EXHIBIT (c)(vii)
Queensland State Budget Papers for 2008-09
1
APPROPRIATION BILL 2008
(Second Reading Speech, 3 June 2008)
TREASURER
The Honourable Andrew Fraser MP
Treasurer
APPROPRIATION BILL 2008
(Second Reading Speech, 3 June 2008)
TREASURER
The Honourable Andrew Fraser MP
Treasurer
Mr Speaker, I move that the bill be now read a second time.
Mr Speaker, “the duty of placing before the [House] the annual review of the finances of the State and the Estimates for the current year imposes, on this occasion, a more difficult task than usual.”1
So began the Budget Speech in 1915. It serves also to introduce the Budget of 2008-09.
It is my unique privilege to present the first Budget of the Bligh Government.
It is a Budget that sets a course for a government determined to meet the challenges of the future.
This is a Budget that looks beyond tomorrow and out to the horizon.
It describes our priorities and reflects our commitments.
To delivering front line services.
To building infrastructure.
To delivering a massive boost to our health and hospital system.
To helping out Queenslanders most in need—the vulnerable and the elderly.
To tackling climate change.
And to improving housing affordability for the next generation.
It is a Budget that looks beyond today to the Queensland of the future.
We have framed this Budget against challenging times. An unprecedented credit crunch hit global finances as the fall out from the US sub-prime mortgage crisis washed around the world.
And our drought stricken state was soaked by flooding rains.
Interest rates were hiked and smashed demand in the economy, as demand for services and infrastructure escalated in our growing state.
We are facing these challenges, meeting them head on and charting a course for our future.
1 | Hon E G Theodore, Hansard, 13 October 1915. |
3
Economic and Fiscal Outlook
Mr Speaker, Queensland has a strong economy, strong population growth, a strong balance sheet and a strong future. However, the modern Queensland economy is strongly enmeshed in the global economy.
The slow down in global economic growth has hit our nation, at the same time as inflation pressures have produced higher interest rates. We are not immune.
Nationally, economic growth is now estimated to be 3 1/2 % in 2007-08, down from previous forecasts.
Australia’s economic growth is forecast to slow further in 2008-09—down to 2 3/4 %.
Queensland is again outpacing the national economy. Our estimated growth for 2007-08 is 3 3/4 % and in contrast to the nation, we are forecast to gather pace and grow at 4 1/4 % in 2008-09.
This will be the thirteenth year we have outpaced the national rate of economic growth.
While jobs growth slows nationally, our economy is set to deliver a year average rate of unemployment that is the lowest in a generation—and it is forecast to stay there, at 3 3/4 % in 2008-09.
This will be the fifth straight year Queensland’s unemployment rate has been well below the national average and is the lowest rate of unemployment in 34 years.
Employment is forecast to grow at double the national rate.
It is not just the quantum of our growth, it’s the composition of our growth that is the real story. Business investment in Queensland is forecast to grow by 9 1/4 %. Real business investment will have doubled to $36 billion over the last six years.
While the cost of the flood has included mine and export disruption in 2007-08, the breaking of the drought and rising agricultural prices are expected to result in a recovery in farm incomes and see our primary industries make a strong contribution to growth. Reforms to the Department of Primary Industries and Fisheries will support this growth.
Our resource industries are experiencing unprecedented prosperity.
While mining and agriculture represent just 12 % of the output in the modern Queensland economy, they will play a strong role in achieving exports growth of 4 1/4 % in the year ahead.
This is the strongest rate for four years and benefits from export infrastructure expansions coming on line and improved weather conditions.
Mr Speaker, the demand for further infrastructure investment comes at a challenging time. In 2008-09, for the first time, Queensland will receive less than a per capita share of GST revenue. We will be a donor State.
At the end of the Budget’s forward estimates in 2011-12, Queensland will have had a cumulative loss in GST funding of more than $1.8 billion since the 2004 Review of the Methodology by the Commonwealth Grants Commission.
In addition, by 2011-12, the revenue foregone from the abolition of State taxes will be over $1.3 billion.
Together this curtails our capacity to meet the funding challenges before us.
4
I am a strong supporter of the Federal Treasurer’s initiative to engage in a comprehensive review of Federal, state and local taxation. The financing of our federation is the dominant fiscal challenge before our nation and the time to address it is now.
The quest for reform is a task that begins at home and the Bligh Government is taking a fresh approach to reform of the Queensland public sector with changes designed to deliver real savings that can be redeployed to frontline service delivery.
We are creating a new Public Service Commission, committed to reducing the number of government boards and statutory bodies, creating one amalgamated Civil and Administrative Tribunal, and have established the Expenditure Review Committee.
We have applied a productivity dividend to the non-service delivery areas of government and are redeploying the $80 million in annual savings to frontline service delivery.
Our amalgamation of the Service Delivery and Performance Commission and the Office of Public Service Commissioner has already generated savings of $1.5 million.
This Budget reallocates these savings to neonatal equipment and night vision goggles in rescue helicopters and to the Healthy Hearing Program for indigenous children.
One of our first acts as a new government was to comprehensively audit the Queensland Ambulance Service, where we identified $12.2 million worth of savings to be returned to frontline service delivery.
It is a record budget for the Ambulance Service of $455.7 million, including 250 additional ambulance officers and 145 new ambulances.
We will continue this task and expand it across government as we strive to achieve the best value for the Queensland taxpayer.
Housing Affordability
Mr Speaker, our decade of unprecedented prosperity has not been enjoyed by everyone.
Many young Queenslanders have been locked out of the great Australian dream by a property market that has risen above their reach.
Housing affordability can not be solved by any one act by any one government. But we can assist, and we will.
Through sweeping changes to our stamp duty regime any Queenslander seeking to break into home ownership through buying a first home under $500 000 will not pay one red cent of stamp duty.
We will immediately raise the first home owner concession to $350 000 from the start of the financial year and then to $500 000 by 1 September this year.
We will bring forward and abolish in full mortgage duty on day one of the start of the new financial year.
We will extend the principal place of residence concession available to all home buyers to provide further savings of up to $750.
These reforms will mean that a Queensland couple looking to take out a mortgage and purchase their first home—whether they are in the growth suburbs of the Gold Coast or the booming city of Mackay—will save up to $9,800 on a $500 000 home.
5
They will not pay one cent of stamp duty on the purchase price, and not one cent of duty on their mortgage.
We are proposing to abolish the First Home Owners Grant and reform duty rates for homes above $1 million to finance the cuts aimed at the Queenslanders who are seeking to break in to the property market.
Our reforms mean that for every home purchase under $1 million—whether first homes or to families upgrading to a new home—Queenslanders will pay the lowest stamp duty in the country.
This reform is at the core of our Budget and of our beliefs as a Government.
I also announce further tax reform to reduce the impact of higher land values on tax liability, with cuts to threshold payments for land tax and a simplification of the rate schedules.
We have the highest threshold in the nation for resident individuals and our top marginal rate of 1.25 % is lower than any State.
In this Budget we will add to our competitive regime which sees the number of land tax payers in Queensland equal to about one-third of that of other major states.
In Queensland a couple could own a home on land worth more than $1 million and three or four other average priced properties before being liable for land tax.
Tax payable at the land tax threshold will be reduced from $1,200 to $500 for resident individuals and from $2,250 to $1,450 for companies, trusts and absentees, which will ensure that the majority of land tax payers will benefit from our reforms.
On the supply side, this Budget will assist with housing affordability through the planned release of $125 million in 2008-09 from the Queensland Future Growth Fund for social housing, as well as $9.5 million for the Urban Land Development Authority.
Health
Mr Speaker, every government around the world of every persuasion faces the challenges of health service delivery. With an ageing population and rapid technological advancement, health costs are ever increasing.
We are facing up to this challenge with the single biggest injection ever into our health and hospital system. A massive boost of $1.2 billion will take the Health budget to a record $8.35 billion in 2008-09.
The capital works component of the Health budget tops more than $1 billion.
This Budget provides funding for the commencement of the new Mackay hospital and the redevelopment of the Cairns and Mt Isa hospitals. These projects are being funded by the sale of Cairns and Mackay airports together with the sale of our 12 % stake in Brisbane Airport.
More than $200 million is allocated towards our program of building three new tertiary hospitals in the south east corner: the Gold Coast University Hospital, the Queensland Children’s Hospital and the Sunshine Coast Hospital.
$55 million will commence the $240 million expansion of the Robina Hospital on the Gold Coast.
A funding injection of $7 million this year will go towards an expansion of the Emergency Department at the Townsville Hospital, while $10 million is also provided to bring on line more beds as we fulfil our election commitment to Townsville.
6
The upgrade of the Rockhampton Hospital Emergency Department will continue, and more than $15 million will be spent on the Yeppoon Hospital Redevelopment. A new community based care initiative will be piloted at Toowoomba Hospital.
The Budget also allocates $200 million over four years to sustain increased elective surgery activity and to relieve pressure on other essential health services.
Other new funding provided includes:
| | • | | $54.9 million over four years to meet the increased demand for medical aids, together with increased subsidies for clients of the Medical Aids Subsidy Scheme |
| | • | | $45.6 million over three years for new health technology and equipment with a further $3.9 million over three years to enhance the Tele-Radiology Network to enable Queenslanders in regional and remote areas access to rapid response radiology reporting |
| | • | | $35.8 million to employ 50 new nurse practitioners over four years and train more nurses to work in neonate intensive care units and special care nurseries |
| | • | | Enhanced Maternity Care—$9 million over four years has been allocated to support the trial of a patient-focussed nurse-led, community-based midwifery model of care in rural and outer urban sites. |
Dental health is a priority of the Bligh Government and we are also allocating $14 million over three years to acquire nine new mobile dental clinics and refurbish the existing fleet.
We will also provide $26 million over the next four years in support of our decision to fluoridate public water supplies—the single most important preventative health measure undertaken for a generation, which will benefit generations to come.
Assisting our Elderly
Mr Speaker, the generations of Queenslanders who have completed their working life and now rely on fixed incomes find the cost of living particularly challenging.
The Budget implements our commitment to introduce a Pensioner Water Subsidy Scheme for eligible pensioners in the south-east corner to reduce the impact of increased water price rises in the future. This scheme, at a cost of $50 million over four years, will provide a rebate of $40 this year, rising to $100 in 2010-11.
This scheme is in addition to the Pensioner Rate Rebate Scheme which applies across the state and provides up to $180 off local government rates charges.
To assist with rising energy costs the Government funds its commitment to introduce a $2.96 million Reticulated Natural Gas Rebate Scheme for pensioners and seniors. Around 50,000 pensioner and concession card holders will benefit from the rebate, which we will index with CPI.
Today I announce the allocation of $10.6 million to increase the pensioner and seniors electricity rebate by $20 to $165. The increase in the rebate at 13.8% is more than double the announced 5.3% increase to electricity prices and demonstrates our commitment to assisting older Queenslanders with rise in the cost of electricity.
Mr Speaker, many Queenslanders have a need for ongoing care and with an ageing population this proportion of the State’s population will grow. To assist our seniors, the Government will change a number of State tax arrangements that apply to Queensland’s aged care facilities and affect Queensland’s aged persons.
We will make aged care facilities, under the Commonwealth’s Aged Care Act, exempt from land tax.
7
We will extend the principal place of residence land tax exemption when the owner is absent due to illness or care requirements—a situation often encountered by the elderly.
These changes will ease the burden on many older Queenslanders and will be subject to appropriate safeguards to ensure the benefits reach their intended recipients. The value of these tax reforms is calculated at $5 million in savings to older Queenslanders.
Climate Change and the Environment
Mr Speaker, dealing with climate change is not only the dominant environmental challenge of our time, it’s the dominant economic challenge before us.
Pricing carbon, calibrating climate change into our economy, will have ramifications for generations to come. Denying and doing nothing is not an option to be contemplated.
The Budget will fund a new service, the ClimateSmart Home Service, to assist households to meet the challenges of climate change.
The service is modelled on the successful Home Waterwise Service—and we will make this new service available State-wide.
The new ClimateSmart Home Service—funded through the Queensland Climate Change Fund—will assist Queensland households with curtailing energy use, reducing greenhouse gas emissions and saving money on energy bills.
Residents will receive over $250 worth of value for a $50 fee which will include the installation of a wireless energy monitor, providing up to 15 compact fluorescent light bulbs, a water efficient shower rose per household and a comprehensive energy audit.
Climate change will have disproportionate impacts on different households and on different locations.
Accordingly, $7.25 million has been allocated over four years for the ClimateSmart Homes Rebate Program to provide financial incentives for households and small business in isolated and remote areas of the State to implement energy conservation measures.
The Budget also provides the $50 million planned for the Queensland Renewable Energy Fund to support the commercialisation of new technologies as well as the $50 million planned for the Smart Energy Savings Fund.
The Funds will support Queensland businesses to implement energy efficient technologies in buildings, appliances and industrial processes.
The Funds will reduce greenhouse gases, and save business money.
Other environmental initiatives funded in this Budget include:
| | • | | the $17 million for a structural adjustment package for commercial fishers affected by the Moreton Bay Marine Park Zoning Plan, to secure the long term health of the bay, |
| | • | | $12 million for land management under the new Cape York Peninsula Heritage Act, and |
| | • | | over $60 million in additional funding over four years for an expanded State-wide compliance program for environmentally relevant activities, including on industrial sites. |
8
Indigenous Queenslanders
Mr Speaker, governments through history have struggled to improve the circumstances of our Indigenous population.
Determined as we are to confront this challenge, our government is tackling the root causes of disadvantage and trauma.
A new regime to tackle alcohol abuse and reduce harm, including divesting local councils of canteens to break the link between alcohol profits and council coffers, is being supported by more than $58 million in funding over four years.
This allocation will deliver new alcohol and drug detoxification and rehabilitation programs, diversionary activities, family support programs and greater enforcement of alcohol restrictions as well as compensating councils for lost revenue from canteen closures.
We are also providing $40 million over five years, commencing in 2007-08, for the Cape York Welfare Reform initiative, an investment in breaking the cycle of generational disadvantage.
We are increasing our funding to those most in need—indigenous children. We will provide $21.5 million for facilities for pre-Prep programs for children aged between three and a half and four and a half in indigenous communities.
More than $13.6 million will be allocated to build and operate four residentials to house children taken into care with another $10.4 million to operate safe havens for indigenous children affected by family violence.
The success of the PCYC program in indigenous communities will be built upon with an injection of $7.6 million over four years.
We don’t want to just repair damage, we want to provide a future for our indigenous population. A healthy future, a safe and economic future that recognises unique cultures.
New funds will support improved land management and tenure reform to promote economic development and enable the provision of essential infrastructure on Aboriginal and Torres Strait Islander lands.
An additional $4.7 million will be provided over three years to support the growth and development of the vibrant Aboriginal and Torres Strait Islander arts industry—a pathway to prosperity for the future.
Safer Queensland Communities
Mr Speaker, prosperity provides opportunity. Opportunity allows for potential, and we aspire to safe and supportive communities to nurture that opportunity.
This Budget sees funding to the Queensland Police Service increase by $134 million to $1.57 billion in 2008-09, a 9 % increase.
An extra 200 police will ensure we maintain our election commitment to having a police to population ratio at national levels. An initial $3.5 million over four years is provided to the Office of the Director of Public Prosecutions to increase the number of prosecutors. An assessment of future resourcing of the DPP is an early priority this financial year. The State Coroner also receives a funding increase.
Construction on the new $600 million Supreme and District Courthouse in Brisbane will commence.
9
In addition, this year sees construction start on the new South East Queensland Correctional Precinct near Gatton with $196 million in this Budget.
The $445 million expansion of Lotus Glen Correctional Centre in Far North Queensland will also commence and $11.4 million is allocated for the purchase of land and detailed planning for increased youth detention capacity at the Cleveland Youth Detention Centre in North Queensland.
Transport Infrastructure and Congestion Busting
Mr Speaker, strong population and economic growth, particularly in South East Queensland, is putting increasing pressure on our roads and public transport. It’s adding to costs within the economy, and costing commuting families precious time.
We are in the midst of the single biggest program of infrastructure upgrades: roads, tunnels, busways, bridges, extending and duplicating rail-lines.
It’s a program that reaches across the State.
More than 40,000 cars will be travelling a day on the $543 million Tugun Bypass, opening this week—6 months ahead of schedule.
250 buses are running beneath our city centre through the $333 million Inner Northern Busway tunnel, opened ahead of schedule.
Queenslanders can see the $980 million we have spent on the Gateway Bridge duplication and upgrade so far ….and we will spend half a billion more this year as the bridge climbs above the ground.
You can see the $68 million we have spent on the Houghton Highway duplication …and we will spend $150 million in this Budget as the bridge stretches over to Redcliffe.
You can see the $52 million on the Caloundra Road upgrade …we will spend $27 million to finish this year. And we’ll finish the Pacific Paradise interchange and David Low Way access on the Sunshine Motorway with $32 million this year on top of the $52 million we’ve already spent.
You can see the $21 million spent building the new Hospital bridge in Mackay …and we’ll spend $11 million this year to finish it along with $66 million on the Forgan Bridge.
You can see the $76 million spent on the Townsville Ring Road already… and we’ll finish it off this year with $42 million in this Budget.
This year we will ramp up our spend on transport infrastructure to service the Western Corridor—the growth corridor of the south-east corner.
We will allocate $200 million to the widening of the Ipswich Motorway.
A massive $254 million will see the work on the Darra to Springfield transport corridor—duplicating the Centenary Highway and duplicating the rail line to enable the extension to Springfield.
Twelve new three car train sets will arrive this year as the Budget funds $162 million over the next four years for an order of 58 new three car units for future years. That’s more train carriages on the line to cope with demand increases.
10
More than $168 million will be pumped into the Translink public transport system to pay for more services including funding for 90 new buses for Brisbane this financial year.
$10 million will be set aside next year to pursue strategies including proven initiatives which promote public transport, cycling and walking.
Delivering on Infrastructure
The Budget’s record $6.968 billion transport and roads capital works program heads up the single biggest infrastructure funding program ever financed in this State.
This year the capital budget is a massive $17 billion—up 21 % on last year’s budget.
That’s $17 billion to be invested over the next 12 months across our state.
To put that in perspective, on average other states will spend $733 per person on capital works in 2008-09. This budget provides for Queensland to spend $1,541 per person: more than double.
Today Mr Speaker, following a major review, the South East Queensland Infrastructure Plan and Program for 2008-2026 is released.
The Plan provides for expenditure of $107 billion over the period with the highlights including:
| | • | | $83.5 billion on road, rail and public transport |
| | • | | $8 billion on water infrastructure |
| | • | | $3.5 billion over five years on energy projects, and |
| | • | | $12 billion in social and community infrastructure. |
A massive task—the $9 billion Water Grid—has a watershed year. More than $2.2 billion is being invested in this Budget to finish:
| | • | | The $900 million Southern Regional Pipeline to be fully operational by the end of November |
| | • | | The $2.5 billion Western Corridor Recycled Water Project to be completed in December |
| | • | | Stage 1 of the Northern Pipeline Interconnectors to be completed by December, and |
| | • | | the $1.2 billion Gold Coast Desalination Project at Tugun to be fully operational by January 2009 |
and we will continue the work on other vital projects such as the Traveston Crossing Dam.
An improved export performance for next financial year comes on the back of capacity enhancements in export infrastructure, including our $5.4 billion Coal Transport Infrastructure Investment Program.
We have already invested $96 million in the expansion of the Abbot Point Coal Terminal to 21 mtpa which opened in November. We have already announced approval for the next stage through to 25 mtpa at a further cost of $95 million and today I announce that we will double capacity at Abbot Point Coal Terminal to 50 mtpa in a massive $818 million project.
This investment, supported through the Future Growth Fund, is an investment in exports. It’s a vote of confidence in our resources sector and demonstrates our commitment to accelerating expansion.
We are also giving the green light to a $107 million project to upgrade the Mt Isa rail link to improve export efficiency for the Northern Minerals Province.
11
This year QR will invest $400 million on the Jilalan Yard Upgrade in central Queensland, and more than $300 million on upgrading the locomotive and wagon fleet.
The booming Bowen Basin will be further supported with a $150 million commitment to roads building, including an upgrade to the Dawson Highway at the Calliope Range and work on the Leichhardt Highway to improve flood immunity and safety.
As our economy powers forward, our energy sector will invest $3.1 billion in the statewide network as we build for growth.
Mr Speaker, we are right in the middle of the resources boom, and that requires a boom in infrastructure spending. We are committed to sustaining that prosperity, and for all of Queensland to share in that prosperity.
State Royalties Reform Package
Mr Speaker, the people of Queensland, as the owners of the resource, should receive a fair share of the resource value of our minerals.
The mining industry is experiencing boom times at the moment—suggesting our mineral wealth has been undervalued in the past.
The Government has examined all of Queensland’s royalty arrangements, many of which have been in place for many years.
Profitability of mining is soaring as is the value of Queensland’s mineral wealth. Coal prices in particular are sharply increasing, trebling in some cases. There is also an expected moderation in prices in future years.
Recent significant increases in contract prices for export coal have greatly increased the value of our coal resource. This Budget introduces a coal royalty rate structure designed to increase the return to the Queensland community as the value of coal increases.
A new two tier royalty for coal is to be introduced. The current 7 % rate will apply to the value of coal produced by a mine below $100 per tonne and a higher 10 % rate will apply to the value of coal above $100. Should coal prices drop below $100, the existing 7 % rate will apply.
New arrangements for base metals—which have also experienced sharp increases in value of up to 469 % since 2000—will also be implemented.
These new arrangements will ensure Queenslanders receive an appropriate return for their mineral wealth, help sustain the infrastructure to sustain export growth and help sustain the communities growing with the growth in mining.
Our reforms will also make the clean coal levy deductible for royalty purposes, and backdate that to 2007. This recognises the need to focus on calibrating climate change into our economy, to meet the imperative of sustainability.
A range of new spending—from construction of a new drill core facility in Mt Isa to additional mining inspectors to additional specialist staff at SIMTARS—demonstrates our commitment to supporting the ongoing prosperity of our resources sector.
Growing the Queensland Economy
Mr Speaker, with this infrastructure spend and our fiscal strategy aligned to the State’s economic outlook, we are charting a course for future growth.
12
We have long maintained not only a lead on other states when it comes to growth and to capital works, but also when it comes to our taxation regime. As we meet the challenges of financing improved services and our infrastructure spend, we seek also to maintain our competitiveness.
Small to medium sized businesses stand to benefit from the total abolition of mortgage duty and land tax reforms outlined earlier.
Queensland currently has a highly competitive payroll tax regime—among the highest thresholds in the country—at $1 million—and the lowest tax rate in country—of 4.75 %. Roughly 1 in 10 business in Queensland pays payroll tax.
Today I announce a further reform, and a policy commitment to seeking to adjust this setting each Budget I deliver.
The current threshold phases out at $4 million. This will be increased to $5 million from 1 July 2008. This change will benefit over 40 % of employers currently paying payroll tax.
Queensland will retain its competitive tax status with per capita state tax estimated at $2,342 in 2008-09 compared to an average of $2,616 for the other states and territories.
It affirms our competitive edge, as we finance the biggest expansion in our State’s history.
Budgeting for Surpluses
Mr Speaker, as Members will be aware, Queensland has financial assets set aside to meet future employee superannuation and other obligations. These funds are invested with Queensland Investment Corporation.
While the intention is that these funds earn a long term average rate of 7.5 %, the actual returns have fluctuated between minus 5 % and plus 21 % over the past seven years.
The returns on these investments are not available for other purposes. However, movements in investment returns have had a significant impact on the Budget’s headline operating balance, although not its capacity to fund services.
The Government has decided to transfer the financial assets set aside to meet future employee and other obligations to the Queensland Treasury Corporation.
The transfer will allow Queensland to remove the earnings volatility from the Budget’s net operating balance in the General Government sector. The funds will continue to be reported in the Report on State Finances, tabled in the Parliament annually and signed off by the Auditor-General.
This change has been discussed with ratings agencies, Moody’s and Standard and Poors, who support the move and have confirmed this reform will not in any way jeopardise our AAA credit rating.
Last year’s Budget forecast an operating surplus of $268 million for 2007-08. This was revised down to $213 million at the Mid Year Economic and Fiscal Review, which noted explicitly that our investment earnings were then below the 7.5 % long term average assumed in that report, and in Budgets before it.
The headline estimated actual outcome for 2007-08 is a deficit of $995 million. This is due to the buffeting of our investment returns from the fallout of global financial turmoil with returns to mid-May of 2 % rather than the long term average of 7.5 % achieved.
13
The estimated actual result for the 2007-08 underlying surplus is $272 million, marginally above the original Budget forecast.
The Budget I present today, with a record infrastructure spend, with a record injection into our health and hospital systems and with our tax reforms to stamp duty and other taxes paid for, is framed with a surplus in 2008-09 of $809million, the second highest budgeted surplus in a decade.
The strength of that forecast is very much built on the upside from our resources sector, and accordingly the forecast surpluses are moderating over time as prices are expected to moderate.
The strong surpluses I am budgeting for in 2008-09 and 2009-10 will greatly assist in funding our record capital program.
Under our legislated Charter of Social and Fiscal Responsibility, responsible borrowings may only be undertaken for investment in capital expansion—like long term infrastructure.
We will continue with our strategy of modest, responsible and economically appropriate borrowings in this Budget.
Our interest expense on Budget in 2008-09 will be just 1.5 %. It will grow modestly as we expand exponentially to average 2.4 % of revenue over the full forward estimates forecast period.
In fact, our planned borrowings of $2.9 billion in 2008-09 are significantly lower than we forecast for 2008-09 in last year’s Budget and at the Mid Year Review. Estimated net borrowings on Budget of $2.9 billion will finance the $6.65 billion capital program in the General Government sector.
Every business I know, every family I know, would love to have an interest expense of just 1.5 % of revenue. This fiscal strategy underpins our economic strategy and its soundness is demonstrated in our continued prosperity.
Our Government Owned Corporations will also undertake responsible borrowings—underpinned by commercial undertakings. They do as other businesses do. They will have a capital structure that recognises their operating environment.
Our financial assets will continue to exceed our financial liabilities in the Budget Sector: the fact is the Queensland Budget has no net debt. Our debt levels are sound, responsible and we maintain our AAA credit rating. We equally maintain a critical assessment of our balance sheet, with a constant guiding principle of seeking maximum advantage for the Queensland taxpayer.
And looking to the future
Mr Speaker, we passionately believe in opportunity, in giving every child every chance to prosper.
It’s not just economics—its our passion.
We are funding for growth and for the future.
Our investment in education and training tops $6 billion for the first time.
We will expand our teaching and teacher aide workforce by 270 this coming year, as we meet the task of educating the next generation of Queenslanders.
The Budget provides for a $100 million 2 year injection into school maintenance through the Tomorrow’s Schools initiative.
14
That will spike maintenance spending, recognising that many of our schools are older than our federation. As anyone who owns a Queenslander knows, with heritage comes obligation.
Beyond the normal capital program funded each year for education, we are funding two new schools both on the northern parts of the baby booming Gold Coast.
$56 million will build a new primary school at Western Oxenford and a new High School at Ormeau.
In fact, three of the four new schools to be funded in this Budget are on the Gold Coast.
The fourth school—a new primary school in the North Lakes area—will be in addition to an announced primary school in Ormeau around Norfolk Village.
The students of these new schools will enter a system graduating a generation of school leavers moving into an employment market not seen before.
That requires an investment in skills, in post school qualifications. Our future lies in the Smart State. That’s where our economic future lies—in skills enhancement, in investing in human capital.
The Budget recognises the immediacy of the skills challenge—with additional funding of $43.4 million over four years to increase apprenticeship and traineeship training places with over 7,500 places in 2008-09.
The Budget provides $50 million over two years, commencing in 2009-10, for the development of specialist trade campuses at Acacia Ridge, Mackay and Townsville.
While we arm ourselves with the skills in demand, we need also to look beyond immediate demands and look to the future over the horizon.
Not just in skills development, but in the demands of our community. Of an ageing population, of a community with changing expectations and changing demography.
Of a Queensland community where the most common type of household is no longer parents and the kids. The makeup of homes throughout the State will dramatically change with couples without children and lone persons households overtaking couples with children by 2011.
Where we will live longer, have fewer children, and later. Where medical technology will greatly enhance quality of care for illness, while rates of illness are expected to greatly increase.
Our abiding commitment to increased disability services funding goes to the core of our Government’s beliefs. This year we will increase the budget for Disability Services Queensland to $1.23 billion—a 14 % increase.
This Budget will provide Disability Services Queensland with $99 million over four years to increase early intervention and other support services available to people with a disability in Queensland.
This is about supporting people with a disability—and their carers, their families—to avoid crisis.
To provide for sustainable living in the most nurturing environment, within their own homes and amongst their loved ones whether their disability is physical or mental—this funding is not about least dollar cost, it’s about least cost to individuals and their families.
We will also increase the budget for the Department of Child Safety—which will be $592 million in 2008-09.
15
More than $15 million is allocated to recruit 40 new frontline child safety workers along with additional support for existing workers at the coalface.
An additional $14 million is allocated for family early intervention services to help avoid the incalculable human cost of family breakdown and harm to children.
Across Government we face the challenge of meeting the demands from growth—in every service, and in every way.
As we seek to meet that demand we are quarantining funds for front-end solutions that can avoid all the costs of back-end fixes—both human and economic.
I announce a $70 million allocation over four years for a new Prevention and Early Intervention Incentives Pool.
The funding will be allocated to departments on a contestable basis for innovative projects where there is the potential to improve longer term outcomes—not in immediate raw dollar terms, but in the currency more relevant to our central beliefs as a Government: in the avoidable human cost of suffering, breakdown, abuse or harm.
The fund will be an incubator of policy innovation and looks beyond the immediacy of this Parliament’s challenges and focuses on a longer term view. We are investing today, for the benefit of our tomorrows.
Conclusion
Mr Speaker,
This Budget funds the frontline services to meet today’s demands.
It funds a record injection into our health and hospital system.
It is delivering on infrastructure today for tomorrow.
It smashes stamp duty for Queenslanders trying to break into home ownership.
It looks to the future challenges of a growing State with a global outlook.
It confronts the central challenge of our times: climate change and its impacts on the household.
It provides for Queenslanders to receive a fair share of our resource value.
It uses that dividend to provide services and infrastructure for all Queenslanders.
This Budget recognises our circumstances—smack bang in the middle of an unprecedented boom.
The decisions we make as a community right now matter. We are charting a course for growth, for a new Queensland not even imagined just a few short years ago.
It is the first Budget of the Bligh Government. It lays down our priorities for the future well beyond electoral cycles.
We look to the longer term and to the need to invest now and take on the huge tasks before us.
We look forward with confidence, commitment and courage as we seek to include all Queenslanders in our bright future.
I commend the Bill to the House.
16

STATE BUDGET
2008-09
BUDGET STRATEGY AND
OUTLOOK
Budget Paper No. 2
TABLE OF CONTENTS
18
19
1. BUDGET STRATEGY, PERFORMANCE AND OUTLOOK
FEATURES
| | • | | The forecast underlying operating result for 2007-08 (adjusted for superannuation arrangements comparable to other states) is a surplus of $272 million. This compares to a forecast surplus at the Mid Year Fiscal and Economic Review of $213 million and at Budget of $268 million. |
| | • | | Under the Uniform Presentation Framework, the General Government sector is forecast to have a headline net operating deficit of $995 million in 2007-08. This is primarily due to the subdued performance of investment markets, which has impacted on the returns the State receives on the substantial funds set aside to meet future liabilities. |
| | • | | The 2008-09 budgeted net operating surplus for the General Government sector is $809 million with a strong surplus of $540 million in 2009-10 and a surplus of $265 million by 2011-12. |
| | • | | Cash deficits in the General Government sector are projected for each year across the forward estimates and are the result of the State’s significant planned capital expansion. |
| | • | | The State’s capital program is an estimated $17 billion, a 19% increase on 2007-08 estimated outlays. The capital outlays of Public Non-financial Corporations (commercial) sector entities constitute approximately 52% of total outlays in 2008-09. |
| | • | | The State’s net worth is forecast to increase to $128.563 billion in 2008-09 and rise to $140.243 billion by 2011-12. |
This chapter discusses:
| | • | | the summary of financial aggregates for the General Government sector for the 2008-09 Budget. A discussion of the Public Non-financial Corporations (PNFC) sector can be found in Chapter 4 |
| | • | | the Government’s fiscal strategy as outlined in the Charter of Social and Fiscal Responsibility. |
20
SUMMARY OF KEY FINANCIAL AGGREGATES
Table 1.1 provides aggregate actual outcome information for 2006-07, estimated actual outcome information for 2007-08, forecasts for 2008-09 and projections for the outyears.
Table 1.1
General Government sector – key financial aggregates1
| | | | | | | | | | | | | | | | | | |
| | | 2006-07
Actual2
$ million | | | 2007-08
Est. Act.
$ million | | | 2008-09
Budget
$ million | | | 2009-10
Projection
$ million | | | 2010-11
Projection
$ million | | | 2011-12
Projection
$ million | |
Revenue | | 31,981 | | | 32,276 | | | 36,582 | | | 37,240 | | | 38,638 | | | 40,385 | |
Expenses | | 30,125 | | | 33,271 | | | 35,772 | | | 36,700 | | | 38,422 | | | 40,120 | |
Net operating balance | | 1,856 | | | (995 | ) | | 809 | | | 540 | | | 215 | | | 265 | |
Cash surplus/(deficit) | | 2,304 | | | (3,547 | ) | | (1,970 | ) | | (2,654 | ) | | (2,669 | ) | | (2,059 | ) |
Capital purchases | | 4,418 | | | 5,223 | | | 6,651 | | | 6,693 | | | 6,590 | | | 5,824 | |
Net borrowing | | (262 | ) | | 3,531 | | | 2,915 | | | 4,448 | | | 4,383 | | | 3,593 | |
Net worth | | 117,831 | | | 123,095 | | | 128,563 | | | 132,708 | | | 136,490 | | | 140,243 | |
Net debt | | (26,686 | ) | | (24,371 | ) | | (21,928 | ) | | (18,670 | ) | | (15,560 | ) | | (13,227 | ) |
| 1. | Numbers may not add due to rounding. |
| 2. | Reflects published actuals. Does not include any recasting of data that may have occurred subsequently. |
BUDGET OUTCOMES 2007-08
Key financial aggregates
Table 1.2
General Government sector – key financial aggregates1
| | | | | | | | | |
| | | 2007-08
Budget
$ million | | | 2007-08
MYFER
$ million | | | 2007-08
Est. Act.
$ million | |
Revenue | | 32,551 | | | 33,342 | | | 32,276 | |
Expenses | | 32,282 | | | 33,129 | | | 33,271 | |
Net operating balance | | 268 | | | 213 | | | (995 | ) |
Cash surplus/(deficit) | | (892 | ) | | (2,481 | ) | | (3,547 | ) |
Capital purchases | | 5,463 | | | 5,888 | | | 5,223 | |
Net borrowing | | 3,569 | | | 4,427 | | | 3,531 | |
Net worth | | 119,799 | | | 124,642 | | | 123,095 | |
Net debt | | (24,709 | ) | | (25,226 | ) | | (24,371 | ) |
| | | | | | | | | |
| 1. | Numbers may not add due to rounding. |
Operating balance
The operating balance expected for 2007-08 is a deficit of $995 million. The estimated 2007-08 deficit reflects the subdued performance of equity markets, with investment returns well below the long-term assumed rate of return of 7.5%.
With around $27 billion in funds invested in a portfolio of equities, property, cash and fixed interest, the performance of international financial markets has a major influence on the Budget result. While Budget and Mid
21
Year Fiscal and Economic Review (MYFER) estimates for investment returns were based on the expected long-term average result for the portfolio of 7.5%, the 2007-08 estimated actual is based on returns as at mid-May which were around 2%. This compares favourably with the ASX 200 Index which has declined by 6% between June 2007 and mid-May 2008.
The estimate of expenditure in 2007-08 is similar to the MYFER forecast. Revenue is estimated to decrease from the MYFER forecast as a result of low investment returns, as outlined above.
Further details on revenue and expenditure projections are contained in Chapters 5 and 6 respectively.
The underlying operating balance
Investment market volatility impacts on the Queensland Budget in 2007-08 more than it does for other states. This is due to differences in the way Queensland’s public sector superannuation arrangements are structured and the size of Queensland’s investments compared to other states. Queensland’s financial assets set aside to meet future superannuation liabilities are held as General Government sector assets and associated superannuation liabilities are similarly recorded as General Government sector financial liabilities. In contrast, other jurisdictions generally have structures whereby all investments are held in superannuation funds and only the net superannuation liability is recorded in the General Government balance sheet.
This results in investment market volatility in Queensland in the current year and represents the difference between the actuary’s assumption on investment returns (currently 7.5%) and actual results achieved during the year.
If Queensland’s superannuation arrangements were structured on the same basis as generally applied in other states, the General Government sector underlying operating balance for 2007-08 would be a surplus of approximately $272 million. The result is outlined in Table 1.3 and is calculated on a consistent basis with that used in the other states.
Table 1.3
Calculation of underlying net operating balance1
| | | |
| | | 2007-08
Est. Act.
$ million | |
Net operating balance | | (995 | ) |
Add investment earnings below long term rate2 | | 1,267 | |
Underlying balance | | 272 | |
Notes:
| 1. | With the transfer of assets to Queensland Treasury Corporation (see Box 1.1), the calculation of an underlying surplus in the outyears is no longer relevant. |
| 2. | Represents the long-term rate of 7.5% less estimated investment returns on financial assets held to meet future defined benefit superannuation liabilities that would be foregone if those assets were transferred to the superannuation fund. |
The Queensland Government has decided to remove investment return volatility from the General Government net operating balance through transferring the Consolidated Fund’s superannuation and other assets held to meet long term liabilities of the Government to the Queensland Treasury Corporation (QTC) (see Box 1.1). The outcome of this will mean that, like other states, there will be no difference between the underlying and headline surplus.
22
Box 1.1
Removing investment volatility in the General Government Sector
Queensland has financial assets set aside to meet future employee and other obligations. These funds are invested with the Queensland Investment Corporation (QIC) and, while the assumption is that these funds earn a long-term average rate of 7.5%, the actual returns have fluctuated between negative 5% and positive 21% over the past seven years.
While returns on these investments are not available for other purposes, movements in investment returns have a significant impact on the General Government net operating balance. This can mask the real quantum of funding available for service delivery.
To overcome this, the Government has decided to transfer the assets to the Queensland Treasury Corporation (QTC) in exchange for a debt instrument that earns the General Government sector 7.5% per annum. Given QTC sits outside of the General Government sector, the transfer allows Queensland to remove the earnings volatility from the General Government sector net operating balance. Instead, QTC will bear the investment return volatility of the assets invested with QIC.
The transfer will have no impact on the current governance or investment arrangements with the investments continuing to be managed by QIC.
This transfer is intended to improve the legibility of the General Government sector accounts as the net operating balance will no longer be significantly impacted by movements in investment returns. Standard and Poor’s and Moody’s ratings agencies have advised that this transaction will have no impact on the State’s credit rating.
Cash surplus/(deficit)
Consistent with running a large capital program, the General Government sector is estimated to record a cash deficit in 2007-08 of $3.547 billion.
At the time of the MYFER, a cash deficit of $2.481 billion was expected in 2007-08 for the General Government sector. The larger than expected cash deficit is predominantly the result of the cash impact of the downward revision to investment returns from 7.5% to 2%.
Capital purchases
General Government investment in capital (purchases of non-financial assets) in 2007-08 is estimated to be $5.223 billion. The estimated 2007-08 capital spend is below the 2007-08 Budget and MYFER estimates, reflecting capacity constraints in the construction and civil engineering sector resulting in a modest level of capital deferrals. Capital spending in the PNFC sector is $837 million more than forecast at the time of the Budget primarily due to increased spending on water infrastructure.
The total capital program for 2007-08, including capital grants, is expected to be $14.285 billion, $257 million higher than expected at the time of the 2007-08 Budget. For further details see Budget Paper 3—Capital Statement.
Borrowing
Responsible borrowing for capital purposes is consistent with the Government’s fiscal principles. Net borrowings of $3.531 billion are expected in 2007-08, $896 million less than forecast at the time of the MYFER and $38 million less than forecast at the 2007-08 Budget.
23
Net worth
The net worth, or equity, of the State is the amount by which the State’s assets exceed its liabilities. This is the value of the investment held on behalf of the people of Queensland by public sector entities. The net worth of the General Government sector at 30 June 2008 is estimated at $123.095 billion. This is $3.296 billion higher than the forecast in the 2007-08 Budget and $5.264 billion higher than the 30 June 2007 audited actual. Net worth is $1.547 billion lower than the net worth forecast at the time of the MYFER primarily as a result of the low return on investments.
Net debt
The net debt of the General Government sector is estimated to be negative $24.371 billion at 30 June 2008, compared to negative $25.226 billion estimated at the time of the MYFER. The change in net debt reflects the impact of lower investment returns than forecast, partially offset by lower borrowings.
BUDGET 2008-09 AND OUTYEAR PROJECTIONS
Key financial aggregates
Table 1.4
General Government sector – key financial aggregates1
| | | | | | | | | | | | |
| | | 2008-09
Budget
$ million | | | 2009-10
Projection
$ million | | | 2010-11
Projection
$ million | | | 2011-12
Projection
$ million | |
Revenue | | 36,582 | | | 37,240 | | | 38,638 | | | 40,385 | |
Expenses | | 35,772 | | | 36,700 | | | 38,422 | | | 40,120 | |
Net operating balance | | 809 | | | 540 | | | 215 | | | 265 | |
Cash surplus/(deficit) | | (1,970 | ) | | (2,654 | ) | | (2,669 | ) | | (2,059 | ) |
Capital purchases | | 6,651 | | | 6,693 | | | 6,590 | | | 5,824 | |
Net borrowing | | 2,915 | | | 4,448 | | | 4,383 | | | 3,593 | |
Net worth | | 128,563 | | | 132,708 | | | 136,490 | | | 140,243 | |
Net debt | | (21,928 | ) | | (18,670 | ) | | (15,560 | ) | | (13,227 | ) |
Note:
| 1. | Numbers may not add due to rounding. |
Operating balance
The budgeted position for the General Government sector is for an operating surplus of $809 million in 2008-09. This surplus is being driven by increased coal royalty revenue, reflecting an increase in the value of coal and a change in the royalty rate.
The forecast budget surpluses are expected to moderate across the forward estimates as a result of expected reductions in royalty revenues, the abolition of a number of State taxes including mortgage duty from 1 July 2008 and duty on the transfer of core business assets progressively from 1 January 2010, growth in recurrent expenditure in support of the capital program and slower growth in GST receipts particularly as a result of Queensland becoming a net donor state. Queensland’s relativity is likely to further decline given the growth in the State’s royalty revenue.
The increase in expenditure relative to 2007-08 primarily relates to service enhancements in key service delivery areas, recurrent expenditure in support of the capital program and moderate increases in wages.
Further details on revenue and expenditure projections are contained in Chapters 5 and 6 respectively.
24
Cash surplus and capital purchases
A cash deficit of $1.970 billion is expected in 2008-09 for the General Government sector. The cash deficit is forecast to be $2.654 billion in 2009-10, reducing to $2.059 billion by 2011-12.
Apart from the cash impact of smaller recurrent operating surpluses relative to 2008-09, the major factor contributing to lower cash results is the significant planned capital expansion. The Government will continue to have cash invested with QTC which has been quarantined for use on Queensland Future Growth Fund projects.
Total General Government capital purchases of $6.651 billion are budgeted for 2008-09, reflecting a range of infrastructure initiatives including those announced in the South East Queensland Infrastructure Plan and Program. Budget Paper No. 3—Capital Statement provides details, by portfolio, of budgeted 2008-09 capital outlays.
Over the period 2008-09 to 2011-12, purchases of non-financial assets (capital purchases) in the General Government sector of $25.758 billion are planned.
Borrowing
Responsible borrowing for capital purposes is consistent with the Government’s fiscal principles. Net borrowings of $2.915 billion are budgeted for 2008-09 in support of $6.651 billion in purchases of non-financial assets.
The remainder of the General Government capital program will continue to be financed through the operating cash flow with the exception of the Mount Isa, Cairns and Mackay Hospitals. These hospitals will be funded through the long-term lease of the Mackay and Cairns airports and the disposal of the Port of Brisbane Corporation’s remaining stake in Brisbane Airport Corporation Pty Ltd.
Over the Budget and forward estimates period, total General Government borrowings of $15.339 billion are planned. Of this amount, some $2.023 billion is to fund net equity injections to Queensland’s PNFC sector entities to support expansion of the State’s water, ports, energy and rail infrastructure.
Net worth
State net worth is projected to increase from the 2007-08 estimated actual by $5.468 billion to $128.563 billion at 30 June 2009. Net worth is also expected to increase in all outyears.
Net debt
In 2008-09, net debt in the General Government sector is estimated to be negative $21.928 billion compared to the MYFER estimate of negative $22.716 billion. The change in net debt from the MYFER primarily reflects the flow through of lower than forecast investment returns on the estimated value of investments, partly offset by lower levels of borrowings. More information on the State’s net worth, assets and liabilities is provided in Chapter 7.
RECONCILIATION OF NET OPERATING BALANCE
Table 1.5 provides a reconciliation of the current General Government sector net operating balances for 2007-08 and 2008-09 to the MYFER estimates.
25
Table 1.5
Reconciliation of 2007-08 and 2008-09 net operating balance to MYFER estimates1
| | | | | | |
| | | 2007-08
Est. Act.
$ million | | | 2008-09
Budget
$ million | |
MYFER net operating balance | | 213 | | | 156 | |
Expenditure policy decisions2 | | (33 | ) | | (353 | ) |
Taxation and royalty policy decisions3 | | — | | | 520 | |
Other significant variations impacting on operating balance | | | | | | |
— Investment returns and interest earnings4 | | (1,261 | ) | | (116 | ) |
— Revenue from the Australian Government5 | | 79 | | | (226 | ) |
— Taxation, royalty and revisions to net flows from PNFC sector entities6 | | (91 | ) | | 1,386 | |
— Other parameter adjustments7 | | 98 | | | (559 | ) |
2008-09 Budget | | (995 | ) | | 809 | |
Notes:
| 1. | Denotes impact on net operating balance. Numbers may not add due to rounding. |
| 2. | Reflects expenditure policy decisions taken since the MYFER. Budget Paper 4—Budget Measures, outlines in detail the policy decisions taken since the 2007-08 Budget. |
| 3. | Reflects changes in transfer duty, royalties, land tax, payroll tax and mortgage duty. These changes are outlined in further detail in Chapter 5 and in Budget Paper 4—Budget Measures. |
| 4. | Reflects revisions of estimated rate of return on investments from 7.5% to 2% in 2007-08 and earnings on cash balances. |
| 5. | Includes outcomes of Commonwealth Grants Commission 2008 Update, population changes and most recent estimates of GST revenue included in the 2008-09 Australian Government Budget as well as changes to Specific Purpose Payments. |
| 6. | Refers to adjustments of a non-policy nature in taxation and royalty estimates. Includes adjustments to net flows in Public Non-financial Corporations and Public Financial Sector entities. |
| 7. | Refers to adjustments of a non-policy nature such as movements in expenditure and revenue relating to economic and technical parameters and expenditure lapses in 2007-08. Major contributors are increased spending for natural disaster relief, growth funding provided to support service delivery in key agencies, increased depreciation expense. |
FISCAL STRATEGY
The Charter of Social and Fiscal Responsibility outlines the Government’s fiscal principles and is an integral part of the Government’s commitment to the community. The fiscal principles, detailed in Box 1.2, have been framed to meet a number of objectives, with the overriding requirement to maintain the integrity of the State’s finances.
The fiscal principles establish the basis for sustainability of the Government’s policies. They require services provided by Government be funded from tax and other revenue sources over the long term. The principles are supported by an accrual budgeting framework, which recognises future liabilities of the State and highlights the full cost of sustaining the Government’s operations on an ongoing basis.
The fiscal principles recognise the importance of a strong financial position for the State. A state government, because of its more limited tax base, does not have the same capacity as a national government to cushion economic and financial shocks. At the same time, state governments have a responsibility to provide continuity of services, such as health, police and education.
A strong financial position, as indicated by a AAA credit rating, enables lower borrowing costs and is an indication of the soundness of the financial position and policies of the Government, rather than a goal in itself.
The success of Queensland’s financial and economic management has been consistently affirmed by international ratings agencies. These agencies have cited Queensland’s strong balance sheet and dynamic economic base as reasons underpinning the State’s AAA credit rating.
26
Box 1.2
The fiscal principles of the Queensland Government
| | | | |
Principle | | Achievement
Budgeted
for 2008-09 | | Indicator |
Competitive tax environment The Government will ensure that State taxes and charges remain competitive with the other states and territories in order to maintain a competitive tax environment for business development and jobs growth. | | ü | | Taxation revenue per capita: Queensland: $2,342 Average of other states and territories: $2,616 |
| | |
Affordable service provision The Government will ensure that its level of service provision is sustainable by maintaining an overall General Government operating surplus, as measured in Government Finance Statistics terms. | | ü | | GFS operating surplus: $809 million |
| | |
Sustainable borrowings for capital investment Borrowings or other financial arrangements will only be undertaken for capital investments and only where these can be serviced within the operating surplus, consistent with maintaining a AAA credit rating. | | ü | | General Government borrowings: $2.915 billion General Government total purchases of non-financial assets: $6.651 billion AAA credit rating confirmed by Moody’s and Standard and Poor’s (highest rating available) |
| | |
Prudent management of financial risk The Government will ensure that the State’s financial assets cover all accruing and expected future liabilities of the General Government sector. | | ü | | General Government net financial worth: $15.164 billion |
| | |
Building the State’s net worth The Government will maintain and seek to increase total State net worth. | | ü | | Net worth to increase to $128.563 billion |
Competitive tax environment
One of the Queensland Government’s key social and fiscal objectives is to maintain a competitive tax environment that raises sufficient revenue to meet the infrastructure and government service delivery needs of the people of Queensland, while at the same time providing a low-cost environment for business to promote economic development and jobs’ growth.
The competitiveness of a state’s tax system is usually assessed by using one of the following measures:
| | • | | taxation revenue on a per capita basis |
| | • | | taxation relativities based on the Commonwealth Grants Commission methodology |
| | • | | taxation revenue expressed as a percentage of gross state product (GSP). |
Queensland’s competitive tax position is confirmed by all three measures:
| | • | | per capita tax collections in Queensland in 2008-09 are estimated at $2,342, compared with an estimated $2,616 for the average of the other states |
| | • | | Commonwealth Grants Commission data indicate that Queensland’s taxation effort ratio is 84.6% compared with the standard (100%) |
| | • | | latest Australian Bureau of Statistics data shows Queensland’s tax collections are 4.34% of GSP compared to 4.75% for the average of the other states. |
27
The 2008-09 Budget includes changes to transfer duty, land tax, payroll tax and mortgage duty, in addition to adjustments to the royalty regime. Details of these changes and other revenue items are provided in Chapter 5.
Affordable service provision
The objective of maintaining affordable service provision requires the maintenance of a budget operating surplus, to ensure recurrent services can be funded from recurrent revenue sources.
The 2008-09 Budget and forward estimates provide funding for implementation of the Government’s key priority areas including health, congestion management and frontline services.
More information on these initiatives is provided in Budget Paper 4—Budget Measures.
Queensland is already one of the more efficient providers of government services among the states. Nevertheless, further improving the efficiency and effectiveness of government services is an essential element of delivering on these key policy priorities in a way that is both affordable and sustainable.
Sustainable borrowings for capital investment
The provision of adequate levels of infrastructure is an ongoing challenge for a state such as Queensland that continues to experience high levels of economic and population growth. In meeting this challenge, the Government funds capital expenditure per capita well above the average of the other states and territories.
Investment in core infrastructure is a key feature of the 2008-09 Budget with a record capital program of $17 billion. This represents an increase of 19% over the estimated 2007-08 outlays. The capital outlays of the PNFC sector constitute approximately 52% of total outlays in 2008-09.
In recognition of Queensland’s capital requirements, the Charter of Social and Fiscal Responsibility allows borrowing for capital where the costs of the borrowing can be serviced within the context of an overall operating surplus.
Queensland’s 2008-09 capital program will be funded from a mix of recurrent sources, cash balances and borrowings. Details of the State capital program for 2008-09 and sources of funds are provided in Budget Paper No. 3—Capital Statement.
Prudent management of financial risk
Queensland has a long-standing policy of setting aside funds to accumulate financial assets sufficient to meet future liabilities, the largest being for future employee entitlements, most notably superannuation.
In this respect, Queensland is far better placed than any of the other state or territory governments to fund future accruing liabilities, as most other jurisdictions have substantial unfunded superannuation liabilities.
The State’s policy of setting aside funds to meet future liabilities and reinvesting all earnings provides the capacity to manage cycles in investment markets without impacting on the Government’s ability to fund ongoing services to the community.
Building the State’s net worth
The Charter of Social and Fiscal Responsibility policy of building the State’s net worth is intended to ensure infrastructure and other assets are not run down to the detriment of future citizens and taxpayers. It is an important element in ensuring intergenerational equity.
Queensland’s net worth is forecast to grow over the forward estimates. Queensland’s per capita net worth is expected to be 46% greater in 2008-09 than the average per capita net worth of the other states.
28
Further information on State net worth and other balance sheet aggregates can be found in Chapter 7.
INDICATORS OF FISCAL CONDITION
Table 1.6 provides information on the Government’s service delivery capacity, financial sustainability and financial capacity.
Service delivery capacity
This financial data provides an indication of the non-financial capital resources of the General Government sector. These resources generally relate to capital infrastructure and therefore indicate the capacity of the Government to provide services to the community. The data, showing increasing levels of, and additions to, non-financial assets, reflect the State’s heightened commitment to infrastructure provision in recent years.
Financial sustainability
These ratios provide an indication of the sustainability of current policy settings—including the size of the operating surplus (relative to expenses) and the level of debt servicing costs (relative to revenue). A large operating balance and stable low debt servicing costs indicate that current policies are sustainable.
Financial capacity
These ratios provide an indication of the State’s capacity to respond to unexpected events or opportunities. Low levels of borrowing and taxation and large negative net debt provide the State with the capacity for additional resources to be called upon if required.
Table 1.6
Indicators of fiscal condition - General Government sector1
| | | | | | | | |
| | | 2007-08
Est. Act. | | | 2008-09
Budget | | | Other
States2
2008-09 |
Service Delivery Capacity | | | | | | | | |
Non-financial assets3/population ($) | | 23,663 | | | 24,930 | | | 15,329 |
Purchases of non-financial assets/non-financial assets (%) | | 5.2 | | | 6.2 | | | 4.8 |
Financial Sustainability | | | | | | | | |
Operating balance/total expenses (%) | | (3.0 | ) | | 2.3 | | | 3.4 |
Debt servicing cost/total revenue (%) | | 1.2 | | | 1.5 | | | 1.9 |
Financial Capacity | | | | | | | | |
Total borrowings/total assets (%) | | 3.6 | | | 5.2 | | | 6.3 |
Total liabilities/total assets (%) | | 22.5 | | | 23.6 | | | 24.8 |
Net worth/population ($) | | 29,164 | | | 29,795 | | | 20,444 |
Net debt/GSP (%) | | (11.1 | ) | | (9.3 | ) | | 0.4 |
Taxation/GSP (%) | | 4.4 | | | 4.3 | | | 4.6 |
Notes:
| 1. | 2006-07 actual has not been included as the new reporting framework (see Chapter 9) makes inter-year and interstate comparisons difficult. |
| 2. | Weighted average of all states and territories, excluding Queensland. |
| 3. | Refers to land and other fixed assets. |
Source: QLD, VIC, WA, NT, ACT State Budgets, NSW, SA, TAS Mid-Year Reviews/Budget Updates
29
2. ECONOMIC PERFORMANCE AND OUTLOOK
FEATURES
| | • | | The Queensland economy is estimated to expand by 3 3/4% in 2007-08 and exceed growth nationally for the 12th successive year. |
| | • | | Reflecting strong growth in consumer incomes and house prices, household consumption growth is estimated to strengthen to 5 1/4% in 2007-08. Limited spare capacity in the economy is estimated to drive further growth in private and public investment, albeit at more modest rates than in recent years. |
| | • | | Temporary disruptions to supply are estimated to subdue growth in export volumes in 2007-08, while growth in imports of consumer and capital goods is estimated to remain strong. As a result, the trade sector is estimated to continue to detract from overall economic growth. |
| | • | | Economic growth in Queensland is forecast to strengthen to 4 1/ 4% in 2008-09, compared with an anticipated moderation in growth for the nation as a whole. |
| | • | | Queensland is forecast to experience some rebalancing in economic growth, with improved trade sector performance and stronger growth in business investment more than offsetting an easing in household consumption growth. |
| | • | | Capacity expansions and improved weather conditions are forecast to drive exports growth of 4 1/4% in 2008-09, the strongest rate in four years. Business investment is forecast to grow by 9 1/4% to a total of $36 billion, representing a doubling in real investment over the past six years. |
| | • | | Reflecting some easing in domestic demand growth, jobs growth is forecast to ease to 2 3/4% in 2007-08 and 2 1/2% in 2008-09. This growth still represents an increase in employment of more than 105,000 persons over the two years. |
| | • | | The State’s year-average unemployment rate is estimated to fall to a 34 year low of 3 3/4% in 2007-08 and remain there in 2008-09, representing a rate well below that nationally for the fifth consecutive year. |
INTRODUCTION
This chapter presents the economic context within which the 2008-09 State Budget has been prepared. It provides an overview of recent developments in Queensland’s external economic environment, examines the performance of and outlook for the Queensland economy and highlights risks to, and opportunities for, economic growth during the forecast period. The chapter details estimated actuals and forecasts for growth in the major components of State economic activity for 2007-08 and 2008-09 respectively (see Table 2.1) and presents projections for key economic variables over the medium term to 2011-12 (see Table 2.2).
EXTERNAL ENVIRONMENT
International conditions
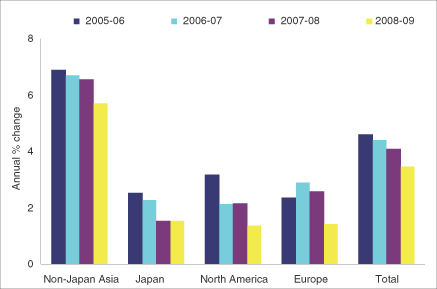
The world economic outlook has been clouded by uncertainty over the extent of the slowing in the US economy, as well as tighter credit conditions triggered by the sub-prime mortgage fallout. Further, rising inflationary pressures may limit the extent of any accommodative easing in monetary policy around the globe. As a consequence, economic growth in Queensland’s major trading partners is estimated to ease from 4.4% in 2006-07 to 4% in 2007-08, and moderate further to 3 1/2% in 2008-09 (see Chart 2.1), its lowest rate in six years.
Despite some relief since mid-March 2008, global credit conditions remain tight. This has been reflected in a widening spread between yields of debt instruments issued by the banking and corporate sectors compared with government bonds and also in the greater difficulty faced by the corporate sector in borrowing directly from capital markets.
30
Tight credit conditions have exacerbated the housing downturn in the US, where the number of housing starts has fallen almost 60% from its peak. It also appears that the impact of the housing downturn has spread to the household and business sectors, coinciding with softer labour market outcomes so far in 2008.
Chart 2.1
Economic growth in Queensland’s major trading partners1
Note:
| 1. | 2007-08 is an estimate, 2008-09 is a forecast. |
Sources: Queensland Treasury and Consensus Economics.
The US economic downturn is expected to not only spill over to other advanced economies, such as Japan and Europe, but also to emerging economies, such as China and India, through trade and financial linkages. In particular, underdeveloped financial infrastructure has led some emerging economies to become overly reliant on foreign capital, which also leaves these economies vulnerable to restrictive credit conditions.
Another development clouding the world economic outlook is the possibility of high global inflation. Prices for petroleum and thermal coal have risen more than 75% and 100% respectively since July 2007. Also, a substantial rise in iron ore and coking coal prices should see steel prices rise significantly in 2008-09. Further, global food prices have surged, including a near tripling of rice prices in Asia since the beginning of 2008 and substantial price rises for other major sources of carbohydrates, such as corn and wheat. With elevated global inflation, major central banks may have to limit the extent of their monetary easing despite the weaker economic outlook.
AUSTRALIAN ECONOMY
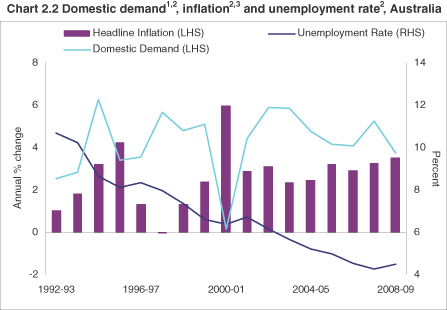
In the 2008-09 Budget, the Australian Government forecast that a moderation in world economic growth, tighter credit conditions and significantly higher interest rates will adversely affect the household sector and slow growth in the national economy from 3 1/2% in 2007-08 to 2 3/4% in 2008-09. With households becoming more indebted, higher interest rates are expected to have a greater impact on consumption than in previous tightening cycles. Falls in share prices have suppressed growth in household wealth and are anticipated to induce saving for precautionary purposes. Higher mortgage rates are also forecast to suppress dwelling investment growth.
31
Partly offsetting the subdued outlook for the household sector, business investment and exports are forecast to support economic growth in 2008-09. Investment should benefit from a large amount of work under construction, a strong Australian dollar (A$) and high levels of capacity utilisation, while an increase in the terms of trade flowing from a surge in coal and iron ore prices is expected to support mining investment. A return to more normal seasonal conditions and recent rises in agricultural prices are also expected to result in a recovery in farm incomes. Reflecting increases in mining and agricultural production, exports growth is forecast to strengthen significantly.
In line with an expected easing in overall economic growth, national employment growth is forecast to moderate from 2 1/2% in 2007-08 to 1 1/4% in 2008-09, causing the year-average unemployment rate to rise 1 /4 of a percentage point, to 4 1/2% in 2008-09.
Despite a forecast moderation in domestic demand, inflation is expected to stay above the Reserve Bank of Australia’s (RBA) target band of 2-3%, at 3 1/2% in 2008-09. This reflects the fact that the Australian economy has been running at close to full capacity for some time, as well as higher energy and food prices and further rises in housing costs.
Notes:
| 1. | CVM, 2005-06 reference year. |
| 2. | 2007-08 is an estimated actual, 2008-09 is a forecast. |
| 3. | 2007-08 year-average estimate is derived from Australian Government 2008-09 Budget through-the-year estimate. |
Sources: ABS 5206.0, 6202.0, 6401.0, Queensland Treasury and Australian Government 2008-09 Budget.
32
THE QUEENSLAND ECONOMY
External forecast assumptions
As a small open economy, forecasts for economic growth in Queensland are based on assumptions about the national economy, trading partners and financial markets:
| | • | | economic growth in Queensland’s major trading partners is estimated to grow at 4% in 2007-08, 0.4 of a percentage point lower than in 2006-07. Growth is forecast to ease further to 3 1/2% in 2008-09, reflecting a slowing in the US economy |
| | • | | while the A$ continued to appreciate in 2007-08, reaching a 24 year high of 96.44USc in late May 2008, the A$ is assumed to depreciate slightly against the United States dollar (US$) by the latter part of 2008-09. This reflects a forecast easing in Australian economic growth and an assumed ending of aggressive monetary easing in the US |
| | • | | supply disruptions pushed oil prices above US$130 per barrel in late May 2008. The strength in oil prices is expected to be maintained until late 2008, before moderating somewhat in the second half of 2008-09, as the global economic slowdown moderates oil demand |
| | • | | forecasts of rural production and exports are based on an assumed return to normal seasonal conditions in Queensland in 2008-09 |
| | • | | the Australian Government’s economic forecasts and projections, as outlined in the Australian Government Budget delivered on 13 May 2008, have been adopted as the basis for national economic performance over the forecast period |
| | • | | the Australian official cash rate is assumed to remain unchanged over the forecast period. |
A discussion of the risks and opportunities associated with these assumptions is contained later in this chapter.
OVERALL ECONOMIC GROWTH
The Queensland economy is estimated to expand by 3 3/4% in 2007-08 and exceed growth nationally, forecast at 3 1/2%, for the 12th consecutive year. Growth in domestic demand in Queensland is estimated to remain strong, at 6% in 2007-08, but is expected to be partly offset by an ongoing detraction from economic growth by the trade sector.
Consumer spending and investment are estimated to drive growth in domestic demand in 2007-08. After easing for three consecutive years, growth in household consumption is estimated to strengthen to 5 1/4% in 2007-08. This partly reflects the lagged impact of a recovery in housing activity in 2006-07 on purchases of household goods and services. A re-acceleration in house price growth has also supported a rebound in discretionary spending on retail items and consumer durables. In response to an economy running near full capacity, business investment is estimated to rise further. However, the pace of growth is expected to slow noticeably from earlier in the cycle, due to the completion of a number of significant projects. Largely reflecting increases in transport, water and energy investment, the public sector is estimated to make the largest contribution to growth in the infrastructure base in 2007-08.
Nevertheless, a significant increase in lending rates is estimated to negatively affect other sectors of the domestic economy. While their adverse affect on disposable incomes and consumer spending has been partially offset by income tax cuts in 2007-08, the rise in mortgage interest rates is estimated to cause dwelling investment to decline for the first time since 2000-01, when the GST was introduced.
The economy, and the trade sector in particular, has also absorbed a range of adverse external and domestic shocks since late 2007. Flooding, the effects of port and rail capacity upgrades, as well as mine maintenance and
33
expansions temporarily disrupted coal and base metal exports in 2007-08. Improved rainfall also encouraged herd rebuilding, with a resultant decline in beef exports. An appreciation in the A$, combined with a deterioration in global economic and financial conditions, has also suppressed tourism and other services exports in 2007-08. As a result, the detraction from economic growth by the trade sector is estimated to widen in 2007-08.
Growth in the Queensland economy is forecast to accelerate slightly to 4 1/4% in 2008-09, in contrast to an anticipated easing in national growth to 2 3/4%. A significant strengthening in exports growth, combined with stronger growth in business investment, is anticipated to more than offset an easing in growth in consumer demand, facilitating some rebalancing in the composition of economic growth.
Additional income tax cuts and continued growth in wages are anticipated to support growth in disposable incomes. However, growth in consumption is forecast to ease, in response to lower levels of housing activity in 2007-08, anticipated slower growth in household wealth and elevated petrol prices. Despite higher borrowing costs and subdued equity prices, business investment is forecast to rise further in 2008-09, reflecting ongoing high levels of capacity utilisation. A surge in the terms of trade is forecast to drive an additional wave of investment in mining and metals processing, while limited office space has resulted in the planning of several major commercial projects.
While world economic growth is anticipated to slow, improved domestic supply conditions are forecast to lead to a significant recovery in exports. The completion of several port and rail expansions, as well as mine and refinery upgrades, should benefit coal and base metal exports, while improved rainfall should lead to a recovery in crop exports. As a result, overall exports growth is forecast to strengthen to a four-year high of 4 1/4% in 2008-09.
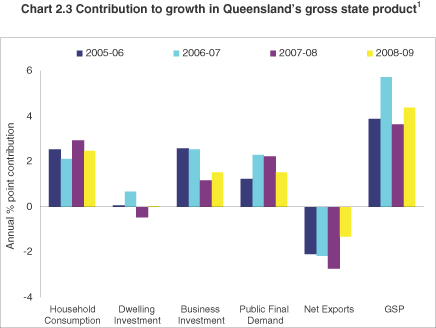
Note:
| 1. | CVM, 2005-06 reference year. 2007-08 is an estimated actual, 2008-09 is a forecast. |
Source: Queensland Treasury.
34
| | | | | | | | |
Table 2.1 State and National Economic Forecasts1 |
| | | Outcomes | | Est. Actual | | Forecast |
| | | 2005-06 | | 2006-07 | | 2007-08 | | 2008-09 |
| | | % | | % | | % | | % |
Queensland forecasts2 | | | | | | | | |
Domestic production | | | | | | | | |
Household consumption | | 4.6 | | 3.8 | | 5 1/4 | | 4 1/2 |
Private investment3,4 | | 11.6 | | 12.7 | | 3 3/4 | | 6 3/4 |
Dwellings | | 0.9 | | 8.2 | | -5 1/2 | | 1/2 |
Business investment4,5 | | 21.3 | | 17.9 | | 7 1/4 | | 9 1/4 |
Other buildings and structures4 | | 25.4 | | 23.4 | | 1/2 | | 10 1/2 |
Machinery and equipment4 | | 18.5 | | 13.9 | | 12 1/2 | | 8 1/4 |
Private final demand4 | | 6.7 | | 6.6 | | 4 3/4 | | 5 1/4 |
Public final demand4 | | 5.7 | | 10.6 | | 9 3/4 | | 6 1/4 |
Gross state expenditure6 | | 5.9 | | 7.7 | | 6 | | 5 1/4 |
Exports of goods and services | | -0.3 | | 2.8 | | 1/2 | | 4 1/4 |
Imports of goods and services | | 5.7 | | 8.7 | | 8 | | 6 3/4 |
Net exports7 | | -2.1 | | -2.2 | | -2 3/4 | | -1 1/4 |
Gross state product | | 3.9 | | 5.7 | | 3 3/4 | | 4 1/4 |
Other state economic measures | | | | | | | | |
Population | | 2.4 | | 2.2 | | 2 1/4 | | 2 1/4 |
Inflation | | 3.1 | | 3.3 | | 4 | | 3 1/2 |
Wage Price Index | | 4.4 | | 4.5 | | 4 1/2 | | 4 1/2 |
Employment | | 3.5 | | 4.6 | | 2 3/4 | | 2 1/2 |
Unemployment rate (%, year-average) | | 4.8 | | 4.0 | | 3 3/4 | | 3 3/4 |
Labour force | | 3.3 | | 3.7 | | 2 1/2 | | 2 1/2 |
Participation rate (%, year-average) | | 66.3 | | 67.1 | | 67 | | 67 |
| | | | |
National forecasts2 | | | | | | | | |
Domestic production | | | | | | | | |
Household consumption | | 2.6 | | 3.6 | | 4 1/2 | | 2 3/4 |
Private investment | | na | | na | | na | | na |
Dwellings | | -4.3 | | 2.4 | | 2 1/2 | | 2 |
Business investment4,5 | | na | | 6.7 | | 9 1/2 | | 8 1/2 |
Other buildings and structures4 | | na | | 12.4 | | 8 1/2 | | 5 1/2 |
Machinery and equipment4 | | na | | 2.9 | | 9 1/2 | | 11 |
Private final demand4 | | na | | 4.0 | | 5 1/4 | | 4 |
Public final demand4 | | na | | 4.3 | | 4 3/4 | | 3 |
Gross national expenditure6 | | 3.8 | | 4.2 | | 5 1/2 | | 3 1/2 |
Exports of goods and services | | 2.2 | | 3.8 | | 3 | | 6 |
Imports of goods and services | | 7.2 | | 8.9 | | 11 | | 9 |
Net exports7 | | -1.1 | | -1.2 | | -2 | | -1 |
Gross domestic product | | 3.0 | | 3.2 | | 3 1/2 | | 2 3/4 |
Other national economic measures | | | | | | | | |
Population | | 1.4 | | 1.5 | | 1 1/2 | | 1 1/2 |
Inflation8 | | 3.2 | | 2.9 | | 3 1/4 | | 3 1/2 |
Wage Price Index | | 4.1 | | 4.0 | | 4 1/4 | | 4 1/4 |
Employment | | 2.4 | | 2.7 | | 2 1/2 | | 1 1/4 |
Unemployment rate (%, year-average) | | 5.0 | | 4.5 | | 4 1/4 | | 4 1/2 |
Labour force | | 2.2 | | 2.2 | | na | | na |
Participation rate (%, year-average) | | 64.4 | | 64.8 | | 65 1/4 | | 65 1/4 |
35
Notes:
| 1. | Unless otherwise stated, all figures are annual % changes. Decimal point figures indicate an actual outcome. na—Indicates not available. |
| 2. | CVM, 2005-06 reference year. |
| 3. | Private investment includes livestock, intangible fixed assets and ownership transfer costs. |
| 4. | Excluding second-hand asset sales between the public and private sectors and including the impact of the privatisation of Telstra. |
| 5. | National calculations of business investment include investment in livestock and intangible fixed assets, which are not included in the Queensland calculations. |
| 6. | Includes statistical discrepancy and change in inventories. |
| 7. | Percentage point contribution to growth in gross state or domestic product. |
| 8. | 2007-08 year-average estimate is derived from Australian Government 2008-09 Budget through-the-year estimate. |
Sources: Queensland Treasury, Australian Government 2008-09 Budget and ABS 5206.0.
Household consumption
Household consumption growth is estimated to strengthen to 5 1/4% in 2007-08, after easing for three consecutive years from a peak in 2003-04 during the housing boom. The lagged impact of a re-acceleration in growth in dwelling investment in 2006-07 has driven faster growth in spending on household services and furnishings in 2007-08. Further, a strengthening in house price growth in 2007 has seen spending on other retail goods and consumer durables recover. Motor vehicle purchases are also estimated to rebound, driven by a fall in oil prices from late 2006 to early 2007 and an unseasonal and transitory shift in the timing of motor vehicle purchases. In addition to solid growth in employment and wages, tax cuts partially offset the impact of higher interest rates on disposable incomes in 2007-08.
Further income tax cuts and solid labour market conditions are forecast to continue to support disposable incomes in 2008-09, while an increase in the terms of trade should also benefit wages in trade-related industries. Despite this, growth in private consumption is forecast to ease to 4 1/2% in 2008-09. A rise in mortgage interest rates is estimated to cause a decline in dwelling investment in 2007-08, which is forecast in turn to result in slower growth in housing-related expenditure the following year. Anticipated slower growth in asset prices is forecast to result in lower growth in household wealth and related spending. This, combined with a rise in petrol prices in the first half of 2008, is predicted to dampen growth in spending on consumer durables such as passenger vehicles in 2008-09.
36
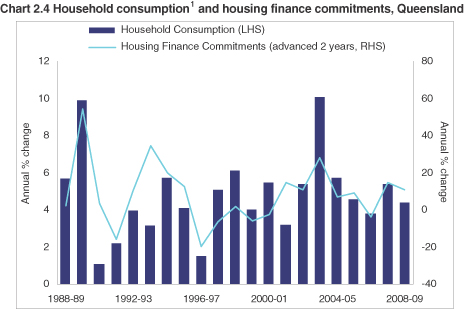
Note:
| 1. | CVM, 2005-06 reference year. 2007-08 is an estimated actual, 2008-09 is a forecast. |
Sources: Queensland Treasury and ABS 5609.0.
Dwelling investment
Following an increase of more than 90% between 2000-01 and 2006-07, dwelling investment is estimated to decline 5 1/2% in 2007-08, representing the first fall since the introduction of the GST in 2000-01. However, led largely by a rebound in renovation activity, dwelling investment is expected to rise by a marginal 1/2% in 2008-09.
New housing construction activity declined sharply in the first half of 2007-08 and leading indicators such as dwelling approvals and housing finance suggest further declines through 2008. Higher interest rates, resulting from a rise in the official cash rate and independent rises in bank mortgage rates, represent an impediment to first home buyers entering the dwelling market (see Chart 2.5). Further, higher lending rates along with elevated house prices have raised borrowing costs for investors, while increases in rents have not kept pace with house prices over the past year. As a result, lower net rental returns have also discouraged investor activity. Renovation activity also declined sharply in the first half of 2007-08 in response to higher interest rates.
Pent-up demand for housing, reflected in low vacancy rates and driven by a buoyant labour market and strong population growth, is forecast to translate into a recovery in new construction late in 2008-09, supported by an assumed stabilisation in interest rates. Renovation activity is anticipated to rebound more strongly, as solid growth in disposable incomes improves the ability to finance alterations and additions activity.
37
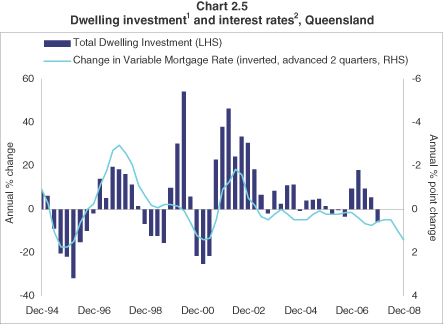
Notes:
| 1. | CVM, 2005-06 reference year, quarterly, seasonally adjusted. |
| 2. | June quarter 2008 interest rate based on April 2008. |
Sources: Queensland Treasury and Reserve Bank of Australia.
Business investment
Business investment is expected to continue to increase, albeit at a slower rate than the very strong growth recorded in recent years (see Chart 2.6). Despite poorer equity returns and higher corporate borrowing costs, the volume of business investment is estimated to increase 7 1/4% in 2007-08, reflecting sustained demand for the State’s major export commodities and limited spare capacity across many sectors of the economy.
Investment in machinery and equipment is estimated to rise 12 1 /2% in 2007-08, supported by a higher A$, which has subdued the price of imported capital goods. After surging by 55% over the last two years, investment in other buildings and structures is estimated to grow marginally ( 1/2%) in 2007-08, reflecting the completion of several major projects, as well as stoppages caused by substantial rainfall in early 2008.
Growth in business investment is forecast to strengthen slightly to 9 1/4% in 2008-09, with the level of investment totalling $36 billion, representing a doubling in real terms over the past six years. Growth in investment in other buildings and structures is forecast to pick up to 10 1/ 2% in 2008-09, with a surge in the terms of trade inducing another wave of investment in mining and base metals manufacturing projects, and rising demand for office space stimulating several major commercial development projects. Forecast growth of 8 1/4% in machinery and equipment investment is anticipated to be supported by the ongoing strength in the A$, as well as a rebound in investment by the rural sector.
38
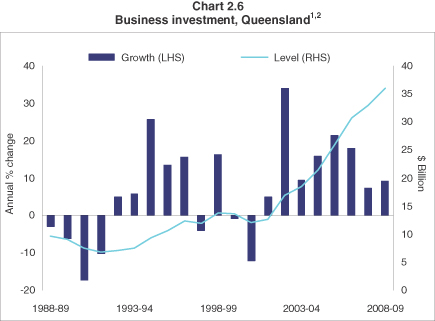
Notes:
| 1. | CVM, 2005-06 reference year. 2007-08 is an estimated actual, 2008-09 is a forecast. |
| 2. | Excludes private sector net purchases of second-hand public sector assets and includes changes to the allocation of investment due to the full privatisation of Telstra. |
Source: Queensland Treasury.
Public final demand
Public final demand is estimated to rise by 9 3/4% in 2007-08 and forecast to increase by a further 6 1/4% in 2008-09. Investment by state and local general government and public trading enterprises is forecast to double in real terms over the four years to 2008-09, reflecting increased investment in water, energy and transport infrastructure.
Net exports
Transitory factors, as well as a continued appreciation of the A$, have suppressed exports in 2007-08. While an easing in growth in domestic demand has also seen import growth moderate during the year, net exports are estimated to detract 2 3/4 percentage points from overall economic growth in 2007-08, larger than the 2.2 percentage point detraction recorded in the previous year.
Expansions in the coal infrastructure network and floods in Central Queensland delayed coal production and exports in 2007-08, while increased rainfall prompted beef producers to re-build herds. Despite improved rainfall since late 2007, cotton production fell significantly in 2007-08, given planting mostly occurs before December. While better rainfall has boosted cereal grain production, exports have been limited by the replenishment of wheat stockpiles.
Services exports (which include tourism) have been adversely affected by a number of factors over the course of 2007-08, including a strong A$ and a slowing global economy. As a result, the total volume of exports of goods and services is forecast to rise only 1/2% in 2007-08.
In contrast, the total volume of imports of goods and services is estimated to rise by 8% in 2007-08. With the economy operating close to full capacity, the propensity to import has increased in recent years. Further,
39
imports of consumer durables and machinery and equipment have been boosted by a higher A$, which has kept prices low.
Improved supply conditions are forecast to see exports improve substantially in 2008-09, despite some deterioration in world economic growth prospects. The volume of goods and services exports is forecast to grow by 4 1/4% in 2008-09, representing the highest rate of growth in four years. Good rainfall since late 2007 and a return to normal seasonal conditions should boost agricultural production and exports. Transport upgrades and a resumption of production in flood affected mines are forecast to increase coal exports. Further, the completion of maintenance and expansions should see production and exports of base metals in Queensland increase significantly.
In addition to higher export volumes, export returns are expected to rise significantly next year, with contract prices for hard coking and thermal coal for the 2008 Japanese fiscal year (April 2008 to March 2009) tripling and doubling respectively. As a result, Queensland’s terms of trade are projected to resume a strong upward trend in 2008-09, after edging lower in the past two years (see Chart 2.7).
An easing in growth in private consumption and machinery and equipment investment is forecast to moderate growth in total imports to 6 3/4% in 2008-09. This, combined with the anticipated improvement in exports growth, is forecast to see net exports detract only 1 1/4 percentage points from overall growth in 2008-09.
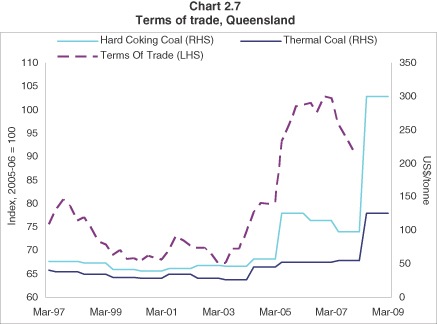
Sources: Queensland Treasury, Australian Bureau of Agricultural and Resource Economics.
Labour Market
Following five years of above average growth, jobs growth is estimated to ease to 2 3/4% in 2007-08, representing an increase in employment of more than 55,000 persons. The easing in jobs growth reflects a moderation in growth in domestic demand, particularly in the labour-intensive construction sector. However, slower overall economic growth is also expected to reduce inflows of marginally attached workers into the labour force, resulting in the participation rate levelling out at 67% in 2007-08. This follows a sharp rise in the participation rate of 2.5 percentage points over the past three years, as mature aged labour force entrants in particular responded to surging demand in the construction, health and retail sectors.
40
With the participation rate estimated to be unchanged, labour force growth is estimated to match civilian population growth, at 2 1/2% in 2007-08. As a result, jobs growth is estimated to surpass labour force growth, reducing the State’s unemployment rate for the sixth consecutive year, to 3 3/4% in 2007-08, the lowest year-average rate in 34 years.
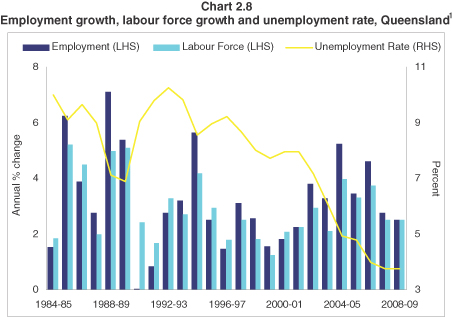
Note:
| 1. | Year-average, 2007-08 is an estimated actual, 2008-09 is a forecast. |
Sources: Queensland Treasury and ABS 6202.0.
Jobs growth is forecast to moderate further, albeit marginally, to 2 1/2% in 2008-09, translating into an additional 50,000 persons in employment. Jobs growth should be supported by an acceleration in non-dwelling construction activity, as well as the positive impact of a rise in the terms of trade on growth in business incomes relative to wage costs. However, the rate of employment growth in 2008-09 is expected to be limited by available supply, with unemployment reaching very low levels and the participation rate expected to remain largely unchanged in the short term. As a result, jobs growth is forecast to match civilian population and labour force growth of 2 1/2%, leaving the year-average unemployment rate unchanged at a generational low of 3 3/4%.
Population
Queensland’s population is forecast to continue to grow at its long run rate of 2 1/4% in 2007-08 and 2008-09, translating into an additional 190,000 persons, or more than 1,800 persons per week. Net overseas migration has become the main driver of population growth in recent years (see Chart 2.9), coinciding with a widening economic growth differential between Australia and countries which are the main source of overseas migrants. Queensland also continues to attract the most interstate migrants of any state, reflecting factors such as a lower cost of living and preferable climate. As a result, the State’s population is expected to continue to grow at well above the national rate.
41
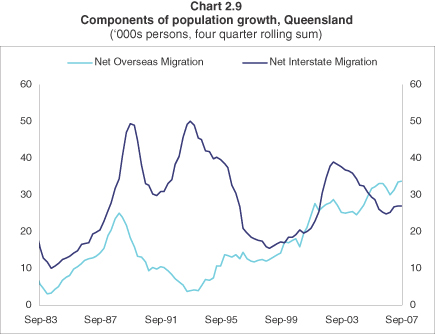
Source: ABS 3101.0.
Wages
Growth in the Wage Price Index (WPI) in Queensland is forecast to remain steady at 4 1/2% in 2007-08 and 2008-09, after generally strengthening over the past decade to reach this rate of growth in 2006-07. Tight labour market conditions are expected to underpin growth in wages across a variety of service industries, in addition to strong wage gains in recent years in the mining industry.
Inflation
Reflecting both domestic and external pressures, inflation, measured by movements in the Brisbane Consumer Price Index (CPI), is estimated to strengthen to 4% in 2007-08, following an outcome of 3.3% in 2006-07.
The housing sector has been the key contributor to inflation so far in 2007-08, driven by rising rents as well as increases in housing construction costs (see Chart 2.10). A tightening in global credit conditions has seen financial institutions widen margins between lending and deposit rates, causing financial and insurance services to make the second largest contribution to inflation in the first three quarters of 2007-08. A significant rise in petrol prices has also driven higher transportation costs, while food prices have also increased. Partly offsetting these pressures, a higher A$ has coincided with subdued prices for retail and household goods in 2007-08.
42
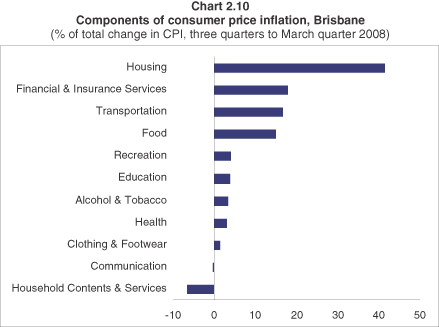
Source: ABS 6401.0.
Inflation is forecast to ease to 3 1/2% in 2008-09. Continuing tight labour market conditions and high capacity utilisation will limit downward pressure on inflation, as will ongoing growth in rents. However, a return to normal seasonal conditions should exert downward pressure on growth in domestic food prices, while growth in the financial and insurance services component of the CPI is likely to moderate as credit conditions stabilise. Further, an assumed levelling out in world oil prices in 2008-09 should also result in a smaller contribution from transport costs to inflation next year.
Risks and opportunities
Domestic inflation pressures represent the key risk to the Queensland and national economy in 2008-09. The RBA forecasts underlying inflation to remain above its 2-3% target band until 2010, when a moderation in the pace of national domestic demand is expected to eventually ease capacity pressures. However, several risks to inflation include a boost to incomes and spending from a higher terms of trade, further increases in global energy prices, and faster growth in world food prices. If any of these trends eventuate or intensify, inflation outcomes may be higher than expected.
Any further increase in lending rates would follow a rise of around 150 basis points so far in 2007-08, reflecting four official rate rises by the RBA and independent rises by banks due to tighter credit conditions. Since households have been carrying a larger amount of debt and using a larger share of income for interest payments, the recent rise in lending rates, along with any further rate rises, may exert a greater impact on household consumption and dwelling investment than in previous tightening cycles.
The possibility of a US-led global economic downturn represents a key risk to the state economy. The ongoing correction in the US housing market has caused consumers in the US to wind back spending and employment conditions to worsen significantly in early 2008. The US remains a major export market and Asia has become increasingly exposed to global financial markets linked to the US. As a result, Consensus Economics downgraded forecasts for economic growth in Queensland’s major trading partners in Asia from 4 3/4% to 4% for 2008-09 between December 2007 and April 2008. With Asia representing the largest destination for Queensland’s goods and education exports, as well as the second largest source of tourism, a further deterioration in Asian growth prospects would adversely affect the state’s exports in 2008-09.
43
Closely related to weaker US economic conditions has been the financial market fallout from the US sub-prime mortgage crisis. International investors have become more risk averse, causing a tightening in credit conditions and a decline in equity prices in the US—trends which have spread to other major economies. In Australia, the yield on A rated corporate bonds averaged 8.9% in April 2008 compared with 7.1% in June 2007, while the premium against Australian Government Treasury bonds increased four-fold over the same period. The ASX 200 Index also declined by 6% between June 2007 and mid-May 2008. Any further rise in corporate borrowing costs or decline in equity prices may dampen business investment in 2008-09.
Disruptions due to heavy rainfall and floods adversely affected agricultural and mining production in 2007-08. Nevertheless, following good rainfall since late 2007 and forecasts for a wetter than normal winter in 2008, a significant rebound in crop production is expected in 2008-09. Further, previously strong La Niña conditions have subsided across the Pacific, suggesting weather may revert to a more normal pattern in 2008-09. However, any reoccurrence of adverse weather conditions has the potential to delay any recovery in agricultural and mining exports.
With the differential between economic growth in Queensland and the rest of Australia expected to widen in 2008-09, Queensland may benefit from a greater inflow of interstate and overseas migrants than currently anticipated. As a result, population growth may be stronger than expected, which may benefit labour force and employment outcomes given current tight conditions in the labour market.
Medium-term outlook
Queensland Treasury provides projections for key economic parameters for the three years following the immediate forecast period in the annual Budget. The projections for the years 2009-10 to 2011-12, shown in Table 2.2, provide a broad indication of the likely path of economic conditions in the State and nationally over the medium-term, rather than point estimates of actual growth for this period. The projections assume a continuation of the longer-term Australian Government policy framework of a stable budget position and monetary policy consistent with a low inflation environment.
Economic growth in Queensland is projected to remain around its average growth rate over the longer-term. Ongoing growth in domestic activity is expected to be complemented by improved trade sector performance, reflecting a significant increase in productive capacity flowing from the investment boom. Overall, economic growth of around 4 1/2% per annum is projected for the period 2009-10 to 2011-12. Jobs growth of 2 1/2% per annum is projected to outpace population growth of 2 1/4% per annum. This implies a moderate increase in labour force participation and the maintenance of the current low unemployment rate over the medium term.
44
Table 2.2
Economic parameters/projections1
(annual % change)
| | | | | | | | |
| | | Outcome
2006-07 | | Est. Act.
2007-08 | | Forecast
2008-09 | | Projections2
2009-10 to
2011-12 |
Queensland | | | | | | | | |
Gross state product3 | | 5.7 | | 3 3/4 | | 4 1/4 | | 4 1/2 |
Employment | | 4.6 | | 2 3/4 | | 2 1/2 | | 2 1/2 |
Inflation | | 3.3 | | 4 | | 3 1/2 | | 2 1/2 |
Wage Price Index | | 4.5 | | 4 1/2 | | 4 1/2 | | 4 |
Population | | 2.2 | | 2 1/4 | | 2 1/4 | | 2 1/4 |
Australia | | | | | | | | |
Gross domestic product3 | | 3.2 | | 3 1/2 | | 2 3/4 | | 3 |
Employment | | 2.7 | | 2 1/2 | | 1 1/4 | | 1 1/4 |
Inflation4 | | 2.9 | | 3 1/4 | | 3 1/2 | | 2 1/2 |
Wage Price Index | | 4.0 | | 4 1/4 | | 4 1/4 | | 4 |
Population | | 1.5 | | 1 1/2 | | 1 1/2 | | 1 1/2 |
Notes:
| 1. | Decimal point figures indicate an actual outcome. |
| 2. | Average annual percentage change over the period. |
| 3. | CVM, 2005-06 reference year. |
| 4. | 2007-08 year-average estimate is derived from Australian Government 2008-09 Budget through-the-year estimate. |
Sources: ABS 6401.0, Queensland Treasury and Australian Government 2008-09 Budget.
45
3. ECONOMIC STRATEGY
FEATURES
| | • | | Queensland’s economic strategy focuses on sustainable growth—maintaining Queensland’s strong economic growth and investing the dividends of growth into infrastructure, skills, and the environment. |
| | • | | In per capita terms, Queensland’s General Government sector capital spending in 2008-09 remains at approximately double the average of the other states, at $1,541 per person. |
| | • | | With a total capital program of $17 billion in 2008-09, new infrastructure will be created at an average rate of more than $320 million a week. |
| | • | | Over the past decade, Queensland’s productivity growth has exceeded the national average. The Government will continue to drive productivity growth by participating in the Council of Australian Governments reform agenda, implementing its own extensive reform program and advancing the Smart State Strategy. |
| | • | | Skills development continues to be a major priority, with the Queensland Skills Plan delivering 63,200 new apprentices and trainees in the year to 30 September 2007. |
| | • | | Environmental sustainability is being advanced through a range of programs and reforms, with the upcoming national emissions trading scheme a major focus. |
SUSTAINABLE GROWTH
If Queensland’s economic growth is to be sustainable, it is critical that the responsibilities and challenges that come with rapid population and economic growth and a changing global outlook are addressed. The Government’s economic strategy recognises that the long-term wellbeing of Queenslanders depends on investing now in world-class infrastructure, an increasingly skilled workforce, and a sustainable environment.
The economic strategy also acknowledges Queensland’s economic and fiscal links with other state and territory governments and the Australian Government. Increasingly, the challenges faced by state governments—such as skill shortages, provision of major infrastructure, population growth and ageing, and climate change—require coordinated national solutions.
This coordinated approach is being pursued under the Council of Australian Governments (COAG) reform agenda. In December 2007, all Australian governments committed to a new reform agenda. COAG’s key priorities include a focus on lifting the productive capacity of the Australian economy.
Major COAG initiatives include:
| | • | | an accelerated business regulation reform agenda across 27 ‘hot spot’ areas of reform, including harmonisation of occupational health and safety laws, and further progress in environmental assessment and approvals, payroll tax administration, trade licenses, national trade measurement, and the consumer policy framework, in addition to a renewed focus on competition reforms |
| | • | | a nationally-coordinated approach to Australia’s infrastructure needs which will see the completion of a National Infrastructure Audit by the end of 2008, and the development of an Infrastructure Priority List by March 2009 |
| | • | | agreement to a new productivity agenda involving long-term and ongoing reforms across all aspects of education and training, with special areas of focus including early childhood education, Indigenous educational attainment and the needs of low socio-economic status school communities |
| | • | | a new framework for Specific Purpose Payments which greatly reduces the number of agreements, emphasises outcomes rather than inputs, and provides financial incentives for participation in national reform (see Chapter 8 for further details) |
46
| | • | | agreement to a national approach to addressing climate change through a national emissions trading scheme, with a comprehensive framework to be finalised by COAG in October 2008 |
| | • | | a focus on health, affordable housing and reforms to Indigenous services, including a review of the respective roles of the Australian Government and state governments in the delivery of services. |
The Queensland Government recognises that a strong commitment to the COAG process and to the real reforms that make up the COAG agenda is of vital importance to Queensland.
A STRONG ECONOMY
In an environment of record low unemployment and an ageing population, strong and sustainable growth in per capita economic output depends on expanding the productive capacity of the Queensland economy—in particular, through policies that promote productivity growth and labour force participation.
Productivity
The productivity of the economy reflects the effectiveness and efficiency with which labour, capital and other inputs are used. Put simply, the more that is produced from our inputs, the more that is available for consumption and trade and the higher the material living standards of Queenslanders.
The benefits of productivity growth may be exhibited in a number of ways:
| | • | | higher wages and profits |
| | • | | lower prices for consumers |
| | • | | better and more efficient public services |
| | • | | better environmental outcomes. |
While employment growth remains a significant source of Queensland’s economic expansion, productivity growth has been almost as important. Chart 3.1 shows that almost half of the growth in Queensland’s real output over the past decade was due to higher labour productivity (output per hour worked), rather than higher employment. Additionally, labour productivity has grown slightly faster on average in Queensland (2.1% per annum) than in the rest of Australia (2% per annum).
47
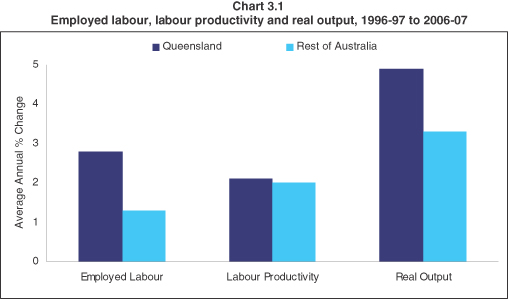
Source: Queensland State Accounts, ABS 6202.0 unpublished data and Queensland Treasury estimates.
Productivity has also been a much more important source of growth in spending power for Queenslanders than increases in the terms of trade arising from high mineral export prices. Chart 3.2 shows that the contribution of labour productivity growth to the increase in Gross State Income per person (a measure of overall spending power) over the past decade was more than twice the contribution of the terms of trade.
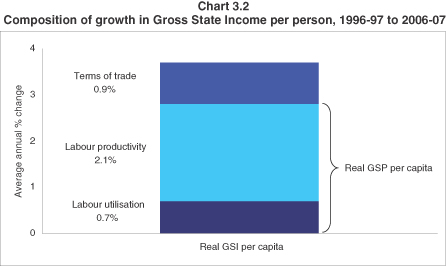
Source: ABS 5206.0, ABS 6202.0 and Queensland Treasury estimates
An important component of labour productivity is so-called multifactor productivity (output per combined unit of labour and capital). This is sometimes known as ‘smart’ or ‘sustainable’ productivity growth because it usually involves the application of new knowledge, which creates opportunities to expand output without increasing physical inputs or imposing more waste products on the environment.
48
Since the mid-1980s, Queensland (together with Western Australia) has had the highest rate of growth in multifactor productivity (MFP) in Australia. Chart 3.3 shows that over the two decades to 2005-06, Queensland’s MFP growth averaged 1.3% per annum, much higher than the 0.9% per annum average for the rest of Australia.
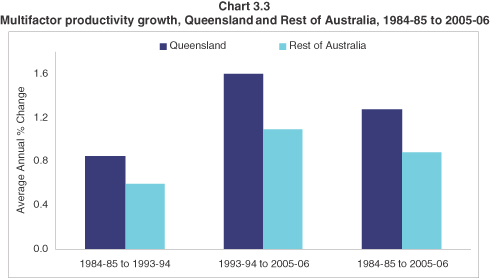
Source: Queensland Treasury estimates
Chart 3.3 also shows that Queensland’s MFP growth rate has approximately doubled over the past decade, from 0.9% per annum to 1.6% per annum. This acceleration means that Queensland enterprises are increasingly developing new and better products and production methods, and in this respect Queensland’s performance has surpassed that of all other states and territories since the mid-1990s.
Participation
Labour force participation reflects the level of engagement of the working age population in work. High labour force participation depends on the structure of incentives to work, and on having skills that are in demand. The structure of incentives is predominantly a policy area of the Australian Government, with the key settings relating to income taxes, welfare payments, childcare subsidies, and superannuation. The states play a large role in skilling the workforce, with key outcomes relating to literacy and numeracy, participation in the early years and senior years of schooling, and post-school qualification rates. Evidence shows that highly-skilled people are much more likely to participate in the labour force than unskilled people.
Chart 3.4 compares Queensland’s participation rate and employment rate with the corresponding rates for the rest of Australia. It shows that since the early 1990s, Queensland’s performance has been above the rest of Australia average in almost every year, and this is expected to continue for the foreseeable future. Further, the sharp increase in Queensland’s labour force participation from 2003-04 has helped to mitigate the skill and labour pressures being experienced by Queensland employers.
49
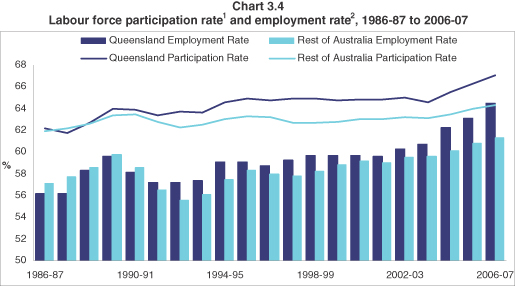
Notes:
| 1. | Labour force as a percentage of civilian population aged 15 and over. |
| 2. | Employment as a percentage of civilian population aged 15 and over. |
Source: ABS 6202.0, Queensland Treasury estimates
If Queensland is to maintain its strong participation performance, increased participation by older Queenslanders will be critical, given our ageing population. Chart 3.5 shows that over the past decade, the proportion of Queensland’s civilian working age population that is aged 55 and over has increased from 24.7% to 29.6%. By 2016-17, the 55+ share is projected to increase to 34.9%.
50
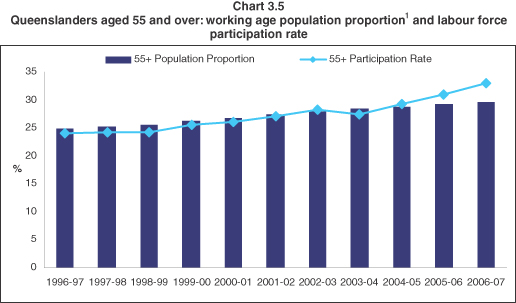
Note:
| 1. | Percentage of the civilian population aged 15 and over |
Source: ABS 6202.0, Queensland Treasury estimates
Chart 3.5 also shows that labour force participation in the 55+ age group has increased significantly over the past decade, with an acceleration from 2004-05 which is possibly linked to the retirement income policy changes introduced by the Australian Government in that year. Given the level of Queensland’s 55+ population in 2006-07, the increase in participation from 1996-97 levels delivered an additional 179,000 workers to the Queensland economy in 2006-07. The Queensland Government is working to ensure that its own policies continue to support mature age participation as more Queenslanders move into the mature age category.
FRAMEWORK FOR SUSTAINING ECONOMIC GROWTH
Overall, the Government’s role is to maintain an economic environment that sets strong incentives to participate, invest and innovate, and allows flexibility in the allocation of resources among products, processes, and industries in response to changing technology and market conditions.
The Government’s framework for a strong, sustainable economy has four main pillars:
| | • | | advancing microeconomic reform, particularly in utility markets and services |
| | • | | investing in economic infrastructure to accommodate continuing strong growth |
| | • | | investing in skills and fostering new knowledge and innovation |
| | • | | managing the linkages between the economy and the environment. |
The Queensland Government’s strategies and initiatives in relation to these four pillars are described below.
Microeconomic reform
The role of government in economic reform is two-fold—firstly, to set appropriate rules for the market sector, ensuring clear incentives, ample flexibility, and low compliance and monitoring costs; and secondly, to improve its own operations, including Government-owned corporations.
51
The Government is committed to an ongoing reform agenda both through the broader COAG arena as well as identifying specific reform opportunities for Queensland. The Queensland Government is currently developing and implementing a wide range of major reform initiatives, which will deliver productivity dividends in 2008-09 and into the future.
Reform of the economic regulation framework
In May 2008, the Queensland Government amended the Queensland Competition Authority Act 1997 (the Act). The amendments are in line with the national Competition and Infrastructure Reform Agreement, agreed by all states, territories and the Australian Government. Queensland is one of the first states to have delivered on this agreement.
The amendments make the Act more responsive to the changing investment climate in Queensland. Highlights include:
| | • | | a new ‘light-handed’ price monitoring option for the Queensland Competition Authority (QCA) to oversee prices set by monopoly businesses and indicate where there could be problems, without having to do a detailed investigation. The new price monitoring powers will be used by the QCA to monitor changes in local government water prices in South East Queensland as the new water supply arrangements come into effect |
| | • | | the implementation of nationally consistent objectives and pricing principles for the third party access regime |
| | • | | the introduction of a six month time limit (with stop-the-clock provisions) on regulatory decisions made by the QCA under the third party access regime. The new time limits should expedite the upcoming QR Limited and Dalrymple Bay Coal Terminal regulatory determination processes (due in 2009 and 2010 respectively) |
| | • | | the capacity for the QCA to develop binding rulings on certain regulatory issues without needing a more formal regulatory process. Binding rulings will provide regulated or potentially regulated enterprises with the option to apply for a ruling from the QCA on how it would exercise its judgement in relation to decisions on key regulatory issues. It is expected the new rulings section will provide greater regulatory certainty and also facilitate investment in regulated significant infrastructure. |
Reform of utility markets and services
Queensland has been progressively implementing extensive reform across the energy, transport and water markets and the Government-owned commercial entities which operate in these markets.
The market-based reforms build on the competition policy achievements of the late 1990s and early 2000s, and include a strong energy market in Queensland with both private sector and public sector participation, transport reform which aims to break bottlenecks in key infrastructure areas, and substantial institutional and market reforms to drought-proof Queensland for future generations. This reform agenda also targets the achievement of robust outcomes from the Government-owned Corporations (GOC) portfolio—in particular, the provision of high-standard services and the achievement of a commercial rate of return.
In some cases, decisions are being taken to exit mature and effective markets, freeing up funds to be redirected into significant and important government priorities. For example, the State GOCs are no longer a part of the energy retail sector in South East Queensland. More recently, the Government announced that the long-term lease of its airport assets in Cairns and Mackay and sale of Port of Brisbane Corporation’s remaining stake in Brisbane Airport Corporation Pty Ltd will fund the expansion of hospital services in Cairns, Mackay and Mount Isa.
Chapter 4 discusses the Public Non-financial Corporations sector and related reforms in detail.
52
Full retail competition
Full retail competition (FRC) was introduced for smaller Queensland electricity and gas users on 1 July 2007, with consumers now able to choose their retailer.
To date, the introduction of FRC has resulted in a significant increase in the number of retailers operating in Queensland and a relatively high take-up rate of market contracts by both electricity and gas customers.
For the first nine months of FRC almost 259,000 electricity customers signed a new market contract with either their current retailer or a competitor, which is significantly higher than the equivalent take-up rates experienced in New South Wales and Victoria. This level of market activity indicates that customers are exercising their right to choose between competitive retailers, with retailers offering incentives including discounts to standard electricity tariffs.
The Queensland Government has established a number of consumer protection measures, including the ability of residential and small business customers to revert to the uniform tariffs and the introduction of a pensioner gas rebate scheme. The QCA has been delegated responsibility for setting the Benchmark Retail Cost Index (BRCI) for electricity. The BRCI is set annually so that regulated electricity prices increase by no more than the actual increase in production costs.
The Minister for Mines and Energy has recently directed the QCA to review small customer gas pricing and competition in the Queensland retail gas market. The QCA will consider issues in Queensland’s small customer gas market such as current levels of competition in the markets for reticulated natural gas and substitute fuels, the impact on retail prices from movements in prices and costs in the upstream gas market, and the extent of current small customer gas market activity. The QCA is due to report to the Minister by 1 December 2008.
Review of port competition and regulation
The final report of the Review of Current Port Competition and Regulation in Queensland (the review) was released in April 2008. Queensland was one of the first jurisdictions to complete the review and release the final report, which was a requirement of the national Competition and Infrastructure Reform Agreement.
The review examined the regulatory framework applied to significant ports in Queensland including the Port of Brisbane, Port of Gladstone, Port of Hay Point, Port of Mackay, Port of Abbot Point, Port of Townsville, and Port of Weipa.
The review’s key findings included overall stakeholder support for the current economic regulatory framework and no demonstrated need for further regulation of any ports in Queensland. However, the report also noted that, should the need for further regulation arise in the future, Queensland’s current ‘light-handed’ regulatory regime could be applied to the areas of port pricing and infrastructure.
The main issue highlighted in the report was not regulation, but the need for better coordination and cooperation between supply chain participants. The Government is addressing these issues in the Goonyella coal supply chain by implementing the recommendations of the O’Donnell Review into Goonyella Coal Supply Chain Capacity.
Regulatory efficiency
The Queensland Government has had a long standing commitment to regulatory reform. The broad legislation review agenda completed over the last decade removed legislation which hindered competition and was the most significant review ever undertaken of Queensland’s legislation.
53
At a federal level, COAG has embarked on a new National Reform Agenda, the first tranche of which focuses on harmonisation of 27 key areas of regulation that impact at an inter-jurisdictional level, including:
| | • | | a new national consumer policy framework, including mortgage credit, consumer credit and financial services |
| | • | | national harmonisation of occupational health and safety laws |
| | • | | national harmonisation of payroll tax administration |
| | • | | improved assessment processes for housing developments, to reduce costs and improve housing affordability |
| | • | | standard business reporting. |
Queensland is also committed to ongoing review of its regulatory environment to promote productivity, facilitate innovation and increase competitiveness.
Complementing our commitment to the COAG reform agenda, Queensland is committed to a new regulatory reform agenda which builds on previous reform work by tackling the quantity of existing regulation and the quality of future regulation simultaneously.
In tackling the existing stock of regulation, the Government intends to focus on removing unnecessary and excessive regulation and associated regulatory requirements, with a focus on reducing or removing tangible and measurable burden, providing real and immediate relief to business and the community.
This approach to tackling the existing stock of regulation will ensure that appropriate and relevant safeguards and protections are maintained.
To improve the quality of future legislation and regulation, the Government will introduce a streamlined, but more rigorous and harmonised, set of processes designed to better measure and understand the regulatory impacts to both business and the community.
Public sector reforms
Queensland is committed to the provision of efficient public services. Key reforms include:
| | • | | creating a new Public Service Commission by amalgamating the Service Delivery and Performance Commission with the Office of the Public Service Commissioner. This will save money, deliver greater efficiencies and bring together the State’s performance management expertise and human resources management knowledge and expertise |
| | • | | creating a Civil and Administrative Tribunal, replacing around 26 different tribunals |
| | • | | establishing an Expenditure Review Committee of Cabinet to review and prioritise government spending |
| | • | | conducting a review of all government boards and statutory bodies—some 600 altogether—to cut red tape and find savings that can be redirected to front line services, to be completed by the end of 2008. |
Local government reform
The new Queensland local government model was implemented on 15 March 2008. The reduced number of local governments in Queensland is intended to increase the effectiveness and sustainability of councils.
54
In support of the new model, the Government is restructuring the Department of Local Government, Sport and Recreation, moving about 150 positions into new regional offices in order to provide tailored, localised support for Queensland’s diverse councils.
Taxation reform
The Government has a commitment to the ongoing reform of the state tax system, with the aim of minimising compliance costs for business and maintaining a competitive tax environment.
Key business tax reforms include:
| | • | | harmonising Queensland’s payroll tax system with those of New South Wales and Victoria in order to reduce compliance costs for large firms operating along the eastern seaboard. At the same time, Queensland’s low payroll tax rate (the lowest in Australia at 4.75%) and high threshold ($1 million) have been maintained. The new arrangements will commence on 1 July 2008 |
| | • | | easing the withdrawal of the payroll tax threshold deduction to phase out at $5 million, rather than $4 million, resulting in a reduction in tax payable for businesses with payrolls between $1 million and $5 million, from 1 July 2008 |
| | • | | abolishing mortgage duty from 1 July 2008, in advance of the commitment made in the 2005-06 Budget |
| | • | | halving duty on the transfer of core business assets from 1 January 2010 and fully abolishing it from 1 January 2011 |
| | • | | revising and simplifying the land tax rate structure, providing land tax benefits for approximately 17,500 companies, trustees and absentees with taxable land holdings valued at up to $750,000 (after averaging and capping) from 1 July 2008 |
| | • | | implementing the next stage of the Office of State Revenue’s management system, called Duties Online, from January 2009. Among other benefits, Duties Online will provide an electronic lodgement facility for returns, expanded electronic payment options and downloadable duty payment calculators. The new system will reduce the time, effort and cost of complying with the tax regime, as well as the Government’s administration and monitoring costs. |
INFRASTRUCTURE INVESTMENT
The rapid growth of Queensland’s economy and population results in escalating demand for economic and social infrastructure. For example, population growth in Queensland has averaged 2.3% per annum over the past five years (twice the national rate), and a similar growth rate is expected in the foreseeable future. This means that Queensland’s stock of infrastructure must expand at a comparable rate in order to keep pace—a massive investment undertaking that places Queensland under more pressure than any other state. This is reflected in the scale of Queensland’s capital program, and in the range of recent reforms to infrastructure planning and management introduced by the Government.
Capital spending
For the General Government sector, capital spending is estimated to be $6.651 billion in 2008-09. Annual capital expenditure by the Queensland Government has now almost trebled from its 2002-03 level of $2.232 billion.
55
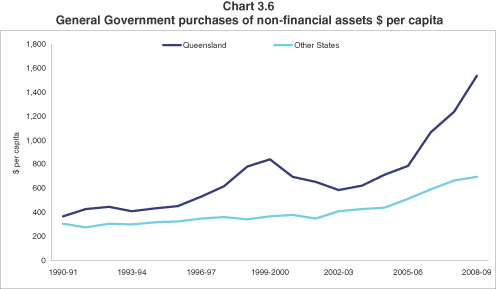
Sources: Unpublished ABS 5512.0 and 3101.0; various State Budget papers, Mid Year Reviews and Budget Updates; population estimates from Australian Government Budget Paper No.3, 2008-09
In per capita terms, the Queensland Government’s capital spending in the General Government sector remains at approximately double the average of the other states, at $1,541 per person (Figure 3.6). Among the states, Queensland has the highest capital expenditure per person in 2008-09, 24.1% above next-highest Western Australia, which is also experiencing rapid growth (Figure 3.7).
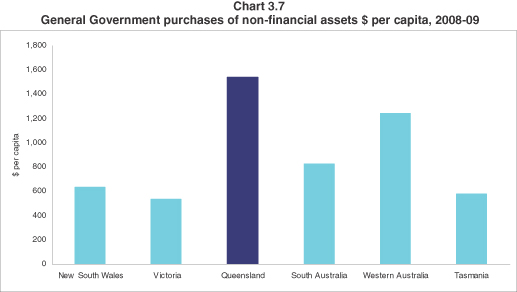
Sources: QLD, VIC, WA State Budgets, NSW, SA, TAS Mid Year Reviews/Budget Updates.
56
The State’s total capital outlays in 2008-09, including outlays by the Public Non-financial Corporations sector, are expected to be $17 billion, an increase of 19.1% on estimated actual 2007-08 capital outlays.
Major Queensland Government infrastructure initiatives for 2008-09 include:
| | • | | continuing the Gateway Upgrade Project, a $1.883 billion investment in duplicating the Gateway Bridge, refurbishing the existing bridge, upgrading the Gateway Motorway, and establishing a new link to Brisbane Airport, with improvements to be introduced progressively to 2012 |
| | • | | continuing construction of the $9 billion SEQ Water Grid, including completion of three key components: the Gold Coast Desalination Plant, the Western Corridor Recycled Water Project, and the Southern Regional Water Pipeline |
| | • | | progressing initial infrastructure works ($14.4 million) for the Northern Missing Link, a new rail line proposed to link Central Queensland coal mines with the Abbot Point export facility near Bowen |
| | • | | further upgrading the Abbot Point Coal Terminal, including the X25 Expansion ($70 million) and on immediately to the X50 Expansion ($250 million) which will more than double the terminal’s capacity to 50 million tonnes per annum |
| | • | | progressing feasibility and approval processes for the new Wiggins Island Coal Terminal near Gladstone, which aims to provide an additional annual export capacity of 25 million tonnes by 2012, and 85 million tonnes when all three stages are completed |
| | • | | progressing new hospitals for the Sunshine Coast (to be delivered in 2014), and Gold Coast (2012), along with Stage 2 of the Prince Charles Hospital Upgrade (2009) and the new Queensland Children’s Hospital (first stage 2011). |
Further details of the State’s capital program are provided in Budget Paper 3—Capital Statement.
Infrastructure planning and management
With a $6.7 billion General Government capital program in 2008-09, there is a large call on the Government’s planning and management functions.
To ensure the efficiency and effectiveness of this extensive capital program, the Government has introduced a number of significant reforms, including:
| | • | | creating the Department of Infrastructure and Planning, to bring together regional planning, economic development and whole-of-Government infrastructure planning and coordination |
| | • | | creating the Translink Transit Authority to integrate and manage public transport services across the South East |
| | • | | implementing the SEQ Water Grid Manager, which gives the Queensland Government control and accountability for water and water assets in the South East. |
Additionally, the Government has commenced developing its Congestion Management Strategy, which will include both capacity building and demand management initiatives. A key initiative under the strategy will be the expansion of the TravelSmart program ($22.6 million over four years), which works with communities, schools, destinations and workplaces to raise awareness, improve access to information and generate opportunities to use sustainable transport modes, such as walking, cycling and using public transport.
The Government will continue to monitor the effectiveness of these reforms and will continue to investigate further reform opportunities, to ensure that the infrastructure essential to our future growth is delivered in the most timely and effective way.
57
SKILLS AND INNOVATION
For Queensland’s skilled workers, the pace of economic growth is generating significant benefits in terms of choice of work and high wages. However, for Queensland’s employers, it is becoming much more difficult to recruit and retain skilled workers, particularly in industries like mining, construction and health, and in agriculture, where scarce workers are being attracted away from employment on the land.
While some skill shortages are cyclical in nature, others reflect long-term changes in Queensland’s economic environment. For example, low and medium technology manufacturing and services employment is increasingly being reallocated from the developed countries, including Australia, to countries like China and India, which have a comparative advantage in low-skilled labour. The onus is now on developed economies like Queensland to ‘move up the value chain’, which means an increasing focus on activities requiring substantial inputs of knowledge, technology, and intangible assets—which in turn requires an increasingly skilled workforce and an effective innovation system.
The latest Australian Bureau of Statistics skills data indicate that young Queenslanders are acquiring post-school qualifications at a higher rate then ever before. Over the period 2001 to 2007, the proportion of Queenslanders aged 25 to 34 with a qualification at Certificate III level or above increased from 43.3% to 57.4% (Chart 3.8).
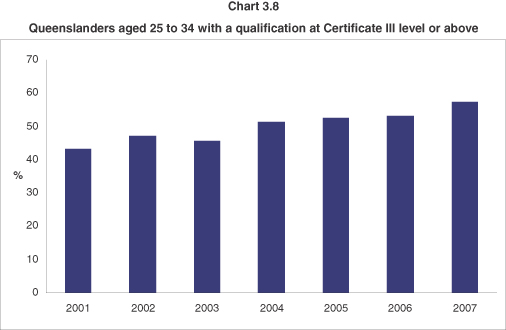
Sources: ABS 6227.0 and Queensland Treasury estimates.
The centrepiece of the Government’s skills agenda is the Queensland Skills Plan (QSP), a substantial policy framework launched in 2006, entailing 24 actions to transform and modernise the vocational education and training system. The QSP is paying off for Queensland, with 63,200 new apprentices and trainees commencing in the 12 months to 30 September 2007. This represents an increase of 12.9% on the previous year, compared with an increase of 4.8% nationally. QSP initiatives for 2008-09 include: $14.9 million for 3,500 additional training places at Certificate IV or higher, with a target of 14,000 additional places available by 2010; and $17.1 million to create 4,250 additional trade training places, with a target of 17,000 extra places available by 2010.
The importance of skills as an enabler of innovation and productivity growth is recognised in the Smart Industry Policy, which aims to realise the Smart State vision by placing productivity at the centre of the Government’s industry development agenda.
58
For 15 priority industry sectors, the Smart Industry Policy targets five key issues to drive innovation:
| | • | | connecting industry with ideas |
| | • | | boosting incentives for productivity |
| | • | | developing skilled people |
| | • | | building markets for smart products |
| | • | | promoting an innovative business culture. |
The third stage of the Smart State Strategy—Queensland’s smart future 2008-2012—will involve a major overhaul of existing programs and a shift in emphasis from the provision of research infrastructure to investing in people through scholarships and fellowships, in key areas such as health and medical research. Over the next four years, the Government will invest $120 million in this next phase of the Smart State Strategy.
ENVIRONMENTAL SUSTAINABILITY
One of the first actions of the current Government was to create the portfolio of Sustainability, Climate Change and Innovation in order to coordinate whole-of-Government responses to environmental challenges.
A key challenge within this portfolio is the upcoming national emissions trading scheme (ETS). In April 2007, the Australian Labor Party and state and territory governments tasked Professor Ross Garnaut to examine the economic and environmental risks of climate change and recommend a path for the implementation of policies to 2050. In December 2007, COAG decided that the Australian Government would work with the states and territories (through the Climate Change Working Group) on its plan for finalising the design and implementation of a national ETS starting no later than 2010. The Garnaut Review’s final report, due by the end of September 2008, will be one input to the Australian Government’s ETS deliberations.
The Queensland Government firmly supports emissions trading, as well as the setting of strong interim emissions reduction targets consistent with the national goal of a 60% reduction in emissions by 2050. At the same time, the Government recognises that introducing a price for carbon will create significant structural adjustment pressures in key sectors of the Queensland economy. It is therefore important that the design and implementation of the ETS recognises the significant lead times associated with new low-emission technologies, particularly as coal gasification and carbon capture and storage will not be deployed for some 12 to 17 years. Setting ambitious targets, which the economy and industry may not realistically have the capacity to meet without significant economic dislocation and large transition costs in the short to medium term, would be a concern, particularly from the perspective of ensuring ongoing energy security. From an economic perspective, maintaining investor confidence and security of supply in the energy sector is critical.
The Government also considers the final design of Australia’s ETS needs to ensure the international competitiveness of trade-exposed emission-intensive industries is preserved.
As well as being involved in national preparations for emissions trading, the Government has developed a strong independent response to the climate challenge which includes the following initiatives:
| | • | | reviewing ClimateSmart 2050, the Government’s long-term agenda for addressing the climate challenge. The Review will build on the suite of greenhouse gas reduction measures contained in the original ClimateSmart strategy, and will outline additional measures across all sectors of the economy |
| | • | | establishing the Queensland Climate Change Fund dividend, using the proceeds of the sale of government energy assets. This will enable a fixed ongoing allocation of $30 million per annum for greenhouse gas reduction programs and climate change adaptation actions. |
59
4. PUBLIC NON-FINANCIAL CORPORATIONS SECTOR AND RELATED REFORMS
FEATURES
| | • | | The Government is committed to actively monitoring its shareholding in Public Non-financial Corporations with the aim of maximising value to Queenslanders. |
| | • | | Proceeds arising from the sale of a number of Government-owned corporations’ assets have been or will be used to fund important priorities for Queensland including the upgrade of existing, and building of new, hospitals and funding climate change initiatives. |
| | • | | A $5.4 billion Coal Transport Infrastructure Investment Program has been launched to ensure that Queensland can continue to efficiently service the growing coal export market through rail and ports. |
| | • | | QR Limited (QR) is undertaking a sequenced program of reform in 2008 which will improve its competitiveness and profitability. New subsidiaries will be created for QR’s passenger, network and services businesses which will improve customer focus and increase accountability for safety, performance and bottom-line results. |
The Public Non-financial Corporations (PNFC) sector is currently undergoing a period of significant reform and renewal.
In recent years the Government has been actively reviewing its strategic shareholding in certain types of commercial asset classes, with the aim of optimising the returns to Queenslanders as the ultimate owners of these assets. Where appropriate, decisions have been taken to exit mature and effective markets, where Government ownership is no longer required and where it has been assessed that the private sector is better placed to manage these risks.
Recent activities include:
| | • | | the transfer of 25% of Port of Brisbane Corporation’s interest in Brisbane Airport Corporation Pty Ltd to the Queensland Investment Corporation on 17 August 2007 |
| | • | | the wind-up of Queensland Power Trading Corporation (Enertrade) following the sale of its gas business and its interest in the Oakey Power Purchase Agreement, and the transfer of its remaining assets and liabilities to Stanwell Corporation Limited (Stanwell), CS Energy Limited (CS Energy) and Ergon Energy Corporation Limited (Ergon) |
| | • | | sale of the wind farms owned by Tarong Energy Corporation Limited (Tarong) and Stanwell in December 2007 |
| | • | | the recently announced decision to lease the Cairns and Mackay Airports on a long-term basis and to dispose of the Port of Brisbane Corporation’s remaining 12.4% interest in Brisbane Airport Corporation Pty Ltd |
| | • | | transfer of the ownership, management and control of the Port of Bundaberg from the Bundaberg Port Authority to a subsidiary of the Port of Brisbane Corporation in October 2007 |
| | • | | significant progress in the implementation of major reforms to the institutional and regulatory arrangements governing urban water supply in South East Queensland, consistent with the recommendations of the Queensland Water Commission in its report to Government of May 2007. |
Proceeds from these and previous sales have been or will be used to fund important Government priorities, including:
| | • | | the new Queensland Children’s Hospital |
| | • | | new hospital facilities in Cairns and Mackay and a major upgrade of Mount Isa Hospital |
60
| | • | | climate change initiatives |
| | • | | the Queensland Future Growth Fund. |
The Government will continue to actively monitor its investment in the PNFC sector by reviewing individual entities’ service delivery, financial performance and risk profiles against the overall policy and market environment in which they operate.
In this context, the Government remains committed to continuing to improve the commercial performance and financial returns of these entities, while optimising broader competition, service delivery, trade and market outcomes in these sectors. The purpose of this strategy is to ensure maximum value, for the benefit of Queensland taxpayers This will be achieved through increased returns on its investment, the continued provision of quality services to the community and customers, and economic benefits to Queensland through increased trade and output.
Further information on the detailed financial outlook for the PNFC sector, which incorporates the Government-owned corporations (GOCs), is provided in Chapter 9.
61
TRANSPORT SECTOR
Coal infrastructure projects
Strong economic growth in China and India continues to contribute significantly to growing demand from the coal-reliant steel and electricity production sectors. Economic growth in the Republic of Korea and Malaysia is also a strong driver of demand for coal used in electricity production. Japan’s persistent strong demand for imported coal has continued.
Japan remains our number one export destination for both thermal and coking coal with exports in 2006-07 of 19.2 million tonnes (mt) and 38.6 mt respectively. The number two export destinations were the Republic of Korea for thermal coal and India for coking coal.
Table 4.1
Queensland’s major coal export destinations, 2006-07
| | | | | | |
Coking Coal | | Thermal Coal |
Country | | Tonnage (Mt) | | Country | | Tonnage (Mt) |
Japan | | 38.6 | | Japan | | 19.2 |
India | | 17.4 | | Republic of Korea | | 7.9 |
Republic of Korea | | 10.9 | | Taiwan | | 5.9 |
Netherlands | | 6.4 | | China | | 1.8 |
Brazil | | 5.6 | | Thailand | | 1.5 |
In the past decade, Queensland, as the supplier of almost 58% of Australia’s coal exports, has increased the volume of its coal exports by 50% to 153.4 million tonnes per annum (mtpa) and its value by 76%. This strong demand is forecast to continue with Queensland’s coal exports predicted to grow by approximately 42% by 2010 and a further 40% by 2015 to reach 306 mtpa.
In response to these coal demand forecasts, the Queensland Government launched a $5.4 billion Coal Transport Infrastructure Investment Program (the Program) which involves significant investment in Government-owned rail and port infrastructure as well as major investments by private coal terminal operators.
The Program, outlined in the document Queensland coal transport—planning for growth, issued in February 2008, sets out Queensland’s current port and rail capacities, likely expansions by 2015 and possible expansions by 2020 where demand warrants. The port expansions in the Program could provide export capacity over 300 mtpa by 2015 and over 400 mtpa by 2020. Rail expansions could provide similar additional capacity.
Abbot Point Coal Terminal
In November 2007, the Ports Corporation of Queensland Limited (PCQ) completed an expansion of the Abbot Point Coal Terminal which increased the coal export capacity of the terminal from 15 mtpa to 21 mtpa. PCQ is currently undertaking a further expansion of the terminal to increase capacity to 25 mtpa. This expansion is expected to be completed in June 2009.
PCQ is now planning a further expansion of the Abbot Point Coal Terminal which will expand the terminal to 50 mtpa. The expansion, referred to as X50, is underwritten by commercial contracts with coal companies and is due for completion in 2010-11.
Work on the expansion, estimated to cost $818 million, including financing charges, will commence in the near future, with $250 million to be spent on early works in 2008-09.
This will coincide with QR Limited’s (QR) construction of the Goonyella to Abbot Point (GAP) Expansion Project which includes the Northern Missing Link, a 69 kilometre rail link between the North Goonyella and
62
Newlands rail systems in the Bowen Basin. The GAP Expansion Project will provide mines in the Goonyella system with access to the Abbot Point Coal Terminal.
The GAP Expansion Project is currently in its final stages of planning prior to the commencement of construction which is expected to occur in August 2008. QR is scheduled to construct the GAP expansion project to a capacity of 25 mtpa by March 2010 and to a capacity of 50 mtpa by end 2010.
Funding will be provided in 2008-09 for this project, subject to final approvals and successful completion of contractual negotiations with coal company customers. It is anticipated that the full cost of the first stage of the GAP project will be over $1 billion.
Wiggins Island Coal Terminal
With demand for the State’s resources forecast to remain solid over the coming years, the Port of Gladstone will form a central part of the required expansion of the Capricornia and Surat Coal Supply Chains.
The proposed location for a new coal terminal to support the expansion of the Capricornia and Surat Coal Supply Chains is to the north of the current RG Tanna Coal Terminal at Wiggins Island.
The ultimate export capacity of the proposed Wiggins Island Coal Terminal is expected to be approximately 70 mtpa. A further port connection linking the proposed terminal to the RG Tanna Coal Terminal may provide additional capacity of 15 mtpa, increasing new throughput capacity to approximately 85 mtpa.
Should the proposed Wiggins Island Coal Terminal project demonstrate commercial and engineering feasibility and progress to implementation, the first stage of the proposed Wiggins Island Coal Terminal is expected to provide initial capacity of 25 mtpa by the end of 2012.
In late 2006, Gladstone Ports Corporation and QR commenced the environmental impact statement planning process, culminating in the receipt of the necessary environmental approval under the Environmental Protection and Biodiversity Conservation Act 1999 for the proposed Wiggins Island Coal Terminal and associated infrastructure in April 2008.
Gladstone Ports Corporation has now commenced detailed engineering and commercial feasibility investigations. In addition, a joint Government/Industry Reference Group to work through possible financing options for the Wiggins Island Coal Terminal has been established. QR also has made significant progress in the planning of the new rail infrastructure, including a second marshalling yard, required to accompany the development of the Wiggins Island Coal Terminal.
QR Limited
To manage growth in the coal freight market, QR will be undertaking a substantial capital investment to meet customers’ needs. The overarching strategy for QR’s coal business incorporates innovation in rollingstock and operations, and negotiation of contracts to achieve improved returns and to maintain their coal haulage industry leader position in Queensland.
In 2008-09, QR will spend $576.4 million on additional track works on the coal network in Central Queensland. The majority of this amount ($400 million) will be spent on the upgrade of the Jilalan Rail Yard near Sarina. The project includes the construction of two new bypass rail tracks, two provisioning tracks and maintenance tracks plus provisioning and wagon maintenance facilities. Other specific projects include the GAP expansion project which includes the Northern Missing Link (subject to approvals).
QR will also invest $303.7 million in 2008-09 for coal rollingstock to meet demand in the Central Queensland coal network. QR’s total coal rollingstock program out to 2011 is $2 billion. This program will enable QR to transport more than 260 mtpa—a 59% increase in Queensland alone from 2006-07.
63
QR is in the process of building a leading national transport and logistics company with the aim of achieving excellence in customer service and commercial outcomes.
QR has a sequenced program of reform in 2008 to improve its competitiveness and profitability, and position itself for a sustainable commercial future. Key initiatives underpinning QR’s reforms involve a corporate restructure which includes the creation of new subsidiaries for QR’s passenger, network and services businesses (all wholly owned by QR), and new wholly-owned subsidiaries created within QR Freight for the coal and regional freight businesses to operate alongside the existing subsidiaries used for the intermodal and bulk businesses.
The above restructure recognises that QR has a portfolio of businesses operating in distinctly different markets that need to be separate, customer-focussed and accountable for safety, performance and bottom line results. QR has been consulting unions and employees on the changes, which will gradually roll out over 2008-09.
Airport assets
On 15 April 2008, the Government announced the intention to lease the Mackay and Cairns airports on a long term basis and the disposal of the Port of Brisbane Corporation’s remaining shareholding in the Brisbane Airport Corporation Pty Ltd.
The proceeds from the airport transactions will provide for the expansion of the Cairns Hospital and delivery of a new clinical wing, a new Mackay Base Hospital and a major upgrade of Mount Isa Hospital.
The decision to divest the State’s interests in its remaining airports is based on the Government’s view that it no longer needs to own and operate airports to ensure their successful operation and financial viability. The Government believes that the private sector is now best placed to manage the operation and development of these assets, due to factors such as its greater ability to attract specialist airport management expertise, develop the airport business and generate commercial returns.
Review of port structure
As both Cairns and Mackay airports form significant parts of their respective port operations, a review of the best structure and management framework for the management of the State’s seaports will be undertaken in parallel with the airport transactions.
The review will be based on the premise that the State will maintain overall ownership of the State’s port network whilst actively encouraging private sector investment in port infrastructure and services.
The outcomes expected by the State from the seaport network review are:
| | • | | that the seaport network continues to facilitate existing and future trade potential to assist in maximising economic growth, regional development and value to the State |
| | • | | to maintain a strong business approach and appropriate commercial returns which also provide for a financially sustainable, and operationally safe and secure seaport network. |
This review is focused on options for the management of the network and is not specifically focused on the discrete roles or functions of individual port authorities. The principal focus of this review is on the management of the port network from Hay Point northwards.
Queensland Motorways Limited
Queensland Motorways Limited (QML) is required by a new Road Franchise Agreement, established in July 2007, to commission, operate and maintain a new tolling system that incorporates full free-flow tolling (FFT). In
64
February 2008, the Minister for Main Roads and Local Government announced the Queensland Government’s approval of QML’s plan to simultaneously introduce free-flow tolling on the Gateway and Logan Motorways in mid 2009.
In response, QML has commenced the design, development and installation of a new tolling system and associated civil works (gantries, interchange redesign) that incorporate full FFT facilities and provide for both E toll and casual or infrequent motorway users. FFT is expected to be implemented on the Gateway Bridge, Gateway Extension Motorway and Logan Motorway during 2009 in accordance with the decision of Government in February 2008.
The FFT project will deliver significant benefits to motorists using QML toll roads through improved safety and reduced congestion, improved traffic speeds with improved environmental outcomes, and more flexible and convenient payment options for customers.
Following an extensive tender process, two leading international technology providers, Thales and IBM, were selected to deliver the roadside and back-office systems components of the project. Together these vendors will deliver for QML and the State the smartest electronic tolling technology available in the world today. The technology will also provide the capability to adjust to emerging tolling strategies that may address vehicle occupancy, time and place, and vehicle emissions as a further response to traffic congestion. The civil works component of the project will be delivered through an alliance contracting arrangement.
In 2008-09, QML will spend $537.6 million towards the construction of a second Gateway Bridge river crossing and to increase capacity on the Gateway Motorway between Mt Gravatt-Capalaba Road and Nudgee Road. The project has an estimated total cost of $1.883 billion.
Investment—ports and rail
Transport GOCs are increasingly delivering new projects in partnership with the private sector. Significant investment is occurring in the port and rail sectors with Government and the private sector developing infrastructure and services to ensure that the State continues to deliver essential services and grows to meet future requirements.
The Port of Brisbane Corporation Limited (PBC) will invest $536.6 million over five years in constructing new wharves 11 and 12 and establishing associated land works at Fisherman Islands. Wharf 11 is expected to be operational by 2012 and Wharf 12 in 2014. This will increase Brisbane’s container-handling facility by 25% and take the number of dedicated container wharves at the port to nine. Hutchison Port Holdings Limited (HPH), one of the world’s leading port investors, developers and operators, has entered into an agreement to lease the new container wharves and will become the third stevedore operating in Brisbane. HPH will subsequently undertake and fund the development of container terminal facilities for the new wharves.
Construction of the new wharves by PBC and construction of the associated container terminals by HPH represent the most significant one-off construction project that PBC has undertaken to date. The introduction of the new wharves and terminals will provide the foundation for the port to meet the future container trade requirements of Queensland, maintain the price competitiveness of the port and provide a future framework for maximising the efficiency of the three stevedores at the port.
QR is seeking to grow its intermodal containerised freight business, a market which is expected to double in the next 20 years. QR’s long-term intermodal strategy recognises the need for new inland terminals and rail connections to capitalise on its expected growth. In December 2007 QR announced it was entering into a joint venture with Stockland and Kaplan Funds Management via a $30 million purchase (a 10% stake) of a future national freight terminal site at Moorebank in New South Wales.
In March 2008 QR announced a joint venture logistics partnership with P&O Trans Australia which will result in the creation of a combined domestic and international rail hub at Yennora in western Sydney. The
65
agreement will see the partners establish a joint operation of rail and terminal services at the existing Yennora Rail Site to enhance their current operations. This includes an intermodal terminal operated by P&O on behalf of both partners, which will cater for QR’s national intermodal business and also a new Port Shuttle Service carrying international cargo to and from Port Botany.
In another dimension to QR’s growing business, QR established Australia’s first major rail multi-user terminal in partnership with P&O at Acacia Ridge. The multi-user terminal is QR-owned, and is a key location for the transfer of interstate freight between road and rail. QR is undertaking long-term planning for terminal upgrades to meet rail volume increases.
The Queensland coal export market is currently experiencing strong growth. While QR will remain the dominant rail haulage provider, its competitor, Pacific National has announced it is investing about $530 million in diesel and electric locomotives and expects to commence coal rail operations in the first half of 2009-10. Pacific National anticipates it will capture in excess of 30 mtpa by 2011.
The Surat Basin Railway, a proposed 207 km railway linking Wandoan and Banana, will allow development of Surat Basin coal deposits and the export of coal from the Port of Gladstone. The Government has granted an unconditional exclusive mandate to a consortium comprising Australian Transport and Energy Corridor Ltd, Industry Funds Management, QR, Xstrata and Anglo Coal to build the Surat Basin Railway.
QRNational has continued its strong expansion into interstate freight markets by doubling coal tonnages in the Hunter Valley in 2006-07. QR holds a 15% share of the market it entered in 2002 through the acquisition of NSW-based freight business Interail.
ENERGY SECTOR
Emissions trading
One of the key challenges facing the energy sector is the transition to an emissions trading environment. The broader issues associated with the implementation of an emissions trading scheme are discussed in Chapter 3.
The Queensland Government is actively participating in work on the development of an emissions trading scheme for Australia and keenly awaits the Federal Government’s decisions later this year. It is actively assessing the range of potential impacts on the GOCs, and in particular shareholder value in the generator GOCs.
A further area being actively investigated by the Government, ENERGEX and Ergon, is demand side management, in turn potentially reducing network, distribution and generation infrastructure requirements, electricity demand and consequently emissions.
It is important that the Queensland Government continue to be actively involved in the review agenda to manage impacts on these businesses, ensure continued electricity supply security and reliability across the state, and smooth the transition to an emissions trading environment while still achieving the desired emissions outcomes.
Investment—energy
The Government will continue to invest in transmission and distribution infrastructure across the State, to ensure that peak demand will be met. ENERGEX and Ergon are reaching the end of their current regulatory period under the Queensland Competition Authority (QCA), and a new determination for their capital expenditure will be made by the Australian Energy Regulator (AER) for the new five year regulatory period from 1 July 2010.
Transmission infrastructure and augmentation will be improved with Powerlink Queensland (Powerlink) investing $675.4 million in 2008-09, while a total of $1.915 billion will be invested in 2008-09 in enhancements
66
to the distribution networks by ENERGEX and Ergon. This investment will ensure that the State maintains reliable and secure transmission and distribution electricity networks.
The Government’s recently-commissioned state-of-the-art Kogan Creek Power Station has added another 750 megawatts of generation capacity to the State. Government-owned generators continue to examine possible generation projects which, once further developed and submitted for consideration, will be examined by Government.
There has been a history of private sector participation in the State’s energy sector, including in joint venture arrangements with GOCs. The private sector currently owns 42.3% of total generation capacity within the State, which will increase to 48.6% with the commissioning of five new gas-fired plants currently under construction. In 2009-10, privately-developed and operated gas-fired generation will add an additional 1,516 megawatts of capacity to the State’s electricity supply. These plants will be progressively commissioned at Mt Stuart, Braemar, Darling Downs, Condamine and Yarwun.
While joint venture arrangements with private sector players provide GOCs with access to capital and expertise, it also indicates an environment that does not inhibit private sector investment in major infrastructure assets in the State and is a reflection of the confidence of the private sector to undertake significant investment in partnership with GOCs. Examples include the Callide C and Tarong North power stations in which private sector investors have a 50% interest. Private sector investors include major Japanese, Chinese and American energy companies.
GOCs continue to engage with private sector players in a range of energy-related activities, particularly in securing fuel supply for their generation plant. The CS Energy-owned Kogan Creek coal mine has been developed and is being operated by Golding Contractors, a major Queensland mining company. CS Energy has also been involved in facilitating the development of gas sources through farm-in arrangements with private sector gas companies such as Queensland Gas Corporation, Arrow Energy and Metgasco in the Surat basin and in northern New South Wales.
ZeroGen Mark II
ZeroGen is a leading-edge clean coal technology project aimed at integrating coal gasification with carbon capture and storage technologies to produce low emission baseload power. The integration of these technologies has the potential to achieve cuts of up to 90% in greenhouse gas emissions from large-scale commercial electricity generation.
The ZeroGen project has been reconfigured to a two-stage development involving a revised Stage One demonstration leading to a Stage Two commercial scale project.
Stage One of the ZeroGen project now involves the construction of an 80 megawatt coal gasification demonstration plant adjacent to the existing Stanwell Power Station. The proposed new plant for Stage One will demonstrate capture of up to 75% of carbon dioxide emissions and also demonstrate underground storage by transporting carbon dioxide to identified geological storage sites in the Northern Denison Trough. A Stage One feasibility study is presently scheduled for completion in late 2009.
With additional funding support, Stage Two of the project can be developed concurrently with Stage One and will involve the deployment of a large-scale 300 megawatt coal gasification plant with 90% carbon capture and storage facilities. A pre-feasibility study will investigate suitable areas in Queensland for the location of the Stage Two project.
The State has currently committed, through the Queensland Future Growth Fund, funding of $102.5 million for the ZeroGen project, with the Australian Coal Association, through the COAL21 Fund, providing a further
67
$26 million towards costs of the Stage One feasibility study. The Queensland Government and ZeroGen Pty Ltd will also be seeking Australian Government and private sector funding support for the ZeroGen Stage One demonstration plant and Stage Two feasibility studies.
Market developments
In the 2006-07 financial year, Government-owned generators operated in an increasingly volatile and competitive market, with drought conditions having varied impacts on generation capacity and profitability for the generators, depending on their access to water and exposure to pool prices. The commissioning of Kogan Creek Power Station, with its advanced design utilising dry-cooling technology (which results in 90% less water consumption than an equivalent-sized wet-cooled power station) was of considerable benefit to the State in providing capacity to manage the drought issue.
Generators, in particular Tarong, have also faced fuel supply issues. Tarong, in response to its diminishing coal supply at Meandu mine, is currently progressing preliminary development activities associated with the Kunioon coal resource, thereby working to ensure its ability to continue to provide generation capacity for Queenslanders.
The Government has moved to ensure security of water supply by investing approximately $9 billion in water infrastructure. A key element of this initiative is the provision of recycled water to the Swanbank and Tarong sites. Swanbank began receiving recycled water in August 2007 and Tarong will commence receiving recycled water from 1 July 2008. These measures guarantee water supply to the two sites and secure continued operation of these plants in similar future drought conditions.
More recently, the Queensland Government decided to divest its interests in wind and gas assets owned by Government-owned generators to climate change initiatives. Proceeds from the sale will enable a fixed ongoing allocation of $30 million per annum for greenhouse gas reduction programs and climate change adaptation actions. Consolidation across the Government generation portfolio has also occurred with the wind-up of Enertrade in April 2008.
Ergon franchise load
Ergon was formed in 1999 by the State Government from the then six regional Queensland electricity distributors and their subsidiary retailers. Ergon Energy Queensland Limited (EEQ) was formed as a wholly-owned subsidiary of Ergon and became operational from 1 November 2006. It was created to provide electricity retail services to the 600,000 plus non-market customers in regional Queensland who were transferred from Powerdirect Australia prior to its sale.
The Government is committed to ensuring that Queenslanders, regardless of where they live in the State, should have access to affordable electricity supply. The Government provides a maximum uniform tariff across Queensland in order to ensure Queenslanders are not disadvantaged by the higher cost of supplying electricity in regional areas. This policy is supported by community service obligation payments by the Government to EEQ, which in 2008-09 are budgeted to be $440 million. The Government also provides a range of concessions to eligible persons to reduce the cost of their electricity bills.
Regulation under the Australian Energy Regulator
Economic regulation of Queensland’s energy sector increasingly falls under the auspices of the Australian Energy Regulator (AER). The AER regulates the wholesale electricity market and electricity transmission and distribution networks in the national electricity market (NEM). The AER will also be responsible for the economic regulation of gas transmission and distribution networks and enforcing the national gas law and national gas rules (once enacted) as well as regulation of retail markets with the exception of retail pricing in all jurisdictions except Western Australia.
68
Since 1 July 2007 Powerlink has operated under the AER’s transmission revenue regulation, with ENERGEX and Ergon operating under the QCA’s regulatory determination for electricity distribution until 30 June 2010. The next distribution regulatory determination will be set by the AER prior to 1 July 2010.
While the transition from the QCA to the AER presents new challenges and risks for ENERGEX and Ergon, the Queensland Government recognises the importance of a consistent regulatory regime across NEM jurisdictions. The Queensland Government is aware that there are a number of factors that will apply significant upward pressure on distribution tariffs in 2010-11, including the increased demand on the ENERGEX and Ergon networks, and increasing input costs (particularly construction costs). This is likely to coincide with upward pressure on energy costs resulting from the introduction of an Emissions Trading Scheme.
WATER SECTOR
In May 2007, the Queensland Water Commission delivered a report to Government recommending major structural reform of urban water supply arrangements in South East Queensland (SEQ). Historically, the institutional arrangements for water supply have been provincial and fragmented, with bulk source, transport and treatment assets owned by 25 different entities, servicing 17 separate retail businesses.
The Commission’s recommendations targeted the serious systemic weaknesses inherent in the existing arrangements as highlighted by the current drought.
The key reforms accepted by the Government include transitioning control and operation of larger bulk water assets to the State, the establishment of a Water Grid Manager and the amalgamation of local governments’ distribution and retail water businesses.
The passage of the South East Queensland Water (Restructuring) Act 2007 (the Water Restructuring Act) in November 2007 helps facilitate the bulk water supply and transport business restructure. Under the revised institutional arrangements, the State—via three new statutory authorities—will control and operate the larger bulk water assets that hold, manufacture and distribute bulk water in the region.
The Water Restructuring Act also provides for the establishment of a Water Grid Manager, to be responsible for equitable distribution of water across the region through a water grid from 1 July 2008.
With the amalgamation of local governments’ distribution and retail water businesses, local governments will be responsible for distributing and selling water to consumers through one distribution entity and a number of retailers. Councils have until July 2010 to give effect to these reforms.
As part of the first stage of the Government’s reforms, SEQ local governments will receive over $2 billion in compensation for the bulk water assets being transferred to the Queensland Bulk Water Supply Authority and Queensland Bulk Water Transport Authority. The compensation is determined on the basis of foregone earnings and in line with council pricing and regulatory principles. The acquisition of existing bulk water businesses is being debt funded. To limit the impact on the overall level of combined local-State Government debt, compensation for the acquisition of assets is being applied to the repayment of councils’ debt in the first instance.
SEQ councils will continue to own, and be entitled to the dividends from, around 82% of their total water assets being retained through the distribution and retail businesses.
To meet current and future water supply needs for SEQ, new water infrastructure is currently being built by four special-purpose vehicle companies established by the Government. These include the $1.2 billion SEQ (Gold Coast) Desalination Company and the $2.5 billion Western Corridor Recycled Water Company, both of which are expected to complete their core construction projects by the end of 2008.
69
The Government-owned Queensland Water Infrastructure Company has commenced design on the $1.6 billion Traveston Crossing and $0.3 billion Wyaralong dams, both of which are currently awaiting environmental approvals. These dams are expected to be completed by 2011. The Southern Regional Water Pipeline Company is constructing an interconnecting pipe network (Southern, Northern and Eastern) to link these bulk water sources, at an estimated cost of over $1.5 billion. Expenditure in 2008-09 on new infrastructure is estimated to be over $2 billion with the total cost of the new infrastructure being approximately $9 billion.
South East Queensland is not the sole focus for the development of water projects to ensure water security across the State of Queensland. SunWater will continue to progress feasibility investigations and prepare business cases for key regional water projects in line with the Program of Works for Statewide Water Grid Regional Water Projects. These projects include the Nathan Dam, Connors River Dam, Fitzroy River Weir, Nullinga Dam, Kinchant Dam and Water for Bowen.
FORESTRY
Forestry Plantations Queensland (FPQ) will continue the expansion of its hardwood sawlog plantations to satisfy the Government’s commitment under the Western Hardwoods Region Plan to make available 20,000 hectares of hardwood sawlog plantations.
FPQ will continue to progress the commercial reform of its plantation forestry business to improve operations and promote the long term sustainability and overall competitiveness of Queensland’s plantation timber industry.
70
5. REVENUE
FEATURES
| | • | | Total General Government sector revenue is estimated to be $36.582 billion in 2008-09. The increase of $4.306 billion (or 13.3%) on 2007-08 estimated actual revenue primarily reflects increased coal royalty revenue, along with moderate growth in taxation revenue, relative to recent years. |
| | • | | Mortgage duty will be abolished from 1 July 2008, providing $190 million in tax relief in 2008-09, including $100 million associated with bringing forward the abolition by six months. |
| | • | | The first home buyer transfer duty exemption threshold and principal place of residence concessional rate threshold will both increase from $320,000 to $350,000 from 1 July 2008. The first home buyer exemption threshold will further increase to $500,000 from 1 September 2008. |
| | • | | The transfer duty rate schedule will be revised and simplified, reducing the number of rate bands from seven to five from 1 July 2008, with the highest marginal rate increasing from 4.5% to 5.25%. |
| | • | | The combination of the new transfer duty rate schedule and increased thresholds for homebuyers will mean lower duty payable for homebuyers purchasing homes valued at between $320,000 and $1 million and those purchasing property, other than homes, valued at up to $590,000. |
| | • | | The land tax schedule will be revised and simplified from 1 July 2008, reducing the number of rate bands from five to three for resident individuals and from four to two for companies, trustees and absentees. |
| | • | | The amount of tax payable at the land tax threshold will be reduced from $1,200 to $500 for resident individuals and reduced from $2,250 to $1,450 for companies, trustees and absentees. |
| | • | | Employers with eligible wages between $1 million and $5 million will benefit from an extended payroll tax deduction, from 1 July 2008. |
| | • | | Overall, the tax changes above will result in a net tax reduction of $157.4 million in 2008-09. |
| | • | | Queensland will retain its competitive tax status, with per capita state tax estimated at $2,342 in 2008-09, compared to an average of $2,616 for the other states and territories. |
| | • | | A two tier royalty on coal will be introduced from 1 July 2008, with the current 7% rate to apply to coal revenue up to $100 per tonne, with a higher 10% rate to apply to the portion of revenue above $100 per tonne. |
| | • | | Revised royalty rates for base and precious metals will be introduced from 1 January 2011, at the conclusion of the current five year nomination period. |
71
INTRODUCTION
This chapter provides an overview of General Government sector revenue for the 2007-08 estimated actual outcome, forecasts for the 2008-09 Budget year and projections for 2009-10 to 2011-12.
Table 5.1
General Government revenue1
| | | | | | | | | | | | |
| | | 2007-08
Budget
$ million | | 2007-08
Est. Act.
$ million | | 2008-09
Budget
$ million | | 2009-10
Projected
$ million | | 2010-11
Projected
$ million | | 2011-12
Projected
$ million |
| | | | | | |
Revenue | | | | | | | | | | | | |
Taxation revenue | | 9,272 | | 9,552 | | 10,106 | | 10,843 | | 11,753 | | 12,612 |
Grants revenue | | | | | | | | | | | | |
Current grants | | 13,726 | | 14,474 | | 14,631 | | 14,869 | | 15,088 | | 15,550 |
Capital grants2 | | 1,441 | | 1,018 | | 1,056 | | 1,180 | | 1,172 | | 1,152 |
Sales of goods and services | | 3,005 | | 3,245 | | 3,385 | | 3,369 | | 3,465 | | 3,524 |
Interest income | | 2,190 | | 841 | | 2,199 | | 2,253 | | 2,335 | | 2,421 |
Dividend and income tax equivalent income | | | | | | | | | | | | |
Dividends | | 915 | | 970 | | 841 | | 1,039 | | 1,160 | | 1,571 |
Income tax equivalent income | | 201 | | 247 | | 210 | | 453 | | 539 | | 632 |
Other revenue | | | | | | | | | | | | |
Royalties and land rents | | 1,436 | | 1,449 | | 3,644 | | 2,860 | | 2,746 | | 2,542 |
Other | | 366 | | 481 | | 509 | | 374 | | 378 | | 382 |
Total Revenue | | 32,551 | | 32,276 | | 36,582 | | 37,240 | | 38,638 | | 40,385 |
Notes:
| 1. | Numbers may not add due to rounding. |
| 2. | The variance between the 2007-08 Budget and Estimated Actual primarily relates to an Australian Government grant, expected to be expensed by the General Government sector to the Western Corridor Recycled Water Scheme, but was instead paid directly to Western Corridor Recycled Water Pty Ltd, a Public Non-financial Corporations sector entity. |
Forward estimates are based on the economic projections outlined in Chapter 2 and are formulated on a no policy change basis.
General Government revenue in 2007-08 is estimated to be $32.276 billion, which is $275 million (or 0.8%) less than the 2007-08 Budget estimate.
Significant variations include:
| | • | | lower interest income, reflecting the weakness in investment markets, which is expected to result in the return from the State’s financial assets in 2007-08 being lower than the assumed long-term rate of return |
| | • | | higher current grants revenue, primarily due to stronger than anticipated GST revenues, flowing from an increase in the GST pool against Queensland’s declining share of GST, and increased specific purpose payments across a range of functions |
| | • | | higher taxation revenue, primarily due to increased revenue from duty on property transfers as a result of stronger than anticipated market activity during the first half of 2007-08, overcoming softer results in the second half. |
General Government revenue in 2008-09 is estimated to be $36.582 billion, 13.3% higher than the 2007-08 estimated actual revenue of $32.276 billion. This is largely due to:
| | • | | increased coal royalties, reflecting both an increase in the value of coal and changes to the royalty rate structure |
72
| | • | | interest income returning to 7.5%, reflecting the interest earned on the QTC debt instrument, as discussed in Chapter 1. |
Revenue by Operating Statement Category
Major sources of General Government revenue in 2008-09 are grants and subsidies (42.9% of revenue) and taxation revenue (27.6%). Chart 5.1 illustrates the composition of General Government revenue.
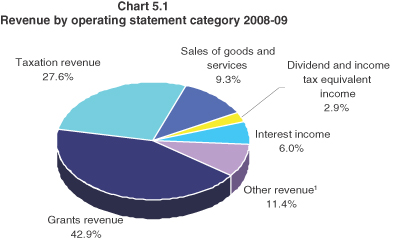
Note:
| 1. | The major component of ‘Other revenue’ is royalties and land rents (10.0%). |
Chart 5.2 compares 2008-09 estimates with 2007-08 estimated actuals. The overall result primarily reflects strong growth in royalties and interest income, supplemented by moderate growth in taxation revenue and grants revenue.
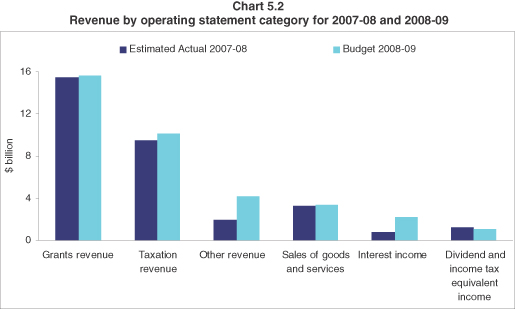
73
TAXATION REVENUE
One of the Queensland Government’s key social and fiscal objectives is to maintain a competitive tax environment while raising sufficient revenue to meet the infrastructure and Government service delivery needs of the people of Queensland.
Total revenue from taxation is expected to increase by 5.8% in 2008-09. This reflects the expected impact of continued strength in employment and wage growth on payroll tax revenue and the impact of higher property values on land tax.
Table 5.2
Taxation revenue1
| | | | | | |
| | | 2006-07
Actual
$ million | | 2007-08
Est. Act.
$ million | | 2008-09
Budget
$ million |
Payroll tax | | 2,232 | | 2,482 | | 2,702 |
| | | |
Duties | | | | | | |
Transfer2 | | 2,542 | | 2,970 | | 3,141 |
Vehicle registration | | 289 | | 380 | | 518 |
Insurance3 | | 361 | | 386 | | 403 |
Mortgage | | 343 | | 335 | | 15 |
Other duties4 | | 25 | | 6 | | 14 |
Total duties | | 3,560 | | 4,077 | | 4,091 |
| | | |
Gambling taxes and levies | | | | | | |
Gaming machine tax | | 489 | | 535 | | 578 |
Health Services Levy | | 29 | | 39 | | 47 |
Lotteries taxes | | 201 | | 202 | | 210 |
Wagering taxes | | 36 | | 37 | | 38 |
Casino taxes and levies5 | | 57 | | 58 | | 61 |
Keno tax | | 13 | | 16 | | 17 |
Total gambling taxes and levies | | 825 | | 886 | | 950 |
| | | |
Other taxes | | | | | | |
Land tax | | 485 | | 622 | | 797 |
Motor vehicle registration | | 887 | | 945 | | 991 |
Fire levy | | 252 | | 264 | | 279 |
Community Ambulance Cover | | 115 | | 128 | | 133 |
Guarantee fees | | 67 | | 84 | | 98 |
Other taxes | | 60 | | 64 | | 65 |
| | | |
Total taxation revenue | | 8,484 | | 9,552 | | 10,106 |
Notes:
| 1. | Numbers may not add due to rounding. |
| 2. | Includes marketable securities duty in 2006-07. |
| 3. | Includes duty on accident insurance premiums. |
| 4. | Includes duty on rental arrangements in 2006-07 and life insurance premiums in all years. |
| 5. | Includes community benefit levies. |
Budget tax initiatives
Transfer duty
Increased concessions—first home buyers
Queensland currently provides a transfer duty exemption for first home buyers purchasing a home valued at up to $320,000. Based on the current duty rates, this represents a saving of up to $9,675 compared to the duty payable by purchasers who do not receive a concession.
74
This Budget increases the first home buyer transfer duty exemption to $350,000 from 1 July 2008, providing further savings of up to $1,650 for those purchasing their first home.
In addition, from 1 September 2008 the first home buyer transfer duty exemption will be increased to $500,000, providing savings of up to $9,500 when compared with the current schedule. This will ensure that the duty payable on a first home is either nil or lower in Queensland than in any other jurisdiction for all first home buyers purchasing a home valued at up to approximately $1.5 million.
This initiative will provide savings of $54.1 million to first home buyers in 2008-09 and will result in first home buyers paying up to $15,925 less than purchasers who do not receive a concession.
Table 5.3 provides an interstate comparison of the transfer duty payable on the purchase of a first home, from 1 September 2008.
Table 5.3
Duty payable on first home purchases, from 1 September 2008
| | | | | | | | | | | | |
Dutiable Value $ | | QLD
$ | | NSW
$ | | Vic
$ | | WA
$ | | SA
$ | | Tas
$ |
100,000 | | — | | — | | — | | — | | 1,415 | | — |
200,000 | | — | | — | | 3,370 | | — | | 5,615 | | 1,675 |
300,000 | | — | | — | | 8,370 | | — | | 11,330 | | 5,550 |
400,000 | | — | | — | | 13,370 | | — | | 16,330 | | 13,550 |
500,000 | | — | | — | | 18,970 | | — | | 21,330 | | 17,550 |
600,000 | | 12,850 | | 22,490 | | 31,070 | | 22,515 | | 26,830 | | 21,550 |
700,000 | | 17,350 | | 26,990 | | 37,070 | | 27,265 | | 32,330 | | 25,550 |
800,000 | | 21,850 | | 31,490 | | 43,070 | | 32,316 | | 37,830 | | 29,550 |
900,000 | | 26,350 | | 35,990 | | 49,070 | | 37,466 | | 43,330 | | 33,550 |
1,000,000 | | 31,000 | | 40,490 | | 55,000 | | 42,616 | | 48,830 | | 37,550 |
1,500,000 | | 57,250 | | 66,740 | | 82,500 | | 72,200 | | 76,330 | | 57,550 |
Increased concessions—homebuyers
Queensland also currently provides a principal place of residence concession, by applying a 1% rate to the first $320,000 of the value of the home. Based on the current duty rates, this represents a saving of up to $6,475 for those purchasing their own home, other than their first.
This Budget increases the principal place of residence concession to the first $350,000 of the value of the home from 1 July 2008, providing further savings of up to $750 for those purchasing their own home, other than their first.
Queensland’s transfer duty concessions for homebuyers are already significant, particularly when considered in the context of concessions available in other states. The increased concession will ensure that less duty is payable in Queensland than in any other state on the purchase of a home valued at up to approximately $1.5 million.
This initiative will provide savings of $16.9 million to homebuyers in 2008-09 and will result in homebuyers paying up to $7,175 less than purchasers who do not receive a concession.
75
Table 5.4 provides an interstate comparison of the transfer duty payable on the purchase of a home, other than a first home, from 1 July 2008.
Table 5.4
Duty payable on home purchases, from 1 July 2008
| | | | | | | | | | | | |
Dutiable Value $ | | QLD
$ | | NSW
$ | | Vic
$ | | WA
$ | | SA
$ | | Tas
$ |
100,000 | | 1,000 | | 1,990 | | 2,150 | | 1,500 | | 2,830 | | 2,425 |
200,000 | | 2,000 | | 5,490 | | 6,370 | | 5,035 | | 6,830 | | 5,675 |
300,000 | | 3,000 | | 8,990 | | 11,370 | | 8,835 | | 11,330 | | 9,550 |
400,000 | | 5,250 | | 13,490 | | 16,370 | | 13,015 | | 16,330 | | 13,550 |
500,000 | | 8,750 | | 17,990 | | 21,970 | | 17,765 | | 21,330 | | 17,550 |
600,000 | | 12,850 | | 22,490 | | 31,070 | | 22,515 | | 26,830 | | 21,550 |
700,000 | | 17,350 | | 26,990 | | 37,070 | | 27,265 | | 32,330 | | 25,550 |
800,000 | | 21,850 | | 31,490 | | 43,070 | | 32,316 | | 37,830 | | 29,550 |
900,000 | | 26,350 | | 35,990 | | 49,070 | | 37,466 | | 43,330 | | 33,550 |
1,000,000 | | 31,000 | | 40,490 | | 55,000 | | 42,616 | | 48,830 | | 37,550 |
1,500,000 | | 57,250 | | 66,740 | | 82,500 | | 72,200 | | 76,330 | | 57,550 |
Revised transfer duty rate structure
In addition to the increased exemptions for first home buyers and concessions for other home buyers, this Budget revises and simplifies the transfer duty rate structure and generally improves competitiveness with other states. The new transfer duty rate structure is presented in Table 5.5.
Table 5.5
Transfer duty rates from 1 July 2008—standard rates1
| | | | | | |
Dutiable value | | Current | | Dutiable value | | New |
up to $20,000 | | 1.50% | | up to $5,000 | | Nil |
$20,001-$50,000 | | $300 + 2.25% | | $5,001 - $75,000 | | 1.50% |
$50,001-$100,000 | | $975 + 2.75% | | | | |
$100,001-$250,000 | | $2,350 + 3.25% | | $75,001 - $540,000 | | $1,050 + 3.50% |
$250,001-$500,000 | | $7,225 + 3.50% | | | | |
$500,001-$700,000 | | $15,975 + 4.00% | | $540,001 - $980,000 | | $17,325 + 4.50% |
above $700,000 | | $23,975 + 4.50% | | above $980,000 | | $37,125 + 5.25% |
Note:
| 1. | Rates are marginal rates unless otherwise specified. |
When combined with the increase in concessions and exemptions for homebuyers and first home buyers, the revised transfer duty schedule will mean a reduction in duty payable on all homes valued at between $320,000 and $1 million.
The revised structure will also result in a reduction in duty payable on the purchase of all other property, other than homes, valued up to $590,000.
It is expected that the changes to transfer duty will result in a lower amount of duty being payable for a substantial majority of transactions. Approximately 75% of transactions that occurred during 2007 would have been subject to a lower rate of duty, while there would have been no change for a further 15% of transactions.
76
Table 5.6 details the changes to duty payable at standard rates and for those receiving a homebuyer concession or first home buyer exemption, across a range of values. Table 5.6 also identifies the standard amount of duty payable in selected states.
The changes to transfer duty rates will take effect from 1 July 2008. When combined with the increased first home buyer exemption and homebuyer concession thresholds, the changes are expected to provide an additional $74.6 million of revenue in 2008-09, due to the application of higher duty rates to properties with relatively high values.
| | | | | | | | | | | | | | | | | | |
Table 5.6 Changes to transfer duty payable and interstate comparison, 1 September 2008 |
| | | First home
buyers
duty payable | | Homebuyers
(not first)
duty payable | | Standard rates
duty payable | | Interstate comparison–
duty payable at
standard rates |
Dutiable value $ | | New
$ | | Saving
$ | | New
$ | | Saving
$ | | New
$ | | Saving
$ | | NSW
$ | | VIC
$ | | WA
$ |
100,000 | | — | | — | | 1,000 | | — | | 1,925 | | 425 | | 1,990 | | 2,150 | | 2,090 |
200,000 | | — | | — | | 2,000 | | — | | 5,425 | | 175 | | 5,490 | | 7,070 | | 5,890 |
300,000 | | — | | — | | 3,000 | | — | | 8,925 | | 50 | | 8,990 | | 13,070 | | 10,165 |
350,000 | | — | | 1,650 | | 3,500 | | 750 | | 10,675 | | 50 | | 11,240 | | 16,070 | | 12,540 |
400,000 | | — | | 4,400 | | 5,250 | | 750 | | 12,425 | | 50 | | 13,490 | | 19,070 | | 14,915 |
500,000 | | — | | 9,500 | | 8,750 | | 750 | | 15,925 | | 50 | | 17,990 | | 25,070 | | 19,665 |
750,000 | | 19,600 | | 150 | | 19,600 | | 150 | | 26,225 | | -550 | | 29,240 | | 40,070 | | 32,540 |
1,000,000 | | 31,000 | | — | | 31,000 | | — | | 37,475 | | -700 | | 40,490 | | 55,000 | | 45,415 |
2,000,000 | | 83,500 | | -7,500 | | 83,500 | | -7,500 | | 90,675 | | -8,200 | | 95,490 | | 110,000 | | 96,915 |
Abolition of mortgage duty
In the 2005-06 Budget, the Queensland Government announced a tax abolition schedule as part of the Intergovernmental Agreement on the Reform of Commonwealth–State Financial Relations (IGA), which included a halving of the rate of mortgage duty from 1 January 2008, with abolition of mortgage duty from 1 January 2009.
This Budget brings forward the abolition of mortgage duty to 1 July 2008, providing benefits for Queensland homebuyers, investors and businesses taking out a mortgage.
The abolition of mortgage duty will provide total savings of approximately $190 million to taxpayers in 2008-09. This includes a $90 million saving from the previous commitment to abolish mortgage duty from 1 January 2009 and a further $100 million saving due to bringing forward the abolition to 1 July 2008.
Concessions to assist older persons
The Queensland Government recognises that as a person ages they are often required to make changes to their living arrangements, which may result in transitional costs, including taxes.
This Budget, therefore, introduces a package of concessions to assist older persons. These concessions include:
| | • | | extending the transfer duty home concession to retirement village residents who adopt lease and sub-lease occupancy arrangements |
| | • | | providing a land tax exemption for aged care facilities, which will complement the existing exemption for retirement villages |
| | • | | reducing the application of the provision that provides for retrospective assessment of land tax on the subdivision of a principal place of residence. |
77
Land tax relief package
Queensland has experienced strong growth in land values for a number of years. Although the taxation consequences have been mitigated by the application of three-year averaging and 50% capping of land valuation increases for assessments, the Government has also taken substantial steps to moderate the increase in the numbers of landowners liable for land tax and growth in land tax liabilities for landowners already in the system.
If the land tax schedule in place during 2002-03 had been retained, it is estimated that the Government would be receiving an additional $450 million in land tax revenue in 2008-09.
This Budget continues the Government’s program of land tax relief and simplification through the revision of the land tax schedules.
The new land tax schedule for resident individuals is presented in Table 5.7.
Table 5.7
Land tax schedules for 2008-09—resident individuals1
| | | | | | |
Unimproved Land Value | | Current | | Unimproved Land Value | | New |
$600,000-$749,999 | | $1,200 + rate of 0.70% | | $600,000 - $999,999 | | $500 + rate of 1.00% |
$750,000-$1,249,999 | | $2,250 + rate of 1.45% | | | | |
$1,250,000-$1,999,999 | | $9,500 + rate of 1.50% | | $1,000,000 - $2,999,999 | | $4,500 + rate of 1.65% |
$2,000,000-$2,999,999 | | $20,750 + rate 1.675% | | | | |
$3,000,000 and above | | 1.25% on full value | | $3,000,000 and above | | 1.25% on full value |
Note:
| 1. | Rates are marginal rates unless otherwise specified. |
The current $600,000 threshold, the highest of any state, will be maintained, with the tax payable at the threshold to be reduced from $1,200 to $500. Table 5.8 provides an interstate comparison of land tax thresholds and maximum land tax rates applicable in 2008-09.
Table 5.8
Land tax thresholds and maximum rates—resident individuals, 2008-09
| | | | | | | | | | | | | | | | | | | | | | | | |
| | | QLD | | | NSW | | | VIC | | | WA | | | SA | | | TAS | |
Threshold | | $ | 600,000 | | | $ | 359,000 | | | $ | 225,000 | | | $ | 300,000 | | | $ | 110,000 | | | $ | 25,000 | |
Maximum rate1 | | | 1.25 | % | | | 1.6 | % | | | 2.5 | % | | | 2.3 | % | | | 3.7 | % | | | 2.5 | % |
Note:
| 1. | The maximum rate is the rate applying to the highest value landholding band. |
Approximately 88% of resident individual land tax payers, representing approximately 15,000 taxpayers with taxable land holdings valued at up to $1.8 million (after averaging and capping), will benefit as a result of the change, compared with the current schedules.
This Budget also provides land tax relief for companies, trustees and absentees through simplification and revision of the rate structure. The new land tax schedule for companies, trustees and absentees is presented in Table 5.9.
This will result in approximately 17,500 companies, trustees and absentees with taxable land holdings valued at up to $750,000 (after averaging and capping) being better off as a result of the change. The current $350,000 threshold, which is already competitive, will be maintained, with the tax payable at the threshold reduced from $2,250 to $1,450.
78
Table 5.9
Land tax schedules for 2008-09—companies, trustees and absentees1
| | | | | | |
Unimproved Land Value | | Current | | Unimproved Land Value | | New |
$350,000-$749,999 | | $2,250 + rate of 1.50% | | | | |
$750,000-$1,249,999 | | $8,250 + rate of 1.65% | | $350,000 - $2,249,999 | | $1,450 + rate of 1.70% |
$1,250,000-$1,999,999 | | $16,500 + rate 1.80% | | | | |
$2,000,000 and above | | 1.50% on full value | | $2,250,000 and above | | 1.50% on full value |
Note:
| 1. | Rates are marginal rates unless otherwise specified. |
The revisions to the land tax rate structures will take effect from 1 July 2008 and are estimated to provide $17 million in land tax relief in 2008-09.
This package continues the land tax reforms introduced by the Queensland Government in the past four Budgets, which included threshold increases, rate reductions and the introduction of a 50% cap on taxable values. In addition, it is estimated that the revenue foregone as a result of three-year averaging is approximately $304 million in 2008-09.
Payroll tax deduction extension
Queensland currently has a competitive payroll tax threshold of $1 million and a highly competitive payroll tax rate of 4.75%. However, the Queensland Government recognises the effective marginal payroll tax rate immediately above the exemption threshold has a particular impact on the tax payable by medium sized businesses.
This Budget further improves the competitiveness of Queensland’s payroll tax regime by extending the $1 million deduction such that it phases out at a rate of $1 in every $4 of taxable wages above the threshold, rather than $1 in every $3. This will provide a benefit to all businesses with taxable wages between $1 million and $5 million.
The extension of the payroll tax deduction is estimated to provide $20 million in payroll tax relief in 2008-09.
The Queensland Government has also announced a policy decision to review the rate at which the deduction phases out in subsequent Budgets.
Abolition of state taxes
The IGA, agreed to by the Australian Government and all state and territory governments in 1999, required the abolition and review of a number of state taxes.
In accordance with the requirements of the IGA, transfer duty on quoted marketable securities and debits tax were abolished in 2001 and 2005 respectively. In 2005, Queensland participated in a multijurisdictional review into the need to retain a number of state duties, as required by the IGA. By abolishing these two duties and participating in the review of other listed duties, the Government met its IGA obligations for tax abolitions in full as of 1 July 2005.
Following the review of duties listed in the IGA, a timetable for the abolition of the majority of these duties was announced in the 2005-06 Budget and agreed to by the Australian Government in the Ministerial Council Meeting of March 2006.
79
The timing of the duty abolitions balances a range of community priorities, including the maintenance of the State’s tax competitiveness while funding the delivery of essential community services and the provision of critical new infrastructure.
The Government has completed a number of duty abolitions announced in the 2005-06 Budget, with the removal of credit business and lease duties from 1 January 2006, hire duty and marketable securities duty (unquoted) from 1 January 2007 and the halving of the rate of mortgage duty from 1 January 2008.
The 2008-09 Budget includes the abolition of mortgage duty from 1 July 2008, six months earlier than scheduled.
Following the abolition of mortgage duty, the only duty remaining on the schedule is duty on the transfer of core business assets, which is to be abolished by 2011.
The savings to Queenslanders from the abolition of these nine taxes has already risen from $290 million in 2005-06 to $840 million in 2008-09 and will rise to over $1.3 billion per year by 2011-12. The cost to revenue from the abolition of these taxes will exceed $5.4 billion over this seven year period.
Table 5.10 presents the full schedule of tax abolitions under the IGA.
Table 5.10
Abolition of state taxes under the IGA
| | | | | | |
Tax | | Description | | Abolition | | Full year
cost1 $ million |
| Marketable securities duty (quoted) | | Payable on the transfer of marketable securities listed on the Australian Stock Exchange or another recognised stock exchange. | | ü July 2001 | | 35 |
| | | |
| Credit card duty2 | | Payable on credit card transactions. | | ü August 2004 | | 20 |
| | | |
| Debits tax | | Payable on debits to accounts with cheque drawing facility. | | ü July 2005 | | 190 |
| | | |
| Lease duty | | Payable on the lease of land or premises in Queensland. Residential leases exempted. | | ü January 2006 | | 27 |
| | | |
| Credit business duty | | Payable on the amount of credit provided under a loan, a discount transaction or a credit arrangement. | | ü January 2006 | | 19 |
| | | |
| Hire duty | | Payable on the hiring charges of the hire of goods. | | ü January 2007 | | 19 |
| | | |
| Marketable securities duty (unquoted) | | Payable on the transfer of marketable securities not listed on the Australian Stock Exchange or another recognised stock exchange. | | ü January 2007 | | 17 |
| | | |
| Mortgage duty | | Payable on entering into a mortgage over property in Queensland. | | ü July 2008 six months ahead of schedule | | 439 |
| | | |
| Duty on transfer of core business assets | | Payable on the transfer of non-realty business assets. | | 50% 1 Jan 2010 100% 1 Jan 2011 | | 326 |
Notes:
| 1. | Estimated revenue foregone in financial year following full abolition. |
| 2. | Credit card duty was abolished prior to its review under the IGA. |
80
Estimates of state taxation revenue
Chart 5.3 indicates the composition of estimated state taxation revenue for 2008-09.
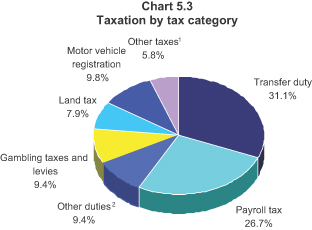
Notes:
| 1. | ‘Other taxes’ includes the fire levy, community ambulance cover, guarantee fees and other minor taxes. |
| 2. | ‘Other duties’ includes vehicle registration duty, insurance duty and other minor duties. |
The largest sources of taxation revenue are payroll tax and transfer duty, which together represent 57.8% of the State’s total taxation revenue in 2008-09.
Payroll tax (26.7% of total tax revenue in 2008-09) has a solid base with relatively stable growth driven by the underlying strength in the state economy. In contrast, revenue growth from transfer duty (representing 31.1% of tax revenue) can vary significantly from year to year with its base being subject to the volatile movements of the property market.
Other duties, including vehicle registration duty, insurance duty and other smaller duties, represent 9.4% of total tax revenue.
Gambling taxes and levies also represent 9.4% of tax revenues in 2008-09. Motor vehicle registration, which is classified as a tax for budget purposes, represents 9.8% of total tax revenue.
Land tax represents 7.9% of total revenue in 2008-09. While also subject to the volatility of price movements in the property market, this impact is moderated by a relatively stable base and the effect of three-year averaging of land values for assessments.
Payroll tax
Payroll tax is chargeable at a rate of 4.75% when the total yearly Australian taxable wages of an employer, or those of a group of related employers, exceed the exemption threshold of $1 million.
Payroll tax collections are estimated to increase by 8.9% in 2008-09, reflecting general growth in employment and wages, with particular strength in key industries, such as construction, mining and property and business services.
The payroll tax rate has been reduced in recent years from 5% to its current level of 4.75%, making Queensland’s payroll tax rate overall the lowest of any state. Further, an employer paying annual taxable wages of less than $1 million from 2007-08 is not liable for payroll tax—this is amongst the highest thresholds in Australia.
81
As mentioned above, the competitiveness of Queensland’s payroll tax regime will be enhanced via an extension of the $1 million deduction.
Duties
Duties are levied on a range of financial and property transactions. Overall, revenue from duties is forecast to increase by 0.3% in 2008-09. This moderate growth is driven by the abolition of mortgage duty almost entirely offsetting growth in the other major duties.
The major duties include transfer, vehicle registration and insurance duties.
| | • | | Transfer duty is charged at various rates on the transfer of real and business property. The Queensland Government offers extensive concessions for the transfer of land where the property is purchased as a first or subsequent home. |
Revenue from transfer duty is expected to increase by 5.8% in 2008-09 as a result of moderate growth in the Queensland property market and revisions to the rate structure being partly offset by increased concessions for homebuyers.
| | • | | Vehicle registration duty is charged at rates of between 2% and 4% of the dutiable value of a motor vehicle on the transfer or initial registration of the motor vehicle, with the rate depending on the number of cylinders of the vehicle. |
Revenue from vehicle registration duty is expected to experience underlying growth of 5% in 2008-09. Combined with the effect of new rate regime announced in the 2007-08 Budget, which commenced on 1 January 2008, total growth is expected to be 36.4%.
| | • | | Insurance duty is charged on contracts of general insurance, life insurance and accident insurance. The base rate for most general insurance products is 7.5%, with certain general insurance products, life insurance and accident insurance charged at the rate of 5%. |
Revenue from insurance duty is expected to grow by 4.3% in 2008-09, reflecting moderate growth in the number of insurance policies and the value of insured items.
Gambling taxes and levies
A range of gambling activities are subject to State taxes and levies. Total gambling tax and levy collections are estimated to increase by 7.2% in 2008-09, a slightly slower rate than is estimated for 2007-08, partly associated with the Government’s gambling reforms that will take effect from 1 January 2009. Gaming machine taxes are estimated to increase by 8%, the Health Services Levy by 20%, lotteries taxes by 4%, and other gambling taxes by 5%.
Land tax
Land tax is levied on the unimproved value of the landowner’s aggregated holdings of freehold land owned in Queensland as at midnight on 30 June each year. The principal place of residence is deducted from this value. A 50% cap on the annual increase in land values used for the purposes of calculating land tax liabilities commenced from 1 July 2007 and will continue until 2009-10.
Resident individuals are generally liable for land tax if the total unimproved value of the freehold land owned by that person as at 30 June is equal to or greater than $600,000. Companies, trustees and absentees are generally liable for land tax if the total unimproved value of the freehold land owned as at 30 June is equal to or greater than $350,000.
82
Land tax is estimated to grow by 28.1% in 2008-09, with strong underlying growth associated with recent increases in land values being partially offset by the revisions to the rate structure outlined above.
The application of three-year averaging for assessments, whereby the land value is determined by averaging the unimproved property values for the current and preceding two years rather than simply using the current year valuation, moderates and delays the impact of valuation increases. It is estimated that the revenue foregone as a result of three-year averaging will be approximately $304 million in 2008-09. Queensland was the first state to apply three-year averaging to land tax, with New South Wales also introducing averaging recently.
Motor vehicle registration fees
Motor vehicle registration fees are expected to grow by 4.8% in 2008-09, primarily reflecting fee adjustments related to the consumer price index (CPI).
Fire levy
Fire levy revenue, which is used to fund the Queensland Fire and Rescue Authority, is expected to increase in line with the growth of the number of contributors and CPI.
Community Ambulance Cover
The Community Ambulance Cover Scheme was introduced in 2003-04 to replace the Ambulance Subscription Scheme and to provide a sustainable funding base for the Queensland Ambulance Service. It is collected through a payment on non-exempt electricity accounts. Growth in 2008-09 reflects CPI adjustment and growth in the number of non-exempt electricity accounts.
Guarantee fees
Guarantee fees are revenues collected by Queensland Treasury Corporation (QTC) on behalf of the State and comprise performance dividends, competitive neutrality fees and credit margin fees. These fees promote competitive neutrality between public sector agencies and those in the private sector and ensure that the benefits accruing from the financial backing and superior borrowing performance of the State (through QTC) are shared between the borrower and the State.
Other taxes
Other taxes represent revenue from taxes such as the Statutory Insurance Scheme Levy, the Nominal Defendant Levy and other sundry taxes.
Tax expenditures
Tax expenditures are reductions in tax revenue that result from the use of the tax system as a policy tool to deliver Government policy objectives. Tax expenditures are provided through a range of concessions, including tax exemptions, reduced tax rates, tax rebates, tax deductions and provisions which defer payment of a tax liability to a future period. Appendix A provides details of tax expenditure arrangements set in place by the Queensland Government.
Queensland’s Competitive Tax Status
Taxation can impact on business decisions regarding investment and employment and also household investment and home ownership. Maintaining the competitiveness of Queensland’s tax system provides a competitive advantage to business and moderates the tax burden for its citizens and is therefore fundamental to the Government’s commitment to job creation and sustainable development.
83
Recent tax changes have sought to improve the efficiency and equity of the State’s tax system, increase consistency with other jurisdictions, strengthen the funding base of essential services and reduce or eliminate taxes to the benefit of taxpayers.
In pursuit of these objectives over recent years, the Government has:
| | • | | rationalised the payroll tax system by reducing the rate from 5% to 4.75%, offset by a broadening of the tax base |
| | • | | increased the payroll tax threshold from $850,000 to $1,000,000 |
| | • | | introduced legislation to harmonise Queensland’s payroll tax system with that in New South Wales and Victoria from 1 July 2008, reducing compliance costs for businesses operating across jurisdictions |
| | • | | increased the land tax threshold for resident individuals to $600,000 and the threshold for companies, trustees and absentees to $350,000 |
| | • | | provided land tax exemptions to moveable dwelling parks and expanded the principal place of residence exemption |
| | • | | applied a 50% cap on the annual increase in the value of land for the purposes of calculating land tax liability |
| | • | | introduced the Community Ambulance Cover to secure the funding base for the Queensland Ambulance Service, while minimising the impact through a range of exemptions |
| | • | | extended the transfer duty concession for purchases of first homes from $80,000 to $320,000 (with the concession phasing out at $500,000) |
| | • | | provided a transfer duty concession for first home buyers purchasing vacant land valued at up to $150,000 (with the concession phasing out at $300,000) on which to build their first home |
| | • | | increased some transfer duty rates to assist the funding of the Health Action Plan |
| | • | | extended the mortgage duty exemption threshold for first home buyers from $100,000 to $250,000 |
| | • | | halved the rate of mortgage duty |
| | • | | reduced the base insurance duty rate from 8.5% to 7.5% |
| | • | | revised the structure of vehicle registration duty rates |
| | • | | abolished transfer duty on quoted marketable securities, credit card duty, debits tax, lease duty, credit business duty, hire duty and unquoted marketable securities duty. |
Consistent with this commitment to ongoing tax reform, the Government has announced in this Budget:
| | • | | the abolition of mortgage duty from 1 July 2008, providing $190 million of tax relief in 2008-09, in addition to savings associated with the halving of mortgage duty rates from 1 January 2008 |
| | • | | an increase in the transfer duty exemption for first home buyers from 1 July 2008, such that there is no duty payable on the purchase of a first home valued at up to $350,000 (previously $320,000), with a further increase in the exemption to $500,000 from 1 September 2008 |
| | • | | an increase in the principal place of residence concession available to other homebuyers from $320,000 to $350,000 from 1 July 2008 |
| | • | | a simplification of the transfer duty rate structure from 1 July 2008, with an increase in the highest marginal rate, to provide additional revenue for service delivery and infrastructure provision |
| | • | | the net impact of the transfer duty changes is a reduction in the amount of duty payable on the purchase of all homes valued at between $320,000 and $1 million and all other properties valued at up to $590,000, offset by increases in rates applied to properties at higher values |
84
| | • | | a package of concessions to assist older persons from 1 July 2008 |
| | • | | a simplification of the land tax rate structure from 1 July 2008, including a reduction in the initial tax payable once the threshold has been reached, for both resident individuals and companies, trustees and absentees |
| | • | | an extension to the payroll tax deduction, such that taxpayers with eligible wages of up to $5 million (previously $4 million) will benefit from the deduction, from 1 July 2008. |
The Charter of Social and Fiscal Responsibility commits the Government to maintaining competitive tax levels in relation to other states. Table 5.11 demonstrates that this commitment is being met, with various measures of tax competitiveness all indicating the Queensland state tax system remains amongst the most competitive in Australia.
| | | | | | | | | | | | | | | | | | |
Table 5.11 Queensland’s tax competitiveness |
| | | QLD | | NSW | | VIC | | WA | | SA | | TAS4 | | ACT | | NT4 | | Avg5 |
Taxation per capita1 ($) | | 2,342 | | 2,747 | | 2,512 | | 3,016 | | 2,157 | | 1,706 | | 3,016 | | 1,809 | | 2,616 |
Taxation effort2 (%) | | 84.6 | | 104.0 | | 103.0 | | 102.7 | | 112.6 | | 95.5 | | 105.9 | | 101.6 | | 100.0 |
Taxation % of GSP3 (%) | | 4.34 | | 5.29 | | 4.73 | | 4.04 | | 4.67 | | 3.55 | | 4.30 | | 2.54 | | 4.75 |
Notes:
| | QLD, VIC, WA, ACT, NT State Budgets, NSW, SA, TAS, Mid Year Reviews. |
| 2. | 2006-07 data. Source: Commonwealth Grants Commission: 2008 Update. Revenue raising effort ratios, assessed by the Commonwealth Grants Commission, isolate policy impacts from revenue capacity impacts and are an indicator of the extent to which the governments burden their revenue bases. Queensland’s tax revenue raising effort is well below the Australian policy standard (equal to 100%). |
| 3. | 2006-07 data. Sources: ABS 5506.0 and ABS 5220.0. |
| 4. | Low taxation per capita primarily reflects the lower revenue raising capacity of those jurisdictions. |
| 5. | Weighted average of states and territories, excluding Queensland. |
As Table 5.11 shows, taxation per capita in Queensland is lower than the average taxation per capita in the other states. However, the gap has narrowed in recent years as strong economic growth in Queensland has resulted in significant increases in employment, leading to growth in payroll tax, and property values and volumes, leading to growth in transfer duty and land tax.
Other measures of competitiveness, such as taxation effort and taxation as a share of gross state product (GSP), provide a clearer view of the level of taxation imposed on the Queensland economy and confirm that Queensland’s taxes are competitive with other states.
Chart 5.4 provides further evidence that increases in taxation per capita are primarily the result of strong economic growth, rather than changes to taxation policy. The chart shows that, since 1999-2000, there have been seven years in which taxes were cut, with the most significant of these being the land tax reforms of 2005-06. There were two years in which taxes were increased (the Community Ambulance Cover levy was introduced in 2003-04 and transfer duty rates were increased in 2006-07 to help fund the Health Action Plan) and a year in which there was no net change to taxes.
85
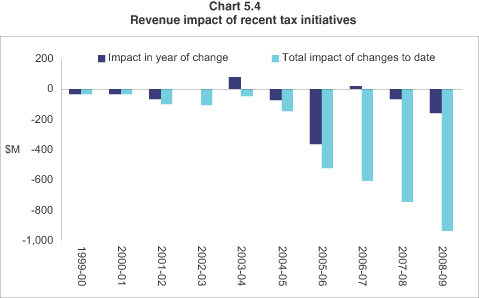
The net impact of these changes is that the level of taxation in 2008-09 is $934 million, or $216 per capita, lower than it would have otherwise been.
GRANTS REVENUE
Grants revenue is comprised of Australian Government grants, grants from the community and industry and other miscellaneous grants. Growth of $195 million (or 1.3%) in 2008-09 is primarily due to increases in GST revenue and health funding from the Australian Government.
Table 5.12
Grants revenue1
| | | | | | |
| | | 2006-07
Actual
$ million | | 2007-08
Est. Act.
$ million | | 2008-09
Budget
$ million |
Current grants | | | | | | |
Australian Government grants | | 13,081 | | 13,983 | | 14,119 |
Other grants and contributions | | 408 | | 491 | | 512 |
| | | |
Total current grants | | 13,489 | | 14,474 | | 14,631 |
| | | |
Capital grants | | | | | | |
Australian Government grants | | 819 | | 1,012 | | 1,054 |
Other grants and contributions | | 18 | | 6 | | 3 |
Total capital grants | | 837 | | 1,018 | | 1,056 |
| | | |
Total grants revenue | | 14,326 | | 15,492 | | 15,687 |
Note:
| 1. | Numbers may not add due to rounding. |
86
Australian Government payments
Australian Government payments to Queensland comprise:
| | • | | general purpose payments, comprised of GST revenue grants and associated payments. General purpose payments are ‘untied’ and are used for both recurrent and capital purposes |
| | • | | specific purpose payments (SPPs), including grants for health, education and roads, which are used to meet Australian Government and shared policy objectives. |
Australian Government payments to Queensland in 2008-09 are expected to total $15.172 billion, an increase of $177 million (or 1.2%) over payments in 2007-08.
Chapter 8 provides detailed background on Commonwealth-state financial arrangements, including an overview of the reforms the Council of Australian Governments has embarked on in relation to SPPs and National Partnership Payments.
Table 5.13
Australian Government payments1
| | | | | | |
| | | 2006-07
Actual
$ million | | 2007-08
Est. Act.
$ million | | 2008-09
Budget
$ million |
General purpose payments | | | | | | |
GST revenue grants and associated payments2 | | 8,092 | | 8,596 | | 8,686 |
| | | |
Specific Purpose Payments3,4 | | | | | | |
Queensland Health | | 2,008 | | 2,248 | | 2,429 |
Education, Training and the Arts | | 2,025 | | 2,075 | | 2,133 |
Main Roads | | 448 | | 703 | | 718 |
Local Government, Sport and Recreation | | 329 | | 367 | | 381 |
Disability Services Queensland | | 323 | | 351 | | 377 |
Housing | | 193 | | 203 | | 197 |
Other | | 481 | | 451 | | 251 |
Total Specific Purpose Payments | | 5,808 | | 6,399 | | 6,486 |
| | | |
Total Australian Government payments | | 13,900 | | 14,995 | | 15,172 |
Notes:
| 1 | Numbers may not add due to rounding. |
| 2 | Includes compensation for GST deferral relating to the Australian Government’s small business measures in 2006-07 and partial repayment of this compensation in 2007-08. |
| 3 | SPPs are shown by relevant Queensland Government department. 2006-07 data has been backcast to reflect current departmental responsibilities. |
| 4 | Differences between SPPs in this chapter and Australian Government Budget estimates can arise and generally reflect the outcome of agency-to-agency discussions or the absence of state level information. |
General purpose payments
GST revenue grants
GST revenue grants and associated payments to Queensland in 2008-09 are expected to be $8.686 billion, which represents an increase of $90 million on 2007-08. This reflects expected growth of $148 million (or 1.7%) in GST revenue being partly offset by reductions associated with other Australian Government decisions.
GST revenue projections are based on expected growth in economic parameters, such as household consumption and dwelling investment, which have a strong link to the GST base. The distribution of GST
87
revenues is based on the recommendations of the Commonwealth Grants Commission in accordance with the application of horizontal fiscal equalisation principles.
The 1.7% growth in GST payments to Queensland in 2008-09 compares with 7.4% average growth in GST payments to the other states and territories. The below-average growth in GST funding to Queensland takes into account the above-average growth in Queensland’s economy and the associated growth in own-source revenue, with 2008-09 being the first year in which Queensland’s share of GST funding is below a per capita share. Further declines in Queensland’s share of GST are expected, particularly as a result of strong growth in royalty revenue.
Specific purpose payments
SPPs for Queensland in 2008-09 are estimated at $6.486 billion, an increase of 1.4% from 2007-08.
Queensland Health
Queensland receives funding for public hospital services from the Australian Government under the Australian Health Care Agreement (AHCA). The AHCA provides the majority of Queensland Health’s Australian Government funding and is adjusted annually for population growth and increases in costs and utilisation. Queensland expects to receive almost $2 billion in Health Care Grants in 2008-09. The current AHCA was due to expire on 30 June 2008 but has been extended to 30 June 2009 while a new broader National Health Agreement is negotiated.
Queensland Health will also receive tied funding of $276 million in 2008-09 for a range of programs including Highly Specialised Drugs, Essential Vaccines and National Public Health. Queensland will also receive $60 million for nursing home benefits.
Department of Education, Training and the Arts
SPPs for education purposes comprise recurrent and capital grants for distribution to state and non-state schools and other organisations. The moderate increase in Australian Government grants in 2008-09 primarily reflects increased recurrent grants, which recognise cost indexation and enrolment growth.
The Australian Government also provides funding for a range of specific vocational education and training programs. In 2008-09, the department expects to receive around $236 million in vocational education and training funding.
Department of Main Roads
Funding is received from the Australian Government for infrastructure and maintenance works on the AusLink Network and for Black Spot Road Safety projects. The 2008-09 allocation reflects funding available under the Australian Government’s AusLink program.
Department of Local Government, Sport and Recreation
SPPs to the Department of Local Government, Sport and Recreation primarily relate to Financial Assistance Grants provided to local government in Queensland.
Disability Services Queensland
The current Commonwealth-State and Territory Disability Agreement is set to expire on 30 June 2008 and is proposed to be extended to December 2008. A new national disability services agreement is in the process of being negotiated between the Australian and state and territory governments.
88
Disability Services Queensland will also receive funding from the Australian Government for the Home and Community Care (HACC) program, with the Queensland Government accepting a new agreement that commenced on 1 July 2007. The HACC Review Agreement, coupled with projected growth funding, ensures the program is a key part of the community care system and will continue to assist frail older people and those with disabilities to live as independently as possible in their own homes.
Department of Housing
In 2008-09, the Department of Housing expects to receive $197 million in SPP funding, including funding under the Commonwealth-State Housing Agreement, which is due to expire on 31 December 2008, and the anticipated National Affordable Housing Agreement from 1 January 2009. This funding will be used for the continued development of a core social housing sector to assist people unable to access alternative suitable housing options, through the delivery of affordable, appropriate, flexible and diverse housing assistance responses that provide people with choice and are tailored to their needs, local conditions and opportunities.
Other
Other SPPs include funding for a range of programs including exceptional circumstances assistance and natural disaster relief.
Other grants and contributions
Other grants and contributions are funds received from other state and local government agencies, other bodies and individuals where there is no direct benefit to the provider. Contributions exclude Australian Government grants and user charges. The main sources of contributions are:
| | • | | those received from private enterprise and community groups to fund research projects and community services, including the contributions of parents and citizens associations to state schools |
| | • | | contributed assets and goods and services received for a nominal amount. |
Table 5.14
Other grants and contributions
| | | | | | |
| | | 2006-07
Actual
$ million | | 2007-08
Est. Act.
$ million | | 2008-09
Budget
$ million |
Other grants and contributions | | 426 | | 497 | | 515 |
Revenues will vary from year to year based on the number and size of research projects, assets transferred between the Government and the private sector and contributed assets and services.
SALES OF GOODS AND SERVICES
Sales of goods and services revenue comprises cost recoveries from the provision of goods or services. Revenue from this source is expected to increase by 4.3% in 2008-09.
89
Table 5.15
Sales of goods and services1
| | | | | | |
| | | 2006-07
Actual
$ million | | 2007-08
Est. Act.
$ million | | 2008-09
Budget
$ million |
Fee for service activities | | 1,065 | | 1,302 | | 1,294 |
TransLink | | 224 | | 239 | | 251 |
Rent revenue | | 320 | | 412 | | 465 |
Sale of land inventory | | 76 | | 100 | | 112 |
Hospital fees | | 277 | | 288 | | 274 |
Transport and traffic fees | | 226 | | 230 | | 241 |
Other sales of goods and services | | 699 | | 672 | | 746 |
Total sales of goods and services | | 2,889 | | 3,245 | | 3,385 |
Note:
| 1. | Numbers may not add due to rounding. |
Fee for service activities
Major items of fee for service activities across the General Government sector include:
| | • | | recoverable works carried out by both the Department of Main Roads and the commercialised arm of the department |
| | • | | fees charged by Technical and Further Education (TAFE) colleges |
| | • | | fees charged by CITEC for information and telecommunications services to the private sector. |
The Government provides concessions in the form of discounts, rebates and subsidies to improve access to and the affordability of a range of services for individuals or families based on eligibility criteria relating to factors such as age, income and special needs or disadvantage. Appendix B provides details of the concession arrangements established by the Queensland Government.
TransLink
Revenues arise from the arrangements associated with TransLink integrated ticketing and public transport arrangements, which commenced in July 2004. Instead of subsidising public transport operators for the gap between operating costs and revenues, the TransLink entity collects revenues from the operation of public transport services in South East Queensland to fund public transport services in the region. These revenues are estimated at $251 million in 2008-09.
Rent revenue
Rent revenue is earned on the rent or lease of Government buildings, housing, plant and equipment, motor vehicles and car parks. Major items under this category include public housing rentals and rents charged for Government buildings.
Sale of land inventory
Sale of land inventory comprises land sales undertaken by agencies, where the buying and selling of land is a core business activity of the agency, such as the Property Services Group under the Department of Infrastructure and Planning. As such, it is distinct from property disposals undertaken by most Government agencies.
90
Hospital fees
Hospital fees are collected by public hospitals for a range of hospital services. Fees include those received from private patients and other third party payers, as well as payments received from the Australian Government Department of Veterans’ Affairs for the treatment of veterans.
Transport and traffic fees
This category comprises state transport fees, the Traffic Improvement Fee, drivers’ licence fees and various marine licence and registration fees.
Other sales of goods and services
Other sales of goods and services includes items such as Title Registration Fees, recreational ship registrations and other licences and permits.
INTEREST INCOME
Interest income primarily comprises interest earned on the Treasurer’s Cash Balances, Queensland Future Growth Fund balances and investments held to finance future employee entitlements, for example superannuation and long service leave.
Table 5.16
Interest income
| | | | | | |
| | | 2006-07
Actual
$ million | | 2007-08
Est. Act.
$ million | | 2008-09
Budget
$ million |
Interest income | | 3,348 | | 841 | | 2,199 |
QTC manages the State’s short-term investments, such as the Treasurer’s Cash Balances, while the Queensland Investment Corporation manages the State’s long-term investments, primarily employee entitlement provisions (including assets held to meet employer superannuation liabilities). The State’s investment portfolio includes a diversified holding of equities, property, fixed interest and other diversified assets.
Entities such as the Public Trust Office, Nominal Defendant and Residential Tenancies Authority also have substantial investments held to meet future liabilities.
Chart 5.5 shows investment return rates achieved over time.
91
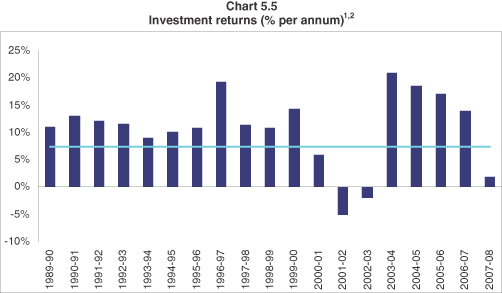
Notes:
| 1. | Line represents actuarial assumed long term average. |
| 2. | 2007-08 is an estimate. |
Source: 1989-90 to 2007-08: Queensland Investment Corporation
The weak performance of domestic and international equity markets negatively impacted interest income in 2007-08, with an estimated rate of return of 2%. This estimate is based on actual year-to-date investment returns at the time of the finalisation of the Budget estimates.
As discussed in Chapter 1, the Government has decided to transfer the assets it holds in the Consolidated Fund to meet future employee and other obligations to QTC in exchange for a debt instrument that earns the General Government sector 7.5% per annum. This transfer will allow the State to reduce the volatility in interest income and hence the General Government net operating balance.
DIVIDEND AND INCOME TAX EQUIVALENT INCOME
Dividends
Dividends are received from the State’s equity in Public Non-financial Corporations and Public Financial Corporations, for example, the Queensland electricity supply industry, Queensland Investment Corporation, port authorities and Queensland Rail.
Dividends are expected to decline by 13.3% in 2008-09, reflecting a reduction in dividends from the energy sector and the one-off dividend received from the Queensland Lotteries Corporation in 2007-08, following the Golden Casket transaction.
92
Table 5.17
Dividends1
| | | | | | |
| | | 2006-07
Actual
$ million | | 2007-08
Est. Act.
$ million | | 2008-09
Budget
$ million |
Energy sector | | 372 | | 556 | | 429 |
Transport sector (rail and ports) | | 227 | | 289 | | 376 |
Other2 | | 23 | | 124 | | 36 |
Total dividends | | 622 | | 970 | | 841 |
Notes:
| 1. | Numbers may not add due to rounding. |
| 2. | Includes dividends from Forestry Plantations Queensland, Queensland Investment Corporation, Queensland Lotteries Corporation and SunWater. |
In total, dividends account for 2.3% of total General Government revenue in 2008-09. Further detail on Public Non-financial Corporations is provided in Chapter 4 and Chapter 9.
Income tax equivalent income
Income tax equivalent income comprises payments by Government-owned corporations in lieu of state and Australian Government taxes and levies from which they are exempt. These payments arise from an agreement reached between the Australian Government and state governments in 1994 to establish a process for achieving tax uniformity and competitive neutrality between public sector and private sector trading activities.
Table 5.18
Income tax equivalent income1
| | | | | | |
| | | 2006-07
Actual
$ million | | 2007-08
Est. Act.
$ million | | 2008-09
Budget
$ million |
Energy sector | | 102 | | 175 | | 144 |
Transport sector (rail and ports) | | 47 | | 40 | | 36 |
Other | | 93 | | 32 | | 30 |
Total income tax equivalent income | | 241 | | 247 | | 210 |
Note:
| 1. | Numbers may not add due to rounding. |
OTHER REVENUE
Table 5.19
Other revenue1
| | | | | | |
| | | 2006-07
Actual
$ million | | 2007-08
Est. Act.
$ million | | 2008-09
Budget
$ million |
Royalties and land rents | | 1,430 | | 1,449 | | 3,644 |
Fines and forfeitures | | 209 | | 211 | | 241 |
Revenue nec | | 385 | | 270 | | 268 |
Total Other Revenue | | 2,024 | | 1,930 | | 4,154 |
Note:
| 1. | Numbers may not add due to rounding. |
93
Royalties and land rents
Budget royalty initiatives
The Queensland Government is charged with the responsibility of ensuring that the people of Queensland receive a fair and appropriate return on the non-renewable mineral and petroleum resources that they own.
The opportunity has been taken to review the full spectrum of Queensland royalties with a view to ensuring the maintenance of an appropriate return to the community. This review also provides an opportunity to streamline administrative arrangements and ensure Queensland’s royalty regime keeps pace with significant changes in Queensland’s mineral industry. The last time a comprehensive review of the total royalty system was undertaken was in 1974.
Substantial increases in coal contract prices and continued strong market conditions for most other commodities prices translate to increases in the value held by those who retain the right to extract resources in Queensland. While there have also been substantial increases in production costs in recent years, the increase in the value of these resources is considered to substantially outweigh the additional costs faced in extracting them.
Coal
The recent surge in contract prices for export coal has increased the value of Queensland’s coal resources. In this context, the 2008-09 Budget introduces a two tier royalty rate structure with effect from 1 July 2008 that is designed to increase the return to the Queensland community when the value of this non-renewable resource increases.
When the Australian dollar value of coal produced by a mine exceeds $100 per tonne, on average across all coal types, a higher royalty rate of 10% will effectively be applied to the value of coal above $100.
For example, if the average value of coal is $150 in a particular quarter, the royalty rate applied will equate to 7% on the first $100 and 10% on the remaining $50, resulting in an effective royalty rate of 8%.
Where the average value of coal is less than $100 per tonne, the current royalty rate of 7% will continue to apply.
In acknowledgement of the strong industry support for the Australian Coal Association Low Emissions Technologies levy, it has been decided to extend allowable deductions by including this levy in the determination of the value of coal. The deduction will be backdated to the inception of the levy.
Base and precious metals
The value of most base and precious metals has also risen in recent years. To ensure the Queensland community receives an appropriate return from the value of these resources, the 2008-09 Budget announces a revision to royalty rates, including the elimination of the fixed rate, from 1 January 2011, at the expiration of the current five-year period, in which companies were able to nominate either fixed or variable royalty rates.
Other initiatives
Other initiatives included in the 2008-09 Budget for commencement from 1 July 2008 are:
| | • | | changes to bauxite royalty arrangements, with the royalty rate for domestic bauxite increasing from 50% to 75% of the calculated export rate—the resultant 25% processing discount is now more closely aligned with that applying to other metals, which range from 20% to 35% |
| | • | | changes to royalty thresholds |
94
| | • | | changes to royalty rates for industrial and sundry minerals |
| | • | | a royalty rate reduction for gemstones |
| | • | | provision for royalties on high value minerals, such as iron ore, molybdenum and tungsten |
| | • | | expansion of section 42 of the Mineral Resources Regulation 2003 to accommodate the increasing trend of vertically integrated operations |
| | • | | reduced frequency of lodgement of petroleum royalty returns |
| | • | | common due date for payment of petroleum tenure rentals. |
The Budget also announces a review of payable metal deductions for base and precious metals.
Further detail on these initiatives is available from the Department of Mines and Energy website—www.dme.qld.gov.au
The Government is investing the proceeds of the royalty changes into the community, including key mineral provinces, in the form of improved services and infrastructure. Other Budget Documents, such as Budget Paper 3—Capital Statement, Budget Paper 4—Budget Measures and the Regional Budget Statements provide further detail.
Royalty estimates
The State earns royalties from the extraction of coal, base and precious metals, bauxite, petroleum, mineral sands and other minerals and land rents from pastoral holdings, mining and petroleum tenures. Royalties return some of the proceeds of the extraction of non-renewable resources to the community.
Coal royalties make up the bulk of royalty and land rent revenue, having risen in recent years as a result of increases in the value of coal produced in Queensland. Royalties from base and precious metals have also risen, with global demand for commodities also causing increases in the value of base and precious metals.
Royalty and land rent revenue in 2007-08 is estimated to be $1.449 billion, representing a 1.3% increase from 2006-07.
Royalty and land rent revenue is expected to increase by $2.196 billion (or 152%) in 2008-09 due to a reported trebling and doubling, respectively, in contract prices for coking and thermal coal, along with the implementation of the two tier royalty system.
Table 5.20
Royalties and land rents1
| | | | | | |
| | | 2006-07
Actual
$ million | | 2007-08
Est. Act.
$ million | | 2008-09
Budget
$ million |
Coal | | 1,019 | | 1,027 | | 3,213 |
Other royalties2 | | 341 | | 374 | | 383 |
Land rents | | 70 | | 48 | | 49 |
Total royalties and land rents | | 1,430 | | 1,449 | | 3,644 |
Notes:
| 1. | Numbers may not add due to rounding. |
| 2. | Includes base and precious metal, petroleum and other minerals royalties. |
95
The estimated $2.186 billion increase in revenue from coal royalties in 2008-09 represents an estimated increase of $578 million associated with royalty changes and $1.608 billion associated with increased export coal prices and production volumes, partly offset by the increased strength of the Australian dollar. An indicative breakdown of the increase in coal royalties from 2007-08 to 2008-09 is provided in Chart 5.6.
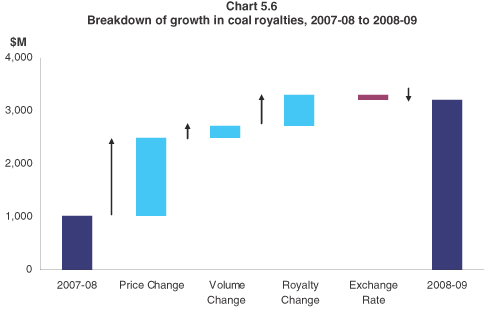
Estimates of mining royalties are based predominantly on forecasts of production compiled by the Department of Mines and Energy, using information provided by mining companies. Price estimates are broadly consistent with those published by the Australian Bureau of Agricultural and Resource Economics and Consensus Economics.
There is a significant degree of uncertainty associated with estimates of commodity prices and Australian dollar-US dollar exchange rates, both of which have significant impacts on royalty revenue. Further discussion of the risks associated with the royalty estimates, including a sensitivity analysis, is provided in Appendix C.
Fines and forfeitures
The major fines included in this category are traffic and court fines. There is an expected increase of 14.1% in collections of fines and forfeitures in 2008-09.
Revenue nec
Revenue nec includes other revenues not elsewhere classified. The moderate decrease in 2008-09 primarily reflects an expected decline in asset transfers from non-Queensland Government entities.
96
6. EXPENSES
FEATURES
| | • | | Total General Government sector expenses are expected to increase by $2.501 billion (or 7.5%) over the estimated actual for 2007-08, to $35.772 billion in 2008-09. |
| | • | | Growth in expenses includes a range of service developments and initiatives with a particular focus on the areas of health, disability services, housing and education and training. |
| | • | | The major areas of expenditure are health and education, which together constitute approximately 47.3% of General Government sector expenses. |
INTRODUCTION
This chapter provides an overview of General Government sector expenses for the estimated actual outcome for 2007-08, forecasts for the 2008-09 Budget year and projections for 2009-10 to 2011-12. The forward estimates are based on the economic projections outlined in Chapter 2 and are formulated on a no policy change basis.
Table 6.1
General Government sector expenses1
| | | | | | | | | | | | |
| | | 2007-08
Budget
$ million | | 2007-08
Est.Act.
$ million | | 2008-09
Budget
$ million | | 2009-10
Projection
$ million | | 2010-11
Projection
$ million | | 2011-12
Projection
$ million |
| | | | | | |
Expenses | | | | | | | | | | | | |
Employee expenses | | 12,595 | | 12,840 | | 13,896 | | 14,710 | | 15,590 | | 16,452 |
Superannuation interest cost | | 969 | | 996 | | 1,219 | | 1,280 | | 1,337 | | 1,389 |
Other superannuation expenses | | 1,681 | | 1,913 | | 1,959 | | 2,009 | | 2,069 | | 2,090 |
Other operating expenses | | 6,194 | | 6,240 | | 6,782 | | 6,808 | | 6,983 | | 7,182 |
Depreciation and amortisation | | 2,015 | | 2,257 | | 2,665 | | 2,721 | | 2,766 | | 2,882 |
Other interest expenses | | 390 | | 383 | | 539 | | 787 | | 1,036 | | 1,293 |
Grants expenses | | 8,438 | | 8,641 | | 8,713 | | 8,385 | | 8,641 | | 8,833 |
Total Expenses | | 32,282 | | 33,271 | | 35,772 | | 36,700 | | 38,422 | | 40,120 |
Note:
| 1. | Numbers may not add due to rounding. |
General Government expenses in 2007-08 are estimated to be $33.271 billion, an increase of $142 million over the 2007-08 Mid Year Fiscal and Economic Review forecast of $33.129 billion. This increase is primarily due to:
| | • | | additional expenditure under Natural Disaster Relief Arrangements including flood relief for Northern Queensland |
| | • | | additional expenditure to match increases in specific purpose grants from the Australian Government and other own-source revenues. |
The General Government operating statement provides for aggregate expenses of $35.772 billion in 2008-09, representing an increase of $2.501 billion (or 7.5%) over the 2007-08 estimated actual. Factors influencing the growth in expenses include growth in service delivery to meet increased demand and the implementation of service enhancements which are outlined in Budget Paper 4—Budget Measures.
97
EXPENSES BY OPERATING STATEMENT CATEGORY
This section provides a breakdown of General Government expenses in 2008-09 by category and discusses the significant variances between 2007-08 estimated actual and 2008-09 Budget by expense category.
The Service Delivery Statements provide details of expenditure for individual departments.
Chart 6.1 indicates that the largest expense category in the General Government sector is employee and superannuation expenses (47.7%), reflecting the direct service provision nature of Government activities, followed by grant expenses (24.4%) that include community service obligation payments to Government-owned corporations (GOCs) and the fuel subsidy and First Home Owner Grant schemes.
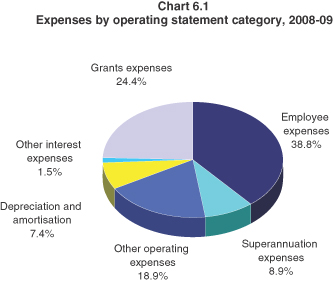
Chart 6.2 compares the 2007-08 estimated actual expenses for each operating statement category with the 2008-09 Budget.
98
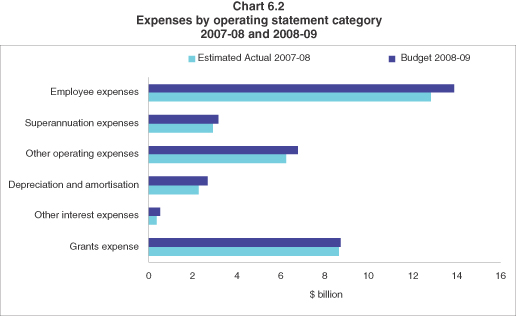
DETAILS OF EXPENSES
Employee expenses
Employee expenses include salaries and wages, annual leave and long service leave expenses.
Employee expenses are forecast to increase by $1.056 billion or 8.2% to $13.896 billion in 2008-09. The increase reflects a combination of wage increases related to enterprise bargaining agreements and other services’ growth and enhancements.
The additional staffing provided in the 2008-09 Budget is predominantly in key service delivery areas, including 270 additional teachers and teacher aides to meet enrolment growth in Queensland state schools and to support students with disabilities and other initiatives and 250 additional ambulance officers across the State in response to increasing demand for ambulance services, as well as 200 additional sworn police positions by October 2009.
In 2005, the Queensland Government committed to build a better health system and implemented major health reforms through the Health Action Plan. Reforms to date include recruiting an additional 1,573 doctors, 5,013 nurses and 1,810 allied health professionals as at April 2008.
Superannuation expenses
The superannuation interest cost represents the imputed interest on the Government’s accruing defined benefit superannuation liability. In determining the State’s defined benefit superannuation liabilities, AASB 119 Employee Benefits requires the discounting of future benefit obligations using yield rates on government bonds net of investment tax, estimated at 6%. Offset against this expense is the revenue from plan assets based on long-term rates of return of 7.5% per annum.
Other superannuation expenses represent employer superannuation contributions to accumulation superannuation and the current service cost of the State’s defined benefit obligation (or the increase in the present value of the defined benefit obligation resulting from employee service in the current period).
99
Other operating expenses
Other operating expenses comprise the non-labour costs of providing goods and services, repairs and maintenance, consultancies, contractors, electricity, communications and marketing.
Other operating expenses in 2008-09 are expected to be $6.782 billion, which represents an increase of $542 million (or 8.7%) on 2007-08. The higher spending in health to improve service delivery and meet demand is a significant contributor to this increase.
Depreciation and amortisation
Depreciation and amortisation expense is an estimate of the progressive consumption of the State’s assets through normal usage, wear and tear and obsolescence. Growth in this expense category primarily reflects asset revaluations and the size of the State’s capital program.
Other interest expense
The other interest expense includes interest paid on borrowings to acquire capital assets and infrastructure such as roads and government buildings. The growth in this expense over the forward estimates reflects growth in borrowings to fund the State’s capital program. The interest expense remains modest with interest costs as a percentage of revenue only 1.5% in 2008-09 and reaching only 3.2% by 2011-12.
Grants expenses
Current grants include grants and subsidies to the community (such as schools, hospitals, benevolent institutions and local governments) and personal benefit payments. Current grants to non-government recipients represent grants to non-government organisations and householders. Funding includes support for non-government healthcare providers, organisations servicing the community in partnership with government in the family support, disability, youth and childcare sectors. Community service obligations (CSOs) are provided where GOCs are required to provide non-commercial services or services at non-commercial prices for the benefit of the community. The State’s fuel subsidy scheme is considered to be a current grant and is estimated to total around $570 million in 2008-09.
Current grants are estimated to increase $200 million in 2008-09 (see Table 6.2). Increases in current grants to non-government schools, non-profit organisations and other non-government recipients are partially offset by a reduction in CSOs resulting from lower anticipated electricity pool prices in 2008-09. CSO payments mainly to Queensland Rail and Ergon Energy total $1.706 billion in 2008-09.
Capital transfers represent grants to GOCs, local governments, non-profit institutions and other non-government entities, such as households and businesses for capital purposes. The First Home Owner Grant represents a significant capital grant. From 1 January 2009, the Government will limit eligibility for the $7,000 First Home Owner Grant to first home buyers purchasing a home valued below $1 million.
100
Table 6.2 indicates the composition of grant payments by recipient.
Table 6.2
Current and capital grants1
| | | | |
| | | 2007-08
Est. Act.
$ million | | 2008-09
Budget
$ million |
Current | | | | |
Fuel Subsidy Scheme | | 555 | | 572 |
Grants to local government | | 496 | | 507 |
Grants to non-government schools | | 1,637 | | 1,736 |
Grants to non-profit organisations | | 924 | | 1,067 |
Grants to other non-government recipients | | 1,837 | | 1,932 |
Payments to GOCs | | 1,964 | | 1,799 |
Total current transfers | | 7,413 | | 7,613 |
| | |
Capital | | | | |
First Home Owner Grant Scheme | | 210 | | 214 |
Grants to local government | | 555 | | 526 |
Grants to non-profit organisations | | 95 | | 163 |
Grants to other non-government recipients | | 368 | | 197 |
Total capital transfers | | 1,228 | | 1,100 |
Total current and capital transfers | | 8,641 | | 8,713 |
Note:
| 1. | Numbers may not add due to rounding. |
OPERATING EXPENSES BY PURPOSE
Chart 6.3
General Government expenses by purpose, 2008-09
Error! Not a valid link.
Chart 6.3 indicates the proportion of expenditure by major purpose classification for the 2008-09 Budget. Health accounts for the largest share of expenses (25%) followed by Education (22.3%).
101
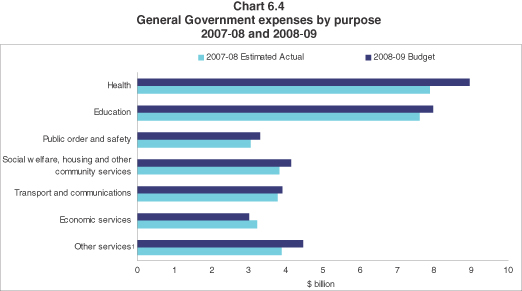
Note:
| 1. | Growth primarily reflects funding for Natural Disaster Relief Arrangements and superannuation interest expense. |
As evidenced in the chart above, expenditure increases in all key service delivery areas from 2007-08 estimated actual to 2008-09 Budget.
The Government’s Charter of Social and Fiscal Responsibility sets out the Government’s priorities for delivering high quality services and improving the quality of life for Queenslanders. The Government has consistently had a clear focus on improving key service areas such as education, health, public order and safety and community services. The Queensland Government’s focus on these areas since 1998-99 can be seen in the following chart.
102
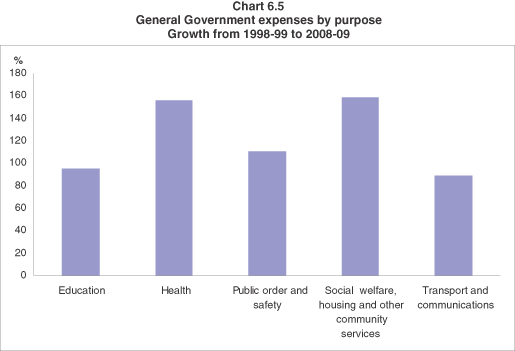
Source: Queensland Treasury’s data supplied to ABS.
Education
The State’s investment in education has been steadily growing since 1998-99. This investment has improved the individual opportunities for students and benefited the State as a whole by supporting productivity growth.
In order to provide a framework for investing in skills and innovation, in 1998 the Government developed the Smart State Strategy. This strategy continues to drive economic growth by improving the quality of, and access to, education and training across the State.
The 95% ($3.880 billion) growth in funding delivered in this area since 1998-99 encompasses primary, secondary and tertiary education and technical and further education. Specifically, initiatives have delivered a reduction in class sizes, enhancement of the assessment and reporting of students’ achievements, broadening of student pathways to further education and training options and improvements in opportunities for Aboriginal and Torres Strait Islander students. Early years of schooling have also been reformed with the introduction of the Prep Year, first introduced on a trial basis and then implemented State-wide in 2007.
The three-year SmartVET initiative and the more recent Queensland Skills Plan have set out the Government’s strategy for learning programs to support the high-skills needs of growth industries, professionals and new technologies. The Government, in partnership with industry and employers, has worked to modernise the apprenticeship system, ensure the VET system is better targeted to economic needs and provide more flexible training options. The Queensland Skills Plan aims to provide an additional 17,000 trade training places and an additional 14,000 higher level training places each year by 2010.
Other initiatives that have contributed to the growth in education expenditure include:
| | • | | support of greater than expected growth in apprenticeships and traineeships training |
103
| | • | | the introduction of Queensland Academies, giving senior students the opportunity to excel in science, maths, technology and the creative arts |
| | • | | the State Schools of Tomorrow package, which provides funding for projects to modernise and refurbish Queensland schools |
| | • | | investment in TAFE infrastructure to modernise and provide new facilities across the State. |
Health
Since 1998-99, the total growth in the health function within the Queensland Government has been 155.8% ($5.448 billion). Spending by Queensland Health now amounts to $8.352 billion in 2008-09.
The Government’s Health Action Plan, first released in 2005, has provided a blueprint for reform of the health system. Investment under the Health Action Plan has focused on:
| | • | | increasing the number of medical professionals by providing additional places for medical students, employing more interns and attracting qualified medical staff to Queensland. As at the end of April 2008, 1,573 extra doctors and 5,013 extra nurses were appointed |
| | • | | continuing to support hospitals through the More Beds for Hospitals program |
| | • | | improving the quality of health services through the Health Quality and Complaints Commission. |
Queensland Health continues to build a dependable healthcare system with better health outcomes for all Queenslanders by:
| | • | | improving programs to prevent illness and injury, promoting and protecting good health and wellbeing of the population, while reducing the health status gap between the most and least advantaged in the community |
| | • | | providing equitable access to quality health services |
| | • | | improving the functional status of a patient with an impairment or disability, slowing the progression of a person’s health condition and assisting them to maintain and better manage their health condition |
| | • | | guiding mental health reform through the National Mental Health Strategy and the Queensland Plan for Mental Health 2007-2017. |
Public order and safety
Public order and safety includes funding to police, legal services and law courts, fire protection, prisons and corrective services. Contributing to the 110.4% ($1.740 billion) growth in public order spending since 1998-99 is the consistent increase in police numbers, which has maintained the police to population ratio at or above the national average, as well as additional allocations relating to infrastructure. Funding has been provided for the planning and construction of new courthouse facilities including the Brisbane Supreme and District Court Complex, and for the expansion and redevelopment of prison infrastructure such as Lotus Glen Correctional Centre and the new South East Queensland (SEQ) correctional precinct at Gatton.
In addition, law enforcement services have benefited from the implementation of new information and communications technologies, such as:
| | • | | the Public Safety Network, which establishes a common ICT network for the Departments of Police, Corrective Services and Justice and Attorney-General |
| | • | | QPRIME, which provides a means to effectively manage the increasing volume of information used by operational police. |
104
Social welfare, housing and other community services
The continuously strong growth in social welfare, housing and community services expenditure is a reflection of a range of policy initiatives designed to respond to issues relating to child safety, community support and housing shortages. Over the last few years, several essential reforms to child protection have been instigated, including upgrades to therapeutic and alternative care, suspected child abuse and neglect teams, and the accelerated increase of frontline staffing.
A number of initiatives have been implemented to address the social housing needs, including the purchase and construction of additional dwellings for the Public Housing and Aboriginal and Torres Strait Islander Housing rental programs, and the construction and purchase of new dwellings under the Community-managed Studio Units program. Since 1998-99, housing assistance has increased by 106%.
Since 1998-99, the investment in disability services has grown by over 245%. This increased expenditure has been directed towards early intervention, the implementation of service systems reform, delivering a comprehensive response to the recommendations from the Carter Report, strengthening the capacity of non-government organisations, expanding the Home and Community Care program and responses to people with mental illness.
This function also includes expenditure relating to families, communities and the environment, all of which have benefited from being part of key Budget priorities in recent years. In total, the area of social welfare, housing and community services has experienced a 159% ($2.547 billion) growth in expenditure since 1998-99.
Transport and communications
The Government is taking action to address urban congestion and is investing heavily in infrastructure and services. The South East Queensland Infrastructure Plan and Program details the Government’s commitment to providing new infrastructure.
Spending in this area has experienced a total growth of 88.8% ($1.837 billion) since 1998-99. This funding has supported the development of transport and road projects including provision of funding to QR Limited to provide Citytrain services, freight transport in and out of SEQ and high-quality connections between the region’s key activity centres. A major focus for the Government is to tackle the growing issue of urban congestion by:
| | • | | building capacity for growth through new roads and infrastructure |
| | • | | improving efficiency of the existing network |
| | • | | better land use and planning |
| | • | | improving public transport services |
| | • | | addressing travel demand. |
Initiatives aimed at reducing congestion in SEQ include TravelSmart initiatives, the Land Use and Public Transport and Accessibility Index (a land use and planning tool) and off-peak freight delivery trials. Outside SEQ, initiatives to reduce congestion include the implementation of fare equalisation for all regional urban bus services, higher frequency services, the upgrade of bus stops, the introduction of wheelchair accessible taxis into small rural and regional communities and disability compliant bus and ferry infrastructure across regional centres.
Road safety issues have also been addressed, with the development of an action plan based on the recommendations of the Queensland Road Safety Summit of February 2006. This includes changes to driver licence requirements and the investigation of further speed enforcement technologies.
105
DEPARTMENTAL EXPENSES
Data presented in Tables 6.3 and 6.4 provide a summary drawn from financial statements contained in Budget Paper 5—Service Delivery Statements. Further information on the composition of expenses, outputs delivered and factors influencing the movement in expenses can also be obtained from the Service Delivery Statements.
Table 6.3
Departmental Controlled Expense1,2
| | | | |
| | | 2007-08
Est. Actual
$'000 | | 2008-09
Estimate
$'000 |
Child Safety | | 563,434 | | 592,438 |
Communities | | 564,170 | | 680,900 |
Corrective Services | | 510,219 | | 511,190 |
Disability Services Queensland | | 1,052,733 | | 1,234,532 |
Education, Training and the Arts | | 6,099,051 | | 6,445,311 |
Electoral Commission of Queensland | | 28,641 | | 11,429 |
Emergency Services | | 848,203 | | 940,781 |
Employment and Industrial Relations | | 206,423 | | 216,081 |
Environmental Protection Agency | | 345,000 | | 411,078 |
Forestry Plantations Queensland Office | | 31,956 | | 31,155 |
Health | | 7,456,983 | | 8,352,012 |
Housing | | 626,894 | | 728,859 |
Infrastructure and Planning | | 115,301 | | 127,619 |
Justice and Attorney-General | | 345,349 | | 359,331 |
Legislative Assembly | | 68,533 | | 69,336 |
Local Government, Sport and Recreation | | 678,386 | | 626,734 |
Main Roads | | 1,606,453 | | 1,467,370 |
Mines and Energy | | 107,180 | | 144,370 |
Natural Resources and Water | | 724,792 | | 560,651 |
Office of the Governor | | 4,613 | | 4,934 |
Office of the Ombudsman | | 6,364 | | 6,869 |
Office of the Public Service Commissioner | | 14,780 | | 10,035 |
Police | | 1,446,806 | | 1,570,994 |
Premier and Cabinet | | 111,616 | | 119,765 |
Primary Industries and Fisheries | | 403,393 | | 342,361 |
Public Works | | 466,450 | | 492,325 |
Queensland Audit Office | | 33,137 | | 34,417 |
The Public Trustee of Queensland | | 67,951 | | 71,697 |
Tourism, Fair Trading and Wine Industry Development
(ceased 13 September 2007) | | 15,973 | | — |
Tourism, Regional Development and Industry | | 205,463 | | 225,457 |
Transport | | 2,392,754 | | 2,513,808 |
Treasury | | 206,548 | �� | 209,659 |
Total Expenses | | 27,355,549 | | 29,113,498 |
Notes:
| 1. | Total expenses by department does not equate to total General Government expenses in Uniform Presentation Framework (UPF) terms reported elsewhere in the Budget Papers as General Government expenses include a wider range of entities including State Government statutory authorities and also transactions eliminated between entities within the General Government sector (for example payroll tax payments) are excluded in the preparation of whole-of-Government UPF financial statements. |
| 2. | Explanation of variations in departmental controlled expenses can be found in the Service Delivery Statements. |
106
| | | | |
Table 6.4 Departmental Administered Expense1,2 |
| | | 2007-08
Est. Actual
$'000 | | 2008-09
Estimate
$'000 |
| | |
| | |
Communities | | 165,398 | | 186,666 |
Education, Training and the Arts | | 1,894,970 | | 2,000,875 |
Health | | 18,469 | | 24,138 |
Infrastructure and Planning | | 32,710 | | 32,776 |
Justice and Attorney-General | | 152,499 | | 158,592 |
Local Government, Sport and Recreation | | 375,106 | | 393,656 |
Mines and Energy | | 754,070 | | 485,210 |
Natural Resources and Water | | 15,358 | | 14,458 |
Police | | 405 | | 420 |
Premier and Cabinet | | 134,823 | | 186,111 |
Primary Industries and Fisheries | | 34,503 | | 21,056 |
Public Works | | 25,686 | | 56,286 |
The Public Trustee of Queensland | | 1,745 | | 2,013 |
Tourism, Fair Trading and Wine Industry Development (ceased 13 September 2007) | | 13,232 | | — |
Tourism, Regional Development and Industry | | 38,744 | | 49,276 |
Transport | | 4,233 | | 3,068 |
Treasury | | 3,339,401 | | 2,922,667 |
Total Expenses | | 7,001,352 | | 6,537,268 |
Notes:
| 1. | Total expenses by department does not equate to total General Government expenses in Uniform Presentation Framework (UPF) terms reported elsewhere in the Budget Papers as General Government expenses include a wider range of entities including State Government statutory authorities and also transactions eliminated between entities within the General Government sector (for example payroll tax payments) are excluded in the preparation of whole-of-Government UPF financial statements. |
| 2. | Explanation of variations in departmental administered expenses can be found in the Service Delivery Statements. |
107
7. BALANCE SHEET AND CASH FLOWS
FEATURES
| | • | | The Queensland Government’s strong financial position is expected to strengthen further in 2008-09. State net worth is projected to rise by $5.468 billion through the year to $128.563 billion. |
| | • | | Net worth is also forecast to increase each year over the forward estimates period, meeting the Government’s commitment in its Charter of Social and Fiscal Responsibility to maintain and seek to increase total State net worth. |
| | • | | The General Government sector is well placed to meet all its present and future liabilities. Financial assets are projected to exceed liabilities by $15.164 billion in the General Government sector at 30 June 2009, consistent with the Government’s Charter principles. |
| | • | | The General Government sector is expected to record a cash deficit of $1.970 billion in 2008-09, after allowing for $6.311 billion in net asset purchases. |
INTRODUCTION
The 2008-09 balance sheet shows the projected assets, liabilities and net worth of the General Government sector as at 30 June 2009. It is important for the Government to maintain a strong balance sheet to provide it with the stability, flexibility and capacity to deal with any emerging financial and economic pressures.
The assets and liabilities in the balance sheet are defined according to the Uniform Presentation Framework (UPF).
Detailed balance sheet and cashflow information for the General Government sector and the rest of the public sector is contained in Chapter 9.
BALANCE SHEET
Table 7.1 provides a summary of the key balance sheet measures for the General Government sector.
| | | | | | | | | | | | | | | | | | |
Table 7.1 General Government sector: summary of budgeted balance sheet1 | |
| | | 2007-08
Budget2
$ million | | | 2007-08
Est. Act.
$ million | | | 2008-09
Budget
$ million | | | 2009-10
Projection
$ million | | | 2010-11
Projection
$ million | | | 2011-12
Projection
$ million | |
Financial assets | | 54,859 | | | 53,420 | | | 54,811 | | | 57,398 | | | 59,699 | | | 61,737 | |
Non-financial assets | | 100,177 | | | 105,437 | | | 113,399 | | | 120,462 | | | 127,447 | | | 133,792 | |
Total Assets3 | | 155,036 | | | 158,857 | | | 168,209 | | | 177,860 | | | 187,146 | | | 195,529 | |
Borrowings and advances | | 7,158 | | | 6,193 | | | 9,311 | | | 13,801 | | | 18,211 | | | 21,808 | |
Superannuation liability | | 19,955 | | | 20,849 | | | 21,874 | | | 22,816 | | | 23,674 | | | 24,442 | |
Other provisions and liabilities | | 8,124 | | | 8,722 | | | 8,461 | | | 8,534 | | | 8,771 | | | 9,038 | |
Total Liabilities | | 35,237 | | | 35,762 | | | 39,646 | | | 45,152 | | | 50,656 | | | 55,287 | |
Net Worth | | 119,799 | | | 123,095 | | | 128,563 | | | 132,708 | | | 136,490 | | | 140,243 | |
Net Financial Worth | | 19,622 | | | 17,657 | | | 15,164 | | | 12,246 | | | 9,043 | | | 6,451 | |
Net Financial Liabilities | | 855 | | | 2,343 | | | 5,504 | | | 9,488 | | | 13,499 | | | 16,596 | |
Net Debt | | (24,709 | ) | | (24,371 | ) | | (21,928 | ) | | (18,670 | ) | | (15,560 | ) | | (13,227 | ) |
Notes:
| 1. | Numbers may not add due to rounding. |
| 2. | Numbers have been restated where subsequent changes in classification have occurred. |
| 3. | For UPF purposes, the State’s assets are classed as either financial or non-financial assets. |
108
Financial assets
The General Government sector holds the full equity of the State’s public enterprises, principally its shareholding in Government-owned corporations (GOCs), in much the same manner as the parent or holding company in a group of companies. The estimated net investment in public enterprises ($20.669 billion at 30 June 2009) is included in the General Government sector’s financial assets.
In the year to 30 June 2009, financial assets are projected to increase by $1.391 billion, attributable principally to increased investment in assets set aside to meet future employee liabilities and higher investment in the State’s public enterprises.
Financial assets of $53.420 billion are forecast for 2007-08, or $1.439 billion lower than originally budgeted, reflecting lower than forecast investment returns. At the time of the 2007-08 Budget, investment earnings were based on the long-term rate of return of 7.5%. Subdued performance in financial markets investments in 2007-08 has resulted in a downward revision of investment returns to 2%. The stability of earnings on investments in future years has been addressed by the transfer of certain investment assets to the Queensland Treasury Corporation (QTC) in exchange for a debt instrument that will earn the General Government sector a 7.5% return per annum (see Box 1.1 in Chapter 1). Therefore, investment earnings in 2008-09 and the outyears are based on 7.5%.
Chart 7.1 shows projected General Government sector financial assets by category at 30 June 2009. Investments held to meet future liabilities including superannuation and long service leave comprise the major part of the State’s financial assets.
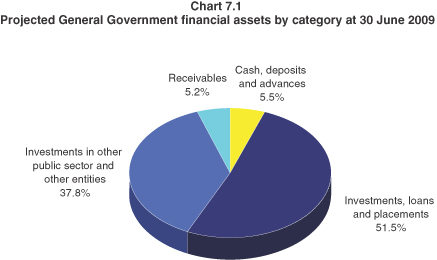
Non-financial assets
General Government non-financial assets are projected to total $113.399 billion at 30 June 2009. These assets consist primarily of land and other fixed assets of $107.569 billion, the majority of which are roads, schools, hospitals and other infrastructure used to provide services to Queenslanders. Other non-financial assets of $5.829 billion held by the State include prepayments and deferred tax assets relating to income tax equivalents collected primarily from GOCs.
109
Changes in non-financial assets occur for a number of reasons including:
| | • | | construction and purchase of assets, either to replace existing assets or provide additional capacity for the State to deliver services |
| | • | | revaluations of assets required under accounting standards |
| | • | | depreciation and disposals of assets. |
Non-financial assets in the year ending 30 June 2009 are expected to grow by $7.962 billion over the 2007-08 estimated actual. Of this increase, $6.651 billion represents the acquisition of non-financial assets.
The Government has traditionally funded new infrastructure at levels well beyond that of the other states. General Government purchases of non-financial assets per capita have far exceeded the average of the other states and territories for well over a decade (see Chart 3.6 in Chapter 3).
Liabilities
The largest accruing liability in the General Government sector is employee entitlements (principally superannuation and long service leave) which are projected to total $25.539 billion at 30 June 2009. The other major component of liabilities is borrowings and advances received.
Total liabilities are budgeted to increase by $3.884 billion in 2008-09, largely on account of increased borrowing to support the State’s capital program and growth in the General Government superannuation liability.
State public sector superannuation liabilities include defined benefit liabilities for current employees and the balance of former scheme members (retirement, resignation etc) who choose to retain their funds within QSuper.
The proportion of the State’s total superannuation liability relating to former scheme members is expected to increase over the forward estimates period as these investment balances grow and new public sector employees join the accumulation scheme, in preference to the defined benefit scheme.
Over the Budget and forward estimates period, total additional General Government borrowings and advances of $15.260 billion are planned. These borrowings are to partially fund the $25.758 billion worth of capital projects in the General Government sector and $2.023 billion worth of equity injections to the Public Non-financial Corporations sector to support expansion of the State’s water, ports, energy and rail infrastructure.
The remainder of the liabilities balance consists of payables and other liabilities such as unearned revenue and provisions.
110
The composition of the General Government sector’s liabilities is illustrated in Chart 7.2.
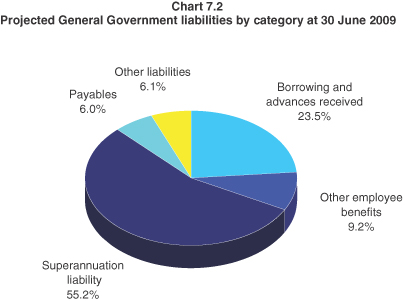
Net financial worth
The net financial worth measure is an indicator of financial strength. Net financial worth is defined as financial assets less all existing and accruing liabilities. Financial assets include cash and deposits, advances, financial investments, loans, receivables and equity in public enterprises.
The net financial worth measure is broader than the alternative measure—net debt—which measures only cash, advances and investments on the assets side and borrowings and advances on the liabilities side. As it is more comprehensive, the net financial worth measure is more appropriate in an accrual accounting framework.
The net financial worth of the General Government sector for 2008-09 is forecast at $15.164 billion, indicating that the State is able to meet all of its current and recognised future obligations, without recourse to material adjustments in fiscal policy settings.
This position is consistent with the principle in the Government’s Charter of Social and Fiscal Responsibility that the State’s financial assets cover all accruing and expected future liabilities of the General Government sector.
Based on current projections, the General Government sector will continue to meet the commitment in the Government’s Charter to ensure that financial assets cover all accruing and expected future liabilities in all years through to 30 June 2012. Net financial worth reduces in future years reflecting the State’s increased borrowings to fund the purchase of infrastructure assets (which are not included in the calculation of net financial worth).
Queensland has consistently pursued sound long-term fiscal policies such as the full funding of employee superannuation entitlements. The strong balance sheet and high levels of liquidity in the General Government sector clearly demonstrate the success of these policies.
111
Net financial liabilities
Net financial liabilities are total liabilities less financial assets, other than equity investments in other public sector entities. This measure is broader than net debt as it includes significant liabilities, other than borrowing (for example, accrued employee liabilities such as superannuation and long service leave entitlements). The net financial liabilities of the General Government sector for 2008-09 are forecast at $5.504 billion, further demonstrating the high level of liquidity of the State.
Queensland’s level of liquidity is well in excess of other states as illustrated in Chart 7.3.
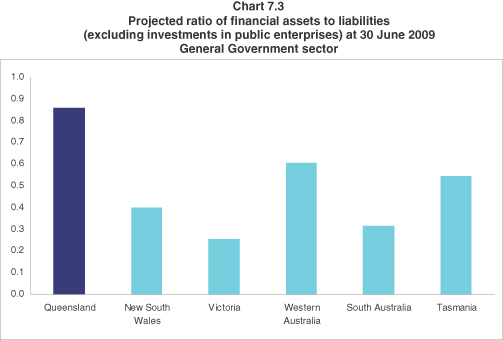
Source: State Budget Papers for QLD, VIC and WA. Mid Year Reviews/Budget Updates for NSW, SA and TAS.
Net worth
The Charter of Social and Fiscal Responsibility specifically requires the Government to maintain and seek to increase total State net worth.
The net worth, or equity, of the State is the amount by which the State’s assets exceed its liabilities (which is equivalent to General Government net worth). This is the value of the investment held on behalf of the people of Queensland by public sector instrumentalities.
Changes in the State’s net worth occur for a number of reasons including:
| | • | | operating surpluses (deficits) that increase (decrease) the Government’s equity |
| | • | | revaluation of assets and liabilities as required by accounting standards. Some financial liabilities are revalued on a regular basis. For example, the Government’s accruing liabilities for employee superannuation and long service leave are determined by actuarial assessments |
112
| | • | | movements in the net worth of the State’s investments in the Public Non-financial Corporations and Public Financial Corporations sectors |
| | • | | gains or losses on disposal of assets. Government agencies routinely buy and sell assets. Where the selling price of an asset is greater (less) than its value in an agency’s accounts, the resultant profit (loss) affects net worth. |
Net worth of the General Government sector in 2007-08 of $123.095 billion is forecast. This exceeds growth forecasts in the 2007-08 Budget by $3.296 billion primarily as a result of the flow through of significantly higher net worth in the 2006-07 outcome.
Net worth is forecast to grow by $5.468 billion to $128.563 billion in 2008-09. This is due to the General Government’s operating surplus and increases in assets as a result of revaluations of major assets as part of the State’s asset revaluation cycle.
Chart 7.4 shows the State’s strong net worth compared with the other states and territories. Queensland’s per capita net worth is 45.7% greater than the average per capita net worth of the other states and territories.
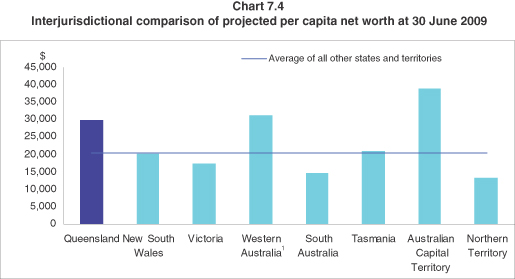
Note:
| 1. | Western Australia values land under roads as part of its overall asset base. This has been adjusted to allow comparison with other jurisdictions which do not value land under roads. |
Source: State Budget Papers for QLD, VIC, WA, ACT and NT. Mid Year Reviews/Budget Updates for NSW, SA and TAS. Population data from Australian Government Budget Paper No.3, 2008-09.
Net debt
Net debt is the sum of advances received and borrowings less cash and deposits, advances paid and investments, loans and placements. The extent of accumulated net debt is used to judge the overall strength of a jurisdiction’s fiscal position. High levels of net debt impose a call on future revenue flows to service that debt and meeting these payments can limit government flexibility to adjust outlays. Excessive net debt can call into question the ability of government to service that debt.
As shown in Table 7.2, the General Government sector has negative net debt, that is, a surplus of financial assets over financial liabilities.
113
Queensland’s negative net debt of $5,082 per capita, compares to the weighted average net debt of $352 per capita in the other states. This indicates the strength of Queensland’s financial position relative to the other states. Queensland has had negative net debt in the General Government sector for many years.
Table 7.2
Projected net debt per capita at 30 June 2009
| | | | | | | | | | | | | | | |
| | | QLD | | | NSW | | VIC | | WA | | | SA | | TAS | |
Net debt per capita ($) | | (5,082 | ) | | 744 | | 702 | | (1,260 | ) | | 509 | | (2,346 | ) |
Source: State Budget Papers for QLD, VIC and WA. Mid Year Reviews/Budget Updates for NSW, SA and TAS.
Population data from Australian Government Budget Paper No.3, 2008-09.
CASH FLOWS
The cash flow statement provides information on the Government’s estimated cash flows from its operating, financing and investing activities.
The cash flow statement records estimated cash payments and cash receipts and hence differs from accrued revenue and expenditure recorded in the operating statement. In particular, the operating statement often records revenues and expenses that do not have an associated cash flow (for example, depreciation expense). The timing of recognition of accrued revenue or expense in the operating statement may differ from the actual cash disbursement or receipt (for example, tax equivalents). A reconciliation between the cash flows from operations and the operating statement is provided later in this chapter.
The cash flow statement also records cash flows associated with investing and financing activities that are otherwise reflected in the balance sheet. For example, purchases of capital equipment are recorded in the cash flow statement and impact on the balance sheet through an increase in physical assets.
The cash flow statement provides the cash surplus (deficit) measure which is comprised of the net cash flow from operating activities plus the net cash flow from investment in non-financial assets (or physical capital).
The Australian Bureau of Statistics Government Finance Statistics (GFS) surplus (deficit) is derived by including the initial increase in liability at the beginning of finance leases in the cash surplus (deficit). This measure is also used to derive the Loan Council Allocation nomination, provided in Chapter 9.
A cash deficit of $1.970 billion is forecast in 2008-09 for the General Government sector, with the cash result forecast to remain in deficit in the outyears. Apart from the cash impact of smaller recurrent operating surpluses, the major factor contributing to lower cash results is the planned capital expansion. Total General Government capital purchases of $6.651 billion are budgeted for 2008-09.
Over the period 2008-09 to 2011-12, capital expenditure is expected to total $25.758 billion in the General Government sector. This substantial investment in capital will impact on the cash surplus (deficit).
Table 7.3 provides summary cash flow information for the General Government sector for 2007-08, 2008-09 and the outyears. Detailed cash flow tables are included in Chapter 9.
114
Table 7.3
General Government sector: summary of budgeted cash flows1
| | | | | | | | | | | | | | | | | | |
| | | 2007-08
Budget2
$ million | | | 2007-08
Est. Actual
$ million | | | 2008-09
Budget
$ million | | | 2009-10
Projection
$ million | | | 20010-11
Projection
$ million | | | 2011-12
Projection
$ million | |
Cash receipts from operating activities | | 34,057 | | | 32,833 | | | 37,297 | | | 37,625 | | | 39,055 | | | 40,674 | |
Cash payments for operating activities | | (29,817 | ) | | (31,591 | ) | | (32,955 | ) | | (33,869 | ) | | (35,468 | ) | | (37,165 | ) |
Net cash inflows from operating activities | | 4,240 | | | 1,242 | | | 4,341 | | | 3,756 | | | 3,586 | | | 3,509 | |
Net cash flows from investing activities | | (7,600 | ) | | (3,053 | ) | | (7,786 | ) | | (8,511 | ) | | (8,207 | ) | | (7,353 | ) |
Receipts from financing activities | | 3,555 | | | 3,522 | | | 2,897 | | | 4,421 | | | 4,366 | | | 3,576 | |
Net increase/(decrease) in cash held | | 195 | | | 1,711 | | | (548 | ) | | (334 | ) | | (255 | ) | | (269 | ) |
| | | | | | |
Derivation of cash surplus (deficit) | | | | | | | | | | | | | | | | | | |
Net cash inflows from operating activities | | 4,240 | | | 1,242 | | | 4,341 | | | 3,756 | | | 3,586 | | | 3,509 | |
Net cash flows from investments in non-financial assets | | (5,132 | ) | | (4,789 | ) | | (6,311 | ) | | (6,410 | ) | | (6,256 | ) | | (5,568 | ) |
Equals cash surplus/(deficit) | | (892 | ) | | (3,547 | ) | | (1,970 | ) | | (2,654 | ) | | (2,669 | ) | | (2,059 | ) |
Notes:
| 1. | Numbers may not add due to rounding. |
| 2. | Numbers have been restated where subsequent changes in classification have occurred. |
Cash flows from operating activities
Table 7.4 provides a disaggregation of operating cash flows.
Table 7.4
General Government sector: cash flows from operating activities1
| | | | | | | | | |
| | | 2007-08
Budget2
$ million | | | 2007-08
Est. Act.
$ million | | | 2008-09
Budget
$ million | |
Cash receipts from operating activities | | | | | | | | | |
Taxes received | | 9,271 | | | 9,551 | | | 10,105 | |
Grants and subsidies received | | 15,029 | | | 15,396 | | | 15,526 | |
Sales of goods and services | | 3,347 | | | 3,667 | | | 3,749 | |
Interest receipts | | 2,190 | | | 832 | | | 2,197 | |
Dividend and income tax equivalents | | 1,858 | | | 931 | | | 1,012 | |
Other receipts | | 2,362 | | | 2,455 | | | 4,707 | |
Total operating receipts | | 34,057 | | | 32,833 | | | 37,297 | |
| | | |
Cash payments for operating activities | | | | | | | | | |
Payments for employees | | (13,928 | ) | | (15,092 | ) | | (15,674 | ) |
Payments for goods and services | | (6,524 | ) | | (6,714 | ) | | (7,246 | ) |
Grants and subsidies | | (8,278 | ) | | (8,704 | ) | | (8,757 | ) |
Interest paid | | (391 | ) | | (383 | ) | | (540 | ) |
Other payments | | (696 | ) | | (697 | ) | | (739 | ) |
Total operating payments | | (29,817 | ) | | (31,591 | ) | | (32,955 | ) |
| | | |
Net cash inflows from operating activities | | 4,240 | | | 1,242 | | | 4,341 | |
Notes:
| 1. | Numbers may not add due to rounding. |
| 2. | Numbers have been restated where subsequent changes in classification have occurred. |
115
Cash inflows from operating activities include receipts from taxes, grants from the Australian Government, fees and charges levied on the provision of goods and services, interest receipts from investments and dividend and income tax receipts from public non-financial and financial corporations.
Taxes received by the General Government sector are forecast at $10.105 billion in 2008-09, an increase of 5.8% or $554 million on the 2007-08 estimated actual of $9.551 billion. This reflects the continued effect of property market activity on transfer duty and land tax revenue, employment and wage growth on payroll tax revenue and increases in vehicle registration duty, partially offset by the full abolition of mortgage duty from 1 July 2008.
Grants and subsidies received are forecast at $15.526 billion in 2008-09, a marginal increase of $130 million or 0.8% on the 2007-08 estimated actual of $15.396 billion.
Sales of goods and services are forecast at $3.749 billion for 2008-09 an increase of 2.2% and include fines and regulatory fees and user charges.
Interest receipts are expected to increase in 2008-09 by $1.365 billion or 164%, to $2.197 billion. This reflects earnings of 7.5% on the debt instrument issued by QTC. The subdued performance in equities markets resulted in a downward revision to investment returns to 2% in 2007-08, reflecting year to date returns to mid May. The transfer of certain investment assets to QTC in exchange for a debt instrument that earns the General Government sector 7.5% per annum will in future insulate the General Government sector from such market volatility.
Estimated dividends and income tax equivalents in the 2007-08 year are $927 million lower than budgeted. This is mainly due to tax equivalent receipts on the privatisation of the electricity retail sector which were returned as policy purposes cash flows instead of tax equivalent receipts as originally budgeted. Dividends and tax equivalents received from public non-financial and public financial corporations are expected to increase in 2008-09 by $81 million to $1.012 billion.
Other receipts are forecast at $4.707 billion in 2008-09 an increase of 91.7% primarily as a result of increased coal royalty revenue (see Chapter 5).
Operating cash outflows represent payment for goods and services, wages and salaries, finance costs and grants and subsidies paid to households, businesses and other Government agencies. In 2008-09 the largest cash disbursement is payments for employees at $15.674 billion or 47.6% of total cash payments from operating activities. Payments for employees include superannuation beneficiary payments which have increased substantially in the 2007-08 estimated actual as a result of changes to the Commonwealth legislation governing superannuation. These payments are expected to moderate in 2008-09, with a forecast increase of 3.9% in payments for employees.
In 2008-09, payments for goods and services are expected to increase 7.9% to $7.246 billion primarily as a result of growth funding and expanded service delivery.
Cash payments for grants and subsidies are expected to increase by $53 million in 2008-09 to $8.757 billion. This figure includes recurrent grants paid by the Australian Government through the State to non-state schools, grants paid to industry and grants to non-profit institutions. This item also includes community service obligation payments to the energy sector and QR Limited and capital grants which are largely paid to local government authorities to fund capital works.
Interest paid is expected to increase by $157 million reflecting the borrowings for the capital program.
Other payments mainly comprise sundry expenditure such as insurance claims and Goods and Services Tax (GST) remitted to the Australian Taxation Office.
116
Cash flows from investments
Cash flows from investments include both financial and non-financial assets. Table 7.5 provides a disaggregation of investment cash flows into the different types.
Table 7.5
General Government sector: cash flows from investing activities
| | | | | | | | | |
| | | 2007-08
Budget1
$ million | | | 2007-08
Est. Act.
$ million | | | 2008-09
Budget
$ million | |
Cash flows from investments in non-financial assets | | (5,132 | ) | | (4,789 | ) | | (6,311 | ) |
Net cash flows from investments in financial assets for policy purposes | | (885 | ) | | 1,020 | | | (389 | ) |
Net cash flows from investments in financial assets for liquidity purposes | | (1,583 | ) | | 716 | | | (1,086 | ) |
Net cash flows from investing activities | | (7,600 | ) | | (3,053 | ) | | (7,786 | ) |
Note:
| 1. | Numbers have been restated where subsequent changes in classification have occurred. |
The largest cash disbursement for the Government, outside of recurrent operations, is for investments in non-financial assets. This represents the Government’s capital works program which provides for infrastructure such as schools, hospitals and roads.
Cash outflows from investments in non-financial assets are expected to increase to $6.311 billion in 2008-09 from $4.789 billion in 2007-08, an increase of 31.8%.
The cash expenditure on investments in non-financial assets differs from the estimates of capital works expenditure in Budget Paper 3—Capital Statement. The estimates contained in that paper are on a gross basis and incorporate both departmental agencies and investments by the Public Non-financial Corporations sector. In addition, Budget Paper 3 only includes capital expenditure (including capital grants) within Queensland and does not offset proceeds from asset sales.
Apart from investing in infrastructure, governments also manage financial assets in order to finance overall expenditures. In addition, Queensland manages financial assets set aside to provide for future employee benefits (for example, superannuation and long service leave). The Government manages its financial assets through a combination of borrowing or investing funds and reducing or increasing equity in government or private sector entities. Investments in financial assets include activities relating to both policy and liquidity.
Investments in financial assets for policy purposes include net equity injections into Government and other business enterprises and the net cash flow from disposal or return of equity in Government business enterprises.
Cash inflows from investments for policy purposes for 2007-08 of $1.020 billion reflect equity transactions by the General Government sector with public non-financial and financial corporations. In 2007-08, this includes the return of proceeds totalling $1.537 billion from the previously announced sale of businesses, offset to some extent by equity transactions with public enterprises, in particular injections to QR Limited for the South East Queensland Infrastructure Plan and Program.
Cash outflows from investments in financial assets for policy purposes for 2008-09 of $389 million also reflect equity injections into public enterprises, offset to some extent by the return of proceeds on the long-term lease of the Cairns and Mackay airports and the sale of the Port of Brisbane Corporation’s remaining share in the Brisbane Airport Corporation Pty Ltd.
117
Net cash flows from investments in financial assets for liquidity purposes represent net investment in financial assets to cover liabilities such as superannuation, other employee entitlements and insurance.
The 2007-08 estimated net cash inflow from investments in financial assets for liquidity purposes of $716 million is substantially higher than the forecast outflow in the 2007-08 Budget due to the lower than forecast return on investments and their subsequent reinvestment, as well as the liquidation of investments to make beneficiary payments.
Net cash outflows from investments in financial assets for liquidity purposes are estimated to be $1.086 billion in 2008-09. The increased out flow compared to 2007-08 reflects the reinvestment of interest earnings based on the earnings on QTC debt instrument of 7.5%.
Cash flows from financing activities
Cash flows generated from financing activities are outlined in Table 7.6 below.
Table 7.6
General Government sector: cash flows from financing activities1
| | | | | | | | | |
| | | 2007-08
Budget2
$ million | | | 2007-08
Est. Act.
$ million | | | 2008-09
Budget
$ million | |
Advances received (net) | | (14 | ) | | (1 | ) | | (18 | ) |
Borrowing (net) | | 3,569 | | | 3,531 | | | 2,915 | |
Other financing (net) | | — | | | (8 | ) | | — | |
Net cash flows from financing activities | | 3,555 | | | 3,522 | | | 2,897 | |
Notes:
| 1. | Numbers may not add due to rounding. |
| 2. | Numbers have been restated where subsequent changes in classification have occurred. |
Net cash flows from financing activities include cash flows from net borrowing (increase in borrowing less redemption), net advances (gross investment in new loans less redemption of loans issued) and other financing.
In 2007-08 net cash inflows from financing activities are estimated at $3.522 billion. This represents borrowings for the State’s capital program.
Net cash inflows from financing activities for 2008-09 are estimated at $2.897 billion, reflecting borrowings to partially fund the General Government’s capital program of $6.651 billion. In spite of higher levels of capital purchases, borrowings for 2008-09 are lower than forecast in the 2007-08 Budget. This has been achieved by utilising the operating cash flow to invest in capital.
118
RECONCILIATION OF OPERATING CASH FLOWS TO THE OPERATING STATEMENT
Table 7.7 provides a reconciliation of the cash flows from operating activities to the operating result for the General Government sector.
Table 7.7
General Government sector: reconciliation of cash flows
from operating activities to accrual operating activities1
| | | | | | | | | |
| | | 2007-08
Budget2
$ million | | | 2007-08
Est. Act.
$ million | | | 2008-09
Budget
$ million | |
Revenue from transactions | | 32,551 | | | 32,276 | | | 36,582 | |
Plus/(less) movement in tax equivalent and dividend receivables | | 742 | | | (287 | ) | | (40 | ) |
Plus GST receipts | | 939 | | | 949 | | | 980 | |
Plus/(less) movement in other receivables | | (175 | ) | | (105 | ) | | (225 | ) |
Equals cash receipts from operating activities | | 34,057 | | | 32,833 | | | 37,297 | |
| | | |
Expenses from transactions | | 32,282 | | | 33,271 | | | 35,772 | |
(Less) non-cash items | | | | | | | | | |
Depreciation and amortisation expense | | (2,015 | ) | | (2,257 | ) | | (2,665 | ) |
Accrued superannuation expense | | (1,738 | ) | | (2,063 | ) | | (2,030 | ) |
Accrued employee entitlements | | (352 | ) | | (416 | ) | | (422 | ) |
Other accrued costs | | (416 | ) | | (261 | ) | | (292 | ) |
Plus superannuation benefits paid—defined benefit | | 408 | | | 893 | | | 419 | |
Plus/(less) movement in employee entitlement provisions | | 181 | | | 273 | | | 266 | |
Plus/(less) GST paid | | 963 | | | 1,015 | | | 1,018 | |
Plus/(less) movement in other provisions and payables | | 504 | | | 1,136 | | | 889 | |
Equals cash payments for operating activities | | 29,817 | | | 31,591 | | | 32,955 | |
Notes:
| 1. | Numbers may not add due to rounding. |
| 2. | Numbers have been restated where subsequent changes in classification have occurred. |
The main difference between the accrual operating statement and the cash flow relates to the timing of cash payments and receipts and their recognition in accrual terms and the inclusion of non-cash expenses and revenues. The largest difference is on the expenses (expenditure) side, with large non-cash expenses associated with depreciation and superannuation. Differences due to the timing of receipt or payment of amounts are recorded as either a receivable or payable in the balance sheet.
119
8. INTERGOVERNMENTAL FINANCIAL RELATIONS
FEATURES
| | • | | The Commonwealth Grants Commission’s 2008 Update Report on State Revenue Sharing Relativities shows that for the first time, Queensland will receive a below per capita share of GST revenue in 2008-09. Queensland’s share of GST revenue in 2008-09 will be reduced by $409.3 million in underlying terms compared with 2007-08 due to a downward revision to the State’s assessed relativity. |
| | • | | The Commonwealth Grants Commission’s assessment was based largely on Queensland’s strong growth in relative capacity to raise transfer duty on property conveyances, and changes in the characteristics of the State’s population which were identified in the results of the 2006 Census. |
| | • | | The expected reduction in Queensland’s share of GST in 2008-09 follows underlying losses experienced in recent years. It is anticipated that by 2011-12 Queensland will experience an annual cumulative loss in GST funding of more than $1.8 billion since the 2004 Review of methodology. |
| | • | | Revenue reductions for Queensland from the abolition of certain duties will be over $840 million in 2008-09, increasing to more than $1.3 billion in 2011-12. The abolition of these duties means that Queensland is becoming increasingly reliant on Australian Government funding, with approximately 41% of Queensland’s revenue being sourced from the Australian Government in 2008-09. |
| | • | | While Queensland’s revenue from GST is estimated to grow at an annual average rate of 3.4% from 2007-08 to 2011-12, Queensland’s available GST revenue per capita, adjusted for tax reform costs, is expected to decline on average by 0.6% per annum over the same period. |
| | • | | The Queensland Government provides strong fiscal support to the local government sector. In 2008-09, the Queensland Government will provide $847.9 million in grants to Queensland local government authorities, comprising 61.8% of grant funding for local government in Queensland. |
| | • | | The election of a new federal government has resulted in an increased focus on improving intergovernmental fiscal relations, with the Council of Australian Governments (COAG) initiating major reforms to tied funding arrangements between the Australian Government and the states. |
COMMONWEALTH-STATE FINANCIAL ARRANGEMENTS
In December 2007, the Council of Australian Governments (COAG) seized the initiative to embark on a collaborative approach to improve Commonwealth-state financial relations. The reform initiative has two major components.
The first of these reforms is to simplify and rationalise the more than 90 Specific Purpose Payments (SPPs) by grouping most of the relatively larger SPPs into five groups, including:
| | • | | education (early childhood and schools) |
| | • | | education (vocational education and training) |
It is proposed that many of the smaller SPPs will be cashed out, or bundled into a single, untied payment to states. In addition, the bundling or grouping of the major SPPs will occur along with streamlining the
120
administrative arrangements—with the Australian Government making a single, monthly SPP payment to state treasuries—and replacing input controls associated with SPPs in the past with performance based outcome measures.
The second reform initiative involves the development of National Partnership payments (NPPs) which will take the form of incentive and/or reward payments, designed to foster or trigger reform in areas of service delivery, or simply represent payment for specific outputs the State is delivering on behalf of the Australian Government.
It is anticipated that the new SPP framework will go some way to clarifying the roles and responsibilities of the Australian and state governments respectively. It is proposed that the Australian Government will drive national reforms, monitor and review program outcomes and provide funding. The role of the states will be to complement the Australian Government’s funds from own-source revenue, as well as provide and administer the services to deliver agreed benchmarks and outcomes. States will have the flexibility to allocate resources within broader service delivery areas (such as health) in ways that will produce the best outcomes for the community.
While not resolving the substantial vertical fiscal imbalance that continues to exist within the Australian Federation, under the new SPP framework the Australian Government has acknowledged the need to revise both the base and escalation factors associated with each of the five SPPs in a way that recognises the funding gap between states’ limited own-revenue sources and the revenue needs arising from their constitutionally assigned service delivery responsibilities.
Under the new framework for Commonwealth-state financial relations there will be four categories of funding provided to the states:
| | • | | a small number of national SPP agreements covering health, education, disability and housing |
| | • | | National Partnership payments for specific projects or reform-linked incentives |
| | • | | other general revenue assistance payments |
Key elements of the new framework for Commonwealth-state financial relations are discussed in Box 8.1.
Box 8.1
New framework for Commonwealth-state financial relations
The framework is based on the following elements:
| | • | | rationalisation of SPPs, by combining many of them into a smaller number of new national SPP agreements, while maintaining total Australian Government funding for these activities |
| | • | | at the centre of each new national SPP agreement will be a mutually agreed statement of roles, responsibilities, objectives and outcomes to which both levels of government commit |
| | • | | these new agreements and the Australian Government funding to support them will be on-going, rather than for fixed periods, but will still be subject to review: |
| | • | | periodically (e.g. every four to five years) in terms of adequacy of funding and related outcomes |
| | • | | on a continuous basis in terms of the relevance of the stated objectives and outcomes, the achievement of outcomes and performance monitoring |
121
| | • | | each national SPP agreement will contain simpler, standardised and more transparent performance reporting, with a focus on the achievement of outcomes, value for money and timely provision of publicly available performance information: |
| | • | | the focus on outcomes-based public accountability will replace input controls and other controls on how state funding is spent |
| | • | | the provision of NPPs for: |
| | • | | funding specific outputs or projects, including for some programs currently classified as SPPs (such as AusLink) |
| | • | | facilitating or rewarding broader reforms of national importance (reward payments will only be made following independent assessment that performance benchmarks have been achieved) |
| | • | | funding arrangements for the new framework to be negotiated as a financial package by Treasurers: |
| | • | | the three elements of base SPP funding, growth factors and NPPs should be considered as part of the overall Australian Government funding contribution provided to the states |
| | • | | all aspects of the arrangements will be actively monitored through the COAG process, including a new COAG Intergovernmental Agreement to underpin the SPP reforms and new NPP agreements. |
Australian Government funding to states
Commonwealth-state financial relations are characterised by a disparity between the revenue-raising capacity and the expenditure responsibilities of the Australian and state governments respectively. This mismatch is known as vertical fiscal imbalance.
The Australian Government collects the major share of taxation revenues and states must rely on grants from the Australian Government to meet their expenditure requirements.
Since the introduction of the Australian Government’s national tax reforms in 2000, states’ dependence on Australian Government funding has increased further. Chart 8.1 shows all states’ funding sources for 1999-2000 and 2008-09. In 1999-2000 the states received 35% of their revenues from the Australian Government. This is estimated to increase to 46% in 2008-09. In contrast, the proportion of the states’ revenues from state taxes has declined from 40% in 1999-2000 to an estimated 33% in 2008-09.
122
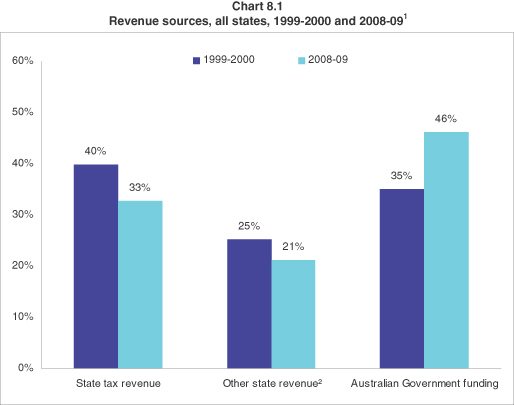
Notes:
| 1. | 2008-09 data are estimates. |
| 2. | Includes user charges, interest earnings, contributions from trading enterprises and mining revenue. |
Sources: ABS Government Finance Statistics Cat No. 5512.0 and state and Australian Government Budget Papers.
Table 8.1 shows that Australian Government payments to the states in 2008-09 are expected to total $77.9 billion, an increase of $3.7 billion or 5% compared with 2007-08.
Table 8.1
Estimated Australian Government payments to the states, 2007-08 and 2008-091
| | | | | | | | | | | | |
| | | 2007-08
$ million | | 2008-09
$ million | | Change
Nominal
Terms % | | Change
Real2
Terms % | | | Change
Real2 Per
Capita % | |
GST Revenue | | 42,630 | | 45,280 | | 6.2 | | 3.4 | | | 1.8 | |
Other General Revenue | | — | | 178 | | — | | — | | | — | |
Payments for Specific Purposes | | | | | | | | | | | | |
—‘to’ the States | | 23,940 | | 24,138 | | 0.8 | | (1.9 | ) | | (3.3 | ) |
—‘through’ the States | | 7,639 | | 8,324 | | 9.0 | | 6.1 | | | 4.5 | |
Total Payments for Specific Purposes | | 31,579 | | 32,462 | | 2.8 | | 0.0 | | | (1.4 | ) |
Total Payments | | 74,209 | | 77,922 | | 5.0 | | 2.2 | | | 0.7 | |
Notes:
| 1. | Numbers may not add due to rounding. |
| 2. | Deflated by the 2007-08 year average national inflation forecast of 2.75% and national population growth of 1.5%. |
123
| 3. | Payments for specific purposes includes existing SPPs, new national SPPs and NPPs. |
| 4. | Payments for specific purposes are not strictly comparable as some payments are to be reclassified as general revenue assistance from 1 January 2009. |
| 5. | Other general revenue includes NCP payments, royalties, compensation for Australian Government policy decisions and ACT municipal services. |
Source: Australian Government Budget Paper No.3, 2008-09.
GST revenue from the Australian Government to all states is expected to increase from $42.6 billion in 2007-08 to $45.3 billion in 2008-09, an increase of 6.2% in nominal terms. In real per capita terms, GST is expected to increase by 1.8%.
Total payments for specific purposes in 2008-09 are expected to be $32.5 billion. This represents an increase of $883 million, or 2.8% in nominal terms, over 2007-08. Payments “to” the states will increase by 0.8% in nominal terms, compared with an increase of 9% in payments for specific purposes “through” the states.
State shares of Australian Government Funding
Table 8.2 shows the expected shares of total Australian Government payments to each state for 2008-09 compared with each state’s population share. Queensland’s anticipated share of total Australian Government funding of 19.4% in 2008-09 will be less than its population share of 20.1%.
Table 8.2
Relative shares of payments to the states, 2008-091
| | | | | | |
| | | Share of
payments % | | Share of
population % | | Relative
share2
% |
New South Wales | | 30.1 | | 32.6 | | 92.4 |
Victoria | | 22.3 | | 24.8 | | 90.0 |
Queensland | | 19.4 | | 20.1 | | 96.6 |
Western Australia | | 10.4 | | 10.1 | | 102.3 |
South Australia | | 8.7 | | 7.5 | | 116.8 |
Tasmania | | 3.3 | | 2.3 | | 142.0 |
Australian Capital Territory | | 1.8 | | 1.6 | | 112.5 |
Northern Territory | | 4.0 | | 1.0 | | 389.7 |
Notes:
| 1. | Numbers may not add due to rounding. |
| 2. | A state’s relative share is measured as its funding share as a percentage of its population share. |
Source: Australian Government Budget Paper No.3, 2008-09.
124
Queensland’s share of Australian Government funding
Table 8.3 details Queensland’s share of estimated Australian Government payments in 2008-09 and the difference from its population share. Queensland expects to receive $341.3 million less than a per capita share of GST revenue. Additionally, Queensland expects to receive $103.4 million less than a per capita share of total payments for specific purposes. In terms of total Australian Government funding, Queensland expects to receive $444.7 million less than a per capita share in 2008-09.
Table 8.3
Queensland’s share of estimated Australian Government payments
2008-09
| | | | | |
| | | Queensland’s
Share
% | | Difference
from
Population
Share
$ million | |
GST Revenues1 | | 19.3 | | (341.3 | ) |
Payments for Specific Purposes | | | | | |
—‘to’ the State | | 19.8 | | (63.3 | ) |
—‘through’ the State | | 19.6 | | (40.1 | ) |
Total Payments for Specific Purposes | | 19.7 | | (103.4 | ) |
Total Australian Government Payments1 | | 19.4 | | (444.7 | ) |
Note:
| 1. | Adjustment for GST deferral included. |
Source: Australian Government Budget Paper No.3, 2008-09.
In addition to the Commonwealth funding discussed above, the Australian Government also provides assistance directly to industry through tariffs, tax concessions or direct budgetary outlays. The major beneficiaries of this assistance in 2006-07, as a percentage of gross state product (GSP), were Victoria and South Australia at around 1% of GSP, while assistance to Queensland industry was around 0.5% of GSP.
Queensland’s reliance on Australian Government funding
Queensland’s reliance on Australian Government funding, as shown in Chart 8.2, is consistent with the national trend, with the share of total funding sourced from the Australian Government increasing from 35% in 1999-2000 to an estimated 41% in 2008-09. Meanwhile Queensland’s own-source revenue has fallen from 65% in 1999-2000 to 59% in 2008-09.
125
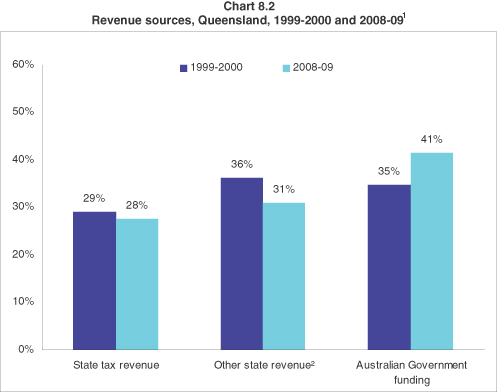
Notes:
| 1. | 2008-09 data are estimates. |
| 2. | Includes user charges, interest earnings, contributions from trading enterprises and mining revenue. |
Source: ABS Government Finance Statistics Cat No. 5512.0 and Queensland Budget estimates.
DISTRIBUTION OF GST FUNDS
Commonwealth Grants Commission
The Commonwealth Grants Commission (CGC) advises the Australian Government on the distribution of GST revenue among the states. Under its terms of reference the CGC is required to determine its recommendations on the basis of horizontal fiscal equalisation, as detailed in Box 8.2.
Box 8.2
Horizontal fiscal equalisation and distribution of GST
Commonwealth Grants Commission
The Commonwealth Grants Commission (CGC) advises the Australian Government on the distribution of GST revenue among the states and each year updates the financial, economic and demographic data that underpin its recommendations.
Horizontal Fiscal Equalisation
The Australian Government distributes GST revenue to states based on the principle of horizontal fiscal equalisation (HFE), using per capita relativities recommended by the CGC. Queensland supports the principle of HFE and the role of the independent CGC in determining each state’s share of GST revenue.
126
The principle of HFE is that state governments should receive funding from the Australian Government such that, if each made the same effort to raise revenue from its own sources and operated at the same level of efficiency of service delivery, each would have the capacity to provide services to the same standard.
A distribution based on HFE principles recognises the different financial capacities of the states, particularly that some states have inherently greater capacity to raise revenue and that some states have inherently greater costs to meet in providing services to an Australian standard. If the distribution of the GST to the states were on any basis other than HFE, some taxpayers would be forced to accept either a lower standard of state services or a higher level of state taxation than other taxpayers in similar circumstances.
Complaints about Equalisation
New South Wales and Victoria have complained about the distribution of GST because they do not receive the GST revenue they claim has been paid by their taxpayers. Aside from the absence of data required to determine how much of the GST is attributable to one state or another, it would not be fair to distribute a tax on the basis of where it was collected. The GST is a nationally based tax and to suggest that it should be distributed back to the states on the basis of where it was raised is akin to saying that the Australian Government income tax should be spent in the states where it was collected. If wealthy states retained all the national taxes that they contribute it would be inequitable, unfair and contrary to the national interest.
More information on HFE and GST distribution can be accessed through the Queensland Government Treasury website: www.treasury.qld.gov.au/gst-factsheets or the Commonwealth Grants Commission website: www.cgc.gov.au.
2008 Update Report on State Revenue Sharing Relativities
At the 2008 Treasurer’s Conference, the Australian Government accepted the CGC’s 2008 Update Report on State Revenue Sharing Relativities (2008 Update) as the basis for the distribution of the GST revenue to the states in 2008-09.
In the 2008 Update, the CGC recommended an underlying decrease in Queensland’s share of GST revenue of $409.3 million in 2008-09, as shown in Table 8.4. This has resulted in Queensland receiving a less than per capita share of GST funding for the first time in 2008-09.
New South Wales and Victoria have gained significantly from the 2008 Update with underlying increases of $341.5 million and $316.9 million respectively.
Table 8.4
Components of underlying change in states share of GST revenue 2007-08 to 2008-091
| | | | | | | | | | | | | | | | | | | | | | |
| | | NSW
$ million | | | VIC
$ million | | QLD
$ million | | | WA
$ million | | | SA
$ million | | | TAS
$ million | | | ACT
$ million | | | NT
$ million |
Revenue | | 325.1 | | | 255.9 | | (289.2 | ) | | (323.5 | ) | | 26.0 | | | (4.2 | ) | | 3.9 | | | 6.1 |
Expenditure | | 59.2 | | | 31.2 | | (96.5 | ) | | (5.1 | ) | | (35.3 | ) | | (17.7 | ) | | (7.9 | ) | | 72.1 |
SPPs | | (41.8 | ) | | 30.7 | | (23.5 | ) | | 2.2 | | | 14.7 | | | 5.3 | | | 12.1 | | | 0.5 |
Total | | 341.5 | | | 316.9 | | (409.3 | ) | | (326.7 | ) | | 5.8 | | | (16.2 | ) | | 8.2 | | | 79.8 |
Note:
| 1. | Numbers may not add due to interactions between Expenditure and SPP assessments. |
Source: Commonwealth Grant Commission 2008 Update Report on State Revenue Sharing Relativities.
127
The decrease in Queensland’s GST revenue share follows reductions in its share of GST funding of $174 million in 2006 and $166 million in 2007. It is expected that Queensland will experience further losses of GST share in future updates as the economy continues to perform strongly. It is anticipated that by 2011-12 Queensland will have experienced a cumulative loss in GST funding of more than $1.8 billion since the 2004 Review of Methodology.
Queensland’s declining share of GST revenue reflects the state’s increased fiscal capacity, particularly from strong performances in the property market and mining sector. The change in Queensland’s GST share over the last three years demonstrates the responsiveness of the CGC’s methodology to changes in states’ revenue earning capacities and expenditure needs. However, the current methodology does not adequately account for the increases in capital expenditure required by states driven by high population growth. Queensland is working with the CGC and the other states to develop a capital assessment as a part of the 2010 Review process (see Box 8.3 for more details).
Box 8.3
Queensland’s Declining Share of GST Revenue
The CGC uses the latest available data in its assessments, which reflect the relative economic circumstances of the states. For example, in the 2008 Update, the CGC found that Queensland had a relatively greater capacity to raise revenue from stamp duty on conveyances and mining revenue. This greater revenue raising capacity, amongst other things, is reducing Queensland’s share of GST funding. Changes in the characteristics of Queensland’s population such as age and income levels, along with the removal of some state taxes from the CGC’s assessment also reduced Queensland’s share of GST funding in the 2008 Update.
In 2008-09 Queensland will receive a share of GST below its per capita share, with the state’s share of GST revenue expected to continue to decline over the next few years. The decreased share of GST revenue will impact the State’s capacity to provide additional services, or enhance existing services to meet the needs of Australia’s fastest growing population base.
However, Queensland recognises that states which experience higher than average economic growth should expect, other things being equal, to see their share of GST revenue fall. This is an intended consequence of the current GST distribution process and is a key aspect of maintaining equity between the states. The 2008 Update shows that New South Wales and Victoria will benefit from $658.4 million being redistributed to them, mostly from Queensland and Western Australia.
The CGC currently use an average of the five most recent single year relativities to reduce the volatility of the annual results. In the absence of this process for smoothing changes in state shares, the current strong performance of the Queensland and Western Australian economies would result in larger changes in redistributions between the states. In particular New South Wales and Victoria would have received an even greater benefit from the 2008 Update, had the current process for smoothing changes in state shares of GST not acted as a mechanism to provide greater stability in GST funding to states.
The Commission’s latest outcomes demonstrate that the grant distribution process is responsive and reflects changes in states’ circumstances.
A key concern that Queensland has with the Commission’s current processes is that they do not adequately take account of states’ need for increased capital expenditure associated with a fast growing population. Queensland is currently experiencing population growth almost twice that of the national average, which is driving expenditure on infrastructure. At the same time, Queensland is receiving a smaller share of the GST funding and this lack of immediacy in recognising capital investment needs to be addressed as a matter of urgency. Queensland intends supporting a capital assessment proposed by the Commission for the 2010 Review of methodology that will account for share of population growth and result in more immediate consideration of capital expenditure.
128
Relationship between GST distribution and economic performance
A key feature of recent Updates has been the convergence of the fast growing states of Queensland and Western Australia with the more established economies of New South Wales and Victoria.
There has been some criticism of the GST distribution process on the basis that it does not adequately take into account the rapid growth in the Queensland and Western Australian economies. Chart 8.3 shows that Queensland’s GSP per capita has been converging with that of both New South Wales and Victoria over the period from 2002-03 to 2006-07.
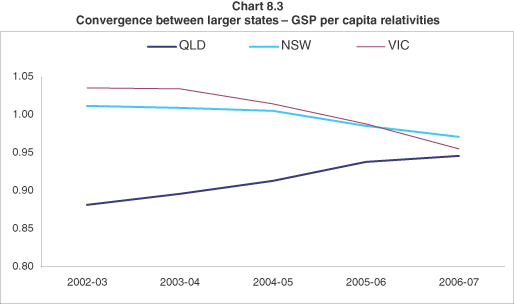
Source: Commonwealth Grants Commission Relative Fiscal Capacities of the States 2008.
Over these four years, Victoria’s GSP per capita has declined from 4% above the Australian average, while Queensland’s GSP per capita has risen substantially towards the national average.
At the same time, New South Wales’ assessed GST single year relativity, which is a key determinant of its share of the GST pool, has risen from 0.84 to 0.96. Over the same period Queensland’s single year GST relativity has fallen from 1.06 to 0.90 as shown in Chart 8.4.
129
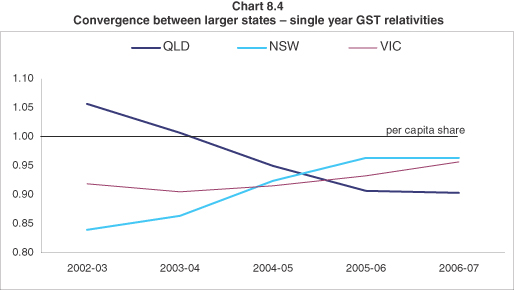
Source: Commonwealth Grants Commission 2008 Update Report on State Revenue Sharing Relativities.
The CGC’s 2008 Update data shows that for both 2005-06 and 2006-07, Queensland’s assessed single year GST relativity was lower than that for both New South Wales and Victoria, which means that for the past two years Queensland has been assessed as requiring less per capita from the GST pool than either of these states.
It is clear that as the relative economic strength of a state changes, so too does its assessed share of GST funding. Queensland recognises that this is the intended consequence of the GST assessment process.
2010 Review of State Revenue Sharing Relativities—progress report
The CGC undertakes a substantive review of its methodology every five years, with the next review due to be completed in 2010. The terms of reference for the 2010 Review of State Revenue Sharing Relativities (2010 review) direct the CGC to simplify its processes and introduce a more streamlined approach to HFE, based on a simplified methodology and better quality data as discussed in Box 8.4. The 2010 review is different to previous reviews and can be viewed as an overhaul of the way the CGC structures its assessments.
Box 8.4
The 2010 review
Some states have raised concerns about the GST distribution process, including suggestions that GST should be distributed on the basis of which state it is raised in, and that grant distribution processes inhibit states from introducing efficiency reforms. Some states have raised concerns that the current process is complex and should be simplified.
An overhaul of how the Commission determines the distribution of the GST
The CGC is currently conducting a review, due in 2010, of the processes used to determine the distribution of the GST revenue. The CGC has indicated that it intends to vigorously pursue both equalisation and simplification for the 2010 review, and has adopted a strategy that:
| | • | | starts with a clean slate when it comes to devising assessment methods |
130
| | • | | adopts a top-down approach, only disaggregating assessment categories if doing so materially improves equalisation and it can be done reliably |
| | • | | works toward improving the quality of data used in the assessments |
| | • | | establishes new assessment guidelines with stronger reliability and materiality criteria. |
Using this strategy, the CGC believes that simplification will improve the reliability and robustness of the processes and acceptability of the outcomes. The CGC is providing all states with the opportunity to put forward arguments about the distribution process. To date no substantive body of evidence has been put forward to support claims that there is anything conceptually wrong with the current principle of fiscal equalisation and the Commission has ruled that discussion regarding this principle is now closed.
Queensland has been proactively involved with working with the Commission to identify areas for simplification of assessments in the 2010 review. A number of alternative approaches and models have been suggested by Queensland to simplify and enhance assessments such as road measurement, dispersion and wages input costs.
Queensland agrees that the strategy adopted by the CGC should make the process simpler, more transparent and ensure that the data used in the assessments is more accurate, consistent and comparable across states.
Progress reports on the 2010 review process were provided to the Ministerial Council for Commonwealth-State Financial Relations in March 2007 and 2008. These reports are available on the CGC’s web site: www.cgc.gov.au.
Queensland’s available GST revenue
The amount of GST revenue provided to Queensland is not equal to the amount of funding available to be spent by the Queensland Government, as can be seen in Chart 8.5. The Queensland Government has to meet a number of costs associated with its commitments under the Intergovernmental Agreement on Commonwealth-State Financial Relations (IGA): the First Home Owners Grant scheme; GST administration costs payable to the Australian Tax Office; and the cost of taxes abolished as part of the IGA.
It is anticipated that Queensland’s total share of GST will continue to grow at an annual average rate of 3.4 % from 2007-08 to 2011-12. The increase in GST is largely attributable to population growth in Queensland along with the increase in the size of the overall GST pool. However, Chart 8.5 shows that after taking the costs listed above, as well as the state’s relatively rapid population growth into consideration, Queensland’s available GST revenue per capita is estimated to decline on average by 0.6 % per annum over the same period.
131
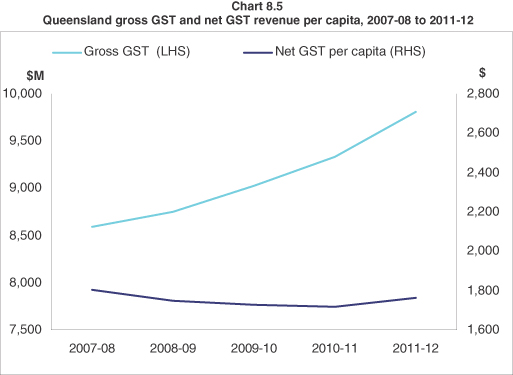
Note:
| 1. | Net GST revenue per capita represents net available revenue after meeting First Home Owners Grant Scheme costs, GST administration costs and the cost of taxes abolished under the IGA. |
Source: Australian Government Budget Paper No.3, 2008-09 and Queensland Treasury.
STATE-LOCAL GOVERNMENT FINANCIAL RELATIONS
In 2008-09, a total of $1.373 billion in grants will be provided to Queensland’s local governments (up from $1.202 billion in 2007-08), with 61.8% of this amount provided by the Queensland Government and the balance provided by the Australian Government.
Table 8.5 details Queensland Government and Australian Government grants to local government in Queensland.
The overall increase in total Queensland Government grants to local government authorities in 2008-09 reflects the expansion of some existing programs or the introduction of new initiatives by some Queensland Government agencies, including:
| | • | | Indigenous Community Housing (Department of Housing) |
| | • | | South East Queensland Cycle Network (Queensland Transport) |
| | • | | Dam Safety Upgrade Program (Department of Natural Resources and Water) |
| | • | | 150th Anniversary Legacy Infrastructure Program, Water and Sewerage Program and Smaller Communities Assistance Program (Department of Local Government, Sport and Recreation). |
132
Table 8.5
Grants to local government in Queensland1,2,3
| | | | | | |
| | | 2006-07
Actual
$ million | | 2007-08
Estimated
Actual
$ million | | 2008-09
Budget
Estimate
$ million |
Queensland Government grants | | | | | | |
Communities | | 50.7 | | 56.1 | | 60.8 |
—including Pensioner Rates Rebate | | 41.5 | | 44.3 | | 49.3 |
Education, Training and Arts | | 18.4 | | 19.7 | | 19.4 |
Employment and Industrial Relations | | 23.4 | | 7.6 | | 8.7 |
Emergency Services | | 7.1 | | 8.1 | | 8.5 |
Housing | | 52.7 | | 69.1 | | 94.6 |
Local Government, Sport and Recreation | | 391.3 | | 400.3 | | 507.2 |
Main Roads | | 74.0 | | 104.0 | | 78.8 |
Natural Resources and Water4 | | 56.1 | | 2.3 | | 14.0 |
Public Works | | 1.9 | | 32.1 | | 1.7 |
Disability Services | | 13.2 | | 17.0 | | 17.1 |
Environmental Protection Agency | | 0.7 | | 3.9 | | 0.9 |
Health | | 1.1 | | 1.6 | | 1.6 |
Transport | | 11.0 | | 19.0 | | 32.2 |
Other | | 2.3 | | 3.1 | | 2.4 |
Total Queensland Government grants | | 703.8 | | 743.9 | | 847.9 |
| | | |
Australian Government grants | | | | | | |
Australian Government “through” | | 327.3 | | 346.8 | | 363.9 |
Australian Government “direct” | | 77.0 | | 110.9 | | 161.1 |
Total Australian Government grants | | 404.3 | | 457.7 | | 525.0 |
| | | |
Total Grants to Local Government Authorities and Aboriginal and Torres Straight Islander Councils | | 1,108.1 | | 1,201.5 | | 1,372.9 |
Notes:
| 1. | For current and capital purposes to local government authorities and Aboriginal and Islander councils. |
| 2. | Numbers yet to be confirmed and may be subject to revision. |
| 3. | Numbers may not add due to rounding. |
| 4. | Ross River Dam completed 2006-07. |
Source: Queensland Treasury, Australian Government Final Budget Outcome 2006-07, Australian Government Budget paper No.3 2008-09.
Grant purposes
The majority of grants to local government are for capital purposes. In 2008-09 capital grants will comprise 79.7% of Queensland Government grants to local government (up from 75.4% in 2007-08).
Grants for housing and community amenities comprise the largest component of Queensland Government grants. Other significant grant purposes include:
| | • | | general public services (including contribution to the costs of providing local government services where councils are unable to levy land rates) |
| | • | | the provision of rate subsidies to eligible pensioners |
| | • | | capital works subsidies provided towards the costs of local public infrastructure |
| | • | | road subsidies for local roads, networks and drainage. |
133
Chart 8.6 highlights the broad range of purposes for which local government grants were provided by the Queensland Government in 2007-08.
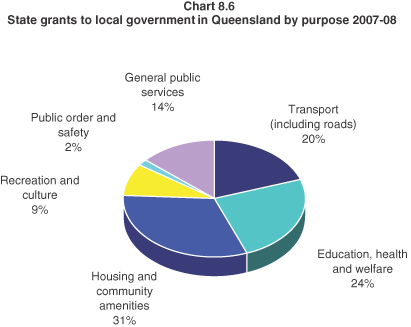
134
9. UNIFORM PRESENTATION FRAMEWORK
INTRODUCTION
This chapter contains detailed financial statements for the Queensland Public Sector prepared under the Uniform Presentation Framework (UPF) of reporting as required under the Australian Loan Council arrangements.
The Framework has recently been reviewed following the release in October 2007 of the Australian Accounting Standards Board’s (AASB) new accounting standard, AASB 1049 Whole of Government and General Government Sector Financial Reporting.
The new standard aims to harmonise Government Finance Statistics (GFS) and Generally Accepted Accounting Principles (GAAP) with the objective of improving the clarity and transparency of government financial statements.
In addition, the chapter provides:
| | • | | a reconciliation of the General Government sector net operating balance to the accounting operating result |
| | • | | a time series for the General Government sector using the revised UPF |
| | • | | details of General Government grant revenue and expenses |
| | • | | details of General Government sector dividend and income tax equivalent income |
| | • | | data on General Government expenses and purchases of non-financial assets by function |
| | • | | details of taxation revenue collected by the General Government sector |
| | • | | the State’s revised Loan Council Budget allocation |
| | • | | background information on the revised UPF and disclosure differences arising from it, including the conceptual basis, sector definitions and a list of reporting entities. |
This chapter also includes a discussion of the operations of the Public Non-Financial Corporations (PNFC) sector.
Under the UPF requirements, budgeted financial information for the Public Financial Corporations (PFC) sector is not included.
GENERAL GOVERNMENT SECTOR
A detailed analysis of the General Government sector is provided in Chapter 5—Revenue, Chapter 6 —Expenses and Chapter 7—Balance Sheet and Cash Flows.
PUBLIC NON-FINANCIAL CORPORATIONS SECTOR
The PNFC sector (which includes the GOCs, Queensland Motorways Limited and the SEQ Bulk Water entities including the Water Grid Manager) continues to perform strongly despite the impact of an increasingly competitive environment and cost pressures. The PNFC sector has forecast total dividend payments of $831 million in 2008-09, with current tax equivalent payments of $192 million.
Government is committed to ensuring that essential services such as electricity and public transport continue to be provided to Queenslanders at a reasonable cost through the provision of Community Service Obligation (CSO) payments. In 2008-09, a total of $1.706 billion in CSO payments will be provided, mainly to QR Limited (QR) in respect of passenger rail travel and Ergon Energy in respect of the electricity uniform tariff.
135
Investment in PNFC infrastructure is required to ensure PNFC entities continue to provide essential services and an appropriate return to Government. Net additional funding of approximately $389 million by way of equity injections has been budgeted for in 2008-09 to enable PNFCs to undertake such investments and remain financially sound. In 2008-09, significant investment will occur in the water and rail sectors with QR budgeted to receive over $670 million. Partially offsetting these injections will be the expected returns to Government from the previously announced airport sales.
PNFC operating statement
The majority of revenue generated in the PNFC sector is received through the sale of goods and services, and the receipt of current grants and subsidies.
For PNFC entities, the majority of sales of goods and services are to customer markets. These revenues are therefore heavily linked to the performance of the Queensland economy and the ability of the sector to compete in increasingly competitive markets.
The major components of PNFC sector revenues include rail freight charges, electricity sales, electricity network and distribution charges, port charges and agricultural and bulk water delivery charges. Key determinants of PNFC revenue growth in 2008-09 will be energy demands, driving electricity pool prices, and continued growth in Queensland’s export markets, in particular coal exports, which generate demand for rail and port services.
Across the PNFC sector, it is anticipated that sales of goods and services will generate revenues of $8.308 billion in 2008-09, with total revenues forecast at $10.561 billion. Total revenues generated by the sector are forecast to grow to $14.020 billion in 2011-12. Again, major drivers include continued demand for PNFC services and supplies in the electricity, rail, water and port sectors.
PNFC revenues are also derived from CSO payments. CSOs are provided by the State where PNFCs are required to provide non-commercial services or services at non-commercial prices for the benefit of the community. Major CSOs include the uniform electricity tariff and QR passenger rail services.
The PNFC sector distributes dividends to the State as shareholder. Dividends from the PNFC sector are a function of net profits and the dividend payout ratio. In general, the dividend payout ratio for the 2008-09 Budget is based on 80% of net profit after tax. In some cases, forecast net profit after tax will be adjusted to exclude any unrealised (i.e. non-cash) forecast gains or losses, for example, from upward revaluation of non-current assets or financial instruments.
The dividend payout ratio does not affect a PNFC’s capacity to carry out necessary maintenance and repairs, as dividends are paid after PNFCs have met their commitments to operating and maintenance expenses. Shareholding Ministers consider the circumstances of individual PNFCs and advice from their boards before arriving at a final determination of dividend payments.
The PNFC sector reflects positive performance with a forecast UPF net operating balance for the 2008-09 year of $604 million.
PNFC balance sheet and cash flow statement
The ability of PNFCs to efficiently and effectively service their customers is reliant upon the investment in and maintenance of underlying infrastructure.
In 2008-09, the PNFC sector is expected to invest approximately $9.985 billion in capital projects. Significant levels of investment are expected to continue across the forward estimates period although they
136
decline in 2011-12 reflecting the completion of a number of major projects including the Gateway Upgrade Project, several major water projects including the proposed Traveston dam and a number of significant energy generation projects.
PNFCs undertake infrastructure investment on a commercial basis and in response to the needs of the market sectors they service.
Investment in electricity infrastructure is driven by peak demand which continues to grow, largely as a result of Queensland’s significant population and economic growth. The focus of capital expenditure in the sector during the year will be on ensuring ongoing generation plant reliability and efficiency, a secure and reliable transmission network across the State and the security and reliability of the extensive distribution network.
In 2008-09, $86 million will be invested by Tarong in developing coal resources at the Kunioon mine, reflecting the continued commitment to security of supply. Capital works programs for 2008-09 will also contribute to the improved level of reliability of electricity transmission and distribution, with a focus on service quality, reliability, availability and capacity improvements. The combined capital network expenditure of Powerlink, Ergon Energy and ENERGEX in 2008-09 totals $2.591 billion.
Powerlink will invest $675 million on new transmission infrastructure and augmentation, while ENERGEX and Ergon Energy will similarly invest a total of $1.916 billion on the distribution networks to maintain reliable and secure transmission and distribution electricity networks across the State.
As one of the State’s largest industries, the coal industry continues to be a key economic driver. Proposed rail and port expansion programs reflect ongoing capital investment in coal supply chains. This includes QR Limited’s forecast 2008-09 expenditure of approximately $880 million on coal network track works and upgraded locomotives and wagons to increase and provide support for additional coal haulage in Central Queensland. The Ports Corporation of Queensland will invest $250 million in 2008-09 in further expanding the coal export capacity of the Abbot Point terminal to 50 million tonnes per annum.
The PNFC capital investment also includes key SEQ bulk water projects, including the Western Corridor Recycled Water project, the South East Queensland (Gold Coast) Desalination Plant, the Southern Regional Water Pipeline and stage 1 of the Northern Pipeline Interconnector.
Financing of capital projects will differ according to the individual circumstances of the relevant PNFC and the specific nature of the project. There are a number of ways in which PNFCs fund these investments, including utilising cash flows from their business, borrowings, and equity injections from shareholding Ministers. The Government is committed to PNFCs being at all times able to fund viable projects whilst at the same time retaining a sound financial position, by ensuring that all PNFCs remain sufficiently well capitalised to ensure an investment grade credit rating as determined by independent credit ratings agencies.
Reflecting the level of support for capital investment within a sound financial framework, an estimated $2.023 billion in net equity support is budgeted to be provided to the PNFC sector for the forward estimates period 2008-09 to 2011-12.
It is worth noting that the PNFC balance sheet is significantly impacted by the requirement of the revised UPF to recognise deferred tax assets and liabilities. In 2008-09 this reduces PNFC net worth by $4.614 billion. (Refer Box 9.1 for further information on disclosure and classification differences arising from the revised UPF.)
The Public Non-financial Corporations sector is discussed in more detail in Chapter 4.
137
UNIFORM PRESENTATION FRAMEWORK FINANCIAL INFORMATION
The tables on the following pages present operating statements, balance sheets and cash flow statements prepared on a harmonised basis for the General Government, Public Non-financial Corporations and Non-financial Public sectors.
Table 9.1
General Government Sector Operating Statement1
| | | | | | | | | | | | | | | | | | | | |
| | | | | 2007-08
Budget2
$ million | | | 2007-08
Est.Actual
$ million | | | 2008-09
Budget
$ million | | | 2009-10
Projection
$ million | | | 2010-11
Projection
$ million | | | 2011-12
Projection
$ million | |
| | Revenue from Transactions | | | | | | | | | | | | | | | | | | |
| | Taxation revenue | | 9,272 | | | 9,552 | | | 10,106 | | | 10,843 | | | 11,753 | | | 12,612 | |
| | Grants revenue | | 15,167 | | | 15,492 | | | 15,687 | | | 16,049 | | | 16,261 | | | 16,701 | |
| | Sales of goods and services | | 3,005 | | | 3,245 | | | 3,385 | | | 3,369 | | | 3,465 | | | 3,524 | |
| | Interest income | | 2,190 | | | 841 | | | 2,199 | | | 2,253 | | | 2,335 | | | 2,421 | |
| | Dividend and income tax equivalent income | | 1,116 | | | 1,217 | | | 1,051 | | | 1,492 | | | 1,699 | | | 2,203 | |
| | Other revenue | | 1,802 | | | 1,930 | | | 4,154 | | | 3,234 | | | 3,124 | | | 2,923 | |
| | Total Revenue from Transactions | | 32,551 | | | 32,276 | | | 36,582 | | | 37,240 | | | 38,638 | | | 40,385 | |
| | | | | | | |
Less | | Expenses from Transactions | | | | | | | | | | | | | | | | | | |
| | Employee expenses | | 12,595 | | | 12,840 | | | 13,896 | | | 14,710 | | | 15,590 | | | 16,452 | |
| | Superannuation expenses | | | | | | | | | | | | | | | | | | |
| | Superannuation interest cost | | 969 | | | 996 | | | 1,219 | | | 1,280 | | | 1,337 | | | 1,389 | |
| | Other superannuation expenses | | 1,681 | | | 1,913 | | | 1,959 | | | 2,009 | | | 2,069 | | | 2,090 | |
| | Other operating expenses | | 6,194 | | | 6,240 | | | 6,782 | | | 6,808 | | | 6,983 | | | 7,182 | |
| | Depreciation and amortisation | | 2,015 | | | 2,257 | | | 2,665 | | | 2,721 | | | 2,766 | | | 2,882 | |
| | Other interest expenses | | 390 | | | 383 | | | 539 | | | 787 | | | 1,036 | | | 1,293 | |
| | Grants expenses | | 8,438 | | | 8,641 | | | 8,713 | | | 8,385 | | | 8,641 | | | 8,833 | |
| | Total Expenses from Transactions | | 32,282 | | | 33,271 | | | 35,772 | | | 36,700 | | | 38,422 | | | 40,120 | |
| | | | | | | |
Equals | | Net Operating Balance | | 268 | | | (995 | ) | | 809 | | | 540 | | | 215 | | | 265 | |
| | | | | | | |
Plus | | Other economic flows—included in operating result | | 49 | | | 1,374 | | | 579 | | | (8 | ) | | (12 | ) | | (6 | ) |
| | | | | | | |
Equals | | Operating Result | | 318 | | | 380 | | | 1,388 | | | 532 | | | 203 | | | 259 | |
| | | | | | | |
Plus | | Other economic flows—other movements in equity | | 5,015 | | | 4,868 | | | 4,080 | | | 3,613 | | | 3,579 | | | 3,494 | |
| | | | | | | |
Equals | | Comprehensive Result—Total Change In Net Worth | | 5,333 | | | 5,247 | | | 5,468 | | | 4,145 | | | 3,782 | | | 3,752 | |
| | | | | | | |
| | KEY FISCAL AGGREGATES | | | | | | | | | | | | | | | | | | |
| | | | | | | |
| | Net Operating Balance | | 268 | | | (995 | ) | | 809 | | | 540 | | | 215 | | | 265 | |
Less | | Net Acquisition of Non-financial Assets | | | | | | | | | | | | | | | | | | |
| | Purchases of non-financial assets | | 5,463 | | | 5,223 | | | 6,651 | | | 6,693 | | | 6,590 | | | 5,824 | |
| | Less Sales of non-financial assets | | 331 | | | 434 | | | 340 | | | 283 | | | 334 | | | 256 | |
| | Less Depreciation | | 2,015 | | | 2,257 | | | 2,665 | | | 2,721 | | | 2,766 | | | 2,882 | |
| | Plus Change in inventories | | 62 | | | 45 | | | 97 | | | 9 | | | 31 | | | 54 | |
| | Plus Other movements in non-financial assets | | (134 | ) | | 6 | | | 200 | | | 50 | | | 50 | | | 50 | |
| | Equals Total Net Acquisition of Non-financial Assets | | 3,045 | | | 2,583 | | | 3,944 | | | 3,749 | | | 3,572 | | | 2,790 | |
Equals | | Net Lending / (Borrowing) | | (2,777 | ) | | (3,577 | ) | | (3,134 | ) | | (3,209 | ) | | (3,356 | ) | | (2,525 | ) |
Notes:
| 1. | Numbers may not add due to rounding. |
| 2. | Numbers have been restated where subsequent changes in classification have occurred. |
138
Table 9.2
Public Non-financial Corporations Sector Operating Statement1
| | | | | | | | | | | | | | | | | | | | |
| | | | | 2007-08
Budget2
$ million | | | 2007-08
Est.Actual
$ million | | | 2008-09
Budget
$ million | | | 2009-10
Projection
$ million | | | 2010-11
Projection
$ million | | | 2011-12
Projection
$ million | |
| | Revenue from Transactions | | | | | | | | | | | | | | | | | | |
| | Grants revenue | | 2,217 | | | 2,469 | | | 1,905 | | | 1,928 | | | 2,025 | | | 2,084 | |
| | Sales of goods and services | | 6,489 | | | 7,023 | | | 8,308 | | | 9,447 | | | 10,381 | | | 11,491 | |
| | Interest income | | 78 | | | 174 | | | 96 | | | 93 | | | 99 | | | 99 | |
| | Dividend and income tax equivalent income | | 5 | | | 12 | | | — | | | — | | | — | | | — | |
| | Other revenue | | 322 | | | 298 | | | 251 | | | 320 | | | 300 | | | 346 | |
| | Total Revenue from Transactions | | 9,111 | | | 9,977 | | | 10,561 | | | 11,788 | | | 12,805 | | | 14,020 | |
| | | | | | | |
Less | | Expenses from Transactions | | | | | | | | | | | | | | | | | | |
| | Employee expenses | | 2,178 | | | 2,153 | | | 2,569 | | | 2,707 | | | 2,849 | | | 3,031 | |
| | Superannuation expenses | | | | | | | | | | | | | | | | | | |
| | Superannuation interest cost | | — | | | — | | | — | | | — | | | — | | | — | |
| | Other superannuation expenses | | 95 | | | 71 | | | 70 | | | 80 | | | 86 | | | 90 | |
| | Other operating expenses | | 2,399 | | | 3,115 | | | 3,088 | | | 3,172 | | | 3,353 | | | 3,385 | |
| | Depreciation and amortisation | | 1,726 | | | 1,699 | | | 1,897 | | | 2,140 | | | 2,347 | | | 2,566 | |
| | Other interest expenses | | 1,327 | | | 1,478 | | | 2,136 | | | 2,398 | | | 2,822 | | | 3,045 | |
| | Grants expenses | | 24 | | | 54 | | | 3 | | | 3 | | | 3 | | | 3 | |
| | Other property expenses | | 182 | | | 230 | | | 194 | | | 435 | | | 518 | | | 606 | |
| | Total Expenses from Transactions | | 7,930 | | | 8,800 | | | 9,956 | | | 10,934 | | | 11,977 | | | 12,726 | |
| | | | | | | |
Equals | | Net Operating Balance | | 1,181 | | | 1,177 | | | 604 | | | 854 | | | 828 | | | 1,294 | |
| | | | | | | |
Plus | | Other economic flows—included in operating result | | (49 | ) | | 511 | | | 429 | | | 77 | | | 62 | | | 48 | |
| | | | | | | |
Equals | | Operating Result | | 1,132 | | | 1,688 | | | 1,034 | | | 931 | | | 890 | | | 1,342 | |
| | | | | | | |
Plus | | Other economic flows—other movements in equity | | 396 | | | (763 | ) | | (365 | ) | | 134 | | | (81 | ) | | (837 | ) |
| | | | | | | |
Equals | | Comprehensive Result—Total Change In Net Worth | | 1,528 | | | 925 | | | 668 | | | 1,065 | | | 809 | | | 505 | |
| | | | | | | |
| | KEY FISCAL AGGREGATES | | | | | | | | | | | | | | | | | | |
| | | | | | | |
| | Net Operating Balance | | 1,181 | | | 1,177 | | | 604 | | | 854 | | | 828 | | | 1,294 | |
| | | | | | | |
Less | | Net Acquisition of Non-financial Assets | | | | | | | | | | | | | | | | | | |
| | Purchases of non-financial assets | | 7,919 | | | 8,756 | | | 9,985 | | | 7,439 | | | 7,051 | | | 4,933 | |
| | Less Sales of non-financial assets | | 84 | | | 18 | | | 92 | | | 77 | | | 52 | | | 88 | |
| | Less Depreciation | | 1,726 | | | 1,699 | | | 1,897 | | | 2,140 | | | 2,347 | | | 2,566 | |
| | Plus Change in inventories | | 29 | | | 134 | | | 24 | | | 2 | | | 40 | | | (22 | ) |
| | Plus Other movements in non-financial assets | | (12 | ) | | (14 | ) | | 23 | | | 26 | | | 28 | | | 31 | |
| | Equals Total Net Acquisition of Non-financial Assets | | 6,126 | | | 7,158 | | | 8,045 | | | 5,250 | | | 4,719 | | | 2,289 | |
| | | | | | | |
Equals | | Net Lending / (Borrowing) | | (4,946 | ) | | (5,982 | ) | | (7,441 | ) | | (4,396 | ) | | (3,891 | ) | | (995 | ) |
Notes:
| 1. | Numbers may not add due to rounding. |
| 2. | Numbers have been restated where subsequent changes in classification have occurred. |
139
Table 9.3
Non-financial Public Sector Operating Statement1
| | | | | | | | | | | | | | | | | | | | |
| | | | | 2007-08
Budget2
$ million | | | 2007-08
Est.Actual
$ million | | | 2008-09
Budget
$ million | | | 2009-10
Projection
$ million | | | 2010-11
Projection
$ million | | | 2011-12
Projection
$ million | |
| | Revenue from Transactions | | | | | | | | | | | | | | | | | | |
| | Taxation revenue | | 9,126 | | | 9,377 | | | 9,921 | | | 10,631 | | | 11,433 | | | 12,258 | |
| | Grants revenue | | 15,277 | | | 15,967 | | | 15,755 | | | 16,116 | | | 16,327 | | | 16,775 | |
| | Sales of goods and services | | 9,320 | | | 10,061 | | | 11,494 | | | 12,612 | | | 13,640 | | | 14,806 | |
| | Interest income | | 2,267 | | | 1,015 | | | 2,295 | | | 2,346 | | | 2,435 | | | 2,520 | |
| | Dividend and income tax equivalent income | | 38 | | | 39 | | | 28 | | | 33 | | | 40 | | | 249 | |
| | Other revenue | | 2,121 | | | 2,221 | | | 4,398 | | | 3,547 | | | 3,417 | | | 3,262 | |
| | Total Revenue from Transactions | | 38,149 | | | 38,680 | | | 43,890 | | | 45,286 | | | 47,292 | | | 49,870 | |
| | | | | | | |
Less | | Expenses from Transactions | | | | | | | | | | | | | | | | | | |
| | Employee expenses | | 14,704 | | | 14,898 | | | 16,373 | | | 17,311 | | | 18,327 | | | 19,365 | |
| | Superannuation expenses | | | | | | | | | | | | | | | | | | |
| | Superannuation interest cost | | 969 | | | 996 | | | 1,219 | | | 1,280 | | | 1,337 | | | 1,389 | |
| | Other superannuation expenses | | 1,776 | | | 1,984 | | | 2,029 | | | 2,089 | | | 2,155 | | | 2,179 | |
| | Other operating expenses | | 8,419 | | | 9,136 | | | 9,658 | | | 9,761 | | | 10,114 | | | 10,339 | |
| | Depreciation and amortisation | | 3,741 | | | 3,957 | | | 4,561 | | | 4,861 | | | 5,113 | | | 5,448 | |
| | Other interest expenses | | 1,638 | | | 1,779 | | | 2,579 | | | 3,077 | | | 3,650 | | | 4,101 | |
| | Grants expenses | | 6,355 | | | 6,710 | | | 6,889 | | | 6,539 | | | 6,697 | | | 6,838 | |
| | Total Expenses from Transactions | | 37,573 | | | 39,460 | | | 43,307 | | | 44,918 | | | 47,392 | | | 49,661 | |
| | | | | | | |
Equals | | Net Operating Balance | | 547 | | | (781 | ) | | 583 | | | 367 | | | (101 | ) | | 209 | |
| | | | | | | |
Plus | | Other economic flows—included in operating result | | 1 | | | 620 | | | 625 | | | 69 | | | 50 | | | 41 | |
| | | | | | | |
Equals | | Operating Result | | 548 | | | (161 | ) | | 1,207 | | | 437 | | | (51 | ) | | 251 | |
| | | | | | | |
Plus | | Other economic flows—other movements in equity | | 4,785 | | | 5,276 | | | 4,261 | | | 3,709 | | | 3,834 | | | 3,502 | |
| | | | | | | |
Equals | | Comprehensive Result—Total Change In Net Worth | | 5,333 | | | 5,116 | | | 5,469 | | | 4,145 | | | 3,783 | | | 3,753 | |
| | | | | | | |
| | KEY FISCAL AGGREGATES | | | | | | | | | | | | | | | | | | |
| | | | | | | |
| | Net Operating Balance | | 547 | | | (781 | ) | | 583 | | | 367 | | | (101 | ) | | 209 | |
| | | | | | | |
Less | | Net Acquisition of Non-financial Assets | | | | | | | | | | | | | | | | | | |
| | Purchases of non-financial assets | | 13,383 | | | 13,979 | | | 16,637 | | | 14,132 | | | 13,641 | | | 10,757 | |
| | Less Sales of non-financial assets | | 415 | | | 452 | | | 432 | | | 360 | | | 386 | | | 344 | |
| | Less Depreciation | | 3,741 | | | 3,957 | | | 4,561 | | | 4,861 | | | 5,113 | | | 5,448 | |
| | Plus Change in inventories | | 91 | | | 179 | | | 121 | | | 11 | | | 71 | | | 32 | |
| | Plus Other movements in non-financial assets | | (146 | ) | | (9 | ) | | 224 | | | 76 | | | 78 | | | 81 | |
| | Equals Total Net Acquisition of Non-financial Assets | | 9,172 | | | 9,741 | | | 11,989 | | | 8,999 | | | 8,291 | | | 5,079 | |
| | | | | | | |
Equals | | Net Lending / (Borrowing) | | (8,624 | ) | | (10,522 | ) | | (11,406 | ) | | (8,631 | ) | | (8,391 | ) | | (4,870 | ) |
Notes:
| 1. | Numbers may not add due to rounding. |
| 2. | Numbers have been restated where subsequent changes in classification have occurred. |
140
Table 9.4
General Government Sector Balance Sheet1
| | | | | | | | | | | | | | | | | | |
| | | 2007-08
Budget2
$ million | | | 2007-08
Est.Actual
$ million | | | 2008-09
Budget
$ million | | | 2009-10
Projection
$ million | | | 2010-11
Projection
$ million | | | 2011-12
Projection
$ million | |
Assets | | | | | | | | | | | | | | | | | | |
Financial Assets | | | | | | | | | | | | | | | | | | |
Cash and deposits | | 2,069 | | | 2,752 | | | 2,204 | | | 1,871 | | | 1,616 | | | 1,347 | |
Advances paid | | 753 | | | 743 | | | 816 | | | 889 | | | 951 | | | 990 | |
Investments, loans and placements | | 29,046 | | | 27,069 | | | 28,218 | | | 29,712 | | | 31,205 | | | 32,697 | |
Receivables | | 2,256 | | | 2,817 | | | 2,864 | | | 3,153 | | | 3,345 | | | 3,616 | |
Equity | | | | | | | | | | | | | | | | | | |
Investments in other public sector entities | | 20,477 | | | 20,000 | | | 20,669 | | | 21,734 | | | 22,542 | | | 23,047 | |
Investments—other | | 259 | | | 39 | | | 39 | | | 39 | | | 39 | | | 40 | |
Total Financial Assets | | 54,859 | | | 53,420 | | | 54,811 | | | 57,398 | | | 59,699 | | | 61,737 | |
| | | | | | |
Non-financial Assets | | | | | | | | | | | | | | | | | | |
Land and other fixed assets | | 94,726 | | | 99,876 | | | 107,569 | | | 114,144 | | | 120,603 | | | 126,294 | |
Other non-financial assets | | 5,451 | | | 5,562 | | | 5,829 | | | 6,318 | | | 6,844 | | | 7,498 | |
Total Non-financial Assets | | 100,177 | | | 105,437 | | | 113,399 | | | 120,462 | | | 127,447 | | | 133,792 | |
| | | | | | |
Total Assets | | 155,036 | | | 158,857 | | | 168,209 | | | 177,860 | | | 187,146 | | | 195,529 | |
| | | | | | |
Liabilities | | | | | | | | | | | | | | | | | | |
Advances received | | 447 | | | 545 | | | 530 | | | 506 | | | 492 | | | 479 | |
Borrowing | | 6,711 | | | 5,648 | | | 8,781 | | | 13,295 | | | 17,719 | | | 21,329 | |
Superannuation liability | | 19,955 | | | 20,849 | | | 21,874 | | | 22,816 | | | 23,674 | | | 24,442 | |
Other employee benefits | | 3,407 | | | 3,499 | | | 3,665 | | | 3,686 | | | 3,820 | | | 3,950 | |
Payables | | 2,431 | | | 2,449 | | | 2,388 | | | 2,466 | | | 2,549 | | | 2,640 | |
Other liabilities | | 2,286 | | | 2,774 | | | 2,408 | | | 2,382 | | | 2,402 | | | 2,448 | |
Total Liabilities | | 35,237 | | | 35,762 | | | 39,646 | | | 45,152 | | | 50,656 | | | 55,287 | |
| | | | | | |
Net Worth | | 119,799 | | | 123,095 | | | 128,563 | | | 132,708 | | | 136,490 | | | 140,243 | |
| | | | | | |
Net Financial Worth | | 19,622 | | | 17,657 | | | 15,164 | | | 12,246 | | | 9,043 | | | 6,451 | |
Net Financial Liabilities | | 855 | | | 2,343 | | | 5,504 | | | 9,488 | | | 13,499 | | | 16,596 | |
Net Debt | | (24,709 | ) | | (24,371 | ) | | (21,928 | ) | | (18,670 | ) | | (15,560 | ) | | (13,227 | ) |
Notes:
| 1. | Numbers may not add due to rounding. |
| 2. | Numbers have been restated where subsequent changes in classification have occurred. |
141
Table 9.5
Public Non-financial Corporations Sector Balance Sheet1
| | | | | | | | | | | | | | | | | | |
| | | 2007-08
Budget2
$ million | | | 2007-08
Est.Actual
$ million | | | 2008-09
Budget
$ million | | | 2009-10
Projection
$ million | | | 2010-11
Projection
$ million | | | 2011-12
Projection
$ million | |
Assets | | | | | | | | | | | | | | | | | | |
Financial Assets | | | | | | | | | | | | | | | | | | |
Cash and deposits | | 1,497 | | | 1,857 | | | 1,461 | | | 1,675 | | | 1,901 | | | 2,179 | |
Advances paid | | 294 | | | 291 | | | 253 | | | 226 | | | 203 | | | 180 | |
Investments, loans and placements | | 1,152 | | | 383 | | | 321 | | | 309 | | | 307 | | | 310 | |
Receivables | | 931 | | | 1,319 | | | 1,547 | | | 1,616 | | | 1,709 | | | 1,753 | |
Equity | | | | | | | | | | | | | | | | | | |
Investments—other | | 199 | | | 278 | | | 80 | | | 97 | | | 115 | | | 134 | |
Total Financial Assets | | 4,074 | | | 4,128 | | | 3,662 | | | 3,923 | | | 4,235 | | | 4,556 | |
| | | | | | |
Non-financial Assets | | | | | | | | | | | | | | | | | | |
Land and other fixed assets | | 46,624 | | | 46,534 | | | 55,707 | | | 61,501 | | | 66,854 | | | 69,501 | |
Other non-financial assets | | 595 | | | 1,538 | | | 2,087 | | | 2,140 | | | 2,127 | | | 2,135 | |
Total Non-financial Assets | | 47,219 | | | 48,073 | | | 57,794 | | | 63,642 | | | 68,982 | | | 71,636 | |
| | | | | | |
Total Assets | | 51,292 | | | 52,201 | | | 61,456 | | | 67,565 | | | 73,217 | | | 76,192 | |
| | | | | | |
Liabilities | | | | | | | | | | | | | | | | | | |
Deposits held | | 64 | | | 57 | | | 58 | | | 58 | | | 59 | | | 60 | |
Borrowing | | 24,163 | | | 24,755 | | | 32,823 | | | 37,335 | | | 41,471 | | | 43,065 | |
Superannuation liability | | (161 | ) | | (279 | ) | | (278 | ) | | (278 | ) | | (278 | ) | | (278 | ) |
Other employee benefits | | 645 | | | 716 | | | 729 | | | 741 | | | 755 | | | 771 | |
Payables | | 1,501 | | | 2,058 | | | 2,234 | | | 2,335 | | | 2,512 | | | 2,702 | |
Other liabilities | | 6,329 | | | 6,755 | | | 7,082 | | | 7,501 | | | 8,017 | | | 8,688 | |
Total Liabilities | | 32,543 | | | 34,062 | | | 42,649 | | | 47,693 | | | 52,536 | | | 55,007 | |
| | | | | | |
Net Worth | | 18,749 | | | 18,138 | | | 18,807 | | | 19,872 | | | 20,681 | | | 21,185 | |
| | | | | | |
Net Financial Worth | | (28,470 | ) | | (29,934 | ) | | (38,987 | ) | | (43,770 | ) | | (48,301 | ) | | (50,450 | ) |
Net Debt | | 21,285 | | | 22,282 | | | 30,847 | | | 35,183 | | | 39,119 | | | 40,455 | |
Notes:
| 1. | Numbers may not add due to rounding. |
| 2. | Numbers have been restated where subsequent changes in classification have occurred. |
142
Table 9.6
Non-financial Public Sector Balance Sheet1
| | | | | | | | | | | | | | | | | | |
| | | 2007-08
Budget2
$ million | | | 2007-08
Est.Actual
$ million | | | 2008-09
Budget
$ million | | | 2009-10
Projection
$ million | | | 2010-11
Projection
$ million | | | 2011-12
Projection
$ million | |
Assets | | | | | | | | | | | | | | | | | | |
Financial Assets | | | | | | | | | | | | | | | | | | |
Cash and deposits | | 3,566 | | | 4,609 | | | 3,665 | | | 3,545 | | | 3,516 | | | 3,526 | |
Advances paid | | 990 | | | 1,016 | | | 1,051 | | | 1,098 | | | 1,137 | | | 1,153 | |
Investments, loans and placements | | 30,198 | | | 27,451 | | | 28,539 | | | 30,022 | | | 31,512 | | | 33,007 | |
Receivables | | 2,426 | | | 3,010 | | | 3,260 | | | 3,372 | | | 3,517 | | | 3,610 | |
Equity | | | | | | | | | | | | | | | | | | |
Investments in other public sector entities | | 1,763 | | | 1,896 | | | 1,896 | | | 1,896 | | | 1,896 | | | 1,896 | |
Investments—other | | 458 | | | 318 | | | 119 | | | 136 | | | 155 | | | 174 | |
Total Financial Assets | | 39,401 | | | 38,301 | | | 38,532 | | | 40,069 | | | 41,733 | | | 43,367 | |
| | | | | | |
Non-financial Assets | | | | | | | | | | | | | | | | | | |
Land and other fixed assets | | 141,316 | | | 146,375 | | | 163,242 | | | 175,611 | | | 187,423 | | | 195,761 | |
Other non-financial assets | | 386 | | | 522 | | | 1,275 | | | 1,404 | | | 1,391 | | | 1,378 | |
Total Non-financial Assets | | 141,702 | | | 146,897 | | | 164,517 | | | 177,015 | | | 188,814 | | | 197,139 | |
| | | | | | |
Total Assets | | 181,103 | | | 185,198 | | | 203,049 | | | 217,084 | | | 230,547 | | | 240,506 | |
| | | | | | |
Liabilities | | | | | | | | | | | | | | | | | | |
Deposits held | | 66 | | | 58 | | | 58 | | | 59 | | | 59 | | | 60 | |
Advances received | | 448 | | | 545 | | | 530 | | | 506 | | | 492 | | | 479 | |
Borrowing | | 30,817 | | | 30,385 | | | 41,587 | | | 50,613 | | | 59,172 | | | 64,376 | |
Superannuation liability | | 19,793 | | | 20,570 | | | 21,595 | | | 22,537 | | | 23,396 | | | 24,163 | |
Other employee benefits | | 4,053 | | | 4,214 | | | 4,394 | | | 4,426 | | | 4,574 | | | 4,720 | |
Payables | | 3,201 | | | 3,395 | | | 3,486 | | | 3,419 | | | 3,538 | | | 3,598 | |
Other liabilities | | 2,926 | | | 2,936 | | | 2,836 | | | 2,816 | | | 2,824 | | | 2,866 | |
Total Liabilities | | 61,303 | | | 62,103 | | | 74,486 | | | 84,376 | | | 94,056 | | | 100,262 | |
| | | | | | |
Net Worth | | 119,799 | | | 123,095 | | | 128,563 | | | 132,708 | | | 136,490 | | | 140,243 | |
Net Financial Worth | | (21,902 | ) | | (23,802 | ) | | (35,954 | ) | | (44,307 | ) | | (52,323 | ) | | (56,895 | ) |
Net Financial Liabilities | | 23,665 | | | 25,698 | | | 37,850 | | | 46,203 | | | 54,219 | | | 58,792 | |
Net Debt | | (3,555 | ) | | (2,089 | ) | | 8,919 | | | 16,513 | | | 23,559 | | | 27,228 | |
Notes:
| 1. | Numbers may not add due to rounding. |
| 2. | Numbers have been restated where subsequent changes in classification have occurred. |
143
Table 9.7
General Government Sector Cash Flow Statement1
| | | | | | | | | | | | | | | | | | |
| | | 2007-08
Budget2
$ million | | | 2007-08
Est.Actual
$ million | | | 2008-09
Budget
$ million | | | 2009-10
Projection
$ million | | | 2010-11
Projection
$ million | | | 2011-12
Projection
$ million | |
Cash Receipts from Operating Activities | | | | | | | | | | | | | | | | | | |
Taxes received | | 9,271 | | | 9,551 | | | 10,105 | | | 10,842 | | | 11,752 | | | 12,611 | |
Grants and subsidies received | | 15,029 | | | 15,396 | | | 15,526 | | | 16,017 | | | 16,228 | | | 16,669 | |
Sales of goods and services | | 3,347 | | | 3,667 | | | 3,749 | | | 3,628 | | | 3,713 | | | 3,779 | |
Interest receipts | | 2,190 | | | 832 | | | 2,197 | | | 2,249 | | | 2,315 | | | 2,399 | |
Dividends and income tax equivalents | | 1,858 | | | 931 | | | 1,012 | | | 1,038 | | | 1,303 | | | 1,665 | |
Other receipts | | 2,362 | | | 2,455 | | | 4,707 | | | 3,851 | | | 3,743 | | | 3,551 | |
Total Operating Receipts | | 34,057 | | | 32,833 | | | 37,297 | | | 37,625 | | | 39,055 | | | 40,674 | |
| | | | | | |
Cash Payments for Operating Activities | | | | | | | | | | | | | | | | | | |
Payments for employees | | (13,928 | ) | | (15,092 | ) | | (15,674 | ) | | (16,857 | ) | | (17,770 | ) | | (18,795 | ) |
Payments for goods and services | | (6,524 | ) | | (6,714 | ) | | (7,246 | ) | | (7,268 | ) | | (7,445 | ) | | (7,670 | ) |
Grants and subsidies | | (8,278 | ) | | (8,704 | ) | | (8,757 | ) | | (8,382 | ) | | (8,639 | ) | | (8,831 | ) |
Interest paid | | (391 | ) | | (383 | ) | | (540 | ) | | (786 | ) | | (1,036 | ) | | (1,292 | ) |
Other payments | | (696 | ) | | (697 | ) | | (739 | ) | | (577 | ) | | (578 | ) | | (578 | ) |
Total Operating Payments | | (29,817 | ) | | (31,591 | ) | | (32,955 | ) | | (33,869 | ) | | (35,468 | ) | | (37,165 | ) |
| | | | | | |
Net Cash Inflows from Operating Activities | | 4,240 | | | 1,242 | | | 4,341 | | | 3,756 | | | 3,586 | | | 3,509 | |
| | | | | | |
Cash Flows from Investments in
Non-Financial Assets | | | | | | | | | | | | | | | | | | |
Purchases of non-financial assets | | (5,463 | ) | | (5,223 | ) | | (6,651 | ) | | (6,693 | ) | | (6,590 | ) | | (5,824 | ) |
Sales of non-financial assets | | 331 | | | 434 | | | 340 | | | 283 | | | 334 | | | 256 | |
Net Cash Flows from Investments in Non-financial Assets | | (5,132 | ) | | (4,789 | ) | | (6,311 | ) | | (6,410 | ) | | (6,256 | ) | | (5,568 | ) |
| | | | | | |
Net Cash Flows from Investments in Financial Assets for Policy Purposes | | (885 | ) | | 1,020 | | | (389 | ) | | (692 | ) | | (549 | ) | | (393 | ) |
| | | | | | |
Net Cash Flows from Investments in Financial Assets for Liquidity Purposes | | (1,583 | ) | | 716 | | | (1,086 | ) | | (1,409 | ) | | (1,402 | ) | | (1,392 | ) |
| | | | | | |
Receipts from Financing Activities | | | | | | | | | | | | | | | | | | |
Advances received (net) | | (14 | ) | | (1 | ) | | (18 | ) | | (27 | ) | | (17 | ) | | (17 | ) |
Borrowing (net) | | 3,569 | | | 3,531 | | | 2,915 | | | 4,448 | | | 4,383 | | | 3,593 | |
Other financing (net) | | — | | | (8 | ) | | — | | | — | | | — | | | — | |
| | | | | | |
Net Cash Flows from Financing Activities | | 3,555 | | | 3,522 | | | 2,897 | | | 4,421 | | | 4,366 | | | 3,576 | |
| | | | | | |
Net Increase/(Decrease) in Cash held | | 195 | | | 1,711 | | | (548 | ) | | (334 | ) | | (255 | ) | | (269 | ) |
Net cash from operating activities | | 4,240 | | | 1,242 | | | 4,341 | | | 3,756 | | | 3,586 | | | 3,509 | |
Net cash flows from investments in non-financial assets | | (5,132 | ) | | (4,789 | ) | | (6,311 | ) | | (6,410 | ) | | (6,256 | ) | | (5,568 | ) |
Cash Surplus/(Deficit) | | (892 | ) | | (3,547 | ) | | (1,970 | ) | | (2,654 | ) | | (2,669 | ) | | (2,059 | ) |
| | | | | | |
Derivation of ABS GFS Cash Surplus/Deficit | | | | | | | | | | | | | | | | | | |
Cash surplus/(deficit) | | (892 | ) | | (3,547 | ) | | (1,970 | ) | | (2,654 | ) | | (2,669 | ) | | (2,059 | ) |
Acquisitions under finance leases and similar arrangements | | — | | | (80 | ) | | (152 | ) | | — | | | — | | | — | |
ABS GFS Cash Surplus/(Deficit) Including Finance Leases and Similar Arrangements | | (892 | ) | | (3,627 | ) | | (2,122 | ) | | (2,654 | ) | | (2,669 | ) | | (2,059 | ) |
Notes:
| 1. | Numbers may not add due to rounding. |
| 2. | Numbers have been restated where subsequent changes in classification have occurred. |
144
Table 9.8
Public Non-financial Corporations Sector Cash Flow Statement1
| | | | | | | | | | | | | | | | | | |
| | | 2007-08
Budget2
$ million | | | 2007-08
Est.Actual
$ million | | | 2008-09
Budget
$ million | | | 2009-10
Projection
$ million | | | 2010-11
Projection
$ million | | | 2011-12
Projection
$ million | |
Cash Receipts from Operating Activities | | | | | | | | | | | | | | | | | | |
Grants and subsidies received | | 2,242 | | | 2,064 | | | 1,904 | | | 1,928 | | | 2,024 | | | 2,084 | |
Sales of goods and services | | 7,395 | | | 7,833 | | | 8,647 | | | 10,028 | | | 11,073 | | | 12,105 | |
Interest receipts | | 75 | | | 171 | | | 93 | | | 90 | | | 96 | | | 96 | |
Dividends and income tax equivalents | | 5 | | | 12 | | | — | | | — | | | — | | | — | |
Other receipts | | 1,009 | | | 825 | | | 702 | | | 784 | | | 780 | | | 865 | |
Total Operating Receipts | | 10,726 | | | 10,906 | | | 11,346 | | | 12,830 | | | 13,974 | | | 15,150 | |
| | | | | | |
Cash Payments for Operating Activities | | | | | | | | | | | | | | | | | | |
Payments for employees | | (2,189 | ) | | (2,256 | ) | | (2,625 | ) | | (2,775 | ) | | (2,920 | ) | | (3,105 | ) |
Payments for goods and services | | (3,044 | ) | | (3,791 | ) | | (3,944 | ) | | (3,650 | ) | | (3,753 | ) | | (3,689 | ) |
Grants and subsidies | | (32 | ) | | (12 | ) | | .. | | | .. | | | .. | | | .. | |
Interest paid | | (1,155 | ) | | (1,226 | ) | | (1,759 | ) | | (2,226 | ) | | (2,624 | ) | | (2,927 | ) |
Other payments | | (1,846 | ) | | (896 | ) | | (731 | ) | | (950 | ) | | (1,042 | ) | | (1,092 | ) |
Total Operating Payments | | (8,267 | ) | | (8,181 | ) | | (9,059 | ) | | (9,601 | ) | | (10,340 | ) | | (10,812 | ) |
| | | | | | |
Net Cash Inflows from Operating Activities | | 2,459 | | | 2,724 | | | 2,286 | | | 3,228 | | | 3,634 | | | 4,337 | |
| | | | | | |
Cash Flows from Investments in
Non-Financial Assets | | | | | | | | | | | | | | | | | | |
Purchases of non-financial assets | | (7,919 | ) | | (8,756 | ) | | (9,985 | ) | | (7,439 | ) | | (7,051 | ) | | (4,933 | ) |
Sales of non-financial assets | | 84 | | | 18 | | | 92 | | | 77 | | | 52 | | | 88 | |
Net Cash Flows from Investments in Non-financial Assets | | (7,836 | ) | | (8,738 | ) | | (9,894 | ) | | (7,362 | ) | | (6,999 | ) | | (4,846 | ) |
| | | | | | |
Net Cash Flows from Investments in Financial Assets for Policy Purposes | | — | | | 536 | | | (324 | ) | | — | | | — | | | — | |
| | | | | | |
Net Cash Flows from Investments in Financial Assets for Liquidity Purposes | | (11 | ) | | 10 | | | — | | | — | | | — | | | — | |
| | | | | | |
Receipts from Financing Activities | | | | | | | | | | | | | | | | | | |
Borrowing (net) | | 4,433 | | | 5,797 | | | 8,007 | | | 4,488 | | | 4,070 | | | 1,540 | |
Dividends paid | | (841 | ) | | (713 | ) | | (861 | ) | | (831 | ) | | (1,026 | ) | | (1,144 | ) |
Deposits received (net) | | (3 | ) | | 23 | | | 1 | | | 1 | | | 1 | | | 1 | |
Other financing (net) | | 860 | | | (1,262 | ) | | 388 | | | 690 | | | 547 | | | 391 | |
Net Cash Flows from Financing Activities | | 4,449 | | | 3,843 | | | 7,535 | | | 4,348 | | | 3,591 | | | 787 | |
| | | | | | |
Net Increase/(Decrease) in Cash held | | (938 | ) | | (1,624 | ) | | (396 | ) | | 214 | | | 226 | | | 278 | |
| | | | | | |
Net cash from operating activities | | 2,459 | | | 2,724 | | | 2,286 | | | 3,228 | | | 3,634 | | | 4,337 | |
Net cash flows from investments in non-financial assets | | (7,836 | ) | | (8,738 | ) | | (9,894 | ) | | (7,362 | ) | | (6,999 | ) | | (4,846 | ) |
Dividends paid | | (841 | ) | | (713 | ) | | (861 | ) | | (831 | ) | | (1,026 | ) | | (1,144 | ) |
Cash Surplus/(Deficit) | | (6,218 | ) | | (6,727 | ) | | (8,468 | ) | | (4,965 | ) | | (4,391 | ) | | (1,653 | ) |
| | | | | | |
Derivation of ABS GFS Cash Surplus/Deficit | | | | | | | | | | | | | | | | | | |
Cash surplus/(deficit) | | (6,218 | ) | | (6,727 | ) | | (8,468 | ) | | (4,965 | ) | | (4,391 | ) | | (1,653 | ) |
Acquisitions under finance leases and similar arrangements | | — | | | — | | | — | | | — | | | — | | | — | |
ABS GFS Cash Surplus/(Deficit) Including Finance Leases and Similar Arrangements | | (6,218 | ) | | (6,727 | ) | | (8,468 | ) | | (4,965 | ) | | (4,391 | ) | | (1,653 | ) |
Notes:
| 1. | Numbers may not add due to rounding. |
| 2. | Numbers have been restated where subsequent changes in classification have occurred. |
145
Table 9.9
Non-financial Public Sector Cash Flow Statement1
| | | | | | | | | | | | | | | | | | |
| | | 2007-08
Budget2
$ million | | | 2007-08
Est.Actual
$ million | | | 2008-09
Budget
$ million | | | 2009-10
Projection
$ million | | | 2010-11
Projection
$ million | | | 2011-12
Projection
$ million | |
Cash Receipts from Operating Activities | | | | | | | | | | | | | | | | | | |
Taxes received | | 9,125 | | | 9,376 | | | 9,920 | | | 10,630 | | | 11,432 | | | 12,257 | |
Grants and subsidies received | | 15,165 | | | 15,467 | | | 15,592 | | | 16,084 | | | 16,293 | | | 16,742 | |
Sales of goods and services | | 10,568 | | | 11,292 | | | 12,197 | | | 13,453 | | | 14,581 | | | 15,675 | |
Interest receipts | | 2,265 | | | 1,003 | | | 2,290 | | | 2,339 | | | 2,411 | | | 2,494 | |
Dividends and income tax equivalents | | 32 | | | 50 | | | 20 | | | 28 | | | 33 | | | 240 | |
Other receipts | | 3,373 | | | 3,273 | | | 5,402 | | | 4,628 | | | 4,516 | | | 4,409 | |
Total Operating Receipts | | 40,528 | | | 40,461 | | | 45,421 | | | 47,161 | | | 49,266 | | | 51,816 | |
| | | | | | |
Cash Payments for Operating Activities | | | | | | | | | | | | | | | | | | |
Payments for employees | | (16,049 | ) | | (17,253 | ) | | (18,207 | ) | | (19,527 | ) | | (20,578 | ) | | (21,783 | ) |
Payments for goods and services | | (9,416 | ) | | (10,310 | ) | | (11,003 | ) | | (10,725 | ) | | (11,004 | ) | | (11,159 | ) |
Grants and subsidies | | (6,204 | ) | | (6,731 | ) | | (6,930 | ) | | (6,533 | ) | | (6,692 | ) | | (6,833 | ) |
Interest paid | | (1,465 | ) | | (1,528 | ) | | (2,203 | ) | | (2,904 | ) | | (3,451 | ) | | (3,982 | ) |
Other payments | | (1,535 | ) | | (1,387 | ) | | (1,311 | ) | | (1,321 | ) | | (1,347 | ) | | (1,357 | ) |
Total Operating Payments | | (34,669 | ) | | (37,209 | ) | | (39,654 | ) | | (41,009 | ) | | (43,073 | ) | | (45,115 | ) |
| | | | | | |
Net Cash Inflows from Operating Activities | | 5,859 | | | 3,252 | | | 5,767 | | | 6,152 | | | 6,193 | | | 6,701 | |
| | | | | | |
Cash Flows from Investments in Non-Financial Assets | | | | | | | | | | | | | | | | | | |
Purchases of non-financial assets | | (13,383 | ) | | (13,979 | ) | | (16,637 | ) | | (14,132 | ) | | (13,641 | ) | | (10,757 | ) |
Sales of non-financial assets | | 415 | | | 452 | | | 432 | | | 360 | | | 386 | | | 344 | |
Net Cash Flows from Investments in Non-financial Assets | | (12,968 | ) | | (13,527 | ) | | (16,205 | ) | | (13,773 | ) | | (13,255 | ) | | (10,414 | ) |
| | | | | | |
Net Cash Flows from Investments in Financial Assets for Policy Purposes | | (25 | ) | | 287 | | | (324 | ) | | (2 | ) | | (2 | ) | | (2 | ) |
| | | | | | |
Net Cash Flows from Investments in Financial Assets for Liquidity Purposes | | (1,594 | ) | | 726 | | | (1,085 | ) | | (1,409 | ) | | (1,403 | ) | | (1,392 | ) |
| | | | | | |
Receipts from Financing Activities | | | | | | | | | | | | | | | | | | |
Advances received (net) | | (14 | ) | | (1 | ) | | (18 | ) | | (27 | ) | | (17 | ) | | (17 | ) |
Borrowing (net) | | 8,002 | | | 9,328 | | | 10,922 | | | 8,936 | | | 8,452 | | | 5,133 | |
Deposits received (net) | | (3 | ) | | 17 | | | 1 | | | 1 | | | 1 | | | 1 | |
Other financing (net) | | — | | | 6 | | | (1 | ) | | — | | | — | | | — | |
Net Cash Flows from Financing Activities | | 7,986 | | | 9,349 | | | 10,904 | | | 8,910 | | | 8,436 | | | 5,116 | |
| | | | | | |
Net Increase/(Decrease) in Cash held | | (742 | ) | | 86 | | | (943 | ) | | (122 | ) | | (30 | ) | | 9 | |
| | | | | | |
Net cash from operating activities | | 5,859 | | | 3,252 | | | 5,767 | | | 6,152 | | | 6,193 | | | 6,701 | |
Net cash flows from investments in non-financial assets | | (12,968 | ) | | (13,527 | ) | | (16,205 | ) | | (13,773 | ) | | (13,255 | ) | | (10,414 | ) |
Cash Surplus/(Deficit) | | (7,109 | ) | | (10,275 | ) | | (10,438 | ) | | (7,620 | ) | | (7,061 | ) | | (3,713 | ) |
| | | | | | |
Derivation of ABS GFS Cash Surplus/Deficit | | | | | | | | | | | | | | | | | | |
Cash surplus/(deficit) | | (7,109 | ) | | (10,275 | ) | | (10,438 | ) | | (7,620 | ) | | (7,061 | ) | | (3,713 | ) |
Acquisitions under finance leases and similar arrangements | | — | | | (80 | ) | | (152 | ) | | — | | | — | | | — | |
ABS GFS Cash Surplus/(Deficit) Including Finance Leases and Similar Arrangements | | (7,109 | ) | | (10,355 | ) | | (10,590 | ) | | (7,620 | ) | | (7,061 | ) | | (3,713 | ) |
Notes:
| 1. | Numbers may not add due to rounding. |
| 2. | Numbers have been restated where subsequent changes in classification have occurred. |
146
RECONCILIATION OF NET OPERATING BALANCE TO ACCOUNTING OPERATING RESULT
The primary difference between the net operating balance and the accounting operating result calculated under Australian Accounting Standards (AAS) is that valuation adjustments are excluded from the net operating balance.
Data presented in Table 9.10 provides a reconciliation of the General Government sector net operating balance to the accounting operating result.
Table 9.10
Reconciliation of UPF net operating balance to accounting surplus1
| | | | | | | | | |
| | | 2007-08
Budget
$ million | | | 2007-08
Est.Act.
$ million | | | 2008-09
Budget
$ million | |
Net operating balance General Government sector (Table 9.1) | | 268 | | | (995 | ) | | 809 | |
| | | |
Remeasurement/valuation adjustments | | | | | | | | | |
Bad debts and amortisation | | (40 | ) | | (57 | ) | | (57 | ) |
Deferred tax equivalents | | 210 | | | 191 | | | 329 | |
Dividends received on privatisation sales | | — | | | 1,229 | | | 384 | |
Market value adjustments investments/loans | | 30 | | | 66 | | | 16 | |
Revaluation of provisions | | (18 | ) | | 62 | | | 14 | |
Decommissioned infrastructure assets and land under roads | | (143 | ) | | (143 | ) | | (143 | ) |
Gain/(loss) on assets sold/written off | | 11 | | | 26 | | | 36 | |
| | | |
AAS net surplus General Government sector | | 318 | | | 380 | | | 1,388 | |
Note:
| 1. | Numbers may not add due to rounding. |
147
GENERAL GOVERNMENT TIME SERIES
Data presented in Table 9.11 provides a time series from 2000-2001 for the General Government sector on the key fiscal aggregates used by the Government to measure financial performance. These aggregates have been backcast (as far as is possible) to comply with AASB 1049 Whole of Government and General Government Sector Financial Reporting.
Table 9.11
General Government Sector1
| | | | | | | | | | | | | | | | | | | | | |
| | | 2000-01
Actual
$ million | | | 2001-02
Actual
$ million | | | 2002-03
Actual
$ million | | | 2003-04
Actual
$ million | | | 2004-05
Actual
$ million | | | 2005-06
Actual
$ million | | | 2006-07
Actual
$ million | |
Revenue from Transactions | | | | | | | | | | | | | | | | | | | | | |
Taxation revenue | | 4,255 | | | 4,815 | | | 5,598 | | | 6,676 | | | 6,952 | | | 7,396 | | | 8,484 | |
Grant revenue | | 9,233 | | | 10,052 | | | 10,666 | | | 11,528 | | | 12,755 | | | 13,590 | | | 14,373 | |
Sales of goods and services | | 1,747 | | | 1,837 | | | 1,964 | | | 2,105 | | | 2,381 | | | 2,586 | | | 2,889 | |
Interest income | | 818 | | | (464 | ) | | (128 | ) | | 2,723 | | | 2,972 | | | 3,414 | | | 3,348 | |
Dividend and income tax equivalent income | | 1,116 | | | 1,287 | | | 1,036 | | | 1,148 | | | 1,028 | | | 1,057 | | | 863 | |
Other revenue | | 1,109 | | | 1,316 | | | 1,118 | | | 1,035 | | | 1,473 | | | 2,039 | | | 2,024 | |
Total Revenue | | 18,278 | | | 18,842 | | | 20,253 | | | 25,214 | | | 27,562 | | | 30,084 | | | 31,982 | |
| | | | | | | |
Expenses from Transactions | | | | | | | | | | | | | | | | | | | | | |
Employee expenses | | 7,452 | | | 7,969 | | | 8,431 | | | 8,972 | | | 9,595 | | | 10,615 | | | 11,731 | |
Superannuation expenses | | | | | | | | | | | | | | | | | | | | | |
Superannuation interest costs | | 467 | | | 626 | | | 630 | | | 1,040 | | | 1,009 | | | 826 | | | 1,154 | |
Other superannuation expenses | | 771 | | | 851 | | | 892 | | | 1,061 | | | 1,182 | | | 1,367 | | | 1,513 | |
Other operating expenses | | 3,309 | | | 3,398 | | | 3,794 | | | 3,948 | | | 4,392 | | | 5,227 | | | 6,109 | |
Depreciation and amortisation | | 1,395 | | | 1,511 | | | 1,460 | | | 1,460 | | | 1,585 | | | 1,679 | | | 1,880 | |
Other interest expenses | | 337 | | | 245 | | | 222 | | | 213 | | | 209 | | | 174 | | | 180 | |
Grant expenses | | 5,404 | | | 5,100 | | | 4,813 | | | 5,180 | | | 5,647 | | | 6,482 | | | 7,558 | |
Total Expenses | | 19,135 | | | 19,701 | | | 20,241 | | | 21,874 | | | 23,619 | | | 26,370 | | | 30,128 | |
| | | | | | | |
Net Operating Balance | | (857 | ) | | (858 | ) | | 12 | | | 3,340 | | | 3,942 | | | 3,714 | | | 1,855 | |
| | | | | | | |
OTHER KEY AGGREGATES | | | | | | | | | | | | | | | | | | | | | |
Purchases of non-financial assets | | 2,520 | | | 2,416 | | | 2,232 | | | 2,415 | | | 2,843 | | | 3,186 | | | 4,418 | |
Net acquisition of non-financial assets | | 813 | | | 708 | | | 155 | | | 503 | | | 1,053 | | | 1,236 | | | 2,067 | |
Net lending / (borrowing) | | (1,671 | ) | | (1,602 | ) | | (140 | ) | | 2,838 | | | 2,873 | | | 2,478 | | | (211 | ) |
Net Worth | | 57,623 | | | 58,093 | | | 64,894 | | | 77,723 | | | 96,433 | | | 105,035 | | | 117,831 | |
Net Debt | | (10,631 | ) | | (11,572 | ) | | (11,802 | ) | | (14,811 | ) | | (19,406 | ) | | (23,202 | ) | | (26,686 | ) |
Cash Surplus/Deficit | | 534 | | | 188 | | | 645 | | | 3,490 | | | 4,640 | | | 4,648 | | | 2,350 | |
Note:
| 1. | Numbers may not add due to rounding. |
Source: Budget Papers and Outcomes Reports for Queensland 2000-01 to 2006-07. (Numbers have been recast for recent changes to UPF presentation.)
148
OTHER GENERAL GOVERNMENT UPF DATA
Data in the following tables is presented in accordance with the Uniform Presentation Framework.
Grants
Data presented in Tables 9.12(a) and 9.12(b) provides details of General Government current and capital grant revenue and expenses.
Table 9.12(a)
General Government Sector Grant Revenue1
| | | | |
| | | 2007-08
Est. Act.
$ million | | 2008-09
Budget
$ million |
Current grant revenue | | | | |
Current grants from the Commonwealth | | | | |
General purpose grants | | 10,977 | | 11,239 |
Specific purpose grants | | 1,377 | | 1,196 |
Specific purpose grants for on-passing | | 1,628 | | 1,683 |
Total current grants from the Commonwealth | | 13,983 | | 14,119 |
Other contributions and grants | | 491 | | 512 |
Total current grant revenue | | 14,474 | | 14,631 |
Capital grant revenue | | | | |
Capital grants from the Commonwealth | | | | |
General purpose grants | | 20 | | 18 |
Specific purpose grants | | 968 | | 1,012 |
Specific purpose grants for on-passing | | 25 | | 25 |
Total capital grants from the Commonwealth | | 1,012 | | 1,054 |
Other contributions and grants | | 6 | | 3 |
Total capital grant revenue | | 1,018 | | 1,056 |
Total grant revenue | | 15,492 | | 15,687 |
Note:
| 1. | Numbers may not add due to rounding. |
149
Table 9.12(b)
General Government Sector Grant Expense1
| | | | |
| | | 2007-08
Est. Act.
$ million | | 2008-09
Budget
$ million |
Current grant expense | | | | |
Private and Not-for-profit sector | | 3,446 | | 3,823 |
Private and Not-for-profit sector on-passing | | 1,281 | | 1,319 |
Local Government | | 149 | | 143 |
Local Government on-passing | | 347 | | 364 |
Grants to other sectors of Government | | 1,964 | | 1,799 |
Other | | 226 | | 165 |
Total current grant expense | | 7,413 | | 7,613 |
| | |
Capital grant expense | | | | |
Private and Not-for-profit sector | | 261 | | 290 |
Private and Not-for-profit sector on-passing | | 25 | | 25 |
Local Government | | 555 | | 526 |
Grants to other sectors of Government | | 20 | | 28 |
Other | | 367 | | 231 |
Total capital grant expense | | 1,228 | | 1,100 |
Total grant expense | | 8,641 | | 8,713 |
Note:
| 1. | Numbers may not add due to rounding. |
Dividend and Income Tax Equivalent Income
Table 9.13 provides details of the source of Dividend and Income Tax Equivalent income in the General Government sector.
Table 9.13
General Government Sector Dividend and Income Tax Equivalent Income1
| | | | |
| | | 2007-08
Est. Act.
$ million | | 2008-09
Budget
$ million |
Dividend and Income Tax Equivalent income from PNFC sector | | 1,190 | | 1,023 |
Dividend and Income Tax Equivalent income from PFC sector | | 23 | | 24 |
Other Dividend income | | 4 | | 4 |
Total Dividend and Income Tax Equivalent income | | 1,217 | | 1,051 |
Note:
| 1. | Numbers may not add due to rounding. |
150
Expenses by function
Data presented in Table 9.14 provides details of General Government sector expenses by function.
Table 9.14
General Government Sector Expenses by Function1
| | | | | | | | | | | | |
| | | 2007-08
Budget
$ million | | 2007-08
Est. Act.
$ million | | 2008-09
Budget
$ million | | 2009-10
Projection
$ million | | 2010-11
Projection
$ million | | 2011-12
Projection
$ million |
General public services | | 1,744 | | 2,001 | | 2,065 | | 2,003 | | 2,057 | | 2,223 |
Public order and safety | | 2,924 | | 3,055 | | 3,316 | | 3,527 | | 3,709 | | 3,958 |
Education | | 7,403 | | 7,607 | | 7,963 | | 8,365 | | 8,607 | | 8,829 |
Health | | 7,745 | | 7,893 | | 8,944 | | 9,387 | | 9,925 | | 10,260 |
Social security and welfare | | 1,917 | | 1,873 | | 2,104 | | 2,087 | | 2,231 | | 2,377 |
Housing and community amenities | | 1,511 | | 1,161 | | 1,233 | | 1,194 | | 1,176 | | 1,226 |
Recreation and culture | | 787 | | 793 | | 814 | | 812 | | 828 | | 846 |
Fuel and energy | | 1,048 | | 1,317 | | 1,068 | | 1,002 | | 1,029 | | 1,055 |
Agriculture, forestry, fishing and hunting | | 886 | | 1,003 | | 930 | | 822 | | 837 | | 889 |
Mining, manufacturing and construction | | 131 | | 140 | | 157 | | 162 | | 163 | | 175 |
Transport and communications | | 3,521 | | 3,772 | | 3,907 | | 4,063 | | 4,315 | | 4,532 |
Other economic affairs | | 753 | | 765 | | 864 | | 783 | | 737 | | 750 |
Other purposes | | 1,912 | | 1,892 | | 2,407 | | 2,492 | | 2,810 | | 3,000 |
Total Expenses | | 32,282 | | 33,271 | | 35,772 | | 36,700 | | 38,422 | | 40,120 |
Note:
| 1. | Numbers may not add due to rounding. |
Purchases of non-financial assets by function
Data presented in Table 9.15 provides details of General Government sector purchases of non-financial assets by function.
Table 9.15
General Government Sector Purchases of Non-financial Assets by Function1
| | | | | | |
| | | 2007-08
Budget
$ million | | 2007-08
Est. Act.
$ million | | 2008-09
Budget
$ million |
General public services | | 349 | | 413 | | 424 |
Public order and safety | | 725 | | 613 | | 970 |
Education | | 439 | | 443 | | 527 |
Health | | 556 | | 544 | | 902 |
Social security and welfare | | 170 | | 63 | | 152 |
Housing and community amenities | | 368 | | 333 | | 340 |
Recreation and culture | | 94 | | 112 | | 164 |
Agriculture, forestry, fishing and hunting | | 51 | | 59 | | 67 |
Mining, manufacturing and construction | | 7 | | 11 | | 20 |
Transport and communications | | 2,648 | | 2,604 | | 2,947 |
Other economic affairs | | 55 | | 30 | | 138 |
Total Purchases | | 5,463 | | 5,223 | | 6,651 |
Note:
| 1. | Numbers may not add due to rounding. |
151
Taxes
Data presented in Table 9.16 provides details of taxation revenue collected by the General Government sector.
Table 9.16
General Government Sector Taxes1
| | | | |
| | | 2007-08
Est.Actual
$ million | | 2008-09
Budget
$ million |
Taxes on employers’ payroll and labour force | | 2,482 | | 2,702 |
| | |
Taxes on property | | | | |
Land taxes | | 622 | | 797 |
Stamp duties on financial and capital transactions | | 3,306 | | 3,156 |
Other | | 353 | | 391 |
| | |
Taxes on the provision of goods and services | | | | |
Taxes on gambling | | 886 | | 950 |
Taxes on insurance | | 449 | | 468 |
| | |
Taxes on use of goods and performance of activities | | | | |
Motor vehicle taxes | | 1,325 | | 1,509 |
Other | | 128 | | 133 |
| | |
Total Taxation Revenue | | 9,552 | | 10,106 |
Note:
| 1. | Numbers may not add due to rounding. |
Loan Council Allocation
The Australian Loan Council requires all jurisdictions to prepare Loan Council Allocations (LCA) to provide an indication of each government’s probable call on financial markets over the forthcoming financial year.
Table 9.17 presents the State’s revised LCA Budget allocation and the Loan Council endorsed LCA for 2008-09.
Table 9.17
Loan Council Allocation1
| | | | | | | |
| | | | | 2008-09
Nomination
$ million | | 2008-09
Budget
$ million | |
| | General Government sector cash deficit/(surplus)2 | | 1,983 | | 1,970 | |
| | PNFC sector cash deficit/(surplus)2 | | 6,061 | | 8,468 | |
| | | |
| | Non Financial Public Sector cash deficit/(surplus)2 | | 8,043 | | 10,438 | |
| | Acquisitions under finance leases and similar arrangements3 | | — | | (152 | ) |
| | | |
Equals | | ABS GFS cash deficit/(surplus) | | 8,043 | | 10,590 | |
| | | |
Less | | Net cash flows from investments in financial assets for policy purposes | | — | | (324 | ) |
Plus | | Memorandum items4 | | 506 | | 506 | |
| | | |
| | Loan Council Allocation | | 8,549 | | 11,420 | |
152
Notes:
| 1. | Numbers may not add due to rounding. |
| 2. | Figures in brackets represent surpluses. |
| 3. | Finance leases are shown with a negative sign as they are deducted in compiling the ABS GFS cash deficit/surplus. |
| 4. | Memorandum items include operating leases and local government borrowings. |
The State’s Budget LCA allocation is a deficit of $11.42 billion. This compares to the LCA nomination of $8.549 billion.
A tolerance limit of two per cent of Non-financial Public sector receipts applies between the LCA nomination and the Budget allocation. For 2008-09, the LCA Budget allocation exceeds the LCA nomination by more than the two per cent tolerance limit.
The increased deficit is largely due to higher net borrowing requirements as a result of increased spending on capital infrastructure in the PNFC sector.
BACKGROUND AND INTERPRETATION OF UNIFORM PRESENTATION FRAMEWORK
As mentioned in the introduction to this chapter, the UPF has recently been reviewed following the release of the Australian Accounting Standards Board’s (AASB) new accounting standard, AASB 1049 Whole of Government and General Government Sector Financial Reporting.
The new standard aims to harmonise Government Finance Statistics (GFS) and Generally Accepted Accounting Principles (GAAP) with the objective of improving the clarity and transparency of government financial statements.
Accrual GFS framework
The GFS reporting framework, developed by the Australian Bureau of Statistics (ABS), is based on international statistical standards (the International Monetary Fund Manual on Government Finance Statistics and the United Nations System of National Accounts). This allows comprehensive assessments to be made of the economic impact of government.
The accrual GFS framework is based on an integrated recording of stocks and flows. Stocks refer to a unit’s holdings of assets, liabilities and net worth at a point in time, whilst flows represent the movement in the stock of assets and liabilities between two points in time. Flows comprise two separate types, transactions and other economic flows. Transactions come about as a result of mutually agreed interactions between units or within a single unit. Other economic flows would include revaluations and destruction or discovery of assets that do not result from a transaction. In GFS operating statements, other economic flows, being outside of the control of government, are excluded and do not affect the net operating result.
Generally Accepted Accounting Principles
In addition to the GFS framework, public sector entities have been required to report at year end against AAS 31 Financial Reporting by Government, which meant complying with the Accounting Standards issued by the Australian Accounting Standards Board (AASB).
153
Harmonisation under AASB 1049
This dual reporting regime caused confusion for financial report users and so the Financial Reporting Council asked the AASB to develop a framework harmonising GAAP and GFS to issue an Australian accounting standard for a single set of government reports.
In the development of AASB 1049, the AASB adopted the following approaches:
| | • | | Adoption of GAAP definition, recognition and measurement principles in almost all cases |
| | • | | Amending presentation requirements to encompass a comprehensive result that retains GAAP classification system but overlays it with a transactions and other economic flows classification system based on GFS |
| | • | | Expanding the disclosure requirements to incorporate key fiscal aggregates required by GFS. |
Revisions to the Uniform Presentation Framework
Following the introduction of AASB 1049, the Australian, state and territory governments consider that the UPF will continue to be an important framework for ensuring comparability of financial information across jurisdictions. There are a number of important areas where the UPF provides either additional information or clearer guidance on the preparation of government financial statements to that of AASB 1049. For example, the Australian, state and territory governments agree that net debt, a fiscal indicator not required by the new standard, continues to be an important indicator in transparent budget reporting and should continue to be presented on the face of the financial statements as a fiscal aggregate. Further, the UPF shall continue to apply to financial statements produced by government in budgets, mid-year budget updates and final budget outcome reports, whereas the new accounting standard applies only to outcome reports.
Therefore, rather than replacing the UPF with the new accounting standard, the framework was updated to align with AASB 1049. Australian, state and territory governments agreed that the updated framework would continue to provide a common core of comparable financial information in their budget papers and comparable data amongst jurisdictions while maintaining at least the current level of transparency.
Aligning the framework with AASB 1049 was not intended to create a UPF that complies with all the reporting requirements of AASB 1049. For example, the UPF does not include the same level of detail in relation to disclosure requirements as AASB 1049. Instead, the revised UPF allows jurisdictions to utilise the framework as the base set of statements and add additional relevant information in order to comply with AASB 1049.
Major disclosure differences arising from the adoption of the revised UPF are outlined in Box 9.1.
Box 9.1
Major disclosure differences arising from the adoption of the
revised Uniform Presentation Framework
ALL SECTORS
Operating Statement
| | • | | Current and capital grants revenue and expenses have been grouped together in the Operating statement. |
| | • | | Dividend and income tax equivalent income has been split out from Other revenue. |
| | • | | Superannuation expenses have been separately disclosed from Employee expenses. |
| | • | | Other economic flows are now shown on the Operating statement, separated into those affecting the Operating result (or accounting profit) and those affecting equity or reserves. |
154
Balance Sheet
| | • | | Deferred tax assets and liabilities are now recognised in the balance sheet in the categories Other non-financial assets and Other liabilities respectively. |
| | • | | Prepayments are included in Other non-financial assets rather than with receivables, which reduces the Net financial worth. |
Cash Flow Statement
| | • | | Interest receipts and Dividend and income tax equivalent receipts have been split out from Other receipts. |
| | • | | Payments for employees have been separated from Payments for goods and services. |
GENERAL GOVERNMENT SECTOR
Operating Statement
| | • | | Expanded grant revenue and expense information is supplied in two additional tables 9.12 (a) and (b). |
| | • | | Additional information on Dividend and income tax equivalent income is supplied in Table 9.13. |
Balance Sheet
| | • | | The recognition of deferred tax assets and liabilities in the balance sheet is offset exactly by a reduction in the Investment in other public sector entities. |
| | • | | Net worth is therefore not impacted by this change but Net financial worth is, as the Deferred tax assets are disclosed as non-financial. |
PUBLIC NON-FINANCIAL SECTOR
Operating Statement
| | • | | Competitive neutrality fees, performance dividends and credit margin fees are now included in Other interest expenses rather than other operating expenses. |
| | • | | The Net operating balance for the PNFC sector no longer includes dividends declared and paid, and these are now included in Other economic flows—other movements in equity. |
| | • | | This also impacts on the Net lending aggregate which now excludes dividends. |
| | • | | The Operating result for the PNFC sector is effectively accounting profit after tax. |
Balance Sheet
| | • | | The overfunded defined benefit superannuation is classified as a negative liability rather than an asset. |
| | • | | The net worth of the PNFC sector is reduced by the recognition of deferred tax assets and liabilities in the balance sheet. |
| | • | | The Net financial worth is reduced by the amount of the deferred tax liabilities as well as the deferred tax asset which disclosed as non-financial. |
Cash Flow Statement
| | • | | Income tax paid is included in Other payments in the cash flow statement rather than Distributions paid, which increases the Cash surplus/(deficit). |
155
Operating statement
The operating statement combines the net result from transactions (net operating balance) and the impact of other economic flows to calculate the comprehensive result (total change in net worth). Neither other economic flows nor the comprehensive result were required under the former UPF.
Net operating balance is represented by revenues less expenses from transactions and excludes any other economic flows such as revaluations, gains or losses on asset disposals and allowances for doubtful debts.
In addition to the net result from transactions (net operating balance), the operating statement also includes other economic flows which are the total change in net worth driven by economic flows other than through transactions. Other economic flows are split between those that relate to the operating result (under GAAP) and those that relate to equity. The total of the net operating balance and all other economic flows equals the comprehensive result (total change in net worth).
Net lending is the net operating balance less net acquisition of non-financial assets. It is also referred to as the fiscal balance. It measures, in accrual terms, the gap between Government savings plus net capital transfers and investment in non-financial assets. A surplus indicates that the State Government is placing financial resources at the disposal of other sectors of the economy, whilst a deficit reflects the State utilising the financial resources of other sectors. Queensland’s net lending is driven by the size of the State’s capital program.
Balance sheet
The balance sheet shows stocks of financial and non-financial assets and liabilities. Key indicators in the balance sheet are net worth, net financial worth, net financial liabilities and net debt.
Net worth, also known as net assets, is defined as total assets less total liabilities. It provides a more comprehensive picture of a government’s position as all assets and liabilities are taken into account.
Net financial worth, on the other hand, is calculated as financial assets minus total liabilities. It measures a government’s net holdings of financial assets.
Net financial liabilities (a new key aggregate for the UPF) is calculated by deducting equity investments in the PNFC/PFC sectors from the net financial worth.
Net debt is represented by the sum of selected financial liabilities (such as deposits held, advances received and borrowings) minus the sum of selected financial assets (cash and deposits, loans and placements). It provides an indication of the strength of a government’s financial position.
Cash flow statement
Cash means cash on hand (notes and coins held and deposits held at call with a bank or financial institution) and cash equivalents (highly liquid investments readily convertible to cash and overdrafts considered integral to the cash management functions).
The cash flow statement demonstrates how cash is generated and applied in a single accounting period.
The cash surplus/deficit is the cash counterpart of the fiscal balance as disclosed in the operating statement. A surplus reflects the availability of cash to increase the State’s financial assets or decrease its liabilities, whilst a deficit reflects the requirement for cash either by running down the State’s financial assets or by drawing on the cash reserves of other sectors of the economy. It comprises net cash received/paid from operating activities, from sales and purchases of non-financial assets and from financing activities.
156
SECTOR CLASSIFICATION
GFS data is presented by institutional sector, distinguishing between the General Government sector and the Public Non-financial Corporations (PNFC) sector.
Budget reporting focuses on the General Government sector, which provides regulatory services and goods and services of a non-market nature that are provided at less than cost or at no cost. These services are largely financed by general revenue (Australian Government grants and state taxation). This sector comprises government departments, their commercialised business units/shared service providers and certain statutory bodies.
The PNFC sector comprises bodies that provide mainly market goods and services that are of a non-regulatory and non-financial nature. PNFCs are financed through sales to consumers of their goods and services and may be supplemented by explicit government subsidy to satisfy community service obligations. In general, PNFCs are legally distinguishable from the governments that own them. Examples of PNFCs include QR and the energy entities.
Together, the General Government sector and the PNFC sector comprise the Non-financial Public sector.
Further discussion of the GFS framework of reporting, including definitions of GFS terms, can be obtained from the webpage of the Australian Bureau of Statistics at www.abs.gov.au.
REPORTING ENTITIES
The reporting entities included in the General Government and PNFC sectors for the 2008-09 Budget are provided below.
General Government
Child Safety
Communities
Corrective Services
Disability Services Queensland
Education, Training and the Arts
Electoral Commission of Queensland
Emergency Services
Employment and Industrial Relations
Environmental Protection Agency
Forestry Plantations Queensland Office
Health
Housing
Infrastructure and Planning
Justice and Attorney-General
Legislative Assembly
Local Government, Sport and Recreation
Main Roads
157
Mines and Energy
Natural Resources and Water
Office of the Governor
Office of the Ombudsman
Public Service Commissioner
Police
Premier and Cabinet
Primary Industries and Fisheries
Public Works
Queensland Audit Office
The Public Trustee of Queensland
Tourism, Regional Development and Industry
Transport
Treasury
Departments
Statutory Authorities
Anti-Discrimination Commission
Australian Agricultural College Corporation
Board of the Queensland Museum
City North Infrastructure Pty Ltd
Commission for Children and Young People and Child Guardian
Crime and Misconduct Commission
Family Responsibilities Commission
Health Quality and Complaints Commission
Legal Aid Queensland
Library Board of Queensland
Motor Accident Insurance Commission
Nominal Defendant
Office of the Information Commissioner
Prostitution Licensing Authority
Queensland Art Gallery Board of Trustees
Queensland Building Services Authority
158
Queensland Events Corporation Pty Ltd
Queensland Future Growth Corporation
Queensland Performing Arts Trust
Queensland Rural Adjustment Authority (QRAA)
Queensland Studies Authority
Queensland Treasury Holdings Pty Ltd
Residential Tenancies Authority
South Bank Corporation
Southbank Institute of Technology
The Council of The Queensland Institute of Medical Research
Tourism Queensland
Urban Land Development Authority
Workers’ Compensation Regulatory Authority (Q-Comp)
Commercialised Business Units
CITEC
Goprint
Main Roads—RoadTek
Project Services
Property Services Group
QBuild
QFleet
SDS
Shared Service Providers
Corporate Administration Agency
Corporate and Professional Services
CorpTech
Queensland Health Shared Service Provider
Shared Service Agency
Public Non-financial Corporations
Cairns Ports
CS Energy Ltd
DBCT Holdings Pty Ltd
ENERGEX Ltd
159
Ergon Energy Corporation Limited
Forestry Plantations Queensland
Gladstone Area Water Board
Gladstone Ports Corporation
Gold Coast Events Co Pty Ltd
Mackay Ports
Major Sports Facilities Authority
Mount Isa Water Board
Port of Brisbane Corporation Limited
Port of Townsville
Ports Corporation of Queensland Limited
Powerlink Queensland
Queensland Bulk Water Supply Authority
Queensland Bulk Water Transport Authority
Queensland Lottery Corporation Pty Ltd
Queensland Manufactured Water Authority
Queensland Motorways Limited
Queensland Power Trading Corporation (Enertrade)
QR Limited
Queensland Water Infrastructure Pty Ltd
SEQ Water Grid Manager
South East Queensland (Gold Coast) Desalination Company Pty Ltd
Southern Regional Water Pipeline Company Pty Ltd
Stanwell Corporation Ltd
SunWater
Tarong Energy Corporation Ltd
The Trustees of Parklands Gold Coast
Western Corridor Recycled Water Pty Ltd
ZeroGen Pty Ltd
160
APPENDIX A—TAX EXPENDITURE STATEMENT
OVERVIEW
Governments employ a range of policy tools to achieve social and economic objectives. These include the use of direct budgetary outlays, regulatory mechanisms and taxation. As required by the Charter of Social and Fiscal Responsibility, this Tax Expenditure Statement (TES) details revenue foregone as a result of Government decisions relating to the provision of tax concessions. The TES is designed to improve transparency in the use of tax expenditures and increase public understanding of the fiscal process.
Tax expenditures are reductions in tax revenue that result from the use of the taxation system as a policy tool to deliver Government policy objectives. Tax expenditures are provided through a range of concessions, including:
| | • | | the application of reduced tax rates to certain groups or sectors of the community |
| | • | | provisions which defer payment of a tax liability to a future period. |
Labelling an exemption or concession as a tax expenditure does not necessarily imply any judgement as to its appropriateness. It merely makes the amount of the exemption or concession explicit and thereby facilitates its scrutiny as part of the annual Budget process.
Methodology
Revenue foregone approach
The method used almost exclusively by governments to quantify the value of their tax expenditures is the revenue foregone approach. This method estimates the revenue foregone through use of the concession by applying the benchmark rate of taxation to the volume of activities or assets affected by the concession. One of the deficiencies of the revenue foregone approach is that the effect on taxpayer behaviour resulting from the removal of the particular tax expenditure is not factored into the estimate. Consequently, the aggregation of costings for individual tax expenditure items presented in the TES will not necessarily provide an accurate estimate of the total level of assistance provided through tax expenditures.
Measuring tax expenditures requires the identification of:
| | • | | concessionally taxed components of the benchmark tax base such as a specific activity or class of taxpayer |
| | • | | a benchmark tax rate to apply to the concessionally taxed components of the tax base. |
Defining the tax benchmark
The most important step in the preparation of a TES is the establishment of a benchmark for each tax included in the statement. The benchmark provides a basis against which each tax concession can be evaluated. The aim of the benchmark is to determine which concessions are tax expenditures as opposed to structural elements of the tax. The key features of a tax benchmark are:
| | • | | any specific accounting conventions applicable to the tax |
| | • | | the deductibility of compulsory payments |
161
| | • | | any provisions to facilitate administration |
| | • | | provisions relating to any fiscal obligations. |
By definition, tax expenditures are those tax concessions not included as part of the tax benchmark.
Identification of benchmark revenue bases and rates requires a degree of judgement and is not definitive. Furthermore, data limitations mean that the tax expenditures are approximations and are not exhaustive. This statement does not include estimates of revenue foregone from exemptions or concessions provided to Government agencies. Very small exemptions or concessions are also excluded.
THE TAX EXPENDITURE STATEMENT
This year’s statement includes 2006-07 and 2007-08 estimates of tax expenditures for payroll tax, land tax, duties, the community ambulance cover and gambling taxes. A summary of the major tax expenditures valued on the basis of revenue foregone is presented in Table A.1. Not all expenditures can be quantified at this time. Accordingly, the total value of tax expenditures should be considered as indicative only.
Table A.1
Tax expenditure summary1
| | | | |
| | | 2006-072
$ million | | 2007-08
$ million |
Payroll Tax | | | | |
Exemption threshold3 | | 901 | | 999 |
Deduction scheme4 | | 171 | | 218 |
Section 14 exemptions | | | | |
Local Government | | 87 | | 95 |
Education | | 140 | | 153 |
Hospitals | | 215 | | 235 |
Total Payroll Tax | | 1,514 | | 1,700 |
| | |
Land Tax | | | | |
Liability thresholds5 | | 293 | | 354 |
Graduated land tax scale | | 142 | | 131 |
Primary production deduction | | 60 | | 75 |
Section 13 exemptions not included elsewhere6 | | 46 | | 55 |
Land developers’ concession | | 15 | | 14 |
Total Land Tax | | 556 | | 629 |
| | |
Duties | | | | |
Transfer duty on residential property | | | | |
Home concession | | 390 | | 402 |
First home concession | | 205 | | 222 |
First home vacant land concession | | 2 | | 2 |
Insurance duty | | | | |
Non-life insurance | | 111 | | 116 |
Workcover | | 23 | | 21 |
Health insurance | | 129 | | 145 |
Total Duties | | 860 | | 908 |
| | |
Community Ambulance Cover | | | | |
Concession to pensioners and seniors7 | | 42 | | 44 |
Taxes on Gambling | | | | |
Gaming machine taxes | | 114 | | 119 |
Casino taxes | | 6 | | 10 |
Total Gambling Tax | | 120 | | 129 |
162
Notes:
| 1. | Numbers may not add due to rounding. |
| 2. | 2006-07 estimates may have been revised since last year’s Budget. |
| 3. | Exemption threshold of $1 million applies. |
| 4. | Deduction of $1 million, which reduces by $1 for every $3 above $1 million, is applicable to employers with an annual payroll between $1 million and $4 million. |
| 5. | Land tax is payable only on the value of taxable land above a threshold which depends on the ownership structure. |
| 6. | Applicable, but not limited, to religious bodies, public benevolent institutions and other exempt charitable institutions. |
| 7. | Estimates are based on the revenue foregone through the use of the levy exemption by pensioners and senior citizens. |
DISCUSSION OF INDIVIDUAL TAXES
Payroll tax
The benchmark tax base for payroll tax is assumed to be all wages, salaries and supplements (including employer superannuation contributions) paid in Queensland, as defined in the Pay-roll Tax Act 1971. The benchmark tax rate for payroll tax is assumed to be the statutory rate applying in each financial year.
Payroll tax exemption threshold
Employers who employ in Queensland with an annual Australian payroll of $1 million or less are exempt from payroll tax. On the basis of average weekly earnings, this threshold corresponds to approximately 18 full-time equivalent employees. This concession is designed to assist small and medium sized businesses.
Deduction scheme
Employers who employ in Queensland with Australian payrolls between $1 million and $4 million benefit from a deduction of $1 million, which reduces by $1 for every $3 by which the annual payroll exceeds $1 million. In 2006-07 and 2007-08, there is no deduction for employers or groups with an annual payroll in excess of $4 million.
Section 14 exemptions
A number of organisations are provided with exemptions from payroll tax under Section 14 of the Pay-roll Tax Act 1971. The activities for which estimates have been calculated are wages paid by public hospitals, non-tertiary private educational institutions and local governments (excluding commercial activities).
Land tax
The benchmark tax base is assumed to be all freehold land within Queensland, excluding residential land used as a principal place of residence and land owned by individuals with a value for that year below the threshold. The benchmark tax rate for land tax is assumed to be the top rate of land tax applicable in Queensland in each financial year.
Liability thresholds
Land tax is payable on the value of taxable land above a threshold which depends on the land’s ownership. In 2006-07, the thresholds were $300,000 for companies, trusts and absentees and $500,000 for resident
163
individuals. In 2007-08, the threshold for companies, trusts and absentees was increased to $350,000 and for resident individuals was increased to $600,000.
Residential land owned by resident individuals as their principal place of residence is excluded from the estimate. The exemption from paying below a minimum amount ($500 in 2006-07 and $1,200 in 2007-08) is not included as a tax expenditure as it is regarded as the application of an administration threshold.
Graduated land tax scale
A graduated (concessional) scale of land tax rates is applicable to land with a taxable value of less than $3 million for resident individuals and $2 million for companies, trustees and absentees.
Primary production deduction
The taxable value of land owned by a resident individual, trustee or some absentees and companies does not include all or part of their land that is used for the business of agriculture, pasturage or dairy farming.
Section 13 exemptions (not elsewhere included)
A number of land tax exemptions are granted under Section 13 of the Land Tax Act 1915 to eligible organisations. These include, but are not limited to, public benevolent institutions, religious institutions and other exempt charitable institutions, retirement villages, trade unions and showgrounds.
Land developers’ concession
From 1 July 1998, land developers have been charged land tax on 60% of the unimproved value of (undeveloped) land subdivided in the previous financial year and which remains unsold at 30 June of that year. This concession is outlined in Section 3CA of the Land Tax Act 1915.
Transfer duty concession on residential property
The benchmark tax base is assumed to be all sales of residential property within Queensland. The benchmark tax scale is assumed to be the scale that actually applied in each financial year.
Home concession
A concessional rate of duty applies to purchases of a principal place of residence. From 1 July 2006, a concessional rate of 1% has applied on dutiable values up to $320,000 compared to the normal schedule of rates between 1.5% and 3.5%. For properties valued over $320,000, the scheduled rates of transfer duty applied on the excess.
First home concession
Where a purchaser has not previously owned a residence in Queensland or elsewhere, the purchaser of a home receives a more generous concession on duty. This concession comprises a rebate in addition to the home concession on properties (this concession may not be applicable if the purchase price is less than the full market value of the property). The size of the rebate depends on the value of the property. Duty relief is provided to purchases of a first principal place of residence valued up to $500,000.
First home vacant land concession
Since 1 January 2007, a first home concession has been available for the purchase of certain vacant land up to the value of $300,000.
164
Insurance duty
The benchmark tax base is assumed to be all premiums for general insurance policies (except for life insurance). The benchmark tax scale is assumed to be the scale that actually applied in each financial year.
The rate of duty applicable to most types of general insurance is 7.5%. Concessional rates apply to some other general insurance types (5% for motor vehicle insurance other than compulsory third party (CTP), workers’ compensation and professional indemnity insurance and 10c on a premium for CTP insurance). Data limitations mean that these insurance types are categorised into non-life insurance cover and WorkCover. An exemption from duty is also provided for private health insurance.
Duty on mortgages—home concessions and first home concessions
The benchmark tax base is assumed to be all mortgages and loans taken out in Queensland. The benchmark tax scale is assumed to be the scale that actually applied in each financial year.
A concession from duty is allowed where a home mortgage secures an advance attributable to the purchase or construction of the borrower’s home.
The data required to estimate the revenue foregone is not available.
Community Ambulance Cover
Concession to pensioners and seniors
Pensioners and senior card holders are exempt from paying the Community Ambulance Cover charge levied quarterly on electricity accounts.
Gambling taxes
Gaming machine tax concessions for licensed clubs
The benchmark tax base is assumed to be all gaming machines operated by licensed clubs and hotels in Queensland. The benchmark tax rate is assumed to be the highest marginal tax rate (as is applied to hotels) that actually applied in each financial year.
A concessional graduated tax rate scale applies to gaming machines operated by licensed clubs. The tax rate is calculated on the gaming machine monthly metered win and the top tax rate is only applied to the portion of gaming machine revenue where the monthly metered win exceeds $1.4 million for any licensed club.
Casino tax concessions
The benchmark tax base is assumed to be all casinos operating in Queensland. The benchmark tax rate is assumed to be the highest tax rate that is actually applied in each financial year.
A tax rate of 20% of gross revenue applies for standard transactions in the Brisbane and Gold Coast casinos. A concessional tax rate of 10% applies for gross revenue from standard transactions in the Cairns and Townsville casinos. In addition concessional rates also apply for revenue from high rollers in all casinos. High roller revenue is taxed at 10% in the Brisbane and Gold Coast casinos and 8% for the Cairns and Townsville Casinos. A GST credit is provided to casinos that approximates a reduction in the above tax rates of 9.09%.
165
APPENDIX B—CONCESSIONS STATEMENT
INTRODUCTION
The Government provides concessions in the form of discounts, rebates and subsidies to improve access to and the affordability of a range of services for individuals or families based on eligibility criteria relating to factors such as age, income and special needs or disadvantage.
This statement serves to highlight the cost and nature of concessions covering both concessions which are reflected as outlays in the Budget (for example, direct subsidy payments) and revenue foregone through fees and charges which are set at a rate lower than that applying to the wider community.
Varying methods have been used to estimate the cost of concessions depending on the nature of the concession, including:
| | • | | direct Budget outlay cost (for example, direct subsidy or rebate payments) |
| | • | | revenue foregone (for example, concessional fees and charges) |
| | • | | cost of goods and services provided. |
Table B.1 sets out the cost of concessions by agency. The total value of concessions is estimated at $1 billion in 2008-09.
166
Table B.1
Concessions by agency1
| | | | |
Agency | | 2007-08
Est.Act.
$ million | | 2008-09
Estimate
$ million |
Department of Communities | | | | |
Electricity Rebate Scheme | | 67.5 | | 86.5 |
Electricity Life Support Scheme | | 0.7 | | 0.8 |
Pensioner Rate Subsidy Scheme | | 44.3 | | 49.3 |
Rail Concession Scheme | | 34.1 | | 35.0 |
Reticulated Natural Gas Rebate Scheme | | — | | 5.8 |
Home Energy Emergency Assistance Scheme | | 1.1 | | 2.7 |
SEQ Pensioner Water Subsidy Scheme | | — | | 6.5 |
| | |
Department of Education, Training and the Arts | | | | |
Living Away from Home Allowances Scheme | | 6.0 | | 6.4 |
School Transport Assistance for Students with Disabilities | | 30.0 | | 30.0 |
Non-State School Transport Assistance Scheme2 | | 2.8 | | 4.4 |
Venue Hire and Lease Discount—Judith Wright Centre of Contemporary Art | | 0.4 | | 0.4 |
Arts Concessional Entry Fees | | 1.0 | | 0.9 |
Venue Hire Discount—Queensland Performing Arts Trust | | 0.4 | | 0.3 |
TAFE Concessions | | 15.5 | | 15.4 |
| | |
Department of Emergency Services | | | | |
Urban Fire Levy Concession | | 5.4 | | 5.7 |
| | |
Environmental Protection Agency | | | | |
Environmental Licence Fee Waiver3 | | 0.1 | | — |
Entry and Tour Fee Concessions | | 0.1 | | 0.2 |
| | |
Queensland Health | | | | |
Spectacles Supply Scheme | | 6.4 | | 6.4 |
Medical Aids Subsidy Scheme | | 22.0 | | 25.8 |
Patient Travel Subsidy Scheme | | 34.4 | | 34.5 |
Oral Health Scheme | | 99.2 | | 103.1 |
| | |
Department of Housing | | | | |
Aboriginal and Torres Strait Islander Housing Rental Rebate | | 14.3 | | 14.5 |
Public Rental Housing Rebate4 | | 256.2 | | 291.5 |
| | |
Department of Justice and Attorney-General | | | | |
Public Trustee of Queensland—Rebates of Fees | | 17.7 | | 18.6 |
| | |
Department of Local Government, Sport and Recreation | | | | |
Active Recreation Centres—Concessional Usage Rates | | 0.1 | | 0.2 |
| | |
Department of Natural Resources and Water | | | | |
Rebates on Fixed Water Charges | | 3.6 | | 5.0 |
167
Table B.1 (continued)
Concessions by agency1
| | | | |
Agency | | 2007-08
Est.Act.
$ million | | 2008-09
Estimate
$ million |
Department of the Premier and Cabinet | | | | |
South Bank Corporation—Venue Hire Discounts | | 0.2 | | 0.2 |
| | |
Department of Primary Industries and Fisheries | | | | |
Drought Rate Rebate Scheme5 | | 8.5 | | — |
| | |
Department of Transport | | | | |
Transport Concessions incl. Taxi Subsidies | | 70.7 | | 74.3 |
Motor Vehicle Registration Concession | | 50.6 | | 51.9 |
Recreational Ship Registration Concession | | 0.8 | | 0.8 |
School Transport Assistance Scheme | | 125.7 | | 129.6 |
| | |
Total | | 919.9 | | 1,006.8 |
Notes:
| 1. | Numbers may not add due to rounding. |
| 2. | 2007-08 estimated actual includes a return of $1.6M excess funds previously accumulated by the Queensland Catholic Education Commission. |
| 3. | Due to the introduction of new environmental protection regulation, this concession will cease on 1 January 2009. |
| 4. | Increases in markets rents have resulted in an increased estimated level of rental rebate for 2008-09. |
| 5. | This scheme will cease on 30 June 2008. |
Department of Communities
The Department of Communities has responsibility for the Queensland Government Electricity Rebate Scheme that provides a rebate on the cost of domestic electricity supply to the home of eligible holders of a Pensioner Concession Card, Queensland Seniors Card or a Repatriation Health Card for All Conditions (Gold Card) who receive a War Widow or Special Rate Totally and Permanently Incapacitated (TPI) pension.
The Electricity Life Support Concession Scheme is aimed at assisting seriously ill people who use home-based life support systems such as oxygen concentrators and kidney dialysis machines.
The Pensioner Rate Subsidy Scheme alleviates the impact of local government rates and charges on pensioners, thereby assisting them to continue to live in their own homes.
The Queensland Rail Concessions Scheme assists pensioners, veterans and seniors to reduce the cost of public transport and to maintain an active and healthy lifestyle.
Two additional schemes were introduced in the 2007-08 financial year—the Reticulated Natural Gas Rebate Scheme and the Home Energy Emergency Assistance Scheme.
The Reticulated Natural Gas Rebate Scheme provides a rebate off the cost of reticulated natural gas supplied to the home of eligible holders of a Pensioner Concession Card, Queensland Seniors Card or Repatriation Health Card for All Conditions (Gold Card) who receive a War Widow or Special Rate Totally and Permanently Incapacitated (TPI) pension.
The Home Energy Emergency Assistance Scheme provides one-off emergency assistance to low income households suffering a short term financial crisis and who are unable to pay their current electricity and/or reticulated natural gas account and are at risk of disconnection.
168
To lessen the impact of increased water prices on pensioners, the Government has established the South East Queensland (SEQ) Pensioner Water Subsidy Scheme. It will be phased in over three years with the increased water prices and will provide a subsidy of $40 in 2008-09, $70 in 2009-10 and $100 from 2010-11. The Scheme, which will only apply to eligible pensioners in the SEQ Water Grid, will be in addition to the current Pensioner Rate Subsidy Scheme of up to $180 per annum.
Department of Education, Training and the Arts
The Department of Education, Training and the Arts provides a living away from home allowance to students in Years 1 to 12 in state and non-state schools whose homes are geographically isolated from local schools. The allowances offset the costs associated with boarding away from home to attend school on a daily basis and include tuition and travel costs.
The Department also offers assistance to students with disabilities to access school programs to meet their educational needs. Assistance is in the form of the provision of taxis or specialised contracted minibuses, payment of fares on regular buses or trains, or an allowance for parents who drive their children to school.
The Non-State School Transport Assistance Scheme assists families of students attending non-state schools outside Brisbane whose bus fare is over a weekly threshold amount. The program also assists families of students with disabilities who attend a non-state school.
Discounts apply to venue rental fees charged to arts and community organisation hirers and rent reductions apply to lease amounts for resident cultural organisation tenants at the Judith Wright Centre of Contemporary Art.
Concessional ticket entry fees apply to a variety of concession card holders, students, children and families for special exhibitions at the Queensland Art Gallery and the Queensland Museum.
Queensland Performing Arts Trust offers discounts on venue rental fees charged to Government funded organisations, primarily Opera Queensland, Queensland Ballet, Queensland Orchestra and Queensland Theatre Company.
Concessions on TAFE tuition fees for Government-funded training are offered to a range of concession card holders, students of Aboriginal and Torres Strait Islander descent and students who can demonstrate extreme financial hardship.
Department of Emergency Services
Pensioners are eligible for a 20% discount on the Urban Fire Levy payable on prescribed properties of which they are the owner or part-owner.
Environmental Protection Agency
A fee waiver may be granted on environmental licences on the grounds of financial hardship or if there is a small or insignificant environmental risk. Due to the introduction of new environmental protection regulation, this concession will conclude on 1 January 2009. The Department also offers concessional entry fees for specified protected areas including St Helena Island, David Fleay Wildlife Park and Mon Repos Conservation Park.
Queensland Health
The Spectacles Supply Scheme assists eligible Queensland residents by providing a comprehensive range of free basic spectacles. The scheme is administered through the Medical Aids Subsidy Scheme, following transfer of the administration and management of the Scheme from Health Service Districts, effective 1 January 2008.
169
The Medical Aids Subsidy Scheme provides eligible Queensland residents with permanent and stabilised conditions or disabilities with access to subsidy funding assistance for the provision of a range of aids and equipment. Aids and equipment are provided primarily to assist people to live at home thus avoiding premature or inappropriate residential care or hospitalisation.
Queensland Health’s Patient Travel Subsidy Scheme provides financial assistance to patients who need to access specialist medical services which are not available within their local area. The Scheme provides a subsidy towards the cost of travel and accommodation for patients and, in some cases, an escort.
The Oral Health Scheme provides free dental care to eligible clients and their dependents who possess a current Health Care Card, Pensioner Concession Card, Queensland Seniors Card or Commonwealth Seniors Card. In rural and remote areas where no private dental practitioner exists, access to dental care for the general public is provided at a concessional rate.
Department of Housing
The Aboriginal and Torres Strait Islander Housing Rental Rebate targets low income Indigenous families and individuals and represents the difference between the rents that would be payable in the private market and the rent that is charged based on the household’s income.
The Public Rental Housing Rebate targets low income families and individuals and represents the difference between the rent that would be payable in the private market and the rent that is charged based on the household’s income. Increasing market rents result in an increasing level of rental rebate.
Department of Justice and Attorney-General
The Public Trustee offers fee rebates (full or partial) for clients who, because of financial circumstances, cannot pay the full amount of fees that have been levied.
Department of Local Government, Sport and Recreation
Concessional rates are offered to school groups for the use of a number of Active Recreation Centres, such as those at Currimundi and Tallebudgera.
Department of Natural Resources and Water
A rebate on fixed water charges (Part A charges) is provided for rural irrigation users in areas where there is low water availability (users with an announced water allocation of 20% or less). The rebate is capped at $10,000 per annum and can provide up to 100% of fixed water charges on water bills for the period from 1 July 2006 to 30 June 2008. Estimated outlays in 2008-09 primarily represent residual claims expected to be received after 30 June 2008. Relief will also be provided on fixed water charges for two billing periods to eligible flood affected irrigators in the Emerald area.
Department of the Premier and Cabinet
Community groups and charities are given discounted charges for the hire of venues within the South Bank parklands, such as the Suncorp Piazza.
Department of Primary Industries and Fisheries
To assist primary producers who have been detrimentally affected by drought leading to financial difficulty, assistance is provided in the form of a rebate of local government rates. A rebate of 50% is available to eligible applicants.
170
The scheme commenced in 2006-07 and will conclude on 30 June 2008.
Department of Transport
Transport concessions are provided by the Government in a variety of forms and across a range of activities to ensure access and mobility for Queenslanders who are transport disadvantaged. Eligible categories to receive a concession include Pensioner Concession Card holders, Seniors Card holders, children and secondary and tertiary students. Members of the Taxi Subsidy Scheme also receive concessions on taxi travel. The provision of these concessions is in the form of a subsidy payment to transport operators.
Motor vehicle and boat registration concessions are provided to holders of the Pensioner Concession Card, Queensland Seniors Card and to those receiving a Totally or Permanently Incapacitated Ex-serviceperson Pension. The concession is aimed at improving the access to travel of pensioners and seniors.
The School Transport Assistance Scheme is a program for students whose access to school is disadvantaged by distance or who are from defined low income groups. Assistance is provided towards the cost of travel on bus, rail and/or ferry with allowances for private vehicle transport.
171
APPENDIX C—STATEMENT OF RISKS AND SENSITIVITY ANALYSIS
INTRODUCTION
The Queensland Budget, like those of other states, is based in part on assumptions made about future elements of uncertainty, both internal and external to the State, which can impact directly on economic and fiscal forecasts. Operating results achieved in recent years reflect the fact that the actual fiscal result achieved depends on the direction of such variables.
Consistent with the Charter of Social and Fiscal Responsibility, this section analyses the sensitivity of the estimates to changes in the economic and other assumptions used in developing the Budget and forward estimates. This analysis is provided, as required under the Charter, to enhance the level of transparency and accountability of the Government.
Notwithstanding the risks associated with the Budget, Queensland is well placed to manage adverse impacts. Queensland’s strong balance sheet and low tax status means it has substantial capacity to withstand the risks normally associated with any state or territory budget.
The forward estimates in the Budget are framed on a no policy change basis. That is, the expenditure and revenue policies in place at the time of the Budget (including those announced in the Budget) are applied consistently throughout the forward estimates period.
The following discussion provides details of some of the key assumptions and risks associated with revenue and expenditure forecasts and, where a direct link can be established, the indicative impact on forecasts resulting from a movement in those variables.
IMPACT OF DROUGHT
The 2008-09 Budget and forward estimates assume a return to average seasonal conditions and a partial recovery from drought. While much of Queensland experienced substantial rainfall over the summer months, close to 60% of the State, predominantly in the south, remains drought declared.
If follow-up rains do not occur, the continuation of drought conditions would have a negative impact on both revenue and expenditure items. For example, reduced levels of rural employment associated with drought would be expected to result in reduced payroll tax revenues, while expenditures on drought assistance programs would be expected to increase.
SENSITIVITY OF EXPENDITURE ESTIMATES AND EXPENDITURE RISKS
Public sector wage costs
Salaries and wages form a large proportion of General Government operating expenses. Increases in salaries and wages are negotiated through enterprise bargaining agreements.
The 2008-09 Budget and forward estimates include funding for wage increases as per the most recent round of enterprise bargaining.
For agreements yet to be reached, funding provisions are consistent with the Government’s wages policy.
Interest rates
The General Government sector has a very moderate level of debt with a total debt servicing cost forecast at $539 million in 2008-09.
172
The current average duration of General Government debt is approximately three years. Accordingly, a one percentage point variation in interest rates would lead to a very modest change in debt servicing costs in 2008-09.
Actuarial estimates of superannuation and long service leave
Liabilities for superannuation and long service leave are estimated by the State Actuary with reference to, among other things, assumed rates of investment returns, salary growth and inflation. These liabilities are therefore subject to changes in these parameters. Similarly, the long service leave liabilities are subject to the risk that the actual rates of employee retention will vary from those assumed in the liability calculation.
While these impacts have been estimated and allowances made in the Budget and forward estimates to accommodate them, the actual outcome may differ from the estimates calculated for the Budget.
Demographic and demand based risks
Unforeseen changes in the size, location and composition of Queensland’s population can impact on the demand for goods and services and therefore on the cost of maintaining existing policies. This is particularly evident in the health, education, community services and criminal justice sectors.
State government expenditure is often more closely associated with socio-demographic factors, such as the number of school age children or the number of elderly residents, than with economic activity. However, such changes are unlikely to impact significantly in the short term.
For this reason, the composition, size and location of the State’s population are more significant in projecting the State’s expenditure needs across the forward estimates period than for the current or budget year.
Unforeseen events
Events will occur during the financial year which will require additional expenditure but could not be foreseen or quantified at the time of the Budget.
Contingency funding for such events is provided in the Budget through the Treasurer’s Advance. The Treasurer’s Advance is an amount of appropriation within Treasury’s Administered Budget as a whole-of-Government provision for potentially emergent costs.
In 2008-09, the Treasurer’s Advance allocation is $50 million.
SENSITIVITY OF REVENUE ESTIMATES AND REVENUE RISKS
The rate of growth in tax revenues is dependent on a range of factors that are linked to the rate of growth in economic activity in the State. Some taxes are closely related to activity in specific sectors of the economy, whilst others are broadly related to the general rate of economic growth, employment, inflation and wages. A change in the level of economic activity, resulting from economic growth differing from forecast levels, would impact upon a broad range of taxation receipts.
Other revenue items are influenced by external variables such as the exchange rate or the performance of financial markets.
Performance of financial markets—investment returns
The Queensland Government has decided to remove investment return volatility from the General Government net operating balance through transferring the Consolidated Fund superannuation and other assets held to meet long term liabilities of the Government to the Queensland Treasury Corporation. See Chapter 1 for further details.
173
The 2007-08 estimates are based on investment returns to mid-May, which were around 2%. Given the transfer of the assets is not to take place until 1 July 2008, volatility associated with equity markets still remains in 2007-08.
Exchange rate and commodity prices and volumes—royalties estimates
Estimates of mining royalties are sensitive to movements in the Australian dollar-US dollar exchange rate and commodity prices and volumes.
Contracts for the supply of commodities are generally written in US dollars. Accordingly, a change in the exchange rate impacts on the Australian dollar price of commodities and therefore expected royalties collections.
A one cent variation in the Australian dollar-US dollar exchange rate would lead to a change in royalty revenue of approximately $43 million in 2008-09.
Also impacting on royalty estimates are volume effects. A large component of Queensland’s royalty collections is derived from coal. A 1% variation in export coking and thermal coal volumes would lead to a change in royalty revenue of approximately $32 million.
The 2008-09 Budget assumptions for export coal prices are derived by taking into account various price forecasts made by coal companies. A 1% variation in the price of export coal would lead to a change in royalty revenue of approximately $37 million.
Property values and volumes—transfer duty estimates
Over recent years, high levels of activity in the property market have resulted in strong growth in revenue collections through transfer duty receipts. The increase in duty receipts flowing from the property market activity has a number of elements. The key elements are the value and volume of properties changing hands.
For 2008-09, a moderation of the recent strong growth in the property market is forecast. The underlying assumption is for moderate growth in property prices and reduced volumes, compared to the high levels of activity in the first half of 2007-08.
A 1% variation in the average value of property transactions would change transfer duty collections by approximately $43 million in 2008-09.
A 1% variation in the volume of transactions would change transfer duty revenues by approximately $38 million in 2008-09.
Wages and employment growth—payroll tax collections
Wages and employment growth have a direct impact on payroll tax collections. The Budget assumptions are for an increase in the Wage Price Index of 4 1/2% and employment growth of 2 1/2% in 2008-09.
A one percentage point variation in wages growth would change payroll tax collections by approximately $27 million. Similarly, a one percentage point variation in employment growth would change payroll tax collections by $27 million.
Parameters influencing Australian Government GST payments to Queensland
Estimates of Australian Government GST revenue grants to states and territories are dependent on total GST revenue collected, which tends to be closely correlated with the general level of economic activity. The
174
Australian Government has provided estimates of total GST collections in its Budget Papers. In 2008-09, Queensland’s Budget will bear the risks of fluctuations in GST revenues and the other components of the package, such as the First Home Owner Grant Scheme, administrative costs associated with the GST and taxes foregone.
The Australian Government’s estimate of GST revenue in 2008-09 is based on its forecast of national non-farm GDP growth of 2 3/4%, household consumption growth of 2 3/ 4%, and a 3 1/2% rate of inflation. However, as the GST is imposed on some goods and services but not others, there is no precise link between these parameters and the GST base. As with all other tax estimates, there is a risk of lower collections than estimated by the Australian Government if economic growth and consumption is weaker than expected.
Relative to other states, Queensland has been assessed as having an increasing capacity to raise revenue from transfer duty and mining revenue in recent years. As a result, Queensland’s share of GST funding (relativity) has declined and is expected to be below a population share for the first time in 2008-09. As Queensland continues to raise relatively more revenue because of strong resource and property sectors, it is expected that Queensland’s relativity and therefore share of GST funding will decline further.
Due to the complexities associated with the GST base, the information provided in the Australian Government Budget Papers is not sufficient to prepare indicative forecasts of the sensitivity of GST estimates to key variables.
Australian Government grants (Specific Purpose Payments)
The Council of Australian Governments has agreed to reform the system of Specific Purpose Payments (SPPs) to the states. The reform process is intended to improve transparency and accountability, and to reduce the factors which lead to the ‘blame game’ and sub-optimal outcomes for the Australian community.
While it is anticipated that the new SPP framework will go some way to clarifying the roles and responsibilities of the Australian and state governments respectively, it will not resolve the substantial vertical fiscal imbalance that continues to exist within the Australian Federation.
The Australian Government has provided a commitment that no state will be financially disadvantaged by the reforms to the financial framework. The Australian Government has acknowledged the need to revise the base and escalation factors associated with each of the new SPPs as part of the reform process.
Chapter 8 provides further details of Australian Government funding and SPP reforms.
CONTINGENT LIABILITIES
Contingent liabilities represent items that are not included in the Budget as significant uncertainty exists as to whether the Government would sacrifice future economic benefits in respect of these items. Nevertheless, such contingencies need to be recognised and managed wherever possible in terms of their potential impact on the Government’s financial position in the future.
The State’s quantifiable and non-quantifiable contingent liabilities are detailed in the 2006-07 Report on State Finances—Consolidated Financial Statements (Note 46).
175
A summary of the State’s quantifiable contingent liabilities as at 30 June 2007 is provided below.
Table C.1
Contingent liabilities
| | |
| | | 2007
$ million |
Nature of contingent liability | | |
| |
Guarantees and indemnities | | 6,215 |
QTC—stock loans | | 1,186 |
Other | | 45 |
| |
Total | | 7,446 |
176
STATE BUDGET
2008-09
CAPITAL STATEMENT
Budget Paper No. 3
TABLE OF CONTENTS
178
1. OVERVIEW
KEY POINTS
Capital outlays in 2008-09 are estimated to be $17 billion, an increase of 19.1% or $2.723 billion on estimated actual 2007-08 capital outlays.
The 2007-08 estimated capital outlays are 1.8% ($257 million) higher than forecast in the 2007-08 Budget. Major contributors to this increase were the Department of Local Government Sport and Recreation, the Department of Education Training and the Arts, as well as increased spending on water.
Capital outlays will support over 119,000 full-time jobs in Queensland.
The Government’s ongoing commitment to regional and rural Queensland is reflected in this Budget. Almost 56% of expenditure will occur outside the Brisbane Statistical Division, including $37.5 million towards the redevelopment of Cairns, Mackay and Mount Isa hospitals, $58.8 million for construction of new social rental housing and $118.3 million for continuing work on the correctional centre near Mareeba.
In 2008-09 there will be capital outlays of $6.968 billion for transport and main roads including Northern Busway and the Gateway Upgrade Project, $929.7 million for education, training and the arts, $1.024 billion for health and $516.9 million for housing.
The capital outlays of the Public Non-Financial Corporations sector, including Government-owned corporations, constitute nearly 52% of total outlays in 2008-09, including $3.108 billion in the energy sector.
The Government will continue to invest in water infrastructure, with capital outlays of $2.551 billion in 2008-09, including $795 million for the Western Corridor Recycled Water Project, $448.1 million to complete the South East Queensland Desalination Plant and $442.3 million to progress development of the Traveston Crossing dam.
INTRODUCTION
This capital statement presents an overview of proposed capital outlays by the Queensland Government in 2008-09, as well as a summary of the Government’s approach to infrastructure provision. Capital outlays in 2008-09 are estimated to be $17 billion, net of a capital contingency reserve of $950 million.
This represents an increase of 19.1% on estimated actual outlays in 2007-08 and reflects the Government’s continuing significant investment in water infrastructure, increased expenditure on health, education and roads, progress with the South East Queensland Infrastructure Plan and Program (SEQIPP), as well as a number of other new capital investments.
Each year a major part of the Queensland Government’s capital program is undertaken through the Public Non-financial Corporations (PNFC) sector (that is, commercial entities of Government, including Government-owned corporations and other authorities such as the water bodies, Forestry Plantations Queensland and Queensland Motorways Limited). For 2008-09, capital outlays of Queensland’s PNFC sector will constitute nearly 52% of total outlays, reflecting major investments in water, electricity, rail and ports infrastructure.
Expenditure in 2008-09 is highest in the Brisbane Statistical Division—the most populated and one of the fastest growing areas of the State—planned at $7.937 billion. However, consistent with the Government’s commitment to building Queensland’s regions, almost 56% of capital expenditure is expected to occur outside the Brisbane Statistical Division.
179
Capital outlays by purpose in 2008-09 are shown in Chart 1.1 below. Capital outlays by State Government entity are listed in Table 1.1.
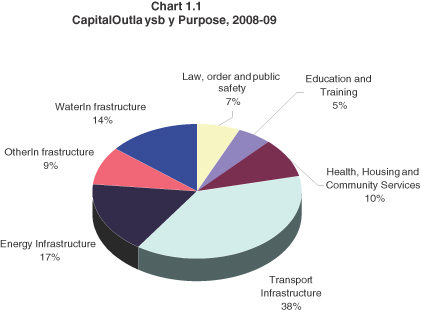
180
Table 1.1
Capital Outlays by Entity1
| | | | | | |
Entity | | 2007-08
Est. Act.
$’000 | | | 2008-09
Budget
$’000 | |
Child Safety | | 16,227 | | | 32,846 | |
Communities | | 38,105 | | | 113,294 | |
Corrective Services | | 242,528 | | | 400,486 | |
Disability Services Queensland | | 47,353 | | | 71,662 | |
Education, Training and the Arts | | 691,130 | | | 929,713 | |
Emergency Services | | 149,927 | | | 160,637 | |
Environmental Protection Agency | | 44,135 | | | 44,734 | |
Health | | 613,734 | | | 1,024,259 | |
Housing | | 428,129 | | | 516,884 | |
Infrastructure and Planning Portfolio | | | | | | |
Infrastructure and Planning2 | | 198,162 | | | 218,565 | |
Water Infrastructure Projects | | 2,733,548 | | | 2,228,736 | |
SEQ Water Grid Manager | | 643 | | | 2,628 | |
Justice and Attorney-General | | 107,633 | | | 332,672 | |
Legislative Assembly of Queensland | | 5,507 | | | 3,553 | |
Local Government, Sport and Recreation | | 571,645 | | | 482,107 | |
Main Roads | | 2,999,191 | | | 3,235,154 | |
Mines and Energy Portfolio | | | | | | |
Mines and Energy | | 3,104 | | | 15,407 | |
Energy GOCs | | 2,774,800 | | | 3,108,064 | |
Natural Resources and Water Portfolio | | | | | | |
Natural Resources and Water | | 58,521 | | | 71,368 | |
Water Boards | | 42,447 | | | 31,922 | |
SunWater | | 46,648 | | | 50,298 | |
Queensland Bulk Water Supply Authority | | 50,000 | | | 161,100 | |
Queensland Bulk Water Transport Authority | | 0 | | | 20,600 | |
Police | | 212,993 | | | 283,442 | |
Premier and Cabinet | | 47,016 | | | 101,011 | |
Primary Industries and Fisheries | | 52,180 | | | 41,536 | |
Public Works | | 448,241 | | | 448,835 | |
Tourism, Regional Development and Industry | | 20,852 | | | 138,990 | |
Transport Portfolio | | | | | | |
Queensland Transport | | 693,842 | | | 669,973 | |
QR Limited | | 1,180,287 | | | 2,184,350 | |
Port Authorities | | 544,118 | | | 798,387 | |
Treasury | | 20,711 | | | 32,340 | |
Other Agencies3 | | 2,125 | | | 2,445 | |
Anticipated Capital Contingency Reserve4 | | (800,000 | ) | | (950,000 | ) |
Total Capital Outlays | | 14,285,482 | | | 17,007,998 | |
| | | | | | |
Notes:
| 1. | Includes associated statutory bodies. |
| 2. | Includes the Department of Infrastructure and Planning, Property Services Group and Airport Link. |
| 3. | Includes the Department of Employment and Industrial Relations, Electoral Commission of Queensland, Office of the Governor, Office of the Ombudsman and Queensland Audit Office. |
181
| 4. | Contingency recognises that individual agencies may budget to fully expend their capital works allocations, however on a whole-of-Government basis, there is likely to be under spending, resulting in a carryover of capital allocations. The amount for 2008-09 has been revised upwards to reflect large increases in the capital program and in anticipation of industry capacity constraints in some areas. |
| 5. | Capital works outside of Queensland are not included in the capital program. |
| 6. | Numbers may not add due to rounding. |
EMPLOYMENT GENERATION
The 2008-09 capital program will have a significant effect on employment, supporting over 119,000 full time jobs, either directly or indirectly. Estimated employment generation from budgeted capital expenditure in 2008-09 exceeds the forecast in the 2007-08 Capital Statement by over 8%. This increased employment is spread across the range of Government services. Employment generating capital does not include expenditure on land purchases, and plant and equipment.
CAPITAL GRANTS TO LOCAL GOVERNMENT AUTHORITIES
As highlighted in Budget Paper 2—Budget Strategy and Outlook, the Queensland Government provides capital grants to local government authorities, ranging from capital works subsidies towards the costs of local public infrastructure to road subsidies for local roads, networks and drainage.
In 2007-08, approximately 75.4% ($480.5 million) of total Queensland Government grants made to local government authorities were for capital purposes. Capital grants to local governments are expected to account for $614 million, or 79.7% of total Queensland Government grants in 2008-09. The capital grant funding can be used for a range of purposes including roads and drainage, water and environment, and housing.
Queensland Government capital grants to local government authorities are shown in Chart 1.2 below.
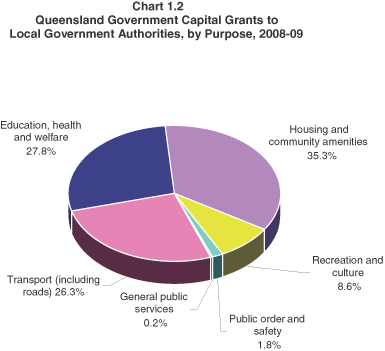
182
FUNDING THE STATE CAPITAL PROGRAM
The State’s capital program is implemented across both the General Government sector and the PNFC sector.
While the capital program undertaken across the PNFC sector contributes significantly towards meeting the Government’s priorities, the process through which this capital program is developed and funded is different from the General Government sector. Entities in the PNFC sector operate as commercial business entities, generally within competitive markets, and as such progress their capital programs on the basis of needs identified within the market sectors they service. There are a number of ways in which the capital expenditure program for the PNFC sector can be funded. These options include using cash flow from their business, borrowings, and, in certain situations, requesting a dividend reinvestment or equity injection from shareholding Ministers.
Table 1.2 outlines the major sources of funding for the State capital program. In 2008-09, net borrowings and advances of $10.904 billion are estimated in support of the capital program, of which $2.897 billion is budgeted for the General Government sector. The expected borrowing and advances requirement of the PNFC sector for 2008-09 is $8.007 billion. The major borrowers in this sector are Queensland Rail, the water bodies including Sunwater, and Queensland Motorways Limited.
In total, borrowings and advances are projected to fund around 66% of new infrastructure in 2008-09. Borrowing for capital purposes is consistent with the Government’s fiscal principles outlined in the Government’s Charter of Social and Fiscal Responsibility and is necessary to support expansion of the State’s capital base. After allowing for the reinvestment of earnings on the State’s superannuation investments, free cash flow of $4.682 billion is expected to be available for investment in capital in 2008-09.
Table 1.2
Sources of Funding for Capital1
| | | | | |
| | | 2007-08
Est. Act.
$ million | | | 2008-09
Budget
$ million |
| | |
| | |
Total Capital Expenditure | | 14,285 | | | 17,008 |
Less Capital Grants (Funded from Operating Revenue) | | 843 | | | 860 |
Add Council water asset purchases 2 | | 429 | | | 1,459 |
Net State Capital Funding Task | | 13,871 | | | 17,607 |
Funding Sources | | | | | |
Cash Flows from Operating Activities | | 3,252 | | | 5,767 |
Less Reinvestments 3 | | (726 | ) | | 1,085 |
Equals Net Cash Flow for Capital Acquisitions | | 3,978 | | | 4,682 |
| | |
Asset Sales | | 452 | | | 432 |
Borrowings and Advances | | 9,326 | | | 10,904 |
Cash Balances and Other Financing Sources | | 115 | | | 1,590 |
| | |
Total Funding Sources | | 13,871 | | | 17,607 |
Notes:
| 1. | Numbers may not add due to rounding. |
| 2. | Does not include bulk water assets owned by Sunwater and the Department of Natural Resources and Water. Numbers are subject to change, with finalisation expected to occur by 30 June 2008. |
| 3. | Primarily reflects reinvestment of General Government investment earnings relating to accruing entitlements. |
183
Table 1.3 outlines capital outlays in 2008-09 by entity for each statistical division.
Table 1.3
Total Capital Outlays by Entity within Statistical Division for 2008-091
| | | | | | | | | | | | | | |
Entity2 | | 05
Brisbane
$’000 | | 07
G/Coast
$’000 | | 09
S/Coast
$’000 | | 12
W/Moreton
$’000 | | 15
W/Bay
$’000 | | 20
D/Downs
$’000 | | 25
S/West
$’000 |
Child Safety | | 14,616 | | 4,171 | | 2,365 | | 591 | | 2,168 | | 1,807 | | 197 |
Communities | | 50,836 | | 8,403 | | 4,764 | | 3,703 | | 5,367 | | 3,639 | | 397 |
Corrective Services | | 25,670 | | 200 | | 400 | | 197,664 | | 400 | | 400 | | 0 |
Disability Services Queensland | | 36,022 | | 7,118 | | 4,036 | | 1,009 | | 5,952 | | 3,600 | | 336 |
Education, Training and the Arts | | 531,004 | | 143,094 | | 44,769 | | 9,365 | | 24,196 | | 20,576 | | 2,534 |
Emergency Services | | 87,120 | | 19,633 | | 8,191 | | 1,336 | | 6,478 | | 5,692 | | 1,685 |
Environmental Protection Agency | | 12,630 | | 4,565 | | 320 | | 2,170 | | 5,490 | | 1,086 | | 361 |
Health | | 555,965 | | 175,532 | | 100,608 | | 818 | | 8,733 | | 1,968 | | 7,547 |
Housing | | 208,592 | | 51,694 | | 23,836 | | 3,327 | | 26,362 | | 20,617 | | 1,978 |
Infrastructure and Planning | | 922,804 | | 604,562 | | 273,450 | | 177,230 | | 398,220 | | 6,668 | | 0 |
Justice and Attorney-General | | 323,801 | | 1,373 | | 779 | | 194 | | 715 | | 596 | | 65 |
Legislative Assembly of Queensland | | 3,553 | | 0 | | 0 | | 0 | | 0 | | 0 | | 0 |
Local Government, Sport and Recreation | | 69,083 | | 14,484 | | 9,765 | | 2,001 | | 7,338 | | 26,632 | | 667 |
Main Roads | | 1,923,917 | | 240,404 | | 181,248 | | 21,821 | | 124,361 | | 87,296 | | 27,813 |
Mines and Energy | | 889,317 | | 144,654 | | 42,069 | | 125,852 | | 462,249 | | 180,697 | | 90,423 |
Natural Resources and Water | | 36,197 | | 122,140 | | 22,140 | | 22,315 | | 15,032 | | 35,790 | | 2,268 |
Police | | 131,447 | | 35,768 | | 17,715 | | 2,685 | | 12,916 | | 8,203 | | 5,435 |
Premier and Cabinet | | 101,011 | | 0 | | 0 | | 0 | | 0 | | 0 | | 0 |
Primary Industries and Fisheries | | 24,018 | | 3,524 | | 1,998 | | 1,619 | | 1,831 | | 2,526 | | 166 |
Public Works | | 269,677 | | 39,927 | | 20,162 | | 2,791 | | 10,232 | | 8,527 | | 930 |
Tourism, Regional Development and Industry | | 134,218 | | 4,123 | | 69 | | 17 | | 64 | | 53 | | 6 |
Transport | | 1,551,443 | | 258,188 | | 139,994 | | 3,245 | | 219,977 | | 5,897 | | 4,070 |
Treasury | | 32,340 | | 0 | | 0 | | 0 | | 0 | | 0 | | 0 |
Other3 | | 2,076 | | 84 | | 48 | | 12 | | 44 | | 37 | | 4 |
Anticipated Capital Contingency Reserve | | | | | | | | | | | | | | |
| | | | | | | | | | | | | | |
Funds Allocated | | 7,937,357 | | 1,883,641 | | 898,726 | | 579,765 | | 1,338,125 | | 422,307 | | 146,882 |
| | | | | | | | | | | | | | |
184
Table 1.3
Total Capital Outlays by Entity within Statistical Division for 2008-091
| | | | | | | | | | | | | | |
Entity2 | | 30
Fitzroy
$’000 | | 35
C/West
$’000 | | 40
Mackay
$’000 | | 45
Northern
$’000 | | 50
F/North
$’000 | | 55
N/West
$’000 | | Totals
$’000 |
Child Safety | | 1,609 | | 99 | | 1,281 | | 1,675 | | 2,004 | | 263 | | 32,846 |
Communities | | 3,242 | | 199 | | 2,580 | | 25,598 | | 4,036 | | 529 | | 113,294 |
Corrective Services | | 960 | | 0 | | 0 | | 51,514 | | 122,828 | | 450 | | 400,486 |
Disability Services Queensland | | 3,443 | | 168 | | 2,186 | | 3,924 | | 3,419 | | 448 | | 71,662 |
Education, Training and the Arts | | 24,717 | | 2,163 | | 27,996 | | 30,515 | | 62,947 | | 5,838 | | 929,713 |
Emergency Services | | 6,838 | | 223 | | 4,233 | | 8,639 | | 9,043 | | 1,525 | | 160,637 |
Environmental Protection Agency | | 3,569 | | 965 | | 3,590 | | 2,763 | | 6,461 | | 764 | | 44,734 |
Health | | 52,515 | | 436 | | 9,090 | | 27,356 | | 75,516 | | 8,175 | | 1,024,259 |
Housing | | 25,661 | | 586 | | 22,435 | | 33,859 | | 79,595 | | 18,344 | | 516,884 |
Infrastructure and Planning | | 33,858 | | 0 | | 12,992 | | 9,546 | | 8,100 | | 2,500 | | 2,449,929 |
Justice and Attorney-General | | 530 | | 32 | | 422 | | 552 | | 3,526 | | 87 | | 332,672 |
Legislative Assembly of Queensland | | 0 | | 0 | | 0 | | 0 | | 0 | | 0 | | 3,553 |
Local Government, Sport and Recreation | | 5,448 | | 334 | | 52,209 | | 80,460 | | 212,795 | | 889 | | 482,107 |
Main Roads | | 74,837 | | 24,535 | | 135,714 | | 191,334 | | 164,464 | | 37,408 | | 3,235,154 |
Mines and Energy | | 381,536 | | 78,436 | | 319,295 | | 176,101 | | 141,144 | | 91,699 | | 3,123,471 |
Natural Resources and Water | | 31,485 | | 1,475 | | 22,831 | | 2,537 | | 7,363 | | 13,715 | | 335,288 |
Police | | 12,755 | | 957 | | 12,650 | | 12,366 | | 29,352 | | 1,193 | | 283,442 |
Premier and Cabinet | | 0 | | 0 | | 0 | | 0 | | 0 | | 0 | | 101,011 |
Primary Industries and Fisheries | | 1,360 | | 83 | | 1,082 | | 1,415 | | 1,692 | | 222 | | 41,536 |
Public Works | | 7,597 | | 465 | | 7,707 | | 17,823 | | 61,757 | | 1,240 | | 448,835 |
Tourism, Regional Development and Industry | | 47 | | 3 | | 38 | | 49 | | 295 | | 8 | | 138,990 |
Transport | | 236,290 | | 3,161 | | 993,935 | | 89,544 | | 132,870 | | 14,094 | | 3,652,710 |
Treasury | | 0 | | 0 | | 0 | | 0 | | 0 | | 0 | | 32,340 |
Other3 | | 33 | | 2 | | 26 | | 34 | | 41 | | 5 | | 2,445 |
Anticipated Capital Contingency Reserve | | | | | | | | | | | | | | -950,000 |
| | | | | | | | | | | | | | |
Funds Allocated | | 908,330 | | 114,322 | | 1,632,292 | | 767,604 | | 1,129,248 | | 199,396 | | 17,007,998 |
| | | | | | | | | | | | | | |
Notes
| 1. | Numbers may not add due to rounding. |
| 2. | Includes associated statutory bodies. Capital works outside of Queensland are not included in the 2008-09 capital program. |
| 3. | Includes the Department of Employment and Industrial Relations, Electoral Commission of Queensland, Office of the Governor, Office of the Ombudsman and Queensland Audit Office. |
185
The Queensland statistical divisions are shown in Chart 1.3 below.
Chart 1.3
Queensland Statistical Divisions, 2008-09
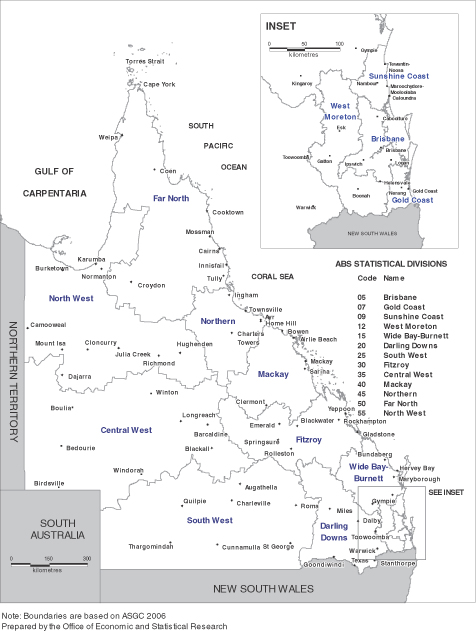
186
2. STATE CAPITAL PROGRAM—PLANNING AND PRIORITIES
INTRODUCTION
The Queensland Government is committed to creating the infrastructure necessary to support the economic and social development of the State. It does so:
by providing infrastructure in support of core service delivery priorities—General Government sector investment
through investments made by commercial entities of Government, including Government-owned corporations (GOCs) – Public Non-financial Corporations (PNFC) sector investment
where appropriate, by fostering private sector investment
This chapter outlines key capital planning and expenditure priorities for the 2008-09 Budget.
Further details on the current status of projects with private sector involvement are provided in Chapter 3 of this Budget Paper.
CAPITAL PLANNING AND PRIORITIES
Capital investment decisions are predominantly driven by the policy priorities of Government and factors such as demographic changes and planning requirements which affect service delivery needs.
The Government has several mechanisms available to deliver the capital needed to support its priorities. These include funding and constructing its own infrastructure and providing capital grants to local government, the private sector and profit and not-for-profit organisations to build capital and provide services on behalf of the Government. The Government also examines private sector involvement in public infrastructure delivery either through joint ventures or stand alone projects.
During the planning and business case phase for each project, the Government carefully analyses which delivery option represents best value for money.
Investments made by the PNFC sector also contribute significantly to the State capital program. Entities in the PNFC sector operate on a commercial basis and, as such, their capital programs are developed on the basis of needs identified within the market sectors serviced by these entities.
There are a number of ways in which capital expenditure by the PNFC sector can be funded, including cash flows from the entities themselves, borrowings and, in certain circumstances, dividend reinvestment or equity injection from shareholding Ministers.
The method of financing utilised for capital investment by the PNFC sector is dependent upon the individual circumstances of the relevant entity and the specific nature of the project in question.
South East Queensland Infrastructure Plan and Program
The South East Queensland Infrastructure Plan and Program 2008-2026 (SEQ Infrastructure Plan) outlines the Government’s infrastructure priorities to support the SEQ Regional Plan to 2026 and represents an unprecedented long term commitment to capital works in South East Queensland.
The SEQ Infrastructure Plan has undergone a major review to keep pace with the changing needs of the region.
The 2008 major review of the SEQ Infrastructure Plan involved a comprehensive analysis of the previous plan, project cost estimates, priorities and sequencing, integrating input from local government and industry, considering impacts on industry, and taking into account implications of other emerging issues.
187
The reviewed plan moves the infrastructure program into a stabilisation phase until 2026, providing long term security for industry to gear up to deliver a sustained expansion of project activity.
Highlights of the $107 billion 2008-2026 SEQ Infrastructure Plan include:
$83.5 billion in road, rail and public transport projects
$8 billion in water infrastructure projects
$3.5 billion spending on energy networks (over five years)
$12 billion in social and community infrastructure
2008-09 HIGHLIGHTS
The Government is committed to continuing to develop Queensland’s infrastructure base. Highlights of capital spending in 2008-09 are outlined in this section.
Water
The Government is continuing to address the unprecedented demand placed on water supplies as a result of a growing population and the worst drought on record in South East Queensland through the development of a range of major water infrastructure projects.
These projects will increase the supply of water and improve use of existing water resources to ensure a safe and sustainable water supply for the region well into the future.
The Government is also progressing a number of key regional water projects.
In 2008-09 the Government will invest over $2.5 billion in water infrastructure across the state.
South East Queensland
The Government is constructing a water grid to connect water storages throughout South East Queensland, allowing water to be moved around the region to meet demand in the area of highest need. The 2008-09 capital works program includes $217.4 million for continued construction of the Southern Regional Water Pipeline between Brisbane and the Gold Coast, due to be completed in 2008.
Funding of $236.5 million is allocated in 2008-09 to complete corridor assessments surveys and a range of studies to support preliminary engineering design and construction works for the Northern and Eastern Pipeline Interconnectors.
In 2008-09, funding of $531.8 million is allocated to progress the development of two dams in South East Queensland. The Wyaralong Dam on Teviot Brook, which is scheduled for completion in 2011, is the centrepiece of water storage initiatives on the Logan-Albert River catchment. The Wyaralong Dam and the Cedar Grove Weir will yield 21,000 megalitres per annum for South East Queensland. The first stage of the Traveston Crossing Dam on the Mary River, which is scheduled for completion in 2011, involves the construction of a 153,000 megalitre dam which will deliver up to 70,000 megalitres per annum.
The Western Corridor Recycled Water Scheme, the largest recycled water project in the southern hemisphere, is due for completion in 2008. The 2008-09 capital program includes funding of $795 million for water treatment plants and 200 kilometres of pipeline.
Construction of the $1.209 billion South East Queensland (Gold Coast) Desalination Plant at Tugun is due to be completed in 2008 and will deliver up to 125 megalitres per day. This project is currently a joint project between the State Government and the Gold Coast City Council. However, the State will purchase the Council’s shares in the project by 30 June 2008 to acquire full ownership of the asset.
188
State-wide
Water security across the state remains a critical issue. The acquisition of land for future water infrastructure projects will continue with $41.9 million allocated in 2008-09 for strategic land purchases relating to the Nathan and Connors River dams. SunWater will progress feasibility investigations and prepare business cases for a number of key regional water projects identified in the Program of Works for the Statewide Water Grid. This work will include expenditure of $31.8 million on feasibility investigations and the preparation of business cases for the Nathan Dam, Connors River Dam, Fitzroy Weir and Water for Bowen projects.
Transport and Roads Infrastructure
In 2008-09, capital funding of $6.968 billion is provided for transport and roads infrastructure, including Queensland Transport, the Department of Main Roads, Airport Link, QR Limited, the port authorities, RoadTek and Queensland Motorways Limited.
Transport
Total capital outlays for the Transport portfolio in 2008-09 will be $3.653 billion, representing a 47% increase in capital expenditure compared with the 2007-08 Budget. This includes $700 million for Queensland Transport.
Highlights of the 2008-09 Queensland Transport capital program include:
$204.5 million towards construction of the Northern Busway between the Royal Children’s Hospital and Kedron
$60.3 million towards construction of an Eastern Bus way corridor connection from the Eleanor Schonell Bridge to Ipswich Road with stations at Park Road and the Princess Alexandra Hospital
$50 million towards construction of the Eastern Busway: Princess Alexandra Hospital to Buranda. Construction will include an elevated busway station within the Princess Alexandra Hospital and will be a key link in the regional busway network
$33.7 million towards the construction of cycle links to enhance the cycle network in South East Queensland. This funding comprises $10.3 million towards the construction of state-owned cycle links and $23.4 million in grants to local authorities
Rail and Ports
In the last 12 years, the nature of the transport industry has fundamentally changed. Competitive reforms have been introduced and a nationally integrated transport market is emerging. This has had the effect of combining all transport modes (road, rail and ports) to improve efficiencies in transport logistics.
An efficient, integrated transport process maximises the efficiency of the flow of goods, increases returns to the State and makes importers and exporters more competitive in an increasingly competitive global market.
Exports are a key driver for the Queensland economy with coal being the single most important mineral commodity exported. Coal exports to Queensland’s largest trading partners are continuing to increase with strong economic growth in China and India resulting in significant growth in demand from the coal-reliant steel and electricity production sectors.
In the past decade, Queensland, as the supplier of almost 58% of Australia’s coal exports, has increased the volume of its coal exports by 50% and its value by 76%. This strong demand is forecast to continue with Queensland’s coal exports predicted to grow by approximately 42% by 2010 and a further 40% by 2015.
In response to these coal demand forecasts, in February 2008 the Queensland Government launched a $5.4 billion Coal Transport Infrastructure Investment Program (the Program) which involves significant investment in government owned rail and port infrastructure as well as major investments by private coal terminal operators.
189
The Program, outlined in the document Queensland coal transport – planning for growth, sets out Queensland’s current port and rail capacities, likely expansions by 2015 and possible expansions by 2020 where demand warrants. Port expansions could provide export capacity of over 300 million tonnes per annum (mtpa) by 2015 and over 400 mtpa by 2020. Rail expansions could provide similar additional capacity.
In particular, QR Limited, the Ports Corporation of Queensland Limited and Gladstone Ports Corporation are investing in coal-related infrastructure that will ensure that the capacity of the export supply chain is maximised. Funding is also being provided for major investments in port infrastructure to meet expected demand for other Queensland export and import trades.
Major rail and port capacity expansions currently in an advanced stage of planning include the Wiggins Island Coal Terminal, the Surat Basin Rail Project, Blackwater rail upgrade, the Abbot Point Coal Terminal expansion (works are underway) and the Goonyella to Abbot Point Expansion project (including the Northern Missing Link). In addition to bulk commodity and containerised trade facilitated by rail and seaports, Queensland Transport GOCs also deliver services in passenger rail. Significant investment in both track infrastructure and rollingstock for Citytrain services is being undertaken in 2008-09.
Continued growth in the low-cost carriers segment of the Australian aviation industry has resulted in sustained growth in domestic passenger numbers through key Queensland airports, driving the need for investment.
Highlights of the 2008-09 rail and ports capital program include:
coal network—$576.4 million will be spent on additional track works on the coal network in Central Queensland. Specific projects include the Goonyella to Abbot Point (GAP) expansion project which includes the Northern Missing Link (subject to approvals) and the Jilalan Rail Yard Upgrade. This expenditure will allow for additional coal haulage capacity on the network. A further $303.7 million will be spent on new and upgraded coal rollingstock, including additional electric and diesel electric locomotives and coal wagons, to support the increased haulage of coal in Central Queensland.
Citytrain track infrastructure upgrades—$565.4 million to extend the Citytrain track network and track upgrades (including Springfield and Robina to Varsity Lakes rail lines, Corinda to Darra third track, Caboolture to Beerburrum duplication).
Citytrain rollingstock—$132.2 million for additional rollingstock for Citytrain service enhancements.
Cairns airport—$67.1 million for redevelopment of the Domestic Terminal Building.
Abbot Point coal terminal—$70 million to increase the capacity of Abbot Point to 25 million tonnes (mt). A further $250 million will be spent on the Abbot Point X50 Expansion, which will increase capacity to 50 mt.
Gladstone port—$18.3 million of ongoing works at the RG Tanna Coal Terminal, $4.3 million for air quality initiatives and $5 million on detailed engineering and commercial feasibility investigations for the proposed Wiggins Island Coal Terminal.
Port of Brisbane—$23.5 million on construction of berth and wharf 11 and 12 at Fisherman Islands to accommodate increasing trade throughput and $29.4 million on completing the general purpose berth. To ensure all weather access to the Port of Bundaberg, $6 million will be spent on the construction of a bridge across the Burnett River.
Port of Townsville—$19.8 million for the acquisition of infrastructure and port improvements during 2008-09.
Mackay port—$4.7 million to build a storage and distribution facility for the importation of fertiliser.
190
Roads
In 2008-09, capital funding of $3.235 billion is provided through the Main Roads portfolio. Highlights of the 2008-09 roads capital program include:
$537.6 million to construct a second Gateway Bridge crossing and to increase capacity on the Gateway Motorway, between Mt Gravatt-Capalaba Road and Nudgee Road, at a total estimated cost of $1.883 billion.
$150 million towards construction of the new Houghton Highway Bridge between Brighton and Redcliffe, at a total estimated cost of $315 million.
$200 million towards the federally-funded Ipswich Motorway upgrade between Wacol and Darra, $100 million to complete the upgrade of the Ipswich/Logan Motorway interchange and $20 million for planning and land acquisitions for the upgrade of the Ipswich Motorway to six lanes between Dinmore and Goodna.
$24 million in federal funding to widen the Bruce Highway in Gympie to four lanes between Kidgell Street and Pine Street, at a total estimated cost of $70.8 million.
$50 million to improve flood immunity on the federally-funded Bruce Highway between Corduroy Creek and Tully High School, at a total estimated cost of $172.4 million.
$42.3 million towards Stages 2 and 3 of the Townsville Ring Road, at a total estimated cost of $119.2 million ($39.8 million—State; $79.5 million—Australian Government).
$34.5 million towards construction of the Bundaberg Ring Road, at a total estimated cost of $92 million. The Ring Road will provide an alternative route from the Isis Highway to the industrial area and the port to the east of Bundaberg City and ease congestion.
Energy
Queensland’s annual electricity consumption over the last three years averaged approximately 50,600 GWh. Electricity consumption in Queensland is expected to grow at an annual average of 3.9% over the next three years to 2010-11 in accordance with the medium economic growth (50% Probability of Exceedance) projection of the 2007 Statement of Opportunities of the National Electricity Market Management Company.
This growth is driven to a large extent by the resources boom and an increase in population, economic activity and use of air-conditioners. The growth in energy consumption has been more significant in South East Queensland, due to the concentration of population and industry.
The 2007 Powerlink Annual Planning Report indicates that the south east region had an average annual population growth of 4.6% over the last three years and it is expected that the forecast energy consumption will grow by an average of 4.4% over the next three years to 2010-11.
Investment in electricity infrastructure continues to be driven by peak demand. While demand management strategies are being explored as medium to long term responses, significant capital investment in the electricity sector is required to ensure the sector continues to meet demand. The Government’s ongoing commitment to the findings and recommendations of the Electricity Distribution and Service Delivery review is also a key driver of the electricity capital expenditure program.
No new generation investment by State-owned generators is planned for 2008-09 as existing capacity will meet reliability and demand requirements, particularly with the recently commissioned state-of-the-art Kogan Creek Power Station adding another 750 megawatts of generation capacity.
The private sector continues to make significant investment in generation capacity in the state. An additional 1,516 megawatts of capacity will be added to the state’s electricity supply over the 2009-10 period as gas-fired plants currently being developed at Mt Stuart, Braemer, Darling Downs, Condamine and Yarwun are progressively commissioned.
191
Powerlink will invest $675.4 million on new transmission infrastructure and augmentation, while ENERGEX and Ergon Energy will similarly invest a total of $1.916 billion on the distribution networks to maintain reliable and secure transmission and distribution electricity networks across the state. The forecast network expenditure has been recognised by both the Australian Energy Regulator and the Queensland Competition Authority in their current regulatory determinations. Altogether, a total of $2.971 billion has been budgeted to be spent in 2008-09 by the Government owned electricity corporations on plant and network overhauls, maintenance and augmentation. This will ensure that the State’s electricity assets and infrastructure continue to maintain secure and reliable supply and are well positioned to meet forecast growth in demand.
Highlights of the 2008-09 electricity capital program include:
generation sector: the primary focus will be capital works to ensure ongoing generation plant reliability and efficiency. CS Energy will spend $110 million on improvements to the Callide power station, including overhauls and major refurbishment work on the B station mid-life refit and $59.8 million on improvements to the Swanbank power station. Stanwell will spend $61.6 million on comprehensive maintenance works and plant upgrades of Stanwell, Barron Gorge and Kareeya power stations.
Similarly, Tarong Energy will spend $118.1 million on maintenance and improvements at the Wivenhoe, Tarong and Tarong North power stations. Tarong Energy will also spend $86.1 million on the Kunioon coal mine to provide a secure future source of fuel for Tarong and Tarong North power stations.
transmission sector: Powerlink will undertake major transmission augmentation and new capital works of $675.4 million to reinforce electricity supply and maintain a secure and reliable transmission network across the state.
distribution sector: ENERGEX and Ergon energy have budgeted network and non-system capital expenditure of $911.1 million and $1.004 billion respectively for the augmentation and maintenance of the distribution network and to improve the security and reliability of electricity supply in their respective regions.
Health
In 2008-09, the Government continues its significant investment in health infrastructure with a $1.024 billion capital program. The focus for 2008-09 includes investment in new hospitals, hospital redevelopments, demand management, staff accommodation and the development of Community Health Centre infrastructure. The program includes the redevelopment of the Cairns, Mackay and Mt Isa Hospitals, which are to be funded through the recently announced airport sales. The capital program also includes SEQ Infrastructure Plan projects such as the Gold Coast University Hospital, Sunshine Coast Hospital, Queensland Children’s Hospital, additional bed capacity in the Sunshine Coast Health Services District, Robina Hospital expansion and North Lakes Health Precinct.
Housing
In 2008-09, $125 million from the Queensland Future Growth Fund will boost the $516.9 million capital program for the Department of Housing. This investment will assist to address the growing need for affordable and appropriate accommodation and to realign the mix of dwellings to provide a better match to client needs.
This will bring the value of Queensland’s social housing asset base to approximately $12.4 billion.
A range of other initiatives totalling $53.4 million will be progressed to respond to housing needs of people who require particular assistance. The funds include providing appropriate housing responses to people being discharged from the Spinal Injuries Unit of the Princess Alexandra Hospital, people with mental illness, homeless people and Indigenous people living in regional and remote locations.
192
Education and Training
The education capital works program will total $532 million (including an expense component of $82.9 million) and $190 million ($48 million of which is expensed) invested in vocational education and training capital initiatives.
Almost half of the education capital works budget will be used to provide facilities for population growth areas across the state. A total of $234.9 million will be spent on construction of new schools, further staged work at existing schools, acquisition of land and provision of additional classrooms and toilets.
The Government’s $1 billion Tomorrow’s Schools initiative, to deliver new and renewed facilities that support modern teaching methods in older schools, will continue with $150 million invested during 2008-09. In addition, $111.2 million will be used to replace and enhance learning facilities in existing schools across the state.
2008-09 is the third year of the implementation of the Queensland Skills Plan, which included a six-year infrastructure program worth over $300 million. The Budget provides $120 million (including an expense component of $22 million) for the construction and refurbishment of TAFE training facilities, including $30.6 million for continuing the SkillsTech Australia Acacia Ridge campus and $24.1 million for planning and construction of SkillsTech campuses at Townsville and Mackay. This capital works program is supported by investment of over $41 million in ICT and other training equipment.
The Government continues to investigate non-traditional arrangements for the delivery of education and training capital works. A public-private partnership arrangement has been utilised to deliver the South Brisbane campus of the Southbank Institute of Technology and Government is examining a similar approach to deliver a package of seven new schools in South East Queensland.
QUEENSLAND FUTURE GROWTH FUND
The Queensland Future Growth Corporation was created as a corporation sole under the Future Growth Fund Act 2006 to administer the Queensland Future Growth Fund. The Queensland Future Growth Fund was established by investing the proceeds from the sale of Sun Retail, Sun Gas, Powerdirect Australia and the Allgas network which amounted to over $3 billion.
The funds will be used to secure the state’s future economic growth and the state’s environmental sustainability through a range of new infrastructure projects.
Recent achievements
Collected and invested the remaining proceeds from the sale of ENERGEX’s electricity and gas retail businesses, the Allgas distribution network and the competitive elements of Ergon Energy’s electricity retail business, including Ergon Energy’s subsidiary, Powerdirect.
Allocated $315.2 million towards transport infrastructure, social housing stock, clean coal technology and the Innovation Building Fund.
Future developments
Over the coming years, the Fund will continue to deliver the following key priorities:
constructing and accelerating vital infrastructure projects in the areas of transport and roads, with $177 million forecast to be allocated from the Fund in 2008-09 water projects are forecast to receive $567.4 million from the Fund during 2008-09
funding for clean coal technology that will make a proactive and positive contribution to the science and technology of reducing greenhouse gas emissions funding for the Renewable Energy Fund and the Queensland Smart Energy Savings Fund to combat the effects of climate change
193
contributing towards the Innovation Building Fund to capitalise on previous investment in research and development infrastructure and to further develop in areas of comparative advantage
supporting commercial infrastructure with details on projects to be determined by future priorities and commercial negotiations and
continuing to fund the Department of Housing for a major expansion of the State’s social housing stock.
Proceeds from sales of the Mackay, Cairns and Brisbane Airports will be transferred to the Queensland Future Growth Fund for allocation to the redevelopment of the Mackay, Cairns and Mt Isa Base Hospitals.
The fund will also benefit from interest earnings on the Fund balance.
Table 2.1 shows the allocation of the Fund towards various projects.
Table 2.1
Queensland Future Growth Fund Projects1
| | | | | | | | | |
| | | Total
allocation
$ million | | 2007-08
Budget
$ million | | 2007-08
Est. Act.
$ million | | 2008-09
Estimate
$ million | |
Transport infrastructure | | 500.0 | | 156.0 | | 151.2 | | 177.0 | |
Water infrastructure2 | | 1,000.0 | | — | | — | | 567.4 | |
Clean coal technology | | 300.0 | | 56.8 | | 66.8 | | 19.4 | |
Climate change projects3 | | 100.0 | | 20.0 | | — | | 32.0 | |
Smart State projects | | 100.0 | | 15.0 | | 12.2 | | 20.0 | |
Commercial infrastructure including Government-owned corporations | | 600.0 | | — | | — | | 50.0 | 4 |
Social housing stock | | 500.0 | | 85.0 | | 85.0 | | 125.0 | |
Total | | 3,100.0 | | 332.8 | | 315.2 | | 990.8 | |
| | | | | | | | | |
Notes:
| 1. | The redevelopment of the Mackay, Cairns and Mt Isa Base hospitals will be reflected following the finalisation of the airport sales in Mackay and Cairns and the Government’s stake in the Brisbane Airport Corporation Limited. |
| 2. | The 2008-09 Estimate reflects the provision of funding to the South East Queensland bulk water entities. |
| 3. | The Renewable Energy Fund and the Queensland Smart Energy Savings Fund were established during 2007-08 however funding will not be required from the Fund until 2008-09. |
| 4. | This funding represents the 2008-09 component of a $100 million funding package to be provided to the Abbott Point Coal Terminal expansion. |
194
3. PRIVATE SECTOR CONTRIBUTION TO THE DELIVERY OF PUBLIC INFRASTRUCTURE
INTRODUCTION
The Government believes that private sector participation in the provision of public infrastructure can assist the timely delivery of efficient and effective infrastructure to the Queensland community.
Currently, the Government is considering several infrastructure projects to be explored as potential Public Private Partnerships (PPP) under its Value for Money Framework. In addition to those projects being assessed under the Framework, other major infrastructure projects with private sector involvement are also being progressed through partnering with the private sector as well as via more traditional delivery methods.
The Supported Debt Model
The Government is currently progressing the South East Queensland Schools Project, utilising the Supported Debt Model (SDM).
The Supported Debt Model is a financing variant of the 100% privately financed PPP Model which seeks to deliver a better value for money solution for the State. Under the SDM, Queensland Treasury Corporation will provide the notionally risk free portion of the Project’s financing requirements during a project’s operations phase, in the form of first ranked senior debt.
The rationale behind the SDM is that, once the construction phase has been completed, the project risk exposure reduces significantly and the probability of any senior debt not being repaid in the event of termination (including for contractor default) is relatively low. Therefore, a certain portion of the total senior debt (the supported debt element) can be assessed as notionally risk free and thus benefits from a risk free borrowing rate; that is, the Queensland Government’s cost of funds.
CURRENT PROJECTS
Toowoomba Bypass
The Queensland Government has recently completed a business case development Study for the Toowoomba Bypass project under the Value for Money Framework, with the assistance of the Australian Government. The Queensland Government is currently in discussion with the Australian Government in regards to its funding commitment for the project. The proposed bypass will provide a safer and faster range crossing, removing the majority of heavy vehicles from city streets and the existing range road.
Southbank Education and Training Precinct Project
Queensland’s first PPP, which in 2007 was awarded ‘Best Global Project’ by the international Public Private Finance Awards, is due for completion in late 2008. The project involves construction of 11 new buildings and renovation of another four buildings on the South Bank campus.
Gold Coast Rapid Transit Project
A quality public transport system from Helensvale to Broadbeach and through to Coolangatta is identified in the SEQ Infrastructure Plan. The Government is currently developing a business case under the Value for Money Framework for stage one of this project (Helensvale to Broadbeach).
This business case will consider several transport modes including Light Rail Transit and Bus Rapid Transit, as well as the project delivery option best suited to achieving a value for money outcome for the state by optimising the allocation of construction, operation, maintenance and financing risks. The business case is expected to be completed by mid 2008.
195
South East Queensland Schools
The Government has announced that it will deliver up to seven new schools in South East Queensland through a PPP, utilising the SDM financing variant on the traditional 100% privately financed PPP. The SDM uses public sector debt for the risk free portion of the financing requirement during the low risk operational phase of the Project.
Following an expressions of interest process, the Government has requested binding bids for the partial financing, master planning, design, construction, maintenance and provision of specified facilities management services for the new schools for a concession period expected to be approximately 30 years. At the end of the concession period, the leasing arrangements would expire and the schools revert to the State. It is anticipated that construction of the schools will commence in 2009, with the first of the schools ready for use by the start of the 2010 school year.
Sunshine Coast Hospital
The Government is currently undertaking market sounding for a proposed 650 bed tertiary hospital at Kawana on the Sunshine Coast, which is planned to be operational by 2014. The hospital is being developed under the Value for Money Framework and the Government considers that there is potential for the project to be delivered as a PPP. A detailed business case will be developed in 2008, following the outcomes of a market sounding process.
Airport Link and Northern Busway
In October 2006, the Government approved the business cases for the Airport Link and Northern Busway projects, and approved the joint procurement of the Airport Link as a PPP and the Northern Busway (Windsor to Kedron) via traditional delivery. The Airport Link is proposed to be a mainly underground toll road that connects the North South Bypass Tunnel, Inner City Bypass and local road network at Bowen Hills to the northern arterials of Gympie Road and Stafford Road at Kedron and Sandgate Road and the East-West Arterial in the north-east. The Northern Busway is a two-lane, two-way dedicated busway proposed to connect the existing Inner Northern Busway with the Royal Children’s Hospital at Herston to Bracken Ridge. Following a competitive process, BrisConnections, a consortium of Macquarie Capital Group, Thiess and John Holland, was announced as preferred bidder for the project on 19 May 2008. Construction of the projects will commence in 2008-09 and it is anticipated that the projects will be operational in 2012.
Gateway Upgrade Project
The Gateway Upgrade Project involves the duplication of the Gateway Bridge and the upgrade of 20 kilometres of the Gateway Motorway from Mount Gravatt-Capalaba Road to Nudgee Road. The project is being delivered by Queensland Motorways Limited under a design, construct and maintain contract (including a 10 year maintenance period) in a partnership agreement between the Department of Main Roads and the Leighton Abigroup Joint Venture.
The project is progressing according to schedule and budget, with sections of the upgrade to be opened progressively to traffic. The new section of the upgrade for southbound traffic from Port of Brisbane Motorway to Wynnum Road is now open, with the new bridge scheduled to be open by late 2010.
State Tennis Centre—Tennyson Riverside Development
Following a competitive bidding process, the Government selected Mirvac as the preferred developer for the delivery of an international standard State Tennis Centre and residential development at Tennyson.
Situated in one of Brisbane’s most scenic locations, the development will include a state-of-the-art tennis and residential complex which integrates with the surrounding area.
196
The State Tennis Centre is estimated to cost $82 million. It is on schedule to be completed in time for the staging of the Brisbane International Tennis Championship in January 2009 and will be managed by Stadiums Queensland.
North Bank
The Government has announced an Enquiry by Design process to bring together a range of professionals in design and construction, as well as stakeholders, to adopt a consultative and creative approach to the North Bank project. The consultation with professional and stakeholder representatives will help determine an acceptable development of North Bank that will enhance public space and improve community facilities in the stretch of the Brisbane central business district waterfront. The aim of the North Bank project is to complement the existing South Bank development, further enhance Brisbane’s reputation as the ‘River City’ and deliver the outcome at no cost to the Government.
Whitsunday Region Airport
The Government is undertaking a competitive process to improve both domestic and international air access to the Whitsunday region. The Government has sought Expressions of Interest for infrastructure upgrades and operational improvements to deliver improved domestic air services and international air charter access at either the existing Whitsunday Coast Airport or the Laguna Whitsunday Airport.
A number of interested parties submitted Expressions of Interest in November 2007, and in March 2008 the Government announced a shortlist of bidders that will be invited to participate in the Binding Bid stage of the competitive process.
Urangan Boat Harbour
The Urangan boat harbour is the principal marine infrastructure for the Hervey Bay region. In response to growing demand in this area, the Government commenced a competitive bidding process to facilitate the development and expansion of the harbour precinct at no cost to the State. In May 2008, Watpac Seymour Joint Venture was selected as the preferred proponent for the development of the Urangan boat harbour precinct.
Gold Coast Marine Development Project
In September 2007, the Government commenced a two stage competitive process for the Gold Coast Marine Development Project. The project consists of two separate Expression of Interest processes for two parcels of state land on the Gold Coast Spit. The vision for the project includes:
a marina for super yachts, recreational and fishing vessels on the western side of The Spit
a tourism development on two parcels of crown land south of Sea World
the incorporation of an Aboriginal cultural centre and recognition of indigenous culture into the tourism experience on the Gold Coast
improved public recreational facilities in Doug Jennings Park and surrounding areas on The Spit
a protection and enhancement program for the 93 hectare Federation Walk and Nature Reserve areas east of Sea World Drive.
Expressions of Interest were received in November 2007. It is anticipated that preferred bidders for the two parcels will be selected in early 2009, with commencement of construction scheduled for late 2010.
Surat Basin Railway
In December 2006, the Government granted a Conditional Exclusive Mandate under its Value for Money Framework guidelines to a joint venture consortium to investigate the development of the Surat Basin Railway.
197
The proposed project would link the towns of Wandoan and Banana to the Port of Gladstone and would assist in the development of the Surat Basin coalfields.
The consortium, comprising Australian Tourism Export Council, Industry Funds Management, QR Limited, Xstrata and Anglo Coal, has completed the initial stage of its investigations, including the identification of a preliminary rail corridor, and is currently preparing a draft Environmental Impact Statement that will be available for public comment towards the end of 2008. Subject to meeting the conditions of the Exclusive Mandate, it is expected that financial close for the development of the railway will be achieved by 2009-10.
Aurukun Project
The Aurukun Bauxite Resource is situated in a parcel of land in western Cape York, south of Weipa. As part of an international competitive bidding process for the granting of development rights over the Aurukun Bauxite Resource, the Government selected the Aluminium Corporation of China Limited (CHALCO) to develop the Aurukun Project, including a mine and wash plant at Aurukun and an alumina refinery on the east coast of Queensland, at an estimated cost of $2.933 billion. The Government is seeking to optimise the economic, social and financial outcomes from the development of the bauxite resource and investment in downstream processing. An Indigenous Land Use Agreement between the traditional owners of Aurukun land, CHALCO and the Government has been entered into, allowing CHALCO to commence its feasibility study for the Aurukun Project. The Government has awarded the Aurukun Project Significant Project Status and CHALCO has commenced work on an Environmental Impact Statement for development of the mine at Aurukun.
Townsville Ocean Terminal
The Townsville Ocean Terminal is a key component in the implementation of the Queensland Cruise Shipping Plan and supports the potential economic benefits to Queensland and the Townsville region in particular, associated with the increased visits from both cruise vessels and Australian and foreign military vessels on rest and recreation visits.
Under a Development Agreement between the Government and developer, the project will provide Townsville with:
a dedicated cruise terminal and wharf to attract cruise ships and naval vessels, located on the Western Breakwater, adjacent to the Port of Townsville
an integrated residential and tourism development for the land surrounding the casino
a landscaped residential development, providing public access to the Breakwater and future green areas.
It is anticipated that construction of the terminal will commence in early 2009 and be completed by the end of 2010.
OTHER PRIVATE SECTOR INVESTMENT
There is significant private sector participation in the state’s energy sector, with the private sector currently owning 42.3% of total generation capacity, which will increase to 48.6% with the commissioning of five new gas-fired plants currently under construction. The private sector also has 50% interest in the Callide C and Tarong North power stations. CS Energy has also been involved in facilitating the development of gas sources through farm-in arrangements with private sector gas companies in the Surat basin and in northern New South Wales.
Queensland’s ports also have a number of projects involving private sector investment. The Port of Brisbane Corporation Limited will invest $536.6 million over five years in constructing new wharves 11 and 12 and establishing associated land works at Fisherman Islands. Hutchison Port Holdings Limited has entered into an agreement to lease the new container wharves and will become the third stevedore operating in Brisbane.
198
4. CAPITAL OUTLAYS BY ENTITY
DEPARTMENT OF CHILD SAFETY
The 2008-09 Budget provides for $32.8 million in capital expenditure for the Department of Child Safety. The capital program includes the establishment of residential care facilities, investment to enhance indigenous service delivery, ongoing investment in the Integrated Client Management Information System (ICMS), and progression of office accommodation solutions to meet service delivery requirements.
Program Highlights
| | • | | $4.1 million in 2008-09 to continue the establishment of safe houses in the Indigenous communities of Pormpuraaw, Kowanyama, Aurukun, Weipa/Napranum, Doomadgee, Yarrabah and Palm Island. Additional funding of $6.6 million over two years will also enable development of facilities to service the Indigenous Communities of Eastern Cape York, Torres Strait, Northern Peninsula Area (Bamaga, Seisia, New Mapoon, Umagico and Injinoo) and Mornington Island. The facilities provide a safe place for Indigenous children and young people to be housed during initial assessments and longer term residential care, allowing children to remain within their own communities. |
| | • | | $8.4 million in 2008-09 will be spent on residential care facilities. This includes increased funding of $5.8 million in 2008-09 ( $26.4 million over four years) to establish an additional 12 residential care facilities. These facilities will expand the range of placement options available for children and young people. |
| | • | | $5.6 million in 2008-09 will progress the establishment of therapeutic residential facilities in Cairns, Townsville and South East Queensland. These facilities will extend the department’s capacity to respond to children with complex behaviours and mental health issues, by providing intensive support services. |
| | • | | $5.9 million in 2008-09 ($14.1 million over four years) will support ongoing investment in ICMS and related information management systems. |
| | • | | $6.2 million will be invested in 2008-09 to progress office accommodation initiatives to support departmental staff located across the state. |
Child Safety
| | | | | | | | | | |
Project | | Statistical
Division | | Total
Estimated
Cost
$’000 | | Expenditure
to 30-06-08
$’000 | | Budget
2008-09
$’000 | | Post
2008-09
$’000 |
DEPARTMENT OF CHILD SAFETY | | | | | | | | | | |
| | | | | |
Property, Plant and Equipment | | | | | | | | | | |
Office accommodation | | Various | | | | | | 6,174 | | Ongoing |
Residential care facilities | | Various | | 30,677 | | 1,277 | | 8,350 | | 21,050 |
Therapeutic residential care facilities | | Various | | 7,685 | | 2,125 | | 5,560 | | |
Services for Indigenous Communities | | Various | | 22,060 | | 960 | | 4,070 | | 17,030 |
Minor works and other plant and equipment | | Various | | | | | | 1,279 | | Ongoing |
| | | | | | | | | | |
| | | | | |
Total Property, Plant and Equipment | | | | | | | | 25,433 | | |
| | | | | | | | | | |
| | | | | |
Other Capital Expenditure | | | | | | | | | | |
Information management systems | | Various | | | | | | 5,942 | | Ongoing |
Minor information systems | | Various | | | | | | 1,471 | | Ongoing |
| | | | | | | | | | |
| | | | | |
Total Other Capital Expenditure | | | | | | | | 7,413 | | |
| | | | | | | | | | |
| | | | | |
TOTAL DEPARTMENT OF CHILD SAFETY | | | | | | | | 32,846 | | |
| | | | | | | | | | |
199
COMMUNITIES
Program Highlights
The department’s capital expenditure program for 2008-09, including capital grants, is $113.3 million. This investment will continue to foster strong communities where all people are safe, valued and empowered, wherever they live, whatever their circumstances. These capital funds are being applied towards a range of strategies including:
| | • | | Refurbish decommissioned preschools into early childhood education and care services at Mackay, Beenleigh, Nerang, Toowoomba, Ayr and Beaudesert from a total budget of $15 million. |
| | • | | Early years centres at Browns Plains and Cairns, with Nerang and Caboolture scheduled for completion in 2008-09. The early years centres will provide high quality universal early childhood education, health and child care services, with some targeted services for vulnerable families from a total budget of $12.1 million. |
| | • | | $8.5 million allocated in 2008-09 for capital grants as part of the early years Best Start Strategy. |
| | • | | $2 million allocated in 2008-09 to continue the commitment to the improvement of youth justice services infrastructure development including youth justice conferencing; youth support services and enhanced program delivery. |
| | • | | $11.4 million is allocated to commence capital works for additional youth detention centre capacity in North Queensland, commencing operation in 2011-12. |
| | • | | Improve learning and development areas, physical security and accommodation at the Cleveland Youth Detention Centre in Townsville at a projected cost of $14.7 million over three years. |
| | • | | $15.3 million allocated in 2008-09 to complete the Brisbane Youth Detention Centre refurbishment and enhancement project. |
| | • | | $3.6 million to complete the construction of neighbourhood centres at Innisfail, Charters Towers, Marlin Coast and Maleny. |
| | • | | $1 million capital grant as a contribution to the replacement of the Hervey Bay Neighbourhood Centre. |
| | • | | $1.5 million allocated in 2008-09 to complete two multi tenant service centres in Toowoomba and Caboolture, with work being undertaken to refurbish a recently acquired site at Mackay from a total budget allocation of $4.1 million. |
| | • | | $3 million allocated in 2008-09 for community and neighbourhood centre upgrades, which includes disability access, air-conditioning and safety issues. |
| | • | | $6.4 million allocated in 2008-09 for the refurbishment of retail stores at Lockhart River and Palm Island, fuel facilities at Kowanyama and the procurement of plant and equipment. |
| | • | | $5.1 million in capital funding over three years for the establishment of safe havens in Cherbourg and Mornington Island. |
| | • | | $4 million allocated in 2008-09 to Smart Service Queensland initiatives to continue the development of key whole-of-Government systems across multiple agencies, and standardise and streamline Queensland Government services to enhance access and service delivery to the community. |
| | • | | $5.4 million allocated in 2008-09 for information communication technology equipment for Shared Information Solutions. |
| | • | | $2.9 million allocated in 2008-09 for the development of a new grants management system. |
| | • | | $8.6 million allocated in 2008-09 to further the development of the Information Renewal Initiative, primarily the Integrated Client Management System. |
200
| | • | | $2.5 million allocated in 2008-09 to capital upgrades at the Southern Outlook in Boonah (total funding of $4.9 million over two years). The Southern Outlook is the main headquarters and location for delivering programs for at risk youth. |
| | • | | $4.3 million allocated in 2008-09 towards capital upgrades at the Brisbane Children’s Court. |
Communities
| | | | | | | | | | |
Project | | Statistical
Division | | Total
Estimated
Cost
$’000 | | Expenditure
to 30-06-08
$’000 | | Budget
2008-09
$’000 | | Post
2008-09
$’000 |
DEPARTMENT OF COMMUNITIES | | | | | | | | | | |
| | | | | |
Property, Plant and Equipment | | | | | | | | | | |
Child Care enhancements | | Various | | 255 | | | | 255 | | |
Early Years education centres | | Various | | 15,048 | | 4,532 | | 3,116 | | 7,400 |
Early Years service centres | | Various | | 12,071 | | 3,894 | | 3,577 | | 4,600 |
Retail Store undertakings | | Various | | 9,736 | | 1,209 | | 6,375 | | 2,152 |
Neighbourhood Centre upgrades | | Various | | 6,553 | | 2,647 | | 3,006 | | 900 |
Shared Information Solutions ICT replacement program | | Various | | | | | | 5,360 | | Ongoing |
Smart Service Queensland | | Various | | 9,377 | | 5,831 | | 1,725 | | 1,821 |
Regional Accommodation Program | | Various | | 17,878 | | 17,233 | | 645 | | |
Brisbane Youth Detention Centre enhancements | | 05 | | 23,258 | | 7,214 | | 15,306 | | 738 |
Cleveland Youth Detention Centre enhancements | | 45 | | 14,676 | | 261 | | 7,448 | | 6,967 |
Youth Justice fitout and project management | | Various | | 1,421 | | | | 231 | | 1,190 |
Brisbane Children’s Court renovation | | 05 | | 4,709 | | 449 | | 4,260 | | |
Northern Outlook | | 45 | | 2,517 | | 480 | | 2,037 | | |
Safe Havens | | Various | | 5,088 | | 192 | | 500 | | 4,396 |
Southern Outlook | | 12 | | 4,943 | | | | 2,512 | | 2,431 |
Smart Service Queensland Strategy Office | | 05 | | 1,927 | | 100 | | 1,827 | | |
North Queensland Youth Detention Centre | | 45 | | 12,494 | | 1,118 | | 11,376 | | |
Multi Tenant Centres | | Various | | 4,066 | | 2,596 | | 1,470 | | |
Strategic Asset and Capital Program | | Various | | 31,832 | | 10,124 | | 6,762 | | 14,946 |
Aboriginal and Torres Strait Islander diversionary centre and fitouts | | Various | | 1,616 | | 114 | | 1,186 | | 316 |
Neighbourhood Centre Program | | Various | | 7,607 | | 2,499 | | 3,608 | | 1,500 |
Property plant and equipment replacement program | | Various | | | | | | 780 | | Ongoing |
Minor capital works | | Various | | 450 | | 109 | | 341 | | |
Other capital works | | Various | | 20,114 | | 83 | | 1,417 | | 18,614 |
| | | | | | | | | | |
Total Property, Plant and Equipment | | | | | | | | 85,120 | | |
| | | | | | | | | | |
201
Communities, (continued)
| | | | | | | | | | |
Project | | Statistical
Division | | Total
Estimated
Cost
$’000 | | Expenditure
to 30-06-08
$’000 | | Budget
2008-09
$’000 | | Post
2008-09
$’000 |
Other Capital Expenditure | | | | | | | | | | |
Grants Management System | | Various | | 3,141 | | 233 | | 2,908 | | |
Information Renewal Initiative | | Various | | 37,470 | | 17,623 | | 8,625 | | 11,222 |
Information Management | | Various | | 6,341 | | 1,353 | | 1,988 | | 3,000 |
Referral for Active Intervention | | Various | | 616 | | | | 616 | | |
Detention Centre Operational Information System | | Various | | 2,040 | | | | 1,780 | | 260 |
Smart Service Queensland Software | | Various | | 990 | | 515 | | 475 | | |
| | | | | | | | | | |
Total Other Capital Expenditure | | | | | | | | 16,392 | | |
| | | | | | | | | | |
| | | | | |
Capital Grants | | | | | | | | | | |
Child Care grants | | Various | | | | | | 2,030 | | Ongoing |
Early Years Best Start capital grants | | Various | | 10,707 | | 2,216 | | 8,491 | | |
Other Capital Grants | | Various | | 125 | | | | 125 | | |
Hervey Bay Neighbourhood Centre | | 15 | | 1,000 | | | | 1,000 | | |
Multi Purpose Community Centre | | Various | | 600 | | 464 | | 136 | | |
| | | | | | | | | | |
Total Capital Grants | | | | | | | | 11,782 | | |
| | | | | | | | | | |
TOTAL DEPARTMENT OF COMMUNITIES | | | | | | | | 113,294 | | |
| | | | | | | | | | |
CORRECTIVE SERVICES
The agency’s capital expenditure program for 2008-09 is $400.5 million and principally comprises the expansion of prison infrastructure to meet the immediate and short-term accommodation needs of prisoners, and upgrades to existing prison infrastructure. These initiatives link to the Government’s outcome of protecting our children and enhancing community safety.
Program Highlights
| | • | | $118.3 million is provided in 2008-09 to commence an expansion and upgrade at |
the Lotus Glen Correctional Centre.
| | • | | $196.7 million is provided in 2008-09 for the first stage of the development of the South East Queensland Correctional Centre at Gatton, comprising a women’s |
centre and central infrastructure.
| | • | | $37.3 million is provided in 2008-09 to complete the expansion of the male Townsville Correctional Centre, $12.0 million to complete the new women’s correctional centre at Townsville, $7.3 million to complete the redevelopment of the Sir David Longland Correctional Centre as Brisbane Correctional Centre, and $5.7 million to complete the expansion of the Arthur Gorrie Correctional Centre. |
| | • | | Upgrades to existing prison infrastructure will continue, including $9.0 million towards the five-year $40 million perimeter security systems upgrade. |
202
Corrective Services
| | | | | | | | | | |
Project | | Statistical
Division | | Total
Estimated
Cost
$’000 | | Expenditure
to 30-06-08
$’000 | | Budget
2008-09
$’000 | | Post
2008-09
$’000 |
| | | | | |
QUEENSLAND CORRECTIVE SERVICES | | | | | | | | | | |
| | | | | |
Property, Plant and Equipment | | | | | | | | | | |
Expansion of Lotus Glen Correctional Centre (CC) | | 50 | | 445,005 | | 10,672 | | 118,333 | | 316,000 |
South East Queensland CC at Gatton, First Stage | | 12 | | 485,073 | | 31,066 | | 196,664 | | 257,343 |
Women’s CC at Townsville | | 45 | | 130,000 | | 117,999 | | 12,001 | | |
Redevelopment of Sir David Longland CC | | 05 | | 110,000 | | 102,692 | | 7,308 | | |
Expansion of Arthur Gorrie CC | | 05 | | 55,000 | | 49,318 | | 5,682 | | |
Expansion of Townsville CC | | 45 | | 142,500 | | 105,179 | | 37,321 | | |
Perimeter security systems | | Various | | 40,000 | | 31,000 | | 9,000 | | |
Establishment of new Probation and Parole service | | Various | | 3,920 | | 2,020 | | 1,900 | | |
Probation and Parole in Indigenous Communities | | 50 | | 1,500 | | 345 | | 1,155 | | |
Videoconferencing to external locations | | 05 | | 2,667 | | 1,914 | | 753 | | |
Accommodation for Offenders under DPSOA | | 05 | | 1,400 | | 350 | | 650 | | 400 |
Correctional Centre Lightning Protection | | 45 | | 3,600 | | 3,208 | | 392 | | |
Other acquisitions of property, plant and equipment | | Various | | | | | | 8,882 | | Ongoing |
| | | | | | | | | | |
Total Property, Plant and Equipment | | | | | | | | 400,041 | | |
| | | | | | | | | | |
Other Capital Expenditure | | | | | | | | | | |
IOMS Capital Upgrade | | 05 | | 1,220 | | 355 | | 445 | | 420 |
| | | | | | | | | | |
Total Other Capital Expenditure | | | | | | | | 445 | | |
| | | | | | | | | | |
TOTAL QUEENSLAND CORRECTIVE SERVICES | | | | | | | | 400,486 | | |
| | | | | | | | | | |
DISABILITY SERVICES QUEENSLAND
Investment in capital infrastructure forms a vital part of delivering specialist disability services. As a human services provider and funder, Disability Services Queensland invests in capital infrastructure in cases where it is required for Government service provision. Capital infrastructure is also utilised to accommodate and support departmental staff, tailored accommodation infrastructure for people with an intellectual disability and respite centres. The major portion of non-Government service delivery utilises existing community sector capital infrastructure.
Program Highlights
The department’s total capital expenditure for 2008-09 is $71.7 million.
The 2008-09 Budget commits $52.1 million to capital works, equipment purchases and software development, of which $2 million is new capital funding to enhance disability services delivered within the Government and non-Government sectors.
| | • | | Continue with a capital upgrade program for the department’s properties with a 2008-09 budget of $20.7 million. Underperforming assets will be upgraded to improve support in service provision, particularly residential and respite accommodation and new office accommodation. |
| | • | | Complete the progress of the tailored accommodation for purpose designed cluster housing infrastructure for people with an intellectual disability at $6.7 million and respite service replacement projects in the amount of $0.5 million. |
203
| | • | | Commit $6.8 million in 2008-09 to design and construct purpose-built accommodation as part of a targeted response for people with severely challenging behaviours, with total project funding being $24.3 million commencing in 2007-08 over four years. |
| | • | | $6.2 million for enhancements to the Disability Services Queensland Information System to support disability service system reform, with total project funding being $37.5 million over four years. |
| | • | | Complete innovative and tailored housing projects at Maryborough and Toowoomba at a cost of $2.4 million. |
| | • | | $0.6 million to complete refurbishments to the former Gladstone South decommissioned preschool for the use of non-Government service providers to deliver services. |
In addition, $19.6 million has been committed to capital grants, including:
| | • | | $3.7 million in capital grants to develop all abilities playgrounds in partnership with local councils which will provide safe and enjoyable recreational equipment and activities for all children including those with a disability. |
| | • | | $2.5 million for the non-Government sector to reduce the number of younger people with a disability living in or at risk of entering residential aged care. |
| | • | | $4.4 million in capital grants to purchase and construct specialist cluster housing for people with an intellectual disability and high and complex physical support needs. |
| | • | | $6.8 million in capital grants to the non-Government mental health sector. |
| | • | | $2.2 million in various capital grants for the non-Government disability service sector. |
204
Disability Services Queensland
| | | | | | | | | | |
Project | | Statistical
Division | | Total
Estimated
Cost
$’000 | | Expenditure
to 30-06-08
$’000 | | Budget
2008-09
$’000 | | Post
2008-09
$’000 |
DISABILITY SERVICES QUEENSLAND | | | | | | | | | | |
| | | | | |
Property, Plant and Equipment | | | | | | | | | | |
Respite Services | | | | | | | | | | |
Ipswich | | 05 | | 3,135 | | 2,915 | | 220 | | |
Toowoomba | | 20 | | 1,984 | | 1,700 | | 284 | | |
Innovative Housing | | | | | | | | | | |
Maryborough West | | 15 | | 3,097 | | 929 | | 2,168 | | |
Toowoomba | | 20 | | 1,964 | | 1,754 | | 210 | | |
Tailored Accommodation | | | | | | | | | | |
Deception Bay | | 05 | | 2,848 | | 2,076 | | 772 | | |
Hillcrest | | 05 | | 14,012 | | 6,965 | | 4,047 | | 3,000 |
Wacol | | 05 | | 3,100 | | 1,211 | | 1,889 | | |
Other Property, Plant and Equipment | | | | | | | | | | |
Gladstone South—preschool | | 30 | | 1,300 | | 689 | | 611 | | |
Ipswich (Whitehill Rd) | | 05 | | 583 | | 453 | | 130 | | |
Toowoomba | | 20 | | 150 | | 127 | | 23 | | |
Maryborough | | 15 | | 191 | | 106 | | 85 | | |
Aspley—house | | 05 | | 600 | | 505 | | 95 | | |
Brisbane West/Wacol area office | | 05 | | 587 | | 89 | | 498 | | |
Caboolture area office | | 05 | | 695 | | 668 | | 27 | | |
Forward capital program | | Various | | | | | | 20,664 | | Ongoing |
Ipswich area office | | 05 | | 3,600 | | 281 | | 3,319 | | |
Plant and equipment replacement | | Various | | | | | | 855 | | Ongoing |
Rockhampton area office | | 30 | | 1,376 | | 1,290 | | 86 | | |
System reform | | Various | | 596 | | | | 596 | | |
Targeted Response to Severely | | Various | | 24,269 | | 426 | | 6,813 | | 17,030 |
Challenging Behaviour | | | | | | | | | | |
Townsville area office | | 45 | | 1,343 | | 278 | | 1,065 | | |
Waterford West—house | | 05 | | 499 | | 416 | | 83 | | |
Other property | | Various | | | | | | 501 | | Ongoing |
| | | | | | | | | | |
Total Property, Plant and Equipment | | | | | | | | 45,041 | | |
| | | | | | | | | | |
| | | | | |
Other Capital Expenditure | | | | | | | | | | |
Roster Management System | | Various | | 855 | | | | 855 | | |
Information System (DISQIS) | | Various | | 37,499 | | 18,014 | | 6,179 | | 13,306 |
| | | | | | | | | | |
Total Other Capital Expenditure | | | | | | | | 7,034 | | |
| | | | | | | | | | |
Capital Grants | | | | | | | | | | |
Mental Health | | Various | | 6,800 | | | | 6,800 | | |
All Abilities Playgrounds, Young People In Residential Aged Care, Strengthening NGOs and Cluster Housing | | Various | | 18,208 | | 5,270 | | 12,787 | | 151 |
| | | | | | | | | | |
Total Capital Grants | | | | | | | | 19,587 | | |
| | | | | | | | | | |
TOTAL DISABILITY SERVICES QUEENSLAND | | | | | | | | 71,662 | | |
| | | | | | | | | | |
205
EDUCATION, TRAINING AND THE ARTS
Total capital expenditure for the Education, Training and the Arts portfolio (including related entities) for 2008-09 is $929.7 million. This significant investment will help to create a sustainable organisation that continues to improve outcomes for Queenslanders.
Education
The 2008-09 Budget provides a substantial investment in educational facilities with an education capital works program of $532.0 million (including an expense component of $82.9 million).
Education’s planning for capital meets the Government’s priorities and needs by considering population growth and shifts and the consequential impacts on enrolments, changes to educational standards and educational delivery methods, meeting school renewal requirements, and addressing high priority needs such as student and staff health and safety.
Program Highlights
| | • | | $234.9 million to construct four new schools: one in outer northern Brisbane; three on the Gold Coast; including two in Ormeau; and one in Oxenford, undertake further staged work at nine schools, make land acquisitions and provide additional classrooms and toilets in growth areas of the State. |
| | • | | $111.2 million to replace and enhance learning facilities at existing schools. |
| | • | | $150 million to continue the $1 billion Tomorrow’s Schools Program. |
| | • | | $15.5 million to acquire new employee housing and refurbish existing housing stock. |
Training
The Training portfolio’s capital expenditure program for 2008-09 is $190 million (including an expense component of $48 million), of which $120 million (including an expense component of $22 million) is for the construction and refurbishment of TAFE training facilities. The implementation of the Queensland Skills Plan is continuing into the third year of a six year major capital works program. This program is supported by a five year information and communication technology (ICT) modernisation program to leverage improvements in efficiency, productivity and increased training output.
Program Highlights
| | • | | $37.4 million is to be invested directly in ICT, while a further $5 million will be invested in training equipment. |
| | • | | $30.6 million for continuing the SkillsTech Australia major trade and technician skills campus at Acacia Ridge in Brisbane. |
| | • | | $24.1 million will be used to continue detailed planning and construction of the SkillsTech Australia major trade and technician skills campuses in Townsville and Mackay. |
| | • | | $12 million for construction of the Gold Coast Institute of TAFE’s Coomera Education Precinct for creative industries. |
| | • | | $6.5 million for the first phase of works to redevelop the Cairns campus of the Tropical North Institute of TAFE. |
Arts
Arts Queensland will continue its delivery of key arts and cultural infrastructure for Queensland, through a capital works program totalling around $41.2 million in 2008-09.
206
Program Highlights
| | • | | Continue the $34 million, 2007-09 program to improve disability access at the Queensland Performing Arts Centre (QPAC) and refurbish the Lyric Theatre, Concert Hall and public spaces at QPAC. |
| | • | | Continue the $7.9 million, two-year allocation to transform the Cultural Centre auditorium into a creative ideas and technology centre, The Edge, for young people aged 14 to 25. |
Australian Agricultural College Corporation
With a capital budget of $2.8 million in 2008-09, the Australian Agricultural College Corporation is continuing its development of a best practice agricultural training platform by aiming for world class facilities at farm scale across representative farming systems.
Library Board of Queensland
The State Library will continue to invest in collection assets for its General Reference and Heritage Collections. The 2008-09 year will see the purchase of new software to provide enhanced access to our collections, the upgrading of existing software that manages our digital collections and the continuation of the State Library’s ongoing plant and equipment replacement program to ensure maximum benefit is achieved from its capital investment.
Queensland Art Gallery
The Gallery’s $2.1 million property, plant and equipment expenditure program for 2008-09 will provide for purchases of works of art and operational plant and equipment.
Queensland Museum
Queensland Museum’s 2008-09 capital program of $2.1 million will fund enhanced visitor experiences at regional campuses, and improve storage of, and public access to, Queensland Museum’s unique collections. Program highlights include:
| | • | | the ongoing development of the National Carriage Factory project at the Cobb+Co Museum, Toowoomba. |
| | • | | detailed design and construction of the ‘Archie’s Shipwreck’ exhibition at the Museum of Tropical Queensland. |
| | • | | an investment of $2.8 million ($1.5 million in 2008-09) to enhance the collection, storage and management of the Queensland Museum’s State Collection, including $0.24 million to upgrade web-based services. |
Queensland Performing Arts Trust
The Trust’s capital expenditure program for 2008-09 is $0.75 million to meet property, plant and equipment requirements, such as theatrical and musical production equipment.
Southbank Institute of Technology
Southbank Institute of Technology will continue to invest in technology to ensure that it maintains the core ICT infrastructure at a level that ensures outstanding learning experiences. The Southbank Education and Training Precinct, a Public Private Partnership project at the Institute’s South Brisbane campus, will be finalised.
207
Education, Training and the Arts1,2,3,4,5
| | | | | | | | | | |
Project | | Statistical
Division | | Total
Estimated
Cost
$’000 | | Expenditure
to 30-06-08
$’000 | | Budget
2008-09
$’000 | | Post
2008-09
$’000 |
EDUCATION AND TRAINING KEY TO ABBREVIATIONS | | | | | | | | | | |
GLAB—General Learning Area Block | | | | | | | | | | |
Property, Plant and Equipment | | | | | | | | | | |
EDUCATION | | | | | | | | | | |
Aviation High, Development of Aviation High | | 05 | | 5,113 | | 124 | | 4,989 | | |
Bellevue Park State School, Performing Arts Hall | | 07 | | 500 | | 126 | | 374 | | |
Benowa State High School, Additional Amenities | | 07 | | 450 | | 180 | | 270 | | |
Bowen State High School, Additional Amenities | | 40 | | 630 | | | | 270 | | 360 |
Brisbane State High School, Stages 2A and 2B—Performing Arts Centre | | 05 | | 9,183 | | 763 | | 8,420 | | |
Bundaberg State High School, Replacement Amenities | | 15 | | 1,170 | | 497 | | 673 | | |
Burpengary Meadows State School, Stage 2 | | 05 | | 3,550 | | 259 | | 3,291 | | |
Calliope State School, Library Block | | 30 | | 1,584 | | 465 | | 1,119 | | |
Chancellor State College, Stage 3C—Performing Arts | | 09 | | 4,811 | | 1,895 | | 2,916 | | |
Cloncurry State School, Air Conditioning Replacement and Electrical Upgrade | | 55 | | 2,087 | | 1,732 | | 355 | | |
Coombabah State High School, Additional Amenities | | 07 | | 630 | | | | 270 | | 360 |
Coomera Springs State School, Stage 1B | | 07 | | 11,219 | | 2,350 | | 8,869 | | |
Corinda State High School, 3 Space Science Block | | 05 | | 2,475 | | 825 | | 1,650 | | |
Corinda State High School, Additional Amenities | | 05 | | 450 | | | | 270 | | 180 |
Cunnamulla State School, Air Conditioning Replacement and Electrical Upgrade | | 25 | | 1,896 | | 1,556 | | 340 | | |
Cupania State School, New School | | 07 | | 17,004 | | 2,312 | | 14,692 | | |
Earnshaw State College, Indoor Sports Facility | | 05 | | 4,744 | | 158 | | 4,586 | | |
Fernvale State School, Additional Amenities | | 12 | | 450 | | | | 450 | | |
Ferny Grove State High School, Additional Amenities | | 05 | | 540 | | | | 270 | | 270 |
Glen Aplin State School, Additional Amenities | | 20 | | 270 | | | | 270 | | |
Greenbank State School, GLAB—2 Storey—8 Spaces | | 05 | | 2,700 | | 180 | | 2,520 | | |
Happy Valley State School, Air Conditioning Replacement and Electrical Upgrade | | 55 | | 1,870 | | 1,598 | | 272 | | |
Harris Fields State School, Replacement Administration Block | | 05 | | 1,140 | | 600 | | 540 | | |
Highfields State School, Multi Purpose Indoor Centre | | 20 | | 515 | | 1 | | 299 | | 215 |
Holland Park State School, Multi Purpose Facility | | 05 | | 500 | | | | 500 | | |
Homebush State School, Additional Amenities | | 40 | | 810 | | 249 | | 561 | | |
Hughenden State School, Air Conditioning Replacement and Electrical Upgrade | | 55 | | 1,385 | | 1,134 | | 251 | | |
Isabella State School, Stage 3 | | 50 | | 7,098 | | 86 | | 7,012 | | |
Ithaca Creek State School, GLAB—3 Storey—8 Spaces—Open Under | | 05 | | 4,050 | | | | 4,050 | | |
208
Education, Training and the Arts1,2,3,4,5, (continued)
| | | | | | | | | | |
Project | | Statistical
Division | | Total
Estimated
Cost
$’000 | | Expenditure
to
30-06-08
$’000 | | Budget
2008-09
$’000 | | Post
2008-09
$’000 |
Kenmore State High School, Stage 1 Redevelopment | | 05 | | 8,800 | | 238 | | 4,400 | | 4,162 |
Kilcoy State High School, Replacement Amenities | | 12 | | 556 | | 237 | | 319 | | |
Kowanyama State School, Multi Purpose Facility | | 50 | | 900 | | 1 | | 899 | | |
Loganlea State High School, Special Education Unit Upgrade | | 05 | | 2,427 | | 368 | | 2,059 | | |
Mackay North State School, Replacement Amenities | | 40 | | 945 | | 415 | | 530 | | |
Mansfield State High School, Additional Amenities | | 05 | | 630 | | | | 270 | | 360 |
Meridan State College, Stage 3—Planning | | 09 | | 1,820 | | | | 1,820 | | |
Meridan State College, Stage 2A | | 09 | | 3,640 | | | | 3,640 | | |
Mitchelton Special School, Redevelopment | | 05 | | 5,490 | | 135 | | 4,590 | | 765 |
Moggill State School, Multi Purpose Hall | | 05 | | 432 | | 1 | | 431 | | |
Montville State School, Additional Amenities | | 09 | | 759 | | 321 | | 438 | | |
Mount Cotton State School, GLAB—2 Storey—8 Spaces | | 05 | | 2,562 | | 180 | | 2,382 | | |
Nebo State School, Additional Amenities | | 40 | | 675 | | | | 315 | | 360 |
Nundah State School, Library Upgrade | | 05 | | 1,151 | | 162 | | 989 | | |
Ormeau State High School, New School | | 07 | | 24,273 | | 1,125 | | 23,148 | | |
Outer Northern Brisbane, New School | | 05 | | 18,444 | | 508 | | 17,936 | | |
Pallara State School, Additional Amenities | | 05 | | 990 | | 450 | | 540 | | |
Palm Island Senior Campus, Administration and Classroom Facilities | | 45 | | 1,584 | | | | 1,584 | | |
Park Lake State School, Stage 2—Planning | | 07 | | 1,001 | | | | 1,001 | | |
Pine Rivers Special School, GLAB—4 Spaces and Amenities | | 05 | | 2,097 | | 124 | | 1,973 | | |
Prospect Creek State School, Additional Amenities | | 30 | | 270 | | | | 270 | | |
Redcliffe Special School, GLAB—4 Spaces and Amenities | | 05 | | 1,980 | | | | 1,980 | | |
Redland Bay State School, Library Upgrade | | 05 | | 1,408 | | 264 | | 1,144 | | |
Redlynch State College, Stage 3 | | 50 | | 18,200 | | 3,107 | | 15,093 | | |
Rochedale State School, Administration Upgrade | | 05 | | 1,636 | | 570 | | 1,066 | | |
Rochedale State School, Oval and Associated Works | | 05 | | 792 | | 431 | | 361 | | |
Runcorn Heights State School, Replacement Amenities Block | | 05 | | 420 | | | | 420 | | |
Southport State High School, Home Economics Block | | 07 | | 2,200 | | 792 | | 1,408 | | |
Spinifex State College—Mount Isa—Junior Campus, Air Conditioning Replacement and Electrical Upgrade | | 55 | | 3,529 | | 3,030 | | 499 | | |
St Helens State School, Additional Amenities | | 15 | | 630 | | 360 | | 270 | | |
Stretton State College, Secondary—Stage 2 | | 05 | | 12,115 | | 810 | | 11,305 | | |
Toowoomba West Special School, Replacement Amenities | | 20 | | 540 | | 45 | | 495 | | |
209
Education, Training and the Arts1,2,3,4,5, (continued)
| | | | | | | | | | |
Project | | Statistical
Division | | Total
Estimated
Cost
$’000 | | Expenditure
to 30-06-08
$’000 | | Budget
2008-09
$’000 | | Post
2008-09
$’000 |
Tully State High School, Indoor Multi Purpose Centre | | 50 | | 600 | | 200 | | 400 | | |
Veresdale Scrub State School, Additional Amenities | | 12 | | 630 | | | | 630 | | |
Wellington Point State High School, Additional Amenities | | 05 | | 540 | | | | 270 | | 270 |
Wellington Point State High School, 2 Space Relocatable Building (Special Education) | | 05 | | 378 | | | | 378 | | |
Western Cape College—Weipa, Stage 3 | | 50 | | 6,300 | | | | 4,500 | | 1,800 |
Western Oxenford State School, New School | | 07 | | 22,751 | | 550 | | 22,201 | | |
Wilston State School, Additional Classroom Accommodation | | 05 | | 3,841 | | 347 | | 3,494 | | |
Xavier Special Education Program, Relocation | | 05 | | 4,500 | | | | 450 | | 4,050 |
Yarrilee State School, Music Block | | 15 | | 900 | | 63 | | 837 | | |
Yugumbir State School, GLAB—2 Storey—8 Spaces | | 05 | | 2,550 | | 117 | | 2,433 | | |
Additional accommodation | | Various | | | | | | 26,534 | | Ongoing |
Employee housing | | Various | | | | | | 12,940 | | Ongoing |
Energy efficiency initiatives | | Various | | | | | | 10,000 | | Ongoing |
General works | | Various | | | | | | 46,100 | | Ongoing |
Land acquisition | | Various | | | | | | 13,720 | | Ongoing |
Minor works | | Various | | | | | | 7,427 | | Ongoing |
State Schools of Tomorrow | | Various | | | | | | 122,833 | | Ongoing |
Plant and equipment | | Various | | | | | | 49,224 | | Ongoing |
| | | | | | | | | | |
Sub-total EDUCATION | | | | | | | | 498,295 | | |
| | | | | | | | | | |
TRAINING | | | | | | | | | | |
Barrier Reef Institute of TAFE—Townsville
Stage II | | 45 | | 14,962 | | 250 | | 2,368 | | 12,344 |
Brisbane North Institute of TAFE—Grovely | | 05 | | 925 | | | | 925 | | |
Central Queensland Institute of TAFE—Rockhampton | | 30 | | 6,850 | | 199 | | 3,740 | | 2,911 |
Gold Coast Institute of TAFE—Coomera Education Precinct | | 07 | | 31,700 | | 1,087 | | 12,000 | | 18,613 |
Metropolitan South Institute of TAFE—Loganlea Campus | | 05 | | 5,986 | | 200 | | 2,511 | | 3,275 |
Metropolitan South Institute of TAFE—Mt Gravatt Redevelopment Stage I | | 05 | | 20,330 | | 11,657 | | 6,973 | | 1,700 |
Metropolitan South Institute of TAFE—Mt Gravatt Stage II | | 05 | | 12,178 | | | | 2,957 | | 9,221 |
Skilling Solutions Qld Centres | | Various | | 4,161 | | 680 | | 3,481 | | |
SkillsTech Australia—Townsville Trade Campus | | 45 | | 36,360 | | 8,475 | | 9,117 | | 18,768 |
SkillsTech Australia—Acacia Ridge Stage I & II | | 05 | | 100,456 | | 44,231 | | 26,625 | | 29,600 |
SkillsTech Australia—Mackay Trade campus | | 40 | | 43,384 | | 8,712 | | 13,533 | | 21,139 |
210
Education, Training and the Arts1,2,3,4,5, (continued)
| | | | | | | | | | |
Project | | Statistical
Division | | Total
Estimated
Cost
$’000 | | Expenditure
to 30-06-08
$’000 | | Budget
2008-09
$’000 | | Post
2008-09
$’000 |
SkillsTech Australia—Northern Brisbane | | 05 | | 47,986 | | 3,397 | | 4,600 | | 39,989 |
Southern Queensland Institute of TAFE—Toowoomba Automotive | | 20 | | 2,645 | | 2,270 | | 375 | | |
Sunshine Coast Institute of TAFE—Quad Park | | 09 | | 7,125 | | 356 | | 891 | | 5,878 |
Sunshine Coast Institute of TAFE—Mooloolaba | | 09 | | 4,285 | | 750 | | 1,000 | | 2,535 |
Sunshine Coast Institute of TAFE—Nambour | | 09 | | 10,696 | | 1,783 | | 2,289 | | 6,624 |
The Bremer Institute of TAFE—Bundamba Campus Phase II | | 05 | | 16,000 | | | | 800 | | 15,200 |
The Bremer Institute of TAFE—Bundamba Campus Phase I | | 05 | | 986 | | | | 986 | | |
Tropical North Institute of TAFE—Cairns | | 50 | | 26,088 | | 500 | | 6,022 | | 19,566 |
Infrastructure Equipment | | Various | | | | | | 2,500 | | Ongoing |
Minor Capital Works | | Various | | | | | | 2,300 | | Ongoing |
ICT Modernisation | | Various | | 7,000 | | 2,800 | | 1,400 | | 2,800 |
ICT TAFE Technology | | Various | | | | | | 7,621 | | Ongoing |
Minor equipment, facility and air conditioning upgrades | | Various | | 7,475 | | 2,000 | | 2,250 | | 3,225 |
Ecological Sustainability Projects | | Various | | 8,110 | | | | 4,130 | | 3,980 |
Public Private Partnership—finance lease | | 05 | | 231,862 | | 80,000 | | 151,862 | | |
Other Plant and Equipment | | Various | | | | | | 2,646 | | Ongoing |
| | | | | | | | | | |
Sub-total TRAINING | | | | | | | | 275,902 | | |
| | | | | | | | | | |
Total Property, Plant and Equipment | | | | | | | | 774,197 | | |
| | | | | | | | | | |
Other Capital Expenditure | | | | | | | | | | |
TRAINING | | | | | | | | | | |
ICT Software Development Projects | | Various | | 37,578 | | 17,830 | | 18,448 | | 1,300 |
| | | | | | | | | | |
Sub-total TRAINING | | | | | | | | 18,448 | | |
| | | | | | | | | | |
Total Other Capital Expenditure | | | | | | | | 18,448 | | |
| | | | | | | | | | |
Capital Grants | | | | | | | | | | |
EDUCATION | | | | | | | | | | |
Capital grants | | Various | | 75,285 | | | | 75,285 | | |
| | | | | | | | | | |
Sub-total EDUCATION | | | | | | | | 75,285 | | |
| | | | | | | | | | |
TRAINING | | | | | | | | | | |
Australian Agricultural College Corporation | | Various | | | | | | 1,000 | | Ongoing |
Skills Centre Program | | Various | | | | | | 3,150 | | Ongoing |
| | | | | | | | | | |
Sub-total TRAINING | | | | | | | | 4,150 | | |
| | | | | | | | | | |
Total Capital Grants | | | | | | | | 79,435 | | |
| | | | | | | | | | |
TOTAL EDUCATION AND TRAINING | | | | | | | | 872,080 | | |
| | | | | | | | | | |
ARTS | | | | | | | | | | |
Property, Plant and Equipment | | | | | | | | | | |
Auditorium—Cultural Centre | | 05 | | 7,900 | | 400 | | 7,500 | | |
Queensland Performing Arts Centre (QPAC) Redevelopment | | 05 | | 34,000 | | 1,000 | | 33,000 | | |
211
Education, Training and the Arts1,2,3,4,5, (continued)
| | | | | | | | | | |
Project | | Statistical
Division | | Total
Estimated
Cost
$’000 | | Expenditure
to 30-06-08
$’000 | | Budget
2008-09
$’000 | | Post
2008-09
$’000 |
Cairns Centre of Contemporary Arts | | 50 | | 1,000 | | 326 | | 674 | | |
| | | | | | | | | | |
Total Property, Plant and Equipment | | | | | | | | 41,174 | | |
| | | | | | | | | | |
TOTAL ARTS | | | | | | | | 41,174 | | |
| | | | | | | | | | |
AUSTRALIAN AGRICULTURAL COLLEGE CORPORATION | | | | | | | | | | |
| | | | | |
Property, Plant and Equipment | | | | | | | | | | |
Land | | Various | | | | | | 1,000 | | Ongoing |
Property Plant & Equipment | | Various | | | | | | 1,000 | | Ongoing |
Minor Equipment | | Various | | | | | | 500 | | Ongoing |
| | | | | | | | | | |
Total Property, Plant and Equipment | | | | | | | | 2,500 | | |
| | | | | | | | | | |
Other Capital Expenditure | | | | | | | | | | |
Other Capital Acquisitions | | Various | | | | | | 327 | | Ongoing |
| | | | | | | | | | |
Total Other Capital Expenditure | | | | | | | | 327 | | |
| | | | | | | | | | |
TOTAL AUSTRALIAN AGRICULTURAL COLLEGE CORPORATION | | | | | | | | 2,827 | | |
| | | | | | | | | | |
LIBRARY BOARD OF QUEENSLAND | | | | | | | | | | |
| | | | | |
Property, Plant and Equipment | | | | | | | | | | |
Plant and equipment—general | | 05 | | | | | | 849 | | Ongoing |
Library Collections expenditure | | 05 | | | | | | 1,037 | | Ongoing |
| | | | | | | | | | |
Total Property, Plant and Equipment | | | | | | | | 1,886 | | |
| | | | | | | | | | |
TOTAL LIBRARY BOARD OF QUEENSLAND | | | | | | | | 1,886 | | |
| | | | | | | | | | |
QUEENSLAND ART GALLERY | | | | | | | | | | |
| | | | | |
Property, Plant and Equipment | | | | | | | | | | |
Property, plant and equipment | | 05 | | | | | | 2,100 | | Ongoing |
| | | | | | | | | | |
Total Property, Plant and Equipment | | | | | | | | 2,100 | | |
| | | | | | | | | | |
TOTAL QUEENSLAND ART GALLERY | | | | | | | | 2,100 | | |
| | | | | | | | | | |
QUEENSLAND MUSEUM | | | | | | | | | | |
| | | | | |
Property, Plant and Equipment | | | | | | | | | | |
Collection Storage, Acquisition and Management | | Various | | 2,835 | | 35 | | 1,450 | | 1,350 |
National Carriage Factory | | 20 | | | | | | 13 | | Ongoing |
Shipwreck Exhibition—Museum of Tropical Queensland | | 45 | | 244 | | | | 244 | | |
Collection Database | | Various | | 840 | | 820 | | 20 | | |
Enchanted Rainforest Exhibition—Museum of Tropical Queensland | | 45 | | 473 | | 450 | | 23 | | |
The Workshops Rail Museum Exhibitions | | 05 | | 30 | | | | 30 | | |
Property, plant and equipment—other | | Various | | | | | | 297 | | Ongoing |
| | | | | | | | | | |
Total Property, Plant and Equipment | | | | | | | | 2,077 | | |
| | | | | | | | | | |
TOTAL QUEENSLAND MUSEUM | | | | | | | | 2,077 | | |
| | | | | | | | | | |
212
Education, Training and the Arts1,2,3,4,5, (continued)
| | | | | | | | | | |
Project | | Statistical
Division | | Total
Estimated
Cost
$’000 | | Expenditure
to 30-06-08
$’000 | | Budget
2008-09
$’000 | | Post
2008-09
$’000 |
QUEENSLAND PERFORMING ARTS TRUST | | | | | | | | | | |
| | | | | |
Property, Plant and Equipment | | | | | | | | | | |
Property, plant and equipment | | 05 | | | | | | 750 | | Ongoing |
| | | | | | | | | | |
Total Property, Plant and Equipment | | | | | | | | 750 | | |
| | | | | | | | | | |
TOTAL QUEENSLAND PERFORMING ARTS TRUST | | | | | | | | 750 | | |
| | | | | | | | | | |
QUEENSLAND STUDIES AUTHORITY | | | | | | | | | | |
| | | | | |
Property, Plant and Equipment | | | | | | | | | | |
Other plant and equipment | | 05 | | | | | | 200 | | Ongoing |
| | | | | | | | | | |
Total Property, Plant and Equipment | | | | | | | | 200 | | |
| | | | | | | | | | |
TOTAL QUEENSLAND STUDIES AUTHORITY | | | | | | | | 200 | | |
| | | | | | | | | | |
CORPORATE AND PROFESSIONAL SERVICES | | | | | | | | | | |
| | | | | |
Property, Plant and Equipment | | | | | | | | | | |
Property, plant and equipment | | 05 | | | | | | 262 | | Ongoing |
| | | | | | | | | | |
Total Property, Plant and Equipment | | | | | | | | 262 | | |
| | | | | | | | | | |
TOTAL CORPORATE AND PROFESSIONAL SERVICES | | | | | | | | 262 | | |
| | | | | | | | | | |
SOUTHBANK INSTITUTE OF TECHNOLOGY | | | | | | | | | | |
| | | | | |
Property, Plant and Equipment | | | | | | | | | | |
Information and communication technology | | 05 | | | | | | 2,748 | | Ongoing |
Other plant and equipment | | 05 | | | | | | 3,609 | | Ongoing |
| | | | | | | | | | |
Total Property, Plant and Equipment | | | | | | | | 6,357 | | |
| | | | | | | | | | |
TOTAL SOUTHBANK INSTITUTE OF TECHNOLOGY | | | | | | | | 6,357 | | |
| | | | | | | | | | |
TOTAL EDUCATION, TRAINING AND THE ARTS | | | | | | | | 929,713 | | |
| | | | | | | | | | |
Notes:
| 1. | Capital grants are distributed by non-state entities throughout Queenslands statistical divisions. |
| 2. | Project budgets listed in the table are in some cases indicative and are subject to refinement as projects are further developed. |
| 3. | Projects contained in the table have been included on the basis of projected enrolments. If projected enrolments do not eventuate, then listed projects may be deferred or stopped, or new projects added during the course of the financial year. |
| 4. | The amounts quoted in the above table reflect the estimated portion of project costs that will be capitalised. The amounts quoted in the program highlights, Agency Service Delivery Statements and the Regional Budget Statements are the full financial costs of projects (i.e. they include some expensed items). |
| 5. | The Australian Government may also contribute funding for these projects. |
213
ELECTORAL COMMISSION OF QUEENSLAND
An amount of $0.04 million is allocated towards the replacement of plant and equipment in 2008-09 to provide for the ongoing operational requirements associated with the efficient and effective provision of electoral services for the State of Queensland.
Electoral Commission of Queensland
| | | | | | | | | | |
Project | | Statistical
Division | | Total
Estimated
Cost
$’000 | | Expenditure
to 30-06-08
$’000 | | Budget
2008-09
$’000 | | Post
2008-09
$’000 |
ELECTORAL COMMISSION OF QUEENSLAND | | | | | | | | | | |
Property, Plant and Equipment | | | | | | | | | | |
Plant and equipment | | 05 | | | | | | 40 | | Ongoing |
| | | | | | | | | | |
Total Property, Plant and Equipment | | | | | | | | 40 | | |
| | | | | | | | | | |
TOTAL ELECTORAL COMMISSION OF QUEENSLAND | | | | | | | | 40 | | |
| | | | | | | | | | |
EMERGENCY SERVICES
The department’s 2008-09 capital program will invest $160.6 million in capital acquisitions and grants to ensure essential services to minimise the risk and impact of accidents, emergencies and disasters.
A major feature is the investment of $29.3 million (as part of a total allocation of $76.1 million) to build a new integrated communication and state emergency operations centre to enable more effective management of large scale emergencies and disasters in Queensland. The investment involves upgrading and replacement of radio and information and communications technology (ICT).
Program Highlights
| | • | | capital investment of the final $2.6 million (as part of a total allocation of $48.7 million) to enhance Emergency Management Queensland’s helicopter rescue fleet with three AgustaWestland 139 helicopters to improve the level of service for aeromedical, search and rescue operations, and emergency management capability across Queensland. |
| | • | | $4.5 million for additional plant and equipment for Emergency Management Queensland, including an additional $3.9 million for the purchase of important helicopter safety equipment including forward looking infra-red (FLIR), neonatal equipment and night vision goggles has been provided. |
| | • | | total outlays of $68.5 million are provided for new ambulance facilities, vehicles, operational equipment, and ICT improvements; and $49.5 million is provided for fire facilities, urban and rural fire appliances, operational equipment and ICT improvements. |
| | • | | two new ambulance stations, 21 replacement or redeveloped facilities will be commenced or completed during 2008-09 and a further $2.2 million has been provided for minor works on ambulance service facilities. |
| | • | | three new fire stations and 11 replacement or redeveloped facilities will be commenced or completed during 2008-09. |
| | • | | $2.2 million will be invested to complete a replacement joint fire and ambulance facility at Palm Island. |
| | • | | $16.9 million will be invested in more than 145 new ambulance vehicles to ensure an efficient fleet and provide vehicles for the additional ambulance officers commencing service. |
214
| | • | | $13.4 million will be invested in 30 new or replacement urban fire and rescue appliances as part of the fleet replacement program to meet enhanced service delivery. |
| | • | | investment will occur for continued improvement of ICT and communications and operational equipment for ambulance services ($14.0 million), and for fire and rescue services ($10.4 million). |
| | • | | investment in strategic land purchases will occur for ambulance services ($4.2 million) including a land acquisition at Bellbowrie, and land for fire and rescue services ($1.1 million). |
| | • | | the Queensland Ambulance Service and the Queensland Fire and Rescue Service will invest $1.3 million (as part of a total allocation of $20 million) to finalise a major expansion of the Queensland Combined Emergency Services Academy as an operational, multi-service and multi-agency training centre of excellence for emergency management and community safety. |
Emergency Services
| | | | | | | | | | |
Project | | Statistical
Division | | Total
Estimated
Cost
$’000 | | Expenditure
to 30-06-08
$’000 | | Budget
2008-09
$’000 | | Post
2008-09
$’000 |
DEPARTMENT OF EMERGENCY SERVICES | | | | | | | | | | |
| | | | | |
Property, Plant and Equipment | | | | | | | | | | |
QUEENSLAND AMBULANCE SERVICE | | | | | | | | | | |
Building/General Works | | | | | | | | | | |
Ashgrove/ The Gap new station | | 05 | | 2,000 | | 50 | | 600 | | 1,350 |
Burleigh Heads station refurbishment | | 07 | | 1,000 | | | | 1,000 | | |
Clermont replacement station | | 40 | | 1,400 | | 62 | | 1,338 | | |
Coolum replacement station | | 09 | | 2,149 | | 1,078 | | 1,071 | | |
Duaringa station refurbishment | | 30 | | 600 | | | | 600 | | |
Grovely/ Mitchelton replacement station | | 05 | | 3,200 | | 100 | | 2,200 | | 900 |
Ipswich replacement station | | 05 | | 3,965 | | 311 | | 2,654 | | 1,000 |
Julia Creek replacement station | | 55 | | 1,054 | | 123 | | 931 | | |
Mitchell station refurbishment | | 25 | | 890 | | 50 | | 840 | | |
Mount Morgan replacement station | | 30 | | 2,000 | | | | 2,000 | | |
Moura station refurbishment | | 30 | | 600 | | | | 600 | | |
Murgon replacement station | | 15 | | 1,993 | | 711 | | 1,282 | | |
Oakey replacement station | | 20 | | 1,450 | | 505 | | 945 | | |
Pimpama replacement station (regional staff development unit) | | 07 | | 2,000 | | 200 | | 1,800 | | |
Redcliffe replacement station | | 05 | | 2,000 | | | | 1,600 | | 400 |
Runaway Bay replacement station | | 07 | | 2,000 | | | | 1,000 | | 1,000 |
South Brisbane replacement regional staff development unit | | 05 | | 2,000 | | | | 2,000 | | |
Springfield new station | | 05 | | 2,400 | | | | 400 | | 2,000 |
Tamborine Mountain replacement station | | 07 | | 1,986 | | 319 | | 1,667 | | |
Townsville redevelopment project | | 45 | | 4,300 | | 1,625 | | 2,675 | | |
Tully replacement station | | 50 | | 2,000 | | | | 1,500 | | 500 |
Weipa replacement station | | 50 | | 1,924 | | 1,006 | | 918 | | |
Yarrabah replacement station | | 50 | | 1,602 | | 9 | | 1,593 | | |
Minor works | | Various | | | | | | 2,209 | | Ongoing |
| | | | | |
Land | | | | | | | | | | |
Bellbowrie | | 05 | | 350 | | | | 350 | | |
Strategic land acquisitions | | Various | | | | | | 3,800 | | Ongoing |
215
Emergency Services, (continued)
| | | | | | | | | | |
Project | | Statistical
Division | | Total
Estimated
Cost
$’000 | | Expenditure
to 30-06-08
$’000 | | Budget
2008-09
$’000 | | Post
2008-09
$’000 |
Other Plant and Equipment | | | | | | | | | | |
Ambulance vehicle purchases | | Various | | | | | | 16,930 | | Ongoing |
Operational and communications equipment | | Various | | | | | | 6,983 | | Ongoing |
| | | | | | | | | | |
Sub-total QUEENSLAND AMBULANCE SERVICE | | | | | | | | 61,486 | | |
| | | | | | | | | | |
QUEENSLAND FIRE AND RESCUE SERVICE | | | | | | | | | | |
Building/General Works | | | | | | | | | | |
Bollon replacement auxiliary station | | 25 | | 400 | | | | 400 | | |
Burpengary new station | | 05 | | 3,254 | | 849 | | 2,405 | | |
Goondiwindi replacement auxiliary station | | 20 | | 964 | | 300 | | 664 | | |
Kippa Ring replacement station | | 05 | | 3,134 | | 739 | | 2,395 | | |
Malanda replacement auxiliary station | | 50 | | 671 | | 400 | | 271 | | |
Nambour replacement station | | 09 | | 3,650 | | 200 | | 1,775 | | 1,675 |
Nerang new station | | 07 | | 3,750 | | | | 2,000 | | 1,750 |
Pullenvale replacement station | | 05 | | 3,400 | | | | 2,400 | | 1,000 |
Queensland Combined Emergency Services Academy—complex improvements | | 05 | | | | | | 1,793 | | Ongoing |
Redland Bay new station | | 05 | | 3,200 | | 200 | | 3,000 | | |
Southport station redevelopment | | 07 | | 3,002 | | 265 | | 2,737 | | |
Tin Can Bay replacement auxiliary station | | 15 | | 696 | | 400 | | 296 | | |
Woodridge replacement station | | 05 | | 3,750 | | | | 500 | | 3,250 |
Yungaburra replacement auxiliary station | | 50 | | 666 | | 434 | | 232 | | |
Minor works | | Various | | | | | | 150 | | Ongoing |
Land | | | | | | | | | | |
Brisbane | | 05 | | 1,000 | | | | 1,000 | | |
Rural Operations land purchase | | Various | | | | | | 100 | | Ongoing |
Other Plant and Equipment | | | | | | | | | | |
Operational and communications equipment | | Various | | | | | | 3,651 | | Ongoing |
Rural Fire appliances | | Various | | | | | | 3,600 | | Ongoing |
Urban Fire appliances | | Various | | | | | | 13,383 | | Ongoing |
| | | | | | | | | | |
Sub-total QUEENSLAND FIRE AND RESCUE SERVICE | | | | | | | | 42,752 | | |
| | | | | | | | | | |
EMERGENCY MANAGEMENT QUEENSLAND | | | | | | | | | | |
Replacement of EMQ Helicopter Rescue Fleet | | Various | | 48,739 | | 46,172 | | 2,567 | | |
Helicopter equipment | | Various | | 3,920 | | | | 3,920 | | |
Other plant and equipment | | Various | | | | | | 595 | | Ongoing |
| | | | | | | | | | |
Sub-total EMERGENCY MANAGEMENT QUEENSLAND | | | | | | | | 7,082 | | |
| | | | | | | | | | |
216
Emergency Services, (continued)
| | | | | | | | | | |
Project | | Statistical
Division | | Total
Estimated
Cost
$’000 | | Expenditure
to 30-06-08
$’000 | | Budget
2008-09
$’000 | | Post
2008-09
$’000 |
JOINT EMERGENCY SERVICE FACILITIES | | | | | | | | | | |
Palm Island replacement joint facility | | 45 | | 2,310 | | 132 | | 2,178 | | |
Queensland Combined Emergency Services Academy—Strategic Development Project | | 05 | | 20,000 | | 18,736 | | 1,264 | | |
Queensland Emergency Operations Centre | | 05 | | 76,050 | | 4,789 | | 29,321 | | 41,940 |
| | | | | | | | | | |
Sub-total JOINT EMERGENCY SERVICE FACILITIES | | | | | | | | 32,763 | | |
| | | | | | | | | | |
OTHER DEPARTMENTAL | | | | | | | | | | |
Minor works | | 05 | | | | | | 200 | | Ongoing |
| | | | | | | | | | |
Sub-total OTHER DEPARTMENTAL | | | | | | | | 200 | | |
| | | | | | | | | | |
Total Property, Plant and Equipment | | | | | | | | 144,283 | | |
| | | | | | | | | | |
Other Capital Expenditure | | | | | | | | | | |
QUEENSLAND AMBULANCE SERVICE | | | | | | | | | | |
Strategic Information Management Initiative | | Various | | | | | | 4,188 | | Ongoing |
Information systems development | | Various | | | | | | 2,844 | | Ongoing |
| | | | | |
QUEENSLAND FIRE AND RESCUE SERVICE | | | | | | | | | | |
Operations Management System (previously Fire Information Management System) | | Various | | 13,172 | | 11,458 | | 1,714 | | |
Information systems development | | Various | | | | | | 5,013 | | Ongoing |
| | | | | |
OTHER DEPARTMENTAL | | | | | | | | | | |
Emergency Services CAD | | Various | | 9,450 | | 9,212 | | 238 | | |
Information systems development | | Various | | | | | | 1,585 | | Ongoing |
| | | | | | | | | | |
Total Other Capital Expenditure | | | | | | | | 15,582 | | |
| | | | | | | | | | |
Capital Grants | | | | | | | | | | |
Rural Fire Brigades | | Various | | | | | | 150 | | Ongoing |
State Emergency Service units | | Various | | | | | | 622 | | Ongoing |
| | | | | | | | | | |
Total Capital Grants | | | | | | | | 772 | | |
| | | | | | | | | | |
TOTAL DEPARTMENT OF EMERGENCY SERVICES | | | | | | | | 160,637 | | |
| | | | | | | | | | |
217
EMPLOYMENT AND INDUSTRIAL RELATIONS
Program Highlights
| | • | | Expenditure on capital items is expected to total $1.6 million in 2008-09. The department will be investing a further $0.40 million, in addition to the $0.74 million invested in 2007-08, to complete an information technology system for the Renewable and Photographic Licensing for Prescribed Occupations as required under the National Standard for the Licensing of Persons Performing High Risk Work. |
| | • | | Other key areas of expenditure will be focused mainly on ICT systems, replacement of operational equipment and new accommodation fit-outs. |
Employment and Industrial Relations
| | | | | | | | | | |
Project | | Statistical
Division | | Total
Estimated
Cost
$’000 | | Expenditure
to 30-06-08
$’000 | | Budget
2008-09
$’000 | | Post
2008-09
$’000 |
DEPARTMENT OF EMPLOYMENT AND INDUSTRIAL RELATIONS | | | | | | | | | | |
| | | | | |
Property, Plant and Equipment | | | | | | | | | | |
Plant and equipment | | Various | | | | | | 190 | | Ongoing |
Leasehold improvements | | Various | | | | | | 475 | | Ongoing |
| | | | | | | | | | |
Total Property, Plant and Equipment | | | | | | | | 665 | | |
| | | | | | | | | | |
Other Capital Expenditure | | | | | | | | | | |
Renewable and Photographic Licensing for Prescribed Occupations | | 05 | | 1,140 | | 740 | | 400 | | |
Information technology systems | | 05 | | 510 | | | | 510 | | |
| | | | | | | | | | |
Total Other Capital Expenditure | | | | | | | | 910 | | |
| | | | | | | | | | |
TOTAL DEPARTMENT OF EMPLOYMENT AND INDUSTRIAL RELATIONS | | | | | | | | 1,575 | | |
| | | | | | | | | | |
ENVIRONMENTAL PROTECTION AGENCY
The 2008-09 capital program for the Environmental Protection Agency (EPA) is $44.7 million and provides for the continuing protection of Queensland’s natural and cultural heritage through the ongoing replacement and construction of new infrastructure as well as funding significant land acquisitions. Such significant investment demonstrates the Government’s commitment to its priority of Managing climate change and protecting the environment.
Program Highlights
| | • | | $15.8 million for capital works on Parks, Forests and Administrative Building Works, for the construction of infrastructure on EPA estate. Of this $13.8 million relates to capital works on parks and forests and another $2 million relates to the Administrative Building Works program. A further $1.2 million has been allocated to three significant projects in the Great Barrier Reef Marine Park. |
| | • | | Funding of $0.5 million has been allocated for the completion of the Ma:Mu Canopy Walk which commenced construction in 2007-08 with a total cost of $10 million. |
| | • | | $20 million has been provided in 2008-09 for land acquisitions which relates to a 2006 election commitment for the purchase of rainforest and green land. |
218
Environmental Protection Agency
| | | | | | | | | | |
Project | | Statistical
Division | | Total
Estimated
Cost
$’000 | | Expenditure
to 30-06-08
$’000 | | Budget
2008-09
$’000 | | Post
2008-09
$’000 |
ENVIRONMENTAL PROTECTION AGENCY | | | | | | | | | | |
| | | | | |
Property, Plant and Equipment | | | | | | | | | | |
Plant and Equipment | | Various | | | | | | 2,960 | | Ongoing |
Capital Works—Parks and Forests | | | | | | | | | | |
Redevelopment of New Laura Ranger Base | | 50 | | 800 | | 59 | | 341 | | 400 |
Construction of new Cardwell Ranger Base | | 50 | | 620 | | 65 | | 555 | | |
Workshop and compound at Bunya Moutains National Park | | 20 | | 390 | | 10 | | 380 | | |
Replace amenities block at Waddy Point Campground | | 15 | | 373 | | 18 | | 355 | | |
Byfield Office Accommodation Redevelopment | | 30 | | 428 | | 42 | | 386 | | |
Waste treatment system at Waddy Point Ranger Base | | 15 | | 394 | | 40 | | 354 | | |
Pyramid Campground and day use area upgrade at Porcupine Gorge | | 55 | | 373 | | 83 | | 290 | | |
Continued redevelopment of Fleays Wildlife Park | | 12 | | 1,291 | | 791 | | 250 | | 250 |
Construction of new Mundubbera Ranger Base | | 15 | | 783 | | 283 | | 500 | | |
Heavy Plant Replacement Program | | Various | | 2,851 | | 2,101 | | 750 | | |
Radio Communications System expansion and upgrade | | Various | | 750 | | 250 | | 250 | | 250 |
Minor Works—Parks and Forests | | Various | | | | | | 9,341 | | Ongoing |
| | | | | | | | | | |
Sub-total Capital Works—Parks and Forests | | | | | | | | 13,752 | | |
| | | | | | | | | | |
219
Environmental Protection Agency, (continued)
| | | | | | | | | | |
Project | | Statistical
Division | | Total
Estimated
Cost
$’000 | | Expenditure
to 30-06-08
$’000 | | Budget
2008-09
$’000 | | Post
2008-09
$’000 |
Capital Works—Great Barrier Reef Marine Park | | | | | | | | | | |
Whitehave Beach Redevelopment | | 40 | | 665 | | 110 | | 555 | | |
Nara Inlet Boardwalk replacement | | 40 | | 269 | | | | 269 | | |
Tongue Point Walking Track Upgrade | | 40 | | 370 | | 30 | | 340 | | |
| | | | | | | | | | |
Sub-total Capital Works—Great Barrier Reef Marine Park | | | | | | | | 1,164 | | |
| | | | | | | | | | |
| | | | | |
Capital Works—Administrative Building Works | | | | | | | | | | |
Rockhampton Regional Office | | 30 | | 1,075 | | 275 | | 800 | | |
Administration Building—Townsville | | 45 | | 1,100 | | 150 | | 950 | | |
Minor Works—Administrative Building Works | | Various | | 250 | | | | 250 | | |
| | | | | | | | | | |
Sub-total Capital Works—Administrative Building Works | | | | | | | | 2,000 | | |
| | | | | | | | | | |
Rainforest/Green Land Acquisition | | Various | | 30,000 | | | | 20,000 | | 10,000 |
More Great Walks | | Various | | 5,035 | | 1,261 | | 2,734 | | 1,040 |
Ma:Mu Canopy Walk | | 50 | | 10,000 | | 9,500 | | 500 | | |
East Trinity Property Management | | 50 | | 1,588 | | 1,088 | | 500 | | |
Cape York Peninsula Heritage Act | | 50 | | 250 | | 102 | | 148 | | |
| | | | | | | | | | |
Total Property, Plant and Equipment | | | | | | | | 43,758 | | |
| | | | | | | | | | |
Other Capital Expenditure | | | | | | | | | | |
Various System Enhancements | | 05 | | | | | | 976 | | Ongoing |
| | | | | | | | | | |
Total Other Capital Expenditure | | | | | | 976 | | | | |
| | | | | | | | | | |
TOTAL ENVIRONMENTAL PROTECTION AGENCY | | | | | | 44,734 | | | | |
| | | | | | | | | | |
HEALTH
The total capital program for Queensland Health will see $1.024 billion invested in new capital acquisitions in 2008-09, which includes the Queensland Institute of Medical Research funding of $2.2 million.
Queensland Health
The Queensland Health capital works program is an important input into the delivery of health services and outputs that underpin the Government’s priorities of improving health care and strengthening services to the community and managing urban growth and building Queensland’s regions. The program also supports Queensland Health’s commitment to creating dependable health care and better health for all Queenslanders.
In 2008-09, Queensland Health will continue its capital investment across a broad range of health care settings including community health centres, hospitals, health technology, pathology and scientific services, renal, mental health, residential care, staff accommodation, and information and communication technologies. This program will ensure that health infrastructure and assets support the delivery of health services and contribute to improved health outcomes.
220
Program Highlights
| | • | | A total of $654.7 million will be invested in 2008-09 on major hospital projects. |
| | • | | $230.8 million in 2008-09 will be spent to continue the planning and development of the new tertiary hospitals at the Gold Coast, Sunshine Coast and the Queensland Children’s Hospital in Brisbane. Queensland will invest a total of $3.803 billion over a number of years to establish these new tertiary hospitals. |
| | • | | $37.5 million is planned to be expended in 2008-09 in the redevelopment of Cairns, Mackay and Mount Isa hospitals. A significant investment, expected to be in the order of $920 million, is foreshadowed for these projects. |
| | • | | it will also meet the cost of additional works in response to demand management requirements throughout the state, for which $100 million is allocated in 2008-09. |
| | • | | additionally, $21.7 million will be spent in 2008-09 on continuing the establishment of the Elective Surgery Centre at the QEII Hospital, with $3 million to be invested in elective surgery at Logan Hospital. |
| | • | | other hospital redevelopments at Bundaberg, Ingham, Robina, Rockhampton, the Prince Charles and Yeppoon Hospitals, and Emergency Department upgrades at the Princess Alexandra, Rockhampton, Redcliffe and Robina Hospitals will also be progressed. |
| | • | | overall, $1.070 billion will be invested over the next four years to increase bed capacity and expand health services at Bundaberg, Cairns, Rockhampton, Robina, Townsville, and Princess Alexandra Hospitals and on the Sunshine Coast. |
| | • | | In 2008-09, $140.4 million will be invested in continuing community based projects including a new Chronic Disease and Prevention Management Centre on Thursday Island, community health services at Cairns and Gladstone, South East Queensland Infrastructure Plan and Program (SEQIPP) initiatives at Browns Plains, North Lakes, Robina and Sunshine Coast, redevelopment of Miles and Weipa Hospitals. This includes $17.3 million to continue the delivery of primary health care centres at Hope Vale, Saibai Island and Yarrabah and a multi-purpose health service at Collinsville. |
| | • | | A feature of the expenditure on community health in 2008-09 is investment of $6.7 million in the provision of eight indigenous health hubs as part of the Government’s commitment to address alcohol and drug treatment requirements in Indigenous communities. These alcohol and drug treatment hubs will be established in Weipa, Mt Isa, Bamaga, Mossman, Cooktown, Palm Island, Woorabinda and Cherbourg. They will add significantly to the amount of social infrastructure in Indigenous communities that is a vital component of the Indigenous Health Equality intent and part of the Government’s program to reduce indigenous alcohol and substance abuse. |
| | • | | In 2008-09, $56.1 million will fund provision of health technology equipment. |
| | • | | The enhancement of Renal Services in Queensland will continue in 2008-09, with $3.2 million invested in renal projects at Princess Alexandra Hospital and Redland Hospital, home dialysis related services, and planning of renal services in areas including Kingaroy, Sunshine Coast and Logan. |
| | • | | $12.8 million will be invested in 2008-09 for mental health services. |
| | • | | Replacement of the residential aged care facility in Nambour will continue, with total planned expenditure of $13.8 million. |
| | • | | $17.4 million will be invested in 2008-09 towards projects to upgrade staff accommodation including $6.5 million for the Regional Accommodation program. Additionally, staff accommodation projects will continue at Cape York, Rockhampton and Roma. |
| | • | | $7.3 million will be invested in 2008-09 on the forensic laboratory, infrastructure and information systems upgrades for Forensic and Scientific Services. A major redesign and refit of the DNA testing |
221
| | laboratory will provide the environment and technologies necessary to perform High Sensitivity DNA analysis. The investment will also fund additional analytical equipment, upgrade accommodation, improve water conservation and water supply management and |
upgrade AUSLAB software.
| | • | | A total of $149.6 million, consisting of $73 million capital and $76.6 million non capital expenditure, will be invested in information and communication |
technology projects in 2008-09.
| | • | | A total of $44.5 million will be invested into projects across the program areas of Acute Care, Administration, Ambulatory Care, Chronic Disease Care, Clinical Support, Promotion, Protection and Prevention, Rehabilitation and Extended Care. These are a series of interlinked programs that will contribute to the objectives of the e-Health strategy. The e-Health strategy will enable the enhanced delivery of health services. Key highlights of this investment include: |
| | • | | ongoing statewide rollout of a new Radiology Information System enabling the reduction of time taken for radiologists to view, assess and diagnose medical problems significantly; |
| | • | | implementation of digital technology for breast screening that will enable faster communication of the results to patients and the potential for improved detection of breast cancer; |
| | • | | ongoing implementation of an Enterprise Discharge Summary to provide a more accurate care record to consumers and improve communication to General Practitioners; and |
| | • | | Information and Communication Technology projects to enable secured system access, integration of existing systems and manage reference datasets. |
| | • | | $28.5 million for information and communication technology equipment to replace, upgrade and provide future capacity/capability to support the e-Health strategy and clinical information solutions. This investment incorporates telephone system replacements, network and server upgrades. |
The Council of the Queensland Institute of Medical Research
The QIMR capital program in 2008-09 will total $2.2 million for acquisition of new or replacement equipment including computer software upgrade and state of the art scientific equipment.
222
Health
| | | | | | | | | | |
Project | | Statistical
Division | | Total
Estimated
Cost
$’000 | | Expenditure
to 30-06-08
$’000 | | Budget
2008-09
$’000 | | Post
2008-09
$’000 |
QUEENSLAND HEALTH | | | | | | | | | | |
| | | | | |
Property, Plant and Equipment | | | | | | | | | | |
Community Health Centres (CHC) | | | | | | | | | | |
Blackall Private Practice Clinic | | 35 | | 1,387 | | 951 | | 436 | | |
Browns Plains Health Precinct | | 05 | | 23,100 | | 9,823 | | 13,277 | | |
Caboolture Health Precinct | | 05 | | 21,000 | | 3,100 | | 9,795 | | 8,105 |
Cairns Central CHC | | 50 | | 12,674 | | 6,422 | | 500 | | 5,752 |
Gladstone Community, Mental and Oral Health consolidation | | 30 | | 15,950 | | 12,166 | | 3,709 | | 75 |
| | | | | |
Indigenous Alcohol Treatment and Rehabilitation | | Various | | 6,700 | | | | 6,700 | | |
Mackay Community Based Rehabilitation/Transition Service | | 40 | | 3,623 | | 3,023 | | 600 | | |
Miles Hospital redevelopment | | 20 | | 12,676 | | 11,610 | | 1,066 | | |
Moura Private Practice Clinic | | 30 | | 1,694 | | 1,483 | | 211 | | |
North Lakes Health Precinct | | 05 | | 52,000 | | 19,000 | | 30,182 | | 2,818 |
Nundah CHC | | 05 | | 14,141 | | 12,347 | | 1,794 | | |
Oral Health Queensland | | Various | | 14,150 | | | | 9,650 | | 4,500 |
Robina Health Precinct | | 07 | | 27,000 | | 10,773 | | 11,500 | | 4,727 |
Sunshine Coast Health Precinct | | 09 | | 15,000 | | 1,117 | | 6,697 | | 7,186 |
Thursday Island Chronic Disease Centre | | 50 | | 39,015 | | 1,088 | | 5,428 | | 32,499 |
Weipa Hospital redevelopment | | 50 | | 45,763 | | 27,151 | | 18,612 | | |
| | | | | | | | | | |
Sub-total Community Health Centres (CHC) | | | | | | | | 120,157 | | |
| | | | | | | | | | |
Multi-Purpose Health Service (MPHS) Collinsville Health Service | | 40 | | 11,261 | | 8,295 | | 2,966 | | |
| | | | | | | | | | |
Sub-total Multi-Purpose Health Service (MPHS) | | | | | | | | 2,966 | | |
| | | | | | | | | | |
| | | | | |
Primary Health Care Centres (PHCC) | | | | | | | | | | |
Erub (Darnley) Island | | 50 | | 6,875 | | 6,306 | | 569 | | |
Hope Vale PHCC | | 50 | | 12,539 | | 10,627 | | 1,912 | | |
Saibai Island Primary Health Care Centre | | 50 | | 5,685 | | 200 | | 5,485 | | |
Warraber Island | | 50 | | 4,777 | | 4,301 | | 476 | | |
Wondai PHCC | | 12 | | 2,603 | | 1,785 | | 818 | | |
Yarrabah PHCC | | 50 | | 15,774 | | 1,118 | | 8,000 | | 6,656 |
| | | | | | | | | | |
Sub-total Primary Health Care Centres (PHCC) | | | | | | | | 17,260 | | |
| | | | | | | | | | |
Hospitals | | | | | | | | | | |
Area Health Services Demand Management | | Various | | 297,500 | | | | 100,000 | | 197,500 |
Building works capital project management | | Various | | | | | | 881 | | Ongoing |
Bundaberg Hospital expansion | | 15 | | 41,100 | | 1,906 | | 6,733 | | 32,461 |
Cairns Base Hospital Redevelopment | | 50 | | 446,300 | | | | 24,200 | | 422,100 |
Cairns Hospital Emergency Dept (Additional bed capacity) | | 50 | | 11,100 | | 383 | | 7,617 | | 3,100 |
Dalby Hospital Outpatients, Emergency Department and Maternity | | 20 | | 11,067 | | 10,565 | | 502 | | |
223
Health, (continued)
| | | | | | | | | | |
Project | | Statistical
Division | | Total
Estimated
Cost $’000 | | Expenditure
to 30-06-08
$’000 | | Budget
2008-09
$’000 | | Post
2008-09
$’000 |
Gold Coast University Hospital | | 07 | | 1,549,000 | | 21,936 | | 103,730 | | 1,423,334 |
Ingham Hospital redevelopment | | 45 | | 36,984 | | 13,260 | | 16,215 | | 7,509 |
Innisfail Hospital redevelopment | | 50 | | 42,510 | | 41,113 | | 1,397 | | |
Mackay Annex | | 40 | | 1,700 | | 1,480 | | 220 | | |
Mackay Base Hospital Redevelopment | | 40 | | 405,618 | | | | 5,304 | | 400,314 |
Master planning studies | | Various | | | | | | 1,590 | | Ongoing |
Mt Isa Health Campus Redevelopment | | 55 | | 65,190 | | | | 8,000 | | 57,190 |
Princess Alexandra Hospital additional bed capacity | | 05 | | 52,000 | | 800 | | 8,000 | | 43,200 |
Princess Alexandra Hospital Emergency Department upgrade preparatory works | | 05 | | 18,300 | | 9,854 | | 8,446 | | |
Queensland Children’s Hospital | | 05 | | 1,044,000 | | 21,937 | | 97,520 | | 924,543 |
Redcliffe Hospital Emergency Department upgrade | | 05 | | 27,515 | | 22,658 | | 4,857 | | |
Robina Hospital expansion | | 07 | | 240,000 | | 1,169 | | 55,402 | | 183,429 |
Robina Hospital Emergency Department and Intensive Care Unit | | 07 | | 42,232 | | 37,332 | | 4,900 | | |
Rockhampton Hospital improvement | | 30 | | 74,000 | | 11,695 | | 31,658 | | 30,647 |
Sunshine Coast Hospital | | 09 | | 1,210,000 | | 53,553 | | 29,529 | | 1,126,918 |
Sunshine Coast Health Services District additional bed capacity | | 09 | | 191,000 | | 15,086 | | 54,251 | | 121,663 |
The Prince Charles Hospital upgrade | | 05 | | 135,200 | | 103,271 | | 31,929 | | |
Toowoomba Hospital Community-Based Care Services | | 20 | | 400 | | | | 400 | | |
Townsville General Hospital Birthing Centre | | 45 | | 1,000 | | 250 | | 750 | | |
Townsville General Hospital expansion | | 45 | | 84,000 | | 1,000 | | 10,000 | | 73,000 |
Yeppoon Hospital redevelopment | | 30 | | 20,600 | | 3,663 | | 15,937 | | 1,000 |
Elective Surgery | | | | | | | | | | |
Logan Elective Surgery | | 05 | | 3,400 | | 400 | | 3,000 | | |
Queen Elizabeth II Hospital Elective Surgery expansion | | 05 | | 34,500 | | 3,500 | | 21,773 | | 9,227 |
| | | | | | | | | | |
Sub-total Hospitals | | | | | | | | 654,741 | | |
| | | | | | | | | | |
| | | | | |
Health Technology Replacement | | | | | | | | | | |
Healthy Hearing | | Various | | 2,825 | | 1,847 | | 978 | | |
Health Technology equipment | | Various | | | | | | 50,000 | | Ongoing |
Program management | | Various | | | | | | 1,045 | | Ongoing |
Radiology Service Delivery | | Various | | 3,907 | | | | 2,407 | | 1,500 |
RCH—Healthy Hearing | | 05 | | 200 | | | | 200 | | |
Skin Cancer Policy | | Various | | 1,500 | | | | 1,500 | | |
| | | | | | | | | | |
Sub-total Health Technology Replacement | | | | | | | | 56,130 | | |
| | | | | | | | | | |
224
Health, (continued)
| | | | | | | | | | |
Project | | Statistical
Division | | Total
Estimated
Cost
$’000 | | Expenditure
to 30-06-08
$’000 | | Budget
2008-09
$’000 | | Post
2008-09
$’000 |
Renal Services | | | | | | | | | | |
Princess Alexandra Hospital Renal (8 Chairs) | | 05 | | 600 | | | | 600 | | |
Renal—5 New Self-Care chairs | | Various | | 300 | | | | 300 | | |
Renal—Home Dialysis Patient Education Centre | | Various | | 75 | | | | 75 | | |
Redland Hospital Renal (3 Chairs) | | 05 | | 200 | | | | 200 | | |
Sunshine/Logan/Kingaroy planning services | | Various | | 2,000 | | | | 2,000 | | |
| | | | | | | | | | |
Sub-total Renal Services | | | | | | | | 3,175 | | |
| | | | | | | | | | |
| | | | | |
Mental Health Services | | | | | | | | | | |
Bundaberg Mental Health Beds | | 15 | | 2,000 | | | | 2,000 | | |
The Park—Centre for Mental Health | | 05 | | 2,000 | | 1,245 | | 755 | | |
Queensland Mental Health—Community | | Various | | 11,236 | | 3,830 | | 3,386 | | 4,020 |
| | | | | |
Queensland Mental Health Plan | | Various | | 121,109 | | 5,585 | | 6,643 | | 108,881 |
| | | | | | | | | | |
Sub-total Mental Health Services | | | | | | | | 12,784 | | |
| | | | | | | | | | |
Pathology and Scientific Services | | | | | | | | | | |
Forensic Science Enhancement | | Various | | 15,200 | | 350 | | 7,250 | | 7,600 |
Queensland Health Scientific Services | | 05 | | 21,846 | | 20,846 | | 1,000 | | |
| | | | | | | | | | |
Sub-total Pathology and Scientific Services | | | | | | | | 8,250 | | |
| | | | | | | | | | |
Residential Aged Care Facilities Program | | | | | | | | | | |
Nambour Residential Aged Care Facility | | 09 | | 13,759 | | 993 | | 10,131 | | 2,635 |
| | | | | | | | | | |
Sub-total Residential Aged Care Facilities Program | | | | | | | | 10,131 | | |
| | | | | | | | | | |
Staff Accommodation Program | | | | | | | | | | |
Cape York staff accommodation-Kowanyama | | 50 | | 1,375 | | 75 | | 1,300 | | |
Cape York staff accommodation-Lockhart River | | 50 | | 954 | | 934 | | 20 | | |
Housing stock upgrade | | Various | | | | | | 1,000 | | Ongoing |
Injune staff accommodation | | 25 | | 1,256 | | 1,233 | | 23 | | |
Regional accommodation program | | Various | | 87,500 | | 80,971 | | 6,529 | | |
Rockhampton staff accommodation | | 30 | | 10,000 | | 9,000 | | 1,000 | | |
Roma Nurses Quarters | | 25 | | 11,436 | | 3,912 | | 7,524 | | |
| | | | | | | | | | |
Sub-total Staff Accommodation Program | | | | | | | | 17,396 | | |
| | | | | | | | | | |
Other Acquisitions of Property Plant and Equipment | | | | | | | | | | |
Capital Program Land Acquisition | | Various | | 86,127 | | 30,564 | | 10,000 | | 45,563 |
Critical Projects | | Various | | 7,346 | | 3,700 | | 3,646 | | |
Emergent works program | | Various | | | | | | 8,949 | | Ongoing |
Essential Infrastructure Projects | | Various | | 5,600 | | 3,600 | | 2,000 | | |
Health Contact Centre | | Various | | 8,762 | | 6,762 | | 2,000 | | |
Minor capital projects and1 acquisitions | | Various | | | | | | 16,538 | | Ongoing |
Princess Alexandra Hospital Power upgrade | | 05 | | 8,500 | | 7,750 | | 750 | | |
Urgent infrastructure initiatives | | Various | | 9,026 | | 8,460 | | 566 | | |
| | | | | | | | | | |
Sub-total Other Acquisitions of Property Plant and Equipment | | | | | | | | 44,449 | | |
| | | | | | | | | | |
225
Health, (continued)
| | | | | | | | | | |
Project | | Statistical
Division | | Total
Estimated
Cost
$’000 | | Expenditure
to 30-06-08
$’000 | | Budget
2008-09
$’000 | | Post
2008-09
$’000 |
Information Technology Equipment | | | | | | | | | | |
Information Technology equipment acquisition | | Various | | | | | | 28,566 | | Ongoing |
| | | | | | | | | | |
Sub-total Information Technology Equipment | | | | | | | | 28,566 | | |
| | | | | | | | | | |
Total Property, Plant and Equipment | | | | | | | | 976,005 | | |
| | | | | | | | | | |
Other Capital Expenditure | | | | | | | | | | |
Information and Communication Technology2 | | | | | | | | | | |
Acute Care | | Various | | 42,244 | | 6,472 | | 23,600 | | 12,172 |
Administration | | Various | | 37,670 | | | | 1,000 | | 36,670 |
Ambulatory Care | | Various | | 5,959 | | 2,102 | | 327 | | 3,530 |
Chronic Disease Care | | Various | | 24,026 | | 8,322 | | 4,714 | | 10,990 |
Clinical Support | | Various | | 34,278 | | 7,857 | | 1,637 | | 24,784 |
Information Technology | | Various | | 38,509 | | 943 | | 2,995 | | 34,571 |
Promotion, Protection and Prevention | | Various | | 17,691 | | 4,081 | | 8,371 | | 5,239 |
Rehabilitation and Extended Care | | Various | | 3,500 | | | | 1,000 | | 2,500 |
IT—Contingency and Emergent needs | | Various | | | | | | 857 | | Ongoing |
| | | | | | | | | | |
Sub-total Information and Communication Technology | | | | | | | | 44,501 | | |
| | | | | | | | | | |
Inventory movement | | Various | | | | | | 1,521 | | Ongoing |
| | | | | | | | | | |
Total Other Capital Expenditure | | | | | | | | 46,022 | | |
| | | | | | | | | | |
TOTAL QUEENSLAND HEALTH | | | | | | | | 1,022,027 | | |
| | | | | | | | | | |
| | | | | |
THE COUNCIL OF THE QUEENSLAND INSTITUTE OF MEDICAL RESEARCH | | | | | | | | | | |
| | | | | |
Property, Plant and Equipment | | | | | | | | | | |
Other scientific equipment | | 05 | | | | | | 2,232 | | Ongoing |
| | | | | | | | | | |
Total Property, Plant and Equipment | | | | | | | | 2,232 | | |
| | | | | | | | | | |
TOTAL THE COUNCIL OF THE QUEENSLAND INSTITUTE OF MEDICAL RESEARCH | | | | | | | | 2,232 | | |
| | | | | | | | | | |
TOTAL HEALTH | | 1,024,259 | | |
| | | | | | | | | | |
Notes:
| 1. | Amount is net of $23.5 million non-capital component of project expenditure |
| 2. | Information and Communication Technology amount is net of $76.6 million non-capital component of project expenditure |
226
HOUSING
The department’s 2008-09 capital program of $516.9 million underpins the provision of a range of social housing solutions across the department’s outputs and includes $125 million from the Queensland Future Growth Fund.
In 2008-09, the department will continue to address the challenges of increasing demand for social housing that results from rising living costs and decreasing availability of affordable housing in the private market. Expanding the supply of social housing and improving access to housing assistance for those clients in greatest need will continue to be a priority, as will the continuing development of new products and services to assist people to find or maintain a private rental home or buy their own home.
The Queensland Government’s four-year, $235.5 million Responding to Homelessness initiative reaches its conclusion in 2008-09. The department’s capital funding commitment of $7.4 million in the final year of this initiative will further expand the housing supply to accommodate people at risk or already experiencing homelessness.
The department will provide a further $11 million in 2008-09 as part of the Government’s Spinal Cord Injuries Initiative to commence the construction of 11 dwellings, complete 23 dwellings and acquire land to facilitate future construction. This cross-agency initiative will provide housing and support to assist people with spinal injuries to leave hospital when they no longer require hospital care.
Under the Council of Australian Governments’ National Mental Health Plan, the Queensland Government has allocated $10 million in 2008-09 to fund the purchase of 35 dwellings across Queensland to provide housing for clients with severe mental illness and moderate to high support needs.
Program Highlights
The department will expand the supply and improve the amenity of social housing dwellings through capital investment and capital grant funding including:
| | • | | $304.2 million in funding for the Public Housing and Aboriginal and Torres Strait Islander Housing rental programs and the Long Term Community Housing Program to: |
| | • | | purchase or commence construction of 634 dwellings, complete construction of 375 dwellings commenced in previous years, and purchase and develop land to facilitate future construction of social housing dwellings; and |
| | • | | enhance the condition of existing social housing dwellings through general upgrades. |
| | • | | $74.3 million in funding for upgrades to existing properties and new and replacement dwellings for the 34 Aboriginal and Torres Strait Islander communities. Construction will be completed on 103 new dwellings, 35 dwellings replaced and 271 dwellings upgraded. In addition, construction will commence on seven new dwellings and 14 properties will be purchased outside of Indigenous communities |
| | • | | $63.4 million in funding for Community-managed Housing—Studio Units to purchase or commence construction of 210 dwellings, complete construction of 193 dwellings commenced in previous years, upgrade existing dwellings and acquire land to facilitate future construction |
| | • | | $13.5 million in funding for the Crisis Accommodation Program to commence construction of two shelters comprising of 12 units of accommodation, complete construction of 19 dwellings and six shelters comprising of over 20 units of accommodation, purchase eight dwellings and upgrade existing dwellings and shelters |
| | • | | $4.9 million to complete the redevelopment of the Lady Bowen Complex to provide housing options for people at risk of homelessness in inner Brisbane |
227
| | • | | $5 million in capital grants to the Brisbane Housing Company that, combined with allocations from previous years, will provide approximately 111 dwellings to low-income households throughout the year |
| | • | | $2.6 million in capital grants for the Gold Coast Housing Company to provide affordable housing to low-income households on the Gold Coast |
| | • | | $15.6 million in capital grants to complete construction of up to 117 dwellings for affordable housing in the Whitsunday and Gold Coast regions |
| | • | | $13.5 million in funding to acquire suitable land for housing development to assist with increasing the supply of affordable housing. |
The department will continue to create better opportunities and outcomes in renewal communities through the allocation of $4.5 million towards improving community facilities and neighbourhood amenities in targeted areas of Queensland under the Community Renewal program.
228
Housing
| | | | | | | | | | |
Project | | Statistical
Division | | Total
Estimated
Cost
$’000 | | Expenditure
to 30-06-08
$’000 | | Budget
2008-09
$’000 | | Post
2008-09
$’000 |
DEPARTMENT OF HOUSING | | | | | | | | | | |
| | | | | |
Property, Plant and Equipment | | | | | | | | | | |
SOCIAL RENTAL HOUSING | | | | | | | | | | |
Construction | | | | | | | | | | |
Brisbane | | | | | | | | | | |
Detached Houses1 | | 05 | | | | | | 6,725 | | Ongoing |
Medium Density1 | | 05 | | | | | | 60,203 | | Ongoing |
Gold Coast | | | | | | | | | | |
Detached Houses1 | | 07 | | | | | | 1,136 | | Ongoing |
Medium Density | | 07 | | | | | | 5,571 | | Ongoing |
Sunshine Coast | | | | | | | | | | |
Detached Houses1 | | 09 | | | | | | 657 | | Ongoing |
Medium Density | | 09 | | | | | | 4,597 | | Ongoing |
Seniors’ Units1 | | 09 | | | | | | 549 | | Ongoing |
Wide Bay-Burnett | | | | | | | | | | |
Detached Houses1 | | 15 | | | | | | 2,367 | | Ongoing |
Medium Density1 | | 15 | | | | | | 7,127 | | Ongoing |
Darling Downs | | | | | | | | | | |
Detached Houses1 | | 20 | | | | | | 2,912 | | Ongoing |
Medium Density1 | | 20 | | | | | | 3,928 | | Ongoing |
Fitzroy | | | | | | | | | | |
Detached Houses | | 30 | | | | | | 1,323 | | Ongoing |
Medium Density1 | | 30 | | | | | | 7,403 | | Ongoing |
Mackay | | | | | | | | | | |
Detached Houses | | 40 | | | | | | 2,676 | | Ongoing |
Medium Density1 | | 40 | | | | | | 3,424 | | Ongoing |
Seniors’ Units1 | | 40 | | | | | | 291 | | Ongoing |
Northern | | | | | | | | | | |
Detached Houses | | 45 | | | | | | 1,240 | | Ongoing |
Medium Density1 | | 45 | | | | | | 9,820 | | Ongoing |
Far North | | | | | | | | | | |
Detached Houses1 | | 50 | | | | | | 3,354 | | Ongoing |
Medium Density1 | | 50 | | | | | | 5,342 | | Ongoing |
Seniors’ Units | | 50 | | | | | | 1,140 | | Ongoing |
North West | | | | | | | | | | |
Detached Houses | | 55 | | | | | | 510 | | Ongoing |
Medium Density1 | | 55 | | | | | | 3,069 | | Ongoing |
Various | | Various | | | | | | 2,866 | | Ongoing |
| | | | | | | | | | |
Sub-total Construction | | | | | | | | 138,230 | | |
| | | | | | | | | | |
Capital Works on Existing Dwellings | | | | | | | | | | |
Brisbane | | 05 | | | | | | 43,787 | | Ongoing |
Gold Coast | | 07 | | | | | | 4,423 | | Ongoing |
Sunshine Coast | | 09 | | | | | | 2,285 | | Ongoing |
Wide Bay-Burnett | | 15 | | | | | | 1,966 | | Ongoing |
Darling Downs | | 20 | | | | | | 3,042 | | Ongoing |
229
Housing, (continued)
| | | | | | | | | | |
Project | | Statistical
Division | | Total
Estimated
Cost
$’000 | | Expenditure
to 30-06-08
$’000 | | Budget
2008-09
$’000 | | Post
2008-09
$’000 |
Fitzroy | | 30 | | | | | | 4,063 | | Ongoing |
Mackay | | 40 | | | | | | 4,057 | | Ongoing |
Northern | | 45 | | | | | | 6,212 | | Ongoing |
Far North | | 50 | | | | | | 5,698 | | Ongoing |
North West | | 55 | | | | | | 1,967 | | Ongoing |
Various | | Various | | | | | | 2,960 | | Ongoing |
| | | | | | | | | | |
Sub-total Capital Works on Existing Dwellings | | | | | | | | 80,460 | | |
| | | | | | | | | | |
Land Purchases and Improvement of Land | | Various | | | | | | 35,475 | | Ongoing |
Purchase of Existing Properties | | Various | | | | | | 101,900 | | Ongoing |
| | | | | | | | | | |
Sub-total SOCIAL RENTAL HOUSING | | | | | | | | 356,065 | | |
| | | | | | | | | | |
INDIGENOUS COMMUNITY HOUSING | | | | | | | | | | |
Purchase of Existing Properties | | Various | | | | | | 5,000 | | Ongoing |
CRISIS HOUSING | | | | | | | | | | |
Construction | | | | | | | | | | |
Brisbane 1 | | 05 | | | | | | 2,706 | | Ongoing |
Gold Coast | | 07 | | | | | | 291 | | Ongoing |
Wide Bay-Burnett 1 | | 15 | | | | | | 997 | | Ongoing |
Fitzroy 1 | | 30 | | | | | | 566 | | Ongoing |
Mackay | | 40 | | | | | | 1,255 | | Ongoing |
Various | | Various | | | | | | 185 | | Ongoing |
| | | | | | | | | | |
Sub-total Construction | | | | | | | | 6,000 | | |
| | | | | | | | | | |
Capital Works on Existing Dwellings | | | | | | | | | | |
Brisbane | | 05 | | | | | | 4,900 | | Ongoing |
Various | | Various | | | | | | 500 | | Ongoing |
| | | | | | | | | | |
Sub-total Capital Works on Existing Dwellings | | | | | | | | 5,400 | | |
| | | | | | | | | | |
Purchase of Existing Properties | | Various | | | | | | 3,000 | | Ongoing |
| | | | | | | | | | |
Sub-total CRISIS HOUSING | | | | | | | | 14,400 | | |
| | | | | | | | | | |
PRIVATE MARKET ASSISTANCE | | | | | | | | | | |
Land Purchases and Development | | | | | | | | | | |
Brisbane | | 05 | | | | | | 1,000 | | Ongoing |
Various | | Various | | | | | | 13,500 | | Ongoing |
| | | | | | | | | | |
Sub-total Land Purchases and Development | | | | | | | | 14,500 | | |
| | | | | | | | | | |
Purchase of Existing Properties | | | | | | | | | | |
Sunshine Coast | | 09 | | | | | | 2,440 | | Ongoing |
Wide Bay-Burnett | | 15 | | | | | | 580 | | Ongoing |
| | | | | | | | | | |
Sub-total Purchase of Existing Properties | | | | | | | | 3,020 | | |
| | | | | | | | | | |
Investment | | Various | | | | | | 300 | | Ongoing |
| | | | | | | | | | |
Sub-total PRIVATE MARKET ASSISTANCE | | | | | | | | 17,820 | | |
| | | | | | | | | | |
PLANT & EQUIPMENT | | | | | | | | | | |
Property, Plant & Equipment | | Various | | | | | | 570 | | Ongoing |
| | | | | | | | | | |
Sub-total PLANT & EQUIPMENT | | | | | | | | 570 | | |
| | | | | | | | | | |
Total Property, Plant and Equipment | | | | | | | | 393,855 | | |
| | | | | | | | | | |
230
Housing, (continued)
| | | | | | | | | | |
Project | | Statistical
Division | | Total
Estimated
Cost
$’000 | | Expenditure
to 30-06-08
$’000 | | Budget
2008-09
$’000 | | Post
2008-09
$’000 |
Other Capital Expenditure | | | | | | | | | | |
Intangibles | | Various | | | | | | 5,630 | | Ongoing |
| | | | | | | | | | |
Total Other Capital Expenditure | | | | | | | | 5,630 | | |
| | | | | | | | | | |
Capital Grants | | | | | | | | | | |
SOCIAL RENTAL HOUSING | | | | | | | | | | |
Brisbane | | 05 | | | | | | 5,000 | | Ongoing |
Gold Coast | | 07 | | | | | | 15,499 | | Ongoing |
Wide Bay-Burnett | | 15 | | | | | | 422 | | Ongoing |
Darling Downs | | 20 | | | | | | 569 | | Ongoing |
South West | | 25 | | | | | | 869 | | Ongoing |
Fitzroy | | 30 | | | | | | 1,215 | | Ongoing |
Central West | | 35 | | | | | | 31 | | Ongoing |
Mackay | | 40 | | | | | | 3,523 | | Ongoing |
Northern | | 45 | | | | | | 2,571 | | Ongoing |
Far North | | 50 | | | | | | 336 | | Ongoing |
North West | | 55 | | | | | | 682 | | Ongoing |
Various | | Various | | | | | | 8,648 | | Ongoing |
| | | | | | | | | | |
Sub-total SOCIAL RENTAL HOUSING | | | | | | | | 39,365 | | |
| | | | | | | | | | |
INDIGENOUS COMMUNITY HOUSING | | | | | | | | | | |
Wide Bay-Burnett | | 15 | | | | | | 704 | | Ongoing |
Fitzroy | | 30 | | | | | | 2,034 | | Ongoing |
Northern | | 45 | | | | | | 3,601 | | Ongoing |
Far North | | 50 | | | | | | 52,300 | | Ongoing |
North West | | 55 | | | | | | 10,637 | | Ongoing |
| | | | | | | | | | |
Sub-total INDIGENOUS COMMUNITY HOUSING | | | | | | | | 69,276 | | |
| | | | | | | | | | |
| | | | | |
CRISIS HOUSING | | | | | | | | | | |
Capital Grants | | Various | | | | | | 4,000 | | Ongoing |
PRIVATE MARKET ASSISTANCE | | | | | | | | | | |
Capital Grants | | Various | | | | | | 300 | | Ongoing |
COMMUNITY RENEWAL | | | | | | | | | | |
Brisbane | | 05 | | | | | | 2,020 | | Ongoing |
Gold Coast | | 07 | | | | | | 1,300 | | Ongoing |
Northern | | 45 | | | | | | 988 | �� | Ongoing |
Far North | | 50 | | | | | | 150 | | Ongoing |
| | | | | | | | | | |
Sub-total COMMUNITY RENEWAL | | | | | | | | 4,458 | | |
| | | | | | | | | | |
Total Capital Grants | | | | | | | | 117,399 | | |
| | | | | | | | | | |
TOTAL DEPARTMENT OF HOUSING | | | | | | | | 516,884 | | |
| | | | | | | | | | |
Note:
| 1. | Funded fully or in part under the Queensland Future Growth Fund |
231
INFRASTRUCTURE AND PLANNING
The 2008-09 capital expenditure budget for Infrastructure and Planning, including Property Services Group, water infrastructure projects and Airport Link is $2.450 billion.
The department’s role is to guide major resource and infrastructure projects to fruition, to ensure the timely delivery of both social and economic infrastructure in a way which is not only sustainable but which also delivers benefits to all Queenslanders and to lead local, regional, statewide planning initiatives and land use. The Government has established a number of special purpose vehicles to provide rigorous governance, management and delivery of major infrastructure including the Western Corridor Recycled Water Project, Southern Regional Water Pipeline, South East Queensland (Gold Coast) Desalination Plant, other key water infrastructure projects and the Airport Link toll road and initial stages of the Northern Busway.
Program Highlights
| | • | | Western Corridor Recycled Water Project—design, construction and operation of the largest recycled water project in Australia will continue, including development of advanced water treatment plants and approximately 200 kilometres of pipeline as part of the Government’s solutions to secure South East Queensland’s water supply future by supplying purified recycled water to industry and to supplement supply to the Wivenhoe Dam. |
| | • | | South East Queensland (Gold Coast) Desalination Plant—construction of the 125 megalitres per day desalination plant at Tugun will continue. The project has an estimated total cost of $1.209 billion, of which $448.1 million is projected to be spent in 2008-09. The project demonstrates the Government’s commitment to providing vital rainfall independent water infrastructure for South East Queensland and is on schedule to commence operations in November 2008. The project is currently a joint project between the State Government and the Gold Coast City Council (GCCC). The State is proposing to purchase the balance of the GCCC shares in the project by 30 June 2008 to acquire full ownership of the asset. |
| | • | | Southern Regional Water Pipeline—construction of the 130 megalitres per day two-way $901 million Southern Regional Water Pipeline between Brisbane and the Gold Coast will be completed by November 2008, including laying approximately 96 kilometres of pipeline and construction of ancillary works. |
| | • | | Northern Pipeline Interconnectors—Stage 1 involves the construction of a 47 kilometre pipeline to transport up to 65 million litres of potable water per day from Landers Shute Water Treatment Plant to Morayfield Reservoirs and will be completed by December 2008. The investigation and assessment for Stage 2 of the Northern Pipeline Interconnectors will continue to determine preferred alignment for the pipeline between Landers Shute and Noosa Water Transport Plant near Cooroy. |
| | • | | Eastern Pipeline Interconnectors—involves the construction of an additional reservoir at Heinemann Road in Redland City and an 8.6 kilometre pipeline and pump station to link to Kimberley Park in Logan City. The works will connect Redland City to the South East Queensland Water Grid and be completed by December 2008. |
| | • | | Traveston Crossing and Wyaralong Dams—work will continue on the environmental impact assessment processes and subject to approval, commencement of construction for the proposed Traveston Crossing Dam and the proposed Wyaralong Dam to meet expected delivery times to address the long-term water demands of the South East Queensland region. The Traveston Crossing Dam will involve the construction of a 153,000 million litre storage delivering up to 70,000 million litres per annum. The Wyaralong Dam will involve the construction of 103,000 million litre storage. When operating with the recently completed Cedar Grove Weir and Bromelton Offstream storage, it will provide 26,000 million litres per year to the people of South East Queensland. |
232
| | • | | Airport Link—construction of the Airport Link toll road, from Windsor to Clayfield and sections of the Northern Busway, will most likely commence around the end of 2008, with the project open in 2012. |
| | • | | Stanwell—Gladstone Infrastructure Corridor—the department will continue the development of the corridor. The corridor will be able to accommodate up to seven underground pipelines in a single area for uses including water, mineral slurries and telecommunication cables. The project will deliver essential services and efficiently transport industrial material throughout the area. |
| | • | | The South East Queensland (SEQ) Water Grid Manager—will manage and oversee the operation of the SEQ Water Grid to ensure security of supply. To do this, the SEQ Water Grid manager will purchase water services from the supply and transport services and sell water to the retailers and other Grid customers. The SEQ Water Grid Manager will also ensure that SEQ water sources are secure and stable into the future. In 2008-09 the SEQ Water Grid Manager will begin operation and is projected to spend $2.6 million on initial capital set up costs. |
Property Services Group
The Property Services Group delivers the property services component of the Industry Location Scheme. Key functions of the group include the acquisition, planning and development of land for business and industry locating to or expanding in Queensland.
The Group’s capital expenditure plan for 2008-09 totals $109.8 million. Construction of the following projects is expected to proceed in 2008-09 once development approvals are obtained:
| | • | | $26.6 million to construct Stage 1 of the Coolum Industrial Estate |
| | • | | $6.0 million to construct Stage 6 of the Bohle Industrial Estate |
| | • | | $6.9 million to complete development of the South Mackay Industrial Estate |
| | • | | $2.0 million to complete construction of the Yandina Industrial Estate expansion. |
The following land acquisitions are planned for 2008-09, subject to negotiations:
| | • | | $2.0 million for the acquisition of additional land for the Amberley Aerospace Park |
| | • | | $8.0 million for the acquisition of land for the future development of industrial estates in Far North Queensland |
| | • | | $11.0 million for the acquisition of land to extend the Gladstone State Development Area |
| | • | | $6.0 million for the acquisition of land for the future development of industrial estates in the Mackay region |
| | • | | $2.0 million for the acquisition of land for the future development of industrial estates in the Rockhampton region; and |
| | • | | $6.5 million for continued acquisitions within South East Queensland for the future development of industrial estates. |
233
Infrastructure and Planning
| | | | | | | | | | |
Project | | Statistical
Division | | Total
Estimated
Cost
$’000 | | Expenditure
to 30-06-08
$’000 | | Budget
2008-09
$’000 | | Post
2008-09
$’000 |
DEPARTMENT OF INFRASTRUCTURE AND PLANNING | | | | | | | | | | |
| | | | | |
Property, Plant and Equipment | | | | | | | | | | |
Targinie Precinct | | 30 | | 57,000 | | 45,800 | | 10,000 | | 1,200 |
Hardrock Haulage Roads | | 05 | | 23,450 | | 19,000 | | 4,450 | | |
Stanwell to Gladstone Infrastructure Corridor | | 30 | | 8,108 | | | | 8,108 | | |
Townsville State Development Area | | 45 | | 7,500 | | 4,100 | | 3,400 | | |
Other capital expenditure | | 05 | | | | | | 127 | | Ongoing |
| | | | | | | | | | |
Total Property, Plant and Equipment | | | | | | | | 26,085 | | |
| | | | | | | | | | |
| | | | | |
Capital Grants | | | | | | | | | | |
South East Queensland Regional Recreational Trails | | Various | | 7,800 | | 1,400 | | 2,300 | | 4,100 |
| | | | | | | | | | |
Total Capital Grants | | | | | | | | 2,300 | | |
| | | | | | | | | | |
TOTAL DEPARTMENT OF INFRASTRUCTURE AND PLANNING | | | | | | | | 28,385 | | |
| | | | | | | | | | |
PROPERTY SERVICES GROUP | | | | | | | | | | |
| | | | | |
Property, Plant and Equipment | | | | | | | | | | |
Asset replacement program | | 05 | | | | | | 20 | | Ongoing |
| | | | | | | | | | |
Total Property, Plant and Equipment | | | | | | | | 20 | | |
| | | | | | | | | | |
Other Capital Expenditure | | | | | | | | | | |
Land Development | | | | | | | | | | |
Amberley Aerospace Park | | 05 | | 30,551 | | 974 | | 1,000 | | 28,577 |
Bohle Industrial Estate Stage 6 | | 45 | | 10,250 | | 1,204 | | 6,046 | | 3,000 |
Brisbane Innovation Park | | 05 | | 5,000 | | 280 | | 2,220 | | 2,500 |
Charlton North Industrial Estate | | 20 | | 17,840 | | 1,272 | | 6,568 | | 10,000 |
Clinton Industrial Park—Blain Drive | | 30 | | 3,000 | | 500 | | 2,000 | | 500 |
Clinton Industrial Estate—Red Rover Precinct | | 30 | | 10,500 | | | | 100 | | 10,400 |
Coolum Industrial Estate—Stage 1 | | 09 | | 30,297 | | 3,659 | | 26,638 | | |
Coomera Government Precinct | | 07 | | 4,250 | | | | 4,250 | | |
Crestmead Industrial Estate—Stage 6 | | 05 | | 4,400 | | 385 | | 4,015 | | |
Ebenezer Industrial Precinct | | 05 | | 30,850 | | 350 | | 500 | | 30,000 |
Gladstone State Development Area—service infrastructure | | 30 | | 25,500 | | | | 500 | | 25,000 |
Moonaboola Industrial Estate | | 15 | | 6,250 | | | | 50 | | 6,200 |
Mount Isa Nordale Industrial Estate | | 55 | | 2,650 | | 150 | | 2,500 | | |
Narangba Industrial Estate | | 05 | | 5,750 | | 250 | | 5,500 | | |
South Mackay Industrial Estate | | 40 | | 9,008 | | 2,116 | | 6,892 | | |
Sunshine Coast Industrial Park | | 09 | | 57,536 | | 55,055 | | 2,481 | | |
Yandina Industrial Estate | | 09 | | 7,935 | | 5,935 | | 2,000 | | |
Minor works | | Various | | | | | | 500 | | Ongoing |
| | | | | | | | | | |
Sub-total Land Development | | | | | | | | 73,760 | | |
| | | | | | | | | | |
234
Infrastructure and Planning, (continued)
| | | | | | | | | | |
Project | | Statistical
Division | | Total
Estimated
Cost $’000 | | Expenditure
to 30-06-08
$’000 | | Budget
2008-09
$’000 | | Post
2008-09
$’000 |
Land Purchases | | | | | | | | | | |
Amberley Aerospace Park | | 05 | | 5,428 | | 3,428 | | 2,000 | | |
Far North Queensland Strategic Land | | 50 | | 8,000 | | | | 8,000 | | |
Gladstone State Development Area Land | | 30 | | 11,000 | | | | 11,000 | | |
Mackay Region Industrial Land | | 40 | | 6,000 | | | | 6,000 | | |
Rockhampton Region Industrial Land | | 30 | | 2,000 | | | | 2,000 | | |
South East Queensland Strategic Land | | 12 | | 28,958 | | 12,468 | | 6,490 | | 10,000 |
Minor land acquisitions | | Various | | | | | | 500 | | Ongoing |
| | | | | | | | | | |
Sub-total Land Purchases | | | | | | | | 35,990 | | |
| | | | | | | | | | |
Total Other Capital Expenditure | | | | | | | | 109,750 | | |
| | | | | | | | | | |
TOTAL PROPERTY SERVICES GROUP | | | | | | | | 109,770 | | |
| | | | | | | | | | |
WATER INFRASTRUCTURE PROJECTS | | | | | | | | | | |
| | | | | |
Property, Plant and Equipment | | | | | | | | | | |
Western Corridor Recycled Water Project | | Various | | 2,493,000 | | 1,698,000 | | 795,000 | | |
Traveston Crossing Dam—Stage 1 | | Various | | 1,592,000 | | 431,818 | | 442,300 | | 717,882 |
Southern Regional Water Pipeline | | Various | | 901,000 | | 683,647 | | 217,353 | | |
Northern Pipeline Interconnectors | | Various | | 849,000 | | 254,221 | | 219,779 | | 375,000 |
Wyaralong Dam | | 12 | | 333,000 | | 28,048 | | 89,497 | | 215,455 |
South East Queensland (Gold Coast) Desalination Plant | | 07 | | 1,209,000 | | 760,891 | | 448,109 | | |
Eastern Pipeline Interconnectors | | 05 | | 38,000 | | 21,302 | | 16,698 | | |
| | | | | | | | | | |
Total Property, Plant and Equipment | | | | | | | | 2,228,736 | | |
| | | | | | | | | | |
TOTAL WATER INFRASTRUCTURE PROJECTS | | | | | | | | 2,228,736 | | |
| | | | | | | | | | |
SEQ WATER GRID MANAGER | | | | | | | | | | |
| | | | | |
Property, Plant and Equipment | | | | | | | | | | |
Plant and Equipment | | 05 | | 3,140 | | 512 | | 2,628 | | |
| | | | | | | | | | |
Total Property, Plant and Equipment | | | | | | | | 2,628 | | |
| | | | | | | | | | |
TOTAL SEQ WATER GRID MANAGER | | | | | | | | 2,628 | | |
| | | | | | | | | | |
AIRPORT LINK | | | | | | | | | | |
Property, Plant and Equipment | | | | | | | | | | |
Airport Link1 | | 05 | | 258,711 | | 115,301 | | 80,410 | | 63,000 |
| | | | | | | | | | |
Total Property, Plant and Equipment | | | | | | | | 80,410 | | |
| | | | | | | | | | |
TOTAL AIRPORT LINK | | | | | | | | 80,410 | | |
| | | | | | | | | | |
TOTAL INFRASTRUCTURE AND PLANNING | | | | | | | | 2,449,929 | | |
| | | | | | | | | | |
Note:
| 1. | Total estimated cost includes land acquisition and early works, but excludes expenditure on land acquisition undertaken by the Department of Main Roads for the project ($36.3 million), and the additional expenditure announced for the project on 19 May 2008, due to timing of contractual close. |
235
JUSTICE AND ATTORNEY-GENERAL
The 2008-09 capital expenditure program for Justice and Attorney-General (Department of Justice and Attorney-General, Public Trust Office, Legal Aid Queensland, Crime and Misconduct Commission and Anti-Discrimination Commission Queensland) is $332.7 million.
The Department of Justice and Attorney-General’s capital expenditure program for 2008-09 is $318.7 million. The department’s capital program focuses on designing, constructing and managing facilities and assets to ensure the services in the justice system are effective, accessible and safe.
Program Highlights
| | • | | $236.2 million is provided for the construction of the new Supreme and District Courts complex. |
| | • | | $52.4 million is provided for the construction of a new courthouse and watchhouse at Ipswich to cope with the growing population in this area. This is part of a combined facility including a watchhouse and a police station. |
| | • | | $2.9 million is provided to construct a courthouse at Mareeba. The courthouse, featuring a high-tech courtroom, prisoner holding cells and facilities for victims of crime and vulnerable witnesses, will form part of a project with a new police station and watchhouse. |
| | • | | $2.8 million is provided for the fitting out of floor four of the Brisbane Magistrate Court (BMC). This floor was not fitted out at the time of construction of the BMC. |
| | • | | $4.6 million is provided to further develop the Integrated Justice Information Strategy which will deliver improved information sharing and operational efficiencies across the criminal justice system. |
The 2008-09 capital expenditure program for the Public Trust Office is $8 million. This expenditure will enable the office to continue to provide a wide range of efficient services to the Queensland community on a self funded basis. The Public Trust Office will source the investment for these capital assets from its own funds at no cost to Government. The Public Trust Office will spend $5 million on two new office buildings to continue delivery of services in areas of greatest need in South East Queensland and $2.1 million on the refurbishment of existing offices throughout Queensland.
Legal Aid Queensland will invest $3.1 million in capital projects in 2008-09, including $0.70 million on new leased accommodation in North Quay for dispute resolution conferencing.
The 2008-09 capital expenditure program for the Crime and Misconduct Commission (CMC) is $2.5 million. The CMC will be relocating from Terrica Place to Green Square in Fortitude Valley in 2008. The CMC will invest $13.6 million in relation to fitout costs associated with this relocation, the majority of which was expended in 2007-08. In addition, the CMC will invest $0.78 million in capital projects relating to computer and motor vehicle replacements in 2008-09.
The 2008-09 capital expenditure program for the Anti-Discrimination Commission Queensland is $0.43 million. One-off funding of $0.39 million will be spent in 2008-09 on the development and implementation of a new Case Management System.
236
Justice and Attorney-General
| | | | | | | | | | |
Project | | Statistical
Division | | Total
Estimated
Cost
$’000 | | Expenditure
to 30-06-08
$’000 | | Budget
2008-09
$’000 | | Post
2008-09
$’000 |
DEPARTMENT OF JUSTICE AND ATTORNEY-GENERAL | | | | | | | | | | |
Property, Plant and Equipment | | | | | | | | | | |
Ipswich, land purchase and new courthouse | | 05 | | 91,510 | | 34,045 | | 52,416 | | 5,049 |
Brisbane Supreme and District Court complex | | 05 | | 600,000 | | 9,050 | | 236,226 | | 354,724 |
Pine Rivers, land purchase and new courthouse | | 05 | | 10,800 | | 10,055 | | 745 | | |
Mareeba Courthouse | | 50 | | 6,078 | | 3,211 | | 2,867 | | |
Brisbane Magistrate Court fitout | | 05 | | 4,300 | | 1,500 | | 2,800 | | |
Buildings, programmed renewal | | Various | | | | | | 5,720 | | Ongoing |
Minor capital works | | Various | | | | | | 1,630 | | Ongoing |
Other acquisitions of property, plant and equipment | | Various | | | | | | 3,628 | | Ongoing |
| | | | | | | | | | |
Total Property, Plant and Equipment | | | | | | | | 306,032 | | |
| | | | | | | | | | |
Other Capital Expenditure | | | | | | | | | | |
Integrated Justice Information Strategy | | 05 | | 23,230 | | 14,410 | | 4,600 | | 4,220 |
Prosecutions Case Management Information System | | 05 | | 2,699 | | 1,489 | | 1,210 | | |
Queensland Wide Integrated Courts System (QWIC) Renewal | | 05 | | 2,040 | | 1,012 | | 1,028 | | |
New Queensland Courts Case Management System | | 05 | | 2,028 | | 199 | | 855 | | 974 |
Crown Law—VISUALFILES System | | 05 | | 2,040 | | 1,590 | | 250 | | 200 |
Minor capital works—software | | 05 | | | | | | 1,666 | | Ongoing |
Other capital | | 05 | | | | | | 3,094 | | Ongoing |
| | | | | | | | | | |
Total Other Capital Expenditure | | | | | | | | 12,703 | | |
| | | | | | | | | | |
TOTAL DEPARTMENT OF JUSTICE AND ATTORNEY-GENERAL | | | | | | | | 318,735 | | |
| | | | | | | | | | |
PUBLIC TRUST OFFICE | | | | | | | | | | |
| | | | | |
Property, Plant and Equipment | | | | | | | | | | |
New office buildings | | 05 | | 5,000 | | | | 5,000 | | |
Property, plant and equipment | | 05 | | | | | | 604 | | Ongoing |
Building Improvements | | 05 | | | | | | 2,120 | | Ongoing |
| | | | | | | | | | |
Total Property, Plant and Equipment | | | | | | | | 7,724 | | |
| | | | | | | | | | |
Other Capital Expenditure | | | | | | | | | | |
Computer software | | 05 | | | | | | 250 | | Ongoing |
| | | | | | | | | | |
Total Other Capital Expenditure | | | | | | | | 250 | | |
| | | | | | | | | | |
TOTAL PUBLIC TRUST OFFICE | | | | | | | | 7,974 | | |
| | | | | | | | | | |
LEGAL AID QUEENSLAND | | | | | | | | | | |
| | | | | |
Property, Plant and Equipment | | | | | | | | | | |
Leasehold improvements | | 05 | | | | | | 1,334 | | Ongoing |
Brisbane building—minor works | | 05 | | | | | | 350 | | Ongoing |
Office equipment | | 05 | | | | | | 516 | | Ongoing |
Vehicle replacement | | 05 | | | | | | 358 | | Ongoing |
| | | | | | | | | | |
Total Property, Plant and Equipment | | | | | | | | 2,558 | | |
| | | | | | | | | | |
237
Justice and Attorney-General, (continued)
| | | | | | | | | | |
Project | | Statistical
Division | | Total
Estimated
Cost
$’000 | | Expenditure
to 30-06-08
$’000 | | Budget
2008-09
$’000 | | Post
2008-09
$’000 |
Other Capital Expenditure | | | | | | | | | | |
Core Business System technical redevelopment | | 05 | | | | | | 500 | | Ongoing |
| | | | | | | | | | |
Total Other Capital Expenditure | | | | | | | | 500 | | |
| | | | | | | | | | |
TOTAL LEGAL AID QUEENSLAND | | | | | | | | 3,058 | | |
| | | | | | | | | | |
CRIME AND MISCONDUCT COMMISSION | | | | | | | | | | |
| | | | | |
Property, Plant and Equipment | | | | | | | | | | |
Green Square fitout costs | | 05 | | 13,579 | | 11,884 | | 1,695 | | |
Vehicle replacements | | 05 | | | | | | 465 | | Ongoing |
Computer and other equipment | | 05 | | | | | | 313 | | Ongoing |
| | | | | | | | | | | |
Total Property, Plant and Equipment | | | | | | | | 2,473 | | |
| | | | | | | | | | |
TOTAL CRIME AND MISCONDUCT COMMISSION | | | | | | | | 2,473 | | |
| | | | | | | | | | |
| | | | | |
ANTI-DISCRIMINATION COMMISSION | | | | | | | | | | |
| | | | | |
Property, Plant and Equipment | | | | | | | | | | |
Property, plant and equipment | | 05 | | | | | | 46 | | Ongoing |
| | | | | | | | | | |
Total Property, Plant and Equipment | | | | | | | | 46 | | |
| | | | | | | | | | |
| | | | | |
Other Capital Expenditure | | | | | | | | | | |
Case Management software system | | 05 | | 386 | | | | 386 | | |
| | | | | | | | | | |
Total Other Capital Expenditure | | | | | | | | 386 | | |
| | | | | | | | | | |
TOTAL ANTI-DISCRIMINATION COMMISSION | | | | | | | | 432 | | |
| | | | | | | | | | |
TOTAL JUSTICE AND ATTORNEY-GENERAL | | | | | | | | 332,672 | | |
| | | | | | | | | | |
238
LEGISLATIVE ASSEMBLY OF QUEENSLAND
Capital outlays in property, plant and equipment are critical to the delivery of the Legislative Assembly and Parliamentary Service output. The 2008-09 capital program of $3.6 million is principally allocated to the replacement of major air conditioning plant within the Parliamentary Precinct, an upgrade of the toilet facilities on Members’ Office floors, and an upgrade of Electorate Office equipment. Funding is also directed to the ongoing Parliament House Stonework Restoration Program and a range of minor capital works projects designed to improve the functionality and performance of existing building infrastructure.
Legislative Assembly of Queensland
| | | | | | | | | | |
Project | | Statistical
Division | | Total
Estimated
Cost
$’000 | | Expenditure
to 30-06-08
$’000 | | Budget
2008-09
$’000 | | Post
2008-09
$’000 |
| | | | | |
LEGISLATIVE ASSEMBLY OF QUEENSLAND | | | | | | | | | | |
| | | | | |
Property, Plant and Equipment | | | | | | | | | | |
Parliament House Stonework Restoration Program | | 05 | | 12,384 | | 4,004 | | 100 | | 8,280 |
Air-conditioning—replacement of cooling towers | | 05 | | 1,318 | | | | 1,318 | | |
Air-conditioning—upgrade and replacement | | 05 | | 1,000 | | 200 | | 200 | | 600 |
Members’ Office Floors—toilet facilities upgrade | | 05 | | 1,236 | | | | 618 | | 618 |
Electorate Office—office equipment upgrade | | 05 | | 1,500 | | | | 750 | | 750 |
Minor capital works—plant and equipment | | 05 | | 567 | | | | 567 | | |
| | | | | | | | | | |
Total Property, Plant and Equipment | | | | | | | | 3,553 | | |
| | | | | | | | | | |
TOTAL LEGISLATIVE ASSEMBLY OF QUEENSLAND | | | | | | | | 3,553 | | |
| | | | | | | | | | |
LOCAL GOVERNMENT, SPORT AND RECREATION
The Department of Local Government, Sport and Recreation capital works and grant and subsidy programs will provide $467.6 million in 2008-09 to assist local government, community sport and recreation organisations, Indigenous organisations and schools to build vibrant, more sustainable communities.
Department of Local Government, Sport and Recreation
The majority of capital expenditure incurred by the department relates to capital grants and subsidies to assist with the:
| | • | | creation or upgrading of a range of essential community infrastructure such as water supply, sewerage works, roads and drainage works. |
| | • | | building or upgrading of community sport and recreation facilities which enhance the opportunities for Queenslanders to participate in an active, healthy lifestyle. |
Other capital expenditure by the department is associated with supporting the delivery of the State Tennis Centre, improving the quality and accessibility of facilities at a number of the State’s Active Recreation Centres, and to ensure the ongoing maintenance and provision of an appropriate level of office equipment and information technology hardware at each of the department’s sites across Queensland.
239
Program Highlights
| | • | | A record $12.5 million investment through the Minor Facilities Program to support community sport and recreation clubs improve the standard and availability of their facilities. |
| | • | | Launching a new $30 million round of the Major Facilities Program to support the development of major community sport and recreational facilities. |
| | • | | Up to $8 million over four years from 2008-09 for the Regional Tennis Facilities Program to provide regional standard tennis facilities in Mount Isa, Cairns, Townsville, Rockhampton and Toowoomba. |
| | • | | Up to $5 million out of total funding of $25.5 million over five years under the Fluoride Capital Assistance Program to undertake capital works outside South East Queensland for the introduction of fluoridation. |
| | • | | $3 million in 2008-09 for the construction of three new Sewerage Treatment Plants in Tin Can Bay, Cooloola Cove, and Rainbow Beach to benefit the growing communities of the Gympie Region. |
| | • | | $14 million under the Indigenous Environmental Health and Infrastructure Program to provide essential community infrastructure in the Torres Strait region, including major sewerage projects at Mabuaig and Moa Islands. |
Stadiums Queensland
The capital program for Stadiums Queensland reflects the investment required to develop and maintain the State’s stadia to a standard appropriate for the conduct of national and international events. The program will provide $14.5 million in 2008-09 which includes the development of a criterion track near the Sleeman Sports Complex at Chandler and the upgrade of facilities at the Brisbane Entertainment Centre.
240
Local Government, Sport and Recreation
| | | | | | | | | | |
Project | | Statistical
Division | | Total
Estimated
Cost
$’000 | | Expenditure
Budget to
30-06-08
$’000 | | Post
2008-09
$’000 | | 2008-09
$’000 |
DEPARTMENT OF LOCAL GOVERNMENT, SPORT AND RECREATION | | | | | | | | | | |
| | | | | |
Property, Plant and Equipment | | | | | | | | | | |
Buildings | | | | | | | | | | |
Tennyson Riverside Development | | 05 | | 44,855 | | 17,308 | | 11,403 | | 16,144 |
Active Recreation Centres | | Various | | | | | | 3,359 | | Ongoing |
Plant and equipment | | 05 | | | | | | 467 | | Ongoing |
| | | | | | | | | | |
Total Property, Plant and Equipment | | | | | | | | 15,229 | | |
| | | | | | | | | | |
| | | | | |
Capital Grants | | | | | | | | | | |
Sport Infrastructure | | | | | | | | | | |
State Equestrian Centre | | 09 | | 1,760 | | | | 1,760 | | |
Regional Tennis Facilities Program | | Various | | 8,000 | | | | 4,000 | | 4,000 |
Local Sport and Recreation Program | | Various | | | | | | 3,459 | | Ongoing |
Major facilities | | Various | | | | | | 21,367 | | Ongoing |
Minor facilities | | Various | | | | | | 12,500 | | Ongoing |
Local Government Infrastructure | | | | | | | | | | |
Fluoride Capital Assistance Program | | Various | | 25,500 | | | | 5,000 | | 20,500 |
Queensland’s 150th Anniversary - Legacy Infrastructure project | | Various | | 100,000 | | 30,489 | | 54,000 | | 15,511 |
Roads and drainage | | Various | | | | | | 25,000 | | Ongoing |
Water and sewerage | | Various | | | | | | 132,718 | | Ongoing |
Other works | | Various | | | | | | 192,574 | | Ongoing |
| | | | | | | | | | |
Total Capital Grants | | | | | | | | 452,378 | | |
| | | | | | | | | | |
TOTAL DEPARTMENT OF LOCAL GOVERNMENT, SPORT AND RECREATION | | | | | | | | 467,607 | | |
| | | | | | | | | | |
| | | | | |
STADIUMS QUEENSLAND | | | | | | | | | | |
| | | | | |
Property, Plant and Equipment | | | | | | | | | | |
Capital Maintenance and Equipment | | Various | | | | | | 11,000 | | Ongoing |
Brisbane Entertainment Centre—Facilities Upgrade | | 05 | | 1,300 | | | | 1,300 | | |
Sleeman Sports Complex—Criterion Track | | 05 | | 2,200 | | | | 2,200 | | |
| | | | | | | | | | |
Total Property, Plant and Equipment | | | | | | | | 14,500 | | |
| | | | | | | | | | |
TOTAL STADIUMS QUEENSLAND | | | | | | | | 14,500 | | |
| | | | | | | | | | |
TOTAL LOCAL GOVERNMENT, SPORT AND RECREATION | | | | | | | | 482,107 | | |
| | | | | | | | | | |
241
MAIN ROADS
The 2008-09 capital expenditure program for Main Roads (which includes Queensland Motorways Limited and RoadTek) is $3.235 billion. Main Roads strategically manages, plans, develops, operates and maintains the State-controlled road network. Key service delivery priorities in 2008-09 are to continue to:
| | • | | improve safety of the road environment |
| | • | | achieve reliable delivery of the Government’s priority projects—including election commitments and other specific initiatives, such as South East Queensland Infrastructure Plan and Program (SEQIPP) projects, the regional bridge renewal, and accelerated road rehabilitation programs |
| | • | | preserve and maintain the state’s largest built community asset—the 33,550 kilometre state-controlled road network—with an estimated value of $37.285 billion |
| | • | | manage the impact of urban traffic growth and congestion, and improve the reliability of service to industry and the community in our major urban centres |
| | • | | plan and prioritise future works to meet the long-term needs of industry and the community within specified state and federal funding limits. |
Main Roads’ capital program enhances, rehabilitates and preserves the road network throughout Queensland. Capital investment in the road system generates long-term benefits to the people of Queensland by delivering safer, more efficient and more convenient transport, for both industry and the community in general.
Safety remains a number one priority for Main Roads. The department will continue its emphasis on safety through programs such as the Safer Roads Sooner initiative, with $47 million allocated in 2008-09 towards road safety capital programs ($235 million over the next five years).
Program Highlights
| | • | | $537.6 million is provided to construct a second Gateway Bridge river crossing and to increase capacity on the Gateway Motorway, between Mt Gravatt-Capalaba Road and Nudgee Road, at a total estimated cost of $1.883 billion. |
| | • | | $200 million is provided towards the federally-funded Ipswich Motorway upgrade between Wacol and Darra, at a total estimated cost of $700 million. |
| | • | | $168.7 million is provided towards the Centenary Highway duplication between Springfield and Darra, in conjunction with the Darra to Springfield rail extension, at a total estimated cost of $414.6 million. |
| | • | | $150 million is provided towards the construction of the new Houghton Highway Bridge between Brighton and Redcliffe, at a total estimated cost of $315 million. |
| | • | | $100 million is provided towards the federally-funded Ipswich Motorway upgrade to complete the upgrade of the Ipswich/Logan Motorway interchange, at a total estimated cost of $255 million. |
| | • | | $70.7 million is provided to upgrade the Pacific Motorway between the Gateway Motorway and the Logan Motorway and between Nerang and Tugun, at a total estimated cost of $910 million ($455 million—State, $455 million—Australian Government). |
| | • | | $66 million is provided towards the duplication of the Forgan Bridge in Mackay, at a total estimated cost of $128 million. |
| | • | | $50 million is provided to improve flood immunity on the federally-funded Bruce Highway between Corduroy Creek and Tully High School, at a total estimated cost of $172.4 million. |
| | • | | $42.3 million is provided towards Stages 2 and 3 of the Townsville Ring Road, at a total estimated cost of $119.2 million ($39.8 million—State, $79.5 million—Australian Government). |
242
| | • | | $34.5 million is provided towards construction of the Bundaberg Ring Road, at a total estimated cost of $92 million. |
| | • | | $32.4 million is provided for construction of the Pacific Paradise interchange and access to David Low Way on the Sunshine Motorway, west of Pacific Paradise, at a total estimated cost of $85 million. |
| | • | | $27.2 million is provided to widen Caloundra Road to four lanes between the Bruce Highway and Pierce Avenue, 7km west of Caloundra, at a total estimated cost of $80 million. |
| | • | | $24.4 million is provided to construct a bridge and approaches at Mulgrave River, south of Cairns, on the federally-funded Bruce Highway, at a total estimated cost of $50 million. |
| | • | | $24 million is provided in federal funding to widen the Bruce Highway in Gympie to four lanes between Kidgell Street and Pine Street, at a total estimated cost of $70.8 million. |
| | • | | $20 million is provided to widen the Gold Coast Highway to four lanes between Government Road and Robert Street, at a total estimated cost of $128 million. |
| | • | | $20 million is provided towards the federally-funded Ipswich Motorway upgrade for planning and land acquisitions for the upgrade to six lanes between Dinmore and Goodna, at a total estimated cost of $50 million. |
| | • | | $18 million is provided to continue widening to four lanes in sections between Santa Barbara Road and Columbus Drive, on Hope Island Road, at a total estimated cost of $109 million. |
| | • | | $17 million is provided to widen the remaining 2 lane sections of North Ward Road to 4 lanes between Walker Street and Gregory Street on the northern approach of Townsville City, at a total estimated cost of $19 million. |
| | • | | $12.1 million is provided towards paving and sealing the Roma—Taroom Road to support oil and gas development and improve regional community access, at a total estimated cost of $29.7 million. |
| | • | | $11.6 million is provided towards construction of the Hospital Bridge in Mackay, at a total estimated cost of $33.6 million. |
| | • | | $10.7 million is provided to widen the New England Highway and realign the highway at the Pechey Range between John Street, Crows Nest and Millard Road, at a total estimated cost of $12.6 million. |
| | • | | $10 million is provided to commence realignment of the Dawson Highway at the Calliope Range, at a total estimated cost of $70 million. |
| | • | | $10 million is provided to widen and seal the New England Highway between Munro Road and Pioneer Road, south of Crows Nest, at a total estimated cost of $13.6 million. |
| | • | | $9.1 million is provided to continue design and construction of the jointly-funded Townsville Port Access Road, at a total estimated cost of $190 million. |
| | • | | $7.5 million is provided to complete the replacement of the Ward River and Woolshed Gully bridges with a single 260 metre long, six metre high, dual lane bridge on the Diamantina Developmental Road, west of Charleville, at a total estimated cost of $15 million. |
| | • | | $7.4 million is provided to widen, repair and strengthen the Flinders Highway at Jardine Valley, between Charters Towers and Hughenden, at a total estimated cost of $8.8 million. |
| | • | | $6.3 million is provided to reconstruct the pavement on the Dawson Highway between Meteor Creek North and Three Chain Road, at a total estimated cost of $6.7 million. |
| | • | | $6.1 million is provided to repair, strengthen and widen the D’Aguilar Highway between Villeneuve Road and Arnolds Road North, East of Kilcoy, at a total estimated cost of $6.3 million. |
| | • | | $5.5 million is provided for paving and sealing sections of the Wills Developmental Road between Gregory and the Doomadgee turnoff, south of Burketown, at a total estimated cost of $7.5 million. |
243
| | • | | $3.1 million is provided for paving and sealing three sections of the Diamantina Developmental Road between Windorah and Bedourie, at a total estimated cost of $4.4 million. |
Main Roads
| | | | | | | | | | |
Project | | Statistical
Division | | Total
Estimated
Cost
$’000 | | Expenditure
to
30-06-08
$’000 | | Budget
2008-09
$’000 | | Post
2008-09
$’000 |
DEPARTMENT OF MAIN ROADS | | | | | | | | | | |
Property, Plant and Equipment | | | | | | | | | | |
Corporate Buildings | | | | | | | | | | |
Maroochydore, Traffic Management Centre | | 09 | | 2,475 | | 100 | | 2,375 | | |
Nerang Office Accommodation | | 07 | | 2,200 | | 200 | | 2,000 | | |
Nundah Office Accommodation | | 05 | | 49,200 | | 200 | | 4,000 | | 45,000 |
Other works | | Various | | | | | | 3,625 | | Ongoing |
| | | | | | | | | | |
Sub-total Corporate Buildings | | | | | | | | 12,000 | | |
| | | | | | | | | | |
AusLink Network | | | | | | | | | | |
Bruce Highway | | | | | | | | | | |
Corduroy Creek—Tully High School, realign 2 lanes | | 50 | | 172,408 | | 97,705 | | 50,000 | | 24,703 |
Farrelleys Lane / Schmidtke Road, Mackay, intersection improvements | | 40 | | 5,300 | | 1,033 | | 4,267 | | |
Gympie urban section, Kidgell Street—Pine Street, duplicate 2 to 4 lanes | | 15 | | 70,800 | | 33,260 | | 24,000 | | 13,540 |
Mulgrave River, south of Cairns, construct bridge | | 50 | | 50,000 | | 7,775 | | 24,385 | | 17,840 |
Townsville Ring Road (Stages 2 and 3), Upper Ross River Road—Shaw Road, constructto new sealed 2 lane standard | | 45 | | 119,152 | | 76,900 | | 42,252 | | |
Uhlmann Road—Caboolture, widen 4 to 6 lanes | | 05 | | 183,000 | | 90,244 | | 82,756 | | 10,000 |
Cunningham Arterial/Highway (Ipswich Motorway) | | | | | | | | | | |
Dinmore—Goodna, planning and land acquisition | | 05 | | 50,000 | | 5,000 | | 20,000 | | 25,000 |
Logan Motorway interchange, construct interchange | | 05 | | 255,000 | | 155,000 | | 100,000 | | |
Wacol—Darra, widen 4 to 6 lanes | | 05 | | 700,000 | | 178,610 | | 200,000 | | 321,390 |
Cunningham Highway | | | | | | | | | | |
Eight Mile intersection, north-east of Warwick,at-grade intersection improvement | | 20 | | 7,114 | | 3,768 | | 3,346 | | |
Flinders Highway | | | | | | | | | | |
Jardine Valley (214—226.1km), east of Hughenden, rehabilitate and widen | | 55 | | 8,801 | | 1,438 | | 7,363 | | |
Townsville Port Access Road, construct new road | | 45 | | 190,000 | | 29,650 | | 9,111 | | 151,239 |
244
Main Roads, (continued)
| | | | | | | | | | |
Project | | Statistical
Division | | Total
Estimated
Cost
$’000 | | Expenditure
to
30-06-08
$’000 | | Budget
2008-09
$’000 | | Post
2008-09
$’000 |
Pacific Motorway | | | | | | | | | | |
Gateway Motorway—Logan Motorway, transit lanes | | 05 | | 490,000 | | 44,000 | | 33,000 | | 413,000 |
Nerang—Tugun, interchange upgrades and widening | | 07 | | 420,000 | | 42,967 | | 37,682 | | 339,351 |
Other Construction | | Various | | | | | | 265,565 | | Ongoing |
| | | | | | | | | | |
Sub-total AusLink Network | | | | | | | | 903,727 | | |
| | | | | | | | | | |
Other State-controlled Roads | | | | | | | | | | |
Brighton—Redcliffe Road | | | | | | | | | | |
Houghton Highway, construct bridge and approaches | | 05 | | 315,000 | | 68,514 | | 150,000 | | 96,486 |
Bundaberg Ring Road | | | | | | | | | | |
construct to new sealed 2 lane standard | | 15 | | 92,000 | | 27,172 | | 34,500 | | 30,328 |
Caloundra Road | | | | | | | | | | |
Bruce Highway—Pierce Avenue, duplicate 2 to 4 lanes | | 09 | | 80,000 | | 52,762 | | 27,238 | | |
Capricorn Highway | | | | | | | | | | |
Bushley Overpass, west of Rockhampton, construct bridge and approaches | | 30 | | 14,300 | | | | 7,000 | | 7,300 |
D’Aguilar Highway | | | | | | | | | | |
Villeneuve Road—Arnolds Road North, east of Kilcoy, rehabilitate and widen | | 12 | | 6,300 | | 156 | | 6,144 | | |
Dawson Highway | | | | | | | | | | |
Gladstone—Biloela, Calliope Range, new realignment | | 30 | | 70,000 | | | | 10,000 | | 60,000 |
Meteor Creek North—Three Chain Road, reconstruct pavement | | 30 | | 6,708 | | 390 | | 6,318 | | |
Diamantina Developmental Road | | | | | | | | | | |
Ward River and Woolshed Gully, replace bridge and approaches | | 25 | | 15,000 | | 7,549 | | 7,451 | | |
Windorah—Bedourie, pave and seal | | 35 | | 4,430 | | 799 | | 3,131 | | 500 |
East-West Arterial and Gateway (EWAG) | | | | | | | | | | |
East-West Arterial and 1 Gateway (EWAG) crossing and link to Brisbane Airport | | 05 | | 181,965 | | 1,011 | | 795 | | 180,159 |
Glenella Connection Road, Mackay | | | | | | | | | | |
Hospital Bridge, construct bridge and approaches | | 40 | | 33,618 | | 21,971 | | 11,647 | | |
Gold Coast Highway | | | | | | | | | | |
Government Road—Robert Street, widen to 4 lanes | | 07 | | 128,000 | | 24,000 | | 20,000 | | 84,000 |
Hervey Bay Road | | | | | | | | | | |
Hunter Street—McNally Street, duplicate 2 to 4 lanes | | 15 | | 11,500 | | 5,415 | | 6,085 | | |
Torbanlea turnoff—Dundowran Road, duplicate 2 to 4 lanes | | 15 | | 18,000 | | 763 | | 8,000 | | 9,237 |
245
Main Roads, (continued)
| | | | | | | | | | |
Project | | Statistical
Division | | Total
Estimated
Cost
$’000 | | Expenditure
to
30-06-08
$’000 | | Budget
2008-09
$’000 | | Post
2008-09
$’000 |
Hervey’s Range Developmental Road | | | | | | | | | | |
Bohle River—Ring Road, duplicate 2 to 4 lanes | | 45 | | 14,520 | | 2,174 | | 12,346 | | |
Hope Island Road | | | | | | | | | | |
Santa Barbara Road—Columbus Drive, duplicate 2 to 4 lanes | | 07 | | 109,000 | | 16,000 | | 18,000 | | 75,000 |
Mackay—Slade Point Road | | | | | | | | | | |
Forgan Bridge over the Pioneer River, construct bridge and approaches | | 40 | | 127,990 | | 21,366 | | 66,008 | | 40,616 |
New England Highway | | | | | | | | | | |
John Street, Crows Nest—Millard Road, construct to new sealed 2 lane standard | | 20 | | 12,575 | | 1,908 | | 10,667 | | |
Munro Road—Pioneer Road, south of Crows Nest, widen and seal | | 20 | | 13,622 | | 1,293 | | 10,002 | | 2,327 |
North Ward Road, Townsville | | | | | | | | | | |
Walker Street—Gregory Street, duplicate 2 to 4 lanes | | 45 | | 19,000 | | 1,000 | | 17,000 | | 1,000 |
Peninsula Developmental Road | | | | | | | | | | |
Lily Creek—Carols Crossing, construct road to seal standard | | 50 | | 12,113 | | 4,914 | | 7,199 | | |
north of Carols Crossing, construct road to seal standard | | 50 | | 9,266 | | 3,536 | | 5,730 | | |
Roma—Taroom Road | | | | | | | | | | |
Sections: 0—64.9km, pave and seal | | 25 | | 12,163 | | 6,123 | | 5,040 | | 1,000 |
Sections: 64.9—149.4km, pave and seal | | 20 | | 17,500 | | 8,378 | | 7,122 | | 2,000 |
Sunshine Motorway | | | | | | | | | | |
Pacific Paradise interchange and access to David Low Way | | 09 | | 85,000 | | 52,581 | | 32,419 | | |
Western Arterial (Centenary Highway) | | | | | | | | | | |
Springfield—Darra, duplicate to 4 lanes | | 05 | | 414,600 | | 46,762 | | 168,738 | | 199,100 |
Wills Developmental Road | | | | | | | | | | |
Gregory—Doomadgee turnoff, pave and seal | | 55 | | 7,500 | | 2,000 | | 5,500 | | |
Other Construction | | Various | | | | | | 871,794 | | Ongoing |
| | | | | | | | | | |
Sub-total Other State-controlled Roads | | | | | | | | 1,535,874 | | |
| | | | | | | | | | |
Plant and equipment | | Various | | | | | | 4,000 | | Ongoing |
| | | | | | | | | | |
Total Property, Plant and Equipment | | | | | | | | 2,455,601 | | |
| | | | | | | | | | |
Other Capital Expenditure | | | | | | | | | | |
Information Technology | | Various | | | | | | 6,500 | | Ongoing |
| | | | | | | | | | |
Total Other Capital Expenditure | | | | | | | | 6,500 | | |
| | | | | | | | | | |
246
Main Roads, (continued)
| | | | | | | | | | |
Project | | Statistical
Division | | Total
Estimated
Cost
$’000 | | Expenditure
to
30-06-08
$’000 | | Budget
2008-09
$’000 | | Post
2008-09
$’000 |
Capital Grants | | | | | | | | | | |
Transport Infrastructure Development Scheme—Capital Grants | | | | | | | | | | |
Blackall—Emmet Road, Blackall, sections 0.0—10.0km, pave and seal | | 35 | | 1,575 | | 450 | | 1,125 | | |
Boundary Road, Brisbane City, Kelliher—Garden Road, construction of two-lane underpass | | 05 | | 32,804 | | 29,378 | | 3,426 | | |
Bundaberg Port access road, Burnett Heads, construct new road | | 15 | | 1,000 | | 97 | | 903 | | |
Cape Pallarenda Road, Townsville City, section 1.94—6.0km, widen pavement | | 45 | | 800 | | 510 | | 290 | | |
Christine Avenue, Robina, Gold Coast, Scottsdale Drive—Regensberg Close, duplicate 2 to 4 lanes | | 07 | | 216 | | | | 216 | | |
Coles Road / Andergrove Road, Mackay City,
upgrade /intersection improvements | | 40 | | 350 | | | | 350 | | |
Connors Road, Mackay, Len Shield Street—East Boundary Road (0.0—0.22km), rehabilitate and widen | | 40 | | 350 | | | | 350 | | |
Gayndah Road, West Maryborough, construct
bikeway / footpath overpass | | 15 | | 788 | | 72 | | 501 | | 215 |
Kowanyama Access Road, Plain Creek, south-east of Kowanyama, floodway, formation and road safety improvements | | 55 | | 1,300 | | 589 | | 711 | | |
Mirambeena Drive, Pimpama, Ormeau State School, passenger set-down facilities | | 07 | | 280 | | 140 | | 140 | | |
Mitchell—Bollon Road, south of Mitchell, section 6.2—12.2km, rehabilitate and widen | | 25 | | 247 | | | | 247 | | |
Northern Peninsula Road, south of Bamaga, Captain Billy’s Turnoff—Jardine River, upgrade drainage, form and gravel | | 50 | | 2,300 | | 259 | | 2,041 | | |
Pacific Motorway, Nathan—Logan Road, construct bikeway | | 05 | | 13,224 | | 7,097 | | 3,237 | | 2,890 |
Palm Island, various road and drainage upgrading works | | 45 | | 1,600 | | 1,001 | | 599 | | |
Petrie Creek Road, near Didillibah, Dusty Rhodes Bridge, construct new bridge and approaches | | 09 | | 1,120 | | 1 | | 1,119 | | |
Pormpuraaw, various roads, restoration works | | 50 | | 4,000 | | 2,333 | | 1,667 | | |
Rockhampton—Yeppoon Road, south-west of Yeppoon, transfer station access road—Multi Modal Facility, intersection improvements | | 30 | | 1,750 | | | | 1,750 | | |
Sandy Creek Road, near Kilcoy, construct concrete bridge | | 12 | | 260 | | | | 260 | | |
Savannah Way, Albert River Bridge, 3km south of Burketown, construct bridge and approaches | | 55 | | 750 | | | | 750 | | |
South Dulacca Road, south of Dulacca, section 0.0—6.3km, widen and reconstruct | | 20 | | 211 | | | | 211 | | |
Talwood—Mungindi Road, south-west of Talwood, various sections, reconstruct and upgrade | | 20 | | 240 | | | | 240 | | |
247
Main Roads, (continued)
| | | | | | | | | | |
Project | | Statistical
Division | | Total
Estimated
Cost
$’000 | | Expenditure
to
30-06-08
$’000 | | Budget
2008-09
$’000 | | Post
2008-09
$’000 |
Tarome Road, Aratula, section 0.0—0.7km, replace bridge and approaches | | 12 | | 250 | | | | 250 | | |
Tewantin Bypass, Beckmans Road, design to a new sealed 2 lane standard | | 09 | | 605 | | | | 605 | | |
Whyenbah Road, west of St George, various sections, gravel resheeting | | 25 | | 250 | | | | 250 | | |
Yeppoon and Emu Park, construct bikeways | | 30 | | 1,000 | | 60 | | 940 | | |
Yaraka—Emmet Road, east of Yaraka, section 20.0—28.0km, pave and seal | | 35 | | 1,175 | | | | 1,175 | | |
Other capital grants | | Various | | | | | | 27,838 | | Ongoing |
| | | | | | | | | | |
Sub-total Transport Infrastructure Development Scheme—Capital Grants | | | | | | | | 51,191 | | |
| | | | | | | | | | |
Federal Black Spots | | Various | | | | | | 8,923 | | Ongoing |
| | | | | | | | | | |
Total Capital Grants | | | | | | | | 60,114 | | |
| | | | | | | | | | |
TOTAL DEPARTMENT OF MAIN ROADS | | | | | | | | 2,522,215 | | |
| | | | | | | | | | |
ROADTEK | | | | | | | | | | |
Property, Plant and Equipment | | | | | | | | | | |
Hire plant | | Various | | | | | | 30,296 | | Ongoing |
| | | | | | | | | | |
Total Property, Plant and Equipment | | | | | | | | 30,296 | | |
| | | | | | | | | | |
Other Capital Expenditure | | | | | | | | | | |
Information technology | | Various | | | | | | 85 | | Ongoing |
| | | | | | | | | | |
Total Other Capital Expenditure | | | | | | | | 85 | | |
| | | | | | | | | | |
TOTAL ROADTEK | | | | | | | | 30,381 | | |
| | | | | | | | | | |
QUEENSLAND MOTORWAYS LIMITED | | | | | | | | | | |
Property, Plant and Equipment | | | | | | | | | | |
Free-Flow Tolling Project | | 05 | | 167,618 | | 38,057 | | 86,632 | | 42,929 |
Gateway Motorway, Gateway Upgrade Project | | 05 | | 1,883,000 | | 982,582 | | 537,626 | | 362,792 |
Other | | 05 | | | | | | 1,450 | | Ongoing |
Sundry roadworks | | 05 | | | | | | 41,650 | | Ongoing |
Toll equipment | | 05 | | | | | | 15,200 | | Ongoing |
| | | | | | | | | | |
Total Property, Plant and Equipment | | | | | | | | 682,558 | | |
| | | | | | | | | | |
TOTAL QUEENSLAND MOTORWAYS LIMITED | | | | | | | | 682,558 | | |
| | | | | | | | | | |
TOTAL MAIN ROADS | | | | | | | | 3,235,154 | | |
| | | | | | | | | | |
Note:
| 1. | The 2008-09 Budget excludes expenditure announced for EWAG on 19 May 2008, due to the timing of contractual close. |
248
MINES AND ENERGY
The department’s 2008-09 capital acquisition program of $15.4 million comprises expenditure to support the continuing development of the State’s minerals and energy industries including construction of a new drill core storage facility at Mount Isa ($2.4 million) and the upgrading of the hardware and software for key departmental systems ($1.5 million and $1.4 million respectively).
CS Energy Limited
A $201.6 million capital expenditure program is planned for 2008-09. This reflects the continued commitment to the ongoing reliability and efficiency of the plant and electricity supply and includes:
| | • | | $110 million has been provided in 2008-09 for improvements to the Callide Power Station including overhauls and major refurbishment work, to ensure ongoing reliability and efficiency of the plant. |
| | • | | $59.8 million has been provided in 2008-09 for improvements to the Swanbank Power Station including major overhauls, to ensure ongoing reliability and efficiency of the plant. |
| | • | | $19.2 million has been provided in 2008-09 for efficiency enhancements to the Kogan Creek Power Station. |
| | • | | $12.4 million has been provided in 2008-09 for improvements to the Mica Creek Power Station including major overhauls, to ensure ongoing reliability and efficiency of the plant. |
ENERGEX Limited
The ENERGEX Group has prepared a capital program of $911.1 million. This includes electricity upgrades to support significant commercial infrastructure in Brisbane and improves and reinforces electricity supply to Brisbane, the Sunshine and Gold Coasts. The regulated electricity capital expenditure program for 2008-09 is $830 million. This includes $491 million on the sub transmission system, and $339 million on the distribution network. The capital program will match the high growth in electricity usage being driven by a strong Queensland economy and increased use of lifestyle enhancing appliances, such as air conditioners. The capital works program for 2008-09 will contribute to the improved level of reliability of electricity distribution and includes the following projects:
| | • | | $19.8 million in 2008-09 to establish a new bulk supply substation at Myrtletown. This substation will ensure reliable electricity supply to the water recycling plant, Brisbane Airport, and the other significant commercial infrastructure in the area. |
| | • | | $16.1 million in 2008-09 to establish a new bulk supply substation at Sandgate, to increase network capacity. |
| | • | | $9 million in 2008-09 to install two transformers in Merrimac to boost network capacity. |
Stanwell Corporation Limited
Stanwell Corporation Limited’s expected capital expenditure for 2008-09 is $91.3 million. This relates to improving the efficiency of existing generation assets at Stanwell, Barron and Kareeya. Projects include:
| | • | | $49 million in 2008-09 for major overhauls and efficiency upgrades at Stanwell Power Station. |
| | • | | $2.1 million in 2008-09 for a focus on emission reductions through the investment in low nitrogen oxide burners at Stanwell Power Station. |
| | • | | $3.6 million in 2008-09 for ongoing capital works at the Kareeya and Barron Gorge Hydro Power Stations. |
249
Tarong Energy Corporation Limited
Tarong Energy’s capital expenditure program for 2008-09 of $224.2 million relates to the Kunioon Development Project and maintaining operations at the Tarong Power Station, Tarong North and Wivenhoe Power Stations. Projects include:
| | • | | $86.1 million in 2008-09 for expenditure on the Kunioon Development Project, including land acquisitions of $43 million. |
| | • | | $17.3 million in 2008-09 for a major overhaul of Unit 1 at the Tarong Power Station. |
| | • | | $17.5 million in 2008-09 for a major overhaul of Unit 2 at the Tarong Power Station. |
| | • | | $15.7 million in 2008-09 in relation to the installation of low nitrogen oxide burners at Tarong Power Station. |
Powerlink Queensland
Powerlink Queensland is the high voltage electricity transmission entity for Queensland. Powerlink Queensland’s budgeted capital expenditure for 2008-09 is $675.4 million and includes:
| | • | | $31.1 million in 2008-09 towards construction of a 275kV transmission line between Powerlink’s existing South Pine Substation and ENERGEX’s existing Sandgate Substation. The project will help reinforce electricity supply to the north eastern Brisbane area, and is expected to be completed in summer 2009-10. |
| | • | | $6.8 million in 2008-09 to complete a project to replace the existing aged Kareeya to Innisfail transmission line with a new 132kV transmission line between Tully and Innisfail, and associated substation and other works. The project will help provide continued reliability of electricity supply to Innisfail, Mission Beach, El Arish and Cairns, and is expected to be completed in mid |
2008.
| | • | | $15.8 million in 2008-09 to complete construction of a 275kV transmission line from Powerlink s existing Ross Substation to the proposed new 132kV Yabulu South Substation to reinforce electricity supply in the Townsville region. |
Construction is expected to be completed in summer 2008-09.
| | • | | $73.2 million in 2008-09 for construction of a 275kV transmission line between Nebo to Strathmore (near Collinsville), expected to be completed in winter 2009. |
This is the second stage of a three-stage project to reinforce electricity supply to North Queensland.
| | • | | $25.6 million in 2008-09 for the replacement of the 275/132kV Woolooga Substation. The project is expected to be completed in winter 2009 and will help provide continued reliability of electricity supply to Gympie and the Fraser and North Coasts. |
| | • | | $53.4 million in 2008-09 towards construction of a new 275/132kV substation at Larcom Creek and to expand the existing substation at the Rio Tinto Alumina Refinery near Gladstone. The project is expected to be completed in summer |
2009-10.
Ergon Energy Corporation Limited
Over recent years Ergon Energy has invested heavily in the network to significantly improve its performance, embedding standardisation across different parts of the business and undertaking the initial investment required in systems and processes to improve operational excellence and productivity. The costs of labour and materials are increasing as a result of the commodities boom and an increasingly tight labour market for the skills needed by Ergon Energy. The budgeted capital expenditure of $1.004 billion for 2008-09 includes a
250
significant number of major projects, which are primarily related to the electricity network and its associated infrastructure, with the objective to improve the quality of supply to domestic and commercial customers. These include:
| | • | | $56 million in 2008-09 for Customer Initiated Works at Dalrymple Bay/Hay Point. |
| | • | | $36 million in 2008-09 for Customer Initiated Works for Queensland Gas Company at Miles. |
| | • | | $30 million in 2008-09 for reinforcement of supply to North Mackay (Glenella). |
| | • | | $15 million in 2008-09 for reinforcement of supply to Townsville (Belgian Gardens). |
| | • | | $15 million in 2008-09 for reinforcement of supply to North Rockhampton (Berserker). |
Mines and Energy
| | | | | | | | | | |
Project | | Statistical
Division | | Total
Estimated
Cost
$’000 | | Expenditure
to 30-06-08
$’000 | | Budget
2008-09
$’000 | | Post
2008-09
$’000 |
DEPARTMENT OF MINES AND ENERGY | | | | | | | | | | |
| | | | | |
Property, Plant and Equipment | | | | | | | | | | |
Systems Hardware | | 05 | | 1,503 | | | | 1,503 | | |
Lime Dosing Plant | | 30 | | 6,394 | | 3,394 | | 3,000 | | |
Building and Accommodation upgrades | | | | | | | | | | |
Drill Core Facility | | 55 | | 4,788 | | | | 2,438 | | 2,350 |
Explosives Reserves | | Various | | 1,001 | | | | 1,001 | | |
Minor works | | Various | | | | | | 2,003 | | Ongoing |
Plant and equipment—general | | Various | | | | | | 3,335 | | Ongoing |
| | | | | | | | | | |
Total Property, Plant and Equipment | | | | | | | | 13,280 | | |
| | | | | | | | | | |
Other Capital Expenditure | | | | | | | | | | |
Systems Software | | 05 | | 1,642 | | | | 1,392 | | 250 |
Systems developments | | 05 | | | | | | 735 | | Ongoing |
| | | | | | | | | | |
Total Other Capital Expenditure | | | | | | | | 2,127 | | |
| | | | | | | | | | |
TOTAL DEPARTMENT OF MINES AND ENERGY | | | | | | | | 15,407 | | |
| | | | | | | | | | |
| | | | | |
CS ENERGY LIMITED | | | | | | | | | | |
Property, Plant and Equipment | | | | | | | | | | |
Callide Power Station | | 30 | | | | | | 109,998 | | Ongoing |
Swanbank Power Station | | 05 | | | | | | 59,782 | | Ongoing |
Kogan Creek Power Station | | 20 | | | | | | 19,192 | | Ongoing |
Mica Creek Power Station | | 55 | | | | | | 12,447 | | Ongoing |
Corporate | | 05 | | | | | | 227 | | Ongoing |
| | | | | | | | | | |
Total Property, Plant and Equipment | | | | | | | | 201,646 | | |
| | | | | | | | | | |
TOTAL CS ENERGY LIMITED | | | | | | | | 201,646 | | |
| | | | | | | | | | |
251
Mines and Energy, (continued)
| | | | | | | | | | |
Project | | Statistical
Division | | Total
Estimated
Cost
$’000 | | Expenditure
to 30-06-08
$’000 | | Budget
2008-09
$’000 | | Post
2008-09
$’000 |
ENERGEX LIMITED | | | | | | | | | | |
Property, Plant and Equipment | | | | | | | | | | |
Distribution augmentation | | | | | | | | | | |
Distribution Augmentation—Brisbane | | 05 | | | | | | 203,292 | | Ongoing |
Distribution Augmentation—Moreton | | 12 | | | | | | 60,293 | | Ongoing |
Distribution Augmentation—WBB | | 15 | | | | | | 6,493 | | Ongoing |
Distribution Augmentation—Gold Coast | | 07 | | | | | | 64,792 | | Ongoing |
Distribution Augmentation—Sunshine Coast | | 09 | | | | | | 4,135 | | Ongoing |
| | | | | | | | | | |
Sub-total Distribution augmentation | | | | | | | | 339,005 | | |
| | | | | | | | | | |
Sub transmission program | | | | | | | | | | |
Install underground sub-transmission cables between Currumbin to Burleigh Heads for Desal Plant and general load growth. | | 07 | | 18,324 | | 18,002 | | 322 | | |
Merrimac. Install two transformers to boost network capacity | | 07 | | 19,884 | | 1,518 | | 8,992 | | 9,374 |
Myrtletown. Establish a bulk supply substation to boost network capacity. | | 05 | | 42,041 | | 17,435 | | 19,820 | | 4,786 |
Sandgate. Establish a bulk supply substation to boost network capacity. | | 05 | | 18,430 | | 407 | | 16,066 | | 1,957 |
Other sub transmission works | | Various | | | | | | 445,795 | | Ongoing |
| | | | | | | | | | |
Sub-total Sub transmission program | | | | | | | | 490,995 | | |
| | | | | | | | | | |
Non system | | | | | | | | | | |
Non Construction Capital | | 05 | | | | | | 2,000 | | Ongoing |
PSG Fleet | | 05 | | | | | | 31,205 | | Ongoing |
PSG Other PP&E | | 05 | | | | | | 8,001 | | Ongoing |
Other Generations | | 05 | | | | | | 6,397 | | Ongoing |
Metering Dynamics | | 05 | | | | | | 5,705 | | Ongoing |
Newstead Project | | 05 | | | | | | 5,584 | | Ongoing |
Toowoomba Gasworks Remediation | | 20 | | 6,513 | | | | 6,513 | | |
Miscellaneous Property | | 05 | | 8,617 | | | | 8,617 | | |
Computer Hardware | | 05 | | 7,000 | | | | 7,000 | | |
Miscellaneous Capital | | 05 | | 100 | | | | 100 | | |
| | | | | | | | | | |
Sub-total Non system | | | | | | | | 81,122 | | |
| | | | | | | | | | |
Total Property, Plant and Equipment | | | | | | | | 911,122 | | |
| | | | | | | | | | |
TOTAL ENERGEX LIMITED | | | | | | | | 911,122 | | |
| | | | | | | | | | |
STANWELL CORPORATION LIMITED | | | | | | | | | | |
Property, Plant and Equipment | | | | | | | | | | |
Koombooloomba Minor Works | | 50 | | 35 | | | | 35 | | |
Mackay Gas Turbine Minor Works | | 40 | | 220 | | | | 220 | | |
Corporate | | Various | | | | | | 21,090 | | Ongoing |
Kareeya | | | | | | | | | | |
Kareeya Power Station Minor Works | | 50 | | | | | | 810 | | Ongoing |
252
Mines and Energy, (continued)
| | | | | | | | | | |
Project | | Statistical
Division | | Total
Estimated
Cost
$’000 | | Expenditure
to 30-06-08
$’000 | | Budget
2008-09
$’000 | | Post
2008-09
$’000 |
Barron Gorge | | | | | | | | | | |
Barron Gorge Power Station Stator Coolers | | 50 | | 212 | | | | 150 | | 62 |
Barron Gorge—Generator Rewinds | | 50 | | 9,630 | | | | 2,006 | | 7,624 |
Barron Gorge Power Station Minor Works | | 50 | | | | | | 630 | | Ongoing |
Stanwell Power Station | | | | | | | | | | |
Stanwell Power Station—Ash Storage Area Extension | | 30 | | 7,003 | | 306 | | 580 | | 6,117 |
Stanwell Power Station Unit Overhauls | | 30 | | | | | | 19,000 | | Ongoing |
Stanwell Power Station—LP Turbine and Generator Upgrade | | 30 | | 87,661 | | 2,564 | | 30,025 | | 55,072 |
Stanwell Power Station—Low Nox Burners | | 30 | | 35,972 | | 556 | | 2,084 | | 33,332 |
Stanwell Power Station Minor Works | | 30 | | | | | | 6,354 | | Ongoing |
| | | | | | | | | | |
Total Property, Plant and Equipment | | | | | | | | 82,984 | | |
| | | | | | | | | | |
Other Capital Expenditure | | | | | | | | | | |
Computer Software | | 05 | | 8,293 | | | | 8,293 | | |
| | | | | | | | | | |
Total Other Capital Expenditure | | | | | | | | 8,293 | | |
| | | | | | | | | | |
TOTAL STANWELL CORPORATION LIMITED | | | | | | | | 91,277 | | |
| | | | | | | | | | |
TARONG ENERGY CORPORATION LIMITED | | | | | | | | | | |
Property, Plant and Equipment | | | | | | | | | | |
Brisbane | | | | | | | | | | |
M&T and Shared Services Project Initiatives | | 05 | | | | | | 4,998 | | Ongoing |
Tarong Power Station | | | | | | | | | | |
Kunioon Mine | | 15 | | 845,985 | | 130,356 | | 86,095 | | 629,534 |
Kunioon Conversion Program | | 15 | | 46,785 | | 467 | | 5,751 | | 40,567 |
Glen Wilga Review | | 15 | | 58,802 | | 47,728 | | 9,292 | | 1,782 |
Instrumentation & Control Systems Upgrade—TPS | | 15 | | 46,178 | | 5,826 | | 19,835 | | 20,517 |
Unit 1 Major Tarong 2008 | | 15 | | | | | | 17,267 | | Ongoing |
Unit 2 Major Tarong 2009 | | 15 | | | | | | 17,518 | | Ongoing |
Low NOx Burners | | 15 | | 31,370 | | 6,117 | | 15,691 | | 9,562 |
Other Capital Projects Tarong Power Station | | 15 | | | | | | 44,265 | | Ongoing |
| | | | | | | | | | |
Sub-total Tarong Power Station | | | | | | | | 215,714 | | |
| | | | | | | | | | |
Wivenhoe Power Station | | | | | | | | | | |
Control Systems Refit & Other—Wivenhoe | | 12 | | 10,327 | | 820 | | 2,081 | | 7,426 |
| | | | | | | | | | |
Sub-total Wivenhoe Power Station | | | | | | | | 2,081 | | |
| | | | | | | | | | |
Tarong North Power Station | | | | | | | | | | |
Minor Capital Tarong North Power Station | | 15 | | | | | | 1,442 | | Ongoing |
| | | | | | | | | | |
Sub-total Tarong North Power Station | | | | | | | | 1,442 | | |
| | | | | | | | | | |
Total Property, Plant and Equipment | | | | | | | | 224,235 | | |
| | | | | | | | | | |
TOTAL TARONG ENERGY CORPORATION LIMITED | | | | | | | | 224,235 | | |
| | | | | | | | | | |
253
Mines and Energy, (continued)
| | | | | | | | | | |
Project | | Statistical
Division | | Total
Estimated
Cost
$’000 | | Expenditure
to 30-06-08
$’000 | | Budget
2008-09
$’000 | | Post
2008-09
$’000 |
POWERLINK QUEENSLAND | | | | | | | | | | |
Property, Plant and Equipment | | | | | | | | | | |
Murarrie 275/110kV Transformer Augmentation | | 05 | | 11,100 | | 9,600 | | 1,500 | | |
El Arish 132/22kV Substation Establishment | | 50 | | 18,800 | | 14,300 | | 4,500 | | |
Greenbank Static VAR Compensator | | 05 | | 35,300 | | 17,300 | | 18,000 | | |
Yabulu South to Ingham Transmission Replacement. (Rossto Ingham) | | 45 | | 107,000 | | 8,600 | | 7,100 | | 91,300 |
Woolooga 275/132kV Substation Replacement | | 15 | | 36,900 | | 10,100 | | 25,600 | | 1,200 |
Tarong Secondary Systems Replacement | | 15 | | 24,500 | | | | 8,300 | | 16,200 |
Clare Substation Rebuild | | 45 | | 28,400 | | 9,500 | | 15,400 | | 3,500 |
North Qld Transmission Reinf. Stage 2 (Nebo to Strathmore) | | 40 | | 145,400 | | 57,600 | | 73,200 | | 14,600 |
Tully—Innisfail 132kV Transmission Line | | 50 | | 87,200 | | 80,400 | | 6,800 | | |
South Pine 110kV Substation Refurbishment—Stage 1 | | 05 | | 53,000 | | 15,000 | | 30,200 | | 7,800 |
Yabulu South Transmission Reinf.
(Ross to Yabulu Sth) | | 45 | | 46,500 | | 30,700 | | 15,800 | | |
West Darra Switchyard Rebuild | | 05 | | 27,300 | | 22,600 | | 4,700 | | |
Innisfail—Edmonton Line Replacement | | 50 | | 94,700 | | 38,600 | | 30,000 | | 26,100 |
Belmont 110kV Substation Refurbishment | | 05 | | 46,500 | | 5,400 | | 11,500 | | 29,600 |
North Qld Transmission Reinforcement Stage 1 (Broadsound Nebo) | | 40 | | 115,700 | | 101,700 | | 14,000 | | |
Pandoin Substation Establishment | | 30 | | 44,100 | | 10,100 | | 20,800 | | 13,200 |
Abermain 275kV Substation Establishment | | 05 | | 23,300 | | 20,900 | | 2,400 | | |
QR Bolingbroke Rail Supply | | 40 | | 43,800 | | 7,300 | | 36,400 | | 100 |
Tarong 275kV Substation Refurbishment | | 15 | | 24,900 | | 20,500 | | 4,400 | | |
Alligator Creek Transformer Replacement | | 40 | | 14,300 | | 13,400 | | 900 | | |
South Pine—Sandgate 275kV Transmission | | 05 | | 57,900 | | 3,200 | | 31,100 | | 23,600 |
Bouldercombe to South Pine Earthwire Replacement | | Various | | 35,400 | | 2,500 | | 19,000 | | 13,900 |
Telecommunications Network Development
(DWDM Establishment) | | Various | | 18,000 | | 8,300 | | 9,700 | | |
South Pine SVC | | 05 | | 36,000 | | 14,000 | | 22,000 | | |
Woolooga SVC | | 15 | | 38,500 | | 20,000 | | 18,500 | | |
South Pine Transformer No 6 | | 05 | | 28,200 | | 9,100 | | 5,800 | | 13,300 |
Larcom Creek 275/132kV Substation Establishment | | 30 | | 74,300 | | 500 | | 53,400 | | 20,400 |
Other Projects | | Various | | 184,400 | | | | 184,400 | | |
| | | | | | | | | | |
Total Property, Plant and Equipment | | | | | | | | 675,400 | | |
| | | | | | | | | | |
TOTAL POWERLINK QUEENSLAND | | | | | | | | 675,400 | | |
| | | | | | | | | | |
254
Mines and Energy, (continued)
| | | | | | | | | | |
Project | | Statistical
Division | | Total
Estimated
Cost
$’000 | | Expenditure
to 30-06-08
$’000 | | Budget
2008-09
$’000 | | Post
2008-09
$’000 |
ERGON ENERGY CORPORATION LIMITED | | | | | | | | | | |
Property, Plant and Equipment | | | | | | | | | | |
System Related | | | | | | | | | | |
Corporation Initiated Works | | | | | | | | | | |
Reinforcement of Supply to North Mackay (Glenella) | | 40 | | 91,600 | | 27,000 | | 30,000 | | 34,600 |
Reinforcement of Supply to Townsville (Belgian Gardens) | | 45 | | 21,900 | | 4,500 | | 15,000 | | 2,400 |
Reinforcement of Supply to North Rockhampton (Berserker) | | 30 | | 18,500 | | 3,500 | | 15,000 | | |
Other Reinforcement of Supply (All Regions) | | Various | | 362,366 | | 94,400 | | 118,812 | | 149,154 |
Redevelop Substation | | Various | | 42,492 | | 13,700 | | 19,392 | | 9,400 |
Augmentation | | 45 | | 12,500 | | 4,500 | | 8,000 | | |
Network Monitoring Project Stage 2 | | Various | | 7,796 | | 1,500 | | 3,000 | | 3,296 |
Reliability Improvement—Calliope to Littlemore | | 30 | | 7,550 | | 1,500 | | 6,000 | | 50 |
Wide Bay 132kV System Upgrades T131 (Isis) | | 15 | | 12,000 | | 9,000 | | 3,000 | | |
Other Corporation Initiated Works | | | | | | | | | | |
Sundry Corporation Initiated | | Various | | 228,556 | | | | 228,556 | | |
| | | | | | | | | | |
Sub-total Other Corporation Initiated Works | | | | | | | | 228,556 | | |
| | | | | | | | | | |
Sub-total Corporation Initiated Works | | | | | | | | 446,760 | | |
| | | | | | | | | | |
Customer Initiated Works | | | | | | | | | | |
Major Customer—Dalrymple Bay/Hay Point | | 40 | | 76,000 | | 7,000 | | 56,000 | | 13,000 |
Major Customer—QGC Miles Generator | | 20 | | 51,000 | | 500 | | 36,000 | | 14,500 |
Other Major Customer Works | | Various | | 50,800 | | 22,150 | | 6,800 | | 21,850 |
Other Customer Initiated Works | | Various | | 282,398 | | | | 282,398 | | |
| | | | | | | | | | |
Sub-total Customer Initiated Works | | | | | | | | 381,198 | | |
| | | | | | | | | | |
Isolated Systems | | | | | | | | | | |
Powerstation—Badu Island | | 50 | | 8,091 | | 7,000 | | 1,091 | | |
Windorah Concentrated PV Cells | | 35 | | 4,095 | | 1,500 | | 2,595 | | |
Other Isolated Systems | | | | | | | | | | |
Sundry Isolated Systems | | Various | | 23,475 | | | | 23,475 | | |
| | | | | | | | | | |
Sub-total Other Isolated Systems | | | | | | | | 23,475 | | |
| | | | | | | | | | |
Sub-total Isolated Systems | | | | | | | | 27,161 | | |
| | | | | | | | | | |
Sub-total System Related | | | | | | | | 855,119 | | |
| | | | | | | | | | |
Other Regulated Asset Additions | | | | | | | | | | |
Sundry other regulated | | Various | | 142,218 | | | | 142,218 | | |
| | | | | | | | | | |
Sub-total Other Regulated Asset Additions | | | | | | | | 142,218 | | |
| | | | | | | | | | |
255
Mines and Energy, (continued)
| | | | | | | | | | |
Project | | Statistical
Division | | Total
Estimated
Cost
$’000 | | Expenditure
to
30-06-08
$’000 | | Budget
2008-09
$’000 | | Post
2008-09
$’000 |
Non-Regulated Asset Additions | | | | | | | | | | |
Sundry non-regulated asset additions | | Various | | 4,515 | | | | 4,515 | | |
| | | | | | | | | | |
Sub-total Non-Regulated Asset Additions | | | | | | | | 4,515 | | |
| | | | | | | | | | |
Total Property, Plant and Equipment | | | | | | | | 1,001,852 | | |
| | | | | | | | | | |
Other Capital Expenditure | | | | | | | | | | |
Software and Intangibles | | 05 | | 2,532 | | | | 2,532 | | |
| | | | | | | | | | |
Total Other Capital Expenditure | | | | | | | | 2,532 | | |
| | | | | | | | | | |
TOTAL ERGON ENERGY CORPORATION LIMITED | | | | | | | | 1,004,384 | | |
| | | | | | | | | | |
TOTAL MINES AND ENERGY | | | | | | | | 3,123,471 | | |
| | | | | | | | | | |
NATURAL RESOURCES AND WATER
Capital acquisitions for the Natural Resources and Water portfolio (including the department, Queensland Bulk Water Supply Authority (QBWSA), Queensland Bulk Water Transport Authority (QBWTA), Gladstone Area Water Board, Mount Isa Water Board and SunWater) in 2008-09 is $322.5 million. A further $12.8 million is budgeted for departmental capital grant payments in relation to dam upgrades. The department’s 2008-09 capital acquisition program of $58.6 million principally comprises expenditure to support the planning and management of the State’s water, land and native vegetation resources.
Program Highlights
| | • | | Water security in Queensland is a critical issue. The acquisitions of land for future water infrastructure projects will continue with $41.9 million set aside in 2008-09 for strategic land purchases relating to Nathan dam ($33.9 million) and Connors River dam ($8.0 million). |
| | • | | The program of dam spillway upgrades will continue in 2008-09 with $12.8 million provided for capital grants for this purpose. |
Bulk Water Authorities
The QBWSA and the QBWTA were established in late 2007 as part of the Government’s institutional reform of urban water supply arrangements in South East Queensland (SEQ), and will assume control of bulk water supply and transport assets in the region. The Authorities have combined capital budgets of $181.7 million for 2008-09, including $100 million for stage 3 of the Hinze Dam raising project. Due for completion in December 2010, this project will provide total storage capacity of 309,700 million litres, and deliver an additional 16ML/day into the SEQ Water Grid. The bulk water businesses of local governments and other SEQ water entities have been progressively transferred to the new authorities over the first half of 2007-08, with the process to be finalised by 1 July 2008. The authorities will pay approximately $2.1 billion in compensation for the transferring assets. The authorities will also acquire those water supply and transport assets currently being constructed by councils and special purpose vehicle (SPV) companies, which are to form part of the SEQ water grid. Consideration paid for bulk water businesses acquired from local governments and other water entities has not been included in the authorities’ capital acquisition program. Capital expenditure by SPV companies on projects to transfer to the authorities is currently recorded under the Department of Infrastructure and Planning.
256
Water Boards
The Gladstone Area Water Board’s capital budget is $19.8 million for 2008-09. Major projects include preliminary works for a new pipeline from the Fitzroy River to the Gladstone region ($10.0 million) and implementation of integration of the Board’s control and flow metering system ($2.5 million).
In 2008-09 the Mount Isa Water Board’s capital budget is $12.1 million. Major projects include the Mount Isa terminal reservoir pump station upgrade ($8 million) and Lake Moondarra pipeline upgrade ($2.5 million).
SunWater
SunWater’s capital budget of $50.3 million for 2008-09 is primarily focused on prefeasibility studies and the development of business cases for the regional water infrastructure projects including Nathan dam ($11.1 million), Connors River dam ($10.3 million) and Fitzroy River weir ($8.7 million), as well as the Water for Bowen project ($1.7 million). Other outlays mainly consist of refurbishment and enhancement of existing assets including upgrades to the Mareeba water supply ($4.9 million), which incorporates the Tinaroo Falls dam spillway upgrade.
Natural Resources and Water1,2
| | | | | | | | | | |
Project | | Statistical
Division | | Total
Estimated
Cost
$’000 | | Expenditure
to
30-06-08
$’000 | | Budget
2008-09
$’000 | | Post
2008-09
$’000 |
DEPARTMENT OF NATURAL RESOURCES AND WATER | | | | | | | | | | |
| | | | | |
Property, Plant and Equipment | | | | | | | | | | |
Land Acquisitions | | | | | | | | | | |
Nathan Dam | | 20 | | 58,600 | | 3,000 | | 33,900 | | 21,700 |
Connors River Dam | | 40 | | 17,000 | | 4,500 | | 8,000 | | 4,500 |
Land development and management system | | 05 | | | | | | 2,100 | | Ongoing |
Building and accommodation upgrades | | Various | | | | | | 2,973 | | Ongoing |
Plant and Equipment | | | | | | | | | | |
Water Reform—continuity of supply | | 05 | | | | | | 1,000 | | Ongoing |
Other plant and equipment | | Various | | | | | | 6,235 | | Ongoing |
| | | | | | | | | | |
Total Property, Plant and Equipment | | | | | | | | 54,208 | | |
| | | | | | | | | | |
Other Capital Expenditure | | | | | | | | | | |
Land Tenure Ledger replacement | | 05 | | 3,800 | | 3,500 | | 300 | | |
Urban Water Management Systems | | 05 | | | | | | 500 | | Ongoing |
Other systems development | | 05 | | | | | | 3,545 | | Ongoing |
| | | | | | | | | | |
Total Other Capital Expenditure | | | | | | | | 4,345 | | |
| | | | | | | | | | |
Capital Grants | | | | | | | | | | |
Dam spillway upgrades | | Various | | 72,500 | | 27,700 | | 12,815 | | 31,985 |
| | | | | | | | | | |
Total Capital Grants | | | | | | | | 12,815 | | |
| | | | | | | | | | |
TOTAL DEPARTMENT OF NATURAL RESOURCES AND WATER | | | | | | | | 71,368 | | |
| | | | | | | | | | |
257
Natural Resources and Water1,2, (continued)
| | | | | | | | | | |
Project | | Statistical
Division | | Total
Estimated
Cost
$’000 | | Expenditure
to
30-06-08
$’000 | | Budget
2008-09
$’000 | | Post
2008-09
$’000 |
GLADSTONE AREA WATER BOARD | | | | | | | | | | |
| | | | | |
Property, Plant and Equipment | | | | | | | | | | |
Fitzroy Pipeline project | | 30 | | 372,925 | | 17,924 | | 10,001 | | 345,000 |
Control system Integration | | 30 | | 2,905 | | 400 | | 2,505 | | |
Rationalisation of land holding | | 30 | | 1,377 | | | | 1,377 | | |
Awoonga Dam power supply upgrade | | 30 | | 1,375 | | 415 | | 960 | | |
Boat Creek Raw Water Network reinstatement works | | 30 | | 739 | | 45 | | 694 | | |
Awoonga Dam projects | | 30 | | 1,432 | | 38 | | 607 | | 787 |
Fitzsimmons Street Raw Water Reservoirs metering upgrade | | 30 | | 332 | | | | 332 | | |
Awoonga to Gladstone Pipeline remedial works | | 30 | | 4,569 | | | | 345 | | 4,224 |
Mt Miller Pipeline remedial works | | 30 | | 337 | | | | 337 | | |
Gladstone Water Treatment Plant projects | | 30 | | 433 | | 20 | | 398 | | 15 |
Yarwun Water Treatment Plant upgrade | | 30 | | 2,447 | | 2,167 | | 280 | | |
Other minor works | | 30 | | | | | | 1,991 | | Ongoing |
| | | | | | | | | | |
Total Property, Plant and Equipment | | | | | | | | 19,827 | | |
| | | | | | | | | | |
TOTAL GLADSTONE AREA WATER BOARD | | | | | | | | 19,827 | | |
| | | | | | | | | | |
MOUNT ISA WATER BOARD | | | | | | | | | | |
| | | | | |
Property, Plant and Equipment | | | | | | | | | | |
Mount Isa Terminal Reservoir Pump Station upgrade | | 55 | | 16,700 | | 8,700 | | 8,000 | | |
Lake Moondarra Pipeline (Stages 1, 1A & 2) | | 55 | | 3,667 | | 1,167 | | 2,500 | | |
Lake Julius power distribution lines upgrade | | 55 | | | | | | 400 | | Ongoing |
Control system upgrade | | 55 | | | | | | 250 | | Ongoing |
Minor acquisitions | | 55 | | | | | | 100 | | Ongoing |
Other minor works | | 55 | | 2,495 | | 1,650 | | 845 | | |
| | | | | | | | | | |
Total Property, Plant and Equipment | | | | | | | | 12,095 | | |
| | | | | | | | | | |
TOTAL MOUNT ISA WATER BOARD | | | | | | | | 12,095 | | |
| | | | | | | | | | |
SUNWATER | | | | | | | | | | |
| | | | | |
Property, Plant and Equipment | | | | | | | | | | |
| | | | | |
Prefeasibility studies and the development of business cases for regional Water Projects | | | | | | | | | | |
Fitzroy River Weir | | 30 | | 8,891 | | | | 8,691 | | 200 |
Connors River Dam | | 40 | | 12,756 | | | | 10,315 | | 2,441 |
Nathan Dam | | 15 | | 14,399 | | | | 11,052 | | 3,347 |
Water for Bowen | | 40 | | 1,700 | | | | 1,700 | | |
258
Natural Resources and Water1,2, (continued)
| | | | | | | | | | |
Project | | Statistical
Division | | Total
Estimated
Cost
$’000 | | Expenditure
to
30-06-08
$’000 | | Budget
2008-09
$’000 | | Post
2008-09
$’000 |
Refurbishment and Enhancement (service contracts) | | | | | | | | | | |
Mareeba Water Supply | | 50 | | | | | | 4,944 | | Ongoing |
Upper Mary Water Supply | | 15 | | | | | | 2,320 | | Ongoing |
Mareeba Irrigation Distribution | | 50 | | | | | | 1,354 | | Ongoing |
Burdekin Irrigation Distribution | | 45 | | | | | | 959 | | Ongoing |
St George Irrigation Distribution | | 25 | | | | | | 691 | | Ongoing |
Awoonga Callide Pipeline | | 30 | | | | | | 676 | | Ongoing |
Pioneer Water Supply | | 40 | | | | | | 528 | | Ongoing |
Macintyre Brook Water Supply | | 20 | | | | | | 386 | | Ongoing |
Bundaberg Irrigation Distribution | | 15 | | | | | | 300 | | Ongoing |
Eton Water Supply | | 40 | | | | | | 269 | | Ongoing |
Nogoa Water Supply | | 30 | | | | | | 267 | | Ongoing |
Eton Irrigation Distribution | | 40 | | | | | | 252 | | Ongoing |
Other schemes < $250K | | Various | | | | | | 1,770 | | Ongoing |
| | | | | | | | | | |
Sub-total Refurbishment and Enhancement (service contracts) | | | | | | | | 14,716 | | |
| | | | | | | | | | |
Minor Works | | | | | | | | | | |
Software development and hardware | | 05 | | | | | | 3,174 | | Ongoing |
Plant and equipment purchase | | Various | | | | | | 650 | | Ongoing |
| | | | | | | | | | |
Sub-total Minor Works | | | | | | | | 3,824 | | |
| | | | | | | | | | |
Total Property, Plant and Equipment | | | | | | | | 50,298 | | |
| | | | | | | | | | |
TOTAL SUNWATER | | | | | | | | 50,298 | | |
| | | | | | | | | | |
QUEENSLAND BULK WATER SUPPLY
AUTHORITY | | | | | | | | |
| | | | | |
Property, Plant and Equipment | | | | | | | | | | |
Raising of the Hinze Dam (stage 3) | | 07 | | 395,000 | | 50,000 | | 100,000 | | 245,000 |
Other capital works | | Various | | | | | | 61,100 | | Ongoing |
| | | | | | | | | | |
Total Property, Plant and Equipment | | | | | | | | 161,100 | | |
| | | | | | | | | | |
TOTAL QUEENSLAND BULK WATER SUPPLY
AUTHORITY | | | | | | | | 161,100 | | |
| | | | | | | | | | |
QUEENSLAND BULK WATER TRANSPORT AUTHORITY | | | | | | | | | | |
| | | | | |
Property, Plant and Equipment | | | | | | | | | | |
Other capital works | | Various | | | | | | 20,600 | | Ongoing |
| | | | | | | | | | |
Total Property, Plant and Equipment | | | | | | | | 20,600 | | |
| | | | | | | | | | |
TOTAL QUEENSLAND BULK WATER TRANSPORT AUTHORITY | | | | | | | | 20,600 | | |
| | | | | | | | | | |
TOTAL NATURAL RESOURCES AND WATER | | | | | | | | 335,288 | | |
| | | | | | | | | | |
Notes:
| 1. | Capital expenditure does not include the consideration paid to local government and other water entities in 2007-08 and 2008-09 for bulk water supply and transport assets acquired as a part of the institutional reform of urban water supply arrangements in South East Queensland. |
259
| 2. | Capital expenditure to 30 June 2008 for stage 3 of the Hinze Dam raising project is being incurred by the responsible local government. From 2008-09, responsibility for the project will transfer to the QBWSA. |
OFFICE OF THE GOVERNOR
During 2008-09, the Office of the Governor will expend $35,000 towards capital replacements including motor vehicles and office equipment.
Ongoing replacement of capital items enables the Governor to undertake the full range of duties expected of the Head of State, including those that promote and support whole-of-Government priorities.
Office of the Governor
| | | | | | | | | | |
Project | | Statistical
Division | | Total
Estimated
Cost
$’000 | | Expenditure
to
30-06-08
$’000 | | Budget
2008-09
$’000 | | Post
2008-09
$’000 |
OFFICE OF THE GOVERNOR | | | | | | | | | | |
| | | | | |
Property, Plant and Equipment | | | | | | | | | | |
Asset replacement | | 05 | | | | | | 35 | | Ongoing |
| | | | | | | | | | |
Total Property, Plant and Equipment | | | | | | | | 35 | | |
| | | | | | | | | | |
TOTAL OFFICE OF THE GOVERNOR | | | | | | | | 35 | | |
| | | | | | | | | | |
OFFICE OF THE OMBUDSMAN
The office has budgeted to spend $80,000 per annum on computer equipment and office equipment. In addition, the office is relocating in April 2009 and has budgeted to spend $300,000 on fitting out the new premises.
Office of the Ombudsman
| | | | | | | | | | |
Project | | Statistical
Division | | Total
Estimated
Cost
$’000 | | Expenditure
to
30-06-08
$’000 | | Budget
2008-09
$’000 | | Post
2008-09
$’000 |
OFFICE OF THE OMBUDSMAN | | | | | | | | | | |
| | | | | |
Property, Plant and Equipment | | | | | | | | | | |
Computer equipment | | 05 | | | | | | 60 | | Ongoing |
Office equipment | | 05 | | | | | | 20 | | Ongoing |
Office Fitout—New Accommodation | | 05 | | 300 | | | | 300 | | |
| | | | | | | | | | |
Total Property, Plant and Equipment | | | | | | | | 380 | | |
| | | | | | | | | | |
TOTAL OFFICE OF THE OMBUDSMAN | | | | | | | | 380 | | |
| | | | | | | | | | |
POLICE
The delivery of effective policing services to the community of Queensland requires the establishment and maintenance of appropriate infrastructure. The Queensland Police Service’s capital program encompasses a strategic approach that focuses on designing, constructing, and maintaining facilities, information and communication technology, and other equipment needs. An allocation of $283.4 million in 2008-09 will enable the Service to progress the following key projects.
260
Program Highlights
| | • | | $147 million is provided to construct new and replacement facilities (including Westgate—New Police Academy) and to plan for future facilities identified in the Queensland Police Service Ten-Year Capital Investment Strategic Plan. |
| | • | | $77.8 million is provided for information and communication technology and relates to projects identified in the Service’s Information Strategic Plan 2001-10, including the Public Safety Network (PSN), Computer Aided Dispatch (CAD) system and Queensland Police Records and Information Management Exchange (QPRIME). |
| | • | | $6.4 million is provided for vessel purchases, upgrades, and outfitting. The ongoing water vessels program provides the facilities to meet enhanced service delivery requirements. |
| | • | | $52.2 million is provided to support the purchase of other plant and equipment (including motor vehicles). |
Police
| | | | | | | | | | |
Project | | Statistical
Division | | Total
Estimated
Cost
$’000 | | Expenditure
to
30-06-08
$’000 | | Budget
2008-09
$’000 | | Post
2008-09
$’000 |
QUEENSLAND POLICE SERVICE | | | | | | | | | | |
| | | | | |
Property, Plant and Equipment | | | | | | | | | | |
Major Capital* | | | | | | | | | | |
Ayr—replacement police station and watchhouse | | 45 | | 9,253 | | 4,493 | | 4,760 | | |
Beenleigh—police station refurbishment | | 07 | | 2,700 | | 241 | | 2,459 | | |
Bribie Island—police station upgrade | | 05 | | 2,167 | | 1,931 | | 236 | | |
Burpengary—new police station and Caboolture district functions | | 05 | | 9,500 | | 928 | | 8,572 | | |
Camp Hill—replacement police station | | 05 | | 2,501 | | 234 | | 2,267 | | |
Carseldine—new police station | | 05 | | 8,400 | | 697 | | 6,203 | | 1,500 |
Charleville—replacement district headquarters and watchhouse | | 25 | | 5,580 | | 1,040 | | 4,540 | | |
Coomera—new district office | | 07 | | 11,200 | | 1,441 | | 7,323 | | 2,436 |
Crestmead / Marsden—new police station | | 05 | | 5,400 | | 460 | | 4,940 | | |
Fortitude Valley—replacement police station | | 05 | | 13,200 | | 5,565 | | 7,635 | | |
Fortitude Valley—heritage building refurbishment | | 05 | | 2,800 | | 660 | | 932 | | 1,208 |
Holland Park—replacement police station | | 05 | | 7,000 | | 1,212 | | 5,788 | | |
Horn Island—hangar | | 50 | | 1,000 | | 50 | | 950 | | |
Ipswich—replacement police station | | 05 | | 18,979 | | 6,937 | | 11,766 | | 276 |
Kawana Waters—replacement water police facility | | 09 | | 3,000 | | | | 3,000 | | |
Longreach—police station refurbishment (stage 3) | | 35 | | 2,091 | | 1,581 | | 510 | | |
Mango Hill (Northlakes)—new police station | | 05 | | 5,360 | | 1,719 | | 3,641 | | |
Mareeba—replacement station and watchhouse | | 50 | | 10,355 | | 860 | | 7,495 | | 2,000 |
Mudgeeraba—police station upgrade | | 07 | | 1,500 | | 920 | | 580 | | |
Murgon—replacement police station / watchhouse (stage 1) | | 15 | | 8,000 | | 231 | | 3,073 | | 4,696 |
Port Douglas—replacement police station | | 50 | | 3,000 | | 631 | | 2,369 | | |
Reedy Creek—new police station | | 07 | | 3,800 | | 224 | | 3,576 | | |
Sippy Downs—new police station | | 09 | | 5,502 | | 1,525 | | 3,977 | | |
Smithfield—police station upgrade | | 50 | | 1,300 | | 350 | | 950 | | |
261
Police, (continued)
| | | | | | | | | | |
Project | | Statistical
Division | | Total
Estimated
Cost
$’000 | | Expenditure
to
30-06-08
$’000 | | Budget
2008-09
$’000 | | Post
2008-09
$’000 |
Springfield—new police station | | 05 | | 5,400 | | 476 | | 4,924 | | |
Surfers Paradise—new police station | | 07 | | 3,535 | | 1,146 | | 2,389 | | |
The Gap—replacement police station | | 05 | | 1,000 | | 385 | | 615 | | |
Thursday Island—station extensions | | 50 | | 1,000 | | 100 | | 900 | | |
Upper Mt Gravatt—police station refurbishment | | 05 | | 3,577 | | 1,218 | | 2,359 | | |
Whitsunday—replacement police station and watchhouse | | 40 | | 11,600 | | 4,767 | | 6,833 | | |
Yeppoon—replacement police station | | 30 | | 8,618 | | 3,881 | | 4,737 | | |
Other major capital | | Various | | | | | | 3,830 | | Ongoing |
| | | | | | | | | | |
Sub-total Major Capital* | | | | | | | | 124,129 | | |
| | | | | | | | | | |
| | | | | |
Sub-Programs | | | | | | | | | | |
Upgrade of establishment | | Various | | | | | | 4,000 | | Ongoing |
Small Station Program | | | | | | | | | | |
Mt Morgan—police station upgrade | | 30 | | 2,037 | | 1,327 | | 710 | | |
Ravenshoe—replacement police station and holding cell | | 50 | | 1,000 | | 700 | | 300 | | |
Woodford—replacement police station | | 05 | | 1,000 | | 800 | | 200 | | |
Watchhouse upgrade program | | Various | | | | | | 500 | | Ongoing |
| | | | | | | | | | |
Sub-total Sub-Programs | | | | | | | | 5,710 | | |
| | | | | | | | | | |
Housing Program | | | | | | | | | | |
Aurukun—new residence | | 50 | | 1,650 | | 80 | | 1,570 | | |
Coomera—new residence | | 07 | | 500 | | | | 500 | | |
Policing Indigenous Communities—Bamaga and Kowanyama | | 50 | | 3,000 | | | | 3,000 | | |
Policing Indigenous Communities—Cooktown and Weipa | | 50 | | 2,800 | | 80 | | 2,720 | | |
State Housing Committee Program | | Various | | | | | | 1,300 | | Ongoing |
| | | | | | | | | | |
Sub-total Housing Program | | | | | | | | 9,090 | | |
| | | | | | | | | | |
Minor Works | | | | | | | | | | |
Minor Works | | Various | | | | | | 3,100 | | Ongoing |
Other Property, Plant and Equipment | | | | | | | | | | |
Westgate—new police academy | | 05 | | 421,933 | | 11,000 | | 5,000 | | 405,933 |
Information and Communication Technology | | Various | | | | | | 64,800 | | Ongoing |
Vessels | | Various | | | | | | 6,435 | | Ongoing |
Other plant and equipment (includes motor vehicles) | | Various | | | | | | 52,196 | | Ongoing |
| | | | | | | | | | |
Total Property, Plant and Equipment | | | | | | | | 270,460 | | |
| | | | | | | | | | |
Other Capital Expenditure | | | | | | | | | | |
Intangibles—Information and Communication Technology | | | | | | | | | | |
Intangibles—Information and Communication Technology | | Various | | | | | | 12,982 | | Ongoing |
| | | | | | | | | | |
Total Other Capital Expenditure | | | | | | | | 12,982 | | |
| | | | | | | | | | |
TOTAL QUEENSLAND POLICE SERVICE | | | | | | | | 283,442 | | |
| | | | | | | | | | |
262
PREMIER AND CABINET
Capital expenditure for the Department of the Premier and Cabinet including all associated organisations is $101.0 million.
The department’s capital budget of $7.0 million will see significant enhancements to the department’s information and communication capability. The completion of key projects will provide significant benefits to the efficient running of both the department and Government in general.
Program Highlights
| | • | | The implementation of the department’s Information and Communication Technology (ICT) Infrastructure and Network Strategy; |
| | • | | SmartCab (Queensland’s new Cabinet Information System); and |
| | • | | A new Electronic Documents and Records Management System (eDRMS). |
Commission for Children and Young People and Child Guardian
The Commission for Children and Young People and Child Guardian’s capital program for 2008-09 provides for expenditure of $3.2 million. Major projects to be undertaken are:
| | • | | The fitout of office accommodation in accordance with the Commission’s Long-term Accommodation Strategy; and |
| | • | | The development of a new Employment Screening Services Database which will provide for a more efficient blue card application process. |
South Bank Corporation
The 2008-09 capital works program for South Bank Corporation is directed at enhancing the experience of visitors to the parklands and the precinct generally, and to the ongoing operational requirements of South Bank Corporation and the Brisbane Convention and Exhibition Centre.
The Government will fund the construction of a Storm Water Harvesting System which is expected to meet 78% of South Bank Parkland’s irrigation and water feature needs. The total cost of the project will be $4.6 million. The installation includes a major stormwater diversion pit, including a collapsible weir to hold back river water and a large capacity stormwater harvesting pump, a further 2 ML storage area and a primary treatment plant and reticulation system to pump Class A recycled water to Parklands irrigation system and water features.
The Brisbane Convention and Exhibition Centre will be expanded, at a total cost of $130 million, by approximately 24,000 square meters of additional floor space. Key components of the expanded facility are a 600 seat and a 400 seat tiered plenary hall, breakout rooms, foyer/exhibition space, and ground floor restaurant and retail uses.
263
Premier and Cabinet
| | | | | | | | | | |
Project | | Statistical
Division | | Total
Estimated
Cost
$'000 | | Expenditure
to
30-06-08
$'000 | | Budget
2008-09
$'000 | | Post
2008-09
$'000 |
DEPARTMENT OF THE PREMIER AND CABINET | | | | | | | | | | |
| | | | | |
Property, Plant and Equipment | | | | | | | | | | |
Information and Communication Technology (ICT) Infrastructure and Network Strategy | | 05 | | 1,981 | | 1,223 | | 758 | | |
Asset replacement program | | 05 | | | | | | 2,833 | | Ongoing |
| | | | | | | | | | |
Total Property, Plant and Equipment | | | | | | | | 3,591 | | |
| | | | | | | | | | |
Other Capital Expenditure | | | | | | | | | | |
Electronic Documents and Records Management System | | 05 | | 1,546 | | 811 | | 735 | | |
SmartCab (Queensland's new Cabinet Information System) | | 05 | | 2,720 | | | | 2,720 | | |
| | | | | | | | | | |
Total Other Capital Expenditure | | | | | | | | 3,455 | | |
| | | | | | | | | | |
TOTAL DEPARTMENT OF THE PREMIER AND CABINET | | | | | | | | 7,046 | | |
| | | | | | | | | | |
| | | | | |
COMMISSION FOR CHILDREN AND YOUNG PEOPLE AND CHILD GUARDIAN | | | | | | | | | | |
| | | | | |
Property, Plant and Equipment | | | | | | | | | | |
Asset replacement program | | 05 | | | | | | 150 | | Ongoing |
Leasehold improvements | | 05 | | 1,017 | | | | 1,017 | | |
| | | | | | | | | | |
Total Property, Plant and Equipment | | | | | | | | 1,167 | | |
| | | | | | | | | | |
Other Capital Expenditure | | | | | | | | | | |
Employment Screening Services Database | | 05 | | 2,000 | | | | 2,000 | | |
| | | | | | | | | | |
Total Other Capital Expenditure | | | | | | | | 2,000 | | |
| | | | | | | | | | |
TOTAL COMMISSION FOR CHILDREN AND YOUNG PEOPLE AND CHILD GUARDIAN | | | | | | | | 3,167 | | |
| | | | | | | | | | |
SOUTH BANK CORPORATION | | | | | | | | | | |
| | | | | |
Property, Plant and Equipment | | | | | | | | | | |
Brisbane Convention and Exhibition Centre expansion | | 05 | | 130,000 | | 28,400 | | 76,000 | | 25,600 |
South Bank Precinct enhancements | | 05 | | | | | | 11,928 | | Ongoing |
Storm Water Harvesting System | | 05 | | 4,600 | | 1,730 | | 2,870 | | |
| | | | | | | | | | |
Total Property, Plant and Equipment | | | | | | | | 90,798 | | |
| | | | | | | | | | |
TOTAL SOUTH BANK CORPORATION | | | | | | | | 90,798 | | |
| | | | | | | | | | |
TOTAL PREMIER AND CABINET | | | | | | | | 101,011 | | |
| | | | | | | | | | |
264
PRIMARY INDUSTRIES AND FISHERIES
The Department of Primary Industries and Fisheries’ (DPIF) capital expenditure program for 2008-09 is $25 million, which is primarily focused on developing world-class research facilities to deliver excellent scientific outcomes for primary industries and fisheries. DPIF has numerous facilities located throughout rural and regional Queensland. These require a significant level of minor works, mechanical items and other plant and equipment upgrades to keep them operating effectively.
Program Highlights
| | • | | $4.5 million has been allocated to provide a world-class facility for combined fisheries and aquaculture research at the Bribie Island Aquaculture Research Centre. The project includes more efficient and integrated infrastructure including new seawater tank facilities. |
| | • | | In 2008-09 $1.1 million will be allocated to the construction of a new facility at the Maroochy Research Station which commenced in 2007-08. Nambour regional office staff will be relocated to the new facility upon its completion, which will provide operational cost savings and synergies by co-locating management, industry development and research staff at the one research station. |
| | • | | $1 million has been provided to upgrade fences and stockyards for the Tick Fever Centre specific pathogen free breeder herd relocated from Wacol to Dalby. Biosecurity Queensland’s Tick Fever Centre produces a range of vaccines against tick fever, a disease with the potential to cost Queensland’s cattle producers up to $35 million per year in deaths, lost production and restricted access to live cattle export markets. |
Forestry Plantations Queensland
The capital expenditure program for 2008-09 is $16 million. This includes $7 million for the purchase of freehold land for hardwood plantation establishment, $5.1 million for the replacement of heavy plant and motor vehicles, $1.2 million for roads, $1.2 million for other plant and equipment, $1.1 million for computer equipment and $0.4 million to construct buildings and land improvements.
QRAA
QRAA’s capital budget for 2008-09 is $0.6 million. This amount covers information technology software and hardware for the twelve months with the major item being the stabilisation and ongoing development of QRAA’s operational software.
265
Primary Industries and Fisheries
| | | | | | | | | | |
Project | | Statistical
Division | | Total
Estimated
Cost
$’000 | | Expenditure
to
30-06-08
$’000 | | Budget
2008-09
$’000 | | Post
2008-09
$’000 |
DEPARTMENT OF PRIMARY INDUSTRIES AND FISHERIES | | | | | | | | | | |
| | | | | |
Property, Plant and Equipment | | | | | | | | | | |
Bribie Island Aquaculture Research Centre-extension | | 05 | | 5,098 | | 550 | | 4,548 | | |
Queensland Crop Development Facility-Redlands | | 05 | | 8,622 | | 8,527 | | 95 | | |
Relocation of Tick Fever Herd | | 20 | | 5,000 | | 4,000 | | 1,000 | | |
Regional Office Complex-Nambour | | 12 | | 2,898 | | 1,778 | | 1,120 | | |
Relocation and refurbishment | | Various | | | | | | 500 | | Ongoing |
Research facilities development | | Various | | | | | | 1,500 | | Ongoing |
Vessel replacement | | Various | | | | | | 1,200 | | Ongoing |
Heavy plant and equipment | | Various | | | | | | 1,000 | | Ongoing |
Minor works | | Various | | | | | | 1,500 | | Ongoing |
Other plant and equipment | | Various | | | | | | 5,594 | | Ongoing |
| | | | | | | | | | |
Total Property, Plant and Equipment | | | | | | | | 18,057 | | |
| | | | | | | | | | |
Other Capital Expenditure | | | | | | | | | | |
Intangible assets | | 05 | | | | | | 1,428 | | Ongoing |
Other projects | | Various | | | | | | 450 | | Ongoing |
| | | | | | | | | | |
Total Other Capital Expenditure | | | | | | | | 1,878 | | |
| | | | | | | | | | |
Capital Grants | | | | | | | | | | |
RSPCA facility | | 05 | | 10,000 | | 350 | | 5,000 | | 4,650 |
| | | | | | | | | | |
Total Capital Grants | | | | | | | | 5,000 | | |
| | | | | | | | | | |
TOTAL DEPARTMENT OF PRIMARY INDUSTRIES AND FISHERIES | | | | | | | | 24,935 | | |
| | | | | | | | | | |
FORESTRY PLANTATIONS QUEENSLAND | | | | | | | | | | |
| | | | | |
Property, Plant and Equipment | | | | | | | | | | |
Roads | | Various | | | | | | 1,217 | | Ongoing |
Buildings & Land Improvements | | Various | | | | | | 376 | | Ongoing |
Land | | Various | | | | | | 7,000 | | Ongoing |
Heavy plant and motor vehicles | | Various | | | | | | 5,055 | | Ongoing |
Computer equipment | | Various | | | | | | 1,136 | | Ongoing |
Other plant and equipment | | Various | | | | | | 1,217 | | Ongoing |
| | | | | | | | | | |
Total Property, Plant and Equipment | | | | | | | | 16,001 | | |
| | | | | | | | | | |
TOTAL FORESTRY PLANTATIONS QUEENSLAND | | | | | | | | 16,001 | | |
| | | | | | | | | | |
QRAA | | | | | | | | | | |
| | | | | |
Property, Plant and Equipment | | | | | | | | | | |
Computer equipment | | 05 | | | | | | 600 | | Ongoing |
| | | | | | | | | | |
Total Property, Plant and Equipment | | | | | | | | 600 | | |
| | | | | | | | | | |
TOTAL QRAA | | | | | | | | 600 | | |
| | | | | | | | | | |
TOTAL PRIMARY INDUSTRIES AND FISHERIES | | | | | | | | 41,536 | | |
| | | | | | | | | | |
266
PUBLIC WORKS
The department’s capital expenditure program for 2008-09, including commercialised business units (CBUs), the Shared Service Agency (SSA) and Corptech, is $448.8 million. Capital expenditure by the department, excluding CBUs, SSA and CorpTech is $209.8 million.
Program Highlights
| | • | | QFleet will purchase motor vehicles totalling $128.2 million. The vehicles will be leased to clients to facilitate the delivery of Government services across Queensland. The vehicle purchases and associated ongoing maintenance provide support for local Queensland firms. |
| | • | | CorpTech, the technology centre of skill established under the Shared Service Initiative, has a capital expenditure program in 2008-09 of $38.0 million. This program will provide innovative whole-of-Government corporate applications and infrastructure solutions for the shared service providers and to agencies within government. |
| | • | | $40.5 million is provided in 2008-09 for the continuing construction of a new government office building in Cairns. The building will provide 9,600 square metres of net lettable area as Stage 2 of William McCormack Place in Hartley Street, Cairns. The total project cost is estimated at $79.5 million. |
| | • | | $24.5 million is provided in 2008-09 for the completion of site infrastructure of works associated with the Boggo Road Precinct redevelopment. The redevelopment will contribute significantly to the Smart State initiatives with the first stage of the proposed knowledge based research and business component providing approximately 60,000 square metres of office and laboratory space for scientific research into eco-science. |
| | • | | $31.5 million is allocated in 2008-09 as part of a $63.3 million project to construct a new footbridge from Tank Street to the new Queensland Gallery of Modern Art at the Queensland Cultural Centre. |
| | • | | $21.3 million is allocated in 2008-09 to provide the foundation infrastructure required to enable technology consolidation across government. It encompasses a metropolitan area network, internet service, core network, carrier gateway service, and an initial server and storage platform. |
| | • | | $20.2 million is provided in 2008-09 for the construction of Stage 2 (Extension) of the Gold Coast Convention and Exhibition Centre. The extension will provide the Gold Coast with a world class convention and exhibition centre with seating for up to 6,000 patrons by doubling the space in the exhibition hall and allowing the centre to host larger national and international events. Provision for the extension was made during original construction of the centre. The total project cost is estimated at $40 million. |
| | • | | $13.6 million is allocated in 2008-09 for the design and construction of a Joint Contact Centre at Zillmere in Brisbane. The building will accommodate an estimated 417 work points from Smart Service Queensland and Queensland Police Services. The Department of Public Works has been allocated a total capital budget of $57.4 million. |
| | • | | $15 million is allocated in 2008-09 for the construction and upgrade of Government employee housing in rural and remote areas of the State, to support the delivery of Government services in these locations. |
| | • | | $10 million is provided in 2008-09 for the government office building at Mareeba. The project includes the purchase of an existing Department of Primary Industries and Fisheries property at Peters Street, Mareeba and the refurbishment of the building to provide new office accommodation. The project will provide improved and efficient office accommodation for four Government agencies in Mareeba. The total project cost is estimated at $15.5 million. |
267
| | • | | $9.4 million is provided in 2008-09 to continue the construction of a new government office building on Palm Island in order to meet the accommodation needs of Queensland Government agencies. The total project cost is estimated at $12.9 million. |
| | • | | $9 million is provided in 2008-09 to continue the construction of a new government office building at Maroochydore. The building will provide 8,900 square metres of net lettable area on a development site in the Maroochydore Central Business District. The total project cost is estimated at $84.5 million. |
Public Works
| | | | | | | | | | |
Project | | Statistical
Division | | Total
Estimated
Cost
$’000 | | Expenditure
to
30-06-08
$’000 | | Budget
2008-09
$’000 | | Post
2008-09
$’000 |
DEPARTMENT OF PUBLIC WORKS | | | | | | | | | | |
| | | | | |
Property, Plant and Equipment | | | | | | | | | | |
Brisbane—Queensland State Archives stage 2 | | 05 | | 52,000 | | 43,752 | | 8,248 | | |
Brisbane—Tank Street—pedestrian/cycle bridge | | 05 | | 63,300 | | 22,137 | | 31,467 | | 9,696 |
Palm Island—office building | | 45 | | 12,870 | | 3,454 | | 9,416 | | |
Carpet replacement program | | Various | | | | | | 800 | | Ongoing |
Anti Discrimination Program | | Various | | | | | | 300 | | Ongoing |
Workplace Health and Safety | | Various | | | | | | 900 | | Ongoing |
Gold Coast Convention and Exhibition Centre—Stage 2 Extension | | 07 | | 40,000 | | 14,762 | | 20,238 | | 5,000 |
Cairns—new office building | | 50 | | 79,500 | | 4,500 | | 40,500 | | 34,500 |
Maroochydore—new office building | | 09 | | 84,500 | | 9,800 | | 9,000 | | 65,700 |
Thursday Island—new office building | | 50 | | 13,500 | | 1,600 | | 1,800 | | 10,100 |
Townsville—Office Refurbishment | | 45 | | 3,500 | | 3,000 | | 500 | | |
Brisbane—Joint Contact Centre, Zillmere | | 05 | | 57,400 | | 1,900 | | 13,600 | | 41,900 |
Government Employee Housing | | Various | | | | | | 15,000 | | Ongoing |
Brisbane—63 George Street refurbishment | | 05 | | 45,300 | | 40,300 | | 2,500 | | 2,500 |
Brisbane—Boggo Road Precinct redevelopment | | 05 | | 45,476 | | 9,105 | | 24,468 | | 11,903 |
Mareeba—new office building | | 50 | | 15,500 | | 5,000 | | 10,000 | | 500 |
Brisbane—Refurbishment CITEC accommodation 317 Edward Street | | 05 | | 6,700 | | 2,400 | | 4,300 | | |
Energy Performance Contract—317 Edward Street | | 05 | | 2,223 | | | | 2,223 | | |
Energy Performance Contract—111 George Street | | 05 | | 3,852 | | | | 3,852 | | |
Other plant and equipment | | Various | | | | | | 6,244 | | Ongoing |
| | | | | | | | | | |
Total Property, Plant and Equipment | | | | | | | | 205,356 | | |
| | | | | | | | | | |
Other Capital Expenditure | | | | | | | | | | |
Whole of Government ICT initiatives | | Various | | | | | | 2,164 | | Ongoing |
Travel Management System | | Various | | 3,280 | | 2,655 | | 625 | | |
| | | | | | | | | | |
Total Other Capital Expenditure | | | | | | | | 2,789 | | |
| | | | | | | | | | |
Capital Grants | | | | | | | | | | |
Mackay Convention Precinct | | 40 | | 36,301 | | 34,640 | | 1,661 | | |
| | | | | | | | | | |
Total Capital Grants | | | | | | | | 1,661 | | |
| | | | | | | | | | |
TOTAL DEPARTMENT OF PUBLIC WORKS | | | | | | | | 209,806 | | |
| | | | | | | | | | |
268
Public Works, (continued)
| | | | | | | | | | |
Project | | Statistical
Division | | Total
Estimated
Cost
$’000 | | Expenditure
to
30-06-08
$’000 | | Budget
2008-09
$’000 | | Post
2008-09
$’000 |
QBUILD | | | | | | | | | | |
| | | | | |
Property, Plant and Equipment | | | | | | | | | | |
Plant and equipment | | Various | | | | | | 832 | | Ongoing |
| | | | | | | | | | |
Total Property, Plant and Equipment | | | | | | | | 832 | | |
| | | | | | | | | | |
| | | | | |
Other Capital Expenditure | | | | | | | | | | |
Business systems—work in progress | | 05 | | 28,160 | | | | 12,922 | | 15,238 |
| | | | | | | | | | |
Total Other Capital Expenditure | | | | | | | | 12,922 | | |
| | | | | | | | | | |
TOTAL QBUILD | | | | | | | | 13,754 | | |
| | | | | | | | | | |
| | | | | |
QFLEET | | | | | | | | | | |
| | | | | |
Property, Plant and Equipment | | | | | | | | | | |
Motor vehicles | | Various | | | | | | 128,168 | | Ongoing |
Other plant and equipment | | 05 | | | | | | 162 | | Ongoing |
| | | | | | | | | | |
Total Property, Plant and Equipment | | | | | | | | 128,330 | | |
| | | | | | | | | | |
Other Capital Expenditure | | | | | | | | | | |
Information systems | | 05 | | | | | | 1,545 | | Ongoing |
| | | | | | | | | | |
Total Other Capital Expenditure | | | | | | | | 1,545 | | |
| | | | | | | | | | |
TOTAL QFLEET | | | | | | | | 129,875 | | |
| | | | | | | | | | |
| | | | | |
PROJECT SERVICES | | | | | | | | | | |
| | | | | |
Property, Plant and Equipment | | | | | | | | | | |
Plant and equipment | | 05 | | | | | | 1,353 | | Ongoing |
| | | | | | | | | | |
Total Property, Plant and Equipment | | | | | | | | 1,353 | | |
| | | | | | | | | | |
| | | | | |
Other Capital Expenditure | | | | | | | | | | |
Business systems software | | 05 | | | | | | 8,928 | | Ongoing |
| | | | | | | | | | |
Total Other Capital Expenditure | | | | | | | | 8,928 | | |
| | | | | | | | | | |
TOTAL PROJECT SERVICES | | | | | | | | 10,281 | | |
| | | | | | | | | | |
SDS (SALES AND DISTRIBUTION SERVICES) | | | | | | | | | | |
| | | | | |
Property, Plant and Equipment | | | | | | | | | | |
Warehouse equipment | | 05 | | | | | | 124 | | Ongoing |
| | | | | | | | | | |
Total Property, Plant and Equipment | | | | | | | | 124 | | |
| | | | | | | | | | |
TOTAL SDS (SALES AND DISTRIBUTION SERVICES) | | | | | | | | 124 | | |
| | | | | | | | | | |
| | | | | |
CITEC | | | | | | | | | | |
| | | | | |
Property, Plant and Equipment | | | | | | | | | | |
Technology Transformation Program | | 05 | | 23,300 | | | | 21,300 | | 2,000 |
Plant and equipment | | 05 | | | | | | 14,195 | | Ongoing |
| | | | | | | | | | |
Total Property, Plant and Equipment | | | | | | | | 35,495 | | |
| | | | | | | | | | |
269
Public Works, (continued)
| | | | | | | | | | |
Project | | Statistical
Division | | Total
Estimated
Cost
$’000 | | Expenditure
to
30-06-08
$’000 | | Budget
2008-09
$’000 | | Post
2008-09
$’000 |
Other Capital Expenditure | | | | | | | | | | |
Proprietary software and internally developed software and systems | | 05 | | | | | | 10,543 | | Ongoing |
| | | | | | | | | | |
Total Other Capital Expenditure | | | | | | | | 10,543 | | |
| | | | | | | | | | |
TOTAL CITEC | | | | | | | | 46,038 | | |
| | | | | | | | | | |
| | | | | |
SHARED SERVICE AGENCY | | | | | | | | | | |
| | | | | |
Property, Plant and Equipment | | | | | | | | | | |
Asset Replacement | | 05 | | | | | | 939 | | Ongoing |
| | | | | | | | | | |
Total Property, Plant and Equipment | | | | | | | | 939 | | |
| | | | | | | | | | |
TOTAL SHARED SERVICE AGENCY | | | | | | | | 939 | | |
| | | | | | | | | | |
| | | | | |
CORPTECH | | | | | | | | | | |
| | | | | |
Property, Plant and Equipment | | | | | | | | | | |
Asset replacement | | 05 | | | | | | 650 | | Ongoing |
| | | | | | | | | | |
Total Property, Plant and Equipment | | | | | | | | 650 | | |
| | | | | | | | | | |
| | | | | |
Other Capital Expenditure | | | | | | | | | | |
Shared Service Solutions (SSS) program | | 05 | | 249,618 | | 186,772 | | 36,714 | | 26,132 |
Other systems upgrades | | 05 | | 1,200 | | 546 | | 654 | | |
| | | | | | | | | | |
Total Other Capital Expenditure | | | | | | | | 37,368 | | |
| | | | | | | | | | |
TOTAL CORPTECH | | | | | | | | 38,018 | | |
| | | | | | | | | | |
TOTAL PUBLIC WORKS | | | | | | | | 448,835 | | |
| | | | | | | | | | |
270
QUEENSLAND AUDIT OFFICE
Information Standard 40 requires the implementation of an electronic document record management solution to appropriately manage all types of records. Queensland Audit Office will be utilising the Queensland Government approved standard product for electronic file management. The estimated cost to progress this project is $0.18 million. Minor works expenditure of $0.24 million is to maintain and replace current office and IT equipment.
Queensland Audit Office
| | | | | | | | | | |
Project | | Statistical
Division | | Total
Estimated
Cost
$’000 | | Expenditure
to
30-06-08
$’000 | | Budget
2008-09
$’000 | | Post
2008-09
$’000 |
QUEENSLAND AUDIT OFFICE | | | | | | | | | | |
| | | | | |
Property, Plant and Equipment | | | | | | | | | | |
Minor works | | 05 | | | | | | 235 | | Ongoing |
| | | | | | | | | | |
Total Property, Plant and Equipment | | | | | | | | 235 | | |
| | | | | | | | | | |
Other Capital Expenditure | | | | | | | | | | |
Operational Recordkeeping | | 05 | | 180 | | | | 180 | | |
| | | | | | | | | | |
Total Other Capital Expenditure | | | | | | | | 180 | | |
| | | | | | | | | | |
TOTAL QUEENSLAND AUDIT OFFICE | | | | | | | | 415 | | |
| | | | | | | | | | |
TOURISM, REGIONAL DEVELOPMENT AND INDUSTRY
Capital expenditure of the Department of Tourism, Regional Development and Industry in 2008-09 is $138.7 million.
The capital program is designed to provide innovation, direction and leadership to industry.
Program Highlights
| | • | | Construction of the Ecosciences Precinct at Boggo Road and the Health and Food Sciences Precinct at Coopers Plains is scheduled to commence in mid 2008, following completion of preliminary works and the satisfactory negotiation of the construction contract. The future development of the precincts will facilitate the co-location of research activities of the Department of Primary Industries and Fisheries, Department of Natural Resources and Water, Department of Mines and Energy, the Environmental Protection Agency and the Commonwealth Scientific and Industrial Research Organisation (CSIRO). Construction of the Ecosciences Precinct at Boggo Road is expected to be completed in the second half of 2010, while the Health and Food Sciences Precinct at Coopers Plains is expected to be completed in late 2009. |
| | • | | $10 million in capital grants over the two years to 2008-09 will be provided to Griffith University as matching funding towards the construction costs of an expanded facility at the Institute for Glycomics. This amount is in addition to the $8 million provided by the Queensland Government to Griffith University in 2001 to construct the Institute for Glycomics. |
271
Tourism, Regional Development and Industry
| | | | | | | | | | |
Project | | Statistical
Division | | Total
Estimated
Cost
$’000 | | Expenditure
to
30-06-08
$’000 | | Budget
2008-09
$’000 | | Post
2008-09
$’000 |
DEPARTMENT OF TOURISM, REGIONAL DEVELOPMENT AND INDUSTRY | | | | | | | | | | |
| | | | | |
Property, Plant and Equipment | | | | | | | | | | |
Ecosciences Precinct at Boggo Road and the Health and Food Sciences Precinct at Coopers Plains | | 05 | | 290,000 | | 13,358 | | 133,400 | | 143,242 |
Computer equipment | | Various | | | | | | 78 | | Ongoing |
Other acquisitions of property, plant and equipment | | Various | | | | | | 517 | | Ongoing |
| | | | | | | | | | |
Total Property, Plant and Equipment | | | | | | | | 133,995 | | |
| | | | | | | | | | |
Capital Grants | | | | | | | | | | |
Institute of Glycomics | | 07 | | 10,000 | | 6,000 | | 4,000 | | |
Queensland Ethanol Conversion initiative | | Various | | 392 | | 22 | | 370 | | |
Other capital grants | | Various | | 531 | | 189 | | 342 | | |
| | | | | | | | | | |
Total Capital Grants | | | | | | | | 4,712 | | |
| | | | | | | | | | |
TOTAL DEPARTMENT OF TOURISM, REGIONAL DEVELOPMENT AND INDUSTRY | | | | | | | | 138,707 | | |
| | | | | | | | | | |
| | | | | |
TOURISM QUEENSLAND | | | | | | | | | | |
| | | | | |
Other Capital Expenditure | | | | | | | | | | |
Enterprise-wide contact management system and modernisation of the Famil system | | 05 | | 250 | | 168 | | 82 | | |
Financial System upgrade (Finance One—Release 11) | | 05 | | 221 | | 20 | | 201 | | |
| | | | | | | | | | |
Total Other Capital Expenditure | | | | | | | | 283 | | |
| | | | | | | | | | |
TOTAL TOURISM QUEENSLAND | | | | | | | | 283 | | |
| | | | | | | | | | |
TOTAL TOURISM, REGIONAL DEVELOPMENT AND INDUSTRY | | | | | | | | 138,990 | | |
| | | | | | | | | | |
TRANSPORT
Total capital outlays for the Transport portfolio in 2008-09 will be $3.653 billion representing a 47% increase in capital expenditure compared with the 2007-08 Budget. The portfolio consists of Queensland Transport, Queensland Rail and the port authorities.
Queensland Transport
Queensland Transport’s capital expenditure program for 2008-09 totals $670.0 million and predominantly comprises investment in public transport infrastructure and systems.
Program Highlights
South East Queensland Infrastructure Plan and Program (SEQIPP)
In the 2008-09 Budget, the Government continues to progress the implementation of the SEQIPP. Some major projects included in the SEQIPP initiative are:
| | • | | $204.5 million towards construction of the Northern Busway between the Royal Children’s Hospital and Kedron. |
272
| | • | | As part of the Eastern Busway: Buranda to Capalaba program, $123.9 million is allocated for the construction of the Eastern Busway connection between Buranda and Main Avenue at Coorparoo. |
| | • | | $60.3 million towards construction of an Eastern Busway corridor connection from the Eleanor Schonell Bridge to Ipswich Road with stations at Park Road and the Princess Alexandra Hospital. |
| | • | | $50 million towards construction of the Eastern Busway: Princess Alexandra Hospital to Buranda. Construction will include an elevated busway station within the Princess Alexandra Hospital and will be a key link in the regional busway network. |
| | • | | $33.7 million towards the construction of cycle links to enhance the cycle network in South East Queensland. This is made up of $10.3 million towards the construction of stated owned cycle links and $23.4 million in grants to be provided to local authorities. |
| | • | | $13.6 million towards construction and design of projects as part of the TransLink Station Upgrade Program. |
Recreational Boating Infrastructure
| | • | | $7.3 million towards the construction of new recreational boating facilities. These funds will ensure that future infrastructure demands can be met as the recreational boating population continues to grow. |
Regional Airport Development Scheme
| | • | | The Blueprint for the Bush initiative, announced as part of the 2006-07 Budget, included an enhanced commitment to the Regional Airport Development Scheme, with investment of $5 million over three years, including $1.75 million in 2008-09. |
QR Limited
QR is allocating $2.184 billion for capital outlays in 2008-09 in Queensland.
| | • | | $697.6 million to upgrade infrastructure and rollingstock on the Citytrain network as part of the SEQIPP initiative including: |
| | • | | Springfield Line $130.0 million, |
| | • | | Robina to Varsity Lakes $127.0 million, |
| | • | | Caboolture to Beerburrum, Helensvale to Robina and Salisbury to Kuraby duplications $97 million, |
| | • | | Corinda to Darra: Third Track $78.1 million, |
| | • | | Metropolitan Freight Capacity Enhancement $44.2 million, |
| | • | | Additional rollingstock (44 x 3 car units) to deliver substantial service enhancements between the Gold Coast, Brisbane and the Sunshine Coast $132.2 million. |
| | • | | $576.4 million for coal network track works in Central Queensland to allow for additional haulage of coal: |
| | • | | Jilalan Yard Upgrade $400 million, |
| | • | | Stanwell to Wycarbah Duplication $45.2 million, |
| | • | | Callemondah 3rd Spur $14.3 million, |
| | • | | Broadlea—Mallawa—Wotonga Duplication $32.5 million, |
| | • | | Bolingbroke Feeder Station $22.1 million, |
| | • | | Goonyella—Abbot Point Expansion (Northern Missing Link) Initial Infrastructure Works $14.4 million, |
273
| | • | | Dalrymple Bay Coal Terminal: 3rd Loop $11.7 million, |
| | • | | Harrow Passing Loop (Peak Downs—Saraji Passing Loop) $8.1 million, |
| | • | | Coppabella Yard Upgrade $7.3 million, |
| | • | | Westwood to Wycarbah Duplication $6.2 million. |
| | • | | $303.7 million towards new and upgraded locomotives and wagons to support the increased haulage of coal in Central Queensland including: |
| | • | | Coal Electric Loco Fleet Upgrade—Stages 1 & 2 $43.9 million, |
| | • | | Electric Loco Upgrade Program $32.0 million, |
| | • | | 510 VCA Coal Wagons $14.8 million, |
| | • | | 15 New Diesel Locomotives (4100 Class) $68.0 million, |
| | • | | 1,190 New Coal Wagons (VCA 106T) $130.6 million. |
| | • | | $ 37.3 million to modify and improve QR facilities and infrastructure for rail travel for disabled persons as prescribed by the Disability Discrimination Act 1992 and to modify the Electric Multiple Unit fleet to meet disability standards for Accessible Public Transport 2007 compliance requirements. |
| | • | | $14.1 million to complete the enhancement of Brunswick Street Station. |
Port of Brisbane Corporation Limited
In 2008-09, Port of Brisbane Corporation Limited has allocated $218.9 million for the continuing development of the port. This allocation is driven predominately by the Hamilton Site Redevelopment Program and construction of additional berths at Fisherman Islands, in order to accommodate the strong growth across a range of commodity areas including:
| | • | | $29.4 million for relocation of remaining trades from Hamilton to Fisherman Islands. |
| | • | | $23.5 million for the construction of berth and wharf 11 and 12 at Fisherman Islands to accommodate increasing trade throughput at the Port of Brisbane. |
| | • | | $16.5 million for the continuation of the Hamilton Site Redevelopment Program. |
| | • | | $6 million to construct a bridge across the Burnett River to ensure all weather access to the Port of Bundaberg. |
| | • | | $3 million for the upgrade of the Barge Wharf for the dredger “Brisbane”, which is owned by the corporation. |
Cairns Ports
In 2008-09, Cairns Ports has allocated $113.6 million towards new and continuing airport and seaport development including:
| | • | | $67.1 million for the redevelopment of the Domestic Terminal Building at Cairns Airport. |
| | • | | Provision of a new facility for the Australian Quarantine Inspection Service operation in the Cairns area being constructed at the Cairns Airport at a cost of $6.4 million and $4.5 million is to be spent in 2008-09. |
| | • | | $2.4 million for a plaza development and landscaping for the domestic terminal in 2008-09. |
| | • | | $1.5 million for extension of the boardwalk and foreshore promenade to the south in the Cityport area of Cairns. |
| | • | | $2.9 million for ongoing preparation and release of sites in the business park at the Cairns Airport as demand dictates. |
274
Gladstone Ports Corporation
In 2008-09, Gladstone Ports Corporation has allocated $55.7 million towards the ongoing expansion of the ports at Gladstone and Rockhampton including:
| | • | | $18.3 million towards ongoing works at the RG Tanna Coal Terminal at the Port of Gladstone. |
| | • | | $5.0 million for the continuation of detailed engineering and feasibility investigations at the Wiggins Island Coal Terminal. |
| | • | | $4.3 million for dust suppression measures at the R G Tanna. |
| | • | | $8.7 million for the Port General Projects relating to general work around the Port of Gladstone, including road rebuilding, land reclamation and mobile plant replacements. |
| | • | | $1.8 million is allocated for the Port of Rockhampton at Port Alma primarily for minor plant and equipment. |
| | • | | $0.6 million is allocated primarily for bunding and reclamation at Fisherman’s Landing South, and other minor plant and equipment. |
Mackay Ports
In 2008-09, Mackay Ports has allocated $23.1 million for the development and continued upgrading of port and airport infrastructure including:
| | • | | $4.7 million for building a storage and distribution facility for the importation of fertiliser, which is expected to be 60 tonnes per annum. |
| | • | | $3 million for rehabilitation of the runway, taxiways, and aprons at the Mackay Airport. |
| | • | | $1.2 million for design and construction of additional car park for long term overflow at the Mackay Airport. |
Ports Corporation of Queensland Limited
In 2008-09, Ports Corporation of Queensland has allocated $367.2 million for various port development projects including:
| | • | | $250 million for the Abbot Point X50 Expansion, which will increase the capacity of the Abbot Point Terminal to 50 million tonnes per annum. |
| | • | | $70 million for the Abbot Point Expansion X25, which will increase capacity to 25 million tonnes per annum and contribute to increasing the efficiency and capacity of Queensland’s coal export industry. |
| | • | | $35 million for the renewal of stacker reclaimer 1 and 2 at Abbot Point Coal Terminal. |
| | • | | $2.8 million for minor asset replacement and acquisitions at Thursday Island Port. |
| | • | | $1.5 million for land acquisition at Louisa Creek. |
Port of Townsville
Port of Townsville has allocated $19.8 million for the acquisition of infrastructure and port improvements during the 2008-09 financial year including:
| | • | | $4.7 million for Berth 1 Services Jetty Duplication for additional access and pipe racks, as well as for maintenance access for the existing pipeline. |
275
| | • | | $3.1 million for the eastern reclamation area for the creation of lots, services and drainage—planning and detailed design works for the subdivision of the reclamation area into 19 lots and construction of the transport network, service corridor and open storm water drain. |
| | • | | $5.3 million for preliminary engineering works, planning, investigation and design associated with general port infrastructure and facilities. |
Transport
| | | | | | | | | | |
Project | | Statistical
Division | | Total
Estimated
Cost
$’000 | | Expenditure
to
30-06-08
$’000 | | Budget
2008-09
$’000 | | Post
2008-09
$’000 |
QUEENSLAND TRANSPORT | | | | | | | | | | |
| | | | | |
Property, Plant and Equipment | | | | | | | | | | |
Public Transport Infrastructure | | | | | | | | | | |
Gold Coast Rapid Transit System (Parkwood to Broadbeach)1 | | 07 | | 84,062 | | 33,296 | | 50,766 | | |
TransLink Station Upgrade Program | | Various | | 248,251 | | 21,704 | | 13,646 | | 212,901 |
Robina to Tallebudgera Rail Extension TOD | | 07 | | 23,733 | | 1,553 | | 20,948 | | 1,232 |
South East Queensland High Occupancy Vehicle Program | | Various | | 3,275 | | | | 1,590 | | 1,685 |
Transport Corridor Acquisitions—SEQ | | Various | | | | | | 14,548 | | Ongoing |
South East Queensland Cycle Network | | 05 | | | | | | 10,329 | | Ongoing |
| | | | | | | | | | |
Sub-total Public Transport Infrastructure | | | | | | | | 111,827 | | |
| | | | | | | | | | |
Busways | | | | | | | | | | |
Northern Busway: Section 1-4 & 52 | | 05 | | 777,000 | | 114,306 | | 204,520 | | 458,174 |
Eastern Busway: Buranda to Coorparoo (Stage 2A) | | 05 | | 465,794 | | 67,397 | | 123,891 | | 274,506 |
Eastern Busway: Eleanor Schonell Bridge to Princess Alexandra Hospital | | 05 | | 218,508 | | 158,188 | | 60,320 | | |
Eastern Busway: Princess Alexandra Hospital to Buranda | | 05 | | 137,800 | | 50,000 | | 50,000 | | 37,800 |
| | | | | | | | | | |
Sub-total Busways | | | | | | | | 438,731 | | |
| | | | | | | | | | |
Maritime Infrastructure | | | | | | | | | | |
Living the Queensland Lifestyle Boating Infrastructure Projects | | Various | | 9,654 | | 2,600 | | 5,172 | | 1,882 |
Townsville & REEFVTS project | | 45 | | 3,500 | | 90 | | 1,375 | | 2,035 |
Automatic Identification System (AIS) | | Various | | 750 | | 370 | | 130 | | 250 |
Amity Point Boat Ramp | | 05 | | 650 | | | | 650 | | |
Port Alma Leads | | 30 | | 586 | | 336 | | 250 | | |
Townsville VHF Communications Upgrade | | Various | | 500 | | | | 200 | | 300 |
Gold Coast Dredging | | 07 | | 500 | | | | 500 | | |
Caniapa Passage Dredging | | 05 | | 500 | | | | 500 | | |
Sandy Hook (Burnett River) Boat Ramp | | 15 | | 380 | | | | 380 | | |
Marine Safety Minor Works | | Various | | | | | | 1,108 | | Ongoing |
Boating Infrastructure Minor Works | | Various | | | | | | 1,077 | | Ongoing |
| | | | | | | | | | |
Sub-total Maritime Infrastructure | | | | | | | | 11,342 | | |
| | | | | | | | | | |
276
Transport, (continued)
| | | | | | | | | | |
Project | | Statistical
Division | | Total
Estimated
Cost
$’000 | | Expenditure
to
30-06-08
$’000 | | Budget
2008-09
$’000 | | Post
2008-09
$’000 |
Other Property, Plant and Equipment | | | | | | | | | | |
Integrated Scheduling TransLink Transit Authority | | 05 | | 2,913 | | | | 2,913 | | |
Transport House Refurbishment | | 05 | | 1,900 | | | | 1,900 | | |
Infrastructure Replacement Upgrades | | 05 | | | | | | 6,823 | | Ongoing |
CBD Refurbishment | | Various | | | | | | 1,050 | | Ongoing |
Departmental Plant and Equipment | | Various | | | | | | 937 | | Ongoing |
Corporate Property Minor Works | | Various | | | | | | 790 | | Ongoing |
| | | | | | | | | | |
Sub-total Other Property, Plant and Equipment | | | | | | | | 14,413 | | |
| | | | | | | | | | |
Total Property, Plant and Equipment | | | | | | | | 576,313 | | |
| | | | | | | | | | |
Other Capital Expenditure | | | | | | | | | | |
New Queensland Driver Licence (Stage 1 Implementation) | | 05 | | 84,085 | | 24,519 | | 36,999 | | 22,567 |
METIS | | 05 | | 3,130 | | 895 | | 1,300 | | 935 |
| | | | | | | | | | |
Total Other Capital Expenditure | | | | | | | | 38,299 | | |
| | | | | | | | | | |
Capital Grants | | | | | | | | | | |
SchoolBUS—Steep Roads Program | | Various | | 12,000 | | 8,300 | | 3,700 | | |
Security Cameras in Taxis | | Various | | 8,543 | | 8,243 | | 300 | | |
Accessible Taxis | | Various | | 4,000 | | 2,800 | | 1,200 | | |
Cairns Bus Priority Project | | 50 | | 885 | | 400 | | 485 | | |
South East Queensland Cycle Network | | Various | | | | | | 23,431 | | Ongoing |
SchoolBUS Upgrade Scheme | | Various | | | | | | 11,300 | | Ongoing |
Public Transport Infrastructure—Compliance with Disability Standards | | Various | | | | | | 4,835 | | Ongoing |
Rural and Remote Airstrips | | Various | | | | | | 3,460 | | Ongoing |
Accessible Buses | | Various | | | | | | 3,000 | | Ongoing |
Network Plan—Public Transport Infrastructure | | Various | | | | | | 3,000 | | Ongoing |
Public Transport Infrastructure | | Various | | | | | | 250 | | Ongoing |
Safe School Travel | | Various | | | | | | 200 | | Ongoing |
Safe Walking and Pedalling | | Various | | | | | | 200 | | Ongoing |
| | | | | | | | | | |
Total Capital Grants | | | | | | | | 55,361 | | |
| | | | | | | | | | |
TOTAL QUEENSLAND TRANSPORT | | | | | | | | 669,973 | | |
| | | | | | | | | | |
QR LIMITED | | | | | | | | | | |
| | | | | |
Property, Plant and Equipment | | | | | | | | | | |
QR Network | | | | | | | | | | |
Citytrain MetTRIP Track Infrastructure Upgrades—Stages 1 and 2 | | Various | | 673,418 | | 519,814 | | 96,996 | | 56,608 |
Jilalan Yard Upgrade | | 40 | | 500,000 | | 79,631 | | 400,000 | | 20,369 |
Springfield Line | | 05 | | 390,280 | | 52,720 | | 130,000 | | 207,560 |
Robina to Varsity Lakes | | 07 | | 300,131 | | 101,109 | | 127,000 | | 72,022 |
Corinda to Darra: Third Track | | 05 | | 187,200 | | 52,568 | | 78,146 | | 56,486 |
Northern Minerals Province: Driver Activated Points Stage 1 | | 55 | | 107,000 | | | | 10,000 | | 97,000 |
277
Transport, (continued)
| | | | | | | | | | |
Project | | Statistical
Division | | Total
Estimated
Cost
$’000 | | Expenditure
to
30-06-08
$’000 | | Budget
2008-09
$’000 | | Post
2008-09
$’000 |
Dalrymple Bay Coal Terminal: 3rd Loop | | 40 | | 106,544 | | 91,184 | | 11,660 | | 3,700 |
Metropolitan Freight Capacity Enhancements | | 05 | | 84,260 | | 27,555 | | 44,238 | | 12,467 |
Broadlea—Mallawa—Wotonga Duplication | | 40 | | 74,000 | | 34,778 | | 32,500 | | 6,722 |
Landsborough to Nambour (Planning and Acquisitions) | | 09 | | 78,354 | | 3,200 | | 58,300 | | 16,854 |
Stanwell to Wycarbah Duplication | | 30 | | 71,500 | | 19,224 | | 45,242 | | 7,034 |
Beerwah Rail Crossing Project | | 09 | | 67,600 | | 16,000 | | 23,100 | | 28,500 |
Timber Bridge Replacement Stage 3 | | Various | | 62,995 | | 27,249 | | 25,958 | | 9,788 |
Mount Isa Line: Concrete Relay, Re-rail & Associated Works | | 55 | | 61,343 | | 59,343 | | 2,000 | | |
Goonyella—Abbot Point Expansion (Northern Missing Link) | | 40 | | 46,120 | | 31,726 | | 14,394 | | |
Callemondah 3rd Spur | | 30 | | 40,506 | | 26,225 | | 14,281 | | |
Minimum Maintenance Track—Metro | | 05 | | 39,402 | | 20,839 | | 18,563 | | |
Citytrain Station Conduit Upgrade Various Projects | | 05 | | 35,500 | | 12,119 | | 5,100 | | 18,281 |
Westwood to Wycarbah Duplication | | 30 | | 32,000 | | 25,771 | | 6,229 | | |
ATP TBS Migration Project | | Various | | 29,950 | | 6,759 | | 8,023 | | 15,168 |
Bolingbroke Feeder Station | | 40 | | 29,900 | | 7,787 | | 22,113 | | |
Coppabella Yard Upgrade | | 40 | | 29,000 | | 21,692 | | 7,308 | | |
Turnout & Crossover Refurbishment | | 05 | | 28,500 | | 2,899 | | 4,540 | | 21,061 |
Regional Re-railing Strategy | | Various | | 27,960 | | 16,761 | | 2,481 | | 8,718 |
Electrification Infrastructure Renewal Strategy | | 05 | | 25,050 | | 3,711 | | 4,200 | | 17,139 |
Moura Line Passing Loops | | 30 | | 22,947 | | 22,312 | | 635 | | |
Wiggins Island (Gladstone) Balloon Loop | | 30 | | 22,000 | | 5,605 | | 2,500 | | 13,895 |
Noise Amelioration—Metro | | 05 | | 20,643 | | 20,243 | | 400 | | |
Central Qld Coal Formation Strengthening (Stage 2) | | Various | | 20,538 | | 4,443 | | 4,220 | | 11,875 |
Telecommunications Infrastructure Renewal—Metro | | 05 | | 18,730 | | 4,000 | | 4,150 | | 10,580 |
Electrification Capacity Upgrade Strategy | | 05 | | 18,410 | | 3,428 | | 4,036 | | 10,946 |
St Lawrence River Bridge Replacement | | 40 | | 17,548 | | 723 | | 16,825 | | |
Mindi Electrical Substation | | 40 | | 17,100 | | 12,984 | | 4,116 | | |
Harrow Passing Loop (Peak Downs—Saraji Passing Loop) | | 40 | | 15,900 | | 7,833 | | 8,067 | | |
Beerburrum to Landsborough (planning and design) | | 09 | | 15,000 | | 12,334 | | 2,666 | | |
Sonoma Balloon Loop | | 40 | | 14,500 | | 12,168 | | 2,332 | | |
Noise Amelioration: Statewide Strategy | | 05 | | 12,317 | | 3,127 | | 8,000 | | 1,190 |
UTC Disaster Recovery | | Various | | 12,000 | | 3,630 | | 2,500 | | 5,870 |
Goonyella System: Rail Upgrade | | 40 | | 11,450 | | 10,609 | | 841 | | |
Telecommunications Backbone Network Strategy | | Various | | 11,210 | | 3,487 | | 2,794 | | 4,929 |
Corridor Integrity Strategy | | Various | | 11,055 | | 5,047 | | 2,100 | | 3,908 |
Corridor Land Requirements | | 05 | | 10,810 | | 2,114 | | 2,000 | | 6,696 |
VPI-type Processors Replacement (Farleigh to Purono) | | Various | | 10,729 | | 59 | | 3,231 | | 7,439 |
278
Transport, (continued)
| | | | | | | | | | |
Project | | Statistical
Division | | Total
Estimated
Cost
$’000 | | Expenditure
to
30-06-08
$’000 | | Budget
2008-09
$’000 | | Post
2008-09
$’000 |
North Coast Line Re-railing (Nambour to Parana) | | 15 | | 10,700 | | 4,956 | | 1,770 | | 3,974 |
Kuraby to Kingston (Planning and Design) | | 05 | | 4,000 | | 1,350 | | 2,650 | | |
Varsity Lakes to Tallebudgera (Planning) | | 07 | | 6,000 | | 3,654 | | 2,346 | | |
QR Network—General | | Various | | | | | | 122,731 | | Ongoing |
| | | | | | | | | | |
Sub-total QR Network | | | | | | | | 1,393,282 | | |
| | | | | | | | | | |
QR Freight Coal | | | | | | | | | | |
Coal Electric Loco Fleet Upgrade—Stages 1 & 2 | | 45 | | 181,051 | | 86,149 | | 43,919 | | 50,983 |
1,190 New Coal Wagons (VCA 106T) | | 05 | | 159,281 | | 7,544 | | 130,578 | | 21,159 |
Electric Loco Upgrade Program | | 30 | | 141,000 | | 84,877 | | 32,000 | | 24,123 |
15 x 4000 Class Locomotives | | 15 | | 93,062 | | 87,062 | | 5,000 | | 1,000 |
15 New Diesel Locomotives (4100 Class) | | 15 | | 87,395 | | 1,547 | | 68,000 | | 17,848 |
12 & 16 Cylinder Loco Overhauls—Coal | | 05 | | 52,479 | | 17,440 | | 5,100 | | 29,939 |
510 VCA Coal Wagons | | 05 | | 25,509 | | 10,672 | | 14,837 | | |
VNQ Coal Wagon Overhauls | | 30 | | 21,188 | | 16,972 | | 4,216 | | |
| | | | | | | | | | |
Sub-total QR Freight Coal | | | | | | | | 303,650 | | |
| | | | | | | | | | |
QR Freight Bulk Freight | | | | | | | | | | |
12 & 16 Cylinder Loco Overhauls—Bulk Freight | | 05 | | 10,540 | | 3,475 | | 2,751 | | 4,314 |
QR Freight Regional Freight | | | | | | | | | | |
12 & 16 Cylinder Loco Overhauls—Regional Freight | | 05 | | 22,457 | | 14,872 | | 5,317 | | 2,268 |
QR Freight | | | | | | | | | | |
QR Freight—General | | Various | | | | | | 118,036 | | Ongoing |
Passenger Services | | | | | | | | | | |
Future Citytrain Rollingstock | | Various | | 923,100 | | | | 2,100 | | 921,000 |
Additional Citytrain Rollingstock | | 15 | | 296,837 | | 39,301 | | 117,804 | | 139,732 |
MetTRIP—Additional Citytrain Rollingstock | | 15 | | 289,456 | | 257,922 | | 14,371 | | 17,163 |
Citytrain Disability Standards 2007 Compliance: Infrastructure | | 05 | | 82,879 | | 32,100 | | 29,707 | | 21,072 |
Citytrain EMU Re-engineering & Overhaul | | 05 | | 80,700 | | 65,094 | | 7,500 | | 8,106 |
Citytrain Disability Standards 2007 Compliance: Rollingstock | | 05 | | 48,594 | | 3,530 | | 7,440 | | 37,624 |
Citytrain Disabled Access Compliance | | 05 | | 43,500 | | 43,323 | | 177 | | |
Citytrain Safe Stations | | 05 | | 39,454 | | 39,058 | | 198 | | 198 |
Brunswick Street Upgrade | | 05 | | 32,800 | | 18,704 | | 14,096 | | |
Partially Completed EMU Overhauls | | 05 | | 30,364 | | 24,695 | | 5,669 | | |
MetTRIP—Citytrain Intermodal Works | | 05 | | 26,794 | | 23,609 | | 3,185 | | |
SMU200 Major Overhauls | | 05 | | 19,200 | | 4,500 | | 11,000 | | 3,700 |
Citytrain Station Upgrade Program | | 05 | | 12,000 | | | | 12,000 | | |
Albion Station Land Bridge | | 05 | | 11,000 | | | | 11,000 | | |
MetTRIP—Citytrain Station Upgrades | | 05 | | 10,712 | | 7,868 | | 2,844 | | |
Passenger Services—General | | 05 | | | | | | 30,540 | | Ongoing |
| | | | | | | | | | |
Sub-total Passenger Services | | | | | | | | 269,631 | | |
| | | | | | | | | | |
279
Transport, (continued)
| | | | | | | | | | |
Project | | Statistical
Division | | Total
Estimated
Cost
$’000 | | Expenditure
to
30-06-08
$’000 | | Budget
2008-09
$’000 | | Post
2008-09
$’000 |
Across QR | | | | | | | | | | |
Major Property Disposals | | Various | | 19,261 | | 11,064 | | 6,936 | | 1,261 |
Rail Welding Facility | | 05 | | 12,554 | | 5,683 | | 6,871 | | |
Motor Vehicle Acquisitions | | 05 | | | | | | 35,020 | | Ongoing |
Across QR—General | | 05 | | | | | | 42,856 | | Ongoing |
| | | | | | | | | | |
Sub-total Across QR | | | | | | | | 91,683 | | |
| | | | | | | | | | |
| | | | | |
Total Property, Plant and Equipment | | | | | | | | 2,184,350 | | |
| | | | | | | | | | |
| | | | | |
TOTAL QR LIMITED | | | | | | | | 2,184,350 | | |
| | | | | | | | | | |
| | | | | |
PORT OF BRISBANE CORPORATION LIMITED | | | | | | | | | | |
| | | | | |
Property, Plant and Equipment | | | | | | | | | | |
Wharf & Berth 11 and 12 | | 05 | | 342,500 | | | | 23,500 | | 319,000 |
Ground Improvement—T11, T12 and T13 | | 05 | | 194,040 | | | | 29,290 | | 164,750 |
Hamilton Site Redevelopment | | 05 | | 65,300 | | 21,700 | | 16,500 | | 27,100 |
General Purpose Berth | | 05 | | 57,400 | | 28,000 | | 29,400 | | |
Environmental Protection Agency Office—Manly | | 05 | | 4,500 | | 1,500 | | 3,000 | | |
Lay-up Berth | | 05 | | 3,850 | | 850 | | 3,000 | | |
Subdivisional Roadworks—Fisherman Islands Business Park | | 05 | | 3,500 | | 1,500 | | 2,000
3,000 | | |
Port Drive—Truck Parking & Associated Works | | 05 | | 3,000 | | | | | | |
Upgrades of Major Roads | | 05 | | | | | | 12,000 | | Ongoing |
Colmslie Estate | | 05 | | | | | | 10,500 | | Ongoing |
Lessee Terminals or Wharves | | 05 | | | | | | 9,500 | | Ongoing |
Portgate Property Developments | | 05 | | | | | | 9,000 | | Ongoing |
Eagle Farm Estate | | 05 | | | | | | 7,500 | | Ongoing |
Port Central | | 05 | | | | | | 6,000 | | Ongoing |
Port West—Lessee Developments | | 05 | | | | | | 6,000 | | Ongoing |
Port West—Filling | | 05 | | | | | | 5,000 | | Ongoing |
Port West—Infrastructure | | 05 | | | | | | 5,000 | | Ongoing |
Warehouses & Container Facilities | | 05 | | | | | | 3,750 | | Ongoing |
Ground Improvement Bishop Drive Estate (S2 & S3) | | 05 | | | | | | 2,000 | | Ongoing |
Electrical & Communication Upgrades | | 05 | | | | | | 1,000 | | Ongoing |
Building & Landscaping Upgrades | | 05 | | | | | | 200 | | Ongoing |
Minor Plant & Equipment | | 05 | | | | | | 25,750 | | Ongoing |
Port of Bundaberg Burnett Bridge | | 15 | | 6,000 | | | | 6,000 | | |
| | | | | | | | | | |
| | | | | |
Total Property, Plant and Equipment | | | | | | | | 218,890 | | |
| | | | | | | | | | |
| | | | | |
TOTAL PORT OF BRISBANE CORPORATION LIMITED | | | | | | | | 218,890 | | |
| | | | | | | | | | |
280
Transport, (continued)
| | | | | | | | | | |
Project | | Statistical
Division | | Total
Estimated
Cost
$’000 | | Expenditure
to
30-06-08
$’000 | | Budget
2008-09
$’000 | | Post
2008-09
$’000 |
CAIRNS PORTS | | | | | | | | | | |
| | | | | |
Property, Plant and Equipment | | | | | | | | | | |
Cairns Airport | | | | | | | | | | |
Domestic Terminal Redevelopment | | 50 | | 192,800 | | 79,262 | | 67,109 | | 46,429 |
Upgrade Domestic Apron Bays 18-23 | | 50 | | 7,276 | | 3,316 | | 3,060 | | 900 |
Australian Quarantine Inspection Service (AQIS) Office Building | | 50 | | 6,350 | | 1,888 | | 4,462 | | |
Precinct Beautification - Landscaping | | 50 | | 4,023 | | | | 2,362 | | 1,661 |
Domestic Short Term Part Covered Parking | | 50 | | 3,778 | | 50 | | 3,728 | | |
Other Airport Projects | | 50 | | | | | | 22,243 | | Ongoing |
Business Park Development | | 50 | | | | | | 2,921 | | Ongoing |
| | | | | | | | | | |
Sub-total Cairns Airport | | | | | | | | 105,885 | | |
| | | | | | | | | | |
Cairns Seaport | | | | | | | | | | |
Tingira St Subdivision Development | | 50 | | | | | | 2,557 | | Ongoing |
Other Seaport Projects | | 50 | | | | | | 2,012 | | Ongoing |
| | | | | | | | | | |
Sub-total Cairns Seaport | | | | | | | | 4,569 | | |
| | | | | | | | | | |
Cairns Cityport | | | | | | | | | | |
Foreshore Development | | 50 | | | | | | 1,500 | | Ongoing |
Cityport Commercial Allowance | | 50 | | | | | | 960 | | Ongoing |
| | | | | | | | | | |
Sub-total Cairns Cityport | | | | | | | | 2,460 | | |
| | | | | | | | | | |
Corporate Minor Plant and Equipment | | 50 | | | | | | 677 | | Ongoing |
| | | | | | | | | | |
Total Property, Plant and Equipment | | | | | | | | 113,591 | | |
| | | | | | | | | | |
TOTAL CAIRNS PORTS | | | | | | | | 113,591 | | |
| | | | | | | | | | |
| | | | | |
GLADSTONE PORTS CORPORATION | | | | | | | | | | |
| | | | | |
Property, Plant and Equipment | | | | | | | | | | |
RG Tanna Coal Terminal | | | | | | | | | | |
RG Tanna Coal Terminal Expansion | | 30 | | 780,000 | | 772,112 | | 7,888 | | |
RG Tanna Coal Terminal Ongoing Projects | | 30 | | 109,992 | | 23,255 | | 18,309 | | 68,428 |
RG Tanna Coal Terminal Dust Suppression Initiatives | | 30 | | 7,846 | | 1,677 | | 4,269 | | 1,900 |
| | | | | | | | | | |
Sub-total RG Tanna Coal Terminal | | | | | | | | 30,466 | | |
| | | | | | | | | | |
Wiggins Island Coal Terminal Feasibility Study | | 30 | | 30,000 | | 25,000 | | 5,000 | | |
Port General Projects | | 30 | | 23,900 | | 3,070 | | 8,730 | | 12,100 |
Fisherman’s Landing Projects | | 30 | | 12,565 | | 4,045 | | 625 | | 7,895 |
Barney Point Projects | | 30 | | 9,830 | | 6,150 | | 450 | | 3,230 |
Auckland Point Projects | | 30 | | 5,705 | | 2,355 | | 1,050 | | 2,300 |
Marina Works Projects | | 30 | | 2,850 | | 1,800 | | 50 | | 1,000 |
Port Alma Shipping Terminal Projects | | 30 | | 2,300 | | 90 | | 1,840 | | 370 |
Minor Plant and Equipment Projects | | 30 | | | | | | 7,538 | | Ongoing |
| | | | | | | | | | |
Total Property, Plant and Equipment | | | | | | | | 55,749 | | |
| | | | | | | | | | |
TOTAL GLADSTONE PORTS CORPORATION | | | | | | | | 55,749 | | |
| | | | | | | | | | |
281
Transport, (continued)
| | | | | | | | | | |
Project | | Statistical
Division | | Total
Estimated
Cost
$’000 | | Expenditure
to
30-06-08
$’000 | | Budget
2008-09
$’000 | | Post
2008-09
$’000 |
MACKAY PORTS | | | | | | | | | | |
| | | | | |
Property, Plant and Equipment | | | | | | | | | | |
Mackay Seaport | | | | | | | | | | |
Hi Fert Pty Ltd Facility Development | | 40 | | 5,800 | | 1,139 | | 4,661 | | |
Other Seaport Projects | | 40 | | | | | | 3,353 | | Ongoing |
| | | | | | | | | | |
Sub-total Mackay Seaport | | | | | | | | 8,014 | | |
| | | | | | | | | | |
| | | | | |
Mackay Airport | | | | | | | | | | |
Runway/Taxiway/Apron Rehabilitation & Improvements | | 40 | | 7,120 | | | | 3,000 | | 4,120 |
Western General Aviation Airside Apron | | 40 | | 2,400 | | 1,979 | | 421 | | |
Shed for Checked Bag Screening | | 40 | | 2,301 | | 1 | | 2,300 | | |
Baggage Handling System | | 40 | | 2,250 | | 1,000 | | 1,250 | | |
Long Term Overflow Carpark | | 40 | | 1,200 | | | | 1,200 | | |
Other Airport Projects | | 40 | | | | | | 5,808 | | Ongoing |
| | | | | | | | | | |
Sub-total Mackay Airport | | | | | | | | 13,979 | | |
| | | | | | | | | | |
Corporate Minor Plant and Equipment | | | | | | | | | | |
Corporate Minor Plant and Equipment | | 40 | | 1,197 | | 47 | | 1,150 | | |
| | | | | | | | | | |
| | | | | |
Total Property, Plant and Equipment | | | | | | | | 23,143 | | |
| | | | | | | | | | |
| | | | | |
TOTAL MACKAY PORTS | | | | | | | | 23,143 | | |
| | | | | | | | | | |
PORTS CORPORATION OF QUEENSLAND LIMITED | | | | | | | | | | |
| | | | | |
Property, Plant and Equipment | | | | | | | | | | |
Abbot Point Expansion X50 | | 40 | | 818,000 | | 15,000 | | 250,000 | | 553,000 |
Abbot Point Expansion X21 | | 40 | | 116,000 | | 96,000 | | 2,000 | | 18,000 |
Abbot Point Expansion X25 | | 40 | | 95,000 | | 15,000 | | 70,000 | | 10,000 |
Abbot Point Expansion Refurbishment SR1 and SR2 | | 40 | | 68,300 | | 2,550 | | 35,000 | | 30,750 |
Louisa Creek Land Acquisitions | | 40 | | 10,000 | | 6,359 | | 1,500 | | 2,141 |
Head Office Miscellaneous Plant and Equipment | | 05 | | | | | | 209 | | Ongoing |
Port Development | | | | | | | | | | |
Abbot Point Port Development | | 40 | | | | | | 4,368 | | Ongoing |
Thurs Island Port Development | | 50 | | | | | | 2,796 | | Ongoing |
Hay Point Port Development | | 40 | | | | | | 1,218 | | Ongoing |
Karumba Port Development | | 55 | | | | | | 46 | | Ongoing |
Weipa Port Development | | 50 | | | | | | 44 | | Ongoing |
Lucinda Port Development | | 45 | | | | | | 5 | | Ongoing |
Mourilyan Port Development | | 50 | | | | | | 5 | | Ongoing |
| | | | | | | | | | |
| | | | | |
Total Property, Plant and Equipment | | | | | | | | 367,191 | | |
| | | | | | | | | | |
| | | | | |
TOTAL PORTS CORPORATION OF QUEENSLAND LIMITED | | | | | | | | 367,191 | | |
| | | | | | | | | | |
282
Transport, (continued)
| | | | | | | | | | |
Project | | Statistical
Division | | Total
Estimated
Cost
$’000 | | Expenditure
to
30-06-08
$’000 | | Budget
2008-09
$’000 | | Post
2008-09
$’000 |
PORT OF TOWNSVILLE | | | | | | | | | | |
| | | | | |
Property, Plant and Equipment | | | | | | | | | | |
Port Infrastructure and Facilities | | 45 | | 8,915 | | 2,220 | | 5,345 | | 1,350 |
Berth 1 Services Jetty Duplication | | 45 | | 4,900 | | 200 | | 4,700 | | |
Eastern Reclamation Area Creation of Lots, Services and Drainage—Design Works | | 45 | | 3,470 | | 340 | | 3,130 | | |
Berth 10 Redevelopment—Planning | | 45 | | 2,700 | | 1,200 | | 1,500 | | |
and Design | | | | | | | | | | |
Saltwater Fire System Review and Upgrade | | 45 | | 2,700 | | | | 2,700 | | |
Port of Townsville Quarry Planning and Approvals | | 45 | | 653 | | 313 | | 340 | | |
Minor Plant and Equipment | | 45 | | | | | | 2,108 | | Ongoing |
| | | | | | | | | | |
| | | | | |
Total Property, Plant and Equipment | | | | | | | | 19,823 | | |
| | | | | | | | | | |
| | | | | |
TOTAL PORT OF TOWNSVILLE | | | | | | | | 19,823 | | |
| | | | | | | | | | |
| | | | | |
TOTAL TRANSPORT | | | | | | | | 3,652,710 | | |
| | | | | | | | | | |
Notes:
| 1. | Planning and preliminary design. |
| 2. | The 2008-09 Budget excludes the revised expenditure announced for the Northern Busway (Sections 2-4 and 5, Windsor-Kedron) on 19 May 2008, due to the timing of contractual close. |
283
TREASURY
The total capital expenditure program for Queensland Treasury in 2008-09 will be $32.3 million.
The principal components of Treasury’s capital program include:
| | • | | $24 million for the further implementation and development of the Revenue Management System within the Office of State Revenue. The system employs contemporary technology to provide revenue and information management and e-business capability to better service the Government and people of Queensland in collecting and administering State tax revenue streams. |
| | • | | $1.2 million provided for scientific equipment for the Racing Science Centre. |
| | • | | $4.9 million to be allocated to ongoing asset replacement, primarily the replacement of existing IT assets. |
| | • | | $1.9 million to be allocated to the Queensland Office of Gaming Regulation (QOGR). This includes the Data Requirements 3 project which involves development of a new standard that meets the electronic data exchange needs of QOGR and its external clients. |
Treasury
| | | | | | | | | | |
Project | | Statistical
Division | | Total
Estimated
Cost
$’000 | | Expenditure
to
30-06-08
$’000 | | Budget
2008-09
$’000 | | Post
2008-09
$’000 |
QUEENSLAND TREASURY | | | | | | | | | | |
| | | | | |
Property, Plant and Equipment | | | | | | | | | | |
Asset replacement | | 05 | | | | | | 3,776 | | Ongoing |
OSR—Revenue Management System | | 05 | | 5,522 | | 2,827 | | 2,695 | | |
Office of Racing—Scientific Equipment | | 05 | | 3,480 | | 2,250 | | 1,230 | | |
OESR—Computer Assisted Telephone Interview (CATI) Room Extension | | 05 | | 415 | | 15 | | 200 | | 200 |
| | | | | | | | | | |
| | | | | |
Total Property, Plant and Equipment | | | | | | | | 7,901 | | |
| | | | | | | | | | |
| | | | | |
Other Capital Expenditure | | | | | | | | | | |
OSR—Revenue Management System | | 05 | | 65,757 | | 44,130 | | 21,327 | | 300 |
Asset replacement | | 05 | | | | | | 1,122 | | Ongoing |
QOGR—Data Requirements 3 | | 05 | | 820 | | | | 820 | | |
QOGR—Grants Management System | | 05 | | 562 | | | | 562 | | |
QOGR—Online Services | | 05 | | 500 | | | | 500 | | |
Documents & Records Management Improvement Project (eDRMS) | | 05 | | 2,094 | | 1,678 | | 108 | | 308 |
| | | | | | | | | | |
Total Other Capital Expenditure | | | | | | | | 24,439 | | |
| | | | | | | | | | |
TOTAL QUEENSLAND TREASURY | | | | | | | | 32,340 | | |
| | | | | | | | | | |
284
APPENDIX A –
ENTITIES INCLUDED IN CAPITAL OUTLAYS 2008-09
Department of Child Safety
Department of Communities
Queensland Corrective Services
Disability Services Queensland
Education, Training and the Arts
Australian Agricultural College Corporation
Library Board of Queensland
Queensland Art Gallery
Queensland Museum
Queensland Performing Arts Trust
Queensland Studies Authority
Corporate and Professional Services
Southbank Institute of Technology
Electoral Commission of Queensland
Department of Emergency Services
Department of Employment and Industrial Relations
Environmental Protection Agency
Queensland Health
The Council of the Queensland Institute of Medical Research
Department of Housing
Department of Infrastructure and Planning
Property Services Group
Water Infrastructure Projects
SEQ Water Grid Manager
Airport Link
Department of Justice and Attorney-General
Public Trust Office
Legal Aid Queensland
Crime and Misconduct Commission
Anti-Discrimination Commission
Legislative Assembly of Queensland
Department of Local Government, Sport and Recreation
Stadiums Queensland
Department of Main Roads
RoadTek
Queensland Motorways Limited
Department of Mines and Energy
CS Energy Limited
ENERGEX Limited
Stanwell Corporation Limited
285
Tarong Energy Corporation Limited
Powerlink Queensland
Ergon Energy Corporation Limited
Department of Natural Resources and Water
Gladstone Area Water Board
Mount Isa Water Board
SunWater
Queensland Bulk Water Supply Authority
Queensland Bulk Water Transport Authority
Office of the Governor
Office of the Ombudsman
Queensland Police Service
Department of the Premier and Cabinet
Commission for Children and Young People and Child Guardian
South Bank Corporation
Department of Primary Industries and Fisheries
Forestry Plantations Queensland
QRAA
Department of Public Works
QBuild
QFleet
Project Services
SDS (Sales and Distribution Services)
CITEC
Shared Service Agency
CorpTech
Queensland Audit Office
Department of Tourism, Regional Development and Industry
Tourism Queensland
Queensland Transport
QR Limited
Port of Brisbane Corporation Limited
Cairns Ports
Gladstone Ports Corporation
Mackay Ports
Ports Corporation of Queensland Limited
Port of Townsville
Queensland Treasury
286
APPENDIX B –
KEY CONCEPTS AND COVERAGE
COVERAGE OF THE CAPITAL STATEMENT
Under accrual output budgeting, capital is the stock of assets including property, plant and equipment, intangible assets and inventories that an agency owns and/or controls and uses in the delivery of services, as well as capital grants made to other entities. For the purpose of this Budget Paper, capital outlays refer to the gross acquisition of these assets. The following definitions are applicable throughout this document:
total capital outlays—property, plant and equipment outlays, other capital expenditure and capital grants
property, plant and equipment outlays—property, plant and equipment outlays as per the financial statements excluding asset sales, depreciation and revaluations
other capital expenditure—intangibles, such as software development, and self-generating and regenerating assets
capital grants—capital grants to other entities (excluding grants to other Government departments, statutory bodies and individuals under the First Home Owners Grant scheme).
Capital outlays include information for all bodies defined as reporting entities for the purpose of whole-of-Government financial reporting requirements, excluding Public Financial Corporations. Projects without a recorded total estimated cost are ongoing. The entities included in scope for the Capital Statement are listed in Appendix A. The Capital Statement only provides details of projects being undertaken within Queensland.
CAPITAL CONTINGENCY
Consistent with the approach adopted in previous years, a capital contingency reserve has been included. This reserve recognises that while agencies budget to fully use their capital works allocation, circumstances such as project lead-in times, project management constraints, unexpected weather conditions and capacity constraints such as the supply of labour and materials may prevent full usage. On a whole-of-Government basis, there is likely to be underspending, resulting in a carryover of capital allocations.
287
2008-09 State Budget Papers
| 2. | Budget Strategy and Outlook |
| 5. | Service Delivery Statements |
Budget Highlights
A number of changes have been made to the Budget documents for 2008-09, to promote the accessibility and readability of the Budget documents.
One of these changes is the introduction of Budget Paper No. 4—Budget Measures which provides comprehensive information on all significant Government policy decisions that involve changes to expense, capital and revenue activities since the previous Budget. This new document provides a comprehensive statement of new policy measures.
The former individual Ministerial Portfolio Statements are now combined into Budget Paper No. 5—Service Delivery Statements. The revision will reduce duplication. Performance measures by output and agency financial statements and variance notes have been retained. The Service Delivery Statements will continue to provide the primary source of information for the hearings of the Parliamentary Estimates Committees.
To further improve the information in the Budget Papers in coming years, new measures will be incorporated in line with the proposed reforms of the Financial Administration and Audit Act 1977 which are currently underway.
The Budget Papers are available online at www.budget.qld.gov.au or they can be purchased through The Queensland Government Bookshop, individually or as a set. Please phone (07) 3883 8700 (1800 801 123 for callers outside of Brisbane).
©Crown copyright
All rights reserved
Queensland Government 2008
Excerpts from this publication may be reproduced, with appropriate
acknowledgement, as permitted under the Copyright Act.
Budget Measures
Budget Paper No.4
ISSN 1445-4890 (Print)
ISSN 1445-4904 (Online)
289
STATE BUDGET
2008-09
BUDGET MEASURES
Budget Paper No. 4
TABLE OF CONTENTS
1. OVERVIEW
|
FEATURES • This is the first time the Government has produced a Budget Paper presenting a consolidation of expense, capital and revenue measures reflecting decisions in the Budget as well as in the period since the previous year’s Budget. • The measures reflect the Government’s policy agenda, targeting priority areas in which the Government will concentrate its efforts to improve performance and respond to changing community needs and expectations. |
INTRODUCTION
This introductory chapter explains the Government’s Budget priorities which provide the framework for government policy making and the major themes of the 2008-09 Budget.
The intention in producing this paper is to provide a consolidated view of the Government’s policy decisions with budgetary impacts made since the 2007-08 Budget, including the 2008-09 Budget. The paper provides an overview of the many individual policy decisions significantly affecting service delivery and revenue raising that are reflected in this year’s Budget. It complements other Budget Papers, in particular Budget Paper No. 2—Budget Strategy and Outlook, Budget Paper No. 3—Capital Statement and the Service Delivery Statements, which provide more detail on the individual initiatives.
This paper includes only new policy decisions and does not detail the full amount of additional funding being provided to agencies to deliver services and infrastructure. For example, formula-driven changes in funding are not included. For details on the total funding available to agencies, refer to agencies’ Service Delivery Statements.
THE 2008-09 BUDGET - PRIORITlES
The 2008-09 Budget introduces measures focused towards achievement in a set of Budget priorities. These priorities include:
| | • | | Helping Queenslanders under financial pressure |
| | • | | Healthy individuals and communities |
| | • | | Building infrastructure |
| | • | | Education and early childhood development |
| | • | | Prevention and early intervention |
| | • | | Closing the gap with Indigenous communities |
| | • | | Managing climate change and protecting the environment. |
Measures in these key policy areas fall into three categories—expense, capital and revenue. Expense and capital initiatives usually have a direct impact on the achievement of the Government’s priorities. Expense
293
initiatives relate to the provision of goods and services and the operation and maintenance of assets. Capital initiatives relate to the purchase and construction of assets that are used to support service delivery, such as hospitals, schools, courthouses, police stations, fire and ambulance stations and roads.
Revenue initiatives provide funding for Government expenditure or relief from the payment of taxation, fees or charges. In some instances, revenue initiatives can directly assist in the achievement of government priorities, if, for example, they encourage more responsible use of community resources or provide taxation, fees or charges relief to promote policy objectives.
More detailed information on service delivery initiatives can be found in the Service Delivery Statements. Budget Paper No. 3—Capital Statement provides an overview of proposed capital outlays by the Queensland Government in 2008-09, including discussion of individual projects. Chapter 5 of Budget Paper No. 2—Budget Strategy and Outlook has a more detailed discussion of the taxation and royalty initiatives in the Budget.
Some of the more significant measures under each priority are indicated below.
Helping Queenslanders under financial pressure
Rising fuel, grocery and other prices, as well as increasing mortgage interest rates, are making it more difficult for Queenslanders to make ends meet. Government is providing relief through a number of measures to reduce the financial pressure now facing Queenslanders and their families. In 2008-09, the value of concessions available to Queenslanders to assist in relieving day-to-day living expenses is estimated at around $1 billion.
Significant measures include:
| | • | | Electricity Rebate and Electricity Life Support Concession Scheme—Supplementation (page 13) |
| | • | | SEQ Pensioner Water Subsidy Scheme (page 13) |
| | • | | Home Energy Emergency Assistance Scheme (page 14) |
| | • | | Reticulated Natural Gas Rebate Scheme (page 14) |
| | • | | Support for Families and Individuals—Disability Service (page 19) |
Housing affordability
Significant growth in home prices, increases in home mortgage interest rates and rising rents have reduced home affordability for Queenslanders. The Government is implementing measures to provide some relief for those Queenslanders buying or renting their home.
Significant measures include:
| | • | | Transfer duty—rate and threshold changes (page 96) |
| | • | | Mortgage Duty—full abolition (page 98) |
| | • | | Queensland Housing Affordability Program (page 35) |
| | • | | Urban Land Development Authority (page 35) |
Congestion management
Queensland’s strong population growth, particularly in South East Queensland, presents challenges for transport systems. The Government is implementing short, medium and long-term strategies to address urban congestion and demand for transport in Queensland’s cities.
294
Significant measures include:
| | • | | Congestion Management Strategy (page 56) |
| | • | | Translink Network Plan (page 56) |
| | • | | Citytrain rollingstock (page 88) |
Healthy individuals and communities
The Queensland community expects and deserves access to high quality and reliable health care services. The Government is implementing measures to continue the improvement in the standard and accessibility of health services.
Significant measures include:
| | • | | Elective Surgery and Increased Demand (page 29) |
| | • | | Southern Area Health Service Demand Management (pages 29, 74) |
| | • | | Central Area Health Service Demand Management (pages 29, 74) |
| | • | | Northern Area Health Service Demand Management (pages 30, 74) |
| | • | | Health Infrastructure Support and Maintenance (page 31) |
| | • | | Cairns Base Hospital Redevelopment (page 75) |
| | • | | Mackay Base Hospital Redevelopment (pages 30, 75) |
| | • | | Mount Isa Hospital Redevelopment (pages 30, 75) |
| | • | | Additional Ambulance Officers (page 25) |
Building infrastructure
The rapid growth of Queensland’s population and economy requires a strong commitment to the development of new infrastructure. The Government is building on its ongoing efforts to develop the State’s social, transport, water and other service delivery infrastructure.
Significant measures include:
| | • | | Additional New Schools (pages 20, 69) |
| | • | | Cairns Base Hospital Redevelopment (page 75) |
| | • | | Mackay Base Hospital Redevelopment (pages 30, 75) |
| | • | | Mount Isa Hospital Redevelopment (pages 30, 75) |
| | • | | Darra to Springfield Road and Rail Connection (page 87) |
| | • | | Abbot Point—Equity Contribution (page 87) |
Economic growth
The economic prosperity which supports Queenslanders’ high quality of life depends on continued improvements in the productivity of the private and public sectors. The Government is implementing measures to drive productivity growth through improvements in education and training, development of infrastructure and the encouragement of research, development and innovation.
295
Significant measures include:
| | • | | Pay-roll Tax—Ex tension of Deduction (page 97) |
| | • | | Queensland Skills Plan—Trade Campuses (page 70) |
| | • | | Additional Training Places (page 20) |
| | • | | Queensland Brain Institute (page 55) |
| | • | | Institute of Glycomics (page 55) |
| | • | | Land tax—reduction in rates (page 97) |
Regional development
Queensland’s regions are the home of a significant part of the State’s population and its continued development will be a significant factor in the State’s future prosperity. The Government is implementing measures to support service delivery and economic development in the regions.
Significant measures include:
| | • | | Highway improvements to support the Bowen Basin Coalfields (page 80) |
| | • | | Northern Minerals Province—driver activated points on the Mount Isa rail line (page 88) |
| | • | | Abbot Point—Equity Contribution (page 87) |
| | • | | Moranbah Water Supply Allocation (page 41) |
Education and early childhood development
Quality education and support from early childhood underpins the future social and economic prosperity of the State. The Government is implementing measures to improve access to high quality education and early childhood services for all Queenslanders.
Significant measures include:
| | • | | Early Years/pre-Prep (pages 21, 69) |
| | • | | Additional New Schools (pages 20, 69) |
| | • | | School Maintenance (page 20) |
| | • | | Queensland Curriculum Assessment and Reporting (page 21) |
Prevention and early intervention
The long term sustainability of high quality service delivery is supported by strategies focused on the prevention of social and other problems and early intervention to reduce the extent of their development. The Government is investing in these strategies through early Government action in areas such as health care, accommodation, training and road safety.
Significant measures include:
| | • | | Investment in Early Intervention and Prevention—Disability Services (pages 19) |
| | • | | Road Safety Summit and Young Drivers Safety Initiatives (pages 37, 48, 78) |
| | • | | Responsible Gambling Strategy (page 58) |
| | • | | Liquor Reform (page 59) |
296
| | • | | Whole-of-Government Prevention and Early Intervention Incentives (page 61) |
| | • | | Family Intervention Services (page 11) |
| | • | | Fluoride Capital Assistance Program (page 40) |
Closing the gap with Indigenous communities
An unacceptable gap exists between the health, economic and social outcomes of Aboriginal and Torres Strait Islanders and those of other Queenslanders. The Government is implementing measures that build on its ongoing commitment to closing that gap through improved service delivery and the creation of real choices and opportunities for Aboriginal and Torres Strait Islanders and their communities.
Significant measures include:
| | • | | Cape York Welfare Reform Initiative (page 50) |
| | • | | Indigenous Alcohol Rehabilitation and Support Programs (pages 14, 31, 40) |
| | • | | Implementation of Cape York Peninsula Heritage Act 2007 Land Dealings (page 46) |
| | • | | Backing Indigenous Arts (page 22) |
| | • | | Indigenous Community Residentials (page 12) |
Managing climate change and protecting the environment
The management of climate change is a major environmental challenge for Queensland, the nation and the world. The Government is committed to making its contribution to meeting this challenge through measures that support the national effort to reduce greenhouse gas emissions.
Significant measures include:
| | • | | Queensland Climate Change Fund Dividend (page 27) |
| | • | | Queensland Renewable Energy Fund (page 43) |
| | • | | Queensland Smart Energy Savings Fund (page 43) |
| | • | | Climate Smart Homes Rebate Program (page 44) |
| | • | | Carbon Geosequestration Initiative (page 44) |
| | • | | Callide Oxyfuel Project (page 81) |
| | • | | Moreton Bay Marine Park Zoning Plan (page 27) |
| | • | | Cape York Peninsula Heritage Act Tenure Resolution and National Park Development (pages 28, 73) |
EXPLANATION OF SCOPE AND TERMS
The following is a description of the scope and terms applied in this document.
Scope
This document includes measures with the following features:
| | • | | Sector. Only Queensland General Government sector agencies are included. Measures involving Government-owned Corporations or other Public Non-financial Corporation sector agencies are within scope if the measures are being funded directly by the General Government sector. |
| | • | | Timeframe. Measures based on decisions made since the release of the 2007-08 Budget (June 2007), including the 2008-09 Budget. |
297
| | • | | Type. Measures with budgetary impacts; in particular, expense and capital measures with service delivery, capital enhancement, grant or subsidy impacts on the community. Revenue measures involving a significant change in revenue policy, including changes in tax rate. |
Initiatives of a technical nature or non-policy based adjustments, such as parameter based funding adjustments, are not included as they do not reflect changes in government policy. The main focus is on measures reflecting policy decisions that impact directly on the community through service delivery or other means.
| | • | | Materiality. Minor measures or measures with non-significant community impact are not included in the document. |
Funding basis
Tables in this document are presented on a net funding basis.
| | • | | Net funding refers to the impact of funding the measure on appropriations from the Consolidated Fund or centrally held funds (such as the Queensland Future Growth Fund) to the relevant General Government agency. It does not include funding directed to the measure from existing agency resources or other sources. Where the funding is provided from sources other than the Queensland Government, this is indicated in the text. |
| | • | | Amounts refer to additional funding being provided to agencies for a particular program or project, as a result of Government decisions since the 2007-08 Budget. This may differ to other Budget papers, such as Budget Paper No. 3—Capital Statement, that may refer to total funding. |
| | • | | Amounts included in the tables relating to revenue measures represent the impact of the measure on Government revenue (with a positive amount representing additional revenue). |
2. EXPENSE MEASURES
Introduction
The following tables present the relevant portfolio expense measures relating to decisions taken since the 2007-08 Budget. This does not represent the full amount of additional funding provided to agencies since the 2007-08 Budget. For further explanation, refer to Explanation of Scope and Terms in Chapter 1.
Child Safety
| | | | | | | | | | |
| | | 2007-08
$’000 | | 2008-09
$’000 | | 2009-10
$’000 | | 2010-11
$’000 | | 2011-12
$’000 |
Integrated Client Management System | | 3,981 | | 14,067 | | 15,552 | | 15,354 | | 16,054 |
The Government is providing additional funding to enhance the department’s ICT Integrated Client Management System. This sophisticated system provides child safety officers with state-wide access to comprehensive client information, as well as carer and therapeutic support details. More informed decision making will better facilitate the needs of children in care and in need of care. The capital component of this initiative can be found in Chapter 3 Capital Measures.
| | | | | | | | | | |
| | | 2007-08
$’000 | | 2008-09
$’000 | | 2009-10
$’000 | | 2010-11
$’000 | | 2011-12
$’000 |
Additional Placements for Children Living Away from Home | | — | | 3,000 | | 2,500 | | 2,500 | | 2,500 |
The Government will provide new funding to improve the range and quality of placement options for children with complex to extreme needs. The initiatives involve additional support to foster and kinship carers who are at risk of placement breakdown; full time home-based carers specialising in caring for extreme needs
298
children; and additional grant funded residential places within high needs areas of the State. The department is also contributing an additional $3 million over four years. The capital component of this initiative can be found in Chapter 3 Capital Measures.
| | | | | | | | | | |
| | | 2007-08
$’000 | | 2008-09
$’000 | | 2009-10
$’000 | | 2010-11
$’000 | | 2011-12
$’000 |
Recruitment Campaign for Foster Carers | | 2,811 | | 2,798 | | 2,802 | | 2,807 | | 2,807 |
The Government is providing funding to recruit additional foster carers in response to growing demand for child protection. The initiative will increase the pool of family based carers and aims to improve carer retention by providing greater flexibility in respite and other carer support arrangements. The department has contributed an additional $1 million in 2007-08 from its existing resources to the recruitment campaign, bringing the total funding package to $15 million over five years.
| | | | | | | | | | |
| | | 2007-08
$’000 | | 2008-09
$’000 | | 2009-10
$’000 | | 2010-11
$’000 | | 2011-12
$’000 |
Additional Frontline Staff | �� | — | | 2,000 | | 2,000 | | 2,000 | | 2,000 |
In responding to sustained growth in demand for child protection, the Government will provide funding to recruit additional frontline staff. This strategy will support those service centres which currently experience the highest workloads or face significant growth pressures. The department has contributed an additional $2.5 million over four years to extend this strategy.
| | | | | | | | | | |
| | | 2007-08
$’000 | | 2008-09
$’000 | | 2009-10
$’000 | | 2010-11
$’000 | | 2011-12
$’000 |
Frontline Workforce Carer Progression | | — | | 2,000 | | 1,000 | | 1,000 | | 1,000 |
The Government is supporting an initiative to improve retention of experienced front line child protection staff by providing funding to support a job redesign program. This initiative will provide greater carer progression opportunities and align skills with position requirements. The department will contribute an additional $10.1 million over four years to extend this strategy.
| | | | | | | | | | |
| | | 2007-08
$’000 | | 2008-09
$’000 | | 2009-10
$’000 | | 2010-11
$’000 | | 2011-12
$’000 |
Family Intervention Services | | — | | 2,000 | | 4,000 | | 4,000 | | 4,000 |
In recognition of research supporting prevention and early intervention as a means of stemming growth in child protection demand, the Government is providing funds to support the department’s Family Intervention Service. The program provides critical support to families who are experiencing crisis and assists them to resolve dysfunctional family elements that cause children to enter care or to enter further into the child protection system. Indigenous families and the One Chance at Childhood cohort will be prioritised within this extended service.
| | | | | | | | | | |
| | | 2007-08
$’000 | | 2008-09
$’000 | | 2009-10
$’000 | | 2010-11
$’000 | | 2011-12
$’000 |
Family Group Meeting Convenors | | — | | 1,000 | | 500 | | 500 | | 500 |
The Government is providing funding for additional Family Group Meeting Convenors to improve case planning for children throughout the State. The program seeks to provide family-based responses to children’s protection and care needs, and ensures an inclusive approach to planning and decision making. The department is contributing an additional $1.7 million over four years to extend this strategy.
| | | | | | | | | | |
| | | 2007-08
$’000 | | 2008-09
$’000 | | 2009-10
$’000 | | 2010-11
$’000 | | 2011-12
$’000 |
Indigenous Community Residentials | | — | | — | | 1,000 | | 2,000 | | 4,000 |
299
The Government will provide funding to support the four safe houses announced in the Budget. This initiative will enhance the provision of services to Indigenous communities by providing placement options for Indigenous children within their communities. The capital component of this initiative can be found in Chapter 3 Capital Measures.
Communities
| | | | | | | | | | |
| | | 2007-08
$’000 | | 2008-09
$’000 | | 2009-10
$’000 | | 2010-11
$’000 | | 2011-12
$’000 |
Electricity Rebate and Electricity Life Support Concession Scheme - Supplementation | | — | | 10,724 | | 10,724 | | 10,724 | | 10,724 |
From 1 July 2008, the electricity rebate for eligible concession card holders will increase by $20 to $165 per annum. Rebates under the Electricity Life Support Concession Scheme will also be enhanced.
| | | | | | | | | | |
| | | 2007-08
$’000 | | 2008-09
$’000 | | 2009-10
$’000 | | 2010-11
$’000 | | 2011-12
$’000 |
Integrated Client Management System | | — | | 9,233 | | 10,148 | | 10,246 | | 10,946 |
The Government is providing funding for the operational support, ongoing enhancements and modifications to the Integrated Client Management System (ICMS). The ICMS allows departmental staff access to the relevant details of children and young people at risk, their families and carers. This funding is important in maintaining the Government’s integrated and effective response to the protection and management of young people in the justice and protection systems. The capital component of this initiative can be found in Chapter 3 Capital Measures.
| | | | | | | | | | |
| | | 2007-08
$’000 | | 2008-09
$’000 | | 2009-10
$’000 | | 2010-11
$’000 | | 2011-12
$’000 |
SEQ Pensioner Water Subsidy Scheme | | — | | 6,480 | | 11,340 | | 16,200 | | 16,200 |
The Government will provide funding to establish a SEQ Pensioner Water Subsidy Scheme for eligible pensioners in the South East Queensland Western Grid to reduce the impact of increased water prices in South East Queensland. The Scheme will be phased in over three years in line with the projected increases in water prices and will provide a subsidy of $40 in 2008-09, $70 in 2009-10 and $100 from 2010-11. The Scheme, which will only apply to eligible pensioners in the SEQ Water Grid, will be in addition to the current Pensioner Rate Subsidy Scheme.
| | | | | | | | | | |
| | | 2007-08
$’000 | | 2008-09
$’000 | | 2009-10
$’000 | | 2010-11
$’000 | | 2011-12
$’000 |
Indigenous Alcohol Rehabilitation and Support Programs | | — | | 5,360 | | 5,360 | | 2,160 | | 2,160 |
The Government will provide additional funding to the department to deliver diversionary activities across Queensland’s Indigenous communities. This initiative is part of a larger Government package to address the harm caused by alcohol and other substances. Other components can be found in the Health and Local Government, Sport and Recreation portfolios.
| | | | | | | | | | |
| | | 2007-08
$’000 | | 2008-09
$’000 | | 2009-10
$’000 | | 2010-11
$’000 | | 2011-12
$’000 |
Home Energy Emergency Assistance Scheme | | 1,275 | | 3,000 | | 3,000 | | 3,000 | | 3,000 |
The Government will provide one-off emergency assistance (up to a maximum of $360 once in any two year period) to low income households suffering a short-term financial crisis and who are unable to pay their current
300
electricity and/or reticulated natural gas account and are at risk of disconnection. Payments are made directly to the energy retailers and credited to the customer’s outstanding account. The capital component of this initiative can be found in Chapter 3 Capital Measures.
| | | | | | | | | | |
| | | 2007-08
$’000 | | 2008-09
$’000 | | 2009-10
$’000 | | 2010-11
$’000 | | 2011-12
$’000 |
Reticulated Natural Gas Rebate Scheme | | 2,825 | | 2,961 | | 2,961 | | 2,961 | | 2,961 |
The Government is providing funding to assist people most in need to meet their reticulated natural gas costs in response to recent price increases. From 1 July 2008, consistent with the Consumer Price Index, the rebate will increase from $55 to $57.64 per year for eligible pensioners and Seniors Card holders throughout Queensland.
| | | | | | | | | | |
| | | 2007-08
$’000 | | 2008-09
$’000 | | 2009-10
$’000 | | 2010-11
$’000 | | 2011-12
$’000 |
Asset Management | | — | | 2,414 | | 3,226 | | 2,747 | | 1,389 |
The Government will provide additional capital and associated recurrent funding to the department to complete upgrades to the Brisbane Childrens’ Court and undertake upgrades and improvements to the Southern Outlook located at Boonah. These projects will be supplemented by departmental funding. The department will also undertake repairs and maintenance of former Department of Aboriginal and Torres Strait Islander Policy properties. The capital component of this initiative can be found in Chapter 3 Capital Measures.
| | | | | | | | | | |
| | | 2007-08
$’000 | | 2008-09
$’000 | | 2009-10
$’000 | | 2010-11
$’000 | | 2011-12
$’000 |
Early Years Initiatives | | — | | 2,000 | | — | | — | | — |
The Government will provide additional funding to the department to establish an implementation team to assist with negotiating Queensland’s input into the national early childhood reform agenda through the Council of Australian Governments. The team will also assist in the planning and roll-out of national reform initiatives and ensure Queensland maximises its share of Commonwealth funding.
| | | | | | | | | | |
| | | 2007-08
$’000 | | 2008-09
$’000 | | 2009-10
$’000 | | 2010-11
$’000 | | 2011-12
$’000 |
Youth Justice Demand | | — | | 2,000 | | 2,000 | | 2,000 | | 2,000 |
The Government will provide additional funding to the department for increased supervision of court orders, and expanded Diversionary Sexual Offending Counselling Service and Griffith Sexual Offender Counselling Service to meet increasing demand for these services and reduce the need for young people to be remanded. The initiative will help meet the Government’s statutory obligations to young people on youth justice orders under the Juvenile Justice Act 1992.
| | | | | | | | | | |
| | | 2007-08
$’000 | | 2008-09
$’000 | | 2009-10
$’000 | | 2010-11
$’000 | | 2011-12
$’000 |
Enhanced Crisis Support Accommodation | | — | | 700 | | 700 | | 700 | | 700 |
The Government will provide additional funding to enhance a number of Ozcare crisis supported accommodation services for single adults. Ozcare has provided invaluable services to people in Queensland for many years and this additional funding will continue the development of services for some of the most vulnerable people in our community.
| | | | | | | | | | |
| | | 2007-08
$’000 | | 2008-09
$’000 | | 2009-10
$’000 | | 2010-11
$’000 | | 2011-12
$’000 |
Equine Influenza | | 3,000 | | — | | — | | — | | — |
The Government contributed funding for those suffering hardship as a result of the equine influenza outbreak in Queensland. The funding enabled the department to establish One-Stop-Shops allowing people
301
access to internet services, counselling and recreational programs as well as providing emergency assistance payments and personal support.
| | | | | | | | | | |
| | | 2007-08
$’000 | | 2008-09
$’000 | | 2009-10
$’000 | | 2010-11
$’000 | | 2011-12
$’000 |
Safe Havens | | — | | — | | 1,864 | | 700 | | 3,000 |
The Government will provide additional funding to the department for the Safe Havens initiative. This initiative provides services to children and young people affected by family violence in the communities of Coen, Cherbourg, Mornington Island and Palm Island. Safe Havens is a joint Commonwealth and Queensland Government initiative and also includes assistance from local government. The capital component of this initiative can be found in Chapter 3 Capital Measures.
| | | | | | | | | | |
| | | 2007-08
$’000 | | 2008-09
$’000 | | 2009-10
$’000 | | 2010-11
$’000 | | 2011-12
$’000 |
Tropical Cyclone Larry Funding | | 1,582 | | — | | — | | — | | — |
The Government contributed funding to the disaster response and community recovery resulting from Cyclone Larry. Services provided to assist families and individuals included case management, counselling and information and referral directly and/or through Government partners.
Corrective Services
| | | | | | | | | | |
| | | 2007-08
$’000 | | 2008-09
$’000 | | 2009-10
$’000 | | 2010-11
$’000 | | 2011-12
$’000 |
Water Efficiency Management Plans | | 8,600 | | — | | — | | — | | — |
The Government funded water saving initiatives at correctional centres in South East Queensland, including the development of Water Efficiency Management Plans as required under the Level 6 water restrictions, replacement of inefficient tapware and other devices, sub-metering to control usage and the installation of rainwater harvesting systems.
Disability Services Queensland
| | | | | | | | | | |
| | | 2007-08
$’000 | | 2008-09
$’000 | | 2009-10
$’000 | | 2010-11
$’000 | | 2011-12
$’000 |
Investment in Early Intervention and Prevention | | — | | 15,000 | | 15,000 | | 15,000 | | 15,000 |
The Government will provide additional funding to enhance early intervention and prevention services by expanding the capacity in five existing service areas: accommodation support; family support; post school services; young adults exiting the care of the State; and respite services. It is proposed that the funding will be available in a timely manner throughout the year to the most needy recipients via a system of rolling allocations of funding and rolling prioritisation across the year. The capital component of this initiative can be found in Chapter 3 Capital Measures.
| | | | | | | | | | |
| | | 2007-08
$’000 | | 2008-09
$’000 | | 2009-10
$’000 | | 2010-11
$’000 | | 2011-12
$’000 |
Support for Families and Individuals | | 10,000 | | 10,000 | | 5,000 | | 5,000 | | 5,000 |
The Government will provide additional funding to manage increased demand to support individuals with disabilities and their families who have experienced crisis situations. Key drivers for the increased demand for the program include the ageing of carers and the increasing complexity of disability support needs.
302
| | | | | | | | | | |
| | | 2007-08
$’000 | | 2008-09
$’000 | | 2009-10
$’000 | | 2010-11
$’000 | | 2011-12
$’000 |
Mental Health Housing and Support Program | | — | | 1,500 | | 1,500 | | 1,500 | | 1,500 |
The Government will provide additional funding to support people with a psychiatric disability to transition from mental health acute and extended treatment facilities to sustainable community living through the Housing and Support Program.
Education, Training and the Arts
| | | | | | | | | | |
| | | 2007-08
$’000 | | 2008-09
$’000 | | 2009-10
$’000 | | 2010-11
$’000 | | 2011-12
$’000 |
School Maintenance | | — | | 66,600 | | 71,600 | | 21,600 | | 5,000 |
The Government will provide ongoing additional funding to supplement the annual asset maintenance program. The funding will be used to increase service maintenance, housing maintenance, roofing, painting and reticulation maintenance and to continue other minor programs. This encompasses the allocation of $100 million to maintenance over two years through the Tomorrow’s Schools initiative.
| | | | | | | | | | |
| | | 2007-08
$’000 | | 2008-09
$’000 | | 2009-10
$’000 | | 2010-11
$’000 | | 2011-12
$’000 |
Additional Training Places | | 10,861 | | 10,861 | | 10,861 | | 10,861 | | 10,861 |
The Government is providing additional funding to support greater than expected growth in apprenticeship and traineeship training. This increase, together with Queensland Skills Plan funding and internal department reallocations, will increase total funding for User Choice in 2008-09 to $186.5 million.
| | | | | | | | | | |
| | | 2007-08
$’000 | | 2008-09
$’000 | | 2009-10
$’000 | | 2010-11
$’000 | | 2011-12
$’000 |
Additional New Schools | | — | | 6,120 | | 765 | | 3,075 | | — |
The Government will provide funding to build two high priority new schools in the heavily growing Northern Gold Coast area. A new primary school will open in Western Oxenford and a new secondary school in Ormeau, for the start of the 2009 school year. These schools are in addition to seven new schools being proposed for delivery as part of a public private partnership and two new schools to be funded directly from the department’s capital program. The capital component of this initiative can be found in Chapter 3 Capital Measures.
| | | | | | | | | | |
| | | 2007-08
$’000 | | 2008-09
$’000 | | 2009-10
$’000 | | 2010-11
$’000 | | 2011-12
$’000 |
Queensland Curriculum Assessment and Reporting | | — | | 3,000 | | 3,000 | | 3,000 | | 3,000 |
The Government will provide funding of $3 million in 2008-09 to complete the development and implementation of the Queensland Curriculum Assessment and Reporting (QCAR) framework to meet the Government’s commitment for a smarter learning framework. Ongoing funding in later years will support the administration and maintenance of the QCAR framework and national literacy and numeracy assessment programs in Queensland schools.
| | | | | | | | | | |
| | | 2007-08
$’000 | | 2008-09
$’000 | | 2009-10
$’000 | | 2010-11
$’000 | | 2011-12
$’000 |
OneSchool | | 2,150 | | 1,000 | | — | | — | | — |
The Government is providing additional funding to contribute towards the development of a custom-built, school management software application (OneSchool). The centralised application will provide an enterprise-wide information management system for all Government schools. The capital component of this initiative can be found in Chapter 3 Capital Measures.
303
| | | | | | | | | | |
| | | 2007-08
$’000 | | 2008-09
$’000 | | 2009-10
$’000 | | 2010-11
$’000 | | 2011-12
$’000 |
Early Years/pre-Prep | | — | | 880 | | 2,043 | | 448 | | 448 |
The Government will provide funding to construct new or enhance existing facilities to support the provision of quality pre-Prep programs for children aged 3 1/2 to 4 1/2 years living in 35 Indigenous communities, under the Queensland Government’s Bound for Success education strategy. The capital component of this initiative can be found in Chapter 3 Capital Measures.
Education, Training and the Arts - Arts
| | | | | | | | | | |
| | | 2007-08
$’000 | | 2008-09
$’000 | | 2009-10
$’000 | | 2010-11
$’000 | | 2011-12
$’000 |
Backing Indigenous Arts | | 322 | | 1,472 | | 1,598 | | 1,608 | | — |
The Government will provide additional funding of $5 million over four years for the Backing Indigenous Arts program. A total program investment of $10.73 million will be made over four years for the development of the Aboriginal and Torres Strait Islander arts industry in Far North Queensland. This includes $4.42 million to support Indigenous Art Centres in Far North Queensland communities; $3.43 million for Building Skills and Opportunities projects; $1.63 million to develop the Cairns Printmaking Centre; $1 million for the Cairns Indigenous Art Marketplace; and $0.25 million to develop an Arts Hub in Weipa.
| | | | | | | | | | |
| | | 2007-08
$’000 | | 2008-09
$’000 | | 2009-10
$’000 | | 2010-11
$’000 | | 2011-12
$’000 |
Additional Maintenance Funding for Queensland Museum | | 1,000 | | 1,000 | | 1,000 | | 1,000 | | 1,000 |
The Government is providing additional funding to maintain the condition of buildings and property at Queensland Museum campuses and storage facilities located at Toowoomba, Townsville, Ipswich and Brisbane (Hendra).
| | | | | | | | | | |
| | | 2007-08
$’000 | | 2008-09
$’000 | | 2009-10
$’000 | | 2010-11
$’000 | | 2011-12
$’000 |
Brisbane Festival | | 500 | | 600 | | 600 | | 600 | | 600 |
The Government is providing additional funding of $0.6 million per annum (from 2008-09) for the Brisbane Festival, as part of the Government’s commitment to Queensland’s Signature Festivals. This is in addition to funding of $0.5 million provided in 2007-08 for the 2008 Brisbane Festival. The additional funding will be used to deliver programs of broad community engagement and support for emerging artists.
| | | | | | | | | | |
| | | 2007-08
$’000 | | 2008-09
$’000 | | 2009-10
$’000 | | 2010-11
$’000 | | 2011-12
$’000 |
Queensland Music Festival | | 600 | | 600 | | 600 | | 600 | | 600 |
The Government is providing additional funding of $0.6 million per annum for the Queensland Music Festival, as part of the Government’s commitment to Queensland’s Signature Festivals. The additional funding will enable the Festival to enhance its program delivery in regional areas and attract artistic leadership for the delivery of future Festivals. Total funding of $3.2 million will be provided for the 2009 Queensland Music Festival.
| | | | | | | | | | |
| | | 2007-08
$’000 | | 2008-09
$’000 | | 2009-10
$’000 | | 2010-11
$’000 | | 2011-12
$’000 |
Out of the Box Festival | | — | | 100 | | 100 | | 100 | | 100 |
The Government will provide additional funding of $0.1 million per annum for Queensland Performing Arts Centre’s Out of the Box Festival for three to eight year olds, as part of the Government’s commitment to Queensland’s Signature Festivals. This brings the Government’s total commitment to $0.7 million per Festival.
304
Electoral Commission of Queensland
| | | | | | | | | | |
| | | 2007-08
$’000 | | 2008-09
$’000 | | 2009-10
$’000 | | 2010-11
$’000 | | 2011-12
$’000 |
2008 Local Government Elections | | 14,998 | | — | | — | | — | | — |
The Government provided additional funding following the report of the Local Government Reform Commission and the Government’s decision that the Electoral Commission of Queensland would conduct the 2008 Quadrennial Local Government Elections. The Electoral Commission of Queensland expects administration associated with the 2008 Quadrennial Local Government Election process will be finalised by the end of 2007-08.
Emergency Services
| | | | | | | | | | |
| | | 2007-08
$’000 | | 2008-09
$’000 | | 2009-10
$’000 | | 2010-11
$’000 | | 2011-12
$’000 |
Additional Ambulance Officers | | — | | 20,807 | | 30,419 | | 33,552 | | 36,189 |
The Government will provide an additional 250 ambulance officers in response to increasing demand for ambulance services, in addition to funding the implementation of a number of demand management strategies. The initiative will be supported by a reallocation of departmental savings identified by the Queensland Ambulance Service Audit, in addition to direct Government funding.
| | | | | | | | | | |
| | | 2007-08
$’000 | | 2008-09
$’000 | | 2009-10
$’000 | | 2010-11
$’000 | | 2011-12
$’000 |
Sustainable Management of Helicopter Operations | | — | | 2,698 | | 924 | | 950 | | 978 |
The Government is providing funding for a major overhaul of one of the Bell 412 helicopters ($1.3 million in 2008-09), helicopter services safety related staffing, Townsville hangar leasing costs, and regional disaster management staff in 2008-09 to support enhanced disaster planning and preparedness. The design and installation of neonatal equipment into AW139 helicopters and purchase of night vision goggles will be funded from the redirection of savings from the merging of the Service Delivery and Performance Commission with the Office of the Public Service Commissioner.
| | | | | | | | | | |
| | | 2007-08
$’000 | | 2008-09
$’000 | | 2009-10
$’000 | | 2010-11
$’000 | | 2011-12
$’000 |
Fire Alarm Telemetry | | 3,068 | | — | | — | | — | | — |
The Government is providing funds to ensure fire alarm systems are upgraded in more than 6,500 Queensland premises following Telstra’s decision to upgrade communications technology. The funding enables Queensland’s fire service to implement new alarm monitoring systems in buildings such as hospitals, schools and shopping centres. Costs are to be recovered by 2009-10 through existing alarm monitoring charges.
| | | | | | | | | | |
| | | 2007-08
$’000 | | 2008-09
$’000 | | 2009-10
$’000 | | 2010-11
$’000 | | 2011-12
$’000 |
Redland Bay Fire and Rescue Station | | — | | — | | — | | — | | — |
Delivering on a 2006 election commitment, the Government provided additional funding of $0.5 million for 2008-09 and $2 million for 2009-10 to fund the operating expenses of the proposed new Redlands Fire Station. The department will now provide an additional $2.074 million in 2010-11 and $2.151 million annually from 2011-12 to fund the ongoing operation of the station. This measure will be funded from existing departmental resources.
305
| | | | | | | | | | |
| | | 2007-08
$’000 | | 2008-09
$’000 | | 2009-10
$’000 | | 2010-11
$’000 | | 2011-12
$’000 |
Smoke Alarms for the Hearing Impaired | | — | | — | | — | | — | | — |
The Government will fund a voucher scheme to assist hearing impaired persons to purchase and install smoke alarms for the hearing-impaired in their homes. Smoke alarms are now compulsory in Queensland residences after legislation was introduced in July 2007. The scheme provides $0.225 million in 2008-09, and then $0.150 million annually until 2010-11. This measure will be funded from existing departmental resources.
Environmental Protection Agency
| | | | | | | | | | |
| | | 2007-08
$’000 | | 2008-09
$’000 | | 2009-10
$’000 | | 2010-11
$’000 | | 2011-12
$’000 |
Queensland Climate Change Fund Dividend | | 7,310 | | 30,000 | | 30,000 | | 30,000 | | 30,000 |
The Government announced in 2007 that it would create a Climate Change Fund with proceeds of the sale of certain wind farm and gas assets. The Fund was expected to be around $300 million and provide an ongoing revenue stream in the order of $20 million per year. The net proceeds from the sale provided $431 million for the Fund. To ensure that climate change initiatives can be planned with confidence and not be subject to future volatility of investment returns, the Government has decided instead to provide on an ongoing basis fixed annual funding of $30 million from the Consolidated Fund to the department to fund climate change initiatives.
The first major initiative funded from the fund is a ClimateSmart Homes Service, which will provide Queenslanders with tools to monitor and reduce their energy usage. Commencing in January 2009, the program will deliver savings in household electricity costs and greenhouse gas reductions. This builds on the current Home WaterWise Service.
| | | | | | | | | | |
| | | 2007-08
$’000 | | 2008-09
$’000 | | 2009-10
$’000 | | 2010-11
$’000 | | 2011-12
$’000 |
Moreton Bay Marine Park Zoning Plan | | 500 | | 17,500 | | 500 | | 500 | | 500 |
The Government is providing $0.5 million per annum for five years for a baseline data and monitoring program for Moreton Bay Marine Park. Funding of up to $17 million has been allocated for a structural adjustment package for commercial fishers affected by the Moreton Bay Marine Park Zoning Plan.
| | | | | | | | | | |
| | | 2007-08
$’000 | | 2008-09
$’000 | | 2009-10
$’000 | | 2010-11
$’000 | | 2011-12
$’000 |
Licencing under the EP Act and Enhanced Compliance | | — | | 10,700 | | 16,700 | | 16,700 | | 16,700 |
This funding, together with existing annual funding of $30 million, will deliver an expanded State-wide compliance program for Environmentally Relevant Activities including industrial sites. This program will enhance investigation and monitoring activities as well as an investment in technology and technical capability to manage environmental risks more holistically. The capital component of this initiative can be found in Chapter 3 Capital Measures. The revenue component of this initiative can found in Chapter 4 Revenue Measures.
| | | | | | | | | | |
| | | 2007-08
$’000 | | 2008-09
$’000 | | 2009-10
$’000 | | 2010-11
$’000 | | 2011-12
$’000 |
Infrastructure Maintenance in National Parks | | — | | 5,000 | | — | | — | | — |
Funding of $5 million has been provided in 2008-09 for the maintenance of infrastructure in national parks. Protected area infrastructure and visitor services include roads and fire-lines, walking tracks, camping areas and day-use facilities, administrative buildings and workshops.
306
| | | | | | | | | | |
| | | 2007-08
$’000 | | 2008-09
$’000 | | 2009-10
$’000 | | 2010-11
$’000 | | 2011-12
$’000 |
Cape York Peninsula Heritage Act Tenure Resolution and National Park Development | | 551 | | 3,259 | | 2,486 | | 2,754 | | 3,460 |
The Government is providing funding to enable negotiations and development of Indigenous Management Agreements (IMA) for the national park estate; provide support to traditional owners and their representatives in the IMA development process; implement IMA and Indigenous Land Use Agreements; develop conservation agreements and nature refuges on Aboriginal land to protect biodiversity; support the Regional Protected Area Committee and Sub-Committees; and provide for costs associated with the declaration of the Area of International Conservation Significance. The capital component of this initiative can be found in Chapter 3 Capital Measures.
Health
| | | | | | | | | | |
| | | 2007-08
$’000 | | 2008-09
$’000 | | 2009-10
$’000 | | 2010-11
$’000 | | 2011-12
$’000 |
Elective Surgery and Increased Demand | | 50,000 | | 50,000 | | 50,000 | | 50,000 | | 50,000 |
The Government is providing recurrent funding of $50 million to meet service delivery demands encompassing elective surgery and other initiatives.
The funding will enable Queensland hospitals to deliver more elective surgery services to approximately 7,000 patients and enables clinicians to take immediate action to relieve pressures on other essential health services.
| | | | | | | | | | |
| | | 2007-08
$’000 | | 2008-09
$’000 | | 2009-10
$’000 | | 2010-11
$’000 | | 2011-12
$’000 |
Southern Area Health Service Demand Management | | — | | 35,504 | | 42,605 | | 44,735 | | 46,905 |
The Government will provide funding to meet increased operational demand for health services including emergency, maternity and other medical. The funding package will be spent on priorities including service demand increases for the Princess Alexandra Hospital, West Moreton South Burnett and Gold Coast (including Robina Hospital) Health Service Districts. The capital component of this initiative can be found in Chapter 3 Capital Measures.
| | | | | | | | | | |
| | | 2007-08
$’000 | | 2008-09
$’000 | | 2009-10
$’000 | | 2010-11
$’000 | | 2011-12
$’000 |
Central Area Health Service Demand Management | | — | | 29,328 | | 35,194 | | 36,953 | | 38,746 |
The Government will provide funding to meet increased operational demand for health services including emergency, maternity and other medical. The capital component of this initiative can be found in Chapter 3 Capital Measures.
| | | | | | | | | | |
| | | 2007-08
$’000 | | 2008-09
$’000 | | 2009-10
$’000 | | 2010-11
$’000 | | 2011-12
$’000 |
Northern Area Health Service Demand Management | | — | | 15,168 | | 18,202 | | 19,110 | | 19,969 |
The Government will provide funding to meet increased operational demand for health services including emergency, maternity and other medical. The funding package will be spent on priorities including service demand increases for Townsville and Cairns Base Hospitals. The capital component of this initiative can be found in Chapter 3 Capital Measures.
307
| | | | | | | | | | |
| | | 2007-08
$’000 | | 2008-09
$’000 | | 2009-10
$’000 | | 2010-11
$’000 | | 2011-12
$’000 |
Mackay Base Hospital Redevelopment | | — | | — | | 5,000 | | 10,000 | | 50,000 |
The Government will provide funds for the operational costs resulting from the redevelopment and expansion of Mackay Base Hospital. The capital component of this initiative can be found in Chapter 3 Capital Measures.
| | | | | | | | | | |
| | | 2007-08
$’000 | | 2008-09
$’000 | | 2009-10
$’000 | | 2010-11
$’000 | | 2011-12
$’000 |
Mount Isa Hospital Redevelopment | | — | | 2,634 | | 3,432 | | 6,123 | | 11,138 |
The Government will provide funds for the operational costs of the Mount Isa Hospital redevelopment to provide functional, high quality facilities for the public. The facilities will include an expanded emergency department and enable implementation of integrated primary, community and acute health services that will provide a foundation for the development of a Centre for Excellence in Rural and Remote Health. The capital component of this initiative can be found in Chapter 3 Capital Measures.
| | | | | | | | | | |
| | | 2007-08
$’000 | | 2008-09
$’000 | | 2009-10
$’000 | | 2010-11
$’000 | | 2011-12
$’000 |
Medical Aids Subsidy Scheme | | — | | 7,124 | | 11,774 | | 17,000 | | 19,000 |
The Government will provide funding to meet increased demand for medical aids provided by the Medical Aids Subsidy Scheme and to support increased subsidies for clients.
| | | | | | | | | | |
| | | 2007-08
$’000 | | 2008-09
$’000 | | 2009-10
$’000 | | 2010-11
$’000 | | 2011-12
$’000 |
Health Infrastructure Support and Maintenance | | — | | 6,878 | | 24,499 | | 14,258 | | — |
The Government will provide additional investments in the maintenance of capital infrastructure and assets, including staff accommodation, that support Queensland health services to continue to ensure the provision of quality and safe services to patients.
| | | | | | | | | | |
| | | 2007-08
$’000 | | 2008-09
$’000 | | 2009-10
$’000 | | 2010-11
$’000 | | 2011-12
$’000 |
Indigenous Alcohol Rehabilitation and Support Programs | | — | | 5,023 | | 8,183 | | 8,188 | | 8,218 |
The Government will fund an Indigenous alcohol initiative, including detoxification and rehabilitation programs. This initiative is part of a larger Government package to address the harm caused by alcohol and other substances. Other components can be found in the Communities and Local Government, Sport and Recreation portfolios. The capital component of this initiative can be found in Chapter 3 Capital Measures.
| | | | | | | | | | |
| | | 2007-08
$’000 | | 2008-09
$’000 | | 2009-10
$’000 | | 2010-11
$’000 | | 2011-12
$’000 |
Renal Services | | — | | 3,000 | | — | | — | | — |
The Government will provide additional funding to enhance renal services in Queensland. The services include:
| | • | | training the existing Indigenous health workforce in chronic disease prevention relating to chronic renal disease |
| | • | | a kidney transplant pilot which addresses blood group incompatability and increases the numbers of eligible donors. |
The capital component of this initiative can be found in Chapter 3 Capital Measures.
308
| | | | | | | | | | |
| | | 2007-08
$’000 | | 2008-09
$’000 | | 2009-10
$’000 | | 2010-11
$’000 | | 2011-12
$’000 |
Nurse Practitioners | | — | | 2,475 | | 7,400 | | 12,300 | | 12,300 |
The Government will fund support for 10 nurse practitioner positions in areas of need including rural/remote area care, mental health, aged care, chronic disease and emergency in 2008-09 and 20 additional positions in both 2009-10 and 2010-11, creating a total of 50 new positions.
| | | | | | | | | | |
| | | 2007-08
$’000 | | 2008-09
$’000 | | 2009-10
$’000 | | 2010-11
$’000 | | 2011-12
$’000 |
HIV/AIDS & STI Prevention | | — | | 2,000 | | 2,000 | | 2,000 | | 2,000 |
The Government will fund additional strategies to address the increasing burden of disease due to sexually transmitted infections, including HIV/AIDS. These strategies will enhance the capacity of clinical services and community-based organisations to engage people most at risk in education, prevention, early detection and treatment programs. Early detection and treatment of common sexually-transmissible infections will additionally have an extra benefit in reducing the number of new HIV infections.
| | | | | | | | | | |
| | | 2007-08
$’000 | | 2008-09
$’000 | | 2009-10
$’000 | | 2010-11
$’000 | | 2011-12
$’000 |
Oral Health and Fluoridation | | 500 | | 1,700 | | 100 | | 100 | | 100 |
The Government will provide funding for a training and education package for water treatment operators and funds to audit plants to ensure compliance with relevant legislation.
The Government will also provide funding for a comprehensive community awareness campaign regarding the role of water fluoridation in improving the oral health of Queenslanders.
| | | | | | | | | | |
| | | 2007-08
$’000 | | 2008-09
$’000 | | 2009-10
$’000 | | 2010-11
$’000 | | 2011-12
$’000 |
Healthy Hearing Program - Deadly Ears, Deadly Kids,
Deadly Communities | | — | | 1,400 | | 1,400 | | 1,400 | | — |
The Government will fund the development of services for Aboriginal and Torres Strait Islander children and young people (0-12 years) who experience a high incidence and prevalence of chronic Otitis Media (OM), and the development of skills to enhance service provision in the management of OM. Savings from the merging of the Service Delivery and Performance Commission with the Office of the Public Service Commissioner will be redirected towards the funding of this initiative. The capital component of this initiative can be found in Chapter 3 Capital Measures.
| | | | | | | | | | |
| | | 2007-08
$’000 | | 2008-09
$’000 | | 2009-10
$’000 | | 2010-11
$’000 | | 2011-12
$’000 |
Enhanced Maternity Care | | — | | 1,000 | | 2,000 | | 3,000 | | 3,000 |
The Government will provide funds to enhance maternity care in priority sites such as Ipswich and Logan. These improvements will provide improved health resources to at-risk population groups.
| | | | | | | | | | |
| | | 2007-08
$’000 | | 2008-09
$’000 | | 2009-10
$’000 | | 2010-11
$’000 | | 2011-12
$’000 |
Toowoomba Hospital Community-Based Care Services | | — | | 950 | | — | | — | | — |
The Government will fund a trial program to ensure that community-based care is delivered wherever possible and to coordinate care for complex patient needs. These funds will help reduce the burden on acute beds in the hospital. The capital component of this initiative can be found in Chapter 3 Capital Measures.
309
| | | | | | | | | | |
| | | 2007-08
$’000 | | 2008-09
$’000 | | 2009-10
$’000 | | 2010-11
$’000 | | 2011-12
$’000 |
Neonatal Intensive Care Unit/Special Care Nursery | | — | | 660 | | 660 | | — | | — |
The Government will fund training to up-skill nurses and midwives to specialist nurses within neonatal intensive care and special care nurseries. Once trained, these nurses will provide expert clinical support in hospitals, support services to smaller regional hospitals and home based care programs.
Infrastructure and Planning
| | | | | | | | | | |
| | | 2007-08
$’000 | | 2008-09
$’000 | | 2009-10
$’000 | | 2010-11
$’000 | | 2011-12
$’000 |
Urban Land Development Authority | | 6,300 | | 9,500 | | 9,500 | | — | | — |
The Government is providing funding for the operation of the Urban Land Development Authority (ULDA). The ULDA was established in late 2007 as part of the Queensland Housing Affordability Strategy with $25.3 million allocated over three years for its day-to-day functions.
| | | | | | | | | | |
| | | 2007-08
$’000 | | 2008-09
$’000 | | 2009-10
$’000 | | 2010-11
$’000 | | 2011-12
$’000 |
Queensland Housing Affordability Program | | 4,407 | | 7,788 | | 6,329 | | 6,321 | | 6,466 |
The Government is providing ongoing funding to progress the Queensland Housing Affordability Strategy. The Strategy represents a whole-of-Government strategic approach to the planning, development, land supply and infrastructure charging components of housing affordability.
| | | | | | | | | | |
| | | 2007-08
$’000 | | 2008-09
$’000 | | 2009-10
$’000 | | 2010-11
$’000 | | 2011-12
$’000 |
Water Plan and Resourcing for the SEQ Water Grid | | 4,457 | | 5,955 | | — | | — | | — |
The Government is providing funding of $10.4 million over two years for the ongoing planning and implementation of the reform of South East Queensland’s institutional arrangements for water management. The implementation of the regional water grid and associated water market commencing 1 July 2008 will enable water supply to urban communities and other users to be managed regionally through interconnected and diversified bulk water supply sources and transport pipelines.
| | | | | | | | | | |
| | | 2007-08
$’000 | | 2008-09
$’000 | | 2009-10
$’000 | | 2010-11
$’000 | | 2011-12
$’000 |
Smart City Master Plan | | 1,084 | | 1,916 | | 500 | | — | | — |
The Government is funding preparation of a Smart City Master Plan for Brisbane city with total funding of $3.5 million over three years, as announced in August 2007. This is a Smart State initiative in response to the “Smart Cities: rethinking the city centre” report released by the Smart State Council in 2007. The Smart City Master Plan is a strategic plan to align land use, transport and infrastructure with key knowledge and cultural precincts in inner Brisbane.
| | | | | | | | | | |
| | | 2007-08
$’000 | | 2008-09
$’000 | | 2009-10
$’000 | | 2010-11
$’000 | | 2011-12
$’000 |
Building Codes Queensland | | 780 | | 360 | | — | | — | | — |
The Government is funding Building Codes Queensland to implement a number of initiatives including the management of key water projects to provide water savings in accordance with new laws effective 1 January 2008, projects aimed at delivering energy savings in new and existing homes and the introduction of a new standard to manage the provision of temporary accommodation in high growth mining communities.
310
Justice and Attorney-General
| | | | | | | | | | |
| | | 2007-08
$’000 | | 2008-09
$’000 | | 2009-10
$’000 | | 2010-11
$’000 | | 2011-12
$’000 |
Office of the State Coroner | | 1,262 | | 1,757 | | 1,779 | | 1,800 | | 1,800 |
The Government is providing additional funding to enhance coronial services in Queensland including increased funding for operational costs associated with the performance of coronial autopsies. To address workload pressures in the South East Queensland and Far North Queensland regions, increased funding is provided for an additional Brisbane Coroner and support staff as well as funding for staff to support a new Cairns Coroner. The capital component of this initiative can be found in Chapter 3 Capital Measures.
| | | | | | | | | | |
| | | 2007-08
$’000 | | 2008-09
$’000 | | 2009-10
$’000 | | 2010-11
$’000 | | 2011-12
$’000 |
Road Safety Summit and Young Drivers Safety Initiatives | | 1,635 | | 759 | | 547 | | 273 | | — |
The Government is providing additional funding for the existing package of initiatives announced as part of the Road Safety Summit Outcomes. These funds will be utilised to cover an increase in the workload of the Magistrates courts throughout Queensland as a result of the initiatives aimed at reducing the Queensland road toll such as young drivers programs, immediate suspension of licences, random drug testing program and vehicle impoundment trial. The capital component of this initiative can be found in Chapter 3 Capital Measures.
| | | | | | | | | | |
| | | 2007-08
$’000 | | 2008-09
$’000 | | 2009-10
$’000 | | 2010-11
$’000 | | 2011-12
$’000 |
Confiscations Unit | | — | | 536 | | 558 | | 558 | | 558 |
The Government is providing additional funding to continue the operations of the Confiscations Unit. The funding will enable the Office of the Director of Public Prosections to conduct the legal and administrative processes necessary to confiscate proceeds of crime.
| | | | | | | | | | |
| | | 2007-08
$’000 | | 2008-09
$’000 | | 2009-10
$’000 | | 2010-11
$’000 | | 2011-12
$’000 |
Office of the Director of Public Prosecutions - Additional Prosecutors | | — | | 500 | | 1,000 | | 1,000 | | 1,000 |
The Government is providing additional funding to enable the Office of the Director of Public Prosecutions to engage three additional prosecutors in 2008-09. The funding for the following three financial years will enable the Office to further increase the number of prosecutors employed. Ongoing funding requirements will be determined as an early priority in 2008-09.
| | | | | | | | | | |
| | | 2007-08
$’000 | | 2008-09
$’000 | | 2009-10
$’000 | | 2010-11
$’000 | | 2011-12
$’000 |
Office of the Information Commissioner | | 267 | | 267 | | 267 | | 267 | | 267 |
The Government is providing additional funding to meet increased staffing costs and ongoing depreciation on leasehold improvements associated with the relocation of the Office to new premises. The Government has also provided additional funding to address ongoing business demands of the Office, including the restructure of the organisation and other staffing costs related to the ongoing internal maintenance of a new case management system, an upgrade of the Office online knowledge management system and a substantial redevelopment of the Office website.
311
| | | | | | | | | | |
| | | 2007-08
$’000 | | 2008-09
$’000 | | 2009-10
$’000 | | 2010-11
$’000 | | 2011-12
$’000 |
Dangerous Sexual Offenders | | 1,000 | | — | | — | | — | | — |
The Government is providing additional funding to assist with managing eligible dangerous prisoners who are released from jail. The additional funding will assist with associated medical and legal costs.
Legislative Assembly of Queensland
| | | | | | | | | | |
| | | 2007-08
$’000 | | 2008-09
$’000 | | 2009-10
$’000 | | 2010-11
$’000 | | 2011-12
$’000 |
Efficiency Upgrade of Air Conditioning Cooling Towers | | — | | 37 | | 37 | | 37 | | 37 |
The Government will provide funding for the acquisition and ongoing depreciation of replacement air conditioning cooling towers to improve the water and energy efficiency of the existing air conditioning system within the precinct. The capital component of this initiative can be found in Chapter 3 Capital Measures.
Local Government, Sport and Recreation
| | | | | | | | | | |
| | | 2007-08
$’000 | | 2008-09
$’000 | | 2009-10
$’000 | | 2010-11
$’000 | | 2011-12
$’000 |
Indigenous Alcohol Rehabilitation and Support Programs - CAPE Program | | — | | 1,900 | | 1,900 | | 1,900 | | 1,900 |
The Government will provide funding to the Queensland Police Citizens Youth Welfare Association to expand their Community Activity Program through Education program in remote Indigenous communities, providing these communities with access to improved sport, active recreation and cultural programs and activities. Other components of the package can be found in the Health and Communities portfolios.
| | | | | | | | | | |
| | | 2007-08
$’000 | | 2008-09
$’000 | | 2009-10
$’000 | | 2010-11
$’000 | | 2011-12
$’000 |
Indigenous Alcohol Rehabilitation and Support Programs - Revenue Replacement Package | | — | | 3,525 | | 3,525 | | 3,525 | | 3,525 |
The Government will provide funding to replace profits derived from the holding of general liquor licences by certain Indigenous Councils to ensure the continued delivery of local services to residents of those communities. Other components of the package can be found in the Health and Communities portfolios.
| | | | | | | | | | |
| | | 2007-08
$’000 | | 2008-09
$’000 | | 2009-10
$’000 | | 2010-11
$’000 | | 2011-12
$’000 |
Fluoride Capital Assistance Program | | — | | 6,350 | | 5,750 | | 7,500 | | 6,500 |
As announced in December 2007, the Government will provide funding to councils and other water service providers outside South East Queensland to assist with the full capital costs associated with fluoridation of public water supplies. Funding is also provided to engage a project manager to facilitate the supply and installation of fluoridation plant and equipment into water treatment plants.
| | | | | | | | | | |
| | | 2007-08
$’000 | | 2008-09
$’000 | | 2009-10
$’000 | | 2010-11
$’000 | | 2011-12
$’000 |
Springfield Town Centre Regional Park | | 5,000 | | 328 | | 266 | | 199 | | 128 |
The Government has agreed to contribute funding, in conjunction with the Ipswich City Council and Springfield Land Corporation, to the development of the Springfield Town Centre Regional Park. This development will provide important sporting and recreational infrastructure to the fast growing western corridor population and supplement existing infrastructure in the South East Corner.
312
| | | | | | | | | | |
| | | 2007-08
$’000 | | 2008-09
$’000 | | 2009-10
$’000 | | 2010-11
$’000 | | 2011-12
$’000 |
Moranbah Water Supply Allocation | | 90 | | 95 | | 100 | | 105 | | 110 |
The Government is providing funding to assist Isaac Regional Council in securing an affordable and appropriate supply of water which meets the needs of the residents and businesses of Moranbah.
| | | | | | | | | | |
| | | 2007-08
$’000 | | 2008-09
$’000 | | 2009-10
$’000 | | 2010-11
$’000 | | 2011-12
$’000 |
Home WaterWise Service Expansion | | 3,985 | | — | | — | | — | | — |
The Government is providing additional funding to further expand the very successful Home WaterWise Service to achieve a total of 224,000 retrofits in South East Queensland households, which will provide additional estimated water savings of 1.04 megalitres per day. It is planned for these retrofits to be completed by 31 December 2008. The Government has previously provided $30.6 million in funding to retrofit 206,187 homes with water efficient showerheads and tap aerators and repairs to leaking taps, equating to estimated water savings of approximately 11.8 megalitres per day. Elements of the Home Waterwise Service will be incorporated into the new ClimateSmart Homes Service (refer to the Queensland Climate Change Fund Dividend initiative).
| | | | | | | | | | |
| | | 2007-08
$’000 | | 2008-09
$’000 | | 2009-10
$’000 | | 2010-11
$’000 | | 2011-12
$’000 |
Local Government Reform | | 9,220 | | — | | — | | — | | — |
As announced last year, the Government is providing additional funding for the State-wide local government reform process which will result in more sustainable, efficient and financially strong councils with increased ability to deliver better services for communities. This package of reforms will deliver a progressive system of local government for Queensland - a system founded on improved service delivery, community-driven outcomes and community engagement and inclusiveness. This additional funding is part of the Government’s $27.1 million allocation to the transition process for councils which were amalgamated under the historic, State-wide reform to local government.
Mines and Energy
| | | | | | | | | | |
| | | 2007-08
$’000 | | 2008-09
$’000 | | 2009-10
$’000 | | 2010-11
$’000 | | 2011-12
$’000 |
Queensland Renewable Energy Fund | | 500 | | 20,500 | | 10,500 | | 10,500 | | 10,500 |
The Government will provide funding for the provision of grants and secured concessional loans to support renewable energy technologies progressing from the demonstration stage to commercialisation. The Queensland Renewable Energy Fund Program supports the development and deployment of technologies that are beyond proof of concept.
| | | | | | | | | | |
| | | 2007-08
$’000 | | 2008-09
$’000 | | 2009-10
$’000 | | 2010-11
$’000 | | 2011-12
$’000 |
Queensland Smart Energy Savings Fund | | 500 | | 12,500 | | 14,500 | | 14,500 | | 10,500 |
The Government will provide funding for the provision of grants and secured concessional loans to Queensland businesses to implement energy efficient technologies in buildings, appliances and industrial processes. The Smart Energy Savings Fund program will help conserve energy and deliver savings to Queensland businesses through reduced operation costs and improved production efficiency.
313
| | | | | | | | | | |
| | | 2007-08
$’000 | | 2008-09
$’000 | | 2009-10
$’000 | | 2010-11
$’000 | | 2011-12
$’000 |
Collingwood Park Compensation Package | | — | | 10,000 | | — | | — | | — |
The Government is providing funding for the repair of homes damaged by mining-related subsidence in Collingwood Park and for the purchase of damaged properties which are unsafe and cannot be economically repaired.
| | | | | | | | | | |
| | | 2007-08
$’000 | | 2008-09
$’000 | | 2009-10
$’000 | | 2010-11
$’000 | | 2011-12
$’000 |
Carbon Geosequestration Initiative | | 60 | | 3,240 | | 2,150 | | 2,350 | | 2,200 |
The Government will provide funding for the delivery of the Carbon Geosequestration initiative which will assess, evaluate and categorise geological sites in Queensland that have the potential for long-term, safe and secure storage of carbon dioxide emissions. These sites may store emissions from large-scale clean coal technology power plants, or other stationary energy emissions sources in the future.
| | | | | | | | | | |
| | | 2007-08
$’000 | | 2008-09
$’000 | | 2009-10
$’000 | | 2010-11
$’000 | | 2011-12
$’000 |
Climate Smart Homes Rebate Program | | 600 | | 2,300 | | 1,450 | | 1,450 | | 1,450 |
The Government will provide funding for the provision of financial incentives to households and small businesses located in isolated and remote areas of the State to undertake energy conservation measures. The Climate Smart Homes Rebate Program will provide rebates for installing greenhouse-friendly hot water systems, replacing damaged refrigeration seals, decommissioning second energy inefficient refrigerators, and installing insulation and compact fluorescent light bulbs.
| | | | | | | | | | |
| | | 2007-08
$’000 | | 2008-09
$’000 | | 2009-10
$’000 | | 2010-11
$’000 | | 2011-12
$’000 |
Safety and Health Initiative | | — | | 1,750 | | 3,514 | | 3,357 | | 3,362 |
The Government will provide additional funding for a number of initiatives to enhance the delivery of safety and health services to the mining industry. These relate to the implementation of the recommendations of the review into the content and communication effectiveness of the Queensland Mines and Quarries Annual Safety Performance and Health Report, additional mining inspectors and an investigator and additional specialist staff at the Safety in mines testing and research station.
| | | | | | | | | | |
| | | 2007-08
$’000 | | 2008-09
$’000 | | 2009-10
$’000 | | 2010-11
$’000 | | 2011-12
$’000 |
Petroleum and Gas Inspectors | | — | | 548 | | 722 | | 728 | | 734 |
The Government will provide additional funding to enhance the service delivery capacity of the Petroleum and Gas Inspectorate. Employing additional specialist staff will ensure that the frequency of industry monitoring and coverage of inspections and audits will maintain effectiveness as the gas industry continues to grow in size and complexity.
Natural Resources and Water
| | | | | | | | | | |
| | | 2007-08
$’000 | | 2008-09
$’000 | | 2009-10
$’000 | | 2010-11
$’000 | | 2011-12
$’000 |
Caring for our Country | | — | | 17,200 | | — | | — | | — |
Bilateral agreements between the State and the Australian Government on a number of initiatives including the National Action Plan for Salinity and Water Quality, the Reef Rescue Plan and implementation of the Natural
314
Heritage Trust on Cape York expire on 30 June 2008. The Government is providing $17.2 million for interim State regional natural resource management activities pending finalisation of a bilateral agreement with the Australian Government on Caring for our Country.
| | | | | | | | | | |
| | | 2007-08
$’000 | | 2008-09
$’000 | | 2009-10
$’000 | | 2010-11
$’000 | | 2011-12
$’000 |
Assessment of Applications under the Vegetation Management Framework | | 847 | | 3,307 | | �� | | — | | — |
The Government is providing funding of $4.2 million over two years commencing 2007-08 to continue implementation of the vegetation management framework, which provides for developing and implementing policy and improving vegetation management assessment activities. The funds will address issues identified in the Blueprint for the Bush ‘Review of the Administrative Implementation Arrangements of the Vegetation Management Act’. These include improving vegetation mapping products, incorporating vegetation interests in regional planning processes to provide certainty for both biodiversity and urban development, and simplifying vegetation clearing assessment processes.
| | | | | | | | | | |
| | | 2007-08
$’000 | | 2008-09
$’000 | | 2009-10
$’000 | | 2010-11
$’000 | | 2011-12
$’000 |
Implementation of Cape York Peninsula Heritage Act 2007 Land Dealings | | 1,880 | | 2,700 | | 2,514 | | 2,246 | | 1,540 |
The Government is providing funding of $1.88 million in 2007-08 and $9 million over four years commencing 2008-09 for the implementation of the Cape York Peninsula Heritage Act 2007, which provides a process for the protection of the conservation values on Cape York as well as providing economic opportunities for Indigenous people in the Cape York Peninsula region. This funding will also support the tenure resolution process for additional State land dealings and national park properties included in the joint management model prescribed by the Act.
| | | | | | | | | | |
| | | 2007-08
$’000 | | 2008-09
$’000 | | 2009-10
$’000 | | 2010-11
$’000 | | 2011-12
$’000 |
Maintenance of Non-Commercial Water Assets | | — | | 1,765 | | 349 | | 340 | | — |
The department is responsible for the administration of a group of major non-commercial water infrastructure assets including weirs, dams and a water pipeline. The Government will provide additional funding of $2.5 million over three years for significant repairs to and continued maintenance of these assets.
| | | | | | | | | | |
| | | 2007-08
$’000 | | 2008-09
$’000 | | 2009-10
$’000 | | 2010-11
$’000 | | 2011-12
$’000 |
Environmental Offsets Exchange Facility | | 769 | | 1,348 | | — | | — | | — |
The Government is providing funding of $2.1 million over two years to develop a service designed to facilitate the identification of environmental offsets, initially for vegetation and koala habitat offsets.
| | | | | | | | | | |
| | | 2007-08
$’000 | | 2008-09
$’000 | | 2009-10
$’000 | | 2010-11
$’000 | | 2011-12
$’000 |
Improved Land Management in Indigenous Communities | | 760 | | 680 | | 430 | | 200 | | 200 |
The Government is providing funding of $2.3 million over five years to improve the administrative capacity and land management skills of Indigenous Councils and Land Trusts and to implement tenure reforms. These initiatives will promote economic development and the provision of essential infrastructure on Aboriginal and Torres Strait Islander lands.
315
Police
| | | | | | | | | | |
| | | 2007-08
$’000 | | 2008-09
$’000 | | 2009-10
$’000 | | 2010-11
$’000 | | 2011-12
$’000 |
CCTV in Police Stations in DOGIT Communities | | 498 | | 1,330 | | 1,335 | | 1,335 | | 1,335 |
The Government is providing funding for the upgrade of closed circuit television digital recording equipment at police facilities in Deed of Grant in Trust (DOGIT) communities (Woorabinda, Aurukun and Palm Island). It will improve the ‘in custody’ management of Indigenous persons and provide independent evidence for investigations into serious incidents occurring in custody.
| | | | | | | | | | |
| | | 2007-08
$’000 | | 2008-09
$’000 | | 2009-10
$’000 | | 2010-11
$’000 | | 2011-12
$’000 |
Road Safety Summit and Young Drivers Safety Initiatives | | 1,365 | | 165 | | — | | 2,936 | | — |
The Government is providing additional funding for the existing package of initiatives announced as part of the Road Safety Summit Outcomes. This program encompasses roadside drug testing, immediate suspension (known as the ‘Enough is Enough’ road safety campaign), and an Integrated Traffic Management System (an automated intelligence based traffic enforcement scheduling system).
| | | | | | | | | | |
| | | 2007-08
$’000 | | 2008-09
$’000 | | 2009-10
$’000 | | 2010-11
$’000 | | 2011-12
$’000 |
Assault Reduction Campaign | | 500 | | — | | — | | — | | — |
The Government funded a State-wide implementation of the Assault Reduction Campaign to build on the results of a trial undertaken in the North Coast Police Region, through an increased emphasis on youth violence; the impact and consequences of violent choices; and the Party Safe program.
| | | | | | | | | | |
| | | 2007-08
$’000 | | 2008-09
$’000 | | 2009-10
$’000 | | 2010-11
$’000 | | 2011-12
$’000 |
Fixed Speed Camera Project | | 594 | | — | | — | | — | | — |
The Government funded the implementation of three wet film fixed speed cameras in 2008. This was an outcome of the Road Safety Summit initiatives to improve Queensland’s road safety performance. Site selection for these fixed speed cameras in Queensland was based on crash history and site suitability for available technologies. Fixed speed cameras are well signed and located on the Story Bridge, the Bruce Highway at Burpengary and the Ml at Tarragindi. Operational costs in 2008-09 and later years are to be funded through the Camera Detected Offence Program. The capital component of this initiative can be found in Chapter 3 Capital Measures.
Premier and Cabinet
| | | | | | | | | | |
| | | 2007-08
$’000 | | 2008-09
$’000 | | 2009-10
$’000 | | 2010-11
$’000 | | 2011-12
$’000 |
Smart State Strategy | | — | | 25,000 | | 30,000 | | 30,000 | | 35,000 |
The Government has allocated $120 million over four years for the 2008 Smart State Strategy. The Strategy will focus on attracting and retaining researchers, developing and commercialising ideas as well as encouraging collaboration between industry and research sectors.
The significant initiatives included in this investment are:
| | • | | $23.3 million for the Innovation Skills Fund to support more researchers in research institutes and industry-research exchanges |
| | • | | $25 million for the Health and Medical Research Program to attract clinicians, health professionals and researchers to translate research into better health services |
316
| | • | | $60 million for the Innovation Projects Fund to support collaborations between institutions and industry |
| | • | | $3 million for Designing Queensland to increase the profile of Queensland design expertise and lift industry competitiveness through design. |
| | | | | | | | | | |
| | | 2007-08
$’000 | | 2008-09
$’000 | | 2009-10
$’000 | | 2010-11
$’000 | | 2011-12
$’000 |
Cape York Welfare Reform Initiative | | 3,257 | | 9,968 | | 8,925 | | 8,925 | | 8,925 |
The Government will contribute funding to support a commitment to implementing the Cape York Welfare Reform Initiative, a partnership between four Aboriginal communities on Cape York, the Australian Government, the Queensland Government and the Cape York Institute for Policy and Leadership. Community leaders and government agencies will work together to rebuild social norms in the communities and to support individuals to resume primary responsibility for the wellbeing of their family and their community.
| | | | | | | | | | |
| | | 2007-08
$’000 | | 2008-09
$’000 | | 2009-10
$’000 | | 2010-11
$’000 | | 2011-12
$’000 |
Commission for Children and Young People and Child Guardian - Community Visitor Program | | — | | 1,000 | | 1,000 | | 1,000 | | 1,000 |
The Government is providing additional funds to meet the service demands within the comprehensive visitation and systemic monitoring program for Queensland children living in alternative care. This program involves community visitors regularly visiting, supporting and reporting on the safety and wellbeing of these children. With this additional funding, these children will have greater access to Community Visitors, particularly in remote and Indigenous communities, and enhanced facilities to resolve concerns and grievances quickly. The capital component of this initiative can be found in Chapter 3 Capital Measures.
| | | | | | | | | | |
| | | 2007-08
$’000 | | 2008-09
$’000 | | 2009-10
$’000 | | 2010-11
$’000 | | 2011-12
$’000 |
Regional Parliament | | — | | 550 | | — | | — | | — |
The Government will host a regional parliament sitting once a term as endorsed by the Legislative Assembly. The Far North Queensland Regional Sitting of Parliament will be held in Cairns on 28 – 30 October 2008. Regional sittings are part of the Government’s continuing commitment to ensuring greater public access to the Parliament. The community are invited to attend the proceedings and also to participate in other activities which accompany the sitting.
Primary Industries and Fisheries
| | | | | | | | | | |
| | | 2007-08
$’000 | | 2008-09
$’000 | | 2009-10
$’000 | | 2010-11
$’000 | | 2011-12
$’000 |
Western Hardwoods Plantation | | — | | 5,600 | | 5,800 | | 6,000 | | 6,100 |
The Government will provide additional funding or $44.6 million over seven years for the establishment of State-owned hardwood sawlog plantations as part of the Western Hardwoods Plan.
| | | | | | | | | | |
| | | 2007-08
$’000 | | 2008-09
$’000 | | 2009-10
$’000 | | 2010-11
$’000 | | 2011-12
$’000 |
National Red Imported Fire Ant Eradication Program | | 1,278 | | 975 | | — | | — | | — |
Funding is being provided for surveillance, treatment and containment measures across areas of South East Queensland where the ants have been detected. The Australian Government and other state and territory governments are partly funding this program in accordance with national cost-sharing arrangements. Total funding for this program is $14.7 million in 2007-08 and $11 million in 2008-09.
317
| | | | | | | | | | |
| | | 2007-08
$’000 | | 2008-09
$’000 | | 2009-10
$’000 | | 2010-11
$’000 | | 2011-12
$’000 |
Drought Relief Assistance Scheme | | 8,000 | | — | | — | | — | | — |
The Government funded assistance to those affected by severe climatic conditions across the State. Freight subsidy assistance was provided for fodder transport, transport of stock drinking water, livestock returning from agistment and restocking post-drought. An additional $3 million was provided for the scheme, bringing the assistance package to $11 million in 2007-08. Funding in later years will be dependent upon drought circumstances and is appropriated based on actual expenses.
| | | | | | | | | | |
| | | 2007-08
$’000 | | 2008-09
$’000 | | 2009-10
$’000 | | 2010-11
$’000 | | 2011-12
$’000 |
Eradication of Equine Influenza | | 4,328 | | — | | — | | — | | — |
Funding was provided for the eradication of Equine Influenza (EI). The Commonwealth and other state and territory governments partly funded this program in accordance with national cost-sharing arrangements. Total funding for this program within Queensland is estimated at $38.8 million. Assistance was also provided to assist small business impacted by the EI outbreak in the form of a non-repayable interest subsidy payment.
| | | | | | | | | | |
| | | 2007-08
$’000 | | 2008-09
$’000 | | 2009-10
$’000 | | 2010-11
$’000 | | 2011-12
$’000 |
Exceptional Circumstances Primary Producer and Small Business Interest Subsidies | | 13,139 | | — | | — | | — | | — |
Funding was provided to primary producers and small businesses affected by adverse seasonal conditions arising from drought.
Public Works
| | | | | | | | | | |
| | | 2007-08
$’000 | | 2008-09
$’000 | | 2009-10
$’000 | | 2010-11
$’000 | | 2011-12
$’000 |
Government Employee Housing Maintenance | | — | | 2,000 | | 2,000 | | 2,000 | | 2,000 |
The Government is providing additional funding of $2 million per annum to meet priority maintenance of Government employee houses in rural and remote areas of Queensland.
Tourism, Regional Development and Industry
| | | | | | | | | | |
| | | 2007-08
$’000 | | 2008-09
$’000 | | 2009-10
$’000 | | 2010-11
$’000 | | 2011-12
$’000 |
Queensland Brain Institute | | — | | 6,500 | | 3,000 | | 2,000 | | 1,000 |
Research conducted at the Queensland Brain Institute at the University of Queensland focuses on the discovery of cellular and molecular mechanisms which underlie the ability of the adult brain to generate new nerve cells and form new functional connections. The Queensland Government has committed an additional $12.5 million to supplement the $12.5 million allocated from the Innovation Project Fund to the Queensland Brain Institute to meet ongoing operational costs of the facility for the period 2007-08 to 2011-12.
| | | | | | | | | | |
| | | 2007-08
$’000 | | 2008-09
$’000 | | 2009-10
$’000 | | 2010-11
$’000 | | 2011-12
$’000 |
Institute of Glycomics | | 6,000 | | 4,000 | | — | | — | | — |
The Queensland Government contributed $8 million to construct the Institute for Glycomics in 2001 at the Griffith University’s Gold Coast Campus. The Institute’s research involves the study of the glycans and glycan- binding proteins in various biological systems leading to the design of new drugs and vaccines. Griffith
318
University is expanding the Institute for Glycomics to become a world class institute in the field of glycomics. The Queensland Government is contributing $10 million over the two years to 2008-09, with matching funding from Griffith University, toward the construction costs of an expanded facility.
Transport
| | | | | | | | | | |
| | | 2007-08
$’000 | | 2008-09
$’000 | | 2009-10
$’000 | | 2010-11
$’000 | | 2011-12
$’000 |
TransLink Network Plan | | — | | 14,322 | | 33,203 | | 50,100 | | 70,741 |
The Government will provide additional funding of $168.4 million over the next four years for additional public transport services as part of the TransLink Network Plan. This additional funding will address growth in passenger demand for public transport and provide an improved level of services in key growth corridors, including the introduction of 90 new buses in the Brisbane area.
| | | | | | | | | | |
| | | 2007-08
$’000 | | 2008-09
$’000 | | 2009-10
$’000 | | 2010-11
$’000 | | 2011-12
$’000 |
Congestion Management Strategy | | — | | 10,000 | | 10,000 | | 10,000 | | 10,000 |
The Government will provide an additional $40 million over four years to address increased level of congestion. These funds will provide programs to alter travel behaviour, promote strategies to spread peak hour demand and provide end-of-trip facilities to promote walking and cycling. This measure is part of a wider Government strategy to reduce congestion.
| | | | | | | | | | |
| | | 2007-08
$’000 | | 2008-09
$’000 | | 2009-10
$’000 | | 2010-11
$’000 | | 2011-12
$’000 |
SchoolBUS Upgrade Scheme | | — | | 5,000 | | 5,000 | | — | | — |
The Government will provide additional funding of $10 million over two years to upgrade school buses. These additional funds will extend the current program of bus replacement to meet rollover compliant standards.
| | | | | | | | | | |
| | | 2007-08
$’000 | | 2008-09
$’000 | | 2009-10
$’000 | | 2010-11
$’000 | | 2011-12
$’000 |
Road Safety Summit and Young Driver Safety Initiatives | | 8,025 | | 1,948 | | 1,539 | | 6,136 | | — |
The Government is providing additional funding for the existing package of initiatives announced as part of the Road Safety Summit Outcomes. This package encompasses funding to meet the cost of implementing committed Road Safety Summit initiatives including Hazard Perception Testing, which is to be introduced from 1 July 2008, as well as the finalisation of the Young Driver initiatives, including automation of logbooks and exemption processing.
| | | | | | | | | | |
| | | 2007-08
$’000 | | 2008-09
$’000 | | 2009-10
$’000 | | 2010-11
$’000 | | 2011-12
$’000 |
Recreational Boating Infrastructure - Operations and Maintenance | | — | | 712 | | 5,960 | | 6,448 | | 6,960 |
The Government will fund the operations and maintenance of new recreational boating facilities. These funds will ensure that future infrastructure demands can be met as the recreational boating population continues to grow. The capital component of this initiative can be found in Chapter 3 Capital Measures. The revenue component of this measure can be found in Chapter 4 Revenue Measures.
319
Treasury
| | | | | | | | | | |
| | | 2007-08
$’000 | | 2008-09
$’000 | | 2009-10
$’000 | | 2010-11
$’000 | | 2011-12
$’000 |
Revenue Management System Release 3 | | — | | 5,722 | | 4,871 | | 4,811 | | 5,217 |
The Government will provide funding to progress the development of the Revenue Management System Release 3 to incorporate land tax, fuel subsidy and Community Ambulance Cover with capability to support whole-of-Government grants and revenue management initiatives. The capital component of this initiative can be found in Chapter 3 Capital Measures.
| | | | | | | | | | |
| | | 2007-08
$’000 | | 2008-09
$’000 | | 2009-10
$’000 | | 2010-11
$’000 | | 2011-12
$’000 |
South East Queensland Water Reform Transaction Implementation | | 15,855 | | 5,367 | | — | | — | | — |
The Government is providing funding to implement the institutional reform of urban water supply arrangements in South East Queensland, as recommended by the Queensland Water Commission. The implementation of these reforms includes undertaking comprehensive due diligence on councils’ and other water entities’ bulk water assets and treatment plants transferring to the State, as well as establishing new State entities to own the assets. The reforms will deliver an integrated industry structure to improve water management and coordination across the region.
| | | | | | | | | | |
| | | 2007-08
$’000 | | 2008-09
$’000 | | 2009-10
$’000 | | 2010-11
$’000 | | 2011-12
$’000 |
Responsible Gambling Strategy | | 511 | | 5,106 | | 27 | | — | | — |
The Government is providing funding for the Queensland Responsible Gambling Strategy. This funding is for the presentation of meaningful player information and responsible gambling signage flow-on and for the evaluation of teaching resources and the broader strategy. Additional funding for gambling help services is also included.
| | | | | | | | | | |
| | | 2007-08
$’000 | | 2008-09
$’000 | | 2009-10
$’000 | | 2010-11
$’000 | | 2011-12
$’000 |
Increased Tax Compliance | | — | | 4,840 | | 4,550 | | 4,540 | | 4,540 |
The Government will provide additional funding to increase compliance activity and to ensure taxpayers are meeting their obligations and receiving their correct entitlements under the relevant tax legislations.
| | | | | | | | | | |
| | | 2007-08
$’000 | | 2008-09
$’000 | | 2009-10
$’000 | | 2010-11
$’000 | | 2011-12
$’000 |
Liquor Reform - Licence Fees Restructure & Building Safer Drinking Cultures | | 951 | | 3,845 | | — | | — | | — |
As decided in the Mid Year Review, the Government is providing funding to contribute to liquor reform in Queensland. The reform addresses the critical issue of harm reduction related to the use and abuse of alcohol and it consists of three strategies - legislative amendments for the sale and supply of liquor; liquor licence type and fee restructure; and the “Building Safer Drinking Cultures” social marketing campaign. The revenue component of this initiative can be found in Chapter 4 Revenue Measures.
| | | | | | | | | | |
| | | 2007-08
$’000 | | 2008-09
$’000 | | 2009-10
$’000 | | 2010-11
$’000 | | 2011-12
$’000 |
Pay-roll Tax Harmonisation Implementation | | 1,368 | | 968 | | 702 | | 702 | | 702 |
The Government is providing funding for administrative changes to support the implementation of measures recommended by the Inter-jurisdictional Consistency Project and alignment of a number of areas of
320
Queensland’s pay-roll tax legislation with other jurisdictions to increase consistency in the application of pay-roll tax and to minimise cross-border business costs.
| | | | | | | | | | |
| | | 2007-08
$’000 | | 2008-09
$’000 | | 2009-10
$’000 | | 2010-11
$’000 | | 2011-12
$’000 |
Fuel Subsidy Commission of Inquiry | | 2,025 | | 370 | | — | | — | | — |
The Government funded a Commission of Inquiry to investigate the extent to which the full 8.354 cents per litre fuel subsidy is being passed through to Queensland motorists, and to recommend improvements to the Queensland Fuel Subsidy Scheme.
The Government is providing funding to implement the Government’s response to the Commission’s findings and to ensure Queensland motorists receive the full benefit of the subsidy and to investigate alleged fraud. Changes to the Scheme will be implemented in 2008-09 and will include the development of client education and compliance programs and the enhancement of systems.
| | | | | | | | | | |
| | | 2007-08
$’000 | | 2008-09
$’000 | | 2009-10
$’000 | | 2010-11
$’000 | | 2011-12
$’000 |
Grants to Queensland Rural Adjustment Authority for Cyclone Larry | | 3,771 | | — | | — | | — | | — |
The Government provided grants to victims of Cyclone Larry. This program ended in December 2007 and the 2007-08 amount represents the final payments under this scheme.
| | | | | | | | | | |
| | | 2007-08
$’000 | | 2008-09
$’000 | | 2009-10
$’000 | | 2010-11
$’000 | | 2011-12
$’000 |
Grants to Queensland Rural Adjustment Authority for Special Disaster Flood Assistance | | 20,000 | | — | | — | | — | | — |
The Government provided grants under the Special Disaster Flood Assistance Scheme to families hit by the impact of severe flooding in regional Queensland. The Scheme is partly funded by the Commonwealth Government.
| | | | | | | | | | | | | | |
| | | 2007-08
$’000 | | 2008-09
$’000 | | | 2009-10
$’000 | | | 2010-11
$’000 | | | 2011-12
$’000 | |
First Home Owners Grant - Change in Eligibility | | — | | (320 | ) | | (685 | ) | | (733 | ) | | (784 | ) |
The Government will limit eligibility for the $7,000 First Home Owners Grant to first home buyers purchasing a home valued below $1 million. The measure applies from 1 January 2009. Refer to Budget Paper No. 2 - Budget Strategy and Outlook for more detail.
| | | | | | | | | | |
| | | 2007-08
$’000 | | 2008-09
$’000 | | 2009-10
$’000 | | 2010-11
$’000 | | 2011-12
$’000 |
Whole-of-Government Prevention and Early Intervention Incentives Pool | | — | | 10,000 | | 20,000 | | 20,000 | | 20,000 |
The Government is providing funding for the establishment of an incentives pool for prevention and early intervention initiatives. The pool will enable innovative projects to be funded on a contestable basis in areas where there is potential to improve outcomes and reduce longer-term costs to both individuals and Government. This is a centrally held provision.
321
| | | | | | | | | | | | | | |
| | | 2007-08
$’000 | | 2008-09
$’000 | | | 2009-10
$’000 | | | 2010-11
$’000 | | | 2011-12
$’000 | |
Whole-of-Government Productivity Dividend | | — | | (60,000 | ) | | (80,000 | ) | | (80,000 | ) | | (80,000 | ) |
In March 2008, the Government announced the introduction of a productivity dividend for implementation by State Government agencies. The savings from the productivity dividend are being redirected to enhance frontline services such as health and education. Agencies must ensure that savings do not impact on frontline service delivery staff or activities.
3. CAPITAL MEASURES
Introduction
The following tables present the relevant portfolio capital measures relating to decisions taken since the 2007-08 Budget. This does not represent the full amount of additional funding provided to agencies since the 2007-08 Budget. For further explanation, refer to Explanation of Scope and Terms in Chapter 1.
Child Safety
| | | | | | | | | | |
| | | 2007-08
$’000 | | 2008-09
$’000 | | 2009-10
$’000 | | 2010-11
$’000 | | 2011-12
$’000 |
Additional Placements for Children Living Away from Home | | — | | 5,000 | | 5,000 | | 5,000 | | 5,000 |
In response to the increasing number of children and young people coming into care with extreme and complex needs, the Government will provide funding to establish 12 additional residential care facilities to suitably accommodate these children and young people. The department is also contributing $6.4 million over four years to this program. The expense component of this initiative can be found in Chapter 2 Expense Measures.
| | | | | | | | | | |
| | | 2007-08
$’000 | | 2008-09
$’000 | | 2009-10
$’000 | | 2010-11
$’000 | | 2011-12
$’000 |
Integrated Client Management System | | — | | 3,000 | | 3,500 | | 3,700 | | 1,000 |
Additional funding is provided to enhance the department’s ICT Integrated Client Management System. This sophisticated system provides child safety officers with State-wide access to comprehensive client information, as well as carer and therapeutic support details. More informed decision making will better facilitate the needs of children in care and in need of care. The expense component of this initiative can be found in Chapter 2 Expense Measures.
| | | | | | | | | | |
| | | 2007-08
$’000 | | 2008-09
$’000 | | 2009-10
$’000 | | 2010-11
$’000 | | 2011-12
$’000 |
Indigenous Community Residentials | | — | | — | | 3,300 | | 3,300 | | — |
The Government will provide additional funding to build four safe houses in the communities of Eastern Cape York, Torres Strait, Northern Peninsula Area (Bamaga, Seisia, New Mapoon, Umagico and Injinoo) and Mornington Island. These facilities will provide a safe place for Indigenous children during initial assessments and for longer term care. The expense component of this initiative can be found in Chapter 2 Expense Measures.
Communities
| | | | | | | | | | |
| | | 2007-08
$’000 | | 2008-09
$’000 | | 2009-10
$’000 | | 2010-11
$’000 | | 2011-12
$’000 |
Land Acquisition and Detailed Plan for Youth Detention Centre | | — | | 11,376 | | — | | — | | — |
The Government will provide additional funding for the department to purchase land and undertake a detailed plan for a facility to provide increased youth detention capacity in North Queensland. This matter will be subject to further consideration during 2008-09.
322
| | | | | | | | | | |
| | | 2007-08
$’000 | | 2008-09
$’000 | | 2009-10
$’000 | | 2010-11
$’000 | | 2011-12
$’000 |
Asset Management | | — | | 4,522 | | 2,167 | | — | | — |
The Government will provide additional capital and associated recurrent funding to the department to complete upgrades to the Brisbane Childrens’ Court and undertake upgrades and improvements to the Southern Outlook located at Boonah. These projects will be supplemented by departmental funding. The expense component of this initiative can be found in Chapter 2 Expense Measures.
| | | | | | | | | | |
| | | 2007-08
$’000 | | 2008-09
$’000 | | 2009-10
$’000 | | 2010-11
$’000 | | 2011-12
$’000 |
Integrated Client Management System | | 895 | | 1,734 | | 5,138 | | — | | — |
The Government is providing additional funding to the department to continue the implementation of an effective asset replacement strategy associated with the assets of the Integrated Client Management System (ICMS) project. Regular asset replacement is important to enable ICMS to continue effective protection and management of young people in the justice and protection systems. The expense component of this initiative can be found in Chapter 2 Expense Measures.
| | | | | | | | | | |
| | | 2007-08
$’000 | | 2008-09
$’000 | | 2009-10
$’000 | | 2010-11
$’000 | | 2011-12
$’000 |
Safe Havens | | — | | 500 | | 2,000 | | 2,300 | | — |
The Government will provide additional capital funding for three years for the Safe Havens initiative. This capital funding will provide non-residential facilities for children and young people affected by family violence in the communities of Cherbourg and Mornington Island. The expense component of this initiative can be found in Chapter 2 Expense Measures.
| | | | | | | | | | |
| | | 2007-08
$’000 | | 2008-09
$’000 | | 2009-10
$’000 | | 2010-11
$’000 | | 2011-12
$’000 |
Home Energy Emergency Assistance Scheme | | 475 | | — | | — | | — | | — |
The Government provided additional funding in 2007-08 for the purchase cost of a fit-for-purpose client information management system to administer the Scheme. This system (based on the Victorian model) effectively administers the grants process and provides appropriate levels of financial security and privacy for clients. The expense component of this initiative can be found in Chapter 2 Expense Measures.
Corrective Services
| | | | | | | | | | |
| | | 2007-08
$’000 | | 2008-09
$’000 | | 2009-10
$’000 | | 2010-11
$’000 | | 2011-12
$’000 |
South East Queensland Correctional Precinct at Gatton | | 37,500 | | 185,730 | | 182,023 | | 70,270 | | 5,050 |
The Government is providing funding for the first stage of the development of a correctional precinct near Gatton in South East Queensland, comprising central infrastructure and a correctional centre for women.
| | | | | | | | | | |
| | | 2007-08
$’000 | | 2008-09
$’000 | | 2009-10
$’000 | | 2010-11
$’000 | | 2011-12
$’000 |
Expansion of Lotus Glen Correctional Centre | | 7,000 | | 117,650 | | 200,000 | | 80,000 | | 36,000 |
The Government is providing funding for a 300 bed expansion and redevelopment at the Lotus Glen Correctional Centre in Far North Queensland.
323
| | | | | | | | | | |
| | | 2007-08
$’000 | | 2008-09
$’000 | | 2009-10
$’000 | | 2010-11
$’000 | | 2011-12
$’000 |
Accommodation for Offenders under DPSOA | | 350 | | 650 | | — | | 400 | | — |
The Government is providing funding to house offenders being supervised under the Dangerous Prisoners (Sexual Offenders) Act 2003.
Disability Services Queensland
| | | | | | | | | | |
| | | 2007-08
$’000 | | 2008-09
$’000 | | 2009-10
$’000 | | 2010-11
$’000 | | 2011-12
$’000 |
Investment in Early Intervention and Prevention | | — | | 2,000 | | 2,000 | | 2,000 | | 2,000 |
The Government will provide additional capital funding for information and communication technology systems that will support the expansion of direct service delivery and the development and implementation of a contemporary disability service system. Funding will support increased investment in early intervention and prevention; the Disability Services Queensland Information System; and other information technology priorities in Disability Services Queensland. The expense component of this initiative can be found in Chapter 2 Expense Measures.
Education, Training and the Arts
| | | | | | | | | | |
| | | 2007-08
$’000 | | 2008-09
$’000 | | 2009-10
$’000 | | 2010-11
$’000 | | 2011-12
$’000 |
Additional New Schools | | — | | 34,680 | | 4,335 | | 17,425 | | — |
The Government will provide funding to build two high priority new schools in the heavily growing Northern Gold Coast area. A new primary school will open in Western Oxenford and a new secondary school in Ormeau, for the start of the 2009 school year. These schools are in addition to seven new schools being proposed for delivery as part of a public private partnership and two new schools to be funded directly from the department’s capital program. The expense component of this initiative can be found in Chapter 2 Expense Measures.
| | | | | | | | | | |
| | | 2007-08
$’000 | | 2008-09
$’000 | | 2009-10
$’000 | | 2010-11
$’000 | | 2011-12
$’000 |
OneSchool | | 10,300 | | 20,900 | | — | | — | | — |
The Government is providing additional funding towards the development of a custom-built, school management software application (OneSchool). The centralised application will provide an enterprise-wide information management system for all Government schools. The expense component of this initiative can be found in Chapter 2 Expense Measures.
| | | | | | | | | | |
| | | 2007-08
$’000 | | 2008-09
$’000 | | 2009-10
$’000 | | 2010-11
$’000 | | 2011-12
$’000 |
Early Years/pre-Prep | | — | | 7,120 | | 14,375 | | — | | — |
The Government will provide funding to construct new or enhance existing facilities to support the provision of quality pre-Prep programs for children aged 3 1/2 to 4 1/2 years living in 35 Indigenous communities, under the Queensland Government’s Bound for Success education strategy. The expense component of this initiative can be found in Chapter 2 Expense Measures.
324
| | | | | | | | | | |
| | | 2007-08
$’000 | | 2008-09
$’000 | | 2009-10
$’000 | | 2010-11
$’000 | | 2011-12
$’000 |
Palm Island Senior Phase Options | | 700 | | — | | — | | — | | — |
The Government is providing additional funding to provide two additional classroom spaces, amenities building and a shade structure to support the continuation of the senior phase of learning trial on Palm Island.
| | | | | | | | | | |
| | | 2007-08
$’000 | | 2008-09
$’000 | | 2009-10
$’000 | | 2010-11
$’000 | | 2011-12
$’000 |
Queensland Skills Plan - Trade Campuses | | — | | — | | 25,000 | | 25,000 | | — |
As part of the Queensland Skills Plan the Government will provide additional funding for the development of specialist trade campuses in Acacia Ridge, Mackay and Townsville.
Education, Training and the Arts - Arts
| | | | | | | | | | |
| | | 2007-08
$’000 | | 2008-09
$’000 | | 2009-10
$’000 | | 2010-11
$’000 | | 2011-12
$’000 |
Queensland Performing Arts Centre Redevelopment | | 1,000 | | 33,000 | | — | | — | | — |
The Government is providing additional funding of $34 million over two years for priority redevelopment works at the Queensland Performing Arts Centre. This will fund theatre refurbishment, and additional disability and other access works.
Emergency Services
| | | | | | | | | | |
| | | 2007-08
$’000 | | 2008-09
$’000 | | 2009-10
$’000 | | 2010-11
$’000 | | 2011-12
$’000 |
Upgrading our Ambulance Fleet and Equipment | | — | | 2,460 | | 3,640 | | — | | — |
The Government will provide funding to accelerate the replacement of Queensland’s ambulance fleet and provide resources to equip extra ambulance officers in response to rapidly escalating demand. $6.1 million is provided for vehicles and equipment associated with additional ambulance staff.
Environmental Protection Agency
| | | | | | | | | | |
| | | 2007-08
$’000 | | 2008-09
$’000 | | 2009-10
$’000 | | 2010-11
$’000 | | 2011-12
$’000 |
Licencing under the EP Act and Enhanced Compliance | | — | | 1,000 | | 2,000 | | 1,000 | | — |
The Government will introduce an enhanced Environmentally Relevant Activity regulatory regime. This will enhance investigation and monitoring activities as well as an investment in technology and technical capability to manage environmental risks more holistically. Capital funding will allow for the acquisition and implementation of an integrated IT system to support regulatory efforts. The expense component of this initiative can be found in Chapter 2 Expense Measures. The revenue component of this initiative can be found in Chapter 4 Revenue Measures.
| | | | | | | | | | |
| | | 2007-08
$’000 | | 2008-09
$’000 | | 2009-10
$’000 | | 2010-11
$’000 | | 2011-12
$’000 |
Cape York Peninsula Heritage Act Tenure Resolution and National Park Development | | 102 | | 148 | | — | | — | | — |
The Government is providing funding for infrastructure (housing, road works, etc) to support the implementation of Indigenous Management Agreements. The expense component of this initiative can be found in Chapter 2 Expense Measures.
325
| | | | | | | | | | |
| | | 2007-08
$’000 | | 2008-09
$’000 | | 2009-10
$’000 | | 2010-11
$’000 | | 2011-12
$’000 |
Daintree National Park Land Acquisition to increase the Protected Estate | | 2,942 | | — | | — | | — | | — |
The Government provided funding for the Daintree rainforest program to acquire land north of the Daintree River to consolidate this World Heritage listed national park.
Health
| | | | | | | | | | |
| | | 2007-08
$’000 | | 2008-09
$’000 | | 2009-10
$’000 | | 2010-11
$’000 | | 2011-12
$’000 |
Southern Area Health Service Demand Management | | — | | 44,380 | | 62,531 | | 26,628 | | — |
The Government will provide funding to meet critical infrastructure needs including: Princess Alexandra Hospital helipad, three intensive care unit beds, additional special care nursery cots, Princess Alexandra Hospital Positron Emission Tomography (PET) scanner and radiation oncology bunkers and the Logan Annex development. The expense component of this initiative can be found in Chapter 2 Expense Measures.
| | | | | | | | | | |
| | | 2007-08
$’000 | | 2008-09
$’000 | | 2009-10
$’000 | | 2010-11
$’000 | | 2011-12
$’000 |
Central Area Health Service Demand Management | | — | | 36,660 | | 51,654 | | 21,996 | | — |
The Government will provide funding to meet critical infrastructure needs including a rural enhancement program that includes the replacement or refurbishment of facilities, a healthy ageing precinct that supports aged care beds and rehabilitation for older patients, a critical clinical infrastructure upgrade in Redcliffe Hospital and an oral health cluster in the Wide Bay area. The expense component of this initiative can be found in Chapter 2 Expense Measures.
| | | | | | | | | | |
| | | 2007-08
$’000 | | 2008-09
$’000 | | 2009-10
$’000 | | 2010-11
$’000 | | 2011-12
$’000 |
Northern Area Health Service Demand Management | | — | | 18,960 | | 26,715 | | 7,976 | | — |
The Government will provide funding to meet critical infrastructure needs including: regional accommodation, helipads in Innisfail, Cooktown, Wujal-Wujal and Torres and a renal dialysis unit in Mossman. The expense component of this initiative can be found in Chapter 2 Expense Measures.
| | | | | | | | | | |
| | | 2007-08
$’000 | | 2008-09
$’000 | | 2009-10
$’000 | | 2010-11
$’000 | | 2011-12
$’000 |
Cairns Base Hospital Redevelopment | | — | | 24,200 | | 21,800 | | 39,600 | | 147,400 |
The Government will fund the redevelopment and expansion of Cairns Base Hospital through the recently announced airport sales. The redevelopment is designed to meet the needs of the residents of Cairns and the surrounding catchment areas to 2021. The redevelopment will include construction of a new clinical block, a new hub for surgical and day beds and enhanced aged care and rehabilitation facilities and the purchase of land. Recurrent funding to support the expansion of Cairns Base Hospital will be sourced from future growth funding including the Australian Health Care Agreement.
| | | | | | | | | | |
| | | 2007-08
$’000 | | 2008-09
$’000 | | 2009-10
$’000 | | 2010-11
$’000 | | 2011-12
$’000 |
Mackay Hospital Redevelopment | | — | | 5,304 | | 57,390 | | 122,939 | | 118,067 |
The Government will fund the redevelopment and expansion of Mackay Base Hospital, through the recently announced airport sales. This project includes a new acute hospital, emergency department, outpatients departments, birthing suite and new staff residential accommodation. The expense component of this initiative can be found in Chapter 2 Expense Measures.
326
| | | | | | | | | | |
| | | 2007-08
$’000 | | 2008-09
$’000 | | 2009-10
$’000 | | 2010-11
$’000 | | 2011-12
$’000 |
Mount Isa Hospital Redevelopment | | — | | 8,000 | | 21,500 | | 21,400 | | 14,290 |
The Government will fund the redevelopment of Mount Isa Hospital through the recently announced airport sales. It will provide functional, high quality facilities to the public in this catchment area. The facilities will include an expanded emergency department and enable implementation of integrated primary, community and acute health services that will provide a foundation for the development of a Centre for Excellence in Rural and Remote Health. The expense component of this initiative can be found in Chapter 2 Expense Measures.
| | | | | | | | | | |
| | | 2007-08
$’000 | | 2008-09
$’000 | | 2009-10
$’000 | | 2010-11
$’000 | | 2011-12
$’000 |
Oral Health Queensland | | — | | 9,650 | | 3,000 | | 1,500 | | — |
The Government will provide funding for the procurement of nine new mobile dental clinics and refurbishment of the existing fleet to ensure compliance with national infection control guidelines and workplace health and safety legislation.
| | | | | | | | | | |
| | | 2007-08
$’000 | | 2008-09
$’000 | | 2009-10
$’000 | | 2010-11
$’000 | | 2011-12
$’000 |
Indigenous Alcohol Rehabilitation and Support Programs | | — | | 6,700 | | — | | — | | — |
The Government will fund the refurbishment or enhancement of alcohol and drug treatment facilities associated with the alcohol reform initiative. This initiative is part of a larger Government package to address the harm caused by alcohol and other substances. Other components can be found in the Communities and Local Government, Sport and Recreation portfolios. The expense component of this initiative can be found in Chapter 2 Expense Measures.
| | | | | | | | | | |
| | | 2007-08
$’000 | | 2008-09
$’000 | | 2009-10
$’000 | | 2010-11
$’000 | | 2011-12
$’000 |
Radiology Services Delivery | | — | | 2,407 | | 1,000 | | 500 | | — |
The Government will provide funds for investment in a Tele-Radiology Network and digital image acquisition and viewing hardware to improve diagnosis times and patient outcomes.
| | | | | | | | | | |
| | | 2007-08
$’000 | | 2008-09
$’000 | | 2009-10
$’000 | | 2010-11
$’000 | | 2011-12
$’000 |
Toowoomba Hospital Community-Based Care Services | | — | | 400 | | — | | — | | — |
The Government will fund a trial program to ensure that community-based care is delivered wherever possible and to coordinate care for complex patient needs. These funds will help reduce the burden on acute beds in the hospital. The expense component of this initiative can be found in Chapter 2 Expense Measures.
| | | | | | | | | | |
| | | 2007-08
$’000 | | 2008-09
$’000 | | 2009-10
$’000 | | 2010-11
$’000 | | 2011-12
$’000 |
Renal Services | | — | | 375 | | — | | — | | — |
The Government will provide additional funding to enhance renal services in Queensland. This initiative will provide a further expansion of chairs in satellite renal dialysis centres. The expense component of this initiative can be found in Chapter 2 Expense Measures.
327
| | | | | | | | | | |
| | | 2007-08
$’000 | | 2008-09
$’000 | | 2009-10
$’000 | | 2010-11
$’000 | | 2011-12
$’000 |
Healthy Hearing Program - Deadly Ears, Deadly Kids, Deadly Communities | | — | | 200 | | — | | — | | — |
The Government will fund diagnostic, screening and health education equipment and a mobile surgical unit as part of the initiative for Aboriginal and Torres Strait Islander children and young people (0-12 years) who experience a high incidence and prevalence of chronic Otitis Media (OM). Savings from the merging of the Service Delivery and Performance Commission with the Office of the Public Service Commissioner will be redirected towards the funding of this initiative. The expense component of this initiative can be found in Chapter 2 Expense Measures.
Justice and Attorney-General
| | | | | | | | | | |
| | | 2007-08
$’000 | | 2008-09
$’000 | | 2009-10
$’000 | | 2010-11
$’000 | | 2011-12
$’000 |
Brisbane Supreme and District Court Complex | | — | | 229,226 | | 200,000 | | 84,724 | | 70,000 |
The Government is providing funding for the construction of the new $600 million Brisbane Supreme and District Courthouse. The building will contain up to 47 courtrooms, jury facilities, judges chambers, the Supreme Court Library, registry and court support functions. The building will include high quality audio/visual facilities in all courts to allow vulnerable witnesses to give evidence remotely and for the presentation of evidence in modern formats.
| | | | | | | | | | |
| | | 2007-08
$’000 | | 2008-09
$’000 | | 2009-10
$’000 | | 2010-11
$’000 | | 2011-12
$’000 |
Road Safety Summit and Young Drivers Safety Initiatives | | — | | 431 | | — | | — | | — |
The Government will provide additional funding for the existing package of initiatives announced as part of the Road Safety Summit Outcomes. These initiatives are aimed at reducing the Queensland road toll by introducing programs such as young drivers initiatives, immediate suspension of licences, random drug testing program and vehicle impoundment trial. The funding arrangement will result in the enhancement of computer software systems and production of reports to enable analysis and determine the effectiveness of the introduced initiatives. The expense component of this initiative can be found in Chapter 2 Expense Measures.
| | | | | | | | | | |
| | | 2007-08
$’000 | | 2008-09
$’000 | | 2009-10
$’000 | | 2010-11
$’000 | | 2011-12
$’000 |
Office of the State Coroner | | 400 | | — | | — | | — | | — |
The Government is providing funding to relocate and refit the premises of the Cairns Magistrate Courthouse to adequately accommodate the establishment of an additional state coroner and other positions. These positions have been created to increase the quality and efficiency of coronial services in the Far North Queensland region. The expense component of this initiative can be found in Chapter 2 Expense Measures.
Legislative Assembly of Queensland
| | | | | | | | | | |
| | | 2007-08
$’000 | | 2008-09
$’000 | | 2009-10
$’000 | | 2010-11
$’000 | | 2011-12
$’000 |
Efficiency Upgrade of Air Conditioning Cooling Towers and Facilities Upgrade | | — | | 1,936 | | 618 | | — | | — |
The Government will provide funding for the upgrade of facilities infrastructure within the Parliamentary Annexe including the replacement of air conditioning cooling towers to improve water and energy efficiency, and the upgrade of existing toilet and shower facilities on levels 9 to 13 to improve functionality and address equitable access priorities. The expense component of this initiative can be found in Chapter 2 Expense Measures.
328
Main Roads
| | | | | | | | | | |
| | | 2007-08
$’000 | | 2008-09
$’000 | | 2009-10
$’000 | | 2010-11
$’000 | | 2011-12
$’000 |
Stages 1 and 2 Road Component: Darra to Springfield Transport Corridor | | 13,300 | | 124,200 | | 119,700 | | 79,100 | | 300 |
As announced in December 2007, the Government is providing funding to commence the road component of the Darra to Springfield Transport Corridor. Stage 1 of the project involves duplicating the Centenary Highway from two to four lanes at Richlands to meet with the existing Logan Motorway interchange at Carole Park and is due for completion in 2011. Stage 2 of the project, planned for delivery after completion of Stage 1, will include continuing the four lane Centenary Highway duplication to Springfield.
| | | | | | | | | | |
| | | 2007-08
$’000 | | 2008-09
$’000 | | 2009-10
$’000 | | 2010-11
$’000 | | 2011-12
$’000 |
Highway Improvements to Support the Bowen Basin Coalfields | | — | | 45,000 | | 85,000 | | 20,000 | | — |
The Government will provide funding to improve the road network in the Bowen Basin region to further support Central Queensland’s coal mining industry. Included in this funding package will be the realignment of the Dawson Highway at the Calliope Range, expected to be completed by 2011. Another major project will commence on the Leichhardt Highway, between Blowhard Creek and the Baralaba intersection, which will provide a new alignment and improved flood immunity at the Don River crossings. This is also expected to be completed by 2011.
Mines and Energy
| | | | | | | | | | |
| | | 2007-08
$’000 | | 2008-09
$’000 | | 2009-10
$’000 | | 2010-11
$’000 | | 2011-12
$’000 |
Information Systems Upgrade | | — | | 2,562 | | 250 | | — | | — |
The Government will provide additional funding for the upgrading of hardware and software for the Department of Mines and Energy’s critical customer service systems for interactive and online information. These systems are the Mineral and Energy Resources Location and Information Network, the Queensland Digital Exploration Reports System and the Interactive Resource and Tenure Maps System.
| | | | | | | | | | |
| | | 2007-08
$’000 | | 2008-09
$’000 | | 2009-10
$’000 | | 2010-11
$’000 | | 2011-12
$’000 |
Drill Core Facility Upgrade | | — | | 2,438 | | 1,110 | | 1,240 | | — |
The Government will fund the construction of a new drill core library facility at Mount Isa for the safe and secure storage of drill core samples. The new facility will accommodate the increasing supply of drill core samples from surrounding areas and will support the promotion of mining and exploration in the North West Mineral Province.
| | | | | | | | | | |
| | | 2007-08
$’000 | | 2008-09
$’000 | | 2009-10
$’000 | | 2010-11
$’000 | | 2011-12
$’000 |
Callide Oxyfuel Project | | 10,000 | | — | | — | | — | | — |
The Government provided funding to the Low Emissions Technology Project at Callide, led by CS Energy, to demonstrate the ‘oxy-fuel’ carbon capture technology on a commercial scale. This technology is capable of being retrofitted to existing coal-fired power stations. The Oxyfuel Project is part of a range of technologies which industry has embraced and is of strategic importance in securing a low carbon energy future for the State’s stationary energy sector.
329
| | | | | | | | | | |
| | | 2007-08
$’000 | | 2008-09
$’000 | | 2009-10
$’000 | | 2010-11
$’000 | | 2011-12
$’000 |
Simtars Building Upgrade | | — | | — | | 3,640 | | 3,760 | | — |
The Government will fund the construction of a new building at the Safety in mines testing and research station (Simtars), replacing existing demountable facilities. Funding is also provided to upgrade training facilities so that Simtars’ reputation as a provider of training services to the mining industry is maintained.
Natural Resources and Water
| | | | | | | | | | |
| | | 2007-08
$’000 | | 2008-09
$’000 | | 2009-10
$’000 | | 2010-11
$’000 | | 2011-12
$’000 |
Land Acquisitions for Future Water Infrastructure | | 7,500 | | 41,900 | | 26,200 | | — | | — |
The Government is providing funding of up to $75.6 million over three years commencing 2007-08 for the acquisition of properties for the Nathan and Connors River dams and other properties in water storage inundated areas.
Police
| | | | | | | | | | |
| | | 2007-08
$’000 | | 2008-09
$’000 | | 2009-10
$’000 | | 2010-11
$’000 | | 2011-12
$’000 |
Fixed Speed Camera Project | | 847 | | — | | — | | — | | — |
The Government funded the implementation of three wet film fixed speed cameras in 2008. This was an outcome of the Road Safety Summit initiatives to improve Queensland’s road safety performance. Site selection for these fixed speed cameras in Queensland was based on crash history and site suitability for available technologies. Fixed speed cameras are well signed and located on the Story Bridge, the Bruce Highway at Burpengary and the Ml at Tarragindi. The expense component of this initiative can be found in Chapter 2 Expense Measures.
| | | | | | | | | | |
| | | 2007-08
$’000 | | 2008-09
$’000 | | 2009-10
$’000 | | 2010-11
$’000 | | 2011-12
$’000 |
Traffic Accident 3D Scanning Equipment | | 630 | | — | | — | | — | | — |
The Government through the Smart Travel Choices Program for South East Queensland funded the purchase of 3D accident survey scanning equipment to use in traffic incident investigation. The use of this equipment means that traffic accidents can be investigated in less time, resulting in wreckage being removed and traffic flow restored promptly.
Premier and Cabinet
| | | | | | | | | | |
| | | 2007-08
$’000 | | 2008-09
$’000 | | 2009-10
$’000 | | 2010-11
$’000 | | 2011-12
$’000 |
South Bank Corporation - Expansion of the Brisbane Convention and Exhibition Centre | | 25,000 | | 76,000 | | 25,600 | | — | | — |
The Brisbane Convention and Exhibition Centre will be expanded by approximately 24,000 square metres of additional floor space. Key components of the expanded facility are 600 seat and 400 seat tiered plenary halls, breakout rooms, foyer/exhibition space, and ground floor restaurant and retail uses.
330
| | | | | | | | | | |
| | | 2007-08
$’000 | | 2008-09
$’000 | | 2009-10
$’000 | | 2010-11
$’000 | | 2011-12
$’000 |
South Bank Corporation - Development of a Stormwater Harvesting System | | 1,730 | | 2,870 | | — | | — | | — |
The Government will fund the construction of a system which is expected to meet 78% of South Bank Parkland’s irrigation and water feature needs. The installation includes a major stormwater diversion pit, including a collapsible weir to hold back river water and a large capacity stormwater harvesting pump, another 2 megalitre storage area and a primary treatment plant and reticulation system to pump Class A recycled water to the Parkland’s irrigation system and water features.
| | | | | | | | | | |
| | | 2007-08
$’000 | | 2008-09
$’000 | | 2009-10
$’000 | | 2010-11
$’000 | | 2011-12
$’000 |
Commission for Children and Young People and Child Guardian -Community Visitor Program | | — | | — | | 400 | | 500 | | — |
The Government is providing additional funds to further improve comprehensive visitation and systemic monitoring for Queensland children living in out-of-home care through enabling enhancements of the Community Visitor Information System which maintains a register of children requiring visits, allocates visits and manages reports. The expense component of this initiative can be found in Chapter 2 Expense Measures.
Public Works
| | | | | | | | | | |
| | | 2007-08
$’000 | | 2008-09
$’000 | | 2009-10
$’000 | | 2010-11
$’000 | | 2011-12
$’000 |
Purchase and Refurbishment of Mareeba Department of Primary Industries and Fisheries facility | | 5,000 | | 10,000 | | 500 | | — | | — |
The Government is funding the purchase and refurbishment of the Mareeba Government Office Building. The aim of the project is to provide an improved and efficient office accommodation for four Government agencies in Mareeba in line with the Mareeba Office Accommodation Strategy. The project is part of an overall regional strategy that will allow agencies to relocate and consolidate.
| | | | | | | | | | |
| | | 2007-08
$’000 | | 2008-09
$’000 | | 2009-10
$’000 | | 2010-11
$’000 | | 2011-12
$’000 |
Government Employee Housing Evaporative Air-conditioning Replacement | | — | | 1,600 | | 1,700 | | 1,800 | | 1,900 |
As part of a replacement program, the Government is providing funding to retrofit approximately 55 residences in rural and remote areas across the State that have existing failing evaporative units with split-system refrigerative units. The combined replacement of units that have reached the end of their useful life will realise significant savings generated through bulk procurement strategies.
| | | | | | | | | | |
| | | 2007-08
$’000 | | 2008-09
$’000 | | 2009-10
$’000 | | 2010-11
$’000 | | 2011-12
$’000 |
Roma Street Parkland Rainwater Tank | | 750 | | — | | — | | — | | — |
The Government is providing funding for the installation of a clean water tank, sterilisation and filtration system in the Roma Street Parklands located in Brisbane. The proposed tank, sterilisation and filtration system will overcome the current short-term risks associated with water quality and also assist with the provision of a long-term sustainable alternate water solution.
331
Transport
| | | | | | | | | | |
| | | 2007-08
$’000 | | 2008-09
$’000 | | 2009-10
$’000 | | 2010-11
$’000 | | 2011-12
$’000 |
Darra to Springfield Road and Rail Connection | | 32,542 | | 130,000 | | 130,000 | | 77,360 | | 200 |
The Government is funding the construction of the Darra to Springfield road and rail connection. Stage 1 will provide a dual rail line from Darra to a new station at Richlands including a park and ride facility, and duplication of the Centenary Highway to four lanes from Boundary Road to the existing Logan Motorway Interchange. The balance of the project will extend the rail line and duplicated highway to Springfield.
| | | | | | | | | | |
| | | 2007-08
$’000 | | 2008-09
$’000 | | 2009-10
$’000 | | 2010-11
$’000 | | 2011-12
$’000 |
Abbot Point - Equity Contribution | | — | | 50,000 | | 50,000 | | — | | — |
The Government will provide an equity injection to the Ports Corporation of Queensland, as a contribution toward the total cost of $818 million for the Abbot Point X50 Expansion, which will increase the capacity of the Abbot Point Terminal to 50 million tonnes per annum.
| | | | | | | | | | |
| | | 2007-08
$’000 | | 2008-09
$’000 | | 2009-10
$’000 | | 2010-11
$’000 | | 2011-12
$’000 |
Citytrain Station Upgrade Program - DDA Compliance | | — | | 12,000 | | — | | — | | — |
The Government will fund the Citytrain Station Upgrade Program in order to meet legislative obligations under the Disability Discrimination Act 1992 (Cth) and the Disability Standards for Accessible Public Transport 2002. This infrastructure program delivers essential accessibility improvements as well as critical upgrades of ageing assets and facilities to ensure the safe and effective operation of Citytrain rail stations.
| | | | | | | | | | |
| | | 2007-08
$’000 | | 2008-09
$’000 | | 2009-10
$’000 | | 2010-11
$’000 | | 2011-12
$’000 |
Albion Station Land Bridge | | — | | 11,000 | | — | | — | | — |
The Government will fund the construction of an eight metre wide land bridge over the rail corridor at Albion Station from a raised Albion Road. The Land Bridge will create a safe, pedestrian friendly connection over the rail corridor, serving both the local community and commuters accessing the station from both sides of the corridor.
| | | | | | | | | | |
| | | 2007-08
$’000 | | 2008-09
$’000 | | 2009-10
$’000 | | 2010-11
$’000 | | 2011-12
$’000 |
Northern Minerals Province - Driver Activated Points | | — | | 10,000 | | 20,000 | | 45,000 | | 32,000 |
Government will finance the project for a total of $107 million. The project involves enhancements to the rail system through the installation of driver activated points at 41 locations between Stuart and Mount Isa. The installation of the driver activated points will reduce transit time by up to two hours by allowing an increase in speed through the passing loop locations for trains not crossing or for the train with right of way during the crossing of another train.
| | | | | | | | | | |
| | | 2007-08
$’000 | | 2008-09
$’000 | | 2009-10
$’000 | | 2010-11
$’000 | | 2011-12
$’000 |
Recreational Boating Infrastructure | | — | | 6,202 | | 4,000 | | 4,000 | | 4,000 |
The Government will fund the construction of new recreational boating facilities. These funds will ensure that future infrastructure demands can be met as the recreational boating population continues to grow.
332
| | | | | | | | | | |
| | | 2007-08
$’000 | | 2008-09
$’000 | | 2009-10
$’000 | | 2010-11
$’000 | | 2011-12
$’000 |
Citytrain Rollingstock | | — | �� | 2,100 | | 11,200 | | 47,600 | | 101,000 |
The Government will fund further rollingstock purchases required to meet peak period patronage projections. A further 58 three car units will be acquired, comprising a mix of Interurban Multiple Units and Suburban Multiple Units. This provides for growth across the network in the morning peak.
Treasury
| | | | | | | | | | |
| | | 2007-08
$’000 | | 2008-09
$’000 | | 2009-10
$’000 | | 2010-11
$’000 | | 2011-12
$’000 |
Revenue Management System Release 3 | | — | | 17,547 | | — | | — | | — |
The Government will provide funding to progress the development of the Revenue Management System Release 3 to incorporate land tax, fuel subsidy and Community Ambulance Cover with capability to support whole-of-Government grants and revenue management initiatives. The expense component of this initiative can be found in Chapter 2 Expense Measures.
| | | | | | | | | | |
| | | 2007-08
$’000 | | 2008-09
$’000 | | 2009-10
$’000 | | 2010-11
$’000 | | 2011-12
$’000 |
Grants Management System | | — | | 562 | | — | | — | | — |
The Government will provide funding from the Gambling Community Benefit Fund accumulated surplus to develop a new grants management system for the Fund with enhanced governance, financial management, reporting and accountability capacity.
4. REVENUE MEASURES
Introduction
The following tables present the relevant portfolio revenue measures relating to decisions taken since the 2007-08 Budget. This does not represent the full amount of additional funding provided to agencies since the 2007-08 Budget. For further explanation, refer to Explanation of Scope and Terms in Chapter 1.
Environmental Protection Agency
| | | | | | | | | | |
| | | 2007-08
$’000 | | 2008-09
$’000 | | 2009-10
$’000 | | 2010-11
$’000 | | 2011-12
$’000 |
Licencing under the EP Act and Enhanced Compliance | | — | | 12,730 | | 26,430 | | 26,430 | | 26,430 |
The Government will introduce a new risk-based fee structure for Environmentally Relevant Activities (ERA) as part of an expanded State-wide compliance program in areas such as industrial estates and mines. The expanded program will enhance investigation and monitoring activities and will provide industry with a higher level of environmental service. The funds will be applied to ERA monitoring and compliance activities. The expense component of this initiative can be found in Chapter 2 Expense Measures. The capital component of this initiative can be found in Chapter 3 Capital Measures.
Mines and Energy
| | | | | | | | | | |
| | | 2007-08
$’000 | | 2008-09
$’000 | | 2009-10
$’000 | | 2010-11
$’000 | | 2011-12
$’000 |
State Royalty Reform Package | | — | | 594,000 | | 334,500 | | 335,500 | | 318,500 |
333
The Government will introduce a package of State royalty reforms. The measures will include the introduction of a two tier royalty rate for coal from 1 July 2008 and a new variable rate schedule for base and precious metals from 1 January 2011. Other measures include an update of royalty rates and thresholds. Refer to Budget Paper No. 2 - Budget Strategy and Outlook for more detail.
| | | | | | | | | | | | | | |
| | | 2007-08
$’000 | | 2008-09
$’000 | | | 2009-10
$’000 | | | 2010-11
$’000 | | | 2011-12
$’000 | |
State Royalty Reform Package - Allowance of ACALET Levy as Deduction | | — | | (7,000 | ) | | (3,500 | ) | | (3,500 | ) | | (3,500 | ) |
The Government will allow the levy paid by coal mining companies pursuant to the Clean Coal Technology Special Agreement Act 2007 as a deduction in determining coal mining royalty. The deduction will be allowed from the time of commencement of the agreement on 1 April 2007.
| | | | | | | | | | |
| | | 2007-08
$’000 | | 2008-09
$’000 | | 2009-10
$’000 | | 2010-11
$’000 | | 2011-12
$’000 |
Safety and Health Levy - Cost Recovery | | — | | 19,531 | | 26,041 | | 26,041 | | 26,041 |
The Government will introduce a levy on all coal and metalliferous mines and quarries in Queensland to recover the cost of safety and health services provided by the Department of Mines and Energy to the mining industry. Owing to the dangerous nature and specific health issues associated with mining, a number of health and safety services are provided on behalf of the mining industry. These services assist the Queensland mining industry to meet its target of ‘Zero Harm’.
| | | | | | | | | | |
| | | 2007-08
$’000 | | 2008-09
$’000 | | 2009-10
$’000 | | 2010-11
$’000 | | 2011-12
$’000 |
Government Explosives Reserves Fees - Cost Recovery | | — | | 1,200 | | 1,200 | | 1,200 | | 1,200 |
The Government will collect additional revenue for the provision of safe and secure storage of explosives and fireworks at the four Government explosives reserves. The service fee has been adjusted to reflect the actual cost for the storage and supervisory activities of these facilities.
Transport
| | | | | | | | | | |
| | | 2007-08
$’000 | | 2008-09
$’000 | | 2009-10
$’000 | | 2010-11
$’000 | | 2011-12
$’000 |
Recreational Boating Infrastructure - Registration Fees | | — | | 6,914 | | 9,960 | | 10,448 | | 10,960 |
Effective 1 October 2008, recreational vessel registration fees will be increased according to the vessel length. The increases will range from $15 for vessels up to 4.5 metres long to over $300 for very large vessels. Revenue from the fee will be used to provide, maintain and operate public recreational boating infrastructure. The expense component of this initiative can be found in Chapter 2 Expense Measures. The capital component of this measure can be found in Chapter 3 Capital Measures.
Treasury
| | | | | | | | | | |
| | | 2007-08
$’000 | | 2008-09
$’000 | | 2009-10
$’000 | | 2010-11
$’000 | | 2011-12
$’000 |
Transfer Duty - Rate and Threshold Changes | | — | | 74,600 | | 72,500 | | 68,500 | | 58,100 |
The Government is adjusting the State’s transfer duty rates to assist people entering the housing market. Comprehensive reform of the transfer duty regime results in all home buyers purchasing a home between $320,000 and $1 million paying less transfer duty. When fully rolled out by 1 September 2008, there will be no duty for first home buyers purchasing a home up to $500,000. Coupled with the abolition of mortgage duty, first
334
home buyers will pay no duty on a home up to $500,000. Adjustments at the higher end of the schedule will fund this policy measure. Overall, approximately 75% of transactions are expected to incur less duty under the reforms. The rate schedule changes apply from 1 July 2008, with the first home exemption threshold moving to $350,000 initially and then to $500,000 by 1 September 2008. Refer to Budget Paper No. 2 - Budget Strategy and Outlook for more detail.
| | | | | | | | | | |
| | | 2007-08
$’000 | | 2008-09
$’000 | | 2009-10
$’000 | | 2010-11
$’000 | | 2011-12
$’000 |
Liquor Licence Fees - Cost Recovery | | — | | 13,000 | | 27,000 | | 29,000 | | 30,000 |
The Government is introducing annual liquor licence renewal fees as part of a package of reforms to address the critical issue of harm reduction related to the use and abuse of alcohol. The revenue from licence renewal fees are intended to recover the costs to Government for the regulation of the liquor industry. The renewal fees are expected to apply from 1 January 2009. The expense component of this initiative can be found in Chapter 2 Expense Measures.
| | | | | | | | | | | | | | |
| | | 2007-08
$’000 | | 2008-09
$’000 | | | 2009-10
$’000 | | | 2010-11
$’000 | | | 2011-12
$’000 | |
Tax concessions to assist older persons | | — | | (5,000 | ) | | (5,000 | ) | | (5,000 | ) | | (5,000 | ) |
The Government will extend certain land tax and duties exemptions and concessional rates to assist older persons. The measures include providing a land tax exemption for aged care facilities, which will complement the existing exemption for retirement villages. Also, the duties home concession will be extended to apply to residents of retirement villages who are required to enter lease and sub-lease occupancy arrangements. Refer to Budget Paper No. 2 - Budget Strategy and Outlook for more detail.
| | | | | | | | | | | | | | |
| | | 2007-08
$’000 | | 2008-09
$’000 | | | 2009-10
$’000 | | | 2010-11
$’000 | | | 2011-12
$’000 | |
Land Tax - Reduction in Rates | | — | | (17,000 | ) | | (20,000 | ) | | (22,000 | ) | | (25,000 | ) |
The Government will reduce the land tax liability for resident individuals who have land holdings with taxable value below $1.8 million. Compared to the current schedule, a land tax payer with assessable land with a taxable value of $600,000 will save $700. 15,000 resident individuals and 17,500 companies, trusts and absentees will benefit from the new schedules. Companies, trusts and absentees with land holdings with a taxable value below $750,000 will also benefit from a reduced land tax liability, compared to the current schedule. The measure applies from 1 July 2008. Refer to Budget Paper No. 2 - Budget Strategy and Outlook for more detail.
| | | | | | | | | | | | | | |
| | | 2007-08
$’000 | | 2008-09
$’000 | | | 2009-10
$’000 | | | 2010-11
$’000 | | | 2011-12
$’000 | |
Pay-roll Tax - Extension of Deduction | | — | | (20,000 | ) | | (21,000 | ) | | (23,000 | ) | | (25,000 | ) |
The Government will extend the current phase-out of the pay-roll tax deduction. Currently the $1 million deduction phases out at $4 million. This measure will extend the phase-out to $5 million, delivering pay-roll tax cuts to eligible small and medium sized businesses with pay-rolls between $1 million and $5 million. The measure applies from 1 July 2008. Refer to Budget Paper No. 2 - Budget Strategy and Outlook for more detail.
| | | | | | | | | | | |
| | | 2007-08
$’000 | | 2008-09
$’000 | | | 2009-10
$’000 | | 2010-11
$’000 | | 2011-12
$’000 |
Mortgage Duty - Full Abolition | | — | | (100,000 | ) | | — | | — | | — |
The Government will bring forward the abolition of mortgage duty to apply from 1 July 2008. The Government halved the rate of mortgage duty from 1 January 2008. It will now be fully abolished from 1 July 2008. Refer to Budget Paper No. 2 - Budget Strategy and Outlook for more detail.
335
This page has been left blank intentionally.
336
By authority: R.J. Hunt, Government Printer, Queensland-2008
State Budget 2008-09
Budget Measures
Budget Paper No. 4
www.budget.qld.gov.au