EXHIBIT (c)(xx)
Queensland’s Annual Economic Report for the year ended June 30, 2009.
Annual Economic Report
on the Queensland economy – year ended 30 June 2009
2008-09
Queensland Government
© Queensland Treasury 2009
Excerpts of this publication may be reproduced, with appropriate acknowledgement, as permitted under the Copyright Act.
2008–09 Annual Economic Report on the Queensland economy – year ended June 2009
ISSN: 1837 4581
This publication is intended only to provide a summary of the subject matter covered and without assuming a duty of care.
Although the information, including commentary, herein has been derived from sources believed to be reliable,
Queensland Treasury does not guarantee or make any representations as to its accuracy or completeness or
accept responsibility for any loss or damage occurring as a result of its use.

Annual Economic Report
2008-09
The Queensland Economy
Contents
| | | | |
| | Foreword | | 2 |
| | |
| 1 | | Overview | | 3 |
| | |
| 2 | | External environment | | 5 |
| | |
| | International conditions | | |
| | Australian economy | | |
| | |
| 3 | | Components of Queensland’s economic growth | | 9 |
| | |
| | Household final consumption | | |
| | Dwelling investment | | |
| | Business investment | | |
| | Public final demand | | |
| | |
| 4 | | Queensland’s trade sector | | 13 |
| | |
| | Net exports | | |
| | Overseas merchandise exports | | |
| | |
| 5 | | Labour market | | 16 |
| | |
| | Employment | | |
| | Unemployment | | |
| | Labour force | | |
| | Participation rate | | |
| | |
| 6 | | Prices and wages | | 20 |
| | |
| | Consumer prices | | |
| | Wages | | |
| | |
| 7 | | Resident population | | 22 |
Foreword
In 2008-09, the global economy endured its most severe financial and economic crisis since the 1930s. Economic activity was undermined throughout developed and developing nations with such severity and synchronicity that Queensland’s major trading partner economies as a whole contracted by 1.7% in 2008-09.
Amid this turbulence, the 2008-09 Annual Economic Report documents the resilience of the Queensland economy, which recorded growth of 0.8% in 2008-09, largely in line with 1.0% growth recorded nationally.
Public and private investment played an important role in supporting Queensland economic activity during the global slowdown, helping offset weak household demand during the year.
A large backlog of work to be completed resulted in the volume of business investment rising 10.1%, the fifth consecutive year of double-digit growth. As a result, the volume of business investment reached almost $40 billion in 2008-09, more than triple its level in 2000-01.
Public sector investment also continued to grow strongly, helping to support the State’s fast population growth and expand the productive capacity of the economy.
In contrast, household consumption growth eased to 1.8% in 2008-09, the weakest growth recorded in 12 years, reflecting lower equity and house prices over the year.
Similarly, dwelling investment declined, reflecting the impact of restrictive interest rates over much of 2008, as well as weak consumer and investor confidence.
Despite a moderation in demand for labour in 2008-09, employment growth remained solid at 2.2%, representing a rate of job creation more than double that in the rest of Australia. An additional 48,000 Queenslanders found employment in 2008-09, the largest increase of any state during the financial year.
While stronger labour force growth drove the State’s year-average unemployment rate higher, to 4.4% in the year, it remained well below the average of 5.1% in the rest of Australia.
The Annual Economic Report is a part of the State Government’s performance accountability framework and is one of many economic resources produced by Queensland Treasury. This publication and other information on Queensland can be viewed at www.treasury.qld.gov.au.
ANDREW FRASER MP
TREASURER
MINISTER FOR EMPLOYMENT AND ECONOMIC DEVELOPMENT
2 Annual Economic Report 2008-09
1 Overview
The Queensland economy proved resilient in 2008-09, managing to expand during a year when most major western economies experienced recessions and global financial market conditions deteriorated. However, with growth in gross state product (GSP) easing to a modest 0.8% in 2008-09, to be largely in line with 1.0% growth nationally, 2008-09 represented the weakest year for the State economy since 1990-91. The household sector weighed on activity during the year, reflecting a decline in dwelling investment and the weakest growth in household consumption in more than a decade. This was offset by residual strength in business investment and support from public sector investment, while a decline in imports saw the trade sector make its first positive contribution to growth in eight years.
Household consumption growth eased to 1.8% in 2008-09, with discretionary spending constrained by considerably lower household wealth, as a result of falls in both equity and house prices over much of the year. While household incomes received support from lower interest rates and government payments, a portion of this additional income was used to increase savings or repay debt, as heightened uncertainty and worsening labour market conditions weighed on consumer confidence.
Dwelling investment in Queensland declined 6.9% in 2008-09, and was a key driver of the slowdown in overall economic growth over the year. The fall reflected the lagged impact of restrictive interest rates over much of 2008, as well as weak consumer and investor confidence following the deterioration in the economic outlook and tightening in credit conditions from late 2008.
In contrast to weakness in the household sector, business investment in Queensland rose 10.1% in 2008-09, the fifth consecutive year of double-digit growth. The large amount of project work already under construction generated considerable momentum, especially in engineering construction. This reflected in part the particularly long construction timeframes associated with large-scale infrastructure projects. Conversely, non-residential construction rose only marginally, as tight global credit markets from late 2008 onwards reduced access to credit for commercial developments in addition to residential high-rises.
|
Figure 1a Economic Growth (annual % change, CVM) |
|
| Sources: Queensland State Accounts and ABS 5206.0. |
Annual Economic Report 2008-09 3
Public sector investment played a key role in supporting activity in 2008-09, contributing 1.1 percentage points to overall economic growth and helping to offset the subdued household sector in the year. Public investment has increased substantially in areas such as transport, health, education, rail, energy and water in recent years, helping to support fast population growth and expand the productive capacity of the economy.
The trade sector contributed 0.6 percentage point to overall economic growth in 2008-09, the first net contribution since 2000-01. This reflected a faster fall in imports relative to exports during the year. Total exports of goods and services fell 1.4% in 2008-09. Overseas exports rose 3.2%, reflecting a strong rise in Chinese coal imports and a weaker A$, which supported tourism and education exports. However, this was more than offset by a 9.5% decline in interstate exports, reflecting weak national economic activity, combined with the impact of unusual weather events, including floods, on interstate tourism. Imports fell 2.6% in 2008-09, with a moderation in growth in household consumption and machinery and equipment investment driving the first decline in total goods imports since 1990-91.
Despite subdued economic conditions, jobs growth in Queensland remained only slightly below average, at 2.2% in 2008-09, more than double the rate in the rest of Australia. The recent period of skill shortages, combined with a flexible labour market, induced employers to reduce hours worked in order to lower labour costs in a period of weak demand. However, the State’s labour force participation rate rose further to an historic high of 67.6% in 2008-09. This, combined with solid population growth, saw the labour force expand by 3.0% and outpace jobs growth of 2.2%. As a result, the year average unemployment rate in Queensland rose 0.7 percentage point to 4.4% in 2008-09, the first increase since 2000-01. However, this was still below the 5.1% rate recorded in the rest of Australia, with 2008-09 representing the fifth consecutive year the Queensland unemployment rate was below the national average.
| | | | | | | | | | | | | | | | | | |
Table 1a Components of Economic Growth1,2 |
| | | Queensland | | | | Australia |
| | | Annual change % | | Contribution3 % points | | | | Annual change % | | Contribution3 % points |
| | | 2007-08 | | 2008-09 | | 2007-08 | | 2008-09 | | | | 2007-08 | | 2008-09 | | 2007-08 | | 2008-09 |
Household consumption | | 4.9 | | 1.8 | | 2.7 | | 1.0 | | | | 4.0 | | 1.4 | | 2.2 | | 0.8 |
Private investment4 | | 9.2 | | 2.7 | | 2.5 | | 0.7 | | | | 10.6 | | 3.1 | | 2.4 | | 0.8 |
Dwelling investment | | -1.3 | | -6.9 | | -0.1 | | -0.6 | | | | 1.7 | | -1.9 | | 0.1 | | -0.1 |
Business investment4 | | 16.3 | | 10.1 | | 2.5 | | 1.7 | | | | 15.2 | | 6.3 | | 2.1 | | 1.0 |
Other buildings and structures4 | | 10.6 | | 16.7 | | 0.7 | | 1.2 | | | | 12.8 | | 7.8 | | 0.8 | | 0.5 |
Machinery and equipment4 | | 21.1 | | 5.0 | | 1.8 | | 0.5 | | | | 17.3 | | 5.1 | | 1.3 | | 0.4 |
Private final demand4 | | 6.3 | | 2.1 | | 5.2 | | 1.7 | | | | 5.9 | | 1.9 | | 4.7 | | 1.6 |
Public final demand4 | | 7.4 | | 4.6 | | 1.7 | | 1.1 | | | | 4.0 | | 4.7 | | 0.9 | | 1.0 |
Change in inventories | | na | | na | | 0.2 | | -1.3 | | | | na | | na | | 0.2 | | -1.3 |
Gross state/national expenditure5 | | 6.8 | | 0.2 | | 7.2 | | 0.2 | | | | 5.8 | | 0.0 | | 5.9 | | 0.0 |
Net exports | | na | | na | | -1.7 | | 0.6 | | | | na | | na | | -2.2 | | 1.0 |
Exports of goods and services | | 3.0 | | -1.4 | | 1.1 | | -0.5 | | | | 4.1 | | 1.8 | | 0.8 | | 0.4 |
Imports of goods and services | | 6.8 | | -2.6 | | 2.8 | | -1.1 | | | | 13.8 | | -2.5 | | 3.0 | | -0.6 |
Gross state/domestic product | | 5.5 | | 0.8 | | 5.5 | | 0.8 | | | | 3.7 | | 1.0 | | 3.7 | | 1.0 |
Notes:
| 1. | Outcomes for overall economic growth and its components represent preliminary estimates based on the June quarter 2009 Queensland State Accounts. Subsequent releases of the Queensland State Accounts may contain revisions to 2008-09 outcomes. na – Indicates not applicable. |
| 2. | Chain volume measure (CVM), 2006-07 reference year. |
| 3. | Sum of component contributions to growth may not add to totals due to rounding. |
| 4. | For Queensland, excludes private sector net purchases of second-hand public sector assets. |
| 5. | Includes statistical discrepancy. |
Sources: Queensland State Accounts and ABS 5206.0.
4 Annual Economic Report 2008-09
2 External environment
International conditions
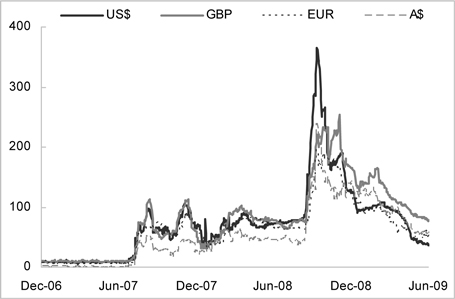
The year of 2008-09 marked the period in which the global financial crisis intensified, after investment bank Lehman Brothers filed for bankruptcy in mid-September 2008, the largest corporate bankruptcy in US history. This led to an escalation in perceived counterparty risk. As a result, interbank interest rate spreads widened from already elevated levels (see Figure 2a), highlighting a reluctance by financial institutions to lend funds. This prompted a deterioration in consumer and business sentiment, as well as falls in equity and commodity prices worldwide.
Figure 2a
Interbank Interest Rate Spreads¹
(basis points)
| | |
Note: |
1. | | Three month London Interbank Offered Rate less three month Overnight Indexed Swap rate. |
| Sources: Reuters and Bloomberg. |
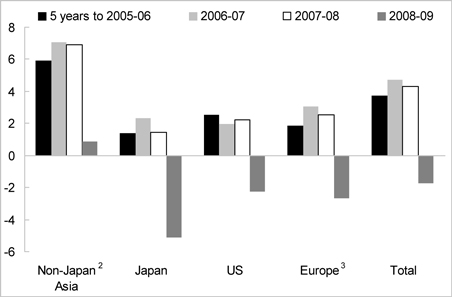
Economic activity was undermined in many industrialised and developing economies with such severity and synchronicity that Queensland’s major trading partner gross domestic product (GDP) contracted 1.7% in 2008-09, in contrast with 4.3% growth in 2007-08. This contraction in Queensland’s major trading partner GDP was broad-based, with output in Japan, Europe and the United States (US) falling in the year (see Figure 2b). Economic activity in non-Japan Asia continued to expand in 2008-09, albeit by only 0.9%. This was supported by ongoing economic growth in China and India, while other major Asian trading partners, such as Korea and Taiwan, contracted during the year.
The deteriorating outlook and tightened funding constraints led businesses globally to cut investment, run down inventories, scale down operations and strengthen balance sheets over 2008-09. This was most pronounced in advanced economies, with industrial production falling more than 20% in Japan and Italy, more than 15% in Germany and Spain, and more than 10% in the United Kingdom (UK), France, Canada and the US. In Japan and Italy, where these falls were most acute, industrial production fell to levels unseen since 1983 and 1987 respectively. By June quarter 2009, the level of private sector business investment fell to around a six-year low in the UK, an 11-year low in the US and around a 22-year low in Japan.
Annual Economic Report 2008-09 5
Figure 2b
Economic Performance in Queensland’s Major Trading Partners¹
(annual % change)
| | |
Notes: |
1. | | Queensland’s major trading partner output comprises 22 economies, weighted by their share of merchandise exports in the three years to 2007-08. |
2. | | Includes New Zealand. |
3. | | Includes the United Kingdom. |
| Sources: ABS 5432.0, Datastream and Queensland Treasury. |
Weaker global economic activity in advanced economies resulted in lower export and investment flows globally, with export-oriented Asian economies particularly hard hit. Lower commodity prices inflicted income losses on developing countries dependent on commodity exports, including many in the Middle East, Latin America and Africa. Moreover, as credit conditions tightened from late 2008, global foreign direct investment flows into developing countries also slowed, acting to soften activity in those economies further.
Household wealth fell in many economies as a result of lower equity and house prices. Specifically, stock prices in the US and UK fell 28.2% and 24.5% respectively over 2008-09, while house prices ended the year 31.3% and 26.4% lower than their respective peaks. Impaired household wealth suppressed consumer sentiment and therefore household consumption in the US and UK. Household consumption in these two countries fell by their largest annual rates in recorded history and declined in many other advanced economies.
Weaker economic activity also led to a worsening in labour market conditions. In the US, the unemployment rate rose 3.9 percentage points in 2008-09, to a 26-year high of 9.5%, with non-farm employment falling by its fastest annual rate in over 50 years. Meanwhile, the unemployment rates of Japan, Canada, Eurozone and the UK rose 1.3, 2.4, 2.0 and 2.2 percentage points respectively over the year.
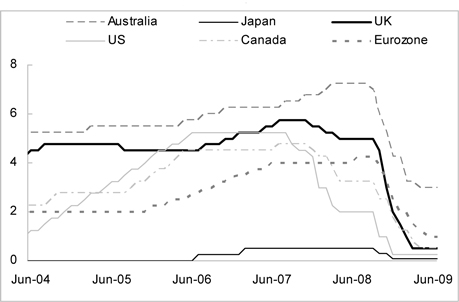
With restoring stability to the global financial system a widely acknowledged prerequisite for a sustainable economic recovery, substantial efforts were made over 2008-09 to increase liquidity and credit provision, reduce borrowing costs and recapitalise the banking sector. An easing in global inflation, as a result of lower commodity prices, falling capacity utilisation and higher unemployment rates enabled central banks to loosen monetary policy considerably. By the end of the financial year, official interest rates were at or near record lows in the US, Japan, UK and Eurozone (see Figure 2c).
6 Annual Economic Report 2008-09
Figure 2c
Official Interest Rates of Selected Developed Economies
(%, end of month)
Complementing the monetary expansion, numerous governments also announced large-scale fiscal stimulus programs. The International Monetary Fund estimated that across the G-20 economies1, fiscal stimulus amounted to 2% of their aggregate GDP in 2009 and 1 1/2% of GDP in 2010. In nominal terms, the largest of the announced fiscal stimulus programs was by the US, amounting to US$787 billion, or 5 1/2% of its GDP in 2008. Elsewhere, fiscal stimulus programs of varying focuses and timeframes were announced in Japan (3% of 2008 GDP), Germany (3 1/4%), Korea (7 1/2%) and China (13 1/4%), among many others.
Less conventional efforts to promote financial stability were also adopted, including quantitative or credit easing by the UK and US central banks respectively, as well as the US Government’s Troubled Assets Relief Program. Moreover, numerous governments provided guarantees on private sector wholesale borrowing, purchased or guaranteed ‘toxic’ assets within the banking sector and recapitalised or nationalised banks.
Such efforts gained traction on global economic activity by late 2008-09, resulting in credit conditions, equity and commodity prices, as well as overall sentiment recovering somewhat. As a result, after considerable falls in world economic output in the six months ending March quarter 2009, the pace of contraction eased in the June quarter. Among the G7 economies, GDP growth returned by June quarter 2009 in Japan, Germany and France. Nevertheless, of the 30 full members forming the Organisation for Economic Co-operation and Development (OECD), Australia, Greece and Poland were the only economies to expand in 2008-09.
| 1 | The Group of 20 comprises 19 countries (Argentina, Australia, Brazil, Canada, China, France, Germany, India, Indonesia, Italy, Japan, Mexico, Republic of Korea, Russia, Saudi Arabia, South Africa, Turkey, UK, and US) and the European Union. |
Annual Economic Report 2008-09 7
Australian economy
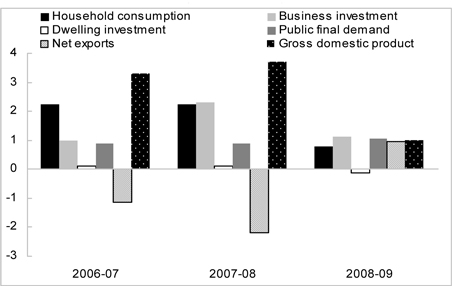
Growth in the Australian economy slowed to 1.0% in 2008-09, the lowest rate of growth since 1991-92. While some improvement in weather conditions saw farm output rise by 13.6% (strengthening from 7.8% growth in 2007-08), non-farm output increased only 0.7% in 2008-09 (moderating from 3.6% growth in 2007-08).
The global financial crisis accentuated existing monetary policy induced pressures on the Australian economy throughout the course of 2008-09. Household consumption growth eased to 1.4% in 2008-09, reflecting an interest rate tightening cycle between mid-2007 and mid-2008, as well as a fall in household wealth and weak consumer confidence. These factors were only partly offset by the positive impact of fiscal stimulus in the second half of the year. Business investment grew strongly in the first half of 2008-09, as the private sector continued to expand production capacity, particularly in the mining sector. However, investment peaked in December quarter 2008. As a result, growth in business investment remained around its long-run average at 6.8% in 2008-09, but moderated considerably from the 15.4% growth recorded in 2007-08. Dwelling investment fell 1.9% in 2008-09, reflecting interest rate rises between late 2007 and early 2008, lower household and investor confidence, and difficulty financing large projects. Partly offsetting weaker growth in overall private investment, growth in public investment accelerated from 6.4% in 2007-08 to 10.2% in 2008-09.
On the external front, export growth more than halved to 1.8% in 2008-09, reflecting slower growth in exports of iron ore, machinery and transport equipment, and other non-rural goods. However, weaker domestic demand growth and a lower A$ drove a 2.5% decline in imports in 2008-09, following very strong growth of 13.8% in 2007-08. As a result, net exports contributed one percentage point to GDP growth in 2008-09, following seven successive years in which the trade sector detracted from growth.
In line with slower growth in the non-farm economy, employment growth nationally eased to 1.1% in 2008-09, to be below growth in the labour force. Accordingly, the year-average unemployment rate rose from a 33-year low of 4.2% in 2007-08 to 5.0% in 2008-09. Growth in the headline Consumer Price Index eased to 3.1% in 2008-09, from 3.4% in 2007-08, but remained just above the RBA’s target band of 2-3%. In through-the-year terms, inflation moderated from September quarter 2008, following weaker domestic demand and some easing in oil prices.
Figure 2d
Contributions to National Economic Growth
(% point contribution)
8 Annual Economic Report 2008-09
3 Components of Queensland’s economic growth
Household final consumption
Following above long-run average growth of 4.9% in 2007-08, household consumption growth in Queensland eased to 1.8% in 2008-09, the weakest growth recorded in 12 years. Similarly, growth in consumer spending in the rest of Australia moderated from 3.8% in 2007-08 to 1.3% in 2008-09.
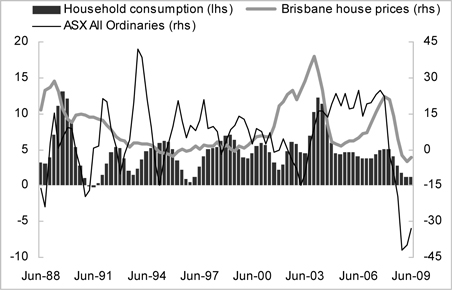
Discretionary spending in Queensland was constrained by lower household wealth, with equity prices halving between late 2007 and early 2009 and Brisbane house prices falling by 5.6% between June quarter 2008 and March quarter 2009 (see Figure 3a). Further, concerns surrounding job security emerged over the year, as the trend unemployment rate in Queensland increased by 1.8 percentage points to reach 5.5% by June 2009. These factors were reflected in the Westpac-Melbourne Institute Consumer Sentiment Index in Queensland, which troughed in July 2008 and remained below 100 (the point at which the level of pessimism equals optimism) throughout the entire financial year.
Households received support from substantially lower interest rates and payments made through the Australian Government’s Economic Security Strategy package in December 2008 and the Nation Building and Jobs Plan from April 2009. However, the extent to which additions to income boosted expenditure was limited by weak consumer confidence, which saw households use a larger proportion of income as savings or to repay debt in 2008-09.
In terms of components of spending, slower growth in household consumption in 2008-09 reflected lower expenditure in discretionary areas and on consumer durables, such as motor vehicles (down 12.1%), alcoholic beverages (down 5.1%), hotels, cafes and restaurants (down 6.3%), and furnishings and household equipment (down 2.4%). These declines were countered by solid growth in spending in non-discretionary areas, including health (12.5%), food (4.8%) and rent and other dwelling services (2.4%).
Figure 3a
Household Consumption1 and Wealth Determinants, Queensland
(annual % change)
| | |
| Note: |
| 1. | | Trend, CVM, 2006-07 reference year. |
| Sources: Queensland State Accounts, ABS 6416.0 and Datastream. |
Annual Economic Report 2008-09 9
Dwelling investment
Dwelling investment in Queensland fell 6.9% in 2008-09, following a marginal fall of 1.3% in 2007-08, and was a key driver of the slowdown in overall economic growth over the past year. In comparison, dwelling investment in the rest of Australia fell 0.2% in 2008-09, following a rise of 2.8% in the previous year. The larger fall in investment in Queensland relative to the rest of Australia over the past two years partly reflects a larger rise during the mining boom, where dwelling investment in Queensland rose by 45.0% over the five years ending 2006-07, compared with 6.5% in the rest of Australia.
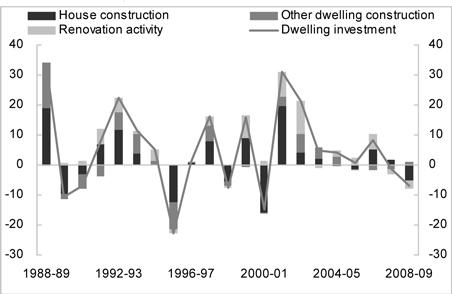
The lagged impact of restrictive interest rates over much of 2008, as well as weak consumer confidence following the deterioration in the economic outlook from late 2008, drove Queensland dwelling investment lower in 2008-09. Total new and used dwelling construction fell 7.8%, reflecting a 16.4% decline in house construction, which more than offset a 2.5% rise in other dwelling construction (which includes high-rises, townhouses and duplexes). The monetary tightening in 2008 appeared to have a greater impact on home construction in Queensland, with the State entering the financial year with lower levels of affordability due to faster house price growth relative to southern states over the preceding housing boom. Renovation activity also declined, by 5.7%, in 2008-09.
Housing market conditions changed markedly over the course of the financial year. While other dwelling construction rose in 2008-09, this reflected growth early in the financial year. Other dwelling construction in the second half of 2008-09 was 10.8% lower than in the first half of the year. This sector has a high concentration of investor activity and requires greater levels of specialised financing, the sources of which were undermined as the global financial crisis intensified from September 2008. After peaking at a 12-year high of 9.6% in July and August 2008, variable mortgage rates averaged just 6.0% in the second half of 2008-09, the lowest six-month average since 1970. Lower interest rates, combined with Australian and Queensland government initiatives, helped revive owner occupier housing demand over the year. In the second half of 2008-09, total housing finance approvals for first-home buyers and non-first home buyers rose 72.1% and 12.1% respectively compared with the first half of the year. As a result of higher turnover, Brisbane house prices had stabilised by June quarter 2009, after falling over the first three quarters of the year.
Figure 3b
Dwelling Investment, by Component
(annual % point contribution to growth)
|
Sources: ABS 5206.0 and 8755.0 and Queensland Treasury. |
10 Annual Economic Report 2008-09
Business investment
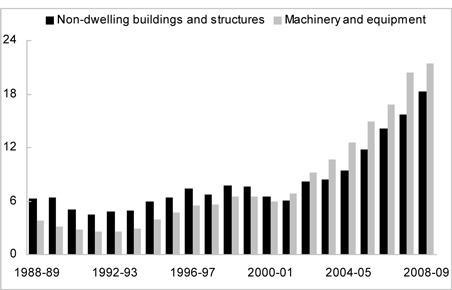
Despite the most pronounced global recession since the 1930s and volatile financial conditions, business investment in Queensland rose 10.1% in 2008-09, the fifth consecutive year of double-digit growth. The real level of business investment more than tripled over the eight years between 2000-01 and 2008-09, to reach almost $40 billion (see Figure 3c). As a consequence, business investment’s share of GSP more than doubled over the period, from 8.3% in 2000-01 to 18.6% in 2008-09, the highest recorded in the 24-year history of the Queensland State Accounts.
While the deepening in the global financial crisis since September 2008 has seen commercial lending dry up and businesses re-evaluate investment plans, the large amount of project work already under construction supported significant momentum in construction activity, especially in the first half of the financial year. Private sector construction work on mining and related infrastructure, energy, and roads resulted in the real value of engineering construction investment rising 29.0% in the year. The ongoing strength in this sector also reflects the long construction timeframes associated with large-scale infrastructure projects. Conversely, non-residential construction investment (such as offices, shops and factories) rose a modest 1.7% in 2008-09. Restricted credit for commercial developments took its toll on this type of construction, particularly in the second half of 2008-09. Overall, investment in non-dwelling buildings and structures in Queensland increased 16.7% in 2008-09, to total more than $18 billion.
Machinery and equipment investment rose a more modest 5.0% in 2008-09, reflecting the more responsive nature of this type of investment to changing economic conditions. The rapid deterioration in the global economy, combined with a considerable depreciation in the A$ in late 2008, discouraged spending on relatively more expensive imported capital goods, particularly in early 2009. However, these effects were unwound somewhat late in the financial year, with the A$ rebounding from its low in February 2009 and expanded Federal Government tax incentives supporting investment.
Figure 3c
Business Investment
($b, CVM)
|
Source: Queensland State Accounts. |
Annual Economic Report 2008-09 11
Public final demand
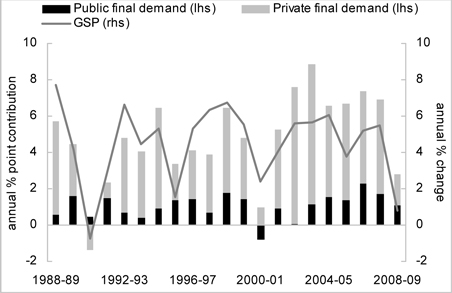
Playing a crucial role in supporting economic activity during the financial crisis, public final demand grew by 4.6% in 2008-09 and partly offset subdued private demand during the year. Partly reflecting the State’s own significant capital program, growth in public final demand contributed 1.1 percentage points to economic growth in 2008-09 (see Figure 3d).
Public final demand is a measure of investment spending by the general government sector and public trading enterprises, as well as government consumption expenditure, the latter of which is largely comprised of wages for government employees.
According to the Queensland State Accounts, state and local general government investment grew by 9.7% in real terms in 2008-09, following double-digit growth in the previous two years. As a result, the volume of state and local general government investment has increased by almost 70% over the past four years. This reflects investment in sectors such as transport, health and education, helping to accommodate fast population growth in the State. Major construction projects worked on in 2008-09 included the duplication of the Gateway Bridge, the Ipswich Motorway upgrade, and further work on the Northern and Eastern Busways.
In real terms, the level of state and local investment by public trading enterprises in 2008-09 was more than double its level four year earlier. Capital infrastructure increased most significantly in sectors such as rail, energy and water over this period, to cater for strong global demand for Queensland’s resource exports and boost the productive capacity of the economy. In particular, key components of the South East Queensland water grid were completed in 2008-09.
Figure 3d
Public and Private Demand, Queensland
|
Source: Queensland State Accounts. |
12 Annual Economic Report 2008-09
4 Queensland’s trade sector
Net exports
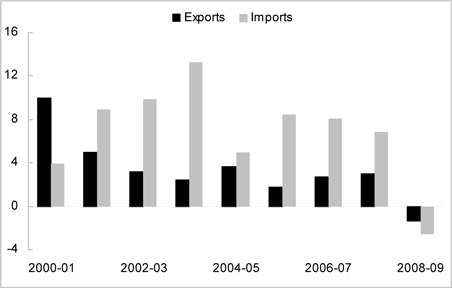
Net exports contributed 0.6 percentage point to overall economic growth in 2008-09, compared with a detraction of 1.7 percentage points in 2007-08. Total exports fell in the year, as resilient growth in overseas exports was more than offset by a fall in interstate exports. In line with a moderation in domestic economic growth, imports to Queensland also declined in 2008-09. With imports falling faster than exports in the year, net exports contributed to the State’s economic growth for first time since 2000-01.
Queensland’s total exports fell 1.4% in 2008-09. The moderation in national economic growth saw exports of goods and services interstate decline 9.5% in 2008-09, the first fall since the recession in 1990-91. Interstate exports of both goods and tourism were lower in the year, with interstate tourism adversely affected by unusual weather events, floods in North Queensland and an oil spill near Moreton Island.
However, despite the recession in Queensland’s major trading partners, exports of goods and services overseas rose 3.2% in 2008-09. Australia and Iceland were the only OECD members to record growth in export volumes in the year. Queensland’s overseas exports were supported by the depreciation in the A$ and the strong rise in Chinese coal imports. Total services exports overseas were largely unchanged in 2008-09. The lower A$ made the State a competitive destination for overseas tourists and students, offsetting a fall in other services exports.
The total volume of Queensland’s imports fell 2.6% in 2008-09. A moderation in growth in import intensive household consumption and machinery and equipment investment drove the first decline in total goods imports since 1990-91. Despite a weak domestic economy and lower A$ exchange rates, overseas imports of tourism continued to increase in 2008-09. This may in part have reflected discounting by airlines and overseas accommodation providers in the year. In contrast, interstate imports of tourism fell for the second consecutive year, suggesting residents in Queensland continued to substitute interstate holidays with overseas travel in 2008-09.
Figure 4a
Queensland’s Trade Sector
(annual % change)
|
Source: Queensland State Accounts. |
Annual Economic Report 2008-09 13
Overseas merchandise exports
The nominal value of Queensland’s overseas merchandise exports rose by a substantial 59.7% in 2008-09. With the volume of overseas exports of goods rising only 3.8% in the year, the rise in the nominal value of exports was driven almost entirely by higher prices received for Queensland coal exports, as well as a depreciation in the A$ (from $US0.90 in 2007-08 to $US0.75 in 2008-09). These factors more than offset the negative impact of the global economic downturn on other export categories, particularly base metals.
Detailed commodity information relating to Queensland’s overseas merchandise exports in 2008-09 is presented in Table 4a, with the key features explained below:
| • | | The nominal value of Queensland’s crude minerals exports rose 89.5% in 2008-09, to total $33.1 billion. Coal accounted for the majority of this category, and over half of the total value of Queensland’s merchandise exports in 2008-09. In Japanese Fiscal Year 2008-09 (April 2008 to March 2009), contract prices for hard coking and semi-soft coking coal more than tripled and prices for thermal coal doubled. In addition to substantially higher prices, the volume of Queensland coal exports also rose in 2008-09, supported considerably by unprecedented demand from China in the second half of the year. The volume of Queensland hard coking and thermal coal exports to China totalled 12.0 million tonnes in the first six months of 2009, compared with 0.8 million tonnes in the same period a year earlier. The rise in coal export volumes to China more than offset a large fall in demand from other major coal buyers in the year. |
| • | | In 2008-09, the nominal value of Queensland’s rural exports rose 23.4%, to total $6.3 billion. This increase was driven by a 12.0% rise in the value of meat exports and a 101.2% rise in cereals and cereal preparations. However, stronger meat export values largely reflected higher export prices. The volume of beef exports (which account for the majority of meat exports from Queensland) rose by a more modest 2.8% in the year. Strong demand from the US for lower-grade manufacturing beef saw export tonnages to the US rise 12.8%, while a more competitive A$ helped exports to Japan (the State’s largest export destination) increase 2.1%. In contrast, exports to South Korea fell 25.7%, following the removal of a ban on US imports into Korea. The value of cotton lint exports increased 47.9% in 2008-09, following large falls in 2007-08, with production benefiting from improved rainfall in particular. Sugar exporters benefited from the world raw sugar price approaching a record high over 2008-09. |
| • | | The nominal value of processed minerals and metals exports fell 17.0% in 2008-09, to $3.6 billion. The majority of the fall was driven by a 17.2% decline in non-ferrous metals, to $3.3 billion. This reflected lower industrial production, which weighed on base metals prices in 2008-09. The world prices of aluminium (down 29.8%), copper (down 36.5%), nickel (down 53.3%), lead (down 49.8%) and zinc (down 46.1%) were all much lower in the year. Further, output was affected as many mining companies responded to the weaker global environment and increased funding constraints by scaling back production. |
14 Annual Economic Report 2008-09
Asian markets remained Queensland’s most important export destinations in 2008-09, with the top destination being Japan (accounting for 29.5% of total exports by value), followed by India (11.8%), South Korea (11.3%), China (9.3%) and Taiwan (5.8%).
| | | | | | | | | | | | | | |
Table 4a |
Overseas Exports of Queensland Goods |
(current prices) |
| Export categories 1 | | 2007-08 $m | | | | 2008-09 $m | | | | Annual change $m % |
Rural 2 | | | | | | | | | | | | | | |
Meat | | 3,091.9 | | | | 3,463.4 | | | | 371.6 | | | | 12.0 |
Cereals and cereal preparations | | 227.1 | | | | 456.8 | | | | 229.7 | | | | 101.2 |
Textile fibres | | 318.3 | | | | 424.3 | | | | 106.0 | | | | 33.3 |
Fish | | 162.2 | | | | 181.9 | | | | 19.7 | | | | 12.1 |
Vegetables and fruit | | 326.4 | | | | 343.0 | | | | 16.6 | | | | 5.1 |
Other rural | | 1,011.4 | | | | 1,468.8 | | | | 457.4 | | | | 45.2 |
Total | | 5,137.3 | | | | 6,338.3 | | | | 1,200.9 | | | | 23.4 |
Crude minerals | | | | | | | | | | | | | | |
Coal3 | | 13,118.8 | | | | 30,221.3 | | | | 17,102.5 | | | | 130.4 |
Other crude minerals | | 4,371.1 | | | | 2,920.4 | | | | -1,450.7 | | | | -33.2 |
Total | | 17,489.9 | | | | 33,141.7 | | | | 15,651.8 | | | | 89.5 |
Manufactures | | | | | | | | | | | | | | |
Processed minerals and metals | | | | | | | | | | | | | | |
Non-ferrous metals | | 3,968.5 | | | | 3,285.4 | | | | -683.0 | | | | -17.2 |
Other processed minerals and metals | | 359.0 | | | | 305.3 | | | | -53.7 | | | | -15.0 |
Total | | 4,327.5 | | | | 3,590.7 | | | | -736.7 | | | | -17.0 |
Other manufactures | | | | | | | | | | | | | | |
Chemicals, fertilisers (excl. crude), plastics, etc. | | 550.9 | | | | 926.8 | | | | 375.8 | | | | 68.2 |
Leather, rubber, etc. | | 269.1 | | | | 243.0 | | | | -26.1 | | | | -9.7 |
Machinery | | 1,038.7 | | | | 1,208.1 | | | | 169.4 | | | | 16.3 |
Transport equipment | | 403.9 | | | | 322.8 | | | | -81.0 | | | | -20.1 |
Miscellaneous manufactures and beverages | | 384.7 | | | | 407.6 | | | | 22.9 | | | | 6.0 |
Total | | 2,647.3 | | | | 3,108.3 | | | | 461.0 | | | | 17.4 |
Total manufactures 4 | | 6,974.8 | | | | 6,699.1 | | | | -275.7 | | | | -4.0 |
Confidential and special 3 | | 5,715.8 | | | | 10,229.7 | | | | 4,513.9 | | | | 79.0 |
Total overseas exports of goods5 | | 35,317.8 | | | | 56,408.7 | | | | 21,090.9 | | | | 59.7 |
Notes:
| | 1. | Based on the Standard International Trade Classification. |
| | 2. | Due to ABS reclassification, raw cane sugar exports are included in the ‘confidential items’ export category rather than the ‘Rural’ export category. |
| | 3. | Since February 2002 a proportion of coal exports (particularly pulverised coal injection (PCI) exports) have been classified as confidential by the ABS. Accordingly, these exports are included in the ‘confidential items’ export category, along with sugar and some processed metal exports. |
| | 4. | Sum of processed minerals and metals and other manufactures. |
| | 5. | The sum of individual categories may not equal total due to rounding. |
Source: ABS Unpublished Trade Data.
Annual Economic Report 2008-09 15
5 Labour market
Employment
Demand for labour weakened considerably throughout 2008-09. Over the year to June 2009, the Department of Education, Employment and Workplace Relations Skilled Vacancy Index and the ANZ Job Advertisement Series for Queensland fell 62.1% and 62.2% (trend) respectively. This weakening in labour demand reflected the decline in business confidence following the collapse of Lehman Brothers, as well as a weakening in labour intensive sectors of the domestic economy in the State.
Despite this, employment growth in Queensland remained solid, at 2.2% in 2008-09, to represent a rate of job creation more than double that in the rest of Australia (see Figure 5a). An additional 48,000 Queenslanders found employment in 2008-09, the largest increase of any state during the financial year. In 2007-08, many Queensland employers had difficulty obtaining suitable labour, due to skill shortages throughout the State. With this in mind, employers took advantage of a more flexible labour market than in previous downturns and reduced hours worked in order to lower labour costs, while retaining skilled workers. Average hours worked per week in Queensland fell 1.1% in 2008-09, following very strong growth in 2007-08. As a result, total hours worked in Queensland rose only 1.1% in 2008-09, the weakest rate of growth since the GST induced slowdown of the economy in 2000-01.
|
Figure 5a Employment (annual % change) 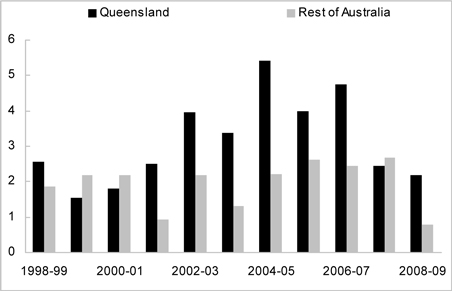
|
Employment growth in 2008-09 was largely driven by the transportation, construction and mining sectors. Growth in these sectors is likely to have reflected the high amount of large scale engineering and non-dwelling construction projects still being worked on in the year, related to the mining investment boom and the continuation of large scale public works. The health care and education and training sectors, which have a strong public sector presence, also made a strong contribution to employment growth.
16 Annual Economic Report 2008-09
Industries facing poor employment outcomes were in line with the sectors of the economy under strain in 2008-09 (see Table 5a). Despite the temporary boost to household incomes from fiscal and monetary stimuli, well below average consumption growth put pressure on the retail sector in 2008-09. As a result, employment in wholesale and retail trade, as well as arts and recreation services, fell by 15,400 persons in the year. Employment in the administrative and support services as well as the rental, hiring and real estate services industries also fell in the year. These falls were likely to have been driven by the decline in demand for labour hire services, the weaker housing market and poor business confidence in the period.
| | | | | | | | | | | | |
Table 5a Employment by Industry, Queensland |
| Industry/Sector | | 2008-09 | | Annual change
(‘000 persons) | | Annual growth (%) |
| | ‘000
persons | | % of total | | 2008-09 | | 10 year
average | | 2008-09 | | 10 year
average1 |
Primary and secondary | | 315.9 | | 14.2 | | 9.5 | | 2.2 | | 3.1 | | 0.7 |
Agriculture, forestry & fishing | | 79.9 | | 3.6 | | -0.3 | | -2.3 | | -0.3 | | -2.5 |
Mining | | 46.2 | | 2.1 | | 8.2 | | 2.7 | | 21.6 | | 9.2 |
Manufacturing | | 189.8 | | 8.5 | | 1.5 | | 1.8 | | 0.8 | | 1.0 |
Services | | 1,910.1 | | 85.8 | | 41.9 | | 58.3 | | 2.2 | | 3.7 |
Electricity, gas, water & waste services | | 26.8 | | 1.2 | | 3.5 | | 1.2 | | 14.8 | | 6.2 |
Construction | | 245.0 | | 11.0 | | 8.6 | | 10.8 | | 3.6 | | 6.0 |
Wholesale trade | | 66.8 | | 3.0 | | -2.1 | | -1.1 | | -3.1 | | -1.4 |
Retail trade | | 261.0 | | 11.7 | | -8.0 | | 6.6 | | -3.0 | | 3.0 |
Accommodation & food services | | 159.4 | | 7.2 | | 4.5 | | 3.9 | | 2.9 | | 2.8 |
Transport, postal & warehousing | | 139.9 | | 6.3 | | 19.5 | | 5.2 | | 16.2 | | 4.7 |
Information media & telecommunications | | 35.1 | | 1.6 | | -6.3 | | 0.4 | | -15.3 | | 1.3 |
Financial & insurance services | | 60.3 | | 2.7 | | 4.2 | | 1.8 | | 7.4 | | 3.7 |
Rental, hiring & real estate services | | 53.1 | | 2.4 | | -1.3 | | 2.2 | | -2.4 | | 5.6 |
Professional, scientific & technical Services | | 143.1 | | 6.4 | | 3.9 | | 5.6 | | 2.8 | | 5.1 |
Administrative & support services | | 67.0 | | 3.0 | | -6.3 | | 2.1 | | -8.6 | | 3.9 |
Public administration & safety | | 128.1 | | 5.8 | | -0.9 | | 4.7 | | -0.7 | | 4.6 |
Education & training | | 169.4 | | 7.6 | | 7.0 | | 5.0 | | 4.3 | | 3.6 |
Health care & social assistance | | 225.1 | | 10.1 | | 13.2 | | 7.2 | | 6.2 | | 3.9 |
Arts & recreation services | | 34.7 | | 1.6 | | -5.3 | | 0.6 | | -13.2 | | 1.7 |
Other services | | 95.5 | | 4.3 | | 8.0 | | 2.0 | | 9.1 | | 2.4 |
All industries 2,3 | | 2,226.0 | | 100.0 | | 51.4 | | 60.5 | | 2.4 | | 3.2 |
Notes:
| 2. | Industry estimates of employment are only available on the mid-month of each quarter. Therefore, the level and growth of total industry employment do not match aggregate estimates of employed persons derived from monthly data. |
| 3. | The sum of individual industries may not add to total due to rounding. |
Source: ABS 6291.0.55.001.
Reflecting the demographic composition of employment in certain industries, employment growth in the year varied considerably between different age cohorts. Young people (aged 15 to 24 years) faced poor employment outcomes, largely due to the lower-skilled nature of their work and their tendency to be employed in industries related to discretionary expenditure. Growth in employment for persons aged over 60 was strong in 2008-09, reflecting job gains across a wide range of industries. The employment of women aged 35 to 54 also increased, particularly in the areas of health and education.
Participation rate
The State’s labour force participation rate rose to an historic high of 67.6% in 2008-09. Despite deteriorating labour market conditions, prime working aged persons (aged 25 to 54) contributed to growth in participation in 2008-09 (see Figure 5b). Specifically, prime aged males made their strongest contribution in 13 years, while prime aged females made their strongest contribution in four years. Strong employment growth in the construction, mining and transportation, and education and health care sectors is likely to have driven this
Annual Economic Report 2008-09 17
contribution. Higher levels of household debt, due to previous strong house price growth, as well as high interest rates early in the financial year, may have also provided support to the participation rate of this cohort.
Persons aged over 55 years made the strongest contribution to growth in the participation rate in 2008-09, as has generally been the case in recent years. This age cohort has benefited from strong labour demand in industries such as construction and health care in recent years. In addition, large falls in asset prices, as well as revised expectations of future investment earnings, may have encouraged people in this cohort to postpone retirement.
Young persons, particularly females, detracted from total participation in 2008-09. This is likely to have reflected the poor employment outcomes in these cohorts, which tend to see this age group leave the labour force if they become unemployed. Likewise, persons in this cohort are also discouraged from entering the labour force and seeking employment if they consider their job prospects to be low.
|
Figure 5b Queensland Labour Force Participation Rate (% point contribution to annual change) 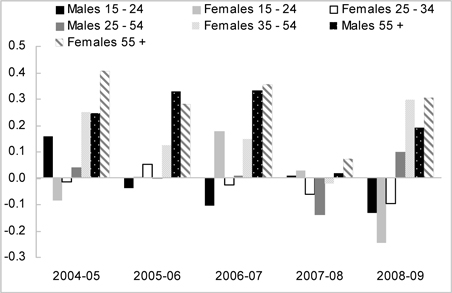
|
|
| Source: ABS 6291.055.001. |
Labour force
The labour force (the number of persons employed and unemployed) in Queensland grew 3.0% in 2008-09 (see Figure 5c), in line with the long-run average growth rate. Labour force growth was supported by the rise in participation in the year, along with civilian population growth of 2.3%. Solid population growth and a considerable increase in the participation rate have driven stronger labour force growth in Queensland relative to the rest of Australia in recent years.
18 Annual Economic Report 2008-09
|
Figure 5c Labour Force (annual % change) 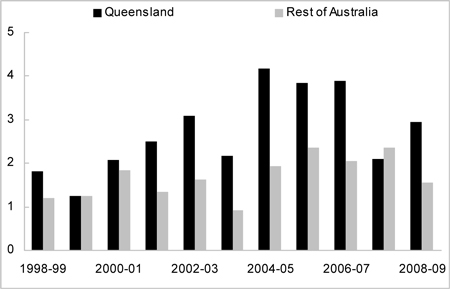
|
Unemployment
With labour force growth of 3.0% outpacing employment growth of 2.2%, the year average unemployment rate in Queensland rose 0.7 percentage point, to 4.4%, in 2008-09, the first increase since 2000-01 (see Figure 5d). In line with deteriorating labour market conditions throughout the year, Queensland’s trend unemployment rate rose from 3.7% in July 2008 to 5.5% in June 2009. Similarly, the unemployment rate in the rest of Australia rose from 4.4% to 5.8% over the period. In 2008-09, increases in unemployment were disproportionately borne by young males, reflecting declines in their employment. The number of young females in employment also declined, but also left the labour force in greater numbers, leading to a fall in the unemployment rate for this cohort.
|
Figure 5d Queensland GSP and Unemployment Rate 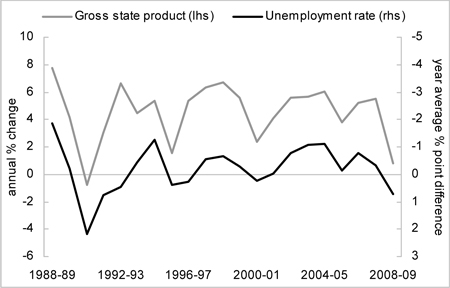
|
|
| Sources: Queensland State Accounts and ABS 6202.0. |
Annual Economic Report 2008-09 19
6 Prices and wages
Consumer prices
The Brisbane Consumer Price Index (CPI) increased 3.7% in 2008-09, easing from 4.1% growth in 2007-08. This was the first year in which CPI growth moderated since 2004-05, reflecting an unwinding of factors which drove strong inflation in previous years, such as higher oil prices, buoyant economic growth and domestic capacity constraints.
As in the preceding two years, housing was the main contributor to the increase in consumer prices in 2008-09, accounting for nearly half the rise in the CPI. Weak house construction activity in recent years, combined with solid population growth, kept rental vacancy rates low and underpinned strong rental price growth.
Food was the second largest contributor to Brisbane’s inflation in 2008-09, reflecting higher prices for dining out and take-away foods, as well as bread and cereal products. The prices of certain foods were also impacted by adverse weather conditions across the nation in the year, including flooding, cyclones and bushfires. Alcohol and tobacco also contributed considerably to Brisbane’s CPI growth in 2008-09, following the pass-through of a substantial increase in Federal taxes on pre-mixed alcoholic drinks from April 2008.
A depreciation in the A$ placed some upward pressure on the cost of internationally priced items in 2008-09, which account for around 40% of Brisbane’s CPI. This was reflected in higher prices of household contents and services in the year, particularly furniture and furnishings, where prices increased 4.3% in 2008-09.
Nationally, average consumer price inflation across the eight Australian capital cities also moderated to 3.1% in 2008-09, from 3.4% in 2007-08. As in Brisbane, increases in the cost of housing, food, and alcohol and tobacco were the major contributors to national inflation. Through the year underlying inflation moderated from 4.4% in June quarter 2008 to 3.9% in June quarter 2009.
|
Figure 6a Components of CPI, Brisbane and Australia1 (annual % point contribution to growth, 2008-09) 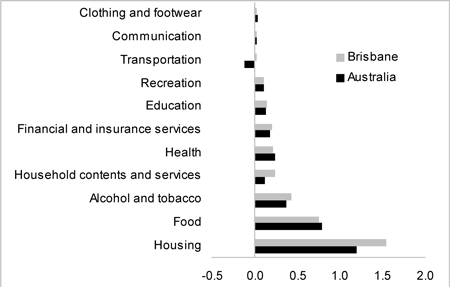
|
Note: 1. Weighted average of capital cities. Source: ABS 6401.0. |
20 Annual Economic Report 2008-09
Wages
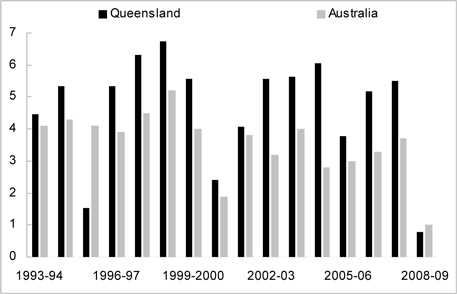
Wages growth in Queensland remained solid in 2008-09, reflecting the lagged impact of tight labour market conditions in previous years. Average weekly ordinary full-time earnings (AWOTE) in Queensland increased 7.3% to $1,120 per week in 2008-09, the strongest growth recorded since 1990-91 (see Figure 6b).
National AWOTE rose 5.5% in 2008-09, to $1,174 per week. National growth was strongest in the mining and construction industries (both up 7.8%), in line with strong economic activity in the resources and engineering construction sectors. Growth was weakest in sectors of the economy related to discretionary consumer spending, such as the retail trade (2.3%) and accommodation, cafes and restaurants (2.8%) industries.
The Wage Price Index (WPI) measures the increases in the price of labour that are not attributable to measurable changes in the quality or quantity of work performed, and is therefore a preferable measure of labour costs. In Queensland, the WPI rose by 4.2% in 2008-09, equalling growth in the previous year. The public sector WPI in Queensland rose 4.3% in 2008-09, slightly stronger than private sector WPI growth of 4.2%.
The Australian WPI rose 4.0% in 2008-09, easing slightly from 4.2% in the previous year. As with AWOTE, national WPI growth was strongest in the mining (up 5.5%), property and business services (4.9%), and construction (4.5%) sectors in the year.
Along with strong growth in wages, fiscal stimulus payments, as well as cuts to both interest rates and income taxes boosted average real disposable incomes in 2008-09.
|
Figure 6b Average Weekly Ordinary Full-time Earnings (nominal, year average, % change) 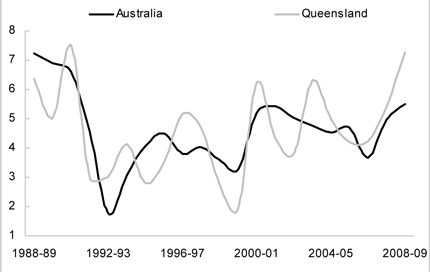
|
Annual Economic Report 2008-09 21
7 Resident population
Queensland’s resident population is estimated to have risen by a solid 2.6%1 in 2008-09, translating into an average increase of more than 2,000 persons per week. In comparison, the resident population in the rest of Australia is estimated to have increased by 1.8% in the year. Queensland’s share of the national population remained over 20% in 2008-09.
Queensland has recorded faster resident population growth than the average of the rest of Australia in each year since 1970-71. Queensland’s population grew at an average annual rate of 2.3% over the past two decades, more than double the 1.1% average annual growth recorded in the rest of Australia.
Historically, faster population growth in the State has been largely attributable to a higher level of net interstate migration relative to other states. While net interstate migration to Queensland has been positive in every year since 1970-71 (earliest data available), it has generally moderated since 2002-03. This partly reflects a general narrowing in the house price gap between Brisbane and Sydney in particular, with New South Wales accounting for more than two-thirds of all net interstate migration to Queensland. Net interstate migration in 2008-09 is also estimated to have been the lowest since 1999-2000, which can be partly attributed to the weak economic growth nationally, which tends to result in lower Australian interstate migratory flows.
Offsetting this easing in net interstate migration, net overseas migration has become increasingly important in recent years and is estimated to have been the primary driver of population growth for the fourth consecutive year in 2008-09 (see Figure 7a). Rising net overseas migration has coincided with a widening economic growth differential between Australia and countries which are the main source of overseas migrants.
|
Figure 7a Contribution to Resident Population Growth (persons, average weekly increase) 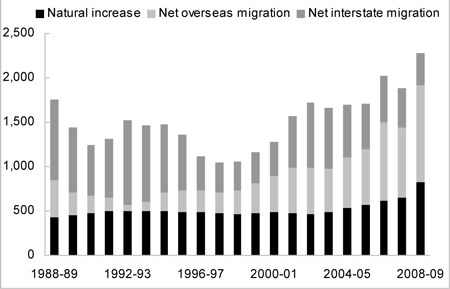
|
| Sources: ABS 3101.0 and Queensland Treasury. |
| 1. | 2008-09 data are estimated by comparing the first three quarters of 2008-09 with the same period a year earlier. ABS data for June quarter 2009 are not yet available. |
22 Annual Economic Report 2008-09
This page has been left intentionally blank
Annual Economic Report 2008-09 23
This page has been left intentionally blank
24 Annual Economic Report 2008-09

Queensland
Government
09-087