EXHIBIT (c)(xxi)
Queensland’s Report on State Finances for the year ended June 30, 2009.
2008-09 Report on State Finances of the Queensland Government – 30 June 2009
Incorporating the Outcomes Report and the AASB 1049 Financial Statements
Queensland
Government
Contents
| | |
| | | Page |
| |
Message from the Treasurer | | 2 |
| |
Scope of the Report | | 3 |
| |
Outcomes Report - Uniform Presentation Framework | | |
| |
Overview and Analysis | | 4-01 |
| |
Operating Statement by Sector | | 4-06 |
| |
Balance Sheet by Sector | | 4-07 |
| |
Cash Flow Statement by Sector | | 4-08 |
| |
General Government Sector Taxes | | 4-09 |
| |
General Government Sector Dividend and Income Tax Equivalent Income | | 4-09 |
| |
General Government Sector Grant Revenue | | 4-10 |
| |
General Government Sector Grant Expenses | | 4-10 |
| |
General Government Sector Expenses by Function | | 4-11 |
| |
General Government Sector Purchases of Non-financial Assets by Function | | 4-12 |
| |
Loan Council Allocation | | 4-12 |
| |
Certification of Outcomes Report | | 4-13 |
| |
AASB 1049 Financial Statements | | |
| |
Overview and Analysis | | 5-01 |
| |
General Government Audited Financial Statements | | |
| |
Operating Statement | | 6-01 |
| |
Balance Sheet | | 6-02 |
| |
Statement of Changes in Net Assets (Equity) | | 6-03 |
| |
Cash Flow Statement | | 6-04 |
| |
Notes to the Financial Statements | | 6-05 |
| |
Certification of General Government Financial Statements | | 6-64 |
| |
Independent Auditor’s Report to the Treasurer of Queensland | | 6-65 |
| |
Whole of Government Audited Financial Statements | | |
| |
Operating Statement | | 7-01 |
| |
Balance Sheet | | 7-02 |
| |
Statement of Changes in Net Assets (Equity) | | 7-03 |
| |
Cash Flow Statement | | 7-04 |
| |
Notes to the Financial Statements | | 7-05 |
| |
Certification of Consolidated Financial Statements | | 7-79 |
| |
Independent Auditor’s Report to the Treasurer of Queensland | | 7-80 |
| | |
| Report on State Finances 2008–09 – Government of Queensland | | 1 |
Message from the Treasurer
As outlined in the Charter of Social and Fiscal Responsibility, the Government is committed to fiscal transparency and accountability. A key objective of this report is to facilitate a meaningful assessment of the State’s financial performance over the 2008-09 financial year and its net worth at balance date.
This report provides details of the General Government sector’s and Total State’s financial operations and position on both a Uniform Presentation Framework (Outcomes Report) and Australian Accounting Standards basis.
2008-09 is the first year the statements have been prepared according to the Australian Accounting Standards Board’s (AASB) new accounting standard, AASB 1049 Whole of Government and General Government Sector Financial Reporting. The standard aims to harmonise Government Finance Statistics (GFS) and Generally Accepted Accounting Principles (GAAP) with the objective of improving the clarity and transparency of government financial statements.
In endorsing this report, I place on record my appreciation of the professionalism and co-operation extended to Queensland Treasury by agency personnel and of the Treasury staff involved in its preparation.
ANDREW FRASER
Treasurer
Minister for Employment and Economic Development
| | |
| Report on State Finances 2008–09 – Government of Queensland | | 2 |
Scope of the Report
The Report on State Finances, incorporating the Outcomes Report and AASB1049 Financial Statements for the General Government sector and Whole of Government (Total State), provides a comprehensive analysis of Government finances for the 2008-09 financial year.
The Outcomes Report
The Outcomes Report contains financial statements that are prepared and presented in accordance with the Uniform Presentation Framework (UPF) agreed to at the 1991 Premiers’ Conference and recently revised to align with AASB 1049 Whole of Government and General Government Sector Financial Reporting. The primary objective of the UPF is to provide uniform and comparable reporting of Commonwealth, State and Territory governments’ financial information.
Queensland’s annual Budget was prepared in accordance with the revised UPF and the Outcomes Report compares achieved financial results with revised forecasts as per the 2009-10 Budget papers.
The UPF presentation is primarily structured on a sectoral basis with a focus on the General Government and Public Non-financial Corporations sectors.
The AASB1049 Financial Statements
The AASB1049 Financial Statements outline the operations of the Queensland Government on an accrual basis in accordance with Australian Accounting Standard AASB 1049 Whole of Government and General Government Sector Financial Reporting and other applicable standards. The statements present the operating statement, balance sheet and cash flows of the Queensland Total State sector on a consolidated basis and the General Government sector on a partially consolidated basis.
AASB 1049 Whole of Government and General Government Sector Financial Reporting was released in October 2007 and is applicable for the year ended 30 June 2009. The standard aims to harmonise the Government Finance Statistics (GFS) and Accounting Standard frameworks. The GFS reporting framework, developed by the Australian Bureau of Statistics (ABS), is based on international statistical standards and allows comprehensive assessments to be made of the economic impact of government. A full set of financial statements is required for both the General Government and Whole of Government sectors. Comparison is with the prior year, though the General Government sector financial statements also require analysis of variances between original published budget and actuals.
Financial statements for the General Government, Public Non-financial Corporations and Public Financial Corporations sectors are disclosed in the disaggregated information note to the State financial statements (Note 2).
Refer Note 53 of the Whole of Government financial statements for a full list of consolidated entities.
Where applicable, comparatives have been restated to agree with changes in presentation in the financial statements for the current reporting period and to correct timing differences and/or errors from prior periods.
Related Publications
This report compliments other key publications relating to the financial performance of the Queensland Public Sector including:
| | - | the annual Budget papers; | |
| | - | Budget updates including the Mid Year Fiscal and Economic Review and subsequent updates such as the Economic and Fiscal Update; | |
| | - | the Treasurer’s Consolidated Fund Financial Report; and | |
| | - | the annual reports of the various departments, statutory bodies, Government-owned corporations and other entities that comprise the Queensland Government. | |
| | |
| Report on State Finances 2008–09 – Government of Queensland | | 3 |

2008-09
Outcomes Report
Uniform Presentation Framework of the
Queensland Government – 30 June 2009
Queensland Government
Outcomes Report - Overview and Analysis
Overview
The General Government UPF net operating balance for 2008-09 was a surplus of $35 million, up $609 million over the forecast at the time of the 2009-10 Budget. The improvement is primarily the result of developer land contributions not budgeted for and marginally higher taxation revenue.
A cash deficit of $2.839 billion was recorded for 2008-09 in the General Government sector, a $1.305 billion improvement on the 2009-10 Budget estimate primarily as a result of the improved operating result and marginally lower payments for capital.
The State’s net worth increased to $184.619 billion as at 30 June 2009, mainly due to the first time valuation of land under roads in accordance with accounting standard AASB 1051 Land under Roads.
Payments for capital purchases in the General Government sector were slightly lower than forecast which is primarily the result of the timing of payments for works undertaken rather than the non-completion of projects.
Summary of Key UPF Financial Aggregates
Outlined in the table below are the key aggregates, by sector.
| | | | | | | | | | | | | | | | | | |
| | | General Government
Sector | | | Public Non-financial
Corporations Sector | | | Non-financial Public
Sector | |
| | | Est. Actual
$ million | | | Outcome
$ million | | | Est. Actual
$ million | | | Outcome
$ million | | | Est. Actual
$ million | | | Outcome
$ million | |
| | | | | | | |
Revenue | | 35,874 | | | 37,008 | | | 10,956 | | | 10,541 | | | 43,510 | | | 43,659 | |
Expenses | | 36,447 | | | 36,974 | | | 10,600 | | | 9,955 | | | 44,572 | | | 43,973 | |
Net operating balance | | (574 | ) | | 35 | | | 356 | | | 587 | | | (1,062 | ) | | (314 | ) |
Cash surplus/(deficit) | | (4,144 | ) | | (2,839 | ) | | (7,458 | ) | | (6,384 | ) | | (11,602 | ) | | (9,223 | ) |
Capital purchases | | 7,137 | | | 6,960 | | | 9,059 | | | 8,353 | | | 16,195 | | | 15,265 | |
Net worth | | 149,800 | | | 184,619 | | | 18,982 | | | 27,595 | | | 149,800 | | | 184,619 | |
Net debt | | (17,808 | ) | | (19,281 | ) | | 31,618 | | | 29,250 | | | 13,810 | | | 9,970 | |
Net borrowing | | 4,014 | | | 3,728 | | | 7,208 | | | 7,141 | | | 11,222 | | | 10,868 | |
Borrowing | | 10,765 | | | 10,278 | | | 33,524 | | | 32,368 | | | 44,288 | | | 42,645 | |
Note: 1. Numbers may not add due to rounding | | | | | | | | | | | | | | | | | | |
| | |
| Outcomes Report 2008–09 – Government of Queensland | | 4-01 |
Outcomes Report - Overview and Analysis
| | | | |
General Government Revenue | | 2008-09
Est. Actual
$ million | | 2008-09
Outcome
$ million |
Taxation revenue | | 8,759 | | 8,877 |
Grants revenue | | 17,272 | | 17,476 |
Sales of goods and services | | 3,466 | | 3,568 |
Interest income | | 1,261 | | 1,482 |
Dividend and income tax equivalent income | | 1,098 | | 1,180 |
Other revenue | | 4,017 | | 4,425 |
Total Revenue | | 35,874 | | 37,008 |
| Note: |
1. Numbers may not add due to rounding |
Total revenue increased by $1.134 billion over the 2008-09 estimated actual. This was largely due to:
| - | other revenue being boosted by land contributions from developers including the first time valuation of lands under roads; |
| - | returns of the State’s investments being better than forecast (primarily assets held for former defined benefit purposes returning -11% compared to a forecast -15%); |
| - | additional grants being received from the Australian Government principally for Health and Education; |
| - | increased dividend income mainly from QR Limited and electricity entities; and |
| - | taxation revenue being marginally (1.3%) stronger than forecast, primarily transfer duty. |
| | | | |
General Government Expenses | | 2008-09
Est. Actual
$ million | | 2008-09
Outcome
$ million |
Employee expenses | | 14,249 | | 14,305 |
Superannuation expenses | | | | |
Superannuation interest cost | | 760 | | 858 |
Other superannuation expenses | | 2,012 | | 2,012 |
Other operating expenses | | 7,446 | | 7,185 |
Depreciation and amortisation | | 2,551 | | 2,496 |
Other interest expenses | | 539 | | 599 |
Grant expenses | | 8,889 | | 9,519 |
Total Expenses | | 36,447 | | 36,974 |
| Note: |
1. Numbers may not add due to rounding |
Total expenses were largely in line with forecasts except for:
| - | other operating expenses being lower than expected due to a change in timing of payments between financial years; |
| - | grant expenses being higher due mainly to increased funding to hospitals and schools, offset by additional funding from the Australian Government and also related to a change in value of the roads granted to local councils as a result of a change in accounting policy; and |
| - | the superannuation interest cost being higher due to better than anticipated return on former defined benefit investments. |
| | |
| Outcomes Report 2008-09 – Government of Queensland | | 4-02 |
Outcomes Report - Overview and Analysis
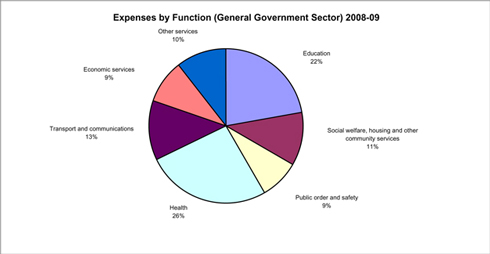
General Government expenditure is focussed on the delivery of core services to the community. As shown in the chart below, education and health account for the largest share of expenses.
Cash Flows
A cash deficit of $2.839 billion was recorded for 2008-09 in the General Government sector, compared to the estimated actual forecast in the 2009-10 Budget of $4.144 billion. This is the result of the improved net operating position and the timing of payments for capital works where work has been completed but not yet paid for.
Capital Purchases and Borrowings
Purchases of non-financial assets (i.e. capital expenditure) totalled $6.960 billion, $177 million (2.5%) less than forecast. This underspend is primarily the result of the timing of payments for works rather than the non-completion of projects. As a result of this and the improved net operating position, net borrowings were $286 million less than forecast.
The gross borrowing for General Government was $10.278 billion, $487 million less than forecast due to the lower net borrowings and market movements in the value of debt.
Queensland’s capital spend per capita is $1,600 in 2008-09 which is more than double the average of the other states.
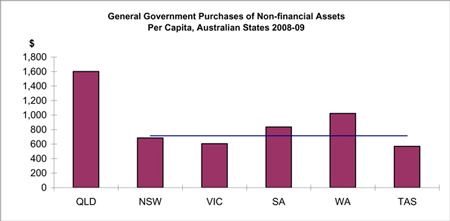
Source: New South Wales, Victoria, South Australia and Tasmania 2009-10 Budget Papers: Western Australia Outcome Results. Population data from ABS 3101.0.
| | |
| Outcomes Report 2008-09– Government of Queensland | | 4-03 |
Outcomes Report - Overview and Analysis
Net Worth
The State’s net worth increased by $34.819 billion to $184.619 billion as at 30 June 2009. $38.589 billion of this increase relates to the adoption of AASB1051 Land under Roads.
This increase has been partly offset by a decrease in the value of road infrastructure with the adoption of a new valuation methodology by the Department of Transport and Main Roads.
There has been an increase in the valuation of the Public Non-financial and Financial Corporations sectors due to a change in the valuation methodology to fair value which particularly impacted QR Limited infrastructure. This was partially offset by a decline in investments as a result of the global financial crisis.
Net Debt
Net debt is the most common measure used to judge the overall strength of a jurisdiction’s fiscal position. High levels of net debt impose a call on future revenue flows to service that debt and can limit government flexibility to adjust outlays.
In 2008-09 Queensland’s net debt is strongly negative due to the investments it holds for employee and other obligations.
Queensland’s net debt position improved compared to budget as a result of the higher cash surplus and better than expected investment returns.
Queensland’s negative net debt of $4,433 per capita compares to the average net debt of $623 per capita of the other states.
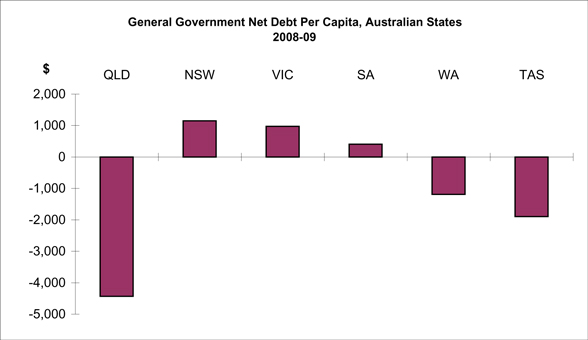
Source: New South Wales, Victoria, South Australia and Tasmania 2009-10 Budget Papers: Western Australia Outcomes Results. Population data from ABS 3101.0.
| | |
| Outcomes Report 2008-09 – Government of Queensland | | 4-04 |
Outcomes Report - Overview and Analysis
Operating Result
The operating result represents the result for the State under the Accounting Standards framework. The operating result of negative $88 million differs from the net operating balance as it includes valuation adjustments such as gains and losses on financial and non-financial assets, deferred tax revenue and dividend revenue on privatisations.
Comprehensive Result - Total Change in Net Worth
The comprehensive result includes revaluation of assets taken to reserves. The increase between the estimated actual and the actual result is due mainly to a revaluation of land under roads which was completed subsequent to the release of the Budget.
Public Non-financial Corporations (PNFC) Sector
The Public Non-financial Corporations sector comprises bodies such as Government-owned corporations that mainly engage in the production of goods and services (of a non-financial nature) for sale in the market place at prices that aim to recover most of the costs involved.
| - | The PNFC sector recorded a surplus of $587 million, $231 million higher than forecast mainly due to lower operating expenses; |
| - | The cash deficit of $6.384 billion is $1.074 billion lower than forecast mainly due to lower than forecast capital expenditure for water and electricity infrastructure; and |
| - | The net worth of the sector has increased due to the improved operating result and an increase in the value of rail infrastructure. |
State Financial Sector (Total State)
The Total State sector includes all State Government departments and statutory authorities, public non-financial corporations, public financial corporations and their controlled entities. All material inter-entity and intra-entity transactions and balances have been eliminated to the extent practicable.
| - | A net operating deficit of $2.571 billion was recorded in 2008-09. |
| - | The Total State cash deficit was $11.188 billion for 2008-09 after allowing for purchases of non-financial assets of $15.374 billion; and |
| - | The Total State net debt position was $11.700 billion. |
| | |
| Outcomes Report 2008-09 – Government of Queensland | | 4-05 |
2008-09 Operating Statement by Sector ($million)
| | | | | | | | | | | | | | | | | | | | | | | | | | | | | | | | | | | | |
| | | | | | | General Government
Sector | | | | | Public Non-financial
Corporations Sector | | | | | Non-financial Public
Sector | | | | | Public Financial
Corporations
Sector | | | | | State
Financial
Sector | |
| | | | | | | Est. Actual | | | Actual | | | | | Est. Actual | | | Actual | | | | | Est. Actual | | | Actual | | | | | Actual (b) | | | | | Actual (b) | |
| | | | | Revenue from Transactions | | | | | | | | | | | | | | | | | | | | | | | | | | | | | | | | |
| | | | | Taxation revenue | | 8,759 | | | 8,877 | | | | | - | | | - | | | | | 8,524 | | | 8,619 | | | | | - | | | | | 8,615 | |
| | | | | Grants revenue | | 17,272 | | | 17,476 | | | | | 1,877 | | | 2,119 | | | | | 17,350 | | | 17,596 | | | | | - | | | | | 17,596 | |
| | | | | Sales of goods and services | | 3,466 | | | 3,568 | | | | | 8,307 | | | 7,807 | | | | | 11,570 | | | 10,867 | | | | | 1,133 | | | | | 11,775 | |
| | | | | Interest income | | 1,261 | | | 1,482 | | | | | 139 | | | 150 | | | | | 1,397 | | | 1,632 | | | | | 3,542 | | | | | 1,033 | |
| | | | | Dividend and income tax equivalent income | | 1,098 | | | 1,180 | | | | | - | | | - | | | | | 26 | | | 61 | | | | | - | | | | | 1 | |
| | | | | Other revenue | | 4,017 | | | 4,425 | | | | | 633 | | | 465 | | | | | 4,644 | | | 4,885 | | | | | 57 | | | | | 4,942 | |
| | | | | Total Revenue from Transactions | | 35,874 | | | 37,008 | | | | | 10,956 | | | 10,541 | | | | | 43,510 | | | 43,659 | | | | | 4,732 | | | | | 43,961 | |
| Less | | | | Expenses from Transactions | | | | | | | | | | | | | | | | | | | | | | | | | | | | | | | | |
| | | | | Employee expenses | | 14,249 | | | 14,305 | | | | | 2,342 | | | 2,112 | | | | | 16,504 | | | 16,313 | | | | | 181 | | | | | 16,351 | |
| | | | | Superannuation expenses | | | | | | | | | | | | | | | | | | | | | | | | | | | | | | | | |
| | | | | Superannuation interest cost | | 760 | | | 858 | | | | | - | | | (14 | ) | | | | 760 | | | 844 | | | | | - | | | | | 844 | |
| | | | | Other superannuation expenses | | 2,012 | | | 2,012 | | | | | 78 | | | 215 | | | | | 2,090 | | | 2,227 | | | | | 13 | | | | | 2,240 | |
| | | | | Other operating expenses | | 7,446 | | | 7,185 | | | | | 4,086 | | | 3,545 | | | | | 11,305 | | | 10,200 | | | | | 1,605 | | | | | 11,719 | |
| | | | | Depreciation and amortisation | | 2,551 | | | 2,496 | | | | | 1,856 | | | 1,848 | | | | | 4,407 | | | 4,344 | | | | | 27 | | | | | 4,371 | |
| | | | | Other interest expenses | | 539 | | | 599 | | | | | 1,946 | | | 1,969 | | | | | 2,345 | | | 2,437 | | | | | 5,103 | | | | | 3,400 | |
| | | | | Grants expenses | | 8,889 | | | 9,519 | | | | | 62 | | | 89 | | | | | 7,161 | | | 7,608 | | | | | - | | | | | 7,608 | |
| | | | | Other property expenses | | - | | | - | | | | | 230 | | | 192 | | | | | - | | | - | | | | | 41 | | | | | - | |
| | | | | Total Expenses from Transactions | | 36,447 | | | 36,974 | | | | | 10,600 | | | 9,955 | | | | | 44,572 | | | 43,973 | | | | | 6,971 | | | | | 46,533 | |
| Equals | | | | Net Operating Balance | | (574 | ) | | 35 | | | | | 356 | | | 587 | | | | | (1,062 | ) | | (314 | ) | | | | (2,239 | ) | | | | (2,571 | ) |
| | | | | Other economic flows - included in operating result | | 301 | | | (122 | ) | | | | (1,378 | ) | | (770 | ) | | | | (1,716 | ) | | (1,530 | ) | | | | (2,882 | ) | | | | (4,413 | ) |
| | | | | Operating Result | | (273 | ) | | (88 | ) | | | | (1,022 | ) | | (184 | ) | | | | (2,778 | ) | | (1,845 | ) | | | | (5,121 | ) | | | | (6,984 | ) |
| | | | | Other economic flows - other movements in equity | | 5,105 | | | 29,528 | | | | | 17 | | | 7,791 | | | | | (2,599 | ) | | 31,286 | | | | | (21 | ) | | | | 36,426 | |
| | | | | Comprehensive Result - Total Change in Net Worth | | 5,378 | | | 29,441 | | | | | (1,006 | ) | | 7,607 | | | | | (5,378 | ) | | 29,441 | | | | | (5,142 | ) | | | | 29,441 | |
| | | | | KEY FISCAL AGGREGATES | | | | | | | | | | | | | | | | | | | | | | | | | | | | | | | | |
| | | | | Net Operating Balance | | (574 | ) | | 35 | | | | | 356 | | | 587 | | | | | (1,062 | ) | | (314 | ) | | | | (2,239 | ) | | | | (2,571 | ) |
| Less | | | | Net Acquisition of Non-financial Assets | | | | | | | | | | | | | | | | | | | | | | | | | | | | | | | | |
| | | | | Purchases of non-financial assets | | 7,137 | | | 6,960 | | | | | 9,059 | | | 8,353 | | | | | 16,195 | | | 15,265 | | | | | 109 | | | | | 15,374 | |
| | | | | Less Sales of non-financial assets | | 343 | | | 405 | | | | | 142 | | | 189 | | | | | 486 | | | 591 | | | | | 17 | | | | | 608 | |
| | | | | Less Depreciation | | 2,551 | | | 2,496 | | | | | 1,856 | | | 1,848 | | | | | 4,407 | | | 4,344 | | | | | 27 | | | | | 4,371 | |
| | | | | Plus Change in inventories | | 81 | | | 87 | | | | | 12 | | | 147 | | | | | 93 | | | 234 | | | | | - | | | | | 234 | |
| | | | | Plus Other movements in non-financial assets | | 99 | | | 288 | | | | | (24 | ) | | (11 | ) | | | | 76 | | | 277 | | | | | - | | | | | 277 | |
| | | | | Equals Total Net Acquisition of Non-financial Assets | | 4,422 | | | 4,434 | | | | | 7,049 | | | 6,452 | | | | | 11,471 | | | 10,840 | | | | | 65 | | | | | 10,906 | |
| | | | | Equals Net Lending / (Borrowing) | | (4,996 | ) | | (4,399 | ) | | | | (6,693 | ) | | (5,866 | ) | | | | (12,533 | ) | | (11,155 | ) | | | | (2,304 | ) | | | | (13,477 | ) |
Notes | | | | (a) Numbers may not add due to rounding. | |
| | | | | (b) In accordance with UPF requirements, estimates for Public Financial Corporations and State Financial sectors are not included in Budget documentation. | |
| | |
| Outcomes Report 2008-09 – Government of Queensland | | 4-06 |
2008-09 Balance Sheet by Sector ($million)
| | | | | | | | | | | | | | | | | | | | | | | | |
| | | General Government
Sector | | | Public Non-financial
Corporations Sector | | | Non-financial Public
Sector | | | Public Financial
Corporations
Sector | | | State
Financial
Sector | |
| | | Est. Actual | | | Actual | | | Est. Actual | | | Actual | | | Est. Actual | | | Actual | | | Actual (b) | | | Actual (b) | |
| | | | | | | | | |
Assets | | | | | | | | | | | | | | | | | | | | | | | | |
Financial assets | | | | | | | | | | | | | | | | | | | | | | | | |
Cash and deposits | | 2,298 | | | 2,848 | | | 1,216 | | | 2,135 | | | 3,514 | | | 4,983 | | | 15 | | | 1,055 | |
Advances paid | | 564 | | | 575 | | | 288 | | | 311 | | | 838 | | | 873 | | | - | | | 873 | |
Investments, loans and placements | | 26,195 | | | 26,624 | | | 442 | | | 684 | | | 26,637 | | | 27,308 | | | 91,312 | | | 54,615 | |
Receivables | | 3,244 | | | 3,484 | | | 1,579 | | | 1,813 | | | 3,663 | | | 3,913 | | | 161 | | | 3,980 | |
Equity | | | | | | | | | | | | | | | | | | | | | | | | |
Investments in other public sector entities | | 15,205 | | | 23,954 | | | - | | | - | | | (3,713 | ) | | (3,577 | ) | | - | | | - | |
Investments - other | | 38 | | | 39 | | | 81 | | | 74 | | | 120 | | | 113 | | | 1 | | | 114 | |
Total financial assets | | 47,544 | | | 57,523 | | | 3,606 | | | 5,018 | | | 31,058 | | | 33,613 | | | 91,488 | | | 60,638 | |
| | | | | | | | | |
Non-financial Assets | | | | | | | | | | | | | | | | | | | | | | | | |
Land and other fixed assets | | 140,766 | | | 165,852 | | | 57,560 | | | 64,487 | | | 198,262 | | | 230,274 | | | 234 | | | 230,509 | |
Other non-financial assets | | 6,220 | | | 6,474 | | | 1,576 | | | 1,657 | | | 553 | | | 512 | | | 447 | | | 506 | |
Total Non-financial Assets | | 146,987 | | | 172,326 | | | 59,135 | | | 66,145 | | | 198,815 | | | 230,786 | | | 681 | | | 231,015 | |
| | | | | | | | | |
Total assets | | 194,531 | | | 229,849 | | | 62,741 | | | 71,163 | | | 229,873 | | | 264,399 | | | 92,169 | | | 291,653 | |
| | | | | | | | | |
Liabilities | | | | | | | | | | | | | | | | | | | | | | | | |
Payables | | 2,536 | | | 3,390 | | | 2,159 | | | 2,676 | | | 3,553 | | | 4,711 | | | 254 | | | 4,871 | |
Superannuation liability | | 23,949 | | | 23,424 | | | (76 | ) | | 130 | | | 23,873 | | | 23,554 | | | - | | | 23,554 | |
Other employee benefits | | 4,012 | | | 4,201 | | | 904 | | | 851 | | | 4,916 | | | 5,052 | | | 60 | | | 5,111 | |
Deposits held | | 4 | | | 4 | | | 26 | | | - | | | 30 | | | 4 | | | 29,888 | | | 3,671 | |
Advances received | | 481 | | | 484 | | | 13 | | | 13 | | | 481 | | | 484 | | | - | | | 484 | |
Borrowing | | 10,765 | | | 10,278 | | | 33,524 | | | 32,368 | | | 44,288 | | | 42,645 | | | 63,169 | | | 64,088 | |
Other liabilities | | 2,985 | | | 3,450 | | | 7,208 | | | 7,528 | | | 2,932 | | | 3,330 | | | 2,377 | | | 5,254 | |
Total liabilities | | 44,731 | | | 45,230 | | | 43,759 | | | 43,568 | | | 80,072 | | | 79,780 | | | 95,747 | | | 107,034 | |
| | | | | | | | | |
Net Worth | | 149,800 | | | 184,619 | | | 18,982 | | | 27,595 | | | 149,800 | | | 184,619 | | | (3,578 | ) | | 184,619 | |
Net Financial Worth | | 2,814 | | | 12,293 | | | (40,153 | ) | | (38,549 | ) | | (49,014 | ) | | (46,167 | ) | | (4,259 | ) | | (46,396 | ) |
Net Financial Liabilities | | 12,391 | | | 11,660 | | | 40,153 | | | 38,549 | | | 45,301 | | | 42,590 | | | 4,259 | | | 46,396 | |
Net Debt | | (17,808 | ) | | (19,281 | ) | | 31,618 | | | 29,250 | | | 13,810 | | | 9,970 | | | 1,730 | | | 11,700 | |
(a) Numbers may not add due to rounding. (b) In accordance with UPF requirements, estimates for Public Financial Corporations and State Financial sectors are not included in Budget documentation. (c) Estimated Actuals have been restated where subsequent changes in classification have occurred, to ensure comparability with estimates. | |
| | |
| Outcomes Report 2008-09 – Government of Queensland | | 4-07 |
2008-09 Cash Flow Statement by Sector ($million)
| | | | | | | | | | | | | | | | | | | | | | | | | | | | | | |
| | | | | | | | | General Government
Sector | | | Public Non-financial
Corporations Sector | | | Non-financial Public
Sector | | | Public Financial
Corporations
Sector | | | State
Financial
Sector | |
| | | | | | | | | Est. Actual | | | Actual | | | Est. Actual | | | Actual | | | Est. Actual | | | Actual | | | Actual (b) | | | Actual (b) | |
| | | Cash Receipts from Operating Activities | | | | | | | | | | | | | | | | | | | | | | | | |
| | | Taxes received | | 8,801 | | | 8,824 | | | - | | | - | | | 8,566 | | | 8,590 | | | - | | | 8,586 | |
| | | Grants and subsidies received | | 17,122 | | | 17,396 | | | 1,889 | | | 2,014 | | | 17,199 | | | 17,488 | | | - | | | 17,488 | |
| | | Sales of goods and services | | 3,910 | | | 4,101 | | | 8,982 | | | 8,794 | | | 12,686 | | | 12,498 | | | 1,317 | | | 13,584 | |
| | | Interest receipts | | 1,257 | | | 1,482 | | | 135 | | | 153 | | | 1,389 | | | 1,636 | | | 3,506 | | | 1,001 | |
| | | Dividends and income tax equivalents | | 1,145 | | | 1,139 | | | - | | | - | | | 18 | | | 43 | | | - | | | - | |
| | | Other receipts | | 4,665 | | | 5,426 | | | 871 | | | 1,018 | | | 5,529 | | | 6,438 | | | 42 | | | 6,478 | |
| | | Total | | 36,899 | | | 38,368 | | | 11,877 | | | 11,980 | | | 45,387 | | | 46,693 | | | 4,865 | | | 47,136 | |
| | | Cash Payments for Operating Activities | | | | | | | | | | | | | | | | | | | | | | | | |
| | | Payments for employees | | (15,992 | ) | | (15,791 | ) | | (2,299 | ) | | (2,240 | ) | | (18,204 | ) | | (17,926 | ) | | (197 | ) | | (17,981 | ) |
| | | Payments for goods and services | | (8,067 | ) | | (8,281 | ) | | (4,778 | ) | | (4,598 | ) | | (12,655 | ) | | (12,528 | ) | | (85 | ) | | (12,517 | ) |
| | | Grants and subsidies | | (8,898 | ) | | (9,231 | ) | | (16 | ) | | (43 | ) | | (7,109 | ) | | (7,352 | ) | | (1 | ) | | (7,352 | ) |
| | | Interest paid | | (534 | ) | | (597 | ) | | (1,516 | ) | | (1,662 | ) | | (1,910 | ) | | (2,140 | ) | | (5,100 | ) | | (3,240 | ) |
| | | Other payments | | (759 | ) | | (754 | ) | | (885 | ) | | (733 | ) | | (1,402 | ) | | (1,297 | ) | | (1,217 | ) | | (2,469 | ) |
| | | Total | | (34,250 | ) | | (34,653 | ) | | (9,494 | ) | | (9,276 | ) | | (41,279 | ) | | (41,243 | ) | | (6,600 | ) | | (43,559 | ) |
| | | Net Cash Inflows from Operating Activities | | 2,649 | | | 3,716 | | | 2,382 | | | 2,705 | | | 4,108 | | | 5,450 | | | (1,735 | ) | | 3,577 | |
| | | Cash Flows from Investments in | | | | | | | | | | | | | | | | | | | | | | | | |
| | | Non-financial Assets | | | | | | | | | | | | | | | | | | | | | | | | |
| | | Purchases of non-financial assets | | (7,137 | ) | | (6,960 | ) | | (9,059 | ) | | (8,353 | ) | | (16,195 | ) | | (15,265 | ) | | (109 | ) | | (15,374 | ) |
| | | Sales of non-financial assets | | 343 | | | 405 | | | 142 | | | 189 | | | 486 | | | 591 | | | 17 | | | 608 | |
| | | Total | | (6,793 | ) | | (6,555 | ) | | (8,916 | ) | | (8,164 | ) | | (15,710 | ) | | (14,673 | ) | | (92 | ) | | (14,765 | ) |
| | | Net Cash Flows from Investments in Financial | | | | | | | | | | | | | | | | | | | | | | | | |
| | | Assets for Policy Purposes | | (229 | ) | | (253 | ) | | (824 | ) | | (931 | ) | | (604 | ) | | (733 | ) | | - | | | (733 | ) |
| | | Net Cash Flows for Investments in Financial | | | | | | | | | | | | | | | | | | | | | | | | |
| | | Assets for Liquidity Purposes | | (436 | ) | | (870 | ) | | 25 | | | (62 | ) | | (411 | ) | | (932 | ) | | (5,600 | ) | | (5,380 | ) |
| | | Receipts from Financing Activities | | | | | | | | | | | | | | | | | | | | | | | | |
| | | Advances received (net) | | (24 | ) | | (26 | ) | | - | | | - | | | (24 | ) | | (26 | ) | | - | | | (26 | ) |
| | | Borrowing (net) | | 4,014 | | | 3,728 | | | 7,208 | | | 7,141 | | | 11,222 | | | 10,868 | | | (11,873 | ) | | (882 | ) |
| | | Dividends paid | | - | | | - | | | (924 | ) | | (925 | ) | | - | | | - | | | (2 | ) | | - | |
| | | Deposits received (net) | | - | | | - | | | 26 | | | - | | | 26 | | | - | | | 1,085 | | | (132 | ) |
| | | Other financing (net) | | (1 | ) | | - | | | 327 | | | 460 | | | (123 | ) | | 8 | | | 18,201 | | | 18,210 | |
| | | Total | | 3,989 | | | 3,701 | | | 6,638 | | | 6,676 | | | 11,101 | | | 10,850 | | | 7,411 | | | 17,170 | |
| | | Net Increase/(Decrease) in Cash Held | | (821 | ) | | (261 | ) | | (696 | ) | | 223 | | | (1,517 | ) | | (38 | ) | | (16 | ) | | (131 | ) |
| | | Net cash from operating activities | | 2,649 | | | 3,716 | | | 2,382 | | | 2,705 | | | 4,108 | | | 5,450 | | | (1,735 | ) | | 3,577 | |
| | | Net cash from investments in non-financial assets | | (6,793 | ) | | (6,555 | ) | | (8,916 | ) | | (8,164 | ) | | (15,710 | ) | | (14,673 | ) | | (92 | ) | | (14,765 | ) |
| | | Dividends paid | | - | | | - | | | (924 | ) | | (925 | ) | | - | | | - | | | (2 | ) | | - | |
| | | Cash Surplus/(Deficit) | | (4,144 | ) | | (2,839 | ) | | (7,458 | ) | | (6,384 | ) | | (11,602 | ) | | (9,223 | ) | | (1,830 | ) | | (11,188 | ) |
| | | Derivation of ABS GFS Cash Surplus/Deficit | | | | | | | | | | | | | | | | | | | | | | | | |
| | | Cash surplus/(deficit) | | (4,144 | ) | | (2,839 | ) | | (7,458 | ) | | (6,384 | ) | | (11,602 | ) | | (9,223 | ) | | (1,830 | ) | | (11,188 | ) |
| | | Acquisitions under finance leases and similar arrangements | | - | | | (20 | ) | | - | | | (6 | ) | | - | | | (26 | ) | | - | | | (26 | ) |
| | | ABS GFS Cash Surplus/(Deficit) Including | | | | | | | | | | | | | | | | | | | | | | | | |
| | | Finance Leases and Similar Arrangements | | (4,144 | ) | | (2,859 | ) | | (7,458 | ) | | (6,390 | ) | | (11,602 | ) | | (9,250 | ) | | (1,830 | ) | | (11,215 | ) |
| | | Notes | | (a) | | Numbers may not add due to rounding. | |
| | | | | (b) | | In accordance with UPF requirements, estimates for Public Financial Corporations and State Financial sectors are not included in Budget documentation. | |
| | |
| Outcomes Report 2008-09 – Government of Queensland | | 4-08 |
Other General Government UPF Data
Data in the following tables is presented in accordance with the Uniform Presentation Framework.
General Government Sector Taxes
| | |
| | | 2008-09
Outcome
$ million |
| | |
Taxes on employers’ payroll and labour force | | 2,754 |
| | |
Taxes on property | | |
Land taxes | | 838 |
Stamp duties on financial and capital transactions | | 1,823 |
Other | | 435 |
| | |
Taxes on the provision of goods and services | | |
Taxes on gambling | | 922 |
Taxes on insurance | | 491 |
| | |
Taxes on use of goods and performance of activities | | |
Motor vehicle taxes | | 1,474 |
Other | | 140 |
| | |
Total Taxation Revenue | | 8,877 |
Note: 1. Numbers may not add due to rounding. | | |
General Government Sector
Dividend and Income Tax Equivalent Income
| | |
| | | 2008-09
Outcome
$ million |
| | |
Dividend and Income Tax Equivalent income from PNFC sector | | 1,120 |
Dividend and Income Tax Equivalent income from PFC sector | | 59 |
Other dividend income | | 1 |
| | |
Total Dividend and Income Tax Equivalent income | | 1,180 |
Note: 1. Numbers may not add due to rounding. | | |
| | |
| Outcomes Report 2008-09 – Government of Queensland | | 4-09 |
Other General Government UPF Data
General Government Sector Grant Revenue
| | |
| | | 2008-09
Outcome
$ million |
| | |
Current grant revenue | | |
| | |
Current grants from the Commonwealth | | |
General purpose grants | | 8,367 |
Specific purpose grants | | 4,597 |
Specific purpose grants for on-passing | | 1,805 |
Total current grants from the Commonwealth | | 14,769 |
Other contributions and grants | | 503 |
Total current grant revenue | | 15,272 |
| | |
Capital grant revenue | | |
| | |
Capital grants from the Commonwealth | | |
Specific purpose grants | | 2,075 |
Specific purpose grants for on-passing | | 119 |
Total capital grants from the Commonwealth | | 2,194 |
Other contributions and grants | | 10 |
Total capital grant revenue | | 2,204 |
| | |
Total grant revenue | | 17,476 |
Note: 1. Numbers may not add due to rounding. | | |
General Government Sector Grant Expenses
| | |
| | | 2008-09
Outcome
$ million |
| | |
Current grant expenses | | |
| | |
Private and Not-for-profit sector | | 3,538 |
Private and Not-for-profit sector on-passing | | 1,433 |
Local Government | | 320 |
Local Government on-passing | | 372 |
Grants to other sectors of Government | | 2,025 |
Other | | 360 |
Total current grant expense | | 8,049 |
| | |
Capital grant expenses | | |
| | |
Private and Not-for-profit sector | | 292 |
Private and Not-for-profit sector on-passing | | 15 |
Local Government | | 567 |
Households sector on-passing | | 193 |
Grants to other sectors of Government | | 47 |
Other | | 356 |
Total capital grant expenses | | 1,470 |
| | |
Total grant expenses | | 9,519 |
Note: 1. Numbers may not add due to rounding. | | |
| | |
| Outcomes Report 2008-09 – Government of Queensland | | 4-10 |
General Government Sector Expenses by Function
| | |
| | | 2008-09 |
| | | Outcome |
| | | $ |
| | | million |
| |
General Public Services | | 1,564 |
Other general public services | | 1,564 |
| |
Public Order and Safety | | 3,172 |
Police and fire protection services | | 1,878 |
Law courts and legal services | | 656 |
Prisons and corrective services | | 548 |
Other public order and safety | | 90 |
| |
Education | | 8,197 |
Primary and secondary education | | 6,380 |
Tertiary education | | 740 |
Pre-school education and education not definable by level | | 741 |
Transportation of students | | 147 |
Education n.e.c. | | 189 |
| |
Health | | 9,604 |
Acute care institutions | | 6,396 |
Mental health institutions | | 253 |
Nursing homes for the aged | | 208 |
Community health services | | 2,185 |
Public health services | | 318 |
Health research | | 120 |
Health administration n.e.c. | | 124 |
| |
Social Security and Welfare | | 1,838 |
Welfare services | | 1,800 |
Social security and welfare n.e.c. | | 38 |
| |
Housing and Community Amenities | | 1,424 |
Housing and community development | | 1,218 |
Water supply | | 63 |
Sanitation and protection of the environment | | 143 |
| |
Recreation and Culture | | 819 |
Recreation facilities and services | | 538 |
Cultural facilities and services | | 281 |
| | |
| | | 2008-09 |
| | | Outcome |
| | | $ |
| | | million |
| |
Fuel and Energy | | 1,227 |
Fuel affairs and services | | 649 |
Electricity and other energy | | 578 |
| |
| | |
Agriculture, Forestry, Fishing and Hunting | | 1,117 |
Agriculture | | 1,002 |
Forestry, fishing and hunting | | 115 |
| |
Mining, manufacturing and construction | | 200 |
Mining and mineral resources other than fuels | | 90 |
Construction | | 110 |
| |
Transport and Communications | | 4,644 |
Road transport | | 2,314 |
Water transport | | 140 |
Rail transport | | 822 |
Air transport | | 13 |
Other transport | | 1,330 |
Communications | | 25 |
| |
Other Economic Affairs | | 852 |
Tourism and area promotion | | 80 |
Labour and employment affairs | | 450 |
Other economic affairs | | 322 |
| |
Other Purposes | | 2,316 |
Nominal superannuation interest | | 858 |
Public debt transactions | | 586 |
General purpose inter-government transactions | | 722 |
Natural disaster relief | | 150 |
| |
| | |
| | |
Total | | 36,974 |
| | |
| | |
| Outcomes Report 2008–09 – Government of Queensland | | 4-11 |
General Government Sector Purchases of Non-financial Assets by
Function and Loan Council Allocation
General Government Sector
Purchases of Non-financial Assets by Function
| | |
| | | 2008-09
Outcome
$ million |
| | |
General public services | | 449 |
Public order and safety | | 634 |
Education | | 580 |
Health | | 868 |
Social security and welfare | | 83 |
Housing and community amenities | | 397 |
Recreation and culture | | 112 |
Fuel and energy | | 11 |
Agriculture, forestry, fishing and hunting | | 51 |
Mining, manufacturing and construction | | 8 |
Transport and communications | | 3,630 |
Other economic affairs | | 137 |
| | |
Total | | 6,960 |
| | | |
| Note: | | |
1. Numbers may not add due to rounding | | |
Loan Council Allocation
The Australian Loan Council requires all jurisdictions to advise the Loan Council Allocation (LCA) outcome for the last financial year as part of the annual Outcomes Report. The LCA represents each government’s call on financial markets for a given financial year. A tolerance limit of two percent of non-financial public sector receipts applies between the LCA budget update and the outcome. The LCA outcome exceeds the Budget estimate by more than this.
The main reason for the lower Non-financial Public Sector cash deficit is lower than budgeted capital spending particularly on water infrastructure.
| | | | | | |
| | | 2008-09
Budget
$ million | | | 2008-09
Outcome
$ million | |
| | | |
General Government sector cash deficit/(surplus)1 | | 1,970 | | | 2,839 | |
PNFC sector cash deficit/(surplus)1 | | 8,468 | | | 6,384 | |
Non-financial Public Sector cash deficit/(surplus)1 | | 10,438 | | | 9,223 | |
Acquisitions under finance leases and similar arrangements | | (152 | ) | | (26 | ) |
ABS GFS cash deficit/(surplus) | | 10,590 | | | 9,249 | |
Net cash flows from investments in financial assets for policy purposes | | (324 | ) | | (733 | ) |
Memorandum items2 | | 506 | | | (341 | ) |
| | | |
LOAN COUNCIL ALLOCATION | | 11,420 | | | 9,641 | |
| | | | | | | |
| Notes: | | | | | | |
1. Figures in brackets represent surpluses 2. Other memorandum items include operating leases and local government borrowings | | | | | | |
| | |
| Outcomes Report 2008–09 – Government of Queensland | | 4-12 |
Certification of Outcomes Report
Management Certification
The foregoing Outcomes Report contains financial statements prepared and presented in accordance with the Uniform Presentation Framework (UPF) agreed to at the 1991 Premiers’ Conference and revised in October 2007 to align with AASB 1049 Whole of Government and General Government Sector Financial Reporting.
The Report separately discloses outcomes for the General Government, Public Non-financial Corporations, Public Financial Corporations and State Financial sectors within Queensland. Entities excluded from this report include local governments and universities. Queensland public sector entities consolidated for this report are listed in the AASB 1049 Financial Statements, taking into account intra and inter-agency eliminations.
Only those agencies considered material by virtue of their financial transactions and balances are consolidated in this report.
In our opinion, we certify that the Outcomes Report has been properly drawn up, in accordance with UPF requirements, to present a true and fair view of:
| (i) | the operating statement and cash flows of the Queensland State Government for the financial year; and | |
| (ii) | the balance sheet of the Government at 30 June 2009. | |
At the date of certification of this report, we are not aware of any material circumstances that would render any particulars included in the Outcomes Report misleading or inaccurate.
| | |
| Leigh Pickering | | Gerard Bradley, CPA FCA |
| Director | | Under Treasurer |
| Fiscal and Taxation Policy | | Queensland Treasury |
| Queensland Treasury | | |
|
| Date 7 October 2009 |
| | |
| Outcomes Report 2008–09 – Government of Queensland | | 4-13 |
2008-09
AASB 1049 Financial Statements
Overview and Analysis – 30 June 2009
Queensland
Government
AASB 1049 - Overview and Analysis
The following analysis compares current year General Government sector (GGS) and Total State performance with last year’s balances, restated for changes in accounting policies, presentational and timing differences and errors.
The new AASB 1049 Whole of Government and General Government Sector Financial Reporting has harmonised the disclosure presentation to be consistent with the Uniform Presentation Framework disclosed in the Outcomes Report.
Summary of Key Financial Aggregates of the Consolidated Financial Statements
The table below provides aggregate information under AASB1049:
| | | | | | | | | | | | |
| | | | | General Government | | Total State | | |
| | | | 2009 | | 2008 | | 2009 | | 2008 | | |
| | | | $ million | | $ million | | $ million | | $ million | | |
| | | | | | | |
| | | Revenue from Transactions | | | | | | | | | | |
| | | Taxation revenue | | 8,877 | | 9,546 | | 8,615 | | 9,349 | | |
| | | Grants revenue | | 17,476 | | 15,510 | | 17,596 | | 16,006 | | |
| | | Sales of goods and services | | 3,568 | | 3,357 | | 11,775 | | 11,439 | | |
| | | Interest income | | 1,482 | | (275) | | 1,033 | | 1,600 | | |
| | | Dividend and income tax equivalents income | | 1,180 | | 1,244 | | 1 | | 24 | | |
| | | Other revenue | | 4,425 | | 2,041 | | 4,942 | | 2,451 | | |
| | | Total Revenue from Transactions | | 37,008 | | 31,424 | | 43,961 | | 40,869 | | |
| | | | | | | |
| | | Expenses from Transactions | | | | | | | | | | |
| | | Employee expenses | | 14,305 | | 13,175 | | 16,351 | | 15,090 | | |
| | | Superannuation expenses | | 2,870 | | 2,681 | | 3,084 | | 2,857 | | |
| | | Other operating expenses | | 7,185 | | 6,646 | | 11,719 | | 11,251 | | |
| | | Depreciation and amortisation | | 2,496 | | 1,851 | | 4,371 | | 3,506 | | |
| | | Other interest expense | | 599 | | 347 | | 3,400 | | 2,673 | | |
| | | Grants expenses | | 9,519 | | 8,329 | | 7,608 | | 6,592 | | |
| | | Total Expenses from Transactions | | 36,974 | | 33,030 | | 46,533 | | 41,970 | | |
| | | Net Operating Balance | | 35 | | (1,606) | | (2,572) | | (1,100) | | |
| | | Other Economic Flows - Included in Operating Result | | (122) | | 1,229 | | (4,413) | | 321 | | |
| | | Operating Result | | (88) | | (377) | | (6,985) | | (779) | | |
| | | | | | | |
| | | Other Economic Flows - Other Movements in Equity | | (9,131) | | 75,683 | | (2,234) | | 76,078 | | |
| | | Comprehensive Result | | (9,219) | | 75,306 | | (9,219) | | 75,299 | | |
| | | Transactions With Owners In Their Capacity as owners | | - | | - | | - | | (100) | | |
| | | Total Change In Net Worth | | (9,219) | | 75,306 | | (9,219) | | 75,199 | | |
| | | | | | | |
| | | Assets | | 229,849 | | 232,259 | | 291,652 | | 276,630 | | |
| | | Liabilities | | 45,230 | | 38,422 | | 107,034 | | 82,793 | | |
| | | Net Worth | | 184,619 | | 193,838 | | 184,619 | | 193,838 | | |
| | |
| State Finances Report 2008–09 – Government of Queensland | | 5-01 |
AASB 1049 - Overview and Analysis
Net Operating Balance
The General Government sector net operating balance was a surplus of $35 million, an improvement of $1.640 billion over the previous year, mainly due to higher royalty income in 2008-09 and negative investment earnings in 2007-08. The majority of these investments were transferred to QTC on 1 July 2008, meaning their impact shows in the total State and not the General Government sector.
The State net operating balance was a deficit of $2.752 billion compared to a deficit of $1.1 billion in 2007-08.
Revenue
Revenue from transactions has increased from 2007-08 by $5.584 billion to be $37.008 billion in the General Government sector and totals $43.961 billion in the total State sector, an increase of $3.092 billion over 2007-08.
Revenues by type for the General Government and State sectors are shown in the following chart:
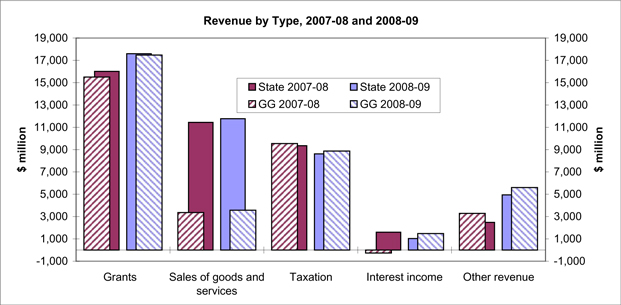
Commonwealth and other grants comprised 47% of General Government revenue and 40% of Total State revenue. Grant revenue increased by $1.966 billion for General Government (up from $15.510 billion) and increased by $1.590 billion for the State (up from $16.006 billion). The majority of this increase was due to the Commonwealth’s Nation Building and Jobs Plan as well as increased Specific Purpose and National Partnership Payments in line with new funding agreements with the Commonwealth.
Taxation revenue reduced in 2008-09 by $669 million for General Government and $734 million for the State. Transfer duty revenue fell by $1.106 billion, reflecting a slowing in activity in the property market.
Interest income in the General Government sector grew by $1.757 billion, reflecting the transfer of the majority of long term investments to QTC in exchange for a fixed return of 7.5%. The fixed return of 7.5% represents an improvement over the negative 2.24% return recorded in 2007-08.
Interest income for the Total State decreased by $567 million to $1.033 billion due to investment returns of -15% in 2008-09 compared to -2.24% in 2007-08.
Royalties, included in other revenue, have increased in 2008-09 by $1.99 billion for both the General Government and the State sectors, reflecting the strength of the commodities market in 2008-09.
| | |
| State Finances Report 2008–09 – Government of Queensland | | 5-02 |
AASB 1049 - Overview and Analysis
Expenses
Total expenses for 2008-09 were $36.974 billion for the General Government sector and $46.533 billion for the State, an increase from 2007-08 of $3.944 billion and $4.563 billion respectively.
Expenses by type are shown in the following chart:
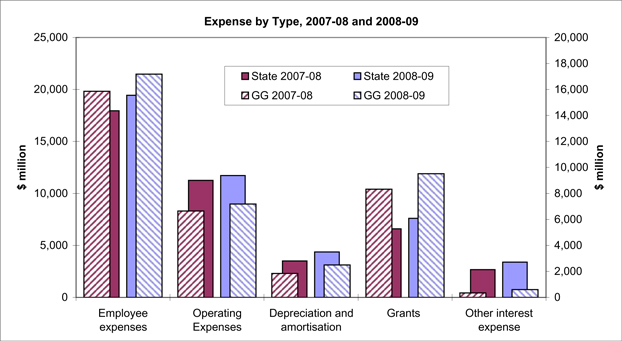
Employee expenses increased in 2008-09 for both the General Government and the State sectors as a result of enterprise bargaining agreements and increased service delivery, particularly in the areas of Health and Education.
Other operating expenses have increased by $539 million for the General Government and $468 million for the State mainly on Health and Education, primarily reflecting the expenditure associated with increased Commonwealth payments. The State increase is also due to WorkCover Queensland claims expenses.
Depreciation costs increased by $645 million to $2.496 billion for General Government sector and by $865 million to $4.371 billion for State. The increase is mainly due to road infrastructure revaluations in 2007-08, flowing through to the 2008-09 depreciation expense.
Grant expenses were $9.519 billion for the General Government sector and $7.608 billion for the State. Both sectors had an increase in grant payments in excess of $1 billion from 2007-08. This increase is mainly due to increased payments for Health and Infrastructure and includes additional grants for on-passing from the Commonwealth.
The State had interest expenses of $3.4 billion in 2008-09, a $727 million increase from 2007-08. This increase is the result of increased borrowing, including the forward borrowing undertaken by QTC.
Operating Result
The operating result is the surplus or deficit for the year under the Accounting Standards framework. Valuation and other adjustments such as deferred tax and privatisation dividends are shown as other economic flows and are included in the operating result.
The General Government sector operating result for the 2008-09 year was a deficit of $88 million (2008, $377 million deficit). The higher other economic flows in 2007-08 are mainly due to privatisation dividends on the sale of the electricity businesses.
The State operating result was a deficit of $6.985 billion (2008, $779 million deficit), mainly due to the market value adjustments to investments and borrowings and asset write-downs, which are shown in the other economic flows line.
| | |
| State Finances Report 2008–09 – Government of Queensland | | 5-03 |
AASB 1049 - Overview and Analysis
Assets
Assets controlled by the General Government sector at 30 June 2009 totalled $229.849 billion (2008, $232.259 billion).
Assets controlled by the State at 30 June 2009 totalled $291.652 billion (2008, $276.630 billion).
The decrease of $2.410 billion in assets for the General Government sector is due to lower property, plant and equipment as a result of the downward revaluation of infrastructure ($14.611 billion). This is partially offset by upward revaluations on land ($4.071 billion) and continuing work on capital projects ($4.611 billion).
The increase of $15.022 billion in assets for the State is due to:
| | - | higher property, plant and equipment balance of $225.181 billion, up from $215.916 billion in 2008. This increase is due to continuing work on capital projects and upward revaluation of Queensland Rail non-financial assets by $7.444 billion; and |
| | - | increased holding of securities and bonds, up by $5.189 billion. This increase results from the investment of forward borrowing by QTC, offset by losses on investments held to meet superannuation and other obligations. |
The main types of assets owned by the State are detailed in the following chart:
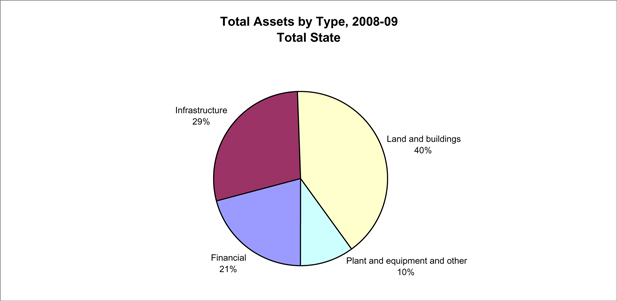
Of the Total State Assets, General Government assets comprise 79%, made up of:
| | | | |
| | | $M | | |
Financial | | 57,523 | |
Infrastructure | | 44,024 | |
Land and Buildings | | 113,380 | |
Plant and Equipment and other | | 14,921 | |
| | |
| State Finances Report 2008–09 – Government of Queensland | | 5-04 |
AASB 1049 - Overview and Analysis
Liabilities
Liabilities of the Queensland Government at 30 June 2009 totalled $45.230 billion for the General Government sector and $107.034 billion for the State. This was an increase of $6.808 billion over 2007-08 for General Government and $24.241 billion for the State.
The increase in liabilities for the General Government sector is largely due to:
| | - | an increase in interest bearing liabilities ($3.952 billion) reflecting increased borrowing by the General Government sector to fund major capital projects; and |
| | - | employee benefit obligations such as superannuation and long service leave liabilities increasing by $2.492 billion. |
The increase in liabilities for the State is largely due to:
| | - | employee benefit obligations such as superannuation and long service leave liabilities increasing by $2.182 billion; and |
| | - | Government issued securities, to finance capital acquisitions and forward borrowings, increased by $21.896 billion. |
The components of State liabilities are shown in the following chart:
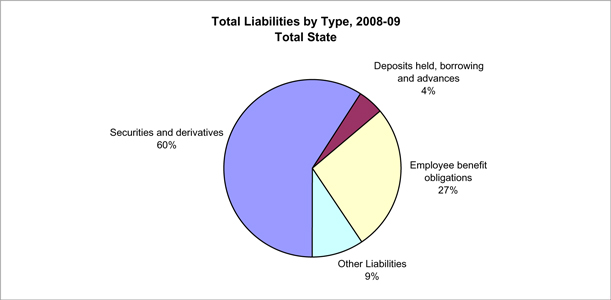
Of the Total State Liabilities, General Government liabilites comprise 42%, made up of:
| | | | |
| | | $M | | |
Deposits held, borrowing and advances | | 10,766 | |
Employee benefit obligations | | 27,625 | |
Other Liabilities | | 6,840 | |
Cash Flow Statement
The General Government sector recorded net cash flows from operating activities of $3.716 billion. The State recorded net cash flows from operating activities for the 2008-09 financial year of $3.577 billion.
Capital purchases by the General Government sector were $6.960 billion, up $1.235 billion from 2007-08. Capital purchases by the State were $15.374 billion, up $1.327 billion from 2007-08.
An increase in net borrowings for the State of $17.170 biliion was undertaken in 2008-09 to fund growth in capital outlays for the State. Net borrowings for the General Government sector increased by $3.701 billion.
| | |
| State Finances Report 2008–09 – Government of Queensland | | 5-05 |
2008-09
Audited Information
Financial Statements of the
Queensland General Government Sector
30 June 2009
Queensland
Government
Operating Statement for the Queensland General Government Sector
for the Year Ended 30 June 2009
| | | | | | | | | | | | | | |
| | | | | | | | 2009 | | | | | 2008 | |
| | | | Notes | | | | $M | | | | | $M | |
| | Revenue from Transactions | | | | | | | | | | | | |
| | Taxation revenue | | 2 | | | | 8,877 | | | | | 9,546 | |
| | Grants revenue | | 3 | | | | 17,476 | | | | | 15,510 | |
| | Sales of goods and services | | 4 | | | | 3,568 | | | | | 3,357 | |
| | Interest income | | 5 | | | | 1,482 | | | | | (275 | ) |
| | Dividend and income tax equivalents income | | 6 | | | | 1,180 | | | | | 1,244 | |
| | Other revenue | | 7 | | | | 4,425 | | | | | 2,041 | |
| | Total Revenue from Transactions | | | | | | 37,008 | | | | | 31,424 | |
| | | | | | |
Less | | Expenses from Transactions | | | | | | | | | | | | |
| | Employee expenses | | 8 | | | | 14,305 | | | | | 13,175 | |
| | Superannuation expenses | | | | | | | | | | | | |
| | Superannuation interest cost | | 9 | | | | 858 | | | | | 816 | |
| | Other superannuation expenses | | 9 | | | | 2,012 | | | | | 1,865 | |
| | Other operating expenses | | 10 | | | | 7,185 | | | | | 6,646 | |
| | Depreciation and amortisation | | 11 | | | | 2,496 | | | | | 1,851 | |
| | Other interest expense | | 12 | | | | 599 | | | | | 347 | |
| | Grants expenses | | 13 | | | | 9,519 | | | | | 8,329 | |
| | Total Expenses from Transactions | | | | | | 36,974 | | | | | 33,030 | |
| | | | | | |
Equals | | Net Operating Balance | | | | | | 35 | | | | | (1,606 | ) |
| | | | | | |
| | Other Economic Flows - Included in Operating Result | | | | | | | | | | | | |
| | Gain on sale of assets and investments | | 14 | | | | 31 | | | | | 40 | |
| | Revaluation increments and impairment loss reversals | | 15 | | | | 1 | | | | | 10 | |
| | Loss on sale of assets and investments | | 16 | | | | (42 | ) | | | | (6 | ) |
| | Asset write-down, revaluation decrements and impairment loss | | 17 | | | | (471 | ) | | | | (260 | ) |
| | Actuarial adjustments to liabilities | | 18 | | | | 14 | | | | | 48 | |
| | Deferred income tax equivalents | | | | | | (141 | ) | | | | 136 | |
| | Dividends and tax equivalents from privatisations | | 19 | | | | 609 | | | | | 1,241 | |
| | Other | | 20 | | | | (123 | ) | | | | 20 | |
| | Total Other Economic Flows - Included in Operating Result | | | | | | (122 | ) | | | | 1,229 | |
| | | | | | |
| | Operating Result | | | | | | (88 | ) | | | | (377 | ) |
| | | | | | |
| | Other Economic Flows - Other Movements in Equity | | | | | | | | | | | | |
| | Adjustments to opening balances | | | | | | - | | | | | 38,644 | |
| | Revaluations | | 21 | | | | (9,131 | ) | | | | 37,635 | |
| | Other | | 22 | | | | - | | | | | (595 | ) |
| | Total Other Economic Flows - Other Movements in Equity | | | | | | (9,131 | ) | | | | 75,683 | |
| | | | | | |
| | Comprehensive Result - Total Change in Net Worth | | | | | | (9,219 | ) | | | | 75,306 | |
| | | | | | |
| | KEY FISCAL AGGREGATES | | | | | | | | | | | | |
| | | | | | |
| | Net Operating Balance | | | | | | 35 | | | | | (1,606 | ) |
| | | | | | |
Less | | Net Acquisition/(Disposal) of Non-Financial Assets | | | | | | | | | | | | |
| | Purchases of non-financial assets | | | | | | 6,960 | | | | | 5,725 | |
| | Less Sales of non-financial assets | | | | | | 405 | | | | | 405 | |
| | Less Depreciation | | | | | | 2,496 | | | | | 1,851 | |
| | Plus Change in inventories | | | | | | 87 | | | | | 42 | |
| | Plus Other movement in non-financial assets | | | | | | 288 | | | | | 169 | |
| | Equals Total Net Acquisition/(Disposal) of Non-Financial Assets | | | | | | 4,434 | | | | | 3,680 | |
| | | | | | |
Equals | | Net Lending/(Borrowing) | | | | | | (4,399 | ) | | | | (5,286 | ) |
This Operating Statement should be read in conjunction with the accompanying notes.
| | |
| Audited Financial Statements 2008–09 – Queensland General Government Sector | | 6-01 |
Balance Sheet for the Queensland General Government Sector
as at 30 June 2009
| | | | | | | | | | | | |
| | | | | | | 2009 | | | | | 2008 | |
| | | Notes | | | | $M | | | | | $M | |
Assets | | | | | | | | | | | | |
Financial Assets | | | | | | | | | | | | |
Cash and deposits | | 23 | | | | 2,848 | | | | | 3,109 | |
Receivables and loans | | | | | | | | | | | | |
Receivables | | 24 | | | | 3,484 | | | | | 3,314 | |
Advances paid | | 24 | | | | 575 | | | | | 560 | |
Loans paid | | 24 | | | | 22,199 | | | | | 90 | |
Securities other than shares | | 25 | | | | 4,425 | | | | | 25,659 | |
Shares and other equity investments | | | | | | | | | | | | |
Investments in public sector entities | | 26 | | | | 23,954 | | | | | 21,531 | |
Investments in other entities | | 26 | | | | 2 | | | | | 2 | |
Investments accounted for using equity method | | 26 | | | | 37 | | | | | 36 | |
Total Financial Assets | | | | | | 57,523 | | | | | 54,302 | |
| | | | | |
Non-Financial Assets | | | | | | | | | | | | |
Inventories | | 29 | | | | 506 | | | | | 419 | |
Assets held for sale | | 30 | | | | 111 | | | | | 221 | |
Investment properties | | 31 | | | | 51 | | | | | 53 | |
Biological assets | | 32 | | | | 9 | | | | | 9 | |
Property, plant and equipment | | 35 | | | | 164,417 | | | | | 170,732 | |
Intangibles | | 36 | | | | 757 | | | | | 666 | |
Deferred tax asset | | | | | | 6,236 | | | | | 5,593 | |
Other non-financial assets | | 33 | | | | 238 | | | | | 264 | |
Total Non-Financial Assets | | | | | | 172,326 | | | | | 177,958 | |
| | | | | |
Total Assets | | | | | | 229,849 | | | | | 232,259 | |
| | | | | |
Liabilities | | | | | | | | | | | | |
Payables | | 37 | | | | 3,390 | | | | | 2,641 | |
Employee benefit obligations | | | | | | | | | | | | |
Superannuation liability | | 38 | | | | 23,424 | | | | | 21,913 | |
Other employee benefits | | 38 | | | | 4,201 | | | | | 3,811 | |
Deposits held | | 39 | | | | 4 | | | | | 4 | |
Borrowings and advances | | | | | | | | | | | | |
Advances received | | 40 | | | | 484 | | | | | 501 | |
Borrowings | | 40 | | | | 10,278 | | | | | 6,327 | |
Deferred tax liability | | | | | | 1,771 | | | | | 1,357 | |
Provisions | | 42 | | | | 941 | | | | | 984 | |
Other liabilities | | 43 | | | | 738 | | | | | 883 | |
Total Liabilities | | | | | | 45,230 | | | | | 38,422 | |
| | | | | |
Net Assets | | | | | | 184,619 | | | | | 193,838 | |
| | | | | |
Net Worth | | | | | | | | | | | | |
Accumulated surplus | | | | | | 90,041 | | | | | 90,538 | |
Reserves | | | | | | 94,578 | | | | | 103,300 | |
Total Net Worth | | | | | | 184,619 | | | | | 193,838 | |
| | | | | |
KEY FISCAL AGGREGATES | | | | | | | | | | | | |
Net Financial Worth | | | | | | 12,293 | | | | | 15,880 | |
Net Financial Liabilities | | | | | | 11,660 | | | | | 5,651 | |
Net Debt | | | | | | (19,281 | ) | | | | (22,586 | ) |
This Balance Sheet should be read in conjunction with the accompanying notes.
| | |
| Audited Financial Statements 2008–09 – Queensland General Government Sector | | 6-02 |
Statement of Changes in Net Assets (Equity)
for the year ended 30 June 2009
| | | | | | | | | | | | | | |
| | | Opening Balance | | Adjustments to Opening Balances 4 | | Comprehensive Result for Period 4 | | Transactions with Owners as Owners | | Closing Balance |
| | | | Movements | | Transfers / Entity Cessation | | Actuarial Gain /Loss on Superannuation | | |
| | | | | | | |
| | | $M | | $M | | $M | | $M | | $M | | $M | | $M |
2009 | | | | | | | | | | | | | | |
Accumulated surplus | | 90,538 | | - | | (88) | | 27 | | (436) | | | | 90,041 |
Revaluation reserve - financial assets | | 12,499 | | - | | 1,803 | | (7) | | - | | | | 14,295 |
Revaluation reserve - non-financial assets | | 90,664 | | - | | (10,497) | | (17) | | - | | | | 80,150 |
Other reserves | | 137 | | - | | (1) | | (3) | | - | | | | 133 |
Minority interest | | - | | - | | - | | - | | - | | | | - |
| | | | | | | | | | | | | | |
Total equity at the end of the financial year | | 193,838 | | - | | (8,783) | | - | | (436) | | - | | 184,619 |
| | | | | | | | | | | | | | |
| | | | | |
| | | Opening Balance | | Adjustments to Opening Balances 4 | | Comprehensive Result for Period 4 | | Transactions with Owners as Owners | | Closing Balance |
| | | | Movements | | Transfers / Entity Cessation | | Actuarial Gain /Loss on Superannuation | | |
| | | | | | | |
| | | $M | | $M | | $M | | $M | | $M | | $M | | $M |
2008 | | | | | | | | | | | | | | |
Accumulated surplus 1 | | 53,522 | | 38,644 | | (377) | | 153 | | (1,404) | | - | | 90,538 |
Revaluation reserve - financial assets 2 | | 10,338 | | - | | 2,758 | | (597) | | - | | - | | 12,499 |
Revaluation reserve - non-financial assets 3 | | 54,520 | | - | | 36,280 | | (136) | | - | | - | | 90,664 |
Other reserves | | 152 | | - | | - | | (15) | | - | | - | | 137 |
Minority interest | | - | | - | | - | | - | | - | | - | | - |
| | | | | | | | | | | | | | |
Total equity at the end of the financial year | | 118,532 | | 38,644 | | 38,661 | | (595) | | (1,404) | | - | | 193,838 |
| | | | | | | | | | | | | | |
1 The opening accumulated surplus has been adjusted by $38.644 billion. This adjustment consists of an increase of $38.589 billion due to the election by the State to recognise land under roads acquired on or before 30 June 2008 in accordance with AASB 1051 Land Under Roads. An adjustment of $40 million was also made to recognise unearned revenue not previously recognised by the former Departments of Environment and Local Government. The movement in the accumulated surplus includes a restatement of $12 million for grant revenue received in prior years by the former Department of Local Government, Sport and Recreation which should have been recognised as revenue when received but which had been incorrectly recognised as revenue when the expenditure was incurred.
2 The movement in the revaluation reserve for financial assets includes a restatement of $16 million in relation to the value of the investment in the Public Non-financial Corporations sector.
3 The movement in the revaluation reserve for non-financial assets includes a restatement of $22 million for the former Departments of Main Roads and Corrective Services.
4 Adjustments to opening balances are included as part of the comprehensive result on the face of the Operating Statement as they represent changes to the comprehensive result in prior periods.
This Statement of Changes in Net Assets (Equity) should be read in conjunction with the accompanying notes.
| | |
| Audited Financial Statements 2008–09 – Queensland General Government Sector | | 6-03 |
Cash Flow Statement for the Queensland General Government Sector
for the Year Ended 30 June 2009
| | | | | | | | | | | | |
| | | | | | 2009 | | | | | 2008 | |
| | Notes | | | | $M | | | | | $M | |
Cash Flows from Operating Activities | | | | | | | | | | | | |
Cash received | | | | | | | | | | | | |
Taxes received | | | | | | 8,824 | | | | | 9,522 | |
Grants and subsidies received | | | | | | 17,396 | | | | | 15,485 | |
Sales of goods and services | | | | | | 4,101 | | | | | 3,896 | |
Interest receipts | | | | | | 1,482 | | | | | (270 | ) |
Dividends and income tax equivalents | | | | | | 1,139 | | | | | 980 | |
Other receipts | | | | | | 5,426 | | | | | 2,987 | |
| | | | | | 38,368 | | | | | 32,600 | |
Cash paid | | | | | | | | | | | | |
Payments for employees | | | | | | (15,791 | ) | | | | (15,097 | ) |
Payments for goods and services | | | | | | (8,281 | ) | | | | (7,631 | ) |
Grants and subsidies | | | | | | (9,231 | ) | | | | (8,247 | ) |
Interest paid | | | | | | (597 | ) | | | | (346 | ) |
Other payments | | | | | | (754 | ) | | | | (884 | ) |
| | | | | | (34,653 | ) | | | | (32,204 | ) |
| | | | | |
Net Cash Flows from Operating Activities | | 44 (a) | | | | 3,716 | | | | | 396 | |
| | | | | |
Cash Flows from Investing Activities | | | | | | | | | | | | |
Non-Financial Assets | | | | | | | | | | | | |
Purchases of non-financial assets | | | | | | (6,960 | ) | | | | (5,725 | ) |
Sales of non-financial assets | | | | | | 405 | | | | | 405 | |
| | | | | | (6,555 | ) | | | | (5,320 | ) |
Financial Assets (Policy Purposes) | | | | | | | | | | | | |
Equity acquisitions | | | | | | (1,232 | ) | | | | (1,140 | ) |
Equity disposals | | | | | | 979 | | | | | 1,895 | |
| | | | | | (253 | ) | | | | 755 | |
Financial Assets (Liquidity Purposes) | | | | | | | | | | | | |
Sales of investments | | | | | | 1,516 | | | | | 2,358 | |
Purchases of investments | | | | | | (2,385 | ) | | | | (277 | ) |
| | | | | | (870 | ) | | | | 2,081 | |
| | | | | |
Net Cash Flows from Investing Activities | | | | | | (7,678 | ) | | | | (2,484 | ) |
| | | | | |
Cash Flows from Financing Activities | | | | | | | | | | | | |
Cash received | | | | | | | | | | | | |
Advances received | | | | | | - | | | | | 16 | |
Proceeds of borrowing | | | | | | 4,490 | | | | | 4,656 | |
| | | | | | 4,490 | | | | | 4,672 | |
| | | | | |
Cash paid | | | | | | | | | | | | |
Advances paid | | | | | | (27 | ) | | | | (14 | ) |
Borrowing repaid | | | | | | (761 | ) | | | | (498 | ) |
Deposits withdrawn | | | | | | - | | | | | (2 | ) |
Other financing | | | | | | - | | | | | (6 | ) |
| | | | | | (788 | ) | | | | (519 | ) |
| | | | | |
Net Cash Flows from Financing Activities | | | | | | 3,702 | | | | | 4,154 | |
| | | | | |
Net increase/(decrease) in Cash and Deposits Held | | | | | | (260 | ) | | | | 2,066 | |
Cash and deposits at the beginning of the financial year | | | | | | 3,109 | | | | | 1,043 | |
Cash and Deposits Held at the End of the Financial Year | | 23 | | | | 2,848 | | | | | 3,109 | |
| | | | | | | | | | | | |
KEY FISCAL AGGREGATES | | | | | | | | | | | | |
Net Cash from Operating Activities | | | | | | 3,716 | | | | | 396 | |
Net Cash Flow from Investments in Non-Financial Assets | | | | | | (6,555 | ) | | | | (5,320 | ) |
CASH SURPLUS/(DEFICIT) | | | | | | (2,839 | ) | | | | (4,924 | ) |
| | | | | |
Derivation of ABS GFS Cash Surplus/Deficit | | | | | | | | | | | | |
Cash surplus/(deficit) | | | | | | (2,839 | ) | | | | (4,924 | ) |
Acquisitions under finance leases and similar arrangements | | | | | | (20 | ) | | | | (179 | ) |
ABS GFS Cash Surplus/(Deficit) Including | | | | | | | | | | | | |
Finance Leases and Similar Arrangements | | | | | | (2,859 | ) | | | | (5,104 | ) |
This Cash Flow Statement should be read in conjunction with the accompanying notes.
| | |
| Audited Financial Statements 2008–09 – Queensland General Government Sector | | 6-04 |
Notes to the Financial Statements
| 1. | Significant Accounting Policies |
The following summary presents the significant accounting policies that have been adopted in preparing and presenting the financial statements for the General Government sector of the Queensland Government.
This financial report of the General Government sector (GGS) of Queensland has been prepared in accordance with AASB 1049 Whole of Government and General Government Sector Financial Reporting which requires compliance with all Australian Accounting Standards except those identified below. The purpose of this financial report is to provide users with information about the stewardship by the Government in relation to its GGS and accountability for the resources entrusted to it, information about the financial position, performance and cash flows of the Government’s GGS and information that facilitates assessments of the macro-economic impact of the Government’s GGS.
The GGS is a component of the whole-of-Government of the Queensland Government. The GGS is determined in accordance with the principles and rules contained in the Australian Bureau of Statistics Australian System of Government Finance Statistics: Concepts, Sources and Methods 2005 (ABS GFS Manual). Under the ABS GFS Manual, the GGS consists of all government units and non-profit institutions controlled and mainly financed by government. Government units are legal entities established by political processes that have legislative, judicial or executive authority over other units and which provide goods and services to the community or to individuals on a non-market basis and make transfer payments to redistribute income and wealth. Non-profit institutions are created for the purpose of producing or distributing goods and services but are not a source of income, profit or other financial gain for the government.
These financial statements have been prepared in accordance with the Financial Accountability Act 2009 , applicable Australian Accounting Standards and Concepts, Urgent Issues Group Consensus Views and other authoritative pronouncements.
New or revised accounting standards and interpretations applicable to the GGS which have been published and are not mandatory for 30 June 2009 reporting periods are set out below:
AASB 1: First-Time Adoption of Australian Accounting Standards
AASB 3: Business Combinations
AASB 101: Presentation of Financial Statements
AASB 123: Borrowing Costs AASB 127: Consolidated and Separate Financial Statements
AASB 2007-3: Amendments to Australian Accounting Standards arising from AASB 8 [AASB 5, AASB 6, AASB 102, AASB 107, AASB 119,
AASB 127, AASB 134, AASB 136, AASB 1023 & AASB 1038]
AASB 2007-6: Amendments to Australian Accounting Standards arising from AASB 123 [AASB 1, AASB 101, AASB 107, AASB 111,
AASB 116 & AASB 138 and Interpretations 1 & 12]
AASB 2007-8: Amendments to Australian Accounting Standards arising from AASB 101
AASB 2007-10: Further Amendments to Australian Accounting Standards arising from AASB 101
AASB 2008-2: Amendments to Australian Accounting Standards - Puttable Financial Instruments and Obligations arising on Liquidation
[AASB 7, AASB 101, AASB 132, AASB 139 & Interpretation 2]
AASB 2008-3: Amendments to Australian Accounting Standards arising from AASB 3 and AASB 127 [AASBs 1, 2, 4, 5, 7, 101, 107, 112,
114, 116, 121, 128, 131, 132, 133, 134, 136, 137, 138, & 139 and Interpretations 9 & 107]
AASB 2008-5: Amendments to Australian Accounting Standards arising from the Annual Improvements Project [AASB 5, 7, 101, 102, 107,
108, 110, 116, 118, 119, 120, 123, 127, 128, 129, 131, 132, 134, 136, 138, 139, 140, 141, 1023 & 1038]
AASB 2008-6: Further Amendments to Australian Accounting Standards arising from the Annual Improvements Project [AASB1 & AASB 5]
AASB 2008-7: Amendments to Australian Accounting Standards - Cost of an Investment in a Subsidiary, Jointly Controlled Entity or
Associate [AASB 1, AASB 118, AASB 121, AASB127 & AASB 136]
AASB 2008-8: Amendments to Australian Accounting Standards - Eligible Hedged Items [AASB 139]
AASB 2008-9: Amendments to AASB1049 for Consistency with AASB 101
AASB 2008-11: Amendments to Australian Accounting Standards - Business Combinations Among Not-for-Profit Entities [AASB3]
AASB 2008-13: Amendments to Australian Accounting Standards arising from AASB Interpretation 17 - Distributions of Non-cash Assets to
Owners [AASB 5 & AASB 110]
AASB 2009-1: Amendments to Australian Accounting Standards - Borrowing Costs of Not-for-Profit Public Sector Entities [AASB 1,
AASB 111 & AASB 123]
AASB 2009-2: Amendments to Australian Accounting Standards - Improving Disclosures about Financial
| | |
| Audited Financial Statements 2008–09 – Queensland General Government Sector | | 6-05 |
Notes to the Financial Statements
| 1. | Significant Accounting Policies continued |
| (b) | Basis of Accounting continued |
Instruments [AASB 4, AASB 7, AASB 1023 & AASB 1038]
AASB 2009-4: Amendments to Australian Accounting Standards arising from the Annual Improvements Project [AASB 2 and AASB 138
and AASB Interpretations 9 & 16]
AASB 2009-5: Further Amendments to Australian Accounting Standards arising from the Annual Improvements Project [AASB 5, 8, 101,
107, 117, 118, 136 & 139]
AASB 2009-6: Amendments to Australian Accounting Standards
AASB 2009-7: Amendments to Australian Accounting Standards [AASB 5, 7, 107, 112, 136 & 139 and Interpretation 17]
Interpretation 1: Changes in Existing Decommissioning, Restoration and Similar Liabilities
Interpretation 12: Service Concession Arrangements
Interpretation 17: Distributions of Non-cash Assets to Owners
Interpretation 18: Transfers of Assets from Customers
The GGS has not adopted these standards and interpretations early. Application of these standards will not materially affect any of the amounts recognised in the financial statements but will impact the type of information disclosed, with the following exception:
The revised version of AASB 123 Borrowing Costs will not impact on the State as under AASB 2009-1 Amendments to Australian Accounting Standards – Borrowing Costs of Not-for-Profit Public Sector Entities [AASB 1, AASB 111 & AASB 123] the AASB decided to reintroduce the option to expense borrowing costs for not-for-profit public sector entities pending the outcome of the AASB project on the application of AASB 123 to not-for-profit public sector entities.
The statements have been prepared on an accrual basis that recognises the financial effects of transactions and events when they occur.
| (c) | The Government Reporting Entity |
The standard under which the GGS financial report is prepared does not require full application of AASB 127 Consolidated and Separate Financial Statements and AASB 139 Financial Instruments: Recognition and Measurement. Assets, liabilities, income, expenses and cash flows of government controlled entities that are in the Public Non-Financial Corporations sector and the Public Financial Corporations sector are not separately recognised in the GGS of the Queensland Government’s financial statements. Instead, the GGS financial statements recognise an asset, being the controlling equity investment in those entities, and recognise a gain or loss relating to changes in the carrying amount of that asset, measured in accordance with AASB 1049. Readers are referred to the whole-of-Government general purpose financial report of the Queensland Government for the year ended 30 June 2009 for financial information that separately recognises assets, liabilities, income, expenses and cash flows of all entities under the control of the Queensland Government.
The ABS GFS Manual provides the basis upon which Government Finance Statistics (GFS) information contained in the financial report is prepared. In particular, notes disclosing key fiscal aggregates of net worth, net operating balance, total change in net worth, net lending/(borrowing) and cash surplus/(deficit) determined using the principles and rules in the ABS GFS Manual are included in the financial report, together with a reconciliation of those key fiscal aggregates to the corresponding key fiscal aggregates determined in accordance with AASB 1049.
The GGS financial statements include the value of all material assets, liabilities, equities, revenues and expenses controlled by the GGS of Queensland. Only those GGS agencies considered material by virtue of the size of their financial transactions and/or resources managed are consolidated for the purposes of this report. Refer Note 50 for a full list of entities consolidated and/or controlled by this sector.
Where control of an GGS entity is obtained during the financial year, its results are included in the Operating Statement from the date control commenced. Where control of an entity ceases during a financial year, its results are included for that part of the year during which control existed.
In the process of reporting the GGS of the Queensland Government as a single economic entity, all material GGS inter-entity and intra-entity transactions and balances have been eliminated to the extent practicable.
A brief description of each broad sector of the Government’s activities, determined in accordance with the Government Finance Statistics Standards (Australian Bureau of Statistics), follows:
| | |
| Audited Financial Statements 2008–09 – Queensland General Government Sector | | 6-06 |
Notes to the Financial Statements
| 1. | Significant Accounting Policies continued |
General Government Sector
The primary function of GGS agencies is to provide public services that:
- are non-trading in nature and that are for the collective benefit of the community;
- are largely financed by way of taxes, fees and other compulsory charges; and
- involve the transfer or redistribution of income.
Public Non-financial Corporations Sector
The primary function of enterprises in the Public Non-financial Corporations sector is to provide goods and services that:
- are trading, non-regulatory or non-financial in nature; and
- are financed by way of sales of goods and services to consumers.
Public Financial Corporations Sector
The Public Financial Corporations sector comprises publicly owned institutions which provide financial services usually on a commercial basis.
Functions they perform may include:
- central bank functions;
- accepting on-call, term or savings deposits;
- investment fund management;
- having the authority to incur liabilities and acquire financial assets in the market on their own account; or
- providing insurance services.
The reporting period of the GGS is the year ended 30 June 2009.
The GGS financial statements adopt the following valuation methodologies:
- superannuation, motor vehicle accident liabilities, Queensland Government Insurance Fund and the Queensland Government
Long Service Leave Central Scheme provisions are based on actuarial valuations;
- equity investments in Public Non-financial Corporations (PNFC) and Public Financial Corporations (PFC) are measured as the
Government’s proportional share of the net asset value of the PNFC sector and PFC sector entities;
- investments and other financial assets are recorded at fair value, except as outlined in note 1(ag);
- borrowings and other financial liabilities are recorded at fair value, except as outlined in note 1(ag);
- land, buildings, other infrastructure, major plant and equipment and heritage and cultural assets are valued at fair value. Other classes
of assets are valued at cost which approximates fair value due to their short useful lives; and
- inventories (other than those held for distribution) are valued at the lower of cost and net realisable value under AASB 102 Inventories.
Historical cost accounting principles are otherwise employed.
Unless otherwise stated, the accounting policies adopted for the reporting period are consistent with those of the previous reporting period. In accordance with AASB 101 Presentation of Financial Statements and AASB 108 Accounting Policies, Changes in Accounting Estimates and Errors, changes to accounting policies are applied retrospectively unless specific transitional provisions apply.
AASB 1049 Whole of Government and General Government Sector Financial Reporting requires the Operating Statement to include all items of income and expense recognised in a period. All amounts relating to an item included in the determination of the comprehensive result (total change in net worth) shall be classified as transactions or other economic flows in a manner that is consistent with the ABS GFS Manual. Key technical terms from the ABS GFS Manual that are used in the financial report are defined in Note 1(al).
Where application of accounting standards results in a variance to GFS, a reconciliation to GFS is provided in Notes 51 to 55.
| | |
| Audited Financial Statements 2008–09 – Queensland General Government Sector | | 6-07 |
Notes to the Financial Statements
| 1. | Significant Accounting Policies continued |
All amounts in the GGS financial statements have been rounded to the nearest $1 million or where the amount is less than $500,000 to zero, unless otherwise indicated. Accordingly, numbers may not add due to rounding.
| (i) | Comparative Information |
In accordance with AASB 1049 comparatives have been prepared as if this standard had applied to the previous period.
AASB 108 requires that material prior period errors be corrected retrospectively by either restating comparative amounts if the errors occurred in the prior year or restating the opening balances of assets, liabilities and equity of the prior year where the error occurred before the prior year.
Commonwealth and other grants are recognised as revenue when the recipient entity obtains control over the grant, usually upon receipt. Where the grant is of a reciprocal nature, revenue is recognised as and when the obligation is fulfilled. When revenue, including grants, has been received in advance for services or works still to be completed at balance date, this revenue is considered to be unearned and is reported in other liabilities. Refer Note 43.
Assets received at below fair value, including those received free of charge, and that can be measured reliably are recognised at their fair value as revenue when control over the assets is obtained, normally either on receipt of the assets or on notification that the assets have been secured.
Contributions of services are recognised only if the services would have been purchased if they had not been donated and their fair value can be reliably measured. Where this is the case, an equal amount is recognised as a revenue and an expense.
To the extent practicable, revenues from the sale of goods and services, fines and regulatory fees are recognised when the transactions or events giving rise to the revenue occurs.
GGS taxation is recognised as revenue upon the earlier of receipt by the responsible agency of a taxpayer’s self-assessment or at the time the taxpayer’s obligation to pay arises pursuant to the issue of an assessment. Taxation also includes interest and penalties.
The main types of taxation and fee revenues raised by the GGS are:
| | - | transfer and other duties; | |
| | - | various gaming and lottery taxes. | |
Interest income includes investment income earned on financial assets during the financial year.
Dividends from PNFC and PFC sectors entities are recorded as revenue from transactions where the dividends are declared out of accumulated surpluses. Dividends paid out of reserves or from the sale of assets represent a return of Government’s initial equity investment under ABS GFS principles and are disclosed as other economic flows. Net profit/(loss) from associates (excluding dividend distributions) is included in other economic flows in the Operating Statement.
Other economic flows of a revenue nature, included in the operating result incorporate gains/losses on disposal of non-financial assets, deferred income tax equivalents and changes in fair value of financial instruments measured at fair value (after excluding dividend distributions).
Net increments in the market values of biological assets are recognised as other economic flows.
| (l) | Other Interest Expense |
Interest and other finance chares are recognised as expenses in the period in which they are incurred.
The GGS is exempt from Commonwealth taxation except for Fringe Benefits Tax and Goods and Services Tax (GST).
| | |
| Audited Financial Statements 2008–09 – Queensland General Government Sector | | 6-08 |
Notes to the Financial Statements
| 1. | Significant Accounting Policies continued |
Revenues, expenses and assets are recognised net of GST, except where the amount of GST incurred is not recoverable from the Australian Taxation Office (ATO). In these circumstances the GST is recognised as part of the acquisition cost of the asset or as part of the item of expense.
Receivables and payables are stated with the amount of GST included. The amounts of GST receivable from, or payable to, the ATO are included as a current asset or liability in the Balance Sheet.
Cash flows are included in the Cash Flow Statement on a gross basis. The GST components of cash flows arising from investing and financing activities which are recoverable from, or payable to, the ATO are classified as operating cash flows.
Cash and deposits includes cash on hand, cash at bank and deposits at call which are readily convertible to cash on hand and are subject to an insignificant risk of changes in value, net of outstanding bank overdrafts.
Trade debtors are recognised at the nominal amount due. Receivables are assessed periodically for impairment. Other receivables include accrued revenue, primarily from taxation revenue assessed as accruing to the State at 30 June. For further details on the State revenue recognition refer to Note 1(k).
Settlement by finance lease debtors is within the terms of the lease, ranging from 2 to 99 years. Title is passed to the purchaser on full repayment. Refer Note 24.
Loans are financial assets held by the GGS and include loans supporting policy objectives of the Government rather than for liquidity management purposes. On 1 July 2008, the State exchanged its investments in unit trusts, held and managed by QIC Limited, for a fixed rate note issued by QTC.
Credit Risk Exposure and Management
Credit or liquidity risk represents the extent of credit related losses that the GGS may be subject to on amounts to be exchanged under loans, accounts receivable and other financial assets. The maximum credit risk at balance date in relation to each class of recognised financial assets is the carrying amount of those assets net of any provisions for impairment.
The credit risk in relation to receivables is managed in the following manner:
| | - | trading terms require payment within a specified period after the goods and services are applied; | |
| | - | outstanding accounts are assessed for impairment at each reporting date based on objective evidence of impairment; | |
| | - | bad debts are written off as they are incurred; and | |
| | - | impairment losses are recognised in the Operating Statement. | |
| (p) | Securities Other Than Shares |
Securities are financial assets held by the GGS including:
| | - | financial assets held at fair value through the profit and loss; | |
| | - | held to maturity investments; | |
| | - | available-for-sale financial assets; and | |
| | - | derivative financial instruments. | |
Securities include fixed term deposits, interest in purchase plan rental properties, government and corporate bonds, managed fund investments and derivatives.
| (q) | Shares and Other Equity Investments |
Shares and other equity investments refer to claims on other entities entitling the GGS to a share of the income of the entity and a right to a share of the residual assets of the entity should it be wound up. It includes holdings of the market value of assets (non-financial and financial) less liabilities of enterprises.
| | |
| Audited Financial Statements 2008–09 – Queensland General Government Sector | | 6-09 |
Notes to the Financial Statements
| 1. | Significant Accounting Policies continued |
| (q) | Shares and Other Equity Investments continued |
There are three main categories:
| | - | investments accounted for using the equity method (associates); | |
| | - | investments in other public sector entities; and | |
| | - | investments - shares in entities that are not controlled or associates. | |
Investments accounted for using the equity method (Associates)
Associates are those entities over which the GGS has significant influence but not control. Such entities are accounted for using the equity method of accounting. The GGS’s share of its associates’ post-acquisition profits or losses (less dividends) is recognised in the Operating Statement as an other economic flow and its share of post-acquisition movements in reserves is recognised in the reserves. The cumulative post-acquisition movements are recognised against the carrying amount of the investment. Dividends from associates are recognised as revenue from transactions in the Operating Statement.
Investments in other public sector entities
Equity investments in Public Non-financial Corporations (PNFC) and Public Financial Corporations (PFC) are measured as the government’s proportional share of the net asset value of the PNFC sector and PFC sector entities. Dividends from PNFCs and PFCs are recorded as revenue from transactions where the dividends are paid out of accumulated surpluses. Dividends paid out of reserves or from the sale of assets represent a return of Government initial equity investment under ABS GFS principles and are disclosed as other economic flows. Changes in the valuation of the GGS equity investments (other than dividends) are recognised as other economic flows.
Note 1(d) outlines the functions of these sectors. Refer to Note 50 for a comprehensive list of entities within the PNFC and PFC sectors.
Investments - shares in entities that are not controlled or associated
Investments in entities that are neither controlled nor associates of the Government are valued at fair value with changes in valuation of these investments treated in a manner consistent with AASB 139 Financial Instruments: Recognition and Measurement.
Inventories (other than those held for distribution) are carried at the lower of cost and net realisable value under AASB 102 Inventories. Cost is determined on either a first-in-first-out or average cost basis and includes expenditure incurred in acquiring the inventories and bringing them to their existing condition and location, except for training costs which are expensed as incurred. Where inventories are acquired for no or nominal consideration, the cost is the current replacement cost as at the date of acquisition.
Inventories held for distribution are those inventories which the GGS distributes for no or nominal consideration. These are measured at the lower of cost and current replacement cost.
All inventories are classified as current non-financial assets.
Land held for resale is stated at the lower of cost and net realisable value. Cost is assigned by specific identification and includes the cost of acquisition and development.
| (s) | Other Non-Financial Assets |
Other non-financial assets primarily represent prepayments by the State. These prepayments include salaries and wages, grant payments or payments of a more general nature made in advance.
In accordance with AASB 5 Non-current Assets Held for Sale and Discontinued Operations, non-current assets held for sale are assets measured at the lower of carrying amount and fair value less costs to sell and have not been depreciated or amortised.
| | |
| Audited Consolidated Financial Statements 2008–09 –Government of Queensland | | 6-10 |
Notes to the Financial Statements
| 1. | Significant Accounting Policies continued |
| (t) | Assets Held for Sale continued |
An impairment loss is recognised for initial or subsequent write down of the asset to fair value less estimated costs to sell. A gain is recognised for any subsequent increases in fair value less costs to sell of an asset but not in excess of any cumulative impairment loss previously recognised.
Pursuant to AASB 140 Investment Property, properties held to earn rental income or for capital gains purposes are classified as investment properties. Such properties are valued at fair value. Changes in fair value are recognised in the Operating Statement and no depreciation expense or asset impairment is recognised.
Biological assets are recognised at net market value which is the amount that could be expected to be received from the disposal of the asset in an active and liquid market, after deducting costs expected to be incurred in realising the proceeds of such a disposal. Where no active and liquid market is available, the net present value methodology has been adopted under the provisions of AASB 141 Agriculture.
Biological assets held by the State and not recognised in the Balance Sheet include:
| | - | the right to harvest forest products from native forests pursuant to the Forestry Act 1959. Cash flows associated with these products have been examined and the net values of the access rights are considered to be immaterial. Accordingly, the value of access rights to native forest products have not been recognised. The State is currently overseeing the final harvesting of forest timber from native forests as part of a process of transitioning native forests into nature conservations reserves. | |
| (w) | Property, Plant and Equipment |
Acquisition
Items of property, plant and equipment with a cost or other value greater than the asset recognition threshold of the agency are initially capitalised and recorded at cost. The Queensland Treasury’s Non-Current Asset Policies for the Queensland Public Sector is applicable to departments and statutory bodies and mandates asset recognition thresholds as follows:
| | |
Asset Class | | Asset Recognition Threshold |
| | |
Land | | $1 (all land) |
| | |
Buildings | | $10,000 |
| | |
Infrastructure | | $10,000 |
| | |
Plant & Equipment | | $5,000 |
| | |
Major Plant & Equipment | | An amount greater than or equal to $5,000, the exact amount of which is at the agency’s discretion. |
| | |
Leased Assets (finance leases) | | The threshold for the class to which the asset would belong if it were not subject to a finance lease. |
| | |
Heritage & Cultural Assets | | $5,000 |
| | |
Work in Progress | | n/a |
| | |
Library Reference Collections | | $1,000,000 |
| | |
| Audited Financial Statements 2008–09 – Queensland General Government Sector | | 6-11 |
Notes to the Financial Statements
| 1. | Significant Accounting Policies continued |
| (w) | Property, Plant and Equipment continued |
Acquisition continued
Items with a cost or other value below each entity’s recognition threshold are expensed in the year of acquisition. Cost is determined as the value given as consideration, plus costs incidental to the acquisition including all other costs incurred in getting the assets ready for use. Training, marketing and advertising costs are expensed as incurred.
In accordance with AASB 116 Property, Plant and Equipment, administration and other general overhead costs are expensed in the year they are incurred. Overhauls and major inspections are only capitalised if it is probable that future economic benefits associated with them will flow to the entity and their cost can be measured reliably. In addition, any remaining carrying amount of the cost of the previous inspection/overhaul (as distinct from physical parts) is derecognised.
Assets acquired at no cost, or for nominal consideration, that can be measured reliably are recognised initially as assets and revenues at their fair value at the date of acquisition.
Recording and Valuation
Land, buildings, infrastructure, major plant and equipment and heritage and cultural assets are valued at fair value in accordance with AASB 116 and Queensland Treasury’s Non-Current Asset Policies for the Queensland Public Sector. Reference should be made to individual agency reports for valuation methodologies and names and qualifications of relevant valuers, where appropriate.
Non-current physical assets measured at fair value are comprehensively revalued once every five years or as appropriate, with interim valuations using relevant indices being otherwise performed on an annual basis. Separately identified components of assets are measured on the same basis as the assets to which they relate.
Any revaluation increment arising on the revaluation of an asset is credited to the asset revaluation reserve for that class of assets, except to the extent it reverses a revaluation decrement for the class of assets previously recognised as an expense. A decrease in the carrying amount on revaluation is charged as an expense, to the extent it exceeds the balance of the relevant asset revaluation reserve.
Where an asset is acquired at no cost, or for nominal cost, the cost is its fair value as at the date of acquisition. All other non-current assets, principally plant and equipment, are measured at cost which equates to fair value due to their short useful lives.
Items or components that form an integral part of an asset are recognised as a single asset (functional asset). The recognition threshold is applied to the aggregate cost of each functional asset.
Non-reciprocal transfers of assets and liabilities between wholly-owned Queensland public sector entities, are accounted for as adjustments to contributed equity in accordance with UIG 1038 Contributions by Owners Made to Wholly-owned Public Sector Entities.
Land Under Roads
Effective 1 July 2008, land under roads acquired on or before 30 June 2008 has been recognised at fair value with the corresponding adjustment against opening Accumulated Surplus in accordance with AASB 1051 Land Under Roads. Land under roads acquired from 1 July 2008 has been initially recognised at cost and thereafter at fair value in accordance with AASB 116 Property Plant and Equipment. Land under roads is included in the asset class ‘land’.
At reporting date all land under roads is re-valued at fair value. Any revaluation increment arising on the revaluation of land under roads is to be credited to the asset revaluation reserve for that asset/class of assets except to the extent it reverses a revaluation decrement for the asset/class of assets previously recognised as an expense. A decrease in the carrying amount on revaluation is charged as an expense, to the extent it exceeds the balance of the relevant asset revaluation reserve.
Fair value is determined using an acceptable, reliable valuation methodology which is undertaken by the State Valuation Services. The valuation methodology has been uniformly applied to the valuation of all land under roads. Where fair value cannot be reliably determined either at acquisition or at any reporting date but is able to be determined subsequently, the fair value adjustment is treated as an adjustment to the revaluation reserve in accordance with Queensland Treasury’s Non-Current Asset Policies for the Queensland Public Sector.
| | |
| Audited Financial Statements 2008–09 – Queensland General Government Sector | | 6-12 |
Notes to the Financial Statements
| 1. | Significant Accounting Policies continued |
| (w) | Property, Plant and Equipment continued |
Land Under Roads continued
Land under roads not subject to title or lease vests in the State in terms of the Land Act 1994. The Department of Environment and Resource Management administers the Land Act on behalf of the State. Therefore untitled land under roads is an administered asset of the Department of Environment and Resource Management. This includes all land under roads in a local government area where the road assets are the responsibility of local government. Land under roads subject to title or lease is controlled by the agency that holds the title or lease and is recorded by the relevant agency as a controlled asset.
Intangible assets are recognised in accordance with AASB 138 Intangible Assets. The Queensland Treasury’s Non-Current Asset Policies for the Queensland Public Sector which is applicable to departments and statutory bodies, mandates classes of non-current physical and intangible assets. Software is classified as an intangible asset, rather than property, plant and equipment unless it is an integral part of the related hardware.
Internally generated assets, such as brands and mastheads, as well as expenditure on initial research are specifically excluded from being recognised in the Balance Sheet.
In accordance with the Non-Current Asset Policies for the Queensland Public Sector, the recognition threshold for departments and statutory bodies is $100,000.
Purchased goodwill represents the excess of costs of acquisition over the fair value of the GGS’s share of the net identifiable assets of the acquired subsidiary at the date of acquisition. Goodwill is not amortised but instead is assessed annually for impairment.
Internally generated intangible assets are only revalued where an active market exists for the asset in question, otherwise they are measured at cost.
The following assets are not recognised in the Balance Sheet:
Quarry Resources
The value of quarry resources held by the Department of Environment and Resource Management is not included in the financial statements as it is not practical to determine reliably the quantum of the resources available for extraction. Revenue from the sale of quarry materials is recognised as extractions are made.
Native Forests and Biological Assets
Disclosures are outlined in Note 1(v).
Railway Corridor Land
Under the Transport Infrastructure Act 1994, railway corridor land was rendered State land under the control of the Department of Environment and Resource Management which for reporting purposes recorded the land at nil value. This land is on-leased to QR via Department of Transport and Main Roads at no cost.
Heritage Assets
Certain heritage assets, including artefacts, memorabilia and other historical objects held by agencies, have not been valued or included in the Balance Sheet because of the unique nature of the items and the difficulty in determining a reliable value.
Library Collections
Library acquisitions are expensed as they are incurred, except for the General Reference and Rare Books Collections of the Library Board of Queensland. These are capitalised and held at fair value in accordance with the Queensland Treasury’s Non-Current Asset Policies for the Queensland Public Sector and Queensland Treasury’s Accounting for Library Collections Policy except for certain heritage assets such as manuscripts whose value cannot be reliably measured.
| | |
| Audited Financial Statements 2008–09 – Queensland General Government Sector | | 6-13 |
Notes to the Financial Statements
| 1. | Significant Accounting Policies continued |
| (z) | Depreciation and Amortisation |
Land, General Reference and Rare Books Collections of the Library Board of Queensland, Museum collections, art works held by the Queensland Art Gallery Board of Trustees and certain other heritage and cultural assets are not depreciated.
Other assets are depreciated or amortised on a straight-line basis from their date of acquisition (or in respect of internally constructed assets, from the time the asset is completed and held ready for use) and based on their estimated useful lives to the agency.
Where assets have separately identifiable components that are subject to regular replacement, these components are assigned useful lives distinct from the asset to which they relate and are depreciated accordingly. Any expenditure which increases the originally assessed capacity or service potential of an asset is capitalised and the new depreciable value is depreciated over the remaining useful life of the asset.
Leasehold improvements are amortised over the estimated useful lives of the improvements or the unexpired period of the lease, whichever is shorter. The unexpired period of the lease includes any option period where exercise of the option is probable.
Capital Work in Progress is not depreciated until it reaches service delivery capacity.
Major spares purchased specifically for particular assets are capitalised and depreciated on the same basis as the asset to which they relate.
Reference should be made to individual agency reports for details of depreciation and amortisation methodologies. The following provides an indication of the estimated useful lives to agencies of the different asset classes:
| | |
| Asset Class | | Useful Life |
| |
| Property Plant and Equipment | | |
| |
Buildings | | 1 - 100 years |
Plant and equipment | | 1 - 100 years |
Infrastructure assets | | up to 200 years |
Heritage and cultural assets | | 7 - 100 years |
| |
| Intangibles | | |
| |
Computer software | | 2 - 20 years |
Other intangibles (including intellectual property, licences and access rights) | | 1 - 99 years |
At each reporting date, an assessment is undertaken as to whether there are any indications that a physical or intangible asset is impaired. If an asset is determined to be impaired, the recoverable amount of the impaired asset is determined as the higher of the asset’s fair value less costs to sell and either depreciated replacement cost or value in use. Value in use is based on discounted cash flows using a risk adjusted discount rate. For the purposes of assessing impairment, assets are grouped at the lowest levels for which there are separately identifiable cash flows which are largely independent of the cash flows from other assets or groups of assets (cash-generating units). Non-financial assets other than goodwill that suffered an impairment are reviewed for possible reversal of the impairment at each reporting date.
Impairment on goodwill is not reversed.
Rights and obligations under finance leases which are leases that effectively transfer most of the risks and rewards relating to ownership of the leased items to the lessee, are recognised initially as assets and liabilities equal to the lower of fair value of the leased property and present value of the minimum lease payments including any guaranteed residual values. The assets are disclosed as leased plant and equipment and are depreciated over the period during which the entity is expected to benefit from the use of the asset. Minimum lease payments are allocated between interest and reduction of the lease liability, according to the interest rate implicit in the lease.
| | |
| Audited Financial Statements 2008–09 – Queensland General Government Sector | | 6-14 |
Notes to the Financial Statements
| 1. | Significant Accounting Policies continued |
For operating leases, where the lessor retains substantially all of the risks and rewards relating to ownership of the leased items, lease payments are expensed over the term of the lease. Incentives received on entering into operating leases are recognised as liabilities. Lease payments are allocated between rental expense and reduction of the liability. Further disclosure on lease commitments is contained in Note 45.
These amounts represent amounts owing for goods and services provided to the GGS prior to the end of the financial year. The amounts are unsecured, are usually paid within 30 days of recognition and are non-interest bearing.
Provisions are recognised when there is a present legal or constructive obligation as a result of past events, it is probable that an outflow of resources will be required to settle the obligation and the amount has been reliably estimated. Where there are a number of similar obligations, the likelihood that an outflow will be required is determined by considering the class of obligations as a whole. A provision is recognised even if the likelihood of an outflow with respect to any one item included in the same class of obligations may be small. Provisions are measured at the present value of the estimate of the expenditure required to settle the present obligation at the reporting date. The discount rate used to determine the present value reflects current market assessment of the time value of money and risks specific to the liability.
Wages, Salaries and Sick Leave
Liabilities for wages and salaries are accrued at year end. For most agencies, sick leave is non-vesting and is expensed as incurred. Liabilities have been calculated based on wage and salary rates at the date they are expected to be paid and include related on-costs.
Annual Leave
The Annual Leave Central Scheme (ALCS) was established at 30 June 2008 to centrally fund annual leave obligations of departments, commercialised business units and shared service providers. Members pay a levy equal to their accrued leave cost into the scheme and are reimbursed by the scheme for annual leave payments made to their employees. Entities that do not participate in the ALCS continue to determine and recognise their own leave liabilities.
The GGS’s annual leave liability has been calculated based on wage and salary rates at the date they are expected to be paid and include related on-costs. In accordance with AASB 119 Employee Benefits, where annual leave is not expected to be paid within 12 months, the liability is classified as non-current and measured at the present value of the future cash flows.
Long Service Leave
A levy of 1.75% of salary and wages costs is paid by participating agencies (predominantly Government departments) into the Long Service Leave Central Scheme introduced in 1999-2000. Amounts paid to employees for long service leave are then claimed from the scheme as a reimbursement. The liability is assessed annually by the State Actuary.
The method used incorporates consideration of expected future wage and salary levels, experience of employee departures and periods of service. On-costs have been included in the liabilities and expenses for the Long Service Leave Central Scheme. These amounts have not been separately identified, as they are not material in the context of the GGS’s overall employee entitlement liabilities.
The GGS’s long service leave provisions are calculated in accordance with AASB 119 using yield rates of Government bonds at reporting date and actuarial assumptions which are mutually compatible. The gross discount rate for 10 year Commonwealth bonds at 30 June 2009 was 5.6% (2008, 6.5%).
Entities that do not participate in the Long Service Leave Central Scheme determine their liability for long service leave based on the present value of estimated future cash outflows to be made.
| | |
| Audited Financial Statements 2008–09 – Queensland General Government Sector | | 6-15 |
Notes to the Financial Statements
| 1. | Significant Accounting Policies continued |
| (ae) | Employee Benefits continued |
Superannuation/Retirement Benefit Obligations
A superannuation liability for the GGS is recognised in respect of the various employees’ accrued superannuation benefits and represents the difference between the net market value of plan assets and the estimated accrued superannuation benefits at year end.
The present value of the accrued benefits is calculated using the projected unit credit method and represents the actuarial value of all benefits that are expected to become payable in the future in respect of contributions made or periods of service completed prior to the valuation date, allowing for future salary increases.
The costs of providing future benefits to employees are recognised over the period during which employees provide services. All superannuation plan costs, excluding actuarial gains and losses, are recognised in the Operating Statement. Actuarial gains and losses are recognised directly in equity on an annual basis and represent experience adjustments (the effects of differences between the previous actuarial assumptions and what has actually occurred e.g. investment returns on plan assets) and the effects of changes in actuarial assumptions underlying the valuation.
Expected future payments are discounted using market yields at the reporting date on Government bonds with terms to maturity and currency that match the estimated future cash outflows. The gross discount rate for 10 year Commonwealth bonds at 30 June 2009 was 5.6% (2008, 6.5%).
Future taxes are part of the provision of the existing benefit obligations (eg. taxes on investment income and employer contributions) and are taken into account in measuring the net liability or asset.
Termination Benefits
Termination benefits are payable when employment is terminated before the normal retirement date or when an employee accepts a voluntary redundancy in exchange for these benefits. The GGS recognises termination benefits when it is demonstrably committed to either terminating the employment of employees according to a detailed formal plan without possibility of withdrawal or providing termination benefits as a result of an offer made to encourage voluntary redundancy. Benefits falling due more than 12 months after balance date are discounted to present value.
| (af) | General Insurance Contracts |
In accordance with AASB 1023 General Insurance Contracts , the claims liability includes a risk margin in addition to expected future payments. This liability is discounted for the time value of money using risk-free discount rates that are based on current, observable, objective rates.
| (ag) | Financial Risk Management |
The GGS’s activities expose it to a variety of financial risks, such as market risk (including foreign currency risk, interest rate risk and price risk), credit risk, liquidity risk and cash flow interest rate risk. The GGS’s overall risk management program focuses on the unpredictability of financial markets and seeks to minimise potential adverse effects. While the GGS has a broad framework for risk management, individual agencies are responsible for managing risks to which they are exposed. The GGS uses certain derivative instruments such as forward exchange contracts and cross currency swaps to hedge risk exposures.
Risk management strategies specific to particular items recognised in the GGS’s financial statements are included in the accounting policies relating to that item.
Financial Instruments
In compliance with AASB 7, AASB 132 and AASB 139 (relating to financial instruments), certain derivatives are recognised in the Balance Sheet. Derivatives are measured on a fair value basis and changes in fair value are taken to the Operating Statement unless strict hedge accounting rules are met, in which case valuation adjustments are recognised in an equity reserve.
| | |
| Audited Financial Statements 2008–09 – Queensland General Government Sector | | 6-16 |
Notes to the Financial Statements
| 1. | Significant Accounting Policies continued |
| (ag) | Financial Risk Management continued |
Financial Instruments continued
Under AASB 139, financial assets are to be classified and measured as follows:
| | - | loans and receivables - measured at amortised cost; | |
| | - | held to maturity - measured at amortised cost; | |
| | - | designated at fair value through profit or loss; or | |
| | - | available-for-sale - measured at fair value with unrealised gains/losses recognised directly in equity except for impairment losses and foreign exchange gains/losses. | |
Financial liabilities are to be classified and measured as follows:
| | - | designated at fair value through profit or loss; or | |
| | - | other financial liabilities - measured at amortised cost. | |
Carrying amounts of financial assets and liabilities equate to fair value except as identified in Note 48.
Recognition and derecognition of financial assets and liabilities
Financial assets and financial liabilities are recognised on the Balance Sheet when the GGS becomes party to the contractual provisions of the financial instrument. A financial asset is derecognised when the contractual rights to the cash flows from the financial assets expire or are transferred and no longer controlled by the GGS. A financial liability is removed from the Balance Sheet when the obligation specified in the contract is discharged, cancelled or expires.
Financial assets held to maturity
Financial assets held to maturity primarily include fixed rate deposits with the Queensland Treasury Corporation (QTC). It is the intention of the GGS to hold these investments until maturity.
Financial assets held-for-sale
Financial assets held-for-sale include bank bonds, corporate bonds, Government bonds and share investments in Public sector enterprises.
Financial assets at fair value through profit or loss
Financial assets at fair value through profit or loss are valued at fair value at balance date. Unrealised gains and losses are brought to account in the Operating Statement. Financial assets at fair value through profit or loss held by the GGS include investments managed by QIC Limited, interest in Rental Purchase Plan properties and other investments in managed funds and shares.
Derivative financial instruments
Derivative instruments are used to hedge the GGS’s exposure to foreign currency movements as part of asset and liability management activities. The GGS does not hold derivatives for trading purposes. All derivatives are carried as assets when fair value is positive and liabilities when fair value is negative. Derivative instruments used by the GGS include forward exchange contracts and cross currency swaps.
Derivatives are initially recognised at the forward exchange market value (fair value) on the date on which a derivative contract is entered into and are subsequently remeasured at their fair value. The effective portion of the gain or loss from changes in the fair value of the hedging instrument is recognised directly in the hedge reserve in equity, while the ineffective portion is recognised in the Operating Statement. Amounts taken to the hedge reserve in equity are transferred to the Operating Statement when the hedged transaction affects the Operating Statement, such as when hedged income or expenses are recognised or when a forecast sale or purchase occurs. Where the forecast transaction that is hedged results in recognising a non-financial asset or liability, the gain or loss deferred to equity is transferred to carrying amount of the asset or liability.
Financial liabilities at fair value through profit or loss
Financial liabilities which include deposits and interest bearing liabilities, such as borrowings from the Queensland Treasury Corporation, are valued at fair value at balance date. Unrealised gains and losses are brought to account as other economic flows in the Operating Statement.
| | |
| Audited Financial Statements 2008–09 – Queensland General Government Sector | | 6-17 |
Notes to the Financial Statements
| 1. | Significant Accounting Policies continued |
| (ag) | Financial Instruments continued |
Financial liabilities held at amortised cost
GGS debt to the Commonwealth represents loans made by the Commonwealth under Loan Council agreements and is held at amortised cost.
Foreign Currency
Foreign currency transactions are translated initially into Australian dollars at the rate of exchange applying at the date of the transaction. Such transactions are subject to price risk which is reflected by price variation changes due to foreign currency movement. Amounts payable and receivable in foreign currencies at balance date are translated to Australian currency at rates of exchange current at 30 June 2009.
Exchange differences relating to amounts payable and receivable in foreign currencies are brought to account as exchange gains or losses in the Operating Statement in the financial year in which the exchange rates change, except when deferred in equity as qualifying cash flow hedges and qualifying net investment hedges.
Translation differences on non-monetary financial assets and liabilities are reported as part of the fair value gain or loss. Translation differences on non-monetary financial assets and liabilities such as equities held at fair value through profit or loss are recognised in the Operating Statement as part of the fair value gain or loss. Translation difference on non-monetary financial assets such as equities classified as available-for-sale financial assets are included in the fair value reserve in equity.
Where transactions involve forward foreign exchange, the amount payable or receivable under the forward exchange contract is adjusted to reflect forward rates of exchange applicable at year-end. Exchange gains or losses are brought to account in the Operating Statement.
Foreign exchange risk arises when future commercial transactions and recognised assets and liabilities are denominated in a currency that is not the entity’s functional currency.
To effectively manage the exposure of foreign currency transactions to fluctuations in exchange rates, both forward exchange contracts and cross currency swaps are used.
| (ah) | Public Private Partnerships (PPPs) |
There is currently no Australian Accounting Standard specifically addressing accounting for private sector financed infrastructure assets. The following policies have been adopted pending the development of an accounting standard.
Agreements equally proportionately unperformed arising from PPPs are not recognised as assets or liabilities. Instead, the payments under these agreements are expensed systematically over the term of the agreements. Any leasing arrangements are disclosed in accordance with AASB 117 Leases. Further, the commitments for future payments under these agreements are disclosed as commitments in the notes to the GGS financial statements.
Security, tender and other deposits administered by the GGS in a fiduciary or trust capacity are not recognised in the financial statements but are disclosed for information purposes in Note 46. Whilst these transactions and balances are in the care of the GGS, they are subject to the normal internal control and external audit requirements.
| (aj) | Critical Accounting Estimates and Judgements |
Estimates and judgements are continually evaluated and are based on historical experience and other factors, including expectations of future events that may have a financial impact on the GGS and that are believed to be reasonable under the circumstances.
| | (i) | Critical Accounting Estimates and Assumptions |
The GGS makes estimates and assumptions concerning the future. The resulting accounting estimates will, by definition, seldom equal the related actual results. The estimates and assumptions that have a significant risk of causing a material adjustment to the carrying amount of assets and liabilities within the next financial year and have not been included in the relevant accounting policy, are discussed below.
| | |
| Audited Financial Statements 2008–09 – Queensland General Government Sector | | 6-18 |
Notes to the Financial Statements
| 1. | Significant Accounting Policies continued |
| (aj) | Critical Accounting Estimates and Judgements continued |
Estimated Impairment of Assets
The GGS tests annually whether any asset or group of assets is impaired, in accordance with the accounting policy Note 1(aa). In some instances the recoverable amount used is value in use. Value in use calculations require assumptions to be made in key areas such as:
| | - | risk adjusted time value of money; | |
| | - | forecast operational and capital expenditure; and | |
There is significant uncertainty over the future price and availability of water which may impact asset values of the electricity generators. In addition, as the impacts from the proposed introduction of a carbon pollution reduction scheme by the Commonwealth Government are still uncertain, no assumptions were included when determining the recoverable amount under value in use calculations.
Fair Value of Derivatives and Other Financial Instruments
The fair value of financial instruments that are not traded in an active market (for example over-the-counter derivatives) is determined by using valuation techniques. The GGS uses judgement to select a variety of methods and make assumptions that are mainly based on market conditions existing at each Balance Sheet date. The GGS has used discounted cash flow analysis for various available-for-sale financial assets that were not traded in active markets.
| | (ii) | Critical Judgements in Applying Accounting Policies |
Held-to-maturity investments
The GGS follows AASB 139 in classifying non-derivative financial assets with fixed or determinable payments and fixed maturity as held-to-maturity. This classification requires significant judgement. In making this judgement, the GGS evaluates its intention and ability to hold such investments to maturity. If the class of held-to-maturity investments is tainted, the GGS would not be able to classify any financial assets as held-to-maturity for the following two annual reporting periods.
If the GGS fails to keep these investments to maturity other than for specific circumstances explained in AASB 139, it will be required to reclassify the whole class as available-for-sale. The investments would therefore be measured at fair value not amortised cost.
| (ak) | Actual and Budgetary Information Comparison |
Explanations of major variances between AASB 1049 actual amounts and corresponding original budget amounts for the GGS are disclosed in Note 59.
| (al) | Key GFS Technical Terms |
ABS GFS Manual
The Australian Bureau of Statistics (ABS) publication Australian System of Government Finance Statistics: Concepts, Sources and Methods as updated from time to time.
Cash Surplus/(Deficit)
Net cash flows from operating activities plus net cash flows from acquisition and disposal of non-financial assets less distributions paid. GFS cash surplus/(deficit) also deducts the value of assets acquired under finance leases and similar arrangements.
Convergence Differences
Convergence differences are the differences between amounts recognised in the financial statements compared with amounts determined for GFS purposes as a result of differences in definition, recognition, measurement and classification principles and rules.
| | |
| Audited Financial Statements 2008–09 – Queensland General Government Sector | | 6-19 |
Notes to the Financial Statements
| 1. | Significant Accounting Policies continued |
| (al) | Key GFS Technical Terms continued |
Comprehensive Result - Total Change in Net Worth
This is the net result of all items of income and expense recognised for the period. It is the aggregate of operating result and other movements in equity.
Financial Asset
A financial asset is any asset that is:
| | - | an equity instrument of another entity; | |
| | (i) | to receive cash or another financial asset from another entity; or | |
| | (ii) | to exchange financial assets or financial liabilities with another entity under conditions that are potentially favourable to the entity; or | |
| | - | a contract that will or may be settled in the entity’s own equity instruments and is: | |
| | (i) | a non-derivative for which the entity is or may be obliged to receive a variable number of the entity’s own equity instruments; or | |
| | (ii) | a derivative that will or may be settled other than by the exchange of a fixed amount of cash or another financial asset for a fixed number of the entity’s own equity instruments. For this purpose the entity’s own equity instruments do not include instruments that are themselves contracts for the future receipt or delivery of the entity’s own equity instruments. | |
Key Fiscal Aggregates
Referred to as analytical balances in the ABS GFS Manual, are data identified in the ABS GFS Manual as useful for macro-economic analysis purposes, including assessing the impact of a government’s GGS on the economy. They are: opening net worth, net operating balance (which equals change in net worth due to transactions), net lending/(borrowing), change in net worth due to other changes in the volume of assets, total change in net worth, closing net worth and cash surplus/(deficit).
Net Debt
Net debt equals (deposit liabilities held plus advances and borrowing liabilities) less (cash and deposits, plus investments plus asset advances outstanding), based on the definition in the ABS GFS Manual. The extent of accumulated net debt is currently the most common measure used to judge the overall strength of a jurisdiction’s fiscal position.
Net Lending/(Borrowing)
The financing requirements of government, calculated as the net operating balance, less the net acquisition of non-financial assets. A positive result reflects a net lending position and a negative result reflects a net borrowing position, based on the definition in the ABS GFS Manual.
Net Operating Balance
This is calculated as income from transactions minus expenses from transactions, based on the definition in the ABS GFS Manual.
Net Worth
Assets less liabilities and shares/contributed capital. For the GGS, net worth is assets less liabilities since shares and contributed capital is zero. It is an economic measure of wealth and reflects the contribution of governments to the wealth of Australia.
Non-profit Institution
A legal or social entity that is created for the purpose of producing or distributing goods and services but is not permitted to be a source of income, profit or other financial gain for the units that establish, control or finance it.
| | |
| Audited Financial Statements 2008–09 – Queensland General Government Sector | | 6-20 |
Notes to the Financial Statements
| 1. | Significant Accounting Policies continued |
| (al) | Key GFS Technical Terms continued |
Non-financial asset
All assets that are not ‘financial assets’.
Operating result
Operating result is a measure of financial performance of the operations of the GGS for the period. It is the net result of items of revenue, gains and expenses (including losses) recognised for the period, excluding those that are classified as ‘other movements in equity’.
Other Economic Flows
Changes in the volume or value of an asset or liability that do not result from transactions (i.e. revaluations and other changes in the volume of assets).
Transactions
Interactions between two institutional units by mutual agreement or actions within a unit that it is analytically useful to treat as transactions.
Whole-of-Government Financial Report
A financial report prepared by a government that is prepared in accordance with other Australian Accounting Standards, including AASB 127 Consolidated and Separate Financial Statements and thereby separately recognises assets, liabilities, income, expenses and cash flows of all entities under the control of the government on a line-by-line basis.
| | |
| Audited Financial Statements 2008–09 – Queensland General Government Sector | | 6-21 |
Notes to the Financial Statements
| | | | | | |
| | | | | 2009 $M | | 2008
$M |
| | | |
2. | | Taxation Revenue | | | | |
| | | |
| | Taxes | | | | |
| | Stamp duty | | | | |
| | Transfer duty | | 1,806 | | 2,912 |
| | Vehicle registration | | 1,474 | | 1,369 |
| | Insurance | | 425 | | 386 |
| | Mortgages | | 17 | | 327 |
| | Other duties | | 23 | | 17 |
| | | | | | |
| | | | 3,746 | | 5,010 |
| | | |
| | Payroll tax | | 2,754 | | 2,493 |
| | Land tax | | 838 | | 610 |
| | Guarantee fees | | 129 | | 87 |
| | Various gaming taxes and other levies | | 1,411 | | 1,346 |
| | | | | | |
| | | | 8,877 | | 9,546 |
| | | | | | |
| | | |
3. | | Grants Revenue | | | | |
| | | |
| | Commonwealth | | | | |
| | General purpose payments | | | | |
| | GST revenue grants | | 7,946 | | 8,549 |
| | Other general purpose payments | | 2,276 | | 2,468 |
| | Specific purpose payments | | 2,972 | | 2,355 |
| | National partnership payments | | 1,845 | | - |
| | Grants for onpassing to non-Queensland Government entities | | 1,925 | | 1,649 |
| | | | | | |
| | | | 16,963 | | 15,022 |
| | | |
| | Other | | | | |
| | Other grants | | 112 | | 133 |
| | Industry/community contributions | | 401 | | 355 |
| | | | | | |
| | | | 513 | | 488 |
| | | | | | |
| | | | 17,476 | | 15,510 |
| | | | | | |
| | | |
4. | | Sales of Goods and Services | | | | |
| | | |
| | User charges | | | | |
| | Sale of goods and services | | 2,298 | | 2,138 |
| | | |
| | Rental income | | 371 | | 341 |
| | | |
| | Fees | | | | |
| | Transport and other licences and permits | | 456 | | 404 |
| | Other regulatory fees | | 443 | | 473 |
| | | | | | |
| | | | 899 | | 878 |
| | | | | | |
| | | | 3,568 | | 3,357 |
| | | | | | |
| | | |
5. | | Interest Income | | | | |
| | | |
| | Interest | | 1,482 | | (275) |
| | | | | | |
| | | |
| | Interest revenue from financial assets not at fair value through profit and loss totalled $263 million (2008, $312 million). | | | | |
| | | |
6. | | Dividend and Income Tax Equivalents Income | | | | |
| | | |
| | Dividends | | 953 | | 1,001 |
| | Income tax equivalents | | 227 | | 244 |
| | | | | | |
| | | | 1,180 | | 1,244 |
| | | | | | |
| | |
| Audited Financial Statements 2008–09 – Queensland General Government Sector | | 6-22 |
Notes to the Financial Statements
| | | | | | |
| | | | | 2009
$M | | 2008
$M |
| | | |
7. | | Other Revenue | | | | |
| | | |
| | Royalties | | 3,365 | | 1,369 |
| | Other territorial revenue | | 107 | | 91 |
| | Assets assumed/liabilities transferred | | 432 | | 115 |
| | Donations, gifts and services received at below fair value | | 54 | | 63 |
| | Contributed assets | | 8 | | 17 |
| | Fines | | 243 | | 219 |
| | Other | | 217 | | 167 |
| | | | | | |
| | | | 4,425 | | 2,041 |
| | | | | | |
| | | |
8. | | Employee Expenses (refer Note 49 for additional disclosures) | | | | |
| | | |
| | Salaries and wages | | 12,362 | | 11,527 |
| | Annual leave | | 1,132 | | 891 |
| | Long service leave | | 460 | | 414 |
| | Other employee related expenses | | 351 | | 343 |
| | | | | | |
| | | | 14,305 | | 13,175 |
| | | | | | |
| | | |
9. | | Superannuation Expenses | | | | |
| | | |
| | Superannuation interest cost (refer Note 49 for additional disclosures) | | | | |
| | Defined benefit interest cost | | 1,148 | | 951 |
| | Former defined benefit interest cost | | (290) | | (135) |
| | | | | | |
| | | | 858 | | 816 |
| | | | | | |
| | | |
| | Other superannuation expenses | | | | |
| | | |
| | Accumulation contribution | | 884 | | 739 |
| | Defined benefit service cost | | 1,128 | | 1,126 |
| | | | | | |
| | | | 2,012 | | 1,865 |
| | | | | | |
| | | |
10. | | Other Operating Expenses | | | | |
| | | |
| | Supplies and services | | 6,582 | | 5,913 |
| | Claims | | 119 | | 149 |
| | Other expenses | | 483 | | 585 |
| | | | | | |
| | | | 7,185 | | 6,646 |
| | | | | | |
| | | |
| | Audit fees of $9.9 million (2008, $9.7 million) charged by the Queensland Audit Office to entities included in these financial statements have been eliminated on consolidation. | | | | |
| | | |
11. | | Depreciation and Amortisation | | | | |
| | | |
| | Depreciation and amortisation expenses for the financial year were charged in respect of: | | | | |
| | Buildings | | 833 | | 768 |
| | Infrastructure | | 1,124 | | 601 |
| | Plant and equipment | | 328 | | 291 |
| | Major plant and equipment | | 89 | | 86 |
| | Heritage and cultural assets | | 3 | | 3 |
| | Leased plant and equipment | | 2 | | 3 |
| | Software development | | 117 | | 99 |
| | | | | | |
| | | | 2,496 | | 1,851 |
| | | | | | |
| | |
| Audited Financial Statements 2008–09 – Queensland General Government Sector | | 6-23 |
Notes to the Financial Statements
| | | | | | |
| | | | | 2009
$M | | 2008
$M |
| | | |
12. | | Other Interest Expense | | | | |
| | | |
| | Interest | | 574 | | 333 |
| | Finance charges relating to finance leases | | 24 | | 13 |
| | Other | | 1 | | 1 |
| | | | | | |
| | | | 599 | | 347 |
| | | | | | |
| | | |
| | Interest expense on financial liabilities other than those at fair value through profit and loss amounts to $60 million (2008, $48 million). | | | | |
| | | |
13. | | Grants Expenses | | | | |
| | | |
| | Grants - recurrent | | 5,447 | | 4,869 |
| | Grants - capital | | 1,229 | | 869 |
| | First Home Owner Grant | | 241 | | 201 |
| | Personal benefit payments | | 232 | | 211 |
| | Community Service Obligations | | 1,814 | | 1,628 |
| | Subsidy payments | | 556 | | 551 |
| | | | | | |
| | | | 9,519 | | 8,329 |
| | | | | | |
| | | |
14. | | Gain on Sale of Assets and Investments | | | | |
| | | |
| | Gain on sale of financial assets | | | | |
| | | | | | |
| | Gain on sale of other investments | | 31 | | 40 |
| | | | | | |
| | | |
| | The gains on sale of financial assets relate to assets at fair value through profit or loss. | | | | |
| | | |
15. | | Revaluation Increments and Impairment Loss Reversals | | | | |
| | | |
| | Revaluation increments of financial assets | | | | |
| | Revaluation decrements - derivatives | | - | | (4) |
| | Revaluation increments - other investments | | - | | 13 |
| | | | | | |
| | | | - | | 10 |
| | | |
| | Revaluation increments - self generating and regenerating assets | | 1 | | - |
| | | | | | |
| | | | 1 | | 10 |
| | | | | | |
| | | |
16. | | Loss on Sale of Assets and Investments | | | | |
| | | |
| | Loss on sale of non-financial assets | | | | |
| | Loss on sale of other non-current assets | | 36 | | 3 |
| | Loss on sale of intangibles | | 6 | | 3 |
| | | | | | |
| | | | 42 | | 6 |
| | | | | | |
| | | |
17. | | Asset Write-Down, Revaluation Decrements and Impairment Loss | | | | |
| | | |
| | Asset write-down | | | | |
| | Bad and doubtful debts (operating receivables impairment loss) | | 79 | | 54 |
| | Inventory write-down (net) | | 3 | | 3 |
| | Other assets written off/donated | | 304 | | 192 |
| | | | | | |
| | | | 386 | | 249 |
| | | |
| | Revaluation decrements of financial assets | | | | |
| | Revaluation decrements - other investments | | 5 | | - |
| | | |
| | Revaluation decrements of non-financial assets | | | | |
| | Revaluation decrements - investment property | | 2 | | (2) |
| | Revaluation decrements - other non-current assets | | 65 | | 2 |
| | | | | | |
| | | | 67 | | - |
| | |
| Audited Financial Statements 2008–09 – Queensland General Government Sector | | 6-24 |
Notes to the Financial Statements
| | | | | | |
| | | | | 2009 $M | | 2008 $M |
| | | |
17. | | Asset Write-Down, Revaluation Decrements and Impairment Loss continued | | | | |
| | | |
| | Impairment losses | | | | |
| | Impairment loss - non-financial assets | | 2 | | 8 |
| | Impairment loss - non-current assets held for sale | | 9 | | 1 |
| | Impairment loss - financial assets at fair value through profit and loss | | 3 | | 2 |
| | | | | | |
| | | | 14 | | 11 |
| | | | | | |
| | | | 471 | | 260 |
| | | | | | |
| | | |
18. | | Actuarial Adjustments to Liabilities | | | | |
| | | |
| | Long service leave | | (44) | | (34) |
| | Other | | 58 | | 83 |
| | | | | | |
| | | | 14 | | 48 |
| | | | | | |
| | | |
19. | | Dividends and Tax Equivalents from Privatisations | | | | |
| | | |
| | Dividends | | 609 | | 1,241 |
| | Income tax equivalents | | - | | - |
| | | | | | |
| | | | 609 | | 1,241 |
| | | | | | |
| | | |
20. | | Other Economic Flows Included in Operating Result | | | | |
| | | |
| | Net market value interest revenue/(expense) | | (123) | | 21 |
| | Time value adjustments | | (16) | | (9) |
| | Other economic flows | | 16 | | 8 |
| | | | | | |
| | | | (123) | | 20 |
| | | | | | |
| | | |
21. | | Other Economic Flows - Other Movement in Equity - Revaluations | | | | |
| | | |
| | Revaluations of financial assets | | | | |
| | Available-for-sale financial assets | | 11 | | (3) |
| | Investments | | 1,792 | | 2,758 |
| | Cash flow hedges | | - | | 3 |
| | | | | | |
| | | | 1,803 | | 2,758 |
| | | |
| | Revaluations of non-financial assets | | | | |
| | Property, plant and equipment | | (10,497) | | 36,281 |
| | | |
| | Self generating and regeneration assets | | (1) | | - |
| | Actuarial gains/(losses) on defined benefit superannuation plans | | (436) | | (1,404) |
| | | | | | |
| | | | (9,131) | | 37,635 |
| | | | | | |
| | | |
22. | | Other Economic Flows - Other Movement in Equity - Other | | | | |
| | | | | | |
| | Equity adjustments from ceased entities | | - | | (595) |
| | | | | | |
| | | |
23. | | Cash and Deposits | | | | |
| | | |
| | Cash | | 498 | | 630 |
| | Deposits on call | | 234 | | 185 |
| | QTC cash funds | | 2,116 | | 2,294 |
| | | | | | |
| | | | 2,848 | | 3,109 |
| | | | | | |
| | | |
| | Agencies forming part of the Public Accounts report all monies on hand as cash. | | | | |
| | |
| Audited Financial Statements 2008–09 – Queensland General Government Sector | | 6-25 |
Notes to the Financial Statements
| | | | | | |
| | | | | 2009
$M | | 2008
$M |
24. | | Receivables and Loans | | | | |
| | | |
| | Receivables | | | | |
| | Current | | | | |
| | Trade debtors | | 746 | | 699 |
| | Interest receivable | | 13 | | 15 |
| | GST input tax credits receivable | | 282 | | 237 |
| | Dividends and guarantee fees receivable | | 958 | | 921 |
| | Royalties and territorial revenue receivable | | 508 | | 472 |
| | Taxes receivable | | 423 | | 382 |
| | Income tax receivable | | 142 | | 131 |
| | Other receivables | | 689 | | 706 |
| | | | | | |
| | | | 3,762 | | 3,562 |
| | Less: Provision for doubtful debts/impairment losses | | 355 | | 317 |
| | | | | | |
| | | | 3,406 | | 3,245 |
| | | | | | |
| | | |
| | Non-Current | | | | |
| | Trade debtors | | 70 | | 69 |
| | Other | | 8 | | - |
| | | | | | |
| | | | 78 | | 69 |
| | | | | | |
| | | | | | |
| | | | | | |
| | | | 3,484 | | 3,314 |
| | | | | | |
| | | |
| | Loans and Advances | | | | |
| | Advances Paid | | | | |
| | Current | | | | |
| | Advances | | 87 | | 53 |
| | Less Provision for doubtful debts/impairment losses | | 3 | | 5 |
| | | | | | |
| | | | 84 | | 48 |
| | | |
| | Non-Current | | | | |
| | Advances | | 491 | | 513 |
| | Less Provision for doubtful debts/impairment losses | | - | | 1 |
| | | | | | |
| | | | 491 | | 512 |
| | | | | | |
| | | | 575 | | 560 |
| | | | | | |
| | | |
| | Loans Paid | | | | |
| | Current | | | | |
| | Fixed rate note | | 806 | | - |
| | Finance leases | | 10 | | 9 |
| | | | | | |
| | | | 816 | | 9 |
| | | | | | |
| | | |
| | Non-Current | | | | |
| | Fixed rate note | | 21,302 | | - |
| | Finance leases | | 80 | | 81 |
| | | | | | |
| | | | 21,383 | | 81 |
| | | | | | |
| | | | | | |
| | | | | | |
| | | | 22,199 | | 90 |
| | | | | | |
| | | |
| | Finance Lease Receivables Due: | | | | |
| | Not later than 1 year | | 10 | | 10 |
| | Later than 1 year but not later than 5 years | | 36 | | 34 |
| | Later than 5 years | | 53 | | 56 |
| | | | | | |
| | | | 99 | | 100 |
| | Less: Future finance revenue | | 9 | | 9 |
| | | | | | |
| | | | 90 | | 91 |
| | | | | | |
| | |
| Audited Financial Statements 2008–09 – Queensland General Government Sector | | 6-26 |
Notes to the Financial Statements
| | | | | | | | | | |
24. | | Receivables and Loans continued | | | | | | | | |
| | | | | |
| | Past Due Not Impaired Financial Assets Analysis
as at 30 June 2009 | | 1 Month or | | 1 to 2 | | 2 to 3 | | Over 3 |
| | | | Less | | Months | | Months | | Months |
| | | | $M | | $M | | $M | | $M |
| | | | | |
| | Trade receivables | | 100 | | 36 | | 20 | | 99 |
| | Other receivables and loans | | 47 | | 2 | | - | | 252 |
| | | | | | | | | | |
| | | | 147 | | 38 | | 20 | | 351 |
| | | | | | | | | | |
| | | | | |
| | Impaired Financial Assets Analysis
as at 30 June 2009 | | 1 Month or | | 1 to 2 | | 2 to 3 | | Over 3 |
| | | | Less | | Months | | Months | | Months |
| | | | $M | | $M | | $M | | $M |
| | | | | |
| | Trade receivables | | 4 | | 2 | | 3 | | 113 |
| | Other receivables and loans | | 2 | | 1 | | 1 | | 233 |
| | | | | | | | | | |
| | | | 6 | | 3 | | 4 | | 346 |
| | | | | | | | | | |
| | | | | |
| | Past Due Not Impaired Financial Assets Analysis
as at 30 June 2008 | | 1 Month or | | 1 to 2 | | 2 to 3 | | Over 3 |
| | | | Less | | Months | | Months | | Months |
| | | | $M | | $M | | $M | | $M |
| | | | | |
| | Trade receivables | | 134 | | 71 | | 19 | | 71 |
| | Other receivables and loans | | 36 | | - | | - | | 194 |
| | | | | | | | | | |
| | | | 170 | | 71 | | 19 | | 265 |
| | | | | | | | | | |
| | | | | |
| | Impaired Financial Assets Analysis
as at 30 June 2008 | | 1 Month or | | 1 to 2 | | 2 to 3 | | Over 3 |
| | | | Less | | Months | | Months | | Months |
| | | | $M | | $M | | $M | | $M |
| | | | | |
| | Trade receivables | | 2 | | 1 | | 2 | | 71 |
| | Other receivables and loans | | 1 | | 1 | | 1 | | 242 |
| | | | | | | | | | |
| | | | 3 | | 2 | | 3 | | 313 |
| | | | | | | | | | |
| | | | | |
| | | | | | | | 2009
$M | | 2008
$M |
25. | | Securities Other Than Shares | | | | | | | | |
| | | | | |
| | Current | | | | | | | | |
| | Term deposits | | | | | | 168 | | 277 |
| | Rental purchase plan | | | | | | 6 | | 9 |
| | Securities/bonds | | | | | | 253 | | 235 |
| | Investments managed by QIC Limited | | | | | | 1,411 | | 2,184 |
| | Other derivatives | | | | | | - | | 1 |
| | Other | | | | | | 1 | | 1 |
| | | | | | | | | | |
| | | | | | | | 1,839 | | 2,706 |
| | | | | | | | | | |
| | | | | |
| | Non-Current | | | | | | | | |
| | Term deposits | | | | | | 25 | | 20 |
| | Rental purchase plan | | | | | | 194 | | 187 |
| | Investments managed by QIC Limited | | | | | | 2,292 | | 22,667 |
| | Other | | | | | | 76 | | 79 |
| | | | | | | | | | |
| | | | | | | | 2,586 | | 22,953 |
| | | | | | | | | | |
| | | | | | | | | | |
| | | | | | | | | | |
| | | | | | | | 4,425 | | 25,659 |
| | | | | | | | | | |
| | |
| Audited Financial Statements 2008–09 – Queensland General Government Sector | | 6-27 |
Notes to the Financial Statements
| | | | | | | | | | | | | | |
| | | | | | | | | | | | 2009
$M | | 2008
$M |
26. | | Shares and Other Equity Investments | | | | | | | | |
| | | | | |
| | Investment in Public Sector Entities | | | | | | 23,954 | | 21,531 |
| | | | | | | | | | | | | | |
| | Investments in public sector entities controlled by the General Government sector are measured | | | | |
| | at the government’s proportional share of the carrying amount of net assets on a GAAP basis. | | | | |
| | Investments in public sector entities are lower than valuations under GFS. GFS does not for | | | | |
| | example recognise provisions for doubtful debts, onerous contracts or deferred tax equivalents. | | | | |
| | | |
| | Reconciliation of Investments in other public sector entities GAAP to GFS | | | | |
| | | |
| | Investments in other public sector entities under GAAP | | 23,954 | | 21,531 |
| | Add provisions for doubtful debts | | 26 | | 36 |
| | Add net deferred tax equivalent liabilities reported by PNFC and PFC | | 4,465 | | 4,237 |
| | Add provisions for onerous contracts recorded by PNFC and PFC | | 100 | | 179 |
| | Add net restoration costs | | 92 | | 91 |
| | | | | | | | | | | | | | |
| | Investments in other public sector entities under GFS | | 28,637 | | 26,074 |
| | | | | | | | | | | | | | |
| | | |
| | Comprehensive result attributable to the GGS of the PNFC and PNF sectors as well
as dividend and other distributions back to the GGS are as follows: | | | | |
| | | | | |
| | | | | | | | Public Non-Financial
Corporations | | Public Financial
Corporations |
| | | | | | | | 2009
$M | | 2008
$M | | 2009
$M | | 2008
$M |
| | | | | | | |
| | Comprehensive result | | | | | | 8,154 | | 4,824 | | (5,124) | | (331) |
| | | | | | | |
| | Dividend and other distributions to GGS | | | | | | (1,543) | | (2,238) | | (18) | | (2) |
| | | | | |
| | Investments in other entities (not controlled or associated) | | | | | | | | |
| | Non-Current | | | | | | | | |
| | Shares at fair value through profit and loss | | | | | | 1 | | 1 |
| | Available-for-sale shares | | | | | | 1 | | 1 |
| | | | | | | | | | | | | | |
| | | | | | | | | | | | 2 | | 2 |
| | | | | | | | | | | | | | |
| | | | | |
| | Investments accounted for using equity method | | | | | | | | |
| | |
| | Investments in the following unlisted associated and joint venture entities are recognised at amounts in excess of $1 million in the accounts of the relevant public sector entity: | | |
| | | | | |
| | Name of Entity | | Principal Activity | | | | Ownership
Interest | | Equity Accounted
Amount |
| | | | | | | | 2009
% | | 2008
% | | 2009
$M | | 2008
$M |
| | | | | | | |
| | Dumaresq-Barwon | | | | | | | | | | | | |
| | Border Rivers | | | | | | | | | | | | |
| | Commission | | Water management | | (i) | | 50 | | 50 | | 36 | | 36 |
| | | | | | | | | | | | | | |
| | | | | | | | | | | | 36 | | 36 |
| | | | | | | | | | | | | | |
| | (i) Dumaresq-Barwon Border Rivers Commission is a joint authority constituted by an
agreement between the Queensland and New South Wales governments. Each
government holds a 50% interest in the joint commission. | | | | | | |
| | | | | |
| | Movements in Carrying Amount of Equity Accounted Investments: | | | | | | | | |
| | | | | |
| | Carrying amount at beginning of the financial year | | | | | | 36 | | 35 |
| | Revaluation of assets | | | | | | - | | 1 |
| | | | | | | | | | | | | | |
| | Carrying amount at end of the financial year | | | | | | 36 | | 36 |
| | | | | | | | | | | | | | |
| | |
| Audited Financial Statements 2008–09 – Queensland General Government Sector | | 6-28 |
Notes to the Financial Statements
| 27. | Interest in Joint Ventures |
Department of Communities (Housing)
The Department of Communities holds a 54% interest (2008, 54%) in a joint venture operation with Queensland University of Technology to develop the Kelvin Grove Urban Village. Each party to the joint venture owns and develops its own land but contributes to the cost of shared infrastructure and other project common works.
The land and development costs included in the Balance Sheet at 30 June 2009 total $14 million (2008, $15 million).
The Council of the Queensland Institute of Medical Research (QIMR)
QIMR holds 24.5% (2008, 24.5%) of the issued capital of Q-Pharm Pty Limited, being a Phase 1 Clinical Trial company joint venture.
QIMR has contractual arrangements with a number of other non-material incorporated and unincorporated joint ventures. Details of the joint venture partners can be obtained from the annual report of QIMR.
Department of Transport and Main Roads
The Department of Transport and Main Roads holds a 50% interest in Personalised Plates Queensland. The joint venture facilitates the management, operational and marketing aspects of personalised number plate sales. The department recognised net revenue of $13 million from these operations (2008, $14 million). Additional details can be obtained from the department’s annual report.
Other
Joint ventures that contribute less than $2 million in net assets and/or net revenues to the Balance Sheet or Operating Statement include:
| | - | The Department of Environment and Resource Management is a party to the Public Sector Mapping Venture to create and facilitate access to national spatial datasets for both governmental and commercial use; and | |
| | - | The Department of Environment and Resource Management, and HEMA Maps Pty Ltd each hold a 50% interest in a joint venture operation to produce, promote, distribute and sell maps from the Sunmap Regional Map series. | |
| 28. | Public Private Partnerships |
Department of Health
Queensland Health has entered into a number of contractual arrangements with private sector entities for the construction and operation of public infrastructure facilities for a period of time on departmental land. After an agreed period of between 15 and 25 years, ownership of these facilities will pass to Queensland Health.
Arrangements are in operation at the following locations as at 30 June 2009:
| | - | Butterfield Street car park (commenced January 1998); | |
| | - | Bramston Terrace car park (commenced November 1998); | |
| | - | Central Energy facility (commenced February 1999); | |
| | - | Noosa Hospital and Specialist Centre (commenced September 1999); | |
| | - | The Prince Charles Hospital car park (commenced November 2000); | |
| | - | Townsville Hospital Support Facilities Building and Walkway (commenced April 2002); | |
| | - | Townsville Childcare Centre (commenced September 2004); | |
| | - | The Prince Charles Hospital Early Education Centre (commenced April 2007); and | |
| | - | The Princess Alexandra Hospital Multi Story Car Park (commenced February 2008). | |
To date, no rights or obligations relating to these facilities have been recognised by Queensland Health, other than those associated with land rental and the provision of various services under the agreements.
Queensland Health also has entered into a number of contractual arrangements (termed collocation agreements) with private sector entities for the construction and operation of private health facilities for a period of time on departmental land. After an agreed period of 25 years, ownership of these facilities will pass to Queensland Health. The department does not control the facilities associated with these arrangements and accordingly, the facilities are not recognised as assets.
Collocation arrangements are in operation at the following locations as at 30 June 2009:
| | - | Caboolture Private Hospital (commenced September 1997); | |
| | - | Redlands Private Hospital (commenced August 1999); and | |
| | - | Holy Spirit Northside Private Hospital (commenced July 2001). | |
| | |
| Audited Financial Statements 2008–09 – Queensland General Government Sector | | 6-29 |
Notes to the Financial Statements
| 28. | Public Private Partnerships continued |
Department of Transport and Main Roads
The Brisbane Airport Rail Link (BARL) is a public rail transport system developed by Airtrain Citylink Limited (Airtrain) to link the Brisbane Domestic and International Airports to the existing QR network.
In 1998, the State Government entered into an agreement with Airtrain whereby Airtrain was required to acquire the land for the BARL, and design, construct, maintain and operate the BARL for a concession period of 35 years. At the end of this period, the agreement provides for Airtrain to transfer the BARL to the Government at no cost to the State.
The State Government leases airport land from the Brisbane Airport Corporation and sub-leases the same land to Airtrain.
Department of Education and Training
(a) Southbank Education and Training Precinct
In April 2005, the State Government entered into a contractual arrangement with Axiom Education Queensland Pty Ltd (Axiom) to design, construct, operate, maintain and finance the Southbank Education and Training Precinct for a period of 34 years on departmental land. The arrangement will involve the refurbishment or demolition of existing buildings and the development of new buildings.
Construction work was completed on 31 October 2008 and leasing arrangements are currently being finalised for the property to be leased to Axiom. The State will sub-lease from Axiom and will pay an abatable, undissected service payment to Axiom for the operation, maintenance and provision of the precinct. At the expiry of the lease in 2039, the buildings will revert to the State for nil consideration. The land on which the facility is constructed is owned and recognised as an asset of the department.
(b) South East Queensland schools - Aspire
In May 2009, the State Government entered into a contractual arrangement with Aspire Schools (Qld) Pty Limited (Aspire) to design, construct, maintain and finance seven schools to the State for a period of 30 years on departmental land.
Construction work commenced in April 2009 and will continue for the next four years with leasing arrangements currently being finalised for the property to be leased to Aspire. The State will lease back the property from Aspire and will pay an abatable, undissected service payment to Aspire for the operation, maintenance and provision of the schools. At the expiry of the lease in 2039, the buildings will revert to the State for nil consideration. The land on which the facility is constructed is owned and recognised as an asset of the department.
Further information may be obtained from the individual financial reports of the relevant agencies.
| | | | |
| | | 2009 | | 2008 |
| | | $M | | $M |
Estimated Cash Flows for Public Private Partnerships | | | | |
Inflows | | | | |
Not later than 1 year | | 1 | | 4 |
Later than 1 year but not later than 5 years | | 3 | | 3 |
Later than 5 years but not later than 10 years | | 4 | | 4 |
Later than 10 years | | 8 | | 9 |
| | | | |
| | 16 | | 20 |
| | |
Outflows | | | | |
Not later than 1 year | | (57) | | (56) |
Later than 1 year but not later than 5 years | | (232) | | (214) |
Later than 5 years but not later than 10 years | | (292) | | (259) |
Later than 10 years | | (433) | | (362) |
| | | | |
| | (1,014) | | (891) |
| | | | |
| | | | |
Estimated Net Cash Flow | | (998) | | (871) |
| | | | |
| | |
| Audited Financial Statements 2008–09 – Queensland General Government Sector | | 6-30 |
Notes to the Financial Statements
| | | | |
| Current | | | | |
Raw materials | | 32 | | 31 |
Work in progress | | 38 | | 49 |
Finished goods | | 132 | | 105 |
Land held for resale | | 296 | | 227 |
Inventories held for distribution | | 4 | | 4 |
Other | | 3 | | 3 |
| | | | |
| | 506 | | 419 |
| | | | |
| | | | |
Land | | 88 | | 175 |
Buildings | | 11 | | 31 |
Plant & equipment (incl. major plant & equipment) | | 11 | | 14 |
Heritage and cultural assets | | 1 | | 1 |
| | | | |
| | 111 | | 221 |
| | | | |
| | | | |
At independent valuation | | 51 | | 53 |
Accumulated depreciation and impairment losses | | - | | - |
| | | | |
| | 51 | | 53 |
| | | | |
| | |
| Movements in Investment Properties | | | | |
| | |
Carrying amount at beginning of year | | 53 | | 50 |
Transfers | | - | | 1 |
Net revaluations increments/(decrements) | | (2) | | 2 |
| | | | |
Carrying amount at end of year | | 51 | | 53 |
| | | | |
| | |
The following revenues and expenses are recognised in the Operating Statement in relation to investment properties: | | | | |
| | |
Rental Income | | 8 | | 7 |
Operating expenses arising from property generating an income | | (2) | | (3) |
| | | | |
| | 6 | | 4 |
| | | | |
| | | | |
Self-generating and regenerating assets: | | | | |
Livestock | | 7 | | 8 |
Plants | | 2 | | 1 |
| | | | |
| | 9 | | 9 |
| | | | |
| 33. | Other Non-Financial Assets |
| | | | |
| Current | | | | |
Prepayments | | 190 | | 221 |
Other | | 3 | | 2 |
| | | | |
| | 193 | | 222 |
| | | | |
| | |
Non-Current | | | | |
Prepayments | | 39 | | 35 |
Other | | 7 | | 7 |
| | | | |
| | 46 | | 42 |
| | | | |
| | | | |
| | | | |
| | 238 | | 264 |
| | | | |
| | |
| Audited Financial Statements 2008–09 – Queensland General Government Sector | | 6-31 |
Notes to the Financial Statements
A number of assets included in the General Government Sector financial statements are classified as restricted assets because their use is wholly or partially restricted by externally imposed requirements. These assets include:
| | | | |
Grants and donations to further medical research in specified areas | | 81 | | 76 |
Cash, property, plant and equipment to be used for specific purposes | | 29 | | 35 |
| | | | |
| | 110 | | 111 |
| | | | |
| | |
| Audited Financial Statements 2008–09 – Queensland General Government Sector | | 6-32 |
Notes to the Financial Statements
| 35. | Property, Plant and Equipment |
| | | | | | | | | | | | | | | | |
| | | | | | | Gross | | Accumulated | | Written Down Value |
| | | | | | | Depreciation/Impairment |
| | | | | | | 2009 | | 2008 | | 2009 | | 2008 | | 2009 | | 2008 |
| | | | | | | $M | | $M | | $M | | $M | | $M | | $M |
Land | | 87,156 | | 82,004 | | (3) | | (1) | | 87,153 | | 82,003 |
Buildings | | 38,780 | | 37,379 | | (12,652) | | (12,251) | | 26,128 | | 25,128 |
Infrastructure | | 57,569 | | 75,115 | | (13,545) | | (17,554) | | 44,024 | | 57,561 |
Major plant and equipment | | 910 | | 978 | | (266) | | (258) | | 644 | | 720 |
Heritage and cultural assets | | 1,310 | | 1,267 | | (106) | | (99) | | 1,204 | | 1,168 |
Plant and equipment | | 3,525 | | 3,159 | | (1,765) | | (1,647) | | 1,760 | | 1,512 |
Leased plant and equipment | | 275 | | 244 | | (7) | | (6) | | 268 | | 238 |
Capital work in progress | | 3,236 | | 2,402 | | - | | - | | 3,236 | | 2,402 |
| | | | | | | | | | | | | | | | |
| | | | | | 192,761 | | 202,548 | | (28,344) | | (31,816) | | 164,417 | | 170,732 |
| | | | | | | | | | | | | | | | |
|
| Reconciliations of the carrying amount for each class of property, plant and equipment are set out below: |
| | | | |
| | | Land | | Buildings | | Infrastructure | | Major Plant and Equipment |
| | | 2009 | | 2008 | | 2009 | | 2008 | | 2009 | | 2008 | | 2009 | | 2008 |
| | | $M | | $M | | $M | | $M | | $M | | $M | | $M | | $M |
| | | | | | | | |
Carrying amount at beginning of year 1 | | 82,003 | | 74,685 | | 25,128 | | 23,569 | | 57,561 | | 26,546 | | 720 | | 271 |
Acquisitions | | 349 | | 448 | | 381 | | 549 | | 1,197 | | 394 | | 147 | | 176 |
Disposals | | (99) | | (105) | | (28) | | (33) | | (294) | | (113) | | (93) | | (99) |
Revaluation increments/(decrements) | | 4,071 | | 7,151 | | 280 | | 1,045 | | (14,611) | | 27,814 | | 12 | | 25 |
Impairment (losses)/reversals | | (95) | | (10) | | (33) | | (47) | | (206) | | - | | - | | - |
Depreciation and amortisation | | - | | - | | (833) | | (768) | | (1,124) | | (601) | | (89) | | (86) |
Net asset transfers | | 924 | | (166) | | 1,233 | | 813 | | 1,501 | | 3,521 | | (53) | | 433 |
| | | | | | | | | | | | | | | | |
Carrying amount at end of year | | 87,153 | | 82,003 | | 26,128 | | 25,128 | | 44,024 | | 57,561 | | 644 | | 720 |
| | | | | | | | | | | | | | | | |
| | |
| Audited Financial Statements 2008–09 – Queensland General Government Sector | | 6-33 |
Notes to the Financial Statements
| 35. | Property, Plant and Equipment continued |
| | | | | | | | | | | | | | | | |
| | | Heritage and Cultural Assets | | Plant and Equipment | | Leased Plant and Equipment | | Capital Work in Progress |
| | | 2009 | | 2008 | | 2009 | | 2008 | | 2009 | | 2008 | | 2009 | | 2008 |
| | | $M | | $M | | $M | | $M | | $M | | $M | | $M | | $M |
| | | | | | | | |
Carrying amount at beginning of year | | 1,168 | | 831 | | 1,512 | | 1,680 | | 238 | | 59 | | 2,402 | | 3,529 |
Acquisitions | | 6 | | 4 | | 385 | | 499 | | 20 | | 179 | | 4,611 | | 3,470 |
Disposals | | - | | - | | (44) | | (36) | | - | | - | | (19) | | (84) |
Revaluation increments/(decrements) | | 3 | | 290 | | 3 | | 1 | | 12 | | 3 | | - | | - |
Depreciation and amortisation | | (3) | | (3) | | (328) | | (291) | | (2) | | (3) | | - | | - |
Net asset transfers | | 30 | | 46 | | 232 | | (341) | | - | | - | | (3,758) | | (4,513) |
| | | | | | | | | | | | | | | | |
Carrying amount at end of year | | 1,204 | | 1,168 | | 1,760 | | 1,512 | | 268 | | 238 | | 3,236 | | 2,402 |
| | | | | | | | | | | | | | | | |
| | | | | | | |
| | | | | | | | | | | | | | Total |
| | | | | | | | | | | | | | | 2009 | | 2008 |
| | | | | | | | | | | | | | | $M | | $M |
| | | | | | | | |
Carrying amount at beginning of year 1 | | | | | | | | | | | | | | 170,732 | | 131,170 |
Acquisitions | | | | | | | | | | | | | | 7,096 | | 5,719 |
Disposals | | | | | | | | | | | | | | (577) | | (470) |
Revaluation increments/(decrements) | | | | | | | | | | | | | | (10,230) | | 36,329 |
Impairment (losses)/reversals | | | | | | | | | | | | | | (334) | | (57) |
Depreciation and amortisation | | | | | | | | | | | | | | (2,379) | | (1,752) |
Net asset transfers | | | | | | | | | | | | | | 109 | | (207) |
| | | | | | | | | | | | | | | | |
Carrying amount at end of year | | | | | | | | | | | | | | 164,417 | | 170,732 |
| | | | | | | | | | | | | | | | |
| | 1. | Carrying amount at beginning of year includes an increase in land of $38.589 billion due to the election by the State to recognise land under roads acquired on or before 30 June 2008 at fair value in accordance with AASB 1051 Land Under Roads. Land under roads acquired on or before 1 July 2008 has been initially recognised at 30 June 2008 at fair value in accordance with AASB 1051 Land Under Roads. Land under roads acquired from 1 July 2008 has been initially recognised at cost and thereafter at fair value in accordance with AASB 116 Property Plant and Equipment. At reporting date the aggregate value of all land under roads is $40.370 billion. | |
| | |
| Audited Financial Statements 2008–09 – Queensland General Government Sector | | 6-34 |
Notes to the Financial Statements
| | | | | | | | | | | | | | | | | | | | |
| 36. | | Intangibles | | Cost | | | | Accumulated | | | | Written Down Value | | |
| | | | | | | | Amortisation | | | | | | |
| | | | | | | | | | | | | | | | |
| | 2009 | | 2008 | | | | 2009 | | 2008 | | | | 2009 | | 2008 |
| | $M | | $M | | | | $M | | $M | | | | $M | | $M |
Software development | | 1,056 | | 884 | | | | (465) | | (390) | | | | 591 | | 494 |
Purchased software | | 481 | | 460 | | | | (332) | | (327) | | | | 149 | | 133 |
Licences and rights | | - | | 1 | | | | - | | (1) | | | | - | | - |
Goodwill | | 3 | | 23 | | | | - | | - | | | | 3 | | 23 |
Other | | 22 | | 22 | | | | (8) | | (6) | | | | 14 | | 16 |
| | | | | | | | | | | | | | | | |
| | 1,562 | | 1,390 | | | | (805) | | (724) | | | | 757 | | 666 |
| | | | | | | | | | | | | | | | |
| | | | |
| | | Software | | Goodwill | | Other | | Total |
| | 2009 | | 2008 | | 2009 | | 2008 | | 2009 | | 2008 | | 2009 | | 2008 |
| | $M | | $M | | $M | | $M | | $M | | $M | | $M | | $M |
Carrying amount at beginning of year | | 628 | | 608 | | 23 | | 3 | | 15 | | 14 | | 666 | | 625 |
Acquisitions | | 19 | | 16 | | - | | 20 | | 1 | | 3 | | 20 | | 39 |
Acquisitions through internal development | | 208 | | 151 | | - | | - | | - | | - | | 208 | | 151 |
Disposals | | (7) | | (7) | | (20) | | - | | - | | - | | (27) | | (7) |
Amortisation | | (117) | | (99) | | - | | - | | (2) | | (2) | | (119) | | (101) |
Net asset transfers | | 9 | | (41) | | - | | - | | - | | - | | 9 | | (41) |
| | | | | | | | | | | | | | | | |
Carrying amount at end of year | | 740 | | 628 | | 3 | | 23 | | 14 | | 15 | | 757 | | 666 |
| | | | | | | | | | | | | | | | |
| | |
| Audited Financial Statements 2008–09 – Queensland General Government Sector | | 6-35 |
Notes to the Financial Statements
| | | | |
Current | | | | |
Trade creditors | | 2,407 | | 1,816 |
Grants and other contributions | | 280 | | 234 |
GST payable | | 117 | | 81 |
Other payables | | 580 | | 505 |
| | | | |
| | 3,384 | | 2,636 |
| | | | |
Non-Current | | | | |
| | | | |
Other payables | | 6 | | 5 |
| | | | |
| | | | |
| | | | |
| | 3,390 | | 2,641 |
| | | | |
| 38. | Employee Benefit Obligations |
| | | | |
Superannuation liability | | | | |
Current | | | | |
Superannuation (refer Note 49) | | 991 | | 1,034 |
Judges’ pensions (refer Note 49) | | 12 | | 11 |
| | | | |
| | 1,003 | | 1,045 |
| | | | |
Non-Current | | | | |
Superannuation (refer Note 49) | | 22,008 | | 20,428 |
Judges’ pensions (refer Note 49) | | 413 | | 440 |
| | | | |
| | 22,421 | | 20,868 |
| | | | |
| | | | |
| | | | |
| | 23,424 | | 21,913 |
| | | | |
Other employee benefits | | | | |
Current | | | | |
Salary and wages payable | | 553 | | 479 |
Annual leave | | 1,010 | | 957 |
Long service leave | | 325 | | 299 |
Other employee entitlements | | 67 | | 63 |
| | | | |
| | 1,955 | | 1,798 |
| | | | |
Non-Current | | | | |
Annual leave | | | | |
Long service leave | | 123 | | 102 |
Other employee entitlement | | 2,102 | | 1,890 |
| | 21 | | 21 |
| | | | |
| | 2,245 | | 2,013 |
| | | | |
| | | | |
| | | | |
| | 4,201 | | 3,811 |
| | | | |
| | | | |
Current | | | | |
Other deposits at amortised cost | | - | | 1 |
| | |
Non-Current | | | | |
Interest bearing security deposits | | 4 | | 3 |
| | | | |
| | 4 | | 4 |
| | | | |
| | |
| Audited Financial Statements 2008–09 – Queensland General Government Sector | | 6-36 |
Notes to the Financial Statements
| 40. | Borrowings and Advances |
| | | | |
Advances Received | | | | |
| Current | | | | |
| State debt to Commonwealth | | 22 | | 21 |
| | |
| Non-Current | | | | |
| State debt to Commonwealth | | 462 | | 480 |
| | | | |
| | 484 | | 501 |
| | | | |
| Borrowings | | | | |
| Current | | | | |
| Finance lease liability (refer note 45) | | 2 | | 2 |
| QTC Borrowings | | 162 | | 397 |
| Loans - other | | 373 | | 292 |
| | | | |
| | 536 | | 691 |
| | | | |
| Non-Current | | | | |
| Finance lease liability (refer note 45) | | 230 | | 212 |
| QTC Borrowings | | 9,510 | | 5,422 |
| Loans - other | | 2 | | 2 |
| | | | |
| | 9,742 | | 5,636 |
| | | | |
| | |
| | | | |
| | 10,278 | | 6,327 |
| | | | |
Lease liabilities are effectively secured as the rights to the leased assets revert to the lessor in the event of a default. Interest on finance leases is recognised as an expense as it accrues. No interest has been capitalised during the current or comparative period.
| 41. | Contractual Maturity Analysis of Financial Liabilities |
The table below sets out the contractual cash flows of the State’s financial liabilities. It is calculated based on undiscounted cash flows relating to the repayment of principal and interest amounts outstanding at balance date.
| | | | | | | | | | |
| As at 30 June 2009 | | | | | | | | | | |
| | | | | |
| | | 1 Year or | | 1 to 5 | | Over 5 | | Total | | Carrying |
| | | Less | | Years | | Years | | | | Value |
| | $M | | $M | | $M | | $M | | $M |
| | | | | |
Payables | | 5,015 | | 149 | | - | | 5,163 | | 5,163 |
QTC Borrowings | | 300 | | 968 | | 11,608 | | 12,876 | | 9,671 |
Liabilities at amortised cost | | 375 | | 106 | | 123 | | 605 | | 611 |
Commonwealth borrowings | | 22 | | 104 | | 357 | | 484 | | 484 |
| | | | | | | | | | |
| | 5,712 | | 1,327 | | 12,088 | | 19,128 | | 15,929 |
| | | | | | | | | | |
| | | | | |
| As at 30 June 2008 | | | | | | | | | | |
| | | | | |
| | | 1 Year or | | 1 to 5 | | Over 5 | | Total | | Carrying |
| | | Less | | Years | | Years | | | | Value |
| | $M | | $M | | $M | | $M | | $M |
| | | | | |
Payables | | 4,135 | | 128 | | - | | 4,263 | | 4,263 |
QTC Borrowings | | 333 | | 1,004 | | 6,524 | | 7,862 | | 5,819 |
Liabilities at amortised cost | | 293 | | 98 | | 115 | | 505 | | 512 |
Commonwealth borrowings | | 21 | | 88 | | 392 | | 501 | | 501 |
| | | | | | | | | | |
| | 4,782 | | 1,318 | | 7,031 | | 13,131 | | 11,095 |
| | | | | | | | | | |
The GGS financial liabilities at fair value through profit and loss comprise the borrowings with QTC as shown above. These loans have a fixed payment schedule, therefore, the repayment amount at maturity is zero.
| | |
| Audited Financial Statements 2008–09 – Queensland General Government Sector | | 6-37 |
Notes to the Financial Statements
| | | | | | | | | | |
| 42. | | Provisions | | | | 2009 | | 2008 | | |
| | | | | | | $M | | $M | | |
| | | | |
| Current | | | | |
| Outstanding claims: (1) | | | | |
HIH/FAI | | 13 | | 14 |
Other | | 150 | | 156 |
| Queensland Government Insurance Fund (2) | | 106 | | 84 |
| Other | | 2 | | 2 |
| | | | |
| | 272 | | 255 |
| | | | |
| Non-Current | | | | |
| Outstanding claims: (1) | | | | |
HIH/FAI | | 34 | | 34 |
Other | | 247 | | 268 |
| Queensland Government Insurance Fund (2) | | 387 | | 425 |
| Other | | 2 | | 2 |
| | | | |
| | 670 | | 729 |
| | | | |
| | | | |
| | | | |
| | 941 | | 984 |
| | | | |
| | (1) | The liability for outstanding claims is measured as the present value of expected future payments, the majority of which are actuarially assessed. The liability includes outstanding claim recoveries and reinsurance receivables of $3 million (2008, $2 million). | |
| | (2) | The Queensland Government Insurance Fund (QGIF) is a centrally managed self-insurance scheme mainly covering property and medical and other liability claims for whole-of-Government. An actuarial assessment of the scheme was undertaken as at 30 June 2009. | |
| | | | | | | | |
Movements in Provisions | | Outstanding
Claims | | QGIF | | Other
Provisions | | Total |
| | $M | | $M | | $M | | $M |
| | | | |
Carrying amount at beginning of year | | 472 | | 509 | | 3 | | 984 |
Additional provisions recognised | | 111 | | 129 | | 2 | | 242 |
Reductions in provisions and payments | | (130) | | (98) | | - | | (228) |
Change from remeasurement
and discounting adjustments | | (9) | | (47) | | (1) | | (57) |
| | | | | | |
Carrying amount at end of year | | 444 | | 493 | | 4 | | 941 |
| | | | | | |
| | | | |
| Current | | | | |
| Unearned revenue | | 513 | | 556 |
| Other | | 74 | | 60 |
| | | | |
| | 587 | | 616 |
| | | | |
Non-Current | | | | |
| Unearned revenue | | 141 | | 258 |
| Other | | 10 | | 8 |
| | | | |
| | 151 | | 267 |
| | | | |
| | | | |
| | | | |
| | 738 | | 883 |
| | | | |
| | |
| Audited Financial Statements 2008–09 – Queensland General Government Sector | | 6-38 |
Notes to the Financial Statements
| (a) | Reconciliation of Operating Result to Net Cash Flows from Operating Activities |
| | | | |
| Operating Result | | (88) | | (377) |
| | |
| Non-Cash Movements (from continuing and discontinued operations): | | | | |
| Depreciation and amortisation | | 2,498 | | 1,853 |
| Net (gain)/loss on disposal/revaluation of non-current assets | | 114 | | 158 |
| Bad debt provision | | 42 | | 36 |
| Equity accounting loss | | - | | - |
| Unrealised net (gain)/loss on borrowings | | 143 | | (8) |
| Other | | (422) | | (1,393) |
| | |
| (Increase)/decrease in receivables | | (79) | | (469) |
| (Increase)/decrease in inventories | | (99) | | (71) |
| (Increase)/decrease in prepayment and other assets | | (5) | | (66) |
| Increase/(decrease) in creditors | | 516 | | 253 |
| Increase/(decrease) in provisions | | 1,225 | | 476 |
| Increase/(decrease) in other liabilities | | (129) | | 4 |
| | | | |
| Total Non-Cash Movements | | 3,804 | | 773 |
| | | | |
| Cash Flows from Operating Activities | | 3,716 | | 396 |
| | | | |
| (b) | Cash Flows Presented on a Net Basis |
Cash flows arising from the following activities are presented on a net basis in the Cash Flow Statement:
| | - | loan advances to and redemptions from borrowing authorities; | |
| | - | receipt and withdrawal of client deposits; and | |
| | - | money market and other deposits. | |
| 45. | Expenditure Commitments |
As at 30 June 2009, GGS entities had entered into the following capital and non-capital expenditure commitments, lease commitments and grant and subsidy commitments with non-public sector entities.
Other than obligations under finance leases, where substantially all the risks and benefits incidental to ownership of the leased assets are transferred to the lessee, the following commitments have not been recognised as liabilities in the Balance Sheet.
Capital Expenditure Commitments
Material classes of capital expenditure commitments inclusive of anticipated GST, contracted for at reporting date but not recognised in the accounts are payable as follows:
| | | | |
Not later than 1 year | | 4,354 | | 3,453 |
Later than 1 year but not later than 5 years | | 3,942 | | 2,982 |
Later than 5 years | | 98 | | 136 |
| | | | |
| | 8,394 | | 6,571 |
| | | | |
Non-Capital Expenditure Commitments | | | | |
| | |
Not later than 1 year | | 1,111 | | 1,825 |
Later than 1 year but not later than 5 years | | 573 | | 1,190 |
Later than 5 years | | 65 | | 232 |
| | | | |
| | 1,749 | | 3,247 |
| | | | |
| | |
| Audited Financial Statements 2008–09 – Queensland General Government Sector | | 6-39 |
Notes to the Financial Statements
| 45. | Expenditure Commitments |
Operating Lease Commitments
| | | | |
Not later than 1 year | | 340 | | 282 |
Later than 1 year but not later than 5 years | | 746 | | 571 |
Later than 5 years | | 276 | | 186 |
| | | | |
| | 1,362 | | 1,039 |
| | | | |
| |
| Operating leases are entered into as a means of acquiring access to office accommodation and storage facilities. Lease payments are generally fixed, but with inflation escalation clauses on which contingent rentals are determined. | | |
| |
| No renewal or purchase options exist in relation to operating leases and no operating leases contain restrictions on financing or other leasing activities. | | |
| | |
| Finance Lease Commitments | | | | |
| | |
Not later than 1 year | | 26 | | 24 |
Later than 1 year but not later than 5 years | | 106 | | 98 |
Later than 5 years | | 666 | | 633 |
| | | | |
Total minimum lease payments | | 798 | | 755 |
Future finance charges | | (566) | | (541) |
| | | | |
Total lease liabilities | | 232 | | 214 |
| | | | |
| | |
Current lease liabilities (refer Note 40) | | 2 | | 2 |
Non-current lease liabilities (refer Note 40) | | 230 | | 212 |
| | | | |
| | 232 | | 214 |
| | | | |
| |
| Finance leases are entered into as a means of funding the acquisition of certain plant and equipment. Lease payments are generally fixed. No leases have escalation clauses other than in the event of payment default. A small number of leases have renewal or purchase options. Where such options exist, they are all exercisable at market prices. | | |
| | |
| Grant and Subsidy Commitments | | | | |
| | |
Not later than 1 year | | 3,225 | | 2,882 |
Later than 1 year but not later than 5 years | | 4,508 | | 5,440 |
Later than 5 years | | 45 | | 473 |
| | | | |
| | 7,778 | | 8,795 |
| | | | |
| 46. | Cash and Other Assets Held in Trust |
| | | | |
| Various monies were held in trust by General Government agencies at 30 June 2009 and are not included as assets/liabilities in the Balance Sheet. A summary follows of entities holding assets in trust: | | |
| | |
The Public Trustee of Queensland | | 1,526 | | 1,544 |
Treasury Department | | 17 | | 19 |
Other | | 239 | | 165 |
| | | | |
| | 1,782 | | 1,728 |
| | | | |
Fees earned by General Government entities for providing trustee services total $12 million (2008, $12 million).
| | |
| Audited Financial Statements 2008–09 – Queensland General Government Sector | | 6-40 |
Notes to the Financial Statements
| 47. | Contingent Assets and Liabilities |
Contingent assets and liabilities represent items that are not recognised in the Balance Sheet because at balance date:
| | - | there is a possible asset or an obligation arising from past events whose existence will be confirmed by the occurrence or non-occurrence of one or more uncertain future events not wholly within the control of the GGS; or | |
| | - | there is a present obligation arising from past events but it is not recognised because it is either not probable that an outflow of resources embodying economic benefits will be required to settle the obligation, or the amount of the obligation cannot be measured reliably. | |
Below are details of the more significant contingent assets and liabilities from a General Government perspective. Reference should be made to individual agency financial reports for additional information.
Pursuant to section 15 of the Queensland Treasury Corporation Act 1988, any losses of the Corporation are the responsibility of the Consolidated Fund. On this basis, the contingent assets and liabilities of the Corporation, which forms part of the Public Financial Corporations Sector, are incorporated in these statements.
| | | | |
Contingent Liabilities – Quantifiable | | 2009 | | 2008 |
| | $M | | $M |
Nature of Contingency | | | | |
| | |
Guarantees and indemnities | | 37,227 | | 29,538 |
QTC Stock Loans | | - | | 124 |
Other | | 22 | | 8 |
| | | | |
| | 37,249 | | 29,670 |
| | | | |
Guarantees and indemnities
These mainly comprise guarantees by the GGS including in respect of borrowings by local governments and public non-financial corporations from the Queensland Treasury Corporation of $2.416 billion and $31.972 billion respectively (2008, $3.038 and $23.325 billion) and in respect of insurance policies issued by Suncorp Life and Suncorp-Metway Limited of $2.084 billion (2008, $2.478 billion). Guarantees of $320 million (2008, $250 million) were also provided by the Queensland Treasury Corporation relating to the trading activities in the national electricity market of subsidiaries of Ergon Energy Corporation Limited, a Queensland Government-owned corporation.
Queensland Treasury Corporation (QTC) - Stock Loans
In support of an active trading and pricing market for QTC stock, the Corporation lends stock to various financial institutions on the basis that such loans form part of QTC’s total exposure to the institution concerned.
QTC’s stock lending policy ensures that all such transactions are covered by appropriate credit arrangements such as credit limits, cash securities or lodgement of collateral securities. In the event that the financial institutions holding QTC stock default on their repayment obligations, QTC would be required to enter the market and borrow further amounts to cover the default. The risk of this eventuality is considered to be low.
At 30 June 2009, no QTC inscribed stock was lent to other financial institutions (2008, $124 million).
Other
As at 30 June 2009, there are 22 cases (2008, 7 cases) filed with the courts relating to revenue collected by the Office of State Revenue. An estimate of the liability should the outcomes of the above mentioned cases prove unfavourable for the State is $22 million (2008, $7 million).
Contingent Liabilities - Not Quantifiable
Legal Proceedings and Disputes
A number of legal actions have been brought against the State Government and its agencies. Notification has also been received of a number of other cases that are not yet subject to court action but which may result in subsequent litigation.
Due to the wide variety and nature of the claims and the uncertainty of any potential liability, no value has been attributed to these actions/claims.
| | |
| Audited Financial Statements 2008–09 – Queensland General Government Sector | | 6-41 |
Notes to the Financial Statements
| 47. | Contingent Assets and Liabilities continued |
Contingent Liabilities - Not Quantifiable continued
Native Title
A number of native title claims that affect the GGS have been filed with the National Native Title Tribunal under the Native Title Act 1993 (Commonwealth). The Native Title Act provides for payment of compensation to native titleholders for a variety of acts that may affect native title.
It is possible that the GGS may face future litigation and liability in respect of these and other claims. However, given the subjectivity of the issue, it is inappropriate to attempt to determine the likely success of such claims or to quantify any potential liability.
Securities, Warranties and Guarantees
The State has provided a number of securities, warranties and guarantees in the normal course of business. The amount of any future claims against these securities, warranties and guarantees cannot be reliably estimated.
Cross Border Lease Transactions
QTC has assumed responsibility for a significant portion of the transaction risk relating to a number of cross border lease transactions and in certain situations could be liable to make additional payments under the transactions. However, external advice and history to date indicate that there is remote likelihood of these events occurring.
In addition, QTC has provided certain guarantees and indemnities to various participants in the cross border lease transactions. Unless exceptional and extreme circumstances arise, it is unlikely that QTC will be required to make a significant payment under these guarantees and indemnities.
Tarong North Power Station
QTC has provided a guarantee of certain payment obligations and an irrevocable put option for an additional 50% of the power station exercisable by the option holder under certain circumstances to support the 50% sale of Tarong North Power Station by the Tarong Energy Corporation Limited.
Rehabilitation of Abandoned Mine Sites
The GGS has a responsibility to rehabilitate abandoned mine sites. At reporting date it is not possible to determine the extent or timing of any potential financial effect that this responsibility may have.
Financial Assurance Liability Gap for Mining Projects
Financial assurances are required when mining projects are undertaken to cover the rehabilitation liability should a mining leaseholder fail to undertake rehabilitation. The current financial assurance system provides for a discount based on past environmental performance. This has resulted in a gap in the financial assurances held by the GGS and the potential liability, should a miner default.
The contingent liability would only be recognised as an actual liability in the event that the miner defaults on the conditions of the licence and the GGS holds insufficient financial assurance to cover the rehabilitation that it considers necessary. At reporting date it is not possible to determine the extent or timing of any potential financial effect of this responsibility.
The State has been negotiating with the mining industry to reduce the gap by encouraging progressive rehabilitation and by reducing discount rates.
Compensation for Infrastructure on Expired Leases
The GGS issues leases or permits which allow activity such as grazing, tourist resorts, etc. to occur on parks and forestry estates. On the expiry of the lease or permit, the GGS may be required to pay compensation to the lessee for improvements made to the property over the duration of the lease. The amount of this liability is not quantifiable, and it is not expected that it will be known until the expiration of the lease or permit. Leases progressively expire until the year 2045.
| | |
| Audited Financial Statements 2008–09 – Queensland General Government Sector | | 6-42 |
Notes to the Financial Statements
| 47. | Contingent Assets and Liabilities continued |
Contingent Liabilities - Not Quantifiable continued
Collingwood Park Mine Subsidence
Due to a mine subsidence event that occurred at Collingwood Park on 26 April 2008, the GGS is providing assistance to property holders including, paying for works necessary to stabilise a property and make it safe, repair mining subsidence-related damage where cost-effective to do so and purchasing of properties beyond economic repair or requiring demolition.
Maritime Incident
In March 2009, the Pacific Adventurer was involved in an incident which resulted in oil and ammonium nitrate being discharged into Moreton Bay. A letter of undertaking from the Standard Steamship Owners’ Protection and Indemnity Insurance (Bermuda) Limited on behalf of the owners of the vessel provides for a capped total aggregate liability on all claims relating to the incident. The Department of Transport and Main Roads is not in a position to accurately and reliably measure the clean up costs which may be directly attributable to the Government.
Alleged Exposure to Lead and Other Toxins at Mount Isa
The Department of Employment, Economic Development and Innovation has been named as a party to claims served on behalf of claimants alleging personal injuries resulting from exposure to lead and other toxins at Mount Isa. It is not possible to make an estimate of the probability of the outcome or of any liability resulting from the above claims.
Contingent Assets - Quantifiable
Guarantees
The Department of Employment, Economic Development and Innovation holds financial assurances of $1.757 billion (2008, $1.451 billion) for mining projects, to cover rehabilitation should a leaseholder fail to undertake rehabilitation. The Department also holds bank guarantees in relation to the Queensland Investment Incentive Scheme (QIIS) grants and other financial support provided to public sector proponents totalling $57 million (2008, $64 million).
The Department of Transport and Main Roads holds securities on behalf of contractors in the form of performance guarantees amounting to $119 million (2008, $143 million).
The Department of Environment and Resource Management holds bank guarantees totalling $70 million (2008, $21 million) as financial security to ensure compliance with various acts, environmental management activities, vegetation management development applications and other contracts and agreements
Translink holds bank guarantees for performance under specific contracts totalling $10 million.
Construction Industry Skills Centre Pty Ltd
A non-recoverable loan of $11 million paid to Construction Industry Skills Centre Pty Ltd is repayable to the State Government in circumstances contingent on the winding up of the company and related trust.
SunWater Land
An agreement entered into in 2001 between the Department of Environment and Resource Management and SunWater carries an obligation on SunWater to pay the Department 50% of the net sale proceeds of a parcel of land at Rocklea. Due to changing circumstances surrounding the usage of the land, the variability of the presale holding period and council requirements for works to be completed before sale, no reliable estimate of the value of the land can be provided.
Ports Corporation of Queensland Ltd
Ports Corporation of Queensland Ltd holds a number of guarantees for security over defects in construction contracts and for future liabilities of port operators.
QIC Limited
An insurance claim is being pursued in relation to a loss incurred as a result of a trading irregularity by QIC Limited. The outcome of this claim is uncertain.
| | |
| Audited Financial Statements 2008–09 – Queensland General Government Sector | | 6-43 |
Notes to the Financial Statements
| 48. | Additional Financial Instruments Disclosure |
Financial Risk Management
The GGS principal financial instruments comprise:
- Cash assets;
- Receivables and loans;
- Term deposits;
- Investments in equities and managed investment schemes;
- Debt securities;
- Payables;
- Borrowings;
- Finance lease payables; and
- Derivatives.
The main purpose in holding financial instruments is to prudentially manage the GGS financial risks within government policy parameters.
The carrying amounts of the GGS financial assets and financial liabilities by category are provided below.
| | | | |
Carrying amounts of financial instruments by category | | 2009 | | 2008 |
| | $M | | $M |
Financial assets | | | | |
Cash and deposits | | 2,848 | | 3,109 |
Receivables and loans | | 26,258 | | 3,965 |
Fair value through profit and loss (at initial recognition) | | 3,971 | | 25,119 |
Held to maturity | | 193 | | 297 |
Available-for-sale investments | | 24,216 | | 21,776 |
| | | | |
| | 57,486 | | 54,265 |
| | | | |
Financial liabilities | | | | |
At fair value through profit and loss (at initial recognition) | | 9,671 | | 5,820 |
At amortised cost | | 6,258 | | 5,275 |
| | | | |
| | 15,929 | | 11,095 |
| | | | |
No GGS financial assets or liabilities at fair value through profit and loss were held for trading.
Net gains/(losses) on General Government available for sale investments recognised in equity amount to $11 million at 30 June 2009 (2008, -$3 million). No amount was removed to profit and loss in 2009 or 2008.
The GGS activities expose it to a variety of financial risks, such as market risk (including interest rate risk, foreign currency risk and price risk), credit risk and liquidity risk. The GGS overall risk management program focuses on the unpredictability of financial markets and seeks to minimise potential adverse effects. The GGS uses certain derivative instruments such as forward exchange contracts and cross currency swaps to hedge risk exposures.
Risk management strategies specific to particular items recognised in the GGS consolidated financial statements are included in the accounting policies relating to that item.
Derivative Financial Instruments
The GGS, through its controlled entities, enters into derivative financial instruments in the normal course of business in order to hedge exposures to movements in foreign currency exchange rates. These transactions relate to contracted purchases of capital equipment and goods and services denominated in foreign currencies.
The portion of the gain or loss on the hedging instrument that is determined to be an effective hedge is recognised directly in equity. When the cash flows occur, the initial measurement of the component recognised in the Balance Sheet is adjusted by the amount deferred in equity.
For the year ended 30 June 2009, no amounts were deferred to or removed from equity by GGS agencies.
| | |
| Audited Financial Statements 2008–09 – Queensland General Government Sector | | 6-44 |
Notes to the Financial Statements
| 48. | Additional Financial Instruments Disclosure continued |
Credit Exposure
Credit risk exposure represents the potential loss that would be recognised if all counterparties failed to perform as contracted. Credit risk is regularly assessed, measured and managed in strict accordance with credit risk policies. These policies minimise exposure to credit default by ensuring entitles within the sector invest in secure assets and monitor funds owed on a timely basis. Exposure to credit risk on borrowings is managed through thorough risk assessments, including credit history, the requirement for new borrowers to obtain independent financial advice and various safety nets, such as limiting the size of loans with any one client. Where appropriate, collateral is obtained in the form of a mortgage or other security. The GGS limits exposure to individually counterparties by determining maximum credit exposure limits based on the counterparty’s rating and size of its Balance Sheet.
The GGS’s credit risk on recognised financial assets is the carrying amount of these assets in the Balance Sheet, net of any impairment losses. This is equal to the market value of investments at balance date. The State’s major concentrations of credit risk are with the housing market and rural sector.
Housing loans are provided to people on low-to-moderate incomes within Queensland. The low level of borrowers overdue indicates the credit quality of the loans. The credit risk in the housing and rural sector is mitigated through mortgages over the properties and other forms of security as deemed appropriate.
The GGS is also exposed to significant concentrations of risk in the finance and investment industry, given the size of its investment portfolio. A ratings-based approach is used to determine credit exposure. The credit risk of investments is monitored through assessment of earnings at risk, current and expected changes in economic conditions and ageing, duration and sensitivity analysis. Cash deposits with QTC are guaranteed by the Queensland Government.
Interest Rate Risk
A number of GGS entities are exposed to interest rate risk through their investments with QIC Limited, cash deposits with QTC and the Commonwealth Bank of Australia, finance leases and borrowings from QTC and Commonwealth Government. In some instances, derivative overlays are used to protect investment portfolios from interest rate risk. The GGS does not undertake hedging in relation to interest rate risk on cash deposits or borrowings. This is managed as per the liquidity risk management strategy.
Price Risk
A number of GGS entities are exposed to price risk through their investments with QIC Limited. The GGS is not materially exposed to other price risks.
Liquidity Risk
Liquidity risk arises from the possibility that individual agencies may be unable to settle a transaction on the due date. The GGS is exposed to liquidity risk in respect of payables and borrowings from the QTC and the Commonwealth Government. A range of funding facilities is used to ensure funds are available, such as maintaining a level of cash balances to fund unexpected cash flows. The contractual maturities of financial liabilities is included at Note 41.
Foreign Exchange Risk
The GGS enters into transactions in currencies other than the Australian Dollar and accordingly, is exposed to foreign currency risk. Individual agencies are responsible for their risk management strategies and forward exchange contracts are entered into to hedge against movements in foreign currencies. Overall, the policy is to hedge between 50% and 100% of committed and forecast purchases denominated in foreign currency where settlement is within 12 months. The sector’s overall exposure to foreign currency risk at 30 June 2009 is minimal.
Sensitivity Analysis
The diverse nature of the financing and investing activities undertaken by agencies across the GGS supports a decentralised approach to risk management. While the GGS has a broad framework for risk management, individual agencies are responsible for managing risks to which they are exposed. A summary sensitivity analysis of the material risks to which the GGS is exposed is provided below. Additional risk management information can be found in individual agencies’ general purpose financial reports.
| | |
| Audited Financial Statements 2008–09 – Queensland General Government Sector | | 6-45 |
Notes to the Financial Statements
| 48. | Additional Financial Instruments Disclosure continued |
Sensitivity Analysis continued
Interest Rate and Price Risk
The GGS is exposed to movements in interest rates and managed fund unit prices through its cash deposits, investments and borrowings.
The effect of a 1% movement in interest rates on the GGS’s cash balances would result in a $28 million increase/decrease (2008, $31 million) in the GGS’s operating result and equity.
The GGS has a fixed rate note with QTC (rate reviewed annually) and investments with QIC Limited that are exposed to interest rate changes and changes in the unit price of the funds managed. Assuming all other variables remained constant, if the return on this loan and investments moved by +/-1%, the GGS operating result and equity would have been approximately $265 million higher or lower (2008, $224 million).
The GGS also has exposure to interest rate risk due to its borrowing from the Commonwealth and QTC. As at 30 June 2009, the carrying value of Commonwealth borrowings was approximately $484 million (2008, $501 million). The majority of this debt is set at fixed interest rates. The remaining portion is at variable rates which have an immaterial sensitivity to changes in interest rates.
QTC borrowings are in the form of fixed rate loans, generic debt pool borrowings (which are akin to fixed rate loans) or floating rate loans. Although the majority of the GGS agency borrowings are either fixed rate loans or generic debt pool loans, the Consolidated Fund bears the risk of movements between the fixed rate and market rate. Consequently, if interest rates on QTC borrowings were to increase/decrease by 1%, the GGS operating result and equity would be approximately $97 million lower or higher (2008, $58 million).
Foreign Exchange Risk
The GGS is exposed to movements in foreign currencies as a result of future commercial transactions denominated in currencies other than the Australian dollar. The effect of these movements on the GGS is not considered material.
Net Fair Value of Financial Instruments
The carrying amount of the State’s financial assets and liabilities equates to their net fair value, except as per table below.
| | | | | | | | |
| | | Carrying Amount | | Fair Value |
| | | | |
| | | 2009 | | 2008 | | 2009 | | 2008 |
| | | $M | | $M | | $M | | $M |
Commonwealth borrowings | | 484 | | 501 | | 414 | | 419 |
The net fair value of financial assets and liabilities is determined as follows:
| | - | cash, deposits, receivables and payables approximate fair value; | |
| | - | the net fair value of other monetary financial assets and liabilities is based on market prices or has been determined by discounting expected future cash flows by the current interest rate for financial assets and liabilities with similar risk profiles; and | |
| | - | the net fair value of derivatives and other financial instruments not traded in an active market is determined using valuation techniques. | |
| 49. | Retirement Benefit Obligations |
Retirement benefit liabilities include the following final salary defined benefit schemes:
| | - | State Public Sector Superannuation Scheme (QSuper); and | |
| | - | Pensions provided in accordance with the Judges’ (Pensions and Long Leave) Act 1967 (Judges’ Scheme). | |
QSuper and Judges’ Schemes
General Government Sector superannuation liabilities include defined benefit schemes for both current and former employees comprising the State Public Sector Superannuation Fund (QSuper). State Government budget dependent agencies, together with a number of statutory bodies, are required to make employer contributions to the QSuper scheme. The “former” defined benefit superannuation liabilities in the Balance Sheet represent the unfunded liabilities of defined benefit members who have elected to leave the scheme. The liability grows due to investment earnings and additional entrants transferring from the defined benefit scheme.
| | |
| Audited Financial Statements 2008–09 – Queensland General Government Sector | | 6-46 |
Notes to the Financial Statements
| 49. | Retirement Benefit Obligations |
QSuper and Judges’ Schemes continued
The QSuper scheme is assessed annually by the State Actuary and a full actuarial review is undertaken every three years. A full actuarial review of QSuper was completed as at 30 June 2007.
QSuper also incorporates defined contribution categories, for which the GGS has no further legal or constructive obligation other than to pay contributions. These liabilities and assets have been accounted for in accordance with the standards relevant to Defined Contribution schemes. In particular, no assets or liabilities relating to the funded Defined Contribution scheme have been included in the Balance Sheet. The expense relating to these schemes is the amount of employer contributions, $1.032 billion (2008, $833 million).
Retirement Benefit Obligations 2008-09
| | | | | | | | |
| | | $M | | $M | | $M | | $M |
Reconciliation of the Present Value of the Defined Benefit Obligation | | | | | | | | |
| | | | |
| | | Total | | QSuper DB | | Former DB | | Judges |
Opening balance at 1 July 2008 | | 28,656 | | 25,509 | | 2,696 | | 451 |
Current service cost | | 1,128 | | 1,106 | | - | | 22 |
Contributions by plan participants | | 258 | | 258 | | - | | - |
Interest cost | | 1,320 | | 1,580 | | (290) | | 30 |
Benefits paid (including contributions tax) | | (1,469) | | (941) | | (517) | | (11) |
Transfers to Former DB | | - | | (490) | | 490 | | - |
Actuarial (gain)/loss | | (996) | | (929) | | - | | (67) |
| | | | | | | | |
Closing balance at 30 June 2009 | | 28,897 | | 26,093 | | 2,379 | | 425 |
| | | | | | | | |
| | | | |
Present Value of the Obligation as at 30 June 2009 by Funding Policy | | | | | | | | |
Present value of the obligation - wholly unfunded | | 2,804 | | | | | | |
Present value of the obligation - wholly/partly funded | | 26,093 | | | | | | |
| | | | | | | | |
| | 28,897 | | | | | | |
| | | | | | | | |
| | | | |
Reconciliation of the Fair Value of Plan Assets | | | | | | | | |
| | | | |
| | | Total | | QSuper DB | | Former DB | | Judges |
Opening balance at 1 July 2008 | | 6,743 | | 6,743 | | - | | - |
Expected return on plan assets | | 462 | | 462 | | - | | - |
Employer contributions | | 900 | | 455 | | 445 | | - |
Contributions by plan participants | | 258 | | 258 | | - | | - |
Benefits paid (including contributions tax) | | (941) | | (941) | | - | | - |
Former DB benefits paid from DB plan assets | | (517) | | (72) | | (445) | | - |
Actuarial gain/(loss) | | (1,432) | | (1,432) | | - | | - |
| | | | | | | | |
Closing balance at 30 June 2009 | | 5,473 | | 5,473 | | - | | - |
| | | | | | | | |
| | | | |
Reconciliation of Balance Sheet Liability/ (Asset) | | | | | | | | |
Present value of the obligation | | 28,897 | | 26,093 | | 2,379 | | 425 |
Fair value of plan assets | | (5,473) | | (5,473) | | - | | - |
| | | | | | | | |
Liability/(Asset) recognised in Balance Sheet | | 23,424 | | 20,620 | | 2,379 | | 425 |
| | | | | | | | |
| | | | |
Amounts recognised in Operating Statement | | | | | | | | |
Current service cost | | 1,128 | | 1,106 | | - | | 22 |
Interest cost | | 1,320 | | 1,580 | | (290) | | 30 |
Expected return on plan assets | | (462) | | (462) | | - | | - |
Total amounts recognised in Operating | | | | | | | | |
| | | | | | | | |
Statement | | 1,986 | | 2,224 | | (290) | | 52 |
| | | | | | | | |
| | | | |
Amounts recognised in Statement of Changes in Equity | | | | | | | | |
Opening cumulative amount of actuarial (gains) and losses | | 2,063 | | 1,976 | | 89 | | (2) |
Net actuarial (gain)/loss recognised in year | | 436 | | 503 | | - | | (67) |
Cumulative actuarial (gains)/losses | | | | | | | | |
recognised in the Statement of Changes | | | | | | | | |
| | | | | | | | |
in Equity | | 2,499 | | 2,479 | | 89 | | (69) |
| | | | | | | | |
| | |
| Audited Financial Statements 2008–09 – Queensland General Government Sector | | 6-47 |
Notes to the Financial Statements
| 49. | Retirement Benefit Obligations continued |
Retirement Benefit Obligations 2008-09 continued
Plan Asset Allocations
State Public Sector Superannuation scheme hold investments with the following asset allocations:
| | | | | | | | |
| | | | | QSuper DB | | Former DB | | Judges |
Equity | | | | 34% | | N/A | | N/A |
Debt instruments | | | | 41% | | N/A | | N/A |
Property | | | | 13% | | N/A | | N/A |
Other | | | | 12% | | N/A | | N/A |
| | | | | | | | |
Total | | | | 100% | | N/A | | N/A |
| | | | | | | | |
QSuper plan assets are those held within the QSuper Trust Fund only.
QSuper holds investments in unit trusts that hold financial instruments issued by the State. These instruments are difficult to accurately value and are immaterial in proportion to the unit trusts. In addition, these trusts own properties which are used by Government agencies. Again the exact values attributable to these tenancies are difficult to accurately determine, nor do they represent a material proportion of the fair value plan assets.
The overall expected rate of return on QSuper plan assets are based on the expected returns by asset class derived by QIC Limited, the strategic asset allocations and the expected levels of taxation applying to the QSuper scheme overall.
| | | | | | | | |
| | | $M | | $M | | $M | | $M |
| | | | |
| | | Total | | QSuper DB | | Former DB | | Judges |
Actual return on plan assets | | (1,100) | | (1,100) | | N/A | | N/A |
| | | | |
Estimate of employer contributions to be paid in 2009-10 | | 1,235 | | 644 | | 591 | | N/A |
| | | | |
Principal actuarial assumptions at 30 June 2009 | | | | | | | | |
| | | | |
| | | | | QSuper DB | | Former DB | | Judges |
Gross discount rate | | | | 5.60% | | -11.46% | | 5.60% |
Net discount rate (after allowance for investment taxation) | | | | 5.30% | | -11.46% | | 5.60% |
Expected rates of return on plan assets (net of fees and taxes) | | | | 7.00% | | N/A | | N/A |
Future inflationary salary increases | | | | 4.10% | | N/A | | 5.10% |
Expected CPI increases | | | | 2.60% | | N/A | | N/A |
| | | | |
Retirement Benefit Obligations 2007-08 | | | | | | | | |
| | | | |
| | | $M | | $M | | $M | | $M |
Reconciliation of the Present Value of the Defined Benefit Obligation | | | | | | | | |
| | | | |
| | | Total | | QSuper DB | | Former DB | | Judges |
Opening balance at 1 July 2007 | | 27,012 | | 23,491 | | 3,111 | | 410 |
Current service cost | | 1,127 | | 1,107 | | - | | 20 |
Contributions by plan participants | | 253 | | 253 | | - | | - |
Interest cost | | 1,291 | | 1,400 | | (135) | | 26 |
Benefits paid (including contributions tax) | | (1,983) | | (1,130) | | (843) | | (10) |
Transfers to Former DB | | - | | (563) | | 563 | | - |
Actuarial (gain)/loss | | 956 | | 951 | | - | | 5 |
| | | | | | | | |
Closing balance at 30 June 2008 | | 28,656 | | 25,509 | | 2,696 | | 451 |
| | | | | | | | |
| | | | |
Present Value of the Obligation as at 30 June 2008 by Funding Policy | | | | | | | | |
Present value of the obligation - wholly unfunded | | 3,147 | | | | | | |
Present value of the obligation - wholly/partly funded | | 25,509 | | | | | | |
| | | | | | | �� | |
| | 28,656 | | | | | | |
| | | | | | | | |
| | |
| Audited Financial Statements 2008–09 – Queensland General Government Sector | | 6-48 |
Notes to the Financial Statements
| 49. | Retirement Benefit Obligations continued |
Retirement Benefit Obligations 2007-08 continued
| | | | | | | | |
| | | $M | | $M | | $M | | $M |
| | | | |
Reconciliation of the Fair Value of Plan Assets | | | | | | | | |
| | | | |
| | | Total | | QSuper DB | | Former DB | | Judges |
Opening balance at 1 July 2007 | | 6,835 | | 6,835 | | - | | - |
Expected return on plan assets | | 474 | | 474 | | - | | - |
Employer contributions | | 1,600 | | 876 | | 724 | | - |
Contributions by plan participants | | 253 | | 253 | | - | | - |
Benefits paid (including contributions tax) | | (1,854) | | (1,130) | | (724) | | - |
Former DB benefits paid from DB plan assets | | (118) | | (118) | | - | | - |
Actuarial gain/(loss) | | (447) | | (447) | | - | | - |
| | | | | | | | |
Closing balance at 30 June 2008 | | 6,743 | | 6,743 | | - | | - |
| | | | | | | | |
| | | | |
Reconciliation of Balance Sheet Liability/(Asset) | | | | | | | | |
| | | | |
Present value of the obligation | | 28,656 | | 25,509 | | 2,696 | | 451 |
Fair value of plan assets | | (6,743) | | (6,743) | | - | | - |
| | | | | | | | |
Liability/(Asset) recognised in Balance Sheet | | 21,913 | | 18,766 | | 2,696 | | 451 |
| | | | | | | | |
| | | | |
Amounts recognised in Operating Statement | | | | | | | | |
Current service cost | | 1,127 | | 1,107 | | - | | 20 |
Interest cost | | 1,291 | | 1,400 | | (135) | | 26 |
Expected return on plan assets | | (474) | | (474) | | - | | - |
Total amounts recognised in Operating | | | | | | | | |
| | | | | | | | |
| Statement | | 1,944 | | 2,033 | | (135) | | 46 |
| | | | | | | | |
| | | | |
Amounts recognised in Statement of Changes in Equity | | | | | | | | |
Opening cumulative amount of actuarial (gains) and losses | | 659 | | 577 | | 89 | | (7) |
Net actuarial (gain)/loss recognised in year | | 1,404 | | 1,399 | | - | | 5 |
Cumulative actuarial (gains)/losses | | | | | | | | |
| recognised in the Statement of Changes | | | | | | | | |
| | | | | | | | |
| in Equity | | 2,063 | | 1,976 | | 89 | | (2) |
| | | | | | | | |
| | | | |
| Plan Asset Allocations | | | | | | | | |
| | | | |
| State Public Sector Superannuation holds investments with the following asset allocations: | | | | | | | | |
| | | | |
| | | | | QSuper DB | | Former DB | | Judges |
Equity | | | | 41% | | N/A | | N/A |
Debt | | | | 40% | | N/A | | N/A |
Property | | | | 13% | | N/A | | N/A |
Other | | | | 6% | | N/A | | N/A |
| | | | | | | | |
Total | | | | 100% | | N/A | | N/A |
| | | | | | | | |
QSuper plan assets are those held within the QSuper Trust Fund only.
QSuper holds investments in unit trusts that hold financial instruments issued by the State. These instruments are difficult to accurately value and are immaterial in proportion to the unit trusts. In addition, these trusts own properties which are used by Government agencies. Again the exact values attributable to these tenancies are difficult to accurately determine, nor do they represent a material proportion of the fair value plan assets.
The overall expected rate of return on QSuper plan assets is based on the expected returns by asset class derived by QIC Limited, the strategic asset allocations and the expected levels of taxation applying to the QSuper scheme overall.
| | |
| Audited Financial Statements 2008–09 – Queensland General Government Sector | | 6-49 |
Notes to the Financial Statements
| 49. | Retirement Benefit Obligations continued |
Retirement Benefit Obligations 2007-08 continued
| | | | | | | | | | |
| | | | | $M | | $M | | $M | | $M |
| | | | | |
| | | | | Total | | QSuper DB | | Former DB | | Judges |
| | | | | |
| Actual return on plan assets | | | | (92) | | (92) | | N/A | | N/A |
| | | | | |
Estimate of employer contributions to be paid in 2008-09 | | | | 1,418 | | 392 | | 1,026 | | N/A |
| | | | | |
Principal actuarial assumptions at 30 June 2008 | | | | | | | | | | |
| | | | | |
| | | | | | | QSuper DB | | Former DB | | Judges |
Gross Discount rate | | | | | | 6.50% | | -4.58% | | 6.50% |
Net Discount rate (after allowance for investment taxation) | | | | | | 6.20% | | -4.58% | | 6.50% |
Expected rates of return on plan assets (net of fees and taxes) | | | | | | 7.00% | | N/A | | N/A |
Future inflationary salary increases | | | | | | 5.25% | | N/A | | 6.75% |
Expected CPI increases | | | | | | 3.75% | | N/A | | N/A |
| | | | | |
| | | 2009 | | 2008 | | 2007 | | 2006 | | 2005 |
| | | $M | | $M | | $M | | $M | | $M |
| | | | |
Experience adjustments relating to liabilities | | | | | | | | |
QSuper DB | | (524) | | (14) | | 428 | | 68 | | (295) |
Former DB | | - | | - | | - | | 89 | | (8) |
Judges | | (15) | | (13) | | (10) | | 12 | | 26 |
| | | | |
Experience adjustments relating to assets | | | | | | | | |
QSuper DB | | (1,432) | | (447) | | 457 | | 392 | | 716 |
Former DB | | - | | - | | - | | - | | - |
Judges | | - | | - | | - | | - | | - |
| | | | |
Present value of defined benefit obligation | | | | | | | | |
QSuper DB | | 26,093 | | 25,509 | | 23,491 | | 21,535 | | 20,115 |
Former DB | | 2,379 | | 2,696 | | 3,111 | | 2,653 | | 2,173 |
Judges | | 425 | | 451 | | 409 | | 398 | | 357 |
| | | | |
Fair value of plan assets | | | | | | | | |
QSuper DB | | 5,473 | | 6,742 | | 6,834 | | 6,886 | | 6,874 |
Former DB | | - | | - | | - | | - | | - |
Judges | | - | | - | | - | | - | | - |
| | | | | |
Surplus/(deficit) QSuper DB | | (20,620) | | (18,767) | | (16,657) | | (14,649) | | (13,241) |
Former DB | | (2,379) | | (2,696) | | (3,111) | | (2,653) | | (2,173) |
Judges | | (425) | | (451) | | (409) | | (398) | | (357) |
Information for years prior to 2005 is not available.
Employee Numbers
The number of full time equivalent employees at 30 June 2009 relating to the GGS entities listed in Note 50 totalled 198,863 (2008, 191,580).
| 50. | Controlled Entities - General Government Sector |
GGS entities are generally considered material for the purposes of this report if they meet either of the following criteria:
| | - | net operating result in excess of $2 million; or | |
| | - | net assets in excess of $25 million. | |
However in addition to material entities, the GGS consolidates some entities which are not material in terms of the operating position or net asset position criteria if they are either a department or if they are funded for the delivery of outputs.
| | |
| Audited Financial Statements 2008–09 – Queensland General Government Sector | | 6-50 |
Notes to the Financial Statements
| 50. | Controlled Entities - General Government Sector continued |
When financial results are available in respect of non-material entities they are reviewed with the aim of including any newly material entities in the following year’s financial statements.
Newly created entities that are expected to meet the materiality criteria on the basis of their initial budget estimates are included in the financial statements from the time of their establishment.
The entities listed under General Government are controlled entities of the GGS which have been included in the financial statements for the year ended 30 June 2009.
The GGS has 100% ownership and voting power in other Queensland public entities and they are listed under and classified as either public non-financial corporations or public financial corporations below.
General Government
Departments of Government (following machinery of government legislation on 26/03/09)
Department of Communities
Department of Community Safety
Department of Education and Training
Department of Employment, Economic Development and Innovation
Department of Environment and Resource Management
Department of Health
Department of Infrastructure and Planning
Department of Justice and Attorney-General
Department of Police
Department of the Premier and Cabinet
Department of Public Works
Department of Transport and Main Roads
Treasury Department
Departments that have ceased (following machinery of government legislation on 26/03/09)
Department of Child Safety
Department of Corrective Services
Department of Emergency Services
Department of Employment and Industrial Relations
Department of Housing
Department of Local Government, Sport and Recreation
Department of Main Roads
Department of Mines and Energy
Department of Natural Resources and Water
Department of Primary Industries and Fisheries
Department of Tourism, Regional Development and Industry
Department of Transport
Disability Services Queensland
Environmental Protection Agency
Other General Government entities
Anti-Discrimination Commission
Australian Agricultural College Corporation
Board of the Queensland Museum
City North Infrastructure Pty Ltd
Commission for Children and Young People and Child Guardian
Crime and Misconduct Commission
Electoral Commission of Queensland
Forestry Plantations Queensland Office
Gold Coast Institute of TAFE (established on 1/07/08)
Health Quality and Complaints Commission
Legal Aid Queensland
Legislative Assembly
Library Board of Queensland
| | |
| Audited Financial Statements 2008–09 – Queensland General Government Sector | | 6-51 |
Notes to the Financial Statements
| 50. | Controlled Entities - General Government Sector continued |
General Government continued
Other General Government entities continued
Motor Accident Insurance Commission
Nominal Defendant
Office of the Governor
Office of the Information Commissioner
Office of the Ombudsman
Prostitution Licensing Authority
Public Service Commission (commenced 1/07/08, amalgamation of Service Delivery and Performance
Commission and the Office of the Public Service Commissioner)
QRAA
Queensland Art Gallery Board of Trustees
Queensland Audit Office
Queensland Building Services Authority
Queensland Future Growth Corporation
Queensland Performing Arts Trust
Queensland Studies Authority
Residential Tenancies Authority
South Bank Corporation
Southbank Institute of Technology
The Council of the Queensland Institute of Medical Research
The Public Trustee of Queensland
Tourism Queensland
TransLink Transit Authority (established on 1/07/08)
Urban Land Development Authority
Workers’ Compensation Regulatory Authority (QComp)
Public Non-financial Corporations
Cairns Ports Limited (transitioned to a company GOC as at 1/07/08)
CS Energy Ltd
DBCT Holdings Pty Ltd
ENERGEX Ltd
Ergon Energy Corporation Limited
Forestry Plantations Queensland
Gladstone Area Water Board
Gladstone Ports Corporation Limited (transitioned to a company GOC as at 1/07/08)
Gold Coast Events Co Pty Ltd (controlled entity of Department of Communities by machinery of government,
previously controlled entity of Department of Local Government, Sport and Recreation)
Mackay Ports Limited (transitioned to a company GOC as at 1/07/08)
Mount Isa Water Board
Port of Brisbane Corporation Limited
Port of Townsville Limited (transitioned to a company GOC as at 1/07/08)
Ports Corporation of Queensland Limited
Powerlink Queensland
QR Limited
Queensland Airport Holdings (Cairns) Pty Ltd (registered on 1/09/08)
Queensland Airport Holdings (Mackay) Pty Ltd (registered on 1/09/08)
Queensland Bulk Water Supply Authority
Queensland Bulk Water Transport Authority
Queensland Lottery Corporation Pty Ltd (controlled entity of Queensland Treasury Holdings Pty Ltd)
Queensland Manufactured Water Authority
Queensland Motorways Limited (controlled entity of Department of Transport and Main Roads)
Queensland Water Infrastructure Pty Ltd (controlled entity of Department of Infrastructure and Planning)
SEQ Water Grid Manager
Southern Regional Water Pipeline Company Pty Ltd trading as LinkWater Projects (controlled entity of
Department of Infrastructure and Planning)
Stadiums Queensland
Stanwell Corporation Limited
SunWater
| | |
| Audited Financial Statements 2008–09 – Queensland General Government Sector | | 6-52 |
Notes to the Financial Statements
| 50. | Controlled Entities - General Government Sector continued |
Public Non-financial Corporations continued
Tarong Energy Corporation Limited
The Trustees of Parklands Gold Coast
ZeroGen Pty Ltd (controlled entity of Department of Employment, Economic Development and Innovation by machinery
of government, previously controlled entity of Department of Mines and Energy)
Public Financial Corporations
QIC Limited (transitioned to a company GOC and renamed from Queensland Investment Corporation as at 30/09/08)
Queensland Treasury Corporation
WorkCover Queensland
The Whole of Government consolidated financial statements (Note 53) list the controlled entities and subsidiaries in relation to the above entities.
| 51. | Reconciliation to GFS Net Operating Balance* |
| | | | | | |
| | | |
| | Notes | | | | |
| | | |
Net result from transactions - net operating balance | | | | 34 | | (1,606) |
| | | | | | |
| | | | | | |
| GFS Net Operating Balance | | | | 34 | | (1,606) |
| | | | | | |
| 52. | Reconciliation to GFS Net Lending/(Borrowing)* |
| | | | | | |
| | | |
Net lending/(borrowing) | | | | (4,399) | | (5,286) |
| | | | | | |
| | | | | | |
GFS net lending/(borrowing) | | | | (4,399) | | (5,286) |
| | | | | | |
| 53. | Reconciliation to GFS Total Change in Net Worth* |
| | | | | | |
Comprehensive result - total change in net worth before transactions with owners as owners | | | | (9,219) | | 75,306 |
| | | |
Convergence differences | | | | | | |
Net gain on equity invesments in other entities | | a | | 140 | | 859 |
Doubtful debts | | b | | 37 | | 35 |
Deferred income tax equivalents | | c | | (228) | | (726) |
| | | | | | |
Total convergence differences | | | | (53) | | 167 |
| | | | | | |
| | | | | | |
GFS Total Change in Net Worth | | | | (9,272) | | 75,473 |
| | | | | | |
Notes:
| | a. | The measurement of equity investments in other public sector entities differs for GFS in that for example, doubtful debt provisions, onerous contract provisions and deferred income tax balances are not recognised in their net worth under GFS. | |
| | b. | GFS does not recognise doubtful debts, whereas the Operating Statement recognises the doubtful debts and classifies it as other economic flows. | |
| | c. | GFS does not recognise deferred income tax equivalents, whereas the Operating Statement classifies deferred income tax equivalents as other economic flows. | |
| | * | Determined in accordance with the ABS GFS Manual. | |
| | |
| Audited Financial Statements 2008–09 – Queensland General Government Sector | | 6-53 |
Notes to the Financial Statements
| 54. | Reconciliation to GFS Net Worth* |
| | | | | | |
| | Notes | | | | |
| | | |
Net Worth | | | | 184,619 | | 193,838 |
| | | |
Convergence differences | | | | | | |
Financial assets | | | | | | |
Accounts receivable | | a | | 360 | | 323 |
Investment in other entities | | b | | 4,683 | | 4,543 |
Non-financial assets | | | | | | |
Deferred tax assets | | c | | (6,236) | | (5,593) |
Liabilities | | | | | | |
Deferred tax liabilities | | d | | 1,771 | | 1,357 |
| | | | | | |
Total convergence differences | | | | 578 | | 629 |
| | | | | | |
| | | | | | |
GFS Net Worth | | | | 185,197 | | 194,467 |
| | | | | | |
Notes:
The convergence differences comprise:
| | a. | GFS does not recognise doubtful debts, whereas a provision for doubtful debts is recognised in the Balance Sheet. | |
| | b. | The measurement of equity investments in other public sector entities differs for GFS in that for example, doubtful debt provisions, onerous contract provisions and deferred income tax balances are not recognised in their net worth under GFS. | |
| | c. | GFS does not recognises deferred tax assets. | |
| | d. | GFS does not recognises deferred tax liabilities. | |
| 55. | Reconciliation to GFS Cash Surplus/(Deficit)* |
| | | | | | |
| | Notes | | | | |
| | | |
Cash surplus/(deficit) | | | | (2,839) | | (4,924) |
| | | |
Convergence differences | | | | | | |
Adjustments to cash flows from investments in non-financial assets for finance leases and similar arrangements | | a | | (20) | | (179) |
| | | | | | |
| | | | | | |
GFS Cash Surplus/(Deficit) | | | | (2,859) | | (5,104) |
| | | | | | |
Notes:
| | a. | GFS recognises a notional cash outflow relating to new finance leases and similar arrangements in calculating cash surplus/(deficit), whereas the Cash Flow Statement does not recognise notional cash flows. | |
| | * | Determined in accordance with the ABS GFS Manual. | |
| | |
| Audited Financial Statements 2008–09 – Queensland General Government Sector | | 6-54 |
Notes to the Financial Statements
| 56. | Expenses from Transactions by Function |
| | | | | | |
General public services | | | | 1,564 | | 1,545 |
Public order and safety | | | | 3,172 | | 2,872 |
Education | | | | 8,197 | | 7,553 |
Health | | | | 9,604 | | 8,537 |
Social security and welfare | | | | 1,838 | | 1,700 |
Housing and community amenities | | | | 1,424 | | 1,127 |
Recreation and culture | | | | 819 | | 743 |
Fuel and energy | | | | 1,227 | | 1,286 |
Agriculture, forestry, fishing and hunting | | | | 1,117 | | 1,025 |
Mining, manufacturing and construction | | | | 200 | | 213 |
Transport and communications | | | | 4,644 | | 3,624 |
Other economic affairs | | | | 852 | | 780 |
Other purposes | | | | 2,316 | | 2,025 |
| | | | | | |
| | | | 36,974 | | 33,030 |
| | | | | | |
| | | | | | |
General public services | | | | 6,087 | | 6,520 |
Public order and safety | | | | 6,306 | | 6,078 |
Education | | | | 17,958 | | 16,125 |
Health | | | | 7,361 | | 7,385 |
Social security and welfare | | | | 756 | | 769 |
Housing and community amenities | | | | 16,071 | | 14,679 |
Recreation and culture | | | | 5,788 | | 5,680 |
Fuel and energy | | | | 5,927 | | 5,533 |
Agriculture, forestry, fishing and hunting | | | | 66,262 | | 62,824 |
Mining, manufacturing and construction | | | | 1,101 | | 1,044 |
Transport and communications | | | | 50,594 | | 62,118 |
Other economic affairs | | | | 235 | | 263 |
Other purposes1 | | | | 45,403 | | 43,241 |
| | | | | | |
| | | | 229,849 | | 232,259 |
| | | | | | |
| | 1 | Includes in excess of $15 billion Crown land subject to lease for a range of purposes and investments held in trust. |
Queensland Infrastructure Reform and Sale Program
On 2 June 2009 the Queensland Government announced its intention to undertake a significant asset sale program.
The Infrastructure Investment (Assets Restructuring and Disposal) Act 2009 has been passed to facilitate the restructure and disposal of particular businesses, assets and liabilities of government entities. The Act grants extensive powers to the Minister to direct the restructuring, disposal or other processes necessary for the sale program with respect to ‘declared projects’. Under Section 5(1) of the Act the following are ‘declared projects’:
| | a. | the disposal of all or part of the businesses, assets and liabilities of Queensland Motorways Limited; | |
| | b. | the disposal of all or part of the businesses, assets and liabilities of Port of Brisbane Corporation Limited (PBC); | |
| | c. | the disposal of all or part of the above rail businesses, assets and liabilities of QR Limited (QR) other than a passenger services business, asset or liability; | |
| | d. | the disposal of all or part of the below rail businesses, assets and liabilities of QR; | |
| | e. | the disposal of all or parts of the Abbot Point Coal Terminal held by Ports Corporation of Queensland Limited and associated businesses, assets and liabilities; and | |
| | f. | the disposal of all or part of the businesses, assets and liabilities of Forestry Plantations Queensland. | |
The Port of Bundaberg will be transferred to Gladstone Ports Corporation prior to the disposal of the businesses, assets and liabilities of PBC.
| | |
| Audited Financial Statements 2008–09 – Queensland General Government Sector | | 6-55 |
Notes to the Financial Statements
| 58. | Future Developments continued |
Queensland Infrastructure Reform and Sale Program continued
The asset sale program will initially consider available options for the disposal of QR’s above and below rail coal business. Opportunities to package up all or parts of QR’s bulk, intermodal, retail and regional freight services as well as certain parts of QR’s below rail network will also be investigated.
At balance sheet date, there is significant uncertainty around the timing and nature of the disposals and therefore the Treasurer considers that the criteria to reclassify the relevant non-current assets or disposal groups as ‘held for sale’ in accordance with AASB 5 Non current Assets Held for Sale and Discontinued Operations as amended have not been met.
| | |
| Audited Financial Statements 2008–09 – Queensland General Government Sector | | 6-56 |
Notes to the Financial Statements
| 59. | 2008-09 Budget to Actual Comparison |
Operating Statement
| | | | | | | | | | | | |
| | | | | Variance Notes | | Published Budget 2009 $M | | Actual 2009 $M | | Change $M | | Change % |
| | Revenue from Transactions | | | | | | | | | | |
| | Taxation revenue | | 1 | | 10,106 | | 8,877 | | (1,230) | | -12.2% |
| | Grants revenue | | 2 | | 15,687 | | 17,476 | | 1,789 | | 11.4% |
| | Sales of goods and services | | | | 3,385 | | 3,568 | | 184 | | 5.4% |
| | Interest income | | 3 | | 2,199 | | 1,482 | | (718) | | -32.6% |
| | Dividend and income tax equivalents income | | 4 | | 1,051 | | 1,180 | | 130 | | 12.3% |
| | Other revenue | | 5 | | 4,154 | | 4,425 | | 272 | | 6.5% |
| | Total Revenue from Transactions | | | | 36,582 | | 37,008 | | 427 | | 1.2% |
| | | | | | |
Less | | Expenses from Transactions | | | | | | | | | | |
| | Employee expenses | | | | 13,896 | | 14,305 | | 409 | | 2.9% |
| | Superannuation expenses | | | | | | | | | | |
| | Superannuation interest cost | | 6 | | 1,219 | | 858 | | (361) | | -29.6% |
| | Other superannuation expenses | | | | 1,959 | | 2,012 | | 53 | | 2.7% |
| | Other operating expenses | | 7 | | 6,782 | | 7,185 | | 403 | | 5.9% |
| | Depreciation and amortisation | | 8 | | 2,665 | | 2,496 | | (168) | | -6.3% |
| | Other interest expense | | | | 539 | | 599 | | 60 | | 11.2% |
| | Grants expenses | | 9 | | 8,713 | | 9,519 | | 806 | | 9.2% |
| | Total Expenses from Transactions | | | | 35,772 | | 36,974 | | 1,201 | | 3.4% |
| | | | | | |
Equals | | Net Operating Balance | | | | 809 | | 35 | | (775) | | |
| | | | | | |
| | Other Economic Flows - Included in Operating Result | | | | | | | | | | |
| | Gain on sale of assets and investments | | | | 31 | | 31 | | 0 | | 1.0% |
| | Revaluation increments and impairment loss reversals | | | | 25 | | 1 | | (23) | | -95.0% |
| | Loss on sale of assets and investments | | | | (11) | | (42) | | (31) | | 294.3% |
| | Asset write-down, revaluation decrements and impairment loss | | 10 | | (198) | | (471) | | (273) | | 138.0% |
| | Actuarial adjustments to liabilities | | | | 14 | | 14 | | (1) | | -3.5% |
| | Deferred income tax equivalents | | 11 | | 329 | | (141) | | (470) | | -143.0% |
| | Dividends and tax equivalents from privatisations | | 12 | | 384 | | 609 | | 225 | | 58.7% |
| | Other | | | | 6 | | (123) | | (128) | | -2305.4% |
| | Total Other Economic Flows - Included in Operating Result | | | | 579 | | (122) | | (701) | | -121.1% |
| | | | | | |
| | Operating Result | | | | 1,388 | | (88) | | (1,476) | | |
| | | | | | |
| | Other Economic Flows - Other Movements in Equity | | | | | | | | | | |
| | Revaluations | | 13 | | 4,072 | | (9,131) | | (13,203) | | -324.2% |
| | Other | | | | 8 | | - | | (8) | | -100.0% |
| | Total Other Economic Flows - Other Movements in Equity | | | | 4,080 | | (9,131) | | (13,211) | | -323.8% |
| | | | | | |
| | | Comprehensive Result - Total Changes in Net Worth | | | | 5,468 | | (9,219) | | (14,687) | | -268.6% |
| | | | | | |
| | KEY FISCAL AGGREGATES | | | | | | | | | | |
| | | | | | |
| | Net Operating Balance | | | | 809 | | 35 | | (775) | | 0.0% |
| | | | | | |
Less | | Net Acquisition/(Disposal) of Non-Financial Assets | | | | | | | | | | |
| | Purchases of non-financial assets | | | | 6,651 | | 6,960 | | 309 | | 4.6% |
| | Less Sales of non-financial assets | | | | 340 | | 405 | | 65 | | 19.2% |
| | Less Depreciation | | | | 2,665 | | 2,496 | | (168) | | -6.3% |
| | Plus Change in inventories | | | | 97 | | 87 | | (10) | | -9.9% |
| | Plus Other movement in non-financial assets | | | | 200 | | 288 | | 88 | | 43.7% |
| | Equals Total Net Acquisition/(Disposal) of Non-Financial Assets | | | | 3,944 | | 4,434 | | 490 | | 25.6% |
| | | | | | |
Equals | | Net Lending/(Borrowing) | | | | (3,134) | | (4,399) | | (1,265) | | -25.6% |
| | |
| Audited Financial Statements 2008–09 – Queensland General Government Sector | | 6-57 |
Notes to the Financial Statements
| 59. | 2008-09 Budget to Actual Comparison continued |
Balance Sheet
| | | | | | | | | | |
| | | Variance
Notes | | Published
Budget
2009 $M | | Actual
2009 $M | | Change
$M | | Change % |
Assets | | | | | | | | | | |
Financial Assets | | | | | | | | | | |
Cash and deposits | | 14 | | 2,204 | | 2,848 | | 643 | | 29.2% |
Receivables and loans | | | | | | | | | | |
Receivables | | 15 | | 2,864 | | 3,484 | | 620 | | 21.7% |
Advances paid | | 16 | | 816 | | 575 | | (241) | | -29.5% |
Loans paid | | 17 | | 88 | | 22,199 | | 22,111 | | 25265.2% |
Securities other than shares | | 18 | | 28,131 | | 4,425 | | (23,706) | | -84.3% |
Shares and other equity investment | | | | | | | | | | |
Investments in public sector entities | | 19 | | 20,669 | | 23,954 | | 3,285 | | 15.9% |
Investments in other entities | | | | 2 | | 2 | | - | | 0.0% |
Investments accounted for using equity method | | | | 37 | | 37 | | - | | 0.0% |
Total Financial Assets | | | | 54,811 | | 57,523 | | 2,713 | | 4.9% |
| | | | | |
Non-Financial Assets | | | | | | | | | | |
Inventories | | | | 497 | | 506 | | 10 | | 2.0% |
Assets held for sale | | | | 76 | | 111 | | 34 | | 44.8% |
Investment properties | | | | 81 | | 51 | | (30) | | -36.7% |
Biological assets | | | | 11 | | 9 | | (2) | | -16.8% |
Property, plant and equipment | | 20 | | 105,986 | | 164,417 | | 58,431 | | 55.1% |
Intangibles | | | | 919 | | 757 | | (162) | | -17.6% |
Deferred tax asset | | 21 | | 5,665 | | 6,236 | | 571 | | 10.1% |
Other non-financial assets | | | | 164 | | 238 | | 74 | | 45.1% |
Total Non-Financial Assets | | | | 113,399 | | 172,326 | | 58,927 | | 52.0% |
| | | | | |
Total Assets | | | | 168,209 | | 229,849 | | 61,640 | | 36.6% |
| | | | | |
Liabilities | | | | | | | | | | |
Deposits held | | | | (6) | | 4 | | 10 | | -168.4% |
Borrowings and advances | | | | | | | | | | |
Advances received | | | | 536 | | 484 | | (52) | | -9.7% |
Borrowings | | 22 | | 8,769 | | 10,278 | | 1,509 | | 17.2% |
Securities other than shares | | | | 12 | | - | | (12) | | -100.0% |
Employee benefit obligations | | | | | | | | | | |
Superannuation liability | | 23 | | 21,874 | | 23,424 | | 1,550 | | 7.1% |
Other employee benefits | | 24 | | 3,665 | | 4,201 | | 536 | | 14.6% |
Payables | | 25 | | 2,388 | | 3,390 | | 1,002 | | 41.9% |
Deferred tax liability | | 26 | | 1,013 | | 1,771 | | 757 | | 74.7% |
Provisions | | | | 995 | | 941 | | (54) | | -5.4% |
Other liabilities | | 27 | | 400 | | 738 | | 338 | | 84.6% |
Total Liabilities | | | | 39,646 | | 45,230 | | 5,584 | | 14.1% |
| | | | | |
Net Assets | | | | 128,563 | | 184,619 | | 56,057 | | 43.6% |
| | | | | |
Net Worth | | | | | | | | | | |
Accumulated surplus | | | | 54,567 | | 90,041 | | 35,475 | | 65.0% |
Reserves | | | | 73,996 | | 94,578 | | 20,581 | | 27.8% |
Total Net Worth | | | | 128,563 | | 184,619 | | 56,056 | | 43.6% |
| | | | | |
KEY FISCAL AGGREGATES | | | | | | | | | | |
Net Financial Worth | | | | 15,164 | | 12,293 | | (2,871) | | -18.9% |
Net Financial Liabilities | | | | 5,504 | | 11,660 | | 6,156 | | 111.8% |
Net Debt | | | | (21,928) | | (19,281) | | 2,647 | | -12.1% |
| | |
| Audited Financial Statements 2008–09 – Queensland General Government Sector | | 6-58 |
Notes to the Financial Statements
| 59. | 2008-09 Budget to Actual Comparison continued |
| | | | | | | | | | |
| Cashflow Statement | | | | | | | | | | |
| | Notes | | Published
Budget 2009 $M | | Actual
2009 $M | | Change
$M | | Change
% |
Cash Flows from Operating Activities | | | | | | | | | | |
| Cash received | | | | | | | | | | |
| Taxes received | | 28 | | 10,105 | | 8,824 | | (1,281) | | -12.7% |
| Grants and subsidies received | | 29 | | 15,526 | | 17,396 | | 1,870 | | 12.0% |
| Sales of goods and services | | 30 | | 3,749 | | 4,101 | | 352 | | 9.4% |
| Interest receipts | | 31 | | 2,197 | | 1,482 | | (715) | | -32.5% |
| Dividends and income tax equivalents | | 32 | | 1,012 | | 1,139 | | 127 | | 12.5% |
| Other receipts | | 33 | | 4,707 | | 5,426 | | 719 | | 15.3% |
| | | | 37,297 | | 38,368 | | 1,072 | | 2.9% |
| | | | | |
Cash paid | | | | | | | | | | |
| Payments for employees | | | | (15,674) | | (15,791) | | (117) | | 0.7% |
| Payments for goods and services | | 34 | | (7,246) | | (8,281) | | (1,035) | | 14.3% |
| Grants and subsidies | | 35 | | (8,757) | | (9,231) | | (474) | | 5.4% |
| Interest paid | | | | (540) | | (597) | | (57) | | 10.5% |
| Other payments | | | | (739) | | (754) | | (15) | | 2.0% |
| | | | (32,955) | | (34,653) | | (1,697) | | 5.2% |
| | | | | |
Net Cash Flows from Operating Activities | | | | 4,341 | | 3,716 | | (625) | | -14.4% |
| | | | | |
Cash Flows from Investing Activities | | | | | | | | | | |
Non-Financial Assets | | | | | | | | | | |
| Purchases of non-financial assets | | 36 | | (6,651) | | (6,960) | | (309) | | 4.6% |
| Sales of non-financial assets | | | | 340 | | 405 | | 65 | | 19.2% |
| | | | (6,311) | | (6,555) | | (244) | | 3.9% |
| | | | | |
Financial Assets (Policy Purposes) | | | | | | | | | | |
| Equity acquisitions | | 37 | | (1,483) | | (1,232) | | 251 | | -16.9% |
| Equity disposals | | | | 1,094 | | 979 | | (115) | | -10.5% |
| | | | (389) | | (253) | | 135 | | -34.8% |
| | | | | |
Financial Assets (Liquidity Purposes) | | | | | | | | | | |
| Sales of investments | | | | 1,717 | | 1,516 | | (201) | | -11.7% |
| Purchases of investments | | | | (2,802) | | (2,385) | | 417 | | -14.9% |
| | 38 | | (1,086) | | (870) | | 216 | | -19.9% |
| | | | | |
Net Cash Flows from Investing Activities | | | | (7,785) | | (7,678) | | 108 | | -1.4% |
| | | | | |
Cash Flows from Financing Activities | | | | | | | | | | |
| Cash received | | | | | | | | | | |
| Advances received | | | | 8 | | - | | (8) | | -100.0% |
| Proceeds of borrowing | | 39 | | 3,271 | | 4,489 | | 1,218 | | 37.2% |
| | | | 3,279 | | 4,489 | | 1,210 | | 36.9% |
| Cash paid | | | | | | | | | | |
| Advances paid | | | | (26) | | (27) | | (1) | | 2.7% |
| Borrowing repaid | | 40 | | (356) | | (761) | | (405) | | 113.6% |
| | | | (382) | | (788) | | (406) | | 106.2% |
| | | | | |
Net Cash Flows from Financing Activities | | | | 2,897 | | 3,701 | | 804 | | 27.8% |
| | | | | |
Net increase/(decreased) in Cash and Deposits Held | | | | (548) | | (261) | | 286 | | -52.3% |
Cash and deposits at the beginning of the financial year | | | | 2,752 | | 3,109 | | 357 | | 13.0% |
Cash and Deposits Held at the End of the Financial Year | | | | 2,204 | | 2,848 | | 643 | | 29.2% |
| | | | | |
KEY FISCAL AGGREGATES | | | | | | | | | | |
Net Cash from Operating Activities | | | | 4,341 | | 3,716 | | (625) | | -14.4% |
Net Cash Flow from Investments in Non-Financial Assets | | | | (6,311) | | (6,555) | | (244) | | 3.9% |
CASH SURPLUS/(DEFICIT) | | | | (1,970) | | (2,839) | | (869) | | 44.1% |
| | | | | |
Derivation of ABS GFS Cash Surplus/Deficit | | | | | | | | | | |
Cash surplus/(deficit) | | | | (1,970) | | (2,839) | | (869) | | 44.1% |
Acquisitions under finance leases and similar arrangements | | | | (152) | | (20) | | 131 | | -86.6% |
ABS GFS Cash Surplus/(Deficit) Including | | | | | | | | | | |
Finance Leases and Similar Arrangements | | | | (2,122) | | (2,859) | | (738) | | 34.8% |
| | |
| Audited Financial Statements 2008–09 – Queensland General Government Sector | | 6-59 |
Notes to the Financial Statements
| 59. | 2008-09 Budget to Actual Comparison continued |
Variance Notes
The Queensland GGS has been impacted by a number of significant events since the original budget was published in June 2008. The largest of these has been the global financial crisis and the resulting Commonwealth Government stimulus package spending.
Operating Statement
| | 1 | The $1.230 billion reduction in taxation revenue compared to the budget published in June 2008 was largely due to a fall in transfer duty of $1.335 billion as a result of the weaker housing market. This was partially offset by increases in payroll tax of $30 million and motor vehicle registration fees of $51 million. | |
| | 2 | Grants revenue has increased by $1.789 billion over the original June 2008 budget. This was due to increased grants funding from the Commonwealth, particularly in the areas of Education, Housing and Health, mostly for the new Specific Purpose Payments and National Partnership Payments arrangements as well as the Nation Building and Jobs Plan. Grants revenue also includes grants received from the Commonwealth to be on-passed to entities outside the State. Current grants for on-passing increased by $122 million against budget and capital grants increased by $94 million, largely due to the Commonwealth Government’s First Home Owners Boost. The outflow of these grants can be seen in the grants expense line (refer note 9). | |
| | 3 | The decline in interest revenue was largely a result of negative 11% earnings on assets held for former defined benefit superannuation liabilities. Former defined benefit superannuation obligations represent the liabilities of defined benefit members who have elected to leave the defined benefit scheme. These liabilities are largely offset by matching investments which fluctuate with investment earnings. The budgeted return on these assets was the long-term expected rate of return of 7.5% per annum. Lower actual earnings on these investments are offset by lower superannuation interest costs (refer note 6). | |
| | 4 | Dividend and tax equivalent income increased $130 million largely due to increases in dividends and tax equivalents income from electricity entities ($157 million), ports ($32 million) and QIC Limited ($22 million), partially offset by a reduction in dividends received from QR Limited ($84 million). | |
| | 5 | Other revenue has increased by $272 million compared to the June 2008 budget. This was driven by an increase in land contributions from developers $323 million, partially offset by a decrease in coal royalties of $173 million. | |
| | 6 | Lower superannuation interest costs are due to lower returns on investments held for former defined benefit superannuation obligations. Actual return on these assets was negative 11% compared to the budget estimate of 7.5% per annum (refer note 3). | |
| | 7 | Other operating expenses have increased by $403 million over the original budget in line with additional funding received from the Commonwealth and the resulting additional projects being undertaken. This is particularly evident in departments responsible for large infrastructure programs, with the Department of Main Roads and Transport showing an increase of $247 million and its commercialised business unit RoadTek increasing by $66 million. | |
| | 8 | Depreciation and amortisation within the GGS has fallen $168 million compared to budget due largely to a decrease in depreciation expense in Health $90 million as a result of changed revaluation practises and re-estimation of building values and useful lives and a downward revaluation in assets of the Department of Main Roads and Transport. | |
| | 9 | Grants expenses have increased $806 million since the original budget was published. This is partly due to an increase in Health grants to the Mater foundation, National Blood Authority, Royal Flying Doctors and other non-government organisations totalling in excess of $120 million. This variance also includes an $89 million increase in grants administered by the Department of Environment and Resource Management including community reserves reinstatement project, contributions to the Border Rivers Commission and land grants to indigenous bodies, and an increase in grants to local governments in the form of $142 million in funding and $76 million of assets transferred. | |
This variance also includes the on-payment of grants received from the Commonwealth for on-passing to entities outside the State. Current grants on-passed increased by $123 million and capital grants by $184 million, largely due to the Commonwealth Government’s introduction of the First Home Owners Boost.
| | 10 | Asset write-downs, revaluation decrements and impairment losses are $273 million higher than budgeted in the June 2008 Budget. This increase is largely due to assets being written off by Department of Main Roads and Transport as a result of their demolition and replacement programs. | |
| | |
| Audited Financial Statements 2008–09 – Queensland General Government Sector | | 6-60 |
Notes to the Financial Statements
| 59. | 2008-09 Budget to Actual Comparison continued |
Variance Notes continued
Operating Statement continued
| | 11 | The $470 million reduction in deferred income tax equivalent income is mainly due to losses incurred by WorkCover. | |
| | 12 | Dividends from privatisation are $225 million higher than budgeted instead of being shown as a return of capital. | |
| | 13 | Revaluations included in the other economic flows are lower than the published budget by $13.216 billion. This is mainly due to Department of Main Roads and Transport re-valuing road infrastructure downward by $14.318 billion. | |
Balance Sheet
The 2008-09 original published budget balance sheet flows from the closing estimated actual balance for 2007-08. This opening position is subsequently revised when the 2007-08 Audited Actual process has been completed. The resulting changes in opening balances can be a major contributor to the variance between 2008-09 original budget position and the actual result. Variances are explained below in terms of changes to opening balances and changes in budgeted transactions for the year.
| | 14 | Movement in cash and deposits was due to changes in the opening balance as outlined above ($357 million) as well as being the result of the sundry variances as per the Cash Flow Statement (refer notes 28 to 40). | |
| | 15 | The change in the receivables balance was largely due to opening balance movements ($502 million). | |
| | 16 | The change in advances paid compared to the 2008-09 budget was mainly due to opening balance movements (-$183 million). | |
| | 17 | The balance of loans paid changed significantly compared to the expected position in the 2008-09 Budget. This was mainly due to a reclassification of long term superannuation assets from securities other than shares into this category ($22.109 billion). | |
| | 18 | Securities other than shares decreased $23.706 billion from the 2008-09 budget due mainly to the reclassification of long term superannuation assets as described above (refer note 16). This balance was also affected by the negative return on investments due to the global financial crisis (-$1.322 billion). | |
| | 19 | Investments in public enterprises increased $3.285 billion since the 2008-09 Budget was published. This was due to an opening balance increase of $1.531 billion as a result of the revaluation of Queensland Motorways assets to fair value in the 2007-08 financial statements and increases in the valuation of the Public Financial Corporations and Public Non-financial Corporations sectors ($2.052 billion). | |
| | 20 | Property plant and equipment opening balances have increased by $58.431 billion mainly as a result of revaluations of land and infrastructure as part of the 2007-08 end of year process ($77.246 billion). This was reduced by a large downward revaluation by the Department of Main Roads and Transport (-$14.318 billion) included in the 2008-09 audited actual position. | |
| | 21 | The $571 million increase in the deferred tax asset over the 2008-09 Budget was due to opening balance movements ($193 million) and increases in Government owned corporations future tax liabilities including the electricity entities ($182 million), Port of Brisbane ($88 million), QR ($58 million) and the water entities ($119 million). | |
| | 22 | Borrowings increased $1.059 billion since the 2008-09 Budget. This variance was largely due to changes to the opening balance ($694 million) and changes in borrowings from QTCn by the departments of Treasury $1.034 billion, Education (-$65 million), Health (-$50 million) and Main Roads and Transport (-$57 million) and by the reduction in Education’s finance leases -$134 million. | |
| | 23 | The superannuation liability increased by $1.550 million largely as a result of opening balance adjustment of $1.065 billion. | |
| | 24 | Other employee benefits increased a total of $536 million, mainly due to an opening balance adjustment of $313 million and an increase in the Long Service Leave Central Scheme provision of $128 million. | |
| | |
| Audited Financial Statements 2008–09 – Queensland General Government Sector | | 6-61 |
Notes to the Financial Statements
| 59. | 2008-09 Budget to Actual Comparison continued |
Variance Notes continued
Balance Sheet continued
| | 25 | The $1.002 billion increase in payables over the 2008-09 budget was partly due to a $192 million movement in the opening balance. Grants payable ($161 million), operating payables ($166 million) and capital payables ($323 million) are largely responsible for the remainder of the total movement. These balances are traditionally difficult to budget as they are impacted by a number of factors which vary throughout the year. | |
| | 26 | The $757 million increase in the deferred tax liability was due to changes in Government owned corporations future income tax liabilities, specifically WorkCover ($414 million), water entities ($240 million) and QR ($211 million), partially offset by reduction in electricity entities (-$103 million). | |
| | 27 | Other liabilities increased $338 million, mainly as a result of an increase in the opening balance of $364 million. | |
Cash Flow Statement
| | 30 | Sales of goods and services increased $352 million from 2008-09 Budget due partly to the grossing up GST on sales and purchases for actuals which was netted at budget time. | |
| | 32 | Dividend and income tax equivalent receipts from government owned electricity and port corporations increased from the 2008-09 Budget by $27 million and $54 million respectively. In addition, income tax equivalent receipts from public financial corporations increased $48 million. These increases were partially offset by a decline of $29 million in dividends from QR Limited. | |
| | 33 | Other revenue has increased $719 million from the original 2008-09 Budget as a result of $966 million GST receipts from the Australian Taxation Office being grossed up on purchases (refer note 34), offset in part by a $208 million decline in mining royalties. | |
| | 34 | The increase in payment for goods and services of $1,035 million largely reflects the gross up of GST paid on purchases (refer note 33). | |
| | 35 | The increase in grants and subsidies from the 2008-09 Budget mainly reflects an additional $220 million in First Home Owner Grant payments to first home buyers driven by the Australian Government’s First Home Owners Boost, growth in grants to local governments of $147 million and $115 million increase in Health grants to the Mater Foundation, National Blood Authority, Royal Flying Doctors and other non-government organisations. | |
| | 36 | Purchases of non-financial assets increased $309 million from the 2008-09 Budget largely due to the revised timing of the Department of Transport and Main Roads capital works program. | |
| | 37 | Equity funding to Public Non-financial Corporation sector entities declined $251 million from the 2008-09 Budget. Lower equity injections reflect reduced funding to Queensland Manufactured Water Authority (QMW) of $198 million and Queensland Rail of $95 million, offset in part by $29 million injection to ZeroGen Pty Ltd. | |
The 2008-09 Budget originally provided equity support to QMW of $360 million. The final equity contribution comprised an injection of $161 million and $198 million contributed via transfer of the equity interest in the South East Queensland (Gold Coast) Desalination Company Pty Ltd.
| | 38 | Net investments in financial assets held for liquidity purposes declined $216 million from the original 2008-09 Budget. Of this decline, $385 million can be attributed to lower reinvestment of interest due to negative 11% earnings on former defined benefit investments and reduced sales following lower than expected superannuation and long service leave beneficiary payments, partially offset by a $150 million increase in fixed term deposits by the Queensland Growth Fund Corporation. | |
| | |
| Audited Financial Statements 2008–09 – Queensland General Government Sector | | 6-62 |
Notes to the Financial Statements
| 59. | 2008-09 Budget to Actual Comparison continued |
Variance Notes continued
Cash Flow Statement continued
| | 39 | Borrowing receipts have increased $1.218 billion over 2008-09 Budget estimate primarily due to reduced operating cash flows and additional funding requirements to support the Government’s capital works program. | |
| | 40 | Borrowing repayments increased $405 million from published Budget, in part, as a result of the reduced equity funding requirements of QMW in obtaining 100 percent ownership in the Gold Coast Desalination Plant (refer note 37). | |
| | |
| Audited Financial Statements 2008–09 – Queensland General Government Sector | | 6-63 |
Certificate of General Government Sector Financial Statements
General Government Financial Statements
2008- 09
Management Certificate
The foregoing General Government sector financial statements have been prepared pursuant to section 25(1)(b) of the Financial Accountability Act 2009 and other prescribed requirements.
In our opinion and in terms of section 25(3) of the Financial Accountability Act 2009 , we certify that the General Government sector financial statements have been properly drawn up, under the prescribed requirements, to present a true and fair view of:
(i) the financial operations and cash flows of the Queensland General Government sector for the financial year; and
(ii) the financial position of the Queensland General Government sector at 30 June 2009.
At date of certification of the statements, we are not aware of any material circumstances that would render any particulars included in the General Government Sector financial statements misleading or inaccurate.
| | | | | | |
| David Newby, CA | | Gerard Bradley, CPA, FCA | | | | ANDREW FRASER |
| Manager, Fiscal Reporting | | Under Treasurer | | | | Treasurer |
| Queensland Treasury | | Queensland Treasury | | | | Minister for Employment and |
| | | | | | Economic Development |
Date 14 October 2009
| | |
| Audited Financial Statements 2008–09 – Queensland General Government Sector | | 6-64 |
Independent Auditor’s Report
To the Treasurer of Queensland
Matters Relating to the Electronic Presentation of the Audited Financial Report
The audit report relates to the financial report of the Queensland General Government Sector for the financial year ended 30 June 2009 included on Treasury Department’s web site. The Under Treasurer is responsible for the integrity of Treasury Department’s web site. We have not been engaged to report on the integrity of Treasury Department’s web site. The audit report refers only to the statements named below. It does not provide an opinion on any other information which may have been hyperlinked to/from these statements. If users of the financial report are concerned with the inherent risks arising from electronic data communications they are advised to refer to the hard copy of the audited financial report, available from Treasury Department, to confirm the information included in the audited financial report presented on this web site.
These matters also relate to the presentation of the audited financial report in other electronic media including CD Rom.
Report on the Financial Report
I have audited the accompanying financial report of the Queensland General Government Sector, which comprises the balance sheet as at 30 June 2009, and the operating statement, statement of changes in net assets (equity), and cash flow statement for the year ended on that date, a summary of significant accounting policies, other explanatory notes and the certificates given by the Treasurer, Under Treasurer and the Manager, Fiscal Reporting. The financial report includes the financial statements of the Queensland General Government Sector for the entities it controlled at the year’s end or from time to time during the financial year.
Treasurer’s Responsibility for the Financial Report
The Treasurer, through the Treasury Department, is responsible for the preparation and fair presentation of the financial report in accordance with prescribed accounting requirements identified in the Financial Accountability Act 2009 and the Financial and Performance Management Standard 2009, including compliance with applicable Australian Accounting Standards (including the Australian Accounting Interpretations). This responsibility includes establishing and maintaining internal controls relevant to the preparation and fair presentation of the financial report that is free from material misstatement, whether due to fraud and error; selecting and applying appropriate accounting policies; and making accounting estimates that are reasonable in the circumstances. The Financial Accountability Act 2009 and the Financial and Performance Management Standard 2009 came into operation on 1 July 2009 and replace the previous requirements contained in the Financial Administration and Audit Act 1977 and the Financial Management Standard 1997.
Auditor’s Responsibility
My responsibility to express an opinion on the financial report based on the audit is prescribed in the Auditor-General Act 2009. This Act, including transitional provisions came into operation on 1 July 2009 and replaces the previous requirements contained in the Financial Administration and Audit Act 1977.
The audit was conducted in accordance with the Auditor-General of Queensland Auditing Standards, which incorporate the Australian Auditing Standards. These auditing standards require compliance with relevant ethical requirements relating to audit engagements and that the audit is planned and performed to obtain reasonable assurance whether the financial report is free of material misstatement.
An audit involves performing procedures to obtain audit evidence about the amounts and disclosures in the financial report. The procedures selected depend on the auditor’s judgement, including the assessment of risks of material misstatement in the financial report, whether due to fraud or error. In making those risk assessments, the auditor considers the entity’s preparation and fair presentation of the financial report in order to design audit procedures that are appropriate in the circumstances, but not for the purpose of expressing an opinion on the effectiveness of the entity’s internal control, other than in expressing an opinion on compliance with prescribed requirements. An audit also includes evaluating the appropriateness of accounting policies and the reasonableness of accounting estimates made by the Accountable Officer, as well as evaluating the overall presentation of the financial report and any mandatory financial reporting requirements as approved by the Treasurer for application in Queensland.
I believe that the audit evidence obtained is sufficient and appropriate to provide a basis for my audit opinion.
My audit is not designed to provide assurance on the accuracy and appropriateness of the budgetary information in the financial report.
Independence
The Auditor-General Act 2009 promotes the independence of the Auditor-General and QAO authorised auditors. The Auditor-General is the auditor of all Queensland public sector entities and can only be removed by Parliament.
| | |
| Audited Financial Statements 2008–09 – Queensland General Government Sector | | 6-65 |
The Auditor-General may conduct an audit in any way considered appropriate and is not subject to direction by any person about the way in which audit powers are to be exercised. The Auditor-General has for the purposes of conducting an audit, access to all documents and property and can report to Parliament matters which in the Auditor-General’s opinion are significant.
Auditor’s Opinion
In accordance with s.42 of the Auditor-General Act 2009 -
| | (a) | I have received all the information and explanations which I have required; and |
| | (i) | the prescribed requirements in respect of the establishment and keeping of accounts have been complied with in all material respects; and | |
| | (ii) | the financial report has been drawn up under prescribed requirements, so as to present a true and fair view of the financial operations and cash flows of the Queensland General Government Sector for the financial year 1 July 2008 to 30 June 2009 and of the financial position as at the end of that year. | |
| | | | |
| |  | | |
G G POOLE FCPA, FCA | | | | Queensland Audit Office |
Auditor-General of Queensland | | | | Brisbane |
| | |
| Audited Consolidated Financial Statements 2008–09 – Government of Queensland | | 6-66 |
2008-09
Audited Information
Queensland Whole of Government
Consolidated Financial Statements
30 June 2009
Queensland
Government
Operating Statement for Queensland Whole of Government Sector
for the Year Ended 30 June 2009
| | | | | | | | | | | | |
| | | | | | | Notes | | 2009 $M | | | 2008
$M | |
| | Revenue from Transactions | | | | | | | | |
| | Taxation revenue | | 3 | | 8,615 | | | 9,349 | |
| | Grants revenue | | 4 | | 17,596 | | | 16,006 | |
| | Sales of goods and services | | 5 | | 11,775 | | | 11,439 | |
| | Interest income | | 6 | | 1,033 | | | 1,600 | |
| | Dividend and income tax equivalents income | | 7 | | 1 | | | 24 | |
| | Other revenue | | 8 | | 4,942 | | | 2,451 | |
| | Total Revenue from Transactions | | | | 43,961 | | | 40,869 | |
| | | | |
Less | | Expenses from Transactions | | | | | | | | |
| | Employee expenses | | 9 | | 16,351 | | | 15,090 | |
| | Superannuation expenses | | | | | | | | |
| | Superannuation interest cost | | 10 | | 844 | | | 790 | |
| | Other superannuation expenses | | 10 | | 2,240 | | | 2,067 | |
| | Other operating expenses | | 11 | | 11,719 | | | 11,251 | |
| | Depreciation and amortisation | | 12 | | 4,371 | | | 3,506 | |
| | Other interest expense | | 13 | | 3,400 | | | 2,673 | |
| | Grants expenses | | 14 | | 7,608 | | | 6,592 | |
| | Total Expenses from Transactions | | | | 46,533 | | | 41,969 | |
| | | | |
Equals | | Net Operating Balance | | | | (2,571 | ) | | (1,100 | ) |
| | | | |
| | Other Economic Flows - Included in Operating Result | | | | | | | | |
| | Gain on sale of assets and investments | | 15 | | 459 | | | 634 | |
| | Revaluation increments and impairment loss reversals | | 16 | | 526 | | | 552 | |
| | Loss on sale of assets and investments | | 17 | | (96 | ) | | (3 | ) |
| | Asset write-down, revaluation decrements and impairment loss | | 18 | | (1,573 | ) | | (797 | ) |
| | Actuarial adjustments to liabilities | | 19 | | 14 | | | 48 | |
| | Other | | 20 | | (3,743 | ) | | (114 | ) |
| | Total Other Economic Flows Included in Operating Result | | | | (4,413 | ) | | 321 | |
| | | | |
| | Operating Result | | | | (6,984 | ) | | (779 | ) |
| | | | |
| | Other Economic Flows - Other Movements in Equity | | | | | | | | |
| | Adjustments to opening balances | | | | - | | | 38,641 | |
| | Revaluations | | 21 | | (2,235 | ) | | 37,433 | |
| | Other | | | | 1 | | | 5 | |
| | Total Other Economic Flows Other Movements in Equity | | | | (2,234 | ) | | 76,078 | |
| | | | |
| | Comprehensive Result | | | | (9,219 | ) | | 75,299 | |
| | | | |
| | Transactions With Owners In Their Capacity as Owners | | | | | | | | |
| | Equity injections/(withdrawals) | | | | - | | | (100 | ) |
| | Total Transactions With Owners In Their Capacity as Owners | | | | - | | | (100 | ) |
| | | | |
| | | Total Change In Net Worth | | | | (9,219 | ) | | 75,199 | |
| | | | |
| | KEY FISCAL AGGREGATES | | | | | | | | |
| | | | |
| | Net Operating Balance | | | | (2,571 | ) | | (1,100 | ) |
| | | | |
Less | | Net Acquisition/(Disposal) of Non-Financial Assets | | | | | | | | |
| | Purchases of non-financial assets | | | | 15,374 | | | 14,047 | |
| | Less | | Sales of non-financial assets | | | | 608 | | | 789 | |
| | Less | | Depreciation | | | | 4,371 | | | 3,506 | |
| | Plus | | Change in inventories | | | | 234 | | | 160 | |
| | Plus | | Other movement in non-financial assets | | | | 277 | | | 194 | |
| | Equals | | Total Net Acquisition/(Disposal) of Non-Financial Assets | | | | 10,906 | | | 10,106 | |
| | | | | |
| | Equals | | Net Lending/(Borrowing) | | | | (13,477 | ) | | (11,205 | ) |
This Operating Statement should be read in conjunction with the accompanying notes.
Note 2 provides disaggregated information in relation to the components of the net surplus/(deficit).
| | |
| Audited Consolidated Financial Statements 2008–09 – Government of Queensland | | 7-01 |
Balance Sheet for Queensland Whole of Government Sector
as at 30 June 2009
| | | | | | | | |
| | | Notes | | 2009 $M | | | 2008
$M | |
Assets | | | | | | | | |
Financial Assets | | | | | | | | |
Cash and deposits | | 22 | | 1,055 | | | 1,186 | |
Receivables and loans | | | | | | | | |
Receivables | | 23 | | 3,980 | | | 3,911 | |
Advances paid | | 23 | | 873 | | | 890 | |
Loans paid | | 23 | | 2,903 | | | 3,444 | |
Securities other than shares | | 24 | | 51,712 | | | 45,527 | |
Shares and other equity investments | | | | | | | | |
Investments in other entities | | 25 | | 35 | | | 262 | |
Investments accounted for using equity method | | 25 | | 79 | | | 87 | |
Total Financial Assets | | | | 60,638 | | | 55,308 | |
| | | |
Non-Financial Assets | | | | | | | | |
Inventories | | 28 | | 1,365 | | | 1,123 | |
Assets held for sale | | 29 | | 208 | | | 374 | |
Investment properties | | 30 | | 1,404 | | | 1,184 | |
Biological assets | | 31 | | 1,177 | | | 1,183 | |
Property, plant and equipment | | 34 | | 225,181 | | | 215,916 | |
Intangibles | | 35 | | 1,173 | | | 1,035 | |
Other non-financial assets | | 32 | | 506 | | | 506 | |
Total Non-Financial Assets | | | | 231,015 | | | 221,322 | |
| | | |
Total Assets | | | | 291,653 | | | 276,630 | |
| | | |
Liabilities | | | | | | | | |
Payables | | 36 | | 4,871 | | | 4,386 | |
Employee benefit obligations | | | | | | | | |
Superannuation liability | | 37 | | 23,554 | | | 21,860 | |
Other employee benefits | | 37 | | 5,111 | | | 4,624 | |
Deposits held | | 38 | | 3,671 | | | 3,774 | |
Borrowings and advances | | | | | | | | |
Advances received | | 39 | | 484 | | | 501 | |
Borrowings | | 39 | | 638 | | | 546 | |
Securities and derivatives | | 40 | | 63,450 | | | 42,153 | |
Provisions | | 42 | | 3,851 | | | 3,382 | |
Other liabilities | | 43 | | 1,404 | | | 1,566 | |
Total Liabilities | | | | 107,034 | | | 82,793 | |
| | | |
Net Assets | | | | 184,619 | | | 193,837 | |
| | | |
Net Worth | | | | | | | | |
Accumulated surplus/(deficit) | | | | 87,716 | | | 94,671 | |
Reserves | | | | 96,903 | | | 99,167 | |
Total Net Worth | | | | 184,619 | | | 193,838 | |
| | | |
KEY FISCAL AGGREGATES | | | | | | | | |
Net Financial Worth | | | | (46,396 | ) | | (27,485 | ) |
Net Financial Liabilities | | | | 46,396 | | | 27,485 | |
Net Debt | | | | 11,700 | | | (4,072 | ) |
This Balance Sheet should be read in conjunction with the accompanying notes.
Note 2 provides disaggregated information in relation to the components of the net assets.
| | |
| Audited Consolidated Financial Statements 2008–09 – Government of Queensland | | 7-02 |
Statement of Changes in Net Assets (Equity) for Queensland Whole of Government Sector
for the year ended 30 June 2009
| | | | | | | | | | | | | | |
| | | | | Adjustments to | | Comprehensive Result for Period 3 | | Transactions with | | |
| | | Opening Balance | | Opening | | | | Transfers / Entity | | Actuarial Gain / Loss | | Owners as | | Closing |
| | | | | Balances 3 | | Movements | | Cessation | | on Superannuation | | Owners | | Balance |
| | | | | | | |
| | | $M | | $M | | $M | | $M | | $M | | $M | | $M |
2009 | | | | | | | | | | | | | | |
Accumulated surplus | | 94,671 | | - | | (6,985) | | 684 | | (654) | | - | | 87,716 |
Revaluation reserve - financial assets | | 1,858 | | - | | 387 | | (6) | | - | | - | | 2,239 |
Revaluation reserve - non-financial assets | | 96,333 | | - | | (1,967) | | (192) | | - | | - | | 94,174 |
Other reserves | | 976 | | - | | (1) | | (485) | | - | | - | | 490 |
Minority interest | | - | | - | | - | | - | | - | | - | | - |
| | | | | | | | | | | | | | |
Total equity at the end of the financial year | | 193,839 | | - | | (8,566) | | 1 | | (654) | | - | | 184,619 |
| | | | | | | | | | | | | | |
| | | | | |
| | | | | Adjustments to | | Comprehensive Result for Period 3 | | Transactions with | | |
| | | Opening Balance | | Opening | | | | Transfers / Entity | | Actuarial Gain / Loss | | Owners as | | Closing |
| | | | | Balances 3 | | Movements | | Cessation | | on Superannuation | | Owners | | Balance |
| | | | | | | |
| | | $M | | $M | | $M | | $M | | $M | | $M | | $M |
2008 | | | | | | | | | | | | | | |
Accumulated surplus 1 | | 57,561 | | 38,639 | | (779) | | 895 | | (1,645) | | - | | 94,671 |
Revaluation reserve - financial assets | | 1,009 | | - | | 1,356 | | (507) | | - | | - | | 1,858 |
Revaluation reserve - non-financial assets 2 | | 58,756 | | 2 | | 37,722 | | (147) | | - | | - | | 96,333 |
Other reserves | | 1,212 | | - | | - | | (236) | | - | | - | | 976 |
Minority interest | | 100 | | - | | - | | - | | - | | (100) | | - |
| | | | | | | | | | | | | | |
Total equity at the end of the financial year | | 118,639 | | 38,641 | | 38,299 | | 5 | | (1,645) | | (100) | | 193,838 |
| | | | | | | | | | | | | | |
1 The opening accumulated surplus has been adjusted by $38.641 billion. This adjustment consists of an increase of $38.589 billion due to the election by the State to recognise land under roads acquired on or before 30 June 2008 in accordance with AASB 1051 Land Under Roads. An adjustment of $40 million was also made to recognise unearned revenue not previously recognised by the former Departments of Environment and Local Government. The movement in the accumulated surplus includes a restatement of $12 million for grant revenue received in prior years by the former Department of Local Government, Sport and Recreation which should have been recognised as revenue when received but which had been incorrectly recognised as revenue when the expenditure was incurred.
2 The movement in the revaluation reserve for non-financial assets includes a restatement of $22 million for the former Departments of Main Roads and Corrective Services, and of $11 million in relation to infrastructure assets of Mount Isa Water Board.
3 Adjustments to opening balances are included as part of the comprehensive result on the face of the Operating Statement as they represent changes to the comprehensive result in prior periods.
This Statement of Changes in Net Assets (Equity) should be read in conjunction with the accompanying notes.
| | |
| Audited Consolidated Financial Statements 2008–09 – Government of Queensland | | 7-03 |
Cash Flow Statement for Queensland Whole of Government Sector
for the Year Ended 30 June 2009
| | | | | | | | |
| | | Notes | | 2009 $M | | | 2008
$M | |
Cash Flows from Operating Activities | | | | | | | | |
Cash received | | | | | | | | |
Taxes received | | | | 8,586 | | | 9,325 | |
Grants and subsidies received | | | | 17,488 | | | 15,594 | |
Sales of goods and services | | | | 13,584 | | | 13,394 | |
Interest receipts | | | | 1,001 | | | 1,569 | |
Dividends and income tax equivalents | | | | - | | | 25 | |
Other receipts | | | | 6,478 | | | 3,945 | |
| | | | 47,137 | | | 43,852 | |
| | | |
Cash paid | | | | | | | | |
Payments for employees | | | | (17,981 | ) | | (17,143 | ) |
Payments for goods and services | | | | (12,517 | ) | | (12,514 | ) |
Grants and subsidies | | | | (7,352 | ) | | (6,452 | ) |
Interest paid | | | | (3,240 | ) | | (2,671 | ) |
Other payments | | | | (2,469 | ) | | (2,397 | ) |
| | | | (43,559 | ) | | (41,177 | ) |
| | | |
Net Cash Flows from Operating Activities | | 44(a) | | 3,577 | | | 2,675 | |
| | | |
Cash Flows from Investing Activities | | | | | | | | |
Non-Financial Assets | | | | | | | | |
Purchases of non-financial assets | | | | (15,374 | ) | | (14,047 | ) |
Sales of non-financial assets | | | | 608 | | | 789 | |
| | | | (14,765 | ) | | (13,258 | ) |
| | | |
Financial Assets (Policy Purposes) | | | | | | | | |
Equity acquisitions | | | | (1,741 | ) | | (310 | ) |
Equity disposals | | | | 1,008 | | | 491 | |
| | | | (733 | ) | | 181 | |
| | | |
Financial Assets (Liquidity Purposes) | | | | | | | | |
Sales of investments | | | | 68,685 | | | 63,850 | |
Purchases of investments | | | | (74,065 | ) | | (63,661 | ) |
| | | | (5,380 | ) | | 188 | |
| | | |
Net Cash Flows from Investing Activities | | | | (20,878 | ) | | (12,888 | ) |
| | | |
Cash Flows from Financing Activities | | | | | | | | |
Cash received | | | | | | | | |
Advances received | | | | - | | | 16 | |
Proceeds of borrowing | | | | 56 | | | 697 | |
Deposits received | | | | 915 | | | 1,082 | |
Other financing | | | | 51,421 | | | 35,140 | |
| | | | 52,392 | | | 36,935 | |
| | | |
Cash paid | | | | | | | | |
Advances paid | | | | (26 | ) | | (14 | ) |
Borrowing repaid | | | | (938 | ) | | - | |
Deposits withdrawn | | | | (1,047 | ) | | (19 | ) |
Other financing | | | | (33,211 | ) | | (26,627 | ) |
| | | | (35,222 | ) | | (26,660 | ) |
| | | |
Net Cash Flows from Financing Activities | | | | 17,170 | | | 10,276 | |
| | | |
Net increase/(decreased) in Cash and Deposits Held | | | | (130 | ) | | 62 | |
Cash and deposits at the beginning of the financial year | | | | 1,186 | | | 1,123 | |
Cash and Cash Equivalents Held at the End of the Financial Year | | 22 | | 1,056 | | | 1,186 | |
KEY FISCAL AGGREGATES | | | | | | | | |
Net Cash from Operating Activities | | | | 3,577 | | | 2,675 | |
Net Cash Flow from Investments in Non-Financial Assets | | | | (14,765 | ) | | (13,258 | ) |
CASH SURPLUS/(DEFICIT) | | | | (11,188 | ) | | (10,583 | ) |
| | | |
Derivation of ABS GFS Cash Surplus/Deficit | | | | | | | | |
Cash surplus/(deficit) | | | | (11,188 | ) | | (10,583 | ) |
Acquisitions under finance leases and similar arrangements | | | | (26 | ) | | (184 | ) |
ABS GFS Cash Surplus/(Deficit) Including | | | | | | | | |
Finance Leases and Similar Arrangements | | | | (11,214 | ) | | (10,767 | ) |
This Cash Flow Statement should be read in conjunction with the accompanying notes.
Note 2 provides disaggregated information in relation to the components of the net cash flows.
| | |
| Audited Consolidated Financial Statements 2008–09 – Government of Queensland | | 7-04 |
Notes to the Financial Statements
| 1. | Significant Accounting Policies |
The following summary presents the significant accounting policies that have been adopted in preparing and presenting the consolidated financial statements of the Government of Queensland.
These consolidated financial statements have been prepared in accordance with the Financial Accountability Act 2009. In addition, the financial statements comply with AASB 1049 Whole of Government and General Government Sector Financial Reporting which requires compliance with all Australian Accounting Standards and Concepts, Urgent Issues Group Consensus Views and other authoritative pronouncements except those identified below.
This financial report is a general purpose financial report.
New or revised accounting standards and interpretations applicable to the reporting entity which have been published and are not mandatory for 30 June 2009 reporting periods are set out below:
AASB 1: First-Time Adoption of Australian Accounting Standards
AASB 3: Business Combinations
AASB 101: Presentation of Financial Statements
AASB 123: Borrowing Costs
AASB 127: Consolidated and Separate Financial Statements
AASB 2007-3: Amendments to Australian Accounting Standards arising from AASB 8 [AASB 5, AASB 6, AASB 102, AASB 107, AASB 119, AASB 127, AASB 134, AASB 136, AASB 1023 & AASB 1038]
AASB 2007-6: Amendments to Australian Accounting Standards arising from AASB 123 [AASB 1, AASB 101, AASB 107, AASB 111, AASB 116 & AASB 138 and Interpretations 1 & 12]
AASB 2007-8: Amendments to Australian Accounting Standards arising from AASB 101
AASB 2007-10: Further Amendments to Australian Accounting Standards arising from AASB 101
AASB 2008-2: Amendments to Australian Accounting Standards - Puttable Financial Instruments and Obligations arising on Liquidation [AASB 7, AASB 101, AASB 132, AASB 139 & Interpretation 2]
AASB 2008-3: Amendments to Australian Accounting Standards arising from AASB 3 and AASB 127 [AASBs 1, 2, 4, 5, 7, 101, 107, 112, 114, 116, 121, 128, 131, 132, 133, 134, 136, 137, 138, & 139 and Interpretations 9 & 107]
AASB 2008-5: Amendments to Australian Accounting Standards arising from the Annual Improvements Project [AASB 5, 7, 101, 102, 107, 108, 110, 116, 118, 119, 120, 123, 127, 128, 129, 131, 132, 134, 136, 138, 139, 140, 141, 1023 & 1038]
AASB 2008-6: Further Amendments to Australian Accounting Standards arising from the Annual Improvements Project [AASB1 & AASB 5]
AASB 2008-7: Amendments to Australian Accounting Standards - Cost of an Investment in a Subsidiary, Jointly Controlled Entity or Associate [AASB 1, AASB 118, AASB 121, AASB127 & AASB 136]
AASB 2008-8: Amendments to Australian Accounting Standards - Eligible Hedged Items [AASB 139]
AASB 2008-9: Amendments to AASB 1049 for Consistency with AASB 101
AASB 2008-11: Amendments to Australian Accounting Standards - Business Combinations Among Not-for-Profit Entities [AASB3]
AASB 2008-13: Amendments to Australian Accounting Standards arising from AASB Interpretation 17 - Distributions of Non-cash Assets to Owners [AASB 5 & AASB 110]
AASB 2009-1: Amendments to Australian Accounting Standards - Borrowing Costs of Not-for-Profit Public Sector Entities [AASB 1, AASB 111 & AASB 123]
AASB 2009-2: Amendments to Australian Accounting Standards - Improving Disclosures about Financial Instruments [AASB 4, AASB 7, AASB 1023 & AASB 1038]
AASB 2009-4: Amendments to Australian Accounting Standards arising from the Annual Improvements Project [AASB 2 and AASB 138 and AASB Interpretations 9 & 16]
AASB 2009-5: Further Amendments to Australian Accounting Standards arising from the Annual Improvements Project [AASB 5, 8, 101, 107, 117, 118, 136 & 139]
AASB 2009-6: Amendments to Australian Accounting Standards
AASB 2009-7: Amendments to Australian Accounting Standards [AASB 5, 7, 107, 112, 136 & 139 and Interpretation 17]
Interpretation 1: Changes in Existing Decommissioning, Restoration and Similar Liabilities
Interpretation 12: Service Concession Arrangements
Interpretation 17: Distributions of Non-cash Assets to Owners
Interpretation 18: Transfers of Assets from Customers
The State has not adopted these standards and interpretations early. Application of these standards will not materially affect any of the amounts recognised in the financial statements, but will impact the type of information disclosed, with the following exception:
| | |
| Audited Consolidated Financial Statements 2008–09 – Government of Queensland | | 7-05 |
Notes to the Financial Statements
| 1. | Significant Accounting Policies continued |
| (a) | Basis of Accounting continued |
The revised version of AASB 123 Borrowing Costs will not impact on the State as under AASB 2009-1 Amendments to Australian Accounting Standards – Borrowing Costs of Not-for-Profit Public Sector Entities [AASB 1, AASB 111 & AASB 123] the AASB decided to reintroduce the option to expense borrowing costs for not-for-profit public sector entities pending the outcome of the AASB project on the application of AASB 123 to not-for-profit public sector entities.
The statements have been prepared on an accrual basis that recognises the financial effects of transactions and events when they occur.
| (b) | The Government Reporting Entity |
In accordance with AASB 127 Consolidated and Separate Financial Statements, these consolidated financial statements include the values of all material assets, liabilities, equities, revenues and expenses controlled by the Government of Queensland.
The ABS GFS Manual provides the basis upon which Government Finance Statistics (GFS) information contained in the financial report is prepared. In particular, notes disclosing key fiscal aggregates of net worth, net operating balance, total change in net worth, net lending/(borrowing) and cash surplus/(deficit) determined using the principles and rules in the ABS GFS Manual are included in the financial report, together with a reconciliation of those key fiscal aggregates to the corresponding key fiscal aggregates determined in accordance with AASB 1049.
Only those agencies considered material by virtue of the size of their financial transactions and/or resources managed are consolidated for the purposes of this report.
Where control of an entity is obtained during the financial year, its results are included in the Operating Statement from the date control commences. Where control of an entity ceases during a financial year, its results are included for that part of the year during which control existed.
The Queensland Government economic entity includes all State Government departments, Public Non-financial Corporations, Public Financial Corporations and their controlled entities. Refer Note 53 for a full list of entities included in each sector.
In the process of reporting the Government of Queensland as a single economic entity, all material inter-entity and intra-entity transactions and balances have been eliminated to the extent practicable.
Assets, liabilities, revenues and expenses that are attributed reliably to each sector of the Queensland Government economic entity are disclosed in Note 2. For disclosure purposes, transactions and balances between sectors have not been eliminated, but those between entities within each sector have been eliminated. The financial impact of inter-sector transactions and balances is disclosed in Note 2, under the heading of Consolidation Adjustments.
A brief description of each broad sector of the Government’s activities, determined in accordance with the Government Financial Statistics Standards (Australian Bureau of Statistics), follows:
General Government Sector
The primary function of General Government sector agencies is to provide public services that:
| | - | | are non-trading in nature and that are for the collective benefit of the community; |
| | - | | are largely financed by way of taxes, fees and other compulsory charges; and |
| | - | | involve the transfer or redistribution of income. |
Public Non-financial Corporations Sector
The primary function of enterprises in the Public Non-financial Corporations sector is to provide goods and services that:
| | - | | are trading, non-regulatory or non-financial in nature; and |
| | - | | are financed by way of sales of goods and services to consumers. |
| | |
| Audited Consolidated Financial Statements 2008–09 – Government of Queensland | | 7-06 |
Notes to the Financial Statements
| 1. | Significant Accounting Policies continued |
Public Financial Corporations Sector
The Public Financial Corporations sector comprises publicly owned institutions which provide financial services usually on a commercial basis.
Functions they perform may include:
| | - | | central bank functions; |
| | - | | accepting on-call, term or savings deposits; |
| | - | | investment fund management; |
| | - | | having the authority to incur liabilities and acquire financial assets in the market on their own account; or |
| | - | | providing insurance services. |
The reporting period of the consolidated entity is the year ended 30 June 2009.
The consolidated financial statements adopt the following valuation methodologies:
| | - | | superannuation, WorkCover, motor vehicle accident liabilities, Queensland Government Insurance Fund and the Queensland Government Long Service Leave Central Scheme provisions are based on actuarial valuations; |
| | - | | investments and other financial assets are recorded at fair value, except as outlined in note 1(ai); |
| | - | | borrowings and other financial liabilities are recorded at fair value, except as outlined in note 1(ai); |
| | - | | power purchase agreements are valued at fair value; |
| | - | | land, buildings, other infrastructure, major plant and equipment and heritage and cultural assets are valued at fair value. Other classes of assets are valued at cost which approximates fair value due to their short useful lives; and |
| | - | | inventories (other than those held for distribution) are valued at the lower of cost and net realisable value under AASB 102 Inventories. |
Historical cost accounting principles are otherwise employed.
Unless otherwise stated, the accounting policies adopted for the reporting period are consistent with those of the previous reporting period. In accordance with AASB 101 Presentation of Financial Statements and AASB 108 Accounting Policies, Changes in Accounting Estimates and Errors, changes to accounting policies are applied retrospectively unless specific transitional provisions apply.
AASB 1049 Whole of Government and General Government Sector Financial Reporting requires the Operating Statement to include all items of income and expense recognised in a period. All amounts relating to an item included in the determination of comprehensive result (total change in net worth) shall be classified as transactions or other economic flows in a manner that is consistent with the ABS GFS Manual. Key technical terms from the ABS GFS Manual that are used in this financial report are outlined in Note 1(an).
Transactions are interactions between two units by mutual agreement or an action within a unit that is analytically useful to treat as a transaction. Other economic flows are changes in the volume or value of an asset or liability that do not result from transactions (i.e. revaluations and other changes in the volume of assets).
Where application of accounting standards results in a variance to GFS, a reconciliation to GFS is provided in Notes 54 to 58.
All amounts in the consolidated financial statements have been rounded to the nearest $1 million or where the amount is less than $500,000 to zero, unless otherwise indicated. Accordingly, numbers may not add due to rounding.
| (h) | Comparative Information |
In accordance with AASB 1049 comparatives have been prepared as if this standard had applied to the previous period.
| | |
| Audited Consolidated Financial Statements 2008–09 – Government of Queensland | | 7-07 |
Notes to the Financial Statements
| 1. | Significant Accounting Policies continued |
AASB 108 requires that material prior period errors be corrected retrospectively by either restating comparative amounts if the errors occurred in the prior year; or restating the opening balances of assets, liabilities and equity of the prior year where the error occurred before the prior year.
Business combinations are recognised in accordance with AASB 3 Business Combinations and accounted for using the purchase method, regardless of whether equity instruments or other assets and liabilities are acquired.
Cost is measured as the fair value of the assets given or liabilities incurred or assumed at the date of exchange plus costs directly attributable to the acquisition.
Identifiable assets acquired, liabilities and contingent liabilities assumed in a business combination are measured initially at their fair value at the acquisition date, irrespective of the extent of any minority interest. The excess of cost of acquisition over the fair value of the State’s share of the identifiable net assets acquired is recorded as goodwill. If the cost of acquisition is less than the State’s share of the fair value of the identifiable net assets of the subsidiary acquired, the difference is recognised directly in the Operating Statement, but only after a reassessment of the identification and measurement of the net assets acquired.
Where settlement of any part of the cash consideration is deferred, the amounts payable in the future are discounted to their present value as at the date of the exchange. The discount rate used is the borrowing rate applicable to similar borrowing from independent financiers under comparable terms and conditions.
Commonwealth and other grants are recognised as revenue when the recipient entity obtains control over the grant, usually upon receipt. Where the grant is of a reciprocal nature, revenue is recognised as and when the obligation is fulfilled. When revenue, including grants, has been received in advance for services or works still to be completed at balance date, this revenue is considered to be unearned and is reported in other liabilities. Refer Note 43.
Assets received at below fair value, including those received free of charge and that can be measured reliably are recognised at their fair value as revenue when control over the assets is obtained, normally either on receipt of the assets or on notification that the assets have been secured.
Contributions of services are recognised only if the services would have been purchased if they had not been donated and their fair value can be reliably measured. Where this is the case, an equal amount is recognised as a revenue and an expense.
Non-repayable developer or customer contributions are recognised as revenue and as assets in accordance with Urgent Issues Group 1017 Developer and Customer Contributions for Connection to a Price Regulated Network .
To the extent practicable, revenues from the sale of goods and services (including gas and electricity), fines and regulatory fees are recognised when the transactions or events giving rise to the revenue occurs.
State taxation is recognised as revenue upon the earlier of receipt by the responsible agency of a taxpayer’s self-assessment or at the time the taxpayer’s obligation to pay arises pursuant to the issue of an assessment. Taxation also includes interest and penalties.
The main types of taxation and fee revenues raised by the State Government are:
| | - | | transfer and other duties; |
| | - | | various gaming and lottery taxes. |
Interest income includes investment income earned on financial assets during the financial year.
Net increments in the market values of biological assets are recognised as other economic flows.
| | |
| Audited Consolidated Financial Statements 2008–09 – Government of Queensland | | 7-08 |
Notes to the Financial Statements
| 1. | Significant Accounting Policies continued |
| (l) | Other Interest Expense |
Interest and other finance charges are recognised as expenses in the period in which they are incurred.
The Government is exempt from Commonwealth taxation except for Fringe Benefits Tax and Goods and Services Tax (GST).
Revenues, expenses and assets are recognised net of GST, except where the amount of GST incurred is not recoverable from the Australian Taxation Office (ATO). In these circumstances the GST is recognised as part of the acquisition cost of the asset or as part of the item of expense.
Receivables and payables are stated with the amount of GST included. The amounts of GST receivable from, or payable to, the ATO are included as a current asset or liability in the Balance Sheet.
Cash flows are included in the Cash Flow Statement on a gross basis. The GST components of cash flows arising from investing and financing activities which are recoverable from, or payable to, the ATO are classified as operating cash flows.
Cash and deposits includes cash on hand, cash at bank and deposits at call which are readily convertible to cash on hand and are subject to an insignificant risk of changes in value, net of outstanding bank overdrafts.
Trade debtors are recognised at the nominal amount due. Receivables are assessed periodically for impairment. Other financial assets include accrued revenue primarily from taxation revenue assessed as accruing to the State at 30 June. For further details on the State revenue recognition refer to Note 1(k).
Settlement by finance lease debtors is within the terms of the lease, ranging from 2 to 99 years. Title is passed to the purchaser on full repayment. Refer Note 23.
Loans are financial assets held by the State and include loans supporting policy objectives of the Government rather than for liquidity management purposes. Loans include other credit foncier loans.
Credit Risk Exposure and Management
Credit or liquidity risk represents the extent of credit related losses that the State may be subject to on amounts to be exchanged under loans, accounts receivable and other financial assets. The maximum credit risk at balance date in relation to each class of recognised financial assets is the carrying amount of those assets net of any provisions for impairment.
The credit risk in relation to receivables is managed in the following manner:
| | - | | trading terms require payment within a specified period after the goods and services are applied; |
| | - | | outstanding accounts are assessed for impairment at each reporting date based on objective evidence of impairment; |
| | - | | bad debts are written off as they are incurred; and |
| | - | | impairment losses are recognised in the Operating Statement. |
| (p) | Securities Other Than Shares |
Securities are financial assets held by the State including:
| | - | | financial assets held at fair value through the profit and loss; |
| | - | | held to maturity investments; |
| | - | | available-for-sale financial assets; and |
| | - | | derivative financial instruments. |
Securities include promissory notes, bills of exchange, certificates of deposits, fixed term deposits, Treasury notes and bonds, redeemable preference shares, debentures, long term notes and the net value of swaps and other derivatives that are in a net asset position.
| | |
| Audited Consolidated Financial Statements 2008–09 – Government of Queensland | | 7-09 |
Notes to the Financial Statements
| (q) | Shares and Other Equity Investments |
Shares and other equity refers to claims on other entities entitling the State to a share of the income of the entity and a right to a share of the residual assets of the entity should it be wound up. It includes holdings of the market value of listed enterprises and the market value of assets (non-financial and financial) less liabilities of unlisted enterprises.
There are two main categories:
| | - | | investments accounted for using the equity method (associates); and |
| | - | | investments - shares in entities that are not controlled or associates. |
Investments accounted for using the equity method (Associates)
Associates are those entities over which the State has significant influence but not control. Such entities are accounted for using the equity method of accounting. The State’s share of its associates’ post-acquisition profits or losses (less dividends) is recognised in the Operating Statement as an other economic flow and its share of post-acquisition movements in reserves is recognised in the reserves. The cumulative post-acquisition movements are recognised against the carrying amount of the investment. Dividends from associates are recognised as revenue from transactions in the Operating Statement.
Investments - shares in entities that are not controlled or associated
Shares are valued at fair value with changes in valuation of these investments treated in a manner consistent with AASB 139.
Inventories (other than those held for distribution) are carried at the lower of cost and net realisable value under AASB 102 Inventories. Cost is determined on either a first-in-first-out or average cost basis and includes expenditure incurred in acquiring the inventories and bringing them to their existing condition and location, except for training costs which are expensed as incurred. Where inventories are acquired for no or nominal consideration, the cost is the current replacement cost as at the date of acquisition.
Inventories held for distribution are those inventories which the State distributes for no or nominal consideration. These are measured at the lower of cost and current replacement cost.
All inventories are classified as current non-financial assets.
Land held for resale is stated at the lower of cost and net realisable value. Cost is assigned by specific identification and includes the cost of acquisition and development.
| (s) | Other Non-Financial Assets |
Other non-financial assets primarily represent prepayments by the State. These prepayments include salaries and wages, grant payments or payments of a more general nature made in advance.
In accordance with AASB 5 Non-current Assets Held for Sale and Discontinued Operations, non-current assets held for sale are assets measured at the lower of carrying amount and fair value less costs to sell and have not been depreciated or amortised.
An impairment loss is recognised for initial or subsequent write down of the asset to fair value less estimated costs to sell. A gain is recognised for any subsequent increases in fair value less costs to sell of an asset, but not in excess of any cumulative impairment loss previously recognised.
Pursuant to AASB 140 Investment Property, properties held to earn rental income or for capital gains purposes are classified as investment properties. Such properties are valued at fair value. Changes in fair value are recognised in the Operating Statement and no depreciation expense or asset impairment is recognised.
| | |
| Audited Consolidated Financial Statements 2008–09 – Government of Queensland | | 7-10 |
Notes to the Financial Statements
| 1. | Significant Accounting Policies continued |
Biological assets are recognised at net market value which is the amount that could be expected to be received from the disposal of the asset in an active and liquid market, after deducting costs expected to be incurred in realising the proceeds of such a disposal. Where no active and liquid market is available, the net present value methodology has been adopted under the provisions of AASB 141 Agriculture.
Biological assets held by the State and recognised in the Balance Sheet include:
| | - | the State’s plantation growing timber resources, mostly located in South East Queensland. All current stands of plantation growing timber are included, with the exception of the following: |
| | (i) | plantings of minor species, small and fragmented plantation areas and areas subject to experimental treatments which are likely to be unmarketable or have a value which is considered to be unreliable; and |
| | (ii) | hardwood plantations which are immaterial. |
Biological assets held by the State and not recognised in the Balance Sheet include:
| | - | the right to harvest forest products from native forests pursuant to the Forestry Act 1959. Cash flows associated with these products have been examined and the net values of the access rights are considered to be immaterial. Accordingly, the value of access rights to native forest products have not been recognised. The State is currently overseeing the final harvesting of forest timber from native forests, as part of a process of transitioning native forests into nature conservations reserves; and |
| | - | other biological assets such as tree seed orchards, tree hedges and nursery seedlings which have been assessed in accordance with AASB 141, found not to be material and accordingly not been recognised. This position will be reviewed annually. |
Valuation of Biological Assets
Net present value is calculated as the net of the future cash inflows and outflows associated with forest production activities discounted back to current values at the specified weighted average cost of capital.
Under this methodology, valuation changes arise mainly from movements in:
| | - | timber volume associated with growth and changes to the overall estate, as a result of annual planting and harvesting activity; |
| | - | forest production costs; and |
| | - | the weighted average cost of capital rate used in the discounted cash flow calculation. |
Reference should be made to individual agency reports for details of individual assumptions used in calculating the net present value of biological assets held by the State.
A reserve has been established to recognise the change in value of biological assets where amounts of unrealised revenue are brought to account through the Operating Statement.
| (w) | Property, Plant and Equipment |
Acquisition
Items of property, plant and equipment with a cost or other value greater than the asset recognition threshold of the agency are initially capitalised and recorded at cost. The Queensland Treasury’s Non-Current Asset Policies for the Queensland Public Sector is applicable to departments and statutory bodies and mandates asset recognition thresholds as follows:
| | |
| Audited Consolidated Financial Statements 2008–09 – Government of Queensland | | 7-11 |
Notes to the Financial Statements
| (w) | Property, Plant and Equipment continued |
Acquisition continued
| | |
Asset Class | | Asset Recognition Threshold |
| Land | | $1 (all land) |
| | |
| Buildings | | $10,000 |
| | |
| Infrastructure | | $10,000 |
| | |
| Plant & Equipment | | $5,000 |
| | |
| Major Plant & Equipment | | An amount greater than or equal to $5,000, the exact amount of which is at the agency’s discretion. |
| | |
| Leased Assets (finance leases) | | The threshold for the class to which the asset would belong if it were not subject to a finance lease. |
| | |
| Heritage & Cultural Assets | | $5,000 |
| | |
| Work in Progress | | n/a |
| | |
| Library Reference Collections | | $1,000,000 |
Asset recognition thresholds for other entities do not exceed the thresholds above.
Items with a cost or other value below each entity’s recognition threshold are expensed in the year of acquisition. Cost is determined as the value given as consideration, plus costs incidental to the acquisition including all other costs incurred in getting the assets ready for use. Training, marketing and advertising costs are expensed as incurred.
In accordance with AASB 116 Property, Plant and Equipment, administration and other general overhead costs are expensed in the year they are incurred. Overhauls and major inspections are only capitalised if it is probable that future economic benefits associated with them will flow to the entity and their cost can be measured reliably. In addition, any remaining carrying amount of the cost of the previous inspection/overhaul (as distinct from physical parts) is derecognised.
Assets acquired at no cost, or for nominal consideration, that can be measured reliably are recognised initially as assets and revenues at their fair value at the date of acquisition.
Recording and Valuation
Land, buildings, infrastructure, major plant and equipment and heritage and cultural assets are valued at fair value in accordance with AASB 116 and Queensland Treasury’s Non-Current Asset Policies for the Queensland Public Sector.
Due to the requirements of AASB 1049 Whole of Government and General Government Sector Financial Reporting all property, plant and equipment assets are measured at fair value under AASB 116. This has resulted in a change in accounting policy in relation to the Queensland rail network assets and the electricity generation assets which were previously valued at depreciated optimised replacement value or cost. The impact of the change in accounting policy for these assets is detailed below.
Rail Infrastructure Assets
Rail infrastructure has been valued at fair value at 30 June 2009. This has resulted in an increase at 30 June 2009 in property, plant and equipment of $7.443 billion and a corresponding increase to the asset revaluation reserve. The revaluation occurred as at 30 June 2009 therefore there is no impact on the depreciation expense and accumulated depreciation for the current year. The rail network assets held at 30 June 2008 were considered to approximate fair value at that time, therefore there has been no change to the value held in the prior year.
Electricity Generation Assets
The electricity generation assets are held by CS Energy Limited, Tarong Energy Corporation Limited and Stanwell Corporation Limited. A fair value calculation was undertaken by Queensland Treasury Corporation (QTC) as at 30 June 2009 and 30 June 2008 to value the electricity generation assets using an income based approached under AASB 116. The value of these assets currently included in the financial statements is considered a reasonable estimate of their fair value and no adjustment was required.
| | |
| Audited Consolidated Financial Statements 2008–09 – Government of Queensland | | 7-12 |
Notes to the Financial Statements
| 1. | Significant Accounting Policies continued |
| (w) | Property, Plant and Equipment continued |
Recording and Valuation continued
Electricity Generation Assets continued
Reference should be made to individual agency reports for valuation methodologies and names and qualifications of relevant valuers, where appropriate.
Non-current physical assets measured at fair value are comprehensively revalued once every five years or as appropriate, with interim valuations using relevant indices being otherwise performed on an annual basis. Separately identified components of assets are measured on the same basis as the assets to which they relate.
Any revaluation increment arising on the revaluation of an asset is credited to the asset revaluation reserve for that class of assets, except to the extent it reverses a revaluation decrement for the class of assets previously recognised as an expense. A decrease in the carrying amount on revaluation is charged as an expense, to the extent it exceeds the balance of the relevant asset revaluation reserve.
Where an asset is acquired at no cost, or for nominal cost, the cost is its fair value as at the date of acquisition. All other non-current assets, principally plant and equipment, are measured at cost which equates to fair value due to their short useful lives.
Items or components that form an integral part of an asset are recognised as a single asset (functional asset). The recognition threshold is applied to the aggregate cost of each functional asset.
Non-reciprocal transfers of assets and liabilities between wholly-owned Queensland public sector entities, are accounted for as adjustments to contributed equity in accordance with UIG 1038 Contributions by Owners Made to Wholly-owned Public Sector Entities.
Land Under Roads
Effective 1 July 2008, land under roads acquired on or before 30 June 2008 has been recognised at fair value with the corresponding adjustment against opening Accumulated Surplus in accordance with AASB 1051 Land Under Roads. Land under roads acquired from 1 July 2008 has been initially recognised at cost and thereafter at fair value in accordance with AASB 116 Property Plant and Equipment. Land under roads is included in the asset class ‘land’.
At reporting date all land under roads is re-valued at fair value. Any revaluation increment arising on the revaluation of land under roads is to be credited to the asset revaluation reserve for that asset/class of assets except to the extent it reverses a revaluation decrement for the asset/class of assets previously recognised as an expense. A decrease in the carrying amount on revaluation is charged as an expense, to the extent it exceeds the balance of the relevant asset revaluation reserve.
Fair value is determined using an acceptable, reliable valuation methodology which is undertaken by the State Valuation Services. The valuation methodology has been uniformly applied to the valuation of all land under roads. Where fair value cannot be reliably determined either at acquisition or at any reporting date, but is able to be determined subsequently, the fair value adjustment is treated as an adjustment to the revaluation reserve in accordance with Queensland Treasury’s Non-Current Asset Policies for the Queensland Public Sector.
Land under roads not subject to title or lease vests in the State in terms of the Land Act 1994. The Department of Environment and Resource Management administers the Land Act on behalf of the State. Therefore untitled land under roads is an administered asset of the Department of Environment and Resource Management. This includes all land under roads in a local government area where the road assets are the responsibility of local government. Land under roads subject to title or lease is controlled by the agency that holds the title or lease and is recorded by the relevant agency as a controlled asset.
Intangible assets are recognised in accordance with AASB 138 Intangible Assets. The Queensland Treasury’s Non-Current Asset Policies for the Queensland Public Sector which is applicable to departments and statutory bodies, mandates classes of non-current physical and intangible assets. Software is classified as an intangible asset, rather than property, plant and equipment unless it is an integral part of the related hardware.
| | |
| Audited Consolidated Financial Statements 2008–09 – Government of Queensland | | 7-13 |
Notes to the Financial Statements
| 1. | Significant Accounting Policies continued |
| (x) | Intangible Assets continued |
Internally generated assets, such as brands and mastheads, as well as expenditure on initial research are specifically excluded from being recognised in the Balance Sheet.
In accordance with the Non-Current Asset Policies for the Queensland Public Sector, the recognition threshold for departments and statutory bodies is $100,000. The threshold for other entities does not exceed this amount.
Purchased goodwill represents the excess of costs of acquisition over the fair value of the State’s share of the net identifiable assets of the acquired subsidiary at the date of acquisition. Goodwill is not amortised but instead is assessed annually for impairment.
Internally generated intangible assets are only revalued where an active market exists for the asset in question, otherwise they are measured at cost.
The following assets are not recognised in the Balance Sheet:
Quarry Resources
The value of quarry resources held by the Department of Environment and Resource Management is not included in the financial statements as it is not practical to determine reliably the quantum of the resources available for extraction. Revenue from the sale of quarry materials is recognised as extractions are made.
Native Forests and Biological Assets
Disclosures are outlined in Note 1(v).
Railway Corridor Land
Under the Transport Infrastructure Act 1994, railway corridor land was rendered State land under the control of the Department of Environment and Resource Management which for reporting purposes recorded the land at nil value. This land is on-leased to QR via Department of Transport and Main Roads at no cost.
User Funded Assets
Certain wharf facilities, bulk sugar terminals, bulk molasses terminals, bulk grain terminals and grain loading facilities have been constructed on land controlled by Queensland port corporations. These assets are not included in the Balance Sheets as users of the assets have either fully or partially funded these facilities and they are either not considered to be controlled by the corporations or no income will flow from the facilities.
Heritage Assets
Certain heritage assets, including artefacts, memorabilia and other historical objects held by agencies, have not been valued or included in the Balance Sheet because of the unique nature of the items and the difficulty in determining a reliable value.
Library Collections
Library acquisitions are expensed as they are incurred, except for the General Reference and Rare Books Collections of the Library Board of Queensland. These are capitalised and held at fair value in accordance with Queensland Treasury’s Non-Current Asset Policies for the Queensland Public Sector and Queensland Treasury’s Accounting for Library Collections Policy except for certain heritage assets such as manuscripts whose value cannot be reliably measured.
| | |
| Audited Consolidated Financial Statements 2008–09 – Government of Queensland | | 7-14 |
Notes to the Financial Statements
| 1. | Significant Accounting Policies continued |
| (z) | Depreciation and Amortisation |
Land, General Reference and Rare Books Collections of the Library Board of Queensland, Museum collections, art works held by the Queensland Art Gallery Board of Trustees and certain other heritage and cultural assets are not depreciated.
Other assets are depreciated or amortised on a straight-line basis from their date of acquisition (or in respect of internally constructed assets, from the time the asset is completed and held ready for use) and based on their estimated useful lives to the agency.
Where assets have separately identifiable components that are subject to regular replacement, these components are assigned useful lives distinct from the asset to which they relate and are depreciated accordingly. Any expenditure which increases the originally assessed capacity or service potential of an asset is capitalised and the new depreciable value is depreciated over the remaining useful life of the asset.
Leasehold improvements are amortised over the estimated useful lives of the improvements or the unexpired period of the lease, whichever is shorter. The unexpired period of the lease includes any option period where exercise of the option is probable.
Capital Work in Progress is not depreciated until it reaches service delivery capacity.
Major spares purchased specifically for particular assets are capitalised and depreciated on the same basis as the asset to which they relate.
Reference should be made to individual agency reports for details of depreciation and amortisation methodologies. The following provides an indication of the estimated useful lives to agencies of the different asset classes:
| | |
| Asset Class | | Useful Life |
| |
| Property Plant and Equipment | | |
| |
Buildings | | 1 - 100 years |
Plant and equipment | | 1 - 100 years |
Infrastructure assets | | up to 200 years |
Heritage and cultural assets | | 7 - 100 years |
| |
Intangibles | | |
| |
Computer software | | 2 - 20 years |
Other intangibles (including intellectual property, licences and access rights) | | 1 - 99 years |
At each reporting date, an assessment is undertaken as to whether there are any indications that a physical or intangible asset is impaired. If an asset is determined to be impaired, the recoverable amount of the impaired asset is determined as the higher of the asset’s fair value less costs to sell and either depreciated replacement cost or value in use. Value in use is based on discounted cash flows using a risk adjusted discount rate. For the purposes of assessing impairment, assets are grouped at the lowest levels for which there are separately identifiable cash flows which are largely independent of the cash flows from other assets or groups of assets (cash-generating units). Non-financial assets other than goodwill that suffered an impairment are reviewed for possible reversal of the impairment at each reporting date.
Impairment on goodwill is not reversed.
Rights and obligations under finance leases which are leases that effectively transfer most of the risks and rewards relating to ownership of the leased items to the lessee, are recognised initially as assets and liabilities equal to the lower of fair value of the leased property and present value of the minimum lease payments including any guaranteed residual values. The assets are disclosed as leased plant and equipment and are depreciated over the period during which the State is expected to benefit from the use of the asset. Minimum lease payments are allocated between interest and reduction of the lease liability, according to the interest rate implicit in the lease.
| | |
| Audited Consolidated Financial Statements 2008–09 – Government of Queensland | | 7-15 |
Notes to the Financial Statements
| 1. | Significant Accounting Policies continued |
For operating leases, where the lessor retains substantially all of the risks and rewards relating to ownership of the leased items, lease payments are expensed over the term of the lease. Incentives received on entering into operating leases are recognised as liabilities. Lease payments are allocated between rental expense and reduction of the liability. Further disclosure on lease commitments is contained in Note 45.
These amounts represent amounts owing for goods and services provided to the State prior to the end of the financial year. The amounts are unsecured, are usually paid within 30 days of recognition and are non-interest bearing.
Provisions are recognised when there is a present legal or constructive obligation as a result of past events, it is probable that an outflow of resources will be required to settle the obligation and the amount has been reliably estimated. Where there are a number of similar obligations, the likelihood that an outflow will be required is determined by considering the class of obligations as a whole. A provision is recognised even if the likelihood of an outflow with respect to any one item included in the same class of obligations may be small. Provisions are measured at the present value of the estimate of the expenditure required to settle the present obligation at the reporting date. The discount rate used to determine the present value reflects current market assessment of the time value of money and risks specific to the liability.
General Provisions
A provision for onerous contracts is recognised when the expected benefits to be derived from a contract are less than the unavoidable costs of meeting the obligations under that contract and only after any impairments to assets dedicated to that contract have been recognised.
The provision is recognised in accordance with AASB 137 Provisions, Contingent Liabilities and Contingent Assets and is based on the excess of the estimated cash flows to meet the unavoidable costs under the contract over the estimated cash flows to be received in relation to the contract, having regard to the risks of the activities relating to the contract. The net estimated cash flows are discounted using market yields at balance date on national government guaranteed bonds with terms to maturity and currency that match, as closely as possible, the expected future payments, where the effect of discounting is material.
Power Purchase Agreement Provisions
A provision for onerous contracts has been realised in relation to a number of long-term power purchase agreements (PPAs) when the unavoidable costs of meeting the ongoing obligations under these agreements exceed the expected benefits to be received. Some of these PPAs have remaining terms which extend to 2016. Current conditions within the electricity market mean a number of the long-term power purchase agreements are considered to be onerous contracts.
The provision for onerous contracts reflects net present value of the least net cost of exiting these onerous PPAs which is the lower of the cost of fulfilling the agreements or the compensation payable, as defined in these agreements for early termination.
The extent of the future losses from the power purchase agreements will depend on future wholesale pool prices as well as the need for the State to meet its network support obligations. The future level of Queensland wholesale pool prices remains significantly uncertain. The critical determinants of future pool prices will be the bidding behaviour of participants in the National Electricity Market, load growth, network reliability and the introduction of new generation capacity. The discount rate used reflects current market assessments of the time value of money and the risks specific to these obligations.
| | |
| Audited Consolidated Financial Statements 2008–09 – Government of Queensland | | 7-16 |
Notes to the Financial Statements
| 1. | Significant Accounting Policies continued |
Wages, Salaries and Sick Leave
Liabilities for wages and salaries are accrued at year end. For most agencies, sick leave is non-vesting and is expensed as incurred. Liabilities have been calculated based on wage and salary rates at the date they are expected to be paid and include related on-costs.
Annual Leave
The Annual Leave Central Scheme (ALCS) was established at 30 June 2008 to centrally fund annual leave obligations of departments, commercialised business units and shared service providers. Members pay a levy equal to their accrued leave cost into the scheme and are reimbursed by the scheme for annual leave payments made to their employees. Entities that do not participate in the ALCS continue to determine and recognise their own leave liabilities.
The State’s annual leave liability has been calculated based on wage and salary rates at the date they are expected to be paid and include related on-costs. In accordance with AASB 119 Employee Benefits, where annual leave is not expected to be paid within 12 months, the liability is classified as non-current and measured at the present value of the future cash flows.
Long Service Leave
A levy of 1.75% of salary and wages costs is paid by participating agencies (predominantly Government departments) into the Long Service Leave Central Scheme introduced in 1999-2000. Amounts paid to employees for long service leave are then claimed from the scheme as a reimbursement. The liability is assessed annually by the State Actuary.
The method used incorporates consideration of expected future wage and salary levels, experience of employee departures and periods of service. On-costs have been included in the liabilities and expenses for the Long Service Leave Central Scheme. These amounts have not been separately identified, as they are not material in the context of the State’s overall employee entitlement liabilities.
The State’s long service leave provisions are calculated in accordance with AASB 119 using yield rates of Government bonds at reporting date and actuarial assumptions which are mutually compatible. The gross discount rate for 10 year Commonwealth bonds at 30 June 2009 was 5.6% (2008, 6.5%).
Entities that do not participate in the Long Service Leave Central Scheme determine their liability for long service leave based on the present value of estimated future cash outflows to be made.
Superannuation/Retirement Benefit Obligations
A superannuation liability for the State public sector is recognised in respect of the various employees’ accrued superannuation benefits and represents the difference between the net market value of plan assets and the estimated accrued superannuation benefits at year end.
The present value of the accrued benefits is calculated using the projected unit credit method and represents the actuarial value of all benefits that are expected to become payable in the future in respect of contributions made or periods of service completed prior to the valuation date, allowing for future salary increases.
The costs of providing future benefits to employees are recognised over the period during which employees provide services. All superannuation plan costs, excluding actuarial gains and losses, are recognised in the Operating Statement. Actuarial gains and losses are recognised directly in equity on an annual basis and represent experience adjustments (the effects of differences between the previous actuarial assumptions and what has actually occurred e.g. investment returns on plan assets) and the effects of changes in actuarial assumptions underlying the valuation.
Expected future payments are discounted using market yields at the reporting date on Government bonds with terms to maturity and currency that match the estimated future cash outflows. The gross discount rate for 10 year Commonwealth bonds at 30 June 2009 was 5.6% (2008, 6.5%).
Future taxes are part of the provision of the existing benefit obligations (eg. taxes on investment income and employer contributions) and are taken into account in measuring the net liability or asset.
| | |
| Audited Consolidated Financial Statements 2008–09 – Government of Queensland | | 7-17 |
Notes to the Financial Statements
| 1. | Significant Accounting Policies continued |
| (af) | Employee Benefits continued |
Superannuation/Retirement Benefit Obligations continued
Employees in the electricity industry contribute to an industry multiple employer superannuation fund, Electricity Supply Industry Superannuation (QLD) (ESI Super). Refer Note 51.
Termination Benefits
Termination benefits are payable when employment is terminated before the normal retirement date or when an employee accepts a voluntary redundancy in exchange for these benefits. The State recognises termination benefits when it is demonstrably committed to either terminating the employment of employees according to a detailed formal plan without possibility of withdrawal or providing termination benefits as a result of an offer made to encourage voluntary redundancy. Benefits falling due more than 12 months after balance date are discounted to present value.
| (ag) | Provision for Retirement/Disposal of Long Lived Assets |
A provision is recognised for dismantling, removal and restoration costs where a constructive obligation exists. The present value of the obligation is recorded in the initial cost of the asset.
| (ah) | General Insurance Contracts |
In accordance with AASB 1023 General Insurance Contracts , the claims liability includes a risk margin in addition to expected future payments. This liability is discounted for the time value of money using risk-free discount rates that are based on current, observable, objective rates.
| (ai) | Financial Risk Management |
The State’s activities expose it to a variety of financial risks, such as market risk (including foreign currency risk, interest rate risk and price risk), credit risk, liquidity risk and cash flow interest rate risk. The State’s overall risk management program focuses on the unpredictability of financial markets and seeks to minimise potential adverse effects. While the State has a broad framework for risk management, individual agencies are responsible for managing risks to which they are exposed. The State uses certain derivative instruments such as forward exchange contracts and cross currency swaps to hedge risk exposures.
Risk management strategies specific to particular items recognised in the State’s consolidated financial statements are included in the accounting policies relating to that item.
Financial Instruments
In compliance with AASB 7, 132 and 139 (relating to financial instruments), certain derivatives are recognised in the Balance Sheet. Derivatives are measured on a fair value basis and changes in fair value are taken to the Operating Statement unless strict hedge accounting rules are met, in which case valuation adjustments are recognised in an equity reserve.
Under AASB 139, financial assets are to be classified and measured as follows:
| | - | loans and receivables - measured at amortised cost; |
| | - | held to maturity - measured at amortised cost; |
| | - | designated at fair value through profit or loss; or |
| | - | available-for-sale - measured at fair value with unrealised gains/losses recognised directly in equity except for impairment losses and foreign exchange gains/losses. |
Financial liabilities are to be classified and measured as follows:
| | - | designated at fair value through profit or loss; or |
| | - | other financial liabilities - measured at amortised cost. |
Carrying amounts of financial assets and liabilities equate to fair value except as identified in Note 50.
| | |
| Audited Consolidated Financial Statements 2008–09 – Government of Queensland | | 7-18 |
Notes to the Financial Statements
| 1. | Significant Accounting Policies continued |
| (ai) | Financial Instruments continued |
Recognition and derecognition of financial assets and liabilities
Financial assets and financial liabilities are recognised on the Balance Sheet when the State becomes party to the contractual provisions of the financial instrument. A financial asset is derecognised when the contractual rights to the cash flows from the financial assets expire or are transferred and no longer controlled by the State. A financial liability is removed from the Balance Sheet when the obligation specified in the contract is discharged, cancelled or expires.
Fair value estimation
Entities within the State use either the quoted market price at balance date or mid market rates as a basis for establishing fair values of quoted financial instruments. Financial assets are priced at current bid prices, while financial liabilities are priced at current asking price. The State adopts the policy of effectively minimising risk arising from market/client transactions whether they be in the nature of onlendings, deposits, leases or hedges.
If the market for a financial asset is not active, the State establishes fair value by using valuation techniques.
Derivative financial instruments
Derivative instruments are used to hedge the State’s exposure to interest rate, foreign currency, commodity prices and credit risks as part of asset and liability management activities. In addition, they may be used to deliver long term floating rate or long term fixed rate exposure. A small number of derivative financial instruments are held for trading purposes.
Derivatives are initially recognised at fair value on the date on which a derivative contract is entered into and are subsequently remeasured at their fair value. Fair values are derived using quoted market prices in active markets and utilising accepted market valuation techniques, including the discounted cash flow model and other pricing models, as appropriate.
The effective portion of the gain or loss from changes in the fair value of the hedging instrument is recognised directly in the hedge reserve in equity, while the ineffective portion is recognised in the Operating Statement. Amounts taken to the hedge reserve in equity are transferred to the Operating Statement when the hedged transaction affects the Operating Statement, such as when hedged income or expenses are recognised or when a forecast sale or purchase occurs. Where the forecast transaction that is hedged results in recognising a non-financial asset or liability, the gain or loss deferred to equity is transferred to carrying amount of the asset or liability.
All derivatives are carried as assets when fair value is positive and liabilities when fair value is negative. Derivative instruments used by the State include: futures contracts, forward rate agreements, forward exchange contracts, cross currency swaps, interest rate swaps and commodity swaps.
Financial assets at fair value through profit or loss
Financial assets which include all other investments are valued at fair value at balance date. Unrealised gains and losses are brought to account in the Operating Statement. Financial assets held by the State include: money market deposits, discount securities, Commonwealth and State securities, floating rate notes, medium term notes, fixed interest deposits, letters of credit and investments managed by QIC Limited.
Financial liabilities at fair value through profit or loss
Financial liabilities which include deposits and interest bearing liabilities are valued at fair value at balance date. Unrealised gains and losses are brought to account as other economic flows in the Operating Statement. Interest bearing liabilities held by the State include: Treasury notes, Australian bonds, credit foncier loans, commercial paper, overseas bonds and medium term notes principally raised by Queensland Treasury Corporation.
In relation to deposits, income derived from their investment accrues to depositors daily. The amount shown in the Balance Sheet represents the market value of deposits held at balance date. Stock lending and repurchase agreement deposits are accepted at an agreed interest rate and are held as security for stock lent.
Financial liabilities held at amortised cost
State debt to the Commonwealth represents loans made by the Commonwealth under Loan Council agreements and is held at amortised cost.
| | |
| Audited Consolidated Financial Statements 2008–09 – Government of Queensland | | 7-19 |
Notes to the Financial Statements
| 1. | Significant Accounting Policies continued |
| (ai) | Financial Instruments continued |
Settlement date accounting
Purchases and sales of financial assets and liabilities at fair value through profit or loss are recognised on settlement date. The State accounts for any change in the fair value of the asset to be received during the period between the trade date and settlement date in the same way as it accounts for the acquired asset.
Foreign Currency
Foreign currency transactions are translated initially into Australian dollars at the rate of exchange applying at the date of the transaction. Such transactions are subject to price risk which is reflected by price variation changes due to foreign currency movement. Amounts payable and receivable in foreign currencies at balance date are translated to Australian currency at rates of exchange current at 30 June 2009.
Exchange differences relating to amounts payable and receivable in foreign currencies are brought to account as exchange gains or losses in the Operating Statement in the financial year in which the exchange rates change, except when deferred in equity as qualifying cash flow hedges and qualifying net investment hedges.
Translation differences on non-monetary financial assets and liabilities are reported as part of the fair value gain or loss. Translation differences on non-monetary financial assets and liabilities such as equities held at fair value through profit or loss are recognised in the Operating Statement as part of the fair value gain or loss. Translation difference on non-monetary financial assets such as equities classified as available-for-sale financial assets are included in the fair value reserve in equity.
In relation to borrowings covered by swaps denominated in foreign currencies, both the loan and the underlying swap are valued at the relevant swap yield existing at year-end. Where transactions involve forward foreign exchange, the amount payable or receivable under the forward exchange contract is adjusted to reflect forward rates of exchange applicable at year-end. Exchange gains or losses are brought to account in the Operating Statement.
Foreign exchange risk arises when future commercial transactions and recognised assets and liabilities are denominated in a currency that is not the entity’s functional currency.
To effectively manage the exposure of foreign currency borrowings and offshore investments to fluctuations in exchange rates, both forward exchange contracts and cross currency swaps are used. Offshore borrowings are required to provide access to additional sources of funding and to diversify risk exposure.
| (aj) | Related Party Transactions |
A number of related party transactions which are at arm’s length and under normal commercial terms, have been disclosed in the financial statements of some of the agencies that are included in these consolidated financial statements. These transactions mainly relate to Government-owned corporations. Reference should be made to individual agency reports for further particulars of these transactions.
| (ak) | Public Private Partnerships (PPPs) |
There is currently no Australian Accounting Standard specifically addressing accounting for private sector financed infrastructure assets. The following policies have been adopted pending the development of an accounting standard.
Agreements equally proportionately unperformed arising from PPPs are not recognised as assets or liabilities. Instead, the payments under these agreements are expensed systematically over the term of the agreements. Any leasing arrangements are disclosed in accordance with AASB 117 Leases. Further, the commitments for future payments under these agreements are disclosed as commitments in the notes to the consolidated financial statements.
Security, tender and other deposits administered by the State in a fiduciary or trust capacity are not recognised in the financial statements but are disclosed for information purposes in Note 46. Whilst these transactions and balances are in the care of the State, they are subject to the normal internal control and external audit requirements.
| | |
| Audited Consolidated Financial Statements 2008–09 – Government of Queensland | | 7-20 |
Notes to the Financial Statements
| 1. | Significant Accounting Policies continued |
| (am) | Critical Accounting Estimates and Judgements |
Estimates and judgements are continually evaluated and are based on historical experience and other factors, including expectations of future events that may have a financial impact on the State and that are believed to be reasonable under the circumstances.
| | (i) | Critical Accounting Estimates and Assumptions |
The State makes estimates and assumptions concerning the future. The resulting accounting estimates will, by definition, seldom equal the related actual results. The estimates and assumptions that have a significant risk of causing a material adjustment to the carrying amount of assets and liabilities within the next financial year and have not been included in the relevant accounting policy, are discussed below.
Estimated Impairment of Assets
The State tests annually whether any asset or group of assets is impaired, in accordance with the accounting policy Note 1(aa). In some instances the recoverable amount used is value in use. Value in use calculations require assumptions to be made in key areas such as:
| | - | risk adjusted time value of money; |
| | - | forecast operational and capital expenditure; and |
Impairment - Electricity Generators
There is significant uncertainty over the future price and availability of water which may impact asset values of the electricity generators. In addition, the impacts from the proposed introduction of a carbon pollution reduction scheme by the Commonwealth Government are still uncertain. The management of Stanwell Corporation Limited and CS Energy Limited have made assumptions based on what management considers reasonable concerning the proposed carbon pollution reduction scheme. These assumptions have been used in calculating future cash flow projections in performing the impairment assessment. Should the scheme be enacted in a form different to that assumed the impairment assessment will be impacted accordingly. The directors of Tarong Energy Corporation Limited believe that given the uncertainties of the carbon pollution reduction scheme it is not possible to provide a reasonable and supportable estimate of any impairment adjustment at this time and on this basis have not adjusted the carrying amounts of non-current assets at 30 June 2009.
Further details of assumptions made concerning the carbon pollution reduction scheme can be found in the individual entity financial statements.
Impairment - Water Assets
The SEQ bulk water authorities (Queensland Manufactured Water Authority, the Queensland Bulk Water Supply Authority and the Queensland Bulk Water Transport Authority) have performed an impairment assessment on their bulk water assets based on current bulk water pricing arrangements under normal pricing principles for regulated assets. The assumptions used in the impairment assessment are particularly sensitive to changes in bulk water pricing parameters set by the State. At this point in time, the Government has not yet determined the bulk water pricing mechanism post 30 June 2010.
Should the State adopt a pricing framework beyond 2009-10 that results in a change to key parameters such as the rate of return on existing or future infrastructure, this may have a material impact on the ability of the bulk water authorities to generate a sufficient return to prevent asset impairment. Such an impairment could significantly impact on the carrying value of the bulk water authorities’ assets. Without additional information in relation to any actual changes to the methodology and with the uncertainty of what form the pricing mechanism may take post 30 June 2010, the water entities have relied on the reasonableness of their assumptions in completing their impairment testing.
Western Corridor Recycled Water Pty Ltd has calculated an impairment loss of $466 million and South East Queensland (Gold Coast) Desalination Company Pty Ltd an impairment loss of $65 million for 30 June 2009.
Fair Value of Derivatives and Other Financial Instruments
The fair value of financial instruments that are not traded in an active market (for example electricity financial instruments such as over-the-counter derivatives) is determined by using valuation techniques. The State uses judgement to select a variety of methods and make assumptions that are mainly based on market conditions existing at each Balance Sheet date. The State has used discounted cash flow analysis for various available-for-sale financial assets that were not traded in active markets.
| | |
| Audited Consolidated Financial Statements 2008–09 – Government of Queensland | | 7-21 |
Notes to the Financial Statements
| 1. | Significant Accounting Policies continued |
| (am) | Critical Accounting Estimates and Judgements continued |
| | (ii) | Critical Judgements in Applying Accounting Policies |
Held-to-maturity investments
The State follows AASB 139 in classifying non-derivative financial assets with fixed or determinable payments and fixed maturity as held-to-maturity. This classification requires significant judgement. In making this judgement, the State evaluates its intention and ability to hold such investments to maturity.
If the class of held-to-maturity investments is tainted, the State would not be able to classify any financial assets as held-to-maturity for the following two annual reporting periods.
If the State fails to keep these investments to maturity other than for specific circumstances explained in AASB 139, it will be required to reclassify the whole class as available-for-sale. The investments would therefore be measured at fair value not amortised cost.
| (an) | Key GFS technical terms |
ABS GFS Manual
The Australian Bureau of Statistics (ABS) publication Australian System of Government Finance Statistics: Concepts, Sources and Methods as updated from time to time.
Cash Surplus/(Deficit)
Net cash flows from operating activities plus net cash flows from acquisition and disposal of non-financial assets less distributions paid. GFS cash surplus/(deficit) also deducts the value of assets acquired under finance leases and similar arrangements.
Convergence Differences
Convergence differences are difference between the amounts recognised in the financial statements compared with the amounts determined for GFS purposes as a result of differences in definition, recognition, measurement and classification principles and rules.
Comprehensive result - total change in net worth before transactions with owners as owners
This is the net result of all items of income and expense recognised for the period. It is the aggregate of operating result and other movements in equity, other than transactions with owners as owners.
Financial Asset
A financial asset is any asset that is:
| | - | | an equity instrument of another entity; |
| | (i) | to receive cash or another financial asset from another entity; or |
| | (ii) | to exchange financial assets or financial liabilities with another entity under conditions that are potentially favourable to the entity; or |
| | - | | a contract that will or may be settled in the entity’s own equity instruments and is: |
| | (i) | a non-derivative for which the entity is or may be obliged to receive a variable number of the entity’s own equity instruments; or |
| | (ii) | a derivative that will or may be settled other than by the exchange of a fixed amount of cash or another financial asset for a fixed number of the entity’s own equity instruments. For this purpose the entity’s own equity instruments do not include instruments that are themselves contracts for the future receipt or delivery of the entity’s own equity instruments. |
Key Fiscal Aggregates
Referred to as analytical balances in the ABS GFS Manual, are data identified in the ABS GFS Manual as useful for macro-economic analysis purposes, including assessing the impact of a government on the economy. They are: opening net worth, net operating balance (which equals change in net worth due to transactions), net lending/(borrowing), change in net worth due to other changes in the volume of assets, total change in net worth, closing net worth and cash surplus/(deficit).
| | |
| Audited Consolidated Financial Statements 2008–09 – Government of Queensland | | 7-22 |
Notes to the Financial Statements
| 1. | Significant Accounting Policies continued |
| (an) | Key GFS technical terms continued |
Net Debt
Net debt equals (deposit liabilities held plus advances and borrowing liabilities) less (cash and deposits, plus investments plus asset advances outstanding). Based on the definition in the ABS GFS Manual. The extent of accumulated net debt is currently the most common measure used to judge the overall strength of a jurisdiction’s fiscal position.
Net Lending/(Borrowing)
The financing requirements of government, calculated as the net operating balance, less the net acquisition of non-financial assets. A positive result reflects a net lending position and a negative result reflects a net borrowing position, based on the definition in the ABS GFS Manual.
Net Operating Balance
This is calculated as income from transactions minus expenses from transactions, based on the definition in the ABS GFS Manual.
Net Worth
Assets less liabilities and shares/contributed capital. For the State, net worth is assets less liabilities since shares and contributed capital is zero. It is an economic measure of wealth and reflects the contribution of governments to the wealth of Australia.
Non-profit Institution
A legal or social entity that is created for the purpose of producing or distributing goods and services but is not permitted to be a source of income, profit or other financial gain for the units that establish, control or finance it.
Non-financial asset
All assets that are not ‘financial assets’.
Operating result
Operating result is a measure of financial performance of the operations of the State for the period. It is the net result of items of revenue, gains and expenses (including losses) recognised for the period, excluding those that are classified as ‘other movements in equity’.
Other Economic Flows
Changes in the volume or value of an asset or liability that do not result from transactions (i.e. revaluations and other changes in the volume of assets).
Transactions
Interactions between two institutional units by mutual agreement or actions within a unit that it is analytically useful to treat as transactions. Defined in the ABS GFS Manual.
Whole-of-Government Financial Report
A financial report prepared by a government that is prepared in accordance with other Australian Accounting Standards, including AASB 127 Consolidated and Separate Financial Statements and thereby separately recognises assets, liabilities, income, expenses and cash flows of all entities under the control of the government on a line-by-line basis.
| | |
| Audited Consolidated Financial Statements 2008–09 – Government of Queensland | | 7-23 |
Notes to the Financial Statements
| 2. | Disaggregated Information |
Operating Statement
| | | | | | | | | | | | | | | | | | | | | | |
| | | | | General
Government (a) | | Public Non-financial
Corporations (a) | | Public Financial
Corporations (a) | | Consolidation
Adjustments | | Consolidated |
| | | | | 2009 | | 2008 | | 2009 | | 2008 | | 2009 | | 2008 | | 2009 | | 2008 | | 2009 | | 2008 |
| | | | | $M | | $M | | $M | | $M | | $M | | $M | | $M | | $M | | $M | | $M |
| | Revenue from Transactions | | | | | | | | | | | | | | | | | | | | |
| | | | | | | | | | | |
| | Taxation revenue | | 8,877 | | 9,546 | | - | | - | | - | | - | | (262) | | (197) | | 8,615 | | 9,349 |
| | Grants revenue | | 17,476 | | 15,510 | | 2,119 | | 2,254 | | - | | - | | (1,999) | | (1,758) | | 17,596 | | 16,006 |
| | Sales of goods and services | | 3,568 | | 3,357 | | 7,807 | | 7,534 | | 1,133 | | 1,037 | | (733) | | (489) | | 11,775 | | 11,439 |
| | Interest income | | 1,482 | | (275) | | 150 | | 198 | | 3,542 | | 3,492 | | (4,141) | | (1,815) | | 1,033 | | 1,600 |
| | Dividend and income tax equivalents income | | 1,180 | | 1,244 | | - | | 12 | | - | | - | | (1,179) | | (1,232) | | 1 | | 24 |
| | Other revenue | | 4,425 | | 2,041 | | 465 | | 363 | | 57 | | 50 | | (5) | | (3) | | 4,942 | | 2,451 |
| | | | | | | | | | | |
| | Total Revenue from Transactions | | 37,008 | | 31,424 | | 10,541 | | 10,361 | | 4,732 | | 4,578 | | (8,320) | | (5,494) | | 43,961 | | 40,869 |
| | | | | | | | | | | |
Less | | Expenses from Transactions | | | | | | | | | | | | | | | | | | | | |
| | | | | | | | | | | |
| | Employee expenses | | 14,305 | | 13,175 | | 2,112 | | 1,964 | | 181 | | 179 | | (246) | | (229) | | 16,351 | | 15,090 |
| | Superannuation expenses | | | | | | | | | | | | | | | | | | | | |
| | Superannuation interest cost | | 858 | | 816 | | (14) | | (26) | | - | | - | | - | | - | | 844 | | 790 |
| | Other superannuation expenses | | 2,012 | | 1,865 | | 215 | | 190 | | 13 | | 12 | | - | | - | | 2,240 | | 2,067 |
| | Other operating expenses | | 7,185 | | 6,646 | | 3,545 | | 3,761 | | 1,605 | | 1,216 | | (616) | | (372) | | 11,719 | | 11,251 |
| | Depreciation and amortisation | | 2,496 | | 1,851 | | 1,848 | | 1,635 | | 27 | | 21 | | - | | - | | 4,371 | | 3,506 |
| | Other interest expense | | 599 | | 347 | | 1,969 | | 1,333 | | 5,103 | | 2,889 | | (4,271) | | (1,896) | | 3,400 | | 2,673 |
| | Grants expenses | | 9,519 | | 8,329 | | 89 | | 21 | | - | | - | | (1,999) | | (1,758) | | 7,608 | | 6,592 |
| | Other property expenses | | - | | - | | 192 | | 213 | | 41 | | 26 | | (233) | | (239) | | - | | - |
| | | | | | | | | | | |
| | Total Expenses from Transactions | | 36,974 | | 33,030 | | 9,955 | | 9,091 | | 6,971 | | 4,343 | | (7,366) | | (4,494) | | 46,533 | | 41,969 |
| | | | | | | | | | | |
Equals | | Net Operating Balance | | 35 | | (1,606) | | 587 | | 1,270 | | (2,239) | | 235 | | (954) | | (999) | | (2,571) | | (1,100) |
| (a) | | See Note 1(c) for explanation of sectors. | | | | | | | | | | | | | | | | | | | | |
| | |
| Audited Consolidated Financial Statements 2008–09 – Government of Queensland | | 7-24 |
Notes to the Financial Statements
| 2. | Disaggregated Information continued |
| | | | | | | | | | | | | | | | | | | | |
| | | General
Government (a) | | Public Non-financial
Corporations (a) | | Public Financial
Corporations (a) | | Consolidation
Adjustments | | Consolidated |
| | | 2009 | | 2008 | | 2009 | | 2008 | | 2009 | | 2008 | | 2009 | | 2008 | | 2009 | | 2008 |
| | $M | | $M | | $M | | $M | | $M | | $M | | $M | | $M | | $M | | $M |
Other Economic Flows | | | | | | | | | | | | | | | | | | | | |
Included in Operating Result | | | | | | | | | | | | | | | | | | | | |
Gain on sale of assets and investments | | 31 | | 40 | | 403 | | 633 | | 1 | | 3 | | 24 | | (43) | | 459 | | 634 |
Revaluation increments and impairment loss reversals | | 1 | | 10 | | 612 | | 598 | | - | | - | | (87) | | (56) | | 526 | | 552 |
Loss on sale of assets and investments | | (42) | | (6) | | - | | - | | - | | - | | (54) | | 3 | | (96) | | (3) |
Asset write-down, revaluation decrements and impairment loss | | (471) | | (260) | | (651) | | (139) | | (537) | | (454) | | 87 | | 56 | | (1,573) | | (797) |
Actuarial adjustments to liabilities | | 14 | | 48 | | - | | - | | - | | - | | - | | - | | 14 | | 48 |
Deferred income tax equivalents | | (141) | | 136 | | (202) | | (265) | | 342 | | 130 | | 1 | | - | | - | | - |
Dividends and tax equivalents from privatisations | | 609 | | 1,241 | | - | | - | | - | | - | | (609) | | (1,241) | | - | | - |
Other | | (123) | | 20 | | (932) | | 117 | | (2,689) | | (251) | | - | | - | | (3,743) | | (114) |
| | | | | | | | | | |
Total Other Economic Flows | | | | | | | | | | | | | | | | | | | | |
| | | | | | | | | | | | | | | | | | | | |
Included in Operating Result | | (122) | | 1,229 | | (770) | | 945 | | (2,882) | | (572) | | (638) | | (1,280) | | (4,413) | | 321 |
| | | | | | | | | | | | | | | | | | | | |
| | | | | | | | | | |
Operating Result | | (88) | | (377) | | (184) | | 2,215 | | (5,121) | | (337) | | (1,591) | | (2,279) | | (6,984) | | (779) |
| | | | | | | | | | |
Other Economic Flows | | | | | | | | | | | | | | | | | | | | |
Other Movements in Equity | | | | | | | | | | | | | | | | | | | | |
Adjustments to opening balances | | - | | 38,644 | | - | | (3) | | - | | - | | - | | - | | - | | 38,641 |
Revaluations | | (9,131) | | 37,635 | | 8,338 | | 2,012 | | (3) | | 7 | | (1,439) | | (2,221) | | (2,235) | | 37,433 |
Other | | - | | (595) | | 1 | | 600 | | - | | - | | - | | - | | 1 | | 5 |
Total Other Economic Flows | | | | | | | | | | | | | | | | | | | | |
Other Movements in Equity | | (9,131) | | 75,683 | | 8,338 | | 2,609 | | (3) | | 7 | | (1,439) | | (2,221) | | (2,234) | | 76,078 |
| | | | | | | | | | |
Comprehensive Result | | (9,219) | | 75,306 | | 8,154 | | 4,824 | | (5,124) | | (331) | | (3,030) | | (4,500) | | (9,219) | | 75,299 |
| | |
| (a) | | See Note 1(c) for explanation of sectors. |
| | |
| Audited Consolidated Financial Statements 2008–09 – Government of Queensland | | 7-25 |
Notes to the Financial Statements
| 2. | Disaggregated Information continued |
| | | | | | | | | | | | | | | | | | | | | | | | |
| | | | | | | General
Government (a) | | Public Non-financial
Corporations (a) | | Public Financial
Corporations (a) | | Consolidation
Adjustments | | Consolidated |
| | | | | | | 2009 | | 2008 | | 2009 | | 2008 | | 2009 | | 2008 | | 2009 | | 2008 | | 2009 | | 2008 |
| | | | | | | $M | | $M | | $M | | $M | | $M | | $M | | $M | | $M | | $M | | $M |
| | Transactions With Owners In Their | | | | | | | | | | | | | | | | | | | | |
| | Capacity as Owners | | | | | | | | | | | | | | | | | | | | |
| | Ordinary dividends provided or paid | | - | | - | | (935) | | (998) | | (18) | | (2) | | 953 | | 1,000 | | - | | - |
| | Dividends from privatisations provided or paid | | - | | - | | (609) | | (1,241) | | - | | - | | 609 | | 1,241 | | - | | - |
| | Equity injections/(withdrawals) | | - | | - | | 984 | | (559) | | - | | 7 | | (984) | | 452 | | - | | (100) |
| | Total Transactions With Owners In | | | | | | | | | | | | | | | | | | | | |
| | Their Capacity as Owners | | - | | - | | (560) | | (2,797) | | (18) | | 5 | | 578 | | 2,692 | | - | | (100) |
| | | | | | | | | | | |
| | Total Change In Net Worth | | (9,219) | | 75,306 | | 7,595 | | 2,027 | | (5,142) | | (326) | | (2,452) | | (1,808) | | (9,219) | | 75,199 |
| | | | | | | | | | | |
| | KEY FISCAL AGGREGATES | | | | | | | | | | | | | | | | | | | | |
| | | | | | | | | | | |
| | Net Operating Balance | | 35 | | (1,606) | | 587 | | 1,270 | | (2,239) | | 235 | | (954) | | (999) | | (2,571) | | (1,100) |
| | | | | | | | | | | |
Less | | Net Acquisition/(Disposal) of | | | | | | | | | | | | | | | | | | | | |
| | Non-Financial Assets | | | | | | | | | | | | | | | | | | | | |
| | Purchases of non-financial assets | | 6,960 | | 5,725 | | 8,353 | | 8,234 | | 109 | | 71 | | (48) | | 16 | | 15,374 | | 14,047 |
| | Less | | Sales of non-financial assets | | 405 | | 405 | | 189 | | 327 | | 17 | | - | | (3) | | 57 | | 608 | | 789 |
| | Less | | Depreciation | | 2,496 | | 1,851 | | 1,848 | | 1,635 | | 27 | | 21 | | - | | - | | 4,371 | | 3,506 |
| | Plus | | Change in inventories | | 87 | | 42 | | 147 | | 118 | | - | | - | | - | | - | | 234 | | 160 |
| | Plus | | Other movement in | | | | | | | | | | | | | | | | | | | | |
| | | | non-financial assets | | 288 | | 169 | | (11) | | 25 | | - | | - | | - | | - | | 277 | | 194 |
| | Equals | | Total Net Acquisition/(Disposal) | | | | | | | | | | | | | | | | | | | | |
| | | | of Non-Financial Assets | | 4,434 | | 3,680 | | 6,452 | | 6,416 | | 65 | | 50 | | (46) | | (40) | | 10,906 | | 10,106 |
| | | | | | | | | | | | |
| | Equals | | Net Lending/(Borrowing) | | (4,399) | | (5,286) | | (5,866) | | (5,146) | | (2,304) | | 185 | | (908) | | (959) | | (13,477) | | (11,205) |
| | | | | | | | | | | |
(a) | | See Note 1(c) for explanation of sectors. | | | | | | | | | | | | | | | | | | | | |
| | |
| Audited Consolidated Financial Statements 2008–09 – Government of Queensland | | 7-26 |
Notes to the Financial Statements
| | | | | | | | | | | | | | | | | | | | | | |
| 2. | | Disaggregated Information continued | | General Government (a) | | Public Non-financial Corporations (a) | | Public Financial Corporations (a) | | Consolidation Adjustments | | Consolidated |
| | | | | 2009 | | 2008 | | 2009 | | 2008 | | 2009 | | 2008 | | 2009 | | 2008 | | 2009 | | 2008 |
| | Balance Sheet | | $M | | $M | | $M | | $M | | $M | | $M | | $M | | $M | | $M | | $M |
| | | | | | | | | | | |
| | Assets | | | | | | | | | | | | | | | | | | | | |
| | Financial Assets | | | | | | | | | | | | | | | | | | | | |
| | | | | | | | | | | |
| | Cash and deposits | | 2,848 | | 3,109 | | 2,135 | | 1,912 | | 15 | | 31 | | (3,942) | | (3,866) | | 1,055 | | 1,186 |
| | Receivables and loans | | | | | | | | | | | | | | | | | | | | |
| | Receivables | | 3,484 | | 3,314 | | 1,813 | | 1,666 | | 161 | | 159 | | (1,478) | | (1,228) | | 3,980 | | 3,911 |
| | Advances paid | | 575 | | 560 | | 311 | | 344 | | - | | - | | (14) | | (14) | | 873 | | 890 |
| | Loans paid | | 22,199 | | 90 | | 132 | | 121 | | 44,408 | | 32,591 | | (63,835) | | (29,358) | | 2,903 | | 3,444 |
| | Securities other than shares | | 4,425 | | 25,659 | | 553 | | 425 | | 46,904 | | 19,738 | | (170) | | (295) | | 51,712 | | 45,527 |
| | Shares and other equity investments | | | | | | | | | | | | | | | | | | | | |
| | Investments in public sector entities | | 23,954 | | 21,531 | | - | | - | | - | | - | | (23,954) | | (21,531) | | - | | - |
| | Investments in other entities | | 2 | | 2 | | 32 | | 260 | | - | | - | | - | | - | | 35 | | 262 |
| | Investments accounted for using equity method | | 37 | | 36 | | 42 | | 50 | | 1 | | 1 | | - | | - | | 79 | | 87 |
| | Total Financial Assets | | 57,523 | | 54,302 | | 5,018 | | 4,778 | | 91,488 | | 52,520 | | (93,393) | | (56,292) | | 60,638 | | 55,308 |
| | | | | | | | | | | |
| | Non-Financial Assets | | | | | | | | | | | | | | | | | | | | |
| | | | | | | | | | | |
| | Inventories | | 506 | | 419 | | 859 | | 704 | | - | | - | | - | | - | | 1,365 | | 1,123 |
| | Assets held for sale | | 111 | | 221 | | 98 | | 153 | | - | | - | | - | | - | | 208 | | 374 |
| | Investment properties | | 51 | | 53 | | 1,353 | | 1,131 | | - | | - | | - | | - | | 1,404 | | 1,184 |
| | Biological assets | | 9 | | 9 | | 1,168 | | 1,174 | | - | | - | | - | | - | | 1,177 | | 1,183 |
| | Property, plant and equipment | | 164,417 | | 170,732 | | 60,589 | | 45,069 | | 209 | | 150 | | (35) | | (35) | | 225,181 | | 215,916 |
| | Intangibles | | 757 | | 666 | | 421 | | 346 | | 25 | | 24 | | (30) | | - | | 1,173 | | 1,035 |
| | Deferred tax assets | | 6,236 | | 5,593 | | 1,332 | | 1,234 | | 438 | | 123 | | (8,007) | | (6,950) | | - | | - |
| | Other non-financial assets | | 238 | | 264 | | 325 | | 341 | | 8 | | 5 | | (65) | | (104) | | 506 | | 506 |
| | Total Non-Financial Assets | | 172,326 | | 177,958 | | 66,145 | | 50,151 | | 681 | | 302 | | (8,136) | | (7,088) | | 231,015 | | 221,322 |
| | | | | | | | | | | |
| | Total Assets | | 229,849 | | 232,259 | | 71,163 | | 54,928 | | 92,169 | | 52,822 | | (101,529) | | (63,381) | | 291,653 | | 276,630 |
(a) | | See Note 1(c) for explanation of sectors. | | | | | | | | | | | | | | | | | | | | |
| | |
| Audited Consolidated Financial Statements 2008–09 – Government of Queensland | | 7-27 |
Notes to the Financial Statements
| | | | | | | | | | | | | | | | | | | | | | | | | | |
2. | | Disaggregated Information continued | | General Government (a) | | Public Non-financial Corporations (a) | | | Public Financial Corporations (a) | | Consolidation Adjustments | | | Consolidated |
| | | | |
| | | | | 2009 | | 2008 | | 2009 | | 2008 | | | 2009 | | | 2008 | | 2009 | | | 2008 | | | 2009 | | 2008 |
| | | | | $M | | $M | | $M | | $M | | | $M | | | $M | | $M | | | $M | | | $M | | $M |
| | Liabilities | | | | | | | | | | | | | | | | | | | | | | | | |
| | | | | | | | | | | |
| | Payables | | 3,390 | | 2,641 | | 2,676 | | 2,771 | | | 254 | | | 185 | | (1,449 | ) | | (1,210 | ) | | 4,871 | | 4,386 |
| | Employee benefit obligations | | | | | | | | | | | | | | | | | | | | | | | | |
| | Superannuation liability | | 23,424 | | 21,913 | | 130 | | (54 | ) | | - | | | - | | - | | | - | | | 23,554 | | 21,860 |
| | Other employee benefits | | 4,201 | | 3,811 | | 851 | | 750 | | | 60 | | | 63 | | - | | | - | | | 5,111 | | 4,624 |
| | Deposits held | | 4 | | 4 | | - | | - | | | 29,888 | | | 7,931 | | (26,221 | ) | | (4,161 | ) | | 3,671 | | 3,774 |
| | Borrowings and advances | | | | | | | | | | | | | | | | | | | | | | | | |
| | Advances received | | 484 | | 501 | | 13 | | 13 | | | - | | | - | | (13 | ) | | (13 | ) | | 484 | | 501 |
| | Borrowings | | 10,278 | | 6,327 | | 32,086 | | 23,578 | | | 1 | | | 1 | | (41,727 | ) | | (29,360 | ) | | 638 | | 546 |
| | Securities and derivatives | | - | | - | | 282 | | 951 | | | 63,168 | | | 41,201 | | - | | | 1 | | | 63,450 | | 42,153 |
| | Deferred tax liabilities | | 1,771 | | 1,357 | | 6,222 | | 5,553 | | | 14 | | | 40 | | (8,007 | ) | | (6,950 | ) | | - | | - |
| | Provisions | | 941 | | 984 | | 583 | | 580 | | | 2,355 | | | 1,834 | | (29 | ) | | (17 | ) | | 3,851 | | 3,382 |
| | Other liabilities | | 738 | | 883 | | 724 | | 785 | | | 7 | | | 2 | | (65 | ) | | (104 | ) | | 1,404 | | 1,566 |
| | | | | | | | | | | |
| | Total Liabilities | | 45,230 | | 38,422 | | 43,568 | | 34,928 | | | 95,747 | | | 51,258 | | (77,511 | ) | | (41,814 | ) | | 107,034 | | 82,793 |
| | | | | | | | | | | |
| | Net Assets | | 184,619 | | 193,838 | | 27,595 | | 20,001 | | | (3,578 | ) | | 1,564 | | (24,018 | ) | | (21,566 | ) | | 184,619 | | 193,837 |
| | | | | | | | | | | |
| | Net Worth | | | | | | | | | | | | | | | | | | | | | | | | |
| | | | | | | | | | | |
| | Contributed equity | | - | | - | | 12,198 | | 11,214 | | | 37 | | | 37 | | (12,235 | ) | | (11,252 | ) | | - | | - |
| | Accumulated surplus/(deficit) | | 90,041 | | 90,538 | | 1,864 | | 3,569 | | | (3,987 | ) | | 671 | | (202 | ) | | (106 | ) | | 87,716 | | 94,671 |
| | Reserves | | 94,578 | | 103,300 | | 13,534 | | 5,217 | | | 371 | | | 856 | | (11,580 | ) | | (10,207 | ) | | 96,903 | | 99,167 |
| | | | | | | | | | | |
| | Total Net Worth | | 184,619 | | 193,838 | | 27,595 | | 20,001 | | | (3,578 | ) | | 1,564 | | (24,017 | ) | | (21,565 | ) | | 184,619 | | 193,838 |
| | | | | | | | | | | |
(a) | | See Note 1(c) for explanation of sectors. | | | | | | | | | | | | | | | | | | | | | | | | |
| | |
| Audited Consolidated Financial Statements 2008–09 – Government of Queensland | | 7-28 |
Notes to the Financial Statements
| | | | | | | | | | | | | | | | | | | | | | |
2. | | Disaggregated Information continued | | General Government (a) | | Public Non-financial Corporations (a) | | Public Financial Corporations (a) | | Consolidation Adjustments | | Consolidated |
| | | | |
| | | | | 2009 | | 2008 | | 2009 | | 2008 | | 2009 | | 2008 | | 2009 | | 2008 | | 2009 | | 2008 |
| | | Cash Flow Statement | | $M | | $M | | $M | | $M | | $M | | $M | | $M | | $M | | $M | | $M |
| | | | | | | | | | | |
| | Cash Flows from Operating Activities | | | | | | | | | | | | | | | | | | | | |
| | Cash received | | | | | | | | | | | | | | | | | | | | |
| | Taxes received | | 8,824 | | 9,522 | | - | | - | | - | | - | | (239) | | (197) | | 8,586 | | 9,325 |
| | Grants and subsidies received | | 17,396 | | 15,485 | | 2,014 | | 1,929 | | - | | - | | (1,922) | | (1,820) | | 17,488 | | 15,594 |
| | Sales of goods and services | | 4,101 | | 3,896 | | 8,794 | | 8,903 | | 1,317 | | 1,114 | | (628) | | (519) | | 13,584 | | 13,394 |
| | Interest receipts | | 1,482 | | (270) | | 153 | | 207 | | 3,506 | | 3,451 | | (4,141) | | (1,819) | | 1,001 | | 1,569 |
| | Dividends and income tax equivalents | | 1,139 | | 980 | | - | | 13 | | - | | - | | (1,139) | | (968) | | - | | 25 |
| | Other receipts | | 5,426 | | 2,987 | | 1,018 | | 942 | | 42 | | 19 | | (8) | | (2) | | 6,478 | | 3,945 |
| | | | 38,368 | | 32,600 | | 11,980 | | 11,992 | | 4,865 | | 4,584 | | (8,077) | | (5,324) | | 47,137 | | 43,852 |
| | Cash paid | | | | | | | | | | | | | | | | | | | | |
| | Payments for employees | | (15,791) | | (15,097) | | (2,240) | | (2,093) | | (197) | | (182) | | 246 | | 229 | | (17,981) | | (17,143) |
| | Payments for goods and services | | (8,281) | | (7,631) | | (4,598) | | (5,190) | | (85) | | (43) | | 446 | | 350 | | (12,517) | | (12,514) |
| | Grants and subsidies | | (9,231) | | (8,247) | | (43) | | (20) | | (1) | | (3) | | 1,922 | | 1,818 | | (7,352) | | (6,452) |
| | Interest paid | | (597) | | (346) | | (1,662) | | (1,169) | | (5,100) | | (2,894) | | 4,119 | | 1,738 | | (3,240) | | (2,671) |
| | Other payments | | (754) | | (884) | | (733) | | (777) | | (1,217) | | (1,036) | | 235 | | 301 | | (2,469) | | (2,397) |
| | | | (34,653) | | (32,204) | | (9,276) | | (9,250) | | (6,600) | | (4,158) | | 6,969 | | 4,435 | | (43,559) | | (41,177) |
| | | | | | | | | | | |
| | Net Cash Flows from Operating Activities | | 3,716 | | 396 | | 2,705 | | 2,743 | | (1,735) | | 426 | | (1,108) | | (890) | | 3,577 | | 2,675 |
| | | | | | | | | | | |
| | Cash Flows from Investing Activities | | | | | | | | | | | | | | | | | | | | |
| | Non-Financial Assets | | | | | | | | | | | | | | | | | | | | |
| | Purchases of non-financial assets | | (6,960) | | (5,725) | | (8,353) | | (8,234) | | (109) | | (71) | | 48 | | (16) | | (15,374) | | (14,047) |
| | Sales of non-financial assets | | 405 | | 405 | | 189 | | 327 | | 17 | | - | | (3) | | 57 | | 608 | | 789 |
| | | | (6,555) | | (5,320) | | (8,164) | | (7,907) | | (92) | | (71) | | 46 | | 40 | | (14,765) | | (13,258) |
| | | | | | | | | | | |
| | Financial Assets (Policy Purposes) | | (253) | | 755 | | (931) | | 417 | | - | | - | | 452 | | (991) | | (733) | | 181 |
| | | | | | | | | | | |
| | Financial Assets (Liquidity Purposes) | | (870) | | 2,081 | | (62) | | (17) | | (5,600) | | (1,531) | | 1,152 | | (345) | | (5,380) | | 188 |
| | | | | | | | | | | |
| | Net Cash Flows from Investing Activities | | (7,678) | | (2,484) | | (9,158) | | (7,507) | | (5,692) | | (1,602) | | 1,650 | | (1,295) | | (20,878) | | (12,888) |
| | | | | | | | | | | |
(a) | | See Note 1(c) for explanation of sectors. | | | | | | | | | | | | | | | | | | | | |
| | |
| Audited Consolidated Financial Statements 2008–09 – Government of Queensland | | 7-29 |
Notes to the Financial Statements
| | | | | | | | | | | | | | | | | | | | | | |
2. | | Disaggregated Information continued | | General Government (a) | | Public Non-financial Corporations (a) | | Public Financial Corporations (a) | | Consolidation Adjustments | | Consolidated |
| | | | |
| | | | | 2009 | | 2008 | | 2009 | | 2008 | | 2009 | | 2008 | | 2009 | | 2008 | | 2009 | | 2008 |
| | | | | $M | | $M | | $M | | $M | | $M | | $M | | $M | | $M | | $M | | $M |
| | Receipts from Financing Activities | | | | | | | | | | | | | | | | | | | | |
| | Advances received (net) | | (26) | | 2 | | - | | (1) | | - | | - | | - | | 1 | | (26) | | 2 |
| | Proceeds of borrowing (net) | | 3,728 | | 4,158 | | 7,141 | | 5,059 | | (11,873) | | (8,679) | | 123 | | 159 | | (882) | | 697 |
| | Dividends paid (net) | | - | | - | | (925) | | (709) | | (2) | | (7) | | 927 | | 716 | | - | | - |
| | Deposits received (net) | | - | | (1) | | - | | (12) | | 1,085 | | 1,494 | | (1,218) | | (417) | | (132) | | 1,063 |
| | Other financing (net) | | - | | (6) | | 460 | | (1,145) | | 18,201 | | 8,384 | | (452) | | 1,280 | | 18,210 | | 8,514 |
| | Net Cash Flows from Financing Activities | | 3,701 | | 4,154 | | 6,676 | | 3,191 | | 7,411 | | 1,191 | | (619) | | 1,739 | | 17,170 | | 10,276 |
| | | | | | | | | | | |
| | Net increase/(decreased) in Cash Held | | (261) | | 2,066 | | 223 | | (1,573) | | (16) | | 15 | | (77) | | (445) | | (130) | | 62 |
| | Cash at the beginning of the financial year | | 3,109 | | 1,043 | | 1,912 | | 3,485 | | 31 | | 16 | | (3,866) | | (3,420) | | 1,186 | | 1,123 |
| | Cash and Cash Equivalents Held at the End of the Financial Year | | 2,848 | | 3,109 | | 2,135 | | 1,912 | | 15 | | 31 | | (3,943) | | (3,866) | | 1,056 | | 1,186 |
| | |
| | KEY FISCAL AGGREGATES | | | | | | | | | | | | | | | | | | | | |
| | Net Cash from Operating Activities | | 3,716 | | 396 | | 2,705 | | 2,743 | | (1,735) | | 426 | | (1,108) | | (890) | | 3,577 | | 2,675 |
| | Net Cash Flow from Investments in Non-Financial Assets | | (6,555) | | (5,320) | | (8,164) | | (7,907) | | (92) | | (71) | | 46 | | 40 | | (14,765) | | (13,258) |
| | Dividends Paid | | - | | - | | (925) | | (709) | | (2) | | (7) | | 927 | | 716 | | - | | - |
| | CASH SURPLUS/(DEFICIT) | | (2,839) | | (4,924) | | (6,384) | | (5,874) | | (1,830) | | 348 | | (135) | | (133) | | (11,188) | | (10,583) |
| | |
| | | | | | | | | | | |
(a) | | See Note 1(c) for explanation of sectors. | | | | | | | | | | | | | | | | | | | | |
| | |
| Audited Consolidated Financial Statements 2008–09 – Government of Queensland | | 7-30 |
Notes to the Financial Statements
| | | | | | |
| | | | | 2009 | | 2008 |
| | | | | $M | | $M |
3. | | Taxation revenue | | | | |
| | | |
| | Taxes | | | | |
| | Stamp duty | | | | |
| | Transfer duty | | 1,806 | | 2,912 |
| | Vehicle registration | | 1,474 | | 1,369 |
| | Insurance | | 425 | | 386 |
| | Mortgages | | 17 | | 327 |
| | Other duties | | 23 | | 17 |
| | | | | | |
| | | | 3,746 | | 5,010 |
| | | |
| | Payroll tax | | 2,646 | | 2,391 |
| | Land tax | | 814 | | 596 |
| | Guarantee fees | | - | | 6 |
| | Various gaming taxes and other levies | | 1,410 | | 1,346 |
| | | | | | |
| | | | 8,615 | | 9,349 |
| | | | | | |
| | | |
4. | | Grants revenue | | | | |
| | | |
| | Commonwealth | | | | |
| | General purpose payments | | | | |
| | GST revenue grants | | 7,946 | | 8,549 |
| | Other general purpose payments | | 2,276 | | 2,468 |
| | Specific purpose payments | | 2,987 | | 2,763 |
| | National partnership payments | | 1,845 | | - |
| | Grants for on-passing to non Queensland Government entities | | 1,925 | | 1,649 |
| | | | | | |
| | | | 16,979 | | 15,430 |
| | | |
| | Other | | | | |
| | Other grants | | 120 | | 139 |
| | Industry/community contributions | | 497 | | 438 |
| | | | | | |
| | | | 617 | | 576 |
| | | | | | |
| | | | 17,596 | | 16,006 |
| | | | | | |
| | | |
5. | | Sales of goods and services | | | | |
| | | |
| | User Charges | | | | |
| | Sale of goods and services | | 10,360 | | 10,094 |
| | Rental Income | | 515 | | 467 |
| | | |
| | Fees | | | | |
| | Transport and other licences and permits | | 456 | | 405 |
| | Other regulatory fees | | 443 | | 473 |
| | | | | | |
| | | | 899 | | 878 |
| | | |
| | | | | | |
| | | | 11,775 | | 11,439 |
| | | | | | |
| | | |
6. | | Interest Income | | | | |
| | | |
| | Interest | | 1,033 | | 1,600 |
| | | | | | |
| | | |
| | Interest revenue from financial assets not at fair value through profit and loss totalled $164 million (2008, $192 million). | | | | |
| | | |
7. | | Dividend and income tax equivalents income | | | | |
| | | |
| | Dividends | | 1 | | 13 |
| | Income tax equivalents | | - | | 11 |
| | | | | | |
| | | | 1 | | 24 |
| | | | | | |
| | |
| Audited Consolidated Financial Statements 2008–09 – Government of Queensland | | 7-31 |
Notes to the Financial Statements
| | | | | | |
| | | | | 2009 | | 2008 |
| | | | | $M | | $M |
8. | | Other revenue | | | | |
| | | |
| | Royalties | | 3,365 | | 1,371 |
| | Other territorial revenue | | 107 | | 91 |
| | Assets assumed/liabilities transferred | | 444 | | 115 |
| | Donations, gifts and services received at below fair value | | 54 | | 63 |
| | Contributed assets | | 26 | | 37 |
| | Fines | | 243 | | 219 |
| | Other | | 703 | | 555 |
| | | | | | |
| | | | 4,942 | | 2,451 |
| | | | | | |
| | | |
| 9. | | Employee expenses (refer Note 51 for additional disclosures) | | | | |
| | | |
| | Salaries and wages | | 14,161 | | 13,203 |
| | Annual leave | | 1,297 | | 1,056 |
| | Long service leave | | 542 | | 490 |
| | Other employee related expenses | | 351 | | 340 |
| | | | | | |
| | | | 16,351 | | 15,090 |
| | | | | | |
| | | |
| 10. | | Superannuation expenses (refer Note 51 for additional disclosures) | | | | |
| | | |
| | Superannuation interest cost | | | | |
| | Nominal interest | | 1,133 | | 925 |
| | Defined benefit interest cost | | (290) | | (135) |
| | | | | | |
| | | | 844 | | 790 |
| | | | | | |
| | | |
| | Other superannuation expenses | | | | |
| | Accumulation contribution | | 1,064 | | 893 |
| | Defined benefit service cost | | 1,176 | | 1,174 |
| | | | | | |
| | | | 2,240 | | 2,067 |
| | | | | | |
| | | |
11. | | Other operating expenses | | | | |
| | | |
| | Supplies and Services | | 9,679 | | 9,402 |
| | Workcover Qld and other claims | | 1,578 | | 1,231 |
| | Other expenses | | 462 | | 618 |
| | | | | | |
| | | | 11,719 | | 11,251 |
| | | | | | |
| | | |
| | Audit fees of $15.8 million (2008, $14.8 million) charged by the Queensland Audit Office to entities included in these financial statements have been eliminated on consolidation. | | | | |
| | | |
12. | | Depreciation and amortisation | | | | |
| | | |
| | Depreciation and amortisation expenses for the financial year were charged in respect of: | | | | |
| | Buildings | | 940 | | 858 |
| | Infrastructure | | 2,275 | | 1,602 |
| | Plant and equipment | | 781 | | 664 |
| | Major plant and equipment | | 92 | | 89 |
| | Heritage and cultural assets | | 3 | | 3 |
| | Leased plant and equipment | | 128 | | 146 |
| | Software development | | 153 | | 143 |
| | | | | | |
| | | | 4,371 | | 3,506 |
| | | | | | |
| | | |
13. | | Other interest expense | | | | |
| | | |
| | Interest | | 3,363 | | 2,654 |
| | Finance charges relating to finance leases | | 24 | | 13 |
| | Other | | 13 | | 7 |
| | | | | | |
| | | | 3,400 | | 2,673 |
| | | | | | |
| | | |
| | Interest expense on financial liabilities other than those at fair value through profit and loss amounts to $60 million (2008, $48 million). | | | | |
| | |
| Audited Consolidated Financial Statements 2008–09 – Government of Queensland | | 7-32 |
Notes to the Financial Statements
| | | | | | |
| | | | | 2009 | | 2008 |
| | | | | $M | | $M |
14. | | Grants expenses | | | | |
| | | |
| | Grants - recurrent | | 5,346 | | 4,783 |
| | Grants - capital | | 1,233 | | 844 |
| | First Home Owners Grant | | 241 | | 201 |
| | Personal benefit payments | | 232 | | 212 |
| | Subsidy payments | | 556 | | 551 |
| | | | | | |
| | | | 7,608 | | 6,592 |
| | | | | | |
| | | |
15. | | Gain on sale of assets and investments | | | | |
| | | |
| | Gain on sale of financial assets | | | | |
| | Gain on sale of available-for-sale financial assets | | 214 | | 276 |
| | Gain on sale of derivatives | | 2 | | 2 |
| | Gain on sale of other investments | | 1 | | 6 |
| | | | | | |
| | | | 217 | | 284 |
| | | |
| | Gain on sale of non-financial assets | | | | |
| | Gain on sale of investment property | | - | | 34 |
| | Gain on sale of other non-current assets | | 242 | | 310 |
| | Gain on sale - environmental certificates/obligations | | - | | 7 |
| | | | | | |
| | | | 459 | | 634 |
| | | | | | |
| | The gains on sale of financial assets relate to the following categories: | | | | |
| | Assets at fair value through profit or loss | | 1 | | 6 |
| | Available for sale | | 43 | | - |
| | Available for sale (recycled from reserves) | | 171 | | 276 |
| | Derivatives | | 2 | | 2 |
| | | | | | |
| | | | 217 | | 284 |
| | | | | | |
| | | |
16. | | Revaluation increments and impairment loss reversals | | | | |
| | | |
| | Revaluation increments of financial assets | | | | |
| | Revaluation increments - derivatives | | 155 | | 223 |
| | Revaluation increments of non-financial assets | | | | |
| | Revaluation increments - investment property | | 304 | | 143 |
| | Revaluation increments - self generating and regenerating assets | | 67 | | 186 |
| | | | | | |
| | | | 526 | | 552 |
| | | | | | |
| | | |
17. | | Loss on sale of assets and investments | | | | |
| | | |
| | Loss on sale of financial assets | | | | |
| | Loss on sale of other investments | | 89 | | - |
| | Loss on sale of non-financial assets | | | | |
| | Loss on sale of intangibles | | 6 | | 3 |
| | | | | | |
| | | | 96 | | 3 |
| | | | | | |
| | |
| Audited Consolidated Financial Statements 2008–09 – Government of Queensland | | 7-33 |
Notes to the Financial Statements
| | | | | | |
| | | | | 2009 | | 2008 |
| | | | | $M | | $M |
18. | | Asset write-down, revaluation decrements and impairment loss | | | | |
| | | |
| | Asset write-down | | | | |
| | Bad and doubtful debts (operating receivables impairment loss) | | 97 | | 63 |
| | Inventory write-down (net) | | 6 | | 9 |
| | Other assets written off/donated | | 308 | | 192 |
| | | | | | |
| | | | 411 | | 264 |
| | Revaluation decrements of financial assets | | | | |
| | Revaluation decrements - other investments | | 463 | | 382 |
| | Revaluation decrements of non-financial assets | | | | |
| | Revaluation decrements - other non-current assets | | 52 | | 7 |
| | Revaluation decrements - environmental certificates/obligations | | 4 | | 35 |
| | Impairment losses | | | | |
| | Impairment loss - non-financial assets | | 620 | | 103 |
| | Impairment loss - intangible assets | | 2 | | 4 |
| | Impairment loss - available-for-sale financial assets | | 9 | | - |
| | Impairment loss - non-current assets held for sale | | 10 | | 1 |
| | Impairment loss - Financial assets at fair value through profit and loss | | 3 | | 2 |
| | | | | | |
| | | | 642 | | 110 |
| | | | | | |
| | | | 1,573 | | 797 |
| | | | | | |
19. | | Actuarial adjustments to liabilities | | | | |
| | | |
| | Long service leave | | (44) | | (34) |
| | Other | | 58 | | 83 |
| | | | | | |
| | | | 14 | | 48 |
| | | | | | |
20. | | Other economic flows in operating result | | | | |
| | | |
| | Net market value interest revenue/(expense) | | (3,772) | | (91) |
| | Time value adjustments | | (54) | | (9) |
| | Share of net profit or (loss) of associates and joint ventures accounted for using the equity method | | (2) | | (3) |
| | Onerous contracts expense | | 70 | | (15) |
| | Other economic flows nec | | 14 | | 4 |
| | | | | | |
| | | | (3,743) | | (114) |
| | | | | | |
| | | |
21. | | Other economic flows - movements in equity - revaluations | | | | |
| | | |
| | Revaluations of financial assets | | | | |
| | Available-for-sale financial assets | | (167) | | (266) |
| | Investments | | - | | (69) |
| | Cash flow hedge | | 555 | | 1,691 |
| | | | | | |
| | | | 388 | | 1,356 |
| | Revaluations of non-financial assets | | | | |
| | Property, plant and equipment | | (1,967) | | 37,683 |
| | Intangible assets | | - | | 39 |
| | | | | | |
| | | | (1,967) | | 37,722 |
| | | |
| | Self generating and regeneration assets | | (1) | | - |
| | Actuarial gains/(losses) on defined superannuation plans | | (654) | | (1,645) |
| | | | | | |
| | | | (2,234) | | 37,433 |
| | | | | | |
22. | | Cash and deposits | | | | |
| | | |
| | Cash | | 815 | | 996 |
| | Deposits on call | | 241 | | 191 |
| | | | | | |
| | | | 1,055 | | 1,186 |
| | | | | | |
| | | |
| | Agencies forming part of the Public Accounts report all monies on hand as cash. This does not include QTC money market deposits of $2.851 billion (2008, $841 million). Refer Note 24. All material cash balances held by those agencies are managed and invested by QTC daily to maximise returns in accordance with agreed risk profiles on a whole-of-Government basis. | | | | |
| | |
| Audited Consolidated Financial Statements 2008–09 – Government of Queensland | | 7-34 |
Notes to the Financial Statements
| | | | | | |
| | | | | 2009 | | 2008 |
| | | | | $M | | $M |
23. | | Receivables and Loans | | | | |
| | | |
| | Receivables | | | | |
| | Current | | | | |
| | Trade debtors | | 1,770 | | 1,913 |
| | Interest receivable | | 23 | | 23 |
| | GST input tax credits receivable | | 368 | | 351 |
| | Dividends and guarantee fees receivable | | - | | 1 |
| | Royalties and territorial revenue receivable | | 521 | | 489 |
| | Taxes receivable | | 412 | | 382 |
| | Other receivables | | 980 | | 795 |
| | | | | | |
| | | | 4,073 | | 3,954 |
| | Less: Provision for doubtful debts/impairment losses | | 381 | | 352 |
| | | | | | |
| | | | 3,692 | | 3,602 |
| | | | | | |
| | Non-Current | | | | |
| | Trade debtors | | 95 | | 98 |
| | Other | | 194 | | 213 |
| | | | | | |
| | | | 289 | | 310 |
| | Less: Provision for doubtful debts/impairment losses | | 1 | | 1 |
| | | | | | |
| | | | 288 | | 310 |
| | | | | | |
| | | | 3,980 | | 3,911 |
| | | | | | |
| | Loans and Advances | | | | |
| | | |
| | Advances Paid | | | | |
| | Current | | | | |
| | Advances | | 132 | | 97 |
| | Less: Provision for doubtful debts/impairment losses | | 3 | | 5 |
| | | | | | |
| | | | 129 | | 92 |
| | Non-Current | | | | |
| | Advances | | 745 | | 799 |
| | Less: Provision for doubtful debts/impairment losses | | - | | 1 |
| | | | | | |
| | | | 745 | | 798 |
| | | |
| | | | | | |
| | | | 873 | | 890 |
| | | | | | |
| | Loans Paid | | | | |
| | Current | | | | |
| | Finance leases | | 13 | | 12 |
| | | |
| | Less: Provision for doubtful debts/impairment losses | | - | | - |
| | | | | | |
| | | | 13 | | 12 |
| | | | | | |
| | Non-Current | | | | |
| | Onlendings | | 2,690 | | 3,233 |
| | Finance leases | | 200 | | 200 |
| | | | | | |
| | | | 2,890 | | 3,433 |
| | Less: Provision for doubtful debts/impairment losses | | - | | - |
| | | |
| | | | | | |
| | | | 2,890 | | 3,433 |
| | | | | | |
| | | |
| | | | | | |
| | | | 2,903 | | 3,444 |
| | | | | | |
| | Finance Lease Receivables due: | | | | |
| | Not later than 1 year | | 19 | | 17 |
| | Later than 1 year but not later than 5 years | | 65 | | 62 |
| | Later than 5 years | | 295 | | 304 |
| | | | | | |
| | | | 379 | | 383 |
| | | |
| | Less: Future finance revenue | | 166 | | 171 |
| | | | | | |
| | | | 213 | | 212 |
| | | | | | |
| | |
| Audited Consolidated Financial Statements 2008–09 – Government of Queensland | | 7-35 |
Notes to the Financial Statements
| | | | | | | | | | |
| | | | | | | | | 2009 | | 2008 |
| | | | | | | | | $M | | $M |
| | | | | |
23. | | Receivables and Loans continued | | | | | | | | |
| | | | | |
| | Minimum Operating Lease Payments Receivable: | | | | | | | | |
| | Operating leases not recognised in the financial statements (excluding investment properties): | | | | | | | | |
| | | | | |
| | Not later than 1 year | | | | | | 15 | | 26 |
| | Later than 1 year but not later than 5 years | | | | | | 42 | | 61 |
| | Later than 5 years | | | | | | 200 | | 167 |
| | | | | | | | | | |
| | | | | | | | 257 | | 254 |
| | | | | | | | | | |
| | Past Due Not Impaired Financial Assets Analysis as at 30 June 2009 | | | | | | | | |
| | | | | |
| | | | | 1 Month or Less $M | | 1 to 2 Months $M | | 2 to 3 Months $M | | Over 3 Months $M |
| | | | 93 | | 29 | | 20 | | 109 |
| | Trade receivables | | 34 | | 2 | | - | | 238 |
| | | | | | | | | | |
| | Other receivables and loans | | 127 | | 31 | | 20 | | 347 |
| | | | | | | | | | |
| | | | | |
| | | Impaired Financial Assets Analysis as at 30 June 2009 | | 1 Month or Less $M | | 1 to 2 Months $M | | 2 to 3 Months $M | | Over 3 Months $M |
| | | | | |
| | Trade receivables | | 26 | | 5 | | 6 | | 131 |
| | Other receivables and loans | | 2 | | 1 | | 1 | | 233 |
| | | | | | | | | | |
| | | | 28 | | 6 | | 7 | | 364 |
| | | | | | | | | | |
| | | | | |
| | Past Due Not Impaired Financial Assets Analysis as at 30 June 2008 | | | | | | | | |
| | | | | |
| | Trade receivables | | 114 | | 65 | | 18 | | 82 |
| | Other receivables and loans | | 34 | | - | | - | | 194 |
| | | | | | | | | | |
| | | | 148 | | 65 | | 18 | | 276 |
| | | | | | | | | | |
| | Impaired Financial Assets Analysis as at 30 June 2008 | | | | | | | | |
| | | | | |
| | Trade receivables | | 14 | | 9 | | 6 | | 99 |
| | Other receivables and loans | | 1 | | 1 | | 1 | | 242 |
| | | | | | | | | | |
| | | | 15 | | 10 | | 7 | | 341 |
| | | | | | | | | | |
| | | | | |
24. | | Securities other than shares | | | | | | | | |
| | | | | |
| | Current | | | | | | | | |
| | Term deposits | | | | | | 24 | | 11 |
| | Rental purchase plan | | | | | | 6 | | 9 |
| | Money market deposits | | | | | | 2,851 | | 841 |
| | Securities/bonds | | | | | | 14,433 | | 9,226 |
| | Investments managed by QIC Limited* | | | | | | 3,268 | | 2,982 |
| | Derivatives | | | | | | | | |
| | Derivatives - cash flow hedges | | | | | | 24 | | 103 |
| | Other derivatives | | | | | | 487 | | 277 |
| | Other | | | | | | 848 | | 285 |
| | | | | | | | | | |
| | | | | | | | 21,941 | | 13,734 |
| | | | | | | | | | |
| | |
| Audited Consolidated Financial Statements 2008–09 – Government of Queensland | | 7-36 |
Notes to the Financial Statements
| | | | | | |
| | | | | 2009 | | 2008 |
| | | | | $M | | $M |
24. | | Securities other than shares continued | | | | |
| | | |
| | Non-Current | | | | |
| | Term deposits | | 5 | | - |
| | Rental purchase plan | | 194 | | 187 |
| | Securities/bonds | | 8,082 | | 6,300 |
| | Investments managed by QIC Limited* | | 20,376 | | 24,693 |
| | Derivatives | | | | |
| | Derivatives - cash flow hedges | | 70 | | 137 |
| | Other derivatives | | 408 | | 88 |
| | Other | | 635 | | 388 |
| | | | | | |
| | | | 29,771 | | 31,793 |
| | | | | | |
| | | |
| | | | | | |
| | | | 51,712 | | 45,527 |
| | | | | | |
| | The carrying amounts of the above financial assets are classified as designated at fair value on initial recognition. | | | | |
| | | |
| | * Investments managed by QIC Limited were allocated over the following categories: | | | | |
| | | |
| | Cash | | 2,473 | | 1,150 |
| | Fixed interest | | 5,390 | | 9,648 |
| | Australian equities | | 3,476 | | 5,662 |
| | International equities | | 3,467 | | 5,357 |
| | Property | | 4,609 | | 3,752 |
| | Other | | 4,229 | | 2,106 |
| | | | | | |
| | | | 23,644 | | 27,675 |
| | | | | | |
25. | | Shares and other equity investments | | | | |
| | | |
| | Investments in other entities (not controlled or associated) | | | | |
| | Current | | | | |
| | Available-for-sale shares | | - | | 246 |
| | | | | | |
| | | | - | | 246 |
| | | | | | |
| | Non-Current | | | | |
| | Shares at fair value through profit and loss | | - | | 1 |
| | Available-for-sale shares | | 35 | | 16 |
| | | | | | |
| | | | 35 | | 16 |
| | | | | | |
| | | |
| | | | | | |
| | | | 35 | | 262 |
| | | | | | |
| | | |
| | On 4 November 2008, the State sold its 12% investment in BAH Holdings Pty Ltd. This investment was neither controlled nor associated. | | | | |
| | | |
| | Investments accounted for using equity method | | | | |
| | |
| | Investments in the following unlisted associated and joint venture entities are recognised at amounts in excess of $1 million in the accounts of the relevant public sector entity: | | |
| | |
| Audited Consolidated Financial Statements 2008–09 – Government of Queensland | | 7-37 |
Notes to the Financial Statements
| | | | | | | | | | | | | | |
25. | | Shares and other equity investments continued |
| | | | | |
| | | Name of Entity | | Principal Activity | | | | Ownership Interest | | Equity Accounted Amount |
| | | | | | | | | 2009 % | | 2008 % | | 2009 $M | | 2008 $M |
| | | | | | | |
| | Dumaresq-Barwon Border Rivers Commission | | Water management | | (i) | | 50 | | 50 | | 36 | | 36 |
| | | | | | | |
| | ElectraNet Pty Ltd | | Electricity transmission | | (ii) | | 41 | | 41 | | 39 | | 47 |
| | | | | | | |
| | QInvest Limited | | Dealer in securities and financial planning advice | | (iii) | | 50 | | 50 | | - | | 1 |
| | | | | | | |
| | Gold Coast Motor Events Co. | | Staging car racing events on the Gold Coast | | (iv) | | 50 | | 50 | | 2 | | 2 |
| | | | | | | |
| | ARG Risk Management Limited | | Insurance | | (v) | | 50 | | 50 | | 1 | | 1 |
| | | | | | | | | | | | | | |
| | | | | | | | | | | | 79 | | 87 |
| | | | | | | | | | | | | | |
| (i) | Dumaresq-Barwon Border Rivers Commission is a joint authority constituted by an agreement between the Queensland and New South Wales governments. Each government holds a 50% interest in the joint commission. |
| (ii) | Powerlink Queensland holds a 41.11% interest in ElectraNet Pty Ltd (trading as ElectraNet SA), being an electricity transmission services provider in South Australia. |
| (iii) | QIC Limited holds a 50% interest in QInvest Limited, being a licensed dealer in securities, providing financial planning advice and acting as responsible entity for the QInvest Investment Access Funds. |
| (iv) | Gold Coast Events Co. Pty Ltd holds 50% interest in Gold Coast Motor Events Co. It is a partnership which stages the Open Wheel Racing Series and V8 Supercar series events on the Gold Coast. |
| (v) | QR Surat Basin Pty Ltd (100% subsidiary of QR) has a 50% ownership interest in ARG Risk Management Limited, being a captive insurance company incorporated in Bermuda to assist with ARG’s insurance needs. It also has a 15% interest in CHCQ, being a construction company in China - Hong Kong and a 30% interest in KMQG Sdn Bhd, being a consulting service provider in Malaysia. |
| | | | |
| | | 2009 $M | | 2008 $M |
Movements in Carrying Amount of Equity Accounted Investments: | | | | |
| | |
Carrying amount at beginning of the financial year | | 87 | | 67 |
Share of net loss | | (2) | | (4) |
Revaluation of assets | | (5) | | 27 |
Changes in holdings | | 1 | | - |
Dividends received | | (2) | | (3) |
| | | | |
Carrying amount at end of the financial year | | 79 | | 87 |
| | | | |
| | |
Share of Commitments of Equity Accounted Investments: | | | | |
| | |
Capital and lease commitments: | | 9 | | 34 |
| | |
| Audited Consolidated Financial Statements 2008–09 – Government of Queensland | | 7-38 |
Notes to the Financial Statements
| 26. | Interest in Joint Ventures |
CS Energy Limited
Callide Energy Pty Ltd, a wholly owned subsidiary of CS Energy Ltd, holds a 50% interest in the Callide Power Project Joint Venture with IG Power (Callide) Ltd. The joint venture’s principal activity is the generation of electricity.
CS Energy Ltd holds a 50% participating interest in the Kogan North Joint Venture, a gas development joint venture with Australian CBM Pty Ltd.
CS Energy Ltd has a 7.5% participating interest in the Stratheden Joint Venture, a gas development joint venture with Metgasco Limited.
CS Energy Ltd has a 75.22% participating interest in the Callide Oxyfuel Project Joint Venture, a project involved in clean coal technology research. Grants are receivable from both government and non-government entities to fund the project on the basis that certain project milestones are met.
The value of the joint venture assets included in the Balance Sheet at 30 June 2009 is $342 million (2008, $346 million).
Tarong Energy Corporation Limited
Tarong Energy Corporation Limited ultimately holds a 21% (2008, 21%) interest in the Private Forestry Plantation Joint Venture. The principal activity is the commercial production of timber from plantations.
TN Power Pty Ltd (a subsidiary of Tarong Energy Corporation) and TM Energy (Australia) Pty Ltd each hold a 50% interest in the TN Power unincorporated Joint Venture whose principal activity is the generation of electricity.
On 8 June 2005, the Centre for Low Emission Technology Joint Venture was established. Tarong Energy Corporation will ultimately hold a 7.7% interest in this Joint Venture whose principal activity is to facilitate research and other activities directed towards the generation of electricity from coal with lower greenhouse gas emissions.
The value of the joint venture assets included in the Balance Sheet at 30 June 2009 is $163 million (2008, $163 million).
Stanwell Corporation Limited
Stanwell Corporation Limited has a 50% (2008, 50%) interest in the Emu Downs Wind Farm Project whose principal activity is the operation of a wind farm in Western Australia. As at reporting date, the sale of the Emu Downs Wind Farm and Badgingarra Wind Farm Project are being negotiated with third parties.
The value of the joint venture net assets included in the Balance Sheet at 30 June 2009 is $95 million (2008, $90 million).
Department of Communities (Housing)
The Department of Housing holds a 54% interest (2008, 54%) in a joint venture operation with Queensland University of Technology to develop the Kelvin Grove Urban Village. Each party to the joint venture owns and develops its own land but contributes to the cost of shared infrastructure and other project common works.
The land and development costs included in the Balance Sheet at 30 June 2009 total $14 million (2008, $15 million).
QR Limited
QR has an interest in the CityTrans joint venture operation with Brisbane City Council. The principal activity is to plan and develop commercially sustainable integrated public and event transport options on behalf of Translink.
QR increased its participating interest from 20% to 33.33% in a joint venture through its wholly-owned subsidiary QR Surat Basin Pty Ltd. Two existing participants sold their 40% interest to QR Surat Basin Pty Ltd and the two other remaining parties. The purpose of this joint venture is the development of an open access multi-user rail freight corridor between Toowoomba and Gladstone. Net liabilities included in the Balance Sheet total $4 million.
QR has interests in a number of smaller joint ventures for transport related works. Further details of these ventures are set out in the annual report of QR.
| | |
| Audited Consolidated Financial Statements 2008–09 – Government of Queensland | | 7-39 |
Notes to the Financial Statements
| 26. | Interest in Joint Ventures continued |
The Council of the Queensland Institute of Medical Research (QIMR)
QIMR holds 24.5% (2008, 24.5%) of the issued capital of Q-Pharm Pty Limited, being a Phase 1 Clinical Trial company joint venture.
QIMR has contractual arrangements with a number of other non-material incorporated and unincorporated joint ventures. Details of the joint venture partners can be obtained from the annual report of QIMR.
Department of Transport and Main Roads
The Department of Transport and Main Roads holds a 50% interest in Personalised Plates Queensland. The joint venture facilitates the management, operational and marketing aspects of personalised number plate sales. The department recognised net revenue of $13 million from these operations (2008, $14 million). Additional details can be obtained from the department’s annual report.
Other
Joint ventures that contribute less than $2 million in net assets and/or net revenues to the Balance Sheet or Operating Statement include:
| | - | Forestry Plantations Queensland holds an interest in various joint ventures relating to private forestry plantations and seed orchards. |
| | - | The Department of Environment and Resource Management is a party to the Public Sector Mapping Venture to create and facilitate access to national spatial datasets for both governmental and commercial use. |
| | - | The Department of Environment and Resource Management and HEMA Maps Pty Ltd each hold a 50% interest in a joint venture operation to produce, promote, distribute and sell maps from the Sunmap Regional Map series. |
| | - | QIC Limited had a 50% interest in the Innovis Investment Partners Australia Limited Partnership and the Innovis Investment Partners LLC (resident in the USA), the principal activities of which are funds management. The Innovis Investment Partners Australia LP partnership was dissolved on 31 December 2008 with all monies returned or distributed. |
| | - | Queensland Treasury Corporation has a 50% interest in Local Government Infrastructure Services Pty Ltd which provides assistance to Queensland local governments in relation to infrastructure procurement. |
| 27. | Public Private Partnerships |
Department of Health
Queensland Health has entered into a number of contractual arrangements with private sector entities for the construction and operation of public infrastructure facilities for a period of time on departmental land. After an agreed period of between 15 and 25 years, ownership of these facilities will pass to Queensland Health.
Arrangements are in operation at the following locations as at 30 June 2009:
| | - | Butterfield Street car park (commenced January 1998); |
| | - | Bramston Terrace car park (commenced November 1998); |
| | - | Central Energy facility (commenced February 1999); |
| | - | Noosa Hospital and Specialist Centre (commenced September 1999); |
| | - | The Prince Charles Hospital car park (commenced November 2000); |
| | - | Townsville Hospital Support Facilities Building and Walkway (commenced April 2002); |
| | - | Townsville Childcare Centre (commenced September 2004); |
| | - | The Prince Charles Hospital Early Education Centre (commenced April 2007); and |
| | - | The Princess Alexandra Hospital Multi Story Car Park (commenced February 2008). |
To date, no rights or obligations relating to these facilities have been recognised by Queensland Health, other than those associated with land rental and the provision of various services under the agreements.
Queensland Health also has entered into a number of contractual arrangements (termed collocation agreements) with private sector entities for the construction and operation of private health facilities for a period of time on departmental land. After an agreed period of 25 years, ownership of these facilities will pass to Queensland Health. The department does not control the facilities associated with these arrangements and accordingly, the facilities are not recognised as assets.
| | |
| Audited Consolidated Financial Statements 2008–09 – Government of Queensland | | 7-40 |
Notes to the Financial Statements
| 27. | Public Private Partnerships continued |
Department of Health continued
Collocation arrangements are in operation at the following locations as at 30 June 2009:
| | - | | Caboolture Private Hospital (commenced September 1997); |
| | - | | Redlands Private Hospital (commenced August 1999); and |
| | - | | Holy Spirit Northside Private Hospital (commenced July 2001). |
Department of Transport and Main Roads
The Brisbane Airport Rail Link (BARL) is a public rail transport system developed by Airtrain Citylink Limited (Airtrain) to link the Brisbane Domestic and International Airports to the existing QR network.
In 1998, the State Government entered into an agreement with Airtrain whereby Airtrain was required to acquire the land for the BARL and design, construct, maintain and operate the BARL for a concession period of 35 years. At the end of this period, the agreement provides for Airtrain to transfer the BARL to the Government at no cost to the State.
The State Government leases airport land from the Brisbane Airport Corporation and sub-leases the same land to Airtrain.
Department of Education and Training
(a) Southbank Education and Training Precinct
In April 2005, the State Government entered into a contractual arrangement with Axiom Education Queensland Pty Ltd (Axiom) to design, construct, operate, maintain and finance the Southbank Education and Training Precinct for a period of 34 years on departmental land. The arrangement involved the refurbishment or demolition of existing buildings and the development of new buildings.
Construction work was completed on 31 October 2008 and leasing arrangements are currently being finalised for the property to be leased to Axiom. The State will sub-lease from Axiom and will pay an abatable, undissected service payment to Axiom for the operation, maintenance and provision of the precinct. At the expiry of the lease in 2039, the buildings will revert to the State for nil consideration. The land on which the facility is constructed is owned and recognised as an asset of the department.
(b) South East Queensland schools - Aspire
In May 2009, the State Government entered into a contractual arrangement with Aspire Schools (Qld) Pty Limited (Aspire) to design, construct, maintain and finance seven schools to the State for a period of 30 years on departmental land.
Construction work commenced in April 2009 and will continue for the next four years with leasing arrangements currently being finalised for the property to be leased to Aspire. The State will lease back the property from Aspire and will pay an abatable, undissected service payment to Aspire for the operation, maintenance and provision of the schools. At the expiry of the lease in 2039, the buildings will revert to the State for nil consideration. The land on which the facility is constructed is owned and recognised as an asset of the department.
Further information may be obtained from the individual financial reports of the relevant agencies.
| | | | |
| | | 2009 | | 2008 |
| Estimated Cash Flows for Public Private Partnerships | | $M | | $M |
Inflows | | | | |
Not later than 1 year | | 1 | | 4 |
Later than 1 year but not later than 5 years | | 3 | | 3 |
Later than 5 years but not later than 10 years | | 4 | | 4 |
Later than 10 years | | 8 | | 9 |
| | | | |
| | 16 | | 20 |
| | |
Outflows | | | | |
Not later than 1 year | | (57) | | (56) |
Later than 1 year but not later than 5 years | | (232) | | (214) |
Later than 5 years but not later than 10 years | | (292) | | (259) |
Later than 10 years | | (433) | | (362) |
| | | | |
| | (1,014) | | (891) |
| | | | |
| | | | |
Estimated Net Cash Flow | | (998) | | (871) |
| | | | |
| | |
| Audited Consolidated Financial Statements 2008–09 – Government of Queensland | | 7-41 |
Notes to the Financial Statements
| | | | | | |
| | | | | 2009 | | 2008 |
| | | | | $M | | $M |
28. | | Inventories | | | | |
| | | |
| | Current | | | | |
| | Raw materials | | 568 | | 496 |
| | Work in progress | | 65 | | 65 |
| | Finished goods | | 278 | | 205 |
| | Land held for resale | | 368 | | 279 |
| | Inventories held for distribution | | 4 | | 4 |
| | Environmental Certificates held for sale/surrender | | 39 | | 31 |
| | Other | | 44 | | 43 |
| | | | | | |
| | | | 1,365 | | 1,123 |
| | | | | | |
| | | |
29. | | Assets Held for Sale | | | | |
| | | |
| | Land | | 103 | | 244 |
| | Buildings | | 11 | | 31 |
| | Infrastructure | | 2 | | - |
| | Plant & equipment (incl. major plant & equipment) | | 92 | | 99 |
| | Heritage and cultural assets | | 1 | | 1 |
| | | | | | |
| | | | 208 | | 374 |
| | | | | | |
| | | |
30. | | Investment Properties | | | | |
| | | |
| | Land and buildings at independent valuation | | 1,404 | | 1,184 |
| | | |
| | Movements in Investment Properties | | | | |
| | | |
| | Carrying amount at beginning of year | | 1,184 | | 972 |
| | Acquisitions | | 1 | | 1 |
| | Disposals | | (92) | | (5) |
| | Transfers | | 7 | | 92 |
| | Net revaluations increments/(decrements) | | 304 | | 133 |
| | Impairment loss | | - | | (9) |
| | | | | | |
| | Carrying amount at end of year | | 1,404 | | 1,184 |
| | | | | | |
| | | |
| | The following revenues and expenses are recognised in the Operating Statement in relation to
investment properties: | | | | |
| | | |
| | Rental income | | 64 | | 55 |
| | Operating expenses arising from property generating an income | | (13) | | (13) |
| | | | | | |
| | | | 51 | | 42 |
| | | | | | |
| | | |
31. | | Biological Assets | | | | |
| | | |
| | Self-generating and regenerating assets: | | | | |
| | Livestock | | 7 | | 8 |
| | Plants | | 1,170 | | 1,175 |
| | | | | | |
| | | | 1,177 | | 1,183 |
| | | | | | |
| | Movement in biological assets: | | | | |
| | | |
| | Carrying amount at beginning of year | | 1,183 | | 1,092 |
| | Gain from changes in fair value | | 67 | | 186 |
| | Acquisitions | | 1 | | - |
| | Disposals | | (74) | | (95) |
| | | | | | |
| | Carrying amount at end of year | | 1,177 | | 1,183 |
| | | | | | |
| | |
| Audited Consolidated Financial Statements 2008–09 – Government of Queensland | | 7-42 |
Notes to the Financial Statements
| | | | | | |
| | | | | 2009 | | 2008 |
| | | | | $M | | $M |
32. | | Other Non-Financial Assets | | | | |
| | | |
| | Current | | | | |
| | Prepayments | | 331 | | 323 |
| | Other | | 60 | | 75 |
| | | | | | |
| | | | 391 | | 398 |
| | | | | | |
| | Non-Current | | | | |
| | Prepayments | | 58 | | 39 |
| | Other | | 57 | | 69 |
| | | | | | |
| | | | 116 | | 108 |
| | | | | | |
| | | | | | |
| | | | | | |
| | | | 506 | | 506 |
| | | | | | |
| | | |
33. | | Restricted Assets | | | | |
| | | |
| | A number of assets included in the consolidated financial statements are classified as restricted assets because their use is wholly or partially restricted by externally imposed requirements. These assets include: | | | | |
| | | |
| | Grants and donations to further medical research in specified areas | | 81 | | 76 |
| | Cash, property, plant and equipment to be used for specific purposes | | 29 | | 35 |
| | Intra regional settlements residue held pursuant to national electricity markets arrangements | | 19 | | 81 |
| | | | | | |
| | | | 129 | | 192 |
| | | | | | |
| | |
| Audited Consolidated Financial Statements 2008–09 – Government of Queensland | | 7-43 |
Notes to the Financial Statements
34. Property, Plant and Equipment
| | | | | | | | | | | | |
| | | Gross | | Accumulated | | Written Down Value |
| | | | | Depreciation/Impairment | | |
| | | 2009 | | 2008 | | 2009 | | 2008 | | 2009 | | 2008 |
| | | $M | | $M | | $M | | $M | | $M | | $M |
Land | | 89,959 | | 83,757 | | (30) | | (8) | | 89,929 | | 83,749 |
Buildings | | 41,690 | | 40,086 | | (13,579) | | (13,091) | | 28,111 | | 26,995 |
Infrastructure | | 110,531 | | 114,094 | | (26,774) | | (29,679) | | 83,757 | | 84,415 |
Major plant and equipment | | 950 | | 1,031 | | (267) | | (284) | | 683 | | 747 |
Heritage and cultural assets | | 1,310 | | 1,267 | | (106) | | (99) | | 1,204 | | 1,168 |
Plant and equipment | | 10,473 | | 8,413 | | (3,640) | | (3,279) | | 6,833 | | 5,134 |
Leased plant and equipment | | 3,385 | | 3,366 | | (1,077) | | (967) | | 2,307 | | 2,399 |
Capital work in progress | | 12,357 | | 11,309 | | - | | - | | 12,357 | | 11,309 |
| | | | | | | | | | | | |
| | 270,655 | | 263,323 | | (45,473) | | (47,407) | | 225,181 | | 215,916 |
| | | | | | | | | | | | |
| | Reconciliations | of the carrying amount for each class of property, plant and equipment are set out below: |
| | | | | | | | | | | | | | | | |
| | | Land | | Buildings | | Infrastructure | | Major Plant and Equipment |
| | | 2009 | | 2008 | | 2009 | | 2008 | | 2009 | | 2008 | | 2009 | | 2008 |
| | | $M | | $M | | $M | | $M | | $M | | $M | | $M | | $M |
| | | | | | | | |
Carrying amount at beginning of year 1 | | 83,749 | | 76,189 | | 26,996 | | 25,088 | | 84,415 | | 48,835 | | 747 | | 298 |
Acquisitions | | 718 | | 595 | | 463 | | 616 | | 3,577 | | 1,620 | | 148 | | 177 |
Disposals | | (109) | | (114) | | (122) | | (36) | | (530) | | (270) | | (93) | | (99) |
Revaluation increments/(decrements) | | 4,664 | | 7,257 | | 390 | | 1,117 | | (7,085) | | 29,003 | | 32 | | 25 |
Impairment (losses)/reversals | | (116) | | (13) | | (38) | | (53) | | (947) | | (47) | | - | | - |
Depreciation and amortisation | | - | | - | | (940) | | (858) | | (2,275) | | (1,602) | | (92) | | (89) |
Net asset transfers | | 1,023 | | (165) | | 1,362 | | 1,121 | | 6,602 | | 6,876 | | (59) | | 435 |
| | | | | | | | | | | | | | | | |
Carrying amount at end of year | | 89,929 | | 83,749 | | 28,111 | | 26,995 | | 83,757 | | 84,415 | | 683 | | 747 |
| | | | | | | | | | | | | | | | |
| | |
| Audited Consolidated Financial Statements 2008–09 – Government of Queensland | | 7-44 |
Notes to the Financial Statements
34. Property, Plant and Equipment continued
| | | | | | | | | | | | | | | | |
| | | Heritage and Cultural | | | | Leased Plant and | | | | |
| | | Assets | | Plant and Equipment | | Equipment | | Capital Work in Progress |
| | | 2009 | | 2008 | | 2009 | | 2008 | | 2009 | | 2008 | | 2009 | | 2008 |
| | | $M | | $M | | $M | | $M | | $M | | $M | | $M | | $M |
| | | | | | | | |
Carrying amount at beginning of year | | 1,168 | | 831 | | 5,134 | | 4,493 | | 2,399 | | 2,245 | | 11,309 | | 10,057 |
Acquisitions | | 6 | | 4 | | 766 | | 1,024 | | 26 | | 184 | | 11,290 | | 10,558 |
Disposals | | - | | - | | (95) | | (72) | | (7) | | (2) | | (88) | | (110) |
Revaluation increments/(decrements) | | 2 | | 290 | | 309 | | 31 | | 139 | | 3 | | - | | - |
Impairment (losses)/reversals | | - | | - | | 9 | | (20) | | (1) | | (12) | | - | | - |
Depreciation and amortisation | | (3) | | (3) | | (781) | | (664) | | (128) | | (146) | | - | | - |
Net asset transfers | | 30 | | 46 | | 1,491 | | 342 | | (120) | | 127 | | (10,154) | | (9,196) |
| | | | | | | | | | | | | | | | |
Carrying amount at end of year | | 1,203 | | 1,168 | | 6,833 | | 5,134 | | 2,308 | | 2,399 | | 12,357 | | 11,309 |
| | | | | | | | | | | | | | | | |
| | | | | | | |
| | | | | | | | | | | | | | | Total |
| | | | | | | | | | | | | | | 2009 | | 2008 |
| | | | | | | | | | | | | | | $M | | $M |
| | | | | | | | |
Carrying amount at beginning of year 1 | | | | | | | | | | | | | | 215,917 | | 168,036 |
Acquisitions | | | | | | | | | | | | | | 16,994 | | 14,778 |
Disposals | | | | | | | | | | | | | | (1,044) | | (703) |
Revaluation increments/(decrements) | | | | | | | | | | | | | | (1,549) | | 37,726 |
Impairment (losses)/reversals | | | | | | | | | | | | | | (1,093) | | (145) |
Depreciation and amortisation | | | | | | | | | | | | | | (4,219) | | (3,362) |
Net asset transfers | | | | | | | | | | | | | | 175 | �� | (414) |
| | | | | | | | | | | | | | | | |
Carrying amount at end of year | | | | | | | | | | | | | | 225,181 | | 215,916 |
| | | | | | | | | | | | | | | | |
| | 1. | Carrying amount at beginning of year includes an increase in land of $38.589 billion due to the election by the State to recognise land under roads acquired on or before 30 June 2008 at fair value in accordance with AASB 1051 Land Under Roads. Land under roads acquired on or before 1 July 2008 has been initially recognised at 30 June 2008 at fair value in accordance with AASB 1051 Land Under Roads. Land under roads acquired from 1 July 2008 has been initially recognised at cost and thereafter at fair value in accordance with AASB 116 Property Plant and Equipment. At reporting date the aggregate value of all land under roads is $40.370 billion. |
| | |
| Audited Consolidated Financial Statements 2008–09 – Government of Queensland | | 7-45 |
Notes to the Financial Statements
35. Intangibles
| | | | | | | | | | | | | | | | |
| | | Cost | | Valuation | | Accumulated | | Written Down Value |
| | | | | | | Amortisation | | |
| | | 2009 | | 2008 | | 2009 | | 2008 | | 2009 | | 2008 | | 2009 | | 2008 |
| | | $M | | $M | | $M | | $M | | $M | | $M | | $M | | $M |
Software development | | 1,173 | | 1,072 | | - | | - | | (514) | | (536) | | 659 | | 536 |
Purchased software | | 642 | | 645 | | 32 | | 14 | | (472) | | (471) | | 202 | | 188 |
Licences and rights | | 13 | | 15 | | 56 | | 57 | | (13) | | (15) | | 56 | | 57 |
Goodwill | | 137 | | 144 | | - | | - | | - | | - | | 137 | | 144 |
Other | | 134 | | 123 | | - | | - | | (15) | | (13) | | 119 | | 110 |
| | | | | | | | | | | | | | | | |
| | 2,099 | | 1,999 | | 88 | | 71 | | (1,014) | | (1,035) | | 1,173 | | 1,035 |
| | | | | | | | | | | | | | | | |
| | | | |
| | | Software | | Licences and Rights | | Goodwill | | Other |
| | | 2009 | | 2008 | | 2009 | | 2008 | | 2009 | | 2008 | | 2009 | | 2008 |
| | | $M | | $M | | $M | | $M | | $M | | $M | | $M | | $M |
Carrying amount at beginning of year | | 724 | | 809 | | 58 | | 56 | | 144 | | 85 | | 110 | | 19 |
Acquisitions | | 32 | | 36 | | - | | 5 | | - | | 65 | | 12 | | 23 |
Acquisitions through internal development | | 254 | | 160 | | - | | - | | - | | - | | - | | - |
Disposals | | (9) | | (91) | | (2) | | - | | - | | - | | - | | - |
Revaluation increments/(decrements) | | 2 | | 2 | | - | | - | | - | | - | | - | | - |
Impairment (losses)/reversals | | (1) | | (1) | | - | | (1) | | - | | (1) | | - | | - |
Amortisation | | (153) | | (143) | | - | | (2) | | - | | - | | (3) | | (4) |
Net asset transfers | | 12 | | (48) | | - | | - | | (7) | | (5) | | - | | 72 |
| | | | | | | | | | | | | | | | |
Carrying amount at end of year | | 861 | | 724 | | 56 | | 58 | | 137 | | 144 | | 119 | | 110 |
| | | | | | | | | | | | | | | | |
| | | | | | | |
| | | | | | | | | | | | | | | Total |
| | | | | | | | | | | | | | | 2009 | | 2008 |
| | | | | | | | | | | | | | | $M | | $M |
Carrying amount at beginning of year | | | | | | | | | | | | | | 1,036 | | 969 |
Acquisitions | | | | | | | | | | | | | | 44 | | 129 |
Acquisitions through internal development | | | | | | | | | | | | | | 254 | | 160 |
Disposals | | | | | | | | | | | | | | (11) | | (91) |
Revaluation increments/(decrements) | | | | | | | | | | | | | | 2 | | 2 |
Impairment (losses)/reversals | | | | | | | | | | | | | | (1) | | (3) |
Amortisation | | | | | | | | | | | | | | (156) | | (149) |
Net asset transfers | | | | | | | | | | | | | | 5 | | 19 |
| | | | | | | | | | | | | | | | |
Carrying amount at end of year | | | | | | | | | | | | | | 1,173 | | 1,035 |
| | | | | | | | | | | | | | | | |
| | |
| Audited Consolidated Financial Statements 2008–09 – Government of Queensland | | 7-46 |
Notes to the Financial Statements
| | | | | | |
| | | | | 2009 $M | | 2008 $M |
36. | | Payables | | | | |
| | | |
| | Current | | | | |
| | Trade creditors | | 3,544 | | 3,206 |
| | Grants and other contributions | | 149 | | 141 |
| | Interest | | 5 | | 5 |
| | GST payable | | 150 | | 157 |
| | Other payables | | 1,016 | | 870 |
| | | | | | |
| | | | 4,864 | | 4,380 |
| | | | | | |
| | | |
| | Non-Current | | | | |
| | Trade creditors | | 2 | | 1 |
| | Other payables | | 6 | | 5 |
| | | | | | |
| | | | 7 | | 6 |
| | | | | | |
| | | | | | |
| | | | | | |
| | | | 4,871 | | 4,386 |
| | | | | | |
| | | |
37. | | Employee Benefit Obligations | | | | |
| | | |
| | Superannuation liability | | | | |
| | Current | | | | |
| | Superannuation (refer Note 51) | | 991 | | 1,035 |
| | Judges’ pensions (refer Note 51) | | 12 | | 11 |
| | | | | | |
| | | | 1,003 | | 1,046 |
| | | | | | |
| | Non-Current | | | | |
| | Superannuation (refer Note 51) | | 22,138 | | 20,374 |
| | Judges’ pensions (refer Note 51) | | 413 | | 440 |
| | | | | | |
| | | | 22,551 | | 20,814 |
| | | | | | |
| | | | | | |
| | | | | | |
| | | | 23,554 | | 21,860 |
| | | | | | |
| | Other employee benefits | | | | |
| | Current | | | | |
| | Salary and wages payable | | 597 | | 522 |
| | Annual leave | | 1,207 | | 1,124 |
| | Long service leave | | 465 | | 350 |
| | Other employee entitlements | | 137 | | 125 |
| | | | | | |
| | | | 2,406 | | 2,121 |
| | | | | | |
| | Non-Current | | | | |
| | Annual leave | | 153 | | 152 |
| | Long service leave | | 2,475 | | 2,270 |
| | Other employee entitlement | | 77 | | 82 |
| | | | | | |
| | | | 2,705 | | 2,503 |
| | | | | | |
| | | | | | |
| | | | | | |
| | | | 5,111 | | 4,624 |
| | | | | | |
38. | | Deposit Held | | | | |
| | | |
| | Current | | | | |
| | Deposits at fair value through profit and loss | | 3,667 | | 3,770 |
| | Other deposits at amortised cost | | - | | 1 |
| | | | | | |
| | | | 3,667 | | 3,771 |
| | | | | | |
| | Non-Current | | | | |
| | | | | | |
| | Interest bearing security deposits | | 4 | | 3 |
| | | | | | |
| | | | | | |
| | | | | | |
| | | | 3,671 | | 3,774 |
| | | | | | |
| | |
| Audited Consolidated Financial Statements 2008–09 – Government of Queensland | | 7-47 |
Notes to the Financial Statements
| | | | | | | | | | | | |
| | | | | | | | | | | 2009 $M | | 2008 $M |
39. | | Borrowings and Advances | | | | | | | | | | |
| | | | | | |
| | Advances Received | | | | | | | | | | |
| | Current | | | | | | | | | | |
| | State debt to the Commonwealth | | | | | | | | 22 | | 21 |
| | | | | | |
| | Non-Current | | | | | | | | | | |
| | State debt to the Commonwealth | | | | | | | | 462 | | 480 |
| | | | | | | | | | | | |
| | | | | | | | | | | | |
| | | | | | | | | | 484 | | 501 |
| | | | | | | | | | | | |
| | Borrowings | | | | | | | | | | |
| | Current | | | | | | | | | | |
| | Finance lease liability (refer note 45) | | | | | | | | 2 | | 2 |
| | Loans - other | | | | | | | | 393 | | 320 |
| | | | | | | | | | | | |
| | | | | | | | | | 395 | | 322 |
| | Non-Current | | | | | | | | | | |
| | Finance lease liability (refer note 45) | | | | | | | | 240 | | 220 |
| | Loans - other | | | | | | | | 4 | | 4 |
| | | | | | | | | | | | |
| | | | | | | | | | 243 | | 225 |
| | | | | | | | | | | | |
| | | | | | | | | | | | |
| | | | | | | | | | 638 | | 546 |
| | | | | | | | | | | | |
| | | | | | |
| | Lease liabilities are effectively secured as the rights to the leased assets revert to the lessor in the event of a default. Interest on finance leases is recognised as an expense as it accrues. No interest has been capitalised during the current or comparative period. | | | | | | | | | | |
| | | | | | |
40. | | Securities and derivatives | | | | | | | | | | |
| | | | | | |
| | | Current | | | | | | | | | | |
| | Government securities issued | | | | | | | | 19,453 | | 3,533 |
| | Derivatives | | | | | | | | | | |
| | Derivatives - cash flow hedges | | | | | | | | 3 | | 432 |
| | Other derivatives | | | | | | | | 652 | | 345 |
| | | | | | | | | | | | |
| | | | | | | | | | 20,108 | | 4,310 |
| | | | | | | | | | | | |
| | Non-Current | | | | | | | | | | |
| | Government Securities issued | | | | | | | | 43,170 | | 37,193 |
| | Derivatives | | | | | | | | | | |
| | Derivatives - cash flow hedges | | | | | | | | 33 | | 320 |
| | Other derivatives | | | | | | | | 139 | | 330 |
| | | | | | | | | | | | |
| | | | | | | | | | 43,342 | | 37,843 |
| | | | | | | | | | | | |
| | | | | | | | | | | | |
| | | | | | | | | | | | |
| | | | | | | | | | 63,450 | | 42,153 |
| | | | | | | | | | | | |
| 41. | | Contractual Maturity Analysis of Financial Liabilities | | | | | | | | | | |
| | |
| | The table below sets out the contractual cash flows of the State’s financial liabilities. It is calculated based on undiscounted cash flows relating to the repayment of principal and interest amounts outstanding at balance date. | | |
| | | | | | |
| | | As at 30 June 2009 | | 1 Year or | | 1 to 5 | | Over 5 | | Total | | Carrying |
| | | | | Less | | Years | | Years | | | | Value |
| | | | | $M | | $M | | $M | | $M | | $M |
| | | | | | |
| | Payables | | 6,803 | | 238 | | - | | 7,040 | | 7,040 |
| | Government securities and other loans at fair value | | 23,440 | | 31,238 | | 26,841 | | 81,519 | | 66,291 |
| | Liabilities at amortised cost | | 392 | | 118 | | 123 | | 634 | | 642 |
| | Commonwealth borrowings | | 22 | | 104 | | 357 | | 484 | | 484 |
| | Derivatives | | 829 | | 247 | | (267) | | 809 | | 827 |
| | | | |
| | | | 31,487 | | 31,944 | | 27,055 | | 90,486 | | 75,283 |
| | | | | | | | | | | | |
| | |
| Audited Consolidated Financial Statements 2008–09 – Government of Queensland | | 7-48 |
Notes to the Financial Statements
| | | | | | | | | | | | |
41. | | Contractual Maturity Analysis of Financial Liabilities continued | | | | | | | | | | |
| | | | | | |
| | | As at 30 June 2008 | | 1 Year or | | 1 to 5 | | Over 5 | | Total | | Carrying |
| | | | | Less | | Years | | Years | | | | Value |
| | | | | $M | | $M | | $M | | $M | | $M |
| | | | | | |
| | Payables | | 6,146 | | 239 | | - | | 6,386 | | 6,386 |
| | Government securities and other loans | | | | | | | | - | | |
| | at fair value | | 7,691 | | 28,310 | | 22,100 | | 58,100 | | 44,499 |
| | Liabilities at amortised cost | | 314 | | 107 | | 115 | | 536 | | 549 |
| | Commonwealth borrowings | | 21 | | 88 | | 392 | | 501 | | 501 |
| | Derivatives | | 835 | | 223 | | 41 | | 1,099 | | 1,426 |
| | | | |
| | | | 15,008 | | 28,966 | | 22,648 | | 66,622 | | 53,361 |
| | | | | | | | | | | | |
| | | | |
| | | The difference between the carrying amounts of financial liabilities held at fair value through profit or loss (other than
derivatives) and the amounts contractually required to be paid at maturity to the holder of the obligation is set out below. | | | | 2009 $M | | 2008 $M |
| | | | | | |
| | Fair value | | | | | | | | 66,291 | | 44,499 |
| | Less: Repayment at maturity | | | | | | | | 64,892 | | 45,567 |
| | | | | | | | | | | | |
| | Difference | | | | | | | | 1,399 | | (1,068) |
| | | | | | | | | | | | |
| | | | | | |
42. | | Provisions | | | | | | | | | | |
| | | | | | |
| | Current | | | | | | | | | | |
| | Outstanding claims: (1) | | | | | | | | | | |
| | HIH/FAI | | | | | | | | 13 | | 13 |
| | Workers’ compensation | | | | | | | | 977 | | 803 |
| | Other | | | | | | | | 168 | | 172 |
| | Onerous contracts | | | | | | | | 25 | | 59 |
| | Queensland Government Insurance Fund (2) | | | | | | | | 106 | | 84 |
| | Other | | | | | | | | 36 | | 51 |
| | | | | | | | | | | | |
| | | | | | | | | | 1,325 | | 1,182 |
| | | | | | | | | | | | |
| | Non-Current | | | | | | | | | | |
| | Outstanding claims: (1) | | | | | | | | | | |
| | HIH/FAI | | | | | | | | 34 | | 34 |
| | Workers’ compensation | | | | | | | | 1,310 | | 1,029 |
| | Other | | | | | | | | 280 | | 306 |
| | Onerous contracts | | | | | | | | 75 | | 120 |
| | Queensland Government Insurance Fund (2) | | | | | | | | 387 | | 425 |
| | Other | | | | | | | | 440 | | 286 |
| | | | | | | | | | | | |
| | | | | | | | | | 2,526 | | 2,200 |
| | | | | | | | | | | | |
| | | | | | | | | | | | |
| | | | | | | | | | | | |
| | | | | | | | | | 3,851 | | 3,382 |
| | | | | | | | | | | | |
| | | | |
| | (1) The liability for outstanding claims is measured as the present value of expected future payments, the majority of which are actuarially assessed. The liability includes outstanding claim recoveries and reinsurance receivables of $124 million (2008, $113 million). (2) The Queensland Government Insurance Fund (QGIF) is a centrally managed self-insurance scheme mainly covering property and medical and other liability claims for whole-of-Government. An actuarial assessment of the scheme was undertaken as at 30 June 2009. | | | | | | |
| | | | | | |
| | | Movements in Provisions | | | | Outstanding | | QGIF | | Other | | Total |
| | | | | | | Claims | | | | Provisions | | |
| | | | | | | 2009 $M | | 2009 $M | | 2009 $M | | 2009 $M |
| | | | | | |
| | Carrying amount at beginning of year | | | | 2,356 | | 509 | | 517 | | 3,382 |
| | Additional provisions recognised | | | | 1,438 | | 129 | | 194 | | 1,761 |
| | Reductions in provisions and payments | | | | (1,271) | | (98) | | (50) | | (1,419) |
| | Change from remeasurement and discounting adjustments | | | | 258 | | (47) | | (84) | | 127 |
| | | | | | | | | | | | |
| | Carrying amount at end of year | | | | 2,781 | | 493 | | 577 | | 3,851 |
| | | | | | | | | | | | |
| | |
| Audited Consolidated Financial Statements 2008–09 – Government of Queensland | | 7-49 |
Notes to the Financial Statements
| | | | | | |
| | | | | 2009 | | 2008 |
| | | | | $M | | $M |
43. | | Other Liabilities | | | | |
| | | |
| | Current | | | | |
| | Unearned revenue | | 725 | | 756 |
| | Environmental surrender obligations (RECs, GECs, NGACs) | | 44 | | 49 |
| | Other | | 115 | | 176 |
| | | | | | |
| | | | 884 | | 981 |
| | | | | | |
| | Non-Current | | | | |
| | Unearned revenue | | 506 | | 572 |
| | Other | | 13 | | 14 |
| | | | | | |
| | | | 519 | | 585 |
| | | | | | |
| | | |
| | | | | | |
| | | | 1,404 | | 1,566 |
| | | | | | |
44. | | Cash Flows | | | | |
| | | |
(a) | | Reconciliation of Operating Result to Net Cash Flows from Operating Activities | | | | |
| | | |
| | Operating Result | | (6,984) | | (779) |
| | | |
| | Non-Cash Movements (from continuing and discontinued operations): | | | | |
| | Depreciation and amortisation | | 4,376 | | 3,513 |
| | Net (gain)/loss on disposal/revaluation of non-current assets | | 3 | | (370) |
| | Bad debt provision | | 32 | | 61 |
| | Equity accounting loss | | 2 | | 3 |
| | Unrealised net (gain)/loss on borrowings | | 4,239 | | 19 |
| | Other | | 312 | | (113) |
| | | |
| | (Increase)/decrease in receivables | | (194) | | 49 |
| | (Increase)/decrease in inventories | | (282) | | (155) |
| | (Increase)/decrease in prepayment and other assets | | 2 | | 32 |
| | Increase/(decrease) in creditors | | 382 | | 179 |
| | Increase/(decrease) in provisions | | 1,830 | | 633 |
| | Increase/(decrease) in other liabilities | | (141) | | (397) |
| | | | | | |
| | Total Non-Cash Movements | | 10,561 | | 3,454 |
| | | |
| | | | | | |
| | Cash Flows from Operating Activities | | 3,577 | | 2,675 |
| | | | | | |
| | | |
(b) | | Cash Flows Presented on a Net Basis | | | | |
| | |
| | Cash flows arising from the following activities are presented on a net basis in the Cash Flow Statement: | | |
| | | |
| | - loan advances to and redemptions from borrowing authorities; - receipt and withdrawal of client deposits; and - money market and other deposits. | | | | |
| | | |
45. | | Expenditure Commitments | | | | |
| | |
| | As at 30 June 2009, State Government entities had entered into the following capital and non-capital expenditure commitments, lease commitments and grant and subsidy commitments with non-public sector entities. | | |
| | |
| | Other than obligations under finance leases, where substantially all the risks and benefits incidental to ownership of the leased assets are transferred to the lessee, the following commitments have not been recognised as liabilities in the Balance Sheet. | | |
| | |
| Audited Consolidated Financial Statements 2008–09 – Government of Queensland | | 7-50 |
Notes to the Financial Statements
| | | | | | |
| | | | | 2009 $M | | 2008 $M |
| | | |
45. | | Expenditure Commitments continued | | | | |
| | | |
| | Capital Expenditure Commitments | | | | |
| | Material classes of capital expenditure commitments inclusive of anticipated GST, contracted for at reporting date but not recognised in the accounts are payable as follows: | | | | |
| | | |
| | Not later than 1 year | | 7,106 | | 7,989 |
| | Later than 1 year but not later than 5 years | | 5,672 | | 6,487 |
| | Later than 5 years | | 25 | | 61 |
| | | | | | |
| | | | 12,803 | | 14,537 |
| | | | | | |
| | Non-Capital Expenditure Commitments | | | | |
| | | |
| | Not later than 1 year | | 1,125 | | 1,250 |
| | Later than 1 year but not later than 5 years | | 885 | | 1,523 |
| | Later than 5 years | | 818 | | 1,026 |
| | | | | | |
| | | | 2,828 | | 3,799 |
| | | | | | |
| | Operating Lease Commitments | | | | |
| | | |
| | Not later than 1 year | | 436 | | 349 |
| | Later than 1 year but not later than 5 years | | 1,020 | | 761 |
| | Later than 5 years | | 368 | | 302 |
| | | | | | |
| | | | 1,824 | | 1,412 |
| | | | | | |
| | | |
| | Operating leases are entered into as a means of acquiring access to office accommodation and storage facilities. Lease payments are generally fixed, but with inflation escalation clauses on which contingent rentals are determined. | | | | |
| | | |
| | No renewal or purchase options exist in relation to operating leases and no operating leases contain restrictions on financing or other leasing activities. | | | | |
| | | |
| | Finance Lease Commitments | | | | |
| | | |
| | Not later than 1 year | | 26 �� | | 24 |
| | Later than 1 year but not later than 5 years | | 120 | | 104 |
| | Later than 5 years | | 666 | | 639 |
| | | | | | |
| | Total minimum lease payments | | 812 | | 767 |
| | Future finance charges | | (570) | | (545) |
| | | | | | |
| | Total lease liabilities | | 242 | | 222 |
| | | | | | |
| | | |
| | Current lease liabilities (refer Note 39) | | 2 | | 2 |
| | Non-current lease liabilities (refer Note 39) | | 240 | | 220 |
| | | | | | |
| | | | 242 | | 222 |
| | | | | | |
| | | |
| | Finance leases are entered into as a means of funding the acquisition of certain plant and equipment. Lease payments are generally fixed. No leases have escalation clauses other than in the event of payment default. A small number of leases have renewal or purchase options. Where such options exist, they are all exercisable at market prices. | | | | |
| | | |
| | Grant and Subsidy Commitments | | | | |
| | | |
| | Not later than 1 year | | 2,499 | | 2,202 |
| | Later than 1 year but not later than 5 years | | 2,629 | | 2,884 |
| | Later than 5 years | | 38 | | 473 |
| | | | | | |
| | | | 5,166 | | 5,559 |
| | | | | | |
| | |
| Audited Consolidated Financial Statements 2008–09 – Government of Queensland | | 7-51 |
Notes to the Financial Statements
| | | | | | |
| | | | | 2009 $M | | 2008 $M |
46. | | Cash and Other Assets Held in Trust | | | | |
| | | |
| | Various monies were held in trust by State Government agencies at 30 June 2009 and are not included as assets/liabilities in the Balance Sheet. A summary follows of entities holding assets in trust: | | | | |
| | | |
| | QIC Limited | | 39,803 | | 54,575 |
| | The Public Trustee of Queensland | | 1,526 | | 1,544 |
| | Treasury Department | | 17 | | 19 |
| | Other | | 239 | | 165 |
| | | | | | |
| | | | 41,585 | | 56,303 |
| | | | | | |
| | Fees earned by Queensland Government entities for providing trustee services total $9 million (2008, $12 million). | | | | |
| | | |
47. | | Contingent Assets and Liabilities | | | | |
| | | |
| | Contingent assets and liabilities represent items that are not recognised in the Balance Sheet because at balance date: | | | | |
| | | |
| | - there is a possible asset or an obligation arising from past events whose existence will be confirmed by the occurrence or non-occurrence of one or more uncertain future events not wholly within the control of the Government; or - there is a present obligation arising from past events but it is not recognised because it is either not probable that an outflow of resources embodying economic benefits will be required to settle the obligation or the amount of the obligation cannot be measured reliably. | | | | |
| | | |
| | Below are details of the more significant contingent assets and liabilities from a whole-of-Government perspective. Reference should be made to individual agency financial reports for additional information. | | | | |
| | | |
| | Contingent Liabilities – Quantifiable | | | | |
| | | |
| | Nature of Contingency | | | | |
| | | |
| | Guarantees and indemnities | | 5,215 | | 6,057 |
| | QTC – stock loans | | - | | 124 |
| | Other | | 106 | | 83 |
| | | | | | |
| | | | 5,321 | | 6,264 |
| | | | | | |
| | | |
| | Guarantees These mainly comprise guarantees by the State including in respect of borrowings by local governments from the Queensland Treasury Corporation of $2.416 billion (2008, $3.038 billion) and in respect of insurance policies issued by Suncorp Life and Suncorp-Metway Limited of $2.084 billion (2008, $2.478 billion). Guarantees of $320 million (2008, $250 million) were also provided by QTC relating to the trading activities in the national electricity market of subsidiaries of Ergon Energy Corporation Limited, a Queensland Government-owned corporation. Queensland Treasury Corporation (QTC) - Stock Loans In support of an active trading and pricing market for QTC stock, QTC lends stock to various financial institutions on the basis that such loans form part of QTC’s total exposure to the institution concerned. QTC’s stock lending policy ensures that all such transactions are covered by appropriate credit arrangements such as credit limits, cash securities or lodgement of collateral securities. In the event that the financial institutions holding QTC stock default on their repayment obligations, QTC would be required to enter the market and borrow further amounts to cover the default. The risk of this eventuality is considered to be low. At 30 June 2009, no QTC inscribed stock was lent to other financial institutions (2008, $124 million). | | | | |
| | |
| Audited Consolidated Financial Statements 2008–09 – Government of Queensland | | 7-52 |
Notes to the Financial Statements
| 47. | Contingent Assets and Liabilities continued |
Contingent Liabilities - Quantifiable continued
Other
As at 30 June 2009, there are 22 cases (2008, 7 cases) filed with the courts relating to revenue collected by the Office of State Revenue. An estimate of the liability should the outcomes of the above mentioned cases prove unfavourable for the State is $22 million (2008, $7 million).
The redevelopment of Suncorp Stadium and construction of Skilled Park included a number of infrastructure projects external to the stadiums. Works amounting to some $46 million (2008, $46 million) have been identified which may need to be transferred to parties external to the State for nil consideration.
A claim has been made against Western Corridor Recycled Water Pty Ltd by a sub-contractor for damages by reason of wrongful repudiation of the sub-contractor’s Sub Alliance agreement. The maximum exposure of the State to this claim has been assessed as $10 million (2008, $22 million). The State believes this claim will be unsuccessful and as such has not recognised a liability in the accounts.
A claim has been made against Burnett Water Pty Ltd, a wholly owned subsidiary of SunWater Ltd in connection to the original design and subsequent operation of an upstream fish lift and downstream fishway at Paradise Dam. The maximum exposure of the State to this claim is estimated to be $23 million (2008, Nil) including legal fees of the State but excluding costs of the claimant. The State believes this claim will be unsuccessful and as such has not recognised a liability in these financial statements.
Contingent Liabilities - Not Quantifiable
Legal Proceedings and Disputes
A number of legal actions have been brought against the State Government and its agencies. Notification has also been received of a number of other cases that are not yet subject to court action but which may result in subsequent litigation.
Due to the wide variety and nature of the claims and the uncertainty of any potential liability, no value has been attributed to these actions/claims.
Native Title
A number of native title claims that affect the Queensland Government have been filed with the National Native Title Tribunal under the Native Title Act 1993 (Commonwealth). The Native Title Act provides for payment of compensation to native titleholders for a variety of acts that may affect native title.
It is possible that the Government may face future litigation and liability in respect of these and other claims. However, given the subjectivity of the issue, it is inappropriate to attempt to determine the likely success of such claims or to quantify any potential liability.
Securities, Warranties and Guarantees
The State has provided a number of securities, warranties and guarantees in the normal course of business. The amount of any future claims against these securities, warranties and guarantees cannot be reliably estimated.
WorkCover
The Workers’ Compensation and Rehabilitation Act 2003 provides that the State Government guarantees every WorkCover policy or other insurance contract with WorkCover Queensland, a statutory body. Given the nature of this contingency, it is not possible to estimate the liability, if any, due under this heading.
QIC Limited
QIC Limited, in its capacity as trustee is potentially liable for the unsettled liabilities of a number of trusts that it administers. However, under the respective trust deeds the Corporation is entitled to be indemnified out of the assets of the trusts for any losses or outgoings that may be sustained in its role as trustee, provided the trustee has acted within the terms of the trust deeds.
| | |
| Audited Consolidated Financial Statements 2008–09 – Government of Queensland | | 7-53 |
Notes to the Financial Statements
| 47. | Contingent Assets and Liabilities continued |
Contingent Liabilities - Quantifiable continued
QIC Limited continued
The directors have assessed the recoverable amounts of the assets of the trusts and concluded that currently they have excess assets over liabilities.
Funds managed by the corporation in a trustee capacity totalled $40.233 billion at 30 June 2009 (2008, $55.089 billion).
Cross Border Lease Transactions
QTC has assumed responsibility for a significant portion of the transaction risk relating to a number of cross border lease transactions and in certain situations could be liable to make additional payments under the transactions. However, external advice and history to date indicate that there is remote likelihood of these events occurring.
In addition, the Corporation has provided certain guarantees and indemnities to various participants in the cross border lease transactions. Unless exceptional and extreme circumstances arise, it is unlikely that the Corporation will be required to make a significant payment under these guarantees and indemnities.
Tarong North Power Station
QTC has provided a guarantee of certain payment obligations and an irrevocable put option for an additional 50% of the power station exercisable by the option holder under certain circumstances to support the 50% sale of Tarong North Power Station by the Tarong Energy Corporation Limited.
Contaminated Land
The State Government controls certain areas of land that are affected by pollutants. The agencies involved will be obliged to restore these assets to a safe and useable condition in the event that their use changes, for example, when the land is sold. Given its nature, it is not possible to provide an estimate of the potential liability of this exposure.
Financial Assurance Liability Gap for Mining Projects
Financial assurances are required when mining projects are undertaken to cover the rehabilitation liability should a mining leaseholder fail to undertake rehabilitation. The current financial assurance system provides for a discount based on past environmental performance. This has resulted in a gap in the financial assurances held by the State and the potential liability, should a miner default.
The contingent liability would only be recognised as an actual liability in the event that the miner defaults on the conditions of the licence and the State holds insufficient financial assurance to cover the rehabilitation that the State considers necessary. At reporting date it is not possible to determine the extent or timing of any potential financial effect of this responsibility.
The State has been negotiating with the mining industry to reduce the gap by encouraging progressive rehabilitation and by reducing discount rates.
Rehabilitation of Abandoned Mine Sites
The State has a responsibility to rehabilitate abandoned mine sites. At reporting date it is not possible to determine the extent or timing of any potential financial effect that this responsibility may have.
Cost of Greenhouse Gas Emission Permits
The Australian Government is committed to the introduction of the Carbon Pollution Reduction Scheme (CPRS) from 1 July 2011. If the legislation is passed in its current form, entities covered by the scheme will be required to hold permits to cover their greenhouse gas emissions. This will affect the operations of a number of State commercial entities, especially the electricity generation corporations.
| | |
| Audited Consolidated Financial Statements 2008–09 – Government of Queensland | | 7-54 |
Notes to the Financial Statements
| 47. | Contingent Assets and Liabilities continued |
Contingent Liabilities - Not Quantifiable continued
Cost of Greenhouse Gas Emission Permits continued
It is not possible at this time to detail the precise implications of the CPRS as this is dependent on the final design of the scheme as agreed by the Australian Parliament. Publicly released modelling by the Australian Government has indicated that there is a possibility of significant reductions in the asset value of black coal generators which include CS Energy Ltd, Tarong Energy Ltd and Stanwell Corporation Ltd.
The Queensland Government will undertake specific modelling of the impact of the CPRS on Queensland’s energy market, state commercial entities and electricity generator Government owned Corporations when the Australian Government’s CPRS legislation is passed.
Compensation for Infrastructure on Expired Leases
The State issues leases or permits which allow activity such as grazing, tourist resorts, etc. to occur on parks and forestry estates. On the expiry of the lease or permit, the State may be required to pay compensation to the lessee for improvements made to the property over the duration of the lease. The amount of this liability is not quantifiable and it is not expected that it will be known until the expiration of the lease or permit. Leases progressively expire until the year 2045.
Collingwood Park Mine Subsidence
Due to a mine subsidence event that occurred at Collingwood Park on 26 April 2008, the State is providing assistance to property holders including paying for works necessary to stabilise a property and make it safe, repair mining subsidence-related damage where cost-effective to do so and purchasing of properties beyond economic repair or requiring demolition.
Maritime Incident
In March 2009, the Pacific Adventurer was involved in an incident which resulted in oil and ammonium nitrate being discharged into Moreton Bay. A letter of undertaking from the Standard Steamship Owners’ Protection and Indemnity Insurance (Bermuda) Limited on behalf of the owners of the vessel provides for a capped total aggregate liability on all claims relating to the incident. The Department of Transport and Main Roads is not in a position to accurately and reliably measure the clean up costs which may be directly attributable to the Government.
Alleged exposure to lead and other toxins at Mount Isa
The Department of Employment, Economic Development and Innovation has been named as a party to claims served on behalf of claimants alleging personal injuries resulting from exposure to lead and other toxins in Mount Isa. It is not possible to make an estimate of the probability of the outcome or of any liability resulting from the above claims.
Contingent Assets - Quantifiable
Guarantees
The Department of Employment, Economic Development and Innovation holds financial assurances of $1.757 billion (2008, $1.451 billion) for mining projects, to cover rehabilitation should a leaseholder fail to undertake rehabilitation. The department also holds bank guarantees in relation to the Queensland Investment Incentive Scheme (QIIS) grants and other financial support provided to public sector proponents totalling $57 million (2008, $64 million).
WorkCover Queensland holds bank guarantees on behalf of self-insurers totalling $514 million (2008, $501 million).
The QR Group holds bank and insurance company guarantees of $272 million (2008, $264 million).
The Department of Transport and Main Roads holds securities on behalf of contractors in the form of performance guarantees amounting to $119 million (2008, $143 million).
ENERGEX Limited holds bank guarantees totalling $46 million (2008, $40 million) from customers relating to subdivision works and the construction of capital assets for those customers and procurement guarantees from suppliers.
| | |
| Audited Consolidated Financial Statements 2008–09 – Government of Queensland | | 7-55 |
Notes to the Financial Statements
| 47. | Contingent Assets and Liabilities continued |
Contingent Assets - Quantifiable continued
The Department of Environment and Resource Management holds bank guarantees totalling $70 million (2008, $21 million) as financial security to ensure compliance with various acts, environmental management activities, vegetation management development applications and other contracts and agreements.
Ergon Energy Corporation Ltd holds bank guarantees from customers totalling $138 million (2008, $165 million) relating to the construction of capital assets for energy customers.
Translink holds bank guarantees for performance under specific contracts totalling $10 million.
Construction Industry Skills Centre Pty Ltd
A non-recoverable loan of $11 million paid to Construction Industry Skills Centre Pty Ltd is repayable to the State Government in circumstances contingent on the winding up of the company and related trust.
Ports Corporation of Queensland Ltd
Ports Corporation of Queensland Ltd holds a number of guarantees for security over defects in construction contracts and for future liabilities of port operators.
FAI General Insurance Company Limited Monies
On 15 March 2001 FAI General Insurance Company Limited was placed into provisional liquidation. The Nominal Defendant has by law become entitled to monies arising from Reinsurance Treaties held by FAI General Insurance Company Limited. While there has been no diminution in the legal standing of the Nominal Defendant to these reinsurance monies, it has been recognised that the actual receipt of these funds may be protracted. As a consequence and out of prudence, it has been decided not to recognise these monies as a current receivable.
QIC Limited
An insurance claim is being pursued in relation to a loss incurred as a result of a trading irregularity by QIC Limited. The outcome of this claim is uncertain.
Gainshare arrangements
In relation to a number of drought response projects currently being undertaken by the State, an adjustment to the final fee payable to alliance contractors may be applied based on measured cost performance of individual projects.
| 48. | Post Balance Date Events |
Purchase of Tarong North Power Station
On 10 September 2009, TN Power Pty Limited, a subsidiary of Tarong Energy Corporation Limited, signed an agreement to acquire the remaining 50 percent share of Tarong North Power Station not already owned. Final settlement of the transaction is expected by the end of October 2009. Full ownership of the power station will provide financial and operations benefits to the State.
| 49. | Defeased Cross Border Leases |
In prior years, the State has entered into a number of cross border leases in conjunction with Queensland Treasury Corporation. In accordance with AASB 117 Leases, the leases are treated as finance leases, the leased assets being amortised over the estimated useful lives of the assets. The entities which have entered into this type of arrangement are detailed below:
In the 2000-01 financial year, the Queensland Electricity Transmission Corporation Limited, trading as Powerlink Queensland, entered into a structured financing arrangement involving the sale and subsequent lease-back of supply system assets. The arrangement, which is a USA cross border lease, represents the sale/lease-back of Powerlink Queensland’s regulated transmission assets, with the date of expiry being 2 January 2027.
| | |
| Audited Consolidated Financial Statements 2008–09 – Government of Queensland | | 7-56 |
Notes to the Financial Statements
| 49. | Defeased Cross Border Leases continued |
In the past, QR has entered into a series of structured financing arrangements involving the sale and subsequent lease-back of assets. QR accounts for cross border leases on a basis that reflects the substance of the transactions, being to record a leased asset and to only recognise in the accounts the resulting changes in cash flows. Where it is necessary under the cross border lease provisions to substitute existing owned assets for damaged or disposed leased assets or to terminate part or all of a lease and there is a difference between the value of the owned asset and the acquisition or termination cost of the leased asset, QR nets this amount off in the Operating Statement to ensure the leased asset is recorded at fair value.
The Stanwell power station is subject to cross border leases that were entered into in 1995. There is no lease liability as future lease payments were prepaid at the commencement of the lease.
| 50. | Additional Financial Instruments Disclosure |
Financial Risk Management
The State’s principal financial instruments comprise of:
Cash assets;
Receivables and loans;
Term deposits;
Investments in equities and managed investment schemes;
Debt securities;
Payables;
Borrowings;
Finance lease payables; and
Derivatives.
The main purpose in holding financial instruments is to prudentially manage the State financial risks within government policy parameters.
The carrying amounts of the GGS financial assets and financial liabilities by category are provided below.
Carrying amounts of financial instruments by category
| | | | |
| | | 2009 | | 2008 |
| | | $M | | $M |
| | |
Financial assets | | | | |
Cash and deposits | | 1,055 | | 1,186 |
Receivables and loans | | 7,756 | | 8,245 |
Fair value through profit and loss (at initial recognition) | | 51,002 | | 45,073 |
Fair value through profit and loss (held for trading) | | 420 | | 200 |
Held to maturity | | 29 | | 11 |
Available-for-sale investments | | 295 | | 505 |
| | | | |
| | 60,558 | | 55,221 |
| | | | |
Financial liabilities | | | | |
At fair value through profit and loss (at initial recognition) | | 66,760 | | 45,718 |
At fair value through profit and loss (held for trading) | | 358 | | 207 |
At amortised cost | | 8,165 | | 7,436 |
| | | | |
| | 75,283 | | 53,361 |
| | | | |
Net gains/(losses) on available for sale investments recognised in equity amount to $4 million at 30 June 2009 (2008, $10 million). $171 million (2008, $276 million) was removed from equity and recognised in Operating Statement for the period. Refer Note 15.
The State’s activities expose it to a variety of financial risks, such as market risk (including interest rate risk, foreign currency risk and price risk), credit risk and liquidity risk. The State’s overall risk management program focuses on the unpredictability of financial markets and seeks to minimise potential adverse effects. The State uses certain derivative instruments such as forward exchange contracts and cross currency swaps to hedge risk exposures.
Risk management strategies specific to particular items recognised in the State’s consolidated financial statements are included in the accounting policies relating to that item.
| | |
| Audited Consolidated Financial Statements 2008–09 – Government of Queensland | | 7-57 |
Notes to the Financial Statements
| 50. | Additional Financial Instruments Disclosure continued |
Derivative Financial Instruments
The State, through its controlled entities, enters into derivative financial instruments in the normal course of business in order to hedge exposures to movements in interest rates, foreign currency exchange rates and commodity prices. They may be used to hedge exposure to fluctuations in anticipated commitments, putting in place either long term floating rate funding or long term fixed rate funding. Speculative contracts are also entered into for the purposes of profiting from short term movements in the electricity derivative forward market.
Instruments used by the State include the following:
Cash flow hedges
Electricity derivatives (mostly price swaps and futures) are used to protect against movements in the price of electricity. The contracts are recognised at trade date and settled net, with cash flows expected within three years.
Forward exchange contracts are entered into to protect against movements in foreign currencies. These transactions relate to contracted purchases of components used in capital investments and capital equipment denominated in foreign currencies and revenue from exports. Contracts cover up to three years and are settled on a net basis.
Interest rate swaps are used to protect interest rate movements on borrowings. These swaps are timed to expire as each loan repayment falls due. Contracts are settled on a net basis each 90 days.
Commodity swaps are used to hedge against price fluctuations of commodities, such as diesel fuel.
Derivatives which do not qualify for hedge accounting
Certain derivatives do not qualify for hedge accounting as they are held for trading or not designated as hedges. These instruments typically include electricity derivatives such as swaps, caps and options. Interest rate swaps, forward rate agreements and credit default swaps are also used to hedge exposure to interest rate movements, foreign currency and credit risks but are not hedge accounted.
The portion of the gain or loss on the hedging instrument that is determined to be an effective hedge is recognised directly in equity. When the cash flows occur, the State adjusts the initial measurement of the component recognised in the Balance Sheet by the amount deferred in equity.
For the year ended 30 June 2009:
| | - | net gains deferred to equity totalled $314 million; |
| | - | net losses of $272 million were removed from equity and reclassified to the Operating Statement as a result of ineffective hedges ($4 million) and settlement of cash flow hedges ($267 million); and |
| | - | a $30 million gain was removed from equity and transferred to the cost of components. |
Credit Exposure
Credit risk exposure represents the potential loss that would be recognised if all counterparties failed to perform as contracted. Credit risk is regularly assessed, measured and managed in strict accordance with credit risk policies. In light of the global financial crisis, monitoring has been enhanced and credit limits and approvals continue to be tightened. Exposure to credit risk is managed through regular analysis of the ability of borrowers, potential borrowers and financial market counterparties with respect to derivative instruments to meet interest and capital repayment obligations and by changing lending limits. Where appropriate, collateral is obtained in the form of rights to securities, deeds of undertaking, letters of credit or guarantees.
The State’s credit risk on recognised financial assets, including derivatives, is the carrying amount of these assets in the Balance Sheet, net of any impairment losses. This is equal to the market value of investments at balance date. The State’s major concentrations of credit risk (excluding derivatives) are with the National Electricity market, housing market and rural sector.
The National Electricity Market operates with strict prudential guidelines that minimise potential for credit related losses. Security deposits or bank guarantees are obtained from customers to mitigate possible losses.
Housing loans are provided to people on low-to-moderate incomes within Queensland. The low level of borrowers overdue indicates the credit quality of the loans. The credit risk in the housing and rural sector is mitigated through mortgages over the properties and other forms of security as deemed appropriate.
| | |
| Audited Consolidated Financial Statements 2008–09 – Government of Queensland | | 7-58 |
Notes to the Financial Statements
| 50. | Additional Financial Instruments Disclosure continued |
Credit Exposure continued
The State is also exposed to significant concentrations of risk in the finance and investment industry, given the size of the State’s investment portfolio. A ratings-based approach is used to determine credit exposure, as well as country of domicile, size and asset composition and underlying security.
The credit exposure for derivative contracts, other than electricity derivatives, is calculated utilising the ‘value at risk methodology’ which takes into account the current market value, duration, term to maturity and interest rate and/or exchange rate volatility.
Credit risk exposures that are related to derivative financial instruments (other than electricity related derivatives) are as follows:
| | | | |
| | | 2009 | | 2008 |
| | | $M | | $M |
| | |
Derivative Exposure | | | | |
Interest rate swaps | | 620 | | 733 |
Cross currency swaps | | 383 | | 66 |
Forward exchange contracts | | 160 | | 41 |
Credit derivatives | | 362 | | 358 |
The Government limits exposure to individual counterparties by determining maximum credit exposure limits based on the counterparty’s rating, size of its Balance Sheet and quality of the underlying security. The State’s largest holder of derivatives and investments is Queensland Treasury Corporation. Its counterparty exposure by rating is as follows:
| | | | |
Rating | | | | |
| | | 2009 | | 2008 |
| | | % | | % |
| | |
Long Term | | | | |
AAA | | 32 | | 41 |
AA+ | | 1 | | 3 |
AA | | 44 | | 15 |
AA- | | 6 | | 16 |
A+ | | 8 | | 15 |
A | | 5 | | 3 |
A- | | 1 | | 1 |
| | |
Short Term | | | | |
A-1+ | | 3 | | 6 |
Credit risk exposures that relate to electricity derivative financial instruments are managed under International Swaps and Derivatives Association (ISDA) agreements. The ISDA has a strict credit policy, based on counterparties’ credit ratings and requiring appropriate security.
Interest Rate Risk
A number of State-owned entities enter into interest rate swaps, forward rate agreements and futures contracts to assist in the management of interest rate risk. In most instances, interest rate swaps are utilised to swap medium to long term fixed rate borrowings into floating rate borrowings at rates that are lower than those available if short term borrowings were utilised.
Forward rate agreements are used to lock in a guaranteed return on known cash flows, as and when they fall due, or to manage the duration of a particular pool or fund. Futures contracts are used primarily for the same purpose as forward rate agreements. These contracts have little credit risk, as the counterparties are organised exchanges.
Price Risk
The State is exposed to commodity price risk resulting from changes in electricity, coal and gas prices, diesel prices and other commodity prices. Longer term fixed price supply agreements are utilised to manage risk in relation to coal and gas. Derivative instruments are used to hedge against the price of electricity and diesel. A variety of swaps, futures, options and forward exchange contracts are used to hedge this risk. These financial instruments have a time horizon of between 3 months and 3 years.
| | |
| Audited Consolidated Financial Statements 2008–09 – Government of Queensland | | 7-59 |
Notes to the Financial Statements
| 50. | Additional Financial Instruments Disclosure continued |
Liquidity Risk
Liquidity risk arises from the possibility that individual agencies may be unable to settle a transaction on the due date. A range of funding facilities is used to ensure funds are available. In light of the liquidity and credit crisis experienced in 2007-08, a number of measures taken to improve liquidity, such as increasing the level of cash holdings to fund unexpected cash flows, remained in place during 2008-09. The contractual maturities of financial liabilities is included at Note 41.
Foreign Exchange Risk
The State borrows offshore to provide access to additional sources of funding. It also undertakes investments in foreign currency assets. To effectively manage the exposure of foreign currency borrowings and offshore investments to to fluctuations in exchange rates, both forward exchange contracts and cross currency swaps are used. The effectiveness of such hedges results in no foreign exchange risk to the State.
The State also enters into other transactions in currencies other than the Australian Dollar and accordingly, is exposed to foreign currency risk. Individual agencies are responsible for their risk management strategies and forward exchange contracts and swaps are entered into to effectively manage the exposure resulting from purchases of various plant, equipment and component parts in foreign currencies or to hedge exposures in commodity prices. Overall, the trading range for foreign exchange risk hedging of committed and forecast purchases denominated in foreign currencies to hedge is set out below.
| | |
0 - 1 year | | 50% - 100% |
1 - 2 years | | 70% - 100% |
2 - 3 years | | 60% - 100% |
Consequently, the State’s overall exposure to foreign currency risk is not considered material.
Sensitivity Analysis
The diverse nature of the financing and investing activities undertaken by agencies across the Queensland
Government supports a decentralised approach to risk management. While the State has a broad framework for risk management, individual agencies are responsible for managing risks to which they are exposed. A summary sensitivity analysis of the material risks to which the State is exposed is provided below. Additional risk management information can be found in individual agencies’ general purpose financial reports.
Commodity Price Risk
As a result of its ownership of electricity generating Government-owned corporations, the State is exposed to Electricity Price Risk. This is the risk associated with fluctuations in electricity prices in the National Electricity Market. The entities affected manage this risk by hedging a portion of the production using electricity derivative instruments. Each entity is responsible for its own risk management and may make varying assumptions in assessing its sensitivity to such movements. The agencies with a material impact for whole-of-Government are CS Energy Limited, Ergon Energy Corporation Limited, Stanwell Corporation Limited and Tarong Energy Corporation Limited. On the assumption that all other variables remain constant, the impact of electricity price movements on the State’s operating result and equity are as follows.
| | | | | | | | | | | | | | | | | | | | | | | | |
| | | 2009 | | | 2008 | |
| | | Operating Result | | | Equity | | | Operating Result | | | Equity | |
| | | $M | | | $M | | | $M | | | $M | | | $M | | | $M | | | $M | | | $M | |
| | | +10% | | | -10% | | | +10% | | | -10% | | | +10% | | | -10% | | | +10% | | | -10% | |
| | | | | | | | |
CS Energy | | (17 | ) | | 7 | | | (64 | ) | | 65 | | | (23 | ) | | 25 | | | (115 | ) | | 115 | |
Ergon Energy | | 2 | | | (6 | ) | | 2 | | | (6 | ) | | 1 | | | (7 | ) | | 1 | | | (7 | ) |
Stanwell | | (4 | ) | | 4 | | | (50 | ) | | 50 | | | - | | | - | | | (106 | ) | | 106 | |
| | | | | | | | |
| | +20% | | | -20% | | | +20% | | | -20% | | | +20% | | | -20% | | | +20% | | | -20% | |
| | | | | | | | |
Tarong Energy | | (11 | ) | | 11 | | | (127 | ) | | 127 | | | (12 | ) | | 32 | | | (120 | ) | | 124 | |
| | |
| Audited Consolidated Financial Statements 2008–09 – Government of Queensland | | 7-60 |
Notes to the Financial Statements
| 50. | Additional Financial Instruments Disclosure continued |
Sensitivity Analysis continued
Commodity Price Risk continued
The State is also exposed to risk of increases in the price of diesel fuel. The majority of the State’s risk in relation to this item is within QR Limited on account of its large fleet of diesel powered freight locomotives. This risk is managed through hedging of commodities using Singapore Gasoil 0.5% and Brent crude oil instruments.
As at 30 June 2009, had the Gasoil/Brent price decreased/increased by 37.1%/40.8% (2008, 24.47%/31.25%) with all other variables held constant, the State’s operating result would have been largely unaffected due to 100% hedge accounting for commodities (2008, $4 million lower/ $4 million higher). The State’s equity is also largely unaffected as a result (2008, $60 million lower/ $56 million higher).
Interest Rate and Unit Price Risk
As the State’s corporate treasury, QTC undertakes portfolio management activities on behalf of customers and raises funding in advance of requirements. QTC borrows in advance of requirements to ensure Queensland public sector entities have ready access to funding when required and also to reduce the risk associated with refinancing maturing loans. In addition, QTC holds surplus funds to assist with the management of customer portfolios. These activities expose the State to interest rate risk including basis risk which is managed within a value-at-risk (VaR) framework.
Given the increase in market volatility and uncertainty due to the global financial crisis, together with a large increase in customer borrowing requirements and a strategy to increase forward funding reserves, there has been a significant increase in the reported VaR over the last two years as follows:
| | | | |
| | | 2009 | | 2008 |
| | | $M | | $M |
| | |
Interest rate risk VaR | | 62 | | 58 |
The above VaR calculation does not include mark-to-market impact of changes in credit spreads on the value of assets held in the QTC Cash Fund. As at 30 June 2009, the State had an exposure of approximately $680,000 per basis point to changes in credit spreads on QTC assets and liabilities.
The effect of a 1% movement in interest rates on the State’s cash balances would result in a $10 million increase/decrease (2008, $12 million) in the State’s operating result and equity.
The State also has other investments that are exposed to interest rate changes and changes in the unit price of the funds managed by QIC Limited. Assuming all other variables remained constant, if the return on these investments moved by +/-1%, the State’s operating result and equity would have been approximately $237 million higher or lower (2008, $245 million).
The State also has exposure to interest rate risk due to its borrowing from the Commonwealth. As at 30 June 2009, the carrying value of Commonwealth borrowings was approximately $484 million. The majority of this debt is set at fixed interest rates. The remaining portion is at variable rates which have an immaterial sensitivity to changes in interest rates.
Foreign Exchange Risk
The State is exposed to movements in foreign currencies as a result of future commercial transactions denominated in currencies other than the Australian dollar. To minimise the impact of foreign currency movements, the State enters into forward exchange contracts and swaps. This is managed by individual agencies. The sensitivities identified by the affected agencies range from -20% to +20% (2008 -20% to +20%) currency movement. Had the exchange rate moved within these ranges, the State’s operating result would have been up to $13 million higher/$3 million lower (2008, $10 million higher/$9 million lower). The State’s equity would have been up to $62 million higher /$44 million lower (2008, $59 million higher/$45 million lower) due to the impact of hedge accounting.
| | |
| Audited Consolidated Financial Statements 2008–09 – Government of Queensland | | 7-61 |
Notes to the Financial Statements
| 50. | Additional Financial Instruments Disclosure continued |
Net Fair Value of Financial Instruments
The carrying amount of the State’s financial assets and liabilities equates to their net fair value, except as per table below.
| | | | | | | | |
| | | Carrying Amount | | Fair Value |
| | | 2009 | | 2008 | | 2009 | | 2008 |
| | | $M | | $M | | $M | | $M |
| | | | |
Commonwealth borrowings | | 484 | | 501 | | 414 | | 419 |
The net fair value of financial assets and liabilities is determined as follows:
| | - | | cash, deposits, receivables and payables approximate fair value; |
| | - | | the net fair value of other monetary financial assets and liabilities is based on market prices or has been determined by discounting expected future cash flows by the current interest rate for financial assets and liabilities with similar risk profiles; and |
| | - | | the net fair value of derivatives and other financial instruments not traded in an active market is determined using valuation techniques. |
| 51. | Retirement Benefit Obligations |
Retirement benefit liabilities include the following final salary defined benefit schemes:
| | - | | State Public Sector Superannuation Scheme (QSuper); |
| | - | | Pensions provided in accordance with the Judges’ (Pensions and Long Leave) Act 1967 (Judges’ Scheme); and |
| | - | | Electricity Supply Industry Superannuation (QLD) (ESI Super). |
QSuper and Judges’ Schemes
State public sector superannuation liabilities include defined benefit schemes for both current and former employees comprising the State Public Sector Superannuation Fund (QSuper). State Government budget dependent agencies, together with a number of statutory bodies, excluding principally the Queensland electricity supply industry, are required to make employer contributions to the QSuper scheme. The “former” defined benefit superannuation liabilities in the Balance Sheet represent the unfunded liabilities of defined benefit members who have elected to leave the scheme. The liability grows due to investment earnings and additional entrants transferring from the defined benefit scheme.
The QSuper scheme is assessed annually by the State Actuary and a full actuarial review is undertaken every three years. A full actuarial review of QSuper was completed as at 30 June 2007.
QSuper also incorporates defined contribution categories, for which the State has no further legal or constructive obligation other than to pay contributions. These liabilities and assets have been accounted for in accordance with the standards relevant to Defined Contribution schemes. In particular, no assets or liabilities relating to the funded Defined Contribution scheme have been included in the Balance Sheet. The expense relating to these schemes is the amount of employer contribution, $1.032 billion (2008, $833 million).
Electricity Supply Industry Superannuation
Queensland electricity entities contribute to an industry multiple employer superannuation fund, the Electricity Supply Industry Superannuation Fund (Qld) (ESI Super). Members, after serving a qualifying period, are entitled to benefits from this scheme on retirement, resignation, retrenchment, disability or death.
The defined benefit account of this fund is a funded plan which provides defined lump sum benefits based on years of service and average final salary. Employee contributions to the fund are based on various percentages of their gross salaries. The defined benefit account of this fund is closed to new members.
The most recent actuarial assessment of the fund, as at 1 July 2008, was carried out by Mr Shane Mather, F.I.A.A. of Sunsuper Financial Services Pty Ltd on 22 May 2009. The Actuary concluded that the value of assets of the Fund were sufficient to meet all benefits payable to all members of the scheme in the event of the Plan’s termination or voluntary or compulsory termination of employment.
| | |
| Audited Consolidated Financial Statements 2008–09 – Government of Queensland | | 7-62 |
Notes to the Financial Statements
| 51. | Retirement Benefit Obligations continued |
Retirement Benefit Obligations 2008-09
| | | | | | | | | | |
| Reconciliation of the Present Value of the Defined Benefit Obligation | | $M | | $M | | $M | | $M | | $M |
| | | Total | | QSuper DB | | Former DB | | Judges | | ESI Super |
Opening balance at 1 July 2008 | | 29,636 | | 25,509 | | 2,696 | | 451 | | 980 |
Current service cost | | 1,174 | | 1,106 | | - | | 22 | | 46 |
Contributions by plan participants | | 272 | | 258 | | - | | - | | 14 |
Interest cost | | 1,371 | | 1,580 | | (290) | | 30 | | 51 |
Benefits paid (including contributions tax) | | (1,528) | | (941) | | (517) | | (11) | | (59) |
Transfers to Former DB | | - | | (490) | | 490 | | - | | - |
Actuarial (gain)/loss | | (917) | | (929) | | - | | (67) | | 79 |
| | | | | | | | | | |
Closing balance at 30 June 2009 | | 30,008 | | 26,093 | | 2,379 | | 425 | | 1,111 |
| | | | | | | | | | |
Present Value of the Obligation as at 30 June 2009 by Funding Policy | | | | | | | | | | |
Present value of the obligation - wholly unfunded | | 2,804 | | | | | | | | |
Present value of the obligation - wholly/partly funded | | 27,204 | | | | | | | | |
| | | | | | | | | | |
| | 30,008 | | | | | | | | |
| | | | | | | | | | |
| | | | | |
| Reconciliation of the Fair Value of Plan Assets | | $M | | $M | | $M | | $M | | $M |
| | | Total | | QSuper DB | | Former DB | | Judges | | ESI Super |
Opening balance at 1 July 2008 | | 7,777 | | 6,743 | | - | | - | | 1,034 |
Expected return on plan assets | | 528 | | 462 | | - | | - | | 66 |
Employer contributions | | 952 | | 455 | | 445 | | - | | 52 |
Contributions by plan participants | | 271 | | 258 | | - | | - | | 13 |
Benefits paid (including contributions tax) | | (1,000) | | (941) | | | | - | | (59) |
Former DB benefits paid from DB plan assets | | (517) | | (72) | | (445) | | - | | - |
Actuarial gain/(loss) | | (1,563) | | (1,432) | | - | | - | | (131) |
Other | | 6 | | - | | - | | - | | 6 |
| | | | | | | | | | |
Closing balance at 30 June 2009 | | 6,454 | | 5,473 | | - | | - | | 981 |
| | | | | | | | | | |
| | | | | |
Reconciliation of Balance Sheet Liability/(Asset) | | | | | | | | | | |
Present value of the obligation | | 30,008 | | 26,093 | | 2,379 | | 425 | | 1,111 |
Fair value of plan assets | | (6,454) | | (5,473) | | - | | - | | (981) |
| | | | | | | | | | |
Liability/(Asset) recognised in Balance Sheet | | 23,554 | | 20,620 | | 2,379 | | 425 | | 130 |
| | | | | | | | | | |
| | | | | |
Amounts recognised in Operating Statement | | | | | | | | | | |
Current service cost | | 1,174 | | 1,106 | | - | | 22 | | 46 |
Interest cost | | 1,371 | | 1,580 | | (290) | | 30 | | 51 |
Expected return on plan assets | | (528) | | (462) | | - | | - | | (66) |
Other | | (6) | | - | | - | | - | | (6) |
| | | | | | | | | | |
Total amounts recognised in Operating Statement | | 2,011 | | 2,224 | | (290) | | 52 | | 25 |
| | | | | | | | | | |
| | | | | |
Amounts recognised in Statement of Changes in Net Assets (Equity) | | | | | | | | | | |
Opening cumulative amount of actuarial (gains) and losses | | 2,113 | | 1,976 | | 89 | | (2) | | 50 |
Net actuarial (gain)/loss recognised in year | | 655 | | 503 | | - | | (67) | | 219 |
| | | | | | | | | | |
Cumulative actuarial (gains)/losses recognised in the Statement of Changes in Net Assets (Equity) | | 2,768 | | 2,479 | | 89 | | (69) | | 269 |
| | | | | | | | | | |
| | |
| Audited Consolidated Financial Statements 2008–09 – Government of Queensland | | 7-63 |
Notes to the Financial Statements
| 51. | Retirement Benefit Obligations continued |
Retirement Benefit Obligations 2008-09 continued
Plan Asset Allocations
State Public Sector Superannuation and ESI Super plans hold
investments with the following asset allocations:
| | | | | | | | |
| | | QSuper DB | | Former DB | | Judges | | ESI Super |
| | | | |
Equity | | 34% | | N/A | | N/A | | 42% |
Debt instruments | | 41% | | N/A | | N/A | | 23% |
Property | | 13% | | N/A | | N/A | | 15% |
Other | | 12% | | N/A | | N/A | | 20% |
| | | | | | | | |
Total | | 100% | | N/A | | N/A | | 100% |
| | | | | | | | |
QSuper plan assets are those held within the QSuper Trust Fund but exclude the assets held by Queensland Treasury Corporation in respect of these liabilities.
QSuper holds investments in unit trusts that hold financial instruments issued by the State. These instruments are difficult to accurately value and are immaterial in proportion to the unit trusts. In addition, these trusts own properties which are used by Government agencies. Again the exact values attributable to these tenancies are difficult to accurately determine, nor do they represent a material proportion of the fair value plan assets.
The overall expected rate of return on QSuper plan assets are based on the expected returns by asset class derived by the QIC Limited, the strategic asset allocations and the expected levels of taxation applying to the QSuper scheme overall.
| | | | | | | | | | |
| | | $M | | $M | | $M | | $M | | $M |
| | | Total | | QSuper DB | | Former DB | | Judges | | ESI Super |
| | | | | |
Actual return on plan assets | | (1,165) | | (1,100) | | N/A | | N/A | | (65) |
| | | | | |
Estimate of employer contributions to be paid in 2009-10 | | 1,235 | | 644 | | 591 | | N/A | | N/A |
| | | | | |
Principal actuarial assumptions at 30 June 2009 | | | | | | | | | | |
| | | | | |
| | | | | QSuper DB | | Former DB | | Judges | | ESI Super |
| | | | | |
Gross discount rate | | | | 5.60% | | -11.46% | | 5.60% | | N/A |
Net discount rate (after allowance for investment taxation) | | | | 5.30% | | -11.46% | | 5.60% | | 4.70% |
Expected rates of return on plan assets (net of fees and taxes) | | | | 7.00% | | N/A | | N/A | | 6.00% |
Future inflationary salary increases | | | | 4.10% | | N/A | | 5.10% | | 4.50% |
Expected CPI increases | | | | 2.60% | | N/A | | N/A | | N/A |
| | | | | |
Retirement Benefit Obligations 2007-08 | | | | | | | | | | |
| | | | | |
| Reconciliation of the Present Value of the Defined Benefit Obligation | | $M | | $M | | $M | | $M | | $M |
| | | Total | | QSuper DB | | Former DB | | Judges | | ESI Super |
Opening balance at 1 July 2007 | | 27,928 | | 23,491 | | 3,111 | | 410 | | 916 |
Current service cost | | 1,172 | | 1,107 | | - | | 20 | | 45 |
Contributions by plan participants | | 267 | | 253 | | - | | - | | 14 |
Interest cost | | 1,340 | | 1,400 | | (135) | | 26 | | 49 |
Benefits paid (including contributions tax) | | (2,050) | | (1,130) | | (843) | | (10) | | (67) |
Transfers to Former DB | | - | | (563) | | 563 | | - | | - |
Curtailments or settlements | | (9) | | - | | - | | - | | (9) |
Actuarial (gain)/loss | | 988 | | 951 | | - | | 5 | | 32 |
| | | | | | | | | | |
Closing balance at 30 June 2008 | | 29,636 | | 25,509 | | 2,696 | | 451 | | 980 |
| | | | | | | | | | |
| | | | | |
| Present Value of the Obligation as at 30 June 2008 by Funding Policy | | $M | | | | | | | | |
Present value of the obligation - wholly unfunded | | 3,147 | | | | | | | | |
Present value of the obligation - wholly/partly funded | | 26,489 | | | | | | | | |
| | | | | | | | | | |
| | 29,636 | | | | | | | | |
| | | | | | | | | | |
| | |
| Audited Consolidated Financial Statements 2008–09 – Government of Queensland | | 7-64 |
Notes to the Financial Statements
| 51. | Retirement Benefit Obligations continued |
Retirement Benefit Obligations 2007-08 continued
| | | | | | | | | | |
| Reconciliation of the Fair Value of Plan Assets | | $M | | $M | | $M | | $M | | $M |
| | | Total | | QSuper DB | | Former DB | | Judges | | ESI Super |
Opening balance at 1 July 2007 | | 8,036 | | 6,835 | | - | | - | | 1,201 |
Expected return on plan assets | | 550 | | 474 | | - | | - | | 76 |
Employer contributions | | 1,621 | | 876 | | 724 | | - | | 21 |
Contributions by plan participants | | 266 | | 253 | | - | | - | | 13 |
Benefits paid (including contributions tax) | | (1,197) | | (1,130) | | - | | - | | (67) |
Former DB benefits paid from DB plan assets | | (842) | | (118) | | (724) | | - | | - |
Curtailments or settlements | | (9) | | - | | - | | - | | (9) |
Actuarial gain/(loss) | | (649) | | (448) | | - | | - | | (201) |
| | | | | | | | | | |
Closing balance at 30 June 2008 | | 7,776 | | 6,742 | | - | | - | | 1,034 |
| | | | | | | | | | |
| | | | | |
Reconciliation of Balance Sheet Liability/(Asset) | | | | | | | | | | |
Present value of the obligation | | 29,636 | | 25,509 | | 2,696 | | 451 | | 980 |
Fair value of plan assets | | (7,776) | | (6,742) | | - | | - | | (1,034) |
| | | | | | | | | | |
Liability/(Asset) recognised in Balance Sheet | | 21,860 | | 18,767 | | 2,696 | | 451 | | (54) |
| | | | | | | | | | |
| | | | | |
Amounts recognised in Operating Statement | | | | | | | | | | |
Current service cost | | 1,172 | | 1,107 | | - | | 20 | | 45 |
Interest cost | | 1,340 | | 1,400 | | (135) | | 26 | | 49 |
Expected return on plan assets | | (550) | | (474) | | - | | - | | (76) |
| | | | | | | | | | |
Total amounts recognised in Operating Statement | | 1,962 | | 2,033 | | (135) | | 46 | | 18 |
| | | | | | | | | | |
| | | | | |
Amounts recognised in Statement of Changes in Net Assets (Equity) | | | | | | | | | | |
Opening cumulative amount of actuarial (gains) and losses | | 468 | | 577 | | 89 | | (7) | | (191) |
Net actuarial (gain)/loss recognised in year | | 1,645 | | 1,399 | | - | | 5 | | 241 |
| | | | | | | | | | |
Cumulative actuarial (gains)/losses recognised in the Statement of Changes in Net Assets (Equity) | | 2,113 | | 1,976 | | 89 | | (2) | | 50 |
| | | | | | | | | | |
Plan Asset Allocations
State Public Sector Superannuation and ESI Super plans hold investments with the following asset allocations:
| | | | | | | | |
| | | QSuper DB | | Former DB | | Judges | | ESI Super |
Equity | | 41% | | N/A | | N/A | | 52% |
Debt | | 40% | | N/A | | N/A | | 27% |
Property | | 13% | | N/A | | N/A | | 12% |
Other | | 6% | | N/A | | N/A | | 9% |
| | | | | | | | |
Total | | 100% | | N/A | | N/A | | 100% |
| | | | | | | | |
QSuper plan assets are those held within the QSuper Trust Fund but exclude the assets held by Queensland Treasury Corporation in respect of these liabilities.
QSuper holds investments in unit trusts that hold financial instruments issued by the State. These instruments are difficult to accurately value and are immaterial in proportion to the unit trusts. In addition, these trusts own properties which are used by Government agencies. Again the exact values attributable to these tenancies are difficult to accurately determine, nor do they represent a material proportion of the fair value plan assets.
The overall expected rate of return on QSuper plan assets is based on the expected returns by asset class derived by the QIC Limited, the strategic asset allocations and the expected levels of taxation applying to the QSuper scheme overall.
| | |
| Audited Consolidated Financial Statements 2008–09 – Government of Queensland | | 7-65 |
Notes to the Financial Statements
| 51. | Retirement Benefit Obligations continued |
Retirement Benefit Obligations 2007-08 continued
| | | | | | | | | | | | |
| | | | | $M | | $M | | $M | | $M | | $M |
| | | | | Total | | QSuper DB | | Former DB | | Judges | | ESI Super |
| | | | | |
Actual return on plan assets | | (206) | | (92) | | N/A | | N/A | | (114) |
| | | | | |
Estimate of employer contributions to be paid in 2008-09 | | 1,418 | | 392 | | 1,026 | | N/A | | N/A |
| | | | | |
Principal actuarial assumptions at 30 June 2008 | | | | | | | | | | |
| | | | | |
| | | | | QSuper DB | | Former DB | | Judges | | ESI Super |
| | | | | |
Gross Discount rate | | | | 6.50% | | -4.58% | | 6.50% | | N/A |
Net Discount rate (after allowance for investment taxation) | | | | 6.20% | | -4.58% | | 6.50% | | 5.40% |
Expected rates of return on plan assets (net of fees and taxes) | | | | 7.00% | | N/A | | N/A | | 6.50% |
Future inflationary salary increases | | | | 5.25% | | N/A | | 6.75% | | 4.50% |
Expected CPI increases | | | | 3.75% | | N/A | | N/A | | N/A |
| | | | | | |
| | | | | 2009 | | 2008 | | 2007 | | 2006 | | 2005 |
| | | | | $M | | $M | | $M | | $M | | $M |
| | | | | | |
Experience adjustments relating to liabilities | | QSuper DB | | (524) | | (14) | | 428 | | 68 | | (295) |
| | Former DB | | - | | - | | - | | 89 | | (8) |
| | Judges | | (15) | | (13) | | (10) | | 12 | | 26 |
| | ESI Super | | (35) | | (40) | | 21 | | 10 | | (60) |
| | | | | | |
Experience adjustments relating to assets | | QSuper DB | | (1,432) | | (447) | | 457 | | 392 | | 716 |
| | Former DB | | - | | - | | - | | - | | - |
| | Judges | | - | | - | | - | | - | | - |
| | ESI Super | | (131) | | (201) | | 79 | | 89 | | 49 |
| | | | | | |
Present value of defined benefit obligation | | QSuper DB | | 26,093 | | 25,509 | | 23,491 | | 21,535 | | 20,115 |
| | Former DB | | 2,379 | | 2,696 | | 3,111 | | 2,653 | | 2,173 |
| | Judges | | 425 | | 451 | | 409 | | 398 | | 357 |
| | ESI Super | | 1,111 | | 980 | | 916 | | 907 | | 888 |
| | | | | | |
Fair value of plan assets | | QSuper DB | | 5,473 | | 6,742 | | 6,834 | | 6,886 | | 6,874 |
| | Former DB | | - | | - | | - | | - | | - |
| | Judges | | - | | - | | - | | - | | - |
| | ESI Super | | 981 | | 1,034 | | 1,202 | | 1,060 | | 901 |
| | | | | | |
Surplus/(deficit) | | QSuper DB | | (20,620) | | (18,767) | | (16,657) | | (14,649) | | (13,241) |
| | Former DB | | (2,379) | | (2,696) | | (3,111) | | (2,653) | | (2,173) |
| | Judges | | (425) | | (451) | | (409) | | (398) | | (357) |
| | ESI Super | | (130) | | 54 | | 286 | | 153 | | 13 |
Information for years prior to 2005 is not available.
Employee Numbers
The number of full time equivalent employees at 30 June 2009 relating to the consolidated entities listed in Note 53 totalled 229,503 (2008, 221,446).
| 52. | Acquisition of Controlled Entities in 2008-09 |
Purchase of Water Assets
The State acquired specified water assets from various Councils during the year for a net consideration of $1.698 billion.
| | |
| Audited Consolidated Financial Statements 2008–09 – Government of Queensland | | 7-66 |
Notes to the Financial Statements
Public sector entities are generally considered material for the purposes of this report if they meet either of the following criteria:
- net operating result in excess of $2 million; or
- net assets in excess of $25 million.
However in addition to material entities, the State consolidates some entities which are not material in terms of the operating position or net asset position criteria if they are either a departmentor if they are funded for the delivery of outputs.
When financial results are available in respect of non-material entities they are reviewed with the aim of including any newly material entities in the following year’s consolidated financial statements.
Newly created entities that are expected to meet the materiality criteria on the basis of their initial budget estimates are included in the consolidated financial statements from the time of their establishment.
The following controlled entities of the Government have been included in the consolidated financial statements for the year ended 30 June 2009. The list has been classified by activity sectors as outlined in Note 1(c).
Entities denoted with an asterisk are consolidated with the accounts of the preceding entity.
General Government
Departments of Government (following machinery of government legislation on 26/03/09)
Department of Communities
* Veterinary Surgeons Board of Queensland
Department of Community Safety
* Central and Northern Queensland Regional Parole Board
* Queensland Parole Board
* Southern Queensland Regional Parole Board
Department of Education and Training
* Corporate and Professional Services
Department of Employment, Economic Development and Innovation
Department of Environment and Resource Management
Department of Health
* Queensland Health Shared Service
Partner Department of Infrastructure and Planning
* Property Services Group
Department of Justice and Attorney-General
Department of Police
Department of the Premier and Cabinet
* Corporate Administration Agency (transferred from Department of Education and Training as at 31/03/09)
* Queensland Events Corporation Pty Ltd
Department of Public Works
* CITEC
* CorpTech (transferred from Treasury Department as at 1/07/08)
* Goprint
* Project Services
* QBuild
* QFleet
* SDS
* Shared Service Agency
Department of Transport and Main Roads
* RoadTek
Treasury Department
* Queensland Treasury Holdings Pty Ltd
| | |
| Audited Consolidated Financial Statements 2008–09 – Government of Queensland | | 7-67 |
Notes to the Financial Statements
53. Controlled Entities continued
General Government continued
Departments that have ceased (following machinery of government legislation on 26/03/09)
Department of Child Safety
Department of Corrective Services
Department of Emergency Services
Department of Employment and Industrial Relations
Department of Housing
Department of Local Government, Sport and Recreation
Department of Main Roads
Department of Mines and Energy
Department of Natural Resources and Water
Department of Primary Industries and Fisheries
Department of Tourism, Regional Development and Industry
Department of Transport
Disability Services Queensland
Environmental Protection Agency
Other General Government entities
Anti-Discrimination Commission
Australian Agricultural College Corporation
Board of the Queensland Museum
* Queensland Museum Foundation Trust
City North Infrastructure Pty Ltd
Commission for Children and Young People and Child Guardian
Crime and Misconduct Commission
Electoral Commission of Queensland
Forestry Plantations Queensland Office
Gold Coast Institute of TAFE (established on 1/07/08)
Health Quality and Complaints Commission
Legal Aid Queensland
Legislative Assembly
Library Board of Queensland
* Queensland Library Foundation Inc
Motor Accident Insurance Commission
Nominal Defendant
Office of the Governor
Office of the Information Commissioner
Office of the Ombudsman
Prostitution Licensing Authority
Public Service Commission (commenced 1/07/08, amalgamation of Service Delivery and Performance Commission and the Office of the Public Service Commissioner)
QRAA
Queensland Art Gallery Board of Trustees
Queensland Audit Office
Queensland Building Services Authority
Queensland Future Growth Corporation
Queensland Performing Arts Trust
Queensland Studies Authority
Residential Tenancies Authority
South Bank Corporation
Southbank Institute of Technology
The Council of the Queensland Institute of Medical Research
The Public Trustee of Queensland
Tourism Queensland
TransLink Transit Authority (established on 1/07/08)
Urban Land Development Authority
Workers’ Compensation Regulatory Authority (QComp)
| | |
| Audited Consolidated Financial Statements 2008–09 – Government of Queensland | | 7-68 |
Notes to the Financial Statements
53. Controlled Entities continued
Public Non-financial Corporations
Cairns Ports Limited (transitioned to a company GOC as at 1/07/08)
CS Energy Ltd
* Aberdare Collieries Pty Ltd
* Callide Energy Pty Ltd
* CS Energy Kogan Creek Pty Ltd
* CS Energy Mica Creek Pty Ltd
* CS Energy Oxyfuel Pty Ltd
* CS Kogan (Australia) Pty Ltd
* CS North West Pty Ltd
* Kogan Creek Power Pty Ltd
* Kogan Creek Power Station Pty Ltd
* Manzillo Insurance (PCC) Ltd - Cell EnMach
* SE CSE Pty Ltd
* Swanbank Energy Pty Ltd
DBCT Holdings Pty Ltd
ENERGEX Ltd
* Beak Industries Pty Ltd
* Energy Impact Pty Ltd
* Metering Dynamics Pty Ltd
* Queensland Energy Services Team Pty Ltd
* Service Essentials Pty Ltd
* Varnsdorf Pty Ltd
* VH Energy Holdings Pty Ltd
* VH Finance Pty Ltd
* VH Operations Pty Ltd
Ergon Energy Corporation Limited
* EA North Queensland Pty Ltd (deregistered in 2008-09)
* Ergon Energy Gas Pty Ltd (deregistered in 2008-09)
* Ergon Energy Queensland Pty Ltd
* Ergon Energy Telecommunications Pty Ltd
* Ergon Energy (Victoria) Pty Ltd (deregistered in 2008-09)
* Northern Electricity Retail Corporation Pty Ltd (deregistered in 2008-09)
Forestry Plantations Queensland
Gladstone Area Water Board
Gladstone Ports Corporation Limited (transitioned to a company GOC as at 1/07/08)
Gold Coast Events Co Pty Ltd (controlled entity of Department of Communities by machinery of government, previously controlled entity of Department of Local Government, Sport and Recreation)
Mackay Ports Limited (transitioned to a company GOC as at 1/07/08)
Mount Isa Water Board
Port of Brisbane Corporation Limited
* Bundaberg Port Corporation Pty Ltd
* Gateway Investments Corporation Pty Ltd (shares disposed on 15/12/08)
Port of Townsville Limited (transitioned to a company GOC as at 1/07/08)
Ports Corporation of Queensland Limited
Powerlink Queensland
* Harold Street Holdings Pty Ltd
* Powerlink Transmission Services Pty Ltd
QR Limited
* Australian Rail Pty Ltd
* Australian Eastern Railroad Pty Ltd
* Australian Railroad Group Employment Pty Ltd
* Australian Western Railroad Pty Ltd
* AWR Lease Co Pty Ltd
* Logistics Australasia Pty Ltd (transferred from QR Intermodal Pty Ltd to QR Limited as at 11/07/08)
* CRT Group Pty Ltd
* Golden Bros Group Pty Ltd
* NHK Pty Ltd
* On Track Insurance Pty Ltd
* QR Intermodal Pty Ltd (formerly National Logistics Alliance Pty Ltd, renamed as at 2/07/08)
* Interail Australia Pty Ltd (transferred from QR Limited to QR Intermodal Pty Ltd as at 11/07/08)
| | |
| Audited Consolidated Financial Statements 2008–09 – Government of Queensland | | 7-69 |
Notes to the Financial Statements
| 53. | Controlled Entities continued |
Public Non-financial Corporations continued
* QR Network Pty Ltd (incorporated as at 11/07/08)
* QR Surat Basin Pty Ltd (transferred from QR Limited to QR Network Pty Ltd as at 11/07/08)
* QR Passenger Pty Ltd (incorporated as at 11/07/08)
Queensland Airport Holdings (Cairns) Pty Ltd (registered on 1/09/08)
Queensland Airport Holdings (Mackay) Pty Ltd (registered on 1/09/08)
Queensland Bulk Water Supply Authority
* South East Queensland Water Corporation Limited
Queensland Bulk Water Transport Authority
Queensland Lottery Corporation Pty Ltd (controlled entity of Queensland Treasury Holdings Pty Ltd)
Queensland Manufactured Water Authority
South East Queensland (Gold Coast) Desalination Company Pty Ltd (shares transferred from Department of Infrastructure and Planning to Queensland Manufactured Water Authority on 1/09/08 and 1/10/08)
Western Corridor Recycled Water Pty Limited (shares transferred from Department of Infrastructure and Planning to Queensland Manufactured Water Authority on 1/09/08 )
Queensland Motorways Limited (controlled entity of Department of Transport and Main Roads)
* Logan Motorway Company Limited
* Port Motorway Limited
* Queensland Motorways Management Pty Ltd
* The Gateway Bridge Company Limited
Queensland Water Infrastructure Pty Ltd (controlled entity of Department of Infrastructure and Planning)
SEQ Water Grid Manager
Southern Regional Water Pipeline Company Pty Ltd trading as LinkWater Projects (controlled entity of Department of Infrastructure and Planning)
Stadiums Queensland
Stanwell Corporation Limited
* EDWF Holdings 1 Pty Ltd
* Energy Portfolio 1 Pty Ltd (incorporated as at 29/05/09)
* Goondi Energy Pty Ltd (incorporated as at 29/05/09)
* Wind Portfolio Pty Ltd
SunWater
* Burnett Water Pty Ltd
* Eungella Water Pipeline Pty Ltd
* North West Queensland Water Pipeline Pty Ltd
Tarong Energy Corporation Limited
* Glen Wilga Coal Pty Ltd
* Tarong Fuel Pty Ltd
* TEC Coal Pty Ltd
* TN Power Pty Ltd
The Trustees of Parklands Gold Coast
ZeroGen Pty Ltd (controlled entity of Department of Employment, Economic Development and Innovation by machinery of government, previously controlled entity of Department of Mines and Energy)
Public Financial Corporations
QIC Limited (transitioned to a company GOC and renamed from Queensland Investment Corporation as at 30/09/08)
* Canberra Centre Investments Pty Ltd
* Eastland Property Holdings Pty Ltd
* Innovis Investments Pty Ltd
* Pacific Echo Pty Limited
* QBF No. 1 Pty Ltd
* QBF No. 2 Pty Ltd
* QIC Asia Real Estate Investments Pty Ltd
* QIC Coomera Pty Ltd
* QIC Developments Pty Ltd
* QIC Helensvale Pty Ltd
* QIC Hi Yield Pty Ltd
* QIC Infrastructure Management Pty Ltd
* QIC Infrastructure Management No. 2 Pty Ltd
* QIC International Real Estate Investments Pty Ltd
| | |
| Audited Consolidated Financial Statements 2008–09 – Government of Queensland | | 7-70 |
Notes to the Financial Statements
| 53. | Controlled Entities continued |
Public Financial Corporations continued
* QIC Logan Hyperdome Pty Ltd
* QIC Merry Hill Pty Ltd
* QIC North America Investments Pty Ltd
* QIC North Asia Real Estate Investment Pty Ltd
* QIC Office Pty Ltd
* QIC Private Capital Pty Ltd
* QIC Properties Pty Ltd
* QIC Property Investments (Jersey) No. 1 Limited
* QIC Property Investments (Jersey) No. 2 Limited
* QIC Property Management Pty Ltd
* QIC Real Estate Funds Pty Ltd
* QIC Real Estate Pty Ltd
* QIC Retail (No 2) Pty Ltd
* QIC Retail Pty Ltd
* QIC Ringwood Pty Ltd
* QIC Robina Pty Ltd
* QIC Strategy No. 1 Pty Ltd (incorporated on 27/02/09)
* QIC Strategy No. 1A Pty Ltd (incorporated on 27/02/09)
* QIC Strategy No. 2 Pty Ltd (incorporated on 27/02/09)
* QIC Strategy No. 2A Pty Ltd (incorporated on 27/02/09)
* QIC Toowoomba Pty Ltd
* QIC (UK) Management Limited
* QIC Westpoint Pty Ltd
* QPC Investments No. 1 Pty Ltd
* Queensland BioCapital Funds Pty Ltd
* Watergardens Pty Ltd
Queensland Treasury Corporation
* Sunshine Locos Pty Ltd
WorkCover Queensland
| | |
| Audited Consolidated Financial Statements 2008–09 – Government of Queensland | | 7-71 |
Notes to the Financial Statements
| 54. | Reconciliation to GFS Net Operating Balance* |
| | | | | | | | | | | | |
| | | Notes | | GGS | | PNFC | | PFC | | Elims | | Whole of
Govt |
| | | | | $M | | $M | | $M | | $M | | $M |
2009 | | | | | | | | | | | | |
Net result from transactions - net operating balance | | | | 35 | | 587 | | (2,239) | | (955) | | (2,572) |
| | | | | | |
Convergence differences | | | | | | | | | | | | |
Other operating expenses - onerous contract | | a | | - | | - | | - | | - | | - |
Other property expenses - income transferred by Public Enterprises as dividends | | b | | - | | (935) | | (18) | | 953 | | - |
| | | | | | | | | | | | |
Total convergence differences | | | | - | | (935) | | (18) | | 953 | | - |
| | | | | | | | | | | | |
GFS Net Operating Balance | | | | 35 | | (348) | | (2,257) | | (2) | | (2,572) |
| | | | | | | | | | | | |
| | | | | | |
2008 | | | | | | | | | | | | |
Net result from transactions - net operating balance | | | | (1,606) | | 1,270 | | 235 | | (1,000) | | (1,100) |
| | | | | | |
Convergence differences | | | | | | | | | | | | |
Other operating expenses - onerous contract | | a | | - | | (16) | | - | | - | | (16) |
Other property expenses - income transferred by Public Enterprises as dividends | | b | | - | | (998) | | (2) | | 1,000 | | - |
| | | | | | | | | | | | |
Total convergence differences | | | | - | | (1,014) | | (2) | | 1,000 | | (16) |
| | | | | | | | | | | | |
GFS Net Operating Balance | | | | (1,606) | | 256 | | 233 | | 0 | | (1,116) |
| | | | | | | | | | | | |
Notes:
The convergence differences comprise:
| | a. | GFS treats onerous contract expense as other economic flows included in operating result. However, it is not recognised as an expense from transactions in the Operating Statement. |
This difference flows through to the whole-of-Government amounts.
| | b. | GFS treats dividends to owners as an expense, whereas such an amount is not recognised as an expense in the Operating Statement because it is treated as a distribution to owners and therefore a direct debit to equity. |
The differences do not flow through to the whole-of-Government amounts as they arise from intersector transactions.
| | c. | A GGS/PNFC elimination difference arises in respect of $44 million (2008, $41 million) of social benefits. Under the ABS GFS Manual, certain transactions between the GGS and the PNFC sector are not eliminated on whole of government consolidation whereas under AASB 127, intragroup transactions are eliminated in full. |
These benefits are grossed up for GFS reporting in Sales of goods and services and Grant expenses and there is no net effect on the Net operating balance.
| | * | Determined in accordance with the ABS GFS Manual. |
| | |
| Audited Consolidated Financial Statements 2008–09 – Government of Queensland | | 7-72 |
Notes to the Financial Statements
| 55. | Reconciliation to GFS Net Lending/(Borrowing)* |
| | | | | | | | | | | | |
| | | Notes | | GGS | | PNFC | | PFC | | Elims | | Whole of
Govt |
| | | | | $M | | $M | | $M | | $M | | $M |
2009 | | | | | | | | | | | | |
Net lending/(borrowing) | | | | (4,399) | | (5,866) | | (2,304) | | (908) | | (13,478) |
| | | | | | |
Convergence differences | | | | | | | | | | | | |
Relating to net operating balance | | | | - | | (935) | | (18) | | 953 | | - |
| | | | | | | | | | | | |
GFS net lending/(borrowing) | | | | (4,399) | | (6,801) | | (2,322) | | 45 | | (13,478) |
| | | | | | | | | | | | |
| | | | | | |
2008 | | | | | | | | | | | | |
Net lending/(borrowing) | | | | (5,286) | | (5,146) | | 185 | | (960) | | (11,206) |
| | | | | | |
Convergence differences | | | | | | | | | | | | |
Relating to net operating balance | | | | - | | (1,014) | | (2) | | 1,000 | | (16) |
| | | | | | | | | | | | |
GFS net lending/(borrowing) | | | | (5,286) | | (6,160) | | 183 | | 40 | | (11,222) |
| | | | | | | | | | | | |
| | * | Determined in accordance with the ABS GFS Manual. |
| | |
| Audited Consolidated Financial Statements 2008–09 – Government of Queensland | | 7-73 |
Notes to the Financial Statements
| | | | | | | | | | | | |
| | | | | | |
| 56. Reconciliation to GFS Total Change in Net Worth* | | | | | | | | | | | | |
| | | | | | | | | | | | | Whole of |
| | | Notes | | GGS | | PNFC | | PFC | | Elims | | Govt |
| | | | | $M | | $M | | $M | | $M | | $M |
2009 | | | | | | | | | | | | |
Comprehensive result - total change in net worth before transactions with owners as owners | | | | (9,219) | | 8,154 | | (5,124) | | (3,030) | | (9,219) |
| | | | | | |
Convergence differences | | | | | | | | | | | | |
Income transferred from Public Enterprises as dividends | | a | | - | | (935) | | (18) | | 953 | | - |
Relating to other economic flows | | | | | | | | | | | | |
Net gain on investments in other entities | | b | | 140 | | - | | - | | (140) | | - |
Onerous contracts | | c | | - | | (79) | | - | | - | | (79) |
Doubtful debts | | d | | 37 | | (10) | | - | | - | | 27 |
Deferred income tax equivalents | | e | | (228) | | 570 | | (342) | | - | | - |
Net restoration costs | | f | | - | | 1 | | - | | - | | 1 |
Remeasurement of shares and other contributed capital | | g | | - | | (7,702) | | 5,484 | | 2,218 | | - |
| | | | | | | | | | | | |
Total convergence differences | | | | (53) | | (8,155) | | 5,124 | | 3,031 | | (51) |
| | | | | | |
| | | | | | | | | | | | |
GFS Total Change in Net Worth | | | | (9,272) | | - | | - | | 1 | | (9,270) |
| | | | | | | | | | | | |
| | | | | | |
2008 | | | | | | | | | | | | |
Comprehensive result - total change in net worth before transactions with owners as owners | | | | 75,306 | | 4,824 | | (331) | | (4,500) | | 75,299 |
| | | | | | |
Convergence differences | | | | | | | | | | | | |
Income transferred from Public Enterprises as dividends | | a | | - | | (998) | | (2) | | 1,000 | | - |
Relating to other economic flows | | | | | | | | | | | | |
Net gain on investments in other entities | | b | | 859 | | - | | - | | (859) | | - |
Onerous contracts | | c | | - | | 30 | | - | | - | | 30 |
Doubtful debts | | d | | 35 | | 25 | | (1) | | - | | 59 |
Deferred income tax equivalents | | e | | (726) | | 854 | | (128) | | - | | - |
Net restoration costs | | f | | - | | 78 | | - | | - | | 78 |
Other | | | | - | | 14 | | - | | - | | 14 |
Remeasurement of shares and other contributed capital | | g | | - | | (4,827) | | 461 | | 4,366 | | - |
| | | | | | | | | | | | |
Total convergence differences | | | | 168 | | (4,824) | | 330 | | 4,507 | | 181 |
| | | | | | |
| | | | | | | | | | | | |
GFS Total Change in Net Worth | | | | 75,473 | | - | | - | | 7 | | 75,480 |
| | | | | | | | | | | | |
Notes:
The convergence differences comprise:
| | a. | GFS treats dividends to owners as an expense, whereas such an amount is not recognised as an expense in the Operating Statement because it is treated as a distribution to owners and therefore a direct debit to equity. The differences do not flow through to the whole of Government amounts as they arise from intersector transactions. |
| | b. | The measurement of equity investments in other public sector entities differs for GFS in that for example, doubtful debt provisions, onerous contract provisions and deferred income tax balances are not recognised in their net worth under GFS. |
| | c. | GFS treats onerous contract expense as other economic flows included in operating result. However, it is not recognised as an expense from transactions in the Operating Statement. This difference flows through to the whole of Government amounts. |
| | |
| Audited Consolidated Financial Statements 2008–09 – Government of Queensland | | 7-74 |
Notes to the Financial Statements
56. Reconciliation to GFS Total Change in Net Worth* continued
| | d. | GFS does not recognise doubtful debts, whereas the Operating Statement recognises the doubtful debts and classifies it as other economic flows. The total difference of $27 million (2008, $59 million) flows through to the whole of Government amounts. |
| | e. | GFS does not recognise deferred income tax equivalents, whereas the Operating Statement recognises the deferred income tax equivalents and classifies it as other economic flows. The differences do not flow through to the whole-of-Government amounts as they arise from intersector transactions. |
| | f. | GFS does not recognise restoration costs. whereas restoration costs have been recognised in the Operating Statement. This difference flows through to the whole of Government amounts. |
| | g. | GFS measures net worth as assets less liabilities less shares/contributed equity (remeasured). Shares/contributed equity are not deducted under Australian Accounting Standards. |
| | * | Determined in accordance with the ABS GFS Manual. |
| 57. | Reconciliation to GFS Net Worth* |
| | | | | | | | | | | | |
| | | | | | | | | | | | | Whole of |
| | | Notes | | GGS | | PNFC | | PFC | | Elims | | Govt |
| | | | | $M | | $M | | $M | | $M | | $M |
2009 | | | | | | | | | | | | |
Net Worth | | | | 184,619 | | 27,595 | | (3,578) | | (24,018) | | 184,619 |
| | | | | | |
Convergence differences | | | | | | | | | | | | |
Financial assets | | | | | | | | | | | | |
Accounts receivable | | a | | 360 | | 25 | | 1 | | - | | 386 |
Investment in other entities | | b | | 4,683 | | - | | - | | (4,683) | | - |
Non-financial assets | | | | | | | | | | | | |
Deferred tax assets | | c | | (6,236) | | (1,332) | | (438) | | 8,007 | | - |
Liabilities | | | | | | | | | | | | |
Deferred tax liabilities | | d | | 1,771 | | 6,222 | | 14 | | (8,007) | | - |
Provision Onerous Contracts | | e | | - | | 100 | | - | | - | | 100 |
Net restoration costs | | f | | - | | 92 | | - | | - | | 92 |
Shares and other contributed equity | | g | | - | | (32,702) | | 4,001 | | 28,701 | | - |
| | | | | | | | | | | | |
Total convergence differences | | | | 578 | | (27,595) | | 3,578 | | 24,018 | | 578 |
| | | | | | |
| | | | | | | | | | | | |
GFS Net Worth | | | | 185,197 | | - | | - | | - | | 185,197 |
| | | | | | | | | | | | |
| | | | | | |
2008 | | | | | | | | | | | | |
Net Worth | | | | 193,838 | | 20,001 | | 1,564 | | (21,565) | | 193,838 |
| | | | | | |
Convergence differences | | | | | | | | | | | | |
Financial assets | | | | | | | | | | | | |
Accounts receivable | | a | | 323 | | 35 | | 1 | | - | | 359 |
Investment in other entities | | b | | 4,543 | | - | | - | | (4,543) | | - |
Non-financial assets | | | | | | | | | | | | |
Deferred tax assets | | c | | (5,593) | | (1,234) | | (123) | | 6,950 | | - |
Liabilities | | | | | | | | | | | | |
Deferred tax liabilities | | d | | 1,357 | | 5,553 | | 40 | | (6,950) | | - |
Provision Onerous Contracts | | e | | - | | 179 | | - | | - | | 179 |
Net restoration costs | | f | | - | | 91 | | - | | - | | 91 |
Shares and other contributed equity | | g | | - | | (24,625) | | (1,483) | | 26,108 | | - |
| | | | | | | | | | | | |
Total convergence differences | | | | 629 | | (20,001) | | (1,564) | | 21,565 | | 629 |
| | | | | | |
| | | | | | | | | | | | |
GFS Net Worth | | | | 194,467 | | - | | - | | - | | 194,467 |
| | | | | | | | | | | | |
Notes:
The convergence differences comprise:
| | a. | GFS does not recognise doubtful debts, whereas a provision for doubtful debts is recognised in the Balance Sheet. This total difference of $386 million (2008, $359 million) flows through to the whole of Government amounts. |
| | |
| Audited Consolidated Financial Statements 2008–09 – Government of Queensland | | 7-75 |
Notes to the Financial Statements
| 57. | Reconciliation to GFS Net Worth* continued |
| | b. | The measurement of equity investments in other public sector entities differs for GFS in that for example, doubtful debt provisions, onerous contract provisions and deferred income tax balances are not recognised in their net worth under GFS. |
| | c. | GFS does not recognise deferred tax assets whereas deferred tax assets are classified as non-financial assets in the Balance Sheet. The differences do not flow through to the whole of Government amounts as they arise from intersector transactions. |
| | d. | GFS does not recognise deferred tax liabilities whereas deferred tax liabilities are classified as non-financial liabilities in the Balance Sheet. The differences do not flow through to the whole of Government amounts as they arise from intersector transactions. |
| | e. | GFS does not recognise provision for onerous contracts, whereas a provision for onerous contracts is recognised in the balance sheet. This difference flows through to the whole of Government amounts. |
| | f. | GFS does not recognise restoration costs. whereas restoration costs have been recognised in the Balance Sheet. This difference flows through to the whole of Government amounts. |
| | g. | GFS measures net worth as assets less liabilities less shares/contributed equity. Shares/contributed equity are not deducted under Australian Accounting Standards. |
| | * | Determined in accordance with the ABS GFS Manual. |
| 58. | Reconciliation to GFS Cash Surplus/(Deficit)* |
| | | | | | | | | | | | |
| | | Notes | | GGS | | PNFC | | PFC | | Elims | | Whole of
Govt |
| | | | | $M | | $M | | $M | | $M | | $M |
2009 | | | | | | | | | | | | |
Cash surplus/(deficit) | | | | (2,839) | | (6,384) | | (1,830) | | (136) | | (11,188) |
| | | | | | |
Convergence differences | | | | | | | | | | | | |
Adjustments to cash flows from investments in non-financial assets from finance leases and similar arrangements | | a | | (20) | | (6) | | - | | - | | (26) |
| | | | | | | | | | | | |
GFS Cash Surplus/(Deficit) | | | | (2,859) | | (6,390) | | (1,830) | | (136) | | (11,214) |
| | | | | | | | | | | | |
| | | | | | |
2008 | | | | | | | | | | | | |
Cash surplus/(deficit) | | | | (4,924) | | (5,874) | | 348 | | (133) | | (10,583) |
| | | | | | |
Convergence differences | | | | | | | | | | | | |
Adjustments to cash flows from investments in non-financial assets from finance leases and similar arrangements | | a | | (179) | | (5) | | - | | - | | (184) |
| | | | | | | | | | | | |
GFS Cash Surplus/(Deficit) | | | | (5,103) | | (5,879) | | 348 | | (133) | | (10,767) |
| | | | | | | | | | | | |
Notes:
| | a. | The convergence differences arise because GFS recognises a notional cash outflow relating to new finance leases and similar arrangements in calculating cash surplus/(deficit), whereas the Cash Flow Statement does not recognise notional cash flows. This total difference flows through to the whole-of-Government amounts. |
| | * | Determined in accordance with the ABS GFS Manual. |
| | |
| Audited Consolidated Financial Statements 2008–09 – Government of Queensland | | 7-76 |
Notes to the Financial Statements
| | | | | | |
| | | | | 2009 | | 2008 |
| | | | | $M | | $M |
| | | |
59. | | Expenses from Transactions by Function | | | | |
| | | |
| | General public services | | 1,646 | | 1,658 |
| | Public order and safety | | 3,138 | | 2,843 |
| | Education | | 8,166 | | 7,523 |
| | Health | | 9,533 | | 8,487 |
| | Social security and welfare | | 1,786 | | 1,650 |
| | Housing and community amenities | | 1,770 | | 1,170 |
| | Recreation and culture | | 854 | | 758 |
| | Fuel and energy | | 3,978 | | 4,310 |
| | Agriculture, forestry, fishing and hunting | | 1,242 | | 1,153 |
| | Mining, manufacturing and construction | | 200 | | 213 |
| | Transport and communications | | 6,594 | | 5,841 |
| | Other economic affairs | | 852 | | 779 |
| | Other purposes | | 6,774 | | 5,585 |
| | | | | | |
| | | | 46,533 | | 41,970 |
| | | | | | |
| | | |
60. | | Sector Assets by Function | | | | |
| | | |
| | General public services | | 4,753 | | 4,302 |
| | Public order and safety | | 6,289 | | 6,051 |
| | Education | | 17,978 | | 16,145 |
| | Health | | 7,341 | | 7,366 |
| | Social security and welfare | | 750 | | 747 |
| | Housing and community amenities | | 19,398 | | 16,891 |
| | Recreation and culture | | 6,713 | | 6,662 |
| | Fuel and energy | | 27,227 | | 25,012 |
| | Agriculture, forestry, fishing and hunting | | 67,768 | | 64,366 |
| | Mining, manufacturing and construction | | 1,086 | | 1,033 |
| | Transport and communications | | 73,706 | | 74,734 |
| | Other economic affairs | | 158 | | 200 |
| | Other purposes1 | | 58,486 | | 53,121 |
| | | | | | |
| | | | 291,653 | | 276,630 |
| | | | | | |
| | 1 | Includes Crown land subject to lease for a range of purposes and investments held in trust. |
| | |
| Audited Consolidated Financial Statements 2008–09 – Government of Queensland | | 7-77 |
Notes to the Financial Statements
Queensland Infrastructure Reform and Sale Program
On 2 June 2009 the Queensland Government announced its intention to undertake a significant asset sale program.
The Infrastructure Investment (Assets Restructuring and Disposal) Act 2009 has been passed to facilitate the restructure and disposal of particular businesses, assets and liabilities of government entities. The Act grants extensive powers to the Minister to direct the restructuring, disposal or other processes necessary for the sale program with respect to ‘declared projects’. Under Section 5(1) of the Act the following are ‘declared projects’:
| | a. | the disposal of all or part of the businesses, assets and liabilities of Queensland Motorways Limited; |
| | b. | the disposal of all or part of the businesses, assets and liabilities of Port of Brisbane Corporation Limited (PBC); |
| | c. | the disposal of all or part of the above rail businesses, assets and liabilities of QR Limited (QR) other than a passenger services business, asset or liability; |
| | d. | the disposal of all or part of the below rail businesses, assets and liabilities of QR; |
| | e. | the disposal of all or parts of the Abbot Point Coal Terminal held by Ports Corporation of Queensland Limited and associated businesses, assets and liabilities; and |
| | f. | the disposal of all or part of the businesses, assets and liabilities of Forestry Plantations Queensland. |
The Port of Bundaberg will be transferred to Gladstone Ports Corporation prior to the disposal of the businesses, assets and liabilities of PBC.
The asset sale program will initially consider available options for the disposal of QR’s above and below rail coal business. Opportunities to package up all or parts of QR’s bulk, intermodal, retail and regional freight services as well as certain parts of QR’s below rail network will also be investigated.
At balance sheet date, there is significant uncertainty around the timing and nature of the disposals and therefore the Treasurer considers that the criteria to reclassify the relevant non-current assets or disposal groups as ‘held for sale’ in accordance with AASB 5 Non current Assets Held for Sale and Discontinued Operations as amended have not been met.
| | |
| Audited Consolidated Financial Statements 2008–09 – Government of Queensland | | 7-78 |
Certificate of Consolidated Whole of Government Financial Statements
Consolidated Whole of Government Financial Statements
2008- 09
Management Certificate
The foregoing consolidated Whole of Government financial statements have been prepared pursuant to section 25(1)(a) of the Financial Accountability Act 2009 and other prescribed requirements.
In our opinion and in terms of section 25(3) of the Financial Accountability Act 2009 , we certify that the consolidated Whole of Government financial statements have been properly drawn up, under the prescribed requirements, to present a true and fair view of:
(i) the financial operations and cash flows of the Government of Queensland for the financial year; and
(ii) the financial position of the Government of Queensland at 30 June 2009.
At date of certification of the statements, we are not aware of any material circumstances that would render any particulars included in the consolidated Whole of Government financial statements misleading or inaccurate.
| | | | |
| David Newby, CA | | Gerard Bradley, CPA, FCA | | ANDREW FRASER |
| Manager, Fiscal Reporting | | Under Treasurer | | Treasurer |
| Queensland Treasury | | Queensland Treasury | | Minister for Employment and |
| | | | Economic Development |
Date 14 October 2009
| | |
| Audited Consolidated Financial Statements 2008–09 – Government of Queensland | | 7-79 |
INDEPENDENT AUDITOR’S REPORT
To the Treasurer of Queensland
Matters Relating to the Electronic Presentation of the Audited Financial Report
The audit report relates to the financial report of the Government of Queensland for the financial year ended 30 June 2009 included on Treasury Department’s web site. The Under Treasurer is responsible for the integrity of Treasury Department’s web site. We have not been engaged to report on the integrity of Treasury Department’s web site. The audit report refers only to the statements named below. It does not provide an opinion on any other information which may have been hyperlinked to/from these statements. If users of the financial report are concerned with the inherent risks arising from electronic data communications they are advised to refer to the hard copy of the audited financial report, available from Treasury Department, to confirm the information included in the audited financial report presented on this web site.
These matters also relate to the presentation of the audited financial report in other electronic media including CD Rom.
Report on the Financial Report
I have audited the accompanying financial report of the Government of Queensland which comprises the balance sheet as at 30 June 2009, and the operating statement, statement of changes in net assets (equity) and cash flow statement for the year ended on that date, a summary of significant accounting policies, other explanatory notes and the certificates given by the Treasurer, Under Treasurer and the Manager, Fiscal Reporting. The financial report includes the consolidated financial statements of the Government of Queensland for the entities it controlled at the year’s end or from time to time during the financial year.
Treasurer’s Responsibility for the Financial Report
The Treasurer, through the Treasury Department, is responsible for the preparation and fair presentation of the financial report in accordance with prescribed accounting requirements identified in the Financial Accountability Act 2009 and the Financial and Performance Management Standard 2009 , including compliance with applicable Australian Accounting Standards (including the Australian Accounting Interpretations). This responsibility includes establishing and maintaining internal controls relevant to the preparation and fair presentation of the financial report that is free from material misstatement, whether due to fraud and error; selecting and applying appropriate accounting policies; and making accounting estimates that are reasonable in the circumstances. The Financial Accountability Act 2009 and the Financial and Performance Management Standard 2009 came into operation on 1 July 2009 and replace the previous requirements contained in the Financial Administration and Audit Act 1977 and the Financial Management Standard 1997.
Auditor’s Responsibility
My responsibility to express an opinion on the financial report based on the audit is prescribed in the Auditor-General Act 2009. This Act, including transitional provisions, came into operation on 1 July 2009 and replaces the previous requirements contained in the Financial Administration and Audit Act 1977.
The audit was conducted in accordance with Auditor-General of Queensland Auditing Standards which incorporate the Australian Auditing Standards. These Auditing Standards require compliance with relevant ethical requirements relating to audit engagements and that the audit is planned and performed to obtain reasonable assurance whether the financial report is free of material misstatement.
An audit involves performing procedures to obtain audit evidence about the amounts and disclosures in the financial report. The procedures selected depend on the auditor’s judgement, including the assessment of risks of material misstatement in the financial report, whether due to fraud or error. In making those risk assessments, the auditor considers the entity’s preparation and fair presentation of the financial report in order to design audit procedures that are appropriate in the circumstances, but not for the purpose of expressing an opinion on the effectiveness of the entity’s internal control, other than in expressing an opinion on compliance with prescribed requirements. An audit also includes evaluating the appropriateness of accounting policies and the reasonableness of accounting estimates made by the Accountable Officer, as well as evaluating the overall presentation of the financial report and any mandatory financial reporting requirements as approved by the Treasurer for application in Queensland.
I believe that the audit evidence obtained is sufficient and appropriate to provide a basis for my audit opinion.
Independence
The Auditor-General Act 2009 promotes the independence of the Auditor-General and QAO authorised auditors. The Auditor-General is the auditor of all Queensland public sector entities and can only be removed by Parliament.
| | |
| Audited Consolidated Financial Statements 2008–09 – Government of Queensland | | 7-80 |
The Auditor-General may conduct an audit in any way considered appropriate and is not subject to direction by any person about the way in which audit powers are to be exercised. The Auditor-General has for the purposes of conducting an audit, access to all documents and property and can report to Parliament matters which in the Auditor-General’s opinion are significant.
Basis for Qualified Auditor’s Opinion
Comparative 2008 balances for property, plant and equipment of $215.916 billion include assets totalling $8.322 billion that have not been disclosed at fair value at 30 June 2008. $4.617 billion of this amount relates to infrastructure assets which are reported in Note 34 and included in the total written down value of $84.415 billion. The balance of the $8.322 billion relates to a number of other asset classes. In my opinion, this is in contravention of the transitional requirement of Australian Accounting Standard AASB 1049 Whole of Government and General Government Sector Financial Reporting which requires all assets, including comparatives, to be reported at fair value. I am therefore unable to and do not express an opinion on the reported written down value of these assets at 30 June 2008.
As a consequence of these assets not being reported at fair value, the reported depreciation expense for infrastructure assets, as per Note 12, of $2.275 billion (2009) and $1.602 billion (2008) has been incorrectly calculated. Had depreciation been calculated correctly, based on the fair value of these assets, I estimate that the depreciation expense for both 2008 and 2009 would have increased in the order of $180 million. As a result, the negative net operating balance of $2.571 billion (2009) and $1.100 billion (2008), reported in the operating statement, would also have increased by approximately $180 million.
Qualified Auditor’s Opinion
In accordance with s.42 of the Auditor-General Act 2009 , I have audited the financial report of the Government of Queensland and, except for the effect of such adjustments, if any, as may have been determined to be necessary in relation to the matters referred to in the preceding paragraph -
| | (a) | I have received all the information and explanations which I have required; and |
| | (i) | the prescribed requirements in respect of the establishment and keeping of accounts have been complied with in all material respects; and |
| | (ii) | the financial report has been drawn up under prescribed requirements, so as to present a true and fair view, of the financial operations and cash flows of the Government of Queensland for the financial year 1 July 2008 to 30 June 2009 and of the financial position as at the end of that year. |
| | | | |
G G POOLE FCPA, FCA Auditor-General of Queensland | |  | | Queensland Audit Office Brisbane |
| | |
| Audited Consolidated Financial Statements 2008–09 – Government of Queensland | | 7-81 |