EXHIBIT (c)(i)
Consolidated Financial Statements of the Registrant
QUEENSLAND
TREASURY
CORPORATION ANNUAL REPORT
2010-2011
VISION
PARTNERS IN FINANCIAL SUSTAINABILITY
MISSION
TO CREATE AND DELIVER UNIQUE AND RELEVANT VALUE FOR QUEENSLAND’S
PUBLIC SECTOR
VALUES
WE ARE FOCUSED
ON OUR CLIENTS WE ARE PASSIONATE
ABOUT QUEENSLAND
WE VALUE AND
RESPECT OUR PEOPLE
WE ARE COLLABORATIVE AND SEEK CONTINUOUS IMPROVEMENT
ABOVE ALL ELSE, WE VALUE INTEGRITY
CONTENTS
Queensland Treasury
Corporation Role Statement 2
Highlights 3
Five-year business Summary 4
Chairman’s Report 8
Chief Executive’s Report 10
Corporate Performance Report 13
Investor Report 21
Corporate Governance 33
Financial Statements 41
Appendices 81
QUEENSLAND TREASURY CORPORATION ANNUAL REPORT 2010-2011
1
QUEENSLAND TREASURY CORPORATION
Queensland Treasury Corporation is the Queensland Government’s central financing authority and corporate treasury services provider, with responsibility for:
‰ sourcing and managing the debt funding to finance Queensland’s infrastructure requirements in the most cost-effective manner
‰ providing financial and risk management advice to the Queensland Government and its public sector clients on financial risk issues, and
‰ investing the State’s short- to medium-term cash surpluses, to maximise client returns through a conservative risk management framework.
QTC does not formulate Government policy, but works within the policy frameworks developed by the Government and Queensland Treasury.
Debt funding and management
QTC borrows funds in the domestic and international markets in a manner that minimises the State’s and QTC’s liquidity and refinancing risk. We then lend these funds to meet our clients’ debt requirements, for both new borrowings and the refinancing of existing debt. With responsibility for all of the State’s debt raising, QTC is able to capture significant economies of scale and scope in the issuance, management and administration of debt.
Financial advisory and risk management services
QTC works closely with its public sector clients to assist in managing their risk in financial transactions and achieve the best financial solutions for their organisations and for Queensland. In assisting clients, QTC does not provide advice that is contrary to the interests of the State. We encourage our clients and Queensland Treasury, our major stakeholder, to use our organisation as an extension of their resources, by:
‰ providing access, on a cost recovery basis, to professional skills and resources to ensure that their financial risks are identified and managed on a consistent basis
‰ acting as a central store of knowledge and expertise on financial structures and transactions, and the risks and benefits they encompass
‰ providing Queensland Treasury with advice on matters of financial and commercial policy and risk relating to the State and its entities
‰ working as a conduit between the Government and the private sector, and
‰ using our economies of scale and scope to ensure that the best possible solutions are obtained.
Short- to medium-term investments
QTC uses its financial markets expertise, developed through strong relationships with the domestic and international markets, together with its understanding of debt management and the management of financial risk, to provide clients with investment solutions that achieve a high return within a conservative risk environment. Clients can choose from an overnight facility, a managed short-term fund or fixed-term facilities. Alternatively, we can assist them to source appropriate solutions from the marketplace.
2
QUEENSLAND TREASURY CORPORATION ANNUAL REPORT 2010-2011

QUEENSLAND TREASURY CORPORATION
HIGHLIGHTS
RAISED $17B to meet clients’ borrowing requirements SAVED $484M for clients and the State through our capital market activities and economies of scale, through access to funding at comparatively low interest rates
MAINTAINED INVESTOR CHOICE
with nine liquid State Government guaranteed bond lines
ASSISTED THE STATE’S disaster recovery, by facilitating the National Disaster Relief and Recovery Arrangements (NDRRA) process on behalf of local authorities
Supported the Government’s asset sales program—that RAISED $15B for the State, and minimised the State’s obligation for future capital expenditure on those assets—by providing two general managers to lead two of the sales teams, as well as hands-on support to execute the associated financial transactions
Helped MANAGE THE STATE’S FINANCIAL RISK, by conducting 40 credit and financial sustainability reviews of various Queensland public sector entities, 13 reviews of potential investments, eight capital structure reviews of Government Owned Corporations, and two post-investment reviews of State-held assets
Developed a WATER PRICING MODEL
to assist local governments in sustainably pricing their water and sewerage services
Embedded our new CLIENT-CENTRIC OPERATING MODEL and structure, receiving positive client survey feedback
The Gateway Bridges were renamed the
‘Sir Leo Hielscher Bridges’ in honour of the QTC Foundation
Chairman’s achievements for the State.
Image supplied by Queensland Motorways Ltd.
ANNUAL REPORT 2010-2011 QUEENSLAND TREASURY CORPORATION
3
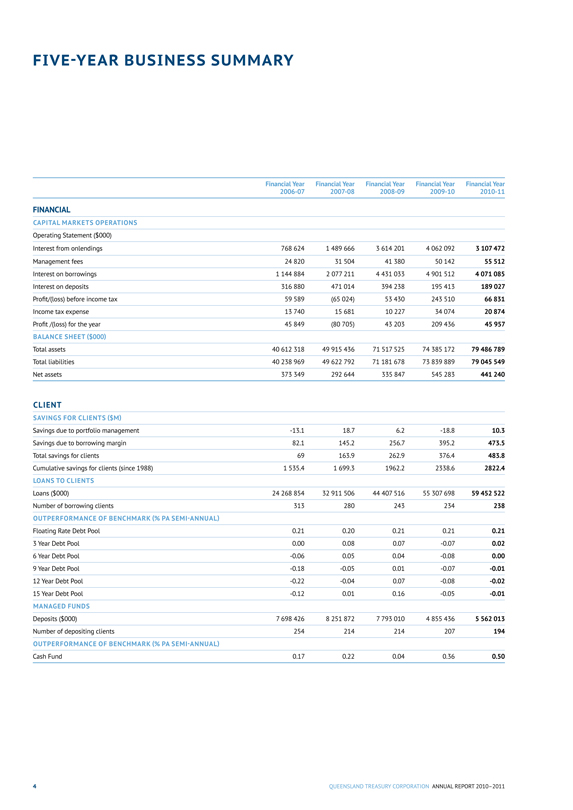
FIVE-YEAR BUSINESS SUMMARY
Financial Year 2006-07 Financial Year 2007-08 Financial Year 2008-09 Financial Year 2009-10 Financial Year
2010-11
FINANCIAL
CAPITAL MARKETS OPERATIONS
Operating Statement ($000)
Interest from onlendings 768 624 1 489 666 3 614 201 4 062 092 3 107 472
Management fees 24 820 31 504 41 380 50 142 55 512
Interest on borrowings 1 144 884 2 077 211 4 431 033 4 901 512 4 071 085
Interest on deposits 316 880 471 014 394 238 195 413 189 027
Profit/(loss) before income tax 59 589 (65 024) 53 430 243 510 66 831
Income tax expense 13 740 15 681 10 227 34 074 20 874
Profit /(loss) for the year 45 849 (80 705) 43 203 209 436 45 957
BALANCE SHEET ($000)
Total assets 40 612 318 49 915 436 71 517 525 74 385 172 79 486 789
Total liabilities 40 238 969 49 622 792 71 181 678 73 839 889 79 045 549
Net assets 373 349 292 644 335 847 545 283 441 240
CLIENT
SAVINGS FOR CLIENTS ($M)
Savings due to portfolio management -13.1 18.7 6.2 -18.8 10.3
Savings due to borrowing margin 82.1 145.2 256.7 395.2 473.5
Total savings for clients 69 163.9 262.9 376.4 483.8
Cumulative savings for clients (since 1988) 1 535.4 1 699.3 1962.2 2338.6 2822.4
LOANS TO CLIENTS
Loans ($000) 24 268 854 32 911 506 44 407 516 55 307 698 59 452 522
Number of borrowing clients 313 280 243 234 238
OUTPERFORMANCE OF BENCHMARK (% PA SEMI-ANNUAL)
Floating Rate Debt Pool 0.21 0.20 0.21 0.21 0.21
3 Year Debt Pool 0.00 0.08 0.07 -0.07 0.02
6 Year Debt Pool -0.06 0.05 0.04 -0.08 0.00
9 Year Debt Pool -0.18 -0.05 0.01 -0.07 -0.01
12 Year Debt Pool -0.22 -0.04 0.07 -0.08 -0.02
15 Year Debt Pool -0.12 0.01 0.16 -0.05 -0.01
MANAGED FUNDS
Deposits ($000) 7 698 426 8 251 872 7 793 010 4 855 436 5 562 013
Number of depositing clients 254 214 214 207 194
OUTPERFORMANCE OF BENCHMARK (% PA SEMI-ANNUAL)
Cash Fund 0.17 0.22 0.04 0.36 0.50
4
QUEENSLAND TREASURY CORPORATION ANNUAL REPORT 2010-2011
Financial Year
2006-07 Financial Year
2007-08 Financial Year
2008-09 Financial Year
2009-10 Financial Year
2010-11
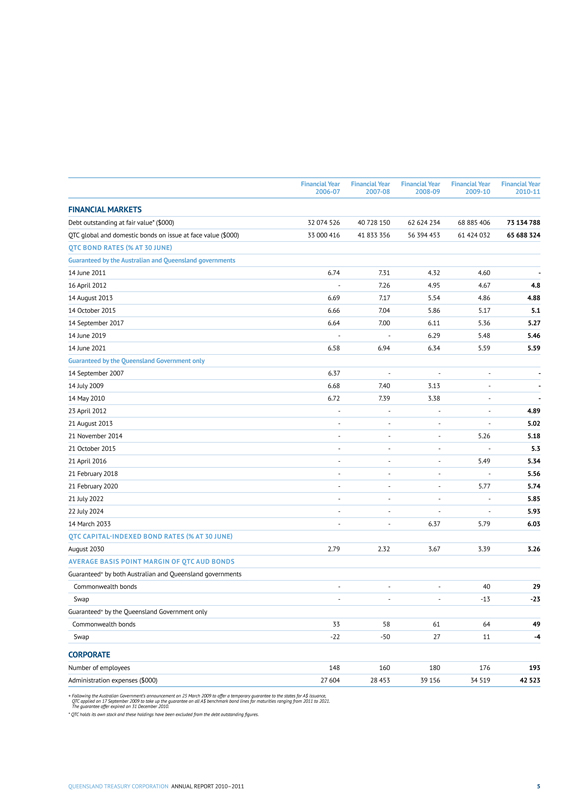
FINANCIAL MARKETS
Debt outstanding at fair value* ($000) 32 074 526 40 728 150 62 624 234 68 885 406 73 134 788
QTC global and domestic bonds on issue at face value ($000) 33 000 416 41 833 356 56 394 453 61 424 032 65 688 324
QTC BOND RATES (% AT 30 JUNE)
Guaranteed by the Australian and Queensland governments
14 June 2011 6.74 7.31 4.32 4.60 -
16 April 2012 - 7.26 4.95 4.67 4.8
14 August 2013 6.69 7.17 5.54 4.86 4.88
14 October 2015 6.66 7.04 5.86 5.17 5.1
14 September 2017 6.64 7.00 6.11 5.36 5.27
14 June 2019 - - 6.29 5.48 5.46
14 June 2021 6.58 6.94 6.34 5.59 5.59
Guaranteed by the Queensland Government only
14 September 2007 6.37 - - - -
14 July 2009 6.68 7.40 3.13 - -
14 May 2010 6.72 7.39 3.38 - -
23 April 2012 - - - - 4.89
21 August 2013 - - - - 5.02
21 November 2014 - - - 5.26 5.18
21 October 2015 - - - - 5.3
21 April 2016 - - - 5.49 5.34
21 February 2018 - - - - 5.56
21 February 2020 - - - 5.77 5.74
21 July 2022 - - - - 5.85
22 July 2024 - - - - 5.93
14 March 2033 - - 6.37 5.79 6.03
QTC CAPITAL-INDEXED BOND RATES (% AT 30 JUNE)
August 2030 2.79 2.32 3.67 3.39 3.26
AVERAGE BASIS POINT MARGIN OF QTC AUD BONDS
Guaranteed* by both Australian and Queensland governments
Commonwealth bonds - - - 40 29
Swap - - - -13 -23
Guaranteed* by the Queensland Government only
Commonwealth bonds 33 58 61 64 49
Swap -22 -50 27 11 -4
CORPORATE
Number of employees 148 160 180 176 193
Administration expenses ($000) 27 604 28 453 39 156 34 519 42 523
+ Following the Australian Government’s announcement on 25 March 2009 to offer a temporary guarantee to the states for A$ issuance, QTC applied on 17 September 2009 to take up the guarantee on all A$ benchmark bond lines for maturities ranging from 2011 to 2021. The guarantee offer expired on 31 December 2010.
* QTC holds its own stock and these holdings have been excluded from the debt outstanding figures.
QUEENSLAND TREASURY CORPORATION ANNUAL REPORT 2010-2011 5
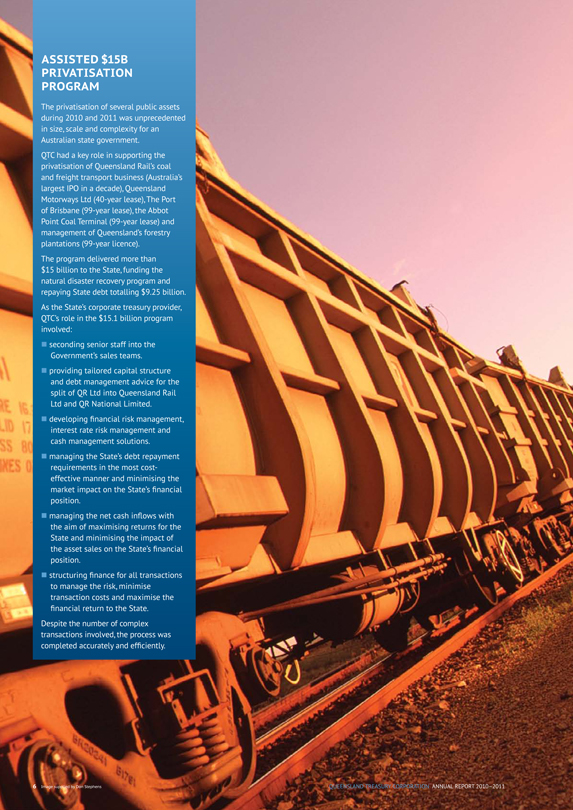
ASSISTED $15B PRIVATISATION PROGRAM
The privatisation of several public assets during 2010 and 2011 was unprecedented in size, scale and complexity for an Australian state government.
QTC had a key role in supporting the privatisation of Queensland Rail’s coal and freight transport business (Australia’s
largest IPO in a decade), Queensland Motorways Ltd (40-year lease), The Port of Brisbane (99-year lease), the Abbot
Point Coal Terminal (99-year lease) and management of Queensland’s forestry plantations (99-year licence).
The program delivered more than $15 billion to the State, funding the natural disaster recovery program and repaying State debt totalling $9.25 billion.
As the State’s corporate treasury provider, QTC’s role in the $15.1 billion program involved:
• seconding senior staff into the Government’s sales teams.
• providing tailored capital structure and debt management advice for the split of QR Ltd into Queensland Rail Ltd and QR National Limited.
• developing financial risk management, interest rate risk management and cash management solutions.
• managing the State’s debt repayment requirements in the most cost-effective manner and minimising the market impact on the State’s financial position.
• managing the net cash inflows with the aim of maximising returns for the State and minimising the impact of the asset sales on the State’s financial position.
• structuring finance for all transactions to manage the risk, minimise transaction costs and maximise the financial return to the State.
Despite the number of complex transactions involved, the process was completed accurately and efficiently.
6 Image supplied by Don Stephens
QUEENSLAND TREASURY CORPORATION ANNUAL REPORT 2010-2011
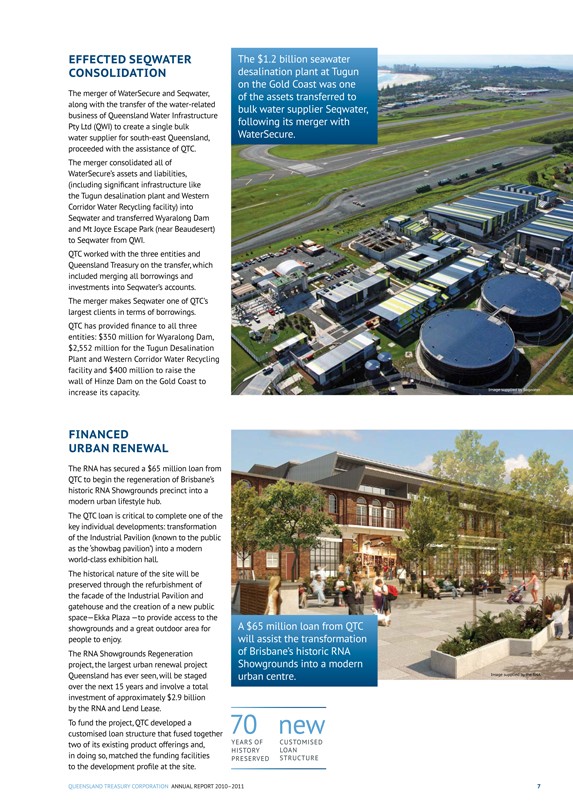
EFFECTED SEQWATER CONSOLIDATION
The merger of WaterSecure and Seqwater, along with the transfer of the water-related business of Queensland Water Infrastructure Pty Ltd (QWI) to create a single bulk water supplier for south-east Queensland, proceeded with the assistance of QTC.
The merger consolidated all of WaterSecure’s assets and liabilities, (including significant infrastructure like the Tugun desalination plant and Western Corridor Water Recycling facility) into Seqwater and transferred Wyaralong Dam and Mt Joyce Escape Park (near Beaudesert) to Seqwater from QWI.
QTC worked with the three entities and Queensland Treasury on the transfer, which included merging all borrowings and investments into Seqwater’s accounts.
The merger makes Seqwater one of QTC’s largest clients in terms of borrowings.
QTC has provided finance to all three entities: $350 million for Wyaralong Dam, $2,552 million for the Tugun Desalination Plant and Western Corridor Water Recycling facility and $400 million to raise the wall of Hinze Dam on the Gold Coast to increase its capacity.
FINANCED
URBAN RENEWAL
The RNA has secured a $65 million loan from QTC to begin the regeneration of Brisbane’s historic RNA Showgrounds precinct into a modern urban lifestyle hub.
The QTC loan is critical to complete one of the key individual developments: transformation of the Industrial Pavilion (known to the public as the ‘showbag pavilion’) into a modern world-class exhibition hall.
The historical nature of the site will be preserved through the refurbishment of the facade of the Industrial Pavilion and gatehouse and the creation of a new public space—Ekka Plaza —to provide access to the showgrounds and a great outdoor area for people to enjoy.
The RNA Showgrounds Regeneration project, the largest urban renewal project Queensland has ever seen, will be staged over the next 15 years and involve a total investment of approximately $2.9 billion by the RNA and Lend Lease.
To fund the project, QTC developed a customised loan structure that fused together two of its existing product offerings and, in doing so, matched the funding facilities to the development profile at the site.
The $1.2 billion seawater desalination plant at Tugun on the Gold Coast was one of the assets transferred to bulk water supplier Seqwater, following its merger with WaterSecure.
A $65 million loan from QTC will assist the transformation of Brisbane’s historic RNA Showgrounds into a modern urban centre.
Image supplied by the RNA
70
YEARS OF
HISTORY
PRESERVED
new
CUSTOMISED LOAN
STRUCTURE
QUEENSLAND TREASURY CORPORATION ANNUAL REPORT 2010-2011
7
In 2010-11, Queensland Treasury Corporation successfully raised $17 billion to fund Queensland’s Borrowing Program, and achieved an operating profit from its capital markets operations of $46 million (2009-10: $209 million).
CHAIRMAN’S REPORT
STEPHEN ROCHESTER
Separate to our capital markets operations, the long-term assets operations, which are managed by QIC Limited, recorded a profit of $1.2 billion (2009-10: $586.8 million).
This success was achieved in a characteristically volatile year, where global market uncertainty initiated fundamental change across global economic, financial and political sectors. With increasing concern around European sovereign debt, and the USA’s loss of its AAA credit rating, we witnessed an ongoing shift in economic power from advanced to emerging economies, which has profoundly influenced the environment in which we operate.
We continue to observe significant variability in economic conditions both globally and domestically; a reminder that post-financial crisis recoveries tend to be more prolonged and muted than those following typical cyclical downturns. While this variability is expected to continue, Australia’s and Queensland’s relative strengths, resource wealth and exposures to the prospering Asian region should ensure we outperform many other advanced economies in the coming years.
There is an upside to this economic shift in the global balance of power, as Australia and Queensland are well-placed to build-on existing regional relationships with newly empowered economies, as they look for expertise and resources to support their growth.
Another positive is Queensland’s close relationship with the Australian Government, as evidenced by the fifty percent of the State’s revenue, seventy-five per cent of the costs of the State’s restoration and recovery works associated with natural disasters, which are provided to the State by the Australian Government. Additionally, a horizontal fiscal equalisation scheme ensures each state has the capacity to provide services at similar standards.
Notwithstanding this positive backdrop, the period ahead will nevertheless continue to be volatile, as the fundamental changes to the global economic and financial architectures we are experiencing are long-lived processes that can be difficult to predict.
QTC’s principal role is to fund the Queensland Government’s capital infrastructure program to support the development of the State’s capital base, and we will continue to be an issuer in domestic and international markets. Issuing in the well-established domestic and international markets, QTC is supported by a distribution group of 17 banks dedicated to providing liquidity in our bond programs, and access to a wide range of investors. In the past year, we have re-established our State Government guaranteed bond line, providing investors with increased access to credit and product alternatives.
8 QUEENSLAND TREASURY CORPORATION ANNUAL REPORT 2010-2011
I am confident that QTC’s long-held and well-formed conservative risk management approach places us in a good position to deal with the inevitable volatility and increasingly complex challenges of the new global marketplace. It also helps ensure our ability to fund, advise and support the Queensland Government and its public sector entities in their various businesses as we pursue the most efficient use of resources to maximise outcomes, and promote financial sensibility and forward thinking in financial decision making.
The efficient procurement of infrastructure — as we rebuild following the flood and cyclone disasters of earlier this year and create greater capacity for future generations — will be critically important. In supporting clients in their infrastructure development, QTC actively promotes four key and related considerations.
The first consideration is to facilitate informed decision making, ensuring Government has accurate, appropriate and complete information to properly assess value in infrastructure procurement. Informed decision making is integral to our second key consideration, which is to concentrate delivery on projects that will provide the greatest value and deliver on the unprecedented opportunity the current environment provides to improve the lives of Queenslanders. The third of our considerations is to support consideration by the State of its capacity to pay for the infrastructure planned. The question of financing, appropriately, comes last in our considerations, acknowledging its place in the decision-making process, but also its importance, as every financing dollar that is wasted is one less dollar for future capacity building.
While these considerations have always been on our radar, they are becoming increasingly important — particularly as the Queensland economy recovers and develops (in line with the shift in global economic power to our region), the volatility of financial markets continues, and fiscal management makes the contribution of the infrastructure and services being financed by the debt we issue, critical to the State’s ongoing success.
Within our organisation, we were delighted to welcome Philip Noble to the role of Chief Executive in December 2010, and QTC’s Board, management and employees are now enjoying the benefits new leadership brings. Together, we’re looking forward to another successful year.
On a final note, our thoughts remain with our neighbours, both here in Queensland, and those in Japan and New Zealand, as we rebuild our communities following significant natural disasters.
STEPHEN ROCHESTER
Chairman
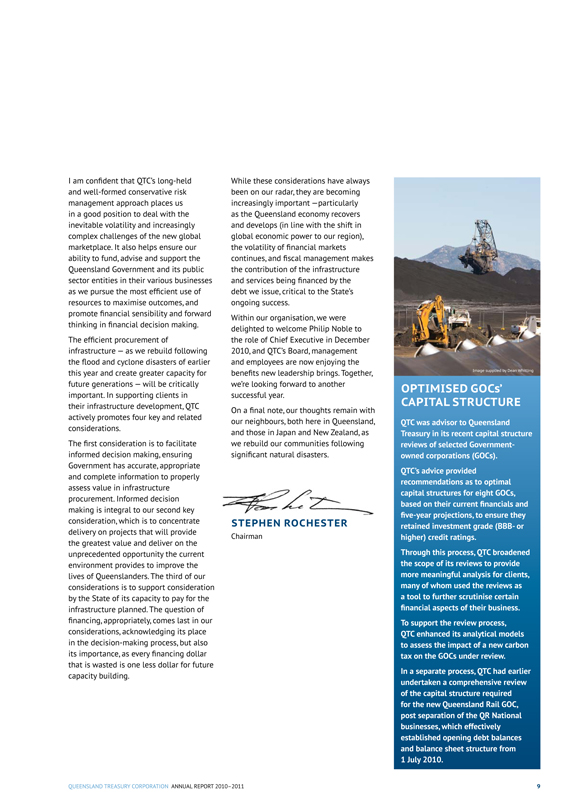
OPTIMISED GOCs’ CAPITAL STRUCTURE
QTC was advisor to Queensland Treasury in its recent capital structure reviews of selected Government-owned corporations (GOCs).
QTC’s advice provided recommendations as to optimal capital structures for eight GOCs, based on their current financials and five-year projections, to ensure they retained investment grade (BBB- or higher) credit ratings.
Through this process, QTC broadened the scope of its reviews to provide more meaningful analysis for clients, many of whom used the reviews as a tool to further scrutinise certain financial aspects of their business.
To support the review process, QTC enhanced its analytical models to assess the impact of a new carbon tax on the GOCs under review.
In a separate process, QTC had earlier undertaken a comprehensive review of the capital structure required for the new Queensland Rail GOC, post separation of the QR National businesses, which effectively established opening debt balances and balance sheet structure from 1 July 2010.
QUEENSLAND TREASURY CORPORATION ANNUAL REPORT 2010-2011 9
CHIEF
EXECUTIVE’S
REPORT
PHILIP NOBLE
In the first few months of my introduction to Queensland Treasury Corporation, I witnessed the success of the newly implemented operating model and structure as it enabled us to mobilise quickly to assist our clients in the immediate aftermath of the flood and cyclone natural disasters.
As is often the case, nature’s overwhelming force brought out the best in everyone involved, and I was very pleased to witness the fortifying of QTC’s role in supporting the State’s financial sustainability over the past six months. Similarly, LGIS — QTC’s joint initiative with the Local Government Association of Queensland — has been actively involved, providing hands-on assistance to councils in their applications for reimbursement under the Australian Government’s National Disaster Relief and Recovery Arrangements.
Client highlights
Throughout the year, we worked closely with our clients to deliver significant benefits to their businesses and the State, in areas ranging from the identification of optimal funding solutions from a cost and debt management perspective, through to support in the identification and management of financial risks in a number of major projects. In particular, we:
• achieved $484 million (2009-10: $376 million) in savings for clients and the State through our capital market activities and economies of scale that provided them with access to funding at comparatively low interest rates
• assisted with the management of the State’s financial risks associated with the restructure of the State’s assets, including the sales of major assets and mergers of key entities
• strengthened the State’s risk management approach, completing 40 credit and financial sustainability reviews of various Queensland public sector entities, 13 reviews of potential investments, eight capital structure reviews of Government Owned Corporations, and two post-investment reviews of State-held assets
• supported clients with their evaluations of potential delivery models for projects; and, in July 2011, established the Infrastructure Projects Assessment Team (IPAT), a joint Treasury-QTC initiative that will see us combine resources to better ensure public sector infrastructure projects are properly analysed, procured and delivered
• facilitated local government outcomes, by providing rebuilding support in the aftermath of the floods and cyclones, and developing the new generic water pricing model to assist with pricing water and sewerage services
• promoted collaboration on major projects, providing two of our most senior staff members to the State Government’s asset sale program, where they headed up the teams responsible for the successful sale of Forestry Plantation Queensland (June 2010), QR National (November 2010) and the Abbot Point Coal Terminal (May 2011), and
• enhanced decision making across Government, by providing bespoke training opportunities and support to build expertise in financial risk management.
10 QUEENSLAND TREASURY CORPORATION ANNUAL REPORT 2010-2011
Funding highlights
Despite the unprecedented uncertainty and volatility in the global markets, we successfully met our clients’ 2010-11 funding requirements and our debt refinancing requirements of $17 billion. In doing so, we increased our domestic and global coverage and interaction with investors, and actively managed the withdrawal of the Australian Government’s guarantee on new debt issued after 31 December 2010, by re-establishing QTC’s State Government Guaranteed yield curve. These two strategies continue to provide benefits in terms of access to liquidity and cost of funds.
Over the course of the year, we were well supported by investors in the establishment of seven new liquid AUD benchmark bond lines — Q2011, Q2012, Q2013, Q2015, Q2018, Q2022 and Q2024 — each with the sole guarantee of the Queensland State Government. We also increased, to 17 banks, the membership of our global distribution group, which is committed to providing investors with two-way pricing and easy and reliable access to transact in QTC’s debt securities.
One notable highlight of the year was the presentation to QTC of KangaNews’s Australian Domestic Sovereign/Agency Deal of the Year Award, for the AUD 4 billion 2014 bond issue. Offered in a syndicated deal for QTC investors to switch out of the QTC December 2014 Australian Government guaranteed bond line, the deal was, at the time, the largest single day nominal bond transaction in Australian market history.
Corporate highlights
The development and implementation of QTC’s strategic and corporate plans for 2010-2014, following the organisation’s restructure in the prior year, was a key achievement in the review period.
Under these plans, and in conjunction with the introduction of a number of new senior staff, we received positive results from our external client survey, which was a testament to the hard work and commitment of every QTC employee. Pleasingly, the external client survey results indicated that 80% of respondents believe QTC provides a better service than other providers.
In addition to the significant client benefits provided this year, these achievements will provide a solid foundation to deliver greater value to our clients in the years to come.
Appropriate risk management remains a priority for QTC, with a comprehensive review of the organisation’s most significant risks. This review is providing QTC with the opportunity to reconsider current approaches to managing risk and will help create a path and vision to improve sustainability, effectiveness and performance.
For the first time in QTC’s history, we put into practice our long-standing and regularly-tested business continuity plan during the January floods. Throughout that challenging time, QTC’s core business remained operational and client and market transactions proceeded as business as usual. As with all ‘live’ situations, some minor improvements were identified to enhance our BCP capability and a full business impact assessment will be completed this year.
Looking forward, economic activity in the State is expected to pick-up as the reconstruction efforts build momentum and a rapid increase in investment in the State occurs, with the expansion of the coal networks and as construction accelerates in the large LNG projects around Gladstone. I am confident the outlook for Queensland, at an aggregate level, is a bright one.
QTC is well positioned and appropriately resourced to address the challenges of managing its sizeable borrowing program in the volatile global market place, as well as the increasing demand from clients for unique and specific financial risk management solutions. I look forward to leading QTC’s dedicated and talented team as we support the State in its rebuilding task, provide funding that ensures Queensland’s ongoing growth, and build our organisation to a point where we can truly say we are partners with our clients in financial sustainability.
PHILIP NOBLE
Chief Executive
QUEENSLAND TREASURY CORPORATION ANNUAL REPORT 2010-2011 11
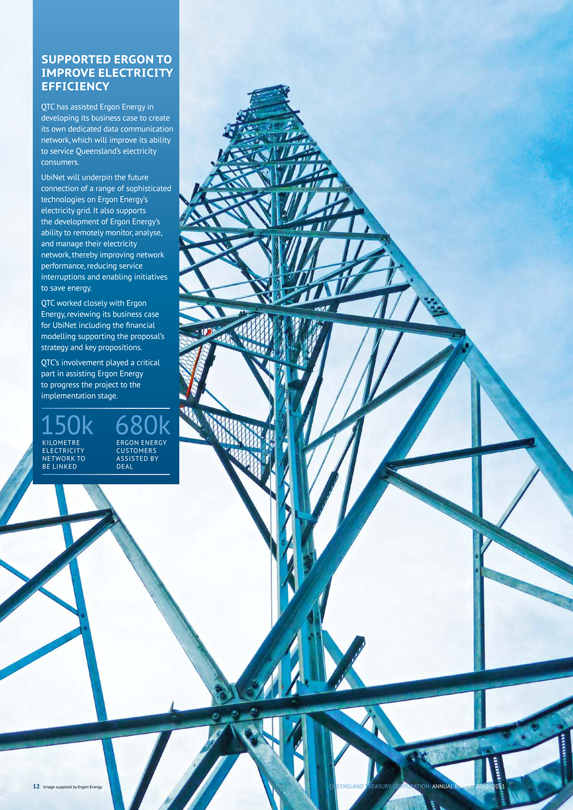
SUPPORTED ERGON TO IMPROVE ELECTRICITY EFFICIENCY
QTC has assisted Ergon Energy in developing its business case to create its own dedicated data communication network, which will improve its ability to service Queensland’s electricity consumers.
UbiNet will underpin the future connection of a range of sophisticated technologies on Ergon Energy’s electricity grid. It also supports the development of Ergon Energy’s ability to remotely monitor, analyse, and manage their electricity network, thereby improving network performance, reducing service interruptions and enabling initiatives to save energy.
QTC worked closely with Ergon Energy, reviewing its business case for UbiNet including the financial modeling supporting the proposal’s strategy and key propositions.
QTC’s involvement played a critical part in assisting Ergon Energy to progress the project to the implementation stage.
150k
KILOMETRE ELECTRICITY NETWORK TO BE LINKED
680k
ERGON ENERGY CUSTOMERS ASSISTED BY DEAL
12 Image supplied by Ergon Energy
QUEENSLAND TREASURY CORPORATION ANNUAL REPORT 2010-2011
QUEENSLAND TREASURY CORPORATION ANNUAL REPORT 2010-2011
QUEENSLAND
TREASURY
CORPORATION
CORPORATE PERFORMANCE REPORT 2010-11
CORPORATE PERFORMANCE REPORT 2010-11
Delivering client value
• QTC generated $484 million of quantifiable savings for clients and the State through its capital market activities and economies of scale that provided them with access to funding at comparatively low interest rates.
• QTC’s cash fund management outperformed its benchmark, the UBS Bank Bill Index, by 50 basis points.
• The client survey found 80% of respondents believe QTC provides better service than other providers, rating ‘value delivered’ at 6.9 out of a possible 10 (where 7 represents ‘best-in-class’, and 10 represents ‘best imaginable’).
Building client loyalty
• Significant focus was devoted to leveraging the implementation of our new client-centric operating model and subsequent internal reorganisation, designed to enhance our engagement with and capacity to service clients.
• Our five-year strategic plan, aligned to the new client-centric model, was developed and progress was made on implementing the supporting initiatives.
• We continued our commitment to seeking ongoing feedback, through post-advisory and client surveys, to ensure our continued focus on client needs and enable continuous improvement.
• In the client survey, clients rated their overall loyalty sentiment to QTC as 8.3 out of 10, with 95% expressing ‘positive’ or ‘extremely positive’ sentiment towards QTC.
• In post-advisory surveys, clients rated QTC an average of 8.5 out of 10 for achieving their outcomes.
Ensuring access to funding
• QTC successfully met clients’ funding requirements despite significant volatility in the global markets.
• The State’s $17 billion borrowing program was funded, which included $2.3 billion sourced in advance of requirement.
• Work was undertaken to improve access to liquidity and lower cost of funds:
• Relationships were strengthened with the 17 financial market intermediaries of our Fixed-Interest Distribution Group, which offers unique access for clients to global financial risk management solutions.
• QTC’s State Government Guaranteed yield curve was re-established following the announcement of the pending withdrawal of the Australian Government guarantee for new debt issued after 31 December 2010.
• QTC undertook a global marketing program to underline the strength and security of investing in Queensland, participating in meetings and conferences with central bank and institutional investors in key markets in Europe, Asia and the Americas, as well as in Australia.
• Investors from 16 significant international markets joined us for the third annual CBA/QTC Australasian Fixed Income Conference. With the aim of promoting investment and highlighting the strength of the State’s continuing economic growth, the conference included a study tour of some of Queensland’s major industries (tourism, mining and major infrastructure).
14
QUEENSLAND TREASURY CORPORATION ANNUAL REPORT 2010-2011
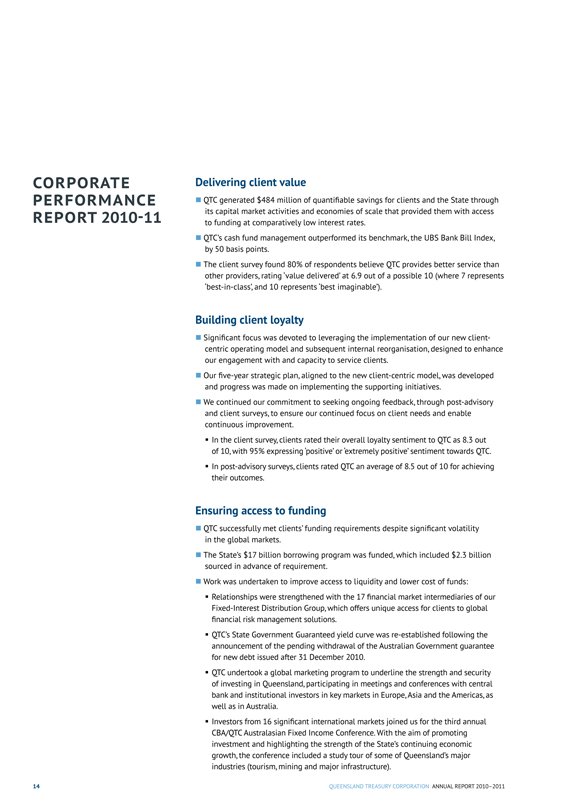
Supported more efficient power generation
QTC has supported the Office of Government-Owned Corporations (OGOC) in its review of the State’s coal-fired electricity generators, which saw three entities merged into two.
QTC’s work covered a six-month period, producing a series of capital structure reviews and complex financial models to analyse various scenarios. The conclusions and recommendations of these reviews informed the financial restructuring of these generator companies.
The Genco Review examined the changing market environment and the risks to Government of maintaining its existing three-entity model, finding the current structure was not sustainable long-term.
The objective of the restructure was to make the two resulting companies–CS Energy and stanwell–more efficient in their operations and equity requirements from the State to ensure value for money for Queenslanders.
Enhancing product offering
• Our new approach to the development, assessment, delivery and measuring of products and services ensured clients received solutions tailored to their individual needs, and contributed to a 25% increase in demand for advisory services.
• QTC’s training courses in financial risk management, corporate finance management, cost of capital and central treasury management provided hands-on opportunities for clients to enhance their own expertise, and was endorsed with excellent client feedback.
• Development continued on the client transaction system that will, when rolled-out, offer clients an enhanced experience and greater efficiency by allowing them to undertake day-to-day management of their own borrowing requirements online.
Managing risk
QTC manages risk within an enterprise-wide framework that supports the achievement of strategic objectives by ensuring risks are effectively identified, evaluated, managed and reported using a consistent, well-understood approach.
• A comprehensive review of the organisation’s key or significant risks was completed to ensure they were identified, understood and managed by appropriate mitigation processes.
• A review of market risk and liability portfolio management was undertaken to look at current approaches and, in light of significant changes in the financial markets, consider ways they could be better managed.
• A framework for internal control assurance was developed, outlining how to design, assess and monitor risk management controls and will provide the Board with greater assurance that risks are effectively managed and mitigated. The framework will be implemented to strengthen QTC’s enterprise-wide risk management program and control environment in the coming year.
QTC reviewed the changing market environment and the risks to Government of maintaining its three-entity model.
QUEENSLAND TREASURY CORPORATION ANNUAL REPORT 2010-2011
15
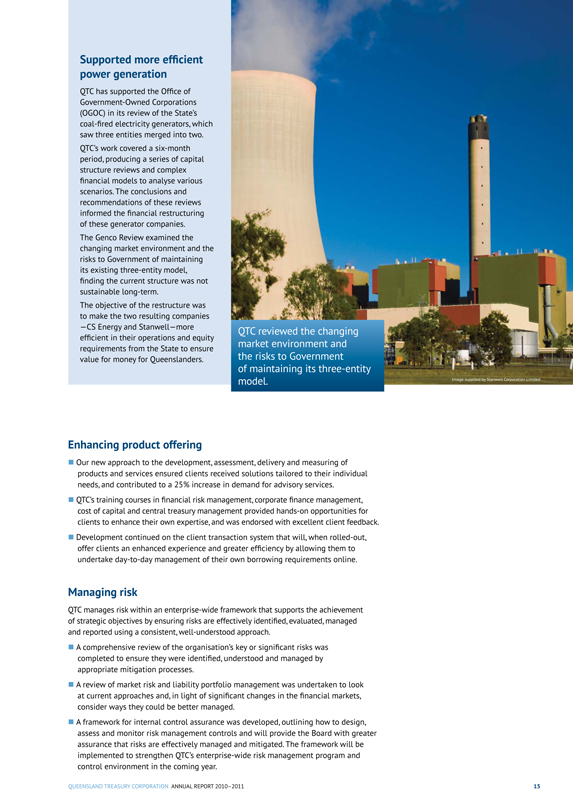
HELPED STANWELL TO MAXIMISE SALE VALUE
QTC’s independent review of the sale process of Stanwell’s Western Australian wind assets–50% each of the Emu Downs Wind Farm and the Badgingarra Wind Development Project-helped the genco achieve an optimum result.
The review assured the Board of Stanwell that the sale, a relatively complex transaction, was structured in a way that would achieve the best price for their asset and appropriately managed the financial risks.
QTC worked alongside Stanwell as the transaction progressed, offering timely strategic advice on a range of complex commercial, financial and legal issues and providing reports shortly after indicative and final offers were made.
This allowed Stanwell to factor QTC’s advice into their decision making and ensure that the necessary approvals were obtained within the sale process deadlines.
The final report was provided to Stanwell’s shareholding Ministers as part of their submission for approval to proceed with the sale.
QUEENSLAND TREASURY CORPORATION ANNUAL REPORT 2010-2011
$171m
SALE PRICE ACHIEVED
80 MEGAWATT WIND FARM
CAN POWER 50,000 HOMES
16 Image supplied by Stanwell Corporation Limited
Building team capacity
Our people and their ability to use their skills and expertise to work with our clients is our greatest strength. In recognising our employees’ criticality to our success, QTC is committed to the ongoing development of a supportive, high-performance culture, characterised by professionalism, communication, learning and pride, and acknowledges the need to proactively retain and attract the right mix of people and skills so that we can achieve our corporate goals and ensure QTC’s sustained business success.
Each of the 220 QTC team members was selected for the skills, knowledge and experience they bring to the organisation. Maintaining an environment where people continually develop their skills and expertise required to create valued client solutions and enhance organisational effectiveness is the cornerstone of our people strategy.
In the year under review, the organisation’s turnover rate was 17.5% (2009-10: 13.5%) and its average employee tenure was 6.01 years (2009-10: 6.19 years). While focusing on the mix of skills and expertise needed to support the newly introduced client-centric operating model, opportunity arose to attract new employees with complementary skill sets.
In the year ahead, we are committed to achieving greater employee engagement and retention, and helping QTC build and sustain its organisational capability, with initiatives underway that will invest in our employees’ potential and their well-being, support our culture, embed our corporate values, and establish attraction strategies.
Strengthening our leadership and management capability is a key priority for the next year, as we strive for consistency and continual learning through our people management practices. This will play a crucial role in developing capacity and skills to support our people and organisational objectives. Driven by a need to ensure a sustainable and resilient organisation, we will implement a targeted leadership development program to build and sustain QTC’s leadership capacity and support employee engagement.
QTC values the input of employees in helping to shape their workplace and, in May 2011, approximately 85% of employees completed the biennial Employee Engagement Survey to share their perceptions of working at QTC. The survey results indicated that employees enjoy their work tasks and the people focus and practices, and identified key areas for further improvement, which included change management, managing performance, and career opportunities.
Looking forward, we will encourage and support our leaders as we strive to create an environment of trust and recognition that leads development of staff capabilities and drives a positive and collaborative organisational culture. Ongoing focus on improving the management of change and performance, as well as the alignment of the performance framework to the client-centric operating model, will be the key inputs for optimising employee engagement.
Through renewed commitment to cross-organisational learning and development initiatives, and using structured learning and professional development programs and experiences, we will promote opportunities to grow and transition our people and further develop their skills and expertise. To support these initiatives, we will also establish a regular process to assess the availability and proficiency of technical and non-technical skills throughout the organisation to ensure we have the required capacity and capability to deliver client solutions.
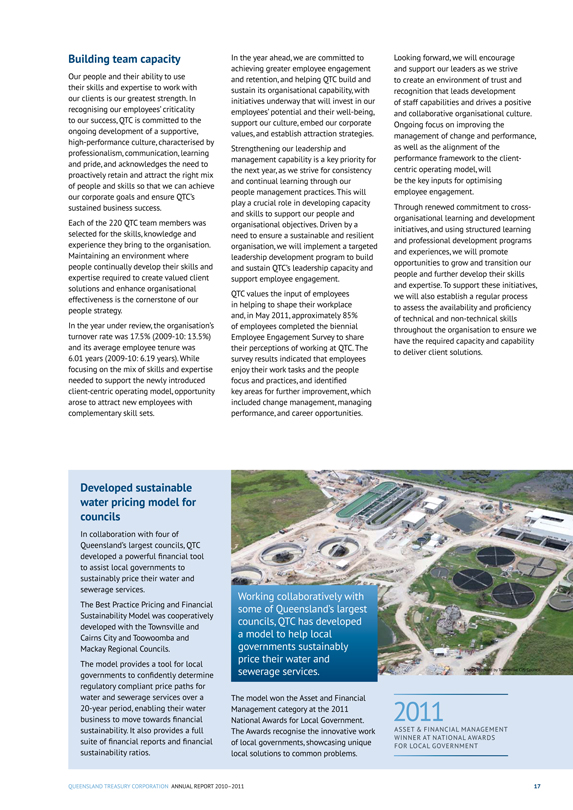
Developed sustainable water pricing model for councils
In collaboration with four of Queensland’s largest councils, QTC developed a powerful financial tool to assist local governments to sustainably price their water and sewerage services.
The Best Practice Pricing and Financial Sustainability Model was cooperatively developed with the Townsville and Cairns City and Toowoomba and Mackay Regional Councils.
The model provides a tool for local governments to confidently determine regulatory compliant price paths for water and sewerage services over a 20-year period, enabling their water business to move towards financial sustainability. It also provides a full suite of financial reports and financial sustainability ratios.
The model won the Asset and Financial Management category at the 2011 National Awards for Local Government. The Awards recognise the innovative work of local governments, showcasing unique local solutions to common problems.
Working collaboratively with some of Queensland’s largest councils, QTC has developed a model to help local governments sustainably price their water and sewerage services.
Image supplied by Townsville City Council
2011
ASSET & FINANCIAL MANAGEMENT WINNER AT NATIONAL AWARDS
FOR LOCAL GOVERNMENT
QUEENSLAND TREASURY CORPORATION ANNUAL REPORT 2010-2011
17
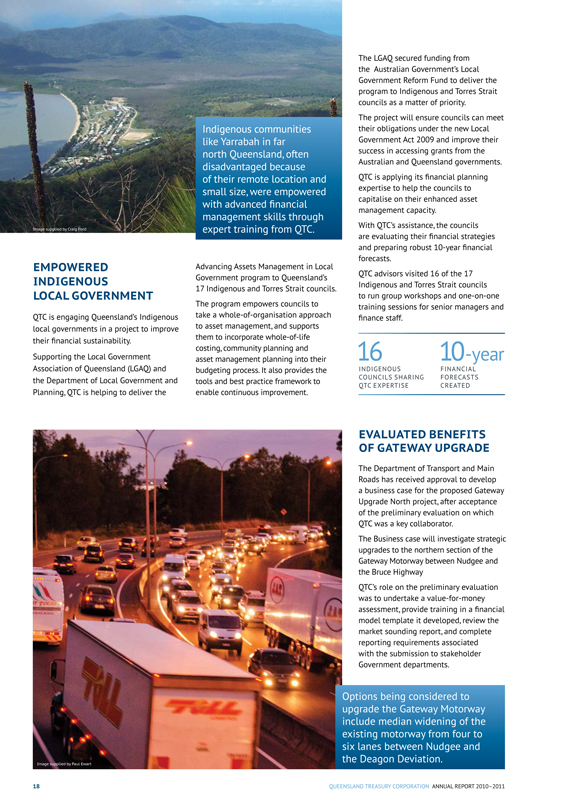
Image supplied by Craig Ford
Indigenous communities like Yarrabah in far north Queensland, often disadvantaged because of their remote location and small size, were empowered with advanced financial management skills through expert training from QTC.
EMPOWERED INDIGENOUS LOCAL GOVERNMENT
QTC is engaging Queensland’s Indigenous local governments in a project to improve their financial sustainability.
Supporting the Local Government Association of Queensland (LGAQ) and the Department of Local Government and Planning, QTC is helping to deliver the
Advancing Assets Management in Local Government program to Queensland’s 17 Indigenous and Torres Strait councils.
The program empowers councils to take a whole-of-organisation approach to asset management, and supports them to incorporate whole-of-life costing, community planning and asset management planning into their budgeting process. It also provides the tools and best practice framework to enable continuous improvement.
The LGAQ secured funding from the Australian Government’s Local Government Reform Fund to deliver the program to Indigenous and Torres Strait councils as a matter of priority.
The project will ensure councils can meet their obligations under the new Local Government Act 2009 and improve their success in accessing grants from the Australian and Queensland governments.
QTC is applying its financial planning expertise to help the councils to capitalise on their enhanced asset management capacity.
With QTC’s assistance, the councils are evaluating their financial strategies and preparing robust 10-year financial forecasts.
QTC advisors visited 16 of the 17 Indigenous and Torres Strait councils to run group workshops and one-on-one training sessions for senior managers and finance staff.
16
INDIGENOUS COUNCILS SHARING QTC EXPERTISE
10-year
FINANCIAL
FORECASTS CREATED
EVALUATED BENEFITS OF GATEWAY UPGRADE
The Department of Transport and Main Roads has received approval to develop a business case for the proposed Gateway Upgrade North project, after acceptance of the preliminary evaluation on which QTC was a key collaborator.
The Business case will investigate strategic upgrades to the northern section of the Gateway Motorway between Nudgee and the Bruce Highway
QTC’s role on the preliminary evaluation was to undertake a value-for-money assessment, provide training in a financial model template it developed, review the market sounding report, and complete reporting requirements associated with the submission to stakeholder Government departments.
Image supplied by Paul Ewart
Options being considered to upgrade the Gateway Motorway include median widening of the existing motorway from four to six lanes between Nudgee and the Deagon Deviation.
18
QUEENSLAND TREASURY CORPORATION ANNUAL REPORT 2010-2011
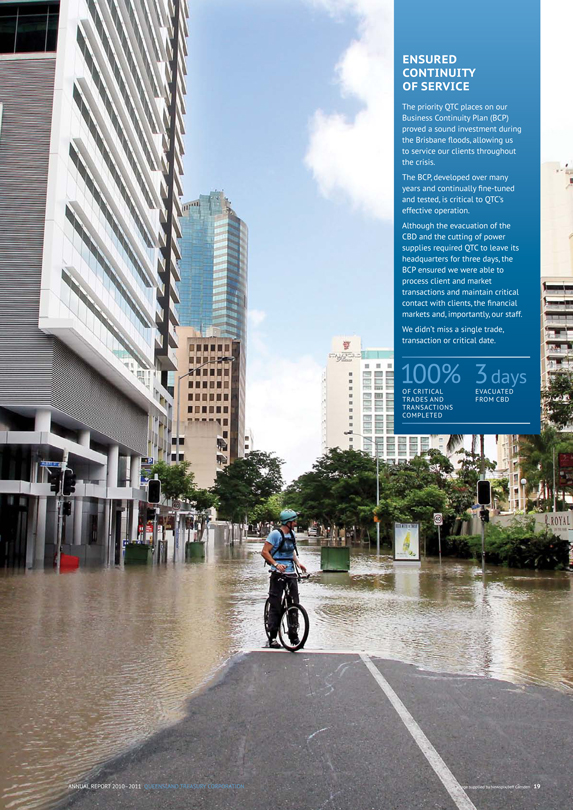
ENSURED CONTINUITY OF SERVICE
The priority QTC places on our Business Continuity Plan (BCP) proved a sound investment during the Brisbane floods, allowing us to service our clients throughout the crisis.
The BCP, developed over many years and continually fine-tuned and tested, is critical to QTC’s effective operation.
Although the evacuation of the CBD and the cutting of power supplies required QTC to leave its headquarters for three days, the BCP ensured we were able to process client and market transactions and maintain critical contact with clients, the financial markets and, importantly, our staff.
We didn’t miss a single trade, transaction or critical date.
100%
OF CRITICAL
TRADES AND
TRANSACTIONS
COMPLETED
3 days EVACUATED
FROM CBD
ANNUAL REPORT 2010-2011 QUEENSLAND TREASURY CORPORATION
Image supplied by Newspix/Jeff Camden 19
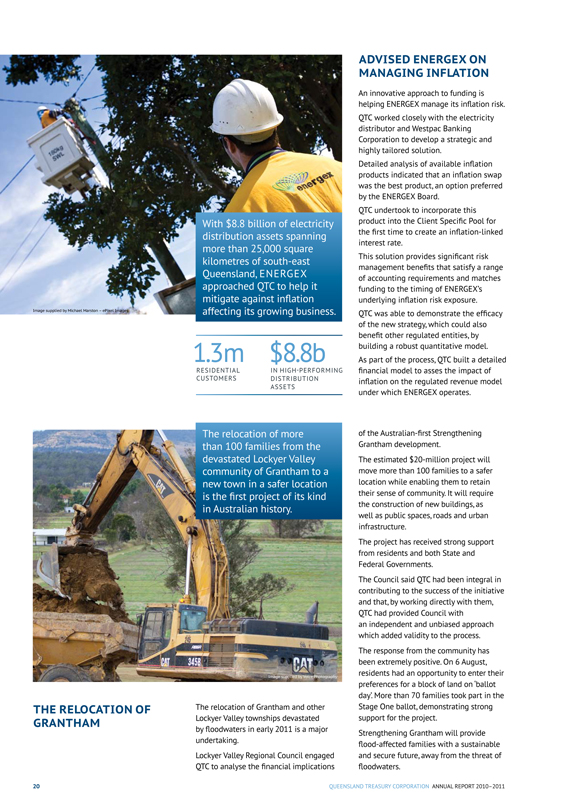
With $8.8 billion of electricity distribution assets spanning more than 25,000 square kilometres of south-east Queensland, ENERGEX approached QTC to help it mitigate against inflation affecting its growing business.
1.3 m
RESIDENTIAL
CUSTOMERS
$8.8b
IN HIGH-PERFORMING
DISTRIBUTION
ASSETS
ADVISED ENERGEX ON MANAGING INFLATION
An innovative approach to funding is helping ENERGEX manage its inflation risk.
QTC worked closely with the electricity distributor and Westpac Banking Corporation to develop a strategic and highly tailored solution.
Detailed analysis of available inflation products indicated that an inflation swap was the best product, an option preferred by the ENERGEX Board.
QTC undertook to incorporate this product into the Client Specific Pool for the first time to create an inflation-linked interest rate.
This solution provides significant risk management benefits that satisfy a range of accounting requirements and matches funding to the timing of ENERGEX’s underlying inflation risk exposure.
QTC was able to demonstrate the efficacy of the new strategy, which could also benefit other regulated entities, by building a robust quantitative model.
As part of the process, QTC built a detailed financial model to asses the impact of inflation on the regulated revenue model under which ENERGEX operates.
The relocation of more than 100 families from the devastated Lockyer Valley community of Grantham to a new town in a safer location is the first project of its kind in Australian history.
THE RELOCATION OF GRANTHAM
The relocation of Grantham and other Lockyer Valley townships devastated by floodwaters in early 2011 is a major undertaking.
Lockyer Valley Regional Council engaged QTC to analyse the financial implications of the Australian-first Strengthening Grantham development.
The estimated $20-million project will move more than 100 families to a safer location while enabling them to retain their sense of community. It will require the construction of new buildings, as well as public spaces, roads and urban infrastructure.
The project has received strong support from residents and both State and Federal Governments.
The Council said QTC had been integral in contributing to the success of the initiative and that, by working directly with them, QTC had provided Council with an independent and unbiased approach which added validity to the process.
The response from the community has been extremely positive. On 6 August, residents had an opportunity to enter their preferences for a block of land on ‘ballot day’. More than 70 families took part in the Stage One ballot, demonstrating strong support for the project.
Strengthening Grantham will provide flood-affected families with a sustainable and secure future, away from the threat of floodwaters.
20
QUEENSLAND TREASURY CORPORATION ANNUAL REPORT 2010-2011
QUEENSLAND
TREASURY
CORPORATION
INVESTOR REPORT
QTC FUNDS THE QUEENSLAND GOVERNMENT PUBLIC
SECTOR
100% GOVERNMENT OWNED
20+ YEARS PROVEN OPERATING EXPERIENCE
09 HIGHLY LIQUID BENCHMARK BOND LINES
SAFE CONSERVATIVE AND TRANSPARENT FUNDING STRATEGIES
AA+ FULL GUARANTEE BY THE STATE OF QUEENSLAND
MOODY’S:
AA1/STABLE/P1
STANDARD AND POOR’S:
AA+/STABLE/A-1+
QUEENSLAND’S
ECONOMIC
HIGHLIGHTS
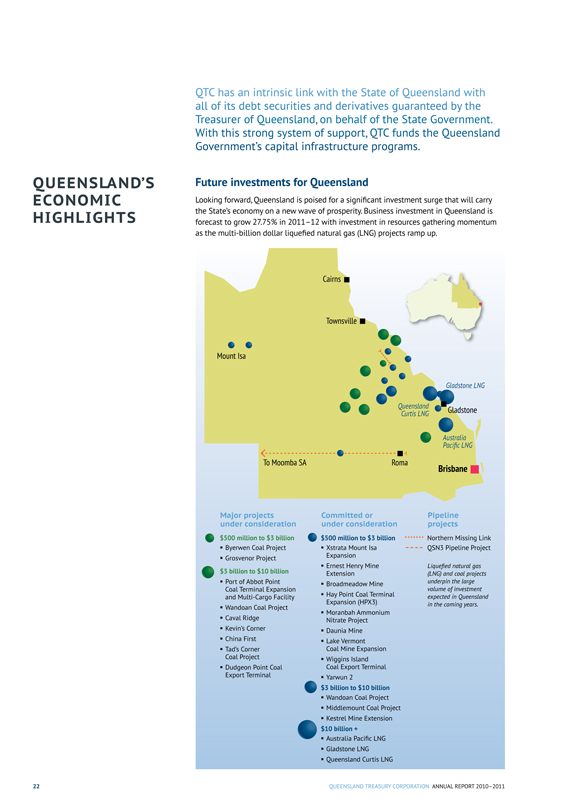
QTC has an intrinsic link with the State of Queensland with all of its debt securities and derivatives guaranteed by the Treasurer of Queensland, on behalf of the State Government. With this strong system of support, QTC funds the Queensland Government’s capital infrastructure programs.
Future investments for Queensland
Looking forward, Queensland is poised for a significant investment surge that will carry the State’s economy on a new wave of prosperity. Business investment in Queensland is forecast to grow 27.75% in 2011-12 with investment in resources gathering momentum as the multi-billion dollar liquefied natural gas (LNG) projects ramp up.
Cairns
Mount Isa
Gladstone LNG
Gladstone
Australia Pacific LNG
To Moomba SA Roma
Brisbane
Major projects under consideration
$500 million to $3 billion
Byerwen Coal Project
Grosvenor Project
$3 billion to $10 billion
Port of Abbot Point Coal Terminal Expansion and Multi-Cargo Facility
Wandoan Coal Project
Caval Ridge
Kevin’s Corner
China First
Tad’s Corner Coal Project
Dudgeon Point Coal Export Terminal
Committed or under consideration
$500 million to $3 billion
Xstrata Mount Isa Expansion
Ernest Henry Mine Extension
Broadmeadow Mine
Hay Point Coal Terminal Expansion (HPX3)
Moranbah Ammonium Nitrate Project
Daunia Mine
Lake Vermont
Coal Mine Expansion
Wiggins Island
Coal Export Terminal
Yarwun 2
$3 billion to $10 billion
Wandoan Coal Project
Middlemount Coal Project
Kestrel Mine Extension
$10 billion +
Australia Pacific LNG
Gladstone LNG
Queensland Curtis LNG
Pipeline projects
Northern Missing Link QSN3 Pipeline Project
Liquefied natural gas (LNG) and coal projects underpin the large volume of investment expected in Queensland in the coming years.
22 QUEENSLAND TREASURY CORPORATION ANNUAL REPORT 2010-2011
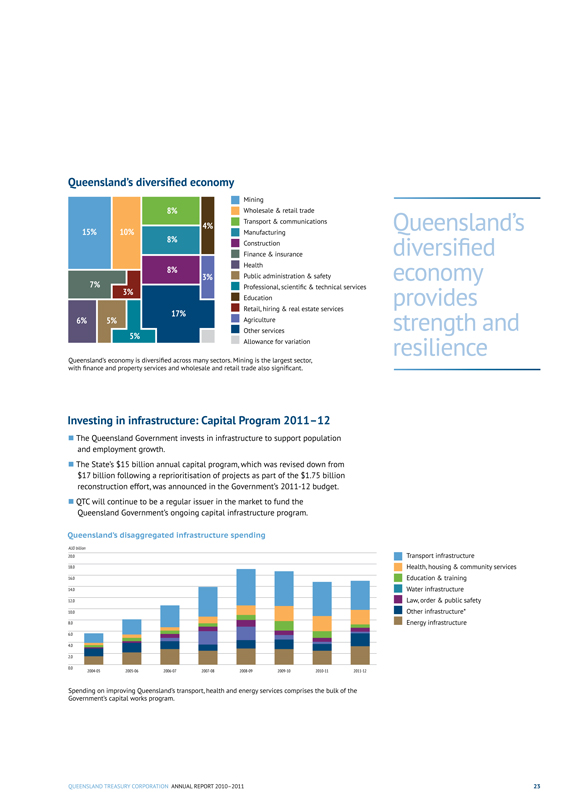
Queensland’s diversified economy
8%
4%
15% 10%
8% 8%
3%
7%
3%
17%
6% 5%
17%
Mining
Wholesale & retail trade
Transport & communications
Manufacturing
Construction
Finance & insurance
Health
Public administration & safety
Professional, scientific & technical services
Education
Retail, hiring & real estate services
Agriculture
Other services
Allowance for variation
Queensland’s economy is diversified across many sectors. Mining is the largest sector, with finance and property services and wholesale and retail trade also significant.
Queensland’s
diversified
economy
provides
strength and
resilience
Investing in infrastructure: Capital Program 2011-12
• The Queensland Government invests in infrastructure to support population and employment growth.
• The State’s $15 billion annual capital program, which was revised down from $17 billion following a reprioritisation of projects as part of the $1.75 billion reconstruction effort, was announced in the Government’s 2011-12 budget.
• QTC will continue to be a regular issuer in the market to fund the Queensland Government’s ongoing capital infrastructure program.
Queensland’s disaggregated infrastructure spending
AUD billion 20.0 18.0 16.0 14.0 12.0 10.0 8.0 6.0 4.0 2.0
0.0 2004-05 2005-06 2006-07 2007-08 2008-09 2009-10 2010-11 2011-12
Transport infrastructure Health, housing & community services Education & training Water infrastructure Law, order & public safety Other infrastructure* Energy infrastructure
Spending on improving Queensland’s transport, health and energy services comprises the bulk of the Government’s capital works program.
QUEENSLAND TREASURY CORPORATION ANNUAL REPORT 2010-2011 23
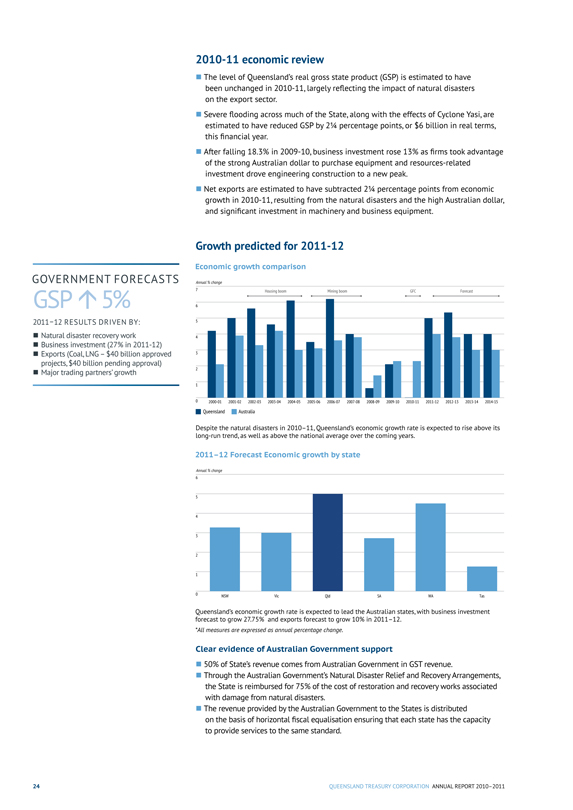
GOVERNMENT FORECASTS
GSP 5%
2011-12 RESULTS DRIVEN BY:
Natural disaster recovery work
Business investment (27% in 2011-12)
Exports (Coal, LNG – $40 billion approved projects, $40 billion pending approval)
Major trading partners’ growth
2010-11 economic review
The level of Queensland’s real gross state product (GSP) is estimated to have been unchanged in 2010-11, largely reflecting the impact of natural disasters on the export sector.
Severe flooding across much of the State, along with the effects of Cyclone Yasi, are estimated to have reduced GSP by 2 1/4 percentage points, or $6 billion in real terms, this financial year.
After falling 18.3% in 2009-10, business investment rose 13% as firms took advantage of the strong Australian dollar to purchase equipment and resources-related investment drove engineering construction to a new peak.
Net exports are estimated to have subtracted 2 1/4 percentage points from economic growth in 2010-11, resulting from the natural disasters and the high Australian dollar, and significant investment in machinery and business equipment.
Growth predicted for 2011-12
Economic growth comparison
Annual % change
7 Housing boom Mining boom GFC Forecast
6
5
4
3
2
1
0 2000-01 2001-02 2002-03 2003-04 2004-05 2005-06 2006-07 2007-08 2008-09 2009-10 2010-11 2011-12 2012-13 2013-14 2014-15
Queensland Australia
Despite the natural disasters in 2010-11, Queensland’s economic growth rate is expected to rise above its long-run trend, as well as above the national average over the coming years.
2011–12 Forecast Economic growth by state
Annual % change
6
5
4
3
2
1
0 NSW Vic Qld SA WA Tas
Queensland’s economic growth rate is expected to lead the Australian states, with business investment forecast to grow 27.75% and exports forecast to grow 10% in 2011-12.
*All measures are expressed as annual percentage change.
Clear evidence of Australian Government support
50% of State’s revenue comes from Australian Government in GST revenue.
Through the Australian Government’s Natural Disaster Relief and Recovery Arrangements, the State is reimbursed for 75% of the cost of restoration and recovery works associated with damage from natural disasters.
The revenue provided by the Australian Government to the States is distributed
on the basis of horizontal fiscal equalisation ensuring that each state has the capacity to provide services to the same standard.
24 QUEENSLAND TREASURY CORPORATION ANNUAL REPORT 2010-2011
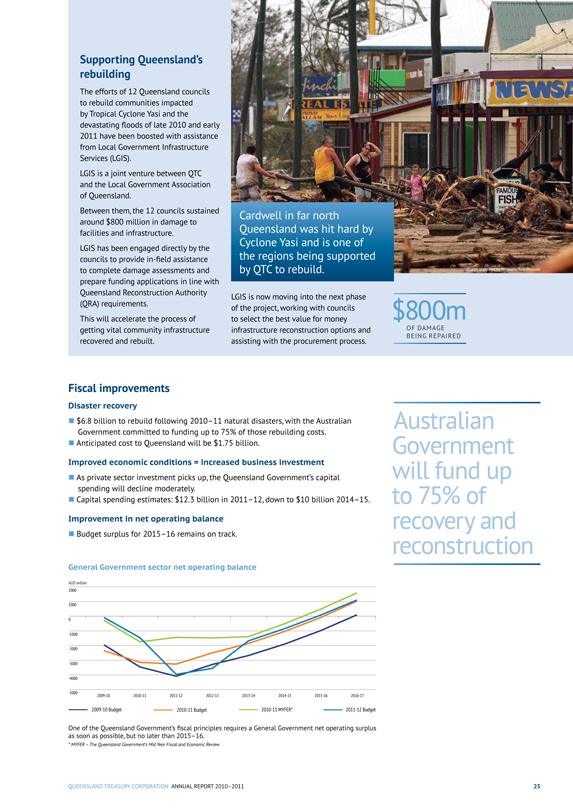
Supporting Queensland’s rebuilding
The efforts of 12 Queensland councils to rebuild communities impacted by Tropical Cyclone Yasi and the devastating floods of late 2010 and early 2011 have been boosted with assistance from Local Government Infrastructure
Services (LGIS).
LGIS is a joint venture between QTC and the Local Government Association of Queensland.
Between them, the 12 councils sustained around $800 million in damage to facilities and infrastructure.
LGIS has been engaged directly by the councils to provide in-field assistance to complete damage assessments and prepare funding applications in line with Queensland Reconstruction Authority (QRA) requirements.
This will accelerate the process of getting vital community infrastructure recovered and rebuilt.
LGIS is now moving into the next phase of the project, working with councils to select the best value for money infrastructure reconstruction options and assisting with the procurement process.
$800m
OF DAMAGE
BEING REPAIRED
Fiscal improvements
Disaster recovery
• $6.8 billion to rebuild following 2010-11 natural disasters, with the Australian Government committed to funding up to 75% of those rebuilding costs.
• Anticipated cost to Queensland will be $1.75 billion.
Improved economic conditions = increased business investment
• As private sector investment picks up, the Queensland Government’s capital spending will decline moderately.
• Capital spending estimates: $12.3 billion in 2011-12, down to $10 billion 2014-15.
Improvement in net operating balance
• Budget surplus for 2015-16 remains on track.
Australian Government
will fund up
to 75% of
recovery and reconstruction
General Government sector net operating balance
AUD million 2000
1000
0
-1000
-2000
-3000
-4000
-5000 2009-10 2010-11 2011-12 2012-13 2013-14 2014-15 2015-16 2016-17 2009-10 Budget-2010-11 Budget-2010-11 MYFER* - 2011-12 Budget
One of the Queensland Government’s fiscal principles requires a General Government net operating surplus as soon as possible, but no later than 2015–16.
* MYFER - The Queensland Government’s Mid Year Fiscal and Economic Review
QUEENSLAND TREASURY CORPORATION ANNUAL REPORT 2010-2011 25
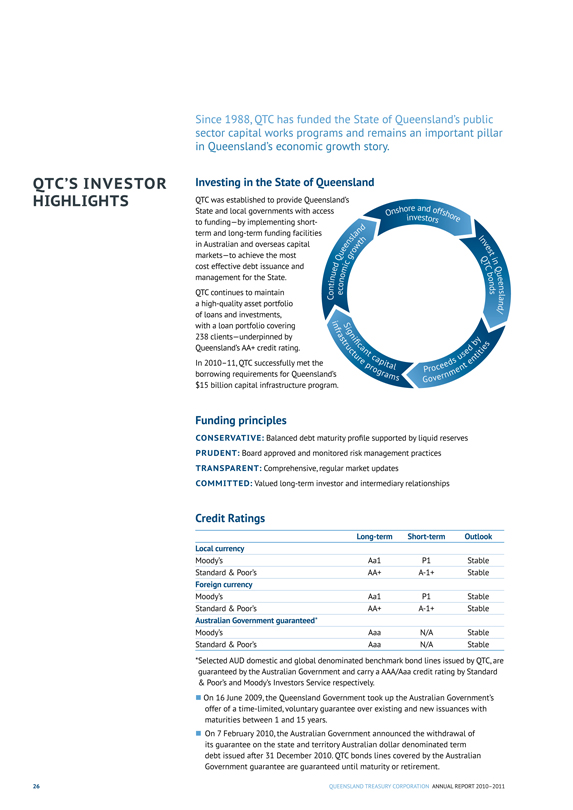
Since 1988, QTC has funded the State of Queensland’s public sector capital works programs and remains an important pillar in Queensland’s economic growth story.
QTC’S INVESTOR HIGHLIGHTS
Investing in the State of Queensland
QTC was established to provide Queensland’s State and local governments with access to funding–by implementing short-term and long-term funding facilities in Australian and overseas capital markets–to achieve the most cost effective debt issuance and management for the State.
QTC continues to maintain a high-quality asset portfolio of loans and investments, with a loan portfolio covering 238 clients–underpinned by Queensland’s AA+ credit rating.
In 2010-11, QTC successfully met the borrowing requirements for Queensland’s $15 billion capital infrastructure program.
Funding principles
CONSERVATIVE: Balanced debt maturity profile supported by liquid reserves PRUDENT: Board approved and monitored risk management practices TRANSPARENT: Comprehensive, regular market updates COMMITTED: Valued long-term investor and intermediary relationships
Credit Ratings
Long-term Short-term Outlook
Local currency
Moody’s Aa1 P1 Stable
Standard & Poor’s AA+ A-1+ Stable
Foreign currency
Moody’s Aa1 P1 Stable
Standard & Poor’s AA+ A-1+ Stable
Australian Government guaranteed*
Moody’s Aaa N/A Stable
Standard & Poor’s Aaa N/A Stable
*Selected AUD domestic and global denominated benchmark bond lines issued by QTC, are guaranteed by the Australian Government and carry a AAA/Aaa credit rating by Standard & Poor’s and Moody’s Investors Service respectively.
On 16 June 2009, the Queensland Government took up the Australian Government’s offer of a time-limited, voluntary guarantee over existing and new issuances with maturities between 1 and 15 years.
On 7 February 2010, the Australian Government announced the withdrawal of its guarantee on the state and territory Australian dollar denominated term debt issued after 31 December 2010. QTC bonds lines covered by the Australian Government guarantee are guaranteed until maturity or retirement.
26
QUEENSLAND TREASURY CORPORATION ANNUAL REPORT 2010-2011
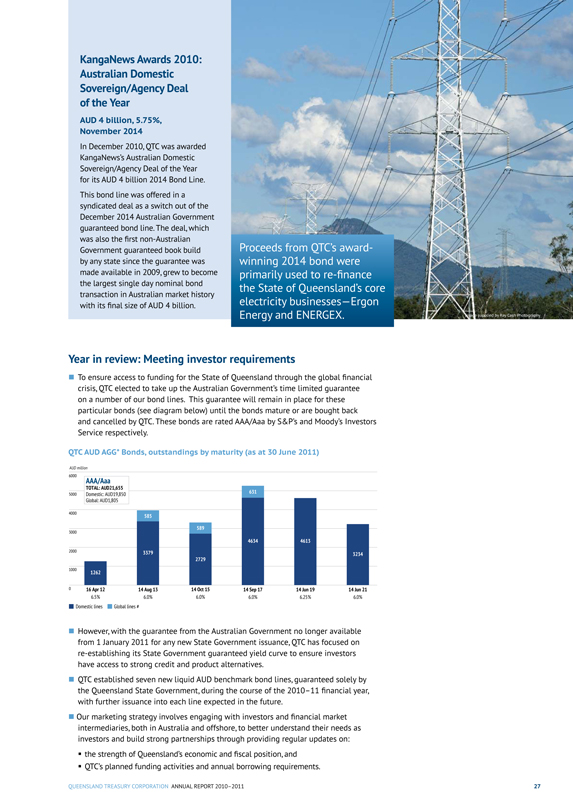
KangaNews Awards 2010: Australian Domestic Sovereign/Agency Deal of the Year
AUD 4 billion, 5.75%, November 2014
In December 2010, QTC was awarded KangaNews’s Australian Domestic Sovereign/Agency Deal of the Year for its AUD 4 billion 2014 Bond Line.
This bond line was offered in a syndicated deal as a switch out of the December 2014 Australian Government guaranteed bond line. The deal, which was also the first non-Australian Government guaranteed book build by any state since the guarantee was made available in 2009, grew to become the largest single day nominal bond transaction in Australian market history with its final size of AUD 4 billion.
Proceeds from QTC’s award-winning 2014 bond were primarily used to re-finance the State of Queensland’s core electricity businesses–Ergon Energy and ENERGEX.
Year in review: Meeting investor requirements
To ensure access to funding for the State of Queensland through the global financial crisis, QTC elected to take up the Australian Government’s time limited guarantee on a number of our bond lines. This guarantee will remain in place for these particular bonds (see diagram below) until the bonds mature or are bought back and cancelled by QTC. These bonds are rated AAA/Aaa by S&P’s and Moody’s Investors Service respectively.
QTC AUD AGG* Bonds, outstandings by maturity (as at 30 June 2011)
AUD million
6000
AAA/Aaa
TOTAL: AUD21,655
5000 Domestic: AUD19,850 Global: AUD1,805 631
4000 585
589
3000 4634 4613
2000 3379 2729 3234
1000 1262
0 16 Apr 12 14 Aug 13 14 Oct 15 14 Sep 17 14 Jun 19 14 Jun 21
6.5% 6.0% 6.0% 6.0% 6.25% 6.0%
Domestic lines Global lines #
However, with the guarantee from the Australian Government no longer available from 1 January 2011 for any new State Government issuance, QTC has focused on re-establishing its State Government guaranteed yield curve to ensure investors have access to strong credit and product alternatives.
QTC established seven new liquid AUD benchmark bond lines, guaranteed solely by the Queensland State Government, during the course of the 2010–11 financial year, with further issuance into each line expected in the future.
Our marketing strategy involves engaging with investors and financial market intermediaries, both in Australia and offshore, to better understand their needs as investors and build strong partnerships through providing regular updates on:
the strength of Queensland’s economic and fiscal position, and
QTC’s planned funding activities and annual borrowing requirements.
QUEENSLAND TREASURY CORPORATION ANNUAL REPORT 2010-2011 27
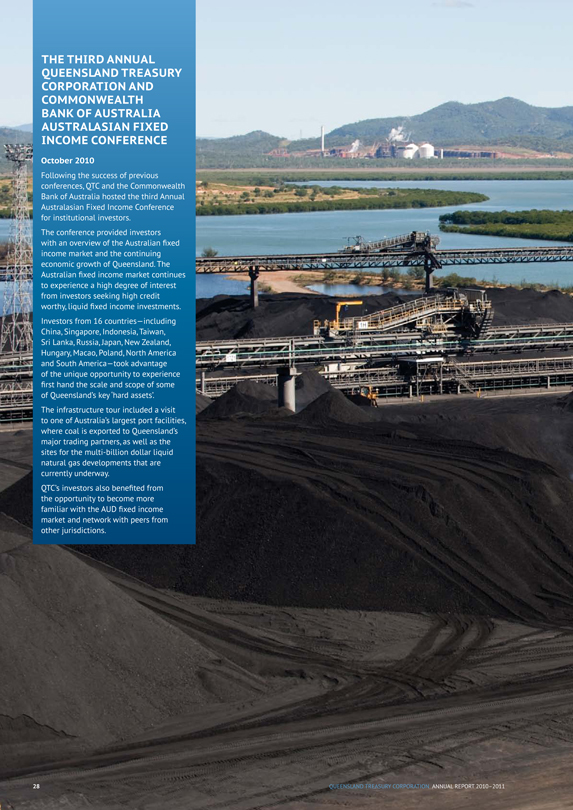
THE THIRD ANNUAL QUEENSLAND TREASURY CORPORATION AND COMMONWEALTH
BANK OF AUSTRALIA AUSTRALASIAN FIXED INCOME CONFERENCE
October 2010
Following the success of previous conferences, QTC and the Commonwealth Bank of Australia hosted the third Annual Australasian Fixed Income Conference for institutional investors.
The conference provided investors with an overview of the Australian fixed income market and the continuing economic growth of Queensland. The Australian fixed income market continues to experience a high degree of interest from investors seeking high credit worthy, liquid fixed income investments.
Investors from 16 countries–including China, Singapore, Indonesia, Taiwan, Sri Lanka, Russia, Japan, New Zealand, Hungary, Macao, Poland, North America and South America–took advantage of the unique opportunity to experience first hand the scale and scope of some of Queensland’s key ‘hard assets’.
The infrastructure tour included a visit to one of Australia’s largest port facilities, where coal is exported to Queensland’s major trading partners, as well as the sites for the multi-billion dollar liquid natural gas developments that are
currently underway.
QTC’s investors also benefited from the opportunity to become more familiar with the AUD fixed income
market and network with peers from
other jurisdictions.
28 QUEENSLAND TREASURY CORPORATION ANNUAL REPORT 2010-2011
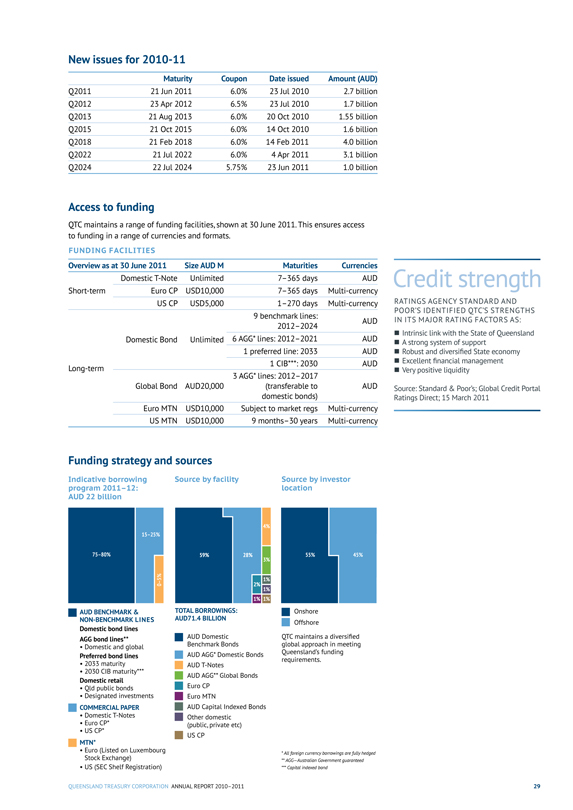
New issues for 2010-11
Maturity Coupon Date issued Amount (AUD)
Q2011 21 Jun 2011 6.0% 23 Jul 2010 2.7 billion
Q2012 23 Apr 2012 6.5% 23 Jul 2010 1.7 billion
Q2013 21 Aug 2013 6.0% 20 Oct 2010 1.55 billion
Q2015 21 Oct 2015 6.0% 14 Oct 2010 1.6 billion
Q2018 21 Feb 2018 6.0% 14 Feb 2011 4.0 billion
Q2022 21 Jul 2022 6.0% 4 Apr 2011 3.1 billion
Q2024 22 Jul 2024 5.75% 23 Jun 2011 1.0 billion
Access to funding
QTC maintains a range of funding facilities, shown at 30 June 2011. This ensures access to funding in a range of currencies and formats.
FUNDING FACILITIES
Overview as at 30 June 2011 Size AUD M Maturities Currencies
Domestic T-Note Unlimited 7-365 days AUD
Short-term Euro CP USD10,000 7-365 days Multi-currency
US CP USD5,000 1-270 days Multi-currency
9 benchmark lines: 2012-2024 AUD
Domestic Bond Unlimited 6 AGG* lines: 2012-2021 AUD
1 preferred line: 2033 AUD
Long-term 1 CIB***: 2030 AUD
Global Bond AUD20,000 3 AGG* lines: 2012-2017 (transferable to domestic bonds) AUD
Euro MTN USD10,000 Subject to market regs Multi-currency
US MTN USD10,000 9 months-30 years Multi-currency
Credit strength
RATINGS AGENCY STANDARD AND POOR’S IDENTIFIED QTC’S STRENGTHS IN ITS MAJOR RATING FACTORS AS:
Intrinsic link with the State of Queensland
A strong system of support
Robust and diversified State economy
Excellent financial management
Very positive liquidity
Source: Standard & Poor’s; Global Credit Portal Ratings Direct; 15 March 2011
Funding strategy and sources
Indicative borrowing program 2011-12:
AUD 22 billion
Source by facility
Source by investor location
AUD BENCHMARK & NON-BENCHMARK LINES
Domestic bond lines
AGG bond lines**
• Domestic and global Preferred bond lines
• 2033 maturity
• 2030 CIB maturity***
Domestic retail
• Qld public bonds
• Designated investments
COMMERCIAL PAPER
• Domestic T-Notes
• Euro CP*
• US CP*
MTN*
• Euro (Listed on Luxembourg Stock Exchange)
• US (SEC Shelf Registration)
TOTAL BORROWINGS: AuD71.4 BILLION
AUD Domestic Benchmark Bonds
AUD AGG* Domestic Bonds
AUD T-Notes
AUD AGG** Global Bonds
Euro CP
Euro MTN
AUD Capital Indexed Bonds
Other domestic (public, private etc)
US CP
Onshore Offshore
QTC maintains a diversified global approach in meeting Queensland’s funding requirements.
* All foreign currency borrowings are fully hedged
** AGG-Australian Government guaranteed
*** Capital indexed bond
QUEENSLAND TREASURY CORPORATION ANNUAL REPORT 2010-2011 29
Strong global partnerships
DEDICATED DISTRIBUTION GROUP
QTC has dedicated dealer panels to ensure investors have choice and reliable access to trade in QTC’s debt securities.
Our Fixed Interest Distribution Group of 17 Banks is committed to making two way pricing in the secondary market for QTC’s bonds, as well as supporting our primary issuance activity.
QTC’s Fixed Interest Distribution Group* includes:
ANZ citi
Bank of America Merrill Lynch
BARCLAYS CAPITAL
BNP PARIBAS
The bank for a changing world
CommonwealthBank
Credit Suisse HSBC RBS
The world’s local bank
J.P.Morgan NOMURA National Australia Bank
RBC Capital Markets*
UBS Westpac
Institutional Bank
*Actual dealer entities may vary depending on the facility and location of the dealer. N.B. HSBCs appointment to be confirmed on completion of legal formalities.
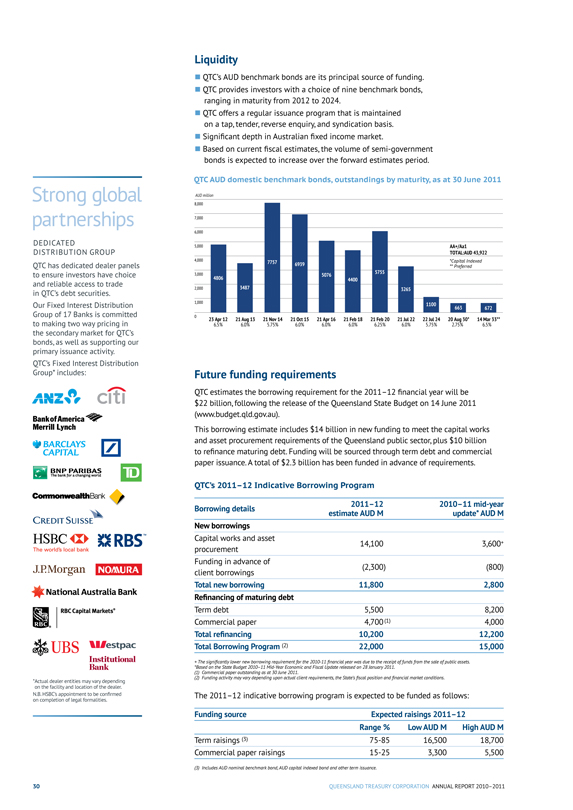
Liquidity
QTC’s AUD benchmark bonds are its principal source of funding.
QTC provides investors with a choice of nine benchmark bonds, ranging in maturity from 2012 to 2024.
QTC offers a regular issuance program that is maintained on a tap, tender, reverse enquiry, and syndication basis.
Significant depth in Australian fixed income market.
Based on current fiscal estimates, the volume of semi-government bonds is expected to increase over the forward estimates period.
QTC AUD domestic benchmark bonds, outstandings by maturity, as at 30 June 2011
AUD million
8,000
7,000
6,000
5,000
AA+/Aa1
TOTAL:AUD 43,922
4,000
7757
6939
*Capital Indexed
** Preferred
3,000
4806
5076
4400
5755
2,000
3487
3265
1,000
1100
0 23 Apr 12 21 Aug 13 21 Nov 14 21 Oct 15 21 Apr 16 21 Feb 18 21 Feb 20 21 Jul 22 22 Jul 24 20 Aug 30* 14 Mar 33**
6.5% 6.0% 5.75% 6.0% 6.0% 6.0% 6.25% 6.0% 5.75% 2.75% 6.5%
Future funding requirements
QTC estimates the borrowing requirement for the 2011-12 financial year will be $22 billion, following the release of the Queensland State Budget on 14 June 2011 (www.budget.qld.gov.au).
This borrowing estimate includes $14 billion in new funding to meet the capital works and asset procurement requirements of the Queensland public sector, plus $10 billion to refinance maturing debt. Funding will be sourced through term debt and commercial paper issuance. A total of $2.3 billion has been funded in advance of requirements.
QTC’s 2011-12 Indicative Borrowing Program
Borrowing details 2011-12 2010-11 mid-year
estimate AUD M update* AUD M
New borrowings
Capital works and asset procurement 14,100 3,600+
Funding in advance of client borrowings(2,300)(800)
Total new borrowing 11,800 2,800
Refinancing of maturing debt
Term debt 5,500 8,200
Commercial paper 4,700(1) 4,000
Total refinancing 10,200 12,200
Total Borrowing Program (2) 22,000 15,000
+ The significantly lower new borrowing requirement for the 2010-11 financial year was due to the receipt of funds from the sale of public assets. *Based on the State Budget 2010-11 Mid-Year Economic and Fiscal Update released on 28 January 2011.
(1) Commercial paper outstanding as at 30 June 2011.
(2) Funding activity may vary depending upon actual client requirements, the State’s fiscal position and financial market conditions.
The 2011-12 indicative borrowing program is expected to be funded as follows:
Funding source Expected raisings 2011-12
Range % Low AUD M High AUD M
Term raisings (3) 75-85 16,500 18,700
Commercial paper raisings 15-25 3,300 5,500
(3) Includes AUD nominal benchmark bond, AUD capital indexed bond and other term issuance.
30 QUEENSLAND TREASURY CORPORATION ANNUAL REPORT 2010-2011
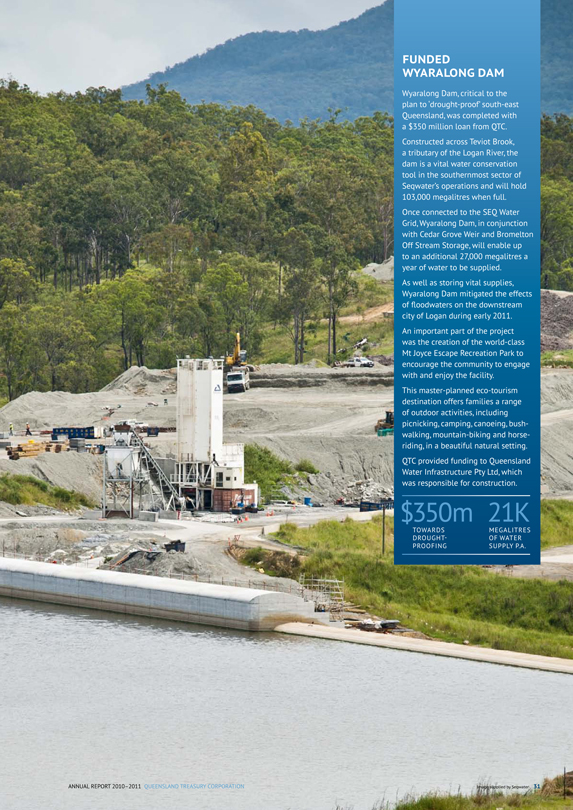
FUNDED
WYARALONG DAM
Wyaralong Dam, critical to the plan to ‘drought-proof south-east Queensland, was completed with a $350 million loan from QTC.
Constructed across Teviot Brook, a tributary of the Logan River, the dam is a vital water conservation tool in the southernmost sector of Seqwater’s operations and will hold 103,000 megalitres when full.
Once connected to the SEQ Water Grid, Wyaralong Dam, in conjunction with Cedar Grove Weir and Bromelton Off Stream Storage, will enable up to an additional 27,000 megalitres a year of water to be supplied.
As well as storing vital supplies, Wyaralong Dam mitigated the effects of floodwaters on the downstream city of Logan during early 2011.
An important part of the project was the creation of the world-class Mt Joyce Escape Recreation Park to encourage the community to engage with and enjoy the facility.
This master-planned eco-tourism destination offers families a range of outdoor activities, including picnicking, camping, canoeing, bush-walking, mountain-biking and horse-riding, in a beautiful natural setting.
QTC provided funding to Queensland Water Infrastructure Pty Ltd, which was responsible for construction.
$350m 21K
TOWARDS DROUGHT-PROOFING
MEGALITRES OF WATER SUPPLY P.A.
ANNUAL REPORT 2010-2011 QUEENSLAND TREASURY CORPORATION
Image supplied by Seqwater 31
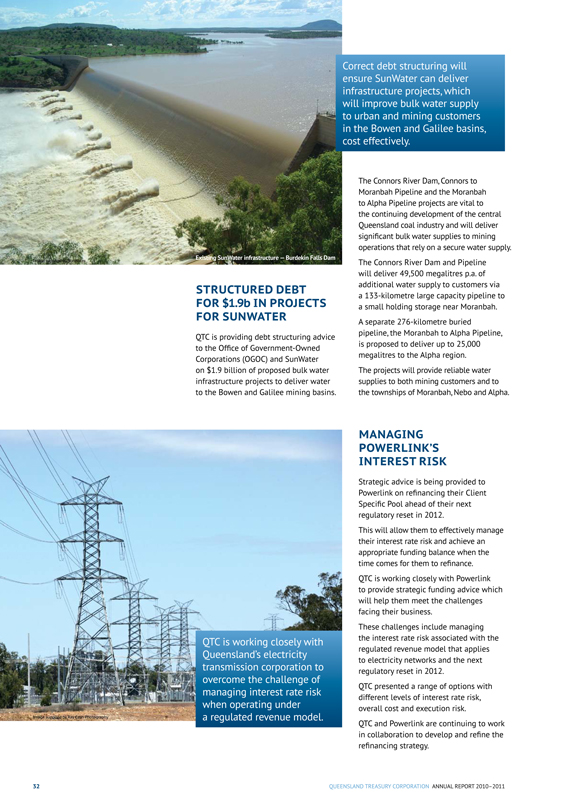
Existing SunWater infrastructure — Burdekin Falls Dam
STRUCTURED DEBT FOR $1.9b IN PROJECTS FOR SUNWATER
QTC is providing debt structuring advice to the Office of Government-Owned Corporations (OGOC) and SunWater on $1.9 billion of proposed bulk water infrastructure projects to deliver water to the Bowen and Galilee mining basins.
The Connors River Dam, Connors to Moranbah Pipeline and the Moranbah to Alpha Pipeline projects are vital to the continuing development of the central Queensland coal industry and will deliver significant bulk water supplies to mining operations that rely on a secure water supply.
The Connors River Dam and Pipeline will deliver 49,500 megalitres p.a. of additional water supply to customers via a 133-kilometre large capacity pipeline to a small holding storage near Moranbah.
A separate 276-kilometre buried pipeline, the Moranbah to Alpha Pipeline, is proposed to deliver up to 25,000 megalitres to the Alpha region.
The projects will provide reliable water supplies to both mining customers and to the townships of Moranbah, Nebo and Alpha.
QTC is working closely with Queensland’s electricity transmission corporation to overcome the challenge of managing interest rate risk when operating under a regulated revenue model.
MANAGING
POWERLINK’S INTEREST RISK
Strategic advice is being provided to Powerlink on refinancing their Client Specific Pool ahead of their next regulatory reset in 2012.
This will allow them to effectively manage their interest rate risk and achieve an appropriate funding balance when the time comes for them to refinance.
QTC is working closely with Powerlink to provide strategic funding advice which will help them meet the challenges facing their business.
These challenges include managing the interest rate risk associated with the regulated revenue model that applies to electricity networks and the next regulatory reset in 2012.
QTC presented a range of options with different levels of interest rate risk, overall cost and execution risk.
QTC and Powerlink are continuing to work in collaboration to develop and refine the refinancing strategy.
32 QUEENSLAND TREASURY CORPORATION ANNUAL REPORT 2010-2011
QUEENSLAND
TREASURY
CORPORATION
CORPORATE
GOVERNANCE
CORPORATE GOVERNANCE
CORPORATE GOVERNANCE
Queensland Treasury Corporation (QTC) is committed to maintaining high standards of corporate governance to support its strong market reputation and ensure that organisational goals are met, and risks are monitored and appropriately addressed. QTC’s corporate governance practices are continually reviewed and updated in line with industry guidelines and standards.
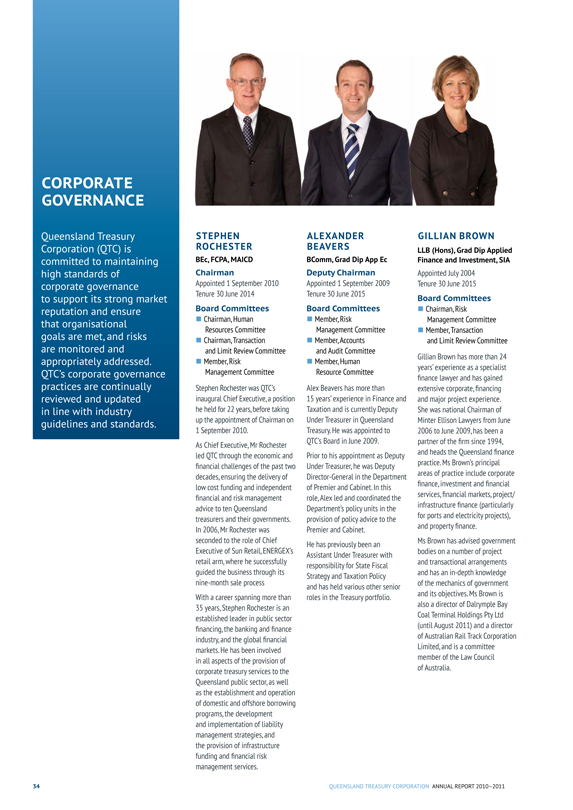
STEPHEN ROCHESTER
BEc, FCPA, MAICD Chairman
Appointed 1 September 2010 Tenure 30 June 2014
Board Committees
Chairman, Human Resources Committee
Chairman, Transaction and Limit Review Committee
Member, Risk Management Committee
Stephen Rochester was QTC’s inaugural Chief Executive, a position he held for 22 years, before taking up the appointment of Chairman on 1 September 2010.
As Chief Executive, Mr Rochester led QTC through the economic and financial challenges of the past two decades, ensuring the delivery of low cost funding and independent financial and risk management advice to ten Queensland treasurers and their governments. In 2006, Mr Rochester was seconded to the role of Chief Executive of Sun Retail, ENERGEX’s retail arm, where he successfully guided the business through its nine-month sale process
With a career spanning more than 35 years, Stephen Rochester is an established leader in public sector financing, the banking and finance industry, and the global financial markets. He has been involved in all aspects of the provision of corporate treasury services to the Queensland public sector, as well as the establishment and operation of domestic and offshore borrowing programs, the development and implementation of liability management strategies, and the provision of infrastructure funding and financial risk management services.
ALEXANDER BEAVERS
BComm, Grad Dip App Ec
Deputy Chairman
Appointed 1 September 2009 Tenure 30 June 2015
Board Committees
Member, Risk Management Committee
Member, Accounts and Audit Committee
Member, Human Resource Committee
Alex Beavers has more than 15 years’ experience in Finance and Taxation and is currently Deputy Under Treasurer in Queensland Treasury. He was appointed to
QTC’s Board in June 2009.
Prior to his appointment as Deputy Under Treasurer, he was Deputy Director-General in the Department of Premier and Cabinet. In this role, Alex led and coordinated the Department’s policy units in the provision of policy advice to the Premier and Cabinet.
He has previously been an Assistant Under Treasurer with responsibility for State Fiscal Strategy and Taxation Policy and has held various other senior roles in the Treasury portfolio.
GILLIAN BROWN
LLB (Hons), Grad Dip Applied Finance and Investment, SIA
Appointed July 2004 Tenure 30 June 2015
Board Committees
Chairman, Risk Management Committee
Member, Transaction
and Limit Review Committee
Gillian Brown has more than 24 years’ experience as a specialist finance lawyer and has gained extensive corporate, financing and major project experience. She was national Chairman of Minter Ellison Lawyers from June 2006 to June 2009, has been a partner of the firm since 1994, and heads the Queensland finance practice. Ms Brown’s principal areas of practice include corporate finance, investment and financial services, financial markets, project/ infrastructure finance (particularly for ports and electricity projects), and property finance.
Ms Brown has advised government bodies on a number of project and transactional arrangements and has an in-depth knowledge of the mechanics of government and its objectives. Ms Brown is also a director of Dalrymple Bay Coal Terminal Holdings Pty Ltd (until August 2011) and a director of Australian Rail Track Corporation Limited, and is a committee member of the Law Council of Australia.
34 QUEENSLAND TREASURY CORPORATION ANNUAL REPORT 2010-2011
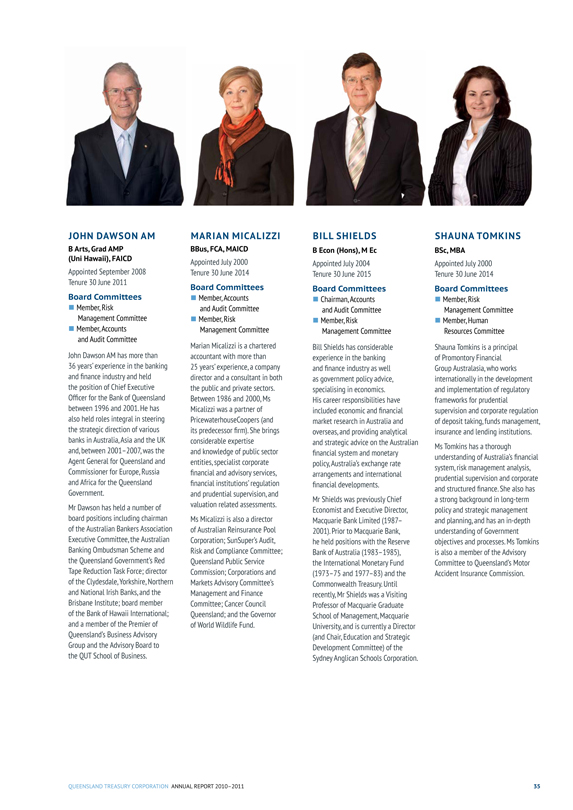
JOHN DAWSON AM
B Arts, Grad AMP
(Uni Hawaii), FAICD
Appointed September 2008 Tenure 30 June 2011
Board Committees
Member, Risk Management Committee
Member, Accounts and Audit Committee
John Dawson AM has more than 36 years’ experience in the banking and finance industry and held the position of Chief Executive Officer for the Bank of Queensland between 1996 and 2001. He has also held roles integral in steering the strategic direction of various banks in Australia, Asia and the UK and, between 2001-2007, was the Agent General for Queensland and Commissioner for Europe, Russia and Africa for the Queensland Government.
Mr Dawson has held a number of board positions including chairman of the Australian Bankers Association Executive Committee, the Australian Banking Ombudsman Scheme and the Queensland Government’s Red Tape Reduction Task Force; director of the Clydesdale, Yorkshire, Northern and National Irish Banks, and the Brisbane Institute; board member of the Bank of Hawaii International; and a member of the Premier of Queensland’s Business Advisory Group and the Advisory Board to the QUT School of Business.
MARIAN MICALIZZI
BBus, FCA, MAICD
Appointed July 2000 Tenure 30 June 2014
Board Committees
Member, Accounts and Audit Committee
Member, Risk Management Committee
Marian Micalizzi is a chartered accountant with more than 25 years’ experience, a company director and a consultant in both the public and private sectors.
Between 1986 and 2000, Ms
Micalizzi was a partner of PricewaterhouseCoopers (and its predecessor firm). She brings considerable expertise and knowledge of public sector entities, specialist corporate financial and advisory services, financial institutions’ regulation and prudential supervision, and valuation related assessments.
Ms Micalizzi is also a director of Australian Reinsurance Pool Corporation; SunSuper’s Audit, Risk and Compliance Committee; Queensland Public Service Commission; Corporations and Markets Advisory Committee’s Management and Finance Committee; Cancer Council Queensland; and the Governor of World Wildlife Fund.
BILL SHIELDS
B Econ (Hons), M Ec
Appointed July 2004 Tenure 30 June 2015
Board Committees
Chairman, Accounts and Audit Committee
Member, Risk Management Committee
Bill Shields has considerable experience in the banking and finance industry as well as government policy advice, specialising in economics. His career responsibilities have included economic and financial market research in Australia and overseas, and providing analytical and strategic advice on the Australian financial system and monetary policy, Australia’s exchange rate arrangements and international financial developments.
Mr Shields was previously Chief Economist and Executive Director, Macquarie Bank Limited (1987-2001). Prior to Macquarie Bank, he held positions with the Reserve Bank of Australia (1983-1985), the International Monetary Fund (1973-75 and 1977-83) and the Commonwealth Treasury. Until recently, Mr Shields was a Visiting Professor of Macquarie Graduate School of Management, Macquarie University, and is currently a Director (and Chair, Education and Strategic Development Committee) of the Sydney Anglican Schools Corporation.
SHAUNA TOMKINS
BSc, MBA
Appointed July 2000 Tenure 30 June 2014
Board Committees
Member, Risk Management Committee
Member, Human Resources Committee
Shauna Tomkins is a principal of Promontory Financial Group Australasia, who works internationally in the development and implementation of regulatory frameworks for prudential supervision and corporate regulation of deposit taking, funds management, insurance and lending institutions.
Ms Tomkins has a thorough understanding of Australia’s financial system, risk management analysis, prudential supervision and corporate and structured finance. She also has a strong background in long-term policy and strategic management and planning, and has an in-depth understanding of Government objectives and processes. Ms Tomkins is also a member of the Advisory Committee to Queensland’s Motor Accident Insurance Commission.
QUEENSLAND TREASURY CORPORATION ANNUAL REPORT 2010-2011 35
QTC’S FOUNDATION CHAIRMAN
SIR LEO HIELSCHER AC
BComm, D Univ Griffith (Hon), FAIM,
FCPA, FFTP (Hon)
Foundation Chairman Appointed on 1 July 2010, following retirement from the role of Chairman on 30 June 2010 that he held for 22 years.
Sir Leo Hielscher AC has 68 years’ experience in the areas of Government, the banking and finance industry, domestic and global financial markets, the superannuation industry and as an independent company director.
He was the Under Treasurer of Queensland for 14 years (1974-1988) before his appointment as Chairman of the Queensland Treasury Corporation (Advisory Board) in 1988. In 1991, the Advisory Board became the Queensland Treasury Corporation Board and Sir Leo was appointed as its inaugural Chairman. Sir Leo was awarded an Eisenhower Fellowship in 1973, a Knight Bachelor in 1987, an Honorary Doctorate of Griffith University in 1993, and a Companion in the Order of Australia (AC) in the General Division in 2004. He was honoured as a ‘Queensland Great’ by the Queensland Government in 2007.
QTC and its Boards
QTC was established by the Queensland Treasury Corporation Act 1988 (QTC Act) as a corporation sole (ie, a corporation that consists solely of a nominated office holder). The Under Treasurer of Queensland is QTC’s nominated office holder.
QTC has delegated its powers to its two boards:
the Queensland Treasury Corporation Capital Markets Board (the Board), which was established in 1991 and manages all of QTC’s affairs except those relating to certain superannuation and other long-term assets, and
the Long Term Asset Advisory Board, which was established in July 2008 and advises in relation to certain superannuation and other long-term assets that were transferred to QTC from Queensland Treasury on 1 July 2008.
Board responsibilities
QTC and the Board have agreed the terms and administrative arrangements for the exercise of the powers that have been delegated to the Board by QTC (as the corporation sole).
The Board operates in accordance with its charter, which sets out its commitment to various corporate governance principles and standards, the roles and responsibilities of the Board and its members (based on its delegated powers), and the conduct of meetings. The charter provides that the role and functions of the Board include:
overseeing QTC’s operations, including its control and accountability systems
developing and monitoring QTC’s strategic and corporate plans, operational policy and yearly budget
monitoring and measuring financial and operational performance
monitoring and measuring organisational and staff performance
monitoring key risks and risk management processes, and
ensuring that QTC’s compliance
is appropriate for an organisation of its type.
The Board holds monthly meetings (except in January) and may, whenever necessary, hold additional meetings.
Board appointments
The Board comprises seven directors who are appointed by the Governor-in-Council, pursuant to section 10(2) of the QTC Act, with consideration given to each Board member’s qualifications, experience, skills, strategic ability, and commitment to contribute to QTC’s performance and achievement of its corporate objectives. QTC’s Chairman is a non-executive director, and the Board is entirely constituted of non-executive directors.
Conflicts of interest
Board members are required to monitor and disclose any actual or potential conflicts of interest. Unless the Board determines otherwise, a conflicted Board member may not receive any Board papers, attend any meetings or take part in any decisions relating to declared interests.
Performance and remuneration
In order to ensure continuous improvement and to enhance overall effectiveness, the Board conducts an annual assessment of the performance of the Board as a whole.
Board members’ remuneration is determined by the Governor-in-Council (details are disclosed in QTC’s financial statements).
36
QUEENSLAND TREASURY CORPORATION ANNUAL REPORT 2010-2011
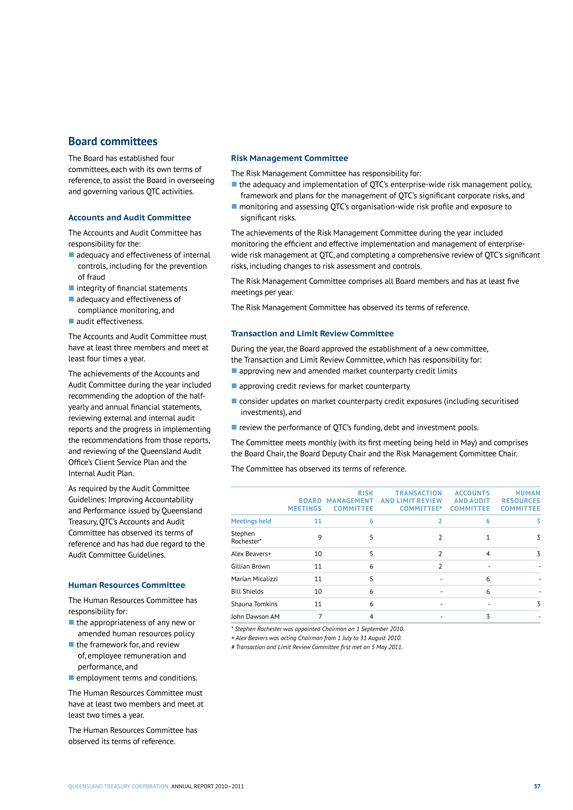
Board committees
The Board has established four committees, each with its own terms of reference, to assist the Board in overseeing and governing various QTC activities.
Accounts and Audit Committee
The Accounts and Audit Committee has responsibility for the:
adequacy and effectiveness of internal controls, including for the prevention of fraud
integrity of financial statements
adequacy and effectiveness of compliance monitoring, and
audit effectiveness.
The Accounts and Audit Committee must have at least three members and meet at least four times a year.
The achievements of the Accounts and Audit Committee during the year included recommending the adoption of the half-yearly and annual financial statements, reviewing external and internal audit reports and the progress in implementing the recommendations from those reports, and reviewing of the Queensland Audit Office’s Client Service Plan and the Internal Audit Plan.
As required by the Audit Committee Guidelines: Improving Accountability and Performance issued by Queensland Treasury, QTC’s Accounts and Audit Committee has observed its terms of reference and has had due regard to the Audit Committee Guidelines.
Human Resources Committee
The Human Resources Committee has responsibility for:
the appropriateness of any new or amended human resources policy
the framework for, and review of, employee remuneration and performance, and
employment terms and conditions.
The Human Resources Committee must have at least two members and meet at least two times a year.
The Human Resources Committee has observed its terms of reference.
Risk Management Committee
The Risk Management Committee has responsibility for:
the adequacy and implementation of QTC’s enterprise-wide risk management policy, framework and plans for the management of QTC’s significant corporate risks, and
monitoring and assessing QTC’s organisation-wide risk profile and exposure to significant risks.
The achievements of the Risk Management Committee during the year included monitoring the efficient and effective implementation and management of enterprise-wide risk management at QTC, and completing a comprehensive review of QTC’s significant risks, including changes to risk assessment and controls.
The Risk Management Committee comprises all Board members and has at least five meetings per year.
The Risk Management Committee has observed its terms of reference. Transaction and Limit Review Committee
During the year, the Board approved the establishment of a new committee, the Transaction and Limit Review Committee, which has responsibility for:
approving new and amended market counterparty credit limits
approving credit reviews for market counterparty
consider updates on market counterparty credit exposures (including securitised investments), and
review the performance of QTC’s funding, debt and investment pools.
The Committee meets monthly (with its first meeting being held in May) and comprises the Board Chair, the Board Deputy Chair and the Risk Management Committee Chair.
The Committee has observed its terms of reference.
RISK TRANSACTION ACCOUNTS HUMAN
BOARD MANAGEMENT AND LIMIT REVIEW AND AUDIT RESOURCES
MEETINGS COMMITTEE COMMITTEE* COMMITTEE COMMITTEE
Meetings held 11 6 2 6 3
Stephen Rochester* 9 5 2 1 3
Alex Beavers+ 10 5 2 4 3
Gillian Brown 11 6 2 - -
Marian Micalizzi 11 5 - 6 -
Bill Shields 10 6 - 6 -
Shauna Tomkins 11 6 - - 3
John Dawson AM 7 4 - 3 -
* Stephen Rochester was appointed Chairman on 1 September 2010. + Alex Beavers was acting Chairman from 1 July to 31 August 2010.
# Transaction and Limit Review Committee first met on 5 May 2011.
QUEENSLAND TREASURY CORPORATION ANNUAL REPORT 2010-2011
37
Auditors
In accordance with the provisions of the Auditor-General Act 2009, the Queensland Audit Office is the external auditor for QTC. The Queensland Audit Office has the responsibility for providing Queensland’s Parliament with assurances as to the adequacy of QTC’s discharge of its financial and administrative obligations.
QTC has an independent Internal Audit function, which is currently outsourced to KPMG, that reports to the Board’s Accounts and Audit Committee. Internal audit is conducted under an Internal Audit Charter, which is consistent with relevant audit and ethical standards and states that the role of internal audit is to support QTC’s corporate governance framework by providing the Board (through the Accounts and Audit Committee) with:
assurance that QTC has effective, adequate and efficient internal controls in place to support the achievement of its objectives, including the management of risk, and
advice with respect to QTC’s internal controls and business processes.
Internal Audit is responsible for:
developing an annual audit plan, based on the assessment of financial and business risks, (based on QTC’s approved significant risks and workshops) aligned with QTC’s strategic goals and objectives, and approved by the QTC Accounts and Audit Committee
providing regular audit reports and periodic program management reports to the management team, and the QTC Accounts and Audit Committee, and
working constructively with QTC’s management team to challenge and improve established and proposed practices and to put forward ideas for process improvement.
In the year under review, KPMG completed its internal audits in accordance with the approved annual audit plan. The internal audit function had due regard to Queensland Treasury’s Audit Committee guidelines.
Long Term Asset Advisory Board
The Long Term Asset Advisory Board (LTAAB) was established in July 2008, following the transfer of certain superannuation and other long-term assets from Treasury to QTC (primarily for reasons relating to market volatility).
The LTAAB has power delegated from QTC to:
manage the sufficiency of the funding of the long-term assets
set investment objectives and strategies for the long-term assets
set the appropriate investment structure for the long-term assets, and
monitor investment performance of the long-term assets.
LTAAB MEETINGS
The members of LTAAB are:
Name Position
Under Treasurer Chairperson
Chief Executive, QSuper Member
State Actuary Member
Assistant Under Treasurer Member
Assistant Under Treasurer Member
Deputy Under Treasurer Member
38
QUEENSLAND TREASURY CORPORATION ANNUAL REPORT 2010-2011
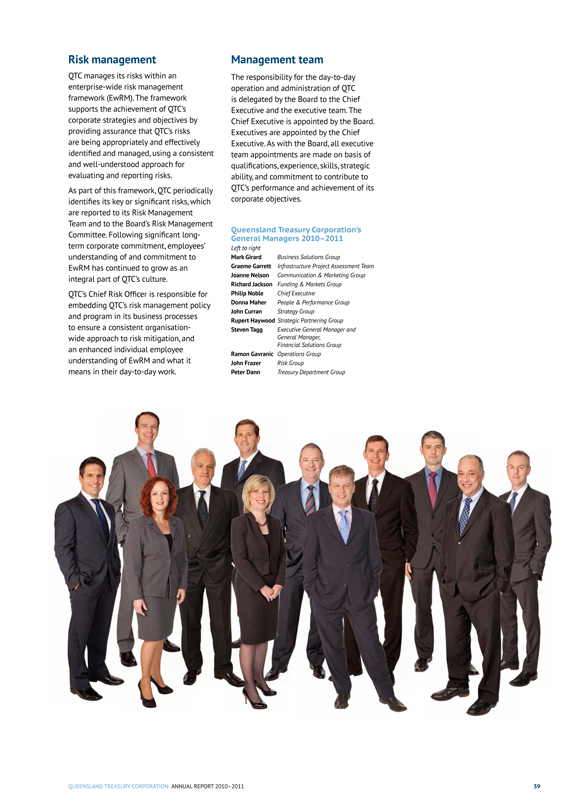
Risk management
QTC manages its risks within an enterprise-wide risk management framework (EwRM). The framework supports the achievement of QTC’s corporate strategies and objectives by providing assurance that QTC’s risks are being appropriately and effectively identified and managed, using a consistent and well-understood approach for evaluating and reporting risks.
As part of this framework, QTC periodically identifies its key or significant risks, which are reported to its Risk Management Team and to the Board’s Risk Management Committee. Following significant long-term corporate commitment, employees’ understanding of and commitment to EwRM has continued to grow as an integral part of QTC’s culture.
QTC’s Chief Risk Officer is responsible for embedding QTC’s risk management policy and program in its business processes to ensure a consistent organisation-wide approach to risk mitigation, and an enhanced individual employee understanding of EwRM and what it means in their day-to-day work.
Management team
The responsibility for the day-to-day operation and administration of QTC is delegated by the Board to the Chief Executive and the executive team. The Chief Executive is appointed by the Board. Executives are appointed by the Chief Executive. As with the Board, all executive team appointments are made on basis of qualifications, experience, skills, strategic ability, and commitment to contribute to QTC’s performance and achievement of its corporate objectives.
Queensland Treasury Corporation’s General Managers 2010-2011
Left to right
Mark Girard Business Solutions Group Graeme Garrett Infrastructure Project Assessment Team Joanne Nelson Communication & Marketing Group Richard Jackson Funding & Markets Group Philip Noble Chief Executive Donna Maher People & Performance Group John Curran Strategy Group Rupert Haywood Strategic Partnering Group Steven Tagg Executive General Manager and General Manager, Financial Solutions Group Ramon Gavranic Operations Group John Frazer Risk Group Peter Dann Treasury Department Group
QUEENSLAND TREASURY CORPORATION ANNUAL REPORT 2010-2011
39
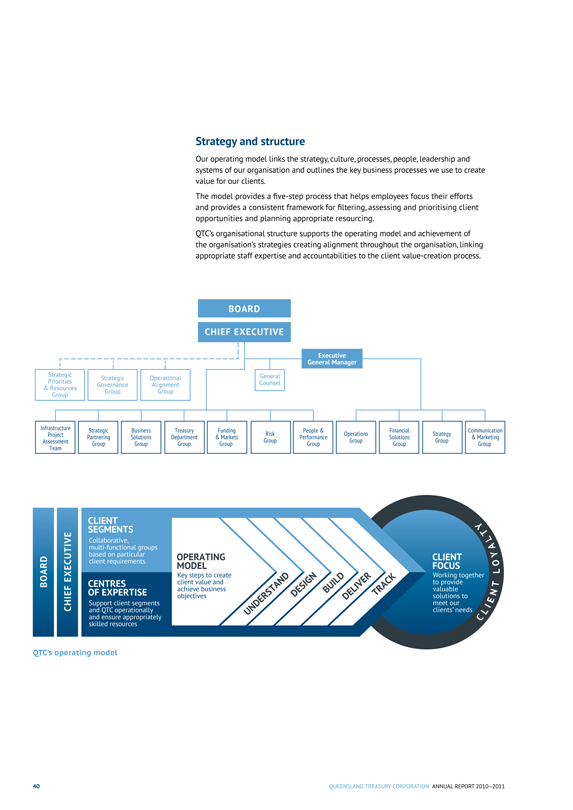
Strategy and structure
Our operating model links the strategy, culture, processes, people, leadership and systems of our organisation and outlines the key business processes we use to create value for our clients.
The model provides a five-step process that helps employees focus their efforts and provides a consistent framework for filtering, assessing and prioritising client opportunities and planning appropriate resourcing.
QTC’s organisational structure supports the operating model and achievement of the organisation’s strategies creating alignment throughout the organisation, linking appropriate staff expertise and accountabilities to the client value-creation process.
BOARD
CHIEF EXECUTIVE
Executive
General Manager
Strategic Priorities & Resources Group
Strategic Governance Group
Operational Alignment
Group General Counsel
Infrastructure Project Assessment Team
Strategic Partnering Group
Business Solutions Group
Treasury Department Group
Funding & Markets Group
Risk Group
People & Performance Group
Operations Group
Financial Solutions Group
Strategy Group
Communication & Marketing Group
BOARD
CHIEF EXECUTIVE
CLIENT SEGMENTS
Collaborative, multi-functional groups based on particular client requirements
CENTRES OF EXPERTISE
Support client segments and QTC operationally and ensure appropriately skilled resources
OPERATING MODEL
Key steps to create client value and achieve business objectives
UNDERSTAND
DESIGN
BUILD
DELIVER
TRACK
CLIENT FOCUS
Working together to provide valuable solutions to meet our client’s needs
CLIENT LOYALTY
QTC’s operating model
40 QUEENSLAND TREASURY CORPORATION ANNUAL REPORT 2010-2011
QUEENSLAND
TREASURY
CORPORATION
FINANCIAL STATEMENTS
FOR THE YEAR ENDED 30 JUNE 2011
CONTENTS
Statement of comprehensive income 42
Balance sheet 43
Statement of changes in equity 44
Statement of cash flows 45
Notes to and forming part
of the financial statements 46
Certificate of the
Queensland Treasury Corporation 77
Independent auditor’s report 78
Management report 80
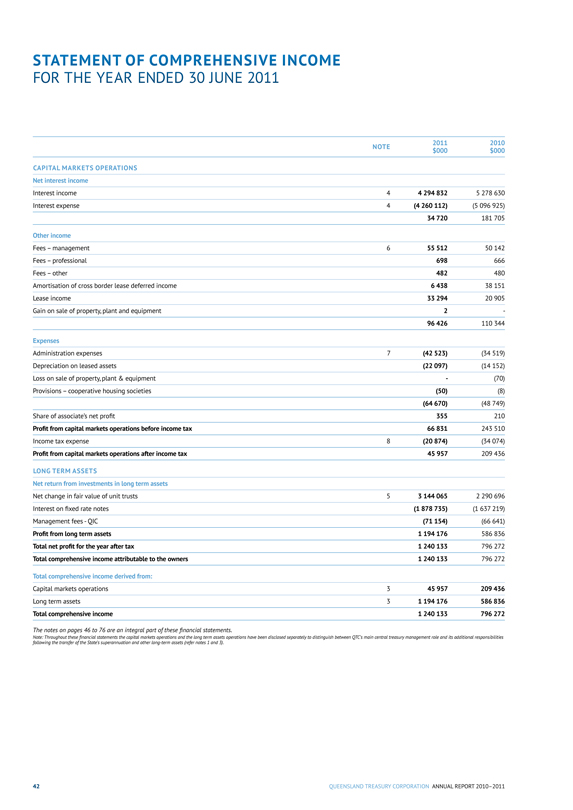
STATEMENT OF COMPREHENSIVE INCOME
FOR THE YEAR ENDED 30 JUNE 2011
NOTE
2011 $000
2010 $000
CAPITAL MARKETS OPERATIONS
Net interest income
Interest income 4 4 294 832 5 278 630
Interest expense 4 (4 260 112) (5 096 925)
34 720 181 705
Other income
Fees - management 6 55 512 50 142
Fees - professional 698 666
Fees - other 482 480
Amortisation of cross border lease deferred income 6 438 38 151
Lease income 33 294 20 905
Gain on sale of property, plant and equipment 2 -
96 426 110 344
Expenses
Administration expenses 7 (42 523) (34 519)
Depreciation on leased assets (22 097) (14 152)
Loss on sale of property, plant & equipment - (70)
Provisions - cooperative housing societies (50) (8)
(64 670) (48 749)
Share of associate’s net profit 355 210
Profit from capital markets operations before income tax 66 831 243 510
Income tax expense 8 (20 874) (34 074)
Profit from capital markets operations after income tax 45 957 209 436
LONG TERM ASSETS
Net return from investments in long term assets
Net change in fair value of unit trusts 5 3 144 065 2 290 696
Interest on fixed rate notes (1 878 735) (1 637 219)
Management fees - QIC (71 154) (66 641)
Profit from long term assets 1 194 176 586 836
Total net profit for the year after tax 1 240 133 796 272
Total comprehensive income attributable to the owners 1 240 133 796 272
Total comprehensive income derived from:
Capital markets operations 3 45 957 209 436
Long term assets 3 1 194 176 586 836
Total comprehensive income 1 240 133 796 272
The notes on pages 46 to 76 are an integral part of these financial statements.
Note: Throughout these financial statements the capital markets operations and the long term assets operations have been disclosed separately to distinguish between QTC’s main central treasury management role and its additional responsibilities following the transfer of the State’s superannuation and other long-term assets (refer notes 1 and 3).
42
QUEENSLAND TREASURY CORPORATION ANNUAL REPORT 2010-2011
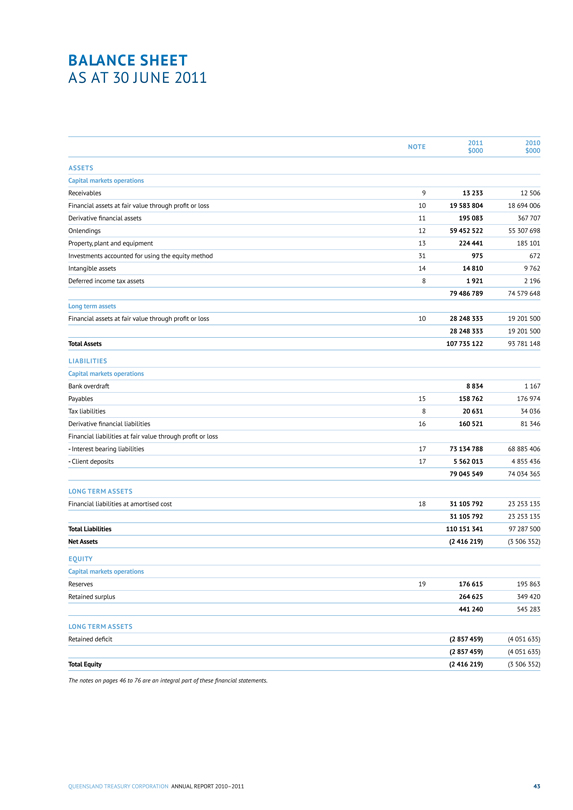
BALANCE SHEET
AS AT 30 JUNE 2011
NOTE 2011
$000 2010
$000
ASSETS
Capital markets operations
Receivables 9 13 233 12 506
Financial assets at fair value through profit or loss 10 19 583 804 18 694 006
Derivative financial assets 11 195 083 367 707
Onlendings 12 59 452 522 55 307 698
Property, plant and equipment 13 224 441 185 101
Investments accounted for using the equity method 31 975 672
Intangible assets 14 14 810 9 762
Deferred income tax assets 8 1 921 2 196
79 486 789 74 579 648
Long term assets
Financial assets at fair value through profit or loss 10 28 248 333 19 201 500
28 248 333 19 201 500
Total Assets 107 735 122 93 781 148
LIABILITIES
Capital markets operations
Bank overdraft 8 834 1 167
Payables 15 158 762 176 974
Tax liabilities 8 20 631 34 036
Derivative financial liabilities 16 160 521 81 346
Financial liabilities at fair value through profit or loss
- Interest bearing liabilities 17 73 134 788 68 885 406
- Client deposits 17 5 562 013 4 855 436
79 045 549 74 034 365
LONG TERM ASSETS
Financial liabilities at amortised cost 18 31 105 792 23 253 135
31 105 792 23 253 135
Total Liabilities 110 151 341 97 287 500
Net Assets (2 416 219) (3 506 352)
EQUITY
Capital markets operations
Reserves 19 176 615 195 863
Retained surplus 264 625 349 420
441 240 545 283
LONG TERM ASSETS
Retained deficit (2 857 459) (4 051 635)
(2 857 459) (4 051 635)
Total Equity (2 416 219) (3 506 352)
The notes on pages 46 to 76 are an integral part of these financial statements.
QUEENSLAND TREASURY CORPORATION ANNUAL REPORT 2010-2011
43
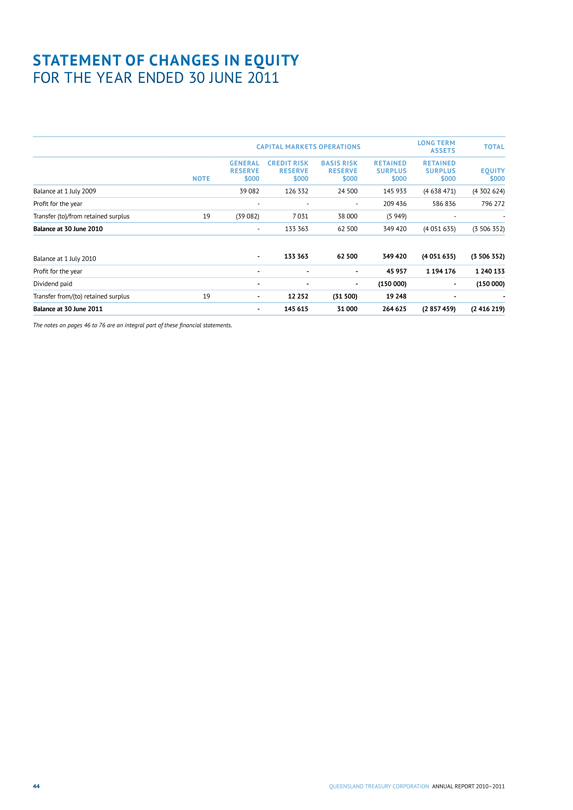
STATEMENT OF CHANGES IN EQUITY
FOR THE YEAR ENDED 30 JUNE 2011
CAPITAL MARKETS OPERATIONS
LONG TERM ASSETS
TOTAL
GENERAL CREDIT RISK BASIS RISK RETAINED RETAINED
RESERVE RESERVE RESERVE SURPLUS SURPLUS EQUITY
NOTE $000 $000 $000 $000 $000 $000
Balance at 1 July 2009 39 082 126 332 24 500 145 933 (4 638 471) (4 302 624)
Profit for the year - - - 209 436 586 836 796 272
Transfer (to)/from retained surplus 19 (39 082) 7 031 38 000 (5 949) - -
Balance at 30 June 2010 - 133 363 62 500 349 420 (4 051 635) (3 506 352)
Balance at 1 July 2010 - 133 363 62 500 349 420 (4 051 635) (3 506 352)
Profit for the year - - - 45 957 1 194 176 1 240 133
Dividend paid - - - (150 000) - (150 000)
Transfer from/(to) retained surplus 19 - 12 252 (31 500) 19 248 - -
Balance at 30 June 2011 - 145 615 31 000 264 625 (2 857 459) (2 416 219)
The notes on pages 46 to 76 are an integral part of these financial statements.
44
QUEENSLAND TREASURY CORPORATION ANNUAL REPORT 2010-2011
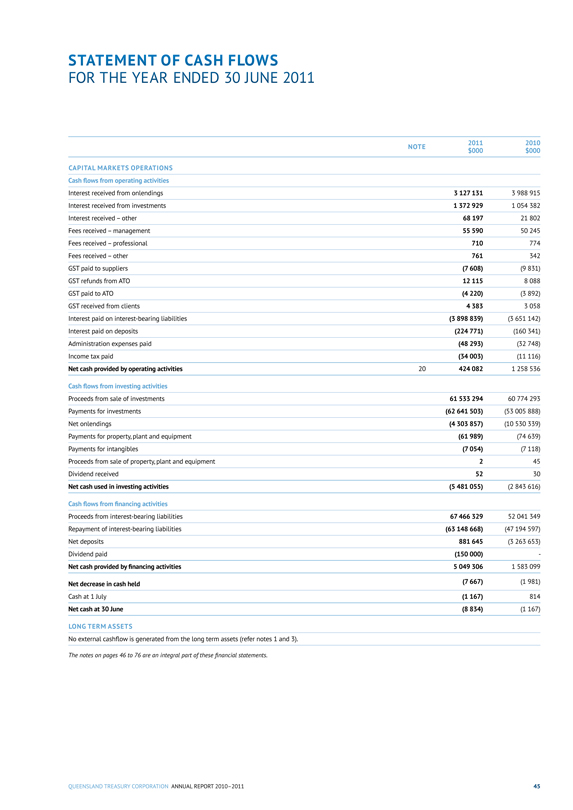
STATEMENT OF CASH FLOWS
FOR THE YEAR ENDED 30 JUNE 2011
NOTE 2011
$000 2010
$000
CAPITAL MARKETS OPERATIONS
Cash flows from operating activities
Interest received from onlendings 3 127 131 3 988 915
Interest received from investments 1 372 929 1 054 382
Interest received - other 68 197 21 802
Fees received - management 55 590 50 245
Fees received - professional 710 774
Fees received - other 761 342
GST paid to suppliers (7 608) (9 831)
GST refunds from ATO 12 115 8 088
GST paid to ATO (4 220) (3 892)
GST received from clients 4 383 3 058
Interest paid on interest-bearing liabilities (3 898 839) (3 651 142)
Interest paid on deposits (224 771) (160 341)
Administration expenses paid (48 293) (32 748)
Income tax paid (34 003) (11 116)
Net cash provided by operating activities 20 424 082 1 258 536
Cash flows from investing activities
Proceeds from sale of investments 61 533 294 60 774 293
Payments for investments (62 641 503) (53 005 888)
Net onlendings (4 303 857) (10 530 339)
Payments for property, plant and equipment (61 989) (74 639)
Payments for intangibles (7 054) (7 118)
Proceeds from sale of property, plant and equipment 2 45
Dividend received 52 30
Net cash used in investing activities (5 481 055) (2 843 616)
Cash flows from financing activities
Proceeds from interest-bearing liabilities 67 466 329 52 041 349
Repayment of interest-bearing liabilities (63 148 668) (47 194 597)
Net deposits 881 645 (3 263 653)
Dividend paid (150 000) -
Net cash provided by financing activities 5 049 306 1 583 099
Net decrease in cash held (7 667) (1 981)
Cash at 1 July (1 167) 814
Net cash at 30 June (8 834) (1 167)
LONG TERM ASSETS
No external cashflow is generated from the long term assets (refer notes 1 and 3).
The notes on pages 46 to 76 are an integral part of these financial statements.
QUEENSLAND TREASURY CORPORATION ANNUAL REPORT 2010-2011
45
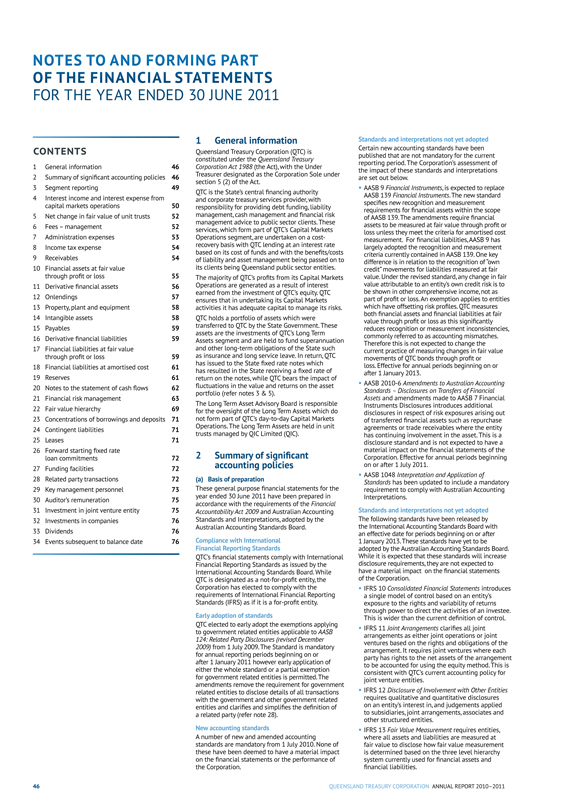
NOTES TO AND FORMING PART
OF THE FINANCIAL STATEMENTS
FOR THE YEAR ENDED 30 JUNE 2011
CONTENTS
1 General information 46
2 Summary of significant accounting policies 46
3 Segment reporting 49
4 Interest income and interest expense from capital markets operations 50
5 Net change in fair value of unit trusts 52
6 Fees - management 52
7 Administration expenses 53
8 Income tax expense 54
9 Receivables 54
10 Financial assets at fair value
through profit or loss 55
11 Derivative financial assets 56
12 Onlendings 57
13 Property, plant and equipment 58
14 Intangible assets 58
15 Payables 59
16 Derivative financial liabilities 59
17 Financial liabilities at fair value
through profit or loss 59
18 Financial liabilities at amortised cost 61
19 Reserves 61
20 Notes to the statement of cash flows 62
21 Financial risk management 63
22 Fair value hierarchy 69
23 Concentrations of borrowings and deposits 71
24 Contingent liabilities 71
25 Leases 71
26 Forward starting fixed rate
loan commitments 72
27 Funding facilities 72
28 Related party transactions 72
29 key management personnel 73
30 Auditor’s remuneration 75
31 Investment in joint venture entity 75
32 Investments in companies 76
33 Dividends 76
34 Events subsequent to balance date 76
1 General information
Queensland Treasury Corporation (QTC) is constituted under the Queensland Treasury Corporation Act 1988 (the Act), with the Under Treasurer designated as the Corporation Sole under section 5 (2) of the Act.
QTC is the State’s central financing authority and corporate treasury services provider, with responsibility for providing debt funding, liability management, cash management and financial risk management advice to public sector clients. These services, which form part of QTC’s Capital Markets Operations segment, are undertaken on a cost-recovery basis with QTC lending at an interest rate based on its cost of funds and with the benefits/costs of liability and asset management being passed on to its clients being Queensland public sector entities.
The majority of QTC’s profits from its Capital Markets Operations are generated as a result of interest earned from the investment of QTC’s equity. QTC ensures that in undertaking its Capital Markets activities it has adequate capital to manage its risks.
QTC holds a portfolio of assets which were transferred to QTC by the State Government. These assets are the investments of QTC’s Long Term Assets segment and are held to fund superannuation and other long-term obligations of the State such as insurance and long service leave. In return, QTC has issued to the State fixed rate notes which has resulted in the State receiving a fixed rate of return on the notes, while QTC bears the impact of fluctuations in the value and returns on the asset portfolio (refer notes 3 & 5).
The Long Term Asset Advisory Board is responsible for the oversight of the Long Term Assets which do not form part of QTC’s day-to-day Capital Markets Operations. The Long Term Assets are held in unit trusts managed by QIC Limited (QIC).
2 Summary of significant accounting policies
(a) Basis of preparation
These general purpose financial statements for the year ended 30 June 2011 have been prepared in accordance with the requirements of the Financial Accountability Act 2009 and Australian Accounting Standards and Interpretations, adopted by the Australian Accounting Standards Board.
Compliance with International Financial Reporting Standards
QTC’s financial statements comply with International Financial Reporting Standards as issued by the International Accounting Standards Board. While QTC is designated as a not-for-profit entity, the Corporation has elected to comply with the requirements of International Financial Reporting Standards (IFRS) as if it is a for-profit entity.
Early adoption of standards
QTC elected to early adopt the exemptions applying to government related entities applicable to AASB 124: Related Party Disclosures (revised December 2009) from 1 July 2009. The Standard is mandatory for annual reporting periods beginning on or after 1 January 2011 however early application of either the whole standard or a partial exemption for government related entities is permitted. The amendments remove the requirement for government related entities to disclose details of all transactions with the government and other government related entities and clarifies and simplifies the definition of a related party (refer note 28).
New accounting standards
A number of new and amended accounting standards are mandatory from 1 July 2010. None of these have been deemed to have a material impact on the financial statements or the performance of the Corporation.
Standards and interpretations not yet adopted
Certain new accounting standards have been published that are not mandatory for the current reporting period. The Corporation’s assessment of the impact of these standards and interpretations are set out below.
AASB 9 Financial Instruments, is expected to replace AASB 139 Financial Instruments. The new standard specifies new recognition and measurement requirements for financial assets within the scope of AASB 139. The amendments require financial assets to be measured at fair value through profit or loss unless they meet the criteria for amortised cost measurement. For financial liabilities, AASB 9 has largely adopted the recognition and measurement criteria currently contained in AASB 139. One key difference is in relation to the recognition of “own credit” movements for liabilities measured at fair value. Under the revised standard, any change in fair value attributable to an entity’s own credit risk is to be shown in other comprehensive income, not as part of profit or loss. An exemption applies to entities which have offsetting risk profiles. QTC measures both financial assets and financial liabilities at fair value through profit or loss as this significantly reduces recognition or measurement inconsistencies, commonly referred to as accounting mismatches. Therefore this is not expected to change the current practice of measuring changes in fair value movements of QTC bonds through profit or loss. Effective for annual periods beginning on or after 1 January 2013.
AASB 2010-6 Amendments to Australian Accounting Standards - Disclosures on Transfers of Financial Assets and amendments made to AASB 7 Financial Instruments Disclosures introduces additional disclosures in respect of risk exposures arising out of transferred financial assets such as repurchase agreements or trade receivables where the entity has continuing involvement in the asset. This is a disclosure standard and is not expected to have a material impact on the financial statements of the Corporation. Effective for annual periods beginning on or after 1 July 2011.
AASB 1048 Interpretation and Application of Standards has been updated to include a mandatory requirement to comply with Australian Accounting Interpretations.
Standards and interpretations not yet adopted
The following standards have been released by the International Accounting Standards Board with an effective date for periods beginning on or after 1 January 2013. These standards have yet to be adopted by the Australian Accounting Standards Board. While it is expected that these standards will increase disclosure requirements, they are not expected to have a material impact on the financial statements of the Corporation.
IFRS 10 Consolidated Financial Statements introduces a single model of control based on an entity’s exposure to the rights and variability of returns through power to direct the activities of an investee. This is wider than the current definition of control.
IFRS 11 Joint Arrangements clarifies all joint arrangements as either joint operations or joint ventures based on the rights and obligations of the arrangement. It requires joint ventures where each party has rights to the net assets of the arrangement to be accounted for using the equity method. This is consistent with QTC’s current accounting policy for joint venture entities.
IFRS 12 Disclosure of Involvement with Other Entities requires qualitative and quantitative disclosures on an entity’s interest in, and judgements applied to subsidiaries, joint arrangements, associates and other structured entities.
IFRS 13 Fair Value Measurement requires entities, where all assets and liabilities are measured at fair value to disclose how fair value measurement is determined based on the three level hierarchy system currently used for financial assets and financial liabilities.
46
QUEENSLAND TREASURY CORPORATION ANNUAL REPORT 2010-2011
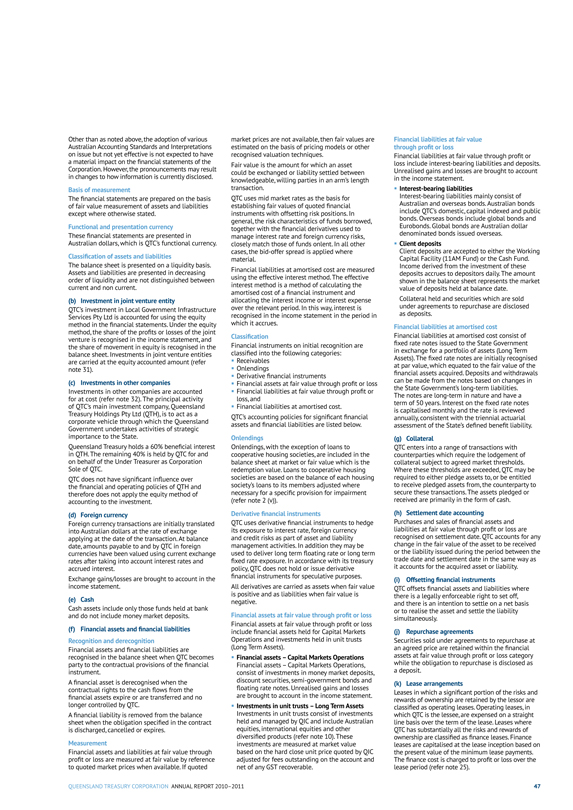
Other than as noted above, the adoption of various Australian Accounting Standards and Interpretations on issue but not yet effective is not expected to have a material impact on the financial statements of the Corporation. However, the pronouncements may result in changes to how information is currently disclosed.
Basis of measurement
The financial statements are prepared on the basis of fair value measurement of assets and liabilities except where otherwise stated.
Functional and presentation currency
These financial statements are presented in Australian dollars, which is QTC’s functional currency.
Classification of assets and liabilities
The balance sheet is presented on a liquidity basis. Assets and liabilities are presented in decreasing order of liquidity and are not distinguished between current and non current.
(b) Investment in joint venture entity
QTC’s investment in Local Government Infrastructure Services Pty Ltd is accounted for using the equity method in the financial statements. Under the equity method, the share of the profits or losses of the joint venture is recognised in the income statement, and the share of movement in equity is recognised in the balance sheet. Investments in joint venture entities are carried at the equity accounted amount (refer note 31).
(c) Investments in other companies
Investments in other companies are accounted for at cost (refer note 32). The principal activity of QTC’s main investment company, Queensland Treasury Holdings Pty Ltd (QTH), is to act as a corporate vehicle through which the Queensland Government undertakes activities of strategic importance to the State.
Queensland Treasury holds a 60% beneficial interest in QTH. The remaining 40% is held by QTC for and on behalf of the Under Treasurer as Corporation Sole of QTC.
QTC does not have significant influence over the financial and operating policies of QTH and therefore does not apply the equity method of accounting to the investment.
(d) Foreign currency
Foreign currency transactions are initially translated into Australian dollars at the rate of exchange applying at the date of the transaction. At balance date, amounts payable to and by QTC in foreign currencies have been valued using current exchange rates after taking into account interest rates and accrued interest.
Exchange gains/losses are brought to account in the income statement.
(e) Cash
Cash assets include only those funds held at bank and do not include money market deposits.
(f) Financial assets and financial liabilities
Recognition and derecognition
Financial assets and financial liabilities are recognised in the balance sheet when QTC becomes party to the contractual provisions of the financial instrument.
A financial asset is derecognised when the contractual rights to the cash flows from the financial assets expire or are transferred and no longer controlled by QTC.
A financial liability is removed from the balance sheet when the obligation specified in the contract is discharged, cancelled or expires.
Measurement
Financial assets and liabilities at fair value through profit or loss are measured at fair value by reference to quoted market prices when available. If quoted
market prices are not available, then fair values are estimated on the basis of pricing models or other recognised valuation techniques.
Fair value is the amount for which an asset could be exchanged or liability settled between knowledgeable, willing parties in an arm’s length transaction.
QTC uses mid market rates as the basis for establishing fair values of quoted financial instruments with offsetting risk positions. In general, the risk characteristics of funds borrowed, together with the financial derivatives used to manage interest rate and foreign currency risks, closely match those of funds onlent. In all other cases, the bid-offer spread is applied where material.
Financial liabilities at amortised cost are measured using the effective interest method. The effective interest method is a method of calculating the amortised cost of a financial instrument and allocating the interest income or interest expense over the relevant period. In this way, interest is recognised in the income statement in the period in which it accrues.
Classification
Financial instruments on initial recognition are classified into the following categories:
Receivables
Onlendings
Derivative financial instruments
Financial assets at fair value through profit or loss
Financial liabilities at fair value through profit or loss, and
Financial liabilities at amortised cost.
QTC’s accounting policies for significant financial assets and financial liabilities are listed below.
Onlendings
Onlendings, with the exception of loans to cooperative housing societies, are included in the balance sheet at market or fair value which is the redemption value. Loans to cooperative housing societies are based on the balance of each housing society’s loans to its members adjusted where necessary for a specific provision for impairment (refer note 2 (v)).
Derivative financial instruments
QTC uses derivative financial instruments to hedge its exposure to interest rate, foreign currency and credit risks as part of asset and liability management activities. In addition they may be used to deliver long term floating rate or long term fixed rate exposure. In accordance with its treasury policy, QTC does not hold or issue derivative financial instruments for speculative purposes.
All derivatives are carried as assets when fair value is positive and as liabilities when fair value is negative.
Financial assets at fair value through profit or loss
Financial assets at fair value through profit or loss include financial assets held for Capital Markets Operations and investments held in unit trusts (Long Term Assets).
Financial assets – Capital Markets Operations
Financial assets – Capital Markets Operations, consist of investments in money market deposits, discount securities, semi-government bonds and floating rate notes. Unrealised gains and losses are brought to account in the income statement.
Investments in unit trusts – Long Term Assets
Investments in unit trusts consist of investments held and managed by QIC and include Australian equities, international equities and other diversified products (refer note 10). These investments are measured at market value based on the hard close unit price quoted by QIC adjusted for fees outstanding on the account and net of any GST recoverable.
Financial liabilities at fair value through profit or loss
Financial liabilities at fair value through profit or loss include interest-bearing liabilities and deposits. Unrealised gains and losses are brought to account in the income statement.
Interest-bearing liabilities
Interest-bearing liabilities mainly consist of Australian and overseas bonds. Australian bonds include QTC’s domestic, capital indexed and public bonds. Overseas bonds include global bonds and Eurobonds. Global bonds are Australian dollar denominated bonds issued overseas.
Client deposits
Client deposits are accepted to either the Working Capital Facility (11AM Fund) or the Cash Fund. Income derived from the investment of these deposits accrues to depositors daily. The amount shown in the balance sheet represents the market value of deposits held at balance date.
Collateral held and securities which are sold under agreements to repurchase are disclosed as deposits.
Financial liabilities at amortised cost
Financial liabilities at amortised cost consist of fixed rate notes issued to the State Government in exchange for a portfolio of assets (Long Term Assets). The fixed rate notes are initially recognised at par value, which equated to the fair value of the financial assets acquired. Deposits and withdrawals can be made from the notes based on changes in the State Government’s long-term liabilities. The notes are long-term in nature and have a term of 50 years. Interest on the fixed rate notes is capitalised monthly and the rate is reviewed annually, consistent with the triennial actuarial assessment of the State’s defined benefit liability.
(g) Collateral
QTC enters into a range of transactions with counterparties which require the lodgement of collateral subject to agreed market thresholds. Where these thresholds are exceeded, QTC may be required to either pledge assets to, or be entitled to receive pledged assets from, the counterparty to secure these transactions. The assets pledged or received are primarily in the form of cash.
(h) Settlement date accounting
Purchases and sales of financial assets and liabilities at fair value through profit or loss are recognised on settlement date. QTC accounts for any change in the fair value of the asset to be received or the liability issued during the period between the trade date and settlement date in the same way as it accounts for the acquired asset or liability.
(i) Offsetting financial instruments
QTC offsets financial assets and liabilities where there is a legally enforceable right to set off, and there is an intention to settle on a net basis or to realise the asset and settle the liability simultaneously.
(j) Repurchase agreements
Securities sold under agreements to repurchase at an agreed price are retained within the financial assets at fair value through profit or loss category while the obligation to repurchase is disclosed as a deposit.
(k) Lease arrangements
Leases in which a significant portion of the risks and rewards of ownership are retained by the lessor are classified as operating leases. Operating leases, in which QTC is the lessee, are expensed on a straight line basis over the term of the lease. Leases where QTC has substantially all the risks and rewards of ownership are classified as finance leases. Finance leases are capitalised at the lease inception based on the present value of the minimum lease payments. The finance cost is charged to profit or loss over the lease period (refer note 25).
QUEENSLAND TREASURY CORPORATION ANNUAL REPORT 2010-2011
47
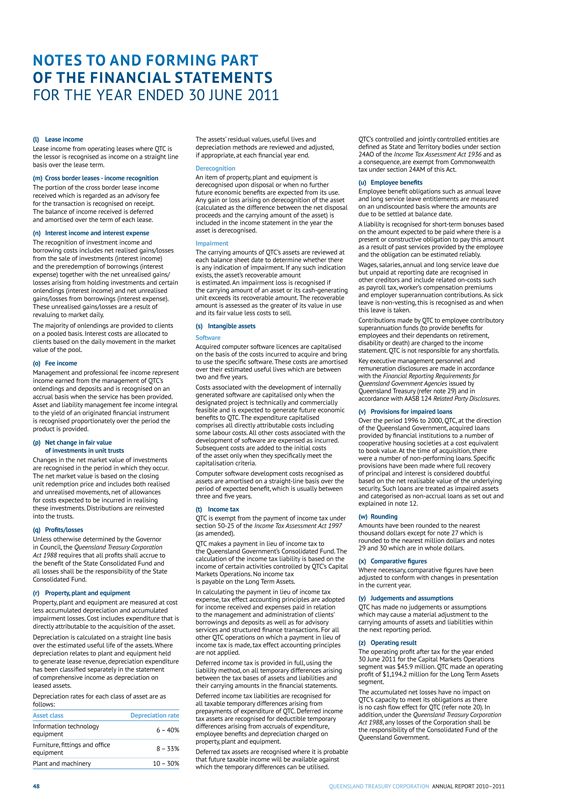
NOTES TO AND FORMING PART OF THE FINANCIAL STATEMENTS
FOR THE YEAR ENDED 30 JUNE 2011
(l) Lease income
Lease income from operating leases where QTC is the lessor is recognised as income on a straight line basis over the lease term.
(m) Cross border leases - income recognition
The portion of the cross border lease income received which is regarded as an advisory fee for the transaction is recognised on receipt. The balance of income received is deferred and amortised over the term of each lease.
(n) Interest income and interest expense
The recognition of investment income and borrowing costs includes net realised gains/losses from the sale of investments (interest income) and the preredemption of borrowings (interest expense) together with the net unrealised gains/losses arising from holding investments and certain onlendings (interest income) and net unrealised gains/losses from borrowings (interest expense). These unrealised gains/losses are a result of revaluing to market daily.
The majority of onlendings are provided to clients on a pooled basis. Interest costs are allocated to clients based on the daily movement in the market value of the pool.
(o) Fee income
Management and professional fee income represent income earned from the management of QTC’s onlendings and deposits and is recognised on an accrual basis when the service has been provided. Asset and liability management fee income integral to the yield of an originated financial instrument is recognised proportionately over the period the product is provided.
(p) Net change in fair value of investments in unit trusts
Changes in the net market value of investments are recognised in the period in which they occur. The net market value is based on the closing unit redemption price and includes both realised and unrealised movements, net of allowances for costs expected to be incurred in realising these investments. Distributions are reinvested into the trusts.
(q) Profits/losses
Unless otherwise determined by the Governor in Council, the Queensland Treasury Corporation Act 1988 requires that all profits shall accrue to the benefit of the State Consolidated Fund and all losses shall be the responsibility of the State Consolidated Fund.
(r) Property, plant and equipment
Property, plant and equipment are measured at cost less accumulated depreciation and accumulated impairment losses. Cost includes expenditure that is directly attributable to the acquisition of the asset.
Depreciation is calculated on a straight line basis over the estimated useful life of the assets. Where depreciation relates to plant and equipment held to generate lease revenue, depreciation expenditure has been classified separately in the statement of comprehensive income as depreciation on leased assets.
Depreciation rates for each class of asset are as follows:
Asset class Depreciation rate
Information technology equipment
6 - 40%
Furniture, fittings and office equipment
8 - 33%
Plant and machinery 10 -30%
The assets’ residual values, useful lives and depreciation methods are reviewed and adjusted, if appropriate, at each financial year end.
Derecognition
An item of property, plant and equipment is derecognised upon disposal or when no further future economic benefits are expected from its use. Any gain or loss arising on derecognition of the asset (calculated as the difference between the net disposal proceeds and the carrying amount of the asset) is included in the income statement in the year the asset is derecognised.
Impairment
The carrying amounts of QTC’s assets are reviewed at each balance sheet date to determine whether there is any indication of impairment. If any such indication exists, the asset’s recoverable amount is estimated. An impairment loss is recognised if the carrying amount of an asset or its cash-generating unit exceeds its recoverable amount. The recoverable amount is assessed as the greater of its value in use and its fair value less costs to sell.
(s) Intangible assets
Software
Acquired computer software licences are capitalised on the basis of the costs incurred to acquire and bring to use the specific software. These costs are amortised over their estimated useful lives which are between two and five years.
Costs associated with the development of internally generated software are capitalised only when the designated project is technically and commercially feasible and is expected to generate future economic benefits to QTC. The expenditure capitalised comprises all directly attributable costs including some labour costs. All other costs associated with the development of software are expensed as incurred. Subsequent costs are added to the initial costs of the asset only when they specifically meet the capitalisation criteria.
Computer software development costs recognised as assets are amortised on a straight-line basis over the period of expected benefit, which is usually between three and five years.
(t) Income tax
QTC is exempt from the payment of income tax under section 50-25 of the Income Tax Assessment Act 1997 (as amended).
QTC makes a payment in lieu of income tax to the Queensland Government’s Consolidated Fund. The calculation of the income tax liability is based on the income of certain activities controlled by QTC’s Capital Markets Operations. No income tax is payable on the Long Term Assets.
In calculating the payment in lieu of income tax expense, tax effect accounting principles are adopted for income received and expenses paid in relation to the management and administration of clients’ borrowings and deposits as well as for advisory services and structured finance transactions. For all other QTC operations on which a payment in lieu of income tax is made, tax effect accounting principles are not applied.
Deferred income tax is provided in full, using the liability method, on all temporary differences arising between the tax bases of assets and liabilities and their carrying amounts in the financial statements.
Deferred income tax liabilities are recognised for all taxable temporary differences arising from prepayments of expenditure of QTC. Deferred income tax assets are recognised for deductible temporary differences arising from accruals of expenditure, employee benefits and depreciation charged on property, plant and equipment.
Deferred tax assets are recognised where it is probable that future taxable income will be available against which the temporary differences can be utilised.
QTC’s controlled and jointly controlled entities are defined as State and Territory bodies under section 24AO of the Income Tax Assessment Act 1936 and as a consequence, are exempt from Commonwealth tax under section 24AM of this Act.
(u) Employee benefits
Employee benefit obligations such as annual leave and long service leave entitlements are measured on an undiscounted basis where the amounts are due to be settled at balance date.
A liability is recognised for short-term bonuses based on the amount expected to be paid where there is a present or constructive obligation to pay this amount as a result of past services provided by the employee and the obligation can be estimated reliably.
Wages, salaries, annual and long service leave due but unpaid at reporting date are recognised in other creditors and include related on-costs such as payroll tax, worker’s compensation premiums and employer superannuation contributions. As sick leave is non-vesting, this is recognised as and when this leave is taken.
Contributions made by QTC to employee contributory superannuation funds (to provide benefits for employees and their dependants on retirement, disability or death) are charged to the income statement. QTC is not responsible for any shortfalls.
key executive management personnel and remuneration disclosures are made in accordance with the Financial Reporting Requirements for Queensland Government Agencies issued by Queensland Treasury (refer note 29) and in accordance with AASB 124 Related Party Disclosures.
(v) Provisions for impaired loans
Over the period 1996 to 2000, QTC, at the direction of the Queensland Government, acquired loans provided by financial institutions to a number of cooperative housing societies at a cost equivalent to book value. At the time of acquisition, there were a number of non-performing loans. Specific provisions have been made where full recovery of principal and interest is considered doubtful based on the net realisable value of the underlying security. Such loans are treated as impaired assets and categorised as non-accrual loans as set out and explained in note 12.
(w) Rounding
Amounts have been rounded to the nearest thousand dollars except for note 27 which is rounded to the nearest million dollars and notes
29 and 30 which are in whole dollars.
(x) Comparative figures
Where necessary, comparative figures have been adjusted to conform with changes in presentation in the current year.
(y) Judgements and assumptions
QTC has made no judgements or assumptions which may cause a material adjustment to the carrying amounts of assets and liabilities within the next reporting period.
(z) Operating result
The operating profit after tax for the year ended
30 June 2011 for the Capital Markets Operations segment was $45.9 million. QTC made an operating profit of $1,194.2 million for the Long Term Assets segment.
The accumulated net losses have no impact on QTC’s capacity to meet its obligations as there is no cash flow effect for QTC (refer note 20). In addition, under the Queensland Treasury Corporation Act 1988, any losses of the Corporation shall be the responsibility of the Consolidated Fund of the Queensland Government.
48
QUEENSLAND TREASURY CORPORATION ANNUAL REPORT 2010-2011
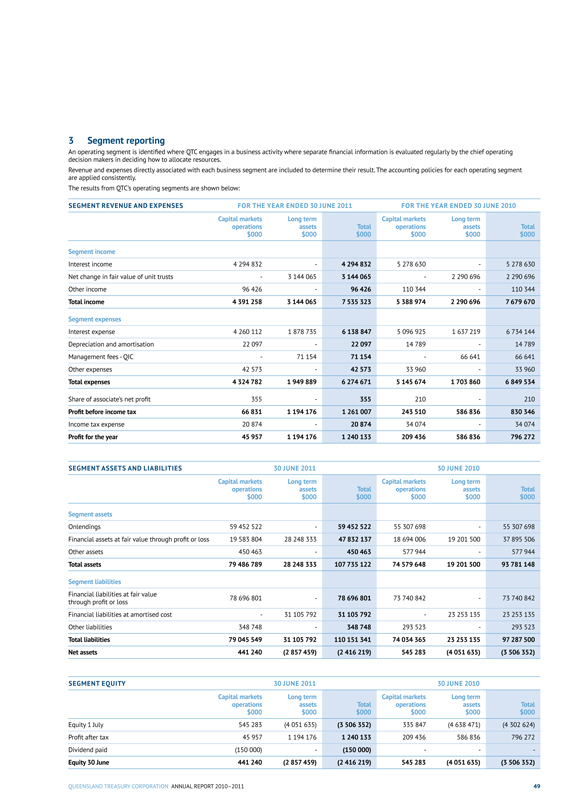
3 Segment reporting
An operating segment is identified where QTC engages in a business activity where separate financial information is evaluated regularly by the chief operating decision makers in deciding how to allocate resources.
Revenue and expenses directly associated with each business segment are included to determine their result. The accounting policies for each operating segment are applied consistently.
The results from QTC’s operating segments are shown below:
SEGMENT REVENUE AND EXPENSES FOR THE YEAR ENDED 30 JUNE 2011 FOR THE YEAR ENDED 30 JUNE 2010
Capital markets operations $000
Long term assets $000
Total $000
Capital markets operations $000
Long term assets $000
Total $000
Segment income
Interest income 4 294 832 - 4 294 832 5 278 630 - 5 278 630
Net change in fair value of unit trusts - 3 144 065 3 144 065 - 2 290 696 2 290 696
Other income 96 426 - 96 426 110 344 - 110 344
Total income 4 391 258 3 144 065 7 535 323 5 388 974 2 290 696 7 679 670
Segment expenses
Interest expense 4 260 112 1 878 735 6 138 847 5 096 925 1 637 219 6 734 144
Depreciation and amortisation 22 097 - 22 097 14 789 - 14 789
Management fees - QIC - 71 154 71 154 - 66 641 66 641
Other expenses 42 573 - 42 573 33 960 - 33 960
Total expenses 4 324 782 1 949 889 6 274 671 5 145 674 1 703 860 6 849 534
Share of associate’s net profit 355 - 355 210 - 210
Profit before income tax 66 831 1 194 176 1 261 007 243 510 586 836 830 346
Income tax expense 20 874 - 20 874 34 074 - 34 074
Profit for the year 45 957 1 194 176 1 240 133 209 436 586 836 796 272
SEGMENT ASSETS AND LIABILITIES 30 JUNE 2011 30 JUNE 2010
Capital markets operations $000
Long term assets $000
Total $000
Capital markets operations $000
Long term assets $000
Total $000
Segment assets
Onlendings 59 452 522 - 59 452 522 55 307 698 - 55 307 698
Financial assets at fair value through profit or loss 19 583 804 28 248 333 47 832 137 18 694 006 19 201 500 37 895 506
Other assets 450 463 - 450 463 577 944 - 577 944
Total assets 79 486 789 28 248 333 107 735 122 74 579 648 19 201 500 93 781 148
Segment liabilities
Financial liabilities at fair value through profit or loss 78 696 801 - 78 696 801 73 740 842 - 73 740 842
Financial liabilities at amortised cost - 31 105 792 31 105 792 - 23 253 135 23 253 135
Other liabilities 348 748 - 348 748 293 523 - 293 523
Total liabilities 79 045 549 31 105 792 110 151 341 74 034 365 23 253 135 97 287 500
Net assets 441 240 (2 857 459) (2 416 219) 545 283 (4 051 635) (3 506 352)
SEGMENT EQUITY 30 JUNE 2011 30 JUNE 2010
Capital markets operations $000
Long term assets $000
Total $000
Capital markets operations $000
Long term assets $000
Total $000
Equity 1 July 545 283 (4 051 635) (3 506 352) 335 847 (4 638 471) (4 302 624)
Profit after tax 45 957 1 194 176 1 240 133 209 436 586 836 796 272
Dividend paid (150 000) - (150 000) - - -
Equity 30 June 441 240 (2 857 459) (2 416 219) 545 283 (4 051 635) (3 506 352)
QUEENSLAND TREASURY CORPORATION ANNUAL REPORT 2010-2011
49
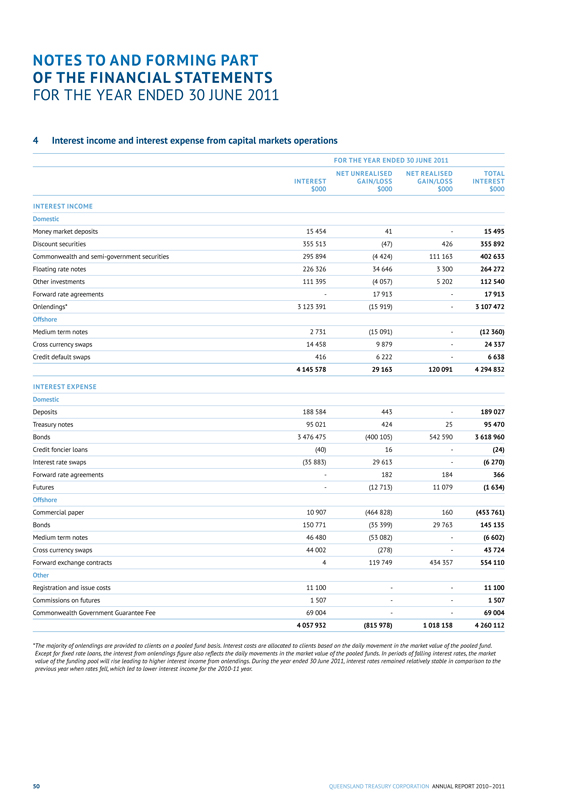
NOTES TO AND FORMING PART OF THE FINANCIAL STATEMENTS
FOR THE YEAR ENDED 30 JUNE 2011
4 Interest income and interest expense from capital markets operations
FOR THE YEAR ENDED 30 JUNE 2011
INTEREST $000
NET UNREALISED GAIN/LOSS $000
NET REALISED GAIN/LOSS $000
TOTAL INTEREST $000
INTEREST INCOME
Domestic
Money market deposits 15 454 41 - 15 495
Discount securities 355 513 (47) 426 355 892
Commonwealth and semi-government securities 295 894 (4 424) 111 163 402 633
Floating rate notes 226 326 34 646 3 300 264 272
Other investments 111 395 (4 057) 5 202 112 540
Forward rate agreements - 17 913 - 17 913
Onlendings* 3 123 391 (15 919) - 3 107 472
Offshore
Medium term notes 2 731 (15 091) - (12 360)
Cross currency swaps 14 458 9 879 - 24 337
Credit default swaps 416 6 222 - 6 638
4 145 578 29 163 120 091 4 294 832
INTEREST EXPENSE
Domestic
Deposits 188 584 443 - 189 027
Treasury notes 95 021 424 25 95 470
Bonds 3 476 475 (400 105) 542 590 3 618 960
Credit foncier loans (40) 16 - (24)
Interest rate swaps (35 883) 29 613 - (6 270)
Forward rate agreements - 182 184 366
Futures - (12 713) 11 079 (1 634)
Offshore
Commercial paper 10 907 (464 828) 160 (453 761)
Bonds 150 771 (35 399) 29 763 145 135
Medium term notes 46 480 (53 082) - (6 602)
Cross currency swaps 44 002 (278) - 43 724
Forward exchange contracts 4 119 749 434 357 554 110
Other
Registration and issue costs 11 100 - - 11 100
Commissions on futures 1 507 - - 1 507
Commonwealth Government Guarantee Fee 69 004 - - 69 004
4 057 932 (815 978) 1 018 158 4 260 112
*The majority of onlendings are provided to clients on a pooled fund basis. Interest costs are allocated to clients based on the daily movement in the market value of the pooled fund. Except for fixed rate loans, the interest from onlendings figure also reflects the daily movements in the market value of the pooled funds. In periods of falling interest rates, the market value of the funding pool will rise leading to higher interest income from onlendings. During the year ended 30 June 2011, interest rates remained relatively stable in comparison to the previous year when rates fell, which led to lower interest income for the 2010-11 year.
50
QUEENSLAND TREASURY CORPORATION ANNUAL REPORT 2010-2011
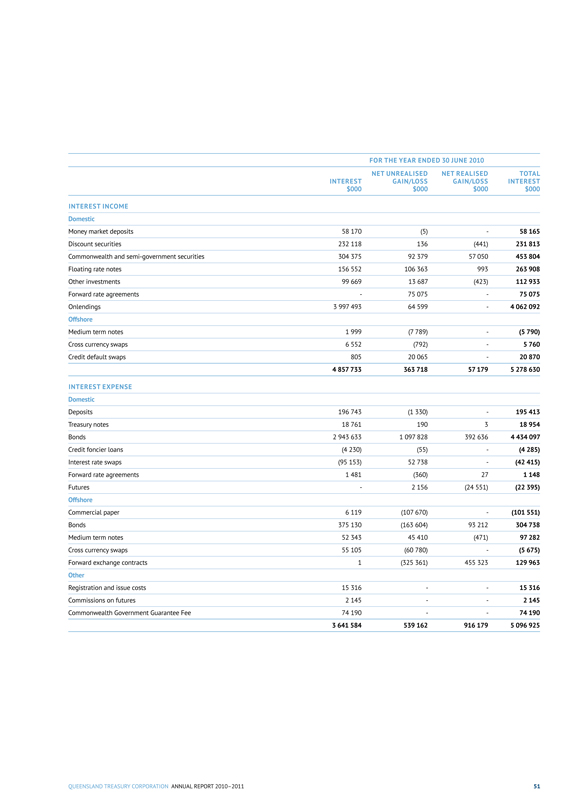
FOR THE YEAR ENDED 30 JUNE 2010
INTEREST $000
NET UNREALISED GAIN/LOSS $000
NET REALISED GAIN/LOSS $000
TOTAL INTEREST $000
INTEREST INCOME
Domestic
Money market deposits 58 170 (5) - 58 165
Discount securities 232 118 136 (441) 231 813
Commonwealth and semi-government securities 304 375 92 379 57 050 453 804
Floating rate notes 156 552 106 363 993 263 908
Other investments 99 669 13 687 (423) 112 933
Forward rate agreements - 75 075 - 75 075
Onlendings 3 997 493 64 599 - 4 062 092
Offshore
Medium term notes 1 999 (7 789) - (5 790)
Cross currency swaps 6 552 (792) - 5 760
Credit default swaps 805 20 065 - 20 870
4 857 733 363 718 57 179 5 278 630
INTEREST EXPENSE
Domestic
Deposits 196 743 (1 330) - 195 413
Treasury notes 18 761 190 3 18 954
Bonds 2 943 633 1 097 828 392 636 4 434 097
Credit foncier loans (4 230) (55) - (4 285)
Interest rate swaps (95 153) 52 738 - (42 415)
Forward rate agreements 1 481 (360) 27 1 148
Futures - 2 156 (24 551) (22 395)
Offshore
Commercial paper 6 119 (107 670) - (101 551)
Bonds 375 130 (163 604) 93 212 304 738
Medium term notes 52 343 45 410 (471) 97 282
Cross currency swaps 55 105 (60 780) - (5 675)
Forward exchange contracts 1 (325 361) 455 323 129 963
Other
Registration and issue costs 15 316 - - 15 316
Commissions on futures 2 145 - - 2 145
Commonwealth Government Guarantee Fee 74 190 - - 74 190
3 641 584 539 162 916 179 5 096 925
QUEENSLAND TREASURY CORPORATION ANNUAL REPORT 2010-2011
51
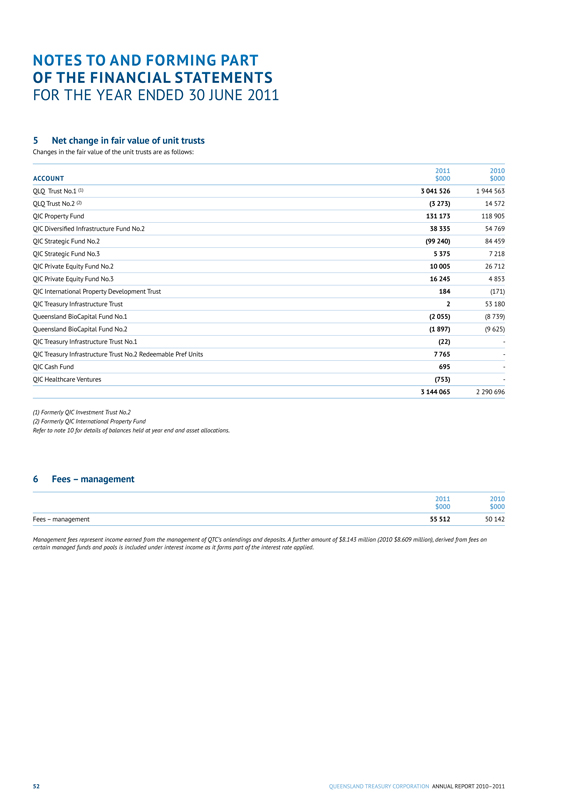
NOTES TO AND FORMING PART OF THE FINANCIAL STATEMENTS
FOR THE YEAR ENDED 30 JUNE 2011
5 Net change in fair value of unit trusts
Changes in the fair value of the unit trusts are as follows:
ACCOUNT
2011 $000
2010 $000
QLQ Trust No.1 (1) 3 041 526 1 944 563
QLQ Trust No.2 (2) (3 273) 14 572
QIC Property Fund 131 173 118 905
QIC Diversified Infrastructure Fund No.2 38 335 54 769
QIC Strategic Fund No.2 (99 240) 84 459
QIC Strategic Fund No.3 5 375 7 218
QIC Private Equity Fund No.2 10 005 26 712
QIC Private Equity Fund No.3 16 245 4 853
QIC International Property Development Trust 184 (171)
QIC Treasury Infrastructure Trust 2 53 180
Queensland BioCapital Fund No.1 (2 055) (8 739)
Queensland BioCapital Fund No.2 (1 897) (9 625)
QIC Treasury Infrastructure Trust No.1 (22) -
QIC Treasury Infrastructure Trust No.2 Redeemable Pref Units 7 765 -
QIC Cash Fund 695 -
QIC Healthcare Ventures (753) -
3 144 065 2 290 696
(1) Formerly QIC Investment Trust No.2
(2) Formerly QIC International Property Fund
Refer to note 10 for details of balances held at year end and asset allocations.
6 Fees – management
2011 $000
2010 $000
Fees – management 55 512 50 142
Management fees represent income earned from the management of QTC’s onlendings and deposits. A further amount of $8.143 million (2010 $8.609 million), derived from fees on certain managed funds and pools is included under interest income as it forms part of the interest rate applied.
52
QUEENSLAND TREASURY CORPORATION ANNUAL REPORT 2010-2011
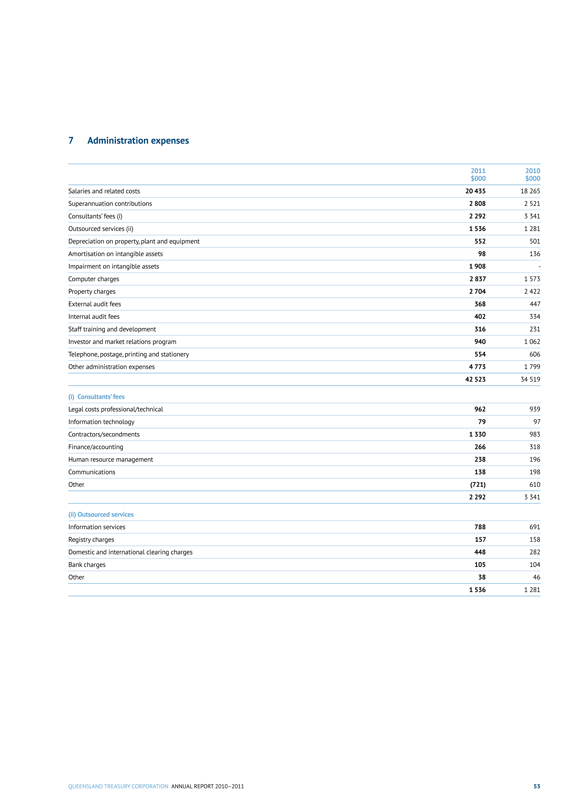
7 Administration expenses
2011 $000
2010 $000
Salaries and related costs 20 435 18 265
Superannuation contributions 2 808 2 521
Consultants’ fees (i) 2 292 3 341
Outsourced services (ii) 1 536 1 281
Depreciation on property, plant and equipment 552 501
Amortisation on intangible assets 98 136
Impairment on intangible assets 1 908 -
Computer charges 2 837 1 573
Property charges 2 704 2 422
External audit fees 368 447
Internal audit fees 402 334
Staff training and development 316 231
Investor and market relations program 940 1 062
Telephone, postage, printing and stationery 554 606
Other administration expenses 4 773 1 799
42 523 34 519
(i) Consultants’ fees
Legal costs professional/technical 962 939
Information technology 79 97
Contractors/secondments 1 330 983
Finance/accounting 266 318
Human resource management 238 196
Communications 138 198
Other (721) 610
2 292 3 341
(ii) Outsourced services
Information services 788 691
Registry charges 157 158
Domestic and international clearing charges 448 282
Bank charges 105 104
Other 38 46
1 536 1 281
QUEENSLAND TREASURY CORPORATION ANNUAL REPORT 2010-2011
53
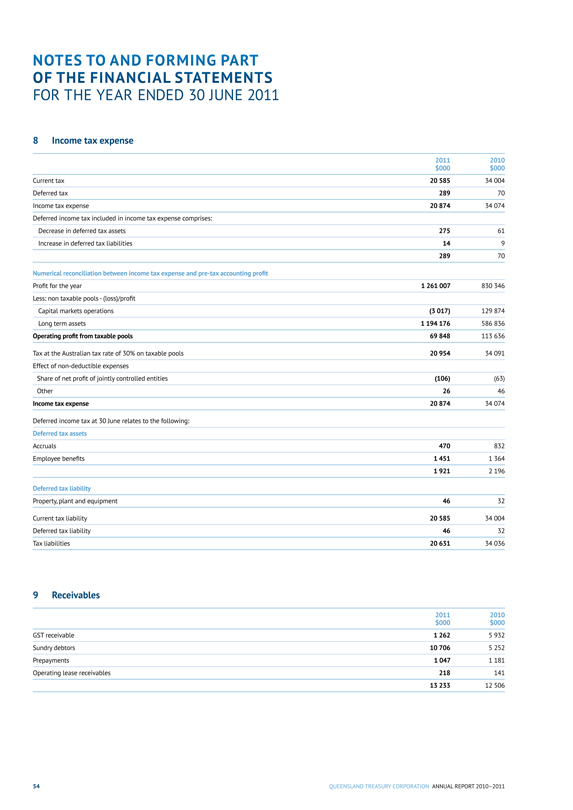
NOTES TO AND FORMING PART OF THE FINANCIAL STATEMENTS
FOR THE YEAR ENDED 30 JUNE 2011
8 Income tax expense
2011 $000
2010 $000
Current tax 20 585 34 004
Deferred tax 289 70
Income tax expense 20 874 34 074
Deferred income tax included in income tax expense comprises:
Decrease in deferred tax assets 275 61
Increase in deferred tax liabilities 14 9 289 70
Numerical reconciliation between income tax expense and pre-tax accounting profit
Profit for the year 1 261 007 830 346
Less: non taxable pools - (loss)/profit
Capital markets operations (3 017) 129 874
Long term assets 1 194 176 586 836
Operating profit from taxable pools 69 848 113 636
Tax at the Australian tax rate of 30% on taxable pools 20 954 34 091
Effect of non-deductible expenses
Share of net profit of jointly controlled entities (106) (63)
Other 26 46
Income tax expense 20 874 34 074
Deferred income tax at 30 June relates to the following:
Deferred tax assets
Accruals 470 832
Employee benefits 1 451 1 364 1 921 2 196
Deferred tax liability
Property, plant and equipment 46 32
Current tax liability 20 585 34 004
Deferred tax liability 46 32
Tax liabilities 20 631 34 036
9 Receivables
2011 $000
2010 $000
GST receivable 1 262 5 932
Sundry debtors 10 706 5 252
Prepayments 1 047 1 181
Operating lease receivables 218 141
13 233 12 506
54
QUEENSLAND TREASURY CORPORATION ANNUAL REPORT 2010-2011
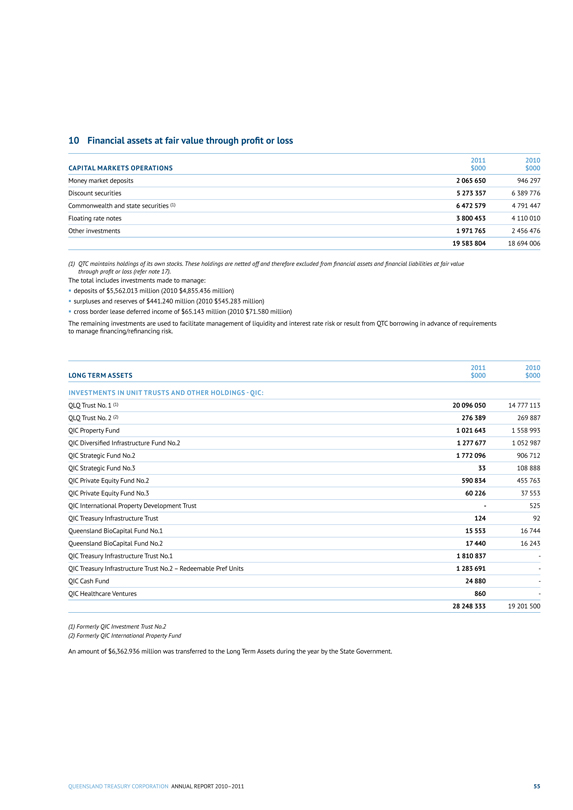
10 Financial assets at fair value through profit or loss
CAPITAL MARKETS OPERATIONS
2011 $000
2010 $000
Money market deposits 2 065 650 946 297
Discount securities 5 273 357 6 389 776
Commonwealth and state securities (1) 6 472 579 4 791 447
Floating rate notes 3 800 453 4 110 010
Other investments 1 971 765 2 456 476
19 583 804 18 694 006
(1) QTC maintains holdings of its own stocks. These holdings are netted off and therefore excluded from financial assets and financial liabilities at fair value through profit or loss (refer note 17).
The total includes investments made to manage:
• deposits of $5,562.013 million (2010 $4,855.436 million)
• surpluses and reserves of $441.240 million (2010 $545.283 million)
• cross border lease deferred income of $65.143 million (2010 $71.580 million)
The remaining investments are used to facilitate management of liquidity and interest rate risk or result from QTC borrowing in advance of requirements to manage financing/refinancing risk.
LONG TERM ASSETS
2011 $000
2010 $000
INVESTMENTS IN UNIT TRUSTS AND OTHER HOLDINGS - QIC:
QLQ Trust No. 1 (1) 20 096 050 14 777 113
QLQ Trust No. 2 (2) 276 389 269 887
QIC Property Fund 1 021 643 1 558 993
QIC Diversified Infrastructure Fund No.2 1 277 677 1 052 987
QIC Strategic Fund No.2 1 772 096 906 712
QIC Strategic Fund No.3 33 108 888
QIC Private Equity Fund No.2 590 834 455 763
QIC Private Equity Fund No.3 60 226 37 553
QIC International Property Development Trust - 525
QIC Treasury Infrastructure Trust 124 92
Queensland BioCapital Fund No.1 15 553 16 744
Queensland BioCapital Fund No.2 17 440 16 243
QIC Treasury Infrastructure Trust No.1 1 810 837 -
QIC Treasury Infrastructure Trust No.2 - Redeemable Pref Units 1 283 691 -
QIC Cash Fund 24 880 -
QIC Healthcare Ventures 860 -
28 248 333 19 201 500
(1) Formerly QIC Investment Trust No.2
(2) Formerly QIC International Property Fund
An amount of $6,362.936 million was transferred to the Long Term Assets during the year by the State Government.
QUEENSLAND TREASURY CORPORATION ANNUAL REPORT 2010-2011
55
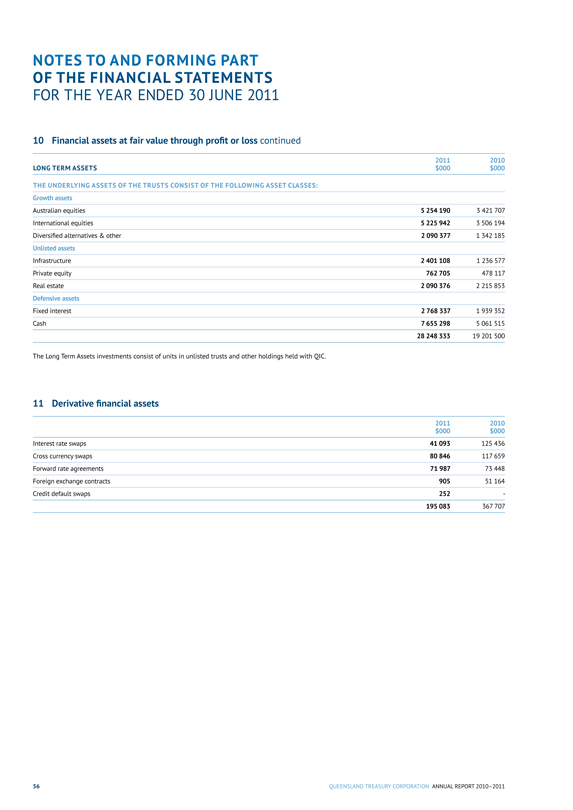
NOTES TO AND FORMING PART OF THE FINANCIAL STATEMENTS
FOR THE YEAR ENDED 30 JUNE 2011
10 Financial assets at fair value through profit or loss continued
LONG TERM ASSETS
2011 $000
2010 $000
THE UNDERLYING ASSETS OF THE TRUSTS CONSIST OF THE FOLLOWING ASSET CLASSES:
Growth assets
Australian equities 5 254 190 3 421 707
International equities 5 225 942 3 506 194
Diversified alternatives & other 2 090 377 1 342 185
Unlisted assets
Infrastructure 2 401 108 1 236 577
Private equity 762 705 478 117
Real estate 2 090 376 2 215 853
Defensive assets
Fixed interest 2 768 337 1 939 352
Cash 7 655 298 5 061 515
28 248 333 19 201 500
The Long Term Assets investments consist of units in unlisted trusts and other holdings held with QIC.
11 Derivative financial assets
2011 $000
2010 $000
Interest rate swaps 41 093 125 436
Cross currency swaps 80 846 117 659
Forward rate agreements 71 987 73 448
Foreign exchange contracts 905 51 164
Credit default swaps 252 -
195 083 367 707
56
QUEENSLAND TREASURY CORPORATION ANNUAL REPORT 2010-2011
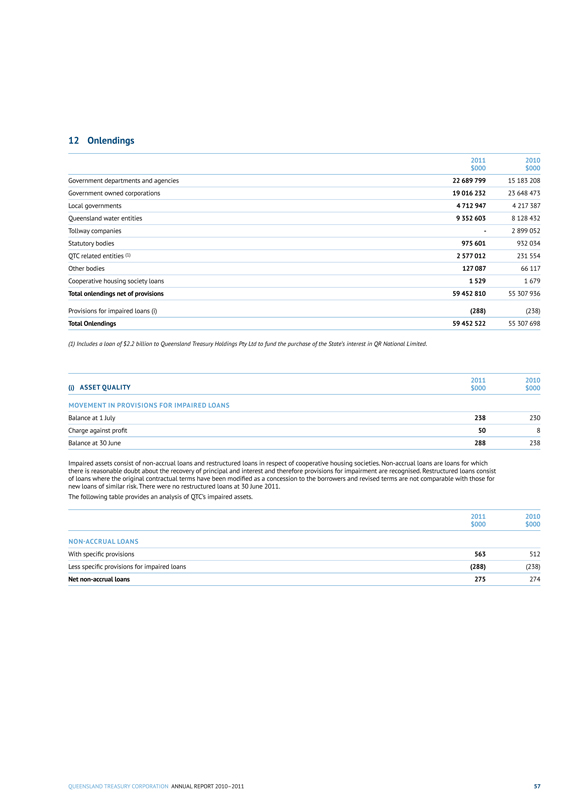
12 Onlendings
2011
$000 2010
$000
Government departments and agencies 22 689 799 15 183 208
Government owned corporations 19 016 232 23 648 473
Local governments 4 712 947 4 217 387
Queensland water entities 9 352 603 8 128 432
Tollway companies - 2 899 052
Statutory bodies 975 601 932 034
QTC related entities (1) 2 577 012 231 554
Other bodies 127 087 66 117
Cooperative housing society loans 1 529 1 679
Total onlendings net of provisions 59 452 810 55 307 936
Provisions for impaired loans (i) (288) (238)
Total Onlendings 59 452 522 55 307 698
(1) Includes a loan of $2.2 billion to Queensland Treasury Holdings Pty Ltd to fund the purchase of the State’s interest in QR National Limited.
(i) ASSET QUALITY 2011
$000 2010
$000
MOVEMENT IN PROVISIONS FOR IMPAIRED LOANS
Balance at 1 July 238 230
Charge against profit 50 8
Balance at 30 June 288 238
Impaired assets consist of non-accrual loans and restructured loans in respect of cooperative housing societies. Non-accrual loans are loans for which there is reasonable doubt about the recovery of principal and interest and therefore provisions for impairment are recognised. Restructured loans consist of loans where the original contractual terms have been modified as a concession to the borrowers and revised terms are not comparable with those for new loans of similar risk. There were no restructured loans at 30 June 2011.
The following table provides an analysis of QTC’s impaired assets.
2011
$000 2010
$000
NON-ACCRUAL LOANS
With specific provisions 563 512
Less specific provisions for impaired loans (288) (238)
Net non-accrual loans 275 274
QUEENSLAND TREASURY CORPORATION ANNUAL REPORT 2010-2011
57
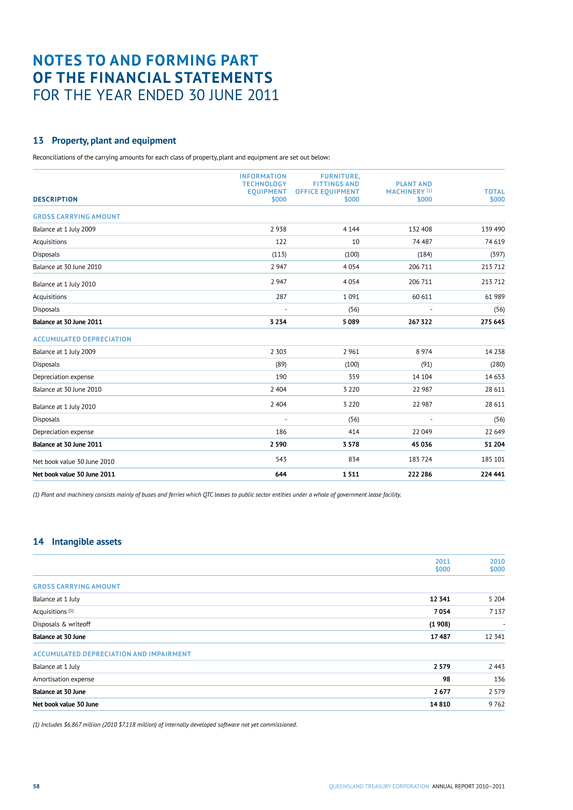
NOTES TO AND FORMING PART OF THE FINANCIAL STATEMENTS
FOR THE YEAR ENDED 30 JUNE 2011
13 Property, plant and equipment
Reconciliations of the carrying amounts for each class of property, plant and equipment are set out below:
DESCRIPTION INFORMATION TECHNOLOGY
EQUIPMENT
$000 FURNITURE, FITTINGS AND OFFICE EQUIPMENT $000 PLANT AND
MACHINERY (1)
$000 TOTAL $000
GROSS CARRYING AMOUNT
Balance at 1 July 2009 2 938 4 144 132 408 139 490
Acquisitions 122 10 74 487 74 619
Disposals (113) (100) (184) (397)
Balance at 30 June 2010 2 947 4 054 206 711 213 712
Balance at 1 July 2010 2 947 4 054 206 711 213 712
Acquisitions 287 1 091 60 611 61 989
Disposals - (56) - (56)
Balance at 30 June 2011 3 234 5 089 267 322 275 645
ACCUMULATED DEPRECIATION
Balance at 1 July 2009 2 303 2 961 8 974 14 238
Disposals (89) (100) (91) (280)
Depreciation expense 190 359 14 104 14 653
Balance at 30 June 2010 2 404 3 220 22 987 28 611
Balance at 1 July 2010 2 404 3 220 22 987 28 611
Disposals - (56) - (56)
Depreciation expense 186 414 22 049 22 649
Balance at 30 June 2011 2 590 3 578 45 036 51 204
Net book value 30 June 2010 543 834 183 724 185 101
Net book value 30 June 2011 644 1 511 222 286 224 441
(1) Plant and machinery consists mainly of buses and ferries which QTC leases to public sector entities under a whole of government lease facility.
14 Intangible assets
2011
$000 2010
$000
GROSS CARRYING AMOUNT
Balance at 1 July 12 341 5 204
Acquisitions (1) 7 054 7 137
Disposals & writeoff (1 908) -
Balance at 30 June 17 487 12 341
ACCUMULATED DEPRECIATION AND IMPAIRMENT
Balance at 1 July 2 579 2 443
Amortisation expense 98 136
Balance at 30 June 2 677 2 579
Net book value 30 June 14 810 9 762
(1) Includes $6.867 million (2010 $7.118 million) of internally developed software not yet commissioned.
58
QUEENSLAND TREASURY CORPORATION ANNUAL REPORT 2010-2011
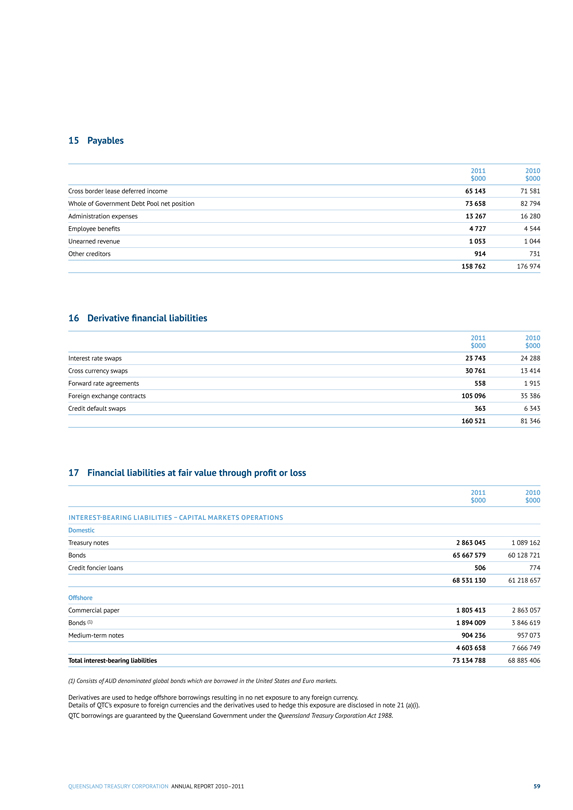
15 Payables
2011
$000 2010
$000
Cross border lease deferred income 65 143 71 581
Whole of Government Debt Pool net position 73 658 82 794
Administration expenses 13 267 16 280
Employee benefits 4 727 4 544
Unearned revenue 1 053 1 044
Other creditors 914 731
158 762 176 974
16 Derivative financial liabilities
2011 2010
$000 $000
Interest rate swaps 23 743 24 288
Cross currency swaps 30 761 13 414
Forward rate agreements 558 1 915
Foreign exchange contracts 105 096 35 386
Credit default swaps 363 6 343
160 521 81 346
17 Financial liabilities at fair value through profit or loss
2011
$000 2010
$000
INTEREST-BEARING LIABILITIES – CAPITAL MARKETS OPERATIONS
Domestic
Treasury notes 2 863 045 1 089 162
Bonds 65 667 579 60 128 721
Credit foncier loans 506 774
68 531 130 61 218 657
Offshore
Commercial paper 1 805 413 2 863 057
Bonds (1) 1 894 009 3 846 619
Medium-term notes 904 236 957 073
4 603 658 7 666 749
Total interest-bearing liabilities 73 134 788 68 885 406
(1) Consists of AUD denominated global bonds which are borrowed in the United States and Euro markets.
Derivatives are used to hedge offshore borrowings resulting in no net exposure to any foreign currency.
Details of QTC’s exposure to foreign currencies and the derivatives used to hedge this exposure are disclosed in note 21 (a)(i).
QTC borrowings are guaranteed by the Queensland Government under the Queensland Treasury Corporation Act 1988.
QUEENSLAND TREASURY CORPORATION ANNUAL REPORT 2010-2011
59
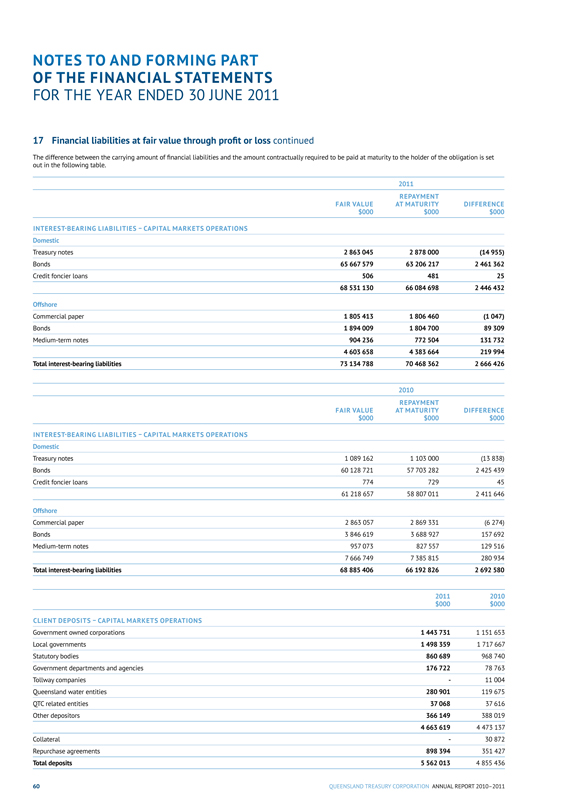
NOTES TO AND FORMING PART OF THE FINANCIAL STATEMENTS
FOR THE YEAR ENDED 30 JUNE 2011
17 Financial liabilities at fair value through profit or loss continued
The difference between the carrying amount of financial liabilities and the amount contractually required to be paid at maturity to the holder of the obligation is set out in the following table.
2011
FAIR VALUE
$000
REPAYMENT
AT MATURITY $000
DIFFERENCE $000
INTEREST-BEARING LIABILITIES – CAPITAL MARKETS OPERATIONS
Domestic
Treasury notes
2 863 045
2 878 000
(14 955)
Bonds
65 667 579
63 206 217
2 461 362
Credit foncier loans
506
481
25
68 531 130
66 084 698
2 446 432
Offshore
Commercial paper
1 805 413
1 806 460
(1 047)
Bonds
1 894 009
1 804 700
89 309
Medium-term notes
904 236
772 504
131 732
4 603 658
4 383 664
219 994
Total interest-bearing liabilities
73 134 788
70 468 362
2 666 426
2010
FAIR VALUE $000
REPAYMENT
AT MATURITY $000
DIFFERENCE $000
INTEREST-BEARING LIABILITIES – CAPITAL MARKETS OPERATIONS
Domestic
Treasury notes
1 089 162
1 103 000
(13 838)
Bonds
60 128 721
57 703 282
2 425 439
Credit foncier loans
774
729
45
61 218 657
58 807 011
2 411 646
Offshore
Commercial paper
2 863 057
2 869 331
(6 274)
Bonds
3 846 619
3 688 927
157 692
Medium-term notes
957 073
827 557
129 516
7 666 749
7385 815
280 934
Total interest-bearing liabilities
68 885 406
66 192 826
2 692 580
2011
$000
2010
$000
CLIENT DEPOSITS – CAPITAL MARKETS OPERATIONS
Government owned corporations
1 443 731
1 151 653
Local governments
1 498 359
1 717 667
Statutory bodies
860 689
968 740
Government departments and agencies
176 722
78 763
Tollway companies
-
11 004
Queensland water entities
280 901
119 675
QTC related entities
37 068
37 616
Other depositors
366 149
388 019
4 663 619
4 473 137
Collateral
-
30 872
Repurchase agreements
898 394
351 427
Total deposits
5 562 013
4855436
60
QUEENSLAND TREASURY CORPORATION ANNUAL REPORT 2010-2011
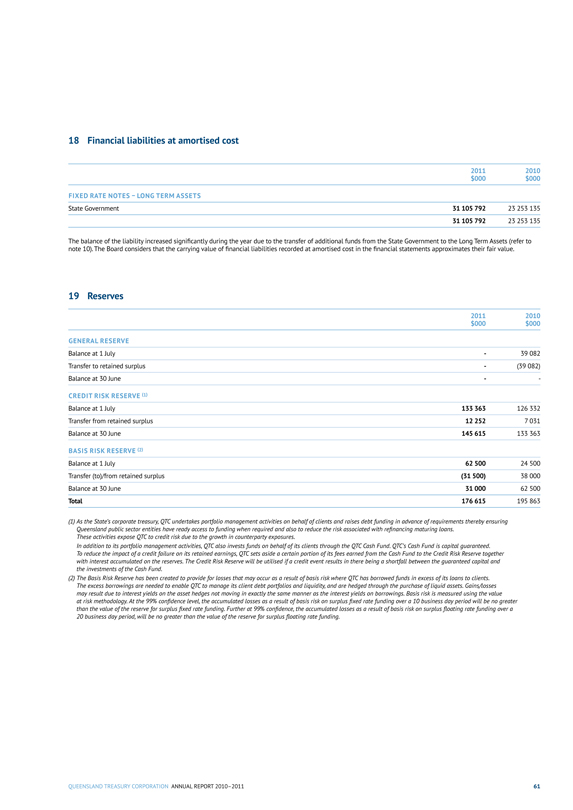
18 Financial liabilities at amortised cost
2011
$000 2010
$000
FIXED RATE NOTES – LONG TERM ASSETS
State Government 31 105 792 23 253 135
31 105 792 23 253 135
The balance of the liability increased significantly during the year due to the transfer of additional funds from the State Government to the Long Term Assets (refer to note 10). The Board considers that the carrying value of financial liabilities recorded at amortised cost in the financial statements approximates their fair value.
19 Reserves
2011
$000 2010
$000
GENERAL RESERVE
Balance at 1 July - 39 082
Transfer to retained surplus - (39 082)
Balance at 30 June - -
CREDIT RISK RESERVE (1)
Balance at 1 July 133 363 126 332
Transfer from retained surplus 12 252 7 031
Balance at 30 June 145 615 133 363
BASIS RISK RESERVE (2)
Balance at 1 July 62 500 24 500
Transfer (to)/from retained surplus (31 500) 38 000
Balance at 30 June 31 000 62 500
Total 176 615 195 863
(1) As the State’s corporate treasury, QTC undertakes portfolio management activities on behalf of clients and raises debt funding in advance of requirements thereby ensuring Queensland public sector entities have ready access to funding when required and also to reduce the risk associated with refinancing maturing loans.
These activities expose QTC to credit risk due to the growth in counterparty exposures.
In addition to its portfolio management activities, QTC also invests funds on behalf of its clients through the QTC Cash Fund. QTC’s Cash Fund is capital guaranteed. To reduce the impact of a credit failure on its retained earnings, QTC sets aside a certain portion of its fees earned from the Cash Fund to the Credit Risk Reserve together with interest accumulated on the reserves. The Credit Risk Reserve will be utilised if a credit event results in there being a shortfall between the guaranteed capital and the investments of the Cash Fund.
(2) The Basis Risk Reserve has been created to provide for losses that may occur as a result of basis risk where QTC has borrowed funds in excess of its loans to clients. The excess borrowings are needed to enable QTC to manage its client debt portfolios and liquidity, and are hedged through the purchase of liquid assets. Gains/losses may result due to interest yields on the asset hedges not moving in exactly the same manner as the interest yields on borrowings. Basis risk is measured using the value
at risk methodology. At the 99% confidence level, the accumulated losses as a result of basis risk on surplus fixed rate funding over a 10 business day period will be no greater than the value of the reserve for surplus fixed rate funding. Further at 99% confidence, the accumulated losses as a result of basis risk on surplus floating rate funding over a 20 business day period, will be no greater than the value of the reserve for surplus floating rate funding.
QUEENSLAND TREASURY CORPORATION ANNUAL REPORT 2010-2011
61
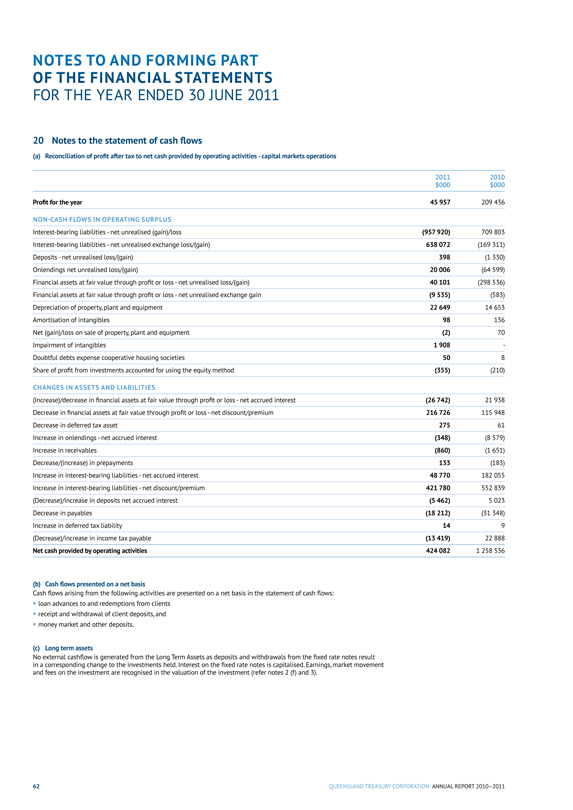
NOTES TO AND FORMING PART OF THE FINANCIAL STATEMENTS
FOR THE YEAR ENDED 30 JUNE 2011
20 Notes to the statement of cash flows
(a) Reconciliation of profit after tax to net cash provided by operating activities - capital markets operations
2011
$000 2010
$000
Profit for the year 45 957 209 436
NON-CASH FLOWS IN OPERATING SURPLUS
Interest-bearing liabilities - net unrealised (gain)/loss (957 920) 709 803
Interest-bearing liabilities - net unrealised exchange loss/(gain) 638 072 (169 311)
Deposits - net unrealised loss/(gain) 398 (1 330)
Onlendings net unrealised loss/(gain) 20 006 (64 599)
Financial assets at fair value through profit or loss - net unrealised loss/(gain) 40 101 (298 536)
Financial assets at fair value through profit or loss - net unrealised exchange gain (9 535) (583)
Depreciation of property, plant and equipment 22 649 14 653
Amortisation of intangibles 98 136
Net (gain)/loss on sale of property, plant and equipment (2) 70
Impairment of intangibles 1 908 -
Doubtful debts expense cooperative housing societies 50 8
Share of profit from investments accounted for using the equity method (355) (210)
CHANGES IN ASSETS AND LIABILITIES
(Increase)/decrease in financial assets at fair value through profit or loss - net accrued interest (26 742) 21 938
Decrease in financial assets at fair value through profit or loss - net discount/premium 216 726 115 948
Decrease in deferred tax asset 275 61
Increase in onlendings - net accrued interest (348) (8 579)
Increase in receivables (860) (1 651)
Decrease/(increase) in prepayments 133 (183)
Increase in interest-bearing liabilities - net accrued interest 48 770 182 055
Increase in interest-bearing liabilities - net discount/premium 421 780 552 839
(Decrease)/increase in deposits net accrued interest (5 462) 5 023
Decrease in payables (18 212) (31 348)
Increase in deferred tax liability 14 9
(Decrease)/increase in income tax payable (13 419) 22 888
Net cash provided by operating activities 424 082 1 258 536
(b) Cash flows presented on a net basis
Cash flows arising from the following activities are presented on a net basis in the statement of cash flows:
loan advances to and redemptions from clients
receipt and withdrawal of client deposits, and
money market and other deposits.
(c) Long term assets
No external cashflow is generated from the Long Term Assets as deposits and withdrawals from the fixed rate notes result in a corresponding change to the investments held. Interest on the fixed rate notes is capitalised. Earnings, market movement and fees on the investment are recognised in the valuation of the investment (refer notes 2 (f) and 3).
62
QUEENSLAND TREASURY CORPORATION ANNUAL REPORT 2010-2011

21 Financial risk management
CAPITAL MARKETS OPERATIONS
QTC’s activities expose it to a variety of financial risks including market risk (including currency, interest rate and price risks), credit risk and liquidity risk. QTC’s financial risk management program focuses on minimising financial risk exposures and managing volatility, and seeks to mitigate potential adverse effects of financial risks on the financial performance of QTC and its clients. To assist in managing financial risk, QTC uses derivative financial instruments such as foreign exchange contracts, interest rate swaps and futures contracts to manage certain risk exposures.
All financial risk management activities are conducted within Board approved policies. The Board approves policies for overall risk management, as well as specifically for managing foreign exchange, interest rate and credit risks, the use of derivative financial instruments and managing and investing liquid funds.
Robust systems are in place for managing financial risk, and compliance with financial risk policies is monitored closely. The financial risk management process, including daily measuring and monitoring of market risk exposure and daily measuring of actual performance against benchmark performance, as well as the Counterparty Credit Limit Framework and Approvals Process, is performed by teams separate from the teams transacting and is subject to review by the Risk Management Team (comprising senior management), the Transaction & Limit Review Committee (comprised of Board members) and the Risk Management Committee of the Board.
All breaches of the Financial Risk Management Policy together with the corrective action proposed or taken are required to be immediately reported to the Chief Executive and then to the next Risk Management Committee meeting.
(a) Market risk
QTC borrows in advance of requirements to ensure Queensland public sector entities have ready access to funding when required and also to reduce the risk associated with refinancing maturing loans. In addition, QTC may hold surplus funds to assist with the management of client portfolios. These surplus funds are invested in high credit quality, highly liquid financial investments. As a consequence, QTC is subject to market risk.
QTC uses a Board approved Value-at-Risk (VaR) framework to manage QTC’s exposure to market risk. The VaR risk measure estimates the potential mark-to-market loss over a given holding period at a 99% confidence level. QTC uses the historical simulation approach to calculate VaR using 18 months of market data. Depending on the liquidity of the underlying financial instruments, either a 10 day or 20 day holding period is used. QTC has developed scenario analysis capabilities to complement VaR.
(i) Foreign exchange risk
QTC has funding facilities that allow for borrowing in foreign currencies. As QTC’s clients have no foreign currency funding requirements, all foreign currency borrowings are either hedged to Australian dollars to ensure no currency risk or invested in financial assets denominated in that currency, effectively eliminating any foreign currency exposure. Therefore QTC is not impacted by changes in foreign exchange rates.
At times, QTC’s Cash Fund invests in foreign currency assets. These investments are always hedged through the use of derivatives to achieve a net Australian dollar exposure.
QTC enters into both forward exchange contracts and cross currency swaps to hedge the exposure of foreign currency borrowings and offshore investments from fluctuations in exchange rates.
The following table summarises the hedging effect that cross currency swaps and forward exchange contracts have had on face value offshore borrowings and investments stated in Australian dollars.
BORROWINGS OFFSHORE
INVESTMENTS FORWARD EXCHANGE
CONTRACTS NET EXPOSURE
2011
$000 2010
$000 2011 2010
$000 $000 2011
$000 2010
$000 2011 2010
$000 $000
USD (1 731 074) (2 233 756) 220 285 25 847 1 510 789 2 207 888 - (21)
CHF (17 899) - - - 17 899 - -
GBP (7 488) (44 026) - - 7 488 44 026 - -
NZD (598 841) (629 690) - - 598 841 629 690 - -
SGD - (12 548) - - - 12 548 - -
YEN (173 664) (197 867) - - 173 664 197 867 - -
(ii) Interest rate risk
In managing interest rate risk on behalf of clients, the onlending portfolios are managed against duration benchmarks. Duration is a direct measure of the interest rate sensitivity of a financial instrument or a portfolio of financial instruments and quantifies the change in value of a financial instrument or portfolio due to interest rate movements. To manage the risk of non-parallel yield curve movements, QTC manages portfolio cash flows in a series of time periods with the duration for each of these periods measured against the equivalent benchmark duration. The same process is also used for QTC’s Cash Fund. All costs or benefits of managing client debt portfolios are passed on to the client meaning that QTC is effectively immunised from interest rate risk with respect to these portfolios.
QTC enters into interest rate swaps, forward rate agreements and futures contracts to assist in the management of interest rate risk for QTC and its clients.
In most instances, interest rate swaps are utilised to change the interest rate exposure of medium to long term fixed rate borrowings into floating rate borrowings to achieve cost effective floating rate funding and to minimise refinancing risk when compared to floating rate debt. At times, floating to fixed swaps are undertaken to generate a fixed rate term funding profile.
Where interest rate swaps are used to manage funding, QTC is exposed to basis risk. This risk gives rise to a mark-to-market exposure due to movements between the Swap curve and the QTC curve. The swap risk is inherent in QTC’s approach to raising floating rate funding.
VaR IMPACT
There has been a significant decrease in the reported Value-at-Risk over the last financial year primarily due to a reduction in market volatility. The VaR at 30 June was as follows:
2011 2010
Interest rate risk VaR $40m $95m
The above VaR calculation does not include the potential mark-to-market impact of changes in credit spreads on the value of assets held in the QTC Cash Fund. At 30 June 2011, QTC had an exposure of approximately $819,000 per basis point to changes in credit spreads of assets held in the QTC Cash Fund.
IMPACT ON OPERATING RESULT
Funding in advance
As previously stated, QTC holds surplus funds generated through the issuance of debt to meet future commitments, which have been hedged through the purchase of high credit quality and highly liquid financial assets. Due to the nature of these hedging instruments (eg futures and other RBA repo eligible securities such as bank bills and government bonds), there are residual risk positions which may result in realised and unrealised accounting gains or losses.
QUEENSLAND TREASURY CORPORATION ANNUAL REPORT 2010-2011 63
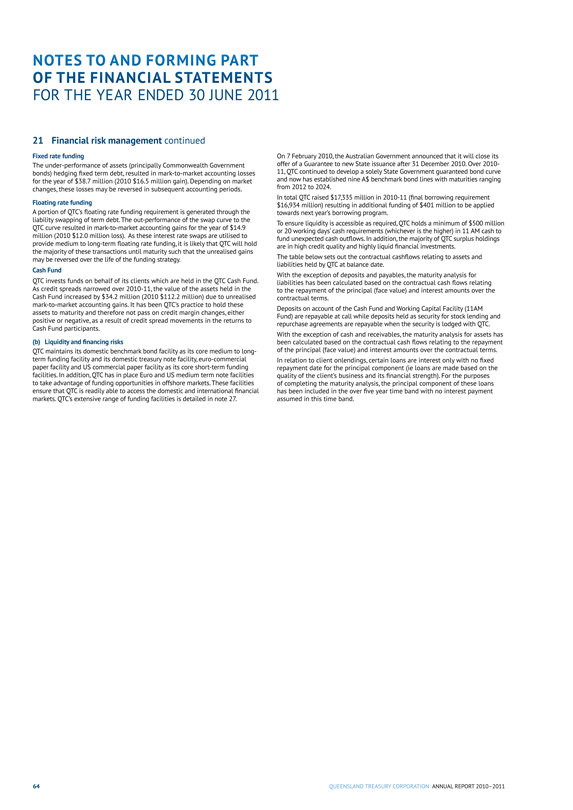
NOTES TO AND FORMING PART OF THE FINANCIAL STATEMENTS
FOR THE YEAR ENDED 30 JUNE 2011
21 Financial risk management continued
Fixed rate funding
The under-performance of assets (principally Commonwealth Government bonds) hedging fixed term debt, resulted in mark-to-market accounting losses for the year of $38.7 million (2010 $16.5 million gain). Depending on market changes, these losses may be reversed in subsequent accounting periods.
Floating rate funding
A portion of QTC’s floating rate funding requirement is generated through the liability swapping of term debt. The out-performance of the swap curve to the QTC curve resulted in mark-to-market accounting gains for the year of $14.9 million (2010 $12.0 million loss). As these interest rate swaps are utilised to provide medium to long-term floating rate funding, it is likely that QTC will hold the majority of these transactions until maturity such that the unrealised gains may be reversed over the life of the funding strategy.
Cash Fund
QTC invests funds on behalf of its clients which are held in the QTC Cash Fund. As credit spreads narrowed over 2010-11, the value of the assets held in the Cash Fund increased by $34.2 million (2010 $112.2 million) due to unrealised mark-to-market accounting gains. It has been QTC’s practice to hold these assets to maturity and therefore not pass on credit margin changes, either positive or negative, as a result of credit spread movements in the returns to Cash Fund participants.
(b) Liquidity and financing risks
QTC maintains its domestic benchmark bond facility as its core medium to long-term funding facility and its domestic treasury note facility, euro-commercial paper facility and US commercial paper facility as its core short-term funding facilities. In addition, QTC has in place Euro and US medium term note facilities to take advantage of funding opportunities in offshore markets. These facilities ensure that QTC is readily able to access the domestic and international financial markets. QTC’s extensive range of funding facilities is detailed in note 27.
On 7 February 2010, the Australian Government announced that it will close its offer of a Guarantee to new State issuance after 31 December 2010. Over 2010 11, QTC continued to develop a solely State Government guaranteed bond curve and now has established nine A$ benchmark bond lines with maturities ranging
from 2012 to 2024.
In total QTC raised $17,335 million in 2010-11 (final borrowing requirement $16,934 million) resulting in additional funding of $401 million to be applied towards next year’s borrowing program.
To ensure liquidity is accessible as required, QTC holds a minimum of $500 million or 20 working days’ cash requirements (whichever is the higher) in 11 AM cash to fund unexpected cash outflows. In addition, the majority of QTC surplus holdings are in high credit quality and highly liquid financial investments.
The table below sets out the contractual cashflows relating to assets and liabilities held by QTC at balance date.
With the exception of deposits and payables, the maturity analysis for liabilities has been calculated based on the contractual cash flows relating to the repayment of the principal (face value) and interest amounts over the contractual terms.
Deposits on account of the Cash Fund and Working Capital Facility (11AM Fund) are repayable at call while deposits held as security for stock lending and repurchase agreements are repayable when the security is lodged with QTC.
With the exception of cash and receivables, the maturity analysis for assets has been calculated based on the contractual cash flows relating to the repayment of the principal (face value) and interest amounts over the contractual terms.
In relation to client onlendings, certain loans are interest only with no fixed repayment date for the principal component (ie loans are made based on the quality of the client’s business and its financial strength). For the purposes of completing the maturity analysis, the principal component of these loans has been included in the over five year time band with no interest payment assumed in this time band.
64
QUEENSLAND TREASURY CORPORATION ANNUAL REPORT 2010-2011
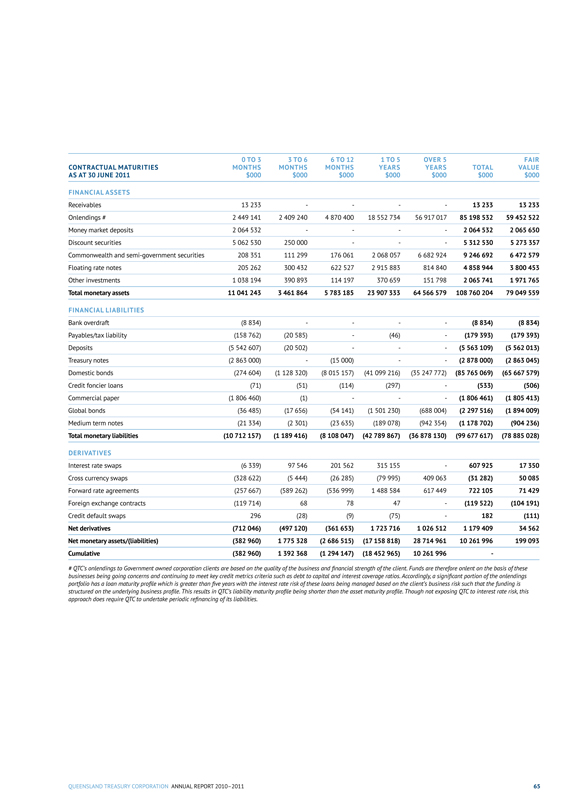
CONTRACTUAL MATURITIES AS AT 30 JUNE 2011 0 TO 3
MONTHS $000 3 TO 6
MONTHS $000 6 TO 12
MONTHS $000 1 TO 5
YEARS $000 OVER 5
YEARS $000 TOTAL $000 FAIR
VALUE $000
FINANCIAL ASSETS
Receivables 13 233 - - - - 13 233 13 233
Onlendings # 2 449 141 2 409 240 4 870 400 18 552 734 56 917 017 85 198 532 59 452 522
Money market deposits 2 064 532 - - - - 2 064 532 2 065 650
Discount securities 5 062 530 250 000 - - - 5 312 530 5 273 357
Commonwealth and semi-government securities 208 351 111 299 176 061 2 068 057 6 682 924 9 246 692 6 472 579
Floating rate notes 205 262 300 432 622 527 2 915 883 814 840 4 858 944 3 800 453
Other investments 1 038 194 390 893 114 197 370 659 151 798 2 065 741 1 971 765
Total monetary assets 11 041 243 3 461 864 5 783 185 23 907 333 64 566 579 108 760 204 79 049 559
FINANCIAL LIABILITIES
Bank overdraft (8 834) - - - - (8 834) (8 834)
Payables/tax liability (158 762) (20 585) - - (46) - (179 393) (179 393)
Deposits (5 542 607) (20 502) - - - (5 563 109) (5 562 013)
Treasury notes (2 863 000) - (15 000) - - (2 878 000) (2 863 045)
Domestic bonds (274 604) (1 128 320) (8 015 157) (41 099 216) (35 247 772) (85 765 069) (65 667 579)
Credit foncier loans (71) (51) (114) (297) - (533) (506)
Commercial paper (1 806 460) (1) - - - (1 806 461) (1 805 413)
Global bonds (36 485) (17 656) (54 141) (1 501 230) (688 004) (2 297 516) (1 894 009)
Medium term notes (21 334) (2 301) (23 635) (189 078) (942 354) (1 178 702) (904 236)
Total monetary liabilities (10 712 157) (1 189 416) (8 108 047) (42 789 867) (36 878 130) (99 677 617) (78 885 028)
DERIVATIVES
Interest rate swaps (6 339) 97 546 201 562 315 155 - 607 925 17 350
Cross currency swaps (328 622) (5 444) (26 285) (79 995) 409 063 (31 282) 50 085
Forward rate agreements (257 667) (589 262) (536 999) 1 488 584 617 449 722 105 71 429
Foreign exchange contracts (119 714) 68 78 47 - (119 522) (104 191)
Credit default swaps 296 (28) (9) (75) - 182 (111)
Net derivatives (712 046) (497 120) (361 653) 1 723 716 1 026 512 1 179 409 34 562
Net monetary assets/(liabilities) (382 960) 1 775 328 (2 686 515) (17 158 818) 28 714 961 10 261 996 199 093
Cumulative (382 960) 1 392 368 (1 294 147) (18 452 965) 10 261 996 -
# QTC’s onlendings to Government owned corporation clients are based on the quality of the business and financial strength of the client. Funds are therefore onlent on the basis of these businesses being going concerns and continuing to meet key credit metrics criteria such as debt to capital and interest coverage ratios. Accordingly, a significant portion of the onlendings portfolio has a loan maturity profile which is greater than five years with the interest rate risk of these loans being managed based on the client’s business risk such that the funding is structured on the underlying business profile. This results in QTC’s liability maturity profile being shorter than the asset maturity profile. Though not exposing QTC to interest rate risk, this approach does require QTC to undertake periodic refinancing of its liabilities.
QUEENSLAND TREASURY CORPORATION ANNUAL REPORT 2010-2011
65
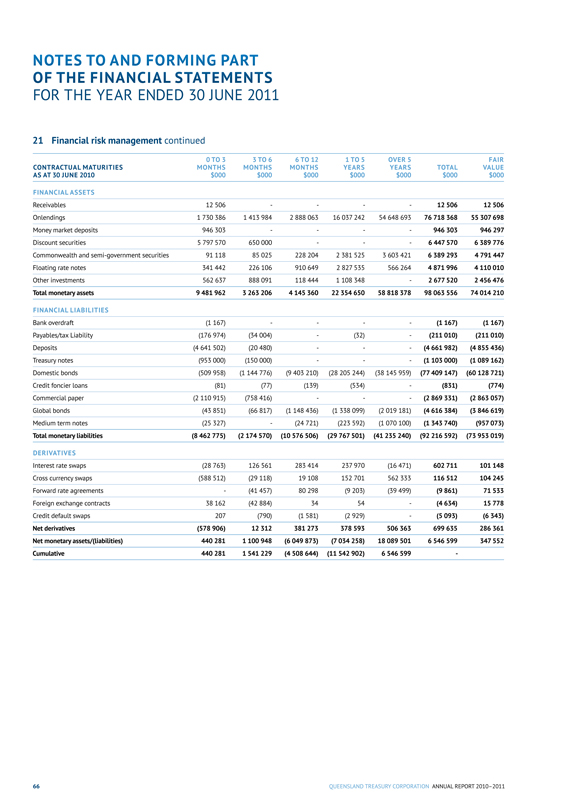
NOTES TO AND FORMING PART OF THE FINANCIAL STATEMENTS
FOR THE YEAR ENDED 30 JUNE 2011
21 Financial risk management continued
CONTRACTUAL MATURITIES AS AT 30 JUNE 2010
0 TO 3 MONTHS $000
3 TO 6 MONTHS $000 6 TO 12 MONTHS
$000 1 TO 5
YEARS $000 OVER 5
YEARS $000 TOTAL $000 FAIR
VALUE $000
FINANCIAL ASSETS
Receivables 12 506 - - - - 12 506 12 506
Onlendings 1 730 386 1 413 984 2 888 063 16 037 242 54 648 693 76 718 368 55 307 698
Money market deposits 946 303 - - - - 946 303 946 297
Discount securities 5 797 570 650 000 - - - 6 447 570 6 389 776
Commonwealth and semi-government securities 91 118 85 025 228 204 2 381 525 3 603 421 6 389 293 4 791 447
Floating rate notes 341 442 226 106 910 649 2 827 535 566 264 4 871 996 4 110 010
Other investments 562 637 888 091 118 444 1 108 348 - 2 677 520 2 456 476
Total monetary assets 9 481 962 3 263 206 4 145 360 22 354 650 58 818 378 98 063 556 74 014 210
FINANCIAL LIABILITIES
Bank overdraft (1 167) - - - - (1 167) (1 167)
Payables/tax Liability (176 974) (34 004) - (32) - (211 010) (211 010)
Deposits (4 641 502) (20 480) - - - (4 661 982) (4 855 436)
Treasury notes (953 000) (150 000) - - - (1 103 000) (1 089 162)
Domestic bonds (509 958) (1 144 776) (9 403 210) (28 205 244) (38 145 959) (77 409 147) (60 128 721)
Credit foncier loans (81) (77) (139) (534) - (831) (774)
Commercial paper (2 110 915) (758 416) - - - (2 869 331) (2 863 057)
Global bonds (43 851) (66 817) (1 148 436) (1 338 099) (2 019 181) (4 616 384) (3 846 619)
Medium term notes (25 327) - (24 721) (223 592) (1 070 100) (1 343 740) (957 073)
Total monetary liabilities (8 462 775) (2 174 570) (10 576 506) (29 767 501) (41 235 240) (92 216 592) (73 953 019)
DERIVATIVES
Interest rate swaps (28 763) 126 561 283 414 237 970 (16 471) 602 711 101 148
Cross currency swaps (588 512) (29 118) 19 108 152 701 562 333 116 512 104 245
Forward rate agreements - (41 457) 80 298 (9 203) (39 499) (9 861) 71 533
Foreign exchange contracts 38 162 (42 884) 34 54 - (4 634) 15 778
Credit default swaps 207 (790) (1 581) (2 929) - (5 093) (6 343)
Net derivatives (578 906) 12 312 381 273 378 593 506 363 699 635 286 361
Net monetary assets/(liabilities) 440 281 1 100 948 (6 049 873) (7 034 258) 18 089 501 6 546 599 347 552
Cumulative 440 281 1 541 229 (4 508 644) (11 542 902) 6 546 599 -
66
QUEENSLAND TREASURY CORPORATION ANNUAL REPORT 2010-2011
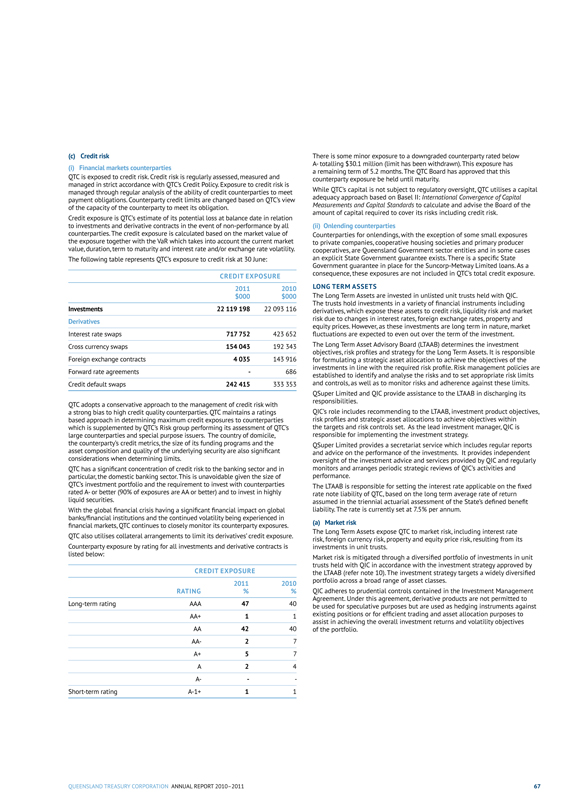
(c) Credit risk
(i) Financial markets counterparties
QTC is exposed to credit risk. Credit risk is regularly assessed, measured and managed in strict accordance with QTC’s Credit Policy. Exposure to credit risk is managed through regular analysis of the ability of credit counterparties to meet payment obligations. Counterparty credit limits are changed based on QTC’s view of the capacity of the counterparty to meet its obligation.
Credit exposure is QTC’s estimate of its potential loss at balance date in relation to investments and derivative contracts in the event of non-performance by all counterparties. The credit exposure is calculated based on the market value of the exposure together with the VaR which takes into account the current market value, duration, term to maturity and interest rate and/or exchange rate volatility.
The following table represents QTC’s exposure to credit risk at 30 June:
CREDIT EXPOSURE
2011
2010
$000
$000
Investments
22 119 198
22 093 116
Derivatives
Interest rate swaps
717 752
423 652
Cross currency swaps
154 043
192 343
Foreign exchange contracts
4 035
143 916
Forward rate agreements
-
686
Credit default swaps
242 415
333 353
QTC adopts a conservative approach to the management of credit risk with a strong bias to high credit quality counterparties. QTC maintains a ratings based approach in determining maximum credit exposures to counterparties which is supplemented by QTC’s Risk group performing its assessment of QTC’s large counterparties and special purpose issuers. The country of domicile, the counterparty’s credit metrics, the size of its funding programs and the asset composition and quality of the underlying security are also significant considerations when determining limits.
QTC has a significant concentration of credit risk to the banking sector and in particular, the domestic banking sector. This is unavoidable given the size of QTC’s investment portfolio and the requirement to invest with counterparties rated A- or better (90% of exposures are AA or better) and to invest in highly liquid securities.
With the global financial crisis having a significant financial impact on global banks/financial institutions and the continued volatility being experienced in financial markets, QTC continues to closely monitor its counterparty exposures.
QTC also utilises collateral arrangements to limit its derivatives’ credit exposure.
Counterparty exposure by rating for all investments and derivative contracts is listed below:
CREDIT EXPOSURE
RATING
2011
%
2010
%
Long-term rating
AAA
47
40
AA+
1
1
AA
42
40
AA-
2
7
A+
5
7
A
2
4
A- - -
Short-term rating A-1+ 1 1
There is some minor exposure to a downgraded counterparty rated below A- totalling $30.1 million (limit has been withdrawn). This exposure has a remaining term of 5.2 months. The QTC Board has approved that this counterparty exposure be held until maturity.
While QTC’s capital is not subject to regulatory oversight, QTC utilises a capital adequacy approach based on Basel II: International Convergence of Capital Measurements and Capital Standards to calculate and advise the Board of the amount of capital required to cover its risks including credit risk.
(ii) Onlending counterparties
Counterparties for onlendings, with the exception of some small exposures to private companies, cooperative housing societies and primary producer cooperatives, are Queensland Government sector entities and in some cases an explicit State Government guarantee exists. There is a specific State Government guarantee in place for the Suncorp-Metway Limited loans. As a consequence, these exposures are not included in QTC’s total credit exposure.
LONG TERM ASSETS
The Long Term Assets are invested in unlisted unit trusts held with QIC. The trusts hold investments in a variety of financial instruments including derivatives, which expose these assets to credit risk, liquidity risk and market risk due to changes in interest rates, foreign exchange rates, property and equity prices. However, as these investments are long term in nature, market fluctuations are expected to even out over the term of the investment.
The Long Term Asset Advisory Board (LTAAB) determines the investment objectives, risk profiles and strategy for the Long Term Assets. It is responsible for formulating a strategic asset allocation to achieve the objectives of the investments in line with the required risk profile. Risk management policies are established to identify and analyse the risks and to set appropriate risk limits and controls, as well as to monitor risks and adherence against these limits.
QSuper Limited and QIC provide assistance to the LTAAB in discharging its responsibilities.
QIC’s role includes recommending to the LTAAB, investment product objectives, risk profiles and strategic asset allocations to achieve objectives within the targets and risk controls set. As the lead investment manager, QIC is responsible for implementing the investment strategy.
QSuper Limited provides a secretariat service which includes regular reports and advice on the performance of the investments. It provides independent oversight of the investment advice and services provided by QIC and regularly monitors and arranges periodic strategic reviews of QIC’s activities and performance.
The LTAAB is responsible for setting the interest rate applicable on the fixed rate note liability of QTC, based on the long term average rate of return assumed in the triennial actuarial assessment of the State’s defined benefit liability. The rate is currently set at 7.5% per annum.
(a) Market risk
The Long Term Assets expose QTC to market risk, including interest rate risk, foreign currency risk, property and equity price risk, resulting from its investments in unit trusts.
Market risk is mitigated through a diversified portfolio of investments in unit trusts held with QIC in accordance with the investment strategy approved by the LTAAB (refer note 10). The investment strategy targets a widely diversified portfolio across a broad range of asset classes.
QIC adheres to prudential controls contained in the Investment Management Agreement. Under this agreement, derivative products are not permitted to be used for speculative purposes but are used as hedging instruments against existing positions or for efficient trading and asset allocation purposes to assist in achieving the overall investment returns and volatility objectives of the portfolio.
QUEENSLAND TREASURY CORPORATION ANNUAL REPORT 2010-2011
67
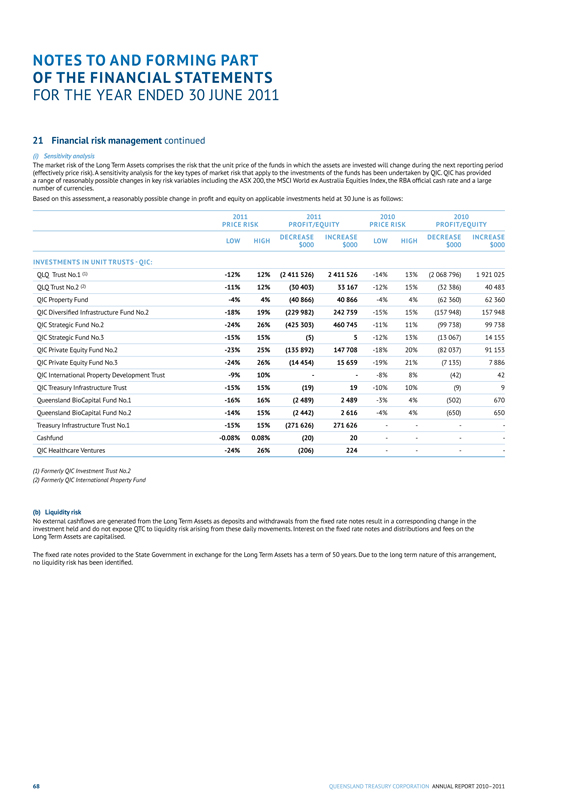
NOTES TO AND FORMING PART OF THE FINANCIAL STATEMENTS
FOR THE YEAR ENDED 30 JUNE 2011
21 Financial risk management continued
(i) Sensitivity analysis
The market risk of the Long Term Assets comprises the risk that the unit price of the funds in which the assets are invested will change during the next reporting period (effectively price risk). A sensitivity analysis for the key types of market risk that apply to the investments of the funds has been undertaken by QIC. QIC has provided a range of reasonably possible changes in key risk variables including the ASX 200, the MSCI World ex Australia Equities Index, the RBA official cash rate and a large number of currencies.
Based on this assessment, a reasonably possible change in profit and equity on applicable investments held at 30 June is as follows:
2011
PRICE RISK 2011
PROFIT/EQUITY 2010
PRICE RISK 2010
PROFIT/EQUITY
LOW HIGH DECREASE $000 INCREASE
$000 LOW HIGH DECREASE
$000 INCREASE
$000
INVESTMENTS IN UNIT TRUSTS - QIC:
QLQ Trust No.1 (1) -12% 12% (2 411 526) 2 411 526 -14% 13% (2 068 796) 1 921 025
QLQ Trust No.2 (2) -11% 12% (30 403) 33 167 -12% 15% (32 386) 40 483
QIC Property Fund -4% 4% (40 866) 40 866 -4% 4% (62 360) 62 360
QIC Diversified Infrastructure Fund No.2 -18% 19% (229 982) 242 759 -15% 15% (157 948) 157 948
QIC Strategic Fund No.2 -24% 26% (425 303) 460 745 -11% 11% (99 738) 99 738
QIC Strategic Fund No.3 -15% 15% (5) 5 -12% 13% (13 067) 14 155
QIC Private Equity Fund No.2 -23% 25% (135 892) 147 708 -18% 20% (82 037) 91 153
QIC Private Equity Fund No.3 -24% 26% (14 454) 15 659 -19% 21% (7 135) 7 886
QIC International Property Development Trust -9% 10% - - 8% 8% (42) 42
QIC Treasury Infrastructure Trust -15% 15% (19) 19 -10% 10% (9) 9
Queensland BioCapital Fund No.1 -16% 16% (2 489) 2 489 -3% 4% (502) 670
Queensland BioCapital Fund No.2 -14% 15% (2 442) 2 616 -4% 4% (650) 650
Treasury Infrastructure Trust No.1 -15% 15% (271 626) 271 626 - - -
Cashfund -0.08% 0.08% (20) 20 - - -
QIC Healthcare Ventures -24% 26% (206) 224 - - -
(1) Formerly QIC Investment Trust No.2
(2) Formerly QIC International Property Fund
(b) Liquidity risk
No external cashflows are generated from the Long Term Assets as deposits and withdrawals from the fixed rate notes result in a corresponding change in the investment held and do not expose QTC to liquidity risk arising from these daily movements. Interest on the fixed rate notes and distributions and fees on the Long Term Assets are capitalised.
The fixed rate notes provided to the State Government in exchange for the Long Term Assets has a term of 50 years. Due to the long term nature of this arrangement, no liquidity risk has been identified.
68
QUEENSLAND TREASURY CORPORATION ANNUAL REPORT 2010-2011
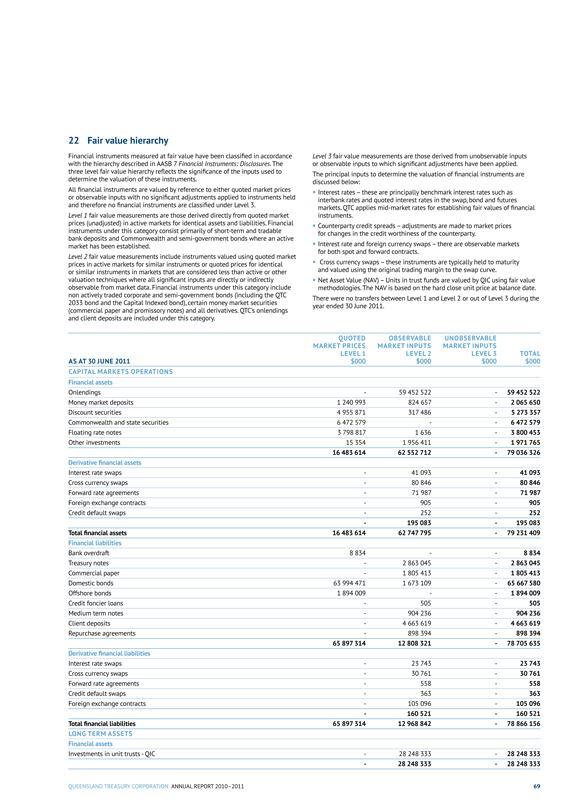
22 Fair value hierarchy
Financial instruments measured at fair value have been classified in accordance with the hierarchy described in AASB 7 Financial Instruments: Disclosures. The three level fair value hierarchy reflects the significance of the inputs used to determine the valuation of these instruments.
All financial instruments are valued by reference to either quoted market prices or observable inputs with no significant adjustments applied to instruments held and therefore no financial instruments are classified under Level 3.
Level 1 fair value measurements are those derived directly from quoted market prices (unadjusted) in active markets for identical assets and liabilities. Financial instruments under this category consist primarily of short-term and tradable bank deposits and Commonwealth and semi-government bonds where an active market has been established.
Level 2 fair value measurements include instruments valued using quoted market prices in active markets for similar instruments or quoted prices for identical or similar instruments in markets that are considered less than active or other valuation techniques where all significant inputs are directly or indirectly observable from market data. Financial instruments under this category include non actively traded corporate and semi-government bonds (including the QTC 2033 bond and the Capital Indexed bond), certain money market securities (commercial paper and promissory notes) and all derivatives. QTC’s onlendings and client deposits are included under this category.
Level 3 fair value measurements are those derived from unobservable inputs or observable inputs to which significant adjustments have been applied.
The principal inputs to determine the valuation of financial instruments are discussed below:
• Interest rates - these are principally benchmark interest rates such as interbank rates and quoted interest rates in the swap, bond and futures markets. QTC applies mid-market rates for establishing fair values of financial instruments.
• Counterparty credit spreads - adjustments are made to market prices for changes in the credit worthiness of the counterparty.
• Interest rate and foreign currency swaps - there are observable markets for both spot and forward contracts.
• Cross currency swaps - these instruments are typically held to maturity and valued using the original trading margin to the swap curve.
• Net Asset Value (NAV) - Units in trust funds are valued by QIC using fair value methodologies. The NAV is based on the hard close unit price at balance date.
There were no transfers between Level 1 and Level 2 or out of Level 3 during the year ended 30 June 2011.
AS AT 30 JUNE 2011 QUOTED MARKET PRICES
LEVEL 1 $000 OBSERVABLE
MARKET INPUTS LEVEL 2 $000 UNOBSERVABLE
MARKET INPUTS
LEVEL 3 $000 TOTAL $000
CAPITAL MARKETS OPERATIONS
Financial assets
Onlendings - 59 452 522 - 59 452 522
Money market deposits 1 240 993 824 657 - 2 065 650
Discount securities 4 955 871 317 486 - 5 273 357
Commonwealth and state securities 6 472 579 - - 6 472 579
Floating rate notes 3 798 817 1 636 - 3 800 453
Other investments 15 354 1 956 411 - 1 971 765
16 483 614 62 552 712 - 79 036 326
Derivative financial assets
Interest rate swaps - 41 093 - 41 093
Cross currency swaps - 80 846 - 80 846
Forward rate agreements - 71 987 - 71 987
Foreign exchange contracts - 905 - 905
Credit default swaps - 252 - 252
- 195 083 - 195 083
Total financial assets 16 483 614 62 747 795 - 79 231 409
Financial liabilities
Bank overdraft 8 834 - - 8 834
Treasury notes - 2 863 045 - 2 863 045
Commercial paper - 1 805 413 - 1 805 413
Domestic bonds 63 994 471 1 673 109 - 65 667 580
Offshore bonds 1 894 009 - - 1 894 009
Credit foncier loans - 505 - 505
Medium term notes - 904 236 - 904 236
Client deposits - 4 663 619 - 4 663 619
Repurchase agreements - 898 394 - 898 394
65 897 314 12 808 321 - 78 705 635
Derivative financial liabilities
Interest rate swaps - 23 743 - 23 743
Cross currency swaps - 30 761 - 30 761
Forward rate agreements - 558 - 558
Credit default swaps - 363 - 363
Foreign exchange contracts - 105 096 - 105 096
- 160 521 - 160 521
Total financial liabilities 65 897 314 12 968 842 - 78 866 156
LONG TERM ASSETS
Financial assets
Investments in unit trusts - QIC - 28 248 333 - 28 248 333
- 28 248 333 - 28 248 333
QUEENSLAND TREASURY CORPORATION ANNUAL REPORT 2010-2011 69
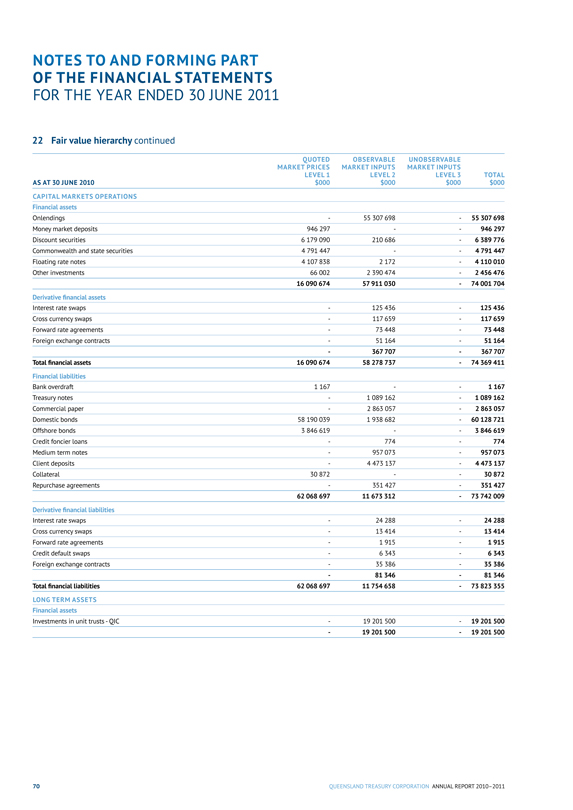
NOTES TO AND FORMING PART OF THE FINANCIAL STATEMENTS
FOR THE YEAR ENDED 30 JUNE 2011
22 Fair value hierarchy continued
AS AT 30 JUNE 2010 QUOTED MARKET PRICES
LEVEL 1 $000 OBSERVABLE
MARKET INPUTS LEVEL 2 $000 UNOBSERVABLE MARKET INPUTS
LEVEL 3 $000 TOTAL $000
CAPITAL MARKETS OPERATIONS
Financial assets
Onlendings - 55 307 698 - 55 307 698
Money market deposits 946 297 - - 946 297
Discount securities 6 179 090 210 686 - 6 389 776
Commonwealth and state securities 4 791 447 - - 4 791 447
Floating rate notes 4 107 838 2 172 - 4 110 010
Other investments 66 002 2 390 474 - 2 456 476
16 090 674 57 911 030 - 74 001 704
Derivative financial assets
Interest rate swaps - 125 436 - 125 436
Cross currency swaps - 117 659 - 117 659
Forward rate agreements - 73 448 - 73 448
Foreign exchange contracts - 51 164 - 51 164
- 367 707 - 367 707
Total financial assets 16 090 674 58 278 737 - 74 369 411
Financial liabilities
Bank overdraft 1 167 - - 1 167
Treasury notes - 1 089 162 - 1 089 162
Commercial paper - 2 863 057 - 2 863 057
Domestic bonds 58 190 039 1 938 682 - 60 128 721
Offshore bonds 3 846 619 - - 3 846 619
Credit foncier loans - 774 - 774
Medium term notes - 957 073 - 957 073
Client deposits - 4 473 137 - 4 473 137
Collateral 30 872 - - 30 872
Repurchase agreements - 351 427 - 351 427
62 068 697 11 673 312 - 73 742 009
Derivative financial liabilities
Interest rate swaps - 24 288 - 24 288
Cross currency swaps - 13 414 - 13 414
Forward rate agreements - 1 915 - 1 915
Credit default swaps - 6 343 - 6 343
Foreign exchange contracts - 35 386 - 35 386
- 81 346 - 81 346
Total financial liabilities 62 068 697 11 754 658 - 73 823 355
LONG TERM ASSETS
Financial assets
Investments in unit trusts - QIC - 19 201 500 - 19 201 500
- 19 201 500 - 19 201 500
70 QUEENSLAND TREASURY CORPORATION ANNUAL REPORT 2010-2011
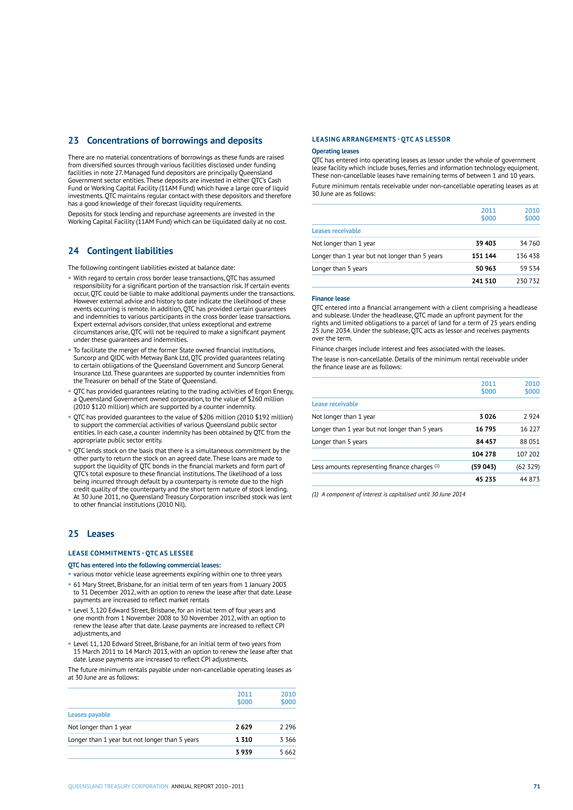
23 Concentrations of borrowings and deposits
There are no material concentrations of borrowings as these funds are raised from diversified sources through various facilities disclosed under funding facilities in note 27. Managed fund depositors are principally Queensland Government sector entities. These deposits are invested in either QTC’s Cash Fund or Working Capital Facility (11AM Fund) which have a large core of liquid investments. QTC maintains regular contact with these depositors and therefore has a good knowledge of their forecast liquidity requirements.
Deposits for stock lending and repurchase agreements are invested in the Working Capital Facility (11AM Fund) which can be liquidated daily at no cost.
24 Contingent liabilities
The following contingent liabilities existed at balance date:
With regard to certain cross border lease transactions, QTC has assumed responsibility for a significant portion of the transaction risk. If certain events occur, QTC could be liable to make additional payments under the transactions. However external advice and history to date indicate the likelihood of these events occurring is remote. In addition, QTC has provided certain guarantees and indemnities to various participants in the cross border lease transactions. Expert external advisors consider, that unless exceptional and extreme circumstances arise, QTC will not be required to make a significant payment under these guarantees and indemnities.
To facilitate the merger of the former State owned financial institutions, Suncorp and QIDC with Metway Bank Ltd, QTC provided guarantees relating to certain obligations of the Queensland Government and Suncorp General Insurance Ltd. These guarantees are supported by counter indemnities from the Treasurer on behalf of the State of Queensland.
QTC has provided guarantees relating to the trading activities of Ergon Energy, a Queensland Government owned corporation, to the value of $260 million (2010 $120 million) which are supported by a counter indemnity.
QTC has provided guarantees to the value of $206 million (2010 $192 million) to support the commercial activities of various Queensland public sector entities. In each case, a counter indemnity has been obtained by QTC from the appropriate public sector entity.
QTC lends stock on the basis that there is a simultaneous commitment by the other party to return the stock on an agreed date. These loans are made to support the liquidity of QTC bonds in the financial markets and form part of QTC’s total exposure to these financial institutions. The likelihood of a loss being incurred through default by a counterparty is remote due to the high credit quality of the counterparty and the short term nature of stock lending. At 30 June 2011, no Queensland Treasury Corporation inscribed stock was lent to other financial institutions (2010 Nil).
LEASING ARRANGEMENTS - QTC AS LESSOR
Operating leases
QTC has entered into operating leases as lessor under the whole of government lease facility which include buses, ferries and information technology equipment. These non-cancellable leases have remaining terms of between 1 and 10 years.
Future minimum rentals receivable under non-cancellable operating leases as at 30 June are as follows:
2011
$000 2010
$000
Leases receivable
Not longer than 1 year 39 403 34 760
Longer than 1 year but not longer than 5 years 151 144 136 438
Longer than 5 years 50 963 59 534
241 510 230 732
Finance lease
QTC entered into a financial arrangement with a client comprising a headlease and sublease. Under the headlease, QTC made an upfront payment for the rights and limited obligations to a parcel of land for a term of 25 years ending 25 June 2034. Under the sublease, QTC acts as lessor and receives payments over the term.
Finance charges include interest and fees associated with the leases.
The lease is non-cancellable. Details of the minimum rental receivable under the finance lease are as follows:
2011
$000
2010
$000
Lease receivable
Not longer than 1 year
3 026
2 924
Longer than 1 year but not longer than 5 years
16 795
16 227
Longer than 5 years
84 457
88 051
104 278
107 202
Less amounts representing finance charges (1)
(59 043)
(62 329)
45 235
44 873
(1) A component of interest is capitalised until 30 June 2014
25 Leases
LEASE COMMITMENTS - QTC AS LESSEE
QTC has entered into the following commercial leases:
various motor vehicle lease agreements expiring within one to three years
61 Mary Street, Brisbane, for an initial term of ten years from 1 January 2003 to 31 December 2012, with an option to renew the lease after that date. Lease payments are increased to reflect market rentals
Level 3, 120 Edward Street, Brisbane, for an initial term of four years and one month from 1 November 2008 to 30 November 2012, with an option to renew the lease after that date. Lease payments are increased to reflect CPI adjustments, and
Level 11, 120 Edward Street, Brisbane, for an initial term of two years from 15 March 2011 to 14 March 2013, with an option to renew the lease after that date. Lease payments are increased to reflect CPI adjustments.
The future minimum rentals payable under non-cancellable operating leases as at 30 June are as follows:
2011
$000 2010
$000
Leases payable
Not longer than 1 year 2 629 2 296
Longer than 1 year but not longer than 5 years 1 310 3 366
3 939 5 662
QUEENSLAND TREASURY CORPORATION ANNUAL REPORT 2010-2011 71
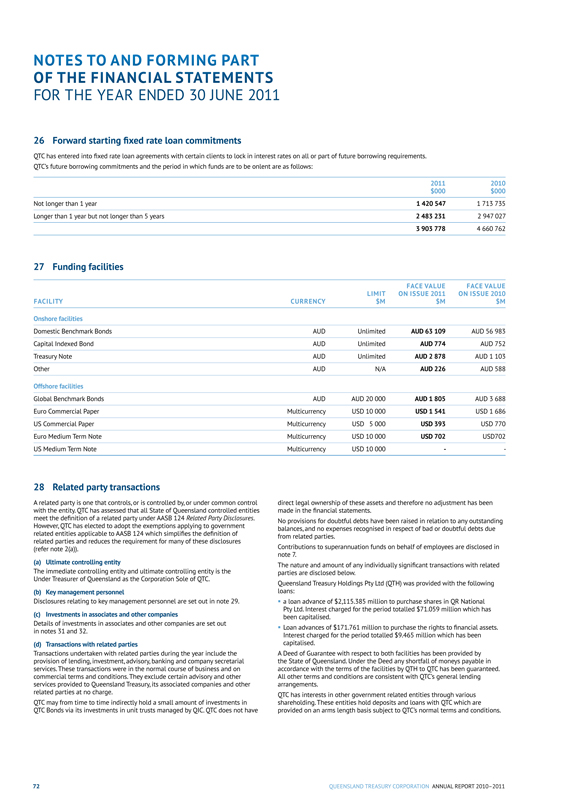
NOTES TO AND FORMING PART OF THE FINANCIAL STATEMENTS
FOR THE YEAR ENDED 30 JUNE 2011
26 Forward starting fixed rate loan commitments
QTC has entered into fixed rate loan agreements with certain clients to lock in interest rates on all or part of future borrowing requirements. QTC’s future borrowing commitments and the period in which funds are to be onlent are as follows:
2011 2010
$000 $000
Not longer than 1 year 1 420 547 1 713 735
Longer than 1 year but not longer than 5 years 2 483 231 2 947 027
3 903 778 4 660 762
27 Funding facilities
FACILITY CURRENCY LIMIT $M FACE VALUE ON ISSUE 2011
$M FACE VALUE
ON ISSUE 2010 $M
Onshore facilities
Domestic Benchmark Bonds AUD Unlimited AUD 63 109 AUD 56 983
Capital Indexed Bond AUD Unlimited AUD 774 AUD 752
Treasury Note AUD Unlimited AUD 2 878 AUD 1 103
Other AUD N/A AUD 226 AUD 588
Offshore facilities
Global Benchmark Bonds AUD AUD 20 000 AUD 1 805 AUD 3 688
Euro Commercial Paper Multicurrency USD 10 000 USD 1 541 USD 1 686
US Commercial Paper Multicurrency USD 5 000 USD 393 USD 770
Euro Medium Term Note Multicurrency USD 10 000 USD 702 USD702
US Medium Term Note Multicurrency USD 10 000 - -
28 Related party transactions
A related party is one that controls, or is controlled by, or under common control with the entity. QTC has assessed that all State of Queensland controlled entities meet the definition of a related party under AASB 124 Related Party Disclosures. However, QTC has elected to adopt the exemptions applying to government related entities applicable to AASB 124 which simplifies the definition of related parties and reduces the requirement for many of these disclosures (refer note 2(a)).
(a) Ultimate controlling entity
The immediate controlling entity and ultimate controlling entity is the Under Treasurer of Queensland as the Corporation Sole of QTC.
(b) Key management personnel
Disclosures relating to key management personnel are set out in note 29.
(c) Investments in associates and other companies
Details of investments in associates and other companies are set out in notes 31 and 32.
(d) Transactions with related parties
Transactions undertaken with related parties during the year include the provision of lending, investment, advisory, banking and company secretarial services. These transactions were in the normal course of business and on commercial terms and conditions. They exclude certain advisory and other services provided to Queensland Treasury, its associated companies and other related parties at no charge.
QTC may from time to time indirectly hold a small amount of investments in QTC Bonds via its investments in unit trusts managed by QIC. QTC does not have direct legal ownership of these assets and therefore no adjustment has been made in the financial statements.
No provisions for doubtful debts have been raised in relation to any outstanding balances, and no expenses recognised in respect of bad or doubtful debts due from related parties.
Contributions to superannuation funds on behalf of employees are disclosed in note 7.
The nature and amount of any individually significant transactions with related parties are disclosed below.
Queensland Treasury Holdings Pty Ltd (QTH) was provided with the following loans:
• a loan advance of $2,115.385 million to purchase shares in QR National Pty Ltd. Interest charged for the period totalled $71.059 million which has been capitalised.
• Loan advances of $171.761 million to purchase the rights to financial assets. Interest charged for the period totalled $9.465 million which has been capitalised.
A Deed of Guarantee with respect to both facilities has been provided by the State of Queensland. Under the Deed any shortfall of moneys payable in accordance with the terms of the facilities by QTH to QTC has been guaranteed. All other terms and conditions are consistent with QTC’s general lending arrangements.
QTC has interests in other government related entities through various shareholding. These entities hold deposits and loans with QTC which are provided on an arms length basis subject to QTC’s normal terms and conditions.
72 QUEENSLAND TREASURY CORPORATION ANNUAL REPORT 2010-2011
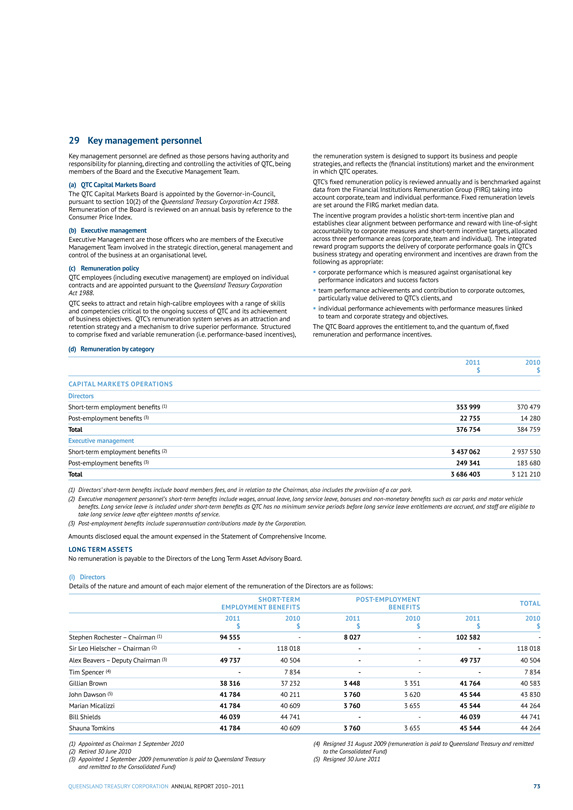
29 Key management personnel
Key management personnel are defined as those persons having authority and responsibility for planning, directing and controlling the activities of QTC, being members of the Board and the Executive Management Team.
(a) QTC Capital Markets Board
The QTC Capital Markets Board is appointed by the Governor-in-Council, pursuant to section 10(2) of the Queensland Treasury Corporation Act 1988. Remuneration of the Board is reviewed on an annual basis by reference to the Consumer Price Index.
(b) Executive management
Executive Management are those officers who are members of the Executive Management Team involved in the strategic direction, general management and control of the business at an organisational level.
(c) Remuneration policy
QTC employees (including executive management) are employed on individual contracts and are appointed pursuant to the Queensland Treasury Corporation
Act 1988.
QTC seeks to attract and retain high-calibre employees with a range of skills and competencies critical to the ongoing success of QTC and its achievement of business objectives. QTC’s remuneration system serves as an attraction and retention strategy and a mechanism to drive superior performance. Structured to comprise fixed and variable remuneration (i.e. performance-based incentives),
(d) Remuneration by category
the remuneration system is designed to support its business and people strategies, and reflects the (financial institutions) market and the environment in which QTC operates.
QTC’s fixed remuneration policy is reviewed annually and is benchmarked against data from the Financial Institutions Remuneration Group (FIRG) taking into account corporate, team and individual performance. Fixed remuneration levels are set around the FIRG market median data.
The incentive program provides a holistic short-term incentive plan and establishes clear alignment between performance and reward with line-of-sight accountability to corporate measures and short-term incentive targets, allocated across three performance areas (corporate, team and individual). The integrated reward program supports the delivery of corporate performance goals in QTC’s business strategy and operating environment and incentives are drawn from the following as appropriate:
corporate performance which is measured against organisational key performance indicators and success factors
team performance achievements and contribution to corporate outcomes, particularly value delivered to QTC’s clients, and
individual performance achievements with performance measures linked to team and corporate strategy and objectives.
The QTC Board approves the entitlement to, and the quantum of, fixed remuneration and performance incentives.
2011
$ 2010
$
CAPITAL MARKETS OPERATIONS
Directors
Short-term employment benefits (1) 353 999 370 479
Post-employment benefits (3) 22 755 14 280
Total 376 754 384 759
Executive management
Short-term employment benefits (2) 3 437 062 2 937 530
Post-employment benefits (3) 249 341 183 680
Total
3 686 403
3 121 210
(1) Directors’ short-term benefits include board members fees, and in relation to the Chairman, also includes the provision of a car park.
(2) Executive management personnel’s short-term benefits include wages, annual leave, long service leave, bonuses and non-monetary benefits such as car parks and motor vehicle benefits. Long service leave is included under short-term benefits as QTC has no minimum service periods before long service leave entitlements are accrued, and staff are eligible to take long service leave after eighteen months of service.
(3) Post-employment benefits include superannuation contributions made by the Corporation.
Amounts disclosed equal the amount expensed in the Statement of Comprehensive Income. LONG TERM ASSETS
No remuneration is payable to the Directors of the Long Term Asset Advisory Board.
(i) Directors
Details of the nature and amount of each major element of the remuneration of the Directors are as follows:
SHORT-TERM EMPLOYMENT BENEFITS POST-EMPLOYMENT
BENEFITS TOTAL
2011 $ 2010 $ 2011 $ 2010 $ 2011 $ 2010 $
Stephen Rochester – Chairman (1) 94 555 - 8 027 - 102 582 -
Sir Leo Hielscher – Chairman (2) - 118 018 - - - 118 018
Alex Beavers – Deputy Chairman (3) 49 737 40 504 - - 49 737 40 504
Tim Spencer (4) - 7 834 - - - 7 834
Gillian Brown 38 316 37 232 3 448 3 351 41 764 40 583
John Dawson (5) 41 784 40 211 3 760 3 620 45 544 43 830
Marian Micalizzi 41 784 40 609 3 760 3 655 45 544 44 264
Bill Shields 46 039 44 741 - - 46 039 44 741
Shauna Tomkins 41 784 40 609 3 760 3 655 45 544 44 264
(1) Appointed as Chairman 1 September 2010
(2) Retired 30 June 2010
(3) Appointed 1 September 2009 (remuneration is paid to Queensland Treasury and remitted to the Consolidated Fund)
(4) Resigned 31 August 2009 (remuneration is paid to Queensland Treasury and remitted to the Consolidated Fund)
(5) Resigned 30 June 2011
QUEENSLAND TREASURY CORPORATION ANNUAL REPORT 2010-2011 73
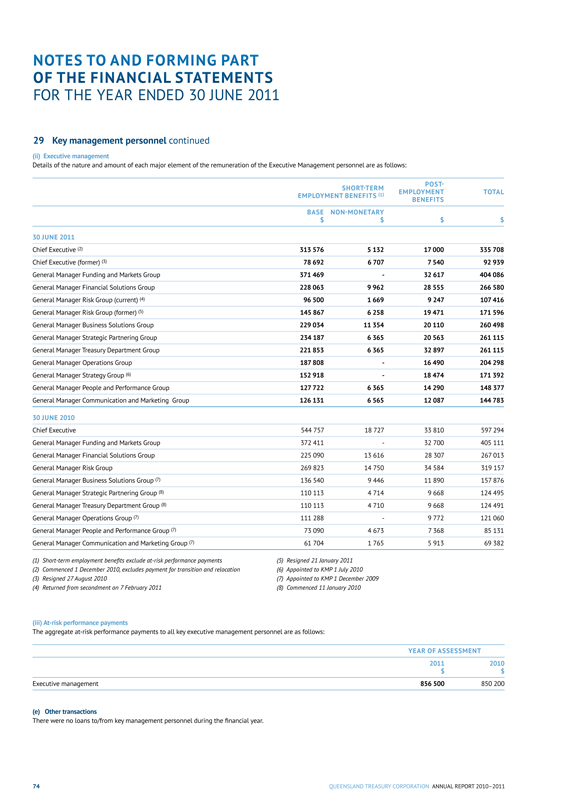
NOTES TO AND FORMING PART OF THE FINANCIAL STATEMENTS
FOR THE YEAR ENDED 30 JUNE 2011
29 Key management personnel continued
(ii) Executive management
Details of the nature and amount of each major element of the remuneration of the Executive Management personnel are as follows:
SHORT-TERM POST-
EMPLOYMENT BENEFITS TOTAL
EMPLOYMENT BENEFITS (1)
BASE NON-MONETARY
$ $ $ $
30 JUNE 2011
Chief Executive (2) 313 576 5 132 17 000 335 708
Chief Executive (former) (3) 78 692 6 707 7 540 92 939
General Manager Funding and Markets Group 371 469 - 32 617 404 086
General Manager Financial Solutions Group 228 063 9 962 28 555 266 580
General Manager Risk Group (current) (4) 96 500 1 669 9 247 107 416
General Manager Risk Group (former) (5) 145 867 6 258 19 471 171 596
General Manager Business Solutions Group 229 034 11 354 20 110 260 498
General Manager Strategic Partnering Group 234 187 6 365 20 563 261 115
General Manager Treasury Department Group 221 853 6 365 32 897 261 115
General Manager Operations Group 187 808 - 16 490 204 298
General Manager Strategy Group (6) 152 918 - 18 474 171 392
General Manager People and Performance Group 127 722 6 365 14 290 148 377
General Manager Communication and Marketing Group 126 131 6 565 12 087 144 783
30 JUNE 2010
Chief Executive 544 757 18 727 33 810 597 294
General Manager Funding and Markets Group 372 411 - 32 700 405 111
General Manager Financial Solutions Group 225 090 13 616 28 307 267 013
General Manager Risk Group 269 823 14 750 34 584 319 157
General Manager Business Solutions Group (7) 136 540 9 446 11 890 157 876
General Manager Strategic Partnering Group (8) 110 113 4 714 9 668 124 495
General Manager Treasury Department Group (8) 110 113 4 710 9 668 124 491
General Manager Operations Group (7) 111 288 - 9 772 121 060
General Manager People and Performance Group (7) 73 090 4 673 7 368 85 131
General Manager Communication and Marketing Group (7) 61 704 1 765 5 913 69 382
(1) Short-term employment benefits exclude at-risk performance payments (5) Resigned 21 January 2011
(2) Commenced 1 December 2010, excludes payment for transition and relocation (6) Appointed to KMP1 July 2010
(3) Resigned 27 August 2010 (7) Appointed to KMP 1 December 2009
(4) Returned from secondment on 7 February 2011 (8) Commenced 11 January 2010
(iii) At-risk performance payments
The aggregate at-risk performance payments to all key executive management personnel are as follows:
YEAR OF ASSESSMENT
2011
2010
$
$
Executive management
856 500
850 200
(e) Other transactions
There were no loans to/from key management personnel during the financial year.
74 QUEENSLAND TREASURY CORPORATION ANNUAL REPORT 2010-2011
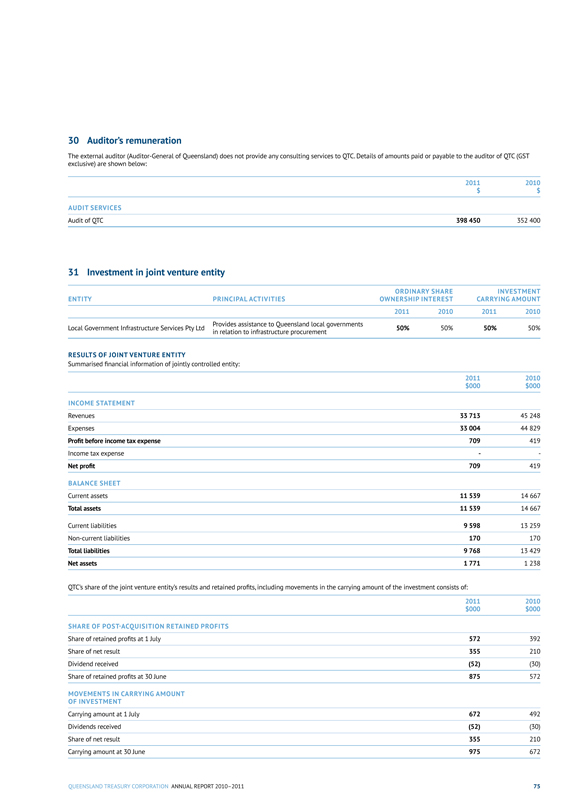
30 Auditor’s remuneration
The external auditor (Auditor-General of Queensland) does not provide any consulting services to QTC. Details of amounts paid or payable to the auditor of QTC (GST exclusive) are shown below:
2011 2010
$ $
AUDIT SERVICES
Audit of QTC 398 450 352 400
31 Investment in joint venture entity
ORDINARY SHARE INVESTMENT
ENTITY PRINCIPAL ACTIVITIES OWNERSHIP INTEREST CARRYING AMOUNT
2011 2010 2011 2010
Provides assistance to Queensland local governments Local Government Infrastructure Services Pty Ltd
in relation to infrastructure procurement 50% 50% 50% 50%
RESULTS OF JOINT VENTURE ENTITY
Summarised financial information of jointly controlled entity:
2011 2010
$000 $000
INCOME STATEMENT
Revenues 33 713 45 248
Expenses 33 004 44 829
Profit before income tax expense 709 419
Income tax expense - -
Net profit 709 419
BALANCE SHEET
Current assets 11 539 14 667
Total assets 11 539 14 667
Current liabilities 9 598 13 259
Non-current liabilities 170 170
Total liabilities 9 768 13 429
Net assets 1 771 1 238
QTC’s share of the joint venture entity’s results and retained profits, including movements in the carrying amount of the investment consists of:
2011 2010
$000 $000
SHARE OF POST-ACQUISITION RETAINED PROFITS
Share of retained profits at 1 July 572 392
Share of net result 355 210
Dividend received (52) (30)
Share of retained profits at 30 June 875 572
MOVEMENTS IN CARRYING AMOUNT
OF INVESTMENT
Carrying amount at 1 July 672 492
Dividends received (52) (30)
Share of net result 355 210
Carrying amount at 30 June 975 672
QUEENSLAND TREASURY CORPORATION ANNUAL REPORT 2010-2011 75
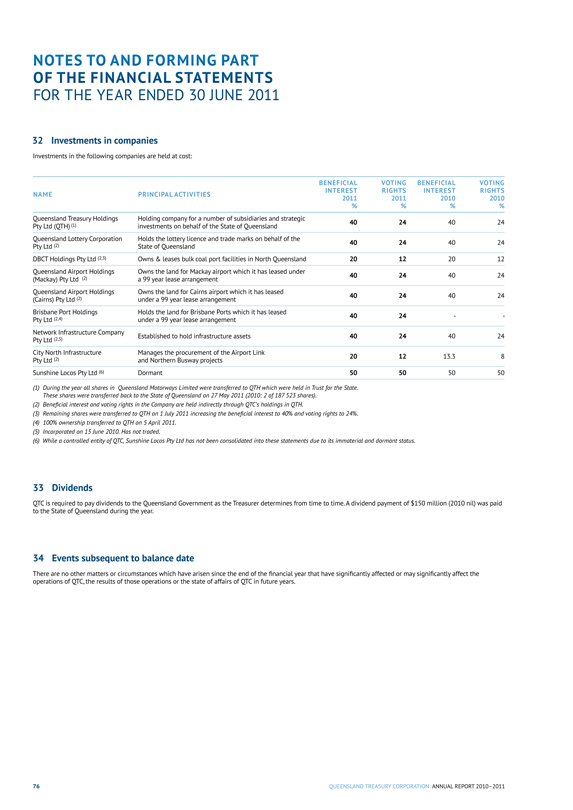
NOTES TO AND FORMING PART OF THE FINANCIAL STATEMENTS
FOR THE YEAR ENDED 30 JUNE 2011
32 Investments in companies
Investments in the following companies are held at cost:
(1) During the year all shares in Queensland Motorways Limited were transferred to QTH which were held in Trust for the State. These shares were transferred back to the State of Queensland on 27 May 2011 (2010: 2 of 187 523 shares).
(2) Beneficial interest and voting rights in the Company are held indirectly through QTC’s holdings in QTH.
(3) Remaining shares were transferred to QTH on 1 July 2011 increasing the beneficial interest to 40% and voting rights to 24%.
(4) 100% ownership transferred to QTH on 5 April 2011.
(5) Incorporated on 15 June 2010. Has not traded.
(6) While a controlled entity of QTC, Sunshine Locos Pty Ltd has not been consolidated into these statements due to its immaterial and dormant status.
NAME PRINCIPAL ACTIVITIES BENEFICIAL
INTEREST 2011
% VOTING
RIGHTS 2011
% BENEFICIAL
INTEREST 2010
% VOTING
RIGHTS 2010
%
Queensland Treasury Holdings Pty Ltd (QTH) (1) Holding company for a number of subsidiaries and strategic investments on behalf of the State of Queensland 40 24 40 24
Queensland Lottery Corporation Pty Ltd (2) Holds the lottery licence and trade marks on behalf of the State of Queensland 40 24 40 24
DBCT Holdings Pty Ltd (2,3) Owns & leases bulk coal port facilities in North Queensland 20 12 20 12
Queensland Airport Holdings
(Mackay) Pty Ltd (2) Owns the land for Mackay airport which it has leased under a 99 year lease arrangement 40 24 40 24
Queensland Airport Holdings (Cairns) Pty Ltd (2) Owns the land for Cairns airport which it has leased under a 99 year lease arrangement 40 24 40 24
Brisbane Port Holdings Pty Ltd (2,4) Holds the land for Brisbane Ports which it has leased under a 99 year lease arrangement 40 24 - -
Network Infrastructure Company Pty Ltd (2,5) Established to hold infrastructure assets 40 24 40 24
City North Infrastructure Pty Ltd (2) Manages the procurement of the Airport Link and Northern Busway projects 20 12 13.3 8
Sunshine Locos Pty Ltd (6) Dormant 50 50 50 50
33 Dividends
QTC is required to pay dividends to the Queensland Government as the Treasurer determines from time to time. A dividend payment of $150 million (2010 nil) was paid to the State of Queensland during the year.
34 Events subsequent to balance date
There are no other matters or circumstances which have arisen since the end of the financial year that have significantly affected or may significantly affect the operations of QTC, the results of those operations or the state of affairs of QTC in future years.
76 QUEENSLAND TREASURY CORPORATION ANNUAL REPORT 2010-2011
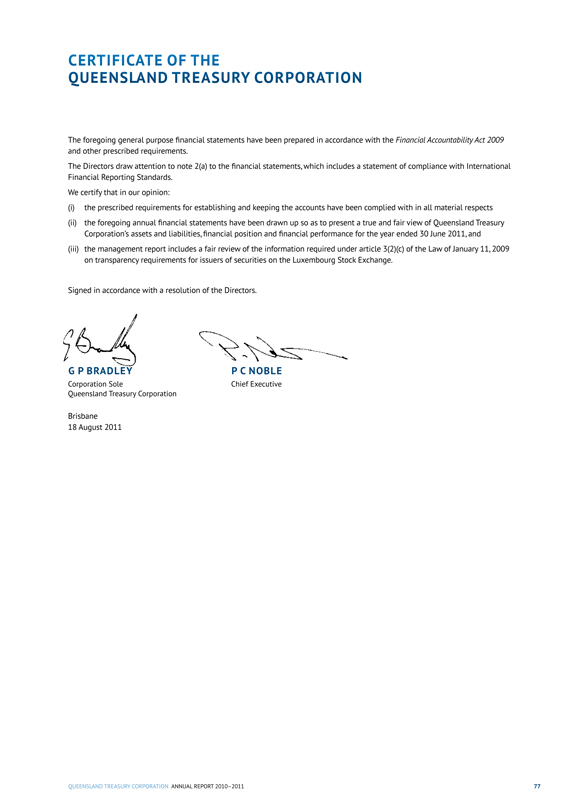
CERTIFICATE OF THE
QUEENSLAND TREASURY CORPORATION
The foregoing general purpose financial statements have been prepared in accordance with the Financial Accountability Act 2009 and other prescribed requirements.
The Directors draw attention to note 2(a) to the financial statements, which includes a statement of compliance with International Financial Reporting Standards.
We certify that in our opinion:
(i) the prescribed requirements for establishing and keeping the accounts have been complied with in all material respects
(ii) the foregoing annual financial statements have been drawn up so as to present a true and fair view of Queensland Treasury Corporation’s assets and liabilities, financial position and financial performance for the year ended 30 June 2011, and
(iii) the management report includes a fair review of the information required under article 3(2)(c) of the Law of January 11, 2009 on transparency requirements for issuers of securities on the Luxembourg Stock Exchange.
Signed in accordance with a resolution of the Directors.
G P BRADLEY P C NOBLE
Corporation Sole Chief Executive
Queensland Treasury Corporation
Brisbane
18 August 2011
QUEENSLAND TREASURY CORPORATION ANNUAL REPORT 2010-2011 77

INDEPENDENT AUDITOR’S REPORT
TO QUEENSLAND TREASURY CORPORATION
Report on the Financial Report
I have audited the accompanying financial report of Queensland Treasury Corporation, which comprises the balance sheet as at 30 June 2011, the statement of comprehensive income, statement of changes in equity and statement of cash flows for the year then ended, notes comprising a summary of significant accounting policies and other explanatory information, and certificates given by the Under Treasurer – Queensland Treasury as the Corporation Sole and Chief Executive.
The Corporation Sole’s Responsibility for the Financial Report
The Corporation Sole is responsible for the preparation of the financial report that gives a true and fair view in accordance with prescribed accounting requirements identified in the Financial Accountability Act 2009 and the Financial and Performance Management Standard 2009, including compliance with Australian Accounting Standards. The Corporation Sole’s responsibility also includes such internal control as the Corporation Sole determines is necessary to enable the preparation of the financial report that is free from material misstatement, whether due to fraud or error. In Note 2(a), the Corporation Sole also states, in accordance with Accounting Standard AASB 101 Presentation of Financial Statements, that the financial statements comply with International Financial Reporting Standards.
Auditor’s Responsibility
My responsibility is to express an opinion on the financial report based on the audit. The audit was conducted in accordance with the Auditor-General of Queensland Auditing Standards, which incorporate the Australian Auditing Standards. Those standards require compliance with relevant ethical requirements relating to audit engagements and that the audit is planned and performed to obtain reasonable assurance about whether the financial report is free from material misstatement.
An audit involves performing procedures to obtain audit evidence about the amounts and disclosures in the financial report. The procedures selected depend on the auditor’s judgement, including the assessment of the risks of material misstatement of the financial report, whether due to fraud or error. In making those risk assessments, the auditor considers internal control relevant to the entity’s preparation of the financial report that gives a true and fair view in order to design audit procedures that are appropriate in the circumstances, but not for the purpose of expressing an opinion on the effectiveness of the entity’s internal control, other than in expressing an opinion on compliance with prescribed requirements. An audit also includes evaluating the appropriateness of accounting policies used and the reasonableness of accounting estimates made by the Corporation, as well as evaluating the overall presentation of the financial report including any mandatory financial reporting requirements approved by the Treasurer for application in Queensland.
I believe that the audit evidence obtained is sufficient and appropriate to provide a basis for my audit opinion. Independence
The Auditor-General Act 2009 promotes the independence of the Auditor General and all authorised auditors. The Auditor-General is the auditor of all Queensland public sector entities and can only be removed by Parliament.
The Auditor-General may conduct an audit in any way considered appropriate and is not subject to direction by any person about the way in which audit powers are to be exercised. The Auditor-General has for the purposes of conducting an audit, access to all documents and property and can report to Parliament matters which in the Auditor-General’s opinion are significant.
Opinion
In accordance with s.40 of the Auditor-General Act 2009 –
(a) I have received all the information and explanations which I have required; and
(b) in my opinion –
(i) the prescribed requirements in relation to the establishment and keeping of accounts have been complied with in all material respects; and
(ii) the financial report presents a true and fair view, in accordance with the prescribed accounting standards, of the transactions of the Queensland Treasury Corporation for the financial year 1 July 2010 to 30 June 2011 and of the financial position as at the end of that year; and
(iii) the financial report also complies with International Financial Reporting Standards as disclosed in Note 2(a).
78 QUEENSLAND TREASURY CORPORATION ANNUAL REPORT 2010-2011
Other Matters - Electronic Presentation of the Audited Financial Report
This auditor’s report relates to the financial report of Queensland Treasury Corporation for the year ended 30 June 2011. Where the financial report is included on Queensland Treasury Corporation’s website the Corporation is responsible for the integrity of Queensland Treasury Corporation’s website and I have not been engaged to report on the integrity of Queensland Treasury Corporation’s website. The auditor’s report refers only to the subject matter described above. It does not provide an opinion on any other information which may have been hyperlinked to/from these statements or otherwise included with the financial report. If users of the financial report are concerned with the inherent risks arising from publication on a website, they are advised to refer to the hard copy of the audited financial report to confirm the information contained in this website version of the financial report.
These matters also relate to the presentation of the audited financial report in other electronic media including CD Rom.
G G POOLE FCPA
Auditor General of Queensland
AUDITOR GENERAL
19 AUG 2011
OF QUEENSLAND
Queensland Audit Office
Brisbane
QUEENSLAND TREASURY CORPORATION ANNUAL REPORT 2010-2011 79
MANAGEMENT REPORT
FOR THE YEAR ENDED 30 JUNE 2011
Review of Operations
QTC made an operating profit after tax for the year ended 30 June 2011 of A$1,240.1 million consisting of the following operating segment results:
Capital Markets Operations
During the period from 1 July 2010 to 30 June 2011, QTC continued in its ordinary course of business as the State of Queensland’s central financing authority and corporate treasury services provider. The operating profit after tax for the year ended 30 June 2011 for the Capital Markets Operations segment was A$45.9 million.
Long Term Assets
QTC holds a portfolio of assets which were transferred to QTC by the State Government under an administrative arrangement. These assets are the investments of QTC’s Long Term Assets segment and were accumulated to fund superannuation and other long-term obligations of the State such as insurance and long service leave. In return, QTC issued to the State fixed rate notes which has resulted in the State receiving a fixed rate of return on the notes, while QTC bears the impact of fluctuations in the value and returns on the asset portfolio.
QTC made an operating profit after tax of A$1,194.2 million for the Long Term Assets segment. The accumulated net losses incurred by the Long Term Assets segment to date have no impact on QTC’s capacity to meet its obligations as there is no cash flow effect for QTC. In addition, under the Queensland Treasury Corporation Act 1988, any losses of the Corporation shall be the responsibility of the Consolidated Fund of the Queensland Government.
Principal risks and uncertainties
The 2010-11 financial year was characterised by a range of events that contributed to challenging market conditions. These included devastating natural disasters, heightened political tensions in the Middle East and North Africa, a re-intensification of sovereign debt worries in Europe, the possibility of downgrades to the US and Japan being canvassed and significant variability in economic conditions, both globally and domestically. Many of these issues will contribute to the likely continuation of elevated levels of uncertainty over the coming 6 months.
Domestic economic conditions, while mixed in recent times, are expected to be favourable over a medium-term time horizon given Queensland’s exposure to long-lived structural developments in Asian economies.
80 QUEENSLAND TREASURY CORPORATION ANNUAL REPORT 2010-2011
G P BRADLEY P C NOBLE
Corporation Sole Chief Executive
Queensland Treasury Corporation
Brisbane
18 August 2011
QUEENSLAND
TREASURY
CORPORATION
APPENDICES
CONTENTS
Appendix A 82
Appendix B 86
Appendix C 88
Appendix D 89
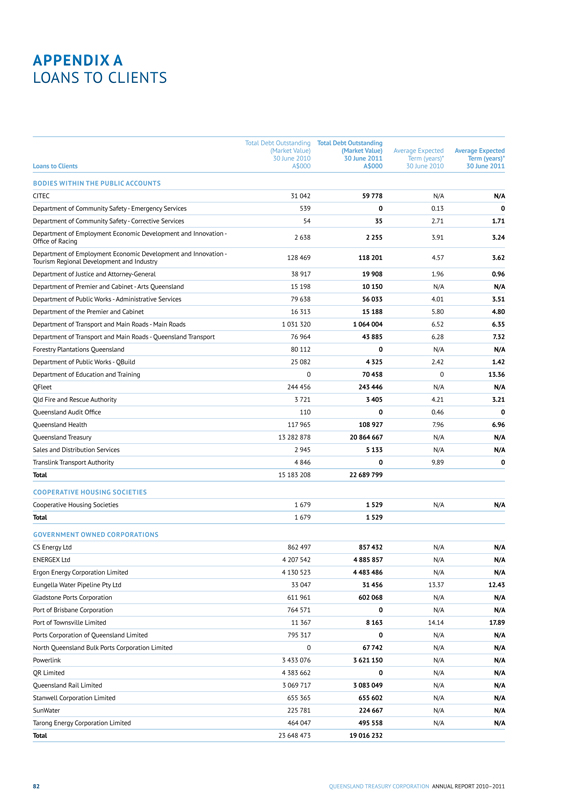
APPENDIX A
LOANS TO CLIENTS
Total Debt Outstanding Total Debt Outstanding
(Market Value)(Market Value) Average Expected Average Expected
30 June 2010 30 June 2011 Term (years)* Term (years)*
Loans to Clients A$000 A$000 30 June 2010 30 June 2011
BODIES WITHIN THE PUBLIC ACCOUNTS
CITEC 31 042 59 778 N/A N/A
Department of Community Safety - Emergency Services 539 0 0.13 0
Department of Community Safety - Corrective Services 54 35 2.71 1.71
Department of Employment Economic Development and Innovation - Office of Racing 2 638 2 255 3.91 3.24
Department of Employment Economic Development and Innovation - Tourism Regional Development and Industry 128 469 118 201 4.57 3.62
Department of Justice and Attorney-General 38 917 19 908 1.96 0.96
Department of Premier and Cabinet - Arts Queensland 15 198 10 150 N/A N/A
Department of Public Works - Administrative Services 79 638 56 033 4.01 3.51
Department of the Premier and Cabinet 16 313 15 188 5.80 4.80
Department of Transport and Main Roads - Main Roads 1 031 320 1 064 004 6.52 6.35
Department of Transport and Main Roads - Queensland Transport 76 964 43 885 6.28 7.32
Forestry Plantations Queensland 80 112 0 N/A N/A
Department of Public Works - QBuild 25 082 4 325 2.42 1.42
Department of Education and Training 0 70 458 0 13.36
QFleet 244 456 243 446 N/A N/A
Qld Fire and Rescue Authority 3 721 3 405 4.21 3.21
Queensland Audit Office 110 0 0.46 0
Queensland Health 117 965 108 927 7.96 6.96
Queensland Treasury 13 282 878 20 864 667 N/A N/A
Sales and Distribution Services 2 945 5 133 N/A N/A
Translink Transport Authority 4 846 0 9.89 0
Total 15 183 208 22 689 799
COOPERATIVE HOUSING SOCIETIES
Cooperative Housing Societies 1 679 1 529 N/A N/A
Total 1 679 1 529
GOVERNMENT OWNED CORPORATIONS
CS Energy Ltd 862 497 857 432 N/A N/A
ENERGEX Ltd 4 207 542 4 885 857 N/A N/A
Ergon Energy Corporation Limited 4 130 523 4 483 486 N/A N/A
Eungella Water Pipeline Pty Ltd 33 047 31 456 13.37 12.43
Gladstone Ports Corporation 611 961 602 068 N/A N/A
Port of Brisbane Corporation 764 571 0 N/A N/A
Port of Townsville Limited 11 367 8 163 14.14 17.89
Ports Corporation of Queensland Limited 795 317 0 N/A N/A
North Queensland Bulk Ports Corporation Limited 0 67 742 N/A N/A
Powerlink 3 433 076 3 621 150 N/A N/A
QR Limited 4 383 662 0 N/A N/A
Queensland Rail Limited 3 069 717 3 083 049 N/A N/A
Stanwell Corporation Limited 655 365 655 602 N/A N/A
SunWater 225 781 224 667 N/A N/A
Tarong Energy Corporation Limited 464 047 495 558 N/A N/A
Total 23 648 473 19 016 232
82 QUEENSLAND TREASURY CORPORATION ANNUAL REPORT 2010-2011
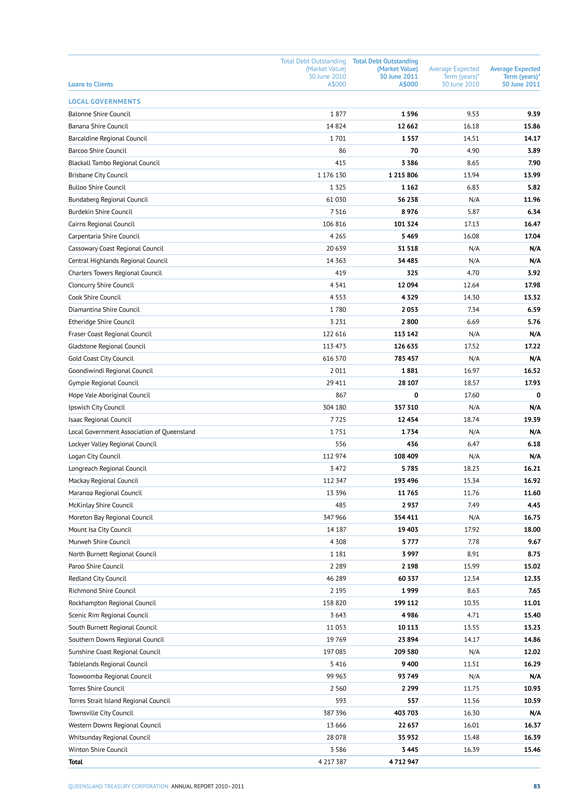
Loans to Clients Total Debt Outstanding (Market Value) 30 June 2010 A$000 Total Debt Outstanding (Market Value) 30 June 2011
A$000 Average Expected Term (years)*
30 June 2010 Average Expected Term (years)* 30 June 2011
LOCAL GOVERNMENTS
Balonne Shire Council 1 877 1 596 9.53 9.39
Banana Shire Council 14 824 12 662 16.18 15.86
Barcaldine Regional Council 1 701 1 557 14.51 14.17
Barcoo Shire Council 86 70 4.90 3.89
Blackall Tambo Regional Council 415 3 386 8.65 7.90
Brisbane City Council 1 176 130 1 215 806 13.94 13.99
Bulloo Shire Council 1 325 1 162 6.83 5.82
Bundaberg Regional Council 61 030 56 238 N/A 11.96
Burdekin Shire Council 7 516 8 976 5.87 6.34
Cairns Regional Council 106 816 101 324 17.13 16.47
Carpentaria Shire Council 4 265 5 469 16.08 17.04
Cassowary Coast Regional Council 20 639 31 518 N/A N/A
Central Highlands Regional Council 14 363 34 485 N/A N/A
Charters Towers Regional Council 419 325 4.70 3.92
Cloncurry Shire Council 4 541 12 094 12.64 17.98
Cook Shire Council 4 553 4 329 14.30 13.32
Diamantina Shire Council 1 780 2 053 7.34 6.59
Etheridge Shire Council 3 231 2 800 6.69 5.76
Fraser Coast Regional Council 122 616 113 142 N/A N/A
Gladstone Regional Council 113 473 126 635 17.52 17.22
Gold Coast City Council 616 570 785 457 N/A N/A
Goondiwindi Regional Council 2 011 1 881 16.97 16.52
Gympie Regional Council 29 411 28 107 18.57 17.93
Hope Vale Aboriginal Council 867 0 17.60 0
Ipswich City Council 304 180 357 310 N/A N/A
Isaac Regional Council 7 725 12 454 18.74 19.39
Local Government Association of Queensland 1 751 1 734 N/A N/A
Lockyer Valley Regional Council 556 436 6.47 6.18
Logan City Council 112 974 108 409 N/A N/A
Longreach Regional Council 3 472 5 785 18.23 16.21
Mackay Regional Council 112 347 193 496 15.34 16.92
Maranoa Regional Council 13 396 11 765 11.76 11.60
Mckinlay Shire Council 485 2 937 7.49 4.45
Moreton Bay Regional Council 347 966 354 411 N/A 16.75
Mount Isa City Council 14 187 19 403 17.92 18.00
Murweh Shire Council 4 308 5 777 7.78 9.67
North Burnett Regional Council 1 181 3 997 8.91 8.75
Paroo Shire Council 2 289 2 198 15.99 15.02
Redland City Council 46 289 60 337 12.54 12.35
Richmond Shire Council 2 195 1 999 8.63 7.65
Rockhampton Regional Council 158 820 199 112 10.35 11.01
Scenic Rim Regional Council 3 643 4 986 4.71 15.40
South Burnett Regional Council 11 053 10 113 13.55 13.23
Southern Downs Regional Council 19 769 23 894 14.17 14.86
Sunshine Coast Regional Council 197 085 209 580 N/A 12.02
Tablelands Regional Council 5 416 9 400 11.51 16.29
Toowoomba Regional Council 99 963 93 749 N/A N/A
Torres Shire Council 2 560 2 299 11.75 10.93
Torres Strait Island Regional Council 593 557 11.56 10.59
Townsville City Council 387 396 403 703 16.30 N/A
Western Downs Regional Council 13 666 22 657 16.01 16.37
Whitsunday Regional Council 28 078 35 932 15.48 16.39
Winton Shire Council 3 586 3 445 16.39 15.46
Total 4 217 387 4 712 947
QUEENSLAND TREASURY CORPORATION ANNUAL REPORT 2010-2011 83
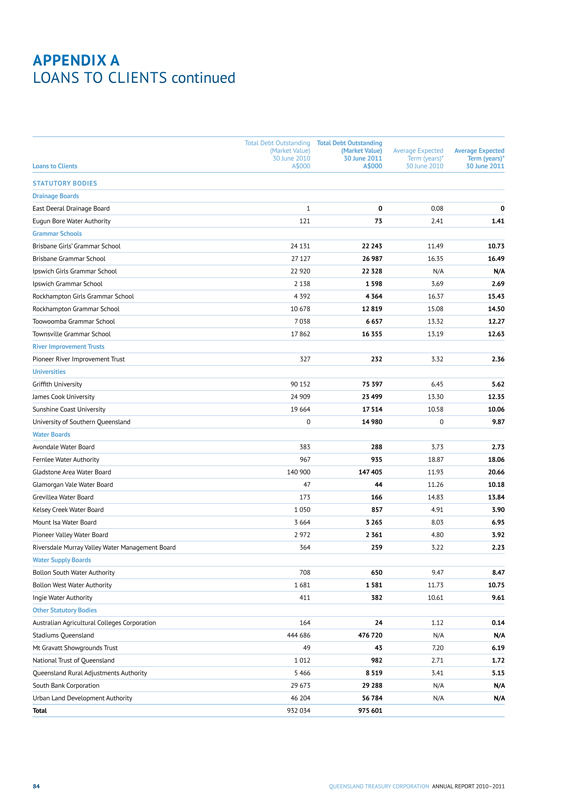
APPENDIX A
LOANS TO CLIENTS continued
Loans to Clients Total Debt Outstanding (Market Value)
30 June 2010
A$000 Total Debt Outstanding
(Market Value)
30 June 2011
A$000 Average Expected Term (years)*
30 June 2010 Average Expected Term (years)* 30 June 2011
STATUTORY BODIES
Drainage Boards
East Deeral Drainage Board 1 0 0.08 0
Eugun Bore Water Authority 121 73 2.41 1.41
Grammar Schools
Brisbane Girls’ Grammar School 24 131 22 243 11.49 10.73
Brisbane Grammar School 27 127 26 987 16.35 16.49
Ipswich Girls Grammar School 22 920 22 328 N/A N/A
Ipswich Grammar School 2 138 1 598 3.69 2.69
Rockhampton Girls Grammar School 4 392 4 364 16.37 15.43
Rockhampton Grammar School 10 678 12 819 15.08 14.50
Toowoomba Grammar School 7 038 6 657 13.32 12.27
Townsville Grammar School 17 862 16 355 13.19 12.63
River Improvement Trusts
Pioneer River Improvement Trust 327 232 3.32 2.36
Universities
Griffith University 90 152 75 397 6.45 5.62
James Cook University 24 909 23 499 13.30 12.35
Sunshine Coast University 19 664 17 514 10.58 10.06
University of Southern Queensland 0 14 980 0 9.87
Water Boards
Avondale Water Board 383 288 3.73 2.73
Fernlee Water Authority 967 935 18.87 18.06
Gladstone Area Water Board 140 900 147 405 11.93 20.66
Glamorgan Vale Water Board 47 44 11.26 10.18
Grevillea Water Board 173 166 14.83 13.84
Kelsey Creek Water Board 1 050 857 4.91 3.90
Mount Isa Water Board 3 664 3 265 8.03 6.95
Pioneer Valley Water Board 2 972 2 361 4.80 3.92
Riversdale Murray Valley Water Management Board 364 259 3.22 2.23
Water Supply Boards
Bollon South Water Authority 708 650 9.47 8.47
Bollon West Water Authority 1 681 1 581 11.73 10.75
Ingie Water Authority 411 382 10.61 9.61
Other Statutory Bodies
Australian Agricultural Colleges Corporation 164 24 1.12 0.14
Stadiums Queensland 444 686 476 720 N/A N/A
Mt Gravatt Showgrounds Trust 49 43 7.20 6.19
National Trust of Queensland 1 012 982 2.71 1.72
Queensland Rural Adjustments Authority 5 466 8 519 3.41 5.15
South Bank Corporation 29 673 29 288 N/A N/A
Urban Land Development Authority 46 204 56 784 N/A N/A
Total 932 034 975 601
84 QUEENSLAND TREASURY CORPORATION ANNUAL REPORT 2010-2011
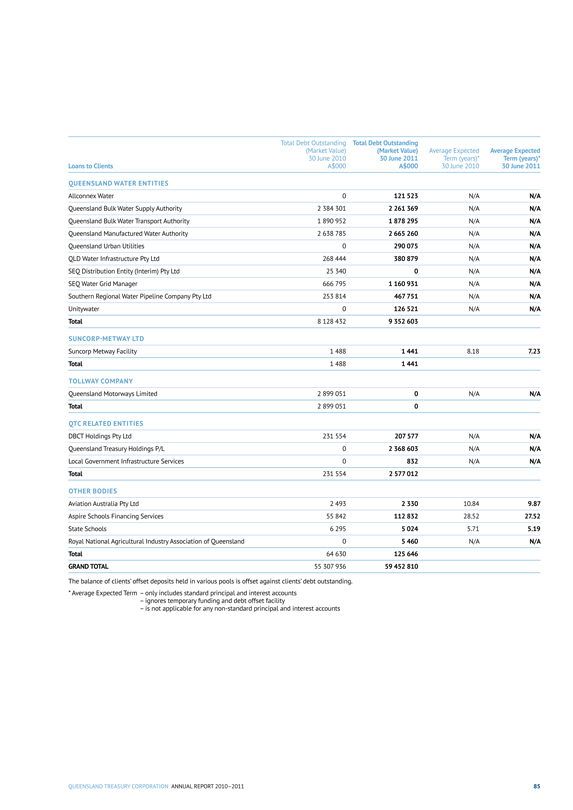
Loans to Clients Total Debt Outstanding (Market Value) 30 June 2010 A$000 Total Debt Outstanding
(Market Value)
30 June 2011
A$000 Average Expected Term (years)*
30 June 2010 Average Expected Term (years)* 30 June 2011
QUEENSLAND WATER ENTITIES
Allconnex Water 0 121 523 N/A N/A
Queensland Bulk Water Supply Authority 2 384 301 2 261 369 N/A N/A
Queensland Bulk Water Transport Authority 1 890 952 1 878 295 N/A N/A
Queensland Manufactured Water Authority 2 638 785 2 665 260 N/A N/A
Queensland Urban Utilities 0 290 075 N/A N/A
QLD Water Infrastructure Pty Ltd 268 444 380 879 N/A N/A
SEQ Distribution Entity (Interim) Pty Ltd 25 340 0 N/A N/A
SEQ Water Grid Manager 666 795 1 160 931 N/A N/A
Southern Regional Water Pipeline Company Pty Ltd 253 814 467 751 N/A N/A
Unitywater 0 126 521 N/A N/A
Total 8 128 432 9 352 603
SUNCORP-METWAY LTD
Suncorp Metway Facility 1 488 1 441 8.18 7.23
Total 1 488 1 441
TOLLWAY COMPANY
Queensland Motorways Limited 2 899 051 0 N/A N/A
Total 2 899 051 0
QTC RELATED ENTITIES
DBCT Holdings Pty Ltd 231 554 207 577 N/A N/A
Queensland Treasury Holdings P/L 0 2 368 603 N/A N/A
Local Government Infrastructure Services 0 832 N/A N/A
Total 231 554 2 577 012
OTHER BODIES
Aviation Australia Pty Ltd 2 493 2 330 10.84 9.87
Aspire Schools Financing Services 55 842 112 832 28.52 27.52
State Schools 6 295 5 024 5.71 5.19
Royal National Agricultural Industry Association of Queensland 0 5 460 N/A N/A
Total 64 630 125 646
GRAND TOTAL 55 307 936 59 452 810
The balance of clients’ offset deposits held in various pools is offset against clients’ debt outstanding.
* Average Expected Term – only includes standard principal and interest accounts
– ignores temporary funding and debt offset facility
– is not applicable for any non-standard principal and interest accounts
QUEENSLAND TREASURY CORPORATION ANNUAL REPORT 2010-2011 85
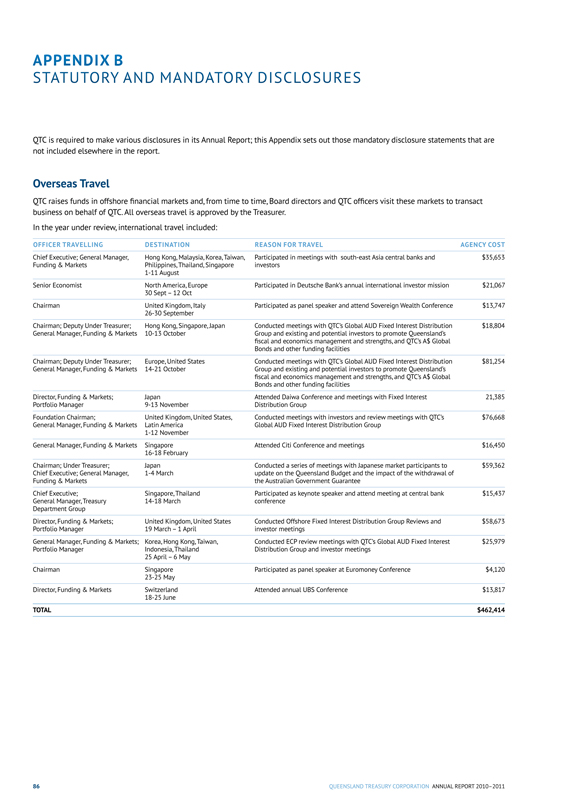
APPENDIX B
STATUTORY AND MANDATORY DISCLOSURES
QTC is required to make various disclosures in its Annual Report; this Appendix sets out those mandatory disclosure statements that are not included elsewhere in the report.
Overseas Travel
QTC raises funds in offshore financial markets and, from time to time, Board directors and QTC officers visit these markets to transact business on behalf of QTC. All overseas travel is approved by the Treasurer.
In the year under review, international travel included:
OFFICER TRAVELLING DESTINATION REASON FOR TRAVEL AGENCY COST
Chief Executive; General Manager, Funding & Markets Hong Kong, Malaysia, Korea, Taiwan, Philippines, Thailand, Singapore 1-11 August Participated in meetings with south-east Asia central banks and investors $35,653
Senior Economist North America, Europe
30 Sept – 12 Oct Participated in Deutsche Bank’s annual international investor mission $21,067
Chairman United Kingdom, Italy 26-30 September Participated as panel speaker and attend Sovereign Wealth Conference $13,747
Chairman; Deputy Under Treasurer; General Manager, Funding & Markets Hong Kong, Singapore, Japan
10-13 October Conducted meetings with QTC’s Global AUD Fixed Interest Distribution Group and existing and potential investors to promote Queensland’s fiscal and economics management and strengths, and QTC’s A$ Global Bonds and other funding facilities $18,804
Chairman; Deputy Under Treasurer; General Manager, Funding & Markets Europe, United States
14-21 October Conducted meetings with QTC’s Global AUD Fixed Interest Distribution Group and existing and potential investors to promote Queensland’s fiscal and economics management and strengths, and QTC’s A$ Global Bonds and other funding facilities $81,254
Director, Funding & Markets; Portfolio Manager Japan
9-13 November Attended Daiwa Conference and meetings with Fixed Interest Distribution Group 21,385
Foundation Chairman;
General Manager, Funding & Markets United Kingdom, United States, Latin America 1-12 November Conducted meetings with investors and review meetings with QTC’s Global AUD Fixed Interest Distribution Group $76,668
General Manager, Funding & Markets Singapore 16-18 February Attended Citi Conference and meetings $16,450
Chairman; Under Treasurer; Chief Executive; General Manager, Funding & Markets Japan 1-4 March Conducted a series of meetings with Japanese market participants to update on the Queensland Budget and the impact of the withdrawal of the Australian Government Guarantee $59,362
Chief Executive;
General Manager, Treasury
Department Group Singapore, Thailand
14-18 March Participated as keynote speaker and attend meeting at central bank conference $15,437
Director, Funding & Markets; Portfolio Manager United Kingdom, United States
19 March – 1 April Conducted Offshore Fixed Interest Distribution Group Reviews and investor meetings $58,673
General Manager, Funding & Markets; Portfolio Manager Korea, Hong Kong, Taiwan, Indonesia, Thailand 25 April – 6 May Conducted ECP review meetings with QTC’s Global AUD Fixed Interest Distribution Group and investor meetings $25,979
Chairman Singapore
23-25 May Participated as panel speaker at Euromoney Conference $4,120
Director, Funding & Markets Switzerland
18-25 June Attended annual UBS Conference $13,817
TOTAL $462,414
86 QUEENSLAND TREASURY CORPORATION ANNUAL REPORT 2010-2011
Public Records Act
During the year, QTC continued its compliance with the provisions of the Public Records Act 2002, and its implementation of the Information Standard 40: Recordkeeping and Information Standard 31: Retention and Disposal of Public Records.
QTC’s Information Management Manual was also reviewed and updated, providing a framework for efficiently and effectively managing corporate information.
A draft of a QTC-specific Local Retention and Disposal Schedule is currently with State Archives awaiting approval.
Remuneration: Board and Committee
For the year ending 30 June 2011, total remuneration payments made to the members of the Queensland Treasury Corporation Capital Markets Advisory Board was $376,754 and the total on-costs (including travel, accommodation, and hiring of motor vehicles for the members) was $30,749.
No payments in relation to remuneration or on-costs (including travel, accommodation, and hiring of motor vehicles for the members) were made to members of the Long Term Asset Advisory Board in the year ending 30 June 2011.
Public Sector Ethics Act
QTC provides the following information pursuant to an obligation under section 23 of the Public Sector Ethics Act 1994 (Qld) to report on action taken to comply with certain sections of the Act.
QTC employees are required to comply with QTC’s Code of Conduct for employees, which sets out the ethics principles and obligations under the Public Sector Ethics Act 1994, as well as the Code of Conduct, established by the Australian Financial Markets Association of which QTC is a member. Both codes are available to employees via QTC’s intranet. Copies of these codes can be inspected by contacting QTC’s People and Performance Group (see Corporate Directory for contact details).
The Public Sector Ethics Act 1994 was amended in 2010 to include changes to the ethics principles and values under the Code of Conduct, effective from 1 January 2011.
An amended QTC Code and standard of practice reflecting alignment to the new ethics principles and values has been drafted and will shortly be provided to the Treasurer for approval, as required by the Public Sector Ethics Act. Once approved by the Treasurer, as the responsible authority for QTC, appropriate education and training on the revised Code of Conduct will be provided to all QTC staff.
QTC’s corporate governance policies and practices ensure that QTC:
acts ethically, within appropriate law, policy and convention, and
addresses the systems and processes necessary for the proper direction and management of its business and affairs.
QTC is committed to:
observing high standards of integrity and fair-dealing in the conduct of its business, and
acting with due care, diligence and skill.
QTC’s Compliance Policy requires that QTC and all employees comply with the letter and the spirit of all relevant laws and regulations, industry standards, and relevant government policies, as well as QTC’s own policies and procedures.
Whistleblowers Protection Act
During the period of 1 July 2010 to 30 June 2011, QTC has not received, nor had to substantially verify, any disclosures.
Carers (Recognition) Act 2008
QTC complies with the obligations of the Carers Recognition Act. The Queensland Carers Charter, which was established under the Carers Recognition Act, provides clear direction on how carers are to be treated and involved in decision making on services that affect their role.
QTC encourages awareness and understanding of the Carers Charter by providing access to both the Act and Charter to all staff via QTC’s intranet.
The QTC Employment Manual reflects the aims of the Act by providing for carers with leave arrangements in place, and allowing for the needs of employees in their capacity as carers.
QUEENSLAND TREASURY CORPORATION ANNUAL REPORT 2010-2011 87
APPENDIX C
GLOSSARY
Australian Government Guarantee (AGG): Also known as the Commonwealth Government Guarantee. The Global Financial Crisis had an adverse effect on the state government bond market and threatened the capacity of state governments to deliver critical infrastructure projects. In response, on 25 March 2009, the Australian Government announced that it would provide a time limited, voluntary guarantee over Australian state and territory government borrowing, available for both existing and new issuances of securities over a range of maturities. On 16 June 2009, the Queensland Government announced it would take up the Australian Government’s offer of the guarantee on all existing AUD denominated benchmark bond lines (global and domestic) issued by QTC with a maturity date of between 12 months and 180 months (1-15 years). On 18 September 2009, the Reserve Bank of Australia (RBA) approved QTC’s application for the Australian Government Guarantee to be applied to selected AUD Domestic Benchmark bonds. On 11 December 2009, the RBA approved QTC’s application for the Australian Government Guarantee to be applied to selected AUD Global Benchmark bonds. The AGG was withdrawn for new borrowings after 31 December 2010.
Basis point: One hundredth of one per cent (0.01%).
Bond: A financial instrument whereby the borrower agrees to pay the investor a rate of interest for a fixed period of time. A typical bond will involve regular interest payments and a return of principal at maturity.
Commonwealth Government Guarantee (CGG): See Australian Government Guarantee above.
CP (commercial paper): A short term money market instrument issued at a discount with the full face value repaid at maturity. CP can be issued in various currencies with a term to maturity of less than one year.
Credit rating: Measures a borrower’s creditworthiness and provides an international framework for comparing the credit quality of issuers and rated debt securities. Rating agencies allocate three kinds of ratings: issuer credit ratings, long-term debt and short-term debt. Issuer credit ratings are among the most widely watched. They measure the creditworthiness of the borrower including its capacity and willingness to meet financial obligations. QTC has a strong rating from two rating agencies – Standard & Poor’s, and Moody’s.
Distribution group: A group of financial intermediaries who market and make prices in QTC’s debt instruments.
Global financial crisis: The global financial crisis refers to a series of events following the rapid increases in default rates on US sub-prime mortgages over 2007-08. Funding and liquidity problems in the world’s major financial centres morphed into concerns about the solvency of many financial institutions over the first half of 2008-09, peaking in September 2008. The highly coordinated and substantial response to the crisis from fiscal and monetary policy makers around the world led to the stabilisation of markets and created the foundation for the global economic recovery that began in March 2009.
GOC: Government-owned Corporation.
Issue price: The price at which a new security is issued in the primary market.
Liquid: Markets or instruments are described as being liquid, and having depth, if there are enough buyers and sellers to absorb sudden shifts in supply and demand without price distortions.
Market value: The price at which an instrument can be purchased or sold in the current market.
MTN (Medium-Term Note): A financial debt instrument that can be structured to meet an investor’s requirements in regards to interest rate basis, currency and maturity. MTNs usually have maturities between 9 months and 30 years.
Public private partnership: A public private partnership (PPP) is a risk-sharing relationship between the public and private sectors to deliver public infrastructure and related non-core services.
QTC: Queensland Treasury Corporation.
RBA: Reserve Bank of Australia.
T-Note (Treasury Note): A short term money market instrument issued at a discount with the full face value repaid at maturity. T-Notes are issued in Australian dollars with a term to maturity of less than 1 year.
88 QUEENSLAND TREASURY CORPORATION ANNUAL REPORT 2010-2011
APPENDIX D
CONTACTS
QUEENSLAND TREASURY CORPORATION
Level 14, 61 Mary Street Brisbane Queensland Australia
GPO Box 1096 Brisbane Queensland Australia 4001
Telephone: +61 7 3842 4600 Facsimile: +61 7 3221 4122 Internet: www.qtc.com.au
Queensland Treasury Corporation’s annual reports [ISSN 1837-1256 (print); ISSN 1837-1264 (online)] are available on QTC’s website: www.qtc.com.au. If you would like a report posted to you, please call QTC’s Communication and Marketing Group on +61 7 3842 4945.
If you would like to comment on our Annual Report, please complete the feedback form that can be downloaded from the Annual Reports page on our website.
Telephone Facsimile
EXECUTIVE +61 7 3842 4611 +61 7 3210 0262
GROUPS
Business Solutions Group +61 7 3842 4743 +61 7 3210 1198
Financial Solutions Group +61 7 3842 4601 +61 7 3211 3629
Strategic Partnering Group +61 7 3842 4901 +61 7 3211 4122
Treasury Department Group +61 7 3842 4798 +61 7 3211 3629
Customer and Market Solutions Delivery +61 7 3842 4644 +61 7 3221 2486
Infrastructure Projects Assessment Team +61 7 3227 6867 +61 7 3225 1271
Stock registry (Link Market Services Ltd) 1800 777 166 +61 2 9287 0315
Funding and Markets Group +61 7 3842 4789 +61 7 3221 2410
Risk Group +61 7 3842 4704 +61 7 3236 9031
Operations Group +61 7 3842 4641 +61 7 3221 4122
Strategy Group +61 7 3842 4725 +61 7 3221 2410
People and Performance Group +61 7 3842 4761 +61 7 3210 2358
Communication and Marketing Group +61 7 3842 4714 +61 7 3211 3629
Interpreter
QTC is committed to providing accessible services to Queensland residents from culturally and linguistically diverse backgrounds. If you have difficulty understanding QTC’s Annual Report, please contact QTC’s Communication and Marketing Group on 07 3842 4945 and we will arrange for an interpreter to assist you.
QUEENSLAND TREASURY CORPORATION ANNUAL REPORT 2010-2011 89
APPENDIX D
CONTACTS continued
DEALER PANELS As at 30 June 2011
Note: actual dealer entities may vary depending on the facility and location of the dealer.
DOMESTIC AND GLOBAL A$ BOND FACILITY DISTRIBUTION GROUP
Australia and New Zealand Banking Group Ltd
Telephone
Domestic (Australia) +61 2 9227 1110
Global (London) +44 203 229 2070
Bank of America Merrill Lynch
Domestic (Australia) +61 2 9226 5570
Global (London) +44 207 996 8465
Barclays
Domestic (Australia) +61 2 9216 8755
Global (London) +44 207 595 8231
BNP Paribas
Domestic (Australia) +61 2 8225 6450
Global (London) +44 207 595 8231
Citigroup Global Markets Australia Ltd
Domestic (Australia) +61 2 8225 6450
Global (London) +44 207 986 9521
Credit Suisse
Domestic (Singapore) +61 2 9117 0020
Global (London) +44 207 329 6444
Commonwealth Bank of Australia
Domestic (Australia) +61 2 6212 2412
Global (London) +44 207 888 4172
Deutsche Capital Markets Australia1
Domestic (Australia) +61 2 8258 1444
Global (London) 1800 125 606
HSBC
Domestic (Australia) +61 2 9255 2054
Global (London) +44 207 991 5466
J.P. Morgan
Domestic (Australia) +61 2 9220 1358
Global (London) +44 207 777 9667
National Australia Bank Ltd
Domestic (Australia) +61 2 9295 1166
Global (London) +44 207 796 4761
Nomura Securities
Domestic (Australia) +61 2 8062 8000
Global (London) +44 207 103 6631
Royal Bank of Canada
Domestic (Australia) +61 2 9033 3222
Global (London) +44 207 029 0093
The Royal Bank of Scotland
Domestic (Australia) +61 2 8259 2200
Global (London) +44 207 085 9785
Toronto Dominion Bank
Domestic (Singapore) 1800 646 497
Global (London) +44 207 628 4334
UBS AG2
Domestic (Australia) +61 2 9324 2222
Global (London) +44 207 567 3645
Westpac Banking Corporation
Domestic (Australia) +61 2 8204 2711
Global (London) +44 207 7621 7620
PANEL MEMBERS
QTC Treasury Note Facility Dealer Panel
Telephone
Australia and New Zealand Banking Group Ltd +61 2 9227 1772
Commonwealth Bank of Australia Ltd (Sydney) +61 2 9117 0020
Deutsche Bank AG (Sydney) +61 2 8258 2688
National Australia Bank Ltd (Sydney) +61 2 9295 1133
Westpac Banking Corporation Ltd (Sydney) +61 2 8204 2744
Multi Currency US Commercial Paper Facility Dealer Panel
Citigroup Global Markets Inc (New York) +1 212 723 6252
Credit Suisse (New York) +1 212 325 3358
Deutsche Bank Securities (New York) +1 212 250 5159
Multi Currency Euro Commercial Paper Facility Dealer Panel
Barclays Bank Plc (London) +44 207 773 9764
Citigroup International Plc (Hong Kong)3 +852 2501 2689
Deutsche Bank AG (Singapore) +65 6883 1698
National Australia Bank Limited +852 2526 5891
(Hong Kong and London)
RBC Capital Markets (Sydney) +61 2 9033 3300
UBS Ltd (London) +44 207 329 0203
Multi Currency Euro Medium-Term Note Facility Dealer Panel4
Includes all Domestic and Global A$ Bond Facility Distribution Group5
Multi Currency US Medium-Term Note Facility Dealer Panel4
Australia and New Zealand +1 212 8019 783
Banking Group Limited
Citigroup (New York) +1 212 723 6175
Commonwealth Bank of Australia +44 207 329 6444
Daiwa Securities SMBC Europe +61 3 9916 1388
Deutsche Bank Securities Inc (New York)6 +1 212 469 7500
J.P. Morgan +1 212 834 4533
RBC Capital Markets (New York) +1 212 858 7380
RBS Greenwich Capital +44 207 085 0000
TD Securities +1 212 827 7325
UBS Investment Bank +44 207 567 3782
1 Lead Manager - United States
2 Lead Manager - Europe
3 Lead Arranger
4 Reverse inquiry also permitted
5 Lead Arranger - UBS Ltd (London)
6 Lead Arranger
90 QUEENSLAND TREASURY CORPORATION ANNUAL REPORT 2010-2011
ISSUING AND PAYING AGENTS
Contact Telephone Facsimile Email
AUD Treasury Notes
Austraclear Services Ltd Sydney Help Desk 1300 362 257 +61 2 9256 0456 cad@asx.com.au
AUD Domestic Bonds
Link Market Services Ltd Markings/Transfers +61 2 8280 7868 +61 2 9287 0315 qtcops@linkmarketservices.com.au
AUD Global Bonds
Deutsche Bank Trust Company Americas Client Services +1 904 271 6586 +1 615 866 3887 transfer.operations@db.com
Euro Commercial Paper Deutsche Bank AG, London Client Services +44 207 547 3553 +44 207 547 6528 +44 207 547 6149 TSS-GDS.ROW@db.com
US Commercial Paper
Deutsche Bank Trust Company Americas Client Services +1 866 770 0355 +1 732 578 2655 mmi.operations@db.com
Euro Medium-Term Notes Deutsche Bank AG, London Client Services +44 207 547 3553 +44 207 547 6528 +44 207 547 6149 TSS-GDS.ROW@db.com
US Medium-Term Notes
Deutsche Bank Trust Company Americas Client Services +1 866 797 2808 +1 212 461 4450 mtn.operations@db.com
QUEENSLAND TREASURY CORPORATION ANNUAL REPORT 2010-2011 91

Queensland’s ‘Sir Leo Hielscher Bridges’.
Image supplied by Queensland Motorways Ltd.

QUEENSLAND
TREASURY
CORPORATION
Level 14 61 Mary Street Brisbane GPO Box 1096 Brisbane Queensland Australia 4001
Telephone: +61 7 3842 4600
Facsimile: +61 7 3221 4122
www.qtc.com.au
Queensland
Government