EXHIBIT (c)(ii)
Consolidated Financial Statements of the Co-registrant
2010-11 Report on State Finances
of the Queensland Government – 30 June 2011
Incorporating the Outcomes Report and the
AASB 1049 Financial Statements
Queensland Government
Contents
| | | | |
| | | Page | |
| |
Message from the Treasurer | | | 2 | |
| |
Scope of the Report | | | 3 | |
| |
Outcomes Report - Uniform Presentation Framework | | | | |
| |
Overview and Analysis | | | 4-01 | |
| |
Operating Statement by Sector | | | 4-07 | |
| |
Balance Sheet by Sector | | | 4-08 | |
| |
Cash Flow Statement by Sector | | | 4-09 | |
| |
General Government Sector Taxes | | | 4-10 | |
| |
General Government Sector Dividend and Income Tax Equivalent Income | | | 4-10 | |
| |
General Government Sector Grant Revenue | | | 4-11 | |
| |
General Government Sector Grant Expenses | | | 4-11 | |
| |
General Government Sector Expenses by Function | | | 4-12 | |
| |
General Government Sector Purchases of Non-financial Assets by Function | | | 4-13 | |
| |
Loan Council Allocation | | | 4-13 | |
| |
Certification of Outcomes Report | | | 4-14 | |
| |
AASB 1049 Financial Statements | | | | |
| |
Overview and Analysis | | | 5-01 | |
| |
Audited Financial Statements | | | | |
| |
Operating Statement | | | 6-01 | |
| |
Balance Sheet | | | 6-03 | |
| |
Statement of Changes in Net Assets (Equity) | | | 6-04 | |
| |
Cash Flow Statement | | | 6-06 | |
| |
Notes to the Financial Statements | | | 6-07 | |
| |
Certification of Queensland State Government Financial Statements | | | 6-97 | |
| |
Independent Auditor’s Report to the Treasurer of Queensland | | | 6-98 | |
| | |
| Report on State Finances 2010–11 – Government of Queensland | | 1 |
Message from the Treasurer
The Government is committed to fiscal transparency and accountability. A key objective of this report is to facilitate a meaningful assessment of the State’s financial performance over the 2010-11 financial year and its net worth at balance date.
This report provides details of the General Government Sector’s and Total State Sector’s financial operations and position on both a Uniform Presentation Framework (Outcomes Report) and Australian Accounting Standards basis.
Accounting standard, AASB 1049 Whole of Government and General Government Sector Financial Reporting aims to harmonise Government Finance Statistics (GFS) and Generally Accepted Accounting Principles (GAAP), with the objective of improving the clarity and transparency of government financial statements.
In endorsing this report, I place on record my appreciation of the professionalism and co-operation extended to Queensland Treasury by agency personnel and of the Treasury staff involved in its preparation.
ANDREW FRASER MP
DEPUTY PREMIER AND TREASURER
MINISTER FOR STATE DEVELOPMENT AND TRADE
| | |
| 2 | | Report on State Finances 2010–11 – Government of Queensland |
Scope of the Report
The Report on State Finances, incorporating the Outcomes Report and AASB1049 Financial Statements for the General Government Sector (GGS) and Whole of Government (Total State Sector), provides a comprehensive analysis of Government finances for the 2010-11 financial year.
The Outcomes Report
The Outcomes Report contains financial statements that are prepared and presented in accordance with the Uniform Presentation Framework (UPF) agreed to at the 1991 Premiers’ Conference and recently revised to align with AASB 1049 Whole of Government and General Government Sector Financial Reporting. The primary objective of the UPF is to provide uniform and comparable reporting of Commonwealth, State and Territory governments’ financial information.
Queensland’s annual Budget was prepared in accordance with the revised UPF, and the Outcomes Report compares achieved financial results with revised forecasts as per the 2011-12 Budget papers.
The UPF presentation is primarily structured on a sectoral basis with a focus on the General Government and Public Non-financial Corporations Sectors.
The AASB 1049 Financial Statements
The AASB 1049 Financial Statements outline the operations of the Queensland Government on an accrual basis in accordance with Australian Accounting Standard AASB 1049 Whole of Government and General Government Sector Financial Reporting and other applicable standards. The statements present the operating statement, balance sheet and cash flows of the Queensland Total State Sector on a consolidated basis and the GGS on a partially consolidated basis.
AASB 1049 Whole of Government and General Government Sector Financial Reporting was released in October 2007. The standard aims to harmonise the Government Finance Statistics (GFS) and Accounting Standard frameworks. The GFS reporting framework, developed by the Australian Bureau of Statistics (ABS), is based on international statistical standards and allows comprehensive assessments to be made of the economic impact of government. A full set of financial statements is required for both the GGS and Total State Sector. Comparison is with the prior year, though the GGS financial statements also require analysis of variances between original published budget and actuals.
Financial statements for the General Government, Public Non-financial Corporations and Public Financial Corporations sectors are disclosed in the disaggregated information note to the financial statements (Note 2).
Note 55 of the financial statements provides a full list of consolidated entities.
Where applicable, comparatives have been restated to agree with changes in presentation in the financial statements for the current reporting period and to correct timing differences and/or errors from prior periods.
Related Publications
This report complements other key publications relating to the financial performance of the Queensland Public Sector including:
| | • | | the annual Budget papers; |
| | • | | Budget updates including the Mid Year Fiscal and Economic Review; |
| | • | | the Treasurer’s Consolidated Fund Financial Report; and |
| | • | | the annual reports of the various departments, statutory bodies, Government-owned corporations and other entities that comprise the Queensland Government. |
| | |
| Report on State Finances 2010–11 – Government of Queensland | | 3 |
Outcomes Report
2010-11
Outcomes Report
Uniform Presentation Framework of the
Queensland Government – 30 June 2011
Queensland
Government
Outcomes Report - Overview and Analysis
Overview
The General Government UPF net operating balance for 2010-11 was a deficit of $1.516 billion, compared to the budgeted estimated actual deficit of $2.127 billion. The improvement in the result is due to modestly higher revenue across a range of categories, with expenses largely in line with those forecast for 2010-11 in the 2011-12 Budget.
A cash deficit of $5.88 billion was recorded in the General Government Sector, compared to an estimated deficit of $6.172 billion.
The State’s net worth decreased to $171.222 billion as at 30 June 2011, mainly due to revaluation decrements to non-financial assets.
Capital purchases of $13.344 billion in the Non-financial Public Sector were $193 million higher than forecast.
Summary of Key UPF Financial Aggregates
Outlined in the table below are the key aggregates, by sector.
| | | | | | | | | | | | | | | | | | | | | | | | |
| | | General Government | | | Public Non-financial | | | Non-financial Public | |
| | | Sector | | | Corporations Sector | | | Sector | |
| | | Est. Actual
$ million | | | Outcome
$ million | | | Est. Actual
$ million | | | Outcome
$ million | | | Est. Actual
$ million | | | Outcome
$ million | |
| | | | | | |
Revenue | | | 41,183 | | | | 41,957 | | | | 11,089 | | | | 11,291 | | | | 48,214 | | | | 48,984 | |
Expenses | | | 43,310 | | | | 43,473 | | | | 10,839 | | | | 10,913 | | | | 51,091 | | | | 50,952 | |
Net operating balance | | | (2,127 | ) | | | (1,516 | ) | | | 250 | | | | 378 | | | | (2,878 | ) | | | (1,968 | ) |
Cash surplus/(deficit) | | | (6,172 | ) | | | (5,880 | ) | | | (4,142 | ) | | | (3,257 | ) | | | (10,315 | ) | | | (9,137 | ) |
Capital purchases | | | 7,457 | | | | 8,237 | | | | 5,694 | | | | 5,106 | | | | 13,151 | | | | 13,344 | |
Net worth | | | 177,966 | | | | 171,222 | | | | 20,060 | | | | 19,679 | | | | 177,966 | | | | 171,222 | |
Net debt | | | (9,989 | ) | | | (9,047 | ) | | | 26,248 | | | | 24,040 | | | | 16,259 | | | | 14,993 | |
Net borrowing | | | 1,362 | | | | 1,311 | | | | 291 | | | | 165 | | | | 1,653 | | | | 1,475 | |
Borrowing | | | 23,820 | | | | 25,089 | | | | 28,990 | | | | 28,964 | | | | 52,811 | | | | 52,618 | |
Note:
| 1. | Numbers may not add due to rounding |
As outlined in the Charter of Fiscal Responsibility, the Treasurer is required to report regularly on progress against the Fiscal Principles. The following table provides an overview of the Government’s progress in meeting these principles in the 2010-11 financial year.
In 2010-11, the Government met the fiscal principles of:
| • | | meet all operating expenses from operating revenue |
| • | | maintain a competitive tax regime |
| • | | stabilise net financial liabilities as a proportion of revenue in the Non-financial Public Sector - 2010-11 outcome of 84% was lower than 2009-10 actual of 94% |
| • | | target full funding of long term liabilities |
The principle that requires a General Government net operating surplus by 2015-16 was budgeted to be met.
The Government did not meet the principle of growth in own-purpose expenses not exceeding real per capita growth in 2010-11. This measure has been substantially impacted by recent natural disasters.
| | |
| Report on State Finances 2010–11 – Government of Queensland | | 4-01 |
Outcomes Report - Overview and Analysis
The fiscal principles of the Queensland Government 2010-11
| | | | | | | | | | |
Principle | | | | Indicator | |
Fiscal sustainability | | | | | | | | |
| | | | | Est. Actual
$ million | | | Outcome
$ million | |
In the General Government sector, meet all operating expenses from operating revenue (where operating revenue is defined as total revenue from transactions and operating expenses are defined as total expenses from transactions less depreciation) | | Operating Revenue | | | 41,183 | | | | 41,957 | |
| | Operating expenses less depreciation | | | 40,702 | | | | 40,967 | |
| | | |
Growth in own-purpose expenses in the General Government sector to not exceed real per capita growth | | Own-purpose expense | | | 10.72 | % | | | 11.4 | % |
| | | |
| | Inflation plus population | | | 5.00 | % | | | 5.55 | % |
| |
| | | Net operating balance ($ million) | |
| | | | | Est. Actual
$ million | | | Outcome
$ million | |
Achieve a General Government net operating surplus as soon as possible, but no later than 2015-16 | | 2010-11 | | | (2,127 | ) | | | (1,516 | ) |
| | | |
Competitive tax regime | | | | | | | | | | |
| |
| | | Taxation revenue per capita Outcome | |
| | |
Maintain a competitive tax environment for business | | Queensland Average of other states | | | $ $ | 2,193 2,687 | |
| | | |
Managing the State’s balance sheet | | | | | | | | | | |
| |
| | | Net Financial Liabilities/Revenue Non-financial Public Sector | |
| | | | | Est Actual | | | Outcome | |
Stabilise net financial liabilities as a proportion of revenue in the Non- financial Public Sector | | 2010-11 | | | 89 | % | | | 84 | % |
| |
Target full funding of long-term liabilities such as superannuation in accordance with actuarial advice | | According to last actuarial review (as at June 2010), accruing superannuation liabilities were fully funded on the funding basis. The State Actuary reviews the scheme every three years. | |
| | |
| 4-02 | | Report on State Finances 2010–11 – Government of Queensland |
Outcomes Report - Overview and Analysis
| | | | | | | | |
| | | 2010-11 | | | 2010-11 | |
General Government Revenue | | Est. Actual
$ million | | | Outcome
$ million | |
| | |
Taxation revenue | | | 9,876 | | | | 9,975 | |
Grants revenue | | | 20,081 | | | | 20,272 | |
Sales of goods and services | | | 4,113 | | | | 4,172 | |
Interest income | | | 2,289 | | | | 2,365 | |
Dividend and income tax equivalent income | | | 1,336 | | | | 1,232 | |
Other revenue | | | 3,488 | | | | 3,941 | |
| | |
Total Revenue | | | 41,183 | | | | 41,957 | |
| | | | | | | | |
Note:
| 1. | Numbers may not add due to rounding |
Total revenue was $774 million higher than the 2010-11 estimated actual. This was largely due to:
| • | | other revenue being boosted by land contributions from Queensland Motorways Limited and developers and a variety of other small adjustments; |
| • | | higher than estimated grants from the Australian Government, particularly for disaster relief and Financial Assistance Grants to councils; and |
| • | | taxation revenue being marginally (1%) more than forecast, partially offset by lower than forecast dividend income as a result of the impairment to electricity generators arising from the Australian Government’s proposed carbon tax. |
| | | | | | | | |
| | | 2010-11 | | | 2010-11 | |
General Government Expenses | | Est. Actual
$ million | | | Outcome
$ million | |
| | |
Employee expenses | | | 16,955 | | | | 16,820 | |
Superannuation expenses | | | | | | | | |
Superannuation interest cost | | | 1,265 | | | | 1,240 | |
Other superannuation expenses | | | 2,128 | | | | 2,171 | |
Other operating expenses | | | 8,659 | | | | 8,646 | |
Depreciation and amortisation | | | 2,608 | | | | 2,506 | |
Other interest expenses | | | 1,240 | | | | 1,125 | |
Grant expenses | | | 10,455 | | | | 10,964 | |
| | |
Total Expenses | | | 43,310 | | | | 43,473 | |
| | | | | | | | |
Note:
| 1. | Numbers may not add due to rounding |
Total expenses were marginally higher than forecast (0.4%) due to:
| • | | grant expenses being higher than forecast with the on-passing of grants for financial assistance and disaster relief to councils, the demaining of roads and the transfer of the Gateway Upgrade South land to Queensland Motorways Limited; |
| • | | employee expenses being slightly lower than budgeted particularly in the areas of Health and Education; and |
| • | | depreciation expenses being lower than forecast following revaluation adjustments. |
| | |
| Report on State Finances 2010–11 – Government of Queensland | | 4-03 |
Outcomes Report - Overview and Analysis
General Government Sector expenditure is focussed on the delivery of core services to the community. As shown in the chart below, education and health account for the largest share of expenses.
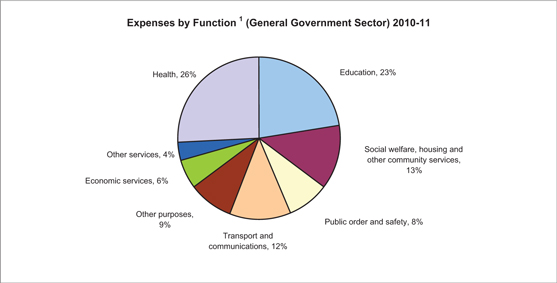
| 1 | Refer to 4-12 for further detail of expenses in each function category. |
Cash Flows
A cash deficit of $5.88 billion was recorded for 2010-11 in the General Government Sector, compared to the estimated actual forecast of $6.172 billion. This is the result of the improved operating position being only partially offset by higher than expected capital works.
Capital Purchases and Borrowings
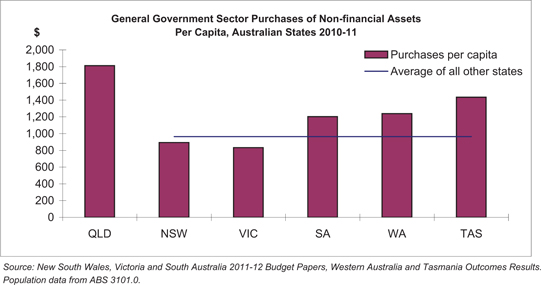
General Government Sector purchases of non-financial assets (i.e. capital expenditure) totalled $8.237 billion, $780 million more than forecast. This increase was mainly in the areas of health and education and relates to the timing of cash payments rather than the delivery of capital.
Queensland’s capital spend per capita is $1,811 in 2010-11 which is almost double the estimated average of the other states.
| | |
| 4-04 | | Report on State Finances 2010–11 – Government of Queensland |
Outcomes Report - Overview and Analysis
The gross borrowing for the General Government sector was $25.089 billion, $1.269 billion more than forecast. This was due to a temporary overdraft at year end which arose when the proceeds of the Abbot Point Coal Terminal were received from North Queensland Bulk Ports Corporation Limited in early 2011-12 rather than late 2010-11 as originally forecast.
Net Worth
The State’s net worth was $171.222 billion as at 30 June 2011, $6.744 billion lower than the estimated actual. A large portion of the decrease relates to the revaluation of land and other fixed assets to reflect market value. These revaluations were finalised after the 2011-12 Budget was published, and relate in large part to the effect of natural disasters.
In addition there has been a decrease in the value of the Public Non-financial Sector due mainly to changes in the valuation of electricity infrastructure to take account of the Australian Government’s proposed carbon tax.
Net Debt
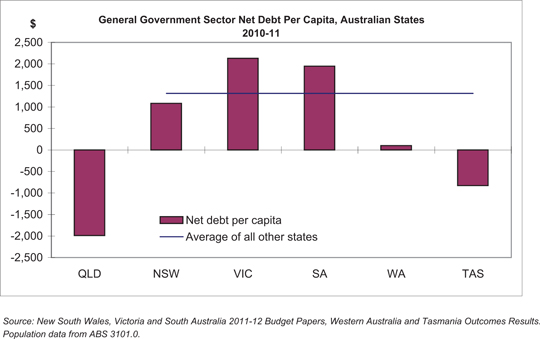
Net debt is a measure used to judge the overall strength of a jurisdiction’s fiscal position. High levels of net debt impose a call on future revenue flows to service that debt and can limit government flexibility to adjust outlays.
Queensland’s net debt position declined from the 2011-12 Budget estimate of negative $9.989 billion to an outcome of negative $9.047 billion due to the Abbot Point sales proceeds being received after year end.
Queensland’s negative net debt of $1,989 per capita compares favourably to the average net debt of $1,317 per capita of the other states.
| | |
| Report on State Finances 2010–11 – Government of Queensland | | 4-05 |
Outcomes Report - Overview and Analysis
Operating Result
The operating result represents the result for the State under the Accounting Standards framework. The GGS operating result of negative $1.399 billion differs from the net operating balance as it includes valuation adjustments such as gains and losses on financial and non-financial assets, and deferred tax revenue.
Comprehensive Result - Total Change in Net Worth
The comprehensive result includes revaluation of assets taken to reserves. The decrease between the estimated actual and the actual result is due mainly to the revaluations discussed above.
Public Non-financial Corporations (PNFC) Sector
The Public Non-financial Corporations Sector comprises bodies such as Government-owned corporations that mainly engage in the production of goods and services (of a non-financial nature) for sale in the market place at prices that aim to recover most of the costs involved:
| • | | The PNFC Sector recorded a net operating surplus of $378 million, $128 million higher than forecast due to lower depreciation and employee costs; |
| • | | The cash deficit of $3.257 billion is $885 million lower than forecast mainly due to improved operating cash flows and lower than expected capital expenditure on transport, water and electricity infrastructure; and |
| • | | The net worth of the Sector has decreased mainly due to the effect of asset revaluation decrements by the generators to account for the effect of a carbon tax. |
State Financial (Total State) Sector
The Total State Sector includes all State Government departments and statutory authorities, public non-financial corporations, public financial corporations and their controlled entities. All material inter-entity and intra-entity transactions and balances have been eliminated to the extent practicable:
| • | | A negative net operating balance of $3.775 billion was recorded in 2010-11; |
| • | | The Total State Sector cash deficit was $10.759 billion for 2010-11 after allowing for purchases of non-financial assets of $13.423 billion; and |
| • | | The Total State Sector net debt position was $17.126 billion. |
| | |
| 4-06 | | Report on State Finances 2010–11 – Government of Queensland |
2010-11 Operating Statement by Sector ($million)
| | | | | | | | | | | | | | | | | | | | | | | | | | | | | | | | | | | | |
| | | | | | | General Government
Sector | | | Public Non-financial
Corporations Sector | | | Non-financial Public
Sector | | | Public Financial
Corporations
Sector | | | State
Financial
Sector | |
| | | | | | | Est. Actual | | | Actual | | | Est. Actual | | | Actual | | | Est. Actual | | | Actual | | | Actual (b) | | | Actual (b) | |
| | Revenue from Transactions | | | | | | | | | | | | | | | | | | | | | | | | | | | | | | | | |
| | Taxation revenue | | | 9,876 | | | | 9,975 | | | | — | | | | — | | | | 9,570 | | | | 9,634 | | | | — | | | | 9,630 | |
| | Grants revenue | | | 20,081 | | | | 20,272 | | | | 2,259 | | | | 2,266 | | | | 20,256 | | | | 20,474 | | | | — | | | | 20,474 | |
| | Sales of goods and services | | | 4,113 | | | | 4,172 | | | | 8,343 | | | | 8,364 | | | | 12,091 | | | | 12,138 | | | | 1,327 | | | | 13,193 | |
| | Interest income | | | 2,289 | | | | 2,365 | | | | 112 | | | | 150 | | | | 2,401 | | | | 2,515 | | | | 4,580 | | | | 2,013 | |
| | Dividend and income tax equivalent income | | | 1,336 | | | | 1,232 | | | | — | | | | — | | | | 35 | | | | 60 | | | | — | | | | 4 | |
| | Other revenue | | | 3,488 | | | | 3,941 | | | | 374 | | | | 511 | | | | 3,860 | | | | 4,162 | | | | 65 | | | | 4,228 | |
| | Total Revenue from Transactions | | | 41,183 | | | | 41,957 | | | | 11,089 | | | | 11,291 | | | | 48,214 | | | | 48,984 | | | | 5,972 | | | | 49,542 | |
| | | | | | | | | |
Less | | Expenses from Transactions | | | | | | | | | | | | | | | | | | | | | | | | | | | | | | | | |
| | Employee expenses | | | 16,955 | | | | 16,820 | | | | 2,129 | | | | 1,934 | | | | 18,979 | | | | 18,645 | | | | 210 | | | | 18,667 | |
| | Superannuation expenses | | | | | | | | | | | | | | | | | | | | | | | | | | | | | | | | |
| | Superannuation interest cost | | | 1,265 | | | | 1,240 | | | | — | | | | (15 | ) | | | 1,265 | | | | 1,225 | | | | — | | | | 1,225 | |
| | Other superannuation expenses | | | 2,128 | | | | 2,171 | | | | 235 | | | | 224 | | | | 2,363 | | | | 2,395 | | | | 13 | | | | 2,408 | |
| | Other operating expenses | | | 8,659 | | | | 8,646 | | | | 3,630 | | | | 3,822 | | | | 11,918 | | | | 12,055 | | | | 1,542 | | | | 13,508 | |
| | Depreciation and amortisation | | | 2,608 | | | | 2,506 | | | | 2,205 | | | | 2,133 | | | | 4,812 | | | | 4,640 | | | | 37 | | | | 4,677 | |
| | Other interest expenses | | | 1,240 | | | | 1,125 | | | | 2,249 | | | | 2,288 | | | | 3,298 | | | | 3,196 | | | | 5,920 | | | | 4,035 | |
| | Grants expenses | | | 10,455 | | | | 10,964 | | | | 85 | | | | 166 | | | | 8,456 | | | | 8,796 | | | | — | | | | 8,796 | |
| | Other property expenses | | | — | | | | — | | | | 307 | | | | 361 | | | | — | | | | — | | | | 36 | | | | 1 | |
| | Total Expenses from Transactions | | | 43,310 | | | | 43,473 | | | | 10,839 | | | | 10,913 | | | | 51,091 | | | | 50,952 | | | | 7,759 | | | | 53,317 | |
| | | | | | | | | |
Equals | | Net Operating Balance | | | (2,127 | ) | | | (1,516 | ) | | | 250 | | | | 378 | | | | (2,878 | ) | | | (1,968 | ) | | | (1,787 | ) | | | (3,775 | ) |
| | | | | | | | | |
| | Other economic flows - included in operating result | | | 797 | | | | 117 | | | | 838 | | | | (67 | ) | | | (123 | ) | | | (1,195 | ) | | | 3,450 | | | | 2,104 | |
| | | | | | | | | |
| | Operating Result | | | (1,331 | ) | | | (1,399 | ) | | | 1,088 | | | | 311 | | | | (3,001 | ) | | | (3,164 | ) | | | 1,663 | | | | (1,671 | ) |
| | | | | | | | | |
| | Other economic flows - other movements in equity | | | 3,642 | | | | (3,034 | ) | | | (3,526 | ) | | | (3,131 | ) | | | 5,314 | | | | (1,269 | ) | | | (44 | ) | | | (2,762 | ) |
| | | | | | | | | |
| | Comprehensive Result - Total Change in Net Worth | | | 2,311 | | | | (4,433 | ) | | | (2,438 | ) | | | (2,820 | ) | | | 2,313 | | | | (4,433 | ) | | | 1,619 | | | | (4,433 | ) |
| | | | | | | | | | | | | | | | | | | | | | | | | | | | | | | | | | | | |
| | | | | | | | | |
| | KEY FISCAL AGGREGATES | | | | | | | | | | | | | | | | | | | | | | | | | | | | | | | | |
| | | | | | | | | |
| | Net Operating Balance | | | (2,127 | ) | | | (1,516 | ) | | | 250 | | | | 378 | | | | (2,878 | ) | | | (1,968 | ) | | | (1,787 | ) | | | (3,775 | ) |
| | | | | | | | | |
Less | | Net Acquisition of Non-financial Assets | | | | | | | | | | | | | | | | | | | | | | | | | | | | | | | | |
| | Purchases of non-financial assets | | | 7,457 | | | | 8,237 | | | | 5,694 | | | | 5,106 | | | | 13,151 | | | | 13,344 | | | | 79 | | | | 13,423 | |
| | Less | | Sales of non-financial assets | | | 171 | | | | 252 | | | | 476 | | | | 407 | | | | 647 | | | | 659 | | | | — | | | | 659 | |
| | Less | | Depreciation | | | 2,608 | | | | 2,506 | | | | 2,205 | | | | 2,133 | | | | 4,812 | | | | 4,640 | | | | 37 | | | | 4,677 | |
| | Plus | | Change in inventories | | | 112 | | | | 80 | | | | 8 | | | | (43 | ) | | | 120 | | | | 37 | | | | — | | | | 37 | |
| | Plus | | Other movements in non-financial assets | | | 226 | | | | 15 | | | | 6 | | | | 39 | | | | 232 | | | | 54 | | | | — | | | | 54 | |
| | Equals | | Total Net Acquisition of Non-financial Assets | | | 5,016 | | | | 5,573 | | | | 3,026 | | | | 2,561 | | | | 8,042 | | | | 8,135 | | | | 42 | | | | 8,177 | |
| | | | | | | | | | |
| | Equals | | Net Lending / (Borrowing) | | | (7,144 | ) | | | (7,089 | ) | | | (2,776 | ) | | | (2,183 | ) | | | (10,920 | ) | | | (10,103 | ) | | | (1,829 | ) | | | (11,952 | ) |
| | | | | | |
Notes | | | (a | ) | | Numbers may not add due to rounding. |
| | | (b | ) | | In accordance with UPF requirements, estimates for Public Financial Corporations and State Financial sectors are not included in Budget documentation. |
| | |
| Report on State Finances 2010–11 – Government of Queensland | | 4-07 |
2010-11 Balance Sheet by Sector ($million)
| | | | | | | | | | | | | | | | | | | | | | | | | | | | | | | | |
| | | General Government
Sector | | | Public Non-financial
Corporations Sector | | | Non-financial Public
Sector | | | Public Financial
Corporations
Sector | | | State
Financial
Sector | |
| | | Est. Actual | | | Actual | | | Est. Actual | | | Actual | | | Est. Actual | | | Actual | | | Actual (b) | | | Actual (b) | |
| | | | | | | | |
Assets | | | | | | | | | | | | | | | | | | | | | | | | | | | | | | | | |
Financial assets | | | | | | | | | | | | | | | | | | | | | | | | | | | | | | | | |
Cash and deposits | | | 646 | | | | 635 | | | | 1,847 | | | | 4,117 | | | | 2,493 | | | | 3,318 | | | | 22 | | | | 1,359 | |
Advances paid | | | 651 | | | | 594 | | | | 308 | | | | 283 | | | | 946 | | | | 865 | | | | — | | | | 865 | |
Investments, loans and placements | | | 33,028 | | | | 33,352 | | | | 612 | | | | 554 | | | | 33,642 | | | | 33,906 | | | | 107,784 | | | | 59,115 | |
Receivables | | | 3,888 | | | | 4,493 | | | | 1,892 | | | | 2,020 | | | | 4,470 | | | | 5,005 | | | | 377 | | | | 5,148 | |
Equity | | | | | | | | | | | | | | | | | | | | | | | | | | | | | | | | |
Investments in other public sector entities | | | 18,908 | | | | 18,168 | | | | — | | | | — | | | | (1,087 | ) | | | (1,511 | ) | | | 98 | | | | — | |
Investments - other | | | 88 | | | | 117 | | | | 86 | | | | 106 | | | | 174 | | | | 223 | | | | 2,805 | | | | 3,028 | |
Total financial assets | | | 57,209 | | | | 57,358 | | | | 4,746 | | | | 7,081 | | | | 40,639 | | | | 41,806 | | | | 111,085 | | | | 69,515 | |
| | | | | | | | |
Non-financial Assets | | | | | | | | | | | | | | | | | | | | | | | | | | | | | | | | |
Land and other fixed assets | | | 176,208 | | | | 171,142 | | | | 53,301 | | | | 50,748 | | | | 229,475 | | | | 221,889 | | | | 329 | | | | 222,218 | |
Other non-financial assets | | | 5,570 | | | | 5,813 | | | | 1,250 | | | | 1,633 | | | | 799 | | | | 925 | | | | 606 | | | | 716 | |
Total Non-financial Assets | | | 181,778 | | | | 176,955 | | | | 54,551 | | | | 52,380 | | | | 230,274 | | | | 222,814 | | | | 934 | | | | 222,934 | |
| | | | | | | | |
Total assets | | | 238,987 | | | | 234,313 | | | | 59,296 | | | | 59,461 | | | | 270,913 | | | | 264,620 | | | | 112,020 | | | | 292,449 | |
| | | | | | | | |
Liabilities | | | | | | | | | | | | | | | | | | | | | | | | | | | | | | | | |
Payables | | | 3,428 | | | | 3,918 | | | | 2,182 | | | | 2,429 | | | | 4,319 | | | | 4,878 | | | | 210 | | | | 4,853 | |
Superannuation liability | | | 25,479 | | | | 25,236 | | | | 84 | | | | (77 | ) | | | 25,563 | | | | 25,159 | | | | — | | | | 25,159 | |
Other employee benefits | | | 4,582 | | | | 4,624 | | | | 671 | | | | 645 | | | | 5,254 | | | | 5,270 | | | | 87 | | | | 5,356 | |
Deposits held | | | — | | | | 1 | | | | 14 | | | | 20 | | | | 14 | | | | 21 | | | | 36,643 | | | | 3,557 | |
Advances received | | | 515 | | | | 444 | | | | 11 | | | | 11 | | | | 516 | | | | 444 | | | | — | | | | 444 | |
Borrowing | | | 23,820 | | | | 25,089 | | | | 28,990 | | | | 28,964 | | | | 52,811 | | | | 52,618 | | | | 73,295 | | | | 74,464 | |
Other liabilities | | | 3,196 | | | | 3,779 | | | | 7,284 | | | | 7,789 | | | | 4,470 | | | | 5,009 | | | | 3,198 | | | | 7,392 | |
Total liabilities | | | 61,021 | | | | 63,091 | | | | 39,237 | | | | 39,782 | | | | 92,947 | | | | 93,398 | | | | 113,433 | | | | 121,227 | |
| | | | | | | | |
Net Worth | | | 177,966 | | | | 171,222 | | | | 20,060 | | | | 19,679 | | | | 177,966 | | | | 171,222 | | | | (1,413 | ) | | | 171,222 | |
| | | | | | | | | | | | | | | | | | | | | | | | | | | | | | | | |
Net Financial Worth | | | (3,812 | ) | | | (5,733 | ) | | | (34,491 | ) | | | (32,701 | ) | | | (52,308 | ) | | | (51,592 | ) | | | (2,347 | ) | | | (51,712 | ) |
Net Financial Liabilities | | | 22,720 | | | | 23,900 | | | | 34,491 | | | | 32,701 | | | | 51,221 | | | | 50,081 | | | | 2,445 | | | | 51,712 | |
Net Debt | | | (9,989 | ) | | | (9,047 | ) | | | 26,248 | | | | 24,040 | | | | 16,259 | | | | 14,993 | | | | 2,133 | | | | 17,126 | |
| | |
| (a) | | Numbers may not add due to rounding. |
| (b) | | In accordance with UPF requirements, estimates for Public Financial Corporations and State Financial sectors are not included in Budget documentation. |
| (c) | | Estimated Actuals have been restated where subsequent changes in classification have occurred, to ensure comparability with estimates. |
| | |
| 4-08 | | Report on State Finances 2010–11 – Government of Queensland |
2010-11 Cash Flow Statement by Sector ($million)
| | | | | | | | | | | | | | | | | | | | | | | | | | | | | | | | |
| | | General Government
Sector | | | Public Non-financial
Corporations Sector | | | Non-financial Public
Sector | | | Public Financial
Corporations
Sector | | | State
Financial
Sector | |
| | | Est. Actual | | | Actual | | | Est. Actual | | | Actual | | | Est. Actual | | | Actual | | | Actual (b) | | | Actual (b) | |
Cash Receipts from Operating Activities | | | | | | | | | | | | | | | | | | | | | | | | | | | | | | | | |
Taxes received | | | 9,906 | | | | 9,900 | | | | — | | | | — | | | | 9,599 | | | | 9,590 | | | | — | | | | 9,586 | |
Grants and subsidies received | | | 20,096 | | | | 20,278 | | | | 2,306 | | | | 2,151 | | | | 20,312 | | | | 20,475 | | | | — | | | | 20,475 | |
Sales of goods and services | | | 4,539 | | | | 4,429 | | | | 9,130 | | | | 9,290 | | | | 13,272 | | | | 13,349 | | | | 1,280 | | | | 14,632 | |
Interest receipts | | | 2,288 | | | | 2,276 | | | | 112 | | | | 149 | | | | 2,401 | | | | 2,425 | | | | 4,570 | | | | 1,912 | |
Dividends and income tax equivalents | | | 1,023 | | | | 1,096 | | | | — | | | | — | | | | 42 | | | | 70 | | | | — | | | | 4 | |
Other receipts | | | 5,192 | | | | 5,361 | | | | 1,122 | | | | 1,277 | | | | 6,312 | | | | 6,618 | | | | 92 | | | | 6,718 | |
Total | | | 43,045 | | | | 43,340 | | | | 12,671 | | | | 12,867 | | | | 51,939 | | | | 52,527 | | | | 5,942 | | | | 53,327 | |
Cash Payments for Operating Activities | | | | | | | | | | | | | | | | | | | | | | | | | | | | | | | | |
Payments for employees | | | (18,841 | ) | | | (18,571 | ) | | | (2,347 | ) | | | (2,193 | ) | | | (21,083 | ) | | | (20,654 | ) | | | (202 | ) | | | (20,669 | ) |
Payments for goods and services | | | (10,622 | ) | | | (10,531 | ) | | | (4,872 | ) | | | (4,803 | ) | | | (15,113 | ) | | | (14,938 | ) | | | (205 | ) | | | (15,187 | ) |
Grants and subsidies | | | (10,461 | ) | | | (10,223 | ) | | | (41 | ) | | | (21 | ) | | | (8,412 | ) | | | (8,302 | ) | | | — | | | | (8,302 | ) |
Interest paid | | | (1,249 | ) | | | (1,118 | ) | | | (2,178 | ) | | | (2,110 | ) | | | (3,236 | ) | | | (3,027 | ) | | | (5,931 | ) | | | (3,882 | ) |
Other payments | | | (758 | ) | | | (793 | ) | | | (1,423 | ) | | | (1,564 | ) | | | (1,906 | ) | | | (2,058 | ) | | | (1,295 | ) | | | (3,281 | ) |
Total | | | (41,931 | ) | | | (41,235 | ) | | | (10,860 | ) | | | (10,690 | ) | | | (49,750 | ) | | | (48,980 | ) | | | (7,633 | ) | | | (51,322 | ) |
Net Cash Inflows from Operating Activities | | | 1,114 | | | | 2,105 | | | | 1,811 | | | | 2,177 | | | | 2,189 | | | | 3,548 | | | | (1,691 | ) | | | 2,005 | |
Cash Flows from Investments in Non-financial Assets | | | | | | | | | | | | | | | | | | | | | | | | | | | | | | | | |
Purchases of non-financial assets | | | (7,457 | ) | | | (8,237 | ) | | | (5,694 | ) | | | (5,106 | ) | | | (13,151 | ) | | | (13,344 | ) | | | (79 | ) | | | (13,423 | ) |
Sales of non-financial assets | | | 171 | | | | 252 | | | | 476 | | | | 407 | | | | 647 | | | | 659 | | | | — | | | | 659 | |
Total | | | (7,286 | ) | | | (7,985 | ) | | | (5,218 | ) | | | (4,698 | ) | | | (12,504 | ) | | | (12,685 | ) | | | (79 | ) | | | (12,764 | ) |
Net Cash Flows from Investments in Financial Assets for Policy Purposes | | | 9,248 | | | | 7,841 | | | | 5,944 | | | | 5,780 | | | | 12,817 | | | | 12,968 | | | | — | | | | 10,606 | |
| | | | | | | | |
Net Cash Flows for Investments in Financial Assets for Liquidity Purposes | | | (4,739 | ) | | | (4,956 | ) | | | 65 | | | | 22 | | | | (4,674 | ) | | | (4,934 | ) | | | (5,951 | ) | | | (4,143 | ) |
Receipts from Financing Activities | | | | | | | | | | | | | | | | | | | | | | | | | | | | | | | | |
Advances received (net) | | | 43 | | | | (19 | ) | | | — | | | | (1 | ) | | | 43 | | | | (19 | ) | | | — | | | | (19 | ) |
Borrowing (net) | | | 1,362 | | | | 1,311 | | | | 291 | | | | 165 | | | | 1,653 | | | | 1,475 | | | | (1,946 | ) | | | (467 | ) |
Dividends paid | | | — | | | | — | | | | (735 | ) | | | (735 | ) | | | — | | | | — | | | | (13 | ) | | | — | |
Deposits received (net) | | | — | | | | (1 | ) | | | — | | | | 4 | | | | — | | | | 3 | | | | 5,507 | | | | 511 | |
Other financing (net) | | | — | | | | — | | | | (2,366 | ) | | | (653 | ) | | | 4 | | | | — | | | | 4,167 | | | | 4,317 | |
Total | | | 1,405 | | | | 1,291 | | | | (2,809 | ) | | | (1,220 | ) | | | 1,701 | | | | 1,460 | | | | 7,715 | | | | 4,343 | |
Net Increase/(Decrease) in Cash Held | | | (259 | ) | | | (1,704 | ) | | | (206 | ) | | | 2,061 | | | | (471 | ) | | | 357 | | | | (6 | ) | | | 47 | |
| | | | | | | | |
Net cash from operating activities | | | 1,114 | | | | 2,105 | | | | 1,811 | | | | 2,177 | | | | 2,189 | | | | 3,548 | | | | (1,691 | ) | | | 2,005 | |
Net cash from investments in non-financial assets | | | (7,286 | ) | | | (7,985 | ) | | | (5,218 | ) | | | (4,698 | ) | | | (12,504 | ) | | | (12,685 | ) | | | (79 | ) | | | (12,764 | ) |
Dividends paid | | | — | | | | — | | | | (735 | ) | | | (735 | ) | | | — | | | | — | | | | (13 | ) | | | — | |
Cash Surplus/(Deficit) | | | (6,172 | ) | | | (5,880 | ) | | | (4,142 | ) | | | (3,257 | ) | | | (10,315 | ) | | | (9,137 | ) | | | (1,784 | ) | | | (10,759 | ) |
| | | | | | | | | | | | | | | | | | | | | | | | | | | | | | | | |
Derivation of ABS GFS Cash Surplus/Deficit | | | | | | | | | | | | | | | | | | | | | | | | | | | | | | | | |
Cash surplus/(deficit) | | | (6,172 | ) | | | (5,880 | ) | | | (4,142 | ) | | | (3,257 | ) | | | (10,315 | ) | | | (9,137 | ) | | | (1,784 | ) | | | (10,759 | ) |
Acquisitions under finance leases and similar arrangements | | | (71 | ) | | | (76 | ) | | | (4 | ) | | | (4 | ) | | | (75 | ) | | | (80 | ) | | | — | | | | (80 | ) |
ABS GFS Cash Surplus/(Deficit) Including Finance Leases and Similar Arrangements | | | (6,243 | ) | | | (5,956 | ) | | | (4,145 | ) | | | (3,261 | ) | | | (10,390 | ) | | | (9,217 | ) | | | (1,784 | ) | | | (10,839 | ) |
| | | | | | | | | | | | | | | | | | | | | | | | | | | | | | | | |
| | | | |
| Notes | | (a) | | Numbers may not add due to rounding. |
| | (b) | | In accordance with UPF requirements, estimates for Public Financial Corporations and State Financial sectors are not included in Budget documentation. |
| | |
| Report on State Finances 2010–11 – Government of Queensland | | 4-09 |
Other General Government UPF Data
Data in the following tables is presented in accordance with the Uniform Presentation Framework.
General Government Sector Taxes
| | | | |
| | | 2010-11 | |
| | | Outcome | |
| | | $ million | |
| |
Taxes on employers’ payroll and labour force | | | 3,023 | |
| |
Taxes on property | | | | |
Land taxes | | | 1,042 | |
Stamp duties on financial and capital transactions | | | 1,933 | |
Other | | | 565 | |
| |
Taxes on the provision of goods and services | | | | |
Taxes on gambling | | | 945 | |
Taxes on insurance | | | 546 | |
| |
Taxes on use of goods and performance of activities | | | | |
Motor vehicle taxes | | | 1,768 | |
Other | | | 152 | |
| |
Total Taxation Revenue | | | 9,975 | |
| | | | |
Note:
| 1. | Numbers may not add due to rounding. |
General Government Sector
Dividend and Income Tax Equivalent Income
| | | | |
| | | 2010-11 | |
| | | Outcome | |
| | | $ million | |
| |
Dividend and Income Tax Equivalent income from PNFC sector | | | 1,172 | |
Dividend and Income Tax Equivalent income from PFC sector | | | 56 | |
Other Dividend and Income Tax Equivalent income | | | 4 | |
| |
Total Dividend and Income Tax Equivalent income | | | 1,232 | |
| | | | |
Note:
| 1. | Numbers may not add due to rounding. |
| | |
| 4-10 | | Report on State Finances 2010–11 – Government of Queensland |
Other General Government UPF Data
General Government Sector Grant Revenue
| | | | |
| | | 2010-11 | |
| | | Outcome | |
| | | $ million | |
| |
Current grant revenue | | | | |
| |
Current grants from the Commonwealth | | | | |
General purpose grants | | | 8,436 | |
Specific purpose grants | | | 7,329 | |
Specific purpose grants for on-passing | | | 2,348 | |
Total current grants from the Commonwealth | | | 18,113 | |
Other contributions and grants | | | 530 | |
Total current grant revenue | | | 18,643 | |
| |
Capital grant revenue | | | | |
| |
Capital grants from the Commonwealth | | | | |
General purpose grants | | | 2 | |
Specific purpose grants | | | 1,568 | |
Specific purpose grants for on-passing | | | 19 | |
Total capital grants from the Commonwealth | | | 1,589 | |
Other contributions and grants | | | 40 | |
Total capital grant revenue | | | 1,629 | |
| |
Total grant revenue | | | 20,272 | |
| | | | |
Note:
| 1. | Numbers may not add due to rounding. |
General Government Sector Grant Expenses
| | | | |
| | | 2010-11 | |
| | | Outcome | |
| | | $ million | |
| |
Current grant expenses | | | | |
| |
Private and Not-for-profit sector | | | 3,566 | |
Private and Not-for-profit sector on-passing | | | 1,933 | |
Local Government | | | 193 | |
Local Government on-passing | | | 416 | |
Grants to other sectors of Government | | | 2,061 | |
Other | | | 478 | |
Total current grant expense | | | 8,646 | |
| |
Capital grant expenses | | | | |
| |
Private and Not-for-profit sector | | | 362 | |
Local Government | | | 1,230 | |
Households sector on-passing | | | 11 | |
Grants to other sectors of Government | | | 245 | |
Other | | | 469 | |
Total capital grant expenses | | | 2,318 | |
| |
Total grant expenses | | | 10,964 | |
| | | | |
Note:
| 1. | Numbers may not add due to rounding. |
| | |
| Report on State Finances 2010–11 – Government of Queensland | | 4-11 |
General Government Sector Expenses by Function
| | | | |
| | | 2010-11
Outcome
$ million | |
| |
General Public Services | | | 1,648 | |
Other general public services | | | 1,648 | |
| |
Public Order and Safety | | | 3,643 | |
Police and fire protection services | | | 2,262 | |
Law courts and legal services | | | 683 | |
Prisons and corrective services | | | 615 | |
Other public order and safety | | | 83 | |
| |
Education | | | 9,801 | |
Primary and secondary education | | | 7,878 | |
Tertiary education | | | 782 | |
Pre-school education and education not definable by level | | | 920 | |
Transportation of students | | | 159 | |
Education n.e.c. | | | 62 | |
| |
Health | | | 11,201 | |
Acute care institutions | | | 7,755 | |
Mental health institutions | | | 292 | |
Nursing homes for the aged | | | 241 | |
Community health services | | | 2,291 | |
Public health services | | | 355 | |
Health research | | | 126 | |
Health administration n.e.c. | | | 141 | |
| |
Social Security and Welfare | | | 2,637 | |
Welfare services | | | 2,636 | |
Social security and welfare n.e.c. | | | 37 | |
| |
Housing and Community Amenities | | | 1,661 | |
Housing and community development | | | 1,287 | |
Water Supply | | | 162 | |
Sanitation and protection of the environment | | | 212 | |
| |
Recreation and Culture | | | 1,161 | |
Recreation facilities and services | | | 642 | |
Cultural facilities and services | | | 320 | |
Recreation and cultural n.e.c. | | | 199 | |
| | | | |
| | | 2010-11
Outcome
$ million | |
| |
Fuel and Energy | | | 466 | |
Fuel affairs and services | | | 72 | |
Electricity and other energy | | | 395 | |
| |
Agriculture, Forestry, Fishing and Hunting | | | 826 | |
Agriculture | | | 738 | |
Forestry, fishing and hunting | | | 88 | |
| |
Mining, manufacturing and construction | | | 259 | |
Mining and mineral resources other than fuels | | | 104 | |
Construction | | | 155 | |
| |
Transport and Communications | | | 5,331 | |
Road transport | | | 2,802 | |
Water transport | | | 30 | |
Rail transport | | | 148 | |
Air transport | | | 20 | |
Other transport | | | 2,299 | |
Communications | | | 31 | |
| |
Other Economic Affairs | | | 877 | |
Tourism and area promotion | | | 101 | |
Labour and employment affairs | | | 527 | |
Other economic affairs | | | 249 | |
| |
Other Purposes | | | 3,926 | |
Nominal superannuation interest | | | 1,240 | |
Public debt transactions | | | 1,140 | |
General purpose inter-government transactions | | | 416 | |
Natural disaster relief | | | 1,129 | |
| | | | |
| |
Total | | | 43,473 | |
| | | | |
| | |
| 4-12 | | Report on State Finances 2010–11 – Government of Queensland |
General Government Sector Purchases of Non-financial Assets by
Function and Loan Council Allocation
General Government Sector
Purchases of Non-financial Assets by Function
| | | | |
| | | 2010-11
Outcome
$ million | |
| |
General public services | | | 189 | |
Public order and safety | | | 575 | |
Education | | | 1,776 | |
Health | | | 1,466 | |
Social security and welfare | | | 152 | |
Housing and community amenities | | | 816 | |
Recreation and culture | | | 160 | |
Fuel and energy | | | 1 | |
Agriculture, forestry, fishing and hunting | | | 112 | |
Mining, manufacturing and construction | | | 9 | |
Transport and communications | | | 2,954 | |
Other economic affairs | | | 26 | |
Total | | | 8,237 | |
Note:
| 1. | Numbers may not add due to rounding |
Loan Council Allocation
The Australian Loan Council requires all jurisdictions to advise the Loan Council Allocation (LCA) outcome for the last financial year as part of the annual Outcomes Report. The LCA represents each government’s call on financial markets for a given financial year. A tolerance limit of two percent of Non-financial Public Sector receipts applies between the LCA budget update and the outcome. The LCA outcome exceeds the Budget estimate by more than this.
The main reason for the lower PNFC Sector cash deficit is lower capital expenditure on rail infrastructure following the listing of QR National on the Stock Exchange in November 2010. The higher cash flows for policy purposes arise from the aforementioned listing as well as the lease of the Port of Brisbane and Abbot Point Coal Terminal to the private sector and the transfer of Queensland Motorways Limited to an investment trust of QIC Limited.
| | | | | | | | |
| | | 2010-11
Budget
$ million | | | 2010-11
Outcome
$ million | |
| | |
General Government Sector cash deficit/(surplus)1 | | | 6,396 | | | | 5,880 | |
PNFC Sector cash deficit/(surplus)1 | | | 4,702 | | | | 3,257 | |
Non-financial Public Sector cash deficit/(surplus)1 | | | 11,099 | | | | 9,137 | |
Acquisitions under finance leases and similar arrangements | | | (71 | ) | | | (80 | ) |
ABS GFS cash deficit/(surplus) | | | 11,170 | | | | 9,217 | |
Net cash flows from investments in financial assets for policy purposes | | | 851 | | | | 12,968 | |
Memorandum items2 | | | 1,234 | | | | 2,369 | |
| | |
LOAN COUNCIL ALLOCATION | | | 11,553 | | | | (1,382 | ) |
Notes:
| 1. | Figures in brackets represent surpluses |
| 2. | Other memorandum items include operating leases and local government borrowings |
| | |
| Report on State Finances 2010–11 – Government of Queensland | | 4-13 |
Certification of Outcomes Report
Management Certification
The foregoing Outcomes Report contains financial statements prepared and presented in accordance with the Uniform Presentation Framework (UPF) agreed to at the 1991 Premiers’ Conference and revised in October 2007 to align with AASB 1049 Whole of Government and General Government Sector Financial Reporting.
This report separately discloses outcomes for the General Government, Public Non-financial Corporations, Public Financial Corporations and State Financial sectors within Queensland. Entities excluded from this report include local governments and universities. Queensland public sector entities consolidated for this report are listed in the AASB 1049 Financial Statements, taking into account intra and inter-agency eliminations.
Only those agencies considered material by virtue of their financial transactions and balances are consolidated in this report.
In our opinion, we certify that the Outcomes Report has been properly drawn up, in accordance with UPF requirements, to present a true and fair view of:
| (i) | the operating statement and cash flows of the Queensland State Government for the financial year; and |
| (ii) | the balance sheet of the Government at 30 June 2011. |
At the date of certification of this report, we are not aware of any material circumstances that would render any particulars included in the Outcomes Report misleading or inaccurate.
| | |
| Dennis Molloy | | Gerard Bradley, CPA FCA |
| Assistant Under Treasurer | | Under Treasurer |
| Queensland Treasury | | Queensland Treasury |
| |
| Date 19 October 2011 | | |
| | |
| 4-14 | | Report on State Finances 2010–11 – Government of Queensland |
AASB 1049 Overview
2010-11
AASB 1049 Financial Statements
Overview and Analysis – 30 June 2011
Queensland
Government
AASB 1049 - Overview and Analysis
The following analysis compares current year General Government Sector (GGS) and Total State Sector performance with last year’s balances, restated for changes in accounting policies, presentational and timing differences and errors.
AASB 1049 Whole of Government and General Government Sector Financial Reporting has harmonised the disclosure presentation to be consistent with the Uniform Presentation Framework disclosed in the Outcomes Report.
Summary of Key Financial Aggregates of the Consolidated Financial Statements
The table below provides aggregate information under AASB1049:
| | | | | | | | | | | | | | | | |
| | | General Government
Sector | | | Total State Sector | |
| | | 2011
$ million | | | 2010
$ million | | | 2011
$ million | | | 2010
$ million | |
| | | | |
Continuing Revenue from Transactions | | | | | | | | | | | | | | | | |
Taxation revenue | | | 9,975 | | | | 9,375 | | | | 9,630 | | | | 9,101 | |
Grants revenue | | | 20,272 | | | | 20,205 | | | | 20,474 | | | | 20,352 | |
Sales of goods and services | | | 4,172 | | | | 3,961 | | | | 11,476 | | | | 10,303 | |
Interest income | | | 2,365 | | | | 2,204 | | | | 2,013 | | | | 1,919 | |
Dividend and income tax equivalents income | | | 1,232 | | | | 949 | | | | 4 | | | | — | |
Other revenue | | | 3,941 | | | | 3,033 | | | | 4,228 | | | | 3,452 | |
| | | | | | | | | | | | | | | | |
| | | 41,957 | | | | 39,727 | | | | 47,825 | | | | 45,127 | |
| | | | | | | | | | | | | | | | |
| | | | |
Continuing Expenses from Transactions | | | | | | | | | | | | | | | | |
Employee expenses | | | 16,820 | | | | 15,566 | | | | 18,222 | | | | 16,660 | |
Superannuation expenses | | | 3,412 | | | | 3,371 | | | | 3,633 | | | | 3,552 | |
Other operating expenses and property expenses | | | 8,646 | | | | 7,569 | | | | 12,779 | | | | 11,224 | |
Depreciation and amortisation | | | 2,506 | | | | 2,501 | | | | 4,559 | | | | 4,308 | |
Other interest expense | | | 1,125 | | | | 803 | | | | 4,035 | | | | 3,625 | |
Grants expenses | | | 10,964 | | | | 9,790 | | | | 8,796 | | | | 7,812 | |
| | | | | | | | | | | | | | | | |
| | | 43,473 | | | | 39,599 | | | | 52,024 | | | | 47,182 | |
| | | | | | | | | | | | | | | | |
| | | | |
Net Operating Balance from Continuing Operations | | | (1,516 | ) | | | 128 | | | | (4,199 | ) | | | (2,055 | ) |
Net Operating Balance from Discontinued Operations | | | — | | | | — | | | | 424 | | | | (3 | ) |
| | | | | | | | | | | | | | | | |
Net Operating Balance | | | (1,516 | ) | | | 128 | | | | (3,775 | ) | | | (2,058 | ) |
| | | | | | | | | | | | | | | | |
Other Economic Flows - Included in Operating Result | | | 117 | | | | (937 | ) | | | 2,104 | | | | (1,120 | ) |
| | | | | | | | | | | | | | | | |
Operating Result | | | (1,399 | ) | | | (809 | ) | | | (1,671 | ) | | | (3,177 | ) |
| | | | | | | | | | | | | | | | |
| | | | |
Other Economic Flows - Other Movements in Equity | | | (2,966 | ) | | | (7,880 | ) | | | (2,695 | ) | | | (5,511 | ) |
| | | | | | | | | | | | | | | | |
Comprehensive Result | | | (4,365 | ) | | | (8,689 | ) | | | (4,365 | ) | | | (8,689 | ) |
| | | | | | | | | | | | | | | | |
| | | | |
Assets | | | 234,313 | | | | 228,072 | | | | 292,449 | | | | 290,192 | |
Liabilities | | | 63,091 | | | | 52,484 | | | | 121,227 | | | | 114,604 | |
| | | | | | | | | | | | | | | | |
Net Worth | | | 171,222 | | | | 175,588 | | | | 171,222 | | | | 175,588 | |
| | | | | | | | | | | | | | | | |
| | |
| Report on State Finances 2010–11 – Government of Queensland | | 5-01 |
AASB 1049 - Overview and Analysis
Net Operating Balance - Continuing Operations
The GGS net operating balance was a deficit of $1.516 billion compared to a surplus (restated) of $128 million in 2009-10.
The Total State Sector net operating balance from continuing operations was a deficit of $4.199 billion compared to a restated deficit of $2.055 billion in 2009-10.
Revenue
Revenue from transactions has increased from 2009-10 by $2.230 billion to be $41.957 billion in the GGS and totals $47.825 billion in the Total State Sector, an increase of $2.698 billion over 2009-10.
Revenues by type for the GGS and Total State Sector are shown in the following chart:
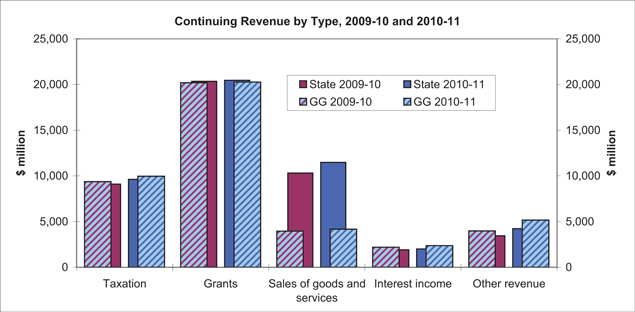
Taxation revenue increased in 2010-11 by $600 million for GGS and $529 million for the Total State Sector. Payroll tax collections explain the majority of this increase, as they grew as a result of employment and wages growth.
Commonwealth and other grants comprised 48% of GGS revenue and 43% of Total State Sector revenue. Grant revenue overall has increased marginally from 2009-10 as Commonwealth stimulus spending in 2009-10 has been replaced by disaster relief funding in 2010-11, as well as increases in GST.
Sales of goods and services increased by $211 million in 2010-11 to $4.172 billion in the GGS and by $1.173 billion in the Total State Sector. The change in the Total State Sector is mainly due to increased electricity sales, recoverable works for the LNG industry and WorkCover premiums.
Interest income in both the GGS and the Total State Sector grew compared to 2009-10, mainly reflecting higher investment balances.
Dividend and income tax equivalent income increased by $283 million in 2010-11 mainly due to higher receipts from the rail sector.
Other revenue increased by $908 million in the GGS and by $776 million in the Total State Sector mainly due to higher coal prices leading to higher royalty revenue.
| | |
| 5-02 | | Report on State Finances 2010–11 – Government of Queensland |
AASB 1049 - Overview and Analysis
Expenses
Total expenses for 2010-11 were $43.473 billion for the GGS and $52.024 billion for the Total State Sector, an increase from 2009-10 of $3.874 billion and $4.842 billion respectively.
Expenses by type are shown in the following chart:
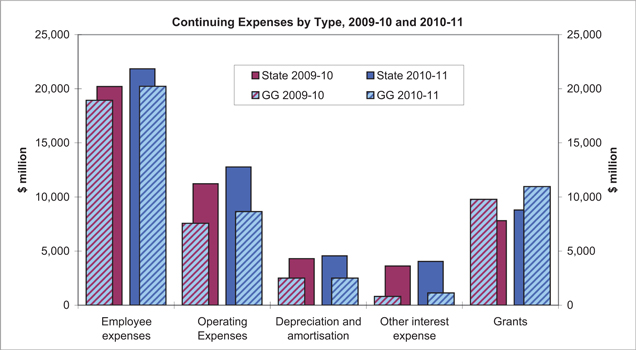
Employee expenses increased in 2010-11 for both the GGS and Total State Sector as a result of enterprise bargaining agreements and increased service delivery, particularly in the areas of health and education.
GGS other operating expenses increased by $1.077 billion in 2010-11 mainly due to expenditure on natural disasters as well as increased service delivery in the areas of health and community services. This increase is also reflected in the Total State Sector in addition to higher expenditure on customer recoverable works.
Depreciation costs increased by $251 million to $4.559 billion for Total State Sector. The increase is mainly due to rail infrastructure revaluations in 2009-10, flowing through to the 2010-11 depreciation expense.
Other interest expenses increased reflecting the cost of borrowing to expand infrastructure.
Grant expenses have increased at both the GGS and Total State Sector level due to grants to councils and householders to fund natural disaster recovery, as well as grants for health and community purposes.
Operating Result
The operating result is the surplus or deficit for the year under the Accounting Standards framework. Valuation and other adjustments such as deferred tax and privatisation dividends are shown as other economic flows and are included in the operating result.
The GGS operating result for the 2010-11 year was a deficit of $1.399 billion (2009-10, $808 million deficit). Other economic flows included in the operating result were $117 million in 2010-11 compared to negative $936 million for 2009-10. The flows for 2010-11 largely arose from the reversal of deferred tax balances following asset sales, offset by dividends treated as capital returns of $1.396 billion, mainly as a result of the asset sales program.
The Total State Sector operating result was a deficit of $1.671 billion (2009-10, $3.177 billion deficit).
Discontinued Operations
As part of its asset sales program, the State finalised the disposal of its forestry plantations business; floated its interest in QR National via an Initial Public Offering (IPO) in November 2010; sold the business of Port of Brisbane and entered into a 99 year lease on the port; and sold its interest in Queensland Motorways Limited. These businesses have been separately disclosed as discontinued operations in these financial statements. The sale of Abbot Point Coal Terminal has not been treated as a discontinuing operation.
| | |
| Report on State Finances 2010–11 – Government of Queensland | | 5-03 |
AASB 1049 - Overview and Analysis
Assets
Assets controlled by the GGS at 30 June 2011 totalled $234.313 billion (2009-10, $228.072 billion).
Financial assets in the GGS increased by $4.383 billion, due mainly to the transfer of the shares in Queensland Motorways Limited to investments set aside to cover future superannuation liabilities. Within financial asset categories, former defined benefit investments were transferred to QSuper during the year, resulting in a matching increase in the Long Term Note with QTC (Loans paid).
Non-financial assets in the GGS increased by $1.858 billion, mainly in relation to property, plant and equipment ($2.730 billion). The capital purchases for the year were partially offset by revaluation decrements of $2.345 billion mainly as a result of natural disasters.
Assets controlled by the State at 30 June 2011 totalled $292.449 billion (2010, $290.192 billion).
Financial assets of the State increased by $12.106 billion, as QTC increased its forward borrowings and on-lending to local government; QML was purchased by QIC, and the above average earnings on the QIC trust were reinvested. In addition, the State’s investment in QR National shares was $2.8 billion at 30 June 2011.
Property, plant and equipment reduced following revaluation decrements and the asset sales program.
The main types of assets owned by the State are detailed in the following chart:
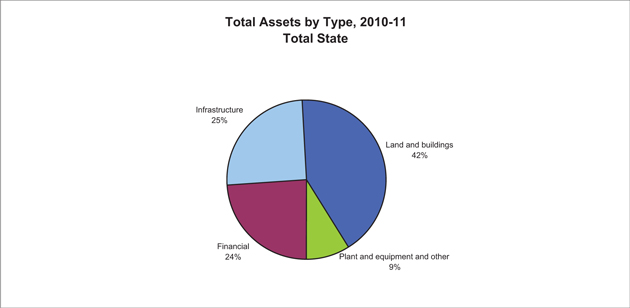
Of the Total State Sector assets, GGS assets comprise 80%, made up of:
| | | | |
| | | $M | |
Financial | | | 57,358 | |
Infrastructure | | | 37,490 | |
Land and buildings | | | 118,613 | |
Plant and equipment and other | | | 20,852 | |
| | |
| 5-04 | | Report on State Finances 2010–11 – Government of Queensland |
AASB 1049 - Overview and Analysis
Liabilities
Liabilities of the Queensland Government at 30 June 2011 totalled $63.091 billion for the GGS and $121.227 billion for the Total State Sector. This was an increase of $10.607 billion over 2009-10 for the GGS and $6.623 billion for the State.
The increase in liabilities for the GGS is largely due to:
| | • | | an increase in interest bearing liabilities ($9.155 billion) reflecting increased borrowing by the GGS to fund major capital projects; the transfer of the $3.088 billion investment in QML to the QIC trusts; the transfer in of borrowings of Abbot Point Coal Terminal; and |
| | • | | employee benefit obligations such as superannuation and long service leave liabilities increasing by $997 million. |
The increase in liabilities for the State is largely due to:
| | • | | Government issued securities, mainly to finance capital acquisitions by the Non-financial Public Sector increased by $4.392 billion; |
| | • | | employee benefit obligations such as superannuation and long service leave liabilities increasing by $921 million. |
The components of State liabilities are shown in the following chart:
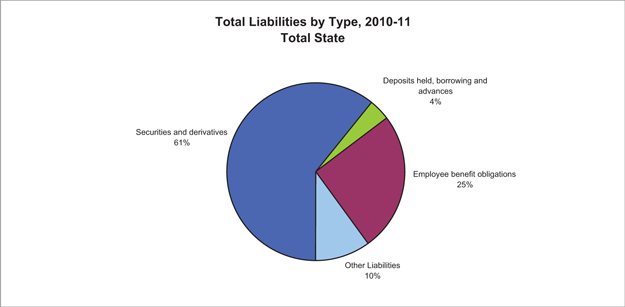
Of the Total State Sector liabilities, GGS liabilities comprise 52%, made up of:
| | | | |
| | | $M | |
Deposits held, borrowing and advances | | | 25,534 | |
Employee benefit obligations | | | 29,860 | |
Other liabilities | | | 7,697 | |
Cash Flow Statement
The GGS recorded net cash flows from operating activities of $2.105 billion and borrowings and advances of $8.999 billion to fund capital purchases of $8.237 billion. Proceeds of asset sales of $8.351 billion were used to repay borrowings and invest in superannuation investments.
The Total State Sector recorded net cash flows from operating activities for the 2010-11 financial year of $2.005 billion. Capital purchases of $13.423 billion were funded by these operating cash flows as well as new borrowings. Asset sales proceeds of $10.605 billion were used to repay debt and invest in superannuation assets.
| | |
| Report on State Finances 2010–11 – Government of Queensland | | 5-05 |

2010-11
Audited Information
Audited Information
Queensland General Government and
Whole of Government Consolidated
Financial Statements
30 June 2011
Queensland
Government
Operating Statement for Queensland
for the Year Ended 30 June 2011
| | | | | | | | | | | | | | | | | | | | | | |
| | | | | | | | General Government Sector | | | Total State Sector | |
| | | | | | | | 2011 | | | 2010 | | | 2011 | | | 2010 | |
| | | | | Notes | | | $M | | | $M | | | $M | | | $M | |
| | | | | | |
| | Continuing Operations Revenue from Transactions | | | | | | | | | | | | | | | | | | | | |
| | Taxation revenue | | | 3 | | | | 9,975 | | | | 9,375 | | | | 9,630 | | | | 9,101 | |
| | Grants revenue | | | 4 | | | | 20,272 | | | | 20,205 | | | | 20,474 | | | | 20,352 | |
| | Sales of goods and services | | | 5 | | | | 4,172 | | | | 3,961 | | | | 11,476 | | | | 10,303 | |
| | Interest income | | | 6 | | | | 2,365 | | | | 2,204 | | | | 2,013 | | | | 1,919 | |
| | Dividend and income tax equivalents income | | | 7 | | | | 1,232 | | | | 949 | | | | 4 | | | | — | |
| | Other revenue | | | 8 | | | | 3,941 | | | | 3,033 | | | | 4,228 | | | | 3,452 | |
| | Continuing Operations Total Revenue from Transactions | | | | | | | 41,957 | | | | 39,727 | | | | 47,825 | | | | 45,127 | |
| | | | | | |
Less | | Continuing Operations Expenses from Transactions | | | | | | | | | | | | | | | | | | | | |
| | Employee expenses | | | 9 | | | | 16,820 | | | | 15,566 | | | | 18,222 | | | | 16,660 | |
| | Superannuation expenses | | | | | | | | | | | | | | | | | | | | |
| | Superannuation interest cost | | | 10 | | | | 1,240 | | | | 1,320 | | | | 1,225 | | | | 1,312 | |
| | Other superannuation expenses | | | 10 | | | | 2,171 | | | | 2,051 | | | | 2,408 | | | | 2,240 | |
| | Other operating expenses | | | 11 | | | | 8,646 | | | | 7,569 | | | | 12,779 | | | | 11,224 | |
| | Depreciation and amortisation | | | 12 | | | | 2,506 | | | | 2,501 | | | | 4,559 | | | | 4,308 | |
| | Other interest expense | | | 13 | | | | 1,125 | | | | 803 | | | | 4,035 | | | | 3,625 | |
| | Grants expenses | | | 14 | | | | 10,964 | | | | 9,790 | | | | 8,796 | | | | 7,812 | |
| | Continuing Operations Total Expenses from Transactions | | | | | | | 43,473 | | | | 39,599 | | | | 52,024 | | | | 47,182 | |
| | | | | | |
Equals | | Net Operating Balance from Continuing Operations | | | | | | | (1,516 | ) | | | 128 | | | | (4,199 | ) | | | (2,055 | ) |
Add | | Net Operating Balance from Discontinued Operations | | | 59 | | | | — | | | | — | | | | 424 | | | | (3 | ) |
Equals | | Net Operating Balance | | | | | | | (1,516 | ) | | | 128 | | | | (3,775 | ) | | | (2,058 | ) |
| | | | | | |
| | Continuing Operations Other Economic Flows - Included in Operating Result | | | | | | | | | | | | | | | | | | | | |
| | Gain on sale of assets and investments | | | 15 | | | | 166 | | | | — | | | | 569 | | | | 8 | |
| | Revaluation increments and impairment loss reversals | | | 16 | | | | 46 | | | | 27 | | | | 1,892 | | | | 551 | |
| | Loss on sale of assets and investments | | | 17 | | | | (36 | ) | | | (13 | ) | | | (737 | ) | | | (926 | ) |
| | Asset write-down, revaluation decrements and impairment loss | | | 18 | | | | (383 | ) | | | (436 | ) | | | (2,566 | ) | | | (1,137 | ) |
| | Actuarial adjustments to liabilities | | | 19 | | | | 65 | | | | (56 | ) | | | 56 | | | | (79 | ) |
| | Deferred income tax equivalents | | | | | | | (1,142 | ) | | | (139 | ) | | | — | | | | — | |
| | Dividends and tax equivalents treated as capital returns | | | 20 | | | | 1,396 | | | | — | | | | — | | | | — | |
| | Other | | | 21 | | | | 5 | | | | (320 | ) | | | 2,945 | | | | 2,306 | |
| | | | | | |
Equals | | Continuing Operations Other Economic Flows Included in Operating Result | | | | | | | 117 | | | | (937 | ) | | | 2,159 | | | | 722 | |
Add | | Discontinued Operations Other Economic Flows Included in Operating Result | | | 22 | | | | — | | | | — | | | | (55 | ) | | | (1,841 | ) |
| | | | | | |
Equals | | Total Other Economic Flows Included in Operating Result | | | | | | | 117 | | | | (937 | ) | | | 2,104 | | | | (1,120 | ) |
| | | | | | |
| | Operating Result from Continuing Operations | | | | | | | (1,399 | ) | | | (809 | ) | | | (2,040 | ) | | | (1,333 | ) |
Add | | Operating Result from Discontinued Operations | | | 59 | | | | — | | | | — | | | | 369 | | | | (1,844 | ) |
Equals | | Operating Result | | | | | | | (1,399 | ) | | | (809 | ) | | | (1,671 | ) | | | (3,177 | ) |
| | | | | | |
| | Other Economic Flows - Other Movements in Equity | | | | | | | | | | | | | | | | | | | | |
| | Adjustments to opening balances | | | | | | | — | | | | 66 | | | | — | | | | 76 | |
| | Revaluations | | | 23 | | | | (2,939 | ) | | | (7,867 | ) | | | (3,235 | ) | | | (5,587 | ) |
| | Other | | | 24 | | | | (28 | ) | | | (79 | ) | | | 541 | | | | (1 | ) |
| | Total Other Economic Flows | | | | | | | | | | | | | | | | | | | | |
| | Other Movements in Equity | | | | | | | (2,966 | ) | | | (7,880 | ) | | | (2,695 | ) | | | (5,511 | ) |
| | | | | | |
| | Comprehensive Result | | | | | | | (4,365 | ) | | | (8,689 | ) | | | (4,365 | ) | | | (8,689 | ) |
| | | | | | |
| | Transactions With Owners In Their Capacity as Owners | | | | | | | | | | | | | | | | | | | | |
| | Equity injections/(withdrawals) | | | | | | | — | | | | — | | | | — | | | | — | |
| | Total Transactions With Owners In Their Capacity as Owners | | | | | | | — | | | | — | | | | — | | | | — | |
| | | | | | |
| | Total Change In Net Worth | | | | | | | (4,365 | ) | | | (8,689 | ) | | | (4,365 | ) | | | (8,689 | ) |
| | |
| Audited Consolidated Financial Statements 2010–11 – Government of Queensland | | 6-01 |
Operating Statement for Queensland
for the Year Ended 30 June 2011
continued
| | | | | | | | | | | | | | | | | | | | | | |
| | | | | | | | | General Government
Sector | | | Total State Sector | |
| | | | | | | | | 2011 | | | 2010 | | | 2011 | | | 2010 | |
| | | | | | | Notes | | $M | | | $M | | | $M | | | $M | |
| | KEY FISCAL AGGREGATES | | | | | | | | | | | | | | | | |
| | | | | |
| | Net Operating Balance | | | (1,516 | ) | | | 128 | | | | (3,775 | ) | | | (2,058 | ) |
| | | | | |
Less | | Net Acquisition/(Disposal) of Non-Financial Assets | | | | | | | | | | | | | | | | |
| | Purchases of non-financial assets | | | | | 8,237 | | | | 8,959 | | | | 13,423 | | | | 15,097 | |
| | Less | | Sales of non-financial assets | | | | | 252 | | | | 218 | | | | 659 | | | | 373 | |
| | Less | | Depreciation | | | | | 2,506 | | | | 2,501 | | | | 4,677 | | | | 4,995 | |
| | Plus | | Change in inventories | | | | | 80 | | | | 78 | | | | 37 | | | | (252 | ) |
| | Plus | | Other movement in non-financial assets | | | | | 15 | | | | 348 | | | | 54 | | | | 374 | |
| | Equals | | Total Net Acquisition/(Disposal) of Non-Financial Assets | | | 5,573 | | | | 6,665 | | | | 8,177 | | | | 9,851 | |
| | | | | | | |
| | Equals | | Net Lending/(Borrowing) | | | | | (7,089 | ) | | | (6,537 | ) | | | (11,952 | ) | | | (11,909 | ) |
This Operating Statement should be read in conjunction with the accompanying notes. Note 2 provides disaggregated information in relation to the above components.
| | |
| 6-02 | | Audited Consolidated Financial Statements 2010–11 – Government of Queensland |
Balance Sheet for Queensland
as at 30 June 2011
| | | | | | | | | | | | | | | | | | |
| | | | | General Government
Sector | | | Total State Sector | |
| | | | | 2011 | | | 2010 | | | 2011 | | | 2010 | |
| | | Notes | | $M | | | $M | | | $M | | | $M | |
Assets | | | | | | | | | | | | | | | | | | |
Financial Assets | | | | | | | | | | | | | | | | | | |
Cash and deposits | | 25 | | | 635 | | | | 904 | | | | 1,359 | | | | 1,311 | |
Receivables and loans | | | | | | | | | | | | | | | | | | |
Receivables | | 26 | | | 4,493 | | | | 3,478 | | | | 5,148 | | | | 3,947 | |
Advances paid | | 26 | | | 594 | | | | 582 | | | | 865 | | | | 879 | |
Loans paid | | 26 | | | 31,233 | | | | 23,350 | | | | 5,888 | | | | 4,784 | |
Securities other than shares | | 27 | | | 2,118 | | | | 4,896 | | | | 53,227 | | | | 46,359 | |
Shares and other equity investments | | | | | | | | | | | | | | | | | | |
Investments in public sector entities | | 28 | | | 18,168 | | | | 19,710 | | | | — | | | | — | |
Investments in other entities | | 28 | | | 5 | | | | 3 | | | | 2,818 | | | | 21 | |
Investments accounted for using equity method | | 28 | | | 112 | | | | 51 | | | | 210 | | | | 108 | |
Total Financial Assets | | | | | 57,358 | | | | 52,975 | | | | 69,515 | | | | 57,409 | |
| | | | | |
Non-Financial Assets | | | | | | | | | | | | | | | | | | |
Inventories | | 31 | | | 678 | | | | 599 | | | | 1,199 | | | | 1,118 | |
Assets held for sale | | 32 | | | 198 | | | | 129 | | | | 371 | | | | 7,501 | |
Investment properties | | 33 | | | 251 | | | | 254 | | | | 1,521 | | | | 1,810 | |
Biological assets | | 34 | | | 9 | | | | 10 | | | | 10 | | | | 10 | |
Property, plant and equipment | | 37 | | | 169,160 | | | | 166,430 | | | | 218,196 | | | | 220,559 | |
Intangibles | | 38 | | | 872 | | | | 856 | | | | 1,135 | | | | 1,212 | |
Deferred tax asset | | | | | 5,504 | | | | 6,495 | | | | — | | | | — | |
Other non-financial assets | | 35 | | | 283 | | | | 324 | | | | 501 | | | | 573 | |
Total Non-Financial Assets | | | | | 176,955 | | | | 175,097 | | | | 222,934 | | | | 232,783 | |
| | | | | |
Total Assets | | | | | 234,313 | | | | 228,072 | | | | 292,449 | | | | 290,192 | |
| | | | | |
Liabilities | | | | | | | | | | | | | | | | | | |
Payables | | 39 | | | 3,918 | | | | 3,712 | | | | 4,853 | | | | 4,778 | |
Employee benefit obligations | | | | | | | | | | | | | | | | | | |
Superannuation liability | | 40 | | | 25,236 | | | | 24,687 | | | | 25,159 | | | | 24,782 | |
Other employee benefits | | 40 | | | 4,624 | | | | 4,176 | | | | 5,356 | | | | 4,812 | |
Deposits held | | 41 | | | 1 | | | | — | | | | 3,557 | | | | 3,170 | |
Borrowings and advances | | | | | | | | | | | | | | | | | | |
Advances received | | 42 | | | 444 | | | | 463 | | | | 444 | | | | 463 | |
Borrowings | | 42 | | | 25,089 | | | | 15,916 | | | | 872 | | | | 736 | |
Securities and derivatives | | 43 | | | — | | | | — | | | | 73,592 | | | | 69,200 | |
Deferred tax liability | | | | | 1,787 | | | | 1,822 | | | | — | | | | — | |
Provisions | | 45 | | | 1,279 | | | | 1,141 | | | | 5,040 | | | | 4,503 | |
Other liabilities | | 46 | | | 713 | | | | 567 | | | | 2,352 | | | | 2,161 | |
Total Liabilities | | | | | 63,091 | | | | 52,484 | | | | 121,227 | | | | 114,604 | |
| | | | | |
Net Assets | | | | | 171,222 | | | | 175,588 | | | | 171,222 | | | | 175,588 | |
| | | | | |
Net Worth | | | | | | | | | | | | | | | | | | |
Accumulated surplus/(deficit) | | | | | 88,666 | | | | 89,369 | | | | 86,309 | | | | 84,864 | |
Reserves | | | | | 82,556 | | | | 86,219 | | | | 84,913 | | | | 90,724 | |
Total Net Worth | | | | | 171,222 | | | | 175,588 | | | | 171,222 | | | | 175,588 | |
| | | | | | | | | | | | | | | | | | |
| | | | | |
KEY FISCAL AGGREGATES | | | | | | | | | | | | | | | | | | |
Net Financial Worth | | | | | (5,733 | ) | | | 491 | | | | (51,712 | ) | | | (57,195 | ) |
Net Financial Liabilities | | | | | 23,900 | | | | 19,218 | | | | 51,712 | | | | 57,195 | |
Net Debt | | | | | (9,047 | ) | | | (13,354 | ) | | | 17,126 | | | | 20,235 | |
This Balance Sheet should be read in conjunction with the accompanying notes. Note 2 provides disaggregated information in relation to the components of the net assets.
| | |
| Audited Consolidated Financial Statements 2010–11 – Government of Queensland | | 6-03 |
Statement of Changes in Net Assets (Equity) for Queensland General Government Sector
for the year ended 30 June 2011
| | | | | | | | | | | | | | | | | | | | | | | | |
| | | | | | | | | Comprehensive Result for Period | | | | |
| | | Opening Balance | | | Adjustments to Opening Balances | | | Movements | | | Transfers / Entity
Cessation 1 | | | Actuarial Gain / Loss
on Superannuation 2 | | | Closing Balance | |
| | | $M | | | $M | | | $M | | | $M | | | $M | | | $M | |
2011 | | | | | | | | | | | | | | | | | | | | | | | | |
Accumulated surplus | | | 89,369 | | | | — | | | | (1,399 | ) | | | 14 | | | | 682 | | | | 88,666 | |
Revaluation reserve - financial assets | | | 10,255 | | | | — | | | | (1,464 | ) | | | — | | | | — | | | | 8,791 | |
Revaluation reserve - non-financial assets | | | 75,830 | | | | — | | | | (2,157 | ) | | | (30 | ) | | | — | | | | 73,643 | |
Other reserves | | | 134 | | | | — | | | | — | | | | (12 | ) | | | — | | | | 122 | |
| | | | | | | | | | | | | | | | | | | | | | | | |
Total equity at the end of the financial year | | | 175,588 | | | | — | | | | (5,020 | ) | | | (28 | ) | | | 682 | | | | 171,222 | |
| | | | | | | | | | | | | | | | | | | | | | | | |
| | | | |
| | | | | | | | | Comprehensive Result for Period 6 | | | | |
| | | Opening Balance | | | Adjustments to
Opening Balances 6 | | | Movements | | | Transfers / Entity
Cessation | | | Actuarial Gain / Loss
on Superannuation | | | Closing Balance | |
| | | $M | | | $M | | | $M | | | $M | | | $M | | | $M | |
2010 | | | | | | | | | | | | | | | | | | | | | | | | |
Accumulated surplus 3 | | | 89,952 | | | | 66 | | | | (809 | ) | | | 90 | | | | 70 | | | | 89,369 | |
Revaluation reserve - financial assets 4 | | | 14,048 | | | | — | | | | (3,715 | ) | | | (78 | ) | | | — | | | | 10,255 | |
Revaluation reserve - non-financial assets 5 | | | 80,144 | | | | — | | | | (4,222 | ) | | | (92 | ) | | | — | | | | 75,830 | |
Other reserves | | | 133 | | | | — | | | | — | | | | 1 | | | | — | | | | 134 | |
| | | | | | | | | | | | | | | | | | | | | | | | |
Total equity at the end of the financial year | | | 184,277 | | | | 66 | | | | (8,746 | ) | | | (79 | ) | | | 70 | | | | 175,588 | |
| | | | | | | | | | | | | | | | | | | | | | | | |
| 1 | Mainly relates to the transfer of Queensland Treasury Holdings from the General Government sector to the Public Financial Corporations Sector. |
| 2 | The 2010-11 actuarial adjustment includes an adjustment for the QSuper Fund as well as the tax effect of the adjustment to the Energy Fund. |
| 3 | The opening accumulated surplus has been adjusted by $66 million. This adjustment consists of $62 million by the Department of Local Government and Planning in relation to the previously unrecognised Northern Peninsula Area Water Supply System asset and various infrastructure assets constructed on behalf of indigenous local councils. The movement in accumulated surplus for the period includes an increase of $176 million to capitalise Department of Transport and Main Roads repairs to infrastructure following natural disasters rather than expensing. |
| 4 | The movement in the revaluation reserve for financial assets includes a prior year adjustment for an increase in the net worth of QR Limited of $258 million. |
| 5 | The movement in the non-financial assets revaluation reserve includes a prior year adjustment decrease of $588 million by the Department of Education and Training to correct indexation decrements in relation to buildings. |
| 6 | Adjustments to opening balances are included as part of the comprehensive result on the face of the Operating Statement as they represent changes to the comprehensive result in prior periods. |
This Statement of Changes in Net Assets (Equity) should be read in conjunction with the accompanying notes.
| | |
| 6-04 | | Audited Consolidated Financial Statements 2010–11 – Government of Queensland |
Statement of Changes in Net Assets (Equity) for Queensland Total State Sector
for the year ended 30 June 2011
| | | | | | | | | | | | | | | | | | | | | | | | |
| | | | | | | | | Comprehensive Result for Period | | | | |
| | | Opening
Balance | | | Adjustments
to Opening
Balances | | | Movements | | | Transfers / Entity
Cessation 1 | | | Actuarial Gain /
Loss on
Superannuation | | | Closing
Balance | |
| | | $M | | | $M | | | $M | | | $M | | | $M | | | $M | |
2011 | | | | | | | | | | | | | | | | | | | | | | | | |
Accumulated surplus | | | 84,864 | | | | — | | | | (1,671 | ) | | | 2,344 | | | | 772 | | | | 86,309 | |
Revaluation reserve - financial assets | | | 2,389 | | | | — | | | | (1,021 | ) | | | 6 | | | | — | | | | 1,374 | |
Revaluation reserve - non-financial assets | | | 88,005 | | | | — | | | | (2,986 | ) | | | (1,779 | ) | | | — | | | | 83,240 | |
Other reserves | | | 330 | | | | — | | | | — | | | | (31 | ) | | | — | | | | 299 | |
| | | | | | | | | | | | | | | | | | | | | | | | |
| | | | | | |
Total equity at the end of the financial year | | | 175,588 | | | | — | | | | (5,678 | ) | | | 540 | | | | 772 | | | | 171,222 | |
| | | | | | | | | | | | | | | | | | | | | | | | |
| | | | | | | | | | | | | | | | | | | | | | | | |
| | | | | | | | | Comprehensive Result for Period 4 | | | | |
| | | Opening
Balance | | | Adjustments
to Opening
Balances 4 | | | Movements | | | Transfers
/ Entity
Cessation | | | Actuarial Gain /
Loss on
Superannuation | | | Closing
Balance | |
| | | $M | | | $M | | | $M | | | $M | | | $M | | | $M | |
2010 | | | | | | | | | | | | | | | | | | | | | | | | |
Accumulated surplus 2 | | | 87,497 | | | | 76 | | | | (3,177 | ) | | | 401 | | | | 67 | | | | 84,864 | |
Revaluation reserve - financial assets | | | 2,224 | | | | — | | | | 258 | | | | (93 | ) | | | — | | | | 2,389 | |
Revaluation reserve - non-financial assets 3 | | | 94,074 | | | | — | | | | (5,911 | ) | | | (158 | ) | | | — | | | | 88,005 | |
Other reserves | | | 481 | | | | — | | | | — | | | | (151 | ) | | | — | | | | 330 | |
| | | | | | | | | | | | | | | | | | | | | | | | |
| | | | | | |
Total equity at the end of the financial year | | | 184,277 | | | | 76 | | | | (8,830 | ) | | | (1 | ) | | | 67 | | | | 175,588 | |
| | | | | | | | | | | | | | | | | | | | | | | | |
| 1 | Mainly relates to the deconsolidation of QR Limited, Queensland Motorways Limited and Forestry Plantations Queensland and an equity adjustment to Port of Brisbane following the sale of the business. |
| 2 | The opening accumulated surplus has been adjusted by $76 million. This adjustment consists of an increase of $62 million by the Department of Local Government and Planning in relation to the previously unrecognised Northern Peninsula Area Water Supply System asset and various infrastructure assets constructed on behalf of indigenous local councils. The movement in accumulated surplus for the period includes an increase of $176 million to capitalise Department of Transport and Main Roads repairs to infrastructure following natural disasters rather than expensing. |
| 3 | The movement in the non-financial assets revaluation reserve includes a decrease of $588 million by the Department of Education and Training to correct indexation decrements in relation to buildings offset by an increase of $271 million by QR Limited correcting the write down to fair value of its assets prior to sale. |
| 4 | Adjustments to opening balances are included as part of the comprehensive result on the face of the Operating Statement as they represent changes to the comprehensive result in prior periods. |
This Statement of Changes in Net Assets (Equity) should be read in conjunction with the accompanying notes.
| | |
| Audited Consolidated Financial Statements 2010–11 – Government of Queensland | | 6-05 |
Cash Flow Statement for Queensland
for the Year Ended 30 June 2011
| | | | | | | | | | | | | | | | | | | | |
| | | | | | General Government
Sector | | | Total State Sector | |
| | | | | | 2011 | | | 2010 | | | 2011 | | | 2010 | |
| | | Notes | | | $M | | | $M | | | $M | | | $M | |
Cash Flows from Operating Activities | | | | | | | | | | | | | | | | | | | | |
Cash received | | | | | | | | | | | | | | | | | | | | |
Taxes received | | | | | | | 9,900 | | | | 9,311 | | | | 9,586 | | | | 9,017 | |
Grants and subsidies received | | | | | | | 20,278 | | | | 20,078 | | | | 20,475 | | | | 20,218 | |
Sales of goods and services | | | | | | | 4,429 | | | | 4,410 | | | | 14,632 | | | | 15,078 | |
Interest receipts | | | | | | | 2,276 | | | | 2,159 | | | | 1,912 | | | | 2,094 | |
Dividends and income tax equivalents | | | | | | | 1,096 | | | | 1,102 | | | | 4 | | | | 1 | |
Other receipts | | | | | | | 5,361 | | | | 4,325 | | | | 6,718 | | | | 5,096 | |
| | | | | | | 43,340 | | | | 41,385 | | | | 53,327 | | | | 51,503 | |
Cash paid | | | | | | | | | | | | | | | | | | | | |
Payments for employees | | | | | | | (18,571 | ) | | | (17,684 | ) | | | (20,669 | ) | | | (20,019 | ) |
Payments for goods and services | | | | | | | (10,531 | ) | | | (9,160 | ) | | | (15,187 | ) | | | (13,048 | ) |
Grants and subsidies | | | | | | | (10,223 | ) | | | (9,614 | ) | | | (8,302 | ) | | | (7,686 | ) |
Interest paid | | | | | | | (1,118 | ) | | | (803 | ) | | | (3,882 | ) | | | (3,545 | ) |
Other payments | | | | | | | (793 | ) | | | (725 | ) | | | (3,281 | ) | | | (2,861 | ) |
| | | | | | | (41,235 | ) | | | (37,986 | ) | | | (51,322 | ) | | | (47,159 | ) |
Net Cash Flows from Operating Activities | | | 47 | | | | 2,105 | | | | 3,399 | | | | 2,005 | | | | 4,344 | |
Cash Flows from Investing Activities | | | | | | | | | | | | | | | | | | | | |
Non-Financial Assets | | | | | | | | | | | | | | | | | | | | |
Purchases of non-financial assets | | | | | | | (8,237 | ) | | | (8,959 | ) | | | (13,423 | ) | | | (15,097 | ) |
Sales of non-financial assets | | | | | | | 252 | | | | 218 | | | | 659 | | | | 373 | |
| | | | | | | (7,985 | ) | | | (8,741 | ) | | | (12,764 | ) | | | (14,724 | ) |
Financial Assets (Policy Purposes) | | | | | | | | | | | | | | | | | | | | |
Equity acquisitions | | | | | | | (510 | ) | | | (1,108 | ) | | | 1 | | | | (19 | ) |
Equity disposals | | | | | | | 8,351 | | | | 890 | | | | 10,605 | | | | 570 | |
| | | | | | | 7,841 | | | | (217 | ) | | | 10,606 | | | | 551 | |
Financial Assets (Liquidity Purposes) | | | | | | | | | | | | | | | | | | | | |
Sales of investments | | | | | | | 1,979 | | | | 1,754 | | | | 65,197 | | | | 64,938 | |
Purchases of investments | | | | | | | (6,935 | ) | | | (3,286 | ) | | | (69,340 | ) | | | (55,794 | ) |
| | | | | | | (4,956 | ) | | | (1,532 | ) | | | (4,143 | ) | | | 9,144 | |
Net Cash Flows from Investing Activities | | | | | | | (5,099 | ) | | | (10,490 | ) | | | (6,301 | ) | | | (5,029 | ) |
Cash Flows from Financing Activities | | | | | | | | | | | | | | | | | | | | |
Cash received | | | | | | | | | | | | | | | | | | | | |
Advances received | | | | | | | 12 | | | | 2 | | | | 12 | | | | 2 | |
Proceeds of borrowing | | | | | | | 8,999 | | | | 5,611 | | | | 1,860 | | | | 527 | |
Deposits received | | | | | | | — | | | | 1 | | | | 702 | | | | 702 | |
Other financing (including interest bearing liabilities) | | | | | | | — | | | | — | | | | 67,467 | | | | 52,041 | |
| | | | | | | 9,011 | | | | 5,614 | | | | 70,040 | | | | 53,272 | |
Cash paid | | | | | | | | | | | | | | | | | | | | |
Advances paid | | | | | | | (31 | ) | | | (23 | ) | | | (31 | ) | | | (23 | ) |
Borrowing repaid | | | | | | | (7,688 | ) | | | (439 | ) | | | (2,327 | ) | | | (3,424 | ) |
Deposits withdrawn | | | | | | | (1 | ) | | | (1 | ) | | | (191 | ) | | | (1,684 | ) |
Other financing | | | | | | | — | | | | — | | | | (63,149 | ) | | | (47,198 | ) |
| | | | | | | (7,720 | ) | | | (463 | ) | | | (65,697 | ) | | | (52,328 | ) |
Net Cash Flows from Financing Activities | | | | | | | 1,291 | | | | 5,151 | | | | 4,343 | | | | 944 | |
Net increase/(decreased) in Cash and Deposits Held | | | | | | | (1,704 | ) | | | (1,940 | ) | | | 47 | | | | 260 | |
Cash and deposits at the beginning of the financial year | | | | | | | 904 | | | | 2,844 | | | | 1,311 | | | | 1,051 | |
Cash and Cash Equivalents Held at the End of the Financial Year | | | 25 | | | | (799 | ) | | | 904 | | | | 1,359 | | | | 1,311 | |
| | | | | | | | | | | | | | | | | | | | |
KEY FISCAL AGGREGATES | | | | | | | | | | | | | | | | | | | | |
Net Cash from Operating Activities | | | | | | | 2,105 | | | | 3,399 | | | | 2,005 | | | | 4,344 | |
Net Cash Flow from Investments in Non-Financial Assets | | | | | | | (7,985 | ) | | | (8,741 | ) | | | (12,764 | ) | | | (14,724 | ) |
CASH SURPLUS/(DEFICIT) | | | | | | | (5,880 | ) | | | (5,341 | ) | | | (10,759 | ) | | | (10,380 | ) |
| | | | | | | | | | | | | | | | | | | | |
Derivation of ABS GFS Cash Surplus/Deficit | | | | | | | | | | | | | | | | | | | | |
Cash surplus/(deficit) | | | | | | | (5,880 | ) | | | (5,341 | ) | | | (10,759 | ) | | | (10,380 | ) |
Acquisitions under finance leases and similar arrangements | | | | | | | (76 | ) | | | (61 | ) | | | (80 | ) | | | (61 | ) |
ABS GFS Cash Surplus/(Deficit) Including Finance Leases and Similar Arrangements | | | | | | | (5,956 | ) | | | (5,402 | ) | | | (10,839 | ) | | | (10,441 | ) |
| | |
| 6-06 | | Audited Consolidated Financial Statements 2010–11 – Government of Queensland |
Notes to the Financial Statements
| 1. | Significant Accounting Policies |
The following summary presents the significant accounting policies that have been adopted in preparing and presenting financial statements of the Queensland General Government Sector (GGS) and the consolidated Total State Sector.
The GGS is a component of the Total State Sector. The GGS is determined in accordance with the principles and rules contained in the Australian Bureau of Statistics’ Australian System of Government Finance Statistics: Concepts, Sources and Methods 2005 (ABS GFS Manual). According to the ABS GFS Manual, the GGS consists of all government units and non-profit institutions controlled and mainly financed by government. Government units are legal entities established by political processes that have legislative, judicial or executive authority over other units and which provide goods and services to the community or to individuals on a non-market basis and make transfer payments to redistribute income and wealth. Non-profit institutions are created for the purpose of producing or distributing goods and services but are not a source of income, profit or other financial gain for the government.
Unless otherwise stated, references in this report to “the State” include both the GGS and Total State Sector.
This financial report has been prepared in accordance with the Financial Accountability Act 2009. In addition, the financial statements comply with AASB 1049 Whole of Government and General Government Sector Financial Reporting which requires compliance with all Australian Accounting Standards and Concepts, Interpretations and other authoritative pronouncements, except those identified below.
AASB 1049 harmonises GFS with Generally Accepted Accounting Principles (GAAP) to the extent that GFS does not conflict with GAAP. This requires the selection of options within the Australian Accounting Standards that harmonise with the ABS GFS Manual.
The purpose of this financial report is to provide users with information about the stewardship by the Government in relation to the GGS and Total State Sector and accountability for the resources entrusted to it, information about the financial position, performance and cash flows of the GGS and Total State Sector and information that facilitates assessments of the macro-economic impact of the Government.
The financial report of the Total State Sector is a general purpose financial report. The financial report of the GGS is included as two separate columns adjacent to the Total State financial information. GGS information is highlighted in gold.
The statements have been prepared on an accrual basis that recognises the financial effects of transactions and events when they occur.
New or revised accounting standards and interpretations applicable to the reporting entity which have been published and are not mandatory for 30 June 2011 reporting periods are set out below:
AASB 1: First-Time Adoption of Australian Accounting Standards
AASB 3: Business Combinations
AASB 4: Insurance Contracts
AASB 5: Non-current Assets Held for Sale and Discontinued Operations
AASB 7: Financial Instruments: Disclosures
AASB 9: Financial Instruments
AASB 101: Presentation of Financial Statements
AASB 107: Statement of Cash Flows
AASB 108: Accounting Policies, Changes in Accounting Estimates and Errors
AASB 110: Events after the Reporting Period
AASB 112: Income Taxes
AASB 118: Revenue
AASB 119: Employee Benefits
AASB 121: The Effect of Changes in Foreign Exchange Rates
AASB 132: Financial Instruments: Presentation
AASB 134: Interim Financial Reporting
AASB 137: Provisions, Contingent Liabilities and Contingent Assets
AASB 139: Financial Instruments: Recognition and Measurement
AASB 140: Investment Property
| | |
| Audited Consolidated Financial Statements 2010–11 – Government of Queensland | | 6-07 |
Notes to the Financial Statements
| 1. | Significant Accounting Policies continued |
| (a) | Basis of Accounting continued |
AASB 1023: General Insurance Contracts
AASB 1031: Materiality
AASB 1038: Life Insurance Contracts
AASB 1053: Application of Tiers of Australian Accounting Standards
AASB 1054: Australian Additional Disclosures
AASB 2010-2: Amendments to Australian Accounting Standards arising from Reduced Disclosure Requirements
[AASB 1, 2, 3, 5, 7, 8, 101, 102, 107, 108, 110, 111, 112, 116, 117, 119, 121, 123, 124, 127, 128, 131, 133, 134,
136, 137, 138, 140, 141, 1050 & 1052 and Interpretations 2, 4, 5, 15, 17, 127, 129, & 1052]
AASB 2010-6: Amendments to Australian Accounting Standards – Disclosures on Transfers of Financial Assets [AASB 1 & AASB 7]
AASB 2010-7: Amendments to Australian Accounting Standards arising from AASB 9 (December 2010) [AASB 1, 3, 4, 5, 7, 101, 102, 108, 112, 118, 120, 121, 127, 128, 131, 132, 136, 137, 139, 1023 & 1038 and Interpretations 2, 5, 10, 12, 19 & 127]
AASB 2010-8: Amendments to Australian Accounting Standards – Deferred Tax: Recovery of Underlying Assets [AASB 112]
AASB 2010-9: Amendments to Australian Accounting Standards – Severe Hyperinflation and Removal of Fixed Dates for First-time Adopters [AASB 1]
AASB 2011-1: Amendments to Australian Accounting Standards arising from the Trans-Tasman Convergence Project [AASB 1, AASB 5, AASB 101, AASB 107, AASB 108, AASB 121, AASB 128, AASB 132 & AASB 134 and Interpretations 2, 112 & 113]
AASB 2011-2: Amendments to Australian Accounting Standards arising from the Trans-Tasman Convergence Project – Reduced Disclosure Requirements [AASB 101 & AASB 1054]
AASB 2011-3: Amendments to Australian Accounting Standards – Orderly Adoption of Changes to the ABS GFS Manual and Related Amendments [AASB 1049]
Interpretation 2: Members’ Shares in Co-operative Entities and Similar Instruments
Interpretation 4: Determining whether an Arrangement contains a Lease
Interpretation 14: AASB 119 – The Limit on a Defined Benefit Asset, Minimum Funding Requirements and their Interaction
Interpretation 112: Consolidation – Special Purpose Entities
Interpretation 115: Operating Leases – Incentives
Interpretation 127: Evaluating the Substance of Transactions Involving the Legal Form of a Lease
Interpretation 132: Intangible Assets – Web Site Costs
Interpretation 1039: Substantive Enactment of Major Tax Bills in Australia
Interpretation 1052: Tax Consolidation Accounting
The State has not adopted these standards and interpretations early. Application of these standards will not materially affect any of the amounts recognised in the financial statements in future reporting periods. The following standards will impact the type of information disclosed.
2010-4 Further Amendments to Australian Accounting Standards arising from the Annual Improvements Project [AASB 1. AASB 7, AASB 101 & AASB 134 and Interpretation 13] has been fully compiled into individual standards, effective from reporting periods beginning on or after 1 January 2011. The State will need to make changes to its disclosures about credit risk on financial instruments. The State will no longer need to disclose amounts that best represent its maximum exposure to credit risk where the carrying amount of the instruments reflect this. If the State holds collateral or other credit enhancement, it will need to disclose the extent to which those arrangements financially mitigate the credit risk, by class of instrument. There will be no need for the State to disclose the carrying amount of financial assets for which the terms have been renegotiated, which would otherwise be past due or impaired. In addition, for those financial assets that are either past due but not impaired, or have been individually impaired, there will no longer be a need to separately disclose details about any associated collateral or other credit enhancements held by the State.
AASB 1053: Application of Tiers of Australian Accounting Standards and AASB 2010-2: Amendments to Australian Accounting Standards arising from Reduced Disclosure Requirements [AASB 1, 2, 3, 5, 7, 8, 101, 102, 107, 108, 110, 111, 112, 116, 117, 119, 121, 123, 124, 127, 128, 131, 133, 134, 136, 137, 138, 140, 141, 1050 & 1052 and Interpretations 2, 4, 5, 15, 17, 127, 129, & 1052] apply to reporting periods beginning on or after 1 July 2013.
| | |
| 6-08 | | Audited Consolidated Financial Statements 2010–11 – Government of Queensland |
Notes to the Financial Statements
| 1. | Significant Accounting Policies continued |
| (a) | Basis of Accounting continued |
AASB 1053 establishes a differential reporting framework for those entities that prepare general purpose financial statements. The differential reporting framework comprises two tiers of reporting requirements – Australian Accounting Standards (commonly referred to as tier 1 consisting of the full range of recognition, measurement, presentation and disclosure requirements), and Australian Accounting Standards – Reduced Disclosure Requirements (commonly referred to as tier 2). The only difference between tier 1 and tier 2 is that tier 2 requires fewer disclosures.
Pursuant to AASB 1053, the Australian Government and State, Territory and Local Governments shall apply tier 1 reporting requirements. The standard will therefore have no impact on the financial statements of the State.
| (b) | The Government Reporting Entity |
The Queensland Government economic entity (Total State) includes all State Government departments, other General Government entities, Public Non-financial Corporations, Public Financial Corporations and their controlled entities. Refer Note 55 for a full list of controlled entities included in each sector.
Under AASB 1049, the preparation of the GGS financial report does not require full application of AASB 127 Consolidated and Separate Financial Statements and AASB 139 Financial Instruments: Recognition and Measurement. The GGS includes the value of all material assets, liabilities, equities, revenue and expenses of entities controlled by the GGS of Queensland. Assets, liabilities, revenue, expenses and cash flows of government controlled entities that are in the Public Non-Financial Corporations Sector and the Public Financial Corporations Sector are not separately recognised in the GGS. Instead, the GGS recognises an asset, being the controlling equity investment in those entities and recognises an increment or decrement relating to changes in the carrying amount of that asset, measured in accordance with AASB 1049.
Where control of an entity is obtained during the financial year, its results are included in the Operating Statement from the date control commences. Where control of an entity ceases during a financial year, its results are included for that part of the year during which control existed.
Only those agencies considered material by virtue of the size of their financial transactions and/or resources managed are consolidated for the purposes of this report.
In the process of reporting the Government of Queensland as a single economic entity, all material inter-entity and intra-entity transactions and balances have been eliminated to the extent practicable.
The ABS GFS Manual provides the basis upon which GFS information contained in the financial report is prepared. In particular, notes disclosing key fiscal aggregates of net worth, net operating balance, total change in net worth, net lending/(borrowing) and cash surplus/(deficit) determined using the principles and rules in the ABS GFS Manual are included in the financial report, together with a reconciliation of those key fiscal aggregates to the corresponding key fiscal aggregates determined in accordance with AASB 1049.
Assets, liabilities, revenues and expenses that are attributed reliably to each sector of the Queensland Government economic entity are disclosed in Note 2. For disclosure purposes, transactions and balances between sectors have not been eliminated but those between entities within each sector have been eliminated. The financial impact of inter-sector transactions and balances is disclosed in Note 2, under the heading of Consolidation Adjustments.
A brief description of each broad sector of the Government’s activities, determined in accordance with the Government Financial Statistics Standards (Australian Bureau of Statistics), follows:
General Government Sector (GGS)
The primary function of General Government Sector agencies is to provide public services that:
| | • | | are non-trading in nature and that are for the collective benefit of the community; |
| | • | | are largely financed by way of taxes, fees and other compulsory charges; and |
| | • | | involve the transfer or redistribution of income. |
| | |
| Audited Consolidated Financial Statements 2010–11 – Government of Queensland | | 6-09 |
Notes to the Financial Statements
| 1. | Significant Accounting Policies continued |
Public Non-financial Corporations Sector (PNFC)
The primary function of enterprises in the Public Non-financial Corporations Sector is to provide goods and services that:
| | • | | are trading, non-regulatory or non-financial in nature; and |
| | • | | are financed by way of sales of goods and services to consumers. |
Public Financial Corporations Sector (PFC)
The Public Financial Corporations Sector comprises publicly owned institutions which provide financial services usually on a commercial basis.
Functions they perform may include:
| | • | | central bank functions; |
| | • | | accepting on-call, term or savings deposits; |
| | • | | investment fund management; |
| | • | | having the authority to incur liabilities and acquire financial assets in the market on their own account; or |
| | • | | providing insurance services. |
The reporting period of the GGS and Total State Sector is the year ended 30 June 2011.
The GGS financial report and Total State Sector consolidated financial report adopt the following valuation methodologies:
| | • | | superannuation, WorkCover, motor vehicle accident liabilities, Queensland Government Insurance Fund and the Queensland Government Long Service Leave Central Scheme provisions are based on actuarial valuations; |
| | • | | investments and other financial assets are recorded at fair value, except as outlined in note 1(ai); |
| | • | | borrowings and other financial liabilities are recorded at fair value, except as outlined in note 1(ai); |
| | • | | power purchase agreements are valued at fair value; |
| | • | | land, buildings, other infrastructure, major plant and equipment and heritage and cultural assets are valued at fair value. Other classes of assets are valued at cost which approximates fair value due to their short useful lives; and |
| | • | | inventories (other than those held for distribution) are valued at the lower of cost and net realisable value under AASB 102 Inventories. |
Historical cost accounting principles are otherwise employed.
Unless otherwise stated, the accounting policies adopted for the reporting period are consistent with those of the previous reporting period. In accordance with AASB 101 Presentation of Financial Statements and AASB 108 Accounting Policies, Changes in Accounting Estimates and Errors, changes to accounting policies are applied retrospectively unless specific transitional provisions apply.
| | |
| 6-10 | | Audited Consolidated Financial Statements 2010–11 – Government of Queensland |
Notes to the Financial Statements
| 1. | Significant Accounting Policies continued |
AASB 1049 Whole of Government and General Government Sector Financial Reporting requires the Operating Statement to include all items of income and expense recognised in a period. All amounts relating to an item included in the determination of comprehensive result (total change in net worth) are classified as transactions or other economic flows in a manner that is consistent with the ABS GFS Manual. Key technical terms from the ABS GFS Manual that are used in this financial report are outlined in Note 1(ap).
Transactions are interactions between two units by mutual agreement or an action within a unit that is analytically useful to treat as a transaction. Other economic flows are changes in the volume or value of an asset or liability that do not result from transactions (i.e. revaluations and other changes in the volume of assets).
Where application of accounting standards results in a variance to GFS, a reconciliation to GFS is provided in Note 28 and 56.
All amounts in these statements have been rounded to the nearest $1 million or where the amount is less than $500,000 to zero, unless otherwise indicated. Accordingly, numbers may not add due to rounding.
| (h) | Comparative Information |
Where applicable, comparatives have been restated, to be consistent with changes in the financial statements presentation for the current reporting period.
AASB 108 requires that material prior period errors be corrected retrospectively by either restating comparative amounts if the errors occurred in the prior year; or restating the opening balances of assets, liabilities and equity of the prior year where the error occurred before the prior year.
Business combinations are recognised in accordance with AASB 3 Business Combinations and accounted for using the purchase method, regardless of whether equity instruments or other assets and liabilities are acquired.
Cost is measured as the fair value of the assets given or liabilities incurred or assumed at the date of exchange plus costs directly attributable to the acquisition.
Identifiable assets acquired, liabilities and contingent liabilities assumed in a business combination are measured initially at their fair value at the acquisition date, irrespective of the extent of any minority interest. The excess of cost of acquisition over the fair value of the State’s share of the identifiable net assets acquired is recorded as goodwill. If the cost of acquisition is less than the State’s share of the fair value of the identifiable net assets of the subsidiary acquired, the difference is recognised directly in the Operating Statement, but only after a reassessment of the identification and measurement of the net assets acquired.
Commonwealth and other grants are recognised as revenue when the recipient entity obtains control over the grant, usually upon receipt. Where the grant is of a reciprocal nature, revenue is recognised as and when the obligation is fulfilled. When revenue has been received in advance for services or works still to be completed at balance date, this revenue is considered to be unearned and is reported in other liabilities. Refer Note 46.
| | |
| Audited Consolidated Financial Statements 2010–11 – Government of Queensland | | 6-11 |
Notes to the Financial Statements
| 1. | Significant Accounting Policies continued |
| (k) | Revenue Recognition continued |
Assets received at below fair value, including those received free of charge and that can be measured reliably are recognised at their fair value as revenue when control over the assets is obtained, normally either on receipt of the assets or on notification that the assets have been secured.
Contributions of services are recognised only if the services would have been purchased if they had not been donated and their fair value can be reliably measured. Where this is the case, an equal amount is recognised as a revenue and an expense.
Non-repayable customer contributions are recognised as revenue and as assets in accordance with Interpretation 18 Transfers of Assets from Customers.
To the extent practicable, revenues from the sale of goods and services (including gas and electricity), fines and regulatory fees are recognised when the transactions or events giving rise to the revenue occur.
Taxation revenue is recognised when the underlying transaction or event which gives rise to the right to collect the tax occurs and can be measured reliably, or where earlier, upon the time the taxpayer’s obligation to pay arises pursuant to the issue of an assessment. Taxation revenue also includes interest and penalties.
Taxation revenue from self assessed taxes such as payroll tax and certain duties is recognised when raised by the self assessor. Other tax revenues are recognised when assessment notices are issued.
Interest income includes investment income earned on financial assets during the financial year.
For the GGS, dividends from PNFC and PFC sector entities are recorded as revenue from transactions where the dividends are declared out of accumulated surpluses. Dividends paid out of reserves or from the sale of assets represent a return of Government’s initial equity investment under ABS GFS principles and are disclosed as other economic flows. Net profit/(loss) from associates and joint ventures (excluding dividend distributions) is included in other economic flows in the Operating Statement.
Dividends from the PNFC and PFC sectors are eliminated in the Total State Sector.
Other economic flows of a revenue nature included in the operating result incorporate gains on disposal of non-financial assets, deferred income tax equivalents (for the GGS) and changes in fair value of financial instruments measured at fair value (after excluding dividend distributions).
Net increments in the market values of biological assets are recognised as other economic flows.
| (l) | Other Interest Expense |
Interest and other finance charges are recognised as expenses in the period in which they are incurred.
The Government is exempt from Commonwealth taxation except for Fringe Benefits Tax and Goods and Services Tax (GST).
Revenues, expenses and assets are recognised net of GST, except where the amount of GST incurred is not recoverable from the Australian Taxation Office (ATO). In these circumstances the GST is recognised as part of the acquisition cost of the asset or as part of the item of expense.
Receivables and payables include GST. The amounts of GST receivable from, or payable to, the ATO are included as a current asset or liability in the Balance Sheet.
Cash flows are included in the Cash Flow Statement on a gross basis. The GST components of cash flows arising from investing and financing activities which are recoverable from, or payable to, the ATO are classified as operating cash flows.
Cash and deposits includes cash on hand, cash at bank and deposits at call which are readily convertible to cash on hand and are subject to an insignificant risk of changes in value, net of outstanding bank overdrafts. Where a net overdraft arises on cash at bank, the overdraft is included in Borrowings and Advances on the Balance Sheet.
| | |
| 6-12 | | Audited Consolidated Financial Statements 2010–11 – Government of Queensland |
Notes to the Financial Statements
| 1. | Significant Accounting Policies continued |
Trade debtors are recognised at the nominal amount due. Receivables are assessed periodically for impairment. Other receivables include lease receivables and accrued revenue, primarily from taxation revenue assessed as accruing to the State at 30 June. For further details on the State revenue recognition refer to Note 1(k).
Settlement by finance lease debtors is within the terms of the lease, ranging from 2 to 99 years. Title is passed to the purchaser on full repayment. Refer Note 26.
Loans are financial assets held by the State and include loans supporting policy objectives of the Government rather than for liquidity management purposes. Due to the “partial consolidation” approach required by AASB1049, the GGS balances include a fixed rate note with the Queensland Treasury Corporation (QTC), which is eliminated on consolidation of the Total State Sector.
| (p) | Securities Other Than Shares |
Securities are financial assets held by the State that may include fixed term deposits, managed fund investments, interest in purchase plan rental properties, government and corporate bonds, promissory notes, bills of exchange, certificates of deposits, redeemable preference shares, debentures, long term notes and the net value of swaps and other derivatives that are in a net asset position.
| (q) | Shares and Other Equity Investments |
Shares and other equity refers to claims on other entities entitling the State to a share of the income of the entity and a right to a share of the residual assets of the entity should it be wound up. It includes holdings of the market value of listed enterprises and the market value of assets (non-financial and financial) less liabilities of unlisted enterprises.
The Total State Sector has two main categories:
| | • | | investments accounted for using the equity method (investments in associates); and |
| | • | | investments in other entities that are not controlled or associated. |
Investments accounted for using the equity method
Associates are those entities over which the State has significant influence but not control. Such entities are accounted for using the equity method of accounting in accordance with AASB 128 Investments in Associates. The State’s share of its associates’ post-acquisition profits or losses (less dividends) is recognised in the Operating Statement as an Other economic flow and its share of post-acquisition movements in reserves is recognised in the reserves. The cumulative post-acquisition movements are recognised against the carrying amount of the investment. Dividends from associates are recognised as revenue from transactions in the Operating Statement.
Investments - shares in entities that are not controlled or associated
Investments in entities that are neither controlled nor associates of the Government are valued at fair value with changes in valuation of these investments treated in a manner consistent with AASB 139 Financial Instruments: Recognition and Measurement.
Investments in public sector entities
In addition to the above two categories, the GGS has equity investments in PNFCs and PFCs that are measured as the Government’s proportional share of the net asset value of the PNFC and PFC Sector entities. Dividends from PNFCs and PFCs that are paid out of accumulated surpluses are recorded as revenue from transactions. Dividends paid out of reserves or from the sale of assets represent a return of Government initial equity investment under ABS GFS principles and are disclosed as Other economic flows. Changes in the valuation of the GGS equity investments (other than dividends) are recognised as Other economic flows.
| | |
| Audited Consolidated Financial Statements 2010–11 – Government of Queensland | | 6-13 |
Notes to the Financial Statements
| 1. | Significant Accounting Policies continued |
| (q) | Shares and Other Equity Investments continued |
Investments in public sector entities continued
Note 1(c) outlines the functions of these sectors. Refer to Note 55 for a comprehensive list of entities within the PNFC and PFC Sectors. Investments in the PNFC and PFC Sectors are eliminated on consolidation of the Total State Sector.
Inventories (other than those held for distribution) are carried at the lower of cost and net realisable value under AASB 102 Inventories. Cost is determined on either a first-in-first-out or average cost basis and includes expenditure incurred in acquiring the inventories and bringing them to their existing condition and location, except for training costs which are expensed as incurred. Where inventories are acquired for no or nominal consideration, the cost is the current replacement cost as at the date of acquisition.
Inventories held for distribution are those inventories which the State distributes for no or nominal consideration. These are measured at the lower of cost and current replacement cost. Land held for resale is stated at the lower of cost and net realisable value. Cost is assigned by specific identification and includes the cost of acquisition and development.
All inventories are classified as current non-financial assets.
| (s) | Other Non-Financial Assets |
Other non-financial assets primarily represent prepayments by the State. These prepayments include salaries and wages, grant payments or payments of a general nature made in advance.
In accordance with AASB 5 Non-current Assets Held for Sale and Discontinued Operations, non-current assets held for sale are assets measured at the lower of carrying amount and fair value less costs to sell and have not been depreciated or amortised.
While an asset is classified as held for sale, an impairment loss is recognised for any write downs of the asset to fair value less estimated costs to sell. A gain is recognised for any subsequent increases in fair value less costs to sell of an asset, but not in excess of any cumulative impairment loss previously recognised.
Pursuant to AASB 140 Investment Property, properties held to earn rental income or for capital gains purposes are classified as investment properties. Such properties are valued at fair value. Changes in fair value are recognised in the Operating Statement as Other economic flows and no depreciation expense or asset impairment is recognised.
Biological assets are recognised at net market value which is the amount that could be expected to be received from the disposal of the asset in an active and liquid market, after deducting costs expected to be incurred in realising the proceeds of such a disposal.
Biological assets held by the State and recognised in the Balance Sheet include:
| | • | | plants (comprising timber plantations, sugarcane, grain and cotton crops). |
Biological assets such as tree seed orchards, vines and nursery seedlings which have been assessed in accordance with AASB 141, found not to be material and accordingly not been recognised. This position will be reviewed annually.
| | |
| 6-14 | | Audited Consolidated Financial Statements 2010–11 – Government of Queensland |
Notes to the Financial Statements
| 1. | Significant Accounting Policies continued |
| (w) | Property, Plant and Equipment |
Acquisition
Items of property, plant and equipment with a cost or other value greater than the asset recognition threshold of the agency are initially capitalised and recorded at cost. The Queensland Treasury’s Non-Current Asset Policies for the Queensland Public Sector mandates asset recognition thresholds for departments and not-for-profit statutory bodies as follows :
| | |
Asset Class | | Asset Recognition Threshold |
Land | | $1 (all land) |
| |
Buildings | | $10,000 |
| |
Infrastructure | | $10,000 |
| |
Plant & Equipment | | $5,000 |
| |
Major Plant & Equipment | | An amount greater than or equal to $5,000, the exact amount of which is at the agency’s discretion. |
| |
Leased Assets (finance leases) | | The threshold for the class to which the asset would belong if it were not subject to a finance lease. |
| |
Heritage & Cultural Assets | | $5,000 |
| |
Work in Progress | | n/a |
| |
Library Reference Collections | | $1,000,000 |
Asset recognition thresholds for other entities do not exceed the thresholds above.
Items with a cost or other value below each entity’s recognition threshold are expensed in the year of acquisition. Cost is determined as the value given as consideration, plus costs incidental to the acquisition including all other costs incurred in getting the assets ready for use. Training, marketing and advertising costs are expensed as incurred.
In accordance with AASB 116 Property, Plant and Equipment, administration and other general overhead costs are expensed in the year they are incurred. Overhauls and major inspections are only capitalised if it is probable that future economic benefits associated with them will flow to the entity and their cost can be measured reliably. Any remaining carrying amount of the cost of the previous inspection/overhaul (as distinct from physical parts) is derecognised.
Assets acquired at no cost, or for nominal consideration, that can be measured reliably are recognised initially as assets and revenues at their fair value at the date of acquisition.
Recording and Valuation
Land, buildings, infrastructure, major plant and equipment and heritage and cultural assets are valued at fair value in accordance with AASB 116 and Queensland Treasury’s Non-Current Asset Policies for the Queensland Public Sector.
Plant and equipment is recorded at cost.
On initial recognition, all costs incurred in purchasing or constructing the asset and getting it ready for use are capitalised to the value of the asset. Costs also include the initial estimate of the costs of dismantling and restoring the site on which it is located, where that obligation is recognised and measured in accordance with AASB 137 Provisions, Contingent Liabilities and Contingent Assets.
Subsequent costs are added to the carrying amount of the asset when it improves the condition of the asset beyond its originally assessed standard of performance or capacity. Otherwise, subsequent costs are expensed.
| | |
| Audited Consolidated Financial Statements 2010–11 – Government of Queensland | | 6-15 |
Notes to the Financial Statements
| 1. | Significant Accounting Policies continued |
| (w) | Property, Plant and Equipment continued |
Recording and Valuation continued
Reference should be made to individual agency reports for valuation methodologies and names and qualifications of relevant valuers, where appropriate.
Non-current physical assets measured at fair value are comprehensively revalued once every five years or as appropriate, with interim valuations using relevant indices being otherwise performed on an annual basis. Separately identified components of assets are measured on the same basis as the assets to which they relate.
Any revaluation increment arising on the revaluation of an asset is credited to the asset revaluation reserve for that class of assets, except to the extent it reverses a revaluation decrement for the class of assets previously recognised as an expense. A decrease in the carrying amount on revaluation is charged as an expense, to the extent it exceeds the balance of the relevant asset revaluation reserve.
Items or components that form an integral part of an asset are recognised as a single asset (functional asset). The recognition threshold is applied to the aggregate cost of each functional asset.
Non-reciprocal transfers of assets and liabilities between wholly-owned Queensland public sector entities, are accounted for as adjustments to contributed equity in accordance with AASB Interpretation 1038 Contributions by Owners Made to Wholly-owned Public Sector Entities.
Land Under Roads
Land under roads is included in the asset class ‘land’.
Land under roads acquired on or before 30 June 2008 was recognised at fair value with the corresponding adjustment against opening Accumulated Surplus (effective 1 July 2008) in accordance with AASB 1051 Land Under Roads. Land under roads acquired from 1 July 2008 was initially recognised at cost and thereafter at fair value in accordance with AASB 116 Property Plant and Equipment.
Fair value is determined using an acceptable, reliable valuation methodology which is undertaken by the State Valuation Services by multiplying the total area of land under roads within each local government area by the average unimproved value of all freehold and leasehold land within the corresponding local government area. Where fair value cannot be reliably determined either at acquisition or at any reporting date, but is able to be determined subsequently, the fair value adjustment is treated as an adjustment to the revaluation reserve in accordance with Queensland Treasury’s Non-Current Asset Policies for the Queensland Public Sector.
Land under roads not subject to freehold or leasehold title or reserve tenure vests in the State in terms of the Land Act 1994. The Department of Environment and Resource Management administers the Land Act on behalf of the State and accordingly, untitled land under roads is an administered asset of that department.
Land under roads subject to freehold or leasehold title or reserve tenure and is controlled by the agency that holds the freehold or leasehold title or trusteeship of a reserve is recorded by the relevant agency as a controlled asset.
Property, Plant and Equipment Held for Rental
Pursuant to paragraph 68A in AASB 116, where items of property, plant and equipment that have been held for rental to others are routinely sold in the course of the State’s ordinary business, these assets are transferred to inventories at their carrying amount when they cease to be rented and become held for sale.
Paragraph 14 of AASB 107 Statement of Cash Flows requires that the cash received from the subsequent sale of assets that were previously held for rental to others and cash paid to purchase these assets are recognised as operating activities rather than investing activities.
| | |
| 6-16 | | Audited Consolidated Financial Statements 2010–11 – Government of Queensland |
Notes to the Financial Statements
| 1. | Significant Accounting Policies continued |
Intangible assets are recognised in accordance with AASB 138 Intangible Assets. Queensland Treasury’s Non-Current Asset Policies for the Queensland Public Sector which is applicable to departments and statutory bodies, mandates classes of non-current physical and intangible assets. Software is classified as an intangible asset, rather than property, plant and equipment unless it is an integral part of the related hardware.
Internally generated goodwill, brands, and items of similar substance, as well as expenditure on initial research, are specifically excluded from being recognised in the Balance Sheet.
In accordance with the Non-Current Asset Policies for the Queensland Public Sector, the recognition threshold for departments and statutory bodies is $100,000. The threshold for other entities does not exceed this amount.
Purchased goodwill represents the excess of costs of acquisition over the fair value of the State’s share of the net identifiable assets of the acquired subsidiary at the date of acquisition. Goodwill is not amortised but instead is assessed annually for impairment.
Internally generated intangible assets are only revalued where an active market exists for the asset in question, otherwise they are measured at cost.
The following assets are not recognised in the Balance Sheet:
Quarry Resources
The value of quarry resources held by the Department of Environment and Resource Management is not included in the financial statements as it is not practical to determine reliably the quantum of the resources available for extraction. Revenue from the sale of quarry materials is recognised as extractions are made.
Railway Corridor Land
Under the Transport Infrastructure Act 1994, railway corridor land was rendered State land under the control of the Department of Environment and Resource Management which for reporting purposes recorded the land at nil value. This land is on-leased to Queensland Rail Limited via Department of Transport and Main Roads at no cost.
Library Collections
Library acquisitions are expensed as they are incurred, except for the General Reference and Rare Books Collections of the Library Board of Queensland. These are capitalised and held at fair value in accordance with Queensland Treasury’s
Non-Current Asset Policies for the Queensland Public Sector and Queensland Treasury’s Accounting for Library Collections Policy except for certain heritage assets such as manuscripts whose value cannot be reliably measured.
Native Forests and Biological Assets
Disclosures are outlined in Note 1(v).
User Funded Assets
Certain wharf facilities, bulk sugar terminals, bulk molasses terminals, bulk grain terminals and grain loading facilities have been constructed on land controlled by Queensland port corporations. These assets are not included in the Balance Sheet as users of the assets have either fully or partially funded these facilities and they are either not considered to be controlled by the corporations or no income will flow from the facilities.
| | |
| Audited Consolidated Financial Statements 2010–11 – Government of Queensland | | 6-17 |
Notes to the Financial Statements
| 1. | Significant Accounting Policies continued |
| (y) | Assets not Recognised continued |
Heritage Assets
Certain heritage assets, including artefacts, memorabilia and other historical objects held by agencies, have not been valued or included in the Balance Sheet because of the unique nature of the items and the difficulty in determining a reliable value.
| (z) | Depreciation and Amortisation |
Land, General Reference and Rare Books Collections of the Library Board of Queensland, Museum collections, art works held by the Queensland Art Gallery Board of Trustees and certain other heritage and cultural assets are not depreciated.
Other assets are depreciated or amortised on a straight-line basis from their date of acquisition (or in respect of internally constructed assets, from the time the asset is completed and held ready for use) and based on their estimated useful lives to the agency.
Where assets have separately identifiable components that are subject to regular replacement, these components are assigned useful lives distinct from the asset to which they relate and are depreciated accordingly. Any expenditure which increases the originally assessed capacity or service potential of an asset is capitalised and the new depreciable value is depreciated over the remaining useful life of the asset.
Leasehold improvements are amortised over the estimated useful lives of the improvements or the unexpired period of the lease, whichever is shorter. The unexpired period of the lease includes any option period where exercise of the option is probable.
Capital work in progress is not depreciated until it reaches service delivery capacity.
Major spares purchased specifically for particular assets are capitalised and depreciated on the same basis as the asset to which they relate.
Estimated useful lives, residual values and depreciation methods are reviewed at the end of each annual reporting period.
Reference should be made to individual agency reports for details of depreciation and amortisation methodologies. The following provides an indication of the estimated useful lives of the different non-financial asset classes held by the State:
| | |
Asset Class | | Useful Life |
Property, Plant and Equipment | | |
| |
Buildings | | 1 - 100 years |
Plant and equipment | | 1 - 100 years |
Infrastructure assets | | up to 200 years |
Heritage and cultural assets | | 7 - 100 years |
| |
Intangibles | | |
| |
Computer software | | 2 - 15 years |
Other intangibles (including intellectual property, licences and access rights) | | 1 - 99 years |
At each reporting date, an assessment is undertaken as to whether there are any indications that a physical or intangible asset is impaired. If an asset is determined to be impaired, the recoverable amount of the impaired asset is determined as the higher of the asset’s fair value less costs to sell and value in use. Value in use is based on either discounted cash flows using a risk adjusted discount rate or in respect of not-for-profit entities, depreciated replacement cost. Non-financial assets other than goodwill that suffered an impairment are reviewed for possible reversal of the impairment at each reporting date.
Impairment on goodwill is not reversed.
| | |
| 6-18 | | Audited Consolidated Financial Statements 2010–11 – Government of Queensland |
Notes to the Financial Statements
| 1. | Significant Accounting Policies continued |
Rights and obligations under finance leases (including cross border leases) which are leases that effectively transfer most of the risks and rewards relating to ownership of the leased items to the lessee, are recognised initially as assets and liabilities by the lessee equal to the lower of fair value of the leased property and present value of the minimum lease payment including any guaranteed residual values. The assets are disclosed as leased plant and equipment and are depreciated over the period during which the State is expected to benefit from the use of the asset. Minimum lease payments are allocated between interest and reduction of the lease liability, according to the interest rate implicit in the lease. Further disclosures on cross border leases is contained in Note 52.
For operating leases, where the lessor retains substantially all of the risks and rewards relating to ownership of the leased items, lease payments are expensed by the lessee over the term of the lease. Incentives received on entering into operating leases are recognised as liabilities. Lease payments are allocated between rental expense and reduction of the liability. Further disclosure on lease commitments is contained in Note 48.
These amounts represent amounts owing for goods and services provided to the State prior to the end of the financial year. The amounts are unsecured, are usually paid within 30 days of recognition and are non-interest bearing.
Provisions are recognised when there is a present legal or constructive obligation as a result of past events, it is probable that an outflow of resources will be required to settle the obligation and the amount has been reliably estimated. Where there are a number of similar obligations, the likelihood that an outflow will be required is determined by considering the class of obligations as a whole. Provisions are measured at the present value of the estimate of the expenditure required to settle the present obligation at the reporting date. The discount rate used to determine the present value reflects current market assessment of the time value of money and risks specific to the liability.
General Provisions
A provision for onerous contracts is recognised when the expected benefits to be derived from a contract are less than the unavoidable costs of meeting the obligations under that contract and only after any impairments to assets dedicated to that contract have been recognised.
The provision is recognised in accordance with AASB 137 Provisions, Contingent Liabilities and Contingent Assets and is based on the excess of the estimated cash flows to meet the unavoidable costs under the contract over the estimated cash flows to be received in relation to the contract, having regard to the risks of the activities relating to the contract. The net estimated cash flows are discounted, where the effect of discounting is material.
Power Purchase Agreement Provisions
A provision for onerous contracts has been realised in relation to a number of long-term power purchase agreements (PPAs) when the unavoidable costs of meeting the ongoing obligations under these agreements exceed the expected benefits to be received. Some of these PPAs have remaining terms to 2016. Current conditions within the electricity market mean a number of the long-term power purchase agreements are considered to be onerous contracts.
The provision for onerous contracts reflects net present value of the least net cost of exiting these onerous PPAs which is the lower of the cost of fulfilling the agreements or the compensation payable, as defined in these agreements for early termination.
| | |
| Audited Consolidated Financial Statements 2010–11 – Government of Queensland | | 6-19 |
Notes to the Financial Statements
| 1. | Significant Accounting Policies continued |
| (ae) | Onerous Contracts continued |
Power Purchase Agreement Provisions continued
The extent of the future losses from the power purchase agreements will depend on future wholesale pool prices as well as the need for the State to meet its network support obligations. The future level of Queensland wholesale pool prices remains significantly uncertain. The critical determinants of future pool prices will be the bidding behaviour of participants in the National Electricity Market, load growth, network reliability, the introduction of new generation capacity and impact of a potential carbon tax. The discount rate used reflects current market assessments of the time value of money and the risks specific to these obligations.
Wages, Salaries and Sick Leave
Liabilities for wages and salaries are accrued at year end. For most agencies, sick leave is non-vesting and is expensed as incurred. Liabilities have been calculated based on wage and salary rates at the date they are expected to be paid and include related on-costs.
Annual Leave
The Annual Leave Central Scheme (ALCS) was established at 30 June 2008 to centrally fund annual leave obligations of departments, commercialised business units and shared service providers. Members pay a levy equal to their accrued leave cost into the scheme and are reimbursed by the scheme for annual leave payments made to their employees. Entities that do not participate in the ALCS continue to determine and recognise their own leave liabilities.
The State’s annual leave liability has been calculated based on wage and salary rates at the date they are expected to be paid and include related on-costs. In accordance with AASB 119 Employee Benefits, where annual leave is not expected to be paid within 12 months, the liability is classified as non-current and measured at the present value of the future cash flows.
Long Service Leave
A levy of 2.1% of salary and wages costs is paid by participating agencies (predominantly Government departments) into the Long Service Leave Central Scheme introduced in 1999-2000. Amounts paid to employees for long service leave are then claimed from the scheme as a reimbursement. The liability is assessed annually by the State Actuary.
The method used incorporates consideration of expected future wage and salary levels, experience of employee departures and periods of service. On-costs have been included in the liabilities and expenses for the Long Service Leave Central Scheme. These amounts have not been separately identified, as they are not material in the context of the State’s overall employee entitlement liabilities.
The State’s long service leave provisions are calculated in accordance with AASB 119 using yield rates of Government bonds at reporting date and actuarial assumptions which are mutually compatible. The gross discount rate for 10 year Commonwealth bonds at 30 June 2011 was 5.3% (2010, 5.3%).
Entities that do not participate in the Long Service Leave Central Scheme determine their liability for long service leave based on the present value of estimated future cash outflows to be made.
Superannuation/Retirement Benefit Obligations
A superannuation liability for the State public sector is recognised in respect of the various employees’ accrued superannuation benefits and represents the difference between the net market value of plan assets and the estimated accrued superannuation benefits at year end.
The present value of the accrued benefits is calculated using the projected unit credit method and represents the actuarial value of all benefits that are expected to become payable in the future in respect of contributions made or periods of service completed prior to the valuation date, allowing for future salary increases.
| | |
| 6-20 | | Audited Consolidated Financial Statements 2010–11 – Government of Queensland |
Notes to the Financial Statements
| 1. | Significant Accounting Policies continued |
| (af) | Employee Benefits continued |
Superannuation/Retirement Benefit Obligations continued
The costs of providing future benefits to employees are recognised over the period during which employees provide services. All superannuation plan costs, excluding actuarial gains and losses, are recognised in the Operating Statement. Actuarial gains and losses are recognised directly in equity on an annual basis and represent experience adjustments (the effects of differences between the previous actuarial assumptions and what has actually occurred e.g. investment returns on plan assets) and the effects of changes in actuarial assumptions underlying the valuation.
Expected future payments are discounted using market yields at the reporting date on Government bonds with terms to maturity and currency that match the estimated future cash outflows. The gross discount rate for 10 year Commonwealth bonds at 30 June 2011 was 5.3% (2010, 5.3%).
Future taxes are part of the provision of the existing benefit obligations (e.g. taxes on investment income and employer contributions) and are taken into account in measuring the net liability or asset.
Employees in the electricity industry contribute to an industry multiple employer superannuation fund, Electricity Super Fund. Refer Note 54.
Termination Benefits
Termination benefits are payable when employment is terminated before the normal retirement date or when an employee accepts a voluntary redundancy in exchange for these benefits. The State recognises termination benefits when it is demonstrably committed to either terminating the employment of employees according to a detailed formal plan without possibility of withdrawal or providing termination benefits as a result of an offer made to encourage voluntary redundancy. Benefits falling due more than 12 months after balance date are discounted to present value.
| (ag) | Provision for Retirement/Disposal of Long Lived Assets |
A provision is recognised for dismantling, removal and restoration costs where a constructive obligation exists. The present value of the obligation is recorded in the initial cost of the asset.
Queensland Government Insurance Fund (QGIF)
QGIF was established as a self-insurance fund for the State’s insurable liabilities and is an administrative arrangement within the Consolidated Fund. QGIF aims to improve the management of insurable risks through indentifying, providing for and funding the Government’s insurance liabilities.
Participating government agencies pay premiums into the fund to meet the cost of claims and future insurable liabilities. QGIF outstanding claim liabilities are reported at whole of government, with claims paid out of Queensland Treasury’s Administered accounts.
The State’s QGIF provisions are actuarially assessed annually and are calculated in accordance with AASB 137. The liabilities relate to all claims incurred prior to 30 June 2011 and include an estimate of the cost of claims that are incurred but not reported. Expected future payments are discounted using yields on Australian government bonds. This risk free discount rate applied as at 30 June 2011 was 5.20% p.a.
The outstanding claims liability is a central estimate and includes no prudential margin.
General Insurance Contracts
In accordance with AASB 1023 General Insurance Contracts, the claims liability includes a risk margin in addition to expected future payments. This liability is discounted for the time value of money using risk-free discount rates that are based on current, observable, objective rates.
| | |
| Audited Consolidated Financial Statements 2010–11 – Government of Queensland | | 6-21 |
Notes to the Financial Statements
| 1. | Significant Accounting Policies continued |
| (ai) | Financial Instruments |
Under AASB 139 Financial Instruments: Recognition and Measurement, financial assets are to be classified and measured as follows:
| | • | | receivables and loans - measured at amortised cost; |
| | • | | held-to-maturity - measured at amortised cost; |
| | • | | fair value through profit or loss; or |
| | • | | available-for-sale - measured at fair value with unrealised gains/losses recognised directly in equity except for impairment losses and foreign exchange gains/losses. |
Financial liabilities are to be classified and measured as follows:
| | • | | fair value through profit or loss; or |
| | • | | other financial liabilities - measured at amortised cost. |
Carrying amounts of financial assets and liabilities equate to fair value except as identified in Note 53.
Receivables and loans
Receivables and loans are non-derivative financial assets with fixed or determinable payments that are not quoted in an active market. They are initially measured at fair value plus any directly attributable transaction costs. Subsequently, receivables and loans are recorded at amortised cost using the effective interest method (except for short-term receivables) less any impairment losses. The effective interest method is a method of calculating the amortised cost of a financial asset and allocating the interest income over the relevant period. Any interest income is recognised in the Operating Result in the period in which it accrues.
Held-to-maturity investments
The State follows AASB 139 in classifying non-derivative financial assets with fixed or determinable payments and fixed maturity as held-to-maturity if the State has the intention and ability to hold such investments to maturity. Held-to-maturity investments are initially recognised at fair value plus any directly attributable transaction costs. Subsequently, held-to- maturity investments are measured at amortised cost using the effective interest method, less any impairment losses.
If a class of held-to-maturity investments is tainted or the State fails to keep these investments to maturity other than for specific circumstances explained in AASB 139, it will be required to reclassify the whole class as available-for-sale. The State would also not be able to classify any financial assets as held-to-maturity for the following two annual reporting periods.
Financial assets held-to-maturity primarily comprises term deposits. It is the State’s intention to hold these investments until maturity. Deposits held with QTC are eliminated on consolidation of the Total State Sector.
Financial assets at fair value through profit or loss
Financial assets are classified as fair value through profit or loss at balance date if they are classified as held for trading or designated so upon initial recognition. Financial assets at fair value through profit or loss are valued at fair value at balance date. Unrealised gains and losses are brought to account as Other economic flows included in the Operating Result, unless strict cash flow hedge accounting rules are met, in which case valuation adjustments are recognised in an equity reserve.
Financial assets at fair value through profit or loss held by the State include money market deposits, discount securities, Commonwealth and State securities, floating rate notes, medium term notes, fixed interest deposits, letters of credit, interest in Rental Purchase Plan properties, investments managed by QIC Limited, other investments in managed funds, shares and derivatives.
| | |
| 6-22 | | Audited Consolidated Financial Statements 2010–11 – Government of Queensland |
Notes to the Financial Statements
| 1. | Significant Accounting Policies continued |
| (ai) | Financial Instruments continued |
Available-for-sale financial assets
Available-for-sale financial assets are those non-derivative financial assets that are designated as available-for-sale or that are not classified as other categories of financial assets. Such assets are measured at fair value with unrealised gains/losses recognised directly in equity, except for impairment losses and foreign exchange losses which are recognised in the Operating Result.
Total State Sector available-for-sale financial assets include bank bonds, corporate bonds, Government bonds and share investments (other than Investments in public sector enterprises). Share investments in public sector enterprises are included in the GGS but are eliminated on consolidation of the Total State Sector.
Financial liabilities at fair value through profit or loss
Financial liabilities are classified as fair value through profit or loss at balance date if they are classified as held for trading or designated so upon initial recognition. Financial liabilities at fair value through profit or loss which include deposits, interest bearing liabilities and derivatives, are valued at fair value at balance date. Unrealised gains and losses are brought to account as Other economic flows included in the Operating Result, unless strict cash flow hedge accounting rules are met, in which case valuation adjustments are recognised in an equity reserve.
Interest bearing liabilities held by the State include Treasury notes, Australian and overseas bonds, credit foncier loans, commercial paper and medium term notes principally raised by QTC. The GGS also includes loans with QTC which are eliminated on consolidation of the Total State Sector.
In relation to deposits, income derived from their investment accrues to depositors daily. The amount shown in the Balance Sheet represents the market value of deposits held at balance date. Stock lending and repurchase agreement deposits are accepted at an agreed price and are held as security for stock lent.
Financial liabilities held at amortised cost
Financial liabilities held at amortised cost are initially measured at fair value plus any directly attributable transaction costs. Subsequently, such financial liabilities are measured at amortised cost using the effective interest method. The effective interest method is a method of calculating the amortised cost of a financial liability and allocating the interest expense over the relevant period. Any interest expense is recognised in the Operating Result in the period in which it accrues.
Financial liabilities measured at amortised cost are financial liabilities other than those designated at fair value through profit or loss. They include payables, finance leases and State debt to the Commonwealth (loans made by the Commonwealth under Loan Council agreements).
Derivative financial instruments
Derivative financial instruments are initially recognised at fair value on the date on which a derivative contract is entered into and are subsequently remeasured to their fair value at balance date. Fair values are derived using quoted market prices in active markets and utilising accepted market valuation techniques, including the discounted cash flow model and other pricing models, as appropriate. Changes in fair value are taken to Other economic flows included in the Operating Result unless strict cash flow hedge accounting rules are met, in which case valuation adjustments are recognised in an equity reserve.
Derivative instruments are used to hedge the State’s exposures to interest rate, foreign currency, commodity prices and credit risks as part of asset and liability management activities. In addition, they may be used to deliver long term floating rate or long term fixed rate exposure. A small number of derivative financial instruments are held for speculative purposes.
| | |
| Audited Consolidated Financial Statements 2010–11 – Government of Queensland | | 6-23 |
Notes to the Financial Statements
| 1. | Significant Accounting Policies continued |
| (ai) | Financial Instruments continued |
Derivative financial instruments continued
Derivatives may be designated as either hedges of the fair value of recognised assets or liabilities or firm commitments (fair value hedges) or as hedges of the cash flows of recognised assets and liabilities and highly probable forecast transactions (cash flow hedges). Gains or losses on fair value hedges are recognised as Other economic flows included in the Operating Result. Gains or losses on the effective portion of cash flow hedges are recognised directly in the hedge reserve in equity, while the ineffective portion is recognised as Other economic flows included in the Operating Result.
Amounts taken to the hedge reserve in equity are transferred to the Operating Result when the hedged transaction affects the Operating Result, such as when hedged income or expenses are recognised, when a forecast sale or purchase occurs or when the hedge becomes ineffective. Where the forecast transaction that is hedged results in recognising a non-financial asset or liability, the gains or losses deferred in equity are transferred to the carrying amount of the asset or liability.
All derivatives are carried as assets when fair value is positive and liabilities when fair value is negative. Derivative instruments used by the State include: options, futures contracts, forward rate agreements, forward exchange contracts, cross currency swaps, interest rate swaps and commodity swaps.
Recognition and derecognition of financial assets and liabilities
Financial assets and financial liabilities are recognised on the Balance Sheet when the State becomes party to the contractual provisions of the financial instrument. A financial asset is derecognised when the contractual rights to the cash flows from the financial assets expire or are transferred and no longer controlled by the State. A financial liability is removed from the Balance Sheet when the obligation specified in the contract is discharged, cancelled or expires.
Settlement date accounting
Purchases and sales of financial assets and liabilities at fair value through profit or loss are recognised on settlement date. The State accounts for any change in the fair value of the asset to be received or liability issued during the period between the trade date and settlement date in the same way as it accounts for the acquired asset or liability.
Fair value estimation
Where there is an active market for financial instruments, entities within the Total State Sector use either the quoted market price at balance date or mid market rates as a basis for establishing fair values. Financial assets are priced at current bid prices, while financial liabilities are priced at current asking price. The State adopts the policy to effectively minimise risk arising from market/client transactions whether they be in the nature of onlendings, deposits, leases or hedges.
The fair value of financial instruments that are not traded in an active market (for example over-the-counter electricity derivatives) is determined by using valuation techniques. The State uses judgement to select a variety of methods and make assumptions that are mainly based on market conditions existing at each Balance Sheet date. The State has used discounted cash flow analysis for various available-for-sale financial assets that were not traded in active markets.
Foreign currency transactions are translated initially into Australian dollars at the rate of exchange applying at the date of the transaction. Such transactions are subject to exchange risk which is reflected by variation in exchange rate due to foreign currency movement. Amounts payable and receivable in foreign currencies at balance date are translated to Australian currency at rates of exchange current at 30 June 2011.
Translation differences relating to amounts payable and receivable in foreign currencies are brought to account as exchange gains or losses in the Operating Result in the financial year in which the exchange rates change, except when deferred in equity as qualifying cash flow hedges or net investment hedges.
| | |
| 6-24 | | Audited Consolidated Financial Statements 2010–11 – Government of Queensland |
Notes to the Financial Statements
| 1. | Significant Accounting Policies continued |
| (aj) | Foreign Currency continued |
Translation differences on non-monetary financial assets and liabilities such as equities held at fair value through profit or loss are recognised in the Operating Result as part of the fair value gain or loss. Translation differences on non-monetary financial assets such as equities classified as available-for-sale financial assets are included in the fair value reserve in equity.
In relation to borrowings covered by swaps denominated in foreign currencies, both the loan and the underlying swap are valued at the relevant swap yield existing at year-end. Where transactions involve forward foreign exchange contracts, the amount payable or receivable under the contract is adjusted to reflect forward rates of exchange applicable at year-end. Exchange gains or losses are brought to account in the Operating Result.
| (ak) | Related Party Transactions |
A number of related party transactions which are at arm’s length and under normal commercial terms, have been disclosed in the financial statements of some of the agencies that are included in these consolidated financial statements. These transactions mainly relate to Government-owned corporations. Reference should be made to individual agency reports for further particulars of these transactions.
| (al) | Public Private Partnerships (PPPs) |
There is currently no Australian Accounting Standard specifically addressing accounting for private sector financed infrastructure assets from a grantor’s perspective. The following policies have been adopted pending the development of an accounting standard for the grantor.
Agreements equally proportionately unperformed arising from PPPs are not recognised as assets or liabilities. Instead, the payments under these agreements are expensed systematically over the term of the agreements. Any leasing arrangements are disclosed in accordance with AASB 117 Leases. Further, the commitments for future payments under these agreements are disclosed as commitments in the notes to the consolidated financial statements.
Security, tender and other deposits administered by the State in a fiduciary or trust capacity are not recognised in the financial statements but are disclosed for information purposes in Note 49. Whilst these transactions and balances are in the care of the State, they are subject to the normal internal control and external audit requirements.
| (an) | Critical Accounting Estimates and Judgements |
Estimates and judgements are continually evaluated and are based on historical experience and other factors, including expectations of future events that may have a financial impact on the State and that are believed to be reasonable under the circumstances.
The State makes estimates and assumptions concerning the future. The resulting accounting estimates will, by definition, seldom equal the related actual results. The estimates and assumptions that have a significant risk of causing a material adjustment to the carrying amount of assets and liabilities within the next financial year and have not been included in the relevant accounting policy, are discussed below.
Estimated Impairment of Assets
The State tests annually whether any asset or group of assets is impaired, in accordance with the accounting policy Note 1(aa). In some instances the recoverable amount used is value in use. Value in use calculations require assumptions to be made in key areas such as:
| | • | | risk adjusted time value of money; |
| | • | | forecast market prices; |
| | |
| Audited Consolidated Financial Statements 2010–11 – Government of Queensland | | 6-25 |
Notes to the Financial Statements
| 1. | Significant Accounting Policies continued |
| (an) | Critical Accounting Estimates and Judgements continued |
Estimated Impairment of Assets continued
| | • | | forecast operational and capital expenditure; and |
Impairment - Electricity Generators
On 10 July 2011 the Australian Government announced a proposal, ‘Securing a Clean Energy Future – the Australian Government’s Climate Change Plan’, which included a carbon pricing mechanism for Australia. Commencing on 1 July 2012, the plan incorporates a three year fixed price path before moving to a flexible price mechanism from 1 July 2015. It also caps greenhouse gas emissions by limiting carbon units once the flexible pricing period commences. In addition, the Australian Government’s proposal includes climate change strategies on renewable energy, energy efficiency and action on land. These proposals are expected to have a significant impact on the value of thermal generation assets as they impact the cost, mix and demand for electricity.
On 13 September 2011 the Australian Government introduced legislation into Parliament detailing implementation of parts of this proposal, which make a price on carbon more likely.
Although the Federal Government’s carbon pricing mechanism was released after 30 June 2011, the boards of directors of the affected Government Owned Corporations are of the view that this information can be incorporated into the impairment models to determine the recoverable amounts of assets in accordance with AASB 136.
Impairment testing of generation assets is conducted at the end of each reporting period by evaluating conditions that may lead to indicators of impairment of assets:
| | • | | The cash flow projections present management’s best estimate of the range of reasonable and supportable economic conditions that will exist over the remaining useful economic life of a particular asset |
| | • | | The valuation incorporates the best estimate of uncertainty regarding the introduction or otherwise of carbon pricing, using scenario-based modelling and probability weightings of a range of possible carbon prices. |
Valuation techniques
The discounted cash flow discounts projected cash flows by a rate of return commensurate to risk associated with the assets and the time value of money. The cash flow projections are based on market assumptions (pricing, dispatch and carbon), and capital expenditure programs that willing market participants might reasonably adopt.
Electricity demand and wholesale electricity prices
Electricity demand, electricity pool price and contract premiums are forecast to the end of the generation asset lives using past experience, economic trends, the impact of a potential carbon price and escalation together with industry and market trends. The forecast also considers efficiencies from capital expenditure projects over the asset’s life. References include:
| | • | | 2010 Electricity Statement of Opportunities (Australian Energy Market Operator) Electricity demand and growth forecasts - median growth forecast |
| | • | | Median Gas Price to reflect Liquefied Natural Gas developments in the domestic gas market and eventual domestic gas price parity with international markets. |
Carbon price scenarios
Two main scenarios have been considered in this impairment testing:
| | • | | The Commonwealth Treasury modelling of core policy and high price scenarios (July 2011) ‘Strong growth, low pollution modelling a carbon price’ which was adopted by CS Energy. |
| | |
| 6-26 | | Audited Consolidated Financial Statements 2010–11 – Government of Queensland |
Notes to the Financial Statements
| 1. | Significant Accounting Policies continued |
| (an) | Critical Accounting Estimates and Judgements continued |
Impairment - Electricity Generators continued
| | • | | A median carbon price scenario reflecting the Federal Government’s pricing for the fixed period moving to a curve reflecting the uncertainty of the availability and pricing of international carbon permits, but achieving the emissions reduction target of five per cent by 2020, which was considered by Stanwell and Tarong Energy in addition to the Commonwealth Treasury modelling. |
Discount rate
The discount rate represents weighted average cost of capital (WACC) for comparable companies operating in similar industries as the generation assets, based on publicly available information, reflecting the overall required rate of return on an investment for both debt and equity owners.
Other key assumptions that are critical to this assessment include:
| | • | | Fuel and operating costs; |
| | • | | Timing and quantum of capital expenditure; and |
| | • | | Consumer price index and other indexations. |
The uncertainties of the carbon pricing mechanism may potentially significantly impact on the assumptions outlined above and, as a result, there is inherent uncertainty on the resulting value of generation assets. The Auditor-General has drawn attention to the uncertainty related to the proposed introduction of the Australian Government’s Clean Energy Plan in the audit reports of the generators.
The sensitivities include the impact of changes in assumptions used for the electricity price, discount rates on the impairment charge as follows:
| | | | | | | | |
| Sensitivity of impairment charge to changes in electricity price and discount rate | | Total State Sector | |
| | | 2011 | |
| | | $M | | | $M | |
| | | +5 | % | | | -5 | % |
Wholesale electricity price - decrease/(increase) to impairment loss | | | 948 | | | | (1,041 | ) |
| | | +1 | % | | | -1 | % |
Discount rate (pre-tax) - (increase)/decrease to impairment loss | | | (280 | ) | | | 300 | |
The impairments the generators have recognised in 2010-11 are as follows:
| | | | |
CS Energy | | | 773 | |
Stanwell | | | 232 | |
Tarong Energy | | | 710 | |
| | | | |
| | | 1,715 | |
| | | | |
Note this impairment differs from the $1.1 billion reduction in the value mentioned in Queensland Treasury’s Carbon Price Impacts for Queensland report of August 2011, because that report was prepared on the economic basis and uses different assumptions and base values.
| | |
| Audited Consolidated Financial Statements 2010–11 – Government of Queensland | | 6-27 |
Notes to the Financial Statements
| 1. | Significant Accounting Policies continued |
| (an) | Critical Accounting Estimates and Judgements continued |
Impairment - Water Assets
The SEQ bulk water authorities (Queensland Manufactured Water Authority, the Queensland Bulk Water Supply Authority and the Queensland Bulk Water Transport Authority) have performed an impairment assessment on their bulk water assets based on current bulk water pricing arrangements under normal pricing principles for regulated assets. The assumptions used in the impairment assessment are particularly sensitive to changes in bulk water pricing parameters set by the State. In accordance with a Direction Notice issued by the Minister for Energy and Water Utilities on 9 February 2011, the first review of SEQ Grid Service Charges was undertaken by the Queensland Competition Authority for prices to apply in 2011-12, with recommendations published in its final report of July 2011. While the Direction Notice for 2012-13 is the subject of continuing consultations, no material changes in the pricing principles and parameters specified in the previous Notice are expected.
Should the State transition to a longer-term pricing framework that results in a change to key parameters such as a reduction in rate of return on existing or future infrastructure, this may have a material impact on the ability of the bulk water authorities to generate a sufficient return to prevent asset impairment. Such an impairment could significantly impact on the carrying value of the bulk water authorities’ assets. Without additional information in relation to any actual changes to the methodology and with uncertainty as to what form the pricing mechanism may take, the water entities have relied on the reasonableness of their assumptions in completing their impairment testing.
Impairment of Financial Assets
The State assesses, at the end of each reporting period, whether there is objective evidence that a financial asset or a group of financial assets is impaired. A financial asset is considered to be impaired if objective evidence indicates that one or more events have had a negative effect on the estimated future cash flow of that asset.
Evidence of impairment may include significant financial difficulties of the debtor, the probability that the debtor will enter bankruptcy or financial reorganisation and payment default or delinquency in interest or principal payments. All financial assets, except for those measured at fair value through profit or loss, are subject to annual review for impairment, in accordance with AASB 139. The amount of the impairment loss is recognised in Other economic flows included in Operating Result. Receivables are assessed regularly for bad and doubtful debts. Bad debts are written off as they are incurred.
For financial assets carried at amortised cost, the carrying amount of the asset is reduced through the use of a provision account and the amount of the loss is measured as the difference between the asset’s carrying amount and the present value of estimated future cash flows, discounted at the effective interest rate. The adjustment is recognised in the Operating Result.
For available-for-sale financial assets, the cumulative loss, measured as the difference between the acquisition cost and current fair value, less any impairment loss previously recognised in the Operating Result, is removed from equity and recognised in the Operating Result.
An impairment loss is reversed if the reversal can be related objectively to an event occurring after the impairment loss was recognised. For financial assets measured at amortised cost, the reversal is recognised in the Operating Result.
| (ao) | Actual and Budgetary Information Comparison |
Explanations of major variances between AASB 1049 actual amounts and corresponding original budget amounts for the GGS are disclosed in Note 60.
| | |
| 6-28 | | Audited Consolidated Financial Statements 2010–11 – Government of Queensland |
Notes to the Financial Statements
| 1. | Significant Accounting Policies continued |
| (ap) | Key GFS technical terms |
ABS GFS Manual
The ABS GFS Manual refers to the Australian Bureau of Statistics (ABS) publication Australian System of Government Finance Statistics: Concepts, Sources and Methods 2005 as updated from time to time.
Cash Surplus/(Deficit)
The cash surplus/(deficit) is calculated as net cash flows from operating activities plus net cash flows from acquisition and disposal of non-financial assets less distributions paid. GFS cash surplus/(deficit) also deducts the value of assets acquired under finance leases and similar arrangements.
Convergence Differences
Convergence differences are difference between the amounts recognised in the financial statements compared with the amounts determined for GFS purposes as a result of differences in definition, recognition, measurement and classification principles and rules.
Comprehensive result - total change in net worth before transactions with owners as owners
This is the net result of all items of income and expense recognised for the period. It is the aggregate of operating result and other movements in equity, other than transactions with owners as owners.
Financial Asset
A financial asset is any asset that is:
| | • | | an equity instrument of another entity; |
| | (i) | to receive cash or another financial asset from another entity; or |
| | (ii) | to exchange financial assets or financial liabilities with another entity under conditions that are potentially favourable to the entity; or |
| | • | | a contract that will or may be settled in the entity’s own equity instruments and is: |
| | (i) | a non-derivative for which the entity is or may be obliged to receive a variable number of the entity’s own equity instruments; or |
| | (ii) | a derivative that will or may be settled other than by the exchange of a fixed amount of cash or another financial asset for a fixed number of the entity’s own equity instruments. For this purpose the entity’s own equity instruments do not include instruments that are themselves contracts for the future receipt or delivery of the entity’s own equity instruments. |
Key Fiscal Aggregates
Key fiscal aggregates are referred to as analytical balances in the ABS GFS Manual, these are data identified in the ABS GFS Manual as useful for macro-economic analysis purposes, including assessing the impact of a government on the economy. They are opening net worth, net operating balance (which equals change in net worth due to transactions), net lending/(borrowing), change in net worth due to other changes in the volume of assets, total change in net worth, closing net worth and cash surplus/(deficit).
| | |
| Audited Consolidated Financial Statements 2010–11 – Government of Queensland | | 6-29 |
Notes to the Financial Statements
| 1. | Significant Accounting Policies continued |
| (ap) | Key GFS technical terms continued |
Net Debt
Net debt equals (deposit liabilities held plus advances and borrowing liabilities) less (cash and deposits, plus investments plus asset advances outstanding). It is based on the definition in the ABS GFS Manual. The extent of accumulated net debt is currently the most common measure used to judge the overall strength of a jurisdiction’s fiscal position.
Net Lending/(Borrowing)
This measures the financing requirements of government, and is calculated as the net operating balance, less the net acquisition of non-financial assets. A positive result reflects a net lending position and a negative result reflects a net borrowing position, based on the definition in the ABS GFS Manual.
Net Operating Balance
This is calculated as income from transactions minus expenses from transactions, based on the definition in the ABS GFS Manual.
Net Worth
Net worth is the result of assets less liabilities and shares/contributed capital. For the State, net worth is assets less liabilities since shares and contributed capital is zero. It is an economic measure of wealth and reflects the contribution of governments to the wealth of Australia.
Non-profit Institution
A non-profit institution is a legal or social entity that is created for the purpose of producing or distributing goods and services but is not permitted to be a source of income, profit or other financial gain for the units that establish, control or finance it.
Non-financial Asset
These are all assets that are not ‘financial assets’.
Operating Result
Operating result is a measure of financial performance of the operations of the State for the period. It is the net result of items of revenue, gains and expenses (including losses) recognised for the period, excluding those that are classified as ‘other movements in equity’.
Other Economic Flows
Changes in the volume or value of an asset or liability that do not result from transactions (i.e. revaluations and other changes in the volume of assets) are other economic flows.
Transactions
Transactions are interactions between two institutional units by mutual agreement or actions within a unit that it is analytically useful to treat as transactions as defined in the ABS GFS Manual.
Whole of Government Financial Report
A whole of government financial report is a financial report prepared by a government that is prepared in accordance with Australian Accounting Standards, including AASB 127 Consolidated and Separate Financial Statements and thereby separately recognises assets, liabilities, income, expenses and cash flows of all entities under the control of the government on a line-by-line basis.
| | |
| 6-30 | | Audited Consolidated Financial Statements 2010–11 – Government of Queensland |
Notes to the Financial Statements
| 2. | Disaggregated Information |
Operating Statement
| | | | | | | | | | | | | | | | | | | | | | | | | | | | | | | | | | | | | | | | | | |
| | | | | General
Government (a) | | | Public
Non-financial
Corporations (a) | | | Public
Financial
Corporations (a) | | | Consolidation
Adjustments | | | Consolidated | |
| | | | | 2011 | | | 2010 | | | 2011 | | | 2010 | | | 2011 | | | 2010 | | | 2011 | | | 2010 | | | 2011 | | | 2010 | |
| | | | | $M | | | $M | | | $M | | | $M | | | $M | | | $M | | | $M | | | $M | | | $M | | | $M | |
| | Continuing Operations | | | | | | | | | | | | | | | | | | | | | | | | | | | | | | | | | | | | | | | | |
| | Revenue from Transactions | | | | | | | | | | | | | | | | | | | | | | | | | | | | | | | | | | | | | | | | |
| | Taxation revenue | | | 9,975 | | | | 9,375 | | | | — | | | | — | | | | — | | | | — | | | | (345 | ) | | | (274 | ) | | | 9,630 | | | | 9,101 | |
| | Grants revenue | | | 20,272 | | | | 20,205 | | | | 2,266 | | | | 2,203 | | | | — | | | | — | | | | (2,064 | ) | | | (2,056 | ) | | | 20,474 | | | | 20,352 | |
| | Sales of goods and services | | | 4,172 | | | | 3,961 | | | | 6,647 | | | | 6,005 | | | | 1,327 | | | | 1,127 | | | | (670 | ) | | | (789 | ) | | | 11,476 | | | | 10,303 | |
| | Interest income | | | 2,365 | | | | 2,204 | | | | 150 | | | | 108 | | | | 4,580 | | | | 4,062 | | | | (5,082 | ) | | | (4,454 | ) | | | 2,013 | | | | 1,919 | |
| | Dividend and income tax equivalents income | | | 1,232 | | | | 949 | | | | — | | | | — | | | | — | | | | — | | | | (1,228 | ) | | | (949 | ) | | | 4 | | | | — | |
| | Other revenue | | | 3,941 | | | | 3,033 | | | | 511 | | | | 357 | | | | 65 | | | | 66 | | | | (290 | ) | | | (5 | ) | | | 4,228 | | | | 3,452 | |
| | Continuing Operations | | | | | | | | | | | | | | | | | | | | | | | | | | | | | | | | | | | | | | | | |
| | Total Revenue from Transactions | | | 41,957 | | | | 39,727 | | | | 9,574 | | | | 8,673 | | | | 5,972 | | | | 5,255 | | | | (9,678 | ) | | | (8,528 | ) | | | 47,825 | | | | 45,127 | |
Less | | Continuing Operations | | | | | | | | | | | | | | | | | | | | | | | | | | | | | | | | | | | | | | | | |
| | Expenses from Transactions | | | | | | | | | | | | | | | | | | | | | | | | | | | | | | | | | | | | | | | | |
| | Employee expenses | | | 16,820 | | | | 15,566 | | | | 1,489 | | | | 1,173 | | | | 210 | | | | 196 | | | | (297 | ) | | | (274 | ) | | | 18,222 | | | | 16,660 | |
| | Superannuation expenses | | | | | | | | | | | | | | | | | | | | | | | | | | | | | | | | | | | | | | | | |
| | Superannuation interest cost | | | 1,240 | | | | 1,320 | | | | (15 | ) | | | (8 | ) | | | — | | | | — | | | | — | | | | — | | | | 1,225 | | | | 1,312 | |
| | Other superannuation expenses | | | 2,171 | | | | 2,051 | | | | 224 | | | | 176 | | | | 13 | | | | 13 | | | | — | | | | — | | | | 2,408 | | | | 2,240 | |
| | Other operating expenses | | | 8,646 | | | | 7,569 | | | | 3,092 | | | | 2,702 | | | | 1,542 | | | | 1,645 | | | | (501 | ) | | | (692 | ) | | | 12,779 | | | | 11,224 | |
| | Depreciation and amortisation | | | 2,506 | | | | 2,501 | | | | 2,016 | | | | 1,779 | | | | 37 | | | | 28 | | | | — | | | | — | | | | 4,559 | | | | 4,308 | |
| | Other interest expense | | | 1,125 | | | | 803 | | | | 2,288 | | | | 2,092 | | | | 5,920 | | | | 5,285 | | | | (5,299 | ) | | | (4,556 | ) | | | 4,035 | | | | 3,625 | |
| | Grants expenses | | | 10,964 | | | | 9,790 | | | | 166 | | | | 79 | | | | — | | | | — | | | | (2,334 | ) | | | (2,056 | ) | | | 8,796 | | | | 7,812 | |
| | Other property expenses | | | — | | | | — | | | | 361 | | | | 243 | | | | 36 | | | | 43 | | | | (397 | ) | | | (286 | ) | | | — | | | | — | |
| | Continuing Operations | | | | | | | | | | | | | | | | | | | | | | | | | | | | | | | | | | | | | | | | |
| | Total Expenses from Transactions | | | 43,473 | | | | 39,599 | | | | 9,620 | | | | 8,235 | | | | 7,759 | | | | 7,211 | | | | (8,828 | ) | | | (7,864 | ) | | | 52,024 | | | | 47,182 | |
Equals | | Continuing Operations | | | | | | | | | | | | | | | | | | | | | | | | | | | | | | | | | | | | | | | | |
| | Net Operating Balance | | | (1,516 | ) | | | 128 | | | | (46 | ) | | | 437 | | | | (1,787 | ) | | | (1,956 | ) | | | (850 | ) | | | (664 | ) | | | (4,199 | ) | | | (2,055 | ) |
add | | Discontinued Operations | | | | | | | | | | | | | | | | | | | | | | | | | | | | | | | | | | | | | | | | |
| | Net Operating Balance | | | — | | | | — | | | | 424 | | | | (3 | ) | | | — | | | | — | | | | — | | | | — | | | | 424 | | | | (3 | ) |
Equals | | Net Operating Balance | | | (1,516 | ) | | | 128 | | | | 378 | | | | 435 | | | | (1,787 | ) | | | (1,956 | ) | | | (850 | ) | | | (664 | ) | | | (3,775 | ) | | | (2,058 | ) |
| (a) | See Note 1(c) for explanation of sectors. |
| | |
| Audited Consolidated Financial Statements 2010–11 – Government of Queensland | | 6-31 |
Notes to the Financial Statements
| 2. | Disaggregated Information continued |
| | | | | | | | | | | | | | | | | | | | | | | | | | | | | | | | | | | | | | | | |
| | | General
Government (a) | | | Public
Non-financial
Corporations (a) | | | Public
Financial
Corporations (a) | | | Consolidation
Adjustments | | | Consolidated | |
| | | 2011 | | | 2010 | | | 2011 | | | 2010 | | | 2011 | | | 2010 | | | 2011 | | | 2010 | | | 2011 | | | 2010 | |
| | | $M | | | $M | | | $M | | | $M | | | $M | | | $M | | | $M | | | $M | | | $M | | | $M | |
Continuing Operations | | | | | | | | | | | | | | | | | | | | | | | | | | | | | | | | | | | | | | | | |
Other Economic Flows | | | | | | | | | | | | | | | | | | | | | | | | | | | | | | | | | | | | | | | | |
Included in Operating Result | | | | | | | | | | | | | | | | | | | | | | | | | | | | | | | | | | | | | | | | |
Gain on sale of assets and investments | | | 166 | | | | — | | | | 613 | | | | 8 | | | | — | | | | — | | | | (210 | ) | | | — | | | | 569 | | | | 8 | |
Revaluation increments and impairment loss reversals | | | 46 | | | | 27 | | | | 26 | | | | 107 | | | | 1,824 | | | | 3 | | | | (5 | ) | | | 414 | | | | 1,892 | | | | 551 | |
Loss on sale of assets and investments | | | (36 | ) | | | (13 | ) | | | — | | | | (54 | ) | | | (899 | ) | | | (860 | ) | | | 197 | | | | — | | | | (737 | ) | | | (926 | ) |
Asset write-down, revaluation decrements and impairment loss | | | (383 | ) | | | (436 | ) | | | (2,078 | ) | | | (244 | ) | | | (122 | ) | | | (110 | ) | | | 17 | | | | (348 | ) | | | (2,566 | ) | | | (1,137 | ) |
Actuarial adjustments to liabilities | | | 65 | | | | (56 | ) | | | — | | | | (24 | ) | | | (9 | ) | | | — | | | | — | | | | — | | | | 56 | | | | (79 | ) |
Deferred income tax equivalents | | | (1,142 | ) | | | (139 | ) | | | 1,308 | | | | 25 | | | | (167 | ) | | | 114 | | | | — | | | | — | | | | — | | | | — | |
Dividends and tax equivalents treated as capital returns | | | 1,396 | | | | — | | | | — | | | | — | | | | — | | | | — | | | | (1,396 | ) | | | — | | | | — | | | | — | |
Other | | | 5 | | | | (320 | ) | | | 118 | | | | (752 | ) | | | 2,822 | | | | 3,378 | | | | — | | | | — | | | | 2,945 | | | | 2,306 | |
| | | | | | | | | | |
Continuing Operations | | | | | | | | | | | | | | | | | | | | | | | | | | | | | | | | | | | | | | | | |
Total Other Economic Flows | | | | | | | | | | | | | | | | | | | | | | | | | | | | | | | | | | | | | | | | |
Included in Operating Result | | | 117 | | | | (936 | ) | | | (13 | ) | | | (933 | ) | | | 3,450 | | | | 2,525 | | | | (1,396 | ) | | | 66 | | | | 2,159 | | | | 722 | |
Discontinued Operations | | | | | | | | | | | | | | | | | | | | | | | | | | | | | | | | | | | | | | | | |
Total Other Economic Flows | | | | | | | | | | | | | | | | | | | | | | | | | | | | | | | | | | | | | | | | |
Included in Operating Result | | | — | | | | — | | | | (55 | ) | | | (1,841 | ) | | | — | | | | — | | | | — | | | | — | | | | (55 | ) | | | (1,841 | ) |
Total Other Economic Flows | | | | | | | | | | | | | | | | | | | | | | | | | | | | | | | | | | | | | | | | |
Included in Operating Result | | | 117 | | | | (936 | ) | | | (67 | ) | | | (2,774 | ) | | | 3,450 | | | | 2,525 | | | | (1,396 | ) | | | 66 | | | | 2,104 | | | | (1,120 | ) |
| | | | | | | | | | |
Continuing Operations | | | | | | | | | | | | | | | | | | | | | | | | | | | | | | | | | | | | | | | | |
Operating Result | | | (1,399 | ) | | | (808 | ) | | | (58 | ) | | | (496 | ) | | | 1,663 | | | | 569 | | | | (2,246 | ) | | | (598 | ) | | | (2,040 | ) | | | (1,333 | ) |
Discontinued Operations | | | | | | | | | | | | | | | | | | | | | | | | | | | | | | | | | | | | | | | | |
Operating Result | | | — | | | | — | | | | 369 | | | | (1,844 | ) | | | — | | | | — | | | | — | | | | — | | | | 369 | | | | (1,844 | ) |
Operating Result | | | (1,399 | ) | | | (808 | ) | | | 311 | | | | (2,340 | ) | | | 1,663 | | | | 569 | | | | (2,246 | ) | | | (598 | ) | | | (1,671 | ) | | | (3,177 | ) |
| | | | | | | | | | |
Other Economic Flows | | | | | | | | | | | | | | | | | | | | | | | | | | | | | | | | | | | | | | | | |
Other Movements in Equity | | | | | | | | | | | | | | | | | | | | | | | | | | | | | | | | | | | | | | | | |
Adjustments to opening balances | | | — | | | | 66 | | | | — | | | | 10 | | | | — | | | | — | | | | — | | | | — | | | | — | | | | 76 | |
Revaluations | | | (2,939 | ) | | | (7,867 | ) | | | (859 | ) | | | (1,469 | ) | | | (1 | ) | | | (4 | ) | | | 563 | | | | 3,753 | | | | (3,235 | ) | | | (5,587 | ) |
Other | | | (28 | ) | | | (79 | ) | | | 511 | | | | 78 | | | | 23 | | | | — | | | | 34 | | | | — | | | | 541 | | | | (1 | ) |
Total Other Economic Flows | | | | | | | | | | | | | | | | | | | | | | | | | | | | | | | | | | | | | | | | |
Other Movements in Equity | | | (2,966 | ) | | | (7,880 | ) | | | (347 | ) | | | (1,380 | ) | | | 23 | | | | (4 | ) | | | 597 | | | | 3,753 | | | | (2,695 | ) | | | (5,511 | ) |
| | | | | | | | | | |
Comprehensive Result | | | (4,365 | ) | | | (8,689 | ) | | | (36 | ) | | | (3,720 | ) | | | 1,686 | | | | 565 | | | | (1,650 | ) | | | 3,155 | | | | (4,365 | ) | | | (8,689 | ) |
| (a) | See Note 1(c) for explanation of sectors. |
| | |
| 6-32 | | Audited Consolidated Financial Statements 2010–11 – Government of Queensland |
Notes to the Financial Statements
| 2. | Disaggregated Information continued |
| | | | | | | | | | | | | | | | | | | | | | | | | | | | | | | | | | | | | | | | | | | | |
| | | | | General
Government (a) | | | Public
Non-financial
Corporations (a) | | | Public
Financial
Corporations (a) | | | Consolidation
Adjustments | | | Consolidated | |
| | | | | 2011 | | | 2010 | | | 2011 | | | 2010 | | | 2011 | | | 2010 | | | 2011 | | | 2010 | | | 2011 | | | 2010 | |
| | | | | $M | | | $M | | | $M | | | $M | | | $M | | | $M | | | $M | | | $M | | | $M | | | $M | |
| | Transactions With Owners In Their Capacity as Owners | | | | | | | | | | | | | | | | | | | | | | | | | | | | | | | | | | | | | | | | |
| | Ordinary dividends provided or paid | | | — | | | | — | | | | (830 | ) | | | (651 | ) | | | (20 | ) | | | (13 | ) | | | 850 | | | | 664 | | | | — | | | | — | |
| | Dividends treated as capital returns paid or provided | | | — | | | | — | | | | (1,246 | ) | | | — | | | | (150 | ) | | | — | | | | 1,396 | | | | — | | | | — | | | | — | |
| | Equity injections/(withdrawals) | | | — | | | | — | | | | (979 | ) | | | (198 | ) | | | 98 | | | | — | | | | 881 | | | | 198 | | | | — | | | | — | |
| | Total Transactions With Owners In Their Capacity as Owners | | | — | | | | — | | | | (3,055 | ) | | | (849 | ) | | | (73 | ) | | | (13 | ) | | | 3,128 | | | | 862 | | | | — | | | | — | |
| | | | | | | | | | | |
| | Total Change In Net Worth | | | (4,365 | ) | | | (8,689 | ) | | | (3,091 | ) | | | (4,569 | ) | | | 1,613 | | | | 552 | | | | 1,478 | | | | 4,017 | | | | (4,365 | ) | | | (8,689 | ) |
| | | | | | | | | | | | | | | | | | | | | | | | | | | | | | | | | | | | | | | | | | | | |
| | | | | | | | | | | |
| | KEY FISCAL AGGREGATES | | | | | | | | | | | | | | | | | | | | | | | | | | | | | | | | | | | | | | | | |
| | | | | | | | | | | |
| | Net Operating Balance | | | (1,516 | ) | | | 128 | | | | 378 | | | | 435 | | | | (1,787 | ) | | | (1,956 | ) | | | (850 | ) | | | (664 | ) | | | (3,775 | ) | | | (2,058 | ) |
| | | | | | | | | | | |
Less | | Net Acquisition/(Disposal) of Non-Financial Assets | | | | | | | | | | | | | | | | | | | | | | | | | | | | | | | | | | | | | | | | |
| | Purchases of non-financial assets | | | 8,237 | | | | 8,959 | | | | 5,106 | | | | 6,503 | | | | 79 | | | | 90 | | | | 1 | | | | (455 | ) | | | 13,423 | | | | 15,097 | |
| | Less | | Sales of non-financial assets | | | 252 | | | | 218 | | | | 407 | | | | 604 | | | | — | | | | — | | | | — | | | | (449 | ) | | | 659 | | | | 373 | |
| | Less | | Depreciation | | | 2,506 | | | | 2,501 | | | | 2,133 | | | | 2,466 | | | | 37 | | | | 28 | | | | — | | | | — | | | | 4,677 | | | | 4,995 | |
| | Plus | | Change in inventories | | | 80 | | | | 78 | | | | (43 | ) | | | (330 | ) | | | — | | | | — | | | | — | | | | — | | | | 37 | | | | (252 | ) |
| | Plus | | Other movement in non-financial assets | | | 15 | | | | 348 | | | | 39 | | | | 26 | | | | — | | | | — | | | | — | | | | — | | | | 54 | | | | 374 | |
| | Equals | | Total Net Acquisition/(Disposal) of Non-Financial Assets | | | 5,573 | | | | 6,665 | | | | 2,561 | | | | 3,130 | | | | 42 | | | | 61 | | | | 1 | | | | (5 | ) | | | 8,177 | | | | 9,851 | |
| | | | | | | | | | | | |
| | Equals | | Net Lending/(Borrowing) | | | (7,089 | ) | | | (6,537 | ) | | | (2,183 | ) | | | (2,695 | ) | | | (1,829 | ) | | | (2,018 | ) | | | (852 | ) | | | (659 | ) | | | (11,952 | ) | | | (11,909 | ) |
| (a) | See Note 1(c) for explanation of sectors. |
| | |
| Audited Consolidated Financial Statements 2010–11 – Government of Queensland | | 6-33 |
Notes to the Financial Statements
| 2. | Disaggregated Information continued |
Balance Sheet
| | | | | | | | | | | | | | | | | | | | | | | | | | | | | | | | | | | | | | | | |
| | | General
Government (a) | | | Public
Non-financial
Corporations (a) | | | Public
Financial
Corporations (a) | | | Consolidation
Adjustments | | | Consolidated | |
| | | 2011 | | | 2010 | | | 2011 | | | 2010 | | | 2011 | | | 2010 | | | 2011 | | | 2010 | | | 2011 | | | 2010 | |
| | | $M | | | $M | | | $M | | | $M | | | $M | | | $M | | | $M | | | $M | | | $M | | | $M | |
Assets | | | | | | | | | | | | | | | | | | | | | | | | | | | | | | | | | | | | | | | | |
Financial Assets | | | | | | | | | | | | | | | | | | | | | | | | | | | | | | | | | | | | | | | | |
| | | | | | | | | | |
Cash and deposits | | | 635 | | | | 904 | | | | 4,117 | | | | 2,056 | | | | 22 | | | | 28 | | | | (3,415 | ) | | | (1,677 | ) | | | 1,359 | | | | 1,311 | |
Receivables and loans | | | | | | | | | | | | | | | | | | | | | | | | | | | | | | | | | | | | | | | | |
Receivables | | | 4,493 | | | | 3,478 | | | | 2,020 | | | | 1,476 | | | | 377 | | | | 178 | | | | (1,742 | ) | | | (1,185 | ) | | | 5,148 | | | | 3,947 | |
Advances paid | | | 594 | | | | 582 | | | | 283 | | | | 310 | | | | — | | | | — | | | | (12 | ) | | | (13 | ) | | | 865 | | | | 879 | |
Loans paid | | | 31,233 | | | | 23,350 | | | | 117 | | | | 118 | | | | 57,092 | | | | 55,313 | | | | (82,555 | ) | | | (73,998 | ) | | | 5,888 | | | | 4,784 | |
Securities other than shares | | | 2,118 | | | | 4,896 | | | | 437 | | | | 776 | | | | 50,692 | | | | 40,707 | | | | (20 | ) | | | (20 | ) | | | 53,227 | | | | 46,359 | |
Shares and other equity investments | | | | | | | | | | | | | | | | | | | | | | | | | | | | | | | | | | | | | | | | |
Investments in public sector entities | | | 18,168 | | | | 19,710 | | | | — | | | | — | | | | 98 | | | | — | | | | (18,266 | ) | | | (19,710 | ) | | | — | | | | — | |
Investments in other entities | | | 5 | | | | 3 | | | | 9 | | | | 19 | | | | 2,804 | | | | — | | | | — | | | | — | | | | 2,818 | | | | 21 | |
Investments accounted for using equity method | | | 112 | | | | 51 | | | | 97 | | | | 56 | | | | 1 | | | | 1 | | | | — | | | | — | | | | 210 | | | | 108 | |
Total Financial Assets | | | 57,358 | | | | 52,975 | | | | 7,081 | | | | 4,811 | | | | 111,085 | | | | 96,226 | | | | (106,010 | ) | | | (96,602 | ) | | | 69,515 | | | | 57,409 | |
| | | | | | | | | | |
Non-Financial Assets | | | | | | | | | | | | | | | | | | | | | | | | | | | | | | | | | | | | | | | | |
| | | | | | | | | | |
Inventories | | | 678 | | | | 599 | | | | 520 | | | | 519 | | | | — | | | | — | | | | — | | | | — | | | | 1,199 | | | | 1,118 | |
Assets held for sale | | | 198 | | | | 129 | | | | 174 | | | | 7,369 | | | | — | | | | 3 | | | | — | | | | — | | | | 371 | | | | 7,501 | |
Investment properties | | | 251 | | | | 254 | | | | 1,270 | | | | 1,556 | | | | — | | | | — | | | | — | | | | — | | | | 1,521 | | | | 1,810 | |
Biological assets | | | 9 | | | | 10 | | | | 1 | | | | — | | | | — | | | | — | | | | — | | | | — | | | | 10 | | | | 10 | |
Property, plant and equipment | | | 169,160 | | | | 166,430 | | | | 48,749 | | | | 53,907 | | | | 289 | | | | 256 | | | | (1 | ) | | | (35 | ) | | | 218,196 | | | | 220,559 | |
Intangibles | | | 872 | | | | 856 | | | | 223 | | | | 322 | | | | 40 | | | | 34 | | | | — | | | | — | | | | 1,135 | | | | 1,212 | |
Deferred tax assets | | | 5,504 | | | | 6,495 | | | | 1,190 | | | | 1,267 | | | | 598 | | | | 555 | | | | (7,291 | ) | | | (8,317 | ) | | | — | | | | — | |
Other non-financial assets | | | 283 | | | | 324 | | | | 255 | | | | 298 | | | | 8 | | | | 9 | | | | (44 | ) | | | (57 | ) | | | 501 | | | | 573 | |
Total Non-Financial Assets | | | 176,955 | | | | 175,097 | | | | 52,380 | | | | 65,238 | | | | 934 | | | | 857 | | | | (7,336 | ) | | | (8,410 | ) | | | 222,934 | | | | 232,783 | |
| | | | | | | | | | |
Total Assets | | | 234,313 | | | | 228,072 | | | | 59,461 | | | | 70,049 | | | | 112,020 | | | | 97,083 | | | | (113,345 | ) | | | (105,012 | ) | | | 292,449 | | | | 290,192 | |
| (a) | See Note 1(c) for explanation of sectors. |
| | |
| 6-34 | | Audited Consolidated Financial Statements 2010–11 – Government of Queensland |
Notes to the Financial Statements
| 2. | Disaggregated Information continued |
| | | | | | | | | | | | | | | | | | | | | | | | | | | | | | | | | | | | | | | | |
| | | General
Government (a) | | | Public
Non-financial
Corporations (a) | | | Public
Financial
Corporations (a) | | | Consolidation
Adjustments | | | Consolidated | |
| | | 2011 | | | 2010 | | | 2011 | | | 2010 | | | 2011 | | | 2010 | | | 2011 | | | 2010 | | | 2011 | | | 2010 | |
| | | $M | | | $M | | | $M | | | $M | | | $M | | | $M | | | $M | | | $M | | | $M | | | $M | |
Liabilities | | | | | | | | | | | | | | | | | | | | | | | | | | | | | | | | | | | | | | | | |
| | | | | | | | | | |
Payables | | | 3,918 | | | | 3,712 | | | | 2,429 | | | | 1,998 | | | | 210 | | | | 232 | | | | (1,703 | ) | | | (1,165 | ) | | | 4,853 | | | | 4,778 | |
Employee benefit obligations | | | | | | | | | | | | | | | | | | | | | | | | | | | | | | | | | | | | | | | | |
Superannuation liability | | | 25,236 | | | | 24,687 | | | | (77 | ) | | | 95 | | | | — | | | | — | | | | — | | | | — | | | | 25,159 | | | | 24,782 | |
Other employee benefits | | | 4,624 | | | | 4,176 | | | | 645 | | | | 570 | | | | 87 | | | | 66 | | | | — | | | | — | �� | | | 5,356 | | | | 4,812 | |
Deposits held | | | 1 | | | | — | | | | 20 | | | | 16 | | | | 36,643 | | | | 28,104 | | | | (33,106 | ) | | | (24,950 | ) | | | 3,557 | | | | 3,170 | |
Borrowings and advances | | | | | | | | | | | | | | | | | | | | | | | | | | | | | | | | | | | | | | | | |
Advances received | | | 444 | | | | 463 | | | | 11 | | | | 12 | | | | — | | | | — | | | | (11 | ) | | | (12 | ) | | | 444 | | | | 463 | |
Borrowings | | | 25,089 | | | | 15,916 | | | | 28,666 | | | | 35,565 | | | | 1 | | | | 1 | | | | (52,884 | ) | | | (50,746 | ) | | | 872 | | | | 736 | |
Securities and derivatives | | | — | | | | — | | | | 297 | | | | 234 | | | | 73,295 | | | | 68,966 | | | | — | | | | — | | | | 73,592 | | | | 69,200 | |
Deferred tax liabilities | | | 1,787 | | | | 1,822 | | | | 5,287 | | | | 6,486 | | | | 216 | | | | 9 | | | | (7,291 | ) | | | (8,371 | ) | | | — | | | | — | |
Provisions | | | 1,279 | | | | 1,141 | | | | 827 | | | | 660 | | | | 2,974 | | | | 2,722 | | | | (39 | ) | | | (20 | ) | | | 5,040 | | | | 4,503 | |
Other liabilities | | | 713 | | | | 567 | | | | 1,676 | | | | 1,643 | | | | 8 | | | | 8 | | | | (44 | ) | | | (57 | ) | | | 2,352 | | | | 2,161 | |
| | | | | | | | | | |
Total Liabilities | | | 63,091 | | | | 52,484 | | | | 39,782 | | | | 47,279 | | | | 113,433 | | | | 100,109 | | | | (95,079 | ) | | | (85,267 | ) | | | 121,227 | | | | 114,604 | |
| | | | | | | | | | |
Net Assets | | | 171,222 | | | | 175,588 | | | | 19,679 | | | | 22,770 | | | | (1,413 | ) | | | (3,026 | ) | | | (18,267 | ) | | | (19,745 | ) | | | 171,222 | | | | 175,588 | |
| | | | | | | | | | |
Net Worth | | | | | | | | | | | | | | | | | | | | | | | | | | | | | | | | | | | | | | | | |
| | | | | | | | | | |
Contributed equity | | | — | | | | — | | | | 11,021 | | | | 12,000 | | | | 135 | | | | 37 | | | | (11,156 | ) | | | (12,073 | ) | | | — | | | | — | |
Accumulated surplus/(deficit) | | | 88,666 | | | | 89,368 | | | | (511 | ) | | | (1,089 | ) | | | (1,744 | ) | | | (3,279 | ) | | | (102 | ) | | | (136 | ) | | | 86,309 | | | | 84,864 | |
Reserves | | | 82,557 | | | | 86,219 | | | | 9,169 | | | | 11,860 | | | | 196 | | | | 216 | | | | (7,008 | ) | | | (7,571 | ) | | | 84,913 | | | | 90,724 | |
| | | | | | | | | | |
Total Net Worth | | | 171,222 | | | | 175,588 | | | | 19,679 | | | | 22,770 | | | | (1,413 | ) | | | (3,026 | ) | | | (18,267 | ) | | | (19,744 | ) | | | 171,222 | | | | 175,588 | |
| | | | | | | | | | | | | | | | | | | | | | | | | | | | | | | | | | | | | | | | |
| | | | | | | | | | |
KEY FISCAL AGGREGATES | | | | | | | | | | | | | | | | | | | | | | | | | | | | | | | | | | | | | | | | |
| | | | | | | | | | |
Net Financial Worth | | | (5,733 | ) | | | 491 | | | | (32,701 | ) | | | (42,468 | ) | | | (2,347 | ) | | | (3,880 | ) | | | (10,931 | ) | | | (11,339 | ) | | | (51,712 | ) | | | (57,195 | ) |
Net Financial Liabilities | | | 23,900 | | | | 19,218 | | | | N/A | | | | N/A | | | | N/A | | | | N/A | | | | N/A | | | | N/A | | | | 51,712 | | | | 57,195 | |
Net Debt | | | (9,047 | ) | | | (13,354 | ) | | | 24,040 | | | | 32,566 | | | | 2,133 | | | | 1,024 | | | | — | | | | — | | | | 17,126 | | | | 20,235 | |
| (a) | See Note 1(c) for explanation of sectors. |
| | |
| Audited Consolidated Financial Statements 2010–11 – Government of Queensland | | 6-35 |
Notes to the Financial Statements
| 2. | Disaggregated Information continued |
Cash Flow Statement
| | | | | | | | | | | | | | | | | | | | | | | | | | | | | | | | | | | | | | | | |
| | | General
Government (a) | | | Public
Non-financial
Corporations (a) | | | Public
Financial
Corporations (a) | | | Consolidation
Adjustments | | | Consolidated | |
| | | 2011 | | | 2010 | | | 2011 | | | 2010 | | | 2011 | | | 2010 | | | 2011 | | | 2010 | | | 2011 | | | 2010 | |
| | | $M | | | $M | | | $M | | | $M | | | $M | | | $M | | | $M | | | $M | | | $M | | | $M | |
Cash Flows from Operating Activities | | | | | | | | | | | | | | | | | | | | | | | | | | | | | | | | | | | | | | | | |
Cash received | | | | | | | | | | | | | | | | | | | | | | | | | | | | | | | | | | | | | | | | |
Taxes received | | | 9,900 | | | | 9,311 | | | | — | | | | — | | | | — | | | | — | | | | (315 | ) | | | (294 | ) | | | 9,586 | | | | 9,017 | |
Grants and subsidies received | | | 20,278 | | | | 20,078 | | | | 2,151 | | | | 2,138 | | | | — | | | | — | | | | (1,954 | ) | | | (1,998 | ) | | | 20,475 | | | | 20,218 | |
Sales of goods and services | | | 4,429 | | | | 4,410 | | | | 9,290 | | | | 10,313 | | | | 1,280 | | | | 1,281 | | | | (367 | ) | | | (926 | ) | | | 14,632 | | | | 15,078 | |
Interest receipts | | | 2,276 | | | | 2,159 | | | | 149 | | | | 107 | | | | 4,570 | | | | 3,931 | | | | (5,084 | ) | | | (4,103 | ) | | | 1,912 | | | | 2,094 | |
Dividends and income tax equivalents | | | 1,096 | | | | 1,102 | | | | — | | | | — | | | | — | | | | — | | | | (1,092 | ) | | | (1,101 | ) | | | 4 | | | | 1 | |
Other receipts | | | 5,361 | | | | 4,325 | | | | 1,277 | | | | 761 | | | | 92 | | | | 14 | | | | (11 | ) | | | (4 | ) | | | 6,718 | | | | 5,096 | |
| | | 43,340 | | | | 41,385 | | | | 12,867 | | | | 13,319 | | | | 5,942 | | | | 5,226 | | | | (8,823 | ) | | | (8,427 | ) | | | 53,327 | | | | 51,503 | |
Cash paid | | | | | | | | | | | | | | | | | | | | | | | | | | | | | | | | | | | | | | | | |
Payments for employees | | | (18,571 | ) | | | (17,684 | ) | | | (2,193 | ) | | | (2,406 | ) | | | (202 | ) | | | (202 | ) | | | 297 | | | | 274 | | | | (20,669 | ) | | | (20,019 | ) |
Payments for goods and services | | | (10,531 | ) | | | (9,160 | ) | | | (4,803 | ) | | | (4,480 | ) | | | (205 | ) | | | (172 | ) | | | 351 | | | | 765 | | | | (15,187 | ) | | | (13,048 | ) |
Grants and subsidies | | | (10,223 | ) | | | (9,614 | ) | | | (21 | ) | | | (71 | ) | | | — | | | | — | | | | 1,941 | | | | 1,998 | | | | (8,302 | ) | | | (7,686 | ) |
Interest paid | | | (1,118 | ) | | | (803 | ) | | | (2,110 | ) | | | (1,749 | ) | | | (5,931 | ) | | | (5,207 | ) | | | 5,276 | | | | 4,213 | | | | (3,882 | ) | | | (3,545 | ) |
Other payments | | | (793 | ) | | | (725 | ) | | | (1,564 | ) | | | (1,122 | ) | | | (1,295 | ) | | | (1,254 | ) | | | 371 | | | | 239 | | | | (3,281 | ) | | | (2,861 | ) |
| | | (41,235 | ) | | | (37,986 | ) | | | (10,690 | ) | | | (9,827 | ) | | | (7,633 | ) | | | (6,836 | ) | | | 8,237 | | | | 7,490 | | | | (51,322 | ) | | | (47,159 | ) |
| | | | | | | | | | |
Net Cash Flows from Operating Activities | | | 2,105 | | | | 3,399 | | | | 2,177 | | | | 3,492 | | | | (1,691 | ) | | | (1,610 | ) | | | (586 | ) | | | (938 | ) | | | 2,005 | | | | 4,344 | |
| | | | | | | | | | |
Cash Flows from Investing Activities | | | | | | | | | | | | | | | | | | | | | | | | | | | | | | | | | | | | | | | | |
Non-Financial Assets | | | | | | | | | | | | | | | | | | | | | | | | | | | | | | | | | | | | | | | | |
Purchases of non-financial assets | | | (8,237 | ) | | | (8,959 | ) | | | (5,106 | ) | | | (6,503 | ) | | | (79 | ) | | | (90 | ) | | | (1 | ) | | | 455 | | | | (13,423 | ) | | | (15,097 | ) |
Sales of non-financial assets | | | 252 | | | | 218 | | | | 407 | | | | 604 | | | | — | | | | — | | | | — | | | | (449 | ) | | | 659 | | | | 373 | |
| | | (7,985 | ) | | | (8,741 | ) | | | (4,698 | ) | | | (5,899 | ) | | | (79 | ) | | | (90 | ) | | | (1 | ) | | | 5 | | | | (12,764 | ) | | | (14,724 | ) |
| | | | | | | | | | |
Financial Assets (Policy Purposes) | | | 7,841 | | | | (217 | ) | | | 5,780 | | | | 143 | | | | — | | | | — | | | | (3,015 | ) | | | 625 | | | | 10,606 | | | | 551 | |
| | | | | | | | | | |
Financial Assets (Liquidity Purposes) | | | (4,956 | ) | | | (1,532 | ) | | | 22 | | | | (4 | ) | | | (5,951 | ) | | | 9,589 | | | | 6,741 | | | | 1,091 | | | | (4,143 | ) | | | 9,144 | |
| | | | | | | | | | |
Net Cash Flows from Investing Activities | | | (5,099 | ) | | | (10,490 | ) | | | 1,104 | | | | (5,760 | ) | | | (6,030 | ) | | | 9,499 | | | | 3,725 | | | | 1,722 | | | | (6,301 | ) | | | (5,029 | ) |
| (a) | See Note 1(c) for explanation of sectors. |
| | |
| 6-36 | | Audited Consolidated Financial Statements 2010–11 – Government of Queensland |
Notes to the Financial Statements
| 2. | Disaggregated Information continued |
| | | | | | | | | | | | | | | | | | | | | | | | | | | | | | | | | | | | | | | | |
| | | General
Government (a) | | | Public
Non-financial
Corporations (a) | | | Public
Financial
Corporations (a) | | | Consolidation
Adjustments | | | Consolidated | |
| | | 2011 | | | 2010 | | | 2011 | | | 2010 | | | 2011 | | | 2010 | | | 2011 | | | 2010 | | | 2011 | | | 2010 | |
| | | $M | | | $M | | | $M | | | $M | | | $M | | | $M | | | $M | | | $M | | | $M | | | $M | |
Receipts from Financing Activities | | | | | | | | | | | | | | | | | | | | | | | | | | | | | | | | | | | | | | | | |
Advances received (net) | | | (19 | ) | | | (21 | ) | | | (1 | ) | | | (1 | ) | | | — | | | | — | | | | 1 | | | | 1 | | | | (19 | ) | | | (21 | ) |
Proceeds of borrowing (net) | | | 1,311 | | | | 5,172 | | | | 166 | | | | 2,464 | | | | (1,945 | ) | | | (10,531 | ) | | | 2 | | | | (2 | ) | | | (467 | ) | | | (2,897 | ) |
Dividends paid (net) | | | — | | | | — | | | | (735 | ) | | | (912 | ) | | | (13 | ) | | | (18 | ) | | | 748 | | | | 931 | | | | — | | | | — | |
Deposits received (net) | | | — | | | | — | | | | 4 | | | | — | | | | 5,507 | | | | (2,173 | ) | | | (4,999 | ) | | | 1,191 | | | | 511 | | | | (982 | ) |
Other financing (net) | | | — | | | | — | | | | (653 | ) | | | 638 | | | | 4,167 | | | | 4,845 | | | | 804 | | | | (640 | ) | | | 4,318 | | | | 4,843 | |
Net Cash Flows from Financing Activities | | | 1,291 | | | | 5,151 | | | | (1,220 | ) | | | 2,189 | | | | 7,715 | | | | (7,876 | ) | | | (3,444 | ) | | | 1,481 | | | | 4,343 | | | | 944 | |
| | | | | | | | | | |
Net increase/(decreased) in Cash Held | | | (1,704 | ) | | | (1,940 | ) | | | 2,061 | | | | (78 | ) | | | (6 | ) | | | 13 | | | | (305 | ) | | | 2,265 | | | | 47 | | | | 260 | |
Cash at the beginning of the financial year | | | 904 | | | | 2,844 | | | | 2,056 | | | | 2,135 | | | | 28 | | | | 15 | | | | (1,678 | ) | | | (3,942 | ) | | | 1,311 | | | | 1,051 | |
Cash and Cash Equivalents Held at the End of the Financial Year | | | (799 | ) | | | 904 | | | | 4,117 | | | | 2,056 | | | | 22 | | | | 28 | | | | (1,980 | ) | | | (1,676 | ) | | | 1,359 | | | | 1,311 | |
| | | | | | | | | | |
KEY FISCAL AGGREGATES | | | | | | | | | | | | | | | | | | | | | | | | | | | | | | | | | | | | | | | | |
Net Cash from Operating Activities | | | 2,105 | | | | 3,399 | | | | 2,177 | | | | 3,492 | | | | (1,691 | ) | | | (1,610 | ) | | | (586 | ) | | | (938 | ) | | | 2,005 | | | | 4,344 | |
Net Cash Flow from Investments in Non-Financial Assets | | | (7,985 | ) | | | (8,741 | ) | | | (4,698 | ) | | | (5,899 | ) | | | (79 | ) | | | (90 | ) | | | (1 | ) | | | 5 | | | | (12,764 | ) | | | (14,724 | ) |
Dividends Paid | | | — | | | | — | | | | (735 | ) | | | (912 | ) | | | (13 | ) | | | (18 | ) | | | 748 | | | | 931 | | | | — | | | | — | |
CASH SURPLUS/(DEFICIT) | | | (5,880 | ) | | | (5,341 | ) | | | (3,257 | ) | | | (3,319 | ) | | | (1,784 | ) | | | (1,718 | ) | | | 161 | | | | (2 | ) | | | (10,759 | ) | | | (10,380 | ) |
| (a) | See Note 1(c) for explanation of sectors. |
| | |
| Audited Consolidated Financial Statements 2010–11 – Government of Queensland | | 6-37 |
Notes to the Financial Statements
| | | | | | | | | | | | | | | | |
| | | General Government
Sector | | | Total State Sector | |
| | | 2011 | | | 2010 | | | 2011 | | | 2010 | |
| | | $M | | | $M | | | $M | | | $M | |
| | | | |
3. Taxation revenue | | | | | | | | | | | | | | | | |
| | | | |
Taxes | | | | | | | | | | | | | | | | |
Transfer duty | | | 1,933 | | | | 1,978 | | | | 1,933 | | | | 1,964 | |
Vehicle registration | | | 1,768 | | | | 1,651 | | | | 1,768 | | | | 1,651 | |
Insurance duty | | | 484 | | | | 443 | | | | 484 | | | | 443 | |
Other duties | | | 33 | | | | 26 | | | | 33 | | | | 26 | |
Payroll tax | | | 3,023 | | | | 2,687 | | | | 2,910 | | | | 2,558 | |
Land tax | | | 1,042 | | | | 1,033 | | | | 1,028 | | | | 1,004 | |
Guarantee fees | | | 219 | | | | 112 | | | | 2 | | | | 11 | |
Various gaming taxes and other levies | | | 1,474 | | | | 1,446 | | | | 1,474 | | | | 1,446 | |
| | | | | | | | | | | | | | | | |
| | | 9,975 | | | | 9,375 | | | | 9,630 | | | | 9,101 | |
| | | | | | | | | | | | | | | | |
| | | | |
4. Grants revenue | | | | | | | | | | | | | | | | |
| | | | |
Commonwealth | | | | | | | | | | | | | | | | |
General purpose payments | | | | | | | | | | | | | | | | |
GST revenue grants | | | 8,412 | | | | 8,090 | | | | 8,412 | | | | 8,090 | |
Other general purpose payments | | | 26 | | | | 26 | | | | 68 | | | | 30 | |
Specific purpose payments | | | 4,132 | | | | 3,945 | | | | 4,132 | | | | 3,978 | |
National partnership payments | | | 4,766 | | | | 4,936 | | | | 4,766 | | | | 4,936 | |
Grants for on-passing to non Queensland Government entities | | | 2,368 | | | | 2,669 | | | | 2,368 | | | | 2,669 | |
| | | | | | | | | | | | | | | | |
| | | 19,702 | | | | 19,666 | | | | 19,745 | | | | 19,703 | |
Other | | | | | | | | | | | | | | | | |
Other grants | | | 198 | | | | 172 | | | | 215 | | | | 194 | |
Industry/community contributions | | | 372 | | | | 367 | | | | 514 | | | | 455 | |
| | | | | | | | | | | | | | | | |
| | | 570 | | | | 539 | | | | 729 | | | | 649 | |
| | | | | | | | | | | | | | | | |
| | | 20,272 | | | | 20,205 | | | | 20,474 | | | | 20,352 | |
| | | | | | | | | | | | | | | | |
| | | | |
5. Sales of goods and services | | | | | | | | | | | | | | | | |
| | | | |
User Charges | | | | | | | | | | | | | | | | |
Sale of goods and services | | | 2,863 | | | | 2,637 | | | | 10,083 | | | | 8,903 | |
Rental Income | | | 415 | | | | 402 | | | | 501 | | | | 479 | |
| | | | | | | | | | | | | | | | |
| | | 3,278 | | | | 3,039 | | | | 10,584 | | | | 9,382 | |
Fees | | | | | | | | | | | | | | | | |
Transport and other licences and permits | | | 494 | | | | 474 | | | | 494 | | | | 475 | |
Other regulatory fees | | | 400 | | | | 448 | | | | 398 | | | | 446 | |
| | | | | | | | | | | | | | | | |
| | | 894 | | | | 922 | | | | 892 | | | | 921 | |
| | | | | | | | | | | | | | | | |
| | | | |
| | | 4,172 | | | | 3,961 | | | | 11,476 | | | | 10,303 | |
| | | | | | | | | | | | | | | | |
| | | | |
6. Interest Income | | | | | | | | | | | | | | | | |
| | | | |
Interest | | | 2,365 | | | | 2,204 | | | | 2,013 | | | | 1,919 | |
| | | | | | | | | | | | | | | | |
| | | | |
Interest revenue from financial assets other than those at fair value through profit and loss totalled: | | | 151 | | | | 151 | | | | 211 | | | | 165 | |
| | | | |
7. Dividend and income tax equivalents income | | | | | | | | | | | | | | | | |
| | | | |
Dividends | | | 851 | | | | 664 | | | | — | | | | — | |
Income tax equivalents | | | 381 | | | | 285 | | | | 4 | | | | — | |
| | | | | | | | | | | | | | | | |
| | | 1,232 | | | | 949 | | | | 4 | | | | — | |
| | | | | | | | | | | | | | | | |
| | |
| 6-38 | | Audited Consolidated Financial Statements 2010–11 – Government of Queensland |
Notes to the Financial Statements
| | | | | | | | | | | | | | | | |
| | | General Government
Sector | | | Total State Sector | |
| | | 2011 | | | 2010 | | | 2011 | | | 2010 | |
| | | $M | | | $M | | | $M | | | $M | |
| 8. Other revenue | | | | | | | | | | | | | | | | |
| | | | |
Royalties | | | 2,722 | | | | 2,036 | | | | 2,722 | | | | 2,036 | |
Other territorial revenue | | | 154 | | | | 112 | | | | 137 | | | | 112 | |
Assets assumed/liabilities transferred | | | 287 | | | | 333 | | | | 287 | | | | 333 | |
Donations, gifts and services received at below fair value | | | 106 | | | | 51 | | | | 106 | | | | 51 | |
Contributed assets | | | 185 | | | | 28 | | | | 91 | | | | 60 | |
Fines | | | 295 | | | | 285 | | | | 295 | | | | 285 | |
Other | | | 192 | | | | 188 | | | | 589 | | | | 574 | |
| | | | | | | | | | | | | | | | |
| | | 3,941 | | | | 3,033 | | | | 4,228 | | | | 3,452 | |
| | | | | | | | | | | | | | | | |
| | | | |
| 9. Employee expenses (refer Note 54 for additional disclosures) | | | | | | | | | | | | | | | | |
| | | | |
Salaries and wages | | | 14,524 | | | | 13,377 | | | | 15,867 | | | | 14,420 | |
Annual leave | | | 1,388 | | | | 1,359 | | | | 1,517 | | | | 1,465 | |
Long service leave | | | 535 | | | | 504 | | | | 579 | | | | 566 | |
Other employee related expenses | | | 373 | | | | 326 | | | | 259 | | | | 209 | |
| | | | | | | | | | | | | | | | |
| | | 16,820 | | | | 15,566 | | | | 18,222 | | | | 16,660 | |
| | | | | | | | | | | | | | | | |
| | | | |
| 10. Superannuation expenses (refer Note 54 for additional disclosures) | | | | | | | | | | | | | | | | |
| | | | |
Superannuation interest cost | | | | | | | | | | | | | | | | |
Nominal interest | | | 1,063 | | | | 1,024 | | | | 1,048 | | | | 1,015 | |
Defined benefit interest cost | | | 177 | | | | 297 | | | | 177 | | | | 297 | |
| | | | | | | | | | | | | | | | |
| | | 1,240 | | | | 1,320 | | | | 1,225 | | | | 1,312 | |
| | | | | | | | | | | | | | | | |
Other superannuation expenses | | | | | | | | | | | | | | | | |
Accumulation contribution | | | 1,065 | | | | 976 | | | | 1,251 | | | | 1,120 | |
Defined benefit service cost | | | 1,106 | | | | 1,075 | | | | 1,157 | | | | 1,120 | |
| | | | | | | | | | | | | | | | |
| | | 2,171 | | | | 2,051 | | | | 2,408 | | | | 2,240 | |
| | | | | | | | | | | | | | | | |
| | | | |
| 11. Other operating expenses | | | | | | | | | | | | | | | | |
| | | | |
Supplies and services | | | 7,900 | | | | 6,917 | | | | 10,638 | | | | 8,952 | |
Workcover Qld and other claims | | | 170 | | | | 180 | | | | 1,554 | | | | 1,692 | |
Other expenses | | | 576 | | | | 472 | | | | 587 | | | | 580 | |
| | | | | | | | | | | | | | | | |
| | | 8,646 | | | | 7,569 | | �� | | 12,779 | | | | 11,224 | |
| | | | | | | | | | | | | | | | |
| | | | |
Audit fees charged by the Queensland Audit Office to entities included in these financial statements amounted to: | | | 9 | | | | 9 | | | | 14 | | | | 15 | |
| | | | |
| 12. Depreciation and amortisation | | | | | | | | | | | | | | | | |
| | | | |
Depreciation and amortisation expenses for the financial year were charged in respect of: | | | | | | | | | | | | | | | | |
Buildings | | | 965 | | | | 965 | | | | 1,074 | | | | 1,076 | |
Infrastructure | | | 901 | | | | 956 | | | | 2,497 | | | | 2,569 | |
Plant and equipment | | | 482 | | | | 419 | | | | 786 | | | | 780 | |
Major plant and equipment | | | 37 | | | | 28 | | | | 123 | | | | 251 | |
Heritage and cultural assets | | | 4 | | | | 3 | | | | 4 | | | | 3 | |
Leased plant and equipment | | | 6 | | | | 4 | | | | 51 | | | | 143 | |
Software development | | | 112 | | | | 126 | | | | 143 | | | | 174 | |
| | | | | | | | | | | | | | | | |
As per Notes 37 and 38 | | | 2,506 | | | | 2,501 | | | | 4,679 | | | | 4,996 | |
| | | | | | | | | | | | | | | | |
| | | | |
Continuing Operations | | | 2,506 | | | | 2,501 | | | | 4,559 | | | | 4,308 | |
Discontinuing Operations. Refer Note 59 | | | — | | | | — | | | | 120 | | | | 689 | |
| | | | | | | | | | | | | | | | |
| | | 2,506 | | | | 2,501 | | | | 4,679 | | | | 4,996 | |
| | | | | | | | | | | | | | | | |
| | |
| Audited Consolidated Financial Statements 2010–11 – Government of Queensland | | 6-39 |
Notes to the Financial Statements
| | | | | | | | | | | | | | | | |
| | | General Government
Sector | | | Total State Sector | |
| | | 2011 | | | 2010 | | | 2011 | | | 2010 | |
| | | $M | | | $M | | | $M | | | $M | |
| | | | |
| 13. Other interest expense | | | | | | | | | | | | | | | | |
| | | | |
Interest | | | 1,092 | | | | 774 | | | | 3,919 | | | | 3,505 | |
Finance charges relating to finance leases | | | 32 | | | | 27 | | | | 32 | | | | 27 | |
Other | | | 1 | | | | 1 | | | | 83 | | | | 93 | |
| | | | | | | | | | | | | | | | |
| | | 1,125 | | | | 803 | | | | 4,035 | | | | 3,625 | |
| | | | | | | | | | | | | | | | |
| | | | |
Interest expense on financial liabilities other than those at fair value through profit and loss amounts to: | | | 67 | | | | 61 | | | | 67 | | | | 61 | |
| | | | |
| 14. Grants expenses | | | | | | | | | | | | | | | | |
| | | | |
Grants - recurrent | | | 6,539 | | | | 6,149 | | | | 6,430 | | | | 6,043 | |
Grants - capital | | | 2,205 | | | | 1,772 | | | | 1,974 | | | | 1,318 | |
First Home Owner Grants | | | 112 | | | | 193 | | | | 112 | | | | 193 | |
Personal benefit payments | | | 280 | | | | 233 | | | | 280 | | | | 233 | |
Community Service Obligations | | | 1,828 | | | | 1,418 | | | | — | | | | — | |
Subsidy payments | | | — | | | | 25 | | | | — | | | | 25 | |
| | | | | | | | | | | | | | | | |
| | | 10,964 | | | | 9,790 | | | | 8,796 | | | | 7,812 | |
| | | | | | | | | | | | | | | | |
| | | | |
| 15. Gain on sale of assets and investments | | | | | | | | | | | | | | | | |
| | | | |
Gain on sale of financial assets | | | | | | | | | | | | | | | | |
Gain on sale of available-for-sale financial assets | | | — | | | | — | | | | — | | | | 8 | |
Gain on sale of other investments | | | 166 | | | | — | | | | — | | | | — | |
| | | | | | | | | | | | | | | | |
| | | 166 | | | | — | | | | — | | | | 8 | |
| | | | |
Gain on sale of non-financial assets | | | | | | | | | | | | | | | | |
Gain on sale of other non-current assets | | | — | | | | — | | | | 569 | | | | — | |
| | | | | | | | | | | | | | | | |
| | | 166 | | | | — | | | | 569 | | | | 8 | |
| | | | | | | | | | | | | | | | |
| | | | |
The gains on sale of financial assets relate to the following categories: | | | | | | | | | | | | | | | | |
Assets at fair value through profit or loss | | | 166 | | | | — | | | | — | | | | 8 | |
| | | | | | | | | | | | | | | | |
| | | 166 | | | | — | | | | — | | | | 8 | |
| | | | | | | | | | | | | | | | |
| | | | |
| 16. Revaluation increments and impairment loss reversals | | | | | | | | | | | | | | | | |
| | | | |
Revaluation increments of financial assets | | | | | | | | | | | | | | | | |
Revaluation increments - derivatives | | | — | | | | — | | | | — | | | | 526 | |
Revaluation increments - other investments | | | 16 | | | | 23 | | | | 1,835 | | | | — | |
| | | | | | | | | | | | | | | | |
| | | 16 | | | | 23 | | | | 1,835 | | | | 526 | |
| | | | |
Revaluation increments of non-financial assets | | | | | | | | | | | | | | | | |
Revaluation increments - investment property | | | — | | | | — | | | | — | | | | 15 | |
Revaluation increments - other non-current assets | | | 1 | | | | — | | | | 18 | | | | — | |
| | | | | | | | | | | | | | | | |
| | | 1 | | | | — | | | | 18 | | | | 15 | |
| | | | |
Revaluation increments - environmental certificates/obligations | | | — | | | | — | | | | 10 | | | | 6 | |
Revaluation increments - self generating and regenerating assets | | | 5 | | | | 4 | | | | 5 | | | | 3 | |
Impairment loss reversal | | | | | | | | | | | | | | | | |
Impairment loss reversal - non-financial assets | | | 25 | | | | — | | | | 25 | | | | — | |
| | | | | | | | | | | | | | | | |
| | | 25 | | | | — | | | | 25 | | | | — | |
| | | | | | | | | | | | | | | | |
| | | 46 | | | | 27 | | | | 1,892 | | | | 551 | |
| | | | | | | | | | | | | | | | |
| | |
| 6-40 | | Audited Consolidated Financial Statements 2010–11 – Government of Queensland |
Notes to the Financial Statements
| | | | | | | | | | | | | | | | |
| | | General Government
Sector | | | Total State Sector | |
| | | 2011 | | | 2010 | | | 2011 | | | 2010 | |
| | | $M | | | $M | | | $M | | | $M | |
| | | | |
| 17. Loss on sale of assets and investments | | | | | | | | | | | | | | | | |
| | | | |
Loss on sale of financial assets | | | | | | | | | | | | | | | | |
Loss on sale of derivatives | | | — | | | | — | | | | 435 | | | | 449 | |
Loss on sale of other investments | | | — | | | | 2 | | | | 297 | | | | 434 | |
| | | | | | | | | | | | | | | | |
| | | — | | | | 2 | | | | 732 | | | | 883 | |
| | | | |
Loss on sale of non-financial assets | | | | | | | | | | | | | | | | |
Loss on sale of other non-current assets | | | 31 | | | | 11 | | | | — | | | | 44 | |
Loss on sale of intangibles | | | 5 | | | | — | | | | 5 | | | | — | |
| | | | | | | | | | | | | | | | |
| | | 36 | | | | 11 | | | | 5 | | | | 44 | |
| | | | | | | | | | | | | | | | |
| | | 36 | | | | 13 | | | | 737 | | | | 926 | |
| | | | | | | | | | | | | | | | |
| | | | |
| 18. Asset write-down, revaluation decrements and impairment loss | | | | | | | | | | | | | | | | |
| | | | |
Asset write-down | | | | | | | | | | | | | | | | |
Bad debts written off not previously impaired | | | 85 | | | | 30 | | | | 80 | | | | 36 | |
Inventory write-down (net) | | | 3 | | | | 5 | | | | 5 | | | | 6 | |
Other assets written off/donated | | | 210 | | | | 250 | | | | 260 | | | | 250 | |
| | | | | | | | | | | | | | | | |
| | | 298 | | | | 285 | | | | 345 | | | | 292 | |
| | | | |
Revaluation decrements of financial assets | | | | | | | | | | | | | | | | |
Revaluation decrements - derivatives | | | — | | | | — | | | | 245 | | | | 89 | |
Revaluation decrements - other investments | | | — | | | | — | | | | — | | | | 429 | |
| | | | | | | | | | | | | | | | |
| | | — | | | | — | | | | 245 | | | | 518 | |
| | | | |
Revaluation decrements of non-financial assets | | | | | | | | | | | | | | | | |
Revaluation decrements - investment property | | | 7 | | | | (3 | ) | | | 92 | | | | — | |
Revaluation decrements - other non-current assets | | | — | | | | 88 | | | | — | | | | 58 | |
| | | | | | | | | | | | | | | | |
| | | 7 | | | | 85 | | | | 92 | | | | 58 | |
| | | | |
Revaluation decrements - environmental certificates/obligations | | | — | | | | — | | | | — | | | | — | |
Impairment losses | | | | | | | | | | | | | | | | |
Impairment loss - receivables and loans | | | 14 | | | | 60 | | | | 19 | | | | 69 | |
Impairment loss - financial assets (excl receivables) | | | — | | | | — | | | | — | | | | (2 | ) |
Impairment loss - non-financial assets | | | — | | | | 1 | | | | 1,710 | | | | 166 | |
Impairment loss - intangible assets | | | 59 | | | | 2 | | | | 105 | | | | 29 | |
Impairment loss - available-for-sale financial assets | | | — | | | | — | | | | 10 | | | | 4 | |
Impairment loss - non-current assets held for sale | | | 5 | | | | 2 | | | | 39 | | | | 2 | |
| | | | | | | | | | | | | | | | |
| | | 78 | | | | 65 | | | | 1,884 | | | | 268 | |
| | | | | | | | | | | | | | | | |
| | | 383 | | | | 436 | | | | 2,566 | | | | 1,137 | |
| | | | | | | | | | | | | | | | |
| | | | |
| 19. Actuarial adjustments to liabilities | | | | | | | | | | | | | | | | |
| | | | |
Long service leave - gain/(loss) | | | (27 | ) | | | (2 | ) | | | (27 | ) | | | (2 | ) |
Insurances and other - gain/(loss) | | | 92 | | | | (54 | ) | | | 83 | | | | (77 | ) |
| | | | | | | | | | | | | | | | |
| | | 65 | | | | (56 | ) | | | 56 | | | | (79 | ) |
| | | | | | | | | | | | | | | | |
| | | | |
| 20. Dividends and tax equivalents treated as capital returns | | | | | | | | | | | | | | | | |
| | | | |
Dividends | | | 1,396 | | | | — | | | | — | | | | — | |
| | | | | | | | | | | | | | | | |
| | | 1,396 | | | | — | | | | — | | | | — | |
| | | | | | | | | | | | | | | | |
| | | | |
| 21. Other economic flows in operating result | | | | | | | | | | | | | | | | |
| | | | |
Net market value interest revenue/(expense) | | | (17 | ) | | | (333 | ) | | | 3,115 | | | | 2,344 | |
Time value adjustments | | | (4 | ) | | | (7 | ) | | | (61 | ) | | | (40 | ) |
Share of net profit or (loss) of associates and joint ventures accounted for using the equity method | | | 25 | | | | 14 | | | | 33 | | | | 18 | |
Onerous contracts expense | | | — | | | | — | | | | (141 | ) | | | (17 | ) |
Other economic flows nec | | | 2 | | | | 5 | | | | (1 | ) | | | 1 | |
| | | | | | | | | | | | | | | | |
| | | 5 | | | | (320 | ) | | | 2,945 | | | | 2,306 | |
| | | | | | | | | | | | | | | | |
| | |
Audited Consolidated Financial Statements 2010–11 – Government of Queensland | | 6-41 |
Notes to the Financial Statements
| | | | | | | | | | | | | | | | |
| | | General Government
Sector | | | Total State Sector | |
| | | 2011 | | | 2010 | | | 2011 | | | 2010 | |
| | | $M | | | $M | | | $M | | | $M | |
| | | | |
| 22. Other economic flows from discontinued operations | | | | | | | | | | | | | | | | |
| | | | |
Gain on sale of discontinued operations | | | — | | | | — | | | | 462 | | | | 24 | |
Impairment loss reversal - discontinued operations | | | — | | | | — | | | | — | | | | 186 | |
Loss on disposal of assets - discontinued operations | | | — | | | | — | | | | (12 | ) | | | (46 | ) |
Impairment loss - discontinued operations | | | — | | | | — | | | | (505 | ) | | | (2,006 | ) |
| | | | | | | | | | | | | | | | |
| | | — | | | | — | | | | (55 | ) | | | (1,841 | ) |
| | | | | | | | | | | | | | | | |
| | | | |
| 23. Other economic flows - other movements in equity - revaluations | | | | | | | | | | | | | | | | |
| | | | |
Revaluations of financial assets - increment/(decrement) | | | | | | | | | | | | | | | | |
Available-for-sale financial assets | | | — | | | | 9 | | | | — | | | | (4 | ) |
Investments | | | (1,354 | ) | | | (3,807 | ) | | | (782 | ) | | | 6 | |
Cash flow hedge | | | (110 | ) | | | 83 | | | | (239 | ) | | | 256 | |
| | | | | | | | | | | | | | | | |
| | | (1,464 | ) | | | (3,715 | ) | | | (1,021 | ) | | | 258 | |
Revaluations of non-financial assets - increment/(decrement) | | | | | | | | | | | | | | | | |
Property, plant and equipment | | | (2,157 | ) | | | (4,221 | ) | | | (2,986 | ) | | | (5,911 | ) |
| | | | |
Actuarial gain/(loss) on defined superannuation plans | | | 682 | | | | 69 | | | | 772 | | | | 67 | |
| | | | | | | | | | | | | | | | |
| | | (2,939 | ) | | | (7,867 | ) | | | (3,235 | ) | | | (5,587 | ) |
| | | | | | | | | | | | | | | | |
| | | | |
| 24. Other economic flows - other movement in equity - other | | | | | | | | | | | | | | | | |
| | | | |
Equity adjustments from ceased entities | | | (28 | ) | | | (79 | ) | | | 541 | | | | (1 | ) |
| | | | | | | | | | | | | | | | |
| | | (28 | ) | | | (79 | ) | | | 541 | | | | (1 | ) |
| | | | | | | | | | | | | | | | |
| | | | |
| 25. Cash and deposits | | | | | | | | | | | | | | | | |
| | | | |
Cash | | | 25 | | | | 343 | | | | 1,027 | | | | 1,043 | |
Deposits on call | | | 299 | | | | 239 | | | | 331 | | | | 268 | |
QTC cash funds | | | 310 | | | | 323 | | | | — | | | | — | |
| | | | | | | | | | | | | | | | |
| | | 635 | | | | 904 | | | | 1,359 | | | | 1,311 | |
| | | | | | | | | | | | | | | | |
| | | | |
Reconciliation to Cash Flow Statement | | | | | | | | | | | | | | | | |
| | | | |
Balances as above | | | 635 | | | | 904 | | | | 1,359 | | | | 1,311 | |
Bank overdraft (Note 42) | | | (1,434 | ) | | | — | | | | — | | | | — | |
| | | | | | | | | | | | | | | | |
Balances per Cash Flow Statement | | | (799 | ) | | | 904 | | | | 1,359 | | | | 1,311 | |
| | | | | | | | | | | | | | | | |
| | | | |
| This does not include QTC money market deposits of $2.066 billion (2010, $946 million). Refer Note 27. | | | | | | | | | | | | | | | | |
| | | | |
| All material cash balances held by agencies are managed and invested by QTC daily to maximise returns in accordance with agreed risk profiles on a whole of Government basis. | | | | | | | | | | | | | | | | |
| | | | |
| 26. Receivables and Loans | | | | | | | | | | | | | | | | |
| | | | |
Receivables | | | | | | | | | | | | | | | | |
Current | | | | | | | | | | | | | | | | |
Trade debtors | | | 1,066 | | | | 869 | | | | 2,310 | | | | 1,780 | |
Interest receivable | | | 17 | | | | 11 | | | | 26 | | | | 22 | |
GST input tax credits receivable | | | 270 | | | | 253 | | | | 319 | | | | 335 | |
Dividends and guarantee fees receivable | | | 1,003 | | | | 682 | | | | — | | | | — | |
Royalties and territorial revenue receivable | | | 778 | | | | 664 | | | | 778 | | | | 664 | |
Taxes receivable | | | 660 | | | | 484 | | | | 654 | | | | 484 | |
Income tax receivable | | | 179 | | | | 173 | | | | — | | | | — | |
Other receivables | | | 857 | | | | 678 | | | | 1,002 | | | | 850 | |
| | | | | | | | | | | | | | | | |
| | | 4,830 | | | | 3,814 | | | | 5,089 | | | | 4,135 | |
Less: Allowance for doubtful debts/impairment losses | | | 443 | | | | 427 | | | | 463 | | | | 455 | |
| | | | | | | | | | | | | | | | |
| | | 4,387 | | | | 3,387 | | | | 4,626 | | | | 3,681 | |
| | | | | | | | | | | | | | | | |
| | |
| 6-42 | | Audited Consolidated Financial Statements 2010–11 – Government of Queensland |
Notes to the Financial Statements
| | | | | | | | | | | | | | | | |
| | | General Government
Sector | | | Total State Sector | |
| | | 2011 | | | 2010 | | | 2011 | | | 2010 | |
| | | $M | | | $M | | | $M | | | $M | |
| | | | |
| 26. Receivables and Loans continued | | | | | | | | | | | | | | | | |
| | | | |
Non-Current | | | | | | | | | | | | | | | | |
Trade debtors | | | 69 | | | | 70 | | | | 213 | | | | 82 | |
Other | | | 38 | | | | 21 | | | | 309 | | | | 183 | |
| | | | | | | | | | | | | | | | |
| | | 107 | | | | 92 | | | | 522 | | | | 266 | |
Less: Allowance for doubtful debts/impairment losses | | | — | | | | — | | | | — | | | | — | |
| | | | | | | | | | | | | | | | |
| | | 107 | | | | 92 | | | | 522 | | | | 266 | |
| | | | | | | | | | | | | | | | |
| | | 4,493 | | | | 3,478 | | | | 5,148 | | | | 3,947 | |
| | | | | | | | | | | | | | | | |
| | | | |
Loans and Advances | | | | | | | | | | | | | | | | |
| | | | |
Advances Paid | | | | | | | | | | | | | | | | |
Current | | | | | | | | | | | | | | | | |
Advances | | | 79 | | | | 84 | | | | 125 | | | | 152 | |
Less: Allowance for doubtful debts/impairment losses | | | 6 | | | | 4 | | | | 6 | | | | 4 | |
| | | | | | | | | | | | | | | | |
| | | 73 | | | | 80 | | | | 119 | | | | 148 | |
| | | | | | | | | | | | | | | | |
Non-Current | | | | | | | | | | | | | | | | |
Advances | | | 522 | | | | 504 | | | | 748 | | | | 733 | |
Less: Allowance for doubtful debts/impairment losses | | | 1 | | | | 2 | | | | 2 | | | | 1 | |
| | | | | | | | | | | | | | | | |
| | | 521 | | | | 502 | | | | 746 | | | | 732 | |
| | | | | | | | | | | | | | | | |
| | | 594 | | | | 582 | | | | 865 | | | | 879 | |
| | | | | | | | | | | | | | | | |
Loans Paid | | | | | | | | | | | | | | | | |
Current | | | | | | | | | | | | | | | | |
Fixed rate note | | | 2,452 | | | | 1,213 | | | | — | | | | — | |
Onlendings | | | — | | | | — | | | | 580 | | | | 615 | |
Finance leases | | | 8 | | | | 10 | | | | 9 | | | | 11 | |
| | | | | | | | | | | | | | | | |
| | | 2,460 | | | | 1,223 | | | | 589 | | | | 626 | |
Less: Allowance for doubtful debts/impairment losses | | | — | | | | — | | | | — | | | | — | |
| | | | | | | | | | | | | | | | |
| | | 2,460 | | | | 1,223 | | | | 589 | | | | 626 | |
| | | | | | | | | | | | | | | | |
| | | | |
Non-Current | | | | | | | | | | | | | | | | |
Fixed rate note | | | 28,653 | | | | 22,040 | | | | — | | | | — | |
Onlendings | | | — | | | | — | | | | 5,063 | | | | 3,953 | |
Finance leases | | | 120 | | | | 87 | | | | 236 | | | | 205 | |
| | | | | | | | | | | | | | | | |
| | | 28,773 | | | | 22,127 | | | | 5,299 | | | | 4,158 | |
Less: Allowance for doubtful debts/impairment losses | | | — | | | | — | | | | — | | | | — | |
| | | | | | | | | | | | | | | | |
| | | 28,773 | | | | 22,127 | | | | 5,299 | | | | 4,158 | |
| | | | | | | | | | | | | | | | |
| | | 31,233 | | | | 23,350 | | | | 5,888 | | | | 4,784 | |
| | | | | | | | | | | | | | | | |
| | | | |
Finance Lease Receivables due: | | | | | | | | | | | | | | | | |
Not later than 1 year | | | 11 | | | | 10 | | | | 18 | | | | 17 | |
Later than 1 year but not later than 5 years | | | 76 | | | | 36 | | | | 103 | | | | 63 | |
Later than 5 years | | | 55 | | | | 57 | | | | 285 | | | | 294 | |
| | | | | | | | | | | | | | | | |
| | | 142 | | | | 103 | | | | 406 | | | | 374 | |
| | | | |
Less: Future finance revenue | | | 14 | | | | 6 | | | | 161 | | | | 158 | |
| | | | | | | | | | | | | | | | |
| | | 128 | | | | 97 | | | | 245 | | | | 216 | |
| | | | | | | | | | | | | | | | |
| | | | |
Minimum Operating Lease Payments Receivable: | | | | | | | | | | | | | | | | |
Operating leases not recognised in the financial statements: | | | | | | | | | | | | | | | | |
| | | | |
Not later than 1 year | | | 20 | | | | 19 | | | | 95 | | | | 73 | |
Later than 1 year but not later than 5 years | | | 85 | | | | 75 | | | | 349 | | | | 280 | |
Later than 5 years | | | 412 | | | | 298 | | | | 1,571 | | | | 566 | |
| | | | | | | | | | | | | | | | |
| | | 517 | | | | 392 | | | | 2,015 | | | | 919 | |
| | | | | | | | | | | | | | | | |
| | |
| Audited Consolidated Financial Statements 2010–11 – Government of Queensland | | 6-43 |
Notes to the Financial Statements
| 26. | Receivables and Loans continued |
In accordance with AASB7 Financial Instruments: Disclosures, details of ‘Past due but not impaired’ and ‘Impaired’ Receivables and loans are included in the tables below. This information has been sourced from GGS and Total State entities with material receivables and loans balances.
General Government Sector
| | | | | | | | | | | | | | | | |
| | | 1 Month or
Less | | | 1 to 2
Months | | | 2 to 3
Months | | | Over 3
Months | |
| | | $M | | | $M | | | $M | | | $M | |
| | | | |
Past Due Not Impaired Financial Assets Analysis as at 30 June 2011 | | | | | | | | | | | | | | | | |
| | | | |
Trade receivables | | | 99 | | | | 56 | | | | 25 | | | | 162 | |
Other receivables and loans | | | 4 | | | | — | | | | 8 | | | | 2 | |
| | | | | | | | | | | | | | | | |
| | | 103 | | | | 56 | | | | 33 | | | | 164 | |
| | | | | | | | | | | | | | | | |
| | | | |
Impaired Financial Assets Analysis as at 30 June 2011 | | | | | | | | | | | | | | | | |
| | | | |
Trade receivables | | | 2 | | | | 1 | | | | 4 | | | | 403 | |
Other receivables and loans | | | — | | | | — | | | | — | | | | — | |
| | | | | | | | | | | | | | | | |
| | | 2 | | | | 1 | | | | 4 | | | | 403 | |
| | | | | | | | | | | | | | | | |
| | | | |
Past Due Not Impaired Financial Assets Analysis as at 30 June 2010 | | | | | | | | | | | | | | | | |
| | | | |
Trade receivables | | | 80 | | | | 40 | | | | 25 | | | | 166 | |
Other receivables and loans | | | 1 | | | | — | | | | — | | | | 18 | |
| | | | | | | | | | | | | | | | |
| | | 81 | | | | 40 | | | | 25 | | | | 184 | |
| | | | | | | | | | | | | | | | |
| | | | |
Impaired Financial Assets Analysis as at 30 June 2010 | | | | | | | | | | | | | | | | |
| | | | |
Trade receivables | | | 3 | | | | 3 | | | | 2 | | | | 400 | |
Other receivables and loans | | | — | | | | — | | | | — | | | | — | |
| | | | | | | | | | | | | | | | |
| | | 3 | | | | 3 | | | | 2 | | | | 400 | |
| | | | | | | | | | | | | | | | |
Total State Sector
| | | | | | | | | | | | | | | | |
| | | 1 Month or
Less | | | 1 to 2
Months | | | 2 to 3
Months | | | Over 3
Months | |
| | | $M | | | $M | | | $M | | | $M | |
| | | | |
Past Due Not Impaired Financial Assets Analysis as at 30 June 2011 | | | | | | | | | | | | | | | | |
| | | | |
Trade receivables | | | 98 | | | | 49 | | | | 25 | | | | 168 | |
Other receivables and loans | | | 4 | | | | — | | | | 8 | | | | 3 | |
| | | | | | | | | | | | | | | | |
| | | 102 | | | | 49 | | | | 33 | | | | 171 | |
| | | | | | | | | | | | | | | | |
| | | | |
Impaired Financial Assets Analysis as at 30 June 2011 | | | | | | | | | | | | | | | | |
| | | | |
Trade receivables | | | 3 | | | | 3 | | | | 5 | | | | 414 | |
Other receivables and loans | | | — | | | | — | | | | — | | | | — | |
| | | | | | | | | | | | | | | | |
| | | 3 | | | | 3 | | | | 5 | | | | 414 | |
| | | | | | | | | | | | | | | | |
| | | | |
Past Due Not Impaired Financial Assets Analysis as at 30 June 2010 | | | | | | | | | | | | | | | | |
| | | | |
Trade receivables | | | 66 | | | | 36 | | | | 25 | | | | 166 | |
Other receivables and loans | | | 1 | | | | — | | | | — | | | | 18 | |
| | | | | | | | | | | | | | | | |
| | | 67 | | | | 36 | | | | 25 | | | | 184 | |
| | | | | | | | | | | | | | | | |
| | | | |
Impaired Financial Assets Analysis as at 30 June 2010 | | | | | | | | | | | | | | | | |
| | | | |
Trade receivables | | | 5 | | | | 5 | | | | 3 | | | | 408 | |
Other receivables and loans | | | — | | | | — | | | | — | | | | — | |
| | | | | | | | | | | | | | | | |
| | | 5 | | | | 5 | | | | 3 | | | | 408 | |
| | | | | | | | | | | | | | | | |
| | |
| 6-44 | | Audited Consolidated Financial Statements 2010–11 – Government of Queensland |
Notes to the Financial Statements
| | | | | | | | | | | | | | | | |
| | | General Government
Sector | | | Total State Sector | |
| | | 2011 | | | 2010 | | | 2011 | | | 2010 | |
| | | $M | | | $M | | | $M | | | $M | |
| | | | |
| 27. Securities other than shares | | | | | | | | | | | | | | | | |
| | | | |
Current | | | | | | | | | | | | | | | | |
Term deposits | | | 50 | | | | 48 | | | | 51 | | | | 48 | |
Rental purchase plan | | | 4 | | | | 6 | | | | 4 | | | | 6 | |
Money market deposits | | | — | | | | — | | | | 2,066 | | | | 946 | |
Securities/bonds | | | 287 | | | | 295 | | | | 6,967 | | | | 8,355 | |
Investments managed by QIC Limited* | | | 869 | | | | 1,514 | | | | 4,507 | | | | 3,940 | |
Derivatives | | | | | | | | | | | | | | | | |
Derivatives - cash flow hedges | | | — | | | | — | | | | 33 | | | | 34 | |
Other derivatives | | | 5 | | | | — | | | | 345 | | | | 638 | |
Other | | | — | | | | — | | | | 1,524 | | | | 1,540 | |
| | | | | | | | | | | | | | | | |
| | | 1,216 | | | | 1,863 | | | | 15,496 | | | | 15,508 | |
| | | | | | | | | | | | | | | | |
| | | | |
Non-Current | | | | | | | | | | | | | | | | |
Term deposits | | | 76 | | | | 50 | | | | 56 | | | | 30 | |
Rental purchase plan | | | 208 | | | | 200 | | | | 208 | | | | 200 | |
Securities/bonds | | | — | | | | — | | | | 8,867 | | | | 7,231 | |
Investments managed by QIC Limited* | | | 561 | | | | 2,720 | | | | 27,846 | | | | 21,949 | |
Derivatives | | | | | | | | | | | | | | | | |
Derivatives - cash flow hedges | | | — | | | | — | | | | 56 | | | | 117 | |
Other derivatives | | | — | | | | — | | | | 192 | | | | 345 | |
Other | | | 57 | | | | 63 | | | | 505 | | | | 979 | |
| | | | | | | | | | | | | | | | |
| | | 902 | | | | 3,033 | | | | 37,731 | | | | 30,851 | |
| | | | | | | | | | | | | | | | |
| | | 2,118 | | | | 4,896 | | | | 53,227 | | | | 46,359 | |
| | | | | | | | | | | | | | | | |
| | | | |
| The carrying amounts of the above financial assets are classified as designated at fair value on initial recognition. | | | | | | | | | | | | | | | | |
| | | | |
* Total State investments managed by QIC Limited were allocated over the following categories: | | | | | | | | | | | | | | | | |
Cash | | | | | | | | | | | 6,834 | | | | 6,891 | |
Fixed interest | | | | | | | | | | | 2,813 | | | | 2,862 | |
Australian equities | | | | | | | | | | | 4,286 | | | | 4,518 | |
International equities | | | | | | | | | | | 4,425 | | | | 4,511 | |
Property and Infrastructure | | | | | | | | | | | 9,337 | | | | 2,975 | |
Other | | | | | | | | | | | 4,658 | | | | 4,132 | |
| | | | | | | | | | | | | | | | |
| | | | | | | | | | | 32,353 | | | | 25,889 | |
| | | | | | | | | | | | | | | | |
| | | | |
| 28. Shares and other equity investments | | | | | | | | | | | | | | | | |
| | | | |
Investment in Public Sector Entities | | | | | | | | | | | | | | | | |
| | | | |
General Government Sector Investment in Public Sector Entities | | | 18,168 | | | | 19,710 | | | | | | | | | |
| | | | | | | | | | | | | | | | |
| | | | |
| Investments in public sector entities controlled by the General Government sector are measured at the government’s proportional share of the carrying amount of net assets on a GAAP basis. Investments in public sector entities are lower than valuations under GFS. GFS does not, for example, recognise allowance for impairment of receivables, onerous contracts or deferred tax equivalents. | | | | | | | | | | | | | | | | |
| | | | |
Reconciliation of GAAP GGS Investments in other public sector entities to GFS | | | | | | | | | | | | | | | | |
| | | | |
Investments in other public sector entities under GAAP | | | 18,168 | | | | 19,710 | | | | | | | | | |
Add allowance for impairment of receivables | | | 20 | | | | 27 | | | | | | | | | |
Add net deferred tax equivalent liabilities reported by PNFC and PFC | | | 3,716 | | | | 4,673 | | | | | | | | | |
Add provisions for onerous contracts recorded by PNFC and PFC | | | 269 | | | | 152 | | | | | | | | | |
Add net restoration costs | | | 155 | | | | 98 | | | | | | | | | |
| | | | | | | | | | | | | | | | |
Investments in other public sector entities under GFS | | | 22,328 | | | | 24,660 | | | | | | | | | |
| | | | | | | | | | | | | | | | |
| | |
| Audited Consolidated Financial Statements 2010–11 – Government of Queensland | | 6-45 |
Notes to the Financial Statements
| | | | | | | | | | | | | | | | |
| | | General Government
Sector | | | Total State Sector | |
| | | 2011 | | | 2010 | | | 2011 | | | 2010 | |
| | | $M | | | $M | | | $M | | | $M | |
| | | | |
| 28. Shares and other equity investments continued | | | | | | | | | | | | | | | | |
| | | | |
Investments in other entities (not controlled or associated) | | | | | | | | | | | | | | | | |
Non-Current | | | | | | | | | | | | | | | | |
Shares at fair value through profit and loss | | | 4 | | | | 2 | | | | 2,808 | | | | 2 | |
Available-for-sale shares | | | 1 | | | | 1 | | | | 10 | | | | 19 | |
| | | | | | | | | | | | | | | | |
| | | 5 | | | | 3 | | | | 2,818 | | | | 21 | |
| | | | | | | | | | | | | | | | |
Investments accounted for using equity method
The following are investments held by the State in unlisted associated and joint venture entities:
| | | | | | | | | | | | | | | | | | | | |
| Name of Entity | | Principal Activity | | | | Ownership
Interest | | | Equity Accounted
Amount | |
| | | | | | | 2011 | | | 2010 | | | 2011 | | | 2010 | |
| | | | | | | % | | | % | | | $M | | | $M | |
| | | | | | |
Dumaresq-Barwon Border Rivers Commission | | Water management | | a | | | 50 | | | | 50 | | | | 71 | | | | 36 | |
| | | | | | |
Translational Research Institute Trust | | Medical research and education | | b | | | 25 | | | | 25 | | | | 41 | | | | 15 | |
| | | | | | |
Investments under $1 million | | | | | | | | | | | | | | | — | | | | 1 | |
| | | | | | | | | | | | | | | | | | | | |
General Government Sector | | | | | | | | | | | | | | | 112 | | | | 51 | |
| | | | | | |
ElectraNet Pty Ltd | | Electricity transmission | | c | | | 41 | | | | 41 | | | | 97 | | | | 56 | |
| | | | | | |
Investments under $1 million | | | | | | | | | | | | | | | 1 | | | | 1 | |
| | | | | | | | | | | | | | | | | | | | |
Total State Sector | | | | | | | | | | | | | | | 210 | | | | 108 | |
| | | | | | | | | | | | | | | | | | | | |
| a | Dumaresq-Barwon Border Rivers Commission is a joint authority constituted by an agreement between the Queensland and New South Wales governments. Each government holds a 50% interest. |
| b | Translational Research Institute (TRI) Trust is a Discretionary Unit Trust founded by four members of which Queensland Health is one. Each founding member holds 25 units in the TRI Trust and equal voting rights. The TRI Trust seeks to design, construct and maintain the TRI Facility and ensure it is operated and managed to promote medical study, research and education. |
| c | Powerlink Queensland holds a 41.11% interest in ElectraNet Pty Ltd (trading as ElectraNet SA), being an electricity transmission services provider in South Australia. |
| | | | | | | | | | | | | | | | |
| | | General Government
Sector | | | Total State Sector | |
| | | 2011 | | | 2010 | | | 2011 | | | 2010 | |
| | | $M | | | $M | | | $M | | | $M | |
| | | | |
Movements in Carrying Amount of Equity Accounted Investments: | | | | | | | | | | | | | | | | |
| | | | |
Carrying amount at beginning of the financial year | | | 51 | | | | 36 | | | | 108 | | | | 79 | |
Share of net profit/(loss) | | | 25 | | | | 15 | | | | 34 | | | | 18 | |
Revaluation of assets | | | 36 | | | | — | | | | 68 | | | | 12 | |
Changes in holdings | | | — | | | | — | | | | — | | | | (1 | ) |
Dividends received | | | — | | | | — | | | | — | | | | — | |
| | | | | | | | | | | | | | | | |
Carrying amount at end of the financial year | | | 112 | | | | 51 | | | | 210 | | | | 108 | |
| | | | | | | | | | | | | | | | |
| | | | |
Share of Commitments of Equity Accounted Investments: | | | | | | | | | | | | | | | | |
| | | | |
Capital and lease commitments: | | | — | | | | — | | | | 41 | | | | 19 | |
| | |
| 6-46 | | Audited Consolidated Financial Statements 2010–11 – Government of Queensland |
Notes to the Financial Statements
| 29. | Interest in Joint Ventures |
General Government Sector
Department of Communities (Housing)
The Department of Communities holds a 54% interest (2010, 54%) in a joint venture operation with Queensland University of Technology to develop the Kelvin Grove Urban Village. Each party to the joint venture owns and develops its own land but contributes to the cost of shared infrastructure and other project common works.
The land and development costs included in the Balance Sheet at 30 June 2011 total $11 million (2010, $12 million).
The Council of the Queensland Institute of Medical Research (QIMR)
QIMR holds 24.5% (2010, 24.5%) of the issued capital of Q-Pharm Pty Limited, being a Phase 1 Clinical Trial company joint venture.
QIMR holds a 50% share in Vaccine Solutions Pty Limited, a company that provides commercialisation services to the Co-operative Research Council.
Department of Transport and Main Roads
The Department of Transport and Main Roads holds a 50% interest in Personalised Plates Queensland. The joint venture facilitates the management, operational and marketing aspects of personalised number plate sales. The department recognised net revenue of $11 million from these operations (2010, $12 million).
Other
Joint ventures that contribute less than $2 million in net assets and/or net revenues to the Balance Sheet or Operating Statement are as follows:
| | • | | The Department of Environment and Resource Management is a party to the Public Sector Mapping Venture to create and facilitate access to national spatial datasets for both governmental and commercial use. |
| | • | | The Department of Environment and Resource Management and HEMA Maps Pty Ltd each hold a 50% interest in a joint venture operation to produce, promote, distribute and sell maps from the Sunmap Regional Map series. |
| | • | | The Urban Land Development Authority holds a 50% interest in a joint venture with the Mackay Regional Council to develop residential land within the Andergrove Urban Development Area. |
Total State Sector
Joint ventures for the Total State Sector include the GGS joint ventures above, in addition to the following:
CS Energy Limited
Callide Energy Pty Ltd, a wholly owned subsidiary of CS Energy Ltd, holds a 50% interest in the Callide Power Project Joint Venture with IG Power (Callide) Ltd. The joint venture’s principal activity is the generation of electricity.
CS Energy Ltd holds a 50% participating interest in the Kogan North Joint Venture, a gas development joint venture with Australian CBM Pty Ltd.
CS Energy Ltd has a 75.22% (2010, 75.22%) participating interest in the Callide Oxyfuel Project Joint Venture, a project involved in clean coal technology research. Grants are receivable from both government and non-government entities to fund the project on the basis that certain project milestones are met.
The value of the joint venture assets included in the Balance Sheet at 30 June 2011 is $131 million (2010, $327 million).
Tarong Energy Corporation Limited
Tarong Energy Corporation Limited ultimately holds a 19.4% (2010, 20.3%) interest in the Private Forestry Plantation Joint Venture. The principal activity is the commercial production of timber from plantations. The value of joint venture assets included in the Balance Sheet at 30 June 2011 is $1 million (2010, $1 million).
Stanwell Corporation Limited
On 30 June 2011, Stanwell Corporation Limited concluded the sale of its 50% interest in the Emu Downs Wind Farm Project whose principal activity is the operation of a wind farm in Western Australia.
| | |
| Audited Consolidated Financial Statements 2010–11 – Government of Queensland | | 6-47 |
Notes to the Financial Statements
| 29. | Interest in Joint Ventures continued |
Queensland Rail Limited
Queensland Rail Limited had a 50% interest in the CityTrans joint venture operation with Brisbane City Council. CityTrans ceased operating on 31 December 2010.
Queensland Treasury Corporation
Queensland Treasury Corporation has a 50% interest in Local Government Infrastructure Services Pty Ltd which provides assistance to Queensland local governments in relation to infrastructure procurement. Net assets of the joint venture held in QTC’s Balance Sheet at 30 June 2011 total $2 million (2010, $1 million).
| 30. | Public Private Partnerships |
The following public private partnerships apply to both the GGS and Total State Sector statements.
Department of Education and Training
(a) Southbank Education and Training Precinct
In April 2005, the State Government entered into a contractual arrangement with Axiom Education Queensland Pty Ltd (Axiom) to design, construct, operate, maintain and finance the Southbank Education and Training Precinct for a period of 34 years on departmental land. The arrangement involved the refurbishment or demolition of existing buildings and the development of new buildings.
Construction work was completed on 31 October 2008 and the State has entered into a Head Lease and Sublease with Axiom. The State will pay an abatable, undissected service payment to Axiom for the operation, maintenance and provision of the precinct. At the expiry of the lease in 2039, the buildings will revert to the State for nil consideration. The land on which the facility is constructed is owned and recognised as an asset of the department.
(b) South East Queensland schools - Aspire
In May 2009, the State Government entered into a contractual arrangement with Aspire Schools (Qld) Pty Limited (Aspire) to design, construct, maintain and partially finance seven schools to the State for a period of 30 years on departmental land. Construction work commenced in April 2009 and will continue for the next four years. In January 2011, Stage 1 of Augusta, Woodlinks and Coomera Rivers Primary Schools were handed over to the State with interim leasing arrangement being implemented with Aspire. Five schools (Bay View and Peregian Springs Primary Schools in the previous year) have now been handed over under this project. The State will lease back these schools from Aspire and will pay an abatable, undissected service payment to Aspire for the operation, maintenance and provision of the schools. At the expiry of the lease in 2039, the buildings will revert to the State for nil consideration. The land on which the facility is constructed is owned and recognised as an asset of the department.
| | |
6-48 | | Audited Consolidated Financial Statements 2010–11 – Government of Queensland |
Notes to the Financial Statements
| 30. | Public Private Partnerships continued |
Department of Health
Queensland Health has entered into a number of contractual arrangements with private sector entities for the construction and operation of public infrastructure facilities for a period of time on departmental land. After an agreed period of between 15 and 25 years, ownership of these facilities will pass to Queensland Health.
Arrangements operating for all or part of the 2010-11 financial year:
| | • | | Butterfield Street car park (commenced January 1998); |
| | • | | Bramston Terrace car park (commenced November 1998); |
| | • | | Central Energy facility (commenced February 1999, finalised January 2011, asset transferred to Queensland Health); |
| | • | | Noosa Hospital and Specialist Centre (commenced September 1999); |
| | • | | The Prince Charles Hospital car park (commenced November 2000); |
| | • | | Townsville Hospital Support Facilities Building and Walkway (commenced April 2002); |
| | • | | Townsville Childcare Centre (commenced September 2004); |
| | • | | The Prince Charles Hospital Early Education Centre (commenced April 2007); and |
| | • | | The Princess Alexandra Hospital Multi Story Car Park (commenced February 2008). |
To date, no rights or obligations relating to these facilities have been recognised by Queensland Health, other than those associated with land rental and the provision of various services under the agreements.
Queensland Health also has entered into a number of contractual arrangements (termed collocation agreements) with private sector entities for the construction and operation of private health facilities for a period of time on departmental land. After an agreed period of 25 years, ownership of these facilities will pass to Queensland Health. The department does not control the facilities associated with these arrangements and accordingly, they are not recognised as assets.
Collocation arrangements are in operation at the following locations as at 30 June 2011:
| | • | | Caboolture Private Hospital (commenced September 1997); |
| | • | | Redlands Private Hospital (commenced August 1999); and |
| | • | | Holy Spirit Northside Private Hospital (commenced July 2001). |
| | |
| Audited Consolidated Financial Statements 2010–11 – Government of Queensland | | 6-49 |
Notes to the Financial Statements
| 30. | Public Private Partnerships continued |
Department of Transport and Main Roads
(a) Brisbane Airport Rail Link
The Brisbane Airport Rail Link (BARL) is a public passenger rail system developed by Airtrain Citylink Limited (Airtrain) to link the Brisbane Domestic and International Airports to the existing QR network.
In 1998, the State Government entered into an agreement with Airtrain whereby Airtrain was required to acquire the land for the BARL and design, construct, maintain and operate the BARL for a concession period of 35 years. At the end of this period, the agreement provides for Airtrain to transfer the BARL to the Government at no cost to the State.
The State Government leases airport land from the Brisbane Airport Corporation and sub-leases the land to Airtrain.
(b) Gold Coast Rapid Transit Project Operator Franchise
In May 2011, the State Government entered into a contractual arrangement with GoldLinQ Consortium to design, build operate and maintain the Gold Coast light rail system for 18 years including the 15 year operations period.
Construction will commence in 2012 and the light rail system is expected to be operational by 2014. At the end of the operations period, ownership will transfer to the State.
(c) City North Infrastructure Pty Ltd
City North Infrastructure Pty Ltd was incorporated on 22 December 2006, with the mandate to oversee the procurement of Airportlink, the Airport Roundabout Upgrade and the Northern Busway. A project deed was made on 2 June 2008 to establish a private public partnership for the design, construction and operation of the Airportlink toll road. Parties are BrisConnections Operations Pty Ltd, BrisConnections Nominee Company Pty Ltd and the State.
Further information may be obtained from the individual financial reports of the relevant agencies.
| | | | | | | | | | | | | | | | |
| | | General Government
Sector | | | Total State Sector | |
| | | 2011 | | | 2010 | | | 2011 | | | 2010 | |
| Estimated Cash Flows for Public Private Partnerships | | $M | | | $M | | | $M | | | $M | |
Inflows | | | | | | | | | | | | | | | | |
Not later than 1 year | | | — | | | | 1 | | | | — | | | | 1 | |
Later than 1 year but not later than 5 years | | | 101 | | | | 3 | | | | 101 | | | | 3 | |
Later than 5 years but not later than 10 years | | | 287 | | | | 5 | | | | 287 | | | | 5 | |
Later than 10 years | | | 554 | | | | 7 | | | | 554 | | | | 7 | |
| | | | | | | | | | | | | | | | |
| | | 942 | | | | 16 | | | | 942 | | | | 16 | |
| | | | |
Outflows | | | | | | | | | | | | | | | | |
Not later than 1 year | | | (324 | ) | | | (71 | ) | | | (324 | ) | | | (71 | ) |
Later than 1 year but not later than 5 years | | | (749 | ) | | | (334 | ) | | | (749 | ) | | | (334 | ) |
Later than 5 years but not later than 10 years | | | (943 | ) | | | (420 | ) | | | (943 | ) | | | (420 | ) |
Later than 10 years | | | (1,488 | ) | | | (653 | ) | | | (1,488 | ) | | | (653 | ) |
| | | | | | | | | | | | | | | | |
| | | (3,504 | ) | | | (1,478 | ) | | | (3,504 | ) | | | (1,478 | ) |
| | | | | | | | | | | | | | | | |
Estimated Net Cash Flow | | | (2,562 | ) | | | (1,462 | ) | | | (2,562 | ) | | | (1,462 | ) |
| | | | | | | | | | | | | | | | |
| | | | |
| 31. Inventories | | | | | | | | | | | | | | | | |
| | | | |
Current | | | | | | | | | | | | | | | | |
Raw materials | | | 22 | | | | 26 | | | | 294 | | | | 309 | |
Work in progress | | | 61 | | | | 56 | | | | 65 | | | | 64 | |
Finished goods | | | 129 | | | | 130 | | | | 246 | | | | 268 | |
Land held for resale | | | 436 | | | | 361 | | | | 436 | | | | 366 | |
Inventories held for distribution | | | 9 | | | | 9 | | | | 9 | | | | 9 | |
Assets formerly held for lease (Qfleet only) | | | 9 | | | | 10 | | | | 9 | | | | 10 | |
Environmental certificates held for sale/surrender | | | — | | | | — | | | | 92 | | | | 48 | |
Other | | | 11 | | | | 6 | | | | 47 | | | | 44 | |
| | | | | | | | | | | | | | | | |
| | | 678 | | | | 599 | | | | 1,199 | | | | 1,118 | |
| | | | | | | | | | | | | | | | |
| | |
6-50 | | Audited Consolidated Financial Statements 2010–11 – Government of Queensland |
Notes to the Financial Statements
| | | | | | | | | | | | | | | | |
| | | General Government
Sector | | | Total State Sector | |
| | | 2011
$M | | | 2010
$M | | | 2011
$M | | | 2010
$M | |
| | | | |
| 32. Assets Held for Sale 1 | | | | | | | | | | | | | | | | |
| | | | |
Land | | | 156 | | | | 109 | | | | 167 | | | | 266 | |
Buildings | | | 37 | | | | 17 | | | | 39 | | | | 214 | |
Infrastructure | | | 3 | | | | 2 | | | | 163 | | | | 2,596 | |
Plant & equipment (incl. major plant & equipment) | | | 2 | | | | 1 | | | | 2 | | | | 2,771 | |
Intangible assets | | | — | | | | — | | | | — | | | | 39 | |
Other assets held for sale | | | — | | | | — | | | | — | | | | 1,615 | |
| | | | | | | | | | | | | | | | |
| | | 198 | | | | 129 | | | | 371 | | | | 7,501 | |
| | | | | | | | | | | | | | | | |
| | | | |
1 Total assets held for sale in 2009-10 included $7.1 billion worth of assets relating to the proposed sale of QR Limited. Liabilities in relation to this sale are separately disclosed in Note 46 in accordance with AASB 5 Non-current Assets Held for Sale and Discontinued Operations. | | | | | | | | | | | | | | | | |
| | | | |
33. Investment Properties | | | | | | | | | | | | | | | | |
| | | | |
At independent valuation | | | 251 | | | | 254 | | | | 1,525 | | | | 1,813 | |
Accumulated depreciation and impairment losses | | | — | | | | — | | | | (4 | ) | | | (3 | ) |
| | | | | | | | | | | | | | | | |
Land, buildings and work in progress at independent valuation | | | 251 | | | | 254 | | | | 1,521 | | | | 1,810 | |
| | | | | | | | | | | | | | | | |
| | | | |
Movements in Investment Properties | | | | | | | | | | | | | | | | |
| | | | |
Carrying amount at beginning of year | | | 254 | | | | 51 | | | | 1,810 | | | | 1,340 | |
Acquisitions | | | 12 | | | | 1 | | | | 18 | | | | 8 | |
Disposals | | | — | | | | — | | | | (193 | ) | | | (3 | ) |
Transfers | | | (8 | ) | | | 199 | | | | (23 | ) | | | 271 | |
Net revaluations increments/(decrements) | | | (7 | ) | | | 3 | | | | (91 | ) | | | 195 | |
Impairment loss | | | — | | | | — | | | | — | | | | (1 | ) |
| | | | | | | | | | | | | | | | |
Carrying amount at end of year | | | 251 | | | | 254 | | | | 1,521 | | | | 1,810 | |
| | | | | | | | | | | | | | | | |
| | | | |
| The following revenues and expenses are recognised in the Operating Statement in relation to investment properties: | | | | | | | | | | | | | | | | |
Rental income | | | 9 | | | | 9 | | | | 33 | | | | 30 | |
Operating expenses arising from property generating an income | | | (4 | ) | | | (3 | ) | | | (7 | ) | | | (5 | ) |
| | | | | | | | | | | | | | | | |
| | | 5 | | | | 6 | | | | 26 | | | | 25 | |
| | | | | | | | | | | | | | | | |
| | | | |
| 34. Biological Assets | | | | | | | | | | | | | | | | |
| | | | |
Self-generating and regenerating assets: | | | | | | | | | | | | | | | | |
Livestock | | | 7 | | | | 8 | | | | 8 | | | | 8 | |
Plants | | | 2 | | | | 2 | | | | 2 | | | | 2 | |
| | | | | | | | | | | | | | | | |
| | | 9 | | | | 10 | | | | 10 | | | | 10 | |
| | | | | | | | | | | | | | | | |
| | | | |
Movement in biological assets: | | | | | | | | | | | | | | | | |
| | | | |
Carrying amount at beginning of year | | | 10 | | | | 9 | | | | 10 | | | | 1,177 | |
Gain/(loss) from changes in fair value | | | 3 | | | | 4 | | | | 3 | | | | (648 | ) |
Acquisitions | | | 1 | | | | 2 | | | | 1 | | | | 1 | |
Disposals | | | (5 | ) | | | (5 | ) | | | (4 | ) | | | (99 | ) |
Transfers in/(out) | | | — | | | | 421 | | | | — | | | | (421 | ) |
Transfers to assets held for sale | | | — | | | | (421 | ) | | | — | | | | — | |
| | | | | | | | | | | | | | | | |
Carrying amount at end of year | | | 9 | | | | 10 | | | | 10 | | | | 10 | |
| | | | | | | | | | | | | | | | |
| | |
| Audited Consolidated Financial Statements 2010–11 – Government of Queensland | | 6-51 |
Notes to the Financial Statements
| | | | | | | | | | | | | | | | |
| | | General Government
Sector | | | Total State Sector | |
| | | 2011 | | | 2010 | | | 2011 | | | 2010 | |
| | | $M | | | $M | | | $M | | | $M | |
| | | | |
| 35. Other Non-Financial Assets | | | | | | | | | | | | | | | | |
| | | | |
Current | | | | | | | | | | | | | | | | |
Prepayments | | | 224 | | | | 270 | | | | 317 | | | | 376 | |
Other | | | 21 | | | | 12 | | | | 128 | | | | 87 | |
| | | | | | | | | | | | | | | | |
| | | 245 | | | | 282 | | | | 445 | | | | 463 | |
| | | | | | | | | | | | | | | | |
| | | | |
Non-Current | | | | | | | | | | | | | | | | |
Prepayments | | | 31 | | | | 34 | | | | 37 | | | | 73 | |
Other | | | 7 | | | | 8 | | | | 19 | | | | 37 | |
| | | | | | | | | | | | | | | | |
| | | 38 | | | | 42 | | | | 56 | | | | 110 | |
| | | | | | | | | | | | | | | | |
| | | 283 | | | | 324 | | | | 501 | | | | 573 | |
| | | | | | | | | | | | | | | | |
| | | | |
| 36. Restricted Assets | | | | | | | | | | | | | | | | |
| | | | |
| A number of assets included in the consolidated financial statements are classified as restricted assets because their use is wholly or partially restricted by externally imposed requirements. These assets include: | | | | | | | | | | | | | | | | |
| | | | |
Grants and donations to further medical research in specified areas | | | 81 | | | | 77 | | | | 81 | | | | 77 | |
Cash, property, plant and equipment to be used for specific purposes | | | 9 | | | | 9 | | | | 41 | | | | 22 | |
| | | | | | | | | | | | | | | | |
| | | 90 | | | | 86 | | | | 122 | | | | 99 | |
| | | | | | | | | | | | | | | | |
| | |
| 6-52 | | Audited Consolidated Financial Statements 2010–11 – Government of Queensland |
Notes to the Financial Statements
| 37. | Property, Plant and Equipment |
General Government Sector
| | | | | | | | | | | | | | | | | | | | | | | | |
| | | Gross | | | Accumulated
Depreciation/Impairment | | | Written Down Value | |
| | | 2011 | | | 2010 | | | 2011 | | | 2010 | | | 2011 | | | 2010 | |
| | | $M | | | $M | | | $M | | | $M | | | $M | | | $M | |
| | | | | | |
Land | | | 90,132 | | | | 88,702 | | | | (51 | ) | | | (3 | ) | | | 90,081 | | | | 88,698 | |
Buildings | | | 40,945 | | | | 37,444 | | | | (12,413 | ) | | | (11,573 | ) | | | 28,532 | | | | 25,870 | |
Infrastructure | | | 56,621 | | | | 52,784 | | | | (19,131 | ) | | | (14,175 | ) | | | 37,490 | | | | 38,609 | |
Major plant and equipment | | | 622 | | | | 622 | | | | (236 | ) | | | (208 | ) | | | 386 | | | | 414 | |
Heritage and cultural assets | | | 1,108 | | | | 886 | | | | (126 | ) | | | (111 | ) | | | 983 | | | | 775 | |
Plant and equipment | | | 4,584 | | | | 4,131 | | | | (2,217 | ) | | | (1,996 | ) | | | 2,367 | | | | 2,134 | |
Leased plant and equipment | | | 494 | | | | 326 | | | | (20 | ) | | | (13 | ) | | | 474 | | | | 313 | |
| Capital work in progress | | | 8,846 | | | | 9,615 | | | | — | | | | — | | | | 8,846 | | | | 9,615 | |
| | | | | | | | | | | | | | | | | | | | | | | | |
| | | 203,353 | | | | 194,510 | | | | (34,193) | | | | (28,080) | | | | 169,160 | | | | 166,430 | |
| | | | | | | | | | | | | | | | | | | | | | | | |
Reconciliations of the carrying amount for each class of property, plant and equipment are set out below:
| | | | | | | | | | | | | | | | | | | | | | | | | | | | | | | | |
| | | Land | | | Buildings | | | Infrastructure | | | Major Plant and Equipment | |
| | | 2011 | | | 2010 | | | 2011 | | | 2010 | | | 2011 | | | 2010 | | | 2011 | | | 2010 | |
| | | $M | | | $M | | | $M | | | $M | | | $M | | | $M | | | $M | | | $M | |
| | | | | | | | |
Carrying amount at beginning of year | | | 88,698 | | | | 87,103 | | | | 25,870 | | | | 26,135 | | | | 38,609 | | | | 44,086 | | | | 414 | | | | 337 | |
Acquisitions | | | 507 | | | | 884 | | | | 745 | | | | 838 | | | | 391 | | | | 2,648 | | | | 6 | | | | 3 | |
Disposals | | | (83 | ) | | | (37 | ) | | | (52 | ) | | | (34 | ) | | | (196 | ) | | | (223 | ) | | | (2 | ) | | | (6 | ) |
Revaluation increments/(decrements) | | | 960 | | | | (62 | ) | | | (9 | ) | | | (1,552 | ) | | | (136 | ) | | | (2,458 | ) | | | (17 | ) | | | 7 | |
Impairment (losses)/reversals 1 | | | (14 | ) | | | (7 | ) | | | (36 | ) | | | (86 | ) | | | (3,114 | ) | | | (415 | ) | | | — | | | | — | |
Depreciation and amortisation | | | — | | | | — | | | | (965 | ) | | | (965 | ) | | | (901 | ) | | | (956 | ) | | | (37 | ) | | | (28 | ) |
Net asset transfers | | | 11 | | | | 817 | | | | 2,979 | | | | 1,534 | | | | 2,836 | | | | (4,073 | ) | | | 21 | | | | 100 | |
| | | | | | | | | | | | | | | | | | | | | | | | | | | | | | | | |
Carrying amount at end of year | | | 90,081 | | | | 88,698 | | | | 28,532 | | | | 25,870 | | | | 37,490 | | | | 38,609 | | | | 386 | | | | 414 | |
| | | | | | | | | | | | | | | | | | | | | | | | | | | | | | | | |
| | |
| Audited Consolidated Financial Statements 2010–11 – Government of Queensland | | 6-53 |
Notes to the Financial Statements
| 37. | Property, Plant and Equipment continued |
General Government Sector continued
| | | | | | | | | | | | | | | | | | | | | | | | | | | | | | | | |
| | | Heritage and Cultural
Assets | | | Plant and Equipment | | | Leased Plant and
Equipment | | | Capital Work in Progress | |
| | | 2011 | | | 2010 | | | 2011 | | | 2010 | | | 2011 | | | 2010 | | | 2011 | | | 2010 | |
| | | $M | | | $M | | | $M | | | $M | | | $M | | | $M | | | $M | | | $M | |
| | | | | | | | |
Carrying amount at beginning of year | | | 775 | | | | 1,203 | | | | 2,134 | | | | 2,065 | | | | 313 | | | | 268 | | | | 9,615 | | | | 3,199 | |
Acquisitions | | | 5 | | | | 8 | | | | 407 | | | | 419 | | | | 76 | | | | 61 | | | | 5,922 | | | | 4,199 | |
Disposals | | | — | | | | — | | | | (28 | ) | | | (42 | ) | | | — | | | | — | | | | (10 | ) | | | (17 | ) |
Revaluation increments/(decrements) | | | (41 | ) | | | 2 | | | | (1 | ) | | | (1 | ) | | | 63 | | | | (12 | ) | | | — | | | | — | |
Impairment (losses)/reversals | | | — | | | | — | | | | (1 | ) | | | — | | | | — | | | | — | | | | — | | | | — | |
Depreciation and amortisation | | | (4 | ) | | | (3 | ) | | | (482 | ) | | | (419 | ) | | | (6 | ) | | | (4 | ) | | | — | | | | — | |
Net asset transfers | | | 247 | | | | (436 | ) | | | 338 | | | | 112 | | | | 28 | | | | — | | | | (6,682 | ) | | | 2,234 | |
| | | | | | | | | | | | | | | | | | | | | | | | | | | | | | | | |
Carrying amount at end of year | | | 983 | | | | 775 | | | | 2,367 | | | | 2,134 | | | | 474 | | | | 313 | | | | 8,846 | | | | 9,615 | |
| | | | | | | | | | | | | | | | | | | | | | | | | | | | | | | | |
| | | | | | | |
| | | | | | | | | | | | | | | | | | | | | Total | |
| | | | | | | | | | | | | | | | | | | | | 2011 | | | 2010 | |
| | | | | | | | | | | | | | | | | | | | | $M | | | $M | |
| | | | | | | | |
Carrying amount at beginning of year | | | | | | | | | | | | | | | | | | | | | | | | | | | 166,430 | | | | 164,398 | |
Acquisitions | | | | | | | | | | | | | | | | | | | | | | | | | | | 8,060 | | | | 9,061 | |
Disposals | | | | | | | | | | | | | | | | | | | | | | | | | | | (370 | ) | | | (359 | ) |
Revaluation increments/(decrements) | | | | | | | | | | | | | | | | | | | | | | | | | | | 819 | | | | (4,075 | ) |
Impairment (losses)/reversals 1 | | | | | | | | | | | | | | | | | | | | | | | | | | | (3,164 | ) | | | (508 | ) |
Depreciation and amortisation | | | | | | | | | | | | | | | | | | | | | | | | | | | (2,395 | ) | | | (2,375 | ) |
Net asset transfers | | | | | | | | | | | | | | | | | | | | | | | | | | | (221 | ) | | | 288 | |
| | | | | | | | | | | | | | | | | | | | | | | | | | | | | | | | |
Carrying amount at end of year | | | | | | | | | | | | | | | | | | | | | | | | | | | 169,160 | | | | 166,430 | |
| | | | | | | | | | | | | | | | | | | | | | | | | | | | | | | | |
| 1 | Impairment losses in 2011 mainly relate to Department of Transport and Main Roads impairment assets of ($3.1 billion) which were damaged by the January 2011 floods. |
| | |
6-54 | | Audited Consolidated Financial Statements 2010–11 – Government of Queensland |
Notes to the Financial Statements
| 37. | Property, Plant and Equipment continued |
Total State Sector
| | | | | | | | | | | | | | | | | | | | | | | | |
| | | Gross | | | Accumulated
Depreciation/Impairment | | | Written Down Value | |
| | | 2011 | | | 2010 | | | 2011 | | | 2010 | | | 2011 | | | 2010 | |
| | | $M | | | $M | | | $M | | | $M | | | $M | | | $M | |
| | | | | | |
Land | | | 92,538 | | | | 91,064 | | | | (86 | ) | | | (35 | ) | | | 92,452 | | | | 91,030 | |
Buildings | | | 43,652 | | | | 39,884 | | | | (13,324 | ) | | | (12,350 | ) | | | 30,329 | | | | 27,534 | |
Infrastructure | | | 110,025 | | | | 108,198 | | | | (35,695 | ) | | | (28,780 | ) | | | 74,330 | | | | 79,418 | |
Major plant and equipment | | | 2,607 | | | | 2,083 | | | | (672 | ) | | | 795 | | | | 1,935 | | | | 2,878 | |
Heritage and cultural assets | | | 1,109 | | | | 886 | | | | (126 | ) | | | (111 | ) | | | 983 | | | | 775 | |
Plant and equipment | | | 7,891 | | | | 8,099 | | | | (3,730 | ) | | | (4,818 | ) | | | 4,161 | | | | 3,282 | |
Leased plant and equipment | | | 1,982 | | | | 2,291 | | | | (606 | ) | | | (918 | ) | | | 1,376 | | | | 1,372 | |
| Capital work in progress | | | 12,630 | | | | 14,270 | | | | — | | | | — | | | | 12,630 | | | | 14,270 | |
| | | | | | | | | | | | | | | | | | | | | | | | |
| | | 272,434 | | | | 266,775 | | | | (54,238) | | | | (46,216) | | | | 218,196 | | | | 220,559 | |
| | | | | | | | | | | | | | | | | | | | | | | | |
Reconciliations of the carrying amount for each class of property, plant and equipment are set out below:
| | | | | | | | | | | | | | | | | | | | | | | | | | | | | | | | |
| | | Land | | | Buildings | | | Infrastructure | | | Major Plant and Equipment | |
| | | 2011 | | | 2010 | | | 2011 | | | 2010 | | | 2011 | | | 2010 | | | 2011 | | | 2010 | |
| | | $M | | | $M | | | $M | | | $M | | | $M | | | $M | | | $M | | | $M | |
| | | | | | | | |
Carrying amount at beginning of year | | | 91,030 | | | | 89,908 | | | | 27,534 | | | | 28,113 | | | | 79,418 | | | | 83,651 | | | | 2,878 | | | | 4,200 | |
Acquisitions | | | 549 | | | | 598 | | | | 784 | | | | 772 | | | | 1,354 | | | | 4,092 | | | | 8 | | | | 83 | |
Disposals | | | (118 | ) | | | (156 | ) | | | (129 | ) | | | (52 | ) | | | (479 | ) | | | (283 | ) | | | (8 | ) | | | (17 | ) |
Revaluation increments/(decrements) | | | 863 | | | | (259 | ) | | | (165 | ) | | | (1,585 | ) | | | (1,040 | ) | | | (3,694 | ) | | | 1 | | | | (13 | ) |
Impairment (losses)/reversals | | | (22 | ) | | | (33 | ) | | | (66 | ) | | | (120 | ) | | | (4,547 | ) | | | (1,200 | ) | | | — | | | | (115 | ) |
Depreciation and amortisation | | | — | | | | — | | | | (1,074 | ) | | | (1,076 | ) | | | (2,497 | ) | | | (2,569 | ) | | | (123 | ) | | | (251 | ) |
Net asset transfers | | | 150 | | | | 972 | | | | 3,445 | | | | 1,482 | | | | 2,120 | | | | (579 | ) | | | (821 | ) | | | (1,008 | ) |
| | | | | | | | | | | | | | | | | | | | | | | | | | | | | | | | |
Carrying amount at end of year | | | 92,452 | | | | 91,030 | | | | 30,329 | | | | 27,534 | | | | 74,330 | | | | 79,418 | | | | 1,935 | | | | 2,878 | |
| | | | | | | | | | | | | | | | | | | | | | | | | | | | | | | | |
| | |
| Audited Consolidated Financial Statements 2010–11 – Government of Queensland | | 6-55 |
Notes to the Financial Statements
| 37. | Property, Plant and Equipment continued |
Total State Sector continued
| | | | | | | | | | | | | | | | | | | | | | | | | | | | | | | | |
| | | Heritage and Cultural
Assets | | | Plant and Equipment | | | Leased Plant and
Equipment | | | Capital Work in Progress | |
| | | 2011 | | | 2010 | | | 2011 | | | 2010 | | | 2011 | | | 2010 | | | 2011 | | | 2010 | |
| | | $M | | | $M | | | $M | | | $M | | | $M | | | $M | | | $M | | | $M | |
| | | | | | | | |
Carrying amount at beginning of year | | | 775 | | | | 1,204 | | | | 3,282 | | | | 3,314 | | | | 1,372 | | | | 2,307 | | | | 14,270 | | | | 12,316 | |
Acquisitions | | | 5 | | | | 8 | | | | 1,012 | | | | 639 | | | | 80 | | | | 61 | | | | 9,407 | | | | 8,702 | |
Disposals | | | — | | | | — | | | | (162 | ) | | | (87 | ) | | | (9 | ) | | | (7 | ) | | | (368 | ) | | | (109 | ) |
Revaluation increments/(decrements) | | | (41 | ) | | | 2 | | | | 26 | | | | 283 | | | | 63 | | | | (122 | ) | | | — | | | | — | |
Impairment (losses)/reversals | | | — | | | | — | | | | (253 | ) | | | (557 | ) | | | — | | | | 20 | | | | — | | | | — | |
Depreciation and amortisation | | | (4 | ) | | | (3 | ) | | | (786 | ) | | | (780 | ) | | | (51 | ) | | | (143 | ) | | | — | | | | — | |
Net asset transfers | | | 247 | | | | (436 | ) | | | 1,043 | | | | 470 | | | | (79 | ) | | | (744 | ) | | | (10,679 | ) | | | (6,640 | ) |
| | | | | | | | | | | | | | | | | | | | | | | | | | | | | | | | |
Carrying amount at end of year | | | 983 | | | | 775 | | | | 4,161 | | | | 3,282 | | | | 1,376 | | | | 1,372 | | | | 12,630 | | | | 14,270 | |
| | | | | | | | | | | | | | | | | | | | | | | | | | | | | | | | |
| | | | | | | |
| | | | | | | | | | | | | | | | | | | | | Total | |
| | | | | | | | | | | | | | | | | | | | | 2011 | | | 2010 | |
| | | | | | | | | | | | | | | | | | | | | $M | | | $M | |
| | | | | | | | |
Carrying amount at beginning of year | | | | | | | | | | | | | | | | | | | | | | | | | | | 220,559 | | | | 225,013 | |
Acquisitions | | | | | | | | | | | | | | | | | | | | | | | | | | | 13,201 | | | | 14,956 | |
Disposals | | | | | | | | | | | | | | | | | | | | | | | | | | | (1,273 | ) | | | (710 | ) |
Revaluation increments/(decrements) | | | | | | | | | | | | | | | | | | | | | | | | | | | (292 | ) | | | (5,388 | ) |
Impairment (losses)/reversals | | | | | | | | | | | | | | | | | | | | | | | | | | | (4,889 | ) | | | (2,006 | ) |
Depreciation and amortisation | | | | | | | | | | | | | | | | | | | | | | | | | | | (4,537 | ) | | | (4,823 | ) |
Net asset transfers 1 | | | | | | | | | | | | | | | | | | | | | | | | | | | (4,574 | ) | | | (6,483 | ) |
| | | | | | | | | | | | | | | | | | | | | | | | | | | | | | | | |
Carrying amount at end of year | | | | | | | | | | | | | | | | | | | | | | | | | | | 218,196 | | | | 220,559 | |
| | | | | | | | | | | | | | | | | | | | | | | | | | | | | | | | |
| 1 | Net asset transfers include transfers to assets held for sale and intangible assets as a result of the asset sales program. |
| | |
| 6-56 | | Audited Consolidated Financial Statements 2010–11 – Government of Queensland |
Notes to the Financial Statements
General Government Sector
| | | | | | | | | | | | | | | | | | | | | | | | |
| | | Cost | | | Accumulated
Amortisation | | | Written Down Value | |
| | | 2011 | | | 2010 | | | 2011 | | | 2010 | | | 2011 | | | 2010 | |
| | | $M | | | $M | | | $M | | | $M | | | $M | | | $M | |
| | | | | | |
Software development | | | 1,258 | | | | 1,175 | | | | (563 | ) | | | (591 | ) | | | 695 | | | | 584 | |
Purchased software | | | 555 | | | | 546 | | | | (404 | ) | | | (294 | ) | | | 151 | | | | 252 | |
Goodwill | | | 3 | | | | 3 | | | | — | | | | — | | | | 3 | | | | 3 | |
Other | | | 32 | | | | 24 | | | | (8 | ) | | | (7 | ) | | | 23 | | | | 16 | |
| | | | | | | | | | | | | | | | | | | | | | | | |
| | | 1,848 | | | | 1,748 | | | | (976 | ) | | | (893 | ) | | | 872 | | | | 856 | |
| | | | | | | | | | | | | | | | | | | | | | | | |
| | | | | | | | | | | | | | | | | | | | | | | | | | | | | | | | |
| | | Software | | | Goodwill | | | Other | | | Total | |
| | | 2011 | | | 2010 | | | 2011 | | | 2010 | | | 2011 | | | 2010 | | | 2011 | | | 2010 | |
| | | $M | | | $M | | | $M | | | $M | | | $M | | | $M | | | $M | | | $M | |
| | | | | | | | |
Carrying amount at beginning of year | | | 836 | | | | 736 | | | | 3 | | | | 3 | | | | 16 | | | | 14 | | | | 855 | | | | 754 | |
Acquisitions | | | 24 | | | | 43 | | | | — | | | | 1 | | | | 10 | | | | 5 | | | | 34 | | | | 49 | |
Acquisitions through internal development | | | 183 | | | | 157 | | | | — | | | | — | | | | — | | | | — | | | | 183 | | | | 157 | |
Disposals | | | (14 | ) | | | — | | | | — | | | | — | | | | — | | | | — | | | | (14 | ) | | | — | |
Impairment (losses)/reversals | | | (58 | ) | | | (2 | ) | | | — | | | | (1 | ) | | | — | | | | — | | | | (58 | ) | | | (2 | ) |
Amortisation | | | (112 | ) | | | (126 | ) | | | — | | | | — | | | | (2 | ) | | | (2 | ) | | | (113 | ) | | | (128 | ) |
Net asset transfers | | | (14 | ) | | | 28 | | | | — | | | | — | | | | (1 | ) | | | (1 | ) | | | (15 | ) | | | 27 | |
| | | | | | | | | | | | | | | | | | | | | | | | | | | | | | | | |
Carrying amount at end of year | | | 846 | | | | 836 | | | | 3 | | | | 3 | | | | 23 | | | | 16 | | | | 872 | | | | 856 | |
| | | | | | | | | | | | | | | | | | | | | | | | | | | | | | | | |
| | |
| Audited Consolidated Financial Statements 2010–11 – Government of Queensland | | 6-57 |
Notes to the Financial Statements
Total State Sector
| | | | | | | | | | | | | | | | | | | | | | | | | | | | | | | | |
| | | Cost | | | Valuation | | | Accumulated
Amortisation | | | Written Down Value | |
| | | 2011 | | | 2010 | | | 2011 | | | 2010 | | | 2011 | | | 2010 | | | 2011 | | | 2010 | |
| | | $M | | | $M | | | $M | | | $M | | | $M | | | $M | | | $M | | | $M | |
| | | | | | | | |
Software development | | | 1,349 | | | | 1,272 | | | | — | | | | — | | | | (633 | ) | | | (644 | ) | | | 716 | | | | 628 | |
Purchased software | | | 723 | | | | 680 | | | | 16 | | | | 102 | | | | (500 | ) | | | (418 | ) | | | 239 | | | | 364 | |
Licences and rights | | | 6 | | | | 24 | | | | 56 | | | | 56 | | | | (3 | ) | | | (19 | ) | | | 58 | | | | 61 | |
Goodwill | | | 3 | | | | 48 | | | | — | | | | — | | | | — | | | | — | | | | 3 | | | | 48 | |
Other | | | 107 | | | | 98 | | | | 29 | | | | 29 | | | | (17 | ) | | | (16 | ) | | | 119 | | | | 111 | |
| | | | | | | | | | | | | | | | | | | | | | | | | | | | | | | | |
| | | 2,188 | | | | 2,123 | | | | 101 | | | | 186 | | | | (1,153 | ) | | | (1,098 | ) | | | 1,135 | | | | 1,212 | |
| | | | | | | | | | | | | | | | | | | | | | | | | | | | | | | | |
| | | | |
| | | Software | | | Licences and Rights | | | Goodwill | | | Other | |
| | | 2011 | | | 2010 | | | 2011 | | | 2010 | | | 2011 | | | 2010 | | | 2011 | | | 2010 | |
| | | $M | | | $M | | | $M | | | $M | | | $M | | | $M | | | $M | | | $M | |
| | | | | | | | |
Carrying amount at beginning of year | | | 992 | | | | 858 | | | | 61 | | | | 59 | | | | 48 | | | | 137 | | | | 111 | | | | 116 | |
Acquisitions | | | 50 | | | | 83 | | | | — | | | | 8 | | | | — | | | | 45 | | | | 12 | | | | 12 | |
Acquisitions through internal development | | | 191 | | | | 204 | | | | — | | | | — | | | | — | | | | — | | | | — | | | | — | |
Disposals | | | (21 | ) | | | (4 | ) | | | — | | | | (1 | ) | | | — | | | | — | | | | (2,014 | ) | | | — | |
Revaluation increments/(decrements) | | | — | | | | 1 | | | | — | | | | — | | | | — | | | | — | | | | — | | | | — | |
Impairment (losses)/reversals | | | (60 | ) | | | (2 | ) | | | — | | | | — | | | | (45 | ) | | | (123 | ) | | | — | | | | (10 | ) |
Amortisation | | | (143 | ) | | | (174 | ) | | | — | | | | (4 | ) | | | — | | | | — | | | | (2 | ) | | | (3 | ) |
Net asset transfers | | | (53 | ) | | | 27 | | | | (3 | ) | | | (2 | ) | | | — | | | | (11 | ) | | | 2,012 | | | | (3 | ) |
| | | | | | | | | | | | | | | | | | | | | | | | | | | | | | | | |
Carrying amount at end of year | | | 955 | | | | 992 | | | | 58 | | | | 61 | | | | 3 | | | | 48 | | | | 119 | | | | 111 | |
| | | | | | | | | | | | | | | | | | | | | | | | | | | | | | | | |
| | | | | | | |
| | | | | | | | | | | | | | | | | | | | | Total | |
| | | | | | | | | | | | | | | | | | | | | 2011 | | | 2010 | |
| | | | | | | | | | | | | | | | | | | | | $M | | | $M | |
| | | | | | | | |
Carrying amount at beginning of year | | | | | | | | | | | | | | | | | | | | | | | | | | | 1,212 | | | | 1,170 | |
Acquisitions | | | | | | | | | | | | | | | | | | | | | | | | | | | 61 | | | | 149 | |
Acquisitions through internal development | | | | | | | | | | | | | | | | | | | | | | | | | | | 191 | | | | 204 | |
Disposals 1 | | | | | | | | | | | | | | | | | | | | | | | | | | | (2,034 | ) | | | (5 | ) |
Revaluation increments/(decrements) | | | | | | | | | | | | | | | | | | | | | | | | | | | — | | | | 1 | |
Impairment (losses)/reversals | | | | | | | | | | | | | | | | | | | | | | | | | | | (105 | ) | | | (135 | ) |
Amortisation | | | | | | | | | | | | | | | | | | | | | | | | | | | (146 | ) | | | (181 | ) |
Net asset transfers 1 | | | | | | | | | | | | | | | | | | | | | | | | | | | 1,957 | | | | 10 | |
| | | | | | | | | | | | | | | | | | | | | | | | | | | | | | | | |
Carrying amount at end of year | | | | | | | | | | | | | | | | | | | | | | | | | | | 1,135 | | | | 1,212 | |
| | | | | | | | | | | | | | | | | | | | | | | | | | | | | | | | |
| 1 | Disposals and net tranfers of other intangible assets includes Queensland Motorways toll road assets ($2.1 billion) which were transferred to intangibles from Property Plant and Equipment, as a result of a Road Franchise Agreement being granted over these assets. The tolling rights were subsequently sold to a trust managed by QIC Limited. |
| | |
6-58 | | Audited Consolidated Financial Statements 2010–11 – Government of Queensland |
Notes to the Financial Statements
| | | | | | | | | | | | | | | | |
| | | General Government
Sector | | | Total State Sector | |
| | | 2011 | | | 2010 | | | 2011 | | | 2010 | |
| | | $M | | | $M | | | $M | | | $M | |
| | | | |
| 39. Payables | | | | | | | | | | | | | | | | |
| | | | |
Current | | | | | | | | | | | | | | | | |
Trade creditors | | | 2,534 | | | | 2,642 | | | | 3,411 | | | | 3,484 | |
Grants and other contributions | | | 577 | | | | 397 | | | | 245 | | | | 175 | |
Interest | | | 2 | | | | — | | | | 74 | | | | 85 | |
GST payable | | | 71 | | | | 44 | | | | 134 | | | | 99 | |
Other payables | | | 728 | | | | 622 | | | | 981 | | | | 923 | |
| | | | | | | | | | | | | | | | |
| | | 3,912 | | | | 3,705 | | | | 4,845 | | | | 4,766 | |
| | | | | | | | | | | | | | | | |
Non-Current | | | | | | | | | | | | | | | | |
Trade creditors | | | 1 | | | | 2 | | | | 1 | | | | 5 | |
Other payables | | | 5 | | | | 5 | | | | 7 | | | | 7 | |
| | | | | | | | | | | | | | | | |
| | | 6 | | | | 7 | | | | 8 | | | | 12 | |
| | | | | | | | | | | | | | | | |
| | | 3,918 | | | | 3,712 | | | | 4,853 | | | | 4,778 | |
| | | | | | | | | | | | | | | | |
| | | | |
| 40. Employee Benefit Obligations | | | | | | | | | | | | | | | | |
| | | | |
Superannuation liability | | | | | | | | | | | | | | | | |
Current | | | | | | | | | | | | | | | | |
Superannuation (refer Note 54) | | | 1,931 | | | | 1,387 | | | | 1,931 | | | | 1,387 | |
Judges’ pensions (refer Note 54) | | | 15 | | | | 13 | | | | 15 | | | | 13 | |
| | | | | | | | | | | | | | | | |
| | | 1,946 | | | | 1,400 | | | | 1,946 | | | | 1,400 | |
| | | | | | | | | | | | | | | | |
Non-Current | | | | | | | | | | | | | | | | |
Superannuation (refer Note 54) | | | 22,818 | | | | 22,854 | | | | 22,741 | | | | 22,949 | |
Judges’ pensions (refer Note 54) | | | 472 | | | | 433 | | | | 472 | | | | 433 | |
| | | | | | | | | | | | | | | | |
| | | 23,290 | | | | 23,287 | | | | 23,213 | | | | 23,382 | |
| | | | | | | | | | | | | | | | |
| | | 25,236 | | | | 24,687 | | | | 25,159 | | | | 24,782 | |
| | | | | | | | | | | | | | | | |
Other employee benefits | | | | | | | | | | | | | | | | |
Current | | | | | | | | | | | | | | | | |
Salary and wages payable | | | 228 | | | | 184 | | | | 289 | | | | 239 | |
Annual leave | | | 1,330 | | | | 1,185 | | | | 1,494 | | | | 1,255 | |
Long service leave | | | 384 | | | | 350 | | | | 635 | | | | 587 | |
Other employee entitlements | | | 29 | | | | 28 | | | | 107 | | | | 117 | |
| | | | | | | | | | | | | | | | |
| | | 1,971 | | | | 1,747 | | | | 2,525 | | | | 2,199 | |
| | | | | | | | | | | | | | | | |
Non-Current | | | | | | | | | | | | | | | | |
Annual leave | | | 119 | | | | 122 | | | | 127 | | | | 129 | |
Long service leave | | | 2,513 | | | | 2,286 | | | | 2,657 | | | | 2,433 | |
Other employee entitlements | | | 22 | | | | 21 | | | | 47 | | | | 51 | |
| | | | | | | | | | | | | | | | |
| | | 2,654 | | | | 2,429 | | | | 2,831 | | | | 2,614 | |
| | | | | | | | | | | | | | | | |
| | | 4,624 | | | | 4,176 | | | | 5,356 | | | | 4,812 | |
| | | | | | | | | | | | | | | | |
| | | | |
| 41. Deposits Held | | | | | | | | | | | | | | | | |
| | | | |
Current | | | | | | | | | | | | | | | | |
Deposits at fair value through profit and loss | | | — | | | | — | | | | 3,536 | | | | 3,155 | |
Interest bearing security deposits | | | — | | | | — | | | | 20 | | | | 15 | |
Other deposits at amortised cost | | | 1 | | | | — | | | | 1 | | | | — | |
| | | | | | | | | | | | | | | | |
| | | 1 | | | | — | | | | 3,557 | | | | 3,170 | |
| | | | | | | | | | | | | | | | |
| | | | |
| 42. Borrowings and Advances | | | | | | | | | | | | | | | | |
| | | | |
Advances Received | | | | | | | | | | | | | | | | |
Current | | | | | | | | | | | | | | | | |
State debt to the Commonwealth | | | 22 | | | | 23 | | | | 22 | | | | 23 | |
| | | | |
Non-Current | | | | | | | | | | | | | | | | |
State debt to the Commonwealth | | | 422 | | | | 440 | | | | 422 | | | | 440 | |
| | | | | | | | | | | | | | | | |
| | | 444 | | | | 463 | | | | 444 | | | | 463 | |
| | | | | | | | | | | | | | | | |
| | |
| Audited Consolidated Financial Statements 2010–11 – Government of Queensland | | 6-59 |
Notes to the Financial Statements
| | | | | | | | | | | | | | | | |
| | | General Government
Sector | | | Total State Sector | |
| | | 2011 | | | 2010 | | | 2011 | | | 2010 | |
| | | $M | | | $M | | | $M | | | $M | |
| | | | |
| 42. Borrowings and Advances continued | | | | | | | | | | | | | | | | |
| | | | |
Borrowings | | | | | | | | | | | | | | | | |
Current | | | | | | | | | | | | | | | | |
Bank overdraft | | | 1,434 | | | | — | | | | — | | | | — | |
Finance lease liability (refer note 48) | | | 5 | | | | 4 | | | | 5 | | | | 4 | |
QTC borrowings | | | 3,608 | | | | 181 | | | | — | | | | — | |
Loans - other | | | 413 | | | | 429 | | | | 413 | | | | 429 | |
| | | | | | | | | | | | | | | | |
| | | 5,460 | | | | 614 | | | | 418 | | | | 433 | |
Non-Current | | | | | | | | | | | | | | | | |
Finance lease liability (refer note 48) | | | 355 | | | | 284 | | | | 356 | | | | 285 | |
QTC borrowings | | | 19,176 | | | | 15,000 | | | | — | | | | — | |
Loans - other | | | 98 | | | | 18 | | | | 98 | | | | 18 | |
| | | | | | | | | | | | | | | | |
| | | 19,629 | | | | 15,302 | | | | 454 | | | | 303 | |
| | | | | | | | | | | | | | | | |
| | | 25,089 | | | | 15,916 | | | | 872 | | | | 736 | |
| | | | | | | | | | | | | | | | |
| | | | |
| Lease liabilities are effectively secured as the rights to the leased assets recognised as an expense as it accrues. No interest has been capitalised during the current or comparative period. | | | | | | | | | | | | | | | | |
| | | | |
| 43. Securities and derivatives | | | | | | | | | | | | | | | | |
| | | | |
Current | | | | | | | | | | | | | | | | |
Government securities issued | | | — | | | | — | | | | 13,912 | | | | 15,867 | |
Derivatives | | | | | | | | | | | | | | | | |
Derivatives - cash flow hedges | | | — | | | | — | | | | 29 | | | | 40 | |
Other derivatives | | | — | | | | — | | | | 222 | | | | 140 | |
| | | | | | | | | | | | | | | | |
| | | — | | | | — | | | | 14,163 | | | | 16,047 | |
| | | | | | | | | | | | | | | | |
Non-Current | | | | | | | | | | | | | | | | |
Government securities issued | | | — | | | | — | | | | 59,222 | | | | 53,018 | |
Derivatives | | | | | | | | | | | | | | | | |
Derivatives - cash flow hedges | | | — | | | | — | | | | 23 | | | | 4 | |
Other derivatives | | | — | | | | — | | | | 184 | | | | 131 | |
| | | | | | | | | | | | | | | | |
| | | — | | | | — | | | | 59,429 | | | | 53,153 | |
| | | | | | | | | | | | | | | | |
| | | — | | | | — | | | | 73,592 | | | | 69,200 | |
| | | | | | | | | | | | | | | | |
| | |
| 6-60 | | Audited Consolidated Financial Statements 2010–11 – Government of Queensland |
Notes to the Financial Statements
| 44. | Contractual Maturity Analysis of Financial Liabilities |
General Government Sector
The table below sets out the contractual cash flows of the GGS financial liabilities. It is calculated based on undiscounted cash flows relating to the repayment of principal and interest amounts outstanding at balance date.
| | | | | | | | | | | | | | | | | | | | |
| As at 30 June 2011 | | | | | | | | | | | | | | | |
| | | 1 Year or
Less | | | 1 to 5
Years | | | Over 5
Years | | | Total | | | Carrying
Value | |
| | | $M | | | $M | | | $M | | | $M | | | $M | |
| | | | | |
Payables | | | 5,498 | | | | 147 | | | | — | | | | 5,645 | | | | 5,645 | |
Commonwealth borrowings | | | 24 | | | | 107 | | | | 314 | | | | 444 | | | | 444 | |
Other liabilities at amortised cost (including bank overdraft) | | | 1,583 | | | | 198 | | | | 432 | | | | 2,213 | | | | 2,305 | |
QTC borrowings | | | 3,614 | | | | 5,487 | | | | 19,232 | | | | 28,333 | | | | 22,785 | |
| | | | | | | | | | | | | | | | | | | | |
| | | 10,719 | | | | 5,937 | | | | 19,978 | | | | 36,635 | | | | 31,179 | |
| | | | | | | | | | | | | | | | | | | | |
| | | | | |
| As at 30 June 2010 | | | | | | | | | | | | | | | |
| | | 1 Year or
Less | | | 1 to 5
Years | | | Over 5
Years | | | Total | | | Carrying
Value | |
| | | $M | | | $M | | | $M | | | $M | | | $M | |
| | | | | |
Payables | | | 5,102 | | | | 150 | | | | — | | | | 5,252 | | | | 5,252 | |
Commonwealth borrowings | | | 21 | | | | 105 | | | | 337 | | | | 463 | | | | 463 | |
Other liabilities at amortised cost | | | 175 | | | | 158 | | | | 320 | | | | 653 | | | | 735 | |
QTC borrowings | | | 1,827 | | | | 4,064 | | | | 12,952 | | | | 18,843 | | | | 15,182 | |
| | | | | | | | | | | | | | | | | | | | |
| | | 7,125 | | | | 4,477 | | | | 13,609 | | | | 25,211 | | | | 21,631 | |
| | | | | | | | | | | | | | | | | | | | |
| | |
| Audited Consolidated Financial Statements 2010–11 – Government of Queensland | | 6-61 |
Notes to the Financial Statements
| 44. | Contractual Maturity Analysis of Financial Liabilities continued |
Total State Sector
The table below sets out the contractual cash flows of the Total State Sector’s financial liabilities. It is calculated based on undiscounted cash flows relating to the repayment of principal and interest amounts outstanding at balance date.
| | | | | | | | | | | | | | | | | | | | |
| As at 30 June 2011 | | 1 Year or Less | | | 1 to 5
Years | | | Over 5
Years | | | Total | | | Carrying
Value | |
| | | $M | | | $M | | | $M | | | $M | | | $M | |
| | | | | |
Payables | | | 6,734 | | | | 181 | | | | — | | | | 6,915 | | | | 6,915 | |
Commonwealth borrowings | | | 24 | | | | 107 | | | | 314 | | | | 444 | | | | 444 | |
Other liabilities at amortised cost | | | 169 | | | | 198 | | | | 432 | | | | 799 | | | | 893 | |
Government securities and other loans at fair value | | | 17,796 | | | | 42,790 | | | | 36,878 | | | | 97,464 | | | | 76,671 | |
Derivatives | | | 401 | | | | 203 | | | | 149 | | | | 753 | | | | 458 | |
| | | | | | | | | | | | | | | | | | | | |
| | | 25,123 | | | | 43,479 | | | | 37,773 | | | | 106,375 | | | | 85,380 | |
| | | | | | | | | | | | | | | | | | | | |
| | | | | |
| As at 30 June 2010 | | 1 Year or
Less | | | 1 to 5
Years | | | Over 5
Years | | | Total | | | Carrying
Value | |
| | | $M | | | $M | | | $M | | | $M | | | $M | |
| | | | | |
Payables | | | 6,377 | | | | 192 | | �� | | — | | | | 6,569 | | | | 6,569 | |
Commonwealth borrowings | | | 21 | | | | 105 | | | | 337 | | | | 463 | | | | 463 | |
Other liabilities at amortised cost | | | 190 | | | | 158 | | | | 320 | | | | 668 | | | | 751 | |
Government securities and other loans at fair value | | | 19,304 | | | | 29,767 | | | | 41,235 | | | | 90,307 | | | | 72,039 | |
Derivatives | | | 207 | | | | 156 | | | | 48 | | | | 411 | | | | 315 | |
| | | | | | | | | | | | | | | | | | | | |
| | | 26,099 | | | | 30,380 | | | | 41,940 | | | | 98,418 | | | | 80,138 | |
| | | | | | | | | | | | | | | | | | | | |
The difference between the carrying amounts of financial liabilities held at fair value through profit or loss (other than derivatives) and the amounts contractually required to be paid at maturity to the holder of the obligation is set out below.
| | | | | | | | | | | | | | | | |
| | | General Government
Sector | | | Total State Sector | |
| | | 2011 | | | 2010 | | | 2011 | | | 2010 | |
| | | $M | | | $M | | | $M | | | $M | |
| | | | |
Fair value | | | 22,785 | | | | 15,182 | | | | 76,671 | | | | 72,039 | |
Less: Repayment at maturity | | | — | | | | — | | | | 74,004 | | | | 69,347 | |
| | | | | | | | | | | | | | | | |
Difference | | | 22,785 | | | | 15,182 | | | | 2,667 | | | | 2,692 | |
| | | | | | | | | | | | | | | | |
| | | | |
| The GGS financial liabilities at fair value through profit and loss comprise the borrowings with QTC as shown above. These loans have a fixed payment schedule, therefore, the repayment amount at maturity is zero. | | | | | | | | | | | | | | | | |
| | | | |
| 45. Provisions | | | | | | | | | | | | | | | | |
| | | | |
Current | | | | | | | | | | | | | | | | |
Outstanding claims: 1 | | | | | | | | | | | | | | | | |
HIH/FAI | | | 10 | | | | 12 | | | | 10 | | | | 12 | |
Workers’ compensation | | | — | | | | — | | | | 1,132 | | | | 977 | |
Other | | | 124 | | | | 120 | | | | 109 | | | | 274 | |
Onerous contracts | | | — | | | | — | | | | 197 | | | | 35 | |
Queensland Government Insurance Fund 2 | | | 127 | | | | 104 | | | | 127 | | | | 104 | |
Other | | | 19 | | | | 9 | | | | 74 | | | | 76 | |
| | | | | | | | | | | | | | | | |
| | | 280 | | | | 245 | | | | 1,649 | | | | 1,479 | |
| | | | | | | | | | | | | | | | |
Non-Current | | | | | | | | | | | | | | | | |
Outstanding claims: 1 | | | | | | | | | | | | | | | | |
HIH/FAI | | | 26 | | | | 34 | | | | 26 | | | | 34 | |
Workers’ compensation | | | — | | | | — | | | | 1,514 | | | | 1,310 | |
Other | | | 322 | | | | 278 | | | | 660 | | | | 523 | |
Onerous contracts | | | — | | | | — | | | | 72 | | | | 117 | |
Queensland Government Insurance Fund 2 | | | 645 | | | | 581 | | | | 645 | | | | 581 | |
Other | | | 5 | | | | 2 | | | | 474 | | | | 459 | |
| | | | | | | | | | | | | | | | |
| | | 999 | | | | 896 | | | | 3,392 | | | | 3,024 | |
| | | | | | | | | | | | | | | | |
| | | 1,279 | | | | 1,141 | | | | 5,040 | | | | 4,503 | |
| | | | | | | | | | | | | | | | |
| | |
6-62 | | Audited Consolidated Financial Statements 2010–11 – Government of Queensland |
Notes to the Financial Statements
| | 1. | The liability for outstanding claims is measured as the present value of expected future payments, the majority of which are actuarially assessed. The liability includes outstanding claim recoveries and reinsurance receivables of: |
| | | | | | | | | | | | | | | | |
| | | General Government Sector | | | Total State Sector | |
| | | 2011 | | | 2010 | | | 2011 | | | 2010 | |
| | | $M | | | $M | | | $M | | | $M | |
| | | | |
| | | 6 | | | | 8 | | | | 149 | | | | 147 | |
| | 2. | The Queensland Government Insurance Fund (QGIF) is a centrally managed self-insurance scheme mainly covering property and medical and other liability claims for whole-of-Government. An actuarial assessment of the scheme was undertaken as at 30 June 2011. |
General Government Sector Movements in Provisions
| | | | | | | | | | | | | | | | |
| | | Outstanding Claims | | | QGIF | | | Other
Provisions | | | Total | |
| | | 2011 | | | 2011 | | | 2011 | | | 2011 | |
| | | $M | | | $M | | | $M | | | $M | |
| | | | |
Carrying amount at beginning of year | | | 444 | | | | 686 | | | | 11 | | | | 1,141 | |
Additional provisions recognised | | | 135 | | | | 194 | | | | 15 | | | | 344 | |
Reductions in provisions and payments | | | (96 | ) | | | (89 | ) | | | (3 | ) | | | (188 | ) |
Change from remeasurement and discounting adjustments | | | (1 | ) | | | (19 | ) | | | 2 | | | | (18 | ) |
| | | | | | | | | | | | | | | | |
Carrying amount at end of year | | | 482 | | | | 772 | | | | 25 | | | | 1,279 | |
| | | | | | | | | | | | | | | | |
| | | | |
| Total State Sector Movements in Provisions | | Outstanding
Claims | | | QGIF | | | Other
Provisions | | | Total | |
| | | 2011 | | | 2011 | | | 2011 | | | 2011 | |
| | | $M | | | $M | | | $M | | | $M | |
| | | | |
Carrying amount at beginning of year | | | 3,130 | | | | 686 | | | | 687 | | | | 4,503 | |
Additional provisions recognised | | | 1,675 | | | | 194 | | | | 190 | | | | 2,059 | |
Reductions in provisions and payments | | | (1,390 | ) | | | (89 | ) | | | (75 | ) | | | (1,554 | ) |
Transfer to other liabilities | | | — | | | | — | | | | (63 | ) | | | (63 | ) |
Change from remeasurement and discounting adjustments | | | 36 | | | | (19 | ) | | | 78 | | | | 95 | |
| | | | | | | | | | | | | | | | |
Carrying amount at end of year | | | 3,451 | | | | 772 | | | | 817 | | | | 5,040 | |
| | | | | | | | | | | | | | | | |
| | |
| | | General Government
Sector | | | Total State Sector | |
| | | 2011 | | | 2010 | | | 2011 | | | 2010 | |
| | | $M | | | $M | | | $M | | | $M | |
| | | | |
| 46. Other Liabilities | | | | | | | | | | | | | | | | |
| | | | |
Current | | | | | | | | | | | | | | | | |
Unearned revenue | | | 364 | | | | 339 | | | | 675 | | | | 548 | |
Environmental surrender obligations (RECs, GECs, NGACs) | | | — | | | | — | | | | 51 | | | | 56 | |
Liabilities of a discontinuing operation | | | — | | | | — | | | | — | | | | 1,079 | |
Other | | | 206 | | | | 75 | | | | 360 | | | | 257 | |
| | | | | | | | | | | | | | | | |
| | | 570 | | | | 414 | | | | 1,086 | | | | 1,940 | |
| | | | | | | | | | | | | | | | |
Non-Current | | | | | | | | | | | | | | | | |
Unearned revenue | | | 131 | | | | 141 | | | | 1,252 | | | | 206 | |
Other | | | 11 | | | | 12 | | | | 14 | | | | 15 | |
| | | | | | | | | | | | | | | | |
| | | 142 | | | | 153 | | | | 1,266 | | | | 221 | |
| | | | | | | | | | | | | | | | |
| | | 713 | | | | 567 | | | | 2,352 | | | | 2,161 | |
| | | | | | | | | | | | | | | | |
| | |
Audited Consolidated Financial Statements 2010–11 – Government of Queensland | | 6-63 |
Notes to the Financial Statements
| | | | | | | | | | | | | | | | |
| | | General Government
Sector | | | Total State Sector | |
| | | 2011 | | | 2010 | | | 2011 | | | 2010 | |
| | | $M | | | $M | | | $M | | | $M | |
| | | | |
| 47. Cash Flows | | | | | | | | | | | | | | | | |
| | | | |
Reconciliation of Operating Result to Net Cash Flows from Operating Activities | | | | | | | | | | | | | | | | |
| | | | |
Operating Result | | | (1,399 | ) | | | (809 | ) | | | (1,671 | ) | | | (3,177 | ) |
| | | | |
Non-Cash Movements (from continuing and discontinued operations): | | | | | | | | | | | | | | | | |
Depreciation and amortisation | | | 2,508 | | | | 2,503 | | | | 4,681 | | | | 5,002 | |
Net (gain)/loss on disposal/revaluation of non-current assets | | | 163 | | | | 32 | | | | 987 | | | | 1,635 | |
Bad debt provision | | | 19 | | | | 75 | | | | 13 | | | | 78 | |
Equity accounting (profit)/loss | | | (25 | ) | | | (14 | ) | | | (33 | ) | | | (21 | ) |
Unrealised net (gain)/loss on borrowings/investments | | | (58 | ) | | | 293 | | | | (3,145 | ) | | | (761 | ) |
Other | | | (297 | ) | | | 109 | | | | (91 | ) | | | 59 | |
| | | | |
(Increase)/decrease in receivables | | | (592 | ) | | | (244 | ) | | | (534 | ) | | | (838 | ) |
(Increase)/decrease in inventories | | | (105 | ) | | | (111 | ) | | | (158 | ) | | | (66 | ) |
(Increase)/decrease in prepayment and other assets | | | 6 | | | | (29 | ) | | | (1 | ) | | | 82 | |
Increase/(decrease) in creditors | | | 206 | | | | (42 | ) | | | (204 | ) | | | 50 | |
Increase/(decrease) in provisions | | | 1,562 | | | | 1,733 | | | | 1,954 | | | | 2,251 | |
Increase/(decrease) in other liabilities | | | 117 | | | | (98 | ) | | | 207 | | | | 50 | |
| | | | | | | | | | | | | | | | |
Total Non-Cash Movements | | | 3,504 | | | | 4,207 | | | | 3,676 | | | | 7,521 | |
| | | | | | | | | | | | | | | | |
Cash Flows from Operating Activities | | | 2,105 | | | | 3,398 | | | | 2,005 | | | | 4,344 | |
| | | | | | | | | | | | | | | | |
| 48. | Expenditure Commitments |
As at 30 June 2011, State Government entities had entered into the following capital and non-capital expenditure commitments, lease commitments and grant and subsidy commitments.
Other than obligations under finance leases, where substantially all the risks and benefits incidental to ownership of the leased assets are transferred to the lessee, the following commitments have not been recognised as liabilities in the Balance Sheet.
| | | | | | | | | | | | | | | | |
| | | General Government
Sector | | | Total State Sector | |
| | | 2011 | | | 2010 | | | 2011 | | | 2010 | |
| | | $M | | | $M | | | $M | | | $M | |
| | | | |
Capital Expenditure Commitments | | | | | | | | | | | | | | | | |
| | | | |
| Material classes of capital expenditure commitments inclusive of anticipated GST, contracted for at reporting date but not recognised in the accounts are payable as follows: | | | | | | | | | | | | | | | | |
| | | | |
Not later than 1 year | | | 4,454 | | | | 4,221 | | | | 5,542 | | | | 6,761 | |
Later than 1 year but not later than 5 years | | | 1,690 | | | | 3,029 | | | | 2,169 | | | | 3,601 | |
Later than 5 years | | | 648 | | | | 78 | | | | 648 | | | | 5 | |
| | | | | | | | | | | | | | | | |
| | | 6,792 | | | | 7,328 | | | | 8,359 | | | | 10,367 | |
| | | | | | | | | | | | | | | | |
| | | | |
Non-Capital Expenditure Commitments | | | | | | | | | | | | | | | | |
| | | | |
Not later than 1 year | | | 2,515 | | | | 2,144 | | | | 1,929 | | | | 1,607 | |
Later than 1 year but not later than 5 years | | | 1,872 | | | | 2,440 | | | | 1,661 | | | | 1,197 | |
Later than 5 years | | | 96 | | | | 124 | | | | 918 | | | | 828 | |
| | | | | | | | | | | | | | | | |
| | | 4,483 | | | | 4,708 | | | | 4,508 | | | | 3,632 | |
| | | | | | | | | | | | | | | | |
| | |
| 6-64 | | Audited Consolidated Financial Statements 2010–11 – Government of Queensland |
Notes to the Financial Statements
| | | | | | | | | | | | | | | | |
| | | General Government
Sector | | | Total State Sector | |
| | | 2011 | | | 2010 | | | 2011 | | | 2010 | |
| | | $M | | | $M | | | $M | | | $M | |
| | | | |
| 48. Expenditure Commitments continued | | | | | | | | | | | | | | | | |
| | | | |
Operating Lease Commitments | | | | | | | | | | | | | | | | |
| | | | |
Not later than 1 year | | | 340 | | | | 301 | | | | 413 | | | | 403 | |
Later than 1 year but not later than 5 years | | | 695 | | | | 680 | | | | 919 | | | | 967 | |
Later than 5 years | | | 199 | | | | 264 | | | | 510 | | | | 576 | |
| | | | | | | | | | | | | | | | |
| | | 1,234 | | | | 1,245 | | | | 1,842 | | | | 1,946 | |
| | | | | | | | | | | | | | | | |
| | | | |
| Operating leases are entered into as a means of acquiring access to office accommodation and storage facilities. Lease payments are generally fixed, but with inflation escalation clauses on which contingent rentals are determined. | | | | | | | | | | | | | | | | |
| | | | |
| Some renewal or extension options exist in relation to operating leases. No operating leases contain restrictions on financing or other leasing activities. | | | | | | | | | | | | | | | | |
| | | | |
Finance Lease Commitments | | | | | | | | | | | | | | | | |
| | | | |
Not later than 1 year | | | 46 | | | | 39 | | | | 46 | | | | 39 | |
Later than 1 year but not later than 5 years | | | 218 | | | | 139 | | | | 218 | | | | 139 | |
Later than 5 years | | | 1,059 | | | | 867 | | | | 1,060 | | | | 867 | |
| | | | | | | | | | | | | | | | |
Total minimum lease payments | | | 1,323 | | | | 1,045 | | | | 1,324 | | | | 1,045 | |
Future finance charges | | | (963 | ) | | | (757 | ) | | | (963 | ) | | | (757 | ) |
| | | | | | | | | | | | | | | | |
Total lease liabilities | | | 360 | | | | 288 | | | | 361 | | | | 288 | |
| | | | | | | | | | | | | | | | |
| | | | |
Current lease liabilities (refer Note 42) | | | 5 | | | | 4 | | | | 5 | | | | 4 | |
Non-current lease liabilities (refer Note 42) | | | 355 | | | | 284 | | | | 356 | | | | 284 | |
| | | | | | | | | | | | | | | | |
| | | 360 | | | | 288 | | | | 361 | | | | 288 | |
| | | | | | | | | | | | | | | | |
| | | | |
| Finance leases are entered into as a means of funding the acquisition of certain plant and equipment. Lease payments are generally fixed. No leases have escalation clauses other than in the event of payment default. A small number of leases have renewal or purchase options. Where such options exist, they are all exercisable at market prices. | | | | | | | | | | | | | | | | |
| | | | |
Grant and Subsidy Commitments | | | | | | | | | | | | | | | | |
| | | | |
Not later than 1 year | | | 4,341 | | | | 3,498 | | | | 3,587 | | | | 2,859 | |
Later than 1 year but not later than 5 years | | | 6,537 | | | | 6,382 | | | | 3,441 | | | | 4,070 | |
Later than 5 years | | | 26 | | | | 6 | | | | 26 | | | | 6 | |
| | | | | | | | | | | | | | | | |
| | | 10,904 | | | | 9,886 | | | | 7,054 | | | | 6,935 | |
| | | | | | | | | | | | | | | | |
| | | | |
| 49. Cash and Other Assets Held in Trust | | | | | | | | | | | | | | | | |
| | | | |
| Various monies were held in trust by State Government agencies at 30 June 2011 and are not included as assets/liabilities in the Balance Sheet. | | | | | | | | | | | | | | | | |
| | | | |
| A summary follows of entities holding assets in trust: | | | | | | | | | | | | | | | | |
| | | | |
QIC Limited | | | — | | | | — | | | | 24,004 | | | | 25,250 | |
The Public Trustee of Queensland | | | 1,734 | | | | 1,649 | | | | 1,734 | | | | 1,649 | |
Department of Justice and Attorney-General | | | 58 | | | | 79 | | | | 58 | | | | 79 | |
Treasury Department | | | 6 | | | | 21 | | | | 6 | | | | 21 | |
Department of Premier and Cabinet | | | 114 | | | | 2 | | | | 114 | | | | 2 | |
Other | | | 68 | | | | 68 | | | | 68 | | | | 68 | |
| | | | | | | | | | | | | | | | |
| | | 1,980 | | | | 1,819 | | | | 25,984 | | | | 27,069 | |
| | | | | | | | | | | | | | | | |
| | |
| Audited Consolidated Financial Statements 2010–11 – Government of Queensland | | 6-65 |
Notes to the Financial Statements
| 50. | Contingent Assets and Liabilities |
Contingent assets and liabilities represent items that are not recognised in the Balance Sheet because at balance date:
| | • | | there is a possible asset or an obligation arising from past events whose existence will be confirmed by the occurrence or non-occurrence of one or more uncertain future events not wholly within the control of the Government; or |
| | • | | there is a present obligation arising from past events but it is not recognised because it is either not probable that an outflow of resources embodying economic benefits will be required to settle the obligation or the amount of the obligation cannot be measured reliably. |
Below are details of the more significant contingent assets and liabilities from a GGS and Total State Sector perspective.
Pursuant to section 15 of the Queensland Treasury Corporation Act 1988, any losses of the Corporation are the responsibility of the Consolidated Fund. On this basis, the contingent assets and liabilities of the Corporation, which forms part of the Public Financial Corporations Sector, are also incorporated in GGS statements.
| | | | | | | | | | | | | | | | |
| | | General Government
Sector | | | Total State Sector | |
| | | 2011 | | | 2010 | | | 2011 | | | 2010 | |
| | | $M | | | $M | | | $M | | | $M | |
| | | | |
Contingent Liabilities – Quantifiable | | | | | | | | | | | | | | | | |
| | | | |
Nature of Contingency | | | | | | | | | | | | | | | | |
| | | | |
Guarantees and indemnities | | | 37,499 | | | | 40,869 | | | | 6,396 | | | | 5,302 | |
Other | | | 44 | | | | 31 | | | | 156 | | | | 107 | |
| | | | | | | | | | | | | | | | |
| | | 37,543 | | | | 40,900 | | | | 6,552 | | | | 5,409 | |
| | | | | | | | | | | | | | | | |
Guarantees and indemnities
(i) General Government
For the GGS, these mainly comprised guarantees of borrowings by local governments and Public Non-financial Corporations from the Queensland Treasury Corporation of $5.251 billion and $28.666 billion (2010, $4.243 billion and $35.471 billion) respectively and of insurance policies issued by Suncorp Life and Suncorp-Metway Limited of $544 million (2010, $567 million). QTC also provided guarantees of $146 million (2010, $120 million) relating to the trading activities in the national electricity market of subsidiaries of Ergon Energy Corporation Limited and Tarong Energy Corporation, both Queensland Government-owned corporations.
(ii) Total State Sector
From a Total State perspective, borrowings by Public Non-financial Corporations from the Queensland Treasury Corporation as disclosed in (i) above are eliminated on consolidation.
Other
(i) General Government Sector
As at 30 June 2011, there were 12 cases (2010, 10 cases) filed with the courts relating to revenue collected by the Office of State Revenue. An estimate of the liability should the outcomes of the abovementioned cases prove unfavourable for the State is $22 million (2010, $31 million).
Due to a mine subsidence event that occurred at Collingwood Park on 26 April 2008, the State is providing assistance to property holders including, paying for works necessary to stabilise a property and make it safe, repair mining subsidence-related damage where cost-effective to do so, and purchasing of properties beyond economic repair or requiring demolition. The matter is currently before the Supreme Court with a claim estimate of $2 million (2010, Nil).
(ii) Total State Sector
In addition to the above GGS quantifiable contingent liabilities, the following relate to the Public Non-financial Corporations Sector.
The redevelopment of Suncorp Stadium included a number of infrastructure projects external to the stadium. Works amounting to some $39 million (2010, $39 million) have been identified which may need to be transferred to parties external to the State for nil consideration.
A claim has been made against the Queensland Manufactured Water Authority by a sub-contractor for damages by reason of wrongful repudiation of the sub-contractor’s Sub Alliance Agreement. The claim has been assessed as $9 million (2010, $9 million). The State believes this claim will be unsuccessful and as such has not recognised a liability.
| | |
| 6-66 | | Audited Consolidated Financial Statements 2010–11 – Government of Queensland |
Notes to the Financial Statements
| 50. | Contingent Assets and Liabilities continued |
Contingent Liabilities - Quantifiable continued
(ii) Total State Sector continued
Retail investors in the QR National Share Offer are entitled to receive loyalty bonus shares, provided shares allocated under the Offer are held continuously in the same registered name until 7 December 2011. Based on the number of shares outstanding at 30 June 2011 to which the bonus would apply, it is estimated based on the share price at 30 June 2011, the State’s interest in QR National Ltd would reduce by $30 million (2010, Nil).
Contingent Liabilities - Not Quantifiable
(i) General Government Sector
Legal Proceedings and Disputes
A number of legal actions have been brought against the State Government and its agencies. Notification has also been received of a number of other cases that are not yet subject to court action but which may result in subsequent litigation. Due to the wide variety and nature of the claims and the uncertainty of any potential liability, no value has been attributed to these actions/claims.
Native Title
A number of native title claims that affect the Queensland Government have been filed with the National Native Title Tribunal under the Native Title Act 1993 (Commonwealth). The Native Title Act provides for payment of compensation to native titleholders for a variety of acts that may affect native title.
It is possible that the Government may face future litigation and liability in respect of claims for native title. However, given the subjectivity of the issue, it is not appropriate to attempt to determine the likely success of such claims or to quantify any potential liability.
Securities, Warranties and Guarantees
The State has provided a number of securities, warranties and guarantees in the normal course of business. The amount of any future claims against these securities, warranties and guarantees cannot be reliably estimated.
Cross Border Lease Transactions
QTC has assumed responsibility for a significant portion of the transaction risk relating to a number of cross border lease transactions and in certain situations could be liable to make additional payments under the transactions. However, external advice and history to date indicate that the likelihood of these events occurring is remote.
In addition, the Corporation has provided certain guarantees and indemnities to various participants in the cross border lease transactions. Unless exceptional and extreme circumstances arise, it is unlikely that the Corporation will be required to make a significant payment under these guarantees and indemnities.
Financial Assurance Liability Gap for Mining Projects
Financial assurances are required when mining projects are undertaken to cover the rehabilitation liability should a mining leaseholder fail to undertake rehabilitation. The current financial assurance system provides for a discount based on past environmental performance. This has resulted in a gap in the financial assurances held by the State and the potential liability, should a miner default.
The contingent liability would only be recognised as an actual liability in the event that the miner defaults on the conditions of the licence and the State holds insufficient financial assurance to cover the rehabilitation that the State considers necessary. At reporting date it is not possible to determine the extent or timing of any potential financial effect of this responsibility.
Rehabilitation of Abandoned Mine Sites
The State has a responsibility to rehabilitate abandoned mine sites. At reporting date it is not possible to determine the extent or timing of any potential financial effect that this responsibility may have.
| | |
| Audited Consolidated Financial Statements 2010–11 – Government of Queensland | | 6-67 |
Notes to the Financial Statements
| 50. | Contingent Assets and Liabilities continued |
Contingent Liabilities - Not Quantifiable continued
(i) General Government Sector continued
Compensation for Infrastructure on Expired Leases
The State issues leases or permits which allow activity such as grazing, tourist resorts, etc. to occur on parks and forestry estates. On the expiry of the lease or permit, the State may be required to pay compensation to the lessee for improvements made to the property over the duration of the lease. The amount of this liability is not quantifiable and it is not expected that it will be known until the expiration of the lease or permit. Leases progressively expire until 2045.
Contaminated Land Sites
On 30 June 2010 the Queensland Government licensed the rights to manage and harvest timber plantations with State Forests to a private company - Forestry Plantations Queensland Pty Limited (FPQ). Ownership of the land on which these plantations are situated has been retained by the State. As part of the execution of this transaction, the State and FPQ will jointly assess all plantation land for contamination within a stipulated timeline during the 2010-12 financial years. In the event that any land sites are assessed to be contaminated, an appropriate land care strategy will be implemented. Any costs associated with remediation to contamination attributable to the period up to 30 June 2010 will be borne by the State and any costs associated with remediation of contamination attributable post 30 June 2010 will be borne by FPQ. The amount and attribution of these costs, if any, will not be quantifiable until the site assessment has been completed. The State also has provided an indemnification to FPQ for costs incurred in defending third party claims for personal injury or death arising from contaminated land in the licensed area for a period of 5 years from 1 July 2010, with payments capped to a range of $1 million to a maximum of $5 million.
(ii) Total State Sector
In addition to the above GGS non-quantifiable contingent liabilities, the following relate specifically to the Public Non-financial and Financial Corporation Sectors.
WorkCover
The Workers’ Compensation and Rehabilitation Act 2003 provides that the State Government guarantees every WorkCover policy or other insurance contract with WorkCover Queensland, a statutory body. Given the nature of this contingency, it is not possible to estimate the liability, if any, due under this heading.
Gainshare arrangements
In relation to a number of drought response projects currently being undertaken by the State, an adjustment to the final fee payable to alliance contractors may be applied based on measured cost performance of individual projects.
Contaminated Land
The State Government controls certain areas of land that are affected by pollutants. The agencies involved will be obliged to restore these assets to a safe and useable condition in the event that their use changes, for example, when the land is sold. Given its nature, it is not possible to provide an estimate of the potential liability of this exposure.
QIC Limited
QIC Limited, in its capacity as trustee is potentially liable for the unsettled liabilities of a number of trusts that it administers. However, under the respective trust deeds the Corporation is entitled to be indemnified out of the assets of the trusts for any losses or outgoings that may be sustained in its role as trustee, provided the trustee has acted within the terms of the trust deeds.
The directors have assessed the recoverable amounts of the assets of the trusts and concluded that currently they have excess assets over liabilities.
Funds managed by the corporation in a trustee capacity totalled $27.757 billion at 30 June 2011 (2010, $25.725 billion).
| | |
| 6-68 | | Audited Consolidated Financial Statements 2010–11 – Government of Queensland |
Notes to the Financial Statements
| 50. | Contingent Assets and Liabilities continued |
Contingent Liabilities - Not Quantifiable continued
(ii) Total State Sector continued
State Asset Sales
As part of the State’s asset sales process (the initial public offering of shares in QR National Limited, the Forestry Plantations business, the Port of Brisbane business, the Abbot Point Coal Terminal (X50) business and the Queensland Motorways business), the State put in place a number of contractual arrangements which result in contingent liabilities as follows:
| | • | | Superannuation indemnity for QR National and Forestry Plantations Queensland for the cost of employer contributions above a particular threshold for their employees who remained as members of QSuper’s defined benefit category. |
| | • | | State indemnities for directors and officers of relevant government owned corporations and State public servants were established in relation to liability which might arise out of the restructuring and sale of the various sale entities. |
| | • | | Indemnities as to tax and other liabilities (including previous cross border lease liabilities) accrued during the State’s ownership. |
| | • | | Indemnities and warranties to the Joint Lead Managers in relation to the initial public offering of shares in QR National Limited. |
| | • | | Compensation potentially payable in the event that the leases issued over land and infrastructure by State agencies are terminated. |
| | • | | Compensation potentially payable for improvements in the event of the termination of relevant leases. |
| | • | | Various warranties in relation to the businesses sold. |
At present management are unaware of any breaches of agreements and there are no claims being made. As such it is not possible to estimate any potential financial effect should such a claim arise in the future.
| | | | | | | | | | | | | | | | |
| | | General Government
Sector | | | Total State Sector | |
| | | 2011 | | | 2010 | | | 2011 | | | 2010 | |
| | | $M | | | $M | | | $M | | | $M | |
| | | | |
Contingent Assets - Quantifiable | | | | | | | | | | | | | | | | |
| | | | |
Nature of Contingency | | | | | | | | | | | | | | | | |
| | | | |
Guarantees and indemnities | | | 3,220 | | | | 2,333 | | | | 4,403 | | | | 3,453 | |
Other | | | 11 | | | | 11 | | | | 69 | | | | 11 | |
| | | | | | | | | | | | | | | | |
| | | 3,231 | | | | 2,344 | | | | 4,472 | | | | 3,464 | |
| | | | | | | | | | | | | | | | |
Guarantees
(i) General Government
The Department of Local Government and Planning held bank guarantees totalling $19 million in 2009-10 as security for the performance and satisfaction of construction contracts. Guarantees held in 2010-11 are immaterial.
The Department of Employment, Economic Development and Innovation holds financial assurances of $2.629 billion (2010, $1.997 billion) for mining projects, to cover rehabilitation should a leaseholder fail to undertake rehabilitation. The Department also holds bank guarantees in relation to the Queensland Investment Incentive Scheme (QIIS) grants and other financial support provided to public sector proponents totalling $41 million (2010, $48 million).
The Department of Health holds $13 million (2010, $13 million) in guarantees and undertakings from third parties in the normal course of business.
The Department of Transport and Main Roads holds securities on behalf of contractors in the form of performance guarantees amounting to $104 million (2010, $105 million).
| | |
Audited Consolidated Financial Statements 2010–11 – Government of Queensland | | 6-69 |
Notes to the Financial Statements
| 50. | Contingent Assets and Liabilities continued |
Contingent Assets - Quantifiable continued
The Department of Environment and Resource Management holds bank guarantees totalling $426 million (2010, $142 million) as financial security to ensure compliance with various acts, environmental management activities, vegetation management development applications and other contracts and agreements.
Translink holds bank guarantees for performance under specific contracts totalling $7 million (2010, $9 million).
(ii) Total State Sector
In addition to the above GGS quantifiable guarantees and indemnities, the following relate specifically to the Public Non-financial and Financial Corporation sectors.
Queensland Rail Limited holds bank, insurance company and other guarantees of $428 million (2010, $381 million).
Ergon Energy Corporation Ltd holds bank guarantees from customers totalling $159 million (2010, $167 million) relating to the construction of capital assets for energy customers.
ENERGEX Limited holds bank guarantees totalling $36 million (2010, $33 million) from customers relating to subdivision works and the construction of capital assets for those customers and procurement guarantees from suppliers.
WorkCover Queensland holds bank guarantees on behalf of self-insurers totalling $560 million (2010, $539 million).
Other
(i) General Government Sector
Construction Industry Skills Centre Pty Ltd
A non-recoverable loan of $11 million (2010, $11 million) paid to Construction Industry Skills Centre Pty Ltd is repayable to the State Government in circumstances contingent on the winding up of the company and related trust.
(ii) Total State
In addition to the above GGS quantifiable other contingent assets, the following relate specifically to the Public Non-financial and Financial Corporation sectors.
Insurance Claims
There are a number of insurance claims yet to be finalised in relation to the Gold Coast Desalination Plant, Gibson Island, Eastern Pipeline and flood damage to Water Secure. These claims total $58 million (2010, Nil).
Contingent Assets - Not Quantifiable
(i) General Government Sector
SunWater Land
Various agreements entered into since 2001 between the Department of Environment and Resource Management and SunWater carry an obligation on SunWater to provide a freehold portion of land to the department in addition to a distribution from the sale proceeds of the remaining land when sold by Sunwater. Due to changing circumstances surrounding the usage of the land and council requirements for works to be completed before sale, no reliable estimate of the value of the land can be provided.
(ii) Total State Sector
North Queensland Bulk Ports Corporation Limited
North Queensland Bulk Ports Corporation Limited holds a number of guarantees for security over defects in construction contracts and for future liabilities of port operators.
Off Shore Products Under Development
The QIC Limited Group have a contingent asset in respect of establishment costs in relation to potential offshore products under development whose receipt is dependent on the outcome of the establishment of the products and funds under management raised.
| | |
| 6-70 | | Audited Consolidated Financial Statements 2010–11 – Government of Queensland |
Notes to the Financial Statements
| 51. | Post Balance Date Events |
Australian Government’s Proposed Carbon Pricing Mechanism
On 10 July 2011 the Australian Government announced a proposal, ‘Securing a Clean Energy Future – the Australian Government’s Climate Change Plan’, to implement a two-stage carbon pricing mechanism for the Australian economy. Commencing on 1 July 2012, the proposal sets a fixed price path for the first three years ($23 per tonne of CO2-equivalent emissions adjusted in real terms by 2.5 percent per annum) before moving to a flexible price mechanism from 1 July 2015. It proposes a framework for setting a cap on greenhouse gas emissions by capping the number of carbon units available once the flexible price period commences, which can be adjusted over time to ensure that the Australian Government’s reduction targets are met. The commencement of the scheme is subject to the Australian Government’s ability to negotiate agreement with a majority in both Houses of Parliament to pass legislation before the scheduled commencement date of 1 July 2012.
Notwithstanding that the carbon pricing mechanism is yet to be legislated, the likelihood of a price on carbon being implemented is considered sufficient to require that the potential impact on asset values should be estimated as at 30 June 2011. In this respect, it is the State Government’s investment within the electricity generation industry that is expected to be most materially impacted by the carbon pricing mechanism. Refer Note 1 (an) for further information regarding assumptions made in the valuation of generation assets.
Voluntary Separation Program
The Government has approved a Voluntary Separation Program (VSP) for eligible employees across the Queensland Public Service. The program is targeted at non-frontline service areas as part of service reprioritisation strategies within departments. An offer can only be made to permanent employees employed permanently prior to 1 January 2010. The ultimate decision as to whether eligible departmental employees are to be offered a VSP, the timing of the offer and the separation rests wholly with the individual departments. Employees are expected to exit under this program in 2011-12.
Department of Health
On 10 July 2011, Queensland Health temporarily suspended the recovery of overpayments to focus on dealing with outstanding underpayment claims. Queensland Health had commenced a process to recover overpayments by working with the individually affected employees to ensure there was timely resolution of the recovery process. The salary recovery process will not resume until a package of changes are fully implemented.
| 52. | Defeased Cross Border Leases |
In prior years, the State has entered into a number of cross border leases in conjunction with Queensland Treasury Corporation. In accordance with AASB 117 Leases, the leases are treated as finance leases, the leased assets being amortised over the estimated useful lives of the assets. At the end of the financial year, the entities which had entered into this type of arrangement are detailed below:
In the 2000-01 financial year, Powerlink Queensland entered into a structured financing arrangement involving the sale and subsequent lease-back of supply system assets. The arrangement is a USA cross border lease transaction with the date of expiry being 2 January 2027.
The Stanwell power station is subject to cross border leases that were entered into in 1995. There is no lease liability as future lease payments were prepaid at the commencement of the lease.
| 53. | Financial Risk Management Disclosure |
The State’s principal financial assets and liabilities comprise:
Cash assets;
Receivables and loans;
Term deposits;
Investments in equities and managed investment schemes;
| | |
| Audited Consolidated Financial Statements 2010–11 – Government of Queensland | | 6-71 |
Notes to the Financial Statements
| 53. | Financial Risk Management Disclosure continued |
Debt securities;
Payables;
Borrowings;
Finance lease payables; and
Derivatives.
The main purpose in holding these financial instruments is to prudently manage the State’s financial risks within government policy parameters.
The carrying amounts of the GGS and Total State Sector financial assets and financial liabilities by category are:
| | | | | | | | | | | | | | | | |
| | | General Government Sector | | | Total State Sector | |
| | | 2011
$M | | | 2010
$M | | | 2011
$M | | | 2010
$M | |
| | | | |
Financial assets | | | | | | | | | | | | | | | | |
Cash and deposits | | | 635 | | | | 904 | | | | 1,359 | | | | 1,311 | |
Receivables and loans at amortised cost | | | 36,320 | | | | 27,410 | | | | 6,258 | | | | 5,041 | |
Held-to-maturity | | | 127 | | | | 98 | | | | 107 | | | | 78 | |
Fair value through profit and loss (at initial recognition) | | | 1,697 | | | | 4,494 | | | | 60,747 | | | | 49,906 | |
Fair value through profit and loss (held for trading) | | | — | | | | — | | | | 525 | | | | 640 | |
Available-for-sale investments | | | 18,437 | | | | 19,986 | | | | 308 | | | | 325 | |
| | | | | | | | | | | | | | | | |
| | | 57,216 | | | | 52,894 | | | | 69,305 | | | | 57,301 | |
| | | | | | | | | | | | | | | | |
Financial liabilities | | | | | | | | | | | | | | | | |
At fair value through profit and loss (at initial recognition) | | | 22,785 | | | | 15,182 | | | | 76,933 | | | | 72,165 | |
At fair value through profit and loss (held for trading) | | | — | | | | — | | | | 196 | | | | 190 | |
At amortised cost | | | 8,394 | | | | 6,449 | | | | 8,252 | | | | 7,783 | |
| | | | | | | | | | | | | | | | |
| | | 31,179 | | | | 21,631 | | | | 85,380 | | | | 80,138 | |
| | | | | | | | | | | | | | | | |
| | | | |
Net gains/(losses) on available-for-sale investments recognised in equity | | | — | | | | 2 | | | | — | | | | 5 | |
| | | | |
Amount removed from the available-for-sale reserve to operating result | | | — | | | | — | | | | — | | | | 9 | |
The State’s activities expose it to a variety of financial risks, such as credit risk, liquidity risk and market risk (including interest rate risk, price risk and foreign exchange risk). The State’s overall risk management objectives, policies and strategies focus on minimising financial risk exposures and seek to mitigate potential adverse effects. The diverse nature of the financing and investing activities undertaken by agencies across the Queensland Government supports a decentralised approach to risk management. Individual agencies are responsible for managing risks to which they are exposed.
| | |
6-72 | | Audited Consolidated Financial Statements 2010–11 – Government of Queensland |
Notes to the Financial Statements
| 53. | Financial Risk Management Disclosure continued |
Risk management strategies in relation to the State’s financial assets and liabilities are summarised below. Additional risk management information can be found in individual agencies’ general purpose financial reports.
Credit Risk
Credit risk exposure represents the potential loss that would be recognised if counterparties failed to meet contractual obligations in relation to receivables, loans and other financial assets. Credit risk is regularly assessed, measured and managed in strict accordance with credit risk policies.
The credit risk in relation to receivables is managed in the following manner:
| | • | | trading terms require payment within a specified period after the goods and services are applied; |
| | • | | outstanding accounts are assessed for impairment at each reporting date based on objective evidence of impairment; |
| | • | | bad debts are written off as they are incurred; and |
| | • | | impairment losses are recognised in the Operating Result. |
Receivables and loans past due but not impaired and past due and impaired are disclosed in Note 26.
Credit risk in relation to loans and other financial assets is managed through regular analysis of the ability of borrowers, potential borrowers and financial market counterparties with respect to derivative instruments to meet interest and capital repayment obligations. Where appropriate, collateral is obtained in the form of rights to securities, deeds of undertaking, letters of credit or guarantees.
Credit risk for the GGS and Total State Sector on recognised financial assets, including derivatives, is the carrying amount of these assets in the Balance Sheet, net of any impairment losses. This is equal to the market value of financial assets at balance date. The State’s major concentrations of credit risk are with the finance sector, National Electricity market, rural and housing sectors.
The credit exposure for derivative contracts, other than electricity derivatives, is calculated utilising the ‘value at risk methodology’ which takes into account the current market value, duration, term to maturity and interest rate and/or exchange rate volatility.
The State’s largest holder of investments and non-electricity derivatives is Queensland Treasury Corporation. Credit risk exposures that are related to derivative financial instruments (other than electricity related derivatives) are as follows:
| | | | | | | | |
| | | Total State
Sector | |
| | | 2011 | | | 2010 | |
| | | $M | | | $M | |
Derivative Exposure | | | | | | | | |
Interest rate swaps | | | 718 | | | | 424 | |
Cross currency swaps | | | 154 | | | | 192 | |
Forward exchange contracts | | | 4 | | | | 144 | |
Forward rate agreements | | | — | | | | 1 | |
Credit default swaps | | | 242 | | | | 333 | |
The State is exposed to significant concentrations of risk in the finance and investment industry, given the size of the State’s investment portfolio. A ratings-based approach is used to determine maximum credit exposure, as well as country of domicile, size of its business and asset composition and quality of the underlying security.
| | |
| Audited Consolidated Financial Statements 2010–11 – Government of Queensland | | 6-73 |
Notes to the Financial Statements
| 53. | Financial Risk Management Disclosure continued |
Credit Risk continued
QTC’s counterparty exposure by rating is as follows:
| | | | | | | | |
| Rating | | Total State
Sector | |
| | | 2011 | | | 2010 | |
| | | % | | | % | |
Long Term | | | | | | | | |
AAA | | | 47 | | | | 40 | |
AA+ | | | 1 | | | | 1 | |
AA | | | 42 | | | | 40 | |
AA- | | | 2 | | | | 7 | |
A+ | | | 5 | | | | 7 | |
A | | | 2 | | | | 4 | |
A- | | | — | | | | — | |
| | |
Short Term | | | | | | | | |
A-1+ | | | 1 | | | | 1 | |
There is also a below A- counterparty with an exposure of $30 million and a remaining term 5.2 months.
The National Electricity Market, operated by the Australian Energy Market Operator, has strict prudential guidelines that minimise potential for credit related losses. This is supported by individual agencies’ Board approved policies. Security deposits, letters of credit or bank guarantees are obtained from customers to mitigate possible losses. Credit risk exposures that relate to electricity derivative financial instruments are managed under International Swaps and Derivatives Association (ISDA) agreements. The ISDA also has a strict credit policy, based on counterparties’ credit ratings and requiring appropriate security.
Loans and advances are made to primary producers and small businesses at either a commercial or concessional interest rate. Housing loans are provided to people within Queensland on low-to-moderate incomes. The low level of borrowers overdue indicates the high credit quality of the loans. The credit risk of the rural and housing sectors is mitigated through collateral in the form of mortgages, charges and liens and on-going monitoring of amounts owed and security valuations.
Liquidity Risk
Liquidity risk arises from the possibility that individual agencies may be unable to settle a transaction on the due date. A range of funding facilities is used to ensure funds are available, such as maintaining a sufficient level of cash holdings to fund unexpected cash flows. Liquidity risk of the electricity sector is controlled by the Australian Energy Market Operator, where by all market participants are required to deliver irrevocable bank guarantees as security for timely settlement. The contractual maturities of financial liabilities are included at Note 44.
Market Risk
Derivative Financial Instruments
The State, through its controlled entities, enters into derivative financial instruments in the normal course of business in order to hedge exposures to movements in interest rates, commodity prices and foreign currency exchange rates. Strict criteria must be met in order for derivatives to be hedge accounted. Speculative contracts may also be entered into for the purposes of profiting from short term movements in the electricity derivative forward market. GGS entities do not engage in speculative trading.
Instruments used by the State include:
Cash flow hedges
Electricity derivatives (mostly price swaps and futures) are used to protect against movements in the price of electricity. The contracts are recognised at trade date and settled net, with cash flows expected within three years.
| | |
| 6-74 | | Audited Consolidated Financial Statements 2010–11 – Government of Queensland |
Notes to the Financial Statements
| 53. | Financial Risk Management Disclosure continued |
Market Risk continued
Derivative Financial Instruments continued
Commodity swaps are used to hedge against price fluctuations of commodities, such as diesel fuel.
Forward exchange contracts are entered into to protect against movements in foreign currencies. These transactions relate to contracted purchases of components used in capital investments, capital equipment and operating expenditure denominated in foreign currencies. Contracts cover up to three years and are settled on a net basis.
The portion of the gain or loss on the hedging instrument that is determined to be an effective hedge is recognised directly in equity. When the cash flows occur, the State adjusts the initial measurement of the component recognised in the Balance Sheet by the amount deferred in equity.
Total State Sector net gains/losses deferred to or removed from equity were as follows:
For the year ended 30 June 2011
| | • | | net gains deferred to equity totalled $100 million; |
| | • | | net gains of $346 million were removed from equity and reclassified to the Operating Result as a result of cash flow hedge settlements ($236 million) and ineffective hedges ($110 million); and |
| | • | | a loss of $2 million was removed from equity and transferred to the cost of components. |
For the year ended 30 June 2010:
| | • | | net gains deferred to equity totalled $411 million; |
| | • | | net gains of $155 million were removed from equity and reclassified to the Operating Result as a result of cash flow hedge settlements ($159 million), offset by $4 million losses on sale related to discontinued operations; and |
| | • | | a gain of $1 million was removed from equity and transferred to the cost of components. |
No amounts were deferred to or removed from equity by GGS entities in 2010 or 2011.
In June 2011, Tarong Energy Corporation Limited discontinued all its cash flow hedges. As a result of the Government’s plan to restructure the electricity generator sector, forecast transactions were no longer considered highly probable. This accounts for $181 million of the amount removed from equity in 2010-11.
Derivatives which do not qualify for hedge accounting
Certain derivatives do not qualify for hedge accounting as they are held for trading or not designated as hedges. These instruments typically include electricity derivatives such as swaps, caps and options. Interest rate swaps, forward rate agreements and credit default swaps are also used to hedge exposure to interest rate movements, foreign currency and credit risks but are not hedge accounted.
Interest Rate Risk
The GGS and Total State Sector are exposed to interest rate risk through investments with QIC Limited, cash deposits with the Commonwealth Bank of Australia and borrowings from the Commonwealth Government. In some instances, derivative overlays are used to protect investment portfolios from interest rate risk. The GGS is also exposed to interest rate risk through its deposits with and borrowings from QTC.
The GGS does not undertake hedging in relation to interest rate risk on cash deposits or borrowings. This is managed as per the liquidity risk management strategy.
A number of other State-owned entities enter into interest rate swaps, forward rate agreements and futures contracts to assist in the management of interest rate risk. In most instances, interest rate swaps are utilised to swap medium to long term fixed rate borrowings into floating rate borrowings at rates that are lower than those available if short term borrowings were utilised. At times, floating to fixed swaps are undertaken to generate a fixed rate term funding profile.
| | |
| Audited Consolidated Financial Statements 2010–11 – Government of Queensland | | 6-75 |
Notes to the Financial Statements
| 53. | Financial Risk Management Disclosure continued |
Market Risk continued
Price Risk
The State is exposed to price risk through investments with QIC Limited and an investment in QR National.
The GGS is not materially exposed to other price risks.
Other State entities are exposed to commodity price risk resulting from changes in electricity, coal and gas prices, diesel prices and other commodity prices. Longer term fixed price supply agreements are utilised to manage risk in relation to coal and gas. Derivative instruments are used to hedge against the price of electricity and diesel. A variety of swaps, futures, options and forward exchange contracts are used to hedge this risk. These financial instruments have a time horizon of between 3 months and 3 years.
Foreign Exchange Risk
The State is exposed to movements in foreign currencies as a result of future commercial transactions and recognised assets and liabilities denominated in currencies other than the Australian dollar. The State enters into forward exchange contracts, currency options and swaps to effectively manage the exposure resulting from purchases of various plant, equipment and component parts in foreign currencies. Foreign exchange risk is managed by individual agencies who hedge significant proportions of anticipated transactions with their respective Board’s approval.
The State also borrows offshore to provide access to additional sources of funding and diversify risk and undertakes investments in foreign currency assets. To effectively manage the exposure to fluctuations in exchange rates, forward exchange contracts and cross currency swaps are used.
The State’s exposure to foreign currency risk is not considered material due to the effectiveness of risk management strategies.
Sensitivity Analysis
A summary sensitivity analysis of the material risks to which the State is exposed is provided below.
Interest Rate and Unit Price Risk
General Government Sector
The GGS is exposed to movements in interest rates and managed fund unit prices through its cash deposits, investments and borrowings.
Due to the GGS overdrawn position for 2011, the effect of a +/-1% movement in interest rates on the GGS cash balances would result in an $8 million decrease/increase (2010, $9 million increase/decrease) in the GGS operating result and equity.
The GGS has a fixed rate note with QTC (rate reviewed annually) and other investments with QIC Limited that are exposed to interest rate changes and changes in the unit price of the funds managed. Assuming all other variables remained constant, if the return on the loan and investments moved by +/-1%, the GGS operating result and equity would have been approximately $332 million higher or lower (2010, $282 million).
| | |
| 6-76 | | Audited Consolidated Financial Statements 2010–11 – Government of Queensland |
Notes to the Financial Statements
| 53. | Financial Risk Management Disclosure continued |
Sensitivity Analysis continued
Interest Rate and Unit Price Risk continued
General Government Sector continued
QTC borrowings are in the form of fixed rate loans, generic debt pool borrowings (which are akin to fixed rate loans) or floating rate loans. Although the majority of the GGS agency borrowings are either fixed rate loans or generic debt pool loans, the Consolidated Fund bears the risk of movements between the fixed rate and market rate. Consequently, if interest rates on QTC borrowings were to increase/decrease by 1%, the GGS operating result and equity would be approximately $228 million lower or higher (2010, $152 million).
Total State Sector
As the State’s corporate treasury, QTC undertakes portfolio management activities on behalf of customers and raises funding in advance of requirements. QTC borrows in advance of requirements to ensure Queensland public sector entities have ready access to funding when required and also to reduce the risk associated with refinancing maturing loans. In addition, QTC holds and invests surplus funds to assist with the management of customer portfolios. These activities expose the State to interest rate risk including basis risk which is managed within a value-at-risk (VaR) framework. Due to a reduction in market volatility since the global financial crisis, there has been a significant decrease in the reported VaR over the last financial year as follows:
| | | | | | | | |
| | | Total State
Sector | |
| | | 2011 | | | 2010 | |
| | | $M | | | $M | |
| | |
Interest rate risk VaR | | | 40 | | | | 95 | |
The above VaR calculation does not include mark-to-market impact of changes in credit spreads on the value of assets held in the QTC Cash Fund. As at 30 June 2011, the State had an exposure of approximately $819,000 (2010, $759,000) per basis point to changes in credit spreads on QTC assets and liabilities.
The effect of a 1% movement in interest rates on the State’s cash balances would result in a $14 million increase/decrease (2010, $13 million) in the State’s operating result and equity.
The State has other investments exposed to interest rate changes and changes in the unit price of the funds managed by QIC Limited. Assuming all other variables remained constant, if the return on these investments moved by +/-1%, the State’s operating result and equity would be approximately $321 million higher or lower (2010, $260 million). For the range of changes to the Operating Result and Equity that are considered reasonably possible at year end refer to individual agency statements, particularly QTC.
Share Price Risk
The State holds approximately 34% of the shares in QR National Limited, which is listed on the Australian Stock Exchange. Consequently, it is exposed to changes in the share price. If the share price increases/decreases by 15%, the State’s operating result and equity would be approximately $421 million higher or lower (2010, nil).
| | |
| Audited Consolidated Financial Statements 2010–11 – Government of Queensland | | 6-77 |
Notes to the Financial Statements
| 53. | Financial Risk Management Disclosure continued |
Sensitivity Analysis continued
Commodity Price Risk
As a result of its ownership of electricity generating Government-owned corporations, the State is exposed to Electricity Price Risk. This is the risk associated with fluctuations in electricity prices in the National Electricity Market. The entities affected manage this risk by hedging a portion of the production using electricity derivative instruments. Each entity is responsible for its own risk management and may make varying assumptions in assessing its sensitivity to such movements. The agencies with a material impact for Total State Sector are CS Energy Limited, Ergon Energy Corporation Limited, Stanwell Corporation Limited and Tarong Energy Corporation Limited. On the assumption that all other variables remain constant, the impact of electricity price movements on the State’s operating result and equity are as follows:
| | | | | | | | | | | | | | | | | | | | | | | | | | | | | | | | |
| | | 2011 | | | 2010 | |
| | | Operating
Result | | | Equity | | | Operating
Result | | | Equity | |
| | | $M | | | $M | | | $M | | | $M | | | $M | | | $M | | | $M | | | $M | |
| | | +10% | | | -10% | | | +10% | | | -10% | | | +10% | | | -10% | | | +10% | | | -10% | |
CS Energy | | | (6 | ) | | | 6 | | | | (46 | ) | | | 46 | | | | (4 | ) | | | 4 | | | | (40 | ) | | | 40 | |
Ergon Energy | | | 1 | | | | (5 | ) | | | 1 | | | | (5 | ) | | | 6 | | | | (6 | ) | | | 6 | | | | (6 | ) |
Stanwell | | | — | | | | — | | | | — | | | | — | | | | (1 | ) | | | 1 | | | | (56 | ) | | | 56 | |
| | | | | | | | |
| | | +20% | | | -20% | | | +20% | | | -20% | | | +16% | | | -16% | | | +16% | | | -16% | |
| | | | | | | | |
Stanwell | | | (8 | ) | | | 7 | | | | (76 | ) | | | 76 | | | | — | | | | — | | | | — | | | | — | |
Tarong Energy | | | (70 | ) | | | 74 | | | | (70 | ) | | | 74 | | | | (60 | ) | | | 50 | | | | (200 | ) | | | 175 | |
Foreign Exchange Risk
For the Total State Sector, the sensitivities identified by the affected entities range from -20% to +20% (2010 -20% to +20%) currency movement. Had the exchange rate moved within these ranges, the State’s operating result would have been up to $37 million higher/$21 million lower (2010, $43 million higher/$34 million lower). The State’s equity would have been up to $37 million higher/$22 million lower (2010, $42 million higher/$33 million lower) due to the impact of hedge accounting.
Net Fair Value of Financial Instruments
Cash, deposits, receivables and payables approximate fair value. The carrying amounts of all other GGS and Total State Sector’s financial assets and liabilities equates to their net fair value, except as per table below.
| | | | | | | | | | | | | | | | |
| | | Carrying
Amount | | | Fair Value | |
| | | 2011 | | | 2010 | | | 2011 | | | 2010 | |
| | | $M | | | $M | | | $M | | | $M | |
Financial Assets | | | | | | | | | | | | | | | | |
Housing loans | | | 37 | | | | 38 | | | | 24 | | | | 26 | |
| | | | |
Financial Liabilities | | | | | | | | | | | | | | | | |
Commonwealth borrowings | | | 444 | | | | 463 | | | | 412 | | | | 429 | |
Financial instruments measured at fair value have been classified in accordance with the hierarchy described in AASB 7 Financial Instruments: Disclosures. The three levels of fair value hierarchy reflect the significance of the inputs used to determine the valuation of these instruments.
| | • | | Level 1 of the fair value hierarchy represents fair value measurements derived from quoted market prices (unadjusted) in active markets for identical assets and liabilities; |
| | • | | Level 2 of the fair value hierarchy represents fair value measurements derived from inputs other than quoted prices included within Level 1 that are observable, either directly or indirectly; and |
| | • | | Level 3 of the fair value hierarchy represents fair value measurements derived from inputs that are not based on |
observable market date.
| | |
| 6-78 | | Audited Consolidated Financial Statements 2010–11 – Government of Queensland |
Notes to the Financial Statements
| 53. | Financial Risk Management Disclosure continued |
Sensitivity Analysis continued
Level 1
The fair value of financial assets and financial liabilities with standard terms and conditions and traded in an active market is based on (unadjusted) quoted market prices. Financial assets are priced at current bid prices, while financial liabilities are priced at current asking prices. Financial instruments in this category include certain equity and debt investments where quoted prices are available from an active market, such as publicly traded derivatives, actively traded Commonwealth and semi-government bonds and investments in certain unit trusts.
Level 2
The fair value of financial assets and liabilities is determined by using quoted market prices for similar instruments in active or less active markets or using valuation techniques, with inputs, other than quoted prices included in Level 1, that are observable either directly (prices) or indirectly (derived from prices). Financial instruments in this category include fixed interest deposits, fixed term notes, investments in rental purchase plan properties, non-actively traded corporate, government and semi-government bonds, unit trusts and other derivatives such as over-the-counter derivatives, forward exchange contracts, commodity swaps and some electricity derivatives.
Level 3
Where financial instruments are measured using valuation techniques based on significant unobservable inputs, such instruments are included in level 3 of the fair value hierarchy. These may include derivatives for long term energy procurement and other electricity contracts.
The following table presents the GGS and Total State Sector financial assets and liabilities recognised and measured at fair value.
| | | | | | | | | | | | | | | | |
| | | Level 1
2011
$M | | | Level 2
2011
$M | | | Level 3
2011
$M | | | Total
2011
$M | |
General Government Sector | | | | | | | | | | | | | | | | |
| | | | |
2011 | | | | | | | | | | | | | | | | |
Assets | | | | | | | | | | | | | | | | |
Financial assets at fair value through profit or loss | | | | | | | | | | | | | | | | |
Rental Purchase Plan | | | — | | | | 212 | | | | — | | | | 212 | |
Derivatives | | | — | | | | 4 | | | | — | | | | 4 | |
Shares | | | 71 | | | | 1,406 | | | | — | | | | 1,477 | |
Available-for-sale financial assets | | | | | | | | | | | | | | | | |
Corporate bonds | | | — | | | | 290 | | | | — | | | | 290 | |
| | | | | | | | | | | | | | | | |
Total assets | | | 71 | | | | 1,913 | | | | — | | | | 1,984 | |
| | | | | | | | | | | | | | | | |
| | |
| Audited Consolidated Financial Statements 2010–11 – Government of Queensland | | 6-79 |
Notes to the Financial Statements
| 53. | Financial Risk Management Disclosure continued |
Net Fair Value of Financial Instruments continued
| | | | | | | | | | | | | | | | |
| | | Level 1
2011
$M | | | Level 2
2011
$M | | | Level 3
2011
$M | | | Total
2011
$M | |
General Government Sector continued | | | | | | | | | | | | | | | | |
| | | | |
2011 | | | | | | | | | | | | | | | | |
Liabilities | | | | | | | | | | | | | | | | |
Financial liabilities at fair value through profit or loss | | | | | | | | | | | | | | | | |
Borrowings | | | — | | | | 22,785 | | | | — | | | | 22,785 | |
| | | | | | | | | | | | | | | | |
Total liabilities | | | — | | | | 22,785 | | | | — | | | | 22,785 | |
| | | | | | | | | | | | | | | | |
| | | | |
2010 | | | | | | | | | | | | | | | | |
| | | | |
Assets | | | | | | | | | | | | | | | | |
Financial assets at fair value through profit or loss | | | | | | | | | | | | | | | | |
Rental Purchase Plan | | | — | | | | 206 | | | | — | | | | 206 | |
Other investments | | | 76 | | | | 4,210 | | | | — | | | | 4,286 | |
Available-for-sale financial assets | | | | | | | | | | | | | | | | |
Corporate bonds | | | — | | | | 297 | | | | — | | | | 297 | |
Shares | | | — | | | | — | | | | — | | | | — | |
Other equity investments | | | — | | | | — | | | | — | | | | — | |
Other | | | — | | | | — | | | | — | | | | — | |
| | | | | | | | | | | | | | | | |
Total assets | | | 76 | | | | 4,713 | | | | — | | | | 4,789 | |
| | | | | | | | | | | | | | | | |
| | | | |
Liabilities | | | | | | | | | | | | | | | | |
Financial liabilities at fair value through profit or loss | | | | | | | | | | | | | | | | |
Borrowings | | | — | | | | 15,182 | | | | — | | | | 15,182 | |
| | | | | | | | | | | | | | | | |
Total liabilities | | | — | | | | 15,182 | | | | — | | | | 15,182 | |
| | | | | | | | | | | | | | | | |
| | | | |
Total State Sector | | | | | | | | | | | | | | | | |
| | |
| 6-80 | | Audited Consolidated Financial Statements 2010–11 – Government of Queensland |
Notes to the Financial Statements
| 53. | Financial Risk Management Disclosure continued |
Net Fair Value of Financial Instruments continued
| | | | | | | | | | | | | | | | |
| | | | |
2011 | | | | | | | | | | | | | | | | |
Assets | | | | | | | | | | | | | | | | |
Financial assets at fair value through profit or loss | | | | | | | | | | | | | | | | |
Rental Purchase Plan | | | — | | | | 212 | | | | — | | | | 212 | |
Derivatives | | | 69 | | | | 256 | | | | 300 | | | | 625 | |
Money market deposits, securities and bonds | | | 16,468 | | | | 1,144 | | | | — | | | | 17,612 | |
Other investments | | | 3,039 | | | | 34,137 | | | | — | | | | 37,176 | |
Loans | | | — | | | | 5,643 | | | | — | | | | 5,643 | |
Available-for-sale financial assets | | | | | | | | | | | | | | | | |
Corporate bonds | | | — | | | | 290 | | | | — | | | | 290 | |
Shares | | | — | | | | 9 | | | | — | | | | 9 | |
| | | | | | | | | | | | | | | | |
Total assets | | | 19,576 | | | | 41,692 | | | | 300 | | | | 61,569 | |
| | | | | | | | | | | | | | | | |
| | | | |
Liabilities | | | | | | | | | | | | | | | | |
Financial liabilities at fair value through profit or loss | | | | | | | | | | | | | | | | |
Derivatives | | | 142 | | | | 231 | | | | 85 | | | | 457 | |
Deposits | | | — | | | | 3,536 | | | | — | | | | 3,536 | |
Government securities issued | | | 65,888 | | | | 7,246 | | | | — | | | | 73,134 | |
Borrowings | | | — | | | | 1 | | | | — | | | | 1 | |
| | | | | | | | | | | | | | | | |
Total liabilities | | | 66,030 | | | | 11,013 | | | | 85 | | | | 77,128 | |
| | | | | | | | | | | | | | | | |
| | | | |
2010 | | | | | | | | | | | | | | | | |
Assets | | | | | | | | | | | | | | | | |
Financial assets at fair value through profit or loss | | | | | | | | | | | | | | | | |
Rental Purchase Plan | | | — | | | | 206 | | | | — | | | | 206 | |
Derivatives | | | 65 | | | | 686 | | | | 383 | | | | 1,134 | |
Money market deposits, securities and bonds | | | 16,025 | | | | 213 | | | | — | | | | 16,238 | |
Other investments | | | 142 | | | | 28,255 | | | | — | | | | 28,397 | |
Loans | | | — | | | | 4,568 | | | | — | | | | 4,568 | |
Available-for-sale financial assets | | | | | | | | | | | | | | | | |
Corporate bonds | | | — | | | | 297 | | | | — | | | | 297 | |
Shares | | | — | | | | 19 | | | | — | | | | 19 | |
| | | | | | | | | | | | | | | | |
Total assets | | | 16,232 | | | | 34,244 | | | | 383 | | | | 50,858 | |
| | | | | | | | | | | | | | | | |
| | |
| Audited Consolidated Financial Statements 2010–11 – Government of Queensland | | 6-81 |
Notes to the Financial Statements
| 53. | Financial Risk Management Disclosure continued |
Net Fair Value of Financial Instruments continued
| | | | | | | | | | | | | | | | |
| | | Level 1
2011
$M | | | Level 2
2011
$M | | | Level 3
2011
$M | | | Total
2011
$M | |
Total State Sector continued | | | | | | | | | | | | | | | | |
| | | | |
2010 | | | | | | | | | | | | | | | | |
| | | | |
Liabilities | | | | | | | | | | | | | | | | |
Financial liabilities at fair value through profit or loss | | | | | | | | | | | | | | | | |
Derivatives | | | 61 | | | | 214 | | | | 38 | | | | 314 | |
Deposits | | | 31 | | | | 3,123 | | | | — | | | | 3,154 | |
Government securities issued | | | 62,037 | | | | 6,848 | | | | — | | | | 68,885 | |
Borrowings | | | — | | | | 1 | | | | — | | | | 1 | |
| | | | | | | | | | | | | | | | |
Total liabilities | | | 62,129 | | | | 10,186 | | | | 38 | | | | 72,353 | |
| | | | | | | | | | | | | | | | |
There were no significant transfers between Level 1 and Level 2 during the year ended 30 June 2011 and 2010.
The following table presents the net changes in level 3 instruments.
| | | | | | | | |
| | | Total State
Sector | |
| | | 2011 | | | 2010 | |
| | | $M | | | $M | |
| | | Derivatives | |
Net Movement | | | | | | | | |
Opening balance 1 July | | | 344 | | | | 174 | |
Purchases | | | 1 | | | | — | |
Settlements | | | (167 | ) | | | (46 | ) |
Movement recognised in other comprehensive income | | | (16 | ) | | | 16 | |
Movement recognised in profit or loss | | | 37 | | | | 238 | |
Transfers out of level 3 | | | 33 | | | | (20 | ) |
| | | | | | | | |
Closing balance 30 June | | | 215 | | | | 344 | |
| | | | | | | | |
For fair value measurements in Level 3 of the fair value hierarchy, changing one or more of the unobservable inputs used to reasonably possible alternative assumptions would have the following effects:
| | | | | | | | | | | | | | | | |
| | | Effect on profit or loss | | | Effect on hedging | |
| | | Favourable | | | Unfavourable | | | Favourable | | | Unfavourable | |
| | | $M | | | $M | | | $M | | | $M | |
Net derivatives | | | | | | | | | | | | | | | | |
2011 | | | 41 | | | | (41 | ) | | | 14 | | | | (14 | ) |
2010 | | | 14 | | | | (14 | ) | | | 1 | | | | 1 | |
| 54. | Retirement Benefit Obligations |
Retirement benefit liabilities include the following final salary defined benefit schemes:
| | • | | State Public Sector Superannuation Scheme (QSuper); |
| | • | | Pensions provided in accordance with the Judges’ (Pensions and Long Leave) Act 1967 (Judges’ Scheme); and |
| | • | | Energy Super Fund (ESF) (formerly ESI Super) |
| | |
| 6-82 | | Audited Consolidated Financial Statements 2010–11 – Government of Queensland |
Notes to the Financial Statements
| 54. | Retirement Benefit Obligations continued |
QSuper and Judges’ Schemes
State public sector superannuation liabilities include defined benefit schemes for both current and former employees comprising the State Public Sector Superannuation Fund (QSuper). State Government budget dependent agencies, together with a number of statutory bodies, excluding principally the Queensland electricity supply industry, are required to make employer contributions to the QSuper scheme. The “former” defined benefit superannuation liabilities in the Balance Sheet represent the unfunded liabilities of defined benefit members who have elected to leave the scheme. The liability grows due to investment earnings and additional entrants transferring from the defined benefit scheme. In December 2010, the State swapped its former defined benefit liabilities with defined benefit liabilities as a result of asset transfers between QSuper defined benefit and accumulation fund accounts.
The QSuper scheme is assessed annually by the State Actuary and a full actuarial review is undertaken every three years. A full actuarial review of QSuper was completed as at 30 June 2010.
QSuper also incorporates defined contribution categories, for which the State has no further legal or constructive obligation other than to pay contributions. These liabilities and assets have been accounted for in accordance with the standards relevant to Defined Contribution schemes. In particular, no assets or liabilities relating to the funded Defined Contribution scheme have been included in the Balance Sheet. The expense relating to these schemes is the amount of employer contributions, $1.328 billion (2010, $1.168 billion).
Energy Super Fund
Queensland electricity entities contribute to an industry multiple employer superannuation fund, the Energy Super Fund (ESF). The ESF was formed on the 1 April 2011 with the merger of the Electricity Supply Industry Superannuation Fund (QLD) (ESI Super) and Superannuation Plan for Electrical Contractors (SPEC Super). Members, after serving a qualifying period, are entitled to benefits from the fund on retirement, resignation, retrenchment, disability or death.
The defined benefit account of this fund is a funded plan which provides defined lump sum benefits based on years of service and average final salary. Employers will contribute to the defined benefit section of the plan at various rates between 10% and 15% of defined benefit members salaries from 1 July 2011. Employee contributions to the fund are based on various percentages of their gross salaries. The defined benefit account of this fund is closed to new members.
The most recent actuarial assessment of the fund, as at 30 June 2010, was carried out by Mr Shane Mather, F.I.A.A. of Sunsuper Financial Services Pty Ltd.
| | |
| Audited Consolidated Financial Statements 2010–11 – Government of Queensland | | 6-83 |
Notes to the Financial Statements
| 54. | Retirement Benefit Obligations continued |
| | | | | | | | | | | | | | | | |
General Government Sector | | | | | | | | | | | | | | | | |
Retirement Benefit Obligations 2010-11 | | | | | | | | | | | | | | | | |
| | | | |
| | | $M | | | $M | | | $M | | | $M | |
| | | | |
Reconciliation of the Present Value of the | | | | | | | | | | | | | | | | |
Defined Benefit Obligation | | | | | | | | | | | | | | | | |
| | | Total | | | QSuper
DB | | | Former
DB | | | Judges | |
Opening balance at 1 July 2010 | | | 30,790 | | | | 27,597 | | | | 2,747 | | | | 446 | |
Current service cost | | | 1,106 | | | | 1,087 | | | | — | | | | 19 | |
Contributions by plan participants | | | 259 | | | | 259 | | | | — | | | | — | |
Interest cost | | | 1,594 | | | | 1,393 | | | | 177 | | | | 24 | |
Benefits paid (including contributions tax) | | | (1,862 | ) | | | (1,609 | ) | | | (241 | ) | | | (12 | ) |
Transfers to Former DB | | | — | | | | (269 | ) | | | 269 | | | | — | |
Transfers from Former DB | | | (2,538 | ) | | | 414 | | | | (2,952 | ) | | | | |
Actuarial (gain)/loss | | | 54 | | | | 44 | | | | — | | | | 10 | |
| | | | | | | | | | | | | | | | |
Closing balance at 30 June 2011 | | | 29,403 | | | | 28,916 | | | | — | | | | 487 | |
| | | | | | | | | | | | | | | | |
| | | | |
Present Value of the Obligation as at 30 June 2011 by Funding Policy | | | | | | | | | | | | | | | | |
Present value of the obligation - wholly unfunded | | | 487 | | | | | | | | | | | | | |
Present value of the obligation - wholly/partly funded | | | 28,916 | | | | | | | | | | | | | |
| | | | | | | | | | | | | | | | |
| | | 29,403 | | | | | | | | | | | | | |
| | | | | | | | | | | | | | | | |
| | | | |
Reconciliation of the Fair Value of Plan Assets | | | | | | | | | | | | | | | | |
| | | Total | | | QSuper
DB | | | Former
DB | | | Judges | |
Opening balance at 1 July 2010 | | | 6,103 | | | | 6,103 | | | | — | | | | — | |
Expected return on plan assets | | | 354 | | | | 354 | | | | — | | | | — | |
Employer contributions | | | 1,140 | | | | 899 | | | | 241 | | | | — | |
Contributions by plan participants | | | 259 | | | | 259 | | | | — | | | | — | |
Benefits paid (including contributions tax) | | | (1,850 | ) | | | (1,609 | ) | | | (241 | ) | | | — | |
Transfer of DB to Accumulation plan assets | | | (2,538 | ) | | | (2,538 | ) | | | — | | | | — | |
Actuarial gain/(loss) | | | 698 | | | | 698 | | | | — | | | | — | |
| | | | | | | | | | | | | | | | |
Closing balance at 30 June 2011 | | | 4,166 | | | | 4,166 | | | | — | | | | — | |
| | | | | | | | | | | | | | | | |
| | | | |
Reconciliation of Balance Sheet Liability/ (Asset) | | | | | | | | | | | | | | | | |
Present value of the obligation | | | 29,403 | | | | 28,916 | | | | — | | | | 487 | |
Fair value of plan assets | | | (4,166 | ) | | | (4,166 | ) | | | — | | | | — | |
| | | | | | | | | | | | | | | | |
Liability/(Asset) recognised in Balance Sheet | | | 25,237 | | | | 24,750 | | | | — | | | | 487 | |
| | | | | | | | | | | | | | | | |
| | | | |
Amounts recognised in Operating Statement | | | | | | | | | | | | | | | | |
Current service cost | | | 1,106 | | | | 1,087 | | | | — | | | | 19 | |
Interest cost | | | 1,594 | | | | 1,393 | | | | 177 | | | | 24 | |
Expected return on plan assets | | | (354 | ) | | | (354 | ) | | | — | | | | — | |
| | | | | | | | | | | | | | | | |
Total amounts recognised in Operating Statement | | | 2,346 | | | | 2,126 | | | | 177 | | | | 43 | |
| | | | | | | | | | | | | | | | |
| | | | |
Amounts recognised in Statement of | | | | | | | | | | | | | | | | |
Changes in Net Assets (Equity) | | | | | | | | | | | | | | | | |
Opening cumulative amount of actuarial (gains) and losses | | | 2,430 | | | | 2,419 | | | | 89 | | | | (78 | ) |
Net actuarial (gain)/loss recognised in year | | | (644 | ) | | | (654 | ) | | | — | | | | 10 | |
| | | | | | | | | | | | | | | | |
Cumulative actuarial (gains)/losses recognised in the Statement of Changes in Net Assets (Equity) | | | 1,786 | | | | 1,765 | | | | 89 | | | | (68 | ) |
| | | | | | | | | | | | | | | | |
| | |
| 6-84 | | Audited Consolidated Financial Statements 2010–11 – Government of Queensland |
Notes to the Financial Statements
| 54. | Retirement Benefit Obligations continued |
General Government Sector
Retirement Benefit Obligations 2010-11 continued
Plan Asset Allocations
State Public Sector Superannuation scheme hold investments with the following asset allocations:
| | | | | | | | | | | | |
| | | QSuper
DB | | | Former
DB | | | Judges | |
Equity | | | 37 | % | | | N/A | | | | N/A | |
Debt instruments | | | 37 | % | | | N/A | | | | N/A | |
Property | | | 7 | % | | | N/A | | | | N/A | |
Other | | | 19 | % | | | N/A | | | | N/A | |
| | | | | | | | | | | | |
Total | | | 100 | % | | | N/A | | | | N/A | |
| | | | | | | | | | | | |
QSuper plan assets are those held within the QSuper Trust Fund only.
QSuper holds investments in unit trusts that hold financial instruments issued by the State. These instruments are difficult to accurately value and are immaterial in proportion to the unit trusts. In addition, these trusts own properties which are used by Government agencies. Again the exact values attributable to these tenancies are difficult to accurately determine, nor do they represent a material proportion of the fair value plan assets.
The overall expected rate of return on QSuper plan assets are based on the expected returns by asset class derived by QIC Limited, the strategic asset allocations and the expected levels of taxation applying to the QSuper scheme overall.
| | | | | | | | | | | | | | | | |
| | | | | | $M | | | $M | | | $M | |
| | | | |
| | | | | | Total | | | QSuper
DB | | | Judges | |
Actual return on plan assets | | | | | | | 791 | | | | 791 | | | | N/A | |
| | | | |
Estimate of employer contributions to be paid in 2011-12 | | | | | | | 1,836 | | | | 1,836 | | | | N/A | |
| | | | |
Principal actuarial assumptions at 30 June 2011 | | | | | | | | | | | | | | | | |
| | | | | | QSuper
DB | | | QSuper
DB | | | Judges | |
Gross discount rate | | | | | | | 5.30 | % | | | 6.40 | % | | | 5.30 | % |
Net discount rate (after allowance for investment taxation) | | | | | | | 5.20 | % | | | 6.40 | % | | | 5.30 | % |
Expected rates of return on plan assets (net of fees and taxes) | | | | | | | 7.00 | % | | | N/A | | | | N/A | |
Future inflationary salary increases | | | | | | | 4.00 | % | | | N/A | | | | 4.50 | % |
Expected CPI increases | | | | | | | 2.50 | % | | | N/A | | | | N/A | |
| | | | |
Retirement Benefit Obligations 2009-10 | | | | | | | | | | | | | | | | |
| | | $M | | | $M | | | $M | | | $M | |
| | | | |
Reconciliation of the Present Value of the Defined Benefit Obligation | | | | | | | | | | | | | | | | |
| | | Total | | | QSuper
DB | | | Former
DB | | | Judges | |
Opening balance at 1 July 2009 | | | 28,897 | | | | 26,093 | | | | 2,379 | | | | 425 | |
Current service cost | | | 1,064 | | | | 1,046 | | | | — | | | | 18 | |
Contributions by plan participants | | | 264 | | | | 264 | | | | — | | | | — | |
Interest cost | | | 1,696 | | | | 1,375 | | | | 297 | | | | 24 | |
Benefits paid (including contributions tax) | | | (1,507 | ) | | | (979 | ) | | | (516 | ) | | | (12 | ) |
Transfers to Former DB | | | — | | | | (587 | ) | | | 587 | | | | — | |
Actuarial (gain)/loss | | | 376 | | | | 385 | | | | — | | | | (9 | ) |
| | | | | | | | | | | | | | | | |
Closing balance at 30 June 2010 | | | 30,790 | | | | 27,597 | | | | 2,747 | | | | 446 | |
| | | | | | | | | | | | | | | | |
| | | | |
Present Value of the Obligation as at 30 June 2010 by Funding Policy | | | | | | | | | | | | | | | | |
Present value of the obligation - wholly unfunded | | | 3,193 | | | | | | | | | | | | | |
Present value of the obligation - wholly/partly funded | | | 27,597 | | | | | | | | | | | | | |
| | | | | | | | | | | | | | | | |
| | | 30,790 | | | | | | | | | | | | | |
| | | | | | | | | | | | | | | | |
| | |
| Audited Consolidated Financial Statements 2010–11 – Government of Queensland | | 6-85 |
Notes to the Financial Statements
| 54. | Retirement Benefit Obligations continued |
General Government Sector
Retirement Benefit Obligations 2009-10 continued
| | | | | | | | | | | | | | | | |
| | | $M | | | $M | | | $M | | | $M | |
Reconciliation of the Fair Value of Plan Assets | | | | | | | | | | | | | | | | |
| | | | |
| | | Total | | | QSuper
DB | | | Former
DB | | | Judges | |
Opening balance at 1 July 2009 | | | 5,473 | | | | 5,473 | | | | — | | | | — | |
Expected return on plan assets | | | 376 | | | | 376 | | | | — | | | | — | |
Employer contributions | | | 1,040 | | | | 524 | | | | 516 | | | | — | |
Contributions by plan participants | | | 264 | | | | 264 | | | | — | | | | — | |
Benefits paid (including contributions tax) | | | (979 | ) | | | (979 | ) | | | — | | | | — | |
Former DB benefits paid from DB plan assets | | | (516 | ) | | | — | | | | (516 | ) | | | — | |
Actuarial gain/(loss) | | | 445 | | | | 445 | | | | — | | | | — | |
| | | | | | | | | | | | | | | | |
Closing balance at 30 June 2010 | | | 6,103 | | | | 6,103 | | | | — | | | | — | |
| | | | | | | | | | | | | | | | |
| | | | |
Reconciliation of Balance Sheet Liability/(Asset) | | | | | | | | | | | | | | | | |
| | | | |
Present value of the obligation | | | 30,790 | | | | 27,597 | | | | 2,747 | | | | 446 | |
Fair value of plan assets | | | (6,103 | ) | | | (6,103 | ) | | | — | | | | — | |
| | | | | | | | | | | | | | | | |
Liability/(Asset) recognised in Balance Sheet | | | 24,687 | | | | 21,494 | | | | 2,747 | | | | 446 | |
| | | | | | | | | | | | | | | | |
| | | | |
Amounts recognised in Operating Statement | | | | | | | | | | | | | | | | |
Current service cost | | | 1,064 | | | | 1,046 | | | | — | | | | 18 | |
Interest cost | | | 1,696 | | | | 1,375 | | | | 297 | | | | 24 | |
Expected return on plan assets | | | (376 | ) | | | (376 | ) | | | — | | | | — | |
| | | | | | | | | | | | | | | | |
Total amounts recognised in Operating Statement | | | 2,384 | | | | 2,045 | | | | 297 | | | | 42 | |
| | | | | | | | | | | | | | | | |
| | | | |
Amounts recognised in Statement of Changes in Net Assets (Equity) | | | | | | | | | | | | | | | | |
Opening cumulative amount of actuarial (gains) and losses | | | 2,499 | | | | 2,479 | | | | 89 | | | | (69 | ) |
Net actuarial (gain)/loss recognised in year | | | (69 | ) | | | (60 | ) | | | — | | | | (9 | ) |
| | | | | | | | | | | | | | | | |
Cumulative actuarial (gains)/losses recognised in the Statement of Changes in Net Assets (Equity) | | | 2,430 | | | | 2,419 | | | | 89 | | | | (78 | ) |
| | | | | | | | | | | | | | | | |
Plan Asset Allocations
State Public Sector Superannuation holds investments with the following asset allocations:
| | | | | | | | | | | | |
| | | QSuper
DB | | | Former
DB | | | Judges | |
Equity | | | 36 | % | | | N/A | | | | N/A | |
Debt | | | 36 | % | | | N/A | | | | N/A | |
Property | | | 12 | % | | | N/A | | | | N/A | |
Other | | | 16 | % | | | N/A | | | | N/A | |
| | | | | | | | | | | | |
Total | | | 100 | % | | | N/A | | | | N/A | |
| | | | | | | | | | | | |
QSuper plan assets are those held within the QSuper Trust Fund only.
QSuper holds investments in unit trusts that hold financial instruments issued by the State. These instruments are difficult to accurately value and are immaterial in proportion to the unit trusts. In addition, these trusts own properties which are used by Government agencies. Again the exact values attributable to these tenancies are difficult to accurately determine, nor do they represent a material proportion of the fair value plan assets.
The overall expected rate of return on QSuper plan assets is based on the expected returns by asset class derived by QIC Limited, the strategic asset allocations and the expected levels of taxation applying to the QSuper scheme overall.
| | |
| 6-86 | | Audited Consolidated Financial Statements 2010–11 – Government of Queensland |
Notes to the Financial Statements
| 54. | Retirement Benefit Obligations continued |
General Government Sector
Retirement Benefit Obligations 2009-10 continued
| | | | | | | | | | | | | | | | | | | | | | |
| | | | | | | | $M | | | $M | | | $M | | | $M | |
| | | | | | |
| | | | | | | | Total | | | QSuper
DB | | | Former
DB | | | Judges | |
| | | | | |
Actual return on plan assets | | | | | | | 715 | | | | 715 | | | | N/A | | | | N/A | |
| | | | | |
Principal actuarial assumptions at 30 June 2010 | | | | | | | | | | | | | | | | | | | | |
| | | | | | | | | | | QSuper
DB | | | Former
DB | | | Judges | |
Gross discount rate | | | | | | | | | | | | | 5.30 | % | | | 11.91 | % | | | 5.30 | % |
Net Discount rate (after allowance for investment taxation) | | | | | | | | | | | 5.10 | % | | | 11.91 | % | | | 5.30 | % |
Expected rates of return on plan assets (net of fees and taxes) | | | | | | | | | | | 7.00 | % | | | N/A | | | | N/A | |
Future inflationary salary increases | | | | | | | | | | | 3.80 | % | | | N/A | | | | 4.80 | % |
Expected CPI increases | | | | | | | | | | | 2.30 | % | | | N/A | | | | N/A | |
| | | | | | |
| | | | | 2011 | | | 2010 | | | 2009 | | | 2008 | | | 2007 | |
| | | | | $M | | | $M | | | $M | | | $M | | | $M | |
Experience adjustments relating to liabilities | | | | | | | | | | | | | | | | | | | | |
| | QSuper DB | | | (216 | ) | | | 537 | | | | (524 | ) | | | (14 | ) | | | 428 | |
| | Former DB | | | — | | | | — | | | | — | | | | — | | | | — | |
| | Judges | | | 6 | | | | (9 | ) | | | (15 | ) | | | (13 | ) | | | (10 | ) |
Experience adjustments relating to assets | | | | | | | | | | | | | | | | | | | | |
| | QSuper DB | | | 698 | | | | 445 | | | | (1,432 | ) | | | (447 | ) | | | 457 | |
| | Former DB | | | — | | | | — | | | | — | | | | — | | | | — | |
| | Judges | | | — | | | | — | | | | — | | | | — | | | | — | |
Present value of defined benefit obligation | | | | | | | | | | | | | | | | | | | | |
| | QSuper DB | | | 28,916 | | | | 27,596 | | | | 26,091 | | | | 25,509 | | | | 23,491 | |
| | Former DB | | | — | | | | 2,747 | | | | 2,380 | | | | 2,696 | | | | 3,111 | |
| | Judges | | | 487 | | | | 446 | | | | 425 | | | | 451 | | | | 409 | |
Fair value of plan assets | | | | | | | | | | | | | | | | | | | | | | |
| | QSuper DB | | | 4,166 | | | | 6,103 | | | | 5,472 | | | | 6,742 | | | | 6,834 | |
| | Former DB | | | — | | | | — | | | | — | | | | — | | | | — | |
| | Judges | | | — | | | | — | | | | — | | | | — | | | | — | |
Surplus/(deficit) | | QSuper DB | | | (24,750 | ) | | | (21,493 | ) | | | (20,619 | ) | | | (18,767 | ) | | | (16,657 | ) |
| | Former DB | | | — | | | | (2,747 | ) | | | (2,380 | ) | | | (2,696 | ) | | | (3,111 | ) |
| | Judges | | | (487 | ) | | | (446 | ) | | | (425 | ) | | | (451 | ) | | | (409 | ) |
|
Total State Sector Retirement Benefit Obligations 2010-11 Reconciliation of the Present Value of the Defined Benefit Obligation | |
| | | | | Total | | | QSuper
DB | | | Former
DB | | | Judges | | | ESF | |
Opening balance at 1 July 2010 | | | | | 31,984 | | | | 27,597 | | | | 2,747 | | | | 446 | | | | 1,194 | |
Current service cost | | | | | 1,156 | | | | 1,087 | | | | — | | | | 19 | | | | 50 | |
Contributions by plan participants | | | | | 273 | | | | 259 | | | | — | | | | — | | | | 14 | |
Interest cost | | | | | 1,644 | | | | 1,393 | | | | 177 | | | | 24 | | | | 50 | |
Benefits paid (including contributions tax) | | | (1,910 | ) | | | (1,609 | ) | | | (241 | ) | | | (12 | ) | | | (48 | ) |
Transfers to Former DB | | | | | — | | | | (269 | ) | | | 269 | | | | — | | | | — | |
Transfers from Former DB | | | | | (2,538 | ) | | | 414 | | | | (2,952 | ) | | | | | | | | |
Actuarial (gain)/loss | | | | | (51 | ) | | | 44 | | | | — | | | | 10 | | | | (105 | ) |
| | | | | | | | | | | | | | | | | | | | | | |
Closing balance at 30 June 2011 | | | 30,558 | | | | 28,916 | | | | — | | | | 487 | | | | 1,155 | |
| | | | | | | | | | | | | | | | | | | | | | |
| | | | | |
Present Value of the Obligation as at 30 June 2011 by Funding Policy | | | | | | | | | | | | | | | | | | | | |
Present value of the obligation - wholly unfunded | | | 487 | | | | | | | | | | | | | | | | | |
Present value of the obligation - wholly/partly funded | | | 30,071 | | | | | | | | | | | | | | | | | |
| | | | | | | | | | | | | | | | | | | | | | |
| | | | | 30,558 | | | | | | | | | | | | | | | | | |
| | | | | | | | | | | | | | | | | | | | | | |
| | |
| Audited Consolidated Financial Statements 2010–11 – Government of Queensland | | 6-87 |
Notes to the Financial Statements
| 54. | Retirement Benefit Obligations continued |
Total State Sector
Retirement Benefit Obligations 2010-11 continued
| | | | | | | | | | | | | | | | | | | | |
| | | $M | | | $M | | | $M | | | $M | | | $M | |
| | | | | |
Reconciliation of the Fair Value of Plan Assets | | | | | | | | | | | | | | | | | | | | |
| | | Total | | | QSuper
DB | | | Former
DB | | | Judges | | | ESF | |
Opening balance at 1 July 2010 | | | 7,202 | | | | 6,103 | | | | — | | | | — | | | | 1,099 | |
Expected return on plan assets | | | 419 | | | | 354 | | | | — | | | | — | | | | 65 | |
Employer contributions | | | 1,214 | | | | 899 | | | | 241 | | | | — | | | | 74 | |
Contributions by plan participants | | | 273 | | | | 259 | | | | — | | | | — | | | | 14 | |
Benefits paid (including contributions tax) | | | (1,899 | ) | | | (1,609 | ) | | | (241 | ) | | | — | | | | (49 | ) |
Transfer of DB to Accumulation plan assets | | | (2,538 | ) | | | (2,538 | ) | | | — | | | | — | | | | — | |
Actuarial gain/(loss) | | | 727 | | | | 698 | | | | — | | | | — | | | | 29 | |
| | | | | | | | | | | | | | | | | | | | |
Closing balance at 30 June 2011 | | | 5,398 | | | | 4,166 | | | | — | | | | — | | | | 1,232 | |
| | | | | | | | | | | | | | | | | | | | |
| | | | | |
Reconciliation of Balance Sheet Liability/(Asset) | | | | | | | | | | | | | | | | | | | | |
Present value of the obligation | | | 30,557 | | | | 28,915 | | | | — | | | | 487 | | | | 1,155 | |
Fair value of plan assets | | | (5,398 | ) | | | (4,166 | ) | | | — | | | | — | | | | (1,232 | ) |
| | | | | | | | | | | | | | | | | | | | |
Liability/(Asset) recognised in Balance Sheet | | | 25,159 | | | | 24,749 | | | | — | | | | 487 | | | | (77 | ) |
| | | | | | | | | | | | | | | | | | | | |
Amounts recognised in Operating Statement | | | | | | | | | | | | | | | | | | | | |
Current service cost | | | 1,156 | | | | 1,087 | | | | — | | | | 19 | | | | 50 | |
Interest cost | | | 1,644 | | | | 1,393 | | | | 177 | | | | 24 | | | | 50 | |
Expected return on plan assets | | | (419 | ) | | | (354 | ) | | | — | | | | — | | | | (65 | ) |
| | | | | | | | | | | | | | | | | | | | |
Total amounts recognised in Operating Statement | | | 2,381 | | | | 2,126 | | | | 177 | | | | 43 | | | | 35 | |
| | | | | | | | | | | | | | | | | | | | |
| | | | | |
Amounts recognised in Statement of Changes in Net Assets (Equity) | | | | | | | | | | | | | | | | | | | | |
Opening cumulative amount of actuarial (gains) and losses | | | 2,701 | | | | 2,419 | | | | 89 | | | | (78 | ) | | | 271 | |
Net actuarial (gain)/loss recognised in year | | | (772 | ) | | | (654 | ) | | | — | | | | 10 | | | | (128 | ) |
| | | | | | | | | | | | | | | | | | | | |
Cumulative actuarial (gains)/losses recognised in the Statement of Changes in Net Assets (Equity) | | | 1,929 | | | | 1,765 | | | | 89 | | | | (68 | ) | | | 143 | |
| | | | | | | | | | | | | | | | | | | | |
| | | | | |
Plan Asset Allocations | | | | | | | | | | | | | | | | | | | | |
| | | | | |
State Public Sector Superannuation and ESF plans hold investments with the following asset allocations: | | | | | | | | | | | | | | | | | | | | |
| | | | | |
| | | | | | QSuper
DB | | | Former
DB | | | Judges | | | ESF | |
| | | | | |
Equity | | | | | | | 37 | % | | | N/A | | | | N/A | | | | 50 | % |
Debt instruments | | | | | | | 37 | % | | | N/A | | | | N/A | | | | 20 | % |
Property | | | | | | | 7 | % | | | N/A | | | | N/A | | | | 10 | % |
Other | | | | | | | 19 | % | | | N/A | | | | N/A | | | | 20 | % |
| | | | | | | | | | | | | | | | | | | | |
Total | | | | | | | 100 | % | | | N/A | | | | N/A | | | | 100 | % |
| | | | | | | | | | | | | | | | | | | | |
QSuper plan assets are those held within the QSuper Trust Fund but exclude the assets held by QTC in respect of these liabilities.
QSuper holds investments in unit trusts that hold financial instruments issued by the State. These instruments are difficult to accurately value and are immaterial in proportion to the unit trusts. In addition, these trusts own properties which are used by Government agencies. Again the exact values attributable to these tenancies are difficult to accurately determine, nor do they represent a material proportion of the fair value plan assets.
The overall expected rate of return on QSuper plan assets is based on the expected returns by asset class derived by QIC Limited, the strategic asset allocations and the expected levels of taxation applying to the QSuper scheme overall.
| | |
| 6-88 | | Audited Consolidated Financial Statements 2010–11 – Government of Queensland |
Notes to the Financial Statements
| 54. | Retirement Benefit Obligations continued |
Total State Sector
Retirement Benefit Obligations 2010-11 continued
| | | | | | | | | | | | | | | | | | | | |
| | | $M | | | $M | | | $M | | | $M | | | $M | |
| | | Total | | | QSuper DB | | | Former DB | | | Judges | | | ESF | |
| | | | | |
Actual return on plan assets | | | 885 | | | | 791 | | | | N/A | | | | N/A | | | | 94 | |
| | | | | |
Estimate of employer contributions to be paid in 2011-12 | | | 1,836 | | | | 1,836 | | | | — | | | | N/A | | | | N/A | |
Principal actuarial assumptions at 30 June 2011
| | | | | | | | | | | | | | | | |
| | | QSuper DB | | | Former DB | | | Judges | | | ESF | |
| | | | |
Gross discount rate | | | 5.30 | % | | | 6.40 | % | | | 5.30 | % | | | 5.20 | % |
Net discount rate (after allowance for investment taxation) | | | 5.20 | % | | | 6.40 | % | | | 5.30 | % | | | 4.40 | % |
Expected rates of return on plan assets (net of fees and taxes) | | | 7.00 | % | | | N/A | | | | N/A | | | | 6.00 | % |
Future inflationary salary increases | | | 4.00 | % | | | N/A | | | | 4.50 | % | | | 4.20 | % |
Expected CPI increases | | | 2.50 | % | | | N/A | | | | N/A | | | | N/A | |
Retirement Benefit Obligations 2009-10
| | | | | | | | | | | | | | | | | | | | |
| | | $M | | | $M | | | $M | | | $M | | | $M | |
| | | Total | | | QSuper DB | | | Former DB | | | Judges | | | ESF | |
Reconciliation of the Present Value of the Defined Benefit Obligation | | | | | | | | | | | | | | | | | | | | |
Opening balance at 1 July 2009 | | | 30,008 | | | | 26,093 | | | | 2,379 | | | | 425 | | | | 1,111 | |
Current service cost | | | 1,113 | | | | 1,046 | | | | — | | | | 18 | | | | 49 | |
Contributions by plan participants | | | 278 | | | | 264 | | | | — | | | | — | | | | 14 | |
Interest cost | | | 1,746 | | | | 1,375 | | | | 297 | | | | 24 | | | | 50 | |
Benefits paid (including contributions tax) | | | (1,567 | ) | | | (979 | ) | | | (516 | ) | | | (12 | ) | | | (60 | ) |
Transfers to Former DB | | | — | | | | (587 | ) | | | 587 | | | | — | | | | — | |
Actuarial (gain)/loss | | | 406 | | | | 385 | | | | — | | | | (9 | ) | | | 30 | |
| | | | | | | | | | | | | | | | | | | | |
Closing balance at 30 June 2010 | | | 31,984 | | | | 27,597 | | | | 2,747 | | | | 446 | | | | 1,194 | |
| | | | | | | | | | | | | | | | | | | | |
| | | | |
| | | $M | |
Present Value of the Obligation as at 30 June 2010 by Funding Policy | | | | |
Present value of the obligation - wholly unfunded | | | 3,193 | |
Present value of the obligation - wholly/partly funded | | | 28,791 | |
| | | | |
| | | 31,984 | |
| | | | |
| | |
| Audited Consolidated Financial Statements 2010–11 – Government of Queensland | | 6-89 |
Notes to the Financial Statements
| 54. | Retirement Benefit Obligations continued |
Total State Sector
Retirement Benefit Obligations 2009-10 continued
| | | | | | | | | | | | | | | | | | | | |
| | | | | | | | | | | | | | | | |
| | | $M | | | $M | | | $M | | | $M | | | $M | |
| | | Total | | | QSuper DB | | | Former DB | | | Judges | | | ESF | |
Reconciliation of the Fair Value of Plan Assets | | | | | | | | | | | | | | | | | | | | |
Opening balance at 1 July 2009 | | | 6,454 | | | | 5,473 | | | | — | | | | — | | | | 981 | |
Expected return on plan assets | | | 434 | | | | 376 | | | | — | | | | — | | | | 58 | |
Employer contributions | | | 1,107 | | | | 524 | | | | 516 | | | | — | | | | 67 | |
Contributions by plan participants | | | 278 | | | | 264 | | | | — | | | | — | | | | 14 | |
Benefits paid (including contributions tax) | | | (1,039 | ) | | | (979 | ) | | | | | | | — | | | | (60 | ) |
Former DB benefits paid from DB plan assets | | | (516 | ) | | | — | | | | (516 | ) | | | — | | | | — | |
Actuarial gain/(loss) | | | 484 | | | | 445 | | | | — | | | | — | | | | 39 | |
Other | | | — | | | | — | | | | — | | | | — | | | | — | |
| | | | | | | | | | | | | | | | | | | | |
Closing balance at 30 June 2010 | | | 7,202 | | | | 6,103 | | | | — | | | | — | | | | 1,099 | |
| | | | | | | | | | | | | | | | | | | | |
| | | | | |
Reconciliation of Balance Sheet Liability/(Asset) | | | | | | | | | | | | | | | | | | | | |
Present value of the obligation | | | 31,984 | | | | 27,597 | | | | 2,747 | | | | 446 | | | | 1,194 | |
Fair value of plan assets | | | (7,202 | ) | | | (6,103 | ) | | | — | | | | — | | | | (1,099 | ) |
| | | | | | | | | | | | | | | | | | | | |
Liability/(Asset) recognised in Balance Sheet | | | 24,782 | | | | 21,494 | | | | 2,747 | | | | 446 | | | | 95 | |
| | | | | | | | | | | | | | | | | | | | |
| | | | | |
Amounts recognised in Operating Statement | | | | | | | | | | | | | | | | | | | | |
Current service cost | | | 1,113 | | | | 1,046 | | | | — | | | | 18 | | | | 49 | |
Interest cost | | | 1,746 | | | | 1,375 | | | | 297 | | | | 24 | | | | 50 | |
Expected return on plan assets | | | (434 | ) | | | (376 | ) | | | — | | | | — | | | | (58 | ) |
Other | | | — | | | | — | | | | — | | | | — | | | | — | |
| | | | | | | | | | | | | | | | | | | | |
Total amounts recognised in Operating Statement | | | 2,425 | | | | 2,045 | | | | 297 | | | | 42 | | | | 41 | |
| | | | | | | | | | | | | | | | | | | | |
| | | | | | | | | | | | | | | | | | | | |
| | | $M | | | $M | | | $M | | | $M | | | $M | |
| | | Total | | | QSuper DB | | | Former DB | | | Judges | | | ESF | |
Amounts recognised in Statement of Changes in Net Assets (Equity) | | | | | | | | | | | | | | | | | | | | |
Opening cumulative amount of actuarial (gains) and losses | | | 2,767 | | | | 2,479 | | | | 89 | | | | (69 | ) | | | 268 | |
Net actuarial (gain)/loss recognised in year | | | (66 | ) | | | (60 | ) | | | — | | | | (9 | ) | | | 3 | |
| | | | | | | | | | | | | | | | | | | | |
Cumulative actuarial (gains)/losses recognised in the Statement of Changes in Net Assets (Equity) | | | 2,701 | | | | 2,419 | | | | 89 | | | | (78 | ) | | | 271 | |
| | | | | | | | | | | | | | | | | | | | |
Plan Asset Allocations
State Public Sector Superannuation and ESI Super plans hold investments with the following asset allocations:
| | | | | | | | | | | | | | | | |
| | | QSuper DB | | | Former DB | | | Judges | | | ESF | |
Equity | | | 36 | % | | | N/A | | | | N/A | | | | 50 | % |
Debt Instruments | | | 36 | % | | | N/A | | | | N/A | | | | 20 | % |
Property | | | 12 | % | | | N/A | | | | N/A | | | | 10 | % |
Other | | | 16 | % | | | N/A | | | | N/A | | | | 20 | % |
| | | | | | | | | | | | | | | | |
Total | | | 100 | % | | | N/A | | | | N/A | | | | 100 | % |
| | | | | | | | | | | | | | | | |
| | |
| 6-90 | | Audited Consolidated Financial Statements 2010–11 – Government of Queensland |
Notes to the Financial Statements
| 54. | Retirement Benefit Obligations continued |
Total State Sector
Retirement Benefit Obligations 2010-11 continued
QSuper plan assets are those held within the QSuper Trust Fund but exclude the assets held by Queensland Treasury Corporation in respect of these liabilities.
QSuper holds investments in unit trusts that hold financial instruments issued by the State. These instruments are difficult to accurately value and are immaterial in proportion to the unit trusts. In addition, these trusts own properties which are used by Government agencies. Again the exact values attributable to these tenancies are difficult to accurately determine, nor do they represent a material proportion of the fair value plan assets.
The overall expected rate of return on QSuper plan assets is based on the expected returns by asset class derived by the QIC Limited, the strategic asset allocations and the expected levels of taxation applying to the QSuper scheme overall.
| | | | | | | | | | | | | | | | | | | | |
| | | $M | | | $M | | | $M | | | $M | | | $M | |
| | | Total | | | QSuper DB | | | Former DB | | | Judges | | | ESF | |
| | | | | |
Actual return on plan assets | | | 810 | | | | 715 | | | | N/A | | | | N/A | | | | 95 | |
Principal actuarial assumptions at 30 June 2010
| | | | | | | | | | | | | | | | |
| | | QSuper DB | | | Former DB | | | Judges | | | ESF | |
| | | | |
Gross Discount rate | | | 5.30 | % | | | 11.91 | % | | | 5.30 | % | | | 5.10 | % |
Net Discount rate (after allowance for investment taxation) | | | 5.10 | % | | | 11.91 | % | | | 5.30 | % | | | 4.30 | % |
Expected rates of return on plan assets (net of fees and taxes) | | | 7.00 | % | | | N/A | | | | N/A | | | | 6.00 | % |
Future inflationary salary increases | | | 3.80 | % | | | N/A | | | | 4.80 | % | | | 4.50 | % |
Expected CPI increases | | | 2.30 | % | | | N/A | | | | N/A | | | | N/A | |
| | | | | | | | | | | | | | | | | | | | | | |
| | | | | 2011 | | | 2010 | | | 2009 | | | 2008 | | | 2007 | |
| | | | | $M | | | $M | | | $M | | | $M | | | $M | |
| | | | | | |
Experience adjustments | | QSuper DB | | | (216 | ) | | | 537 | | | | (524 | ) | | | (14 | ) | | | 428 | |
relating to liabilities | | Former DB | | | — | | | | — | | | | — | | | | — | | | | — | |
| | Judges | | | 6 | | | | (9 | ) | | | (15 | ) | | | (13 | ) | | | (10 | ) |
| | ESF (formerly ESI Super) | | | 27 | | | | (9 | ) | | | (18 | ) | | | (40 | ) | | | 25 | |
| | | | | | |
Experience adjustments | | QSuper DB | | | 698 | | | | 445 | | | | (1,432 | ) | | | (447 | ) | | | 457 | |
relating to assets | | Former DB | | | — | | | | — | | | | — | | | | — | | | | — | |
| | Judges | | | — | | | | — | | | | — | | | | — | | | | — | |
| | ESF (formerly ESI Super) | | | 27 | | | | 45 | | | | (131 | ) | | | (201 | ) | | | 79 | |
| | | | | | |
Present value of defined | | QSuper DB | | | 28,915 | | | | 27,596 | | | | 26,091 | | | | 25,509 | | | | 23,491 | |
benefit obligation | | Former DB | | | — | | | | 2,747 | | | | 2,380 | | | | 2,696 | | | | 3,111 | |
| | Judges | | | 487 | | | | 446 | | | | 425 | | | | 451 | | | | 409 | |
| | ESF (formerly ESI Super) | | | 1,155 | | | | 1,194 | | | | 1,111 | | | | 980 | | | | 916 | |
| | |
| Audited Consolidated Financial Statements 2010–11 – Government of Queensland | | 6-91 |
Notes to the Financial Statements
| 54. | Retirement Benefit Obligations continued |
Total State Sector
Principal actuarial assumptions at 30 June 2010 continued
| | | | | | | | | | | | | | | | | | | | | | |
| | | | | 2011 | | | 2010 | | | 2009 | | | 2008 | | | 2007 | |
| | | | | $M | | | $M | | | $M | | | $M | | | $M | |
| | | | | | |
Fair value of plan assets | | QSuper DB | | | 4,166 | | | | 6,103 | | | | 5,472 | | | | 6,742 | | | | 6,834 | |
| | Former DB | | | — | | | | — | | | | — | | | | — | | | | — | |
| | Judges | | | — | | | | — | | | | — | | | | — | | | | — | |
| | ESF (formerly ESI Super) | | | 1,232 | | | | 1,099 | | | | 980 | | | | 1,034 | | | | 1,202 | |
| | | | | | |
Surplus/(deficit) | | QSuper DB | | | (24,749 | ) | | | (21,493 | ) | | | (20,619 | ) | | | (18,767 | ) | | | (16,657 | ) |
| | Former DB | | | — | | | | (2,747 | ) | | | (2,380 | ) | | | (2,696 | ) | | | (3,111 | ) |
| | Judges | | | (487 | ) | | | (446 | ) | | | (425 | ) | | | (451 | ) | | | (409 | ) |
| | ESF (formerly ESI Super) | | | (77 | ) | | | (95 | ) | | | (130 | ) | | | 54 | | | | 286 | |
Employee Numbers
The number of full time equivalent employees in the GGS at 30 June 2010 relating to the GGS entities listed in Note 55 totalled 210,787 (2010, 203,092).
The number of Total State full time equivalent employees at 30 June 2010 relating to the consolidated entities listed in Note 55 totalled 232,933 (2010, 234,413).
Public sector entities are generally considered material for the purposes of this report if they meet either of the following criteria:
| | • | | net operating result in excess of $4 million (2010, $2 million); or |
| | • | | net assets in excess of $50 million (2010, $25 million). |
However, in addition to material entities, the State consolidates some entities which are not material in terms of the operating position or net asset position criteria if they are either a department or if they are funded for the delivery of services.
When financial results are available in respect of non-material entities, they are reviewed with the aim of including any newly material entities in the following year’s consolidated financial statements.
Newly created entities that are expected to meet the materiality criteria on the basis of their initial budget estimates are included in the consolidated financial statements from the time of their establishment.
The following controlled entities of the Government have been included in the consolidated financial statements for the year ended 30 June 2011. The list has been classified by activity sectors as outlined in Note 1(c).
Entities denoted with an asterisk are consolidated with the accounts of the preceding entity.
The GGS has 100% ownership and voting power in other Queensland public sector entities, classified as either Public Non-financial Corporations or Public Financial Corporations below.
General Government
Departments of Government
Department of Communities
Department of Community Safety
| | • | | Central and Northern Queensland Regional Parole Board |
| | • | | Queensland Parole Board |
| | • | | Southern Queensland Regional Parole Board |
| | |
| 6-92 | | Audited Consolidated Financial Statements 2010–11 – Government of Queensland |
Notes to the Financial Statements
| 55. | Controlled Entities continued |
General Government continued
Departments of Government continued
Department of Education and Training
Department of Employment, Economic Development and Innovation
| | • | | Property Services Group (commercialised business unit) (transferred from Department of Infrastructure and Planning on 1/3/11) |
Department of Environment and Resource Management
Department of Health
Department of Justice and Attorney-General
Department of Local Government and Planning (renamed from Department of Infrastructure and Planning on 1/3/11)
Department of Police
Department of the Premier and Cabinet
| | • | | Events Queensland Pty Ltd (formerly Queensland Events Corporation Pty Ltd) |
Department of Public Works
| | • | | CITEC (commercialised business unit) |
| | • | | CorpTech (shared service provider) |
| | • | | Goprint (commercialised business unit) |
| | • | | Project Services (commercialised business unit) |
| | • | | Qbuild (commercialised business unit) |
| | • | | Qfleet (commercialised business unit) |
| | • | | SDS (commercialised business unit) |
| | • | | Shared Service Agency (shared service provider) |
Department of Transport and Main Roads
| | • | | RoadTek (commercialised business unit) |
Treasury Department
Other General Government entities
Anti-Discrimination Commission
Australian Agricultural College Corporation
Board of the Queensland Museum
| | • | | Queensland Museum Foundation Trust |
City North Infrastructure Pty Ltd
Commission for Children and Young People and Child Guardian
Crime and Misconduct Commission
Electoral Commission of Queensland
| | |
| Audited Consolidated Financial Statements 2010–11 – Government of Queensland | | 6-93 |
Notes to the Financial Statements
| 55. | Controlled Entities continued |
Forestry Plantations Queensland Office (wound up on 30/11/10)
Gold Coast Institute of TAFE
Health Quality and Complaints Commission
Legal Aid Queensland
Legislative Assembly
Library Board of Queensland
| | • | | Queensland Library Foundation Inc |
Motor Accident Insurance Commission
Nominal Defendant
Office of the Governor
Office of the Information Commissioner
Office of the Ombudsman
Prostitution Licensing Authority
Public Service Commission
QRAA
Queensland Art Gallery Board of Trustees
| | • | | Queensland Art Gallery Foundation |
Queensland Audit Office
Queensland Building Services Authority
Queensland Future Growth Corporation
Queensland Performing Arts Trust
Queensland Reconstruction Authority (established on 21/2/11)
Queensland Studies Authority
Residential Tenancies Authority
South Bank Corporation
Southbank Institute of Technology
The Council of the Queensland Institute of Medical Research
The Public Trustee of Queensland
Tourism Queensland
TransLink Transit Authority
Urban Land Development Authority
Workers’ Compensation Regulatory Authority (QComp)
| | |
| 6-94 | | Audited Consolidated Financial Statements 2010–11 – Government of Queensland |
Notes to the Financial Statements
| 55. | Controlled Entities continued |
Public Non-financial Corporations
Brisbane Port Holdings, formerly Port of Brisbane Corporation Limited (controlled entity of Queensland Treasury Holdings Pty Ltd)
| | • | | Bundaberg Port Corporation Pty Ltd (deregistered on 15/8/10) |
| | • | | Port of Brisbane Pty Ltd (sold on 30/11/10) |
CS Energy Ltd
| | • | | Aberdare Collieries Pty Ltd |
| | • | | CS Energy Kogan Creek Pty Ltd |
| | • | | CS Energy Mica Creek Pty Ltd |
| | • | | CS Energy Oxyfuel Pty Ltd |
| | • | | CS Kogan (Australia) Pty Ltd |
| | • | | Kogan Creek Power Pty Ltd |
| | • | | Kogan Creek Power Station Pty Ltd |
| | • | | Manzillo Insurance (PCC) Ltd - Cell EnMach |
| | • | | Swanbank Energy Pty Ltd |
DBCT Holdings Pty Ltd
ENERGEX Ltd
| | • | | Beak Industries Pty Ltd (deregistered in 2010-11) |
| | • | | Metering Dynamics Business Support Pty Ltd |
| | • | | Queensland Energy Services Team Pty Ltd |
| | • | | Service Essentials Pty Ltd (deregistered in 2010-11) |
| | • | | VH Energy Holdings Pty Ltd |
Ergon Energy Corporation Limited
| | • | | Ergon Energy Queensland Pty Ltd |
| | • | | Ergon Energy Telecommunications Pty Ltd |
Far North Queensland Ports Corporation Limited
Forestry Plantations Queensland (wound up on 30/11/10)
Gladstone Area Water Board
Gladstone Ports Corporation Limited
| | |
| Audited Consolidated Financial Statements 2010–11 – Government of Queensland | | 6-95 |
Notes to the Financial Statements
| 55. | Controlled Entities continued |
Public Non-financial Corporations continued
Gold Coast Events Co Pty Ltd (controlled entity of Department of Communities)
Mount Isa Water Board
North Queensland Bulk Ports Corporation Limited
| | • | | Ports Corporation of Queensland Limited |
Port of Townsville Limited
Powerlink Queensland
| | • | | Harold Street Holdings Pty Ltd |
| | • | | Powerlink Transmission Services Pty Ltd |
QR Limited (QR National) (listed on Australian Securities on 22/11/10)
Queensland Airport Holdings (Cairns) Pty Ltd (controlled entity of Queensland Treasury Holdings Pty Ltd)
Queensland Airport Holdings (Mackay) Pty Ltd (controlled entity of Queensland Treasury Holdings Pty Ltd)
Queensland Bulk Water Supply Authority
| | • | | South East Queensland Water Corporation Limited |
Queensland Bulk Water Transport Authority
Queensland Lottery Corporation Pty Ltd (controlled entity of Queensland Treasury Holdings Pty Ltd)
Queensland Manufactured Water Authority
| | • | | South East Queensland (Gold Coast) Desalination Company Pty Ltd |
| | • | | Western Corridor Recycled Water Pty Limited |
Queensland Motorways Limited (sold on 31/5/11)
Queensland Rail Limited
| | • | | On Track Insurance Pty Ltd |
Queensland Water Infrastructure Pty Ltd (controlled entity of Department of Employment, Economic Development and Innovation from 1/3/11, previously controlled entity of Department of Infrastructure and Planning)
SEQ Water Grid Manager
Southern Regional Water Pipeline Company Pty Ltd (controlled entity of Department of Employment, Economic Development and Innovation from 1/3/11, previously controlled entity of Department of Infrastructure and Planning)
Stadiums Queensland
Stanwell Corporation Limited
| | • | | EDWF Holdings 1 Pty Ltd (sold on 30/6/11) |
| | • | | Energy Portfolio 1 Pty Ltd |
| | • | | Wind Portfolio Pty Ltd (sold on 30/6/11) |
SunWater Limited
| | • | | Eungella Water Pipeline Pty Ltd |
| | • | | North West Queensland Water Pipeline Pty Ltd |
| | |
| 6-96 | | Audited Consolidated Financial Statements 2010–11 – Government of Queensland |
Notes to the Financial Statements
| 55. | Controlled Entities continued |
Public Non-financial Corporations continued
Tarong Energy Corporation Limited
| | • | | Glen Wilga Coal Pty Ltd |
The Trustees of Parklands Gold Coast
ZeroGen Pty Ltd (controlled entity of Department of Employment, Economic Development and Innovation)
Public Financial Corporations
QIC Limited
| | • | | Canberra Centre Investments Pty Ltd |
| | • | | Eastland Property Holdings Pty Ltd |
| | • | | Innovis Investments Pty Ltd |
| | • | | Pacific Echo Pty Limited |
| | • | | QIC Asia Real Estate Investments Pty Ltd |
| | • | | QIC Developments Pty Ltd |
| | • | | QIC Infrastructure Management Pty Ltd |
| | • | | QIC Infrastructure Management No. 2 Pty Ltd |
| | • | | QIC Infrastructure Management No. 3 Pty Ltd |
| | • | | QIC Infrastructure Management No. 4 Pty Ltd |
| | • | | QIC International Real Estate Investments Pty Ltd |
| | • | | QIC Investments No.1 Pty Ltd |
| | • | | QIC Investments No.2 Pty Ltd |
| | • | | QIC Logan Hyperdome Pty Ltd |
| | • | | QIC North America Investments Pty Ltd |
| | • | | QIC North Asia Real Estate Investment Pty Ltd |
| | • | | QIC Private Capital Pty Ltd |
| | • | | QIC Property Investments (Jersey) No. 1 Limited |
| | |
| Audited Consolidated Financial Statements 2010–11 – Government of Queensland | | 6-97 |
Notes to the Financial Statements
| 55. | Controlled Entities continued |
Public Non-financial Corporations continued
| | • | | QIC Property Investments (Jersey) No. 2 Limited |
| | • | | QIC Property Management Pty Ltd |
| | • | | QIC Real Estate Funds Pty Ltd |
| | • | | QIC Real Estate Pty Ltd |
| | • | | QIC Retail (No 2) Pty Ltd |
| | • | | QIC Strategy No. 1 Pty Ltd |
| | • | | QIC Strategy No. 1A Pty Ltd |
| | • | | QIC Strategy No. 2 Pty Ltd |
| | • | | QIC Strategy No. 2A Pty Ltd |
| | • | | QIC (UK) Management Limited |
| | • | | QPC Investments No. 1 Pty Ltd |
| | • | | Queensland BioCapital Funds Pty Ltd |
Queensland Treasury Corporation
Queensland Treasury Holdings Pty Ltd (controlled entity of Treasury Department)
| | • | | Network Infrastructure Company Pty Ltd |
WorkCover Queensland
| | |
| 6-98 | | Audited Consolidated Financial Statements 2010–11 – Government of Queensland |
Notes to the Financial Statements
| 56. | Reconciliation to GFS * |
Reconciliation to GFS Net Operating Balance
| | | | | | | | | | | | | | | | | | | | | | | | |
| | | | | | | | | | | | | | | | | | Total
State | |
| | | Notes | | | GGS | | | PNFC | | | PFC | | | Elims | | | Sector | |
| | | | | | $M | | | $M | | | $M | | | $M | | | $M | |
2011 | | | | | | | | | | | | | | | | | | | | | | | | |
Net result from transactions - | | | | | | | | | | | | | | | | | | | | | | | | |
Net operating balance (as per Operating Statement) | | | | | | | (1,516 | ) | | | 378 | | | | (1,787 | ) | | | (850 | ) | | | (3,775 | ) |
| | | | | | |
Convergence differences | | | | | | | | | | | | | | | | | | | | | | | | |
Other operating expenses - onerous contract | | | a | | | | — | | | | — | | | | — | | | | — | | | | — | |
Other property expenses - income transferred by Public Enterprises as dividends | | | b | | | | — | | | | (830 | ) | | | (20 | ) | | | 850 | | | | — | |
| | | | | | | | | | | | | | | | | | | | | | | | |
Total convergence differences | | | | | | | — | | | | (830 | ) | | | (20 | ) | | | 850 | | | | — | |
| | | | | | | | | | | | | | | | | | | | | | | | |
| | | | | | |
GFS Net Operating Balance | | | | | | | (1,516 | ) | | | (452 | ) | | | (1,807 | ) | | | — | | | | (3,775 | ) |
| | | | | | | | | | | | | | | | | | | | | | | | |
| | | | | | |
2010 | | | | | | | | | | | | | | | | | | | | | | | | |
Net result from transactions - | | | | | | | | | | | | | | | | | | | | | | | | |
Net operating balance (as per Operating Statement) | | | | | | | 128 | | | | 435 | | | | (1,956 | ) | | | (664 | ) | | | (2,058 | ) |
| | | | | | |
Convergence differences | | | | | | | | | | | | | | | | | | | | | | | | |
Other operating expenses - onerous contract | | | a | | | | — | | | | — | | | | — | | | | — | | | | — | |
Other property expenses - income transferred by Public Enterprises as dividends | | | b | | | | — | | | | (651 | ) | | | (13 | ) | | | 664 | | | | — | |
| | | | | | | | | | | | | | | | | | | | | | | | |
Total convergence differences | | | | | | | — | | | | (651 | ) | | | (13 | ) | | | 664 | | | | — | |
| | | | | | | | | | | | | | | | | | | | | | | | |
| | | | | | |
GFS Net Operating Balance | | | | | | | 128 | | | | (216 | ) | | | (1,969 | ) | | | — | | | | (2,058 | ) |
| | | | | | | | | | | | | | | | | | | | | | | | |
Notes:
The convergence differences comprise:
| | a. | The Operating Statement treats onerous contract expenses as other economic flows included in the operating result. GFS only recognises expenses from transactions when payments are made from the provision. |
This difference flows through to the Total State Sector.
| | b. | GFS treats dividends to owners as an expense, whereas in the Operating Statement, they are treated as a distribution to owners and therefore a direct debit to equity. |
The differences do not flow through to the Total State Sector as they arise from intersector transactions.
An elimination difference arises in respect of social benefits of $67 million (2010, $63 million) in the GGS and $54 million (2010, $48 million) in the Total State Sector. In accordance with the ABS GFS Manual, certain transactions within and between the GGS and the PNFC sector are not eliminated on consolidation of the GGS or Total State Sector, whereas under AASB 127, intragroup transactions are eliminated in full. These benefits are grossed up for GFS reporting in Sales of goods and services and Other operating expenses and there is no net effect on the Net operating balance.
| | |
| Audited Consolidated Financial Statements 2010–11 – Government of Queensland | | 6-99 |
Notes to the Financial Statements
| 56. | Reconciliation to GFS * continued |
Reconciliation to GFS Net Lending/(Borrowing)
| | | | | | | | | | | | | | | | | | | | | | | | |
| | | | | | | | | | | | | | | | | | Total
State | |
| | | Notes | | | GGS | | | PNFC | | | PFC | | | Elims | | | Sector | |
| | | | | | $M | | | $M | | | $M | | | $M | | | $M | |
2011 | | | | | | | | | | | | | | | | | | | | | | | | |
Net Lending/(Borrowing) (as per Operating Statement) | | | | | | | (7,089 | ) | | | (2,183 | ) | | | (1,829 | ) | | | (852 | ) | | | (11,952 | ) |
| | | | | | |
Convergence differences | | | | | | | | | | | | | | | | | | | | | | | | |
Relating to net operating balance | | | | | | | — | | | | (830 | ) | | | (20 | ) | | | 850 | | | | — | |
Purchases of non-financial assets | | | a | | | | (223 | ) | | | — | | | | — | | | | — | | | | (223 | ) |
Sales of non-financial assets | | | a | | | | 119 | | | | — | | | | — | | | | — | | | | 119 | |
Change in net inventories | | | a, b | | | | 74 | | | | (5 | ) | | | — | | | | — | | | | 69 | |
| | | | | | | | | | | | | | | | | | | | | | | | |
| | | | | | |
GFS Net Lending/(Borrowing) | | | | | | | (7,120 | ) | | | (3,018 | ) | | | (1,849 | ) | | | (2 | ) | | | (11,988 | ) |
| | | | | | | | | | | | | | | | | | | | | | | | |
| | | | | | |
2010 | | | | | | | | | | | | | | | | | | | | | | | | |
Net Lending/(Borrowing) (as per Operating Statement) | | | | | | | (6,537 | ) | | | (2,695 | ) | | | (2,018 | ) | | | (659 | ) | | | (11,909 | ) |
| | | | | | |
Convergence differences | | | | | | | | | | | | | | | | | | | | | | | | |
Relating to net operating balance | | | | | | | — | | | | (651 | ) | | | (13 | ) | | | 664 | | | | — | |
Purchases of non-financial assets | | | a | | | | (193 | ) | | | — | | | | — | | | | — | | | | (193 | ) |
Sales of non-financial assets | | | a | | | | 99 | | | | 12 | | | | — | | | | — | | | | 111 | |
Change in net inventories | | | a, b | | | | 65 | | | | (67 | ) | | | — | | | | — | �� | | | (1 | ) |
| | | | | | | | | | | | | | | | | | | | | | | | |
| | | | | | |
GFS Net Lending/(Borrowing) | | | | | | | (6,565 | ) | | | (3,401 | ) | | | (2,031 | ) | | | 5 | | | | (11,992 | ) |
| | | | | | | | | | | | | | | | | | | | | | | | |
Notes:
The convergence differences comprise:
| | a. | GFS treats purchases and sales of land inventories and assets held for rental and subsequently held for sale as purchases and sales of non-financial assets. These are reflected in changes in net inventories for AASB1049. |
| | b. | For AASB 1049, change in net inventories includes total changes in the balance of land inventories and assets held for rental and subsequently held for sale. |
Reconciliation to GFS Total Change in Net Worth
| | | | | | | | | | | | | | | | | | | | | | |
2011 | | | | | | | | | | | | | | | | | | | | | | |
Comprehensive result - total change in net worth before transactions with owners as owners (as per Operating Statement) | | | | | (4,365 | ) | | | (36 | ) | | | 1,686 | | | | (1,650 | ) | | | (4,365 | ) |
| | | | | | |
Convergence differences | | | | | | | | | | | | | | | | | | | | | | |
Income transferred from Public Enterprises as dividends | | a | | | — | | | | (830 | ) | | | (20 | ) | | | 850 | | | | — | |
Relating to other economic flows | | | | | | | | | | | | | | | | | | | | | | |
Impairment of Receivables | | b | | | 19 | | | | (9 | ) | | | 1 | | | | — | | | | 11 | |
Net gain on investments in other entities | | c | | | (791 | ) | | | — | | | | — | | | | 791 | | | | — | |
Deferred income tax equivalents | | d | | | 958 | | | | (1,122 | ) | | | 165 | | | | — | | | | — | |
Net restoration costs | | e | | | 1 | | | | 57 | | | | (1 | ) | | | — | | | | 58 | |
Onerous contracts | | f | | | — | | | | 116 | | | | 2 | | | | — | | | | 117 | |
Remeasurement of shares and other contributed capital | | g | | | — | | | | 1,824 | | | | (1,832 | ) | | | 8 | | | | — | |
| | | | | | | | | | | | | | | | | | | | | | |
Total convergence differences | | | | | 187 | | | | 36 | | | | (1,686 | ) | | | 1,650 | | | | 187 | |
| | | | | | | | | | | | | | | | | | | | | | |
| | | | | | |
GFS Total Change in Net Worth | | | | | (4,179 | ) | | | — | | | | — | | | | — | | | | (4,179 | ) |
| | | | | | | | | | | | | | | | | | | | | | |
| | |
| 6-100 | | Audited Consolidated Financial Statements 2010–11 – Government of Queensland |
Notes to the Financial Statements
| 56. | Reconciliation to GFS * continued |
| | Reconciliation to GFS Total Change in Net Worth continued |
| | | | | | | | | | | | | | | | | | | | | | | | |
| | | Notes | | | GGS | | | PNFC | | | PFC | | | Elims | | | Total State
Sector | |
| | | | | | $M | | | $M | | | $M | | | $M | | | $M | |
2010 | | | | | | | | | | | | | | | | | | | | | | | | |
Comprehensive result - total change in net worth before transactions with owners as owners (as per Operating Statement) | | | | | | | (8,689 | ) | | | (3,720 | ) | | | 565 | | | | 3,155 | | | | (8,689 | ) |
| | | | | | |
Convergence differences | | | | | | | | | | | | | | | | | | | | | | | | |
Income transferred from Public Enterprises as dividends | | | a | | | | — | | | | (651 | ) | | | (13 | ) | | | 664 | | | | — | |
Relating to other economic flows | | | | | | | | | | | | | | | | | | | | | | | | |
Impairment of receivables | | | b | | | | 73 | | | | — | | | | 1 | | | | — | | | | 74 | |
Net gain on investments in other entities | | | c | | | | 204 | | | | — | | | | — | | | | (204 | ) | | | — | |
Deferred income tax equivalents | | | d | | | | (152 | ) | | | 273 | | | | (121 | ) | | | — | | | | — | |
Net restoration costs | | | e | | | | (5 | ) | | | (1 | ) | | | — | | | | — | | | | (6 | ) |
Onerous contracts | | | f | | | | — | | | | 52 | | | | — | | | | — | | | | 52 | |
Other | | | | | | | | | | | | | | | | | | | | | | | | |
Remeasurement of shares and other contributed capital | | | g | | | | — | | | | 4,047 | | | | (432 | ) | | | (3,615 | ) | | | — | |
| | | | | | | | | | | | | | | | | | | | | | | | |
Total convergence differences | | | | | | | 119 | | | | 3,720 | | | | (565 | ) | | | (3,155 | ) | | | 120 | |
| | | | | | | | | | | | | | | | | | | | | | | | |
| | | | | | |
GFS Total Change in Net Worth | | | | | | | (8,569 | ) | | | — | | | | — | | | | — | | | | (8,569 | ) |
| | | | | | | | | | | | | | | | | | | | | | | | |
Notes:
The convergence differences comprise:
| | a. | GFS treats dividends to owners as an expense, whereas in the Operating Statement, they are treated as a distribution to owners and therefore a direct debit to equity. The differences do not flow through to the Total State Sector as they arise from intersector transactions. |
| | b. | GFS does not recognise impairment of receivables, whereas the Operating Statement recognises impairment of receivables and classifies them as other economic flows. The total difference of $11 million (2010, $74 million) flows through to the Total State Sector. |
| | c. | The measurement of equity investments in other public sector entities differs for GFS in that for example, allowance for impairment of receivables, onerous contract provisions and deferred income tax balances are not recognised in net worth under GFS. |
| | d. | GFS does not recognise deferred income tax equivalents at all, whereas the Operating Statement recognises the deferred income tax equivalents and classifies them as other economic flows. The differences do not flow through to the Total State Sector as they arise from intersector transactions. |
| | e. | GFS does not recognise restoration costs, whereas restoration costs have been recognised in the Operating Statement. This difference flows through to the Total State Sector. |
| | f. | The Operating Statement treats onerous contract expenses as other economic flows included in the operating result. GFS only recognises expenses from transactions when payments are made from the provision. This difference flows through to the Total State Sector. |
| | g. | GFS measures net worth as assets less liabilities less shares/contributed equity (remeasured). Shares/contributed equity are not deducted under Australian Accounting Standards. |
| | |
| Audited Consolidated Financial Statements 2010–11 – Government of Queensland | | 6-101 |
Notes to the Financial Statements
| 56. | Reconciliation to GFS * continued |
Reconciliation to GFS Net Worth
| | | | | | | | | | | | | | | | | | | | | | | | |
| | | Notes | | | GGS | | | PNFC | | | PFC | | | Elims | | | Total State
Sector | |
| | | | | | $M | | | $M | | | $M | | | $M | | | $M | |
2011 | | | | | | | | | | | | | | | | | | | | | | | | |
Net Worth (as per Balance Sheet) | | | | | | | 171,222 | | | | 19,679 | | | | (1,413 | ) | | | (18,267 | ) | | | 171,222 | |
| | | | | | |
Convergence differences | | | | | | | | | | | | | | | | | | | | | | | | |
Financial assets | | | | | | | | | | | | | | | | | | | | | | | | |
Accounts receivable | | | a | | | | 451 | | | | 17 | | | | 3 | | | | — | | | | 471 | |
Investment in other entities | | | b | | | | 4,160 | | | | — | | | | — | | | | (4,160 | ) | | | — | |
Non-financial assets | | | | | | | | | | | | | | | | | | | | | | | | |
Restoration assets | | | c | | | | (5 | ) | | | (45 | ) | | | — | | | | — | | | | (50 | ) |
Deferred tax assets | | | d | | | | (5,504 | ) | | | (1,190 | ) | | | (598 | ) | | | 7,291 | | | | — | |
Liabilities | | | | | | | | | | | | | | | | | | | | | | | | |
Deferred tax liabilities | | | e | | | | 1,787 | | | | 5,287 | | | | 217 | | | | (7,291 | ) | | | — | |
Restoration provision | | | f | | | | 2 | | | | 199 | | | | — | | | | — | | | | 201 | |
Provision onerous contracts | | | g | | | | — | | | | 268 | | | | 2 | | | | — | | | | 269 | |
Shares and other contributed equity | | | h | | | | — | | | | (24,215 | ) | | | 1,789 | | | | 22,426 | | | | — | |
| | | | | | | | | | | | | | | | | | | | | | | | |
Total convergence differences | | | | | | | 892 | | | | (19,679 | ) | | | 1,413 | | | | 18,267 | | | | 892 | |
| | | | | | | | | | | | | | | | | | | | | | | | |
GFS Net Worth | | | | | | | 172,114 | | | | — | | | | — | | | | — | | | | 172,114 | |
| | | | | | | | | | | | | | | | | | | | | | | | |
| | | | | | |
2010 | | | | | | | | | | | | | | | | | | | | | | | | |
Net Worth (as per Balance Sheet) | | | | | | | 175,588 | | | | 22,770 | | | | (3,026 | ) | | | (19,744 | ) | | | 175,588 | |
| | | | | | |
Convergence differences | | | | | | | | | | | | | | | | | | | | | | | | |
Financial assets | | | | | | | | | | | | | | | | | | | | | | | | |
Accounts receivable | | | a | | | | 433 | | | | 25 | | | | 2 | | | | — | | | | 460 | |
Investment in other entities | | | b | | | | 4,950 | | | | — | | | | — | | | | (4,950 | ) | | | — | |
Non-financial assets | | | | | | | | | | | | | | | | | | | | | | | | |
Restoration assets | | | c | | | | (5 | ) | | | (82 | ) | | | — | | | | — | | | | (87 | ) |
Deferred tax assets | | | d | | | | (6,495 | ) | | | (1,267 | ) | | | (555 | ) | | | 8,317 | | | | — | |
Liabilities | | | | | | | | | | | | | | | | | | | | | | | | |
Deferred tax liabilities | | | e | | | | 1,822 | | | | 6,486 | | | | 9 | | | | (8,317 | ) | | | — | |
Restoration provision | | | f | | | | 1 | | | | 179 | | | | 1 | | | | — | | | | 181 | |
Provision onerous contracts | | | g | | | | — | | | | 152 | | | | — | | | | — | | | | 152 | |
Shares and other contributed equity | | | h | | | | — | | | | (28,264 | ) | | | 3,569 | | | | 24,695 | | | | — | |
| | | | | | | | | | | | | | | | | | | | | | | | |
Total convergence differences | | | | | | | 705 | | | | (22,770 | ) | | | 3,026 | | | | 19,745 | | | | 706 | |
| | | | | | | | | | | | | | | | | | | | | | | | |
GFS Net Worth | | | | | | | 176,293 | | | | — | | | | — | | | | — | | | | 176,293 | |
| | | | | | | | | | | | | | | | | | | | | | | | |
Notes:
The convergence differences comprise:
| | a. | GFS does not recognise impairment of receivables, whereas an allowance for impairment of receivables is recognised in the Balance Sheet. This total difference of $471 million (2010, $460 million) flows through to the Total State Sector. |
| | b. | The measurement of equity investments in other public sector entities differs for GFS in that for example, allowance for impairment of receivables, net restoration provisions, onerous contract provisions and deferred income tax balances are not recognised in net worth under GFS. |
| | c. | GFS does not recognise restoration assets, whereas restoration assets have been recognised in the Balance Sheet. This difference flows through to the Total State Sector. |
| | d. | GFS does not recognise deferred tax assets, whereas deferred tax assets are classified as non-financial assets in the Balance Sheet. The difference does not flow through to the Total State Sector as it arises from intersector transactions. |
| | e. | GFS does not recognise deferred tax liabilities at all, whereas deferred tax liabilities are classified as non-financial liabilities in the Balance Sheet. The difference does not flow through to the Total State Sector as it arises from intersector transactions. |
| | f. | GFS does not recognise restoration provisions, whereas restoration provisions have been recognised in the Balance Sheet. This difference flows through to the Total State Sector. |
| | g. | GFS does not recognise provision for onerous contracts, whereas a provision for onerous contracts is recognised in the Balance Sheet. This difference flows through to the Total State Sector. |
| | h. | GFS measures net worth as assets less liabilities less shares/contributed equity. Shares/contributed equity are not deducted under Australian Accounting Standards. |
| | |
| 6-102 | | Audited Consolidated Financial Statements 2010–11 – Government of Queensland |
Notes to the Financial Statements
| 56. | Reconciliation to GFS * continued |
Reconciliation to GFS Cash Surplus/(Deficit)
| | | | | | | | | | | | | | | | | | | | | | |
| | | | | | | | | | | | | | | | | Total State | |
| | | Notes | | GGS | | | PNFC | | | PFC | | | Elims | | | Sector | |
| | | | | $M | | | $M | | | $M | | | $M | | | $M | |
2011 | | | | | | | | | | | | | | | | | | | | | | |
Cash surplus/(deficit) | | | | | (5,880 | ) | | | (3,257 | ) | | | (1,784 | ) | | | 160 | | | | (10,759 | ) |
| | | | | | |
Convergence differences | | | | | | | | | | | | | | | | | | | | | | |
Acquisitions under finances leases and similar arrangements | | a | | | (76 | ) | | | (4 | ) | | | — | | | | — | | | | (80 | ) |
| | | | | | | | | | | | | | | | | | | | | | |
| | | | | | |
GFS Cash Surplus/(Deficit) | | | | | (5,956 | ) | | | (3,261 | ) | | | (1,784 | ) | | | 160 | | | | (10,839 | ) |
| | | | | | | | | | | | | | | | | | | | | | |
| | | | | | |
2010 | | | | | | | | | | | | | | | | | | | | | | |
Cash surplus/(deficit) | | | | | (5,341 | ) | | | (3,319 | ) | | | (1,718 | ) | | | (2 | ) | | | (10,380 | ) |
| | | | | | |
Convergence differences | | | | | | | | | | | | | | | | | | | | | | |
Acquisitions under finances leases and similar arrangements | | a | | | (61 | ) | | | (1 | ) | | | — | | | | — | | | | (61 | ) |
| | | | | | | | | | | | | | | | | | | | | | |
| | | | | | |
GFS Cash Surplus/(Deficit) | | | | | (5,402 | ) | | | (3,320 | ) | | | (1,718 | ) | | | (2 | ) | | | (10,441 | ) |
| | | | | | | | | | | | | | | | | | | | | | |
Notes:
| a. | The convergence differences arise because GFS recognises a notional cash outflow relating to new finance leases and similar arrangements in calculating cash surplus/(deficit), whereas the Cash Flow Statement does not recognise notional cash flows. This total difference flows through to the Total State Sector. |
| * | Determined in accordance with the ABS GFS Manual. |
| | | | | | | | | | | | | | | | |
| | | General Government | | | | | | | |
| | | Sector | | | Total State Sector | |
| | | 2011 | | | 2010 | | | 2011 | | | 2010 | |
| | | $M | | | $M | | | $M | | | $M | |
| | | | |
| 57. Expenses from Transactions by Function | | | | | | | | | | | | | | | | |
| | | | |
General public services | | | 1,648 | | | | 1,883 | | | | 1,794 | | | | 1,721 | |
Public order and safety | | | 3,643 | | | | 3,413 | | | | 3,602 | | | | 3,381 | |
Education | | | 9,801 | | | | 9,371 | | | | 9,757 | | | | 9,338 | |
Health | | | 11,201 | | | | 10,267 | | | | 11,111 | | | | 10,191 | |
Social security and welfare | | | 2,673 | | | | 2,399 | | | | 2,612 | | | | 2,344 | |
Housing and community amenities | | | 1,661 | | | | 1,383 | | | | 2,070 | | | | 1,752 | |
Recreation and culture | | | 1,161 | | | | 910 | | | | 1,196 | | | | 941 | |
Fuel and energy | | | 466 | | | | 375 | | | | 3,597 | | | | 3,444 | |
Agriculture, forestry, fishing and hunting | | | 826 | | | | 970 | | | | 917 | | | | 1,089 | |
Mining, manufacturing and construction | | | 259 | | | | 248 | | | | 247 | | | | 248 | |
Transport and communications | | | 5,331 | | | | 4,376 | | | | 7,227 | | | | 7,518 | |
Other economic affairs | | | 877 | | | | 955 | | | | 876 | | | | 954 | |
Other purposes | | | 3,926 | | | | 3,047 | | | | 8,311 | | | | 7,531 | |
| | | | | | | | | | | | | | | | |
| | | 43,473 | | | | 39,599 | | | | 53,317 | | | | 50,451 | |
| | | | | | | | | | | | | | | | |
| | | | |
Continuing Operations | | | 43,473 | | | | 39,599 | | | | 52,024 | | | | 47,182 | |
Discontinuing Operations | | | — | | | | — | | | | 1,293 | | | | 3,269 | |
| | | | | | | | | | | | | | | | |
| | | 43,473 | | | | 39,599 | | | | 53,317 | | | | 50,451 | |
| | | | | | | | | | | | | | | | |
| | |
| Audited Consolidated Financial Statements 2010–11 – Government of Queensland | | 6-103 |
Notes to the Financial Statements
| | | | | | | | | | | | | | | | |
| | | General Government Sector | | | Total State Sector | |
| | | 2011 $M | | | 2010 $M | | | 2011 $M | | | 2010 $M | |
| | | | |
58. Sector Assets by Function | | | | | | | | | | | | | | | | |
| | | | |
General public services | | | 3,603 | | | | 4,882 | | | | 2,289 | | | | 4,701 | |
Public order and safety | | | 7,024 | | | | 6,552 | | | | 6,963 | | | | 6,542 | |
Education | | | 18,833 | | | | 17,957 | | | | 18,843 | | | | 17,977 | |
Health | | | 8,665 | | | | 7,527 | | | | 8,644 | | | | 7,506 | |
Social security and welfare | | | 767 | | | | 857 | | | | 760 | | | | 852 | |
Housing and community amenities | | | 18,407 | | | | 17,596 | | | | 23,614 | | | | 23,005 | |
Recreation and culture | | | 5,664 | | | | 5,771 | | | | 6,641 | | | | 6,630 | |
Fuel and energy | | | 6,563 | | | | 6,510 | | | | 30,649 | | | | 29,823 | |
Agriculture, forestry, fishing and hunting | | | 68,567 | | | | 66,709 | | | | 69,315 | | | | 67,562 | |
Mining, manufacturing and construction | | | 1,526 | | | | 1,266 | | | | 1,517 | | | | 1,258 | |
Transport and communications | | | 49,373 | | | | 52,133 | | | | 63,903 | | | | 75,718 | |
Other economic affairs | | | 586 | | | | 724 | | | | 493 | | | | 641 | |
Other purposes1 | | | 44,734 | | | | 39,589 | | | | 58,818 | | | | 47,977 | |
| | | | | | | | | | | | | | | | |
| | | 234,313 | | | | 228,072 | | | | 292,449 | | | | 290,192 | |
| | | | | | | | | | | | | | | | |
| 1 | Includes Crown land subject to lease for a range of purposes and investments held in trust. |
| 59. | Discontinued Operations |
On 2 June 2009, the Queensland Government announced its intention to undertake a significant asset sale program. At the end of 2010-11 this program had been completed with the finalisation of the Forestry Plantations Queensland 99 year licence sale, the QR Limited Initial Public Offering (IPO), the lease of the Ports of Brisbane and Abbot Point Coal Terminal to the private sector and the transfer of Queensland Motorways Limited to an investment trust of QIC. The details of these transactions are provided below.
Forestry Plantations Queensland (FPQ)
On 18 May 2010, the Treasurer announced the sale of the business of FPQ, including a licence to manage the business for 99 years, to Hancock Queensland Plantations, a company managed by Hancock Timber Resources Group, for $613 million. Financial close for this transaction was achieved on 30 June 2010.
The operations of FPQ are not considered material for detailed disclosure as a discontinued operation in the Report on State Finances, however a net downward revaluation adjustment of $652 million to the value of plantation assets has been disclosed as “Other economic flows from discontinued operations” in (a) below.
QR Limited
The asset sale program included the sale of QR Limited’s above and below rail coal businesses and certain freight and related services. The State retains full ownership of the passenger transport business.
Shares in QR National Limited (the listing vehicle) were offered to the market by way of an Initial Public Offering on the Australian Securities Exchange on 22 November 2010. The sale of these shares provided proceeds of $4.05 billion to the State. The State retains approximately 34% of the shares in QR National Limited. This investment is held by Queensland Treasury Holdings Pty Ltd and is included in Investments in other entities not controlled or consolidated in Note 28 above.
The operations of QR Limited are included in the discontinued operations disclosure below, as are the asset values as at 30 June 2010.
| | |
| 6-104 | | Audited Consolidated Financial Statements 2010–11 – Government of Queensland |
Notes to the Financial Statements
| 59. | Discontinued Operations continued |
Port of Brisbane
On 10 November 2010 the Treasurer announced the sale of the business of the Port of Brisbane including a lease, for a 99 year term to the QPort Holdings Consortium. This sale delivered $2.1 billion in proceeds to the State. The lessee also agreed to fund Stage 3 of the Port of Brisbane Motorway expansion at an estimated cost of $200 million.
This sale of business (including a long term lease of the Port of Brisbane to a private sector consortium) is considered a discontinuation of this business by the State. The Port of Brisbane’s current and previous year’s operations are included in the financial performance information on discontinued operations below.
Queensland Motorways Limited (QML)
The Treasurer announced on 10 May 2011 that the transfer of QML to an investment trust of QIC had been completed. QML was transferred at a market value of $3.088 billion, which represented the value of the 40 year tolling franchise of the Gateway and Logan motorways and the lease of the land under these motorways.
QML is held by an investment trust which QIC manages for the provision of funding for the State’s ongoing superannuation obligations.
The transfer of QML and lease of the land under the Logan and Gateway motorways to an entity outside of the State’s control represents a discontinued operation to the State. As such QML’s current and previous year’s operations are included in the discontinued operations financial performance information below.
Abbot Point Coal Terminal
The sale of the business of Abbot Point Coal Terminal No 1 to Mundra Port Pty Ltd, including a 99 year lease over the land, was announced on 3 May 2011. This sale returned $1.829 billion to the State, which the Premier committed to fund the State’s share of the cost of natural disaster recovery from the 2010-11 cyclones and floods. The state retains ownership of the port land and infrastructure but has leased the operations of the port to the private sector.
Given that the day-to-day operation of the port has been contracted to private sector company Xstrata for a number of years, the long term lease is not considered a discontinued operation and is, therefore, not included in the numbers below.
| | | | | | | | |
| | | 2011 $M | | | 2010 $M | |
| | |
(a) Financial Performance information in relation to discontinued operations | | | | | | | | |
| | |
Revenue | | | 1,717 | | | | 3,266 | |
Employee Expenses | | | (445 | ) | | | (1,129 | ) |
Depreciation | | | (118 | ) | | | (687 | ) |
Other expenses | | | (730 | ) | | | (1,453 | ) |
| | | | | | | | |
Net Operating Balance from discontinued operations1 | | | 424 | | | | (3 | ) |
| | |
Other economic flows from discontinued operations | | | (55 | ) | | | (1,841 | ) |
| | |
| | | | | | | | |
Operating Result from discontinued operations | | | 369 | | | | (1,844 | ) |
| | | | | | | | |
| | |
Net cash flows from operating activities | | | 567 | | | | (30 | ) |
Net cash flows from investing activities 2 | | | 3,159 | | | | (2,255 | ) |
Net cash flows from financing activities | | | — | | | | — | |
| | | | | | | | |
Net cash flows from discontinued operations1 | | | 3,726 | | | | (2,285 | ) |
| | | | | | | | |
| | |
| Audited Consolidated Financial Statements 2010–11 – Government of Queensland | | 6-105 |
Notes to the Financial Statements
| 59. | Discontinued Operations continued |
Queensland Motorways Limited (QML) continued
(b) Carrying amounts of assets and liabilities of disposal group
Only QR Limited met the AASB 5 Non-Current Assets Held for Sale and Discontinued Operations requirements for a discontinued operation on 30 June 2010.
| | | | |
| | | 2010 $M | |
Assets | | | | |
Receivables | | | 530 | |
Property, plant and equipment | | | 6,281 | |
Other | | | 267 | |
| | | | |
| | | 7,079 | |
| | | | |
| |
Liabilities3 | | | | |
Payables | | | 335 | |
Other | | | 744 | |
| | | | |
| | | 1,079 | |
| | | | |
| |
Net Assets | | | 6,000 | |
| | | | |
| 1 | The effect of CSOs, interest and income tax is excluded from the transactions and balances disclosed as they are inter-entity transactions within the State and therefore eliminated. |
| 2 | Cashflows from investing activities for 2010-11 include proceeds from the asset sale program. |
| 3 | Borrowings of QR Limited are with Queensland Treasury Corporation which is a Queensland Government entity. These amounts are therefore eliminated and are not included as liabilities of the disposal group. The net assets of QR have been revalued to reflect the fair value less costs to sell in accordance with AASB 5 Non-Current Assets Held for Sale and Discontinued Operations . |
| | |
| 6-106 | | Audited Consolidated Financial Statements 2010–11 – Government of Queensland |
Notes to the Financial Statements
| 60. | General Government Sector Budget to Actual Comparison |
Operating Statement
| | | | | | | | | | | | | | | | | | | | | | | | |
| | | | | | | Variance Notes | | | Published Budget 2011 $M | | | Actual 2011 $M | | | Change $M | | | Change % | |
| | Revenue from Transactions | | | | | | | | | | | | | | | | | | | | |
| | Taxation revenue | | | | | | | 10,192 | | | | 9,975 | | | | (217 | ) | | | -2.1 | % |
| | Grants revenue | | | 1 | | | | 18,872 | | | | 20,272 | | | | 1,400 | | | | 7.4 | % |
| | Sales of goods and services | | | | | | | 4,077 | | | | 4,172 | | | | 95 | | | | 2.3 | % |
| | Interest income | | | 2 | | | | 2,132 | | | | 2,365 | | | | 233 | | | | 10.9 | % |
| | Dividend and income tax equivalents income | | | 3 | | | | 1,460 | | | | 1,232 | | | | (228 | ) | | | -15.6 | % |
| | Other revenue | | | | | | | 3,874 | | | | 3,941 | | | | 67 | | | | 1.7 | % |
| | Total Revenue from Transactions | | | | | | | 40,606 | | | | 41,957 | | | | 1,350 | | | | 3.3 | % |
| | | | | | |
Less | | Expenses from Transactions | | | | | | | | | | | | | | | | | | | | |
| | Employee expenses | | | | | | | 16,221 | | | | 16,820 | | | | 600 | | | | 3.7 | % |
| | Superannuation expenses | | | | | | | | | | | | | | | | | | | | |
| | Superannuation interest cost | | | | | | | 1,261 | | | | 1,240 | | | | (21 | ) | | | -1.7 | % |
| | Other superannuation expenses | | | | | | | 2,103 | | | | 2,171 | | | | 68 | | | | 3.3 | % |
| | Other operating expenses | | | | | | | 8,502 | | | | 8,646 | | | | 143 | | | | 1.7 | % |
| | Depreciation and amortisation | | | 4 | | | | 2,822 | | | | 2,506 | | | | (315 | ) | | | -11.2 | % |
| | Other interest expense | | | 5 | | | | 1,242 | | | | 1,125 | | | | (117 | ) | | | -9.4 | % |
| | Grants expenses | | | 6 | | | | 10,201 | | | | 10,964 | | | | 763 | | | | 7.5 | % |
| | Total Expenses from Transactions | | | | | | | 42,352 | | | | 43,473 | | | | 1,121 | | | | 2.6 | % |
| | | | | | |
Equals | | Net Operating Balance | | | | | | | (1,746 | ) | | | (1,516 | ) | | | 229 | | | | | |
| | | | | | |
| | Other Economic Flows - Included in Operating Result | | | | | | | | | | | | | | | | | | | | |
| | Gain on sale of assets and investments | | | 7 | | | | 19 | | | | 166 | | | | 147 | | | | 765.8 | % |
| | Revaluation increments and impairment loss reversals | | | | | | | 8 | | | | 46 | | | | 38 | | | | 477.3 | % |
| | Loss on sale of assets and investments | | | | | | | (8 | ) | | | (36 | ) | | | (28 | ) | | | 329.5 | % |
| | Asset write-down, revaluation decrements and impairment loss | | | 8 | | | | (200 | ) | | | (383 | ) | | | (183 | ) | | | 91.8 | % |
| | Actuarial adjustments to liabilities | | | | | | | — | | | | 65 | | | | 65 | | | | N/A | |
| | Deferred income tax equivalents | | | 9 | | | | 12 | | | | (1,142 | ) | | | (1,153 | ) | | | -9896.8 | % |
| | Dividends and tax equivalents treated as capital returns | | | 10 | | | | — | | | | 1,396 | | | | 1,396 | | | | N/A | |
| | Other | | | | | | | (9 | ) | | | 5 | | | | 15 | | | | -159.8 | % |
| | Total Other Economic Flows - Included in Operating Result | | | | | | | (178 | ) | | | 117 | | | | 296 | | | | -165.9 | % |
| | | | | | |
| | Operating Result | | | | | | | (1,924 | ) | | | (1,399 | ) | | | 525 | | | | | |
| | | | | | |
| | Other Economic Flows - Other Movements in Equity | | | | | | | | | | | | | | | | | | | | |
| | Revaluations | | | 11 | | | | 2,892 | | | | (2,939 | ) | | | (5,831 | ) | | | -201.6 | % |
| | Other | | | | | | | (11 | ) | | | (28 | ) | | | (16 | ) | | | 142.3 | % |
| | Total Other Economic Flows - Other Movements in Equity | | | | | | | 2,881 | | | | (2,966 | ) | | | (5,847 | ) | | | -203.0 | % |
| | | | | | |
| | Comprehensive Result - Total Changes in Net Worth | | | | | | | 957 | | | | (4,365 | ) | | | (5,322 | ) | | | | |
| | | | | | | | | | | | | | | | | | | | | | | | |
| | | | | | |
| | KEY FISCAL AGGREGATES | | | | | | | | | | | | | | | | | | | | |
| | | | | | |
| | Net Operating Balance | | | | | | | (1,746 | ) | | | (1,516 | ) | | | 229 | | | | -13.1 | % |
| | | | | | |
Less | | Net Acquisition/(Disposal) of Non-Financial Assets | | | | | | | | | | | | | | | | | | | | |
| | Purchases of non-financial assets | | | | | | | 8,335 | | | | 8,237 | | | | (98 | ) | | | -1.2 | % |
| | Less | | Sales of non-financial assets | | | | | | | 203 | | | | 252 | | | | 49 | | | | 24.0 | % |
| | Less | | Depreciation | | | | | | | 2,822 | | | | 2,506 | | | | (315 | ) | | | -11.2 | % |
| | Plus | | Change in inventories | | | | | | | 73 | | | | 80 | | | | 7 | | | | 9.4 | % |
| | Plus | | Other movement in non-financial assets | | | | | | | 186 | | | | 15 | | | | (172 | ) | | | -92.1 | % |
| | Equals | | Total Net Acquisition/(Disposal) of Non-Financial Assets | | | | | | | 5,569 | | | | 5,573 | | | | 4 | | | | 0.1 | % |
| | | | | | |
Equals | | Net Lending/(Borrowing) | | | | | | | (7,315 | ) | | | (7,089 | ) | | | 226 | | | | -3.1 | % |
| | |
| Audited Consolidated Financial Statements 2010–11 – Government of Queensland | | 6-107 |
Notes to the Financial Statements
| 60. | General Government Sector Budget to Actual Comparison continued |
Balance Sheet
| | | | | | | | | | | | | | | | | | | | |
| | | Variance Notes | | | Published Budget 2011 $M | | | Actual 2011 $M | | | Change $M | | | Change % | |
Assets | | | | | | | | | | | | | | | | | | | | |
Financial Assets | | | | | | | | | | | | | | | | | | | | |
Cash and deposits | | | 12 | | | | 308 | | | | 635 | | | | 327 | | | | 106.1 | % |
Receivables and loans | | | | | | | | | | | | | | | | | | | | |
Receivables | | | 13 | | | | 3,357 | | | | 4,493 | | | | 1,136 | | | | 33.8 | % |
Advances paid | | | | | | | 594 | | | | 594 | | | | — | | | | 0.0 | % |
Loans paid | | | 14 | | | | 24,048 | | | | 31,233 | | | | 7,185 | | | | 29.9 | % |
Securities other than shares | | | 15 | | | | 5,505 | | | | 2,118 | | | | (3,386 | ) | | | -61.5 | % |
Shares and other equity investment | | | | | | | | | | | | | | | | | | | | |
Investments in public sector entities | | | 16 | | | | 24,648 | | | | 18,168 | | | | (6,480 | ) | | | -26.3 | % |
Investments in other entities | | | | | | | 2 | | | | 5 | | | | 3 | | | | 141.4 | % |
Investments accounted for using equity method | | | | | | | 58 | | | | 112 | | | | 55 | | | | 94.9 | % |
Total Financial Assets | | | | | | | 58,518 | | | | 57,358 | | | | (1,161 | ) | | | -2.0 | % |
| | | | | |
Non-Financial Assets | | | | | | | | | | | | | | | | | | | | |
Inventories | | | | | | | 729 | | | | 678 | | | | (51 | ) | | | -7.0 | % |
Assets held for sale | | | | | | | 108 | | | | 198 | | | | 90 | | | | 83.8 | % |
Investment properties | | | | | | | 273 | | | | 251 | | | | (22 | ) | | | -8.0 | % |
Biological assets | | | | | | | 9 | | | | 9 | | | | — | | | | 0.0 | % |
Property, plant and equipment | | | 17 | | | | 180,739 | | | | 169,160 | | | | (11,579 | ) | | | -6.4 | % |
Intangibles | | | | | | | 876 | | | | 872 | | | | (3 | ) | | | -0.4 | % |
Deferred tax asset | | | 18 | | | | 6,513 | | | | 5,504 | | | | (1,010 | ) | | | -15.5 | % |
Other non financial assets | | | | | | | 246 | | | | 283 | | | | 37 | | | | 14.8 | % |
Total Non-Financial Assets | | | | | | | 189,493 | | | | 176,955 | | | | (12,539 | ) | | | -6.6 | % |
| | | | | |
Total Assets | | | | | | | 248,012 | | | | 234,313 | | | | (13,699 | ) | | | -5.5 | % |
| | | | | |
Liabilities | | | | | | | | | | | | | | | | | | | | |
Payables | | | 19 | | | | 3,085 | | | | 3,918 | | | | 833 | | | | 27.0 | % |
Employee benefit obligations | | | | | | | | | | | | | | | | | | | | |
Superannuation liability | | | | | | | 25,462 | | | | 25,236 | | | | (226 | ) | | | -0.9 | % |
Other employee benefits | | | 20 | | | | 4,177 | | | | 4,624 | | | | 447 | | | | 10.7 | % |
Deposits held | | | | | | | — | | | | 1 | | | | 1 | | | | N/A | |
Borrowings and advances | | | | | | | | | | | | | | | | | | | | |
Advances received | | | | | | | 462 | | | | 444 | | | | (18 | ) | | | -3.9 | % |
Borrowings | | | 21 | | | | 23,250 | | | | 25,089 | | | | 1,839 | | | | 7.9 | % |
Securities other than shares | | | | | | | — | | | | — | | | | — | | | | N/A | |
Deferred tax liability | | | 22 | | | | 1,270 | | | | 1,787 | | | | 517 | | | | 40.7 | % |
Provisions | | | 23 | | | | 1,015 | | | | 1,279 | | | | 264 | | | | 26.0 | % |
Other liabilities | | | | | | | 726 | | | | 713 | | | | (13 | ) | | | -1.9 | % |
Total Liabilities | | | | | | | 59,447 | | | | 63,091 | | | | 3,644 | | | | 6.1 | % |
| | | | | |
Net Assets | | | | | | | 188,564 | | | | 171,222 | | | | (17,343 | ) | | | -9.2 | % |
| | | | | |
Net Worth | | | | | | | | | | | | | | | | | | | | |
Accumulated surplus | | | | | | | 88,115 | | | | 88,666 | | | | 550 | | | | 0.6 | % |
Reserves | | | | | | | 100,451 | | | | 82,557 | | | | (17,894 | ) | | | -17.8 | % |
Total Net Worth | | | | | | | 188,564 | | | | 171,222 | | | | (17,343 | ) | | | -9.2 | % |
| | | | | | | | | | | | | | | | | | | | |
| | | | | |
KEY FISCAL AGGREGATES | | | | | | | | | | | | | | | | | | | | |
Net Financial Worth | | | | | | | (929 | ) | | | (5,733 | ) | | | (4,804 | ) | | | 517.3 | % |
Net Financial Liabilities | | | | | | | 25,576 | | | | 23,901 | | | | (1,676 | ) | | | -6.6 | % |
Net Debt | | | | | | | (6,743 | ) | | | (9,047 | ) | | | (2,304 | ) | | | 34.2 | % |
| | |
| 6-108 | | Audited Consolidated Financial Statements 2010–11 – Government of Queensland |
Notes to the Financial Statements
| 60. | General Government Sector Budget to Actual Comparison continued |
Cashflow Statement
| | | | | | | | | | | | | | | | | | | | |
| | | Notes | | | Published Budget 2011 $M | | | Actual 2011 $M | | | Change $M | | | Change % | |
Cash Flows from Operating Activities | | | | | | | | | | | | | | | | | | | | |
Cash received | | | | | | | | | | | | | | | | | | | | |
Taxes received | | | | | | | 10,190 | | | | 9,900 | | | | (290 | ) | | | -2.8 | % |
Grants and subsidies received | | | 24 | | | | 18,883 | | | | 20,278 | | | | 1,396 | | | | 7.4 | % |
Sales of goods and services | | | | | | | 4,485 | | | | 4,429 | | | | (56 | ) | | | -1.2 | % |
Interest receipts | | | 25 | | | | 2,131 | | | | 2,276 | | | | 145 | | | | 6.8 | % |
Dividends and income tax equivalents | | | | | | | 1,062 | | | | 1,096 | | | | 34 | | | | 3.2 | % |
Other receipts | | | 26 | | | | 4,832 | | | | 5,361 | | | | 529 | | | | 11.0 | % |
| | | | | | | 41,582 | | | | 43,340 | | | | 1,758 | | | | 4.2 | % |
Cash paid | | | | | | | | | | | | | | | | | | | | |
Payments for employees | | | | | | | (18,435 | ) | | | (18,571 | ) | | | (136 | ) | | | 0.7 | % |
Payments for goods and services | | | 27 | | | | (9,298 | ) | | | (10,531 | ) | | | (1,233 | ) | | | 13.3 | % |
Grants and subsidies | | | | | | | (10,135 | ) | | | (10,223 | ) | | | (87 | ) | | | 0.9 | % |
Interest paid | | | 28 | | | | (1,240 | ) | | | (1,118 | ) | | | 122 | | | | -9.8 | % |
Other payments | | | | | | | (738 | ) | | | (793 | ) | | | (54 | ) | | | 7.3 | % |
| | | | | | | (39,847 | ) | | | (41,235 | ) | | | (1,388 | ) | | | 3.5 | % |
| | | | | |
Net Cash Flows from Operating Activities | | | | | | | 1,735 | | | | 2,105 | | | | 370 | | | | 21.3 | % |
| | | | | |
Cash Flows from Investing Activities | | | | | | | | | | | | | | | | | | | | |
Non-Financial Assets | | | | | | | | | | | | | | | | | | | | |
Purchases of non-financial assets | | | | | | | (8,335 | ) | | | (8,237 | ) | | | 98 | | | | -1.2 | % |
Sales of non-financial assets | | | | | | | 203 | | | | 252 | | | | 49 | | | | 24.0 | % |
| | | | | | | (8,131 | ) | | | (7,985 | ) | | | 147 | | | | -1.8 | % |
| | | | | |
Financial Assets (Policy Purposes) | | | | | | | | | | | | | | | | | | | | |
Equity acquisitions | | | 29 | | | | (660 | ) | | | (510 | ) | | | 150 | | | | -22.8 | % |
Equity disposals | | | 29 | | | | 659 | | | | 8,351 | | | | 7,693 | | | | 1168.0 | % |
| | | | | | | (1 | ) | | | 7,841 | | | | 7,843 | | | | -564235.0 | % |
| | | | | |
Financial Assets (Liquidity Purposes) | | | | | | | | | | | | | | | | | | | | |
Sales of investments | | | | | | | 1,848 | | | | 1,979 | | | | 131 | | | | 7.1 | % |
Purchases of investments | | | | | | | (3,209 | ) | | | (6,935 | ) | | | (3,726 | ) | | | 116.1 | % |
| | | 30 | | | | (1,361 | ) | | | (4,956 | ) | | | (3,595 | ) | | | 264.2 | % |
| | | | | |
Net Cash Flows from Investing Activities | | | | | | | (9,494 | ) | | | (5,099 | ) | | | 4,394 | | | | -46.3 | % |
| | | | | |
Cash Flows from Financing Activities | | | | | | | | | | | | | | | | | | | | |
Cash received | | | | | | | | | | | | | | | | | | | | |
Advances received | | | | | | | 10 | | | | 12 | | | | 2 | | | | 18.1 | % |
Proceeds of borrowing | | | | | | | 7,988 | | | | 8,999 | | | | 1,011 | | | | 12.7 | % |
Deposits received | | | | | | | — | | | | — | | | | — | | | | 100 | % |
| | | | | | | 7,998 | | | | 9,011 | | | | 1,013 | | | | 12.7 | % |
| | | | | |
Cash paid | | | | | | | | | | | | | | | | | | | | |
Advances paid | | | | | | | (24 | ) | | | (31 | ) | | | (7 | ) | | | 31.7 | % |
Borrowing repaid | | | | | | | (359 | ) | | | (7,688 | ) | | | (7,329 | ) | | | 2039.1 | % |
Deposits withdrawn | | | | | | | — | | | | (1 | ) | | | (1 | ) | | | 100 | % |
| | | | | | | (383 | ) | | | (7,720 | ) | | | (7,337 | ) | | | 1915.7 | % |
| | | | | |
Net Cash Flows from Financing Activities | | | 31 | | | | 7,615 | | | | 1,291 | | | | (6,324 | ) | | | -83.1 | % |
| | | | | |
Net increase/(decreased) in Cash and Deposits Held | | | | | | | (143 | ) | | | (1,704 | ) | | | (1,560 | ) | | | 1088.7 | % |
Cash and deposits at the beginning of the financial year | | | | | | | 451 | | | | 904 | | | | 453 | | | | 100.5 | % |
Cash and Deposits Held at the End of the Financial Year | | | | | | | 308 | | | | (799 | ) | | | (1,107 | ) | | | -359.7 | % |
| | | | | | | | | | | | | | | | | | | | |
| | | | | |
KEY FISCAL AGGREGATES | | | | | | | | | | | | | | | | | | | | |
Net Cash from Operating Activities | | | | | | | 1,735 | | | | 2,105 | | | | 370 | | | | 21.3 | % |
Net Cash Flow from Investments in Non-Financial Assets | | | | | | | (8,131 | ) | | | (7,985 | ) | | | 147 | | | | -1.8 | % |
CASH SURPLUS/(DEFICIT) | | | | | | | (6,396 | ) | | | (5,880 | ) | | | 516 | | | | -8.1 | % |
| | |
| Audited Consolidated Financial Statements 2010–11 – Government of Queensland | | 6-109 |
Notes to the Financial Statements
| 60. | General Government Sector Budget to Actual Comparison continued |
Variance Notes
| | 1 | Grants revenue has increased $1.4 billion over the original 2010-11 Budget. The significant increase is largely due to the Australian Government’s payment towards Queensland’s flood and cyclone reconstruction effort under the Natural Disaster Relief and Recovery Arrangements ($2.1 billion) partly offset by a decrease in GST distributed to Queensland ($494 million) and other Commonwealth payments ($236 million). |
| | 2 | Interest revenue increased by $233 million over the original budget largely reflecting earnings on higher than estimated long term note balances and better than expected returns on assets held for insurance liabilities. |
| | 3 | Dividend and tax equivalent income declined $228 million from the 2010-11 Budget. This is mainly due to the sale of QR National Limited, which, due to the timing of the preparation of the 2010-11 Budget was not factored into budget estimates. This was offset in part by additional tax income from Stanwell Corporation Limited due to a gain on sale of a mineral development licence and higher than budgeted income from Queensland Investment Corporation. |
| | 4 | Depreciation and amortisation expense has fallen $315 million compared to budget largely due to lower than budgeted road asset valuations by the Department of Transport and Main Roads. |
| | 5 | Other interest expense declined $117 million from budget largely due to the repayment of borrowings from the proceeds of QR National Limited initial public offering. |
| | 6 | Grants expenses have increased $763 million since the original budget was published. This is mainly due to $368 million in additional funding for Natural Disaster Relief and Recovery Arrangements to local governments for infrastructure reparation works and payments to householders following the significant flooding events from late 2010 to January 2011 and Tropical Cyclone Yasi; Health grants of $224 million, including funding for community helicopter providers, aeromedical expenses and grants to the Translational Research Institute; transfer and de-recognition of $327 million in Gateway Motorway infrastructure assets prior to the sale of Queensland Motorways Limited; $79 million in additional demained roads; $50 million funding to Townsville Port Limited for redevelopment of Berth 10A and increased community service obligation payments of $50 million to Ergon Energy. These payments were partially offset by a $144 million deferral within Local Government Grant and Subsidy programs and $326 million deferral of expenditure within Housing and Homelessness Services and the Home and Community Care program. |
| | 7 | Gain on sale of assets and investments increased by $147 million over the original 2010-11 Budget mainly due to the gain on sale of QR National Limited. At 30 June 2010, QRN shares were reported as assets held for sale and were measured as required by accounting standards at fair value less cost to sell. The gain on sale is offset by selling costs which are included in “other operating expenses”. |
| | 8 | Asset write-down, revaluation decrements and impairment losses are $183 million higher than the 2010-11 Budget. Contributing to this increase is an additional $53 million write down of road assets and a $52 million impairment of CorpTech software. |
| | 9 | The decline in deferred income tax equivalent income of $1,153 million compared to the 2010-11 Budget is mainly due to the de-recognition of deferred tax assets following the sale of QR National Limited ($534 million), Port of Brisbane ($271 million), North Queensland Bulk Ports Corporation Limited’s Abbot Point Coal Terminal ($67 million) and a $560 million decrease in deferred tax income from the electricity sector largely due to electricity generation asset impairments as a result of the Australian Government’s proposal to implement a carbon price mechanism. These variances were partially offset by Queensland Treasury Holdings Pty Limited deferred tax on QRN shares held at fair value ($188 million) and the timing of the sale and de-recognition of Forestry Planation Queensland tax assets ($155 million) which was budgeted for 2010-11 but occurred in 2009-10. |
| | 10 | Dividends and tax equivalents from privatisations reflects the dividend repatriation of $1.046 billion from the sale of Port of Brisbane Corporation Limited, a dividend declared of $200 million by North Queensland Bulk Ports Corporation Limited from the sale and 99 year lease of Abbot Point Coal Terminal and $150 million return of capital from Queensland Treasury Corporation. |
| | 11 | Revaluations included in other economic flows are lower than original Budget by $5.831 billion due to downward valuations of non-financial assets particularly by the Department of Transport and Main Roads ($3.1 billion), Department of Communities ($483 million), Department of Employment, Economic Development and Innovation ($299 million), Department of Education and Training ($293 million), Department of Health ($180 million) and a decline in value of the GGS investment in public sector entities of $1.133 billion resulting from the transfer of Queensland Motorways Limited to Queensland Investment Corporation trusts and electricity generation asset impairments. These decreases are partially offset by an actuarial gain of $643 million on defined benefit superannuation liabilities. |
| | 12 | Refer to Cash Flow Statement variances. |
| | |
| 6-110 | | Audited Consolidated Financial Statements 2010–11 – Government of Queensland |
Notes to the Financial Statements
| 60. | General Government Sector Budget to Actual Comparison continued |
Variance Notes continued
| | 13 | Receivables are $1.136 billion higher than 2010-11 Budget. The variance is partly due to the increase in taxes receivable of $245 million, royalties receivable of $270 million, Department of Health operating receivables of $205 million including reimbursements due from the Commonwealth Department of Veteran Affairs and NSW Government for patient revenue and payroll overpayments and additional fines and regulatory fees receivable of $52 million. |
| | 14 | Loans paid are $7.185 billion higher than the 2010-11 Budget mainly reflecting the transfer of the State’s investment in Queensland Motorways Limited to Queensland Investment Corporation (QIC) through the long term loan arrangement with Queensland Treasury Corporation (QTC) and the transfer of the State’s remaining investments in QIC Trust, held in respect of former defined benefit liabilities, to QTC to also form part of the long term loan (Refer to Note 15). |
| | 15 | Securities other than shares declined $3.386 billion primarily following the transfer of the State’s remaining former defined benefit investments, held in trust with QIC, to QTC to form part of the long term loan arrangement (Refer to Note 14). |
| | 16 | Investment in public sector entities decreased $6.480 billion from published Budget. This variance is primarily attributable to the sale of QR National, the long term lease of Abbot Point Coal Terminal and Port of Brisbane and the transfer of Queensland Motorways Limited ($6.656 billion) and the decline in net worth of the electricity sector ($490 million) largely due to electricity generation asset impairments as a result of the Australian Government’s proposed introduction of a carbon price mechanism. These decreases were partially offset by improved operating results for the Public Financial Corporations Sector ($838 million) as a result of fair value gains on investments. |
| | 17 | Property, plant and equipment decreased $11.579 billion since the 2010-11 Budget. The variance is largely due to lower opening balances of $6.875 billion resulting from the downwards valuations reported in the audited 2009-10 actuals, and the downward valuations of non-financial assets for 2010-11 (Refer to Note 11). |
| | 18 | Deferred tax assets are $1.01 billion lower than 2010-11 Budget, reflecting the de-recognition of tax assets on sale of QR National and long term lease of Port of Brisbane and Abbot Point Coal Terminal ($1.591 billion), partially offset by increases in future tax liabilities within the electricity sector ($242 million) and by Queensland Treasury Holdings Pty Limited ($209 million). |
| | 19 | The $833 million increase in payables over the 2010-11 Budget was partly due to the increased volume of infrastructure related works and emergent works for Natural Disaster Relief and Recovery Arrangements by the Department of Transport and Main Roads ($318 million) and additional operating payables by the Department of Health ($132 million). |
| | 20 | Other employee benefits have increased $447 million since the 2010-11 Budget. This increase is mainly attributable to additional salary and wages payable ($146 million), annual leave liabilities ($217 million) and long service leave obligations ($109 million). These variances are partly due to differences on opening balances. |
| | 21 | Borrowings are $1.839 billion higher than the 2010-11 Budget estimate. Significantly contributing to this increase is the impact of the asset sales program which was not factored into the original Budget estimates. Prior to asset sales, $6.265 billion of borrowings was transferred into the GGS from the Public Non-financial Corporation (PNFC) sector. An additional $2.187 billion was borrowed to repay an equivalent amount of Queensland Motorways Limited debt as part of the transfer to Queensland Investment Corporation trusts. Proceeds of $7.312 billion from the sale of QR National and long term lease of Port of Brisbane Corporation were used to repay borrowings. Proceeds from the sale of Abbot Point Coal Terminal remained within the PNFC sector as at 30 June 2011. |
| | 22 | The increase in deferred tax liabilities of $517 million from the 2010-11 Budget largely reflects an increase in deferred tax liabilities within the electricity sector mainly as a result of the change in treatment of the offset of deferred tax assets and liabilities ($387 million), and additional deferred tax within the Public Financial Corporation Sector ($151 million). This increase was partially offset by the de-recognition of tax liabilities relating to the sale of QR National ($110 million). |
| | 23 | Provisions are higher than 2010-11 Budget by $264 million mainly due to the 2009-10 growth in outstanding Queensland Government Insurance Fund liabilities. |
| | 25 | Interest receipts are above budget levels, largely due to to higher balances on the Long Term Note with QTC. |
| | 26 | Other receipts are higher than the original budget by $529 million. This is partly due to GST receipts and payments being netted off in the budget and grossed up in the actuals, offset by a $481 million decrease in mining royalties receipts. |
| | |
| Audited Consolidated Financial Statements 2010–11 – Government of Queensland | | 6-111 |
Notes to the Financial Statements
| 60. | General Government Sector Budget to Actual Comparison continued |
Variance Notes continued
| | 27 | The increase in payments for goods and services of $1,233 million largely reflects the gross up of GST paid on purchases (see 26 above). |
| | 28 | Interest paid is $122 million less than Budget primarily due to the timing of borrowings and the use of proceeds from asset sales to repay borrowings. |
| | 29 | Net equity funding to Public Non-financial and Financial Corporations decreased by $150 million from the 2010-11 Budget with an unbudgeted equity return from QTC. |
Proceeds from equity disposals were $7.693 billion higher than budgeted as the proceeds from the sale of QR National Limited, Port of Brisbane and Queensland Motorways Limited were not certain enough to be factored into the 2010-11 Budget. Offsetting the above increases were proceeds of $421 million from the sale of the forestry licence granted by the Department of Environment and Resource Management which were received in 2009-10 ahead of the original expectation of 2010-11.
| | 30 | Net investment in financial assets held for liquidity purposes increased by $3.595 billion from the original 2010-11 Budget largely reflecting the investment of the proceeds in Queensland Motorways Limited in QIC trusts. |
| | 31 | Net cash flows from financing activities decreased $6.324 billion from the 2010-11 Budget largely due to the proceeds from asset sales of QR National and Port of Brisbane being used to repay borrowings. |
| 61. | Immaterial Modified Audit Opinions over Agency Financial Statements |
The following matters were reported by the Auditor-General for individual agency financial statements which have been individually assessed as not having a material impact upon these General Government and Whole of Government financial statements:
| | • | | The Auditor-General reported that in relation to a new payroll system for Queensland Health, there was material non-compliance with the prescribed requirements for the Department to maintain appropriate systems of internal control, though the deficiencies have not had a material effect on disclosed employee expenses. |
| | • | | In relation to the uncertainty surrounding the proposed introduction of the Federal Government’s Clean Energy Plan, impairment testing carried out at 30 June 2011 on the generator assets of Tarong Energy Corporation Limited, CS Energy Limited and Stanwell Corporation Limited has resulted in impairment losses disclosed in Note 1(an) of $1.715 billion. The Auditor-General has drawn attention to the uncertainty surrounding the impairment losses as an emphasis of matter in the audit reports of those entities. |
| | • | | SunWater Limited has irrigation assets that have been assessed for impairment using value-in-use cash flow calculations which are sensitive to key assumptions such as price. With new prices expected to be set by the QCA by 1 July 2012, the Auditor-General has raised an emphasis of matter in relation to significant uncertainty over the calculation of value-in-use of infrastructure assets in the absence of an approved future pricing structure for irrigation water. |
| | • | | The South East Queensland bulk water authorities (Queensland Manufactured Water Authority, the Queensland Bulk Water Supply Authority and the Queensland Bulk Water Transport Authority) have performed an impairment assessment on their bulk water assets based on current bulk water pricing arrangements under normal pricing principles for regulated assets. The assumptions used in the impairment assessment are particularly sensitive to changes in bulk water pricing parameters set by the State and this has been noted as an emphasis of matter in the audit reports of these entities. |
| | |
| 6-112 | | Audited Consolidated Financial Statements 2010–11 – Government of Queensland |
Certificate of Queensland State Government Financial Statements
General Government Sector and Total State Sector Consolidated Financial Statements 2010-11
Management Certificate
The foregoing GGS and Total State Sector consolidated financial statements have been prepared pursuant to section 25(1)(a) and (b) of the Financial Accountability Act 2009 and other prescribed requirements.
In our opinion and in terms of section 25(3) of the Financial Accountability Act 2009, we certify that the GGS and Total State Sector consolidated financial statements have been properly drawn up, under the prescribed requirements, to present a true and fair view of:
(i) the financial operations and cash flows of the Government of Queensland for the financial year; and
(ii) the financial position of the Government of Queensland at 30 June 2011.
At date of certification of the statements, we are not aware of any material circumstances that would render any particulars included in the GGS and Total State Sector consolidated financial statements misleading or inaccurate.
| | | | |
| David Newby, CA | | Gerard Bradley, CPA, FCA | | ANDREW FRASER MP |
| Manager, Fiscal Reporting | | Under Treasurer | | DEPUTY PREMIER and TREASURER |
| Queensland Treasury | | Queensland Treasury | | MINISTER FOR STATE |
| | | | DEVELOPMENT AND TRADE |
Date 19 October 2011
| | |
| Audited Consolidated Financial Statements 2010–11 – Government of Queensland | | 6-113 |
INDEPENDENT AUDITOR’S REPORT
To the Treasurer of Queensland
Report on the Financial Report
I have audited the accompanying financial report of the Government of Queensland including General Government Sector and Total State Sector, which comprises the balance sheet as at 30 June 2011, and the operating statement, statement of changes in net assets (equity) and cash flow statement for the year ended on that date, a summary of significant accounting policies, other explanatory notes and the certificates given by the Treasurer, Under Treasurer and the Manager, Fiscal Reporting. The financial report includes the consolidated financial statements of the Government of Queensland and the entities it controlled at the year’s end or from time to time during the financial year.
Responsibility for the Financial Report
The Treasurer, through the Treasury Department, is responsible for the preparation and fair presentation of the financial report in accordance with prescribed accounting requirements identified in the Financial Accountability Act 2009 and with Accounting Standard AASB 1049 Whole of Government and General Government Sector Financial Reporting. AASB 1049 requires compliance with other applicable Australian Accounting Standards. This responsibility includes establishing and maintaining internal controls relevant to the preparation and fair presentation of the financial report that is free from material misstatement, whether due to fraud and error; selecting and applying appropriate accounting policies; and making accounting estimates that are reasonable in the circumstances.
Auditor’s Responsibility
My responsibility is to express an opinion on the financial report based on the audit. The audit was conducted in accordance with the Auditor-General of Queensland Auditing Standards, which incorporate the Australian Auditing Standards. These auditing standards require compliance with relevant ethical requirements relating to audit engagements and that the audit is planned and performed to obtain reasonable assurance whether the financial report is free of material misstatement.
An audit involves performing procedures to obtain audit evidence about the amounts and disclosures in the financial report. The procedures selected depend on the auditor’s judgement, including the assessment of risks of material misstatement in the financial report, whether due to fraud or error. In making those risk assessments, the auditor considers the entity’s preparation and fair presentation of the financial report in order to design audit procedures that are appropriate in the circumstances, but not for the purpose of expressing an opinion on the effectiveness of the entity’s internal control, other than in expressing an opinion on compliance with prescribed requirements. An audit also includes evaluating the appropriateness of accounting policies and the reasonableness of accounting estimates made by the Accountable Officer, as well as evaluating the overall presentation of the financial report and any mandatory financial reporting requirements as approved by the Treasurer for application in Queensland.
I believe that the audit evidence obtained is sufficient and appropriate to provide a basis for my audit opinion.
My audit is not designed to provide assurance on the accuracy and appropriateness of the budgetary information in the financial report.
Independence
The Auditor-General Act 2009 promotes the independence of the Auditor-General and all authorised auditors. The Auditor-General is the auditor of all Queensland public sector entities and can only be removed by Parliament.
The Auditor-General may conduct an audit in any way considered appropriate and is not subject to direction by any person about the way in which audit powers are to be exercised. The Auditor-General has for the purposes of conducting an audit, access to all documents and property and can report to Parliament matters which in the Auditor-General’s opinion are significant.
Auditor’s Opinion
In accordance with s.42 of the Auditor-General Act 2009 -
| | (a) | I have received all the information and explanations which I have required; and |
| | (i) | the prescribed requirements in respect of the establishment and keeping of accounts have been complied with in all material respects; and |
| | (ii) | the financial report has been drawn up under prescribed requirements, so as to present a true and fair view, of the financial operations and cash flows of the Government of Queensland for the financial year 1 July 2010 to 30 June 2011 and of the financial position as at the end of that year. |
| | |
| 6-114 | | Audited Consolidated Financial Statements 2010–11 – Government of Queensland |
INDEPENDENT AUDITOR’S REPORT continued
Matters Relating to the Electronic Presentation of the Audited Financial Report
The auditor’s report relates to the financial report of the Government of Queensland including General Government Sector and Total State Sector for the financial year ended 30 June 2011. Where the financial report is included on the Queensland Treasury Department’s website, the accountable officer is responsible for the integrity of the Queensland Treasury Department’s website and I have not been engaged to report on the integrity of the Queensland Treasury Department’s website. The auditor’s report refers only to the subject matter described above. It does not provide an opinion on any other information which may have been hyperlinked to/from these statements or otherwise included with the financial report. If users of the financial report are concerned with the inherent risks arising from publication on a website, they are advised to refer to the hard copy of the audited financial report to confirm the information contained in this website version of the financial report.
These matters also relate to the presentation of the audited financial report in other electronic media including CD Rom.

| | |
G G POOLE FCPA, FCA | | Queensland Audit Office |
Auditor-General of Queensland | | Brisbane |
| | |
| Audited Consolidated Financial Statements 2010–11 – Government of Queensland | | 6-115 |

Queensland
Government