EXHIBIT (f)(iii)
The Queensland Government Document Entitled
“The Strongest & Smartest Choice:
Queensland’s Plan for Secure Finances and a Strong Economy”
FORWARD-LOOKING STATEMENTS
This exhibit contains forward-looking statements. Statements that are not historical facts, including statements about the State of Queensland’s (the “State” or “Queensland”) beliefs and expectations, are forward-looking statements. These statements are based on current plans, budgets, estimates and projections and therefore you should not place undue reliance on them. The words “believe”, “may”, “will”, “should”, “estimate”, “continue”, “anticipate”, “intend”, “expect” and similar words are intended to identify forward-looking statements. Forward-looking statements speak only as of the date they are made, and neither the Queensland Treasury Corporation nor the State undertake any obligation to update publicly any of them in light of new information or future events.
Forward-looking statements are based on current plans, estimates and projections and, therefore, undue reliance should not be placed on them. Although the Queensland Treasury Corporation and the State believe that the beliefs and expectations reflected in such forward-looking statements are reasonable, no assurance can be given that such beliefs and expectations will prove to have been correct. Forward-looking statements involve inherent risks and uncertainties. We caution you that actual results may differ materially from those contained in any forward-looking statements.
A number of important factors could cause actual results to differ materially from those expressed in any forward-looking statement. Factors that could cause the actual outcomes to differ materially from those expressed or implied in forward-looking statements include:
| | • | | the international and Australian economies, and in particular the rates of growth (or contraction) of the State’s major trading partners; |
| | • | | the effects, both internationally and in Australia, of any further global financial crisis, any subsequent economic downturn, the ongoing economic, banking and sovereign debt crisis in Europe and any stalling of the protracted United States recovery; |
| | • | | increases or decreases in international and Australian domestic interest rates; |
| | • | | changes in the State’s domestic consumption; |
| | • | | changes in the State’s labor force participation and productivity; |
| | • | | downgrades in the credit ratings of the State and Australia; |
| | • | | changes in the rate of inflation in the State; |
| | • | | changes in environmental and other regulation; and |
| | • | | changes in the distribution of revenue from the Commonwealth of Australia Government to the State. |
THE STRONGEST &
SMARTEST CHOICE
Great state. Great opportunity.
QUEENSLAND’S PLAN FOR SECURE FINANCES AND A STRON ECONOMY
2 The Strongest & Smartest Choice Contents The Strong Choices Process . 3 Executive Summary . 4 The Problem . 7 Queensland’s debt and deficit problem . 7 How did our debt get to $80 billion? 9 Do other states have the same problem? . 11 Why action is needed – the cost of doing nothing 13 Action plan: Budget repair to date 14 What must be done now? 17 Strong Choices 18 Strong Choices – The Campaign . 18 Strong Choices – Increase taxes? . 19 Strong Choices: Significantly increase taxes . 19 What the Government has already done 20 Impact of further increasing taxes . 21 STRONG CHOICES – CONSULTATION REPORT Strong Choices – Reduce services? . 23 Strong Choices: Reduce services 23 What the Government has already done 23 Impact of service reductions . 24 Strong Choices – Sale or lease of assets? 25 Options for asset transactions 26 What the Government has already done 27 Why Governments should not continue to own some assets 28 New External Environment . 29 Implications of the Federal Budget . 29 The Strongest and Smartest Choice 30 The result of Strong Choices 34 The Strong Choices Investment Program . 35 Appendix 40 Contents
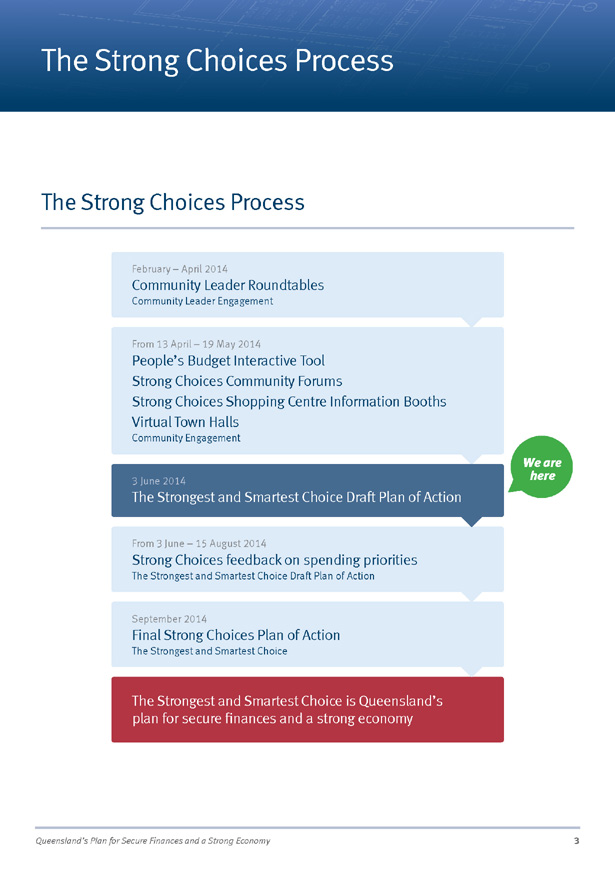
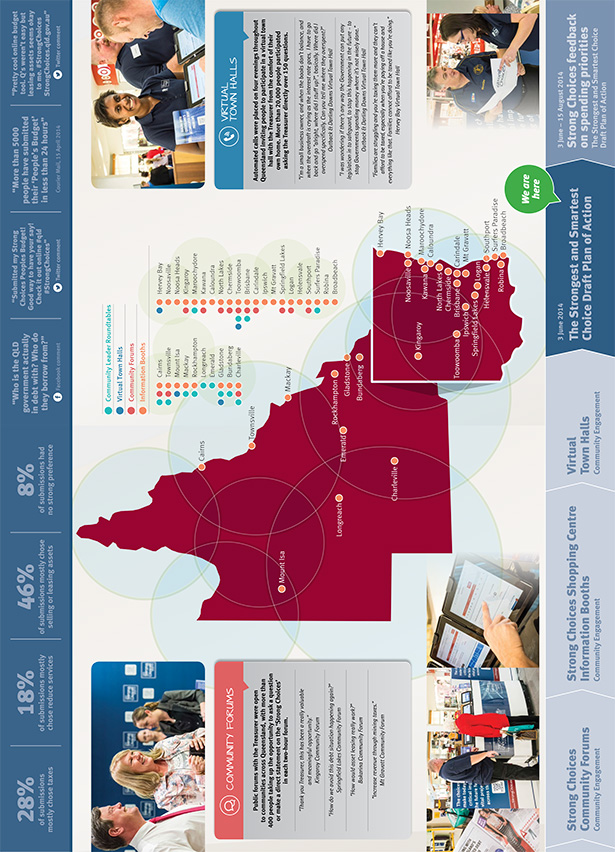
Queensland’s Plan for Secure Finances and a Strong Economy 3 We are here The Strong Choices Process The Strong Choices Process February – April 2014 Community Leader Roundtables Community Leader Engagement From 3 June – 15 August 2014 Strong Choices feedback on spending priorities The Strongest and Smartest Choice Draft Plan of Action September 2014 Final Strong Choices Plan of Action The Strongest and Smartest Choice The Strongest and Smartest Choice is Queensland’s plan for secure finances and a strong economy From 13 April – 19 May 2014 People’s Budget Interactive Tool Strong Choices Community Forums Strong Choices Shopping Centre Information Booths Virtual Town Halls Community Engagement 3 June 2014 The Strongest and Smartest Choice Draft Plan of Action
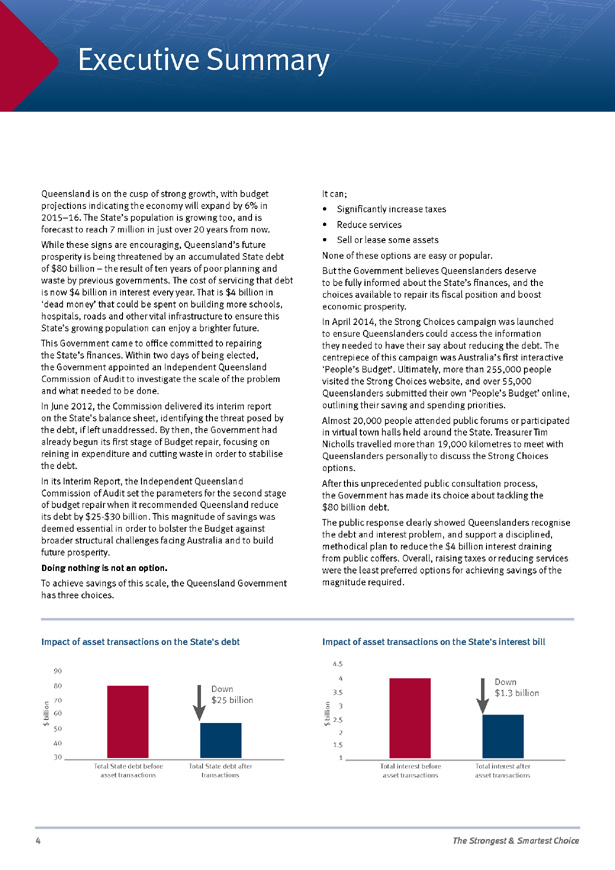
4 The Strongest & Smartest Choice Executive Summary Queensland is on the cusp of strong growth, with budget projections indicating the economy will expand by 6% in 2015–16. The State’s population is growing too, and is forecast to reach 7 million in just over 20 years from now. While these signs are encouraging, Queensland’s future prosperity is being threatened by an accumulated State debt of $80 billion – the result of ten years of poor planning and waste by previous governments. The cost of servicing that debt is now $4 billion in interest every year. That is $4 billion in ‘dead money’ that could be spent on building more schools, hospitals, roads and other vital infrastructure to ensure this State’s growing population can enjoy a brighter future. This Government came to office committed to repairing the State’s finances. Within two days of being elected, the Government appointed an Independent Queensland Commission of Audit to investigate the scale of the problem and what needed to be done. In June 2012, the Commission delivered its interim report on the State’s balance sheet, identifying the threat posed by the debt, if left unaddressed. By then, the Government had already begun its first stage of Budget repair, focusing on reining in expenditure and cutting waste in order to stabilise the debt. In its Interim Report, the Independent Queensland Commission of Audit set the parameters for the second stage of budget repair when it recommended Queensland reduce its debt by $25-$30 billion. This magnitude of savings was deemed essential in order to bolster the Budget against broader structural challenges facing Australia and to build future prosperity. Doing nothing is not an option. To achieve savings of this scale, the Queensland Government has three choices. It can; • Significantly increase taxes • Reduce services • Sell or lease some assets None of these options are easy or popular. But the Government believes Queenslanders deserve to be fully informed about the State’s finances, and the choices available to repair its fiscal position and boost economic prosperity. In April 2014, the Strong Choices campaign was launched to ensure Queenslanders could access the information they needed to have their say about reducing the debt. The centrepiece of this campaign was Australia’s first interactive ‘People’s Budget’. Ultimately, more than 255,000 people visited the Strong Choices website, and over 55,000 Queenslanders submitted their own ‘People’s Budget’ online, outlining their saving and spending priorities. Almost 20,000 people attended public forums or participated in virtual town halls held around the State. Treasurer Tim Nicholls travelled more than 19,000 kilometres to meet with Queenslanders personally to discuss the Strong Choices options. After this unprecedented public consultation process, the Government has made its choice about tackling the $80 billion debt. The public response clearly showed Queenslanders recognise the debt and interest problem, and support a disciplined, methodical plan to reduce the $4 billion interest draining from public coffers. Overall, raising taxes or reducing services were the least preferred options for achieving savings of the magnitude required. Impact of asset transactions on the State’s debt 30 40 50 60 70 80 90 Total State debt before asset transactions $ billion Total State debt after transactions Down $25 billion Impact of asset transactions on the State’s interest bill 1 1.5 2 2.5 3 3.5 4 4.5 Total interest before asset transactions $ billion Total interest after asset transactions Down $1.3 billion
Queensland’s Plan for Secure Finances and a Strong Economy 5 Strong Choices Investment Program Proposed Spending Initiatives $8.6bn over 6 years Future Fund (Natural Disasters) Bus and Train Project Local Government Co-Investment Fund Public Transport Rail Infrastructure Fund Rural and Regional Roads Fund South East Queensland Roads Fund Rural and Regional Economic Development Fund Entrepreneurial and Innovation Fund Future Schools Fund Community Hospitals Fund Cultural Infrastructure Fund After cutting waste, reducing the size of the public service, and lifting some taxes and mining royalties to stabilise the Budget after coming to office, the Government recognises Queenslanders are concerned about service reductions or tax increases. With spending cuts and increased taxes in the 2014-15 Federal Budget, it has become even more important to avoid fuelling cost of living pressures felt by everyday Queenslanders. Now is not the time to burden people with taxes upon taxes, or to reduce services that have already been made more efficient. The State Government has taken this new economic context, framed by the Federal Government’s own debt reduction efforts, into consideration. The Strongest Choice for Queensland is also the Smartest: the one that secures Queensland’s future, without placing an undue burden on Queenslanders in the present. That is why the Government is now proposing a program of asset transactions, in which several Government assets will be transitioned out of State ownership. The means of doing so will vary, depending on the asset. Most transactions will involve either long-term leases or sales. However, in some cases, the Government will propose an innovative option of private sector participation, where the Government will retain ownership of the ordinary shares, with private sector investors funding future capital expenditure. At their current book value, the asset transactions proposed could potentially reduce debt and deliver proceeds to a value of $33.6 billion. Three-quarters of this would be applied to reduce the State’s debt by $25 billion to $55 billion. This new debt level would mean Queensland’s annual interest bill would drop from $4 billion to $2.7 billion. The remaining proceeds would be deposited in the Strong Choices Investment Program, a suite of new infrastructure and investment funds designed to build more schools, hospitals, roads and other vital infrastructure to ensure this State’s growing population can enjoy a brighter future. After a period of further consultation, in which Queenslanders will be invited to nominate projects in their communities that may qualify for funding from the Strong Choices Investment Program, the Government will deliver its final plan for the Strongest and Smartest Choice in September 2014. None of these proposals will be implemented until the Government has taken this methodical and disciplined plan to the next State election. Not everyone will agree with all of the choices this Government has made about how to pay for things into the future. But at least Queenslanders now know we will have funding certainty into the future, so we can invest in the things we need for a growing and ageing population. The Strongest Choice is now the Smartest Choice.
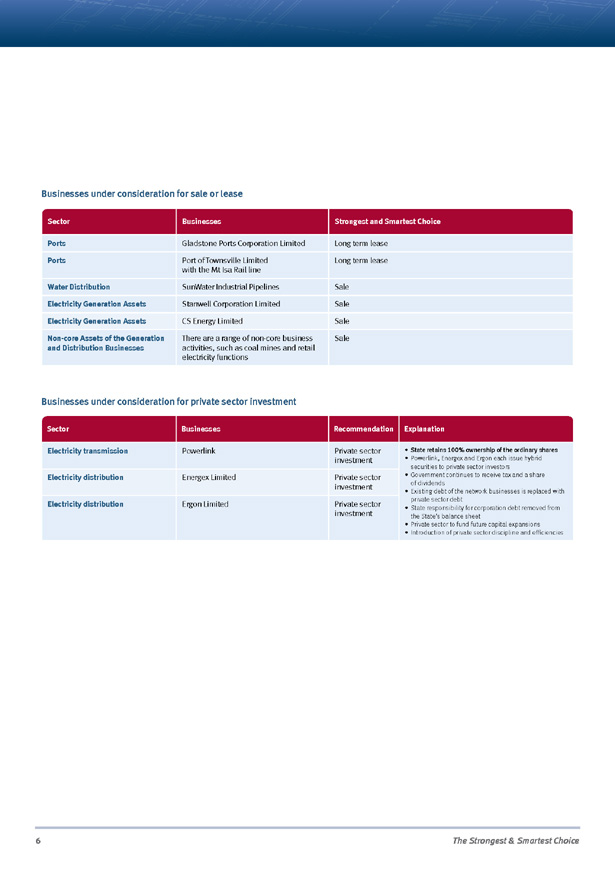
6 The Strongest & Smartest Choice The Problem Businesses under consideration for sale or lease Sector Businesses Strongest and Smartest Choice Ports Gladstone Ports Corporation Limited Long term lease Ports Port of Townsville Limited with the Mt Isa Rail line Long term lease Water Distribution SunWater Industrial Pipelines Sale Electricity Generation Assets Stanwell Corporation Limited Sale Electricity Generation Assets CS Energy Limited Sale Non-core Assets of the Generation and Distribution Businesses There are a range of non-core business activities, such as coal mines and retail electricity functions Sale Businesses under consideration for private sector investment Sector Businesses Recommendation Explanation Electricity transmission Powerlink Private sector investment • State retains 100% ownership of the ordinary shares • Powerlink, Energex and Ergon each issue hybrid securities to private sector investors • Government continues to receive tax and a share of dividends • Existing debt of the network businesses is replaced with private sector debt • State responsibility for corporation debt removed from the State’s balance sheet • Private sector to fund future capital expansions • Introduction of private sector discipline and efficiencies Electricity distribution Energex Limited Private sector investment Electricity distribution Ergon Limited Private sector investment
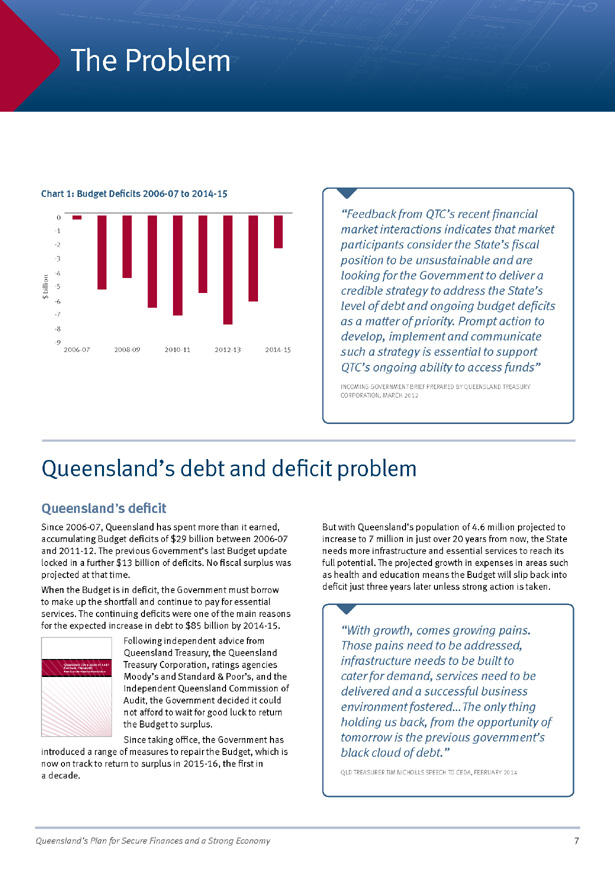
Queensland’s Plan for Secure Finances and a Strong Economy 7 Queensland’s debt and deficit problem Queensland’s deficit Since 2006-07, Queensland has spent more than it earned, accumulating Budget deficits of $29 billion between 2006-07 and 2011-12. The previous Government’s last Budget update locked in a further $13 billion of deficits. No fiscal surplus was projected at that time. When the Budget is in deficit, the Government must borrow to make up the shortfall and continue to pay for essential services. The continuing deficits were one of the main reasons for the expected increase in debt to $85 billion by 2014-15. Following independent advice from Queensland Treasury, the Queensland Treasury Corporation, ratings agencies Moody’s and Standard & Poor’s, and the Independent Queensland Commission of Audit, the Government decided it could not afford to wait for good luck to return the Budget to surplus. Since taking office, the Government has introduced a range of measures to repair the Budget, which is now on track to return to surplus in 2015-16, the first in a decade. But with Queensland’s population of 4.6 million projected to increase to 7 million in just over 20 years from now, the State needs more infrastructure and essential services to reach its full potential. The projected growth in expenses in areas such as health and education means the Budget will slip back into deficit just three years later unless strong action is taken. The Problem Chart 1: Budget Deficits 2006-07 to 2014-15 Queensland Commission of Audit Final Report February 2013—Volume 1 Queensland Commission of Audit Final Report—February 2013 Volume 1—Executive Summary and Recommendations “With growth, comes growing pains. Those pains need to be addressed, infrastructure needs to be built to cater for demand, services need to be delivered and a successful business environment fostered…The only thing holding us back, from the opportunity of tomorrow is the previous government’s black cloud of debt.” QLD TREASURER TIM NICHOLLS SPEECH TO CEDA, FEBRUARY 2014 2006-07 2008-09 2010-11 2012-13 2014-15 -7 -8 $ billion -9 -4 -5 -6 -3 0 -1 -2 “Feedback from QTC’s recent financial market interactions indicates that market participants consider the State’s fiscal position to be unsustainable and are looking for the Government to deliver a credible strategy to address the State’s level of debt and ongoing budget deficits as a matter of priority. Prompt action to develop, implement and communicate such a strategy is essential to support QTC’s ongoing ability to access funds” INCOMING GOVERNMENT BRIEF PREPARED BY QUEENSLAND TREASURY CORPORATION, MARCH 2012
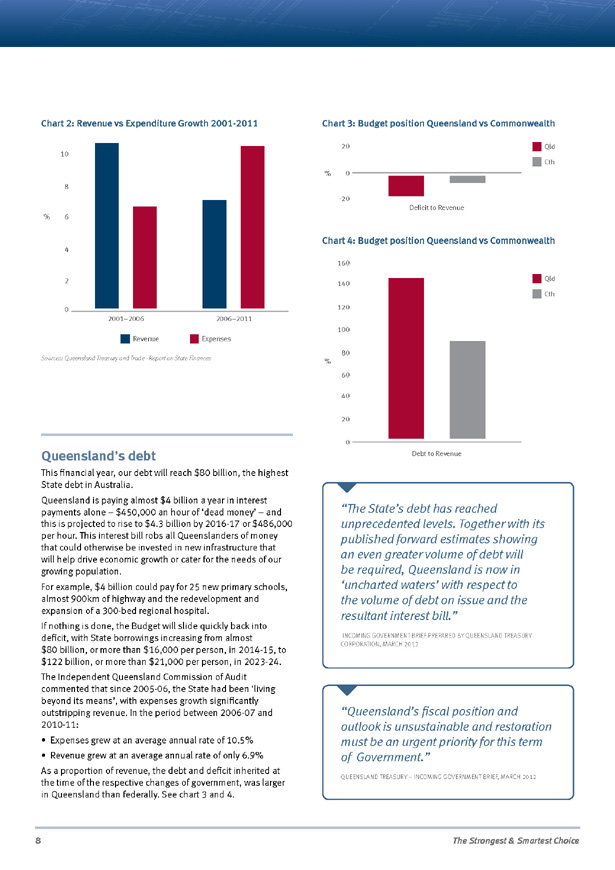
8 The Strongest & Smartest Choice Queensland’s debt This financial year, our debt will reach $80 billion, the highest State debt in Australia. Queensland is paying almost $4 billion a year in interest payments alone – $450,000 an hour of ‘dead money’ – and this is projected to rise to $4.3 billion by 2016-17 or $486,000 per hour. This interest bill robs all Queenslanders of money that could otherwise be invested in new infrastructure that will help drive economic growth or cater for the needs of our growing population. For example, $4 billion could pay for 25 new primary schools, almost 900km of highway and the redevelopment and expansion of a 300-bed regional hospital. If nothing is done, the Budget will slide quickly back into deficit, with State borrowings increasing from almost $80 billion, or more than $16,000 per person, in 2014-15, to $122 billion, or more than $21,000 per person, in 2023-24. The Independent Queensland Commission of Audit commented that since 2005-06, the State had been ‘living beyond its means’, with expenses growth significantly outstripping revenue. In the period between 2006-07 and 2010-11: • Expenses grew at an average annual rate of 10.5% • Revenue grew at an average annual rate of only 6.9% As a proportion of revenue, the debt and deficit inherited at the time of the respective changes of government, was larger in Queensland than federally. See chart 3 and 4. Debt to Revenue 0 20 40 60 % 80 100 120 140 160 Qld Cth 2001–2006 0 2 4 % 6 8 10 12 2006–2011 Revenue Revenue vs Expenditure Growth Expenses Chart 2: Revenue vs Expenditure Growth 2001-2011 Chart 3: Budget position Queensland vs Commonwealth Chart 4: Budget position Queensland vs Commonwealth “The State’s debt has reached unprecedented levels. Together with its published forward estimates showing an even greater volume of debt will be required, Queensland is now in ‘uncharted waters’ with respect to the volume of debt on issue and the resultant interest bill.” INCOMING GOVERNMENT BRIEF PREPARED BY QUEENSLAND TREASURY CORPORATION, MARCH 2012 “Queensland’s fiscal position and outlook is unsustainable and restoration must be an urgent priority for this term of Government.” QUEENSLAND TREASURY – INCOMING GOVERNMENT BRIEF, MARCH 2012 Sources: Queensland Treasury and Trade—Report on State Finances Deficit to Revenue 0 20 -20 % Qld Cth
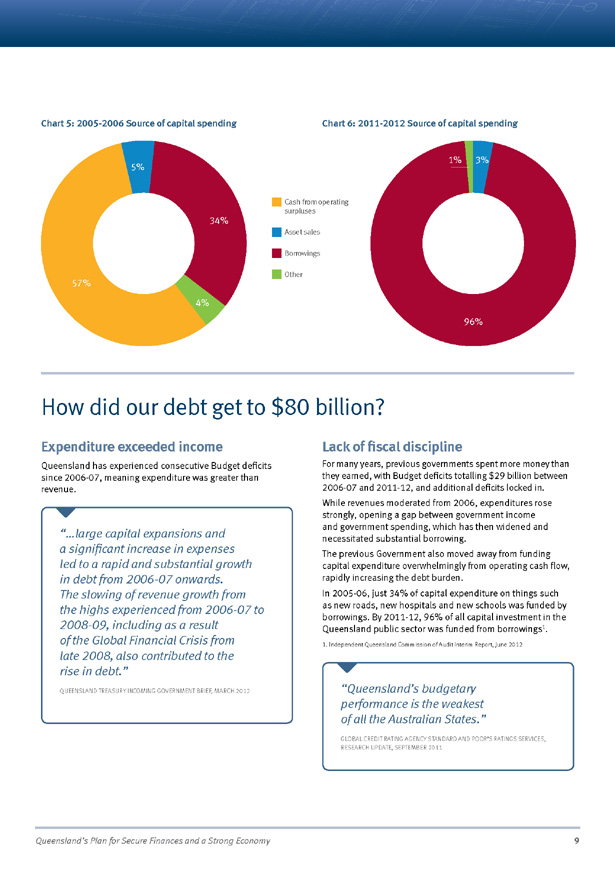
Queensland’s Plan for Secure Finances and a Strong Economy 9 How did our debt get to $80 billion? Expenditure exceeded income Queensland has experienced consecutive Budget deficits since 2006-07, meaning expenditure was greater than revenue. Lack of fiscal discipline For many years, previous governments spent more money than they earned, with Budget deficits totalling $29 billion between 2006-07 and 2011-12, and additional deficits locked in. While revenues moderated from 2006, expenditures rose strongly, opening a gap between government income and government spending, which has then widened and necessitated substantial borrowing. The previous Government also moved away from funding capital expenditure overwhelmingly from operating cash flow, rapidly increasing the debt burden. In 2005-06, just 34% of capital expenditure on things such as new roads, new hospitals and new schools was funded by borrowings. By 2011-12, 96% of all capital investment in the Queensland public sector was funded from borrowings1. 1. Independent Queensland Commission of Audit Interim Report, June 2012 Chart 5: 2005-2006 Source of capital spending Chart 6: 2011-2012 Source of capital spending Other 2005-2006 Source of capital spending 2011-2012 Source of capital spending Borrowings Asset sales Cash from operating surpluses 34% 4% 57% 5% 96% 1% 3% “…large capital expansions and a significant increase in expenses led to a rapid and substantial growth in debt from 2006-07 onwards. The slowing of revenue growth from the highs experienced from 2006-07 to 2008-09, including as a result of the Global Financial Crisis from late 2008, also contributed to the rise in debt.” QUEENSLAND TREASURY INCOMING GOVERNMENT BRIEF, MARCH 2012 “Queensland’s budgetary performance is the weakest of all the Australian States.” GLOBAL CREDIT RATING AGENCY STANDARD AND POOR’S RATINGS SERVICES, RESEARCH UPDATE, SEPTEMBER 2011
10 The Strongest & Smartest Choice The Independent Queensland Commission of Audit regarded the previous Government’s forward estimates as overly optimistic. In particular, the Commission noted that Budget improvement was reliant on the following assumptions: • 14% annual growth in transfer duty year on year from 2013-14 to 2015-16, compared to average growth rates of 5% in the years following the events in the international economy in 2008 • A rapid deceleration in employee expenses growth from average annual growth of 9.6% since 2005-06 to 3.7% over the forward estimates • A decline in net capital expenditure from $4.6 billion in 2012-13 to less than $1 billion in 2015-16 The Commission also noted that optimistic royalty forecasts were a key driver of growth in revenue estimates. As royalty revenue is a highly volatile item, the Commission considered that a conservative bias should be applied in forecasting this item, given the risks and uncertainties involved. The structural budget deficit led to an increase in borrowing needed to fund core government services (especially in the non-Government owned corporations sector) which caused the loss of Queensland’s AAA credit rating in 2009. Revenue challenges Economic growth has strong links to Government revenues, and all other things being equal, improvements in economic growth will improve the State Budget position. However, in 2014-15, it is estimated that 47% of Queensland’s revenue will be sourced from Commonwealth payments through GST distribution and payments for specific purposes. Less than one-third of Queensland’s revenue is sourced from State taxation and royalties. This means that, for example, a 50% increase in Queensland’s tax and royalty collections would only increase total State revenue by 15%. In other words, the State’s capacity to raise sufficient revenue through taxation to pay down the debt is severely limited. To raise funds of the magnitude necessary to make a real impact on the debt, tax increases would have to be so large they would threaten economic growth by stifling business expansion and consumer confidence, potentially triggering tens of thousands of job losses. Almost inevitably, tax increases of this scale would also increase cost of living pressures on everyday Queenslanders. “Queensland’s financial position is unsustainable. The State is currently locked into a debilitating cycle of over-expenditure, ever-increasing levels of debt, and crippling increases in debt servicing costs. A major task of fiscal repair is imperative to prevent further damage to the future prosperity of the State.” INDEPENDENT QLD COMMISSION OF AUDIT INTERIM REPORT JUNE 2012
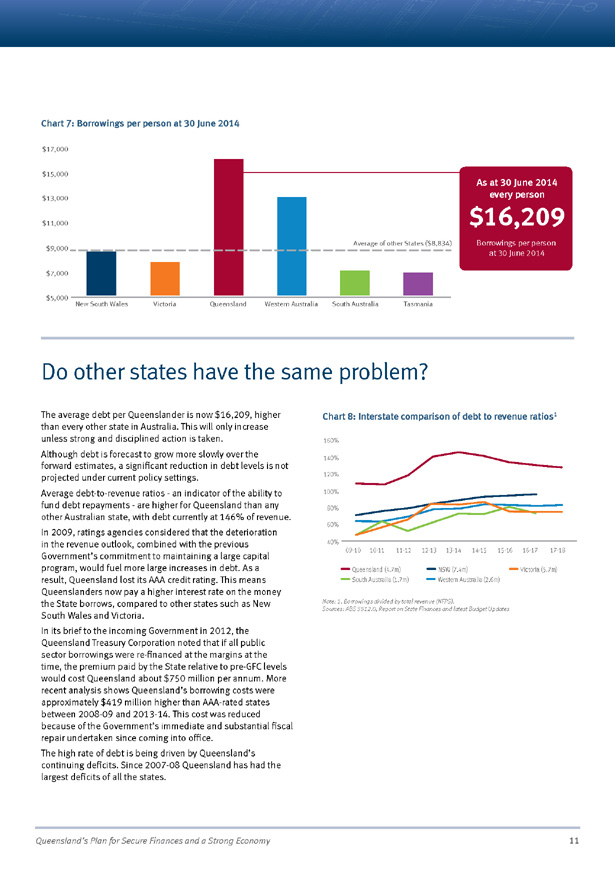
Queensland’s Plan for Secure Finances and a Strong Economy 11 Do other states have the same problem? The average debt per Queenslander is now $16,209, higher than every other state in Australia. This will only increase unless strong and disciplined action is taken. Although debt is forecast to grow more slowly over the forward estimates, a significant reduction in debt levels is not projected under current policy settings. Average debt-to-revenue ratios—an indicator of the ability to fund debt repayments—are higher for Queensland than any other Australian state, with debt currently at 146% of revenue. In 2009, ratings agencies considered that the deterioration in the revenue outlook, combined with the previous Government’s commitment to maintaining a large capital program, would fuel more large increases in debt. As a result, Queensland lost its AAA credit rating. This means Queenslanders now pay a higher interest rate on the money the State borrows, compared to other states such as New South Wales and Victoria. In its brief to the incoming Government in 2012, the Queensland Treasury Corporation noted that if all public sector borrowings were re-financed at the margins at the time, the premium paid by the State relative to pre-GFC levels would cost Queensland about $750 million per annum. More recent analysis shows Queensland’s borrowing costs were approximately $419 million higher than AAA-rated states between 2008-09 and 2013-14. This cost was reduced because of the Government’s immediate and substantial fiscal repair undertaken since coming into office. The high rate of debt is being driven by Queensland’s continuing deficits. Since 2007-08 Queensland has had the largest deficits of all the states. Chart 7: Borrowings per person at 30 June 2014 $5,000 $7,000 $9,000 $11,000 $13,000 $17,000 $15,000 $16,209 New South Wales Victoria Western Australia Average of other States ($8,834) Source: State 2014-15 Budgets and 2013-14 Mid Year Reviews for NFPS borrowings. Population from 2014-15 Commonwealth Budget. Queensland South Australia Tasmania Borrowings per Person by State at 30 June 2014 Borrowings per person at 30 June 2014 As at 30 June 2014 every person 09-10 10-11 15-16 16-17 17-18 1 1 12-13 13-14 14-15 Borrowings divided by total revenue (NFPS) Sources: ABS 5512.0, Report on State Finances and latest Budget Updates 11-12 40% 100% 120% 60% 80% 140% 160% Interstate Comparison of Debt to Revenue Ratios Queensland (4.7m) NSW (7.4m) Victoria (5.7m) South Australia (1.7m) Western Australia (2.6m) Chart 8: Interstate comparison of debt to revenue ratios1 Note: 1. Borrowings divided by total revenue (NFPS). Sources: ABS 5512.0, Report on State Finances and latest Budget Updates
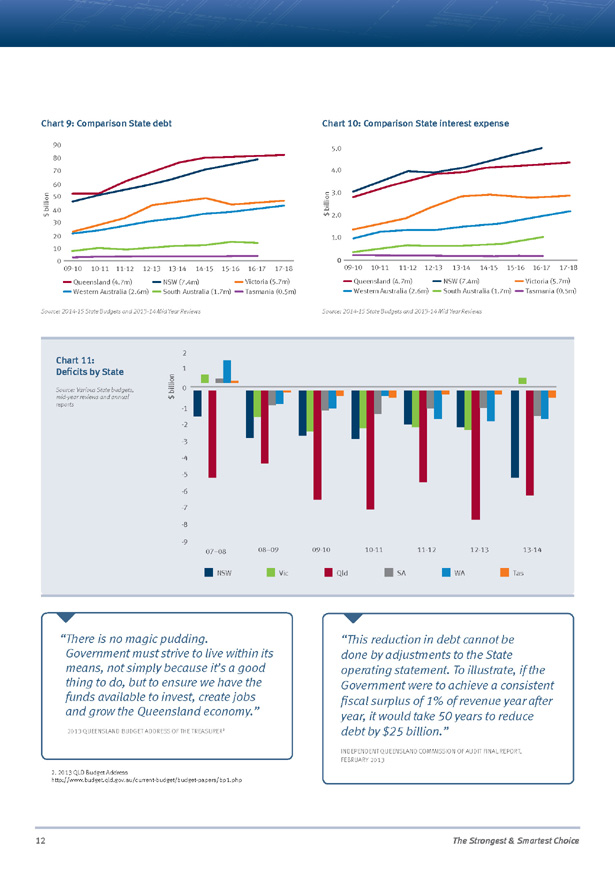
12 The Strongest & Smartest Choice -9 -8 -7 -6 -5 -4 -3 -2 0 -1 1 2 $ billion 07–08 08–09 09-10 10-11 11-12 12-13 13-14 Deficits by State Sources: Various state budgets, mid-year reviews and annual reports. NSW Vic Qld SA WA Tas Chart 9: Comparison State debt Chart 10: Comparison State interest expense Chart 11: Deficits by State South Australia (1.7m) Western Australia (2.6m) Victoria (5.7m) 09-10 10-11 Source: 2014-15 State Budgets and 2013-14 Mid Year Reviews 11-12 12-13 13-14 14-15 15-16 16-17 17-18 0 10 20 40 50 60 70 80 90 30 Comparison State Debt and Population Queensland (4.7m) NSW (7.4m) Tasmania (0.5m) $ billion Source: 2014-15 State Budgets and 2013-14 Mid Year Reviews Source: 2014-15 State Budgets and 2013-14 Mid Year Reviews Source: Various State budgets, mid-year reviews and annual reports 1.0 2.0 3.0 4.0 5.0 Comparison State Interest Expense and Population $ billion 09-10 10-11 11-12 12-13 13-14 14-15 15-16 16-17 17-18 0 South Australia (1.7m) Western Australia (2.6m) Victoria (5.7m) Queensland (4.7m) NSW (7.4m) Tasmania (0.5m) Source: 2014-15 State Budgets and 2013-14 Mid Year Reviews “This reduction in debt cannot be done by adjustments to the State operating statement. To illustrate, if the Government were to achieve a consistent fiscal surplus of 1% of revenue year after year, it would take 50 years to reduce debt by $25 billion.” INDEPENDENT QUEENSLAND COMMISSION OF AUDIT FINAL REPORT, FEBRUARY 2013 “ There is no magic pudding. Government must strive to live within its means, not simply because it’s a good thing to do, but to ensure we have the funds available to invest, create jobs and grow the Queensland economy.” 2013 QUEENSLAND BUDGET ADDRESS OF THE TREASURER2 2. 2013 QLD Budget Address http://www.budget.qld.gov.au/current-budget/budget-papers/bp1.php
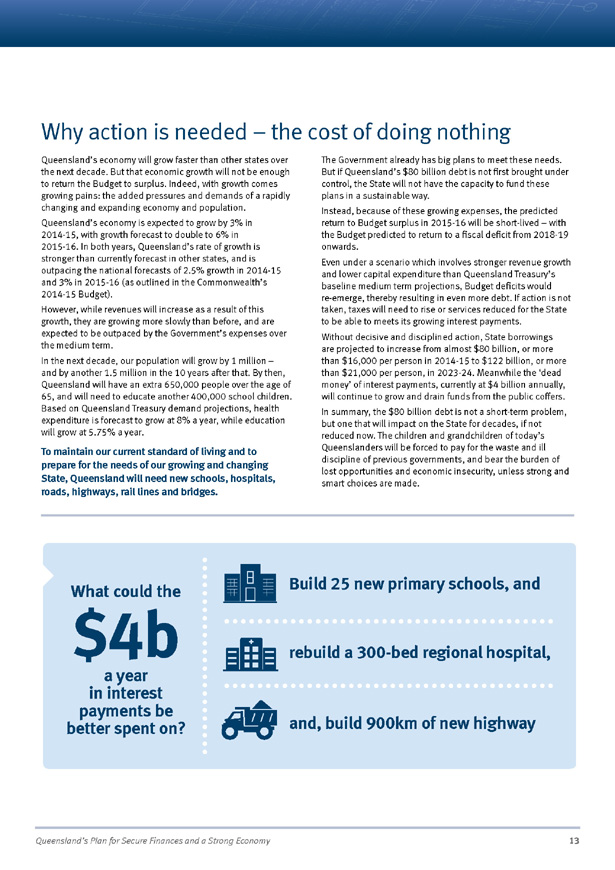
Queensland’s Plan for Secure Finances and a Strong Economy 13 Why action is needed – the cost of doing nothing Queensland’s economy will grow faster than other states over the next decade. But that economic growth will not be enough to return the Budget to surplus. Indeed, with growth comes growing pains: the added pressures and demands of a rapidly changing and expanding economy and population. Queensland’s economy is expected to grow by 3% in 2014-15, with growth forecast to double to 6% in 2015-16. In both years, Queensland’s rate of growth is stronger than currently forecast in other states, and is outpacing the national forecasts of 2.5% growth in 2014-15 and 3% in 2015-16 (as outlined in the Commonwealth’s 2014-15 Budget). However, while revenues will increase as a result of this growth, they are growing more slowly than before, and are expected to be outpaced by the Government’s expenses over the medium term. In the next decade, our population will grow by 1 million – and by another 1.5 million in the 10 years after that. By then, Queensland will have an extra 650,000 people over the age of 65, and will need to educate another 400,000 school children. Based on Queensland Treasury demand projections, health expenditure is forecast to grow at 8% a year, while education will grow at 5.75% a year. To maintain our current standard of living and to prepare for the needs of our growing and changing State, Queensland will need new schools, hospitals, roads, highways, rail lines and bridges. The Government already has big plans to meet these needs. But if Queensland’s $80 billion debt is not first brought under control, the State will not have the capacity to fund these plans in a sustainable way. Instead, because of these growing expenses, the predicted return to Budget surplus in 2015-16 will be short-lived – with the Budget predicted to return to a fiscal deficit from 2018-19 onwards. Even under a scenario which involves stronger revenue growth and lower capital expenditure than Queensland Treasury’s baseline medium term projections, Budget deficits would re-emerge, thereby resulting in even more debt. If action is not taken, taxes will need to rise or services reduced for the State to be able to meets its growing interest payments. Without decisive and disciplined action, State borrowings are projected to increase from almost $80 billion, or more than $16,000 per person in 2014-15 to $122 billion, or more than $21,000 per person, in 2023-24. Meanwhile the ‘dead money’ of interest payments, currently at $4 billion annually, will continue to grow and drain funds from the public coffers. In summary, the $80 billion debt is not a short-term problem, but one that will impact on the State for decades, if not reduced now. The children and grandchildren of today’s Queenslanders will be forced to pay for the waste and ill discipline of previous governments, and bear the burden of lost opportunities and economic insecurity, unless strong and smart choices are made. What could the $4b a year in interest payments be better spent on? Build 25 new primary schools, and rebuild a 300-bed regional hospital, and, build 900km of new highway
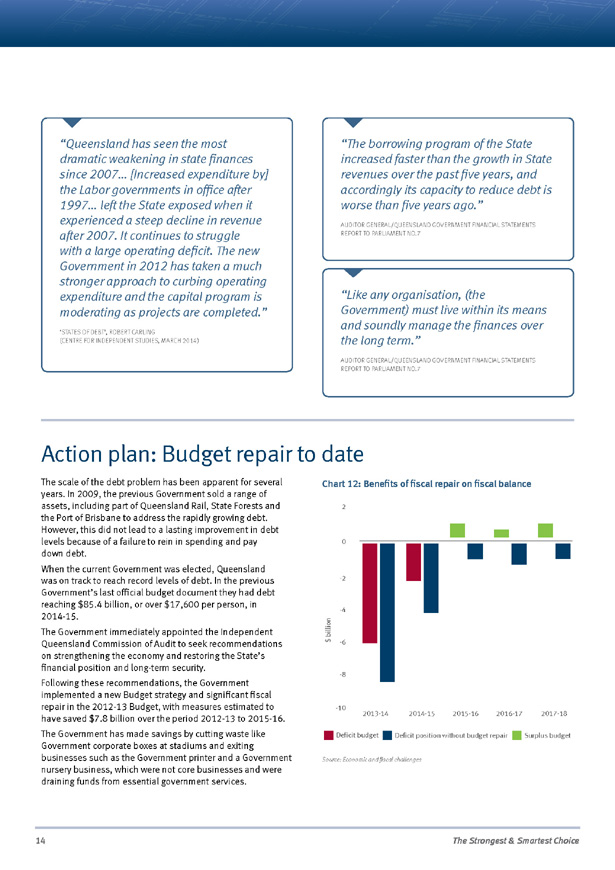
14 The Strongest & Smartest Choice Action plan: Budget repair to date The scale of the debt problem has been apparent for several years. In 2009, the previous Government sold a range of assets, including part of Queensland Rail, State Forests and the Port of Brisbane to address the rapidly growing debt. However, this did not lead to a lasting improvement in debt levels because of a failure to rein in spending and pay down debt. When the current Government was elected, Queensland was on track to reach record levels of debt. In the previous Government’s last official budget document they had debt reaching $85.4 billion, or over $17,600 per person, in 2014-15. The Government immediately appointed the Independent Queensland Commission of Audit to seek recommendations on strengthening the economy and restoring the State’s financial position and long-term security. Following these recommendations, the Government implemented a new Budget strategy and significant fiscal repair in the 2012-13 Budget, with measures estimated to have saved $7.8 billion over the period 2012-13 to 2015-16. The Government has made savings by cutting waste like Government corporate boxes at stadiums and exiting businesses such as the Government printer and a Government nursery business, which were not core businesses and were draining funds from essential government services. -10 -8 -6 -4 -2 0 2 $ billion 2013-14 2014-15 2015-16 2016-17 2017-18 Benefits of fiscal repair on Fiscal Balance Source: Economic and Fiscal Challenges Deficit budget Deficit position without budget repair Surplus budget Chart 12: Benefits of fiscal repair on fiscal balance Source: Economic and fiscal challenges “Queensland has seen the most dramatic weakening in state finances since 2007… [Increased expenditure by] the Labor governments in office after 1997… left the State exposed when it experienced a steep decline in revenue after 2007. It continues to struggle with a large operating deficit. The new Government in 2012 has taken a much stronger approach to curbing operating expenditure and the capital program is moderating as projects are completed.” ‘STATES OF DEBT’, ROBERT CARLING (CENTRE FOR INDEPENDENT STUDIES, MARCH 2014) “The borrowing program of the State increased faster than the growth in State revenues over the past five years, and accordingly its capacity to reduce debt is worse than five years ago.” AUDITOR GENERAL/QUEENSLAND GOVERNMENT FINANCIAL STATEMENTS REPORT TO PARLIAMENT NO.7 “Like any organisation, (the Government) must live within its means and soundly manage the finances over the long term.” AUDITOR GENERAL/QUEENSLAND GOVERNMENT FINANCIAL STATEMENTS REPORT TO PARLIAMENT NO.7
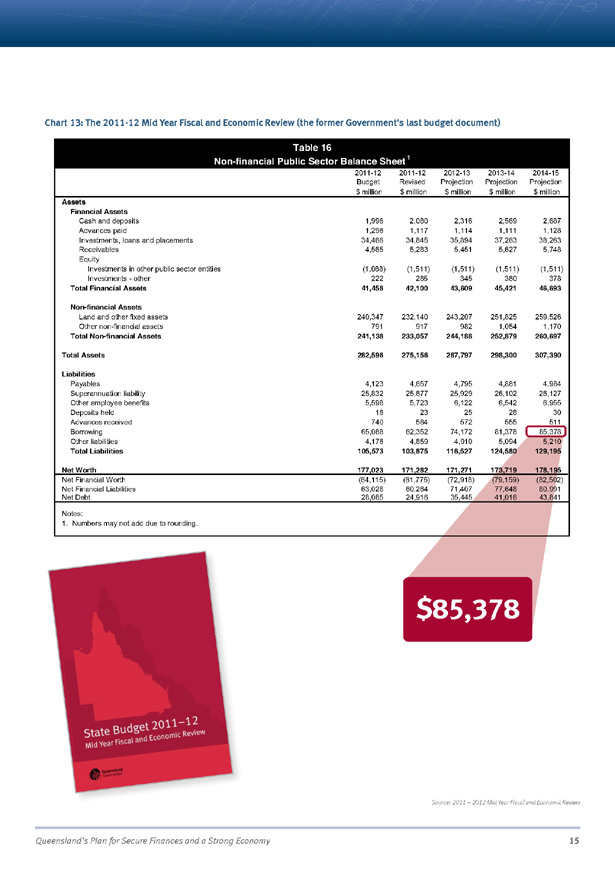
Queensland’s Plan for Secure Finances and a Strong Economy 15 Chart 13: The 2011-12 Mid Year Fiscal and Economic Review (the former Government’s last budget document) Source: 2011 – 2012 Mid Year Fiscal and Economic Review Assets Financial Assets Cash and deposits 1,996 2,080 2,316 2,569 2,687 Advances paid 1,296 1,117 1,114 1,111 1,128 Investments, loans and placements 34,466 34,845 35,894 37,263 38,263 Receivables 4,565 5,283 5,451 5,627 5,748 Equity Investments in other public sector entities (1,088) (1,511) (1,511) (1,511) (1,511) Investments—other 222 285 345 360 378 Total Financial Assets 41,458 42,100 43,609 45,421 46,693 Non-financial Assets Land and other fixed assets 240,347 232,140 243,207 251,825 259,526 Other non-financial assets 791 917 982 1,054 1,170 Total Non-financial Assets 241,138 233,057 244,188 252,879 260,697 Total Assets 282,596 275,156 287,797 298,300 307,390 Liabilities Payables 4,123 4,657 4,795 4,881 4,984 Superannuation liability 25,832 25,677 25,929 26,102 26,127 Other employee benefits 5,598 5,723 6,122 6,542 6,955 Deposits held 16 23 25 28 30 Advances received 740 584 572 555 511 Borrowing 65,088 62,352 74,172 81,378 85,378 Other liabilities 4,176 4,859 4,910 5,094 5,210 Total Liabilities 105,573 103,875 116,527 124,580 129,195 Net Worth 177,023 171,282 171,271 173,719 178,195 Net Financial Worth (64,115) (61,775) (72,918) (79,159) (82,502) Net Financial Liabilities 63,028 60,264 71,407 77,648 80,991 Net Debt 28,085 24,916 35,445 41,016 43,841 Notes: 1. Numbers may not add due to rounding. $ million $ million 2013-14 Projection $ million $ million 2011-12 Revised $ million Table 16 Non-financial Public Sector Balance Sheet 1 2011-12 Budget 2012-13 Projection 2014-15 Projection $
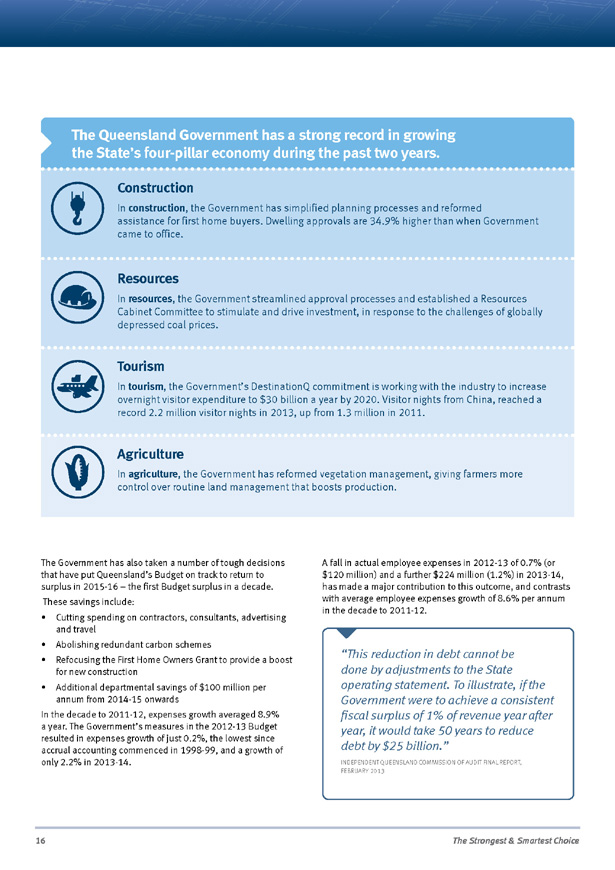
16 The Strongest & Smartest Choice The Government has also taken a number of tough decisions that have put Queensland’s Budget on track to return to surplus in 2015-16 – the first Budget surplus in a decade. These savings include: • Cutting spending on contractors, consultants, advertising and travel • Abolishing redundant carbon schemes • Refocusing the First Home Owners Grant to provide a boost for new construction • Additional departmental savings of $100 million per annum from 2014-15 onwards In the decade to 2011-12, expenses growth averaged 8.9% a year. The Government’s measures in the 2012-13 Budget resulted in expenses growth of just 0.2%, the lowest since accrual accounting commenced in 1998-99, and a growth of only 2.2% in 2013-14. A fall in actual employee expenses in 2012-13 of 0.7% (or $120 million) and a further $224 million (1.2%) in 2013-14, has made a major contribution to this outcome, and contrasts with average employee expenses growth of 8.6% per annum in the decade to 2011-12. The Queensland Government has a strong record in growing the State’s four-pillar economy during the past two years. Construction In construction, the Government has simplified planning processes and reformed assistance for first home buyers. Dwelling approvals are 34.9% higher than when Government came to office. Resources In resources, the Government streamlined approval processes and established a Resources Cabinet Committee to stimulate and drive investment, in response to the challenges of globally depressed coal prices. Tourism In tourism, the Government’s DestinationQ commitment is working with the industry to increase overnight visitor expenditure to $30 billion a year by 2020. Visitor nights from China, reached a record 2.2 million visitor nights in 2013, up from 1.3 million in 2011. Agriculture In agriculture, the Government has reformed vegetation management, giving farmers more control over routine land management that boosts production. “This reduction in debt cannot be done by adjustments to the State operating statement. To illustrate, if the Government were to achieve a consistent fiscal surplus of 1% of revenue year after year, it would take 50 years to reduce debt by $25 billion.” INDEPENDENT QUEENSLAND COMMISSION OF AUDIT FINAL REPORT, FEBRUARY 201385,3
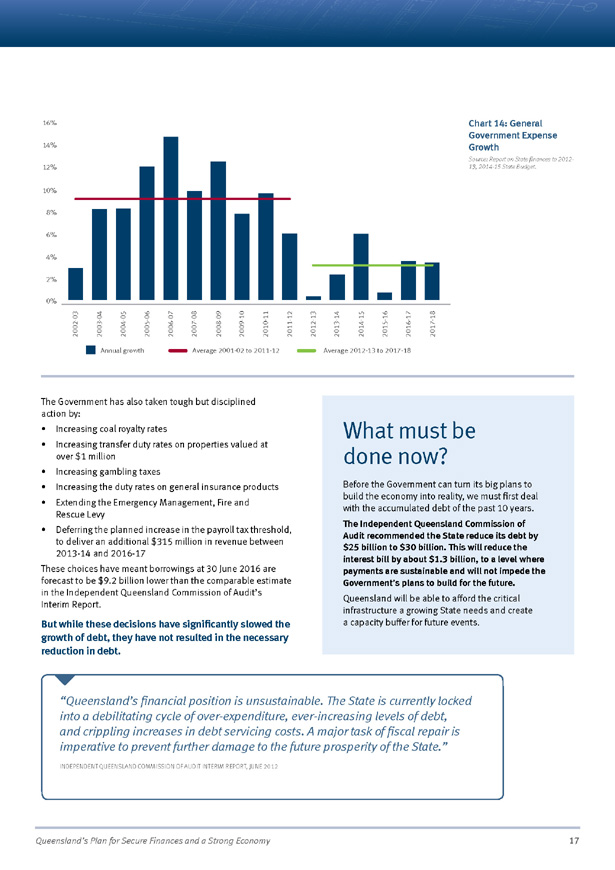
Queensland’s Plan for Secure Finances and a Strong Economy 17 The Government has also taken tough but disciplined action by: • Increasing coal royalty rates • Increasing transfer duty rates on properties valued at over $1 million • Increasing gambling taxes • Increasing the duty rates on general insurance products • Extending the Emergency Management, Fire and Rescue Levy • Deferring the planned increase in the payroll tax threshold, to deliver an additional $315 million in revenue between 2013-14 and 2016-17 These choices have meant borrowings at 30 June 2016 are forecast to be $9.2 billion lower than the comparable estimate in the Independent Queensland Commission of Audit’s Interim Report. But while these decisions have significantly slowed the growth of debt, they have not resulted in the necessary reduction in debt. “Queensland’s financial position is unsustainable. The State is currently locked into a debilitating cycle of over-expenditure, ever-increasing levels of debt, and crippling increases in debt servicing costs. A major task of fiscal repair is imperative to prevent further damage to the future prosperity of the State.” INDEPENDENT QUEENSLAND COMMISSION OF AUDIT INTERIM REPORT, JUNE 2012 Chart 14: General Government Expense Growth Source: Report on State finances to 2012- 13, 2014-15 State Budget. 4% 2% 0% 6% 8% 10% 12% 14% 16% 2002-03 2003-04 2004-05 2005-06 2006-07 2007-08 2008-09 2009-10 2010-11 2011-12 2012-13 2013-14 2014-15 2015-16 2016-17 2017-18 General Government Expense Growth Annual growth Average 2001-02 to 2011-12 Average 2012-13 to 2017-18 Sources: Report on State Finances to 2012-13, 2014-15 State Budget What must be done now? Before the Government can turn its big plans to build the economy into reality, we must first deal with the accumulated debt of the past 10 years. The Independent Queensland Commission of Audit recommended the State reduce its debt by $25 billion to $30 billion. This will reduce the interest bill by about $1.3 billion, to a level where payments are sustainable and will not impede the Government’s plans to build for the future. Queensland will be able to afford the critical infrastructure a growing State needs and create a capacity buffer for future events.7
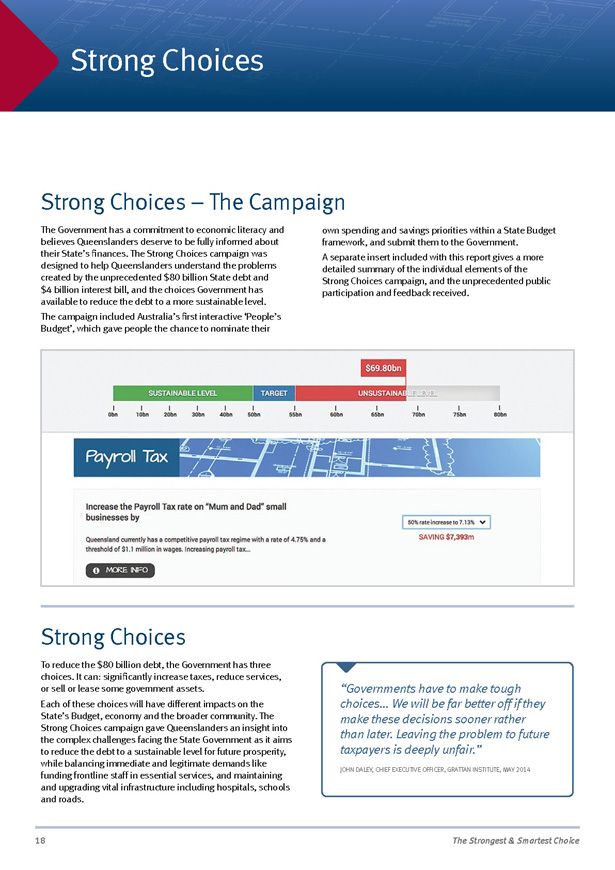
18 The Strongest & Smartest Choice Strong Choices Strong Choices – The Campaign The Government has a commitment to economic literacy and believes Queenslanders deserve to be fully informed about their State’s finances. The Strong Choices campaign was designed to help Queenslanders understand the problems created by the unprecedented $80 billion State debt and $4 billion interest bill, and the choices Government has available to reduce the debt to a more sustainable level. The campaign included Australia’s first interactive ‘People’s Budget’, which gave people the chance to nominate their own spending and savings priorities within a State Budget framework, and submit them to the Government. A separate insert included with this report gives a more detailed summary of the individual elements of the Strong Choices campaign, and the unprecedented public participation and feedback received. Strong Choices To reduce the $80 billion debt, the Government has three choices. It can: significantly increase taxes, reduce services, or sell or lease some government assets. Each of these choices will have different impacts on the State’s Budget, economy and the broader community. The Strong Choices campaign gave Queenslanders an insight into the complex challenges facing the State Government as it aims to reduce the debt to a sustainable level for future prosperity, while balancing immediate and legitimate demands like funding frontline staff in essential services, and maintaining and upgrading vital infrastructure including hospitals, schools and roads. “Governments have to make tough choices… We will be far better off if they make these decisions sooner rather than later. Leaving the problem to future taxpayers is deeply unfair.” JOHN DALEY, CHIEF EXECUTIVE OFFICER, GRATTAN INSTITUTE, MAY 20148
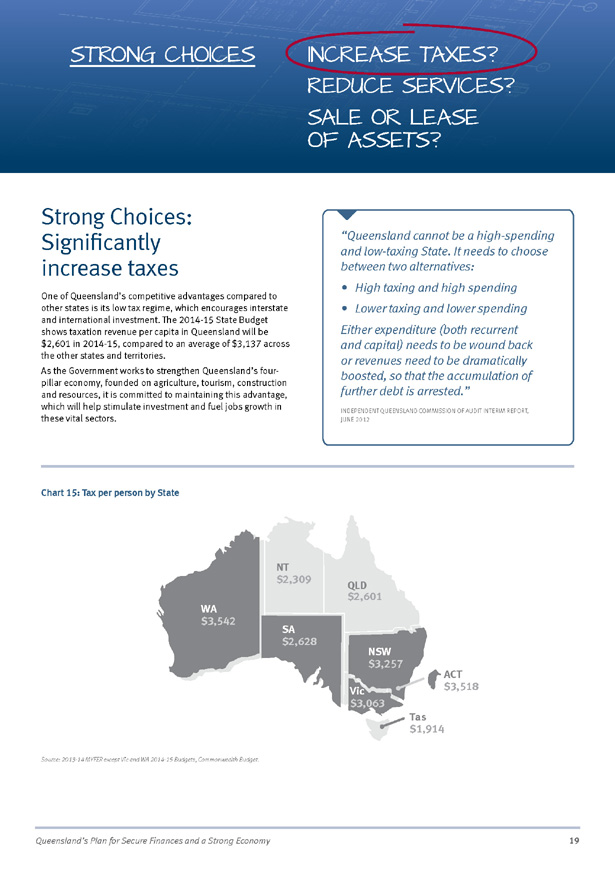
Strong Choices: Significantly increase taxes One of Queensland’s competitive advantages compared to other states is its low tax regime, which encourages interstate and international investment. The 2014-15 State Budget shows taxation revenue per capita in Queensland will be $2,601 in 2014-15, compared to an average of $3,137 across the other states and territories. As the Government works to strengthen Queensland’s fourpillar economy, founded on agriculture, tourism, construction and resources, it is committed to maintaining this advantage, which will help stimulate investment and fuel jobs growth in these vital sectors. “Queensland cannot be a high-spending and low-taxing State. It needs to choose between two alternatives: • High taxing and high spending • Lower taxing and lower spending Either expenditure (both recurrent and capital) needs to be wound back or revenues need to be dramatically boosted, so that the accumulation of further debt is arrested.” INDEPENDENT QUEENSLAND COMMISSION OF AUDIT INTERIM REPORT, JUNE 2012 Queensland’s Plan for Secure Finances and a Strong Economy 19 STRONG CHOICES INCREASE TAXES? REDUCE SERVICES? SALE OR LEASE OF ASSETS? Tax per person by State Source: 2013-14 MYFER except Vic and WA 2014-15 Budgets, Commonwealth Budget $3,542 WA $2,309 NT $3,257 NSW $2,601 QLD $3,063 Vic $1,914 Tas $3,518 ACT $2,628 SA Source: 2013-14 MYFER except Vic and WA 2014-15 Budgets, Commonwealth Budget. Chart 15: Tax per person by State
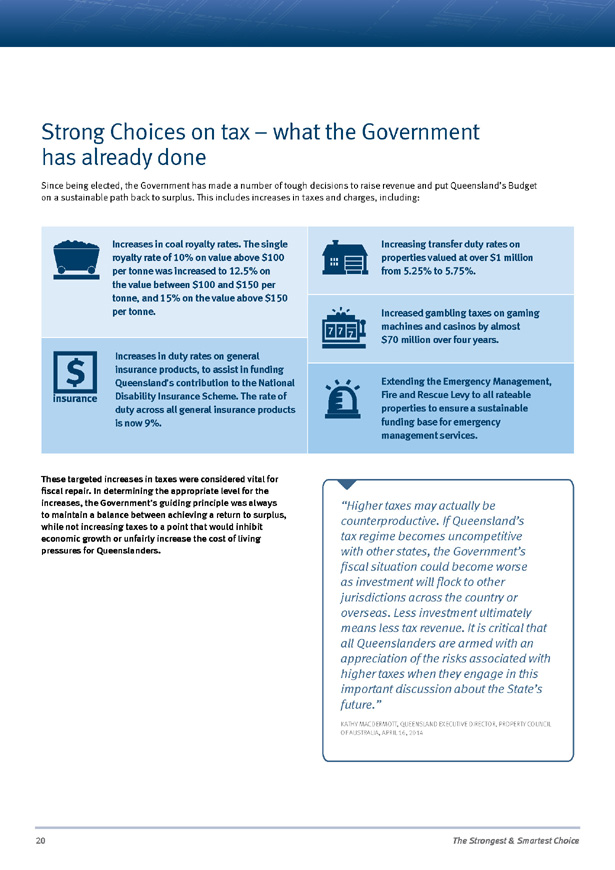
20 The Strongest & Smartest Choice Strong Choices on tax – what the Government has already done Since being elected, the Government has made a number of tough decisions to raise revenue and put Queensland’s Budget on a sustainable path back to surplus. This includes increases in taxes and charges, including: These targeted increases in taxes were considered vital for fiscal repair. In determining the appropriate level for the increases, the Government’s guiding principle was always to maintain a balance between achieving a return to surplus, while not increasing taxes to a point that would inhibit economic growth or unfairly increase the cost of living pressures for Queenslanders. Increases in coal royalty rates. The single royalty rate of 10% on value above $100 per tonne was increased to 12.5% on the value between $100 and $150 per tonne, and 15% on the value above $150 per tonne. Increases in duty rates on general insurance products, to assist in funding Queensland’s contribution to the National Disability Insurance Scheme. The rate of duty across all general insurance products is now 9%. Extending the Emergency Management, Fire and Rescue Levy to all rateable properties to ensure a sustainable funding base for emergency management services. Increasing transfer duty rates on properties valued at over $1 million from 5.25% to 5.75%. Increased gambling taxes on gaming machines and casinos by almost $70 million over four years. “Higher taxes may actually be counterproductive. If Queensland’s tax regime becomes uncompetitive with other states, the Government’s fiscal situation could become worse as investment will flock to other jurisdictions across the country or overseas. Less investment ultimately means less tax revenue. It is critical that all Queenslanders are armed with an appreciation of the risks associated with higher taxes when they engage in this important discussion about the State’s future.” KATHY MACDERMOTT, QUEENSLAND EXECUTIVE DIRECTOR, PROPERTY COUNCIL OF AUSTRALIA, APRIL 16, 2014
Queensland’s Plan for Secure Finances and a Strong Economy 21 The Federal Government has the exclusive power to tax income, while the states raise funds from a relatively small number of narrowly based taxes. State governments have control over revenue primarily from: • State taxes, such as land tax and payroll tax • Revenue from the sale of goods and services • Royalties from the mining of mineral resources The Government is aware many Queenslanders are already experiencing considerable cost of living pressures, and at this time raising taxes would only serve to increase those pressures. Significantly, if increasing taxes was the strong choice used to reduce the $80 billion debt by the target of at least $25 billion, this would require a dramatic 50% increase in the Government’s revenue from taxes and royalties. This would undermine the Government’s commitment to providing a competitive tax environment, while substantially adding to cost of living pressures for everyday Queenslanders and threatening economic growth by discouraging investment around the State. The Strong Choices ‘People’s Budget’ tool demonstrated this, providing Queenslanders with 15 options to increase taxes and royalties. Selecting all of these options would have allowed participants to achieve a debt reduction of up to $58.7 billion over the three years from 2014-15 to 2016-17, which would double tax and royalty collections. The total revenue from taxation and royalties in 2014-15 is currently estimated at only $15.1 billion. Some of the most significant taxation choices within the ‘People’s Budget’ tool were: Payroll Tax Increasing payroll tax (a 50% increase would raise $7.4 billion over three years) would impact “mum and dad” small businesses as it would dramatically increase the cost of doing business and act as a disincentive for investment and job creation. This would have crippling flow-on effects on the whole economy, as businesses would ultimately pass on the increased tax as lower wages or fewer jobs resulting in lost household income. Even on a much smaller scale, an increase in payroll tax would have significant negative effects while having a limited impact on debt reduction. Queensland Treasury modelling shows an increase in the payroll tax rate from the current 4.75% to 6% would raise an extra $1 billion. However the modelling also shows that in the year following the tax increase, Queensland’s economy would be $800 million worse off, and almost 10,000 fewer jobs would be available for Queenslanders. Wage earners predominantly feel the costs of payroll tax increases. Although payroll tax is imposed on employers, it increases the cost of employing labour. In the long run, firms will attempt to maintain profitability by increasing prices and/or cutting staff or otherwise moderating wage growth. This has the effect of pushing the burden of tax increases on to households by reducing real wage growth and fuelling cost of living pressures. The modelling also shows that a reduction in annual wages of $439 for the average Queensland worker would result from an increase in payroll tax. As a result, real consumption in Queensland is projected to be around $1.3 billion lower in 2025 than it otherwise would have been. This is equivalent to a loss of $221 for every Queenslander. Property Taxes Increasing property taxes through transfer duty (a 75% increase would raise $6.2 billion over three years, removing the family home concession would raise $1.1 billion over three years, removing first home buyer concessions would raise $736 million over three years) would reduce the affordability of homes for families and first home buyers, making it more expensive for Queenslanders to move house to follow job opportunities or to downsize as their needs change. Impact of further increasing taxes Summary A significant increase in taxes, to reduce debt by at least $25 billion would: • Require a doubling of total state taxation, which would dramatically increase the cost of doing business and discourage investment and job creation • Result in an $800 million hit to the Queensland economy, when it can least afford it • Mean the loss of 10,000 jobs • Severely reduce housing affordability for families and first home buyers together with reducing construction activity • Make Queensland based resource companies less competitive, forcing them to consider their operations and • Make the family motor vehicle registration costs the highest in the nation
22 The Strongest & Smartest Choice “The coal sector for example has shed over 8,000 jobs in Queensland in the face of some of the most challenging business conditions in decades. There can be no dispute that the best means of boosting the resources sector contribution to the state’s fiscal repair task is the pursuit of policies to promote sector growth, not a resort to jobdestroying tax increases… Queensland already sits amongst the regions with the top taxation rates globally.” QUEENSLAND RESOURCES COUNCIL STATEMENT, APRIL 2014 “Any move to increase royalties will further impact operations and communities in the form of job losses and mine closures. It will place significant pressure on the industry and its shareholders and will undermine the confidence of mining houses considering investments in Queensland.” JOINT LETTER TO TREASURER TIM NICHOLLS FROM HEADS OF 19 MAJOR COAL COMPANIES, 7 MAY 2014 Increased transfer duty would also discourage investment activity in commercial property and businesses. Increasing land tax (a 75% increase would raise $2.4 billion over three years) or applying land tax to all properties ($10.55 billion over three years) would increase the cost of property ownership, including the family home, and add cost pressures to homeowners, businesses and renters. Royalties The State earns royalties from mining and petroleum projects in Queensland, with over 75% of royalty revenue coming from coal mines. Increasing royalties (a 75% increase in all royalties would raise $8.8 billion over three years) would make Queensland based resources companies less competitive on the world market. Ultimately, these companies would choose to close mines, and abandon the development of others. This would also have an indirect impact on businesses as industries that support the mining industry would contract, households would be impacted through the associated loss of jobs and the overall economy would experience a reduction of investment and the loss of exports would reduce economic growth. Analysis conducted for the Queensland Resources Council found that, even without an increase in royalty rates, low coal prices mean that 10% of Queensland’s coal is currently being produced at a significant loss. Motor Vehicle Registration Fees Increasing vehicle registration fees (doubling registration fees would raise $5.9 billion over three years) would increase the cost of running the family car as well as transport and business costs, resulting in cost of living increases for Queenslanders. Doubling the fee would increase the cost of registration for a 6 cylinder family car from $492 to $984. This would compare with a registration cost of $482 in New South Wales or $238 in Victoria. It is expected that businesses, in particular, would seek to take advantage of this differential by registering vehicles in other states, leading to revenue leakage from Queensland.
www.StrongChoices.qld.gov.au Great state. Great opportunity. HOW YOU HAD YOUR SAY STRONG CHOICES CONSULTATION REPORT
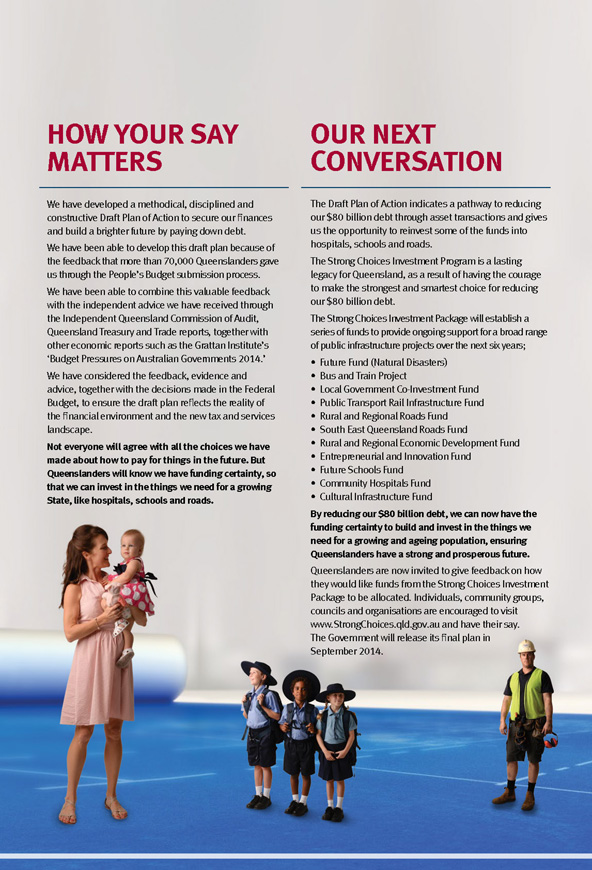
We have developed a methodical, disciplined and constructive Draft Plan of Action to secure our finances and build a brighter future by paying down debt. We have been able to develop this draft plan because of the feedback that more than 70,000 Queenslanders gave us through the People’s Budget submission process. We have been able to combine this valuable feedback with the independent advice we have received through the Independent Queensland Commission of Audit, Queensland Treasury and Trade reports, together with other economic reports such as the Grattan Institute’s ‘Budget Pressures on Australian Governments 2014.’ We have considered the feedback, evidence and advice, together with the decisions made in the Federal Budget, to ensure the draft plan reflects the reality of the financial environment and the new tax and services landscape. Not everyone will agree with all the choices we have made about how to pay for things in the future. But Queenslanders will know we have funding certainty, so that we can invest in the things we need for a growing State, like hospitals, schools and roads. The Draft Plan of Action indicates a pathway to reducing our $80 billion debt through asset transactions and gives us the opportunity to reinvest some of the funds into hospitals, schools and roads. The Strong Choices Investment Program is a lasting legacy for Queensland, as a result of having the courage to make the strongest and smartest choice for reducing our $80 billion debt. The Strong Choices Investment Package will establish a series of funds to provide ongoing support for a broad range of public infrastructure projects over the next six years; • Future Fund (Natural Disasters) • Bus and Train Project • Local Government Co-Investment Fund • Public Transport Rail Infrastructure Fund • Rural and Regional Roads Fund • South East Queensland Roads Fund • Rural and Regional Economic Development Fund • Entrepreneurial and Innovation Fund • Future Schools Fund • Community Hospitals Fund • Cultural Infrastructure Fund By reducing our $80 billion debt, we can now have the funding certainty to build and invest in the things we need for a growing and ageing population, ensuring Queenslanders have a strong and prosperous future. Queenslanders are now invited to give feedback on how they would like funds from the Strong Choices Investment Package to be allocated. Individuals, community groups, councils and organisations are encouraged to visit www.StrongChoices.qld.gov.au and have their say. The Government will release its final plan in September 2014. HOW YOUR SAY MATTERS OUR NEXT CONVERSATION
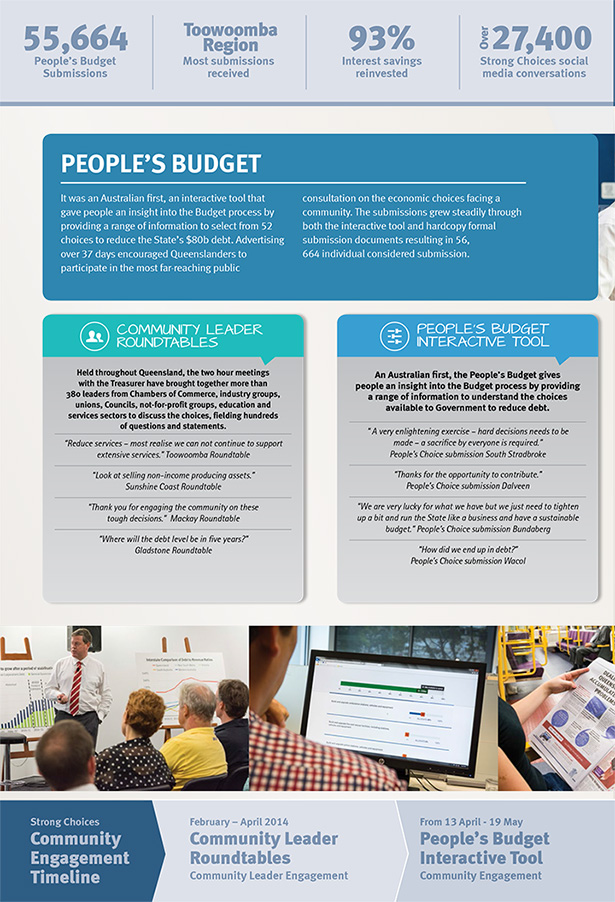
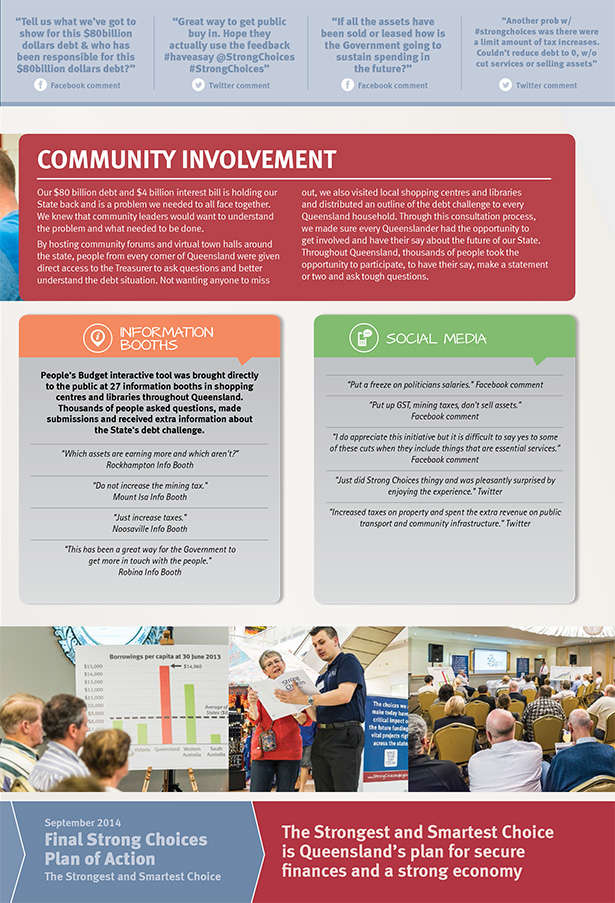
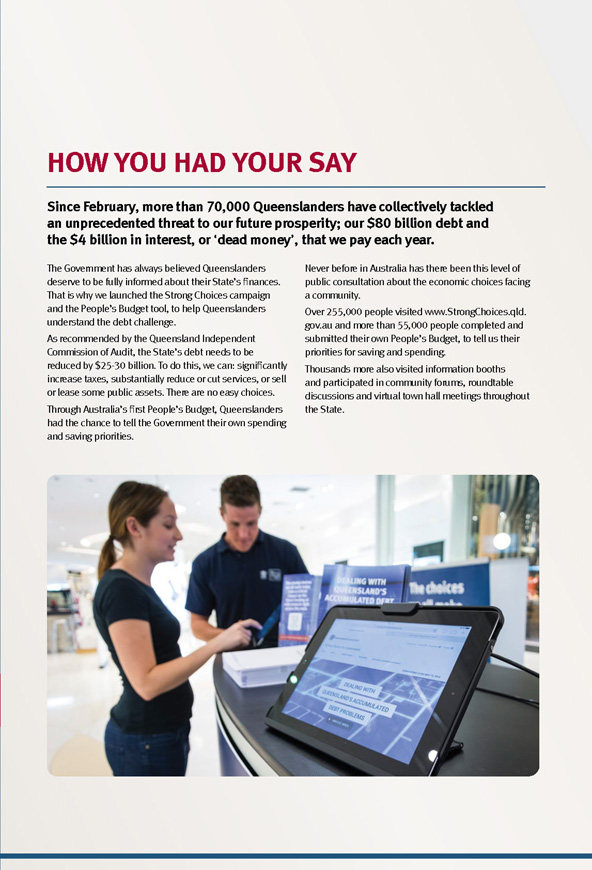
HOW YOU HAD YOUR SAY The Government has always believed Queenslanders deserve to be fully informed about their State’s finances. That is why we launched the Strong Choices campaign and the People’s Budget tool, to help Queenslanders understand the debt challenge. As recommended by the Queensland Independent Commission of Audit, the State’s debt needs to be reduced by $25-30 billion. To do this, we can: significantly increase taxes, substantially reduce or cut services, or sell or lease some public assets. There are no easy choices. Through Australia’s first People’s Budget, Queenslanders had the chance to tell the Government their own spending and saving priorities. Never before in Australia has there been this level of public consultation about the economic choices facing a community. Over 255,000 people visited www.StrongChoices.qld. gov.au and more than 55,000 people completed and submitted their own People’s Budget, to tell us their priorities for saving and spending. Thousands more also visited information booths and participated in community forums, roundtable discussions and virtual town hall meetings throughout the State. Since February, more than 70,000 Queenslanders have collectively tackled an unprecedented threat to our future prosperity; our $80 billion debt and the $4 billion in interest, or ‘dead money’, that we pay each year.

www.StrongChoices.qld.gov.au
THANK YOU
QUEENSLAND
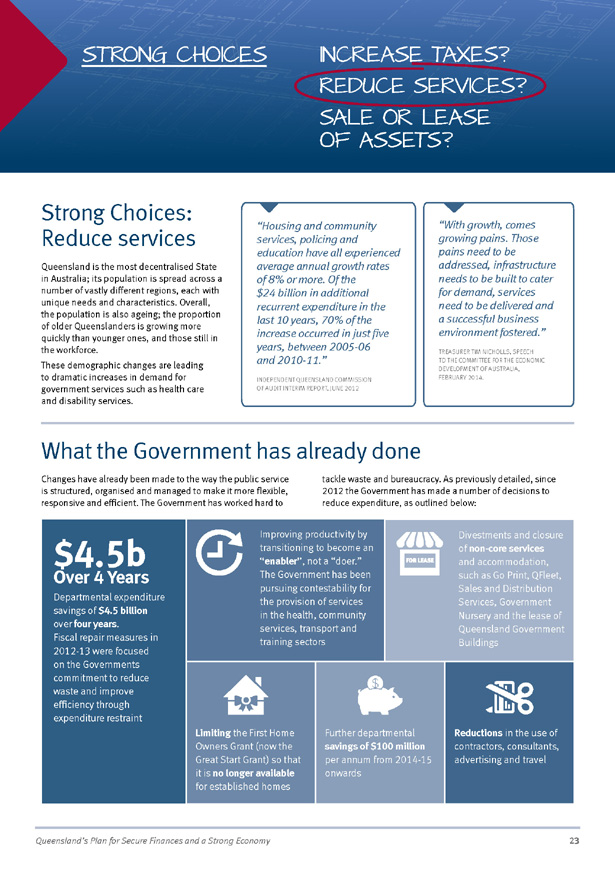
Queensland’s Plan for Secure Finances and a Strong Economy 23 INCREASE TAXES? REDUCE SERVICES? SALE OR LEASE OF ASSETS? STRONG CHOICES Strong Choices: Reduce services Queensland is the most decentralised State in Australia; its population is spread across a number of vastly different regions, each with unique needs and characteristics. Overall, the population is also ageing; the proportion of older Queenslanders is growing more quickly than younger ones, and those still in the workforce. These demographic changes are leading to dramatic increases in demand for government services such as health care and disability services. What the Government has already done Changes have already been made to the way the public service is structured, organised and managed to make it more flexible, responsive and efficient. The Government has worked hard to tackle waste and bureaucracy. As previously detailed, since 2012 the Government has made a number of decisions to reduce expenditure, as outlined below: Reductions in the use of contractors, consultants, advertising and travel $4.5b Over 4 Years Departmental expenditure savings of $4.5 billion over four years. Fiscal repair measures in 2012-13 were focused on the Governments commitment to reduce waste and improve efficiency through expenditure restraint Improving productivity by transitioning to become an “enabler”, not a “doer.” The Government has been pursuing contestability for the provision of services in the health, community services, transport and training sectors Limiting the First Home Owners Grant (now the Great Start Grant) so that it is no longer available for established homes Further departmental savings of $100 million per annum from 2014-15 onwards Divestments and closure of non-core services and accommodation, such as Go Print, QFleet, Sales and Distribution Services, Government Nursery and the lease of Queensland Government Buildings “Housing and community services, policing and education have all experienced average annual growth rates of 8% or more. Of the $24 billion in additional recurrent expenditure in the last 10 years, 70% of the increase occurred in just five years, between 2005-06 and 2010-11.” INDEPENDENT QUEENSLAND COMMISSION OF AUDIT INTERIM REPORT, JUNE 2012 “With growth, comes growing pains. Those pains need to be addressed, infrastructure needs to be built to cater for demand, services need to be delivered and a successful business environment fostered.” TREASURER TIM NICHOLLS, SPEECH TO THE COMMITTEE FOR THE ECONOMIC DEVELOPMENT OF AUSTRALIA, FEBRUARY 2014.
24 The Strongest & Smartest Choice Impact of service reductions Reducing the number or quality of Government services will also reduce the value those services provide to the community. Reducing services will often have the greatest impact on the people who need those services the most. For many services, it is difficult for the market to provide a level of service that maximises both community wellbeing and long-term economic growth. Where this is the case, the Government needs to step in and be directly or indirectly involved in the provision of these services, such as education, health, child safety, law and order and public transport. Often the major users of these services are those in the community who could not afford to access a privately run service. The largest areas of Government spending are in health (28%) and education (23%). There were more than one million admissions to public hospitals in Queensland in 2012-13. If a 1% reduction in funding translated into a 1% reduction in activity, this would mean that public hospitals could manage 10,000 less admissions in a year. The Strong Choices ‘Peoples Budget’ Tool provided Queenslanders with 32 options to pay down debt by reducing services and subsidies. Selecting all of these choices would have allowed users to achieve a debt reduction of $33.1 billion over the three years from 2014-15 to 2016-17. The total expenditure on government services over the same three-year period is projected to be just over $150 billion. If reducing services was the choice used to reduce debt by the target of at least $25 billion, this would represent a decrease of around 16% in spending on the services provided by the Government. Given the size of this reduction, it would result in fewer health, education and transport services, as well as a further reduction of around 30,000 public sector jobs. Overall, it is expected service reductions of this scale would result in Queensland failing to meet the needs of our growing, and ageing population. Some of the most important spending choices presented for reduction in the ‘People’s Budget’ tool were: Health Reducing funding for health services (a 10% cut would save $4.3 billion over three years) would lead to less dependable healthcare and a lower level of services for all Queenslanders. It would jeopardise the improvements that the Government has made in reducing waiting times in areas such as surgery, dental work and emergency departments. A cut of 10% would result in a reduction of around 7,200 health staff, who are primarily nurses, doctors and other health professionals. Transport The Government provides over $2.5 billion each year in transport subsidies and concessions, including almost $1.5 billion in subsidies to public transport users. If subsidies were removed (saving $4.5 billion over three years), commuters around Queensland would face significantly increased fares for buses, ferries, coaches and rail use. Removing these subsidies would cause Go Card fares to increase from $4.14 to $18.40 for a two-zone trip and from $4.91 to $21.82 for a three-zone trip. Education Education funding represents almost a quarter of Government spending, with the Department of Education, Training and Employment employing about one third of the total Queensland public service which includes 61,388 teachers (a 10% cut would save $2.9 billion over three years). As employee expenses make up approximately 70% of the department’s expenditure, significant budget cuts would mean fewer teachers and support staff in our schools, more students per teacher and less funding for teaching materials and resources. A 10% cut in education funding would be expected to result in a reduction of more than 6,500 full-time positions. Other Government Departments A reduction to all Government departmental budgets (a 10% cut would save $3 billion over three years) would cause a decrease in the number of frontline employees in areas such as police, fire and emergency services, corrections, disabilities and child safety as well as a reduction in funding for nongovernment service providers and community organisations. In the absence of Government and community sector provision, many of these services would simply cease to exist, increasing the burden on those Queenslanders who can least afford it. Summary Reductions in services, to reduce debt by at least $25 billion would: • Mean the loss of 30,000 public sector jobs, including teachers, doctors and nurses • Would reverse the improvements in surgery, emergency department waiting times and dental care achieved by the Government • Massively increase Go Card fares for public transport users • Result in 10,000 fewer hospital admissions per year • See a decrease in the number of police, fire and emergency services, corrections, disabilities and child safety employees • Result in less funding for non-government services providers and community organizations
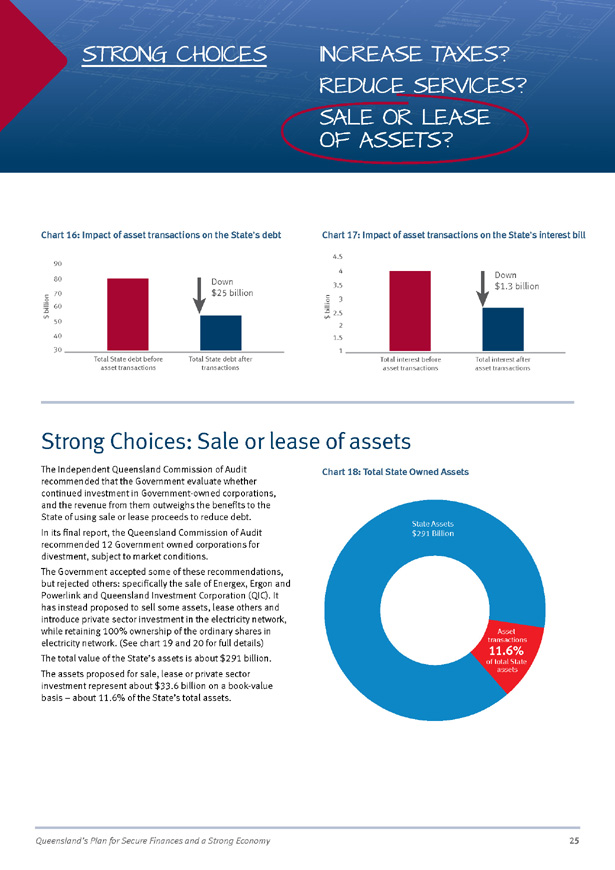
Queensland’s Plan for Secure Finances and a Strong Economy 25 Strong Choices: Sale or lease of assets The Independent Queensland Commission of Audit recommended that the Government evaluate whether continued investment in Government-owned corporations, and the revenue from them outweighs the benefits to the State of using sale or lease proceeds to reduce debt. In its final report, the Queensland Commission of Audit recommended 12 Government owned corporations for divestment, subject to market conditions. The Government accepted some of these recommendations, but rejected others: specifically the sale of Energex, Ergon and Powerlink and Queensland Investment Corporation (QIC). It has instead proposed to sell some assets, lease others and introduce private sector investment in the electricity network, while retaining 100% ownership of the ordinary shares in electricity network. (See chart 19 and 20 for full details) The total value of the State’s assets is about $291 billion. The assets proposed for sale, lease or private sector investment represent about $33.6 billion on a book-value basis – about 11.6% of the State’s total assets. INCREASE TAXES? REDUCE SERVICES? SALE OR LEASE OF ASSETS? STRONG CHOICES Revenue Expenditure 11.6% of total State assets Asset transactions State Assets $291 Billion Source: Budget 2014-15, Strong Choices Chart 18: Total State Owned Assets Chart 16: Impact of asset transactions on the State’s debt 30 40 50 60 70 80 90 Total State debt before asset transactions $ billion Total State debt after transactions Down $25 billion Chart 17: Impact of asset transactions on the State’s interest bill 1 1.5 2 2.5 3 3.5 4 4.5 Total interest before asset transactions $ billion Total interest after asset transactions Down $1.3 billion
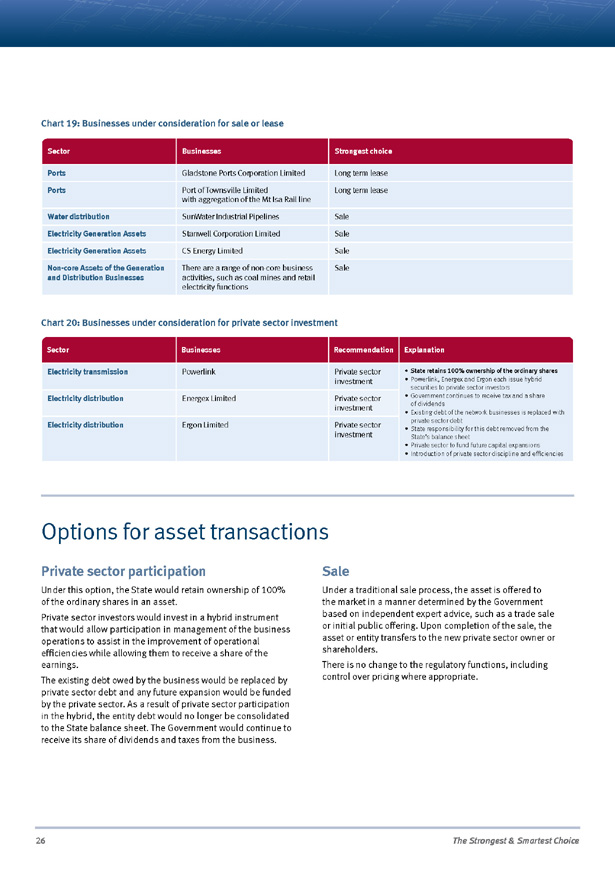
26 The Strongest & Smartest Choice Sector Businesses Recommendation Explanation Electricity transmission Powerlink Private sector investment • State retains 100% ownership of the ordinary shares • Powerlink, Energex and Ergon each issue hybrid securities to private sector investors • Government continues to receive tax and a share of dividends • Existing debt of the network businesses is replaced with private sector debt • State responsibility for this debt removed from the State’s balance sheet • Private sector to fund future capital expansions • Introduction of private sector discipline and efficiencies Electricity distribution Energex Limited Private sector investment Electricity distribution Ergon Limited Private sector investment Chart 19: Businesses under consideration for sale or lease Sector Businesses Strongest choice Ports Gladstone Ports Corporation Limited Long term lease Ports Port of Townsville Limited with aggregation of the Mt Isa Rail line Long term lease Water distribution SunWater Industrial Pipelines Sale Electricity Generation Assets Stanwell Corporation Limited Sale Electricity Generation Assets CS Energy Limited Sale Non-core Assets of the Generation and Distribution Businesses There are a range of non-core business activities, such as coal mines and retail electricity functions Sale Chart 20: Businesses under consideration for private sector investment Options for asset transactions Private sector participation Under this option, the State would retain ownership of 100% of the ordinary shares in an asset. Private sector investors would invest in a hybrid instrument that would allow participation in management of the business operations to assist in the improvement of operational efficiencies while allowing them to receive a share of the earnings. The existing debt owed by the business would be replaced by private sector debt and any future expansion would be funded by the private sector. As a result of private sector participation in the hybrid, the entity debt would no longer be consolidated to the State balance sheet. The Government would continue to receive its share of dividends and taxes from the business. Sale Under a traditional sale process, the asset is offered to the market in a manner determined by the Government based on independent expert advice, such as a trade sale or initial public offering. Upon completion of the sale, the asset or entity transfers to the new private sector owner or shareholders. There is no change to the regulatory functions, including control over pricing where appropriate.
Queensland’s Plan for Secure Finances and a Strong Economy 27 What has the Government already done? Former governments sold almost $15 billion in public assets in the last five years of their time in office. This included the $4 billion privatisation of the QR National rail business, the $2.1 billion sale of the Port of Brisbane and the $1.2 billion sale of retail electricity businesses. However these sales were not enough to reduce debt, or the pressure on the budget, because they were not used to reduce debt. The QR National public offer document released in 2010 advised that the State would retain a shareholding in QR National but that the State did not intend to remain a shareholder in the longer term. In accordance with this advice to shareholders in 2012 and 2013, the incoming Government reduced the State’s shareholding in QR National, using these proceeds to pay down debt. The Government inherited this obligation but was committed to achieving the best possible outcome from the sale of Government shares and the Government’s measured and methodical plan represented significant gains for Queenslanders over the Initial Public Offer price. The Queensland Government is committed to refocusing its Government owned corporations to drive value for money for Queensland taxpayers, improving accountability and enhancing efficiency of business performance. In addition, the future capital and debt required by Government owned corporations to grow needs to be effectively managed so as not to tie up valuable and scarce capital that could be directed elsewhere. Government owned corporations are driving efficiencies across their activities and cutting unnecessary expenditure. The efficiencies being captured by this process will positively impact the cost of delivering services and the cost of living and doing business in Queensland. The Government has committed to not selling any Government businesses without first seeking a mandate at the next election. “The Government remains fully committed to seeking a mandate from the Queensland people before divesting itself of any Government business… such a proposal warrants a considered and rational debate to establish its viability and to inform stakeholders of the costs and benefits of Government owning such businesses, noting these also come with significant financial risks in the context of a modern economy.” 2013 – 2014 MID-YEAR FISCAL AND ECONOMIC REVIEW, QUEENSLAND TREASURY AND TRADE Long term lease Transactions by way of long term leases allow Government to retain an interest in the strategic infrastructure of the State. A lease allows the private sector to operate, maintain and expand the asset for their benefit over a term, often of up to 99 years in return for an upfront payment. The State as the owner of the land can recover the asset in the event of failure of the lessee and at the end of the lease the asset reverts to the State unless there is an extension to the lease. The lease terms also usually place certain obligations on the lessee to ensure that the assets keep pace with market conditions, harness growth potential and continues to be used for the purpose intended. There is no change to the regulatory environment in which the asset operates and any externally regulated price setting mechanisms are maintained. The lessee must continue to comply with any legislative or lease imposed safety and governance standards, including community service obligations.
28 The Strongest & Smartest Choice Why Governments should not continue to own some assets Governments are involved in public infrastructure to provide equitable access to services across the community and because there is a range of ‘market failures’ that could cause inadequate provision if they were not involved3. Queensland operates commercial businesses primarily in the electricity, water, transport and financial services sectors that can be delivered efficiently by, and often compete with, private commercial entities. These businesses also compete for capital against new economic investment priorities and core services such as health, education and other social services. Once commercially focussed businesses are established and mature with appropriate regulatory structures or long-term contracts in place, the rationale for public ownership becomes less compelling and the commercial risks of the business make the case for divesting to the private sector stronger. Generally, the history and culture of the public sector makes it less flexible and less likely to promote and value entrepreneurial and commercial skills, or to respond quickly and effectively to changing market conditions and risks. This means private sector operators can often move faster and with more agility to deal with emerging risks and take advantage of opportunities. Private investors are often more able – and willing – to take on financial risk for the opportunity of greater reward than the public sector can or should, particularly in a fiscally constrained environment. Many of the commercial activities the Queensland Government is involved in have already been divested by other states and are being delivered more efficiently by commercial entities. For example, the New South Wales Government has recently entered into long-term leases of the ports of Kembla, Botany and Newcastle. States such as Victoria and South Australia have already sold assets in similar markets, and their average debt per person is substantially lower than Queensland. Analysis by Infrastructure Australia in December 2013 of publicly owned infrastructure assets across Australia indicated that their financial performance was substantially below their private sector peer group.4 3. Public Infrastructure – Productivity Commission Draft Report Volume 1, March 2014 4. Australia’s Public Infrastructure Update Paper Balance Sheet Impacts of Sell to Build Infrastructure Australia, December 2013 “Today, this reaction (to privatisation) is less ideological than it is reactionary.” “There is a perception that the government will be more lenient on inefficiency. It is the opposite of big picture thinking.” “The big picture reveals that the labour movement has nothing to fear from privatisation – unless we choose to stubbornly remain on the sidelines with our arms crossed refusing to help…” PAUL HOWES, FORMER AWU NATIONAL SECRETARY “I acknowledge that privatisation is politically unpopular, yet with so many benefits to the community it should be possible to persuade voters that it is in their interest…” Benefits of privatisation “are a more competitive generation and retail market that encourages innovation and drives efficiencies to bring down costs.” MARTIN FERGUSON, FORMER RUDD AND GILLARD GOVERNMENT ENERGY AND RESOURCES MINISTER, FORMER PRESIDENT OF ACTU
Queensland’s Plan for Secure Finances and a Strong Economy 29 NEW EXTERNAL ENVIRONMENT: Implications of the Federal Budget Delivered on May 2014, the Federal Budget significantly altered the context in which the State Government was considering its own strong choices. While the State Government applauds the responsibility and foresight of its Federal counterpart in choosing to address its own looming debt and deficit problem, many of the initiatives it has chosen rely on shifting the financial burden unfairly to the states. The Federal Budget included a number of revisions to funding agreements that were unilaterally determined by the Federal Government. Changing these arrangements so dramatically – and without consultation – has placed considerable further pressure on the State’s Budget. The most significant Federal change was an $80 billion funding cut to all States for schools and hospitals. This is a massive cost shift by the Commonwealth. The narrow revenue base of the States will make it increasingly difficult to fund the delivery of these vital services from 2017-18 onwards. In addition, the Federal Government unilaterally removed the State Specific Guarantee (SSG) aspect of the National Health Reform Agreement, which was designed to ensure a guaranteed level of additional funding would flow to the State irrespective of growth in public hospital activity. Meanwhile, the introduction of a $7 co-payment for GP visits and diagnostic tests is expected to put pressure on the State’s public hospitals through increased presentations at Emergency Departments. The Federal Budget also announced that the rate of growth in education funding to states would reduce from 1 January 2018. In this environment, the Queensland Government is not willing to reduce its own funding of school education. Reduced education funding could ultimately lead to a decrease in the overall number of teachers, placing undue pressure on schools and educational outcomes. Without Strong and Smart Choices that acknowledge and respond to the Federal Government’s new strategy, the State Budget will be in an even worse position, placing further pressure on a return to surplus and our ability to hold a surplus into the future. The State Government is particularly sensitive to the impact of tax increases imposed by the Federal Government on everyday Queenslanders. To raise State taxes and levies at this time would be a “double whammy” that would risk significant individual hardship as well as threaten Queensland’s promising growth. It is not practical to make up the difference left by Federal changes by cutting services in such vital sectors as health and education.
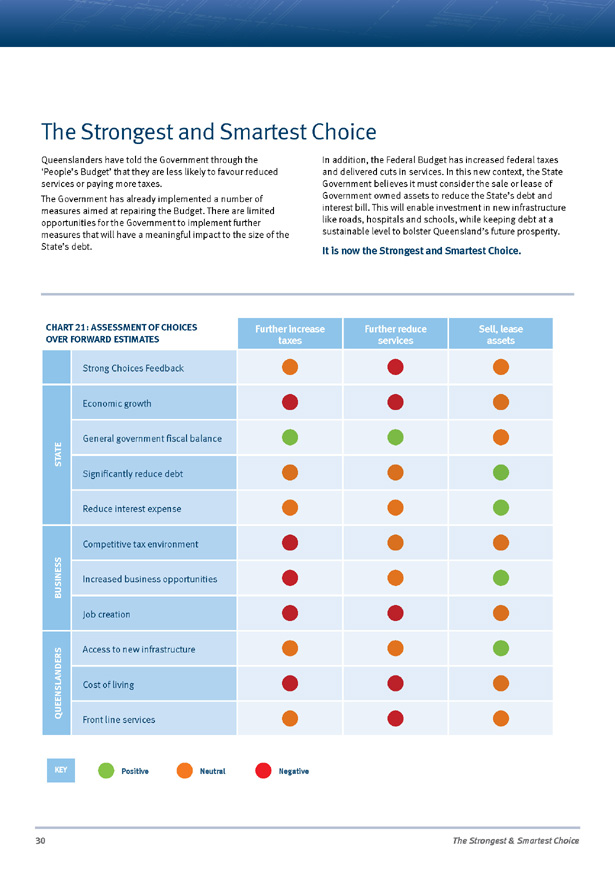
30 The Strongest & Smartest Choice CHART 21: ASSESSMENT OF CHOICES OVER FORWARD ESTIMATES Further increase taxes Further reduce services Sell, lease assets Strong Choices Feedback STATE Economic growth General government fiscal balance Significantly reduce debt Reduce interest expense BUSINESS Competitive tax environment Increased business opportunities Job creation QUEENSLANDERS Access to new infrastructure Cost of living Front line services KEY Positive Neutral Negative The Strongest and Smartest Choice Queenslanders have told the Government through the ‘People’s Budget’ that they are less likely to favour reduced services or paying more taxes. The Government has already implemented a number of measures aimed at repairing the Budget. There are limited opportunities for the Government to implement further measures that will have a meaningful impact to the size of the State’s debt. In addition, the Federal Budget has increased federal taxes and delivered cuts in services. In this new context, the State Government believes it must consider the sale or lease of Government owned assets to reduce the State’s debt and interest bill. This will enable investment in new infrastructure like roads, hospitals and schools, while keeping debt at a sustainable level to bolster Queensland’s future prosperity. It is now the Strongest and Smartest Choice.
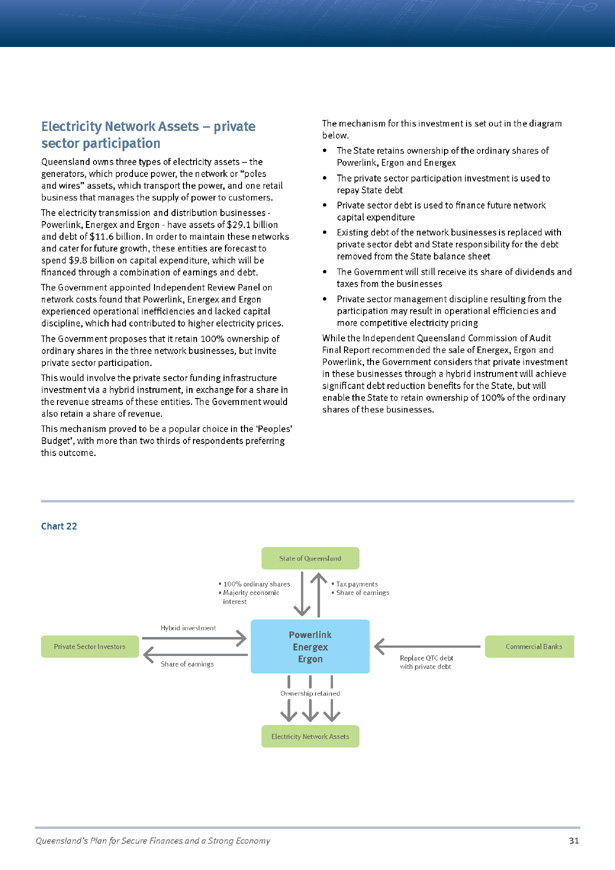
Queensland’s Plan for Secure Finances and a Strong Economy 31 Electricity Network Assets – private sector participation Queensland owns three types of electricity assets – the generators, which produce power, the network or “poles and wires” assets, which transport the power, and one retail business that manages the supply of power to customers. The electricity transmission and distribution businesses—Powerlink, Energex and Ergon—have assets of $29.1 billion and debt of $11.6 billion. In order to maintain these networks and cater for future growth, these entities are forecast to spend $9.8 billion on capital expenditure, which will be financed through a combination of earnings and debt. The Government appointed Independent Review Panel on network costs found that Powerlink, Energex and Ergon experienced operational inefficiencies and lacked capital discipline, which had contributed to higher electricity prices. The Government proposes that it retain 100% ownership of ordinary shares in the three network businesses, but invite private sector participation. This would involve the private sector funding infrastructure investment via a hybrid instrument, in exchange for a share in the revenue streams of these entities. The Government would also retain a share of revenue. This mechanism proved to be a popular choice in the ‘Peoples’ Budget’, with more than two thirds of respondents preferring this outcome. The mechanism for this investment is set out in the diagram below. • The State retains ownership of the ordinary shares of Powerlink, Ergon and Energex • The private sector participation investment is used to repay State debt • Private sector debt is used to finance future network capital expenditure • Existing debt of the network businesses is replaced with private sector debt and State responsibility for the debt removed from the State balance sheet • The Government will still receive its share of dividends and taxes from the businesses • Private sector management discipline resulting from the participation may result in operational efficiencies and more competitive electricity pricing While the Independent Queensland Commission of Audit Final Report recommended the sale of Energex, Ergon and Powerlink, the Government considers that private investment in these businesses through a hybrid instrument will achieve significant debt reduction benefits for the State, but will enable the State to retain ownership of 100% of the ordinary shares of these businesses. Private Sector Investors Commercial Banks State of Queensland Electricity Network Assets Ownership retained Replace QTC debt Share of earnings with private debt Hybrid investment 100% ordinary shares Majority economic interest Tax payments Share of earnings Powerlink Energex Ergon Chart 22
32 The Strongest & Smartest Choice Ports – long-term lease The Government owns a number of ports across Queensland, which transfer a variety of cargo to domestic and international markets. These ports are operated by both Government and private operators. In Australia, including Queensland, ports have been successfully leased to private operators, with the Government retaining a landlord role to ensure safety and security. Rail freight networks are operated under a range of government and private ownership models in Australia. The integration of ports and rail lines may improve efficiencies and therefore lower the cost of exporters bringing their products to market. This is seen as a significant means to promote increased economic development in Queensland. Based on expert, independent advice and on the outcomes of the community consultation undertaken as part of the Strong Choices consultation, the Government proposes to let longterm leases for: • Port of Gladstone (excluding Port of Bundaberg), and • An integrated supply chain comprising Port of Townsville (excluding Port of Lucinda) and the Mt Isa Rail Line A long-term lease will enable: • Government to retain ownership of the ports and rail land • Private sector to operate the port and rail line, which would revert to Government on expiry of the lease • The private sector to be responsible for upgrades and maintenance, reducing the dependence on State debt to finance these activities • A substantial upfront lease premium to be used by the State for debt reduction and new infrastructure investment The appropriate timing of these transactions, and consideration of detailed transaction structures will need to be considered, and ultimate completion of any transactions would be subject to a robust process so that the State achieves value for money. Private ownership of assets can enable access to private sector capital for expansion, which may not have been possible for Government’s facing fiscal constraints. Economic benefits may be achieved by creating a more conducive environment for investment, which can provide better opportunities for the development of associated or complementary projects, for example a resource project with links to ports. Electricity Generation – sale Stanwell Corporation Limited and CS Energy Limited own power stations using coal or gas to generate power that is sold into the wholesale National Electricity Market (NEM) where customers are electricity retailers like Origin and AGL. These capital-intensive businesses have to compete with other private and Government-owned operators. State-owned generation companies account for approximately two thirds of the electricity generation market in Queensland, but most generation assets in other parts of the Australian NEM are privately owned. Based on expert, independent advice and on the outcomes of the community consultation undertaken as part of the Strong Choices consultation, the Government proposes the sale of the generation and coal assets of Stanwell Corporation Limited and CS Energy Limited, when market conditions are suitable A sale will: • Allow upfront proceeds to be used for debt reduction and new infrastructure investment by Government • Avoid increases in debt to fund capital expenditure • Allow a private owner to determine optimal generation capacity for the future • Reduce government exposure and risk due to competition from new technologies • Enable the State balance sheet to be de-risked from variability of returns • Allow these businesses to compete more effectively with other private sector competitors generating electricity • Remove the need for the Government to inject future funds into the businesses to allow them to operate
Queensland’s Plan for Secure Finances and a Strong Economy 33 Electricity Retail – sale Ergon Energy Queensland buys electricity in the wholesale market and sells it to customers outside South East Queensland. With the recently announced sale of Tasmania’s electricity business, Queensland will be the only state that owns a retail electricity business. The main asset of the retail business is its customer base. On current policy settings, the State will retain a subsidised electricity price for regional Queenslanders. Based on expert and independent advice, together with the outcomes of the community consultation undertaken as part of the Strong Choices consultation, the Government proposes the sale of the retail assets of Ergon Energy Queensland. This will result in upfront proceeds to be used for debt reduction and will limit Government exposure to reducing customer numbers as customers change retailers, de-risking the State’s balance sheet from variability of returns. The sale of Queensland’s residual retail electricity business will enable Queenslanders in regional areas to access a competitive retail market, just like people in South East Queensland, meaning they will no longer be tied to Ergon Energy for their power. Commercial water pipelines – sale or lease The State owns water supply infrastructure servicing commercial and industrial businesses including mines, power stations and coal seam gas operations. They do not represent core business functions of Government. Domestic users of SunWater pipelines will continue to access their existing water supply. Based on expert, independent advice and on the outcomes of the community consultation undertaken as part of the Strong Choices campaign, the Government proposes the sale of the industrial water pipelines of SunWater Limited. This will result in upfront proceeds to be used for debt reduction and new infrastructure investment by Government and de-risk the State balance sheet from the variability of returns.
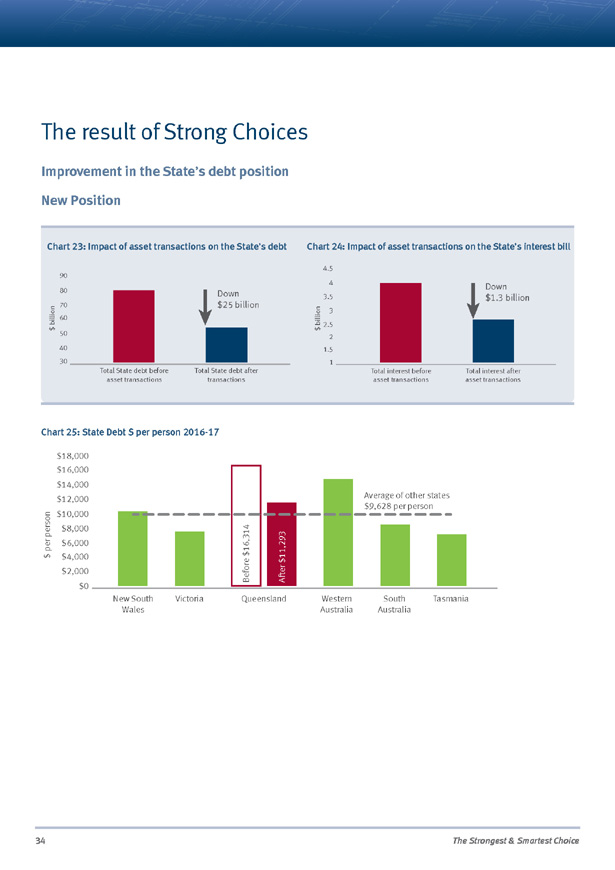
34 The Strongest & Smartest Choice The result of Strong Choices Improvement in the State’s debt position New Position $0 $2,000 $4,000 $6,000 $8,000 $10,000 $14,000 $12,000 $16,000 $18,000 $ per person Before $16,314 Average of other states $9,628 per person After $11,293 New South Victoria Wales Western Australia South Australia Queensland Tasmania Forecast State Debt per Capita after Strong Choices implementation 2016-17 Chart 25: State Debt $ per person 2016-17 Chart 23: Impact of asset transactions on the State’s debt 30 40 50 60 70 80 90 Total State debt before asset transactions $ billion Total State debt after transactions Down $25 billion Chart 24: Impact of asset transactions on the State’s interest bill 1 1.5 2 2.5 3 3.5 4 4.5 Total interest before asset transactions $ billion Total interest after asset transactions Down $1.3 billion
Queensland’s Plan for Secure Finances and a Strong Economy 35 Building on Strong Choices: the Strong Choices Investment Program Having made the Strongest and Smartest Choice to reduce the $80 billion State debt, the Government will also free up funds to build more schools, hospitals and other vital infrastructure to ensure this State’s growing population can enjoy a brighter future. These funds should become available over a six-year period, and only after the next State election when the Government will seek a mandate for its final plan. While some have argued that 100% of income from the proposed asset transactions should be directed to paying down the State debt, the Government is committed to delivering the infrastructure required to drive economic growth in Queensland. With a disciplined and methodical plan, it aims to optimise private sector involvement in these infrastructure projects and to ensure its own investments represent value for money. Therefore, as outlined above, the Government proposes to set aside 25% of the proceeds received from the sale, lease or other divestment of its assets, to establish and fund the Strong Choices Investment Program. The Program will incorporate a range of funding pools designed to support and enhance Queensland’s four-pillar economy built on agriculture, tourism, construction and resources. It is expected to directly support approximately 25,000 full-time equivalent (FTE) jobs in the Queensland construction industry. On a conservative book value basis, the assets listed for sale, long term lease or private sector participation would provide $33.6 billion to the State. This includes deconsolidation of the debt held by the network businesses. The Government proposes to use 75% of the proceeds or $25 billion for debt reduction and 25% or $8.6 billion, to create the Strong Choices Investment Program. The amount of infrastructure funding may also increase depending on eligibility for Commonwealth funding under the Federal Government’s asset recycling incentives. This will reduce the State’s interest bill from $4 billion to approximately $2.7 billion, freeing up $1.3 billion a year. This Choice would also reduce the per capita interest cost from an estimated $855 per person a year to $592, together with reducing the average debt per person from $16,314 to $11,293. The asset transactions will also mean the State will no longer have to fund up to $15.6 billion in future capital expenditure over the forward estimates depending on the timing of transactions. In the case of power station and/or port upgrades, this will save the Government billions of dollars over the medium term. Future capital expansion will be undertaken by the private sector in response to customer demand. The Government’s commitment to ongoing expenditure constraint, coupled with a greater reliance on private sector funding and delivery models, will ensure that the State’s debt does not again return to unsustainable levels.
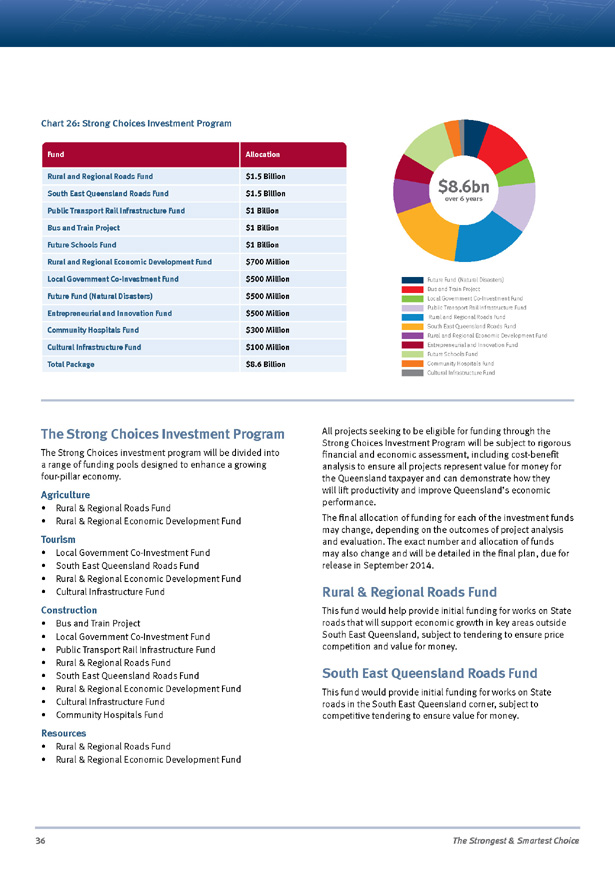
36 The Strongest & Smartest Choice The Strong Choices Investment Program The Strong Choices investment program will be divided into a range of funding pools designed to enhance a growing four-pillar economy. Agriculture • Rural & Regional Roads Fund • Rural & Regional Economic Development Fund Tourism • Local Government Co-Investment Fund • South East Queensland Roads Fund • Rural & Regional Economic Development Fund • Cultural Infrastructure Fund Construction • Bus and Train Project • Local Government Co-Investment Fund • Public Transport Rail Infrastructure Fund • Rural & Regional Roads Fund • South East Queensland Roads Fund • Rural & Regional Economic Development Fund • Cultural Infrastructure Fund • Community Hospitals Fund Resources • Rural & Regional Roads Fund • Rural & Regional Economic Development Fund All projects seeking to be eligible for funding through the Strong Choices Investment Program will be subject to rigorous financial and economic assessment, including cost-benefit analysis to ensure all projects represent value for money for the Queensland taxpayer and can demonstrate how they will lift productivity and improve Queensland’s economic performance. The final allocation of funding for each of the investment funds may change, depending on the outcomes of project analysis and evaluation. The exact number and allocation of funds may also change and will be detailed in the final plan, due for release in September 2014. Rural & Regional Roads Fund This fund would help provide initial funding for works on State roads that will support economic growth in key areas outside South East Queensland, subject to tendering to ensure price competition and value for money. South East Queensland Roads Fund This fund would provide initial funding for works on State roads in the South East Queensland corner, subject to competitive tendering to ensure value for money. Chart 26: Strong Choices Investment Program Fund Allocation Rural and Regional Roads Fund $1.5 Billion South East Queensland Roads Fund $1.5 Billion Public Transport Rail Infrastructure Fund $1 Billion Bus and Train Project $1 Billion Future Schools Fund $1 Billion Rural and Regional Economic Development Fund $700 Million Local Government Co-Investment Fund $500 Million Future Fund (Natural Disasters) $500 Million Entrepreneurial and Innovation Fund $500 Million Community Hospitals Fund $300 Million Cultural Infrastructure Fund $100 Million Total Package $8.6 Billion Proposed Spending Initiatives Future Fund (Natural Disasters) Bus and Train Project Local Government Co-Investment Fund Public Transport Rail Infrastructure Fund Rural and Regional Roads Fund South East Queensland Roads Fund Rural and Regional Economic Development Fund Entrepreneurial and Innovation Fund Future Schools Fund Community Hospitals Fund Cultural Infrastructure Fund $8.6bn over 6 years
Queensland’s Plan for Secure Finances and a Strong Economy 37 Public Transport Rail Infrastructure Fund This fund would be used to fund, in part or in full, public transport rail projects across Queensland. Bus and Train Project The Government has identified an initial funding allocation for the proposed $5 billion Bus and Train (BaT) project. This is an upfront capital payment to ensure the project can proceed. The private sector will be invited to fund the remaining project cost with the State to pay the private sector an availability fee over the life of the tunnel. The private sector would be responsible for the maintenance of the tunnel, which will be built into the availability payment. In a world-first design, the BaT project will provide a combined rail and bus tunnel, stretching 5km from Dutton Park in the south to Victoria Park in the north. The BaT project is a single, double-decked, 15m-wide tunnel beneath the Brisbane River and Brisbane’s central business district, providing new underground stations at Woolloongabba, George Street and Roma Street. The BaT project will be critical to boosting Brisbane’s inner-city public transport capacity and is a key new link in South East Queensland’s public transport network. The level, nature and timing of the project’s residual funding requirements, including a contribution from Brisbane City Council, will be considered by Government as part of the BaT Business Case. Depending on the final delivery approach, a level of private sector financing will be sought for the BaT project. Future Schools Fund The Schools Planning Commission has delivered its interim report to Government, detailing the need for up to 48 new schools between now and 2021. The fund would enable a program for new schools and a program to deliver new classrooms for existing schools. All new State schools built will be independent public schools. Where possible, all new State schools will be built as part of the now established and successful public-private partnership (PPP) model. A portion of the funds will be made available to the independent school sector. Rural & Regional Economic Development Fund This fund would be used to support projects that drive economic growth and diversification of regional industries across regional Queensland. The fund will focus on major strategic infrastructure and community-led local initiatives that improve both the competitiveness and livability of regional and rural Queensland, creating more jobs and economic growth. A portion of the funds from the Rural & Regional Economic Development Fund form part of the Government’s Royalties for the Regions fund for 2016-17 and 2017-18. Local Government Co-Investment Fund This fund would be fully contestable and set aside exclusively for Local Governments across Queensland. The fund is for capital expenditure and not recurrent expenditure. Local Governments can apply for co-investment to upgrade, renew, build and or construct infrastructure that supports growth and economic development. Preference will be given to projects that assist in building a four pillar economy. The fund will co-invest with Local Governments and seek a return for the investment so that the fund can be rolled over multiple times in future years, as an ongoing source of investment. A portion of the funds from the Local Government Co- Investment Fund form part of the Government’s Royalties for the Regions fund for 2016-17 and 2017-18. Future Fund (Natural Disasters) The Government would put $500 million in cash from the proceeds of assets transactions into a separate Queensland Future Fund, with the policy focus on having funding set aside for the State’s costs in the event of future natural disasters. The Queensland Future Fund will invest the proceeds, with the view to growing the fund to bolstering the State’s finances against future challenges. Entrepreneurial and Innovation Fund Since 1998, Governments have invested in research and innovation across a wide range of industries. Over recent years, this investment has declined, putting at risk Queensland’s knowledge-based industries. Queensland also has a strong and proud history of entrepreneurship which this fund will seek to foster and ensure we continue to be a great state with great opportunity. This fund would be used to reinvigorate research and innovation across Queensland, once again placing Queensland at the forefront of technological break throughs, focusing on growing our four pillar economy and providing jobs and opportunity for all Queenslanders. This fund will help create and maintain highly skilled jobs for future generations of Queenslanders; it’s an investment in our future.
38 The Strongest & Smartest Choice Community Hospitals Fund Hospitals across Queensland, particularly in rural and regional areas, need upgrading and redevelopment to cater for our increasing population and growing demand for health services. This fund puts aside money for the future health and hospital infrastructure needs of Queensland. Cultural Infrastructure Fund This fund would be used to revitalise cultural venues across Queensland. Federal Government Incentive Pool The Commonwealth Government recently announced it would support the States in asset recycling where assets are sold or leased, provided the proceeds are invested (recycled) in economic infrastructure. Under the Commonwealth’s incentive, the State could be eligible to receive up to 15% of the expected $8.6 billion put aside for infrastructure – a further $1.3 billion. Commonwealth funding will be available for infrastructure that supports economic growth, such as roads, highways and railway lines, but not for spending on “social infrastructure” such as schools and hospitals. Based on the State’s proposed infrastructure priorities, and the parameters set by the Commonwealth, the potential pool of Commonwealth funding could be an extra $975 million (of the possible $1.3 billion). The Commonwealth has given the states up to 30 June 2016 to agree on the assets to be sold and the infrastructure to be built. The Commonwealth has also given the States until 30 June 2019 to start eligible infrastructure projects. The payments from the pool are made in two parts. The first payment is made when the sale process has commenced, with the second payment delivered when the contract for the new infrastructure has been signed or the sale process is completed. The State Government has not included this incentive pool funding in any of the funds outlined above, as it has promised to seek a mandate for its final plan at the next election. Community Feedback Queenslanders are now invited to give feedback on how they would like funds from the Strong Choices Infrastructure Package to be allocated. Individuals, community groups, councils and organisations alike are encouraged to visit www. StrongChoices.qld.gov.au and provide their feedback. The Government will release a final plan in September 2014. Summary Through their record response to the Strong Choices campaign, Queenslanders have made it clear they believe decisive action is necessary and justified to address the State’s debt and interest problem. The Government has already achieved substantial expenditure reductions and revenue increases as part of its Budget repair program. The Government’s ability to make further inroads in these areas has been severely curtailed by the recent Federal Budget, which also flagged significant spending cuts as well as increases in taxes and levies. The State Government recognises that many Queenslanders are feeling considerable cost of living pressures already; in the wake of the Federal Budget, further tax rises or spending cuts would represent a significant “double whammy” for these people. In this context, the State Government’s proposed asset divestment program will reduce debt, restore strength to the Budget, and deliver a “community dividend” in the form of additional funds to invest in new infrastructure around the State. The Strongest Choice is now the Smartest Choice, and will build a brighter, more prosperous future for all Queenslanders.

Queensland’s Plan for Secure Finances and a Strong Economy 39
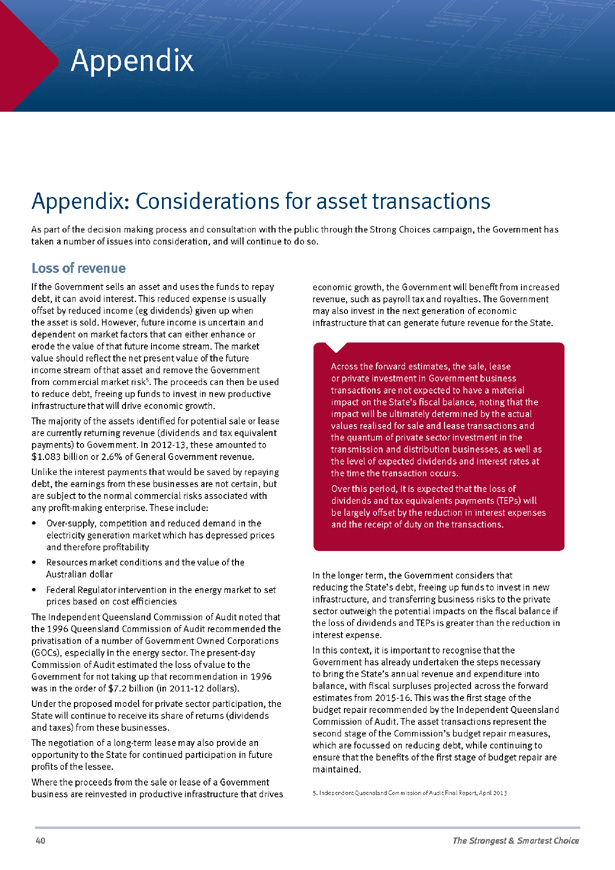
40 The Strongest & Smartest Choice Appendix: Considerations for asset transactions As part of the decision making process and consultation with the public through the Strong Choices campaign, the Government has taken a number of issues into consideration, and will continue to do so. Loss of revenue If the Government sells an asset and uses the funds to repay debt, it can avoid interest. This reduced expense is usually offset by reduced income (eg dividends) given up when the asset is sold. However, future income is uncertain and dependent on market factors that can either enhance or erode the value of that future income stream. The market value should reflect the net present value of the future income stream of that asset and remove the Government from commercial market risk5. The proceeds can then be used to reduce debt, freeing up funds to invest in new productive infrastructure that will drive economic growth. The majority of the assets identified for potential sale or lease are currently returning revenue (dividends and tax equivalent payments) to Government. In 2012-13, these amounted to $1.083 billion or 2.6% of General Government revenue. Unlike the interest payments that would be saved by repaying debt, the earnings from these businesses are not certain, but are subject to the normal commercial risks associated with any profit-making enterprise. These include: • Over-supply, competition and reduced demand in the electricity generation market which has depressed prices and therefore profitability • Resources market conditions and the value of the Australian dollar • Federal Regulator intervention in the energy market to set prices based on cost efficiencies The Independent Queensland Commission of Audit noted that the 1996 Queensland Commission of Audit recommended the privatisation of a number of Government Owned Corporations (GOCs), especially in the energy sector. The present-day Commission of Audit estimated the loss of value to the Government for not taking up that recommendation in 1996 was in the order of $7.2 billion (in 2011-12 dollars). Under the proposed model for private sector participation, the State will continue to receive its share of returns (dividends and taxes) from these businesses. The negotiation of a long-term lease may also provide an opportunity to the State for continued participation in future profits of the lessee. Where the proceeds from the sale or lease of a Government business are reinvested in productive infrastructure that drives economic growth, the Government will benefit from increased revenue, such as payroll tax and royalties. The Government may also invest in the next generation of economic infrastructure that can generate future revenue for the State. In the longer term, the Government considers that reducing the State’s debt, freeing up funds to invest in new infrastructure, and transferring business risks to the private sector outweigh the potential impacts on the fiscal balance if the loss of dividends and TEPs is greater than the reduction in interest expense. In this context, it is important to recognise that the Government has already undertaken the steps necessary to bring the State’s annual revenue and expenditure into balance, with fiscal surpluses projected across the forward estimates from 2015-16. This was the first stage of the budget repair recommended by the Independent Queensland Commission of Audit. The asset transactions represent the second stage of the Commission’s budget repair measures, which are focussed on reducing debt, while continuing to ensure that the benefits of the first stage of budget repair are maintained. 5. Independent Queensland Commission of Audit Final Report, April 2013 Appendix Across the forward estimates, the sale, lease or private investment in Government business transactions are not expected to have a material impact on the State’s fiscal balance, noting that the impact will be ultimately determined by the actual values realised for sale and lease transactions and the quantum of private sector investment in the transmission and distribution businesses, as well as the level of expected dividends and interest rates at the time the transaction occurs. Over this period, it is expected that the loss of dividends and tax equivalents payments (TEPs) will be largely offset by the reduction in interest expenses and the receipt of duty on the transactions.
Queensland’s Plan for Secure Finances and a Strong Economy 41 Jobs The nature and extent of employment in a business after a transaction depends on how efficiently the business was being run by government and the future growth potential of the business. There are likely to be changes in the composition of the workforce as a result of the differing shareholder demands of the Government and private sector. For example, the government monitors and requires ongoing reporting of certain types of expenditure like entertainment and travel, and issues more focussed on the operation of government. A private sector shareholder will have a different focus and may require employees with different skills. Further investment and growth in businesses under private ownership can create new employment opportunities. Commonwealth Serum Laboratories (CSL Limited), for example, was sold by the Commonwealth Government through an initial public offering in 1994. At that time, CSL Limited had 1300 employees in Australia, had sales of $170 million and paid $4 million in tax. Today it has over 11,000 employees in Australia and around the world, sales of almost $5 billion and pays $300 million in tax. Pricing/competition Government-owned businesses including those in the electricity, port and water pipeline sectors are subject to the same competition and pricing arrangements as their private sector counterparts under State and Federal legislation. After sale they will be subject to the same pricing constraints or regulatory structures. For example: • Wholesale electricity prices are set by the Australian Energy Market Operator (AEMO) every thirty minutes, based on competitive bids from generation plants • All electricity network businesses are subject to detailed revenue and price regulation by the Australian Energy Regulator (AER). Every five years, the AER sets “allowed revenues” and reviews their annual pricing proposals for compliance with the National Electricity Rules • The Queensland Competition Authority also plays a role in setting retail electricity prices charged by Ergon Energy Queensland • Water prices are negotiated commercially before the pipeline is built and usually set for the life of the contract • Ports negotiate long term agreements (usually about 10 years) with their customers who are typically large resource companies that provide pricing certainty • Any natural monopolies can be subject to regulation if there are concerns that monopoly power is being abused. The cost of electricity supply to South East Queensland is lower than the cost of supply in regional Queensland, where there are no equivalent economies of scale. The Government’s uniform tariff policy (UTP) ensures all Queensland non-market electricity customers of a similar type pay the same price for electricity, regardless of where they live. As these prices do not reflect the full cost of electricity supply for most remote and regional Queenslanders, the Government provides subsidy funding to Ergon Energy Queensland. In 2014-15 this subsidy payment is expected to total $656 million. The Government’s policy that regional Queenslanders should pay a price for electricity which is on a par with that paid by the residents of South East Queensland will not change as a result of the sale of Ergon Energy Queensland. In addition, the Government proposes to open the regional electricity market to competition to encourage electricity price competition between retailers for the benefit of regional Queenslanders. Regulation In matters involving pricing, competition, health and safety, environment, employment, development and planning approvals, and service standards, Government-owned businesses are subject to the same Commonwealth, State and local regulations as their private sector counterparts. Should they be sold or leased to the private sector, each of the Government businesses listed here will be subject to the same regulations as they are now. Private ownership can also remove unnecessary policy restrictions on these businesses to operate on a fully commercial basis and make the cost of any Government policy requirements more transparent. Service Standards The electricity generation, retail and network businesses are subject to the same service standard obligations as private sector organisations under State and Commonwealth laws. The AEMO requires all electricity generators to comply with stringent technical and operating standards to supply electricity in the National Electricity Market. The electricity networks are subject to a range of performance obligations to connect and supply customers within their franchise areas, and must develop their network in response to new developments and increasing customer needs. The Electricity Act 1996 imposes strict obligations on all electricity retail businesses in Queensland, whether private or Government-owned, and the Government is currently considering whether national rules should be adopted across all electricity retailers in Queensland.
42 The Strongest & Smartest Choice The service standards for water pipeline businesses are negotiated with each customer when the long-term contract is entered into and set out in the supply agreement. Ports are an important part of the regional economies where they are located, and it is typical in a lease process can include an obligation to expand the port in response to economic growth and genuine customer demand. Planning frameworks The Ports of Townsville and Port of Gladstone are subject to the strategic planning framework under the Transport Infrastructure Act 1993 (Qld). It is anticipated that a tailored planning framework will be in place for those ports, after privatisation, to ensure the ongoing appropriate development of the ports is similar to the regime used for the Port of Brisbane. These planning frameworks will help ensure appropriate development on port land and allow the port to grow in ways that will encourage economic development and provide port users, industry, local governments and local communities with transparency about future development.

Queensland’s Plan for Secure Finances and a Strong Economy 43

www.StrongChoices.qld.gov.au