
The Atlantic Building
950 F Street, NW
Washington, DC 20004-1404
202-756-3300
Fax:202-756-3333
www.alston.com
| Dennis O. Garris | 202-756-3452 | E-mail: dennis.garris@alston.com |
April 6, 2010
Via EDGAR Filing
Perry Hindin
Special Counsel
United States Securities and Exchange Commission
Division of Corporation Finance
Office of Mergers and Acquisitions
100 F Street, NE
Washington, D.C. 20549-3628
| Re: | Denny’s Corporation | |
| Preliminary Proxy Statement on Schedule 14A | ||
| Filed March 26, 2010 | ||
| Soliciting Materials on Schedule 14A | ||
| Filed March 19, 2010 | ||
| File No. 000-18051 |
Dear Mr. Hindin:
On behalf of our client, Denny’s Corporation (the “Company”), we are providing this letter to you in response to the comments of the staff of the Division of Corporation Finance (the “Staff”) of the Securities and Exchange Commission (the “Commission”), as set forth in your letter, dated April 1, 2010 (the “Comment Letter”) relating to the filings referenced above. The numbered paragraphs below correspond to the numbered paragraphs in the Comment Letter. To facilitate your review, we have reproduced below in bold the original text of the Staff’s comments, and have included the Company’s responses immediately following such comments.
The Company plans to file a definitive proxy statement which reflects the changes described herein when the Staff has no further comments. Included with this letter are separate pages of the proxy statement showing proposed changes in response to Staff comments that will be incorporated into the definitive proxy statement.
Atlanta • Charlotte • Dallas • Los Angeles • New York • Research Triangle • Silicon Valley • Ventura County • Washington, D.C.
Denny’s Corporation
Response to SEC Staff Comments
April 6, 2010
Page 2
PREC14A filed March 26, 2010
General
| 1. | Please characterize each statement or assertion of opinion or belief as such, and ensure that a reasonable basis for each opinion or belief exists. In addition, support for opinions or beliefs should be self-evident, disclosed in your materials or provided to the staff on a supplemental basis with a view toward disclosure. We cite the following examples of statements or assertions in your materials which require supplemental support and which may need to be recharacterized as statements of belief or opinion: |
| • | the characterization of Oak Street Capital Master Fund, Ltd. and certain of its affiliates as “activist” hedge funds in the cover letter; |
| • | assertions regarding Mr. Marchioli’s accomplishments and performance while at Denny’s as referenced in (i) through (v) of Mr. Marchioli’s biography; and, |
| • | the Board’s belief that the 2004 restructuring and refinancing plan led by Mr. Marks washighlysuccessful (emphasis added). |
On behalf of the Company, we submit that the Company has a reasonable basis for each of the opinions and beliefs expressed in the preliminary proxy statement. For convenience of reference, the Company’s responses to the Staff’s specific concerns appear immediately following each of the Staff’s comments, which are reproduced below:
| • | the characterization of Oak Street Capital Master Fund, Ltd. and certain of its affiliates as “activist” hedge funds in the cover letter; |
On behalf of the Company, we submit that the term “activist” is commonly used to describe those shareholders who acquire and hold securities with the purpose of changing or influencing control of an issuer, as Oak Street Capital Master Fund, Ltd. (“Oak Street”) and its affiliates have done with Denny’s. As such, this is not a characterization of Oak Street by the Company, but rather a self-evident description of Oak Street’s ongoing activities. The news media, including financial publications, regularly refer to hedge funds that wage proxy contests as “activists.” Additionally, the Commission itself has recognized the difference of a passive investor and an active or activist investor. For example, in a speech delivered on November 20, 2007, while a member of the Commission, Paul S. Atkins referred to hedge funds, in the context of their seeking to
- 2 -
Denny’s Corporation
Response to SEC Staff Comments
April 6, 2010
Page 3
influence the decision-making of individual companies, as “activist hedge funds.”1 Similarly, Roel C. Campos, while a Commissioner, used the term “activist hedge funds” to describe hedge funds that, among other things, attempt to negotiate with management before seeking to replace directors or other executives with their own candidates.2 The Staff of the Commission has also used the term “activist” to describe investors who attempt to influence a company’s decision making.3 Furthermore, when the SEC amended Regulation 13D-G, it characterized those eligible to file a Schedule 13G pursuant to Rule 13d-1(c) as “passive investors.”4 Under that rule, to certify as a “passive investors” such shareholders may not be engaged in activities similar to those of Oak Street. In addition, in the Proxy Access Proposing Release issued earlier this year, the SEC referred to “activist shareholders” gaining representation on the board of directors of an issuer “through actual or threatened proxy contests.”5 This is precisely the activity that Oak Street has undertaken with respect to the Company.
As such, the support for the Company’s reference to Oak Street as an activist hedge fund is self-evident, as the term “activist” is a widely accepted term to describe the activities of Oak Street.
| • | assertions regarding Mr. Marchioli’s accomplishments and performance while at Denny’s as referenced in (i) through (v) of Mr. Marchioli’s biography; and, |
Mr. Marchioli’s accomplishments in his biography have been revised. The basis for the factual assertions made in Mr. Marchioli’s revised biography is outlined below and has all been previously disclosed in the Company’s public filings.
As measured by the Company’s debt leverage ratio, the Company is in the strongest financial position since the end of the 1980’s. The debt leverage ratio is the ratio between debt and the Company’s EBITDA. In 1989, the Company’s debt leverage ratio was over 20x. From 2005 to 2009, the Company’s debt leverage ratio decreased from 4.9x to 3.0x. During the same period, the Company’s interest coverage ratio increased from 2.2x to 2.9x. The Company’s debt leverage ratio was 9.3x when Mr. Marchioli became CEO in 2001. Additionally, in 2005, the Company had nearly $550 million of debt. In 2009, the Company reduced its debt to $279 million. This represents the Company’s lowest level of debt since 1987.
| 1 | SEC Commissioner Paul S. Atkins, Remarks Before EDHEC Alternative Investment Days 2007 (Nov. 20, 2007), available at:http://www.sec.gov/news/speech/2007/spch112007psa.htm. |
| 2 | SEC Commissioner Roel C. Campos, Remarks before the SIA Hedge Funds & Alternative Investments Conference (Jun 14, 2006), available athttp://www.sec.gov/news/speech/2006/spch061406rcc.htm |
| 3 | See e.g.Chester S. Spatt, Chief Economist and Director, Office of Economic Analysis, Shareholder Voting and Corporate Governance: Economic Perspectives”(Apr. 20, 2007), available athttp://search.sec.gov/secgov/index.jsp#queryResultsTop |
| 4 | Amendments to Beneficial Ownership Reporting Requirements, Release No. 34-39538, 63 Fed. Reg. 2854 (Jan. 16, 1998). |
| 5 | Facilitating Shareholder Director Nominations, Release No. 33-9046, 74 Fed. Reg. 29024, 29074 n. 349 (Jun. 18, 2009). |
- 3 -
Denny’s Corporation
Response to SEC Staff Comments
April 6, 2010
Page 4
As disclosed in its 2005 Annual Report, the Company had 28 consecutive months of increased same-store sales and re-listed on Nasdaq on May 10, 2005. In 2009, the Company achieved a Pre-Tax Adjusted Income of $30 million. In 2001, when Mr. Marchioli became the President and CEO, the Company’s Pre-Tax Adjusted Income was a loss of $45 million. From 2007 to 2009, the Company worked to increase its franchise-to-company unit mix from 66% in 2007 to 85% in 2009 through the Company’s Franchise Growth Initiative. From 2001 to 2009, the Company’s average unit volumes increased 19%.
| • | the Board’s belief that the 2004 restructuring and refinancing plan led by Mr. Marks washighly successful (emphasis added). |
The restructuring and refinancing plan completed in 2004, as discussed on the Company’s Current Report on Form 8-K filed on October 6, 2004, reduced annual cash interest expenses by $26 million annually, extended debt maturities, and increased the Company’s financial flexibility by renegotiating the Company’s revolving credit facility and letters of credit. In this regard, in the view of the Board of Directors of the Company, the restructuring and refinancing headed by Mr. Marks, which included an equity infusion of $92 million; a public bond refinancing of $175 million; and a new senior secured credit facility of $420 million, was highly successful.
Election of Directors, page 6
Nominees for Election as Directors of Denny’s Corporation, page 6
| 2. | We note the participants reserve the right to vote for unidentified substitute nominees. Please confirm for us that should the participants lawfully identify or nominate substitute nominees before the meeting, the participants will file an amended proxy statement that (1) identifies the substitute nominees, (2) discloses whether such nominees have consented to being named in the revised proxy statement and to serve if elected and (3) includes the disclosure required by Items 5(b) and 7 of Schedule 14A with respect to such nominees. |
On behalf of the Company we submit that the disclosure on page 6 of the preliminary proxy statement is intended to address the situation contemplated by the discretionary authority created by Rule 14a-4(c)(5). Should Rule 14a-4(c)(5) not be applicable in a certain circumstance, and should the participants identify or nominate substitute nominees before the meeting, we herby confirm, on behalf of the Company, that the participants will file an amended proxy statement that (1) identifies the substitute nominees, (2) discloses whether such nominees have consented to be named in the revised proxy statement and to serve if elected and (3) includes the disclosure required by Items 5(b) and 7 of Schedule 14A with respect to such nominees.
- 4 -
Denny’s Corporation
Response to SEC Staff Comments
April 6, 2010
Page 5
Other Matters, page 42
| 3. | It appears that you intend to solicit proxies via mail, personally, by telephone or facsimile. Please be advised that all written soliciting materials, including any e-mails or scripts to be used in soliciting proxies must be filed under the cover of Schedule 14A on the date of first use. Refer to Rule 14a-6(b) and (c). Please confirm your understanding. |
On behalf of the Company, we hereby confirm that under Rule 14a-6(b) and (c), all written soliciting materials, including any e-mails or scripts to be used in soliciting proxies over the telephone or any other medium, must be filed under the cover of Schedule 14A on the date of first use.
| 4. | It would appear that you also intend to solicit proxies via the Internet. Please revise to clarify or advise. Further, please tell us whether you plan to solicit via Internet chat rooms and if so, please tell us which websites you plan to utilize. |
The Company may post material that may be considered soliciting material on its investor relations website, athttp://ir.dennys.com. The Company does not otherwise intend to solicit proxies via Internet chat rooms. The Company understands its obligation to file with the Commission any written communications that constitute soliciting material.
Soliciting Materials filed March 19, 2010
| 5. | Support for each statement or assertion of opinion or belief must be self-evident, disclosed in the proxy materials, or provided to the staff on a supplemental basis. Please provide support for the following statements made in the presentation: |
| • | point 4 of the “Overview” slide and the bullet points thereunder regarding Denny’s “improved investment thesis”; |
| • | data supporting the assertion of exceptional Denny’s brand awareness as outlined in the bullet points; |
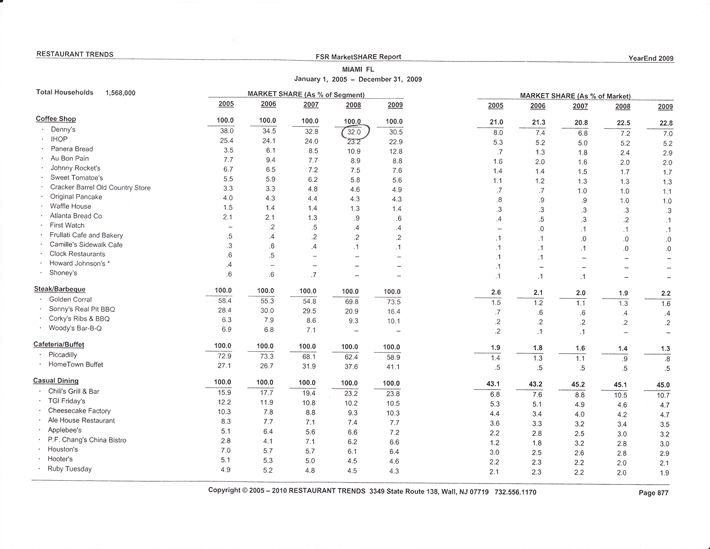
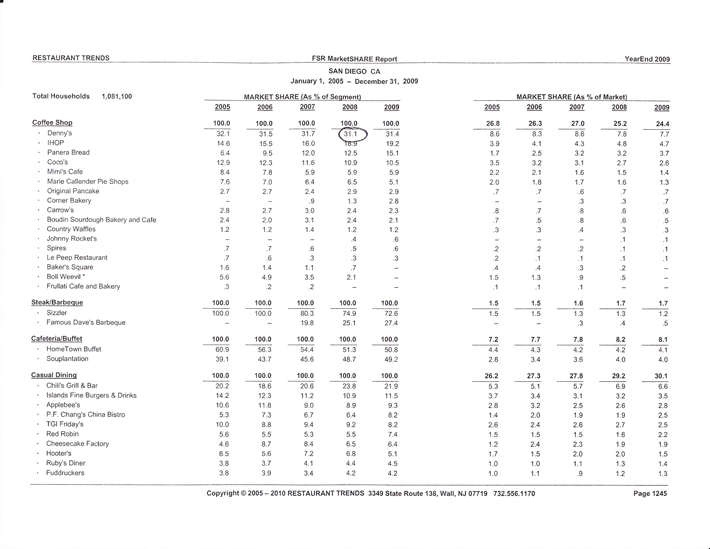
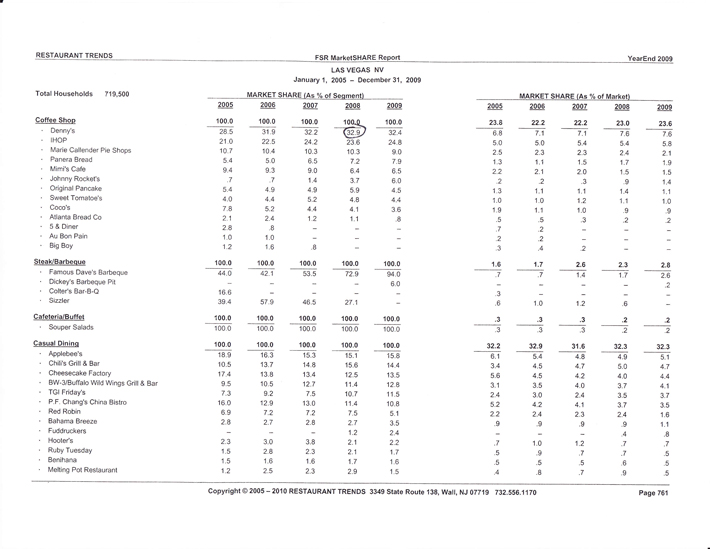
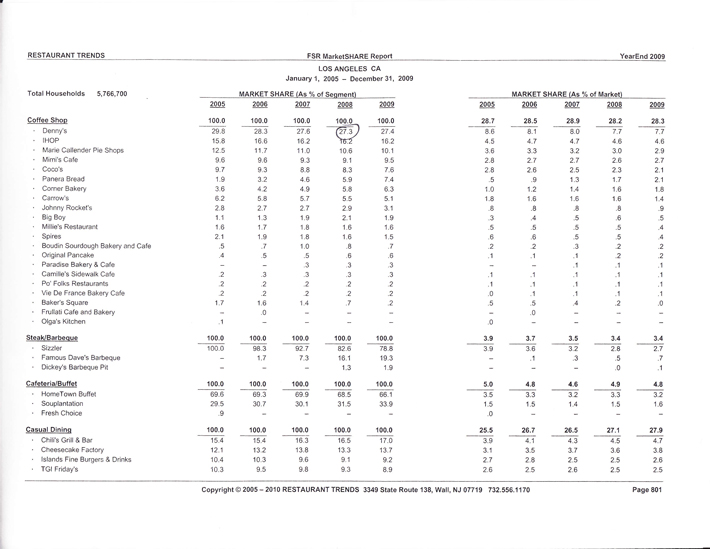
| • | Denny’s market share statistics; and, |
| • | Denny’s ongoing transformation as evidenced by “greater financial flexibility”. |
Where the basis of support is other documents, please provide either complete copies of the documents or sufficient pages of information so that we can assess the context of the information upon which you rely. Mark any supporting documents provided to identify the specific information
- 5 -
Denny’s Corporation
Response to SEC Staff Comments
April 6, 2010
Page 6
relied upon, such as quoted statements, financial statement line items, press releases, and mathematical computations, and identify the sources of all data utilized.
For convenience of reference, the Company’s responses to the Staff’s specific concerns appear immediately following each of the Staff’s comments, which are reproduced below:
| • | point 4 of the “Overview” slide and the bullet points thereunder regarding Denny’s “improved investment thesis”; |
The following investment initiatives by the Company provide support for the statement that the Company’s improved investment thesis has led to a materially reduced risk profile, as well as a greater ability to flow sales through to earnings and free cash flow. The following results have been publicly reported by the Company in various filings with the SEC.
First, under its Franchise Growth Initiative, since 2007, Denny’s has migrated from a franchise percent of its unit mix from 66% to 85%. This migration of franchise unit mix, and the associated sale of lower-volume less-profitable Company restaurants, allowed the Company to optimize its restaurant portfolio while expanding its brand. Second, the Company’s adjusted income before tax has increased sequentially since 2000. Third, the Company’s restaurant unit development was up to 40 units in 2009, the highest rate of development since 2001. Fourth, the net restaurant unit growth in 2009 was over 10, the highest since 2000. Fifth, the return on assets (adjusted income before tax/assets) has increased sequentially since 2000. Finally, the Company’s total debt was reduced almost 50% since 2005.
| • | data supporting the assertion of exceptional Denny’s brand awareness as outlined in the bullet points; |
As noted in the Company’s soliciting material, the Company based its assertion regarding its brand awareness on data provided by Brand Tracker, the Company’s proprietary market research service. Brand Tracker conducted market research of consumers who had dined at a family style restaurant within the month prior to the survey. In the first and second quarters of 2009, 98% and 99%, respectively, of those surveyed had heard of Denny’s prior to the survey. This brand awareness is significantly above all but one of the Company’s competitors included in the survey and therefore supports the Company’s assertion that the Company’s brand awareness is exceptional.
The specific information of the survey is set forth below:
Q1 and Q2 09 Tracker Data
Sample: Consumers who have dined at a Family Style Restaurant in the Past Month.
- 6 -
Denny’s Corporation
Response to SEC Staff Comments
April 6, 2010
Page 7
Q.15Which of the following family style restaurants had you heard of prior to this survey? (Yes or No response)
| % saying Yes | % saying Yes | |||||
| Aided Awareness Q1 N=1579 | Aided Awareness Q2 N=1653 | |||||
Denny’s | 98 | % | 99 | % | ||
IHOP | 98 | % | 99 | % | ||
Cracker Barrel | 77 | % | 78 | % | ||
Waffle House | 77 | % | 78 | % | ||
Perkins | 48 | % | 50 | % | ||
Bob Evans | 49 | % | 49 | % | ||
Marie Callender | 47 | % | 45 | % | ||
Cocos | 29 | % | 28 | % | ||
Village Inn | 28 | % | 28 | % | ||
Carrows | 27 | % | 27 | % |
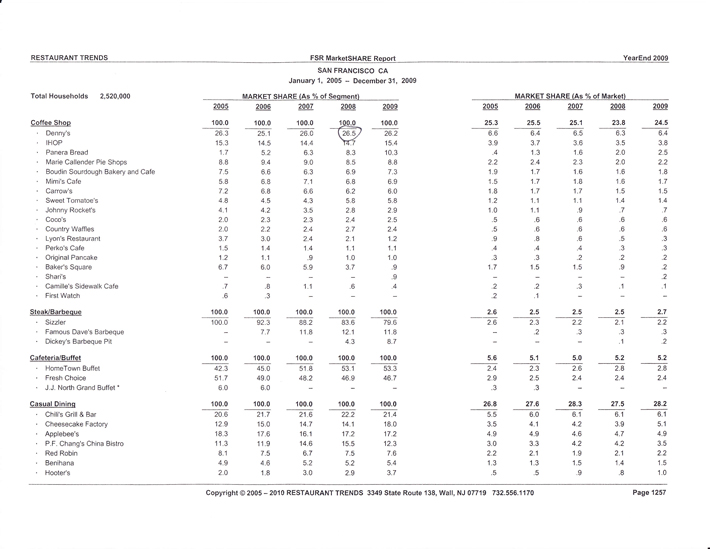
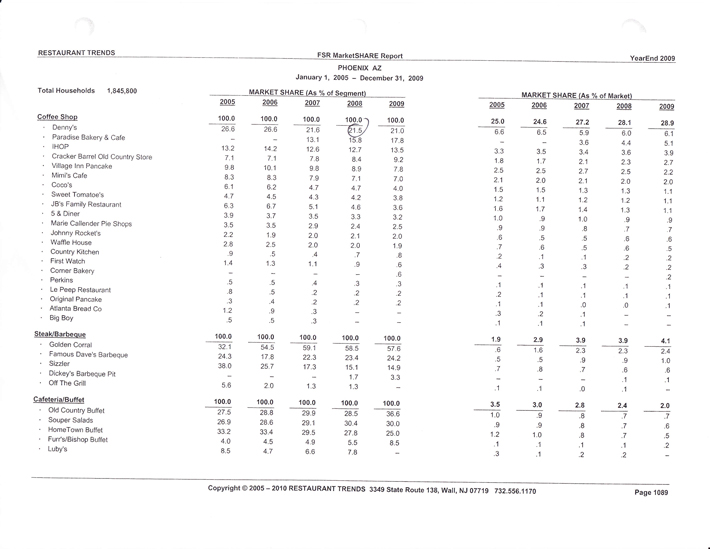
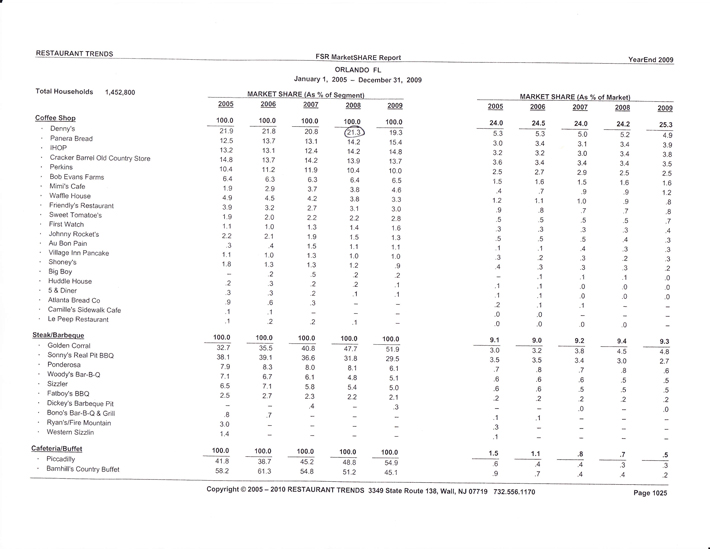
| • | Denny’s market share statistics; and, |
We are attaching statistics created by Restaurant Trends, which demonstrate Denny’s market share statistics for the last five completed fiscal years.
| • | Denny’s ongoing transformation as evidenced by “greater financial flexibility”. |
The Company’s “Greater Financial Flexibility” is based on a number of factors. Since 2005, the Company has reduced its total debt from nearly $550 million of debt to $279 million in 2009. This represents the Company’s lowest level of debt since 1987. Total debt was $650 million in 2001. Additionally, the Company’s debt leverage ratio commensurately decreased from 4.9x EBITDA in 2005 to 3.0x in 2009. The debt leverage ratio was 9.3x in 2001. The Company’s interest coverage ratio went from 2.2x in 2005 to 2.9x in 2009. The restructuring and refinancing plan completed in 2004, as discussed on the Company’s Current Report on Form 8-K filed on October 6, 2004, reduced annual cash interest expenses by $26 million annually, extended debt maturities, and increased the Company’s financial flexibility by renegotiating the Company’s revolving credit facility and letters of credit. Furthermore, the increase of its franchise-to-company unit mix from 66% in 2007 to 85% in 2009 has allowed the generated greater free cash flow and greater profitability. These results have been publicly reported by the Company in various filings with the SEC.
- 7 -
Denny’s Corporation
Response to SEC Staff Comments
April 6, 2010
Page 8
Closing Comments
As requested in the Comment Letter, on behalf of the Company and the participants, we hereby acknowledge that:
| • | the participants are responsible for the adequacy and accuracy of the disclosure in the filing; |
| • | Staff comments or changes to disclosure in response to Staff comments do not foreclose the Commission from taking any action with respect to the filing; and |
| • | the participants may not assert Staff comments as a defense in any proceeding initiated by the Commission or any person under the federal securities laws of the United States. |
Should you have any questions regarding the foregoing, please do not hesitate to contact me at (202) 756-3452.
| Sincerely, |
| /s/ Dennis O. Garris |
| Dennis O. Garris |
Enclosure
- 8 -
RESTAURANT TRENDS FSR MarketSHARE Report YearEnd 2009
MIAMI FL January 1, 2005 - December 31, 2009
Total Households 1,568,000 MARKET SHARE (As % of Segment) MARKET SHARE (As % of Market)
2005 2006 2007 2008 2009 2005 2006 2007 2008 2009
Coffee Shop 100.0 100,0 100.0 100.0 100.0 21.0 21.3 20.8 22.5 22.8
• Denny’s 38.0 34.5 32.8 32.0 30.5 8.0 7.4 6.8 7.2 7.0
• IHOP 25.4 24.1 24.0 23.2 22.9 5.3 5.2 5.0 5.2 5.2
• Panera Bread 3.5 6.1 8.5 10.9 12.8 .7 1.3 1.8 2.4 2.9
• Au Bon Pain 7.7 9.4 7.7 8.9 8.8 1.6 2.0 1.6 2.0 2.0
• Johnny Rocket’s 6.7 6.5 7.2 7.5 7.6 1.4 1.4 1.5 1.7 1.7
• Sweet Tomatoe’s 5.5 5.9 6.2 5.8 5.6 1.1 1.2 1.3 1.3 1.3
• Cracker Barrel Old Country Store 3.3 3.3 4.8 4.6 4.9 .7 .7 1.0 1.0 1.1
• Original Pancake 4.0 4.3 4.4 4.3 4.3 .8 .9 .9 1.0 1.0
• Waffle House 1.5 1.4 1.4 1.3 1.4 .3 .3 .3 .3 .3
• Atlanta Bread Co 2.1 2.1 1.3 .9 .6 .4 .5 .3 .2 .1
• First Watch .2 .5 .4 .4 .0 .1 .1 .1
• Frullati Cafe and Bakery .5 .4 .2 .2 .2 .1 .1 .0 .0 .0
• Camilla’s Sidewalk Cafe .3 .6 .4 .1 .1 .1 .1 .1 .0 .0
• Clock Restaurants .6 ..5 .1 .1
• Howard Johnson’s * .4 .1 - -
• Shoney’s .6 .6 .7 .1 .1 .1
Steak/Barbeque 100.0 100.0 100.0 100.0 100.0 2.6 2.1 2.0 1.9 2.2
• Golden Corral 58.4 55.3 54.8 69.8 73.5 1.5 1..2 1.1 1.3 1.6
• Sonny’s Real Pit BBQ 28.4 30.0 29.5 20.9 16.4 .7 .6 .6 .4 .4
• Corky’s Ribs & BBQ 6.3 7.9 8.6 9.3 10.1 .2 .2 ..2 .2 .2
• Woody’s Bar-B-Q 6.9 6.8 7.1 - .2 .1 .1
Cafeteria/Buffet 100.0 100.0 100.0 100.0 100.0 1.9 1.8 1.6 1.4 1.3
• Piccadilly 72.9 73.3 68.1 62.4 58.9 1.4 1.3 1.1 .9 .8
• HomeTown Buffet 27.1 26.7 31.9 37.6 41.1 .5 .5 .5 .5 .5
Casual Dining 100.0 100.0 100.0 100.0 100.0 43.1 43.2 45.2 45.1 45.0
• Chili’s Grill & Bar 15.9 17.7 19.4 23.2 23.8 6.8 7.6 8.8 10.5 10.7
• TGI Friday’s 12.2 11.9 10.8 10.2 10.5 5.3 5.1 4.9 4.6 4.7
• Cheesecake Factory 10.3 7.8 8.8 9.3 10.3 4.4 3.4 4.0 4.2 4.7
• Ale House Restaurant 8.3 7.7 7.1 7.4 7.7 3.6 3.3 3.2 3.4 3.5
• Applebee’s 5.1 6.4 5.6 6.6 7.2 2.2 2.8 2.5 3.0 3.2
• P.F. Chang’s China Bistro 2.8 4.1 7.1 6.2 6.6 1.2 1.8 3.2 2.8 3.0
• Houston’s 7.0 5.7 5.7 6.1 6.4 3.0 2.5 2.6 2.8 2.9
• Hooter’s 5.1 5.3 5.0 4.5 4.6 2.2 2.3 2.2 2.0 2.1
• Ruby Tuesday 4.9 5.2 4.8 4.5 4.3 2.1 2.3 2.2 2.0 1.9
Copyright ©2005-2010 RESTAURANT TRENDS 3349 State Route 138, Wall, NJ 07719 732.556.1170 Page 877
RESTAURANT TRENDS FSR MarketSHARE Report YearEnd 2009
SAN DIEGO CA January 1, 2005 - December 31, 2009
Total Households 1,081,100 MARKET SHARE (As % of Segment) MARKET SHARE (As % of Market)
2005 2006 2007 2008 2009 2005 2006 2007 2008 2009
Coffee Shop 100.0 100.0 100.0 100.0 100.0 26.8 26.3 27.0 25.2 24.4
• Denny’s 32.1 31.5 31.7 31.1 31.4 8.6 8.3 8.6 7.8 7.7
• IHOP 14.6 15.5 16.0 18.9 19.2 3.9 4.1 4.3 4.8 4.7
• Panera Bread 6.4 9.5 12.0 12.5 15.1 1.7 2.5 3.2 3.2 3.7
• Coco’s 12.9 12.3 11.6 10.9 10.5 3.5 3.2 3.1 2.7 2.6
• Mimi’sCafe 8.4 7.8 5.9 5.9 5.9 2.2 2.1 1.6 1.5 1.4
• Marie Callender Pie Shops 7.6 7.0 6.4 6.5 5.1 2.0 1.8 1.7 1.6 1.3
• Original Pancake 2.7 2.7 2.4 2.9 2.9 .7 .7 .6 .7 .7
• Corner Bakery - - .9 1.3 2.8 - - .3 .3 .7
• Carrow’s 2.8 2.7 3.0 2.4 2.3 .8 .7 .8 .6 .6
• Boudin Sourdough Bakery and Cafe 2.4 2,0 3.1 2.4 2.1 .7 .5 .8 .6 .5
• Country Waffles 1.2 1.2 1.4 1.2 1.2 .3 .3 .4 .3 .3
• Johnny Rocket’s - - - .4 .6 - - .1 .1
• Spires .7 .7 .6 .5 .6 .2 .2 .2 .1 .1
• Le Peep Restaurant .7 .6 .3 .3 .3 .2 .1 .1 .1 .1
• Baker’s Square 1.6 1.4 1.1 .7 - .4 .4 .3 .2-
• Boil Weevil* 5.6 4.9 3.5 2.1 - 1.5 1.3 .9 .5 -
• Frullati Cafe and Bakery .3 .2 .2 - - .1 .1 .1- -
Steak/Barbeque 100.0 100.0 100.0 100.0 100.0 1.5 1.5 1.6 1.7 1.7
• Sizzler 100.0 100.0 80.3 74.9 72.6 1.5 15 1.3 1.3 1.2
• Famous Dave’s Barbeque 19.8 25.1 27.4 .3 .4 .5
Cafeteria/Buffet 100.0 100.0 100.0 100.0 100.0 7.2 7.7 7.8 8.2 8.1
• HomeTown Buffet 60.9 56.3 54.4 51.3 50.8 4.4 4..3 4.2 4.2 4.1
• Souplantation 39.1 43.7 45.6 48.7 49.2 2.8 3.4 3.6 4.0 4.0
Casual Dining 100.0 100.0 100.0 100.0 100.0 26.2 27.3 27.8 29.2 30.1
• Chili’s Grill & Bar 20.2 18.6 20.6 23.8 21.9 5.3 5.1 5.7 6.9 6.6
• Islands Fine Burgers & Drinks 14.2 12.3 11.2 10.9 11.5 3.7 3.4 3.1 3.2 3.5
• Applebee’s 10.6 11.8 9.0 8.9 9.3 2.8 3.2 2.5 2.6 2.8
• P.F. Chang’s China Bistro 5.3 7.3 6.7 6.4 8.2 1.4 2.0 1.9 1.9 2.5
• TGI Friday’s 10.0 8.8 9.4 9.2 8.2 2.6 2.4 2.6 2.7 2.5
• Red Robin 5.6 5.5 5.3 5.5 7.4 1.5 1.5 1.5 1.6 2.2
• Cheesecake Factory 4.6 8.7 8.4 6.5 6.4 1.2 2.4 2.3 1.9 1.9
• Hooter’s 6.5 5.6 7.2 6.8 5.1 1.7 1.5 2.0 2.0 1.5
• Ruby’s Diner 3.8 3.7 4.1 4.4 4.5 1.0 1.0 1.1 1.3 1.4
• Fuddruckers 3.8 3.9 3.4 4.2 4.2 1.0 1.1 .9 1.2 1.3
Copyright ©2005-2010 RESTAURANT TRENDS 3349 State Route 138, Wall, NJ 07719 732.556.1170 Page 1245
RESTAURANT TRENDS FSR MarketSHARE Report YearEnd 2009
LAS VEGAS NV January 1, 2005 - December 31, 2009
Total Households 719,500 MARKET SHARE (As % of Segment) MARKET SHARE (As % of Market)
2005 2006 2007 2008 2009 2005 2006 2007 2008 2009
Coffee Shop 100.0 100.0 100.0 100.0 100.0 23’8 22’2 22.2 23.0 23.6
• Denny’s 28.5 31.9 32.2 32.9 32.4 6.8 7.1 7.1 7.6 7.6
• IHOP 21.0 22.5 24.2 23.6 24.8 5.0 5.0 5.4 5.4 5.8
• Marie Callender Pie Shops 10.7 10.4 10.3 10.3 9.0 2.5 2.3 2.3 2.4 2.1
• Panera Bread 5.4 5.0 6.5 7.2 7.9 1.3 1.1 1.5 1.7 1.9
• Mimi’s Cafe 9.4 9.3 9.0 6.4 6.5 2.2 2.1 2.0 1.5 1.5
• Johnny Rocket’s .7 .7 1.4 3.7 6.0 .2 .2 .3 .9 1.4
• Original Pancake 5.4 4.9 4.9 5.9 4.5 1.3 1.1 1.1 1.4 1.1
• Sweet Tomatoe’s 4.0 4.4 5.2 4.8 4.4 1.0 1.0 1.2 1.1 1.0
• Coco’s 7.8 5.2 4.4 4.1 3.6 1.9 1.1 1.0 .9 .9
• Atlanta Bread Co 2.1 2.4 1.2 1.1 .8 .5 .5 .3 .2 .2
• 5 & Diner 2.8 .8 .7 .2 - - -
• Au Bon Pain 1.0 1.0 .2 .2 - - -
• Big Boy 1.2 1.6 .8 .3 .4 .2 - -
Steak/Barbeque 100.0 100.0 100.0 100.0 100.0 1.6 1.7 2.6 2.3 2.8
• Famous Dave’s Barbeque 44.0 42.1 53.5 72.9 94.0 .7 .7 1.4 1.7 2.6
• Dickey’s Barbeque Pit - - - - 6.0 - - - - .2
• Colter’s Bar-B-Q 16.6 - - - - .3 - - - -
• Sizzler 39.4 57.9 46.5 27.1 - .6 1.0 1.2 .6 -
Cafeteria/Buffet 100.0 100.0 100.0 100.0 100.0 .3 .3 .3 .2
Souper Salads 100.0 100.0 100.0 100.0 100.0 .3 .3 .3 .2 .2
Casual Dining 100.0 100.0 100.0 100.0 100.0 32.2 32.9 31.6 32.3 32.3
• Applebee’s 18.9 16.3 15.3 15.1 15.8 6.1 5.4 4.8 4.9 5.1
• Chili’s Grill & Bar 10.5 13.7 14.8 15.6 14.4 3.4 4.5 4.7 5.0 4.7
• Cheesecake Factory 17.4 13.8 13.4 12.5 13.5 5.6 4.5 4.2 4.0 4.4
• BW-3/Buffalo Wild Wings Grill & Bar 9.5 10.5 12.7 11.4 12.8 3.1 3.5 4.0 3.7 4.1
• TGI Friday’s 7.3 9.2 7.5 10.7 11.5 2.4 3.0 2.4 3.5 3.7
• P.F. Chang’s China Bistro 16.0 12.9 13.0 11.4 10.8 5.2 4.2 4.1 3.7 3.5
• Red Robin 6.9 7.2 7.2 7.5 5.1 2.2 2.4 2.3 2.4 1.6
• Bahama Breeze 2.8 2.7 2.8 2.7 3.5 .9 .9 .9 .9 1.1
• Fuddruckers - 1.2 2.4 .4 .8
• Hooter’s 2.3 3.0 3.8 2.1 2.2 .7 1.0 1.2 .7 .7
• Ruby Tuesday 1.5 2.8 2.3 2.1 1.7 .5 .9 .7 .7 .5
• Benihana 1.5 1.6 1.6 1.7 1.6 .5 ..5 .5 .6 .5
• Melting Pot Restaurant 1.2 2.5 2.3 2.9 1.5 .4 .8 .7 .9 .5
Copyright ©2005-2010 RESTAURANT TRENDS 3349 State Route 138, Wall, NJ 07719 732.556.1170 Page 761
RESTAURANT TRENDS FSR MarketSHARE Report YearEnd 2009
LOS ANGELES CA January 1, 2005 December 31, 2009
Total Households 5,766,700 MARKET SHARE (As % of Segment) MARKET SHARE (As % of Market)
2005 2006 2007 2008 2009 2005 2006 2007 2008 2009
Coffee Shop 100.0 100.0 100.0 100.0 100.0 28.7 28.5 28.9 28.2 28.3
Denny’s 29.8 28.3 27.6 27.3 27.4 8.6 8.1 8.0 7.7 7.7
IHOP 15.8 16.6 16.2 16.2 16.2 4.5 4.7 4.7 4.6 4.6
Marie Callender Pie Shops 12.5 11.7 11.0 10.6 10.1 3.6 3.3 3.2 3.0 2.9
Mimi’s Cafe 9.6 9.6 9.3 9.1 9.5 2.8 2.7 2.7 2.6 2.7
Coco’s 9.7 9.3 8.8 8.3 7.6 2.8 2.6 2.5 2.3 2.1
Panera Bread 1.9 3.2 4.6 5.9 7.4 .5 .9 1.3 1.7 2.1
Corner Bakery 3.6 4.2 4.9 5.8 6.3 1.0 1.2 1.4 1.6 1.8
Carrow’s 6.2 5.8 5.7 5.5 5.1 1.8 1.6 1.6 1.6 1.4
Johnny Rocket’s 2.8 2.7 2.7 2.9 3.1 .8 .8 .8 .8 .9
Big Boy 1.1 1.3 1.9 2.1 1.9 .3 .4 .5 .6 .5
Millie’s Restaurant 1.6 1.7 1.8 1.6 1.6 .5 .5 .5 .5 .4
Spires 2.1 1.9 1.8 1.6 1.5 .6 .6 .5 .5 .4
Boudin Sourdough Bakery and Cafe .5 .7 1.0 .8 .7 .2 ..2 .3 .2 .2
Original Pancake .4 .5 .5 .6 .6 .1 .1 .1 .2 .2
Paradise Bakery & Cafe - - .3 .3 .3 - - .1 .1 .1
Camille’s Sidewalk Cafe .2 .3 .3 .3 .3 .1 .1 .1 .1 .1
Po’Folks Restaurants .2 .2 .2 .2 .2 .1 .1 .1 .1 .1
Vie De France Bakery Cafe .2 .2 .2 .2 .2 .0 .1 .1 .1 .1
Baker’s Square 1.7 1.6 1.4 .7 .2 .5 .5 .4 .2 .0
Frullati Cafe and Bakery - .0 - - - - .0 - -
Olga’s Kitchen .1 - - - - .0 - - - -
Steak/Barbeque 100.0 100.0 100.0 100.0 100.0 3.9 3.7 3.5 3.4 3.4
Sizzler 100.0 98..3 92.7 82.6 78.8 3..9 3.6 3.2 2.8 2.7
Famous Dave’s Barbeque - 1.7 7.3 16.1 19.3 -.1 .3 .5 .7
Dickey’s Barbeque Pit - - - 1.3 1.9 - - - .0 .1
Cafeteria/Buffet 100.0 100.0 100.0 100.0 100.0 5.0 4.8 4.6 4.9 4.8
HomeTown Buffet 69.6 69.3 69.9 68.5 66.1 3.5 3.3 32 3.3 3.2
Souplantation 29.5 30.7 30.1 31.5 33.9 1.5 1.5 1.4 1.5 1.6
Fresh Choice .9 - - - - .0 - - - -
Casual Dining 100.0 100.0 100.0 100.0 100.0 25.5 26.7 26.5 27.1 27.9
Chili’s Grill & Bar 15.4 15.4 16.3 16.5 17.0 3.9 4.1 4.3 4.5 4.7
Cheesecake Factory 12.1 13.2 13.8 13.3 13.7 3.1 3.5 3.7 3.6 3.8
Islands Fine Burgers & Drinks 10.4 10.3 9.6 9.1 9.2 2.7 2.8 2.5 2.5 2.6
TGI Friday’s 10.3 9.5 9.8 9.3 8.9 2.6 2.5 2.6 2.5 2.5
Copyright ©2005-2010 RESTAURANT TRENDS 3349 State Route 138, Wall, NJ 07719 732.556.1170 Page 801
RESTAURANT TRENDS FSR MarketSHARE Report YearEnd 2009
SAN FRANCISCO CA January 1, 2005 - December 31, 2009
Total Households 2,520,000 MARKET SHARE (As % of Segment) MARKET SHARE (As % of Market)
2005 2006 2007 2008 2009 2005 2006 2007 2008 2009
Coffee Shop 100.0 100.0 100.0 100.0 100.0 25.3 25.5 25.1 23.8 24.5
Denny’s 26.3 25.1 26.0 26.5 26.2 6.6 6.4 6.5 6.3 6.4
IHOP 15.3 14.5 14.4 14.7 15.4 3.9 3.7 3.6 3.5 3.8
Panera Bread 1.7 5.2 6.3 8.3 10.3 .4 1.3 1.6 2.0 2.5
Marie Callender Pie Shops 8.8 9.4 9.0 8.5 8.8 2.2 2.4 2.3 2.0 2.2
Boudin Sourdough Bakery and Cafe 7.5 6.6 6.3 6.9 7.3 1.9 1.7 1.6 1.6 1.8
Mimi’sCafe 5.8 6.8 7.1 6.8 6.9 1.5 1.7 1.8 1.6 1.7
Carrow’s 7.2 6.8 6.6 6.2 6.0 1.8 1.7 1.7 1.5 1.5
Sweet Tomatoe’s 4.8 4.5 4.3 5.8 5.8 1.2 1.1 1.1 1.4 1.4
Johnny Rocket’s 4.1 4.2 3.5 2.8 2.9 1.0 1.1 .9 .7 .7
Coco’s 2.0 2.3 2.3 2.4 2.5 .5 .6 .6 .6 .6
Country Waffles 2.0 2.2 2.4 2.7 2.4 .5 .6 .6 .6 .6
Lyon’s Restaurant 3.7 3.0 2.4 2.1 1.2 .9 .8 .6 .5 .3
Perko’sCafe 1.5 1.4 1.4 1.1 1.1 ..4 .4 .4 .3 .3
Original Pancake 1.2 1.1 .9 1.0 1.0 .3 .3 .2 .2 .2
Baker’s Square 6.7 6.0 5.9 3.7 .9 1.7 1.5 1.5 .9 .2
Shan’s .9 .2
Camiile’s Sidewalk Cafe .7 .8 1.1 .6 .4 .2 .2 .3 .1 .1
First Watch .6 .3 .2 .1
Steak/Barbeque 100.0 100.0 100.0 100.0 100.0 2.6 2.5 2.5 2.5 2.7
Sizzler 100.0 92.3 88.2 83.6 79.6 2.6 2.3 2.2 2.1 2.2
Famous Dave’s Barbeque 7.7 11.8 12.1 11.8 .2 .3 .3 .3
Dickey’s Barbeque Pit 4.3 8.7 .1 .2
Cafeteria/Buffet 100.0 100.0 100.0 100.0 100.0 5.6 5.1 5.0 5.2 5.2
HomeTown Buffet 42.3 45.0 51.8 53.1 53.3 2.4 2.3 2.6 2.8 2.8
Fresh Choice 51.7 49.0 48.2 46.9 46.7 2.9 2.5 2.4 2.4 2.4
J.J. North Grand Buffet* 6.0 6.0 .3 .3
Casual Dining 100.0 100.0 100.0 100.0 100.0 26.8 27.6 28.3 27.5 28.2
Chili’s Grill & Bar 20.6 21.7 21.6 222 21.4 5.5 6.0 6.1 6.1 6.1
Cheesecake Factory 12.9 15.0 14.7 14.1 18.0 3.5 4.1 4.2 3.9 5.1
Applebee’s 18.3 17.6 16.1 17.2 17.2 4.9 4.9 4.6 4.7 4.9
P.F. Chang’s China Bistro 11.3 11.9 14.6 15.5 12.3 3.0 3.3 4.2 4.2 3.5
Red Robin 8.1 7.5 6.7 7.5 7.6 2.2 2.1 1.9 2.1 2.2
Benihana 4.9 4.6 5.2 5.2 5.4 1.3 1.3 1.5 1.4 1.5
Hooter’s 2.0 1.8 3.0 2.9 3.7 .5 .5 .9 .8 1.0
Copyright ©2005-2010 RESTAURANT TRENDS 3349 State Route 138, Wall, NJ 07719 732.556,1170 Page 1257
RESTAURANT TRENDS FSR MarketSHARE Report YearEnd 2009
PHOENIX AZ January 1, 2005 - December 31, 2009
Total Households 1,845,800 MARKET SHARE (As % of Segment) MARKET SHARE (As % of Market)
2QQ5 2006 2007 2008 2009 2005 2006 2007 2008 2009
Coffee Shop 100.0 100.0 100.0 100.0 100.0 25.0 24.6 27.2 28.1 28.9
. Denny’s 26.6 26 213 21.5 21.0 6.6 6.5 5.9 6.0 6.1
• Paradise Bakery & Cafe - - 13.1 15.8 17.8 - - 3.6 4.4 5.1
. IHOP 13.2 14.2 12.6 12.7 13.5 3.3 3.5 3.4 3.6 3.9
• Cracker Barrel Old Country Store 7.1 7.1 7.8 8.4 9.2 1.8 1.7 2.1 2.3 2.7
• Village Inn Pancake 9.8 10.1 9.8 8.9 7.8 2.5 2.5 2.7 2.5 2.2
. Mimi’sCafe 8.3 8.3 7.9 7.1 7.0 2.1 2.0 2.1 2.0 2.0
. Coco’s 6.1 6.2 4.7 4.7 4.0 1.5 1.5 1.3 1.3 1.1
• Sweet Tomatoe’s 4.7 4.5 4.3 4.2 3.8 1.2 1.1 1.2 1.2 1.1
• JB’s Family Restaurant 6.3 6.7 5.1 4.6 3.6 1.6 1.7 1.4 1.3 1.1
. 5 & Diner 3.9 3.7 3.5 3.3 3.2 1.0 .9 1.0 .9 .9
• Marie Caliender Pie Shops 3.5 3.5 2.9 2.4 2.5 .9 .9 .8 .7 .7
• Johnny Rocket’s 2.2 1.9 2.0 2.1 2.0 .6 .5 .5 .6 .6
• Waffle House 2.8 2.5 2.0 2.0 1.9 -7 .6 .5 .6 .5
• Country Kitchen .9 .5 .4 .7 .8 .2 .1 .1
• First Watch 1.4 1.3 1.1 .9 .6 .4 .3 .3 .2 -
• Corner Bakery - - - - .6 - - - - .2
• Perkins .5 .5 .4 .3 .3 .1 .1 .1 .1
• Le Peep Restaurant .8 .5 .2 .2 .2 .2 .1 .1 .1 .1
• Original Pancake .3 .4 .2 .2 .2 .1 .1 .0 .0 .1
• Atlanta Bread Co 1.2 .9 .3 - - .3 .2 .1 --
• Big Boy .5 .5 .3 - - .1 .1 -1 - -
Steak/Barbeque 100.0 100.0 100.0 100.0 100.0 1.9 2.9 3.9 3.3 4.1
• Golden Corral 32.1 54.5 59.1 58.5 57.6 .6 1.6 2.3 2.3 2.4
• Famous Dave’s Barbeque 24.3 17.8 22.3 23.4 24.2 .5 .5 .9 .9 1.0
• Sizzler 38.0 25.7 17.3 15.1 14.9 .7 .8 .7 .6 .6
• Dickey’s Barbeque Pit - -- 1.7 3.3 - - -.1 .1
• Off The Grill 5.6 2.0 1.3 1.3 .1 .1 .0 .1 -
Cafeteria/Buffet 100.0 100.0 100.0 100.0 10 -0.0 3.5 3.0 2.8 2.4 2-0
• Old Country Buffet 27.5 28.8 29.9 28.5 36.6 1.0 .9 .8 .7 .7
• Souper Salads 26.9 28.6 29.1 30.4 30.0 .9 .9 .8 .7 .6
• HomeTown Buffet 33.2 33.4 29.5 27.8 25.0 1.2 1.0 .8 .7 .5
• Furr’s/Bishop Buffet 4.0 4.5 4.9 5.5 8.5 .1 .1 .1 .1 -2
• Luby’s 8.5 4.7 6.6 7.8 - .3 .1 .2 .2 -
Copyright ©2005-2010 RESTAURANT TRENDS 3349 State Route 138, Wall, NJ 07719 732.556.1170 Page 1089
RESTAURANT TRENDS FSR MarketSHARE Report __ YearEnd 2009
ORLANDO FL January 1, 2005 December 31, 2009
Total Households 1,452,800 MARKET SHARE (As % of Segment) MARKET SHARE (As % of Market)
2005 2006 2007 2008 2009 2005 2006 2007 2008 2009
Coffee Shop 100.0 100.0 100.0 100.0 100.0 24.0 24.5 24.0 24.2 25.3
• Denny’s 21.9 21.8 20.8 21.3 19.3 5.3 5.3 5.0 5.2 4.9
• Panera Bread 12.5 13.7 13.1 14.2 15.4 3.0 3.4 3.1 3.4 3.9
• IHOP 13.2 13.1 12.4 14.2 14.8 3.2 3.2 3.0 3.4 3.8
• Cracker Barrel Old Country Store 14.8 13.7 14.2 13.9 13.7 3.6 3.4 3.4 3.4 3.5
• Perkins 10.4 11.2 11.9 10.4 10.0 2.5 2.7 2.9 2.5 2.5
• Bob Evans Farms 6.4 6.3 6.3 6.4 6.5 1.5 1.6 1.5 1.6 1.6
• Mimi’sCafe 1.9 2.9 3.7 3.8 4.6 .4 .7 .9 .9 1.2
• Waffle House 4.9 4.5 4.2 3.8 3.3 1.2 1.1 1.0 .9 .8
• Friendly’s Restaurant 3.9 3.2 2.7 3.1 3.0 .9 .8 .7 .7 .8
• Sweet Tomatoe’s 1.9 2.0 2.2 2.2 2.8 .5 .5 .5 .5 .7
• First Watch 1.1 1.0 1.3 1.4 1.6 .3 .3 .3 .3 .4
• Johnny Rocket’s 2.2 2.1 1.9 1.5 1.3 .5 .5 .5 .4 .3
• Au Bon Pain .3 .4 1.5 1.1 1.1 .1 .1 .4 .3 .3
• Village Inn Pancake 1.1 1.0 1.3 1.0 1.0 .3 .2 .3 .2 .3
• Shoney’s 1.8 1.3 1.3 1.2 .9 .4 .3 .3 .3 .2
. Big Boy - .2 .5 .2 .2 - . 1 .1 .1 .0
• Huddle House .2 .3 .2 .2 .1 .1 .1 .0 .0 .0
• 5 & Diner .3 .3 .2 .1 .1 .1 .1 .0 .0 .0
• Atlanta Bread Co .9 .6 .3 - - .2 .1 ..1 - -
• Camille’s Sidewalk Cafe .1 .1 - - - .0 .0 - - -
• Le Peep Restaurant .1 .2 .2 .1 - .0 .0 .0 .0 -
Steak/Barbeque 100.0 100.0 100.0 100.0 100.0 9.1 9.0 9.2 9.4 9-3
• Golden Corral 32.7 35.5 40.8 47.7 51.9 3.0 3.2 3.8 4.5 4.8
• Sonny’s Real Pit BBQ 38.1 39.1 36.6 31.8 29.5 3.5 3.5 3.4 3.0 2.7
• Ponderosa 7.9 8.3 8.0 8.1 6.1 .7 .8 .7 .8 .6
• Woody’s Bar-B-Q 7.1 6.7 6.1 4.8 5.1 .6 .6 .6 .5 .5
• Sizzler 6.5 7.1 5.8 5.4 5.0 .6 .6 .5 .5 .5
• Fatboy’s BBQ 2.5 2.7 2.3 2.2 2.1 .2 .2 .2 .2 .2
• Dickey’s Barbeque Pit - - .4 - .3 - - .0 - .0
• Bono’s Bar-B-Q & Grill .8 .7 - - - .1 .1 - - -
• Ryan’s/Fire Mountain 3.0 - - - - .3 -- -
• Western Sizzlin 1.4 - - - - .1 - - - -
Cafeteria/Buffet 100.0 100.0 100.0 100.0 100.0 1.5 1.1 .8 .7_ .5
• Piccadilly 41.8 38.7 45.2 48.8 54.9 .6 .4 .4 .3 .3
• Barnhill’s Country Buffet 58.2 61.3 54.8 51.2 45.1 .9 .7 .4 .4 .2
Copyright ©2005-2010 RESTAURANT TRENDS 3349 State Route 138, Wall, NJ 07719 732.556.1170 Page 1025