| UNITED STATES SECURITIES AND EXCHANGE COMMISSION Washington, D.C. 20549 |
| FORM N-CSR CERTIFIED SHAREHOLDER REPORT OF REGISTERED MANAGEMENT INVESTMENT COMPANIES |
| Investment Company Act file number 811- 57347 |
| John Hancock Financial Trends Fund, Inc. (Exact name of registrant as specified in charter) |
| 601 Congress Street, Boston, Massachusetts 02210 (Address of principal executive offices) (Zip code) |
| Alfred P. Ouellette Senior Attorney and Assistant Secretary |
| 601 Congress Street |
| Boston, Massachusetts 02210 (Name and address of agent for service) |
| Registrant's telephone number, including area code: 617-663-4324 |
| Date of fiscal year end: | December 31 |
Date of reporting period: | June 30, 2006 |
| ITEM 1. REPORT TO SHAREHOLDERS. |

| Table of contents |
| Your fund at a glance |
| page 1 |
| Managers’ report |
| page 2 |
| Fund’s investments |
| page 6 |
| Financial statements |
| page 10 |
| For more information |
| page 21 |
Dear Fellow Shareholders,
After producing modest returns in 2005, the stock market advanced smartly in the first four months of 2006. Investors were encouraged by solid corporate earnings, a healthy economy and stable inflation, which suggested the Federal Reserve could be coming close to the end of its two-year campaign of raising interest rates. Those hopes were dashed in May, however, when economic data suggested a resurgence of inflation and more Fed rate hikes. The result was a significant increase in volatility and a market pullback that continued into June, erasing much of the earlier gains. For the first six months of 2006, the market advanced slightly, returning 2.71%, as measured by the Standard & Poor’s 500 Index.
In the midst of the turmoil, financial stocks and the Fund managed to outperform the broad market. As Jim Schmidt reports on the following pages, the Fund produced very competitive returns of 5.19% at net asset value (NAV) through June 30, 2006, and 6.18% at market price — a premium over the NAV return.
With the financial markets’ about-face and increased volatility, it is anyone’s guess where the market will end 2006, especially given the wild cards of interest rate moves and record-high energy prices and their impact on the economy and corporate profits.
One thing we do know, however, is that the stock market’s pattern is one of extremes. Consider the last 10 years. From 1995 through 1999, we saw double-digit returns in excess of 20% per year, only to have 2000 through 2002 produce ever-increasing negative results, followed by another 20%-plus up year in 2004 and a less than 5% advance in 2005. Since 1926, the market, as measured by the Standard & Poor’s 500 Index, has produced average annual results of 10.4% . However, that “normal” return is rarely produced in any given year. In fact, calendar-year returns of 8% to 12% have occurred only five times in the 80 years since 1926.
Given this backdrop of market extremes, we are well aware of the importance of our oversight role. I can assure you that your fund’s Board of Directors will continue to work hard on your behalf, putting your interests above all else.
Sincerely,

| Franklin C. Golden, Chairman of John Hancock Financial Trends Fund, Inc. |
This commentary reflects the chairman’s views as of June 30, 2006. They are subject to change at any time.
| YOUR FUND AT A GLANCE The Fund seeks long-term capital appreciation with current income as a secondary objective by investing at least 80% of its assets in stocks of U.S. and foreign financial services companies of any size. |
| Over the last six months | |
■ | The stock market had a stellar first quarter and then turned |
| sharply down and became more volatile over interest rate and | |
| inflation concerns. | |
■ | Financial stocks held up better than the overall market, in part |
| because they are viewed as a safe haven in volatile times. | |
■ | The Fund’s focus on regional banks, and good selection within the |
| group, helped it outperform its benchmark index and peers. | |
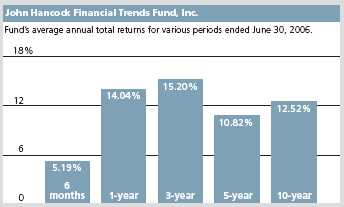
The total returns for the Fund are at net asset value and include the reinvestment of all distributions. The performance data contained within this material represents past performance, which does not guarantee future results.
| Top 10 holdings | |
| 4.5% | Bank of America Corp. |
| 3.0% | Wachovia Corp. |
| 2.9% | Pinnacle Financial Partners, Inc. |
| 2.8% | Wells Fargo & Co. |
| 2.8% | Citigroup, Inc. |
| 2.7% | Zions Bancorp. |
| 2.7% | Prudential Financial, Inc. |
| 2.6% | U.S. Bancorp. |
| 2.5% | SunTrust Banks, Inc. |
| 2.3% | Seacoast Banking Corp. of Florida |
As a percentage of net assets on June 30, 2006.
1
| BY JAMES K. SCHMIDT, CFA, LISA A. WELCH AND ROGER C. HAMILTON, FOR THE SOVEREIGN ASSET MANAGEMENT LLC PORTFOLIO MANAGEMENT TEAM |
| MANAGERS’ REPORT |
| JOHN HANCOCK Financial Trends Fund, Inc. |
Recently Roger Hamilton was named a portfolio manager on the management team, replacing Thomas Finucane, who left the company to pursue other opportunities. In addition to being a member of several other management teams since joining John Hancock in 1994, Mr. Hamilton has worked with the financial investment team for the past two years as an analyst covering the insurance industry.
| “After a spectacular beginning to 2006, the stock market began a downturn in mid-May.” |
After a spectacular beginning to 2006, the stock market began a downturn in mid-May. The first four-plus months saw strong and steady upward progress, with the Dow Jones Industrial Average flirting with a new record high. Its success stemmed from the combination of a strong economy, good corporate earnings growth and still-tame inflation. Even though interest rates kept rising thanks to a two-year rate-hike campaign by the Federal Reserve, investors believed we were soon coming to the end of the cycle. But by mid-May, investor sentiment had changed. Faster-than-expected consumer price increases and robust economic growth led to new infla-tion fears and the belief that more rate increases lay ahead. In addition, comments by the new Fed chairman Ben Bernanke first suggesting an end to the rate-hike cycle and then reversing his stance in May only upped investors’ uncertainty. As a result, the broad market, as represented by the Standard & Poor’s 500 Index, increased only modestly, returning 2.71% for the six months ended June 30, 2006.
Financial stocks held up better than the broad market, returning 3.12% in the same period, as measured by the Standard & Poor’s 500 Financial Index. The financial group was bolstered early in the period by the stellar results of the market-sensitive companies such as investment bankers and asset managers. When this group fell along with the market, regional banks rose to the top in the more volatile second half of the period, as investors viewed them as a safe haven, with their steady, albeit moderate, earnings
2

growth. What’s more, bank stocks benefited from investors’ belief that they would outperform once the Fed’s rate hikes were done.
Fund performance
For the six months ended June 30, 2006, John Hancock Financial Trends Fund, Inc. posted a total return of 5.19% at net asset value and 6.18% at market value. The difference in the Fund’s net asset value (NAV) performance and its market performance stems from the fact that the market share price is subject to the dynamics of secondary market trading, which could cause it to trade at a discount or premium to the Fund’s NAV share price at any time. The Fund’s NAV return exceeded the Fund’s benchmark Standard & Poor’s 500 Financial Index and the 3.68% return of the average open-end Specialty-Financial Services fund, according to Morningstar, Inc.
Bank overweight drives performance
The Fund’s main driver of outperformance of its benchmark index and peers was our overweight in regional banks and good stock selection within that group.
| “The Fund’s main driver of outper- formance of its benchmark index and peers was our overweight in regional banks and good stock selection within that group.” |
Some of our better performers came from our small- and mid-cap bank group, including Pinnacle Financial Partners, Inc. Investors like this Nashville bank’s consistent, better-than-average earnings growth. Compass Bancshares, Inc., Seacoast Banking Corp. of Florida and Colonial BancGroup, Inc. were other smaller banks whose stocks rose along with their good earnings growth.
Several of our small banks located on the Gulf Coast experienced strong performance in the wake of hurricanes Katrina and Rita, as relief funds poured into the region for rebuilding and credit quality held up relatively well. The subsequent improvement in earnings boosted the stocks of Hancock Holding Co., BancorpSouth, Inc. and Whitney Holding Corp. of New Orleans, as investors recognized that economic recovery would be an ongoing process in the region.
Superregionals and investment bankers trade places
Although market-sensitive financial stocks dropped like a stone in the latter half of the period, several of our holdings did so well in the first half that they managed to positively contribute to the
3
| Industry | |
| distribution1 | |
| Regional | |
| banks | 42% |
| Other diversified | |
| financial | |
| services | 9% |
| Diversified | |
| banks | 9% |
| Asset management | |
| & custody banks | 9% |
| Investment banking | |
| & brokerage | 7% |
| Life & health | |
| Insurance | 6% |
| Thrifts & mortgage | |
| finance | 5% |
| Multi-line | |
| insurance | 4% |
| Property & casualty | |
| insurance | 3% |
| Reinsurance | 1% |
| Diversified capital | |
| markets | 1% |
| Insurance | |
| brokers | 1% |
Fund’s performance for the period overall. These included Raymond James Financial, Inc., which had strong production in the fourth quarter resulting in solid earnings, and Goldman Sachs Group, Inc., which experienced two of its best earnings quarters ever. Considered “best in class,” Goldman continues to gain market share as it expands globally and diversifies its product lines beyond the traditional trading and deal making into commodities, fixed income and credit products. Such diversity means it has a better chance of performing well even if it’s not firing on all cylinders.
Later in the period, some of our large superregionals began to outperform as investors gravitated to them as a safer trade out of brokers into banks. Some of our biggest contributors included PNC Financial Services Group, Inc., Bank of America Corp., Wells Fargo & Co., JPMorgan Chase & Co., SunTrust Banks, Inc. and U.S. Bancorp. During the period, we took profits and trimmed our positions in some of the market-sensitive names and moved into insurance stocks and other financial stocks with cheaper valuations.
Laggards
The drags on performance were primarily due to company-specific issues. Legg Mason Inc.’s stock fell as investors became concerned that its recent deal to give Citigroup, Inc. its brokerage arm in exchange for Citigroup’s asset management group was not going as well as had been hoped. Mortgage giant Freddie Mac continued to struggle with regulatory risk issues and regional bank City National Corp. suffered earnings disappointments in two consecutive quarters. Insurer American International Group, Inc. (AIG) had two quarters of mixed results and investors have begun to question
4

if the new leadership can fill the shoes of the company’s now-departed long-time leader.
| “Looking forward, the prospects for financial stocks remain generally favorable.” |
Outlook
Looking forward, the prospects for financial stocks remain generally favorable. The economy is still growing, there are no early signs of credit deterioration and commercial loan growth remains strong. However, the flat yield curve and hyper-competitive deposit pricing are putting pressure on banks’ net interest margins. And the downturn in the market has weighed on the market-sensitive financial names. We continue to view some of the larger cap banks — including some foreign names — as having the best value due to their relatively lower price/earnings ratios. In the small- and mid-cap bank stocks, we have taken profits in some names whose valuations have gotten too rich and we have initiated or added to positions that are trading at more attractive valuations. We also continue to like the valuation of some of the property and casualty insurance stocks.
We believe that the recent pick-up in bank merger activity will continue, particularly given the more difficult operating environment. While price/earnings ratios remain inversely correlated to bank size, the differential has narrowed, making it easier for larger banks to purchase the smaller institutions.
This commentary reflects the views of the portfolio managers through the end of the Fund’s period discussed in this report. The managers’ statements reflect their own opinions. As such, they are in no way guarantees of future events, and are not intended to be used as investment advice or a recommendation regarding any specific security. They are also subject to change at any time as market and other conditions warrant.
Sector investing is subject to greater risks than the market as a whole.
1 As a percentage of net assets on June 30, 2006.
5
F I N A N C I A L S TAT E M E N T S
| FUND’S INVESTMENTS |
| Securities owned by the Fund on June 30, 2006 (unaudited) |
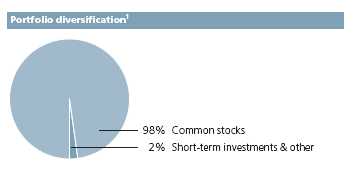
| This schedule is divided into two main categories: common stocks and short-term investments. Common stocks are further broken down by industry group. Short-term investments, which represent the Fund’s cash position, are listed last. |
| Issuer | Shares | Value |
| Common stocks 98.29% | $80,321,087 | |
| (Cost $41,471,174) | ||
Asset Management & Custody Banks 8.86% | 7,239,976 | |
| Affiliated Managers Group, Inc. (I)(L) | 16,700 | 1,451,063 |
| Bank of New York Co., Inc. (The) | 24,000 | 772,800 |
| Eaton Vance Corp. | 20,000 | 499,200 |
| Franklin Resources, Inc. | 11,500 | 998,315 |
| Legg Mason, Inc. | 15,650 | 1,557,488 |
| Northern Trust Corp. | 5,000 | 276,500 |
| State Street Corp. | 29,000 | 1,684,610 |
Data Processing & Outsourced Services 0.05% | 41,280 | |
| MasterCard, Inc. (Class A) (I) | 860 | 41,280 |
Diversified Banks 8.99% | 7,348,815 | |
| HSBC Holdings Plc, American Depositary Receipt (United Kingdom) | 5,500 | 485,925 |
| U.S. Bancorp. | 68,000 | 2,099,840 |
| Wachovia Corp. | 45,653 | 2,468,914 |
| Wells Fargo & Co. | 34,200 | 2,294,136 |
Diversified Capital Markets 0.67% | 548,500 | |
| UBS AG (Switzerland) | 5,000 | 548,500 |
Insurance Brokers 0.64% | 522,796 | |
| Marsh & McLennan Cos., Inc. | 10,000 | 268,900 |
| National Financial Partners Corp. | 5,730 | 253,896 |
Investment Banking & Brokerage 7.42% | 6,062,735 | |
| Goldman Sachs Group, Inc. (The) | 3,500 | 526,505 |
| Lehman Brothers Holdings, Inc. | 22,000 | 1,433,300 |
| Merrill Lynch & Co., Inc. | 22,000 | 1,530,320 |
| Morgan Stanley | 7,750 | 489,878 |
| Raymond James Financial, Inc. | 59,925 | 1,813,930 |
| TD Ameritrade Holding Corp. | 18,150 | 268,802 |
| See notes to financial statements. |
6
F I N A N C I A L S TAT E M E N T S
| Issuer | Shares | Value |
Life & Health Insurance 6.00% | $4,901,277 | |
| AFLAC, Inc. | 25,000 | 1,158,750 |
| Prudential Financial, Inc. | 28,510 | 2,215,227 |
| StanCorp Financial Group, Inc. | 30,000 | 1,527,300 |
Multi-Line Insurance 3.83% | 3,131,862 | |
| American International Group, Inc. | 17,000 | 1,003,850 |
| Genworth Financial, Inc. (Class A) | 15,550 | 541,762 |
| Hartford Financial Services Group, Inc. (The) | 18,750 | 1,586,250 |
Other Diversified Financial Services 9.38% | 7,668,701 | |
| Bank of America Corp. | 76,008 | 3,655,985 |
| Citigroup, Inc. | 46,650 | 2,250,396 |
| JPMorgan Chase & Co. | 41,960 | 1,762,320 |
Property & Casualty Insurance 3.27% | 2,674,236 | |
| Ambac Financial Group, Inc. | 7,000 | 567,700 |
| Assured Guaranty Ltd. (Bermuda) | 22,650 | 574,630 |
| Axis Capital Holdings Ltd. (Bermuda) | 11,500 | 329,015 |
| ProAssurance Corp. (I) | 17,615 | 848,691 |
| Republic Companies Group, Inc. | 20,000 | 354,200 |
Regional Banks 42.34% | 34,598,607 | |
| Alabama National Bancorp. | 9,500 | 647,425 |
| Ameris Bancorp. | 21,480 | 497,047 |
| BancorpSouth, Inc. | 36,167 | 985,551 |
| BB&T Corp. (L) | 38,382 | 1,596,307 |
| BOK Financial Corp. | 26,776 | 1,329,964 |
| Capital City Bank Group, Inc. | 26,327 | 795,075 |
| City National Corp. | 18,550 | 1,207,419 |
| Colonial BancGroup, Inc. (The) | 38,112 | 978,716 |
| Commerce Bancshares, Inc. | 17,497 | 875,725 |
| Commercial Bankshares, Inc. | 35,551 | 1,314,676 |
| Community Bancorp. (I) | 880 | 27,350 |
| Compass Bancshares, Inc. | 24,525 | 1,363,590 |
| Fifth Third Bancorp. | 15,500 | 572,725 |
| First Bancorp. of North Carolina | 18,532 | 389,172 |
| First Charter Corp. | 28,500 | 699,105 |
| First Horizon National Corp. | 20,580 | 827,316 |
| Hancock Holding Co. | 11,000 | 616,000 |
| LSB Bancshares, Inc. | 56,512 | 976,527 |
| M&T Bank Corp. | 8,000 | 943,360 |
| Marshall & Ilsley Corp. | 18,750 | 857,625 |
| See notes to financial statements. |
7
F I N A N C I A L S TAT E M E N T S
| Issuer | Shares | Value | ||
| Regional Banks (continued) | ||||
| National City Corp. | 15,000 | $542,850 | ||
| North Fork Bancorp., Inc. | 20,500 | 618,485 | ||
| Peoples BancTrust Co., Inc. (The) | 52,800 | 1,213,344 | ||
| Pinnacle Financial Partners, Inc. (I)(L) | 78,000 | 2,373,540 | ||
| PNC Financial Services Group, Inc. | 22,500 | 1,578,825 | ||
| Provident Bankshares Corp. | 20,156 | 733,477 | ||
| Seacoast Banking Corp. of Florida | 69,520 | 1,851,318 | ||
| Summit Bancshares, Inc. | 18,600 | 394,506 | ||
| SunTrust Banks, Inc. | 26,556 | 2,025,161 | ||
| SVB Financial Group (I) | 11,000 | 500,060 | ||
| Synovus Financial Corp. | 15,600 | 417,768 | ||
| TCF Financial Corp. | 40,650 | 1,075,193 | ||
| Trustmark Corp. | 32,000 | 991,040 | ||
| Western Alliance Bancorp. (I) | 980 | 34,084 | ||
| Whitney Holding Corp. | 14,300 | 505,791 | ||
| Zions Bancorp. | 28,772 | 2,242,490 | ||
Reinsurance 1.03% | 839,809 | |||
| Max Re Capital Ltd. (Bermuda) | 14,600 | 318,864 | ||
| RenaissanceRe Holdings Ltd. (Bermuda) | 10,750 | 520,945 | ||
Specialized Finance 0.43% | 349,297 | |||
| CIT Group, Inc. | 6,680 | 349,297 | ||
Thrifts & Mortgage Finance 5.38% | 4,393,196 | |||
| Countrywide Financial Corp. | 15,150 | 576,912 | ||
| First Financial Holdings, Inc. | 40,500 | 1,296,000 | ||
| Freddie Mac | 8,450 | 481,734 | ||
| Hudson City Bancorp., Inc. | 34,150 | 455,220 | ||
| South Street Financial Corp. | 95,000 | 854,050 | ||
| Washington Mutual, Inc. | 16,000 | 729,280 | ||
| Interest | Par value | |||
| Issuer, description, maturity date | rate | (000) | Value | |
| Short-term investments 3.81% | $3,116,507 | |||
| (Cost $3,116,507) | ||||
Certificates of Deposit 0.03% | 25,393 | |||
| Deposits in mutual banks | $25 | 25,393 | ||
| See notes to financial statements. |
8
F I N A N C I A L S TAT E M E N T S
| Interest | Par value | |||
| Issuer, description, maturity date | rate | (000) | Value | |
| Joint Repurchase Agreement 1.66% | $1,357,000 | |||
| Investment in a joint repurchase agreement transaction | ||||
| with Morgan Stanley — Dated 6-30-06 due 7-3-06 | ||||
| (Secured by U.S. Treasury Inflation Indexed Note 1.875% | ||||
| due 7-15-15) | 4.550% | $1,357 | 1,357,000 | |
| Shares | ||||
| Cash Equivalents 2.12% | 1,734,114 | |||
| AIM Cash Investment Trust (T) | 1,734,114 | 1,734,114 | ||
| Total investments 102.10% | $83,437,594 | |||
| Other assets and liabilities, net (2.10%) | ($1,713,790) | |||
| Total net assets 100.00% | $81,723,804 | |||
(I) Non-income-producing security.
(L) All or a portion of this security is on loan as of June 30, 2006.
(T) Represents investment of securities lending collateral.
Parenthetical disclosure of a foreign country in the security description represents country of a foreign issuer.
The percentage shown for each investment category is the total value of that category as a percentage of the net assets of the Fund.
| See notes to financial statements. |
9
F I N A N C I A L S TAT E M E N T S
| ASSETS AND LIABILITIES |
| June 30, 2006 (unaudited) This Statement of Assets and Liabilities is the Fund’s balance sheet. It shows the value of what the Fund owns, is due and owes. You’ll also find the net asset value for each common share. |
| Assets | |
| Investments, at value (cost $44,587,681) | |
| including $1,700,112 of securities loaned | $83,437,594 |
| Cash | 278 |
| Receivable for investments sold | 437,600 |
| Dividends and interest receivable | 126,615 |
| Total assets | 84,002,087 |
| Liabilities | |
| Payable for investments purchased | 478,694 |
| Payable upon return of securities loaned | 1,734,114 |
| Payable to affiliates | |
| Management fees | 50,909 |
| Other | 13,107 |
| Other payables and accrued expenses | 1,459 |
| Total liabilities | 2,278,283 |
| Net assets | |
| Capital paid-in | 40,212,716 |
| Accumulated net realized gain on investments | 2,086,489 |
| Net unrealized appreciation of investments | 38,849,913 |
| Accumulated net investment income | 574,686 |
| Net assets | $81,723,804 |
| Net asset value per share | |
| Based on 3,993,124 shares outstanding — | |
| 50 million shares authorized with par value | |
| of $0.001 per share. | $20.47 |
| See notes to financial statements. |
10
F I N A N C I A L S TAT E M E N T S
| OPERATIONS For the period ended June 30, 2006 (unaudited)1 This Statement of Operations summarizes the Fund’s investment income earned and expenses incurred in operating the Fund. It also shows net gains (losses) for the period stated. |
| Investment income | |
| Dividends | $964,881 |
| Interest | 29,212 |
| Securities lending | 923 |
| Total investment income | 995,016 |
| Expenses | |
| Investment management fees | 264,396 |
| Directors’ fees | 77,315 |
| Administration fees | 61,014 |
| Professional fees | 36,568 |
| Printing | 11,635 |
| Miscellaneous | 11,083 |
| Custodian fees | 10,073 |
| Transfer agent fees | 7,505 |
| Related party fees | |
| Compliance fees | 1,047 |
| Total expenses | 480,636 |
| Net investment income | 514,380 |
| Realized and unrealized gain | |
| Net realized gain on investments | 1,864,298 |
| Change in net unrealized appreciation | |
| (depreciation) of investments | 1,656,201 |
| Net realized and unrealized gain | 3,520,499 |
1 Semiannual period from 1-1-06 to 6-30-06.
| See notes to financial statements. |
11
F I N A N C I A L S TAT E M E N T S
| CHANGES IN NET ASSETS |
| These Statements of Changes in Net Assets show how the value of the Fund’s net assets has changed during the last two periods. The difference reflects earnings less expenses, any investment gains and losses, and distributions, if any, paid to shareholders. |
| Year | Period | |
| ended | ended | |
| 12-31-05 | 6-30-061 | |
| Increase (decrease) in net assets | ||
| From operations | ||
| Net investment income | $904,560 | $514,380 |
| Net realized gain | 1,433,399 | 1,864,298 |
| Change in net unrealized | ||
| appreciation (depreciation) | 2,412,459 | 1,656,201 |
| Increase in net assets resulting | ||
| from operations | 4,750,418 | 4,034,879 |
| Distributions to common shareholders | ||
| From net investment income | (878,487) | — |
| From net realized gain | (2,411,048) | — |
| (3,289,535) | — | |
| Net assets | ||
| Beginning of period | 76,228,042 | 77,688,925 |
| End of period2 | $77,688,925 | $81,723,804 |
1 Semiannual period from 1-1-06 to 6-30-06. Unaudited.
2 Includes accumulated net investment income of $60,306 and $574,686, respectively.
| See notes to financial statements. |
12
F I N A N C I A L H I G H L I G H T S
| FINANCIAL HIGHLIGHTS |
| COMMON SHARES The Financial Highlights show how the Fund’s net asset value for a share has changed since the end of the previous period. |
| PERIOD ENDED | 12-31-011 | 12-31-021 | 12-31-031 | 12-31-041 | 12-31-05 | 6-30-062 |
| Per share operating performance | ||||||
| Net asset value, | ||||||
| beginning of period | $16.58 | $15.67 | $14.39 | $17.63 | $19.09 | $19.46 |
| Net investment income3 | 0.22 | 0.16 | 0.17 | 0.19 | 0.23 | 0.13 |
| Net realized and unrealized | ||||||
| gain (loss) on investments | 1.49 | (0.66) | 3.814 | 2.44 | 0.96 | 0.88 |
| Total from | ||||||
| investment operations | 1.71 | (0.50) | 3.98 | 2.63 | 1.19 | 1.01 |
| Less distributions | ||||||
| From net investment income | (0.24) | (0.16) | (0.16) | (0.20) | (0.22) | — |
| From net realized gain | (2.38) | (0.62) | (0.58) | (0.97) | (0.60) | — |
| (2.62) | (0.78) | (0.74) | (1.17) | (0.82) | — | |
| Net asset value, end of period | $15.67 | $14.39 | $17.63 | $19.09 | $19.46 | $20.47 |
| Per share market value, | ||||||
| end of period | $13.17 | $12.36 | $18.40 | $17.47 | $16.68 | $17.71 |
| Total return at market value5 (%) | 14.41 | (0.25) | 58.66 | 1.54 | 0.21 | 6.186 |
| Ratios and supplemental data | ||||||
| Net assets, end of period | ||||||
| (in millions) | $62 | $57 | $70 | $76 | $78 | $82 |
| Ratio of expenses | ||||||
| to average net assets (%) | 1.23 | 1.16 | 1.20 | 1.22 | 1.18 | 1.197 |
| Ratio of net investment income | ||||||
| to average net assets (%) | 1.23 | 1.04 | 1.04 | 1.04 | 1.21 | 1.287 |
| Portfolio turnover (%) | 53 | 42 | 26 | 10 | 4 | 6 |
1 Audited by previous auditor.
2 Semiannual period from 1-1-06 to 6-30-06. Unaudited.
3 Based on the average of the shares outstanding.
4 Net of federal income taxes of $0.39 per share for the year ended 12-31-03, on net long-term capital gains retained by the Fund.
5 Assumes dividend reinvestment.
6 Not annualized.
7 Annualized.
| See notes to financial statements. |
13
| NOTES TO STATEMENTS Unaudited |
Note A
Accounting policies
John Hancock Financial Trends Fund, Inc. (the “Fund”) is a diversified closed-end management investment company registered under the Investment Company Act of 1940.
| Significant accounting policies of the Fund are as follows: |
Valuation of investments
Securities in the Fund’s portfolio are valued on the basis of market quotations, valuations provided by independent pricing services or, if quotations are not readily available, or the value has been materially affected by events occurring after the closing of a foreign market, at fair value as determined in good faith in accordance with procedures approved by the Directors. Short-term debt investments which have a remaining maturing of 60 days or less may be valued at amortized cost, which approximates market value. Investments in AIM Cash Investment Trust are valued at their net asset value each business day.
Joint repurchase agreement
Pursuant to an exemptive order issued by the Securities and Exchange Commission, the Fund, along with other registered investment companies having a management contract with John Hancock Advisers, LLC (the “Adviser”), a wholly owned subsidiary of John Hancock Financial Services, Inc., a subsidiary of Manulife Financial Corporation (“MFC”), may participate in a joint repurchase agreement transaction. Aggregate cash balances are invested in one or more large repurchase agreements, whose underlying securities are obligations of the U.S. government and/or its agencies. The Fund’s custodian bank receives delivery of the underlying securities for the joint account on the Fund’s behalf. The Adviser is responsible for ensuring that the agreement is fully collateralized at all times.
Investment transactions
Investment transactions are recorded as of the date of purchase, sale or maturity. Net realized gains and losses on sales of investments are determined on the identified cost basis.
Securities lending
The Fund may lend securities to certain qualified brokers who pay the Fund negotiated lender fees. The loans are collateralized at all times with cash or securities with a market value at least equal to the market value of the securities on loan. As with other extensions of credit, the Fund may bear the risk of delay of the loaned securities in recovery or even loss of rights in the collateral, should the borrower of the securities fail financially. On June 30, 2006, the Fund loaned securities having a market value of $1,700,112 collateralized by cash in the amount of $1,734,114. The cash collateral was invested in a short-term instrument. Securities lending expenses are paid by the Fund to the Adviser.
14
Federal income taxes
The Fund qualifies as a “regulated investment company” by complying with the applicable provisions of the Internal Revenue Code and will not be subject to federal income tax on taxable income that is distributed to shareholders. Therefore, no federal income tax provision is required.
In June 2006, Financial Accounting Standards Board (FASB) Interpretation No. 48, Accounting for Uncertainty in Income Taxes (the “Interpretation”) was issued, and is effective for fiscal years beginning after December 15, 2006 and is to be applied to all open tax years as of the effective date. This Interpretation prescribes a minimum threshold for financial statement recognition of the benefit of a tax position taken or expected to be taken in a tax return, and requires certain expanded disclosures. Management has recently begun to evaluate the application of the Interpretation to the Fund, and has not at this time quantified the impact, if any, resulting from the adoption of this Interpretation on the Fund's financial statements.
Dividends, interest
and distributions
Dividend income on investment securities is recorded on the ex-dividend date or, in the case of some foreign securities, on the date thereafter when the Fund identifies the dividend. Interest income on investment securities is recorded on the accrual basis. Foreign income may be subject to foreign withholding taxes, which are accrued as applicable.
The Fund records distributions to shareholders from net investment income and net realized gains, if any, on the ex-dividend date. During the year ended December 31, 2005, the tax character of distributions paid was as follows: ordinary income $991,732 and long-term capital gains $2,297,803.
Such distributions, on a tax basis, are determined in conformity with income tax regulations, which may differ from accounting principles generally accepted in the United States of America. Distributions in excess of tax basis earnings and profits, if any, are reported in the Fund’s financial statements as a return of capital.
Use of estimates
The preparation of these financial statements, in accordance with accounting principles generally accepted in the United States of America, incorporates estimates made by management in determining the reported amount of assets, liabilities, revenues and expenses of the Fund. Actual results could differ from these estimates.
| Note B Management and administration fees and transactions with affiliates and others |
The Fund has an investment management contract with the Adviser, under which the Adviser furnishes office space, furnishings and equipment and provides the services of persons to manage the investment of the Fund’s assets and to continually review, supervise and administer the Fund’s investment program. Under the investment management agreement the Fund pays a monthly management fee to the Adviser at an annual rate of 0.65% of the Fund’s average weekly net asset value, or a flat annual fee of $50,000, whichever is higher. If total Fund expenses exceed 2% of the fund’s average weekly net asset value in any one year, the Fund may require the Adviser to reimburse the Fund for such excess, subject to a minimum fee of $50,000.
Effective December 31, 2005, the investment management teams of the Adviser were reorganized into Sovereign Asset Management LLC (“Sovereign”), a wholly owned indirect subsidiary of John Hancock Life Insurance Company (“JHLICo”), a subsidiary of MFC. The Adviser remains the principal advisor on the Fund and Sovereign acts as subadviser under the supervision of the Adviser. The restructuring did not
15
have an impact on the Fund, which continues to be managed using the same investment philosophy and process. The Fund is not responsible for payment of the subadvisory fees.
The Fund has an administration agreement with the Adviser under which the Adviser provides certain administrative services required by the Fund. The Fund pays a monthly administration fee to the Adviser at an annual rate of 0.15% of the Fund’s average weekly net assets value, or a flat annual fee of $22,000, whichever is higher. The compensation for the period amounted to $61,014. The Fund also paid the Adviser the amount of $88 for certain publishing services, included in the printing fees. The Fund also also reimbursed JHLICo for certain compliance costs, included in the Fund’s Statement of Operations.
The Fund does not pay remuneration to its Officers. Certain Officers of the Fund are officers of the Adviser.
| Note C Fund share transactions |
The Fund had no share transactions during the last two periods.
The Fund from time-to-time may, but is not required to, make open market repurchases of its shares in order to attempt to reduce or eliminate the amount of any market value discount or to increase the net asset value of its shares, or both. In addition, the Board currently intends each quarter during periods when the Fund’s shares are trading at a discount from the net asset value to consider the making of tender offers. The Board may at any time, however, decide that the Fund should not make share repurchases or tender offers.
| Note D Investment transactions |
Purchases and proceeds from sales or maturities of securities, other than short-term securities and obligations of the U.S. government, during the period ended June 30, 2006, aggregated $4,745,998 and $5,445,776, respectively.
The cost of investments owned on June 30, 2006, including short-term investments, for federal income tax purposes, was $44,592,869. Gross unrealized appreciation and depreciation of investments aggregated $39,127,851 and $283,126, respectively, resulting in net unrealized appreciation of $38,844,725. The difference between book basis and tax basis net unrealized appreciation of investments is attributable primarily to the tax deferral of losses on certain sales of securities.
16
| Investment objective and policy |
The Fund’s primary investment objective is long-term capital appreciation. Its secondary investment objective is current income. The Fund will seek to achieve its primary investment objective of long-term capital appreciation by investing at least 80% (65% prior to January 25, 2002) of its assets in stocks of U.S. and foreign financial services companies of any size. These companies include banks, thrifts, finance companies, brokerage and advisory firms, real estate-related firms, insurance companies and financial holding companies. These companies are usually regulated by governmental or quasi-governmental entities, and as a result, are subject to the risk that regulatory developments will adversely affect them. With respect to the Fund’s investment policy of investing at least 80% of “assets” in equity securities, “assets” is defined as net assets plus the amount of any borrowings for investment purposes. The Fund will notify shareholders at least 60 days prior to any change in this policy. In abnormal market conditions, the Fund may take temporary defensive positions. As such, the Fund may temporarily invest all of its assets in investment-grade, short-term securities. In such circumstances, the Fund may not achieve its objective. The Fund’s current investment restriction, relating to industry concentration, has been modified to remove the reference to the banking and savings industry so that it reads as follows: “Except for temporary defensive purposes, the Fund may not invest more than 25% of its total assets in any one industry or group of related industries except that the Fund will invest more than 25% of its assets in the financial services sector.”
| Repurchase agreement |
A repurchase agreement is a contract under which the Fund would acquire a security for a relatively short period (usually not more than seven days) subject to the obligation of the seller to repurchase and the Fund to resell such security at a fixed time and price (representing the Fund’s cost plus interest). The Fund will enter into repurchase agreements only with member banks of the Federal Reserve System and with “primary dealers” in U.S. government securities. The Adviser will continuously monitor the creditworthiness of the parties with whom the Fund enters into repurchase agreements.
Repurchase transactions must be fully collateralized at all times, but they involve some credit risk to the Fund if the other party defaults on its obligations and the Fund is delayed or prevented from liquidating the collateral. The Fund has established a procedure providing that the securities serving as collateral for each repurchase agreement must be delivered to the Fund’s custodian either physically or in book-entry form and that the collateral must be marked to market daily to ensure that each repurchase agreement is fully collateralized at all times. In the event of bankruptcy or other default by a seller on a repurchase agreement, the Fund could experience delays in liquidating the underlying securities and could experience losses, including the possible decline in the value of the underlying securities during the period while the Fund seeks to enforce its rights thereto, possible subnormal levels of income, lack of access to income during this period and the expense of enforcing its rights.
Bylaws
In January 2003, the Board of Directors adopted several amendments to the Fund’s bylaws, including provisions relating to the calling of a special meeting and requiring advance notice of shareholder proposals or nominees for Director. The advance notice provisions in the bylaws require shareholders to notify the Fund in writing of any proposal that they intend to present at an annual meeting of shareholders, including any
17
nominations for Director, between 90 and 120 days prior to the first anniversary of the mailing date of the notice from the prior year’s annual meeting of shareholders. The notification must be in the form prescribed by the bylaws. The advance notice provisions provide the Fund and its Directors with the opportunity to thoughtfully consider and address the matters proposed before the Fund prepares and mails its proxy statement to shareholders. Other amendments set forth the procedures that must be followed in order for a shareholder to call a special meeting of shareholders. The Fund is presently listed on NASDAQ and per a grandfathering provision it is not required to hold annual shareholder meetings. The Board approved the above amendment to the Fund’s bylaws to provide a defined structure for the submission of shareholder proposals should the circumstances change and an annual meeting be required. Please contact the Secretary of the Fund for additional information about the advance notice requirements or the other amendments to the bylaws.
In November 2005, the Fund’s Board of Directors adopted several amendments to the Fund’s bylaws regarding the Chairman of the Board position: The Chairman of the Board shall at all times be a director who is not an interested person of the Fund as that term is defined by the Investment Company Act of 1940. The scope of the Chairman’s responsibilities and fiduciary obligations were further defined. Lastly, disclosure regarding the election, resignation and removal of the Chairman as well as the filling of a vacancy was added.
At a quarterly meeting of the Fund’s Board of Directors held February 13, 2006, the Board amended Article II Section 2 of the Fund’s bylaws to state that a special meeting of the stockholders, unless otherwise provided by law or by the Articles of Incorporation, may be called for any purpose or purposes by a majority of the Board of Directors, the President, or, subject to Section 2(c), by the Secretary of the Corporation upon the written request of stockholders entitled to cast at least 35% of all votes entitles to be cast at the meeting.
Dividend reinvestment plan
The Fund offers its registered shareholders an automatic Dividend Reinvestment Plan (the “Plan”), which enables each participating shareholder to have all dividends (including income dividends and/or capital gains distributions) payable in cash, reinvested by Mellon Investor Services (the “Plan Agent”) in shares of the Fund’s common stock. However, shareholders may elect not to enter into, or may terminate at any time without penalty, their participation in the Plan by notifying the Plan Agent in writing. Shareholders who do not participate in the Plan will receive all dividends in cash.
In the case of shareholders such as banks, brokers or nominees who hold shares for others who are the bene-ficial owners, the Plan Agent will administer the Plan on the basis of record ownership of shares. These record shareholders will receive dividends under the Plan on behalf of participating bene-ficial owners and cash on behalf of non-participating beneficial owners. These recordholders will then credit the beneficial owners’ accounts with the appropriate stock or cash distribution.
Whenever the market price of the Fund’s stock equals or exceeds net asset value per share, participating shareholders will be issued stock valued at the greater of (i) net asset value per share or (ii) 95% of the market price. If the net asset value per share of the Fund’s stock exceeds the market price per share, the Plan Agent shall make open market purchases of the Fund’s stock for each participating shareholder’s
18
account. These purchases may begin no sooner than five business days prior to the payment date for the dividend and will end up to thirty days after the payment date. If shares cannot be purchased within thirty days after the payment date, the balance of shares will be purchased from the Fund at the average price of shares purchased on the open market. Each participating shareholder will be charged a pro rata share of brokerage commissions on all open market purchases.
The shares issued to participating shareholders, including fractional shares, will be held by the Plan Agent in the name of the shareholder. The Plan Agent will confirm each acquisition made for the account of the participating shareholders as soon as practicable after the payment date of the distribution.
The reinvestment of dividends does not relieve participating shareholders of any federal, state or local income tax that may be due with respect to each dividend. Dividends reinvested in shares will be treated on your federal income tax return as though you had received a dividend in cash in an amount equal to the fair market value of the shares received, as determined by the prices for shares of the Fund on the Nasdaq National Market System as of the dividend payment date. Distributions from the Fund’s long-term capital gains will be taxable to you as long-term capital gains. The confirmation referred to above will contain all the information you will require for determining the cost basis of shares acquired and should be retained for that purpose. At year end, each account will be supplied with detailed information necessary to determine total tax liability for the calendar year.
All correspondence or additional information concerning the Plan should be directed to the Plan Agent, Mellon Bank, N.A., c/o Mellon Investor Services at P.O. Box 3338, South Hackensack, New Jersey 07606-1938 (Telephone: 1-800-852-0218).
| Shareholder communication and assistance |
If you have any questions concerning the Fund, we will be pleased to assist you. If you hold shares in your own name and not with a brokerage firm, please address all notices, correspondence, questions or other communications regarding the Fund to the transfer agent at:
| Mellon Investor Services Newport Office Center VII 480 Washington Boulevard Jersey City, NJ 07310 Telephone: 1-800-852-0218 |
If your shares are held with a brokerage firm, you should contact that firm, bank or other nominee for assistance.
19
20
For more information
The Fund’s proxy voting policies, procedures and records are available without charge, upon request:
| By phone | On the Fund’s Web site | On the SEC’s Web site |
| 1-800-225-5291 | www.jhfunds.com/proxy | www.sec.gov |
| Directors | Investment adviser | Independent directors’ |
| Franklin C. Golden | John Hancock Advisers, LLC | counsel |
| Robert G. Freedman | 601 Congress Street | Kilpatrick Stockton LLP |
| Russell J. Page | Boston, MA 02210-2805 | 1100 Peachtree Street |
| Fred G. Steingraber | Atlanta, Georgia 30309-4530 | |
| Donald R. Tomlin | Subadviser | |
| H. Hall Ware, III | Sovereign Asset Management | Fund counsel |
| LLC | Wilmer Cutler Pickering | |
| Officers | 101 Huntington Avenue | Hale and Dorr LLP |
| Franklin C. Golden | Boston, MA 02199 | 60 State Street |
| Boston, MA 02109-1803 | ||
| Chairman | Custodian | |
| Barry H. Evans | The Bank of New York | Stock symbol |
| President | One Wall Street | Listed Nasdaq Symbol: |
| James K. Schmidt | New York, NY 10286 | JHFT |
| Vice President | ||
| Lisa A. Welch | Transfer agent | For shareholder assistance |
| Vice President | and registrar | refer to page 19 |
| Robert E. Gramer | ||
| Treasurer | Mellon Investor Services | |
| Alfred P. Ouellette | Newport Office Center VII | |
| Corporate Secretary | 480 Washington Boulevard | |
| Jersey City, NJ 07310 |

A listing of month-end portfolio holdings is available on our Web site, www.jhfunds.com. A more detailed portfolio holdings summary is available on a quarterly basis 60 days after the fiscal quarter on our Web site or upon request by calling 1-800-225-5291, or on the Securities and Exchange Commission’s Web site, www.sec.gov.
21

| 1-800-852-0218 1-800-843-0090 EASI-Line 1-800-231-5469 (TDD) www.jhfunds.com |
| PRESORTED STANDARD U. S. POSTAGE PAID MIS |
| PT0SA 6/06 8/06 |
| ITEM 2. CODE OF ETHICS. |
As of the end of the period, June 30, 2006, the registrant has adopted a code of ethics, as defined in Item 2 of Form N-CSR, that applies to its Chief Executive Officer, Chief Financial Officer and Treasurer (respectively, the principal executive officer, the principal financial officer and the principal accounting officer, the “Senior Financial Officers”). A copy of the code of ethics is filed as an exhibit to this Form N-CSR.
ITEM 3. AUDIT COMMITTEE FINANCIAL EXPERT.
| Not applicable at this time. |
ITEM 4. PRINCIPAL ACCOUNTANT FEES AND SERVICES.
| Not applicable at this time. |
ITEM 5. AUDIT COMMITTEE OF LISTED REGISTRANTS.
| Not applicable at this time. ITEM 6. SCHEDULE OF INVESTMENTS. |
| Not applicable. |
ITEM 7. DISCLOSURE OF PROXY VOTING POLICIES AND PROCEDURES FOR CLOSED-END MANAGEMENT INVESTMENT COMPANIES.
| Not applicable. |
ITEM 8. PORTFOLIO MANAGERS OF CLOSED-END MANAGEMENT INVESTMENT COMPANIES.
| Not applicable. |
ITEM 9. PURCHASES OF EQUITY SECURITIES BY CLOSED-END MANAGEMENT INVESTMENT COMPANY AND AFFILIATED PURCHASERS.
| Not applicable. |
ITEM 10. SUBMISSION OF MATTERS TO A VOTE OF SECURITY HOLDERS.
The registrant has adopted procedures by which shareholders may recommend nominees to the registrant's Board of Trustees. A copy of the procedures is filed as an exhibit to this Form N-CSR. See attached “John Hancock Funds – Governance Committee Charter”.
| ITEM 11. CONTROLS AND PROCEDURES. |
officer and principal financial officer have concluded that those disclosure controls and procedures provide reasonable assurance that the material information required to be disclosed by the registrant on this report is recorded, processed, summarized and reported within the time periods specified in the Securities and Exchange Commission's rules and forms.
(b) There were no changes in the registrant's internal control over financial reporting that occurred during the registrant's most recent fiscal half-year (the registrant's second fiscal half-year in the case of an annual report) that have materially affected, or are reasonably likely to materially affect, the registrant's internal control over financial reporting.
| ITEM 12. EXHIBITS. |
(a)(1) Code of Ethics for Senior Financial Officers is attached.
(a)(2) Separate certifications for the registrant's principal executive officer and principal financial officer, as required by Section 302 of the Sarbanes-Oxley Act of 2002 and Rule 30a-2(a) under the Investment Company Act of 1940, are attached.
(b) Separate certifications for the registrant's principal executive officer and principal financial officer, as required by 18 U.S.C. Section 1350, as adopted pursuant to Section 906 of the Sarbanes-Oxley Act of 2002, and Rule 30a-2(b) under the Investment Company Act of 1940, are attached. The certifications furnished pursuant to this paragraph are not deemed to be "filed" for purposes of Section 18 of the Securities Exchange Act of 1934, or otherwise subject to the liability of that section. Such certifications are not deemed to be incorporated by reference into any filing under the Securities Act of 1933 or the Securities Exchange Act of 1934, except to the extent that the Registrant specifically incorporates them by reference.
(c)(1) Submission of Matters to a Vote of Security Holders is attached. See attached “John Hancock Funds – Governance Committee Charter”.
| (c)(2) Contact person at the registrant. |
| SIGNATURES |
Pursuant to the requirements of the Securities Exchange Act of 1934 and the Investment Company Act of 1940, the registrant has duly caused this report to be signed on its behalf by the undersigned, thereunto duly authorized.
| John Hancock Financial Trends Fund, Inc. |
| By: /s/ Barry H. Evans ------------------------------------- Barry H. Evans President |
| Date: August 29, 2006 |
Pursuant to the requirements of the Securities Exchange Act of 1934 and the Investment Company Act of 1940, this report has been signed below by the following persons on behalf of the registrant and in the capacities and on the dates indicated.
| By: /s/ Barry H. Evans ------------------------------------- Barry H. Evans President |
| Date: August 29, 2006 |
| By: /s/ William H. King ------------------------------------- William H. King Associate Treasurer |
| Date: August 29, 2006 |