UNITED STATES
SECURITIES AND EXCHANGE COMMISSION
Washington, D.C. 20549
FORM N-CSR
CERTIFIED SHAREHOLDER REPORT OF REGISTERED
MANAGEMENT INVESTMENT COMPANIES
Investment Company Act file number 811- 57347
John Hancock Financial Trends Fund, Inc.
(Exact name of registrant as specified in charter)
601 Congress Street, Boston, Massachusetts 02210
(Address of principal executive offices) (Zip code)
Alfred P. Ouellette
Senior Counsel and Assistant Secretary
601 Congress Street
Boston, Massachusetts 02210
(Name and address of agent for service)
Registrant's telephone number, including area code: 617-663-4324
| Date of fiscal year end: | December 31 |
| Date of reporting period: | June 30, 2007 |
ITEM 1. REPORT TO SHAREHOLDERS.

| TABLE OF CONTENTS |
| Your fund at a glance |
| page 1 |
| Managers’ report |
| page 2 |
| Fund’s investments |
| page 6 |
| Financial statements |
| page 10 |
| Notes to financial |
| statements |
| page 14 |
| For more information |
| page 24 |
Welcome
Dear Fellow Shareholders:
The stock market gained ground in the first half of 2007, returning 6.96% through June 30, as measured by the Standard & Poor’s 500 Index. It was bolstered by stronger-than-expected corporate earnings growth, healthy global economic growth, increased merger and acquisitions activity and mostly steady interest rates. These positives served to overcome concerns about inflation, a slumping housing market, ills in the subprime mortgage market and mixed signals on the future direction of interest rates.
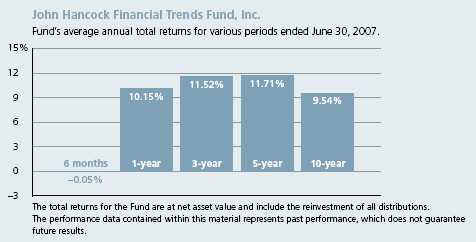
Financial stocks lagged the broad market on credit concerns stemming from the subprime mortgage fallout and on a continuation of an unfavorable interest rate environment that hurt net interest margins. As a result, the Standard & Poor’s 500 Financial Index lost a bit of ground, returning –0.79% in the first half of the year. John Hancock Financial Trends Fund, Inc. outperformed its benchmark index, returning –0.05% at net asset value.
We encourage our shareholders to view the flat returns over the last six months in a broader context, using the longer-term results on the facing page as Exhibit A. This fund has produced very strong average annual returns over the last 10 years — an outcome that serves as a good reminder that investing should be a marathon, rather than a sprint. Keeping a long-term perspective and maintaining a well-diversified portfolio are the keys to reaching your financial goals.
We continue to be as optimistic as ever about the prospects for financial stocks. All the elements that have made investing in financial stocks so compelling over time remain in place. Mergers and consolidation continue to be a major factor in the sector, and a growing population nearing retirement augurs well for increased demand for financial services.
Rest assured that your Board of Directors will continue to make every effort to ensure that the Fund generates the best possible long-term results, despite the market’s near-term twists and turns.
Sincerely,

Franklin C. Golden
Chairman of John Hancock Financial Trends Fund, Inc.
This commentary reflects the Chairman’s views as of June 30, 2007. They are subject to change at any time.
Your fund at a glance
The Fund seeks long-term capital appreciation with current income as a secondary objective by investing at least 80% of its assets in stocks of U.S. and foreign financial services companies of any size.
Over the last six months
► Stocks performed well despite slower economic growth. Record merger and acquisition activity supported the market, as did continued low interest rates.
► Financial stocks lagged the broader market because of worry about exposure to subprime loans, while banks continued to face a challenging business environment.
► The Fund slightly outperformed its benchmark due to our asset managers and custody bank positions, while regional bank shares and thrifts and mortgage companies detracted.
| Top 10 holdings | ||||
| Bank of America Corp. | 3.8% | State Street Corp. | 2.7% | |
| UBS AG | 3.3% | Zions Bancorp. | 2.7% | |
| Citigroup, Inc. | 2.8% | U.S. Bancorp | 2.6% | |
| Wachovia Corp. | 2.8% | Pinnacle Financial Partners, Inc. | 2.6% | |
| Wells Fargo & Co. | 2.8% | Affiliated Managers Group, Inc. | 2.5% | |
As a percentage of net assets on June 30, 2007.
1
Managers’ report
John Hancock
Financial Trends Fund, Inc.
Despite a bumpy ride, stocks managed healthy returns during the six months ended June 30, 2007, when the Standard & Poor’s 500 Index rose 6.96% . A slowdown in the housing market weighed on economic growth, which ran at only a 0.7% annual rate during the first quarter, but appears to have rebounded in the April–June quarter. Inflation remained fairly tame, increasing at a 2.2% annual rate through May — the latest period for which data are available — when you exclude volatile food and energy prices. Stocks were supported by record merger and acquisition activity, including the largest-ever private equity buyout.
In this environment, financial shares underperformed the broader market, as the Standard & Poor’s 500 Financial Index returned –0.79% . Many industry segments were weighed down by worry about exposure to subprime loans. For example, thrift and mortgage finance companies were down about 3% for the six months. In addition to credit concerns, banking stocks also had to deal with an unfavorable interest-rate environment — the yield curve was inverted (yields on the shortest-term debt exceeded those on longer-term notes and bonds) for much of the period, hurting net interest margins. In contrast, financial groups whose revenues are tied to the market, such as asset managers and custody banks, performed well thanks to continued robust capital markets and deal activity. Finally, insurance firms made up some of the best-performing industry
SCORECARD
| INVESTMENT | PERIOD’S PERFORMANCE ... AND WHAT’S BEHIND THE NUMBERS | |
| Commercial | ▲ | Top contributor acquired at a significant premium by Colonial Bancorp |
| Bankshares | ||
| Affiliated | ▲ | Continued strong earnings growth, with exposure to growing |
| Managers Group | international and hedge-fund markets | |
| Hancock Holding | ▼ | Southeast regional bank reported slower business, |
| disappointing earnings |
2

Portfolio Managers, MFC Global Investment Management (U.S.), LLC
Lisa A. Welch and Roger C. Hamilton
segments, as life and health insurance firms and reinsurers were up about 10%. In general, these firms benefited from positive industry trends, some merger and acquisition activity and having no exposure to the subprime lending issues that weighed on other financial stocks.
Fund performance
For the six months ended June 30, 2007, John Hancock Financial Trends Fund, Inc. posted total returns of –0.05% at net asset value (NAV) and 0.26% at market value. These results were slightly better than the –0.79% return of the Standard & Poor’s 500 Financial Index. By comparison, the average return of the open-end, specialty-financial funds tracked by Morningstar, Inc. was 0.57% . The difference in the Fund’s NAV performance and its market performance stems from the fact that the market share price is subject to the dynamics of secondary market trading, which could cause it to trade at a discount or premium to the Fund’s NAV share price at any time.
“Despite a bumpy ride, stocks
managed healthy returns
during the six months ended
June 30, 2007…”
The leading contributors to the portfolio’s performance were holdings among asset managers, custody banks, insurance names and select bank holdings. At the other end of the spectrum, small- and mid-cap regional banks and thrifts and mortgage companies generally limited the portfolio’s relative results.
Capital performance
Asset managers and custody banks were among the leading contributors to performance in the last six months behind positive stock selection and a sizable overweight to this winning industry. Affiliated Managers Group, Inc. (AMG), Franklin Resources, Inc. and Eaton Vance Corp. were all asset
Financial Trends Fund, Inc.
3
managers landing among the portfolio’s top 10 contributors. AMG was the leading contributor in this space thanks to continued strong earnings growth, as well as exposure to growing international and hedge-fund markets. Other notable contributors were State Street Corp. and Bank of New York Co. Inc. (The), whose earnings are driven largely by trust and custody bank businesses.
Adding value in insurance
Stock selection among insurance providers also helped relative results. Life insurance firms benefited from consolidation, as well as trends we’ve highlighted in the past, including a changing product mix and growing demand for insurance services from the aging baby-boom population. Positioning among property and casualty firms also contributed significantly, where it helped to be underweight this lagging industry segment and to have our stocks outperform this slice of the index.
Regional banks mixed
Despite difficult current business conditions, we’ve maintained an overweight to regional banks because we believe there’s a compelling long-term investment opportunity in these shares. Indeed, it’s worth noting that banks managed to post near-record profits even in the face of slower loan growth and revenue pressures from deposit competition and the inverted yield curve. In addition, credit trends across the board have generally been better than expected despite fears of mortgage-related defaults.
| INDUSTRY DISTRIBUTION1 | |
| Regional banks | 37% |
| Asset management | |
| & custody banks | 11% |
| Other diversified | |
| financial services | 10% |
| Diversified banks | 8% |
| Investment banking | |
| & brokerage | 7% |
| Life & health insurance | 6% |
| Multi-line insurance | 4% |
| Thrifts & mortgage | |
| finance | 4% |
| Diversified capital | |
| markets | 3% |
| Property & | |
| casualty insurance | 3% |
| Specialized finance | 2% |
| All others | 5% |
And as often happens in difficult earnings growth environments for banks, merger and acquisition activity was strong, supporting Fund performance. Indeed, Commercial Bankshares, Inc. was the top contributor to performance after being acquired at a significant premium by Colonial Bancorp in a cash and stock deal. Compass Bancshares, Inc. was another leading contributor — a large, long-time holding acquired by Spanish bank BBVA at a premium that also performed well in the build-up to the deal. Two other notable contributors were City National Corp. and SunTrust Banks, Inc., which benefited from speculation that they were next in line for buyouts by big U.S. and European banks.
Financial Trends Fund, Inc.
4
Nevertheless, many of the portfolio’s largest detractors from performance were small-cap regional banks — such as Pinnacle Financial Partners, Inc.; Hancock Holding Co; LSB Bancshares, Inc.; First Charter Corp.; and Seacoast Banking Corp. of Florida — that experienced a slowdown in growth or suffered earnings misses as a result of the poor business environment.
“Asset managers and custody
banks were among the leading
contributors to performance…”
Thrifts, investment banks detract
Thrifts and mortgage companies performed poorly, weighed down by worries about subprime risk to their loan portfolios. We were actually underweight this lagging industry segment; unfortunately, our mortgage and thrift holdings underperformed this portion of the index. A number of investment banks also were hit by worry about exposure to subprime loans repackaged and sold as marketable securities, including the Fund’s largest investment bank holding, Merrill Lynch & Co., Inc.
Outlook
We remain generally positive on the financials sector, given the economic and investing backdrop. That said, the business climate for banks is likely to remain challenging in the near term, with revenue growth sluggish for banks reliant on traditional spread income.
We’re looking for names we believe can outperform in this environment, which include capital market-related shares and banks that generate a higher portion of their revenue from fees. We should also point out that we’re finding valuations for some of the smaller banking stocks that have underperformed to be increasingly attractive.
This commentary reflects the views of the portfolio managers through the end of the Fund’s period discussed in this report. The managers’ statements reflect their own opinions. As such, they are in no way guarantees of future events, and are not intended to be used as investment advice or a recommendation regarding any specific security. They are also subject to change at any time as market and other conditions warrant.
Sector investing is subject to greater risks than the market as a whole.
1 As a percentage of net assets on June 30, 2007.
Financial Trends Fund, Inc.
5
F I N A N C I A L S T A T E M E N T S
Fund’s investments
Securities owned by the Fund on 6-30-07 (unaudited)
This schedule is divided into two main categories: common stocks and short-term investments. Common stocks are further broken down by industry group. Short-term investments, which represent the Fund’s cash position, are listed last.
| Issuer | Shares | Value |
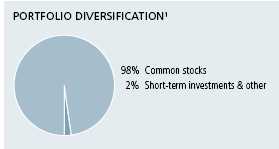
| Common stocks 97.94% | $83,064,473 | |
| (Cost $44,715,389) | ||
| Aerospace & Defense 0.77% | 653,760 | |
| AerCap Holdings NV (Netherlands) (F)(I) | 20,430 | 653,760 |
| Asset Management & Custody Banks 11.37% | 9,640,525 | |
| Affiliated Managers Group, Inc. (I)(L) | 16,700 | 2,150,291 |
| Bank of New York Co., Inc. (The) (I)(W) | 24,000 | 994,560 |
| Eaton Vance Corp. | 20,000 | 883,600 |
| Franklin Resources, Inc. | 6,950 | 920,666 |
| Legg Mason, Inc. | 17,700 | 1,741,326 |
| Northern Trust Corp. | 5,000 | 321,200 |
| State Street Corp. | 34,000 | 2,325,600 |
| Tortoise Capital Resources Corp. | 17,400 | 303,282 |
| Diversified Banks 8.14% | 6,899,129 | |
| U.S. Bancorp. | 67,500 | 2,224,125 |
| Wachovia Corp. | 45,653 | 2,339,716 |
| Wells Fargo & Co. | 66,400 | 2,335,288 |
| Diversified Capital Markets 3.35% | 2,835,472 | |
| UBS AG (Switzerland) (F) | 47,250 | 2,835,472 |
| Investment Banking & Brokerage 7.42% | 6,291,500 | |
| Evercore Partners, Inc. | 25,850 | 769,555 |
| Goldman Sachs Group, Inc. (The) | 3,300 | 715,275 |
| KBW, Inc. (I) | 5,700 | 167,466 |
| Lehman Brothers Holdings, Inc. | 6,700 | 499,284 |
| Merrill Lynch & Co., Inc. | 19,600 | 1,638,168 |
| Morgan Stanley (W) | 7,750 | 650,070 |
| Raymond James Financial, Inc. | 59,925 | 1,851,682 |
| Life & Health Insurance 5.87% | 4,979,986 | |
| AFLAC, Inc. | 25,000 | 1,285,000 |
| Prudential Financial, Inc. | 21,810 | 2,120,586 |
| StanCorp Financial Group, Inc. | 30,000 | 1,574,400 |
| Marine 0.66% | 559,700 | |
| OceanFreight, Inc. (Greece) (F)(I) | 29,000 | 559,700 |
See notes to financial statements
Financial Trends Fund, Inc.
6
F I N A N C I A L S T A T E M E N T S
| Issuer | Shares | Value |
| Multi-Line Insurance 4.21% | $3,572,492 | |
| American International Group, Inc. | 17,000 | 1,190,510 |
| Genworth Financial, Inc. (Class A) | 15,550 | 534,920 |
| Hartford Financial Services Group, Inc. (The) | 18,750 | 1,847,062 |
| Other Diversified Financial Services 9.62% | 8,155,339 | |
| Bank of America Corp. | 66,008 | 3,227,131 |
| Citigroup, Inc. | 45,850 | 2,351,646 |
| JPMorgan Chase & Co. | 41,960 | 2,032,962 |
| SNS Reaal (Netherlands) (F)(C) | 24,030 | 543,600 |
| Property & Casualty Insurance 3.27% | 2,777,045 | |
| Ambac Financial Group, Inc. | 7,000 | 610,330 |
| Assured Guaranty Ltd. (Bermuda) (F) | 7,950 | 235,002 |
| Axis Capital Holdings Ltd. (Bermuda) (F) | 12,000 | 487,800 |
| OneBeacon Insurance Group Ltd. | 18,290 | 463,286 |
| ProAssurance Corp. (I) | 17,615 | 980,627 |
| Regional Banks 36.68% | 31,113,228 | |
| Alabama National Bancorp. | 13,100 | 810,104 |
| Ameris Bancorp. | 22,180 | 498,385 |
| BancorpSouth, Inc. | 19,167 | 468,825 |
| BB&T Corp. | 38,382 | 1,561,380 |
| BOK Financial Corp. | 26,776 | 1,430,374 |
| Boston Private Financial Holdings, Inc. | 4,950 | 133,007 |
| Capital City Bank Group, Inc. (L) | 26,327 | 825,088 |
| City National Corp. | 18,550 | 1,411,470 |
| Colonial BancGroup, Inc. (The) | 79,028 | 1,973,329 |
| Commerce Bancshares, Inc. | 13,371 | 605,706 |
| Cullen/Frost Bankers, Inc. | 30,321 | 1,621,264 |
| First Bancorp. of North Carolina | 18,532 | 347,104 |
| First Charter Corp. | 40,850 | 795,349 |
| First Horizon National Corp. | 20,580 | 802,620 |
| Hancock Holding Co. | 21,950 | 824,223 |
| LSB Bancshares, Inc. | 56,512 | 771,389 |
| M&T Bank Corp. | 7,000 | 748,300 |
| Marshall & Ilsley Corp. | 12,950 | 616,809 |
| Peoples BancTrust Co., Inc. (The) | 48,300 | 1,199,772 |
| Pinnacle Financial Partners, Inc. (I) | 75,000 | 2,202,000 |
| PNC Financial Services Group, Inc. (The) | 22,150 | 1,585,497 |
| Provident Bankshares Corp. | 21,656 | 709,884 |
| Seacoast Banking Corp. of Florida (L) | 69,520 | 1,512,060 |
| SunTrust Banks, Inc. | 22,006 | 1,886,794 |
| SVB Financial Group (I) | 22,500 | 1,194,975 |
| Synovus Financial Corp. | 20,100 | 617,070 |
| TCF Financial Corp. | 40,150 | 1,116,170 |
| Whitney Holding Corp. | 19,700 | 592,970 |
| Zions Bancorp. | 29,272 | 2,251,310 |
See notes to financial statements
Financial Trends Fund, Inc.
7
F I N A N C I A L S T A T E M E N T S
| Issuer | Shares | Value | |||
| Reinsurance 0.61% | $520,401 | ||||
| RAM Holdings Ltd. (Bermuda) (F)(I) | 10,410 | 163,958 | |||
| RenaissanceRe Holdings Ltd. (Bermuda) (F) | 5,750 | 356,443 | |||
| Specialized Finance 2.07% | 1,756,554 | ||||
| CIT Group, Inc. | 6,680 | 366,264 | |||
| Interactive Brokers Group, Inc., Class A (I) | 20,220 | 548,569 | |||
| Nymex Holdings, Inc. | 6,700 | 841,721 | |||
| Thrifts & Mortgage Finance 3.90% | 3,309,342 | ||||
| Countrywide Financial Corp. | 4,650 | 169,028 | |||
| First Financial Holdings, Inc. | 40,500 | 1,324,755 | |||
| Hudson City Bancorp., Inc. | 36,950 | 451,529 | |||
| South Street Financial Corp. | 95,000 | 745,750 | |||
| Washington Mutual, Inc. | 14,500 | 618,280 | |||
| Interest | Maturity | Par value | |||
| Issuer, description | rate | date | (000) | Value | |
| Short-term investments 7.22% | $6,123,060 | ||||
| (Cost $6,123,060) | |||||
| Certificates of Deposit 0.02% | 13,202 | ||||
| First Piedmont | 2.600% | 09-30-07 | $2 | 2,344 | |
| Home Federal Tennessee | 4.410 | 09-28-07 | 2 | 2,159 | |
| Oconee Federal Savings Bank | 5.610 | 09-27-07 | 2 | 2,407 | |
| Piedmont Federal Savings Bank | 4.200 | 10-09-07 | 2 | 2,251 | |
| Securities Savings Bank | 3.730 | 09-28-07 | 2 | 2,192 | |
| Stephen Federal Bank | 4.000 | 10-11-07 | 2 | 1,849 | |
| Joint Repurchase Agreement 1.81% | 1,540,000 | ||||
| Joint Repurchase Agreement with Cantor Fitzgerald LP | |||||
| dated 6-29-07 at 4.40% to be repurchased | |||||
| at $1,540,565 on 7-2-07, collateralized by | |||||
| $1,207,843 of U.S. Treasury Inflation Indexed | |||||
| Note, 3.875%, due 1-15-09 (Valued at | |||||
| $1,570,800, including interest) | 1,540 | 1,540,000 | |||
| Issuer | Shares | Value | |||
| Cash Equivalents 5.39% | 4,569,858 | ||||
| John Hancock Cash Investment Trust (T)(W) | 4,569,858 | ||||
| Total investments (Cost $50,838,449) 105.16% | $89,187,533 | ||||
| Other assets and liabilities, net (5.16%) | ($4,374,694) | ||||
| Total net assets 100.00% | $84,812,839 | ||||
See notes to financial statements
Financial Trends Fund, Inc.
8
F I N A N C I A L S T A T E M E N T S
Notes to Schedule of Investments
The percentage shown for each investment category is the total value of that category as a percentage of the net assets of the Fund.
(C) Parenthetical disclosure of a country in the security description represents country of issuer; however, the security is euro-denominated.
(F) Parenthetical disclosure of a foreign country in the security description represents country of a foreign issuer; however, security is U.S. dollar-denominated.
(I) Non-income-producing security.
(L) All or a portion of this security is on loan as of June 30, 2007.
(T) Represents investment of securities lending collateral.
(W) Issuer is an affiliate of John Hancock Advisers, LLC.
See notes to financial statements
Financial Trends Fund, Inc.
9
F I N A N C I A L S T A T E M E N T S
Financial statements
Statement of assets and liabilities 6-30-07 (unaudited)
This Statement of Assets and Liabilities is the Fund’s balance sheet. It shows the value of what the Fund owns, is due and owes. You’ll also find the net asset value for each common share.
| Assets | |
| Investments in unaffiliated issuers, at value (cost $46,268,591) including | |
| $4,436,656 of securities loaned (Note 1) | $84,617,675 |
| Investments in affiliated issuers, at value (cost $4,569,858) | 4,569,858 |
| Total investments, at value (cost $50,838,449) | 89,187,533 |
| Cash | 2,359 |
| Receivable for investments sold | 167,152 |
| Dividends and interest receivable | 130,276 |
| Total assets | 89,487,320 |
| Liabilities | |
| Payable upon return of securities loaned (Note 1) | 4,569,858 |
| Payable to affiliates | |
| Management fees | 33,157 |
| Other | 12,211 |
| Other payables and accrued expenses | 59,255 |
| Total liabilities | 4,674,481 |
| Net assets | |
| Capital paid-in | 40,212,716 |
| Accumulated net realized gain on investments and foreign currency transactions | 5,685,614 |
| Net unrealized appreciation of investments | 38,349,084 |
| Accumulated net investment income | 565,425 |
| Net assets | $84,812,839 |
| Net asset value per share | |
| Based on 3,993,124 shares outstanding — 50 million shares authorized | |
| with par value of $0.001 per share. | $21.24 |
See notes to financial statements
Financial Trends Fund, Inc.
10
F I N A N C I A L S T A T E M E N T S
Statement of operations For the period ended 6-30-07 (unaudited)1
This Statement of Operations summarizes the Fund’s investment income earned and expenses incurred in operating the Fund. It also shows net gains (losses) for the period stated.
| Investment income | |
| Dividends (net of foreign withholding taxes of $11,981) | $994,550 |
| Interest | 29,534 |
| Securities lending | 1,426 |
| Total investment income | 1,025,510 |
| Expenses | |
| Investment management fees (Note 2) | 256,549 |
| Administration fees (Note 2) | 59,204 |
| Compliance fees | 943 |
| Directors’ fees | 88,118 |
| Professional fees | 36,047 |
| Custodian fees | 11,979 |
| Printing fees | 10,557 |
| Transfer agent fees | 7,314 |
| Registration and filing fees | 216 |
| Securities lending fees | 30 |
| Interest | 14 |
| Miscellaneous | 13,301 |
| Total expenses | 484,272 |
| Net investment income | 541,238 |
| Realized and unrealized gain (loss) | |
| Net realized gain (loss) on | |
| Investments | 4,907,319 |
| Foreign currency transactions | (1,764) |
| Change in net unrealized appreciation (depreciation) of | |
| Investments | (5,475,610) |
| Net realized and unrealized loss | (570,055) |
| Decrease in net assets from operations | ($28,817) |
1 Semiannual period from 1-1-07 to 6-30-07.
See notes to financial statements
Financial Trends Fund, Inc.
11
F I N A N C I A L S T A T E M E N T S
Statement of changes in net assets
These Statements of Changes in Net Assets show how the value of the Fund’s net assets has changed during the last two periods. The difference reflects earnings less expenses, any investment gains and losses, distributions, if any, paid to shareholders.
| Year | Period | |
| ended | ended | |
| 12-31-06 | 6-30-071 | |
| Increase (decrease) in net assets | ||
| From operations | ||
| Net investment income | $1,002,093 | $541,238 |
| Net realized gain | 4,127,322 | 4,905,555 |
| Change in net unrealized appreciation (depreciation) | 6,630,982 | (5,475,610) |
| Increase (decrease) in net assets resulting from operations | 11,760,397 | (28,817) |
| Distributions to common shareholders | ||
| From net investment income | (1,038,212) | — |
| From net realized gain | (3,569,454) | — |
| (4,607,666) | — | |
| Total increase (decrease) | 7,152,731 | (28,817) |
| Net assets | ||
| Beginning of period | 77,688,925 | 84,841,656 |
| End of period2 | $84,841,656 | $84,812,839 |
1 Semiannual period from 1-1-07 to 6-30-07. Unaudited.
2 Includes accumulated net investment income of $24,187 and $565,425, respectively.
See notes to financial statements
Financial Trends Fund, Inc.
12
F I N A N C I A L S T A T E M E N T S
Financial highlights
The Financial Highlights show how the Fund’s net asset value for a share has changed since the end of the previous period.
| Period ended | 12-31-021 | 12-31-031 | 12-31-041 | 12-31-05 | 12-31-06 | 6-30-072 |
| Per share operating performance | ||||||
| Net asset value, | ||||||
| beginning of period | $15.67 | $14.39 | $17.63 | $19.09 | $19.46 | $21.25 |
| Net investment income3 | 0.16 | 0.17 | 0.19 | 0.23 | 0.25 | 0.14 |
| Net realized and unrealized | ||||||
| gain (loss) on investments | (0.66) | 3.814 | 2.44 | 0.96 | 2.69 | (0.15) |
| Total from investment operations | (0.50) | 3.98 | 2.63 | 1.19 | 2.94 | (0.01) |
| Less distributions | ||||||
| From net investment income | (0.16) | (0.16) | (0.20) | (0.22) | (0.26) | — |
| From net realized gain | (0.62) | (0.58) | (0.97) | (0.60) | (0.89) | — |
| (0.78) | (0.74) | (1.17) | (0.82) | (1.15) | — | |
| Net asset value, end of period | $14.39 | $17.63 | $19.09 | $19.46 | $21.25 | $21.24 |
| Per share market value, | ||||||
| end of period | $12.36 | $18.40 | $17.47 | $16.68 | $19.01 | $19.06 |
| Total return at net asset value5 (%) | (2.39)8 | 30.578 | 15.818 | 6.99 | 15.92 | (0.05)6 |
| Total return at market value5 (%) | (0.25) | 58.66 | 1.54 | 0.21 | 20.99 | 0.266 |
| Ratios and supplemental data | ||||||
| Net assets, end of period | ||||||
| (in millions) | $57 | $70 | $76 | $78 | $85 | $85 |
| Ratio of expenses to average | ||||||
| net assets (%) | 1.16 | 1.20 | 1.22 | 1.18 | 1.21 | 1.197 |
| Ratio of net investment income | ||||||
| to average net assets (%) | 1.04 | 1.04 | 1.04 | 1.21 | 1.21 | 1.337 |
| Portfolio turnover (%) | 42 | 26 | 10 | 4 | 10 | 156 |
1 Audited by previous auditor.
2 Semiannual period from 1-1-07 to 6-30-07. Unaudited.
3 Based on the average of the shares outstanding.
4 Net of federal income taxes of $0.39 per share for the year ended 12-31-03, on net long-term capital gains retained by the Fund.
5 Total return based on net asset value reflects changes in the Fund’s net asset value during each period. Total return based on market value reflects changes in market value. Each figure assumes that dividend and capital gain distributions, if any, were reinvested. These figures will differ depending upon the level of any discount from or premium to net asset value at which the Fund’s shares traded during the period.
6 Not annualized.
7 Annualized.
8 Unaudited.
See notes to financial statements
Financial Trends Fund, Inc.
13
Notes to financial statements (unaudited)
Note 1
Accounting policies
John Hancock Financial Trends Fund, Inc. (the Fund) is a closed-end diversified management investment company registered under the Investment Company Act of 1940, as amended (the 1940 Act).
Significant accounting policies of the Fund are as follows:
Security valuation
The net asset value of the common shares of the Fund is determined daily as of the close of the NYSE, normally at 4:00 p.m., Eastern Time. Short-term debt investments that have a remaining maturity of 60 days or less are valued at amortized cost, and thereafter assume a constant amortization to maturity of any discount or premium, which approximates market value. Investments in John Hancock Cash Investment Trust (JHCIT), an affiliate of John Hancock Advisers, LLC (the Adviser), a wholly owned subsidiary of John Hancock Financial Services, Inc., a subsidiary of Manulife Financial Corpor ation (MFC), are valued at their net asset value each business day. All other securities held by the Fund are valued at the last sale price or official closing price (closing bid price or last evaluated quote if no sale has occurred) as of the close of business on the principal securities exchange (domestic or foreign) on which they trade or, lacking any sales, at the closing bid price. Securities traded only in the over-the-counter market are valued at the last bid price quoted by brokers making markets in the securities at the close of trading. Securities for which there are no such quotations, principally debt securities, are valued based on the valuation provided by an independent pricing service, which utilizes both dealer-supplied and electronic data processing techniques, which take into account factors such as institutional-size trading in similar groups of securities, yield, quality, coupon rate, maturity, type of issue, trading ch aracteristics and other market data.
Other assets and securities for which no such quotations are readily available are valued at fair value as determined in good faith under consistently applied procedures established by and under the general supervision of the Board of Trustees. Generally, trading in non-U.S. securities is substantially completed each day at various times prior to the close of trading on the NYSE. The values of such securities used in computing the net asset value of the Fund’s shares are generally determined as of such times. Occasionally, significant events that affect the values of such securities may occur between the times at which such values are generally determined and the close of the NYSE. Upon such an occurrence, these securities will be valued at fair value as determined in good faith under consistently applied procedures established by and under the general supervision of the Board of Trustees.
Joint repurchase agreement
Pursuant to an exemptive order issued by the Securities and Exchange Commission (SEC), the Fund, along with other registered investment companies having a management contract with the Adviser may participate in a joint repurchase agreement transaction. Aggregate cash balances are invested in one or more large repurchase agreements, whose underlying securities are obligations of the U.S. government and/or its agencies. The Fund’s custodian bank receives delivery of the underlying securities for the joint account on the Fund’s behalf. The Adviser is responsible for ensuring that the agreement is fully collateralized at all times.
Financial Trends Fund, Inc.
14
Investment transactions
Investment transactions are accounted for on a trade date plus one basis for daily net asset value calculations. However, for financial reporting purposes, investment transactions are reported on trade date. Net realized gains and losses on sales of investments are determined on the identified cost basis.
Securities lending
The Fund may lend securities in amounts up to 33 1 / 3% of the Fund’s total assets. Such loans are callable at any time and are at all times fully secured by cash, cash equivalents or securities issued or guaranteed by the U.S. Government or its agencies or instrumentalities and marked-to-market on a daily basis. The Fund may bear the risk of delay in recovery of, or even of rights in, the securities loaned should the borrower of the securities fail financially. The Fund receives compensation for lending their securities either in the form of fees and/or by retaining a portion of interest on the investment of any cash received as collateral. The Fund invests the cash collateral received in connection with securities lending transactions in the JHCIT, a Delaware common la w trust and an affiliated fund. JHCIT is exempt from registration under Section 3(c)(7) of the 1940 Act (pursuant to exemptive order issued by the SEC) and is managed by the Adviser, for which the Adviser receives an investment advisory fee of 0.04% of the average daily net assets of the JHCIT.
All collateral received will be in an amount equal to at least 100% of the market value of the loaned securities and is intended to be maintained at that level during the period of the loan. The market value of the loaned securities is determined at the close of business of the Fund and any additional required collateral is delivered to the Fund the next business day. During the loan period, the Fund continues to retain rights of ownership, including dividends and interest of the loaned securities. As of June 30, 2007, the Fund loaned securities having a market value of $4,436,656 collateralized by cash invested in securities in the amount of $4,569,858.
Federal income taxes
The Fund qualifies as a “regulated investment company” by complying with the applicable provisions of the Internal Revenue Code and will not be subject to federal income tax on taxable income that is distributed to shareholders. Therefore, no federal income tax provision is required.
New accounting pronouncements
In June 2006, Financial Accounting Standards Board (FASB) Interpretation No. 48, Accounting for Uncertainty in Income Taxes (the Interpretation), was issued and is effective for fiscal years beginning after December 15, 2006, and is to be applied to all open tax years as of the effective date. This Interpretation prescribes a minimum threshold for financial statement recognition of the benefit of a tax position taken or expected to be taken in a tax return, and requires certain expanded disclosures. Management has evaluated the application of this Interpretation to the Fund and does not believe there is a material impact resulting from the adoption of this Interpretation on the Fund’s financial statements.
In September 2006, FASB Standard No. 157, Fair Value Measurements (FAS 157), was issued and is effective for fiscal years beginning after November 15, 2007. FAS 157 defines fair value, establishing a framework for measuring fair value and expands disclosure about fair value measurements. Management is currently evaluating the application of FAS 157 to the Fund and its impact, if any, resulting from the adoption of FAS 157 on the Fund’s financial statements.
Dividends, interest and distributions
Dividend income on investment securities is recorded on the ex-dividend date or, in the case of some foreign securities, on the date thereafter when the Fund identifies the dividend. Interest income on investment securities is recorded on the accrual basis. Foreign income may be subject to foreign withholding taxes, which are accrued as applicable.
The Fund records distributions to shareholders from net investment income and net realized gains, if any, on the ex-dividend date. During the year ended December 31, 2006, the tax character of distributions paid was as follows:
Financial Trends Fund, Inc.
15
ordinary income $1,478,534 and long-term capital gains $3,129,132.
Such distributions on a tax basis, are determined in conformity with income tax regulations, which may differ from accounting principles generally accepted in the United States of America. Distributions in excess of tax basis earnings and profits, if any, are reported in the Fund’s financial statements as a return of capital.
Use of estimates
The preparation of these financial statements, in accordance with accounting principles generally accepted in the United States of America, incorporates estimates made by management in determining the reported amount of assets, liabilities, revenues and expenses of the Fund. Actual results could differ from these estimates.
Note 2
Management fees and transactions
with affiliates and others
The Fund has an investment management contract with the Adviser, under which the Adviser furnishes office space, furnishings and equipment and provides the services of persons to manage the investment of the Fund’s assets and to continually review, supervise and administer the Fund’s investment program. Under the investment management agreement the Fund pays a monthly management fee to the Adviser at an annual rate of 0.65% of the Fund’s average weekly net asset value, or a flat annual fee of $50,000, whichever is higher. If total Fund expenses exceed 2% of the fund’s average weekly net asset value in any one year, the Fund may require the Adviser to reimburse the Fund for such excess, subject to a minimum fee of $50,000.
The Fund has an administration agreement with the Adviser under which the Adviser provides certain administrative services required by the Fund. The Fund pays a monthly administration fee to the Adviser at an annual rate of 0.15% of the Fund’s average weekly net assets value, or a flat annual fee of $22,000, whichever is higher. The compensation for the period amounted to $59,204. The Fund also reimbursed John Hancock Life Insurance Company for certain compliance costs, included in the Fund’s Statement of Operations.
The Fund does not pay remuneration to its Officers. Certain Officers of the Fund are officers of the Adviser.
Note 3
Guarantees and indemnifications
Under the Fund’s organizational documents, its Officers and Trustees are indemnified against certain liability arising out of the performance of their duties to the Fund. Additionally, in the normal course of business, the Fund enters into contracts with service providers that contain general indemnification clauses. The Fund’s maximum exposure under these arrangements is unknown, as this would involve future claims that may be made against the Fund that have not yet occurred. However, based on experience, the Fund believes the risk of loss to be remote.
Note 4
Fund share transactions
The Fund had no share transactions during the year ended December 31, 2006 and the period ended June 30, 2007.
The Fund from time-to-time may, but is not required to, make open market repurchases of its shares in order to attempt to reduce or eliminate the amount of any market value discount or to increase the net asset value of its shares, or both. In addition, the Board currently intends each quarter during periods when the Fund’s shares are trading at a discount from the net asset value to consider the making of tender offers. The Board may at any time, however, decide that the Fund should not make share repurchases or tender offers.
Note 5
Investment transactions
Purchases and proceeds from sales or maturities of securities, other than short term securities and obligations of the U.S. government, during the period ended June 30, 2007, aggregated $12,293,479 and $12,925,936, respectively.
The cost of investments owned on June 30, 2007, including short-term investments,
Financial Trends Fund, Inc.
16
for federal income tax purposes, was $50,843,637. Gross unrealized appreciation and depreciation of investments aggregated $38,429,557 and $85,661, respectively, resulting in net unrealized appreciation of $38,343,896. The difference between book basis and tax basis net unrealized appreciation of investments is attributable primarily to the tax deferral of losses on certain sales of securities.
Note 6
SEC settlement
On June 25, 2007, John Hancock Advisers, LLC (the Adviser) and John Hancock Funds, LLC (the Distributor) and two of their affiliates (collectively, the John Hancock Affiliates) reached a settlement with the SEC that resolved an investigation of certain practices relating to the John Hancock Affiliates’ variable annuity and mutual fund operations involving directed brokerage and revenue sharing. Under the terms of the settlement, each John Hancock Affiliate was censured and agreed to pay a $500,000 civil penalty to the United States Treasury. In addition, the Adviser and the Distributor agreed to pay disgorgement of $2,087,477 and prejudgment interest of $359,460 to entities, including certain John Hancock Funds, that participated in the Adviser’s directed brokerage program during the period from 2000 to October 2003. Collectively, all John Hancock Affiliates agreed to pay a total disgorgement of $16,926,420 and prejudgment interest of $2,361,460 to the entities advised or distributed by John Hancock Affiliates. The Adviser discontinued the use of directed brokerage in recognition of the sale of Fund shares in October 2003. As a result of this settlement, the Fund received $19,770, which was recorded as a realized gain to the Fund’s books on June 25, 2007.
Financial Trends Fund, Inc.
17
Investment objective and policy
The Fund’s primary investment objective is long-term capital appreciation. Its secondary investment objective is current income. The Fund will seek to achieve its primary investment objective of long-term capital appreciation by investing at least 80% (65% prior to January 25, 2002) of its assets in stocks of U.S. and foreign financial services companies of any size. These companies include banks, thrifts, finance companies, brokerage and advisory firms, real estate-related firms, insurance companies and financial holding companies. These companies are usually regulated by governmental or quasi-governmental entities and, as a result, are subject to the risk that regulatory developments will adversely affect them. With respect to the Fund’s investment policy of investing at least 80% of “assets” in equity securities, “assets” is defined as net assets plus the amount of any borrowings for investment purpos es. The Fund will notify shareholders at least 60 days prior to any change in this policy. In abnormal market conditions, the Fund may take temporary defensive positions.
As such, the Fund may temporarily invest all of its assets in investment-grade, short-term securities. In such circumstances, the Fund may not achieve its objective. The Fund’s current investment restriction, relating to industry concentration, has been modified to remove the reference to the banking and savings industry so that it reads as follows: “Except for temporary defensive purposes, the Fund may not invest more than 25% of its total assets in any one industry or group of related industries, except that the Fund will invest more than 25% of its assets in the financial services sector.”
Repurchase agreement
A repurchase agreement is a contract under which the Fund would acquire a security for a relatively short period (usually not more than seven days) subject to the obligation of the seller to repurchase and the Fund to resell such security at a fixed time and price (representing the Fund’s cost plus interest). The Fund will enter into repurchase agreements only with member banks of the Federal Reserve System and with “primary dealers” in U.S. government securities. The Adviser will continuously monitor the creditworthiness of the parties with whom the Fund enters into repurchase agreements.
Repurchase transactions must be fully collateralized at all times, but they involve some credit risk to the Fund if the other party defaults on its obligations and the Fund is delayed or prevented from liquidating the collateral. The Fund has established a procedure providing that the securities serving as collateral for each repurchase agreement must be delivered to the Fund’s custodian either physically or in book-entry form and that the collateral must be marked to market daily to ensure that each repurchase agreement is fully collateralized at all times. In the event of bankruptcy or other default by a seller on a repurchase agreement, the Fund could experience delays in liquidating the underlying securities and could experience losses, including the possible decline in the value of the underlying securities during the period while the Fund seeks to enforce its rights thereto, possible subnormal levels of income, lack of acc ess to income during this period and the expense of enforcing its rights.
Bylaws
In January 2003, the Board of Directors adopted several amendments to the Fund’s bylaws, including provisions relating to the calling of a special meeting and requiring advance notice of shareholder proposals or nominees for Director. The advance notice provisions in the bylaws require shareholders to notify the Fund in writing of any proposal that they intend to present at an annual meeting of shareholders, including any nominations for Director, between 90 and 120 days prior to the first anniversary of the mailing date of the notice from the prior year’s annual meeting of shareholders. The notification must be in the form prescribed by the bylaws. The advance notice provisions provide the Fund and its Directors with the opportunity to thoughtfully consider and address the matters proposed before the Fund prepares and mails its proxy statement to shareholders. Other amendments set forth the procedures that must be followed in order for a shareholder to call a special meeting of shareholders. The Fund is presently listed on NASDAQ and, per a grandfathering provision, it is not required to hold annual shareholder meetings. The Board
18
approved the above amendment to the Fund’s bylaws to provide a defined structure for the submission of shareholder proposals, should the circumstances change and an annual meeting be required. Please contact the Secretary of the Fund for additional information about the advance notice requirements or the other amendments to the bylaws.
In November 2005, the Fund’s Board of Directors adopted several amendments to the Fund’s bylaws regarding the Chairman of the Board position. The Chairman of the Board shall at all times be a director who is not an interested person of the Fund as that term is defined by the Investment Company Act of 1940. The scope of the Chairman’s responsibilities and fiduciary obligations were further defined. Lastly, disclosure regarding the election, resignation and removal of the Chairman as well as the filling of a vacancy was added.
At a quarterly meeting of the Fund’s Board of Directors held February 13, 2006, the Board amended Article II Section 2 of the Fund’s bylaws to state that a special meeting of the stockholders, unless otherwise provided by law or by the Articles of Incorporation, may be called for any purpose or purposes by a majority of the Board of Directors, the President or, subject to Section 2(c), by the Secretary of the Corporation upon the written request of stockholders entitled to cast at least 35% of all votes entitled to be cast at the meeting.
Dividends and distributions
During the year ended December 31, 2006, dividends from net investment income totaling $0.260 per share and capital gain distributions totaling $0.894 were paid to shareholders. The dates of payments and the amounts per share are as follows:
| INCOME | |
| PAYMENT DATE | DIVIDEND |
| August 10, 2006 | $0.130 |
| December 29, 2006 | 0.130 |
| CAPITAL GAIN | |
| PAYMENT DATE | DISTRIBUTION |
| August 10, 2006 | $0.057 |
| December 29, 2006 | 0.837 |
Dividend reinvestment plan
The Fund offers its registered shareholders an automatic Dividend Reinvestment Plan (the Plan), which enables each participating shareholder to have all dividends (including income dividends and/or capital gains distributions) payable in cash, reinvested by Mellon Investor Services (the Plan Agent) in shares of the Fund’s common stock. However, shareholders may elect not to enter into, or may terminate at any time without penalty, their participation in the Plan by notifying the Plan Agent in writing. Shareholders who do not participate in the Plan will receive all dividends in cash.
In the case of shareholders such as banks, brokers or nominees who hold shares for others who are the beneficial owners, the Plan Agent will administer the Plan on the basis of record ownership of shares. These record shareholders will receive dividends under the Plan on behalf of participating beneficial owners and cash on behalf of non-participating beneficial owners. These recordholders will then credit the beneficial owners’ accounts with the appropriate stock or cash distribution.
Whenever the market price of the Fund’s stock equals or exceeds net asset value per share, participating shareholders will be issued stock valued at the greater of (i) net asset value per share or (ii) 95% of the market price. If the net asset value per share of the Fund’s stock exceeds the market price per share, the Plan Agent shall make open market purchases of the Fund’s stock for each participating shareholder’s account. These purchases may begin no sooner than five business days prior to the payment date for the dividend and will end up to 30 days after the payment date. If shares cannot be purchased within 30 days after the payment date, the balance of shares will be purchased from the Fund at the average price of shares purchased on the open market. Each participating shareholder will be charged a pro rata share of brokerage commissions on all open market purchases.
The shares issued to participating shareholders, including fractional shares, will be held by the Plan Agent in the name of the shareholder. The Plan Agent will confirm each acquisition made for the account of the participating shareholders
19
as soon as practicable after the payment date of the distribution.
The reinvestment of dividends does not relieve participating shareholders of any federal, state or local income tax that may be due with respect to each dividend. Dividends reinvested in shares will be treated on your federal income tax return as though you had received a dividend in cash in an amount equal to the fair market value of the shares received, as determined by the prices for shares of the Fund on the NASDAQ National Market System as of the dividend payment date. Distributions from the Fund’s long-term capital gains will be taxable to you as long-term capital gains. The confirmation referred to above will contain all the information you will require for determining the cost basis of shares acquired and should be retained for that purpose. At year-end, each account will be supplied with detailed information necessary to determine total tax liability for the calendar year.
All correspondence or additional information concerning the Plan should be directed to the Plan Agent, Mellon Bank, N.A., c/o Mellon Investor Services, P.O. Box 3338, South Hackensack, New Jersey 07606-1938 (Telephone: 1-800-852-0218).
Shareholder communication
and assistance
If you have any questions concerning the Fund, we will be pleased to assist you. If you hold shares in your own name and not with a brokerage firm, please address all notices, correspondence, questions or other communications regarding the Fund to the transfer agent at:
Mellon Investor Services
Newport Office Center VII
480 Washington Boulevard
Jersey City, NJ 07310
Telephone: 1-800-852-0218
If your shares are held with a brokerage firm, you should contact that firm, bank or other nominee for assistance.
20
For more information
The Fund’s proxy voting policies, procedures and records are available without charge, upon request:
| By phone | On the Fund’s Web site | On the SEC’s Web site |
| 1-800-225-5291 | www.jhfunds.com/proxy | www.sec.gov |
| Directors | Investment adviser | Independent directors’ |
| Franklin C. Golden | John Hancock Advisers, LLC | counsel |
| Robert G. Freedman | 601 Congress Street | Kilpatrick Stockton LLP |
| Russell J. Page | Boston, MA 02210-2805 | 1100 Peachtree Street |
| Fred G. Steingraber | Atlanta, GA 30309-4530 | |
| Donald R. Tomlin | Subadviser | |
| H. Hall Ware III | MFC Global Investment | Fund counsel |
| Management (U.S.), LLC | Wilmer Cutler Pickering | |
| Officers | 101 Huntington Avenue | Hale and Door LLP |
| Franklin C. Golden | Boston, MA 02199 | 60 State Street |
| Chairman | Boston, MA 02109-1803 | |
| Custodian | ||
| Barry H. Evans | The Bank of New York | Stock symbol |
| President | One Wall Street | Listed Nasdaq Symbol: |
| New York, NY 10286 | JHFT | |
| William H. King | ||
| Treasurer | Transfer agent and registrar | For shareholder assistance, |
| Mellon Investor Services | refer to page 20 | |
| Francis V. Knox | Newport Office Center VII | |
| Vice President and | 480 Washington Boulevard | |
| Chief Compliance Officer | Jersey City, NJ 07310 | |
| Thomas M. Kinzler | ||
| Secretary and Chief | ||
| Legal Officer | ||
| How to contact us | ||
| Internet | www.jhfunds.com | |
| Mellon Investor Services | ||
| Newport Office Center VII | ||
| 480 Washington Boulevard | ||
| Jersey City, NJ 07310 | ||
| Phone | Customer service representatives | 1-800-852-0218 |
| Portfolio commentary | 1-800-344-7054 | |
| EASI-Line | 1-800-843-0090 | |
| TDD line | 1-800-231-5469 | |
A listing of month-end portfolio holdings is available on our Web site, www.jhfunds.com. A more detailed portfolio holdings summary is available on a quarterly basis 60 days after the fiscal quarter on our Web site or upon request by calling 1-800-225-5291, or on the SEC’s Web site, www.sec.gov.
24
J O H N H A N C O C K F A M I L Y O F F U N D S
| EQUITY | INTERNATIONAL/GLOBAL |
| Balanced Fund | Global Opportunities Fund |
| Classic Value Fund | Global Shareholder Yield Fund |
| Classic Value Fund II | Greater China Opportunities Fund |
| Classic Value Mega Cap Fund | International Allocation Portfolio |
| Core Equity Fund | International Classic Value Fund |
| Growth Fund | International Core Fund |
| Growth Opportunities Fund | International Growth Fund |
| Growth Trends Fund | |
| Intrinsic Value Fund | INCOME |
| Large Cap Equity Fund | Bond Fund |
| Large Cap Select Fund | Government Income Fund |
| Mid Cap Equity Fund | High Yield Fund |
| Multi Cap Growth Fund | Investment Grade Bond Fund |
| Small Cap Equity Fund | Strategic Income Fund |
| Small Cap Fund | |
| Small Cap Intrinsic Value Fund | TAX-FREE INCOME |
| Sovereign Investors Fund | California Tax-Free Income Fund |
| U.S. Core Fund | High Yield Municipal Bond Fund |
| U.S. Global Leaders Growth Fund | Massachusetts Tax-Free Income Fund |
| Value Opportunities Fund | New York Tax-Free Income Fund |
| Tax-Free Bond Fund | |
| ASSET ALLOCATION | |
| Allocation Core Portfolio | MONEY MARKET |
| Allocation Growth + Value Portfolio | Money Market Fund |
| Lifecycle 2010 Portfolio | U.S. Government Cash Reserve |
| Lifecycle 2015 Portfolio | |
| Lifecycle 2020 Portfolio | CLOSED-END |
| Lifecycle 2025 Portfolio | Bank and Thrift Opportunity Fund |
| Lifecycle 2030 Portfolio | Financial Trends Fund, Inc. |
| Lifecycle 2035 Portfolio | Income Securities Trust |
| Lifecycle 2040 Portfolio | Investors Trust |
| Lifecycle 2045 Portfolio | Patriot Premium Dividend Fund II |
| Lifecycle Retirement Portfolio | Patriot Select Dividend Trust |
| Lifestyle Aggressive Portfolio | Preferred Income Fund |
| Lifestyle Balanced Portfolio | Preferred Income II Fund |
| Lifestyle Conservative Portfolio | Preferred Income III Fund |
| Lifestyle Growth Portfolio | Tax-Advantaged Dividend Income Fund |
| Lifestyle Moderate Portfolio | Tax-Advantaged Global Shareholder Yield Fund |
| SECTOR | |
| Financial Industries Fund | |
| Health Sciences Fund | |
| Real Estate Fund | |
| Regional Bank Fund | |
| Technology Fund | |
| Technology Leaders Fund | |
The Fund’s investment objectives, risks, charges and expenses are included in the prospectus and should be considered carefully before investing. For a prospectus, contact your financial professional, call John Hancock Funds at 1-800-225-5291 or visit the Fund’s Web site at www.jhfunds.com. Please read the prospectus carefully before investing or sending money.

1-800-852-0218
1-800-231-5469 TDD
1-800-843-0090 EASI-Line
www.jhfunds.com
PRESORTED
STANDARD
U.S. POSTAGE
PAID
MIS
PT0SA 6/07
8/07
ITEM 2. CODE OF ETHICS.
As of the end of the period, June 30, 2007, the registrant has adopted a code of ethics, as defined in Item 2 of Form N-CSR, that applies to its Chief Executive Officer, Chief Financial Officer and Treasurer (respectively, the principal executive officer, the principal financial officer and the principal accounting officer, the “Senior Financial Officers”). A copy of the code of ethics is filed as an exhibit to this Form N-CSR.
ITEM 3. AUDIT COMMITTEE FINANCIAL EXPERT.
Not applicable at this time.
ITEM 4. PRINCIPAL ACCOUNTANT FEES AND SERVICES.
Not applicable at this time.
ITEM 5. AUDIT COMMITTEE OF LISTED REGISTRANTS.
Not applicable at this time.
ITEM 6. SCHEDULE OF INVESTMENTS.
Not applicable.
ITEM 7. DISCLOSURE OF PROXY VOTING POLICIES AND PROCEDURES FOR CLOSED-END MANAGEMENT INVESTMENT COMPANIES.
Not applicable.
ITEM 8. PORTFOLIO MANAGERS OF CLOSED-END MANAGEMENT INVESTMENT COMPANIES.
Not applicable.
ITEM 9. PURCHASES OF EQUITY SECURITIES BY CLOSED-END MANAGEMENT INVESTMENT COMPANY AND AFFILIATED PURCHASERS.
Not applicable.
ITEM 10. SUBMISSION OF MATTERS TO A VOTE OF SECURITY HOLDERS.
The registrant has adopted procedures by which shareholders may recommend nominees to the registrant's Board of Trustees. A copy of the procedures is filed as an exhibit to this Form N-CSR. See attached “John Hancock Funds – Governance Committee Charter”.
ITEM 11. CONTROLS AND PROCEDURES.
(a) Based upon their evaluation of the registrant's disclosure controls and procedures as conducted within 90 days of the filing date of this Form N-CSR, the registrant's principal executive officer and principal financial officer have concluded that those disclosure controls and procedures provide reasonable assurance that the material information required to be disclosed
by the registrant on this report is recorded, processed, summarized and reported within the time periods specified in the Securities and Exchange Commission's rules and forms.
(b) There were no changes in the registrant's internal control over financial reporting that occurred during the registrant's most recent fiscal half-year (the registrant's second fiscal half-year in the case of an annual report) that have materially affected, or are reasonably likely to materially affect, the registrant's internal control over financial reporting.
ITEM 12. EXHIBITS.
(a)(1) Code of Ethics for Senior Financial Officers is attached.
(a)(2) Separate certifications for the registrant's principal executive officer and principal financial officer, as required by Section 302 of the Sarbanes-Oxley Act of 2002 and Rule 30a-2(a) under the Investment Company Act of 1940, are attached.
(b) Separate certifications for the registrant's principal executive officer and principal financial officer, as required by 18 U.S.C. Section 1350, as adopted pursuant to Section 906 of the Sarbanes-Oxley Act of 2002, and Rule 30a-2(b) under the Investment Company Act of 1940, are attached. The certifications furnished pursuant to this paragraph are not deemed to be "filed" for purposes of Section 18 of the Securities Exchange Act of 1934, or otherwise subject to the liability of that section. Such certifications are not deemed to be incorporated by reference into any filing under the Securities Act of 1933 or the Securities Exchange Act of 1934, except to the extent that the Registrant specifically incorporates them by reference.
(c)(1) Submission of Matters to a Vote of Security Holders is attached. See attached “John Hancock Funds – Governance Committee Charter”.
(c)(2) Contact person at the registrant.
SIGNATURES
Pursuant to the requirements of the Securities Exchange Act of 1934 and the Investment Company Act of 1940, the registrant has duly caused this report to be signed on its behalf by the undersigned, thereunto duly authorized.
John Hancock Financial Trends Fund, Inc.
By: /s/ Barry H. Evans
-------------------------------------
Barry H. Evans
President
Date: August 27, 2007
Pursuant to the requirements of the Securities Exchange Act of 1934 and the Investment Company Act of 1940, this report has been signed below by the following persons on behalf of the registrant and in the capacities and on the dates indicated.
By: /s/ Barry H. Evans
-------------------------------------
Barry H. Evans
President
Date: August 27, 2007
By: /s/ William H. King
-------------------------------------
William H. King
Treasurer
Date: August 27, 2007