UNITED STATES
SECURITIES AND EXCHANGE COMMISSION
Washington, D.C. 20549
FORM N-CSR
CERTIFIED SHAREHOLDER REPORT OF REGISTERED
MANAGEMENT INVESTMENT COMPANIES
Investment Company Act file number 811- 57347
John Hancock Financial Trends Fund, Inc.
(Exact name of registrant as specified in charter)
601 Congress Street, Boston, Massachusetts 02210
(Address of principal executive offices) (Zip code)
Alfred P. Ouellette
Senior Counsel and Assistant Secretary
601 Congress Street
Boston, Massachusetts 02210
(Name and address of agent for service)
| Registrant's telephone number, including area code: 617-663-4324 | ||
| Date of fiscal year end: | December | 31 |
| Date of reporting period: | December | 31, 2006 |
ITEM 1. REPORT TO SHAREHOLDERS.

| TABLE OF CONTENTS |
| Your fund at a glance |
| page 1 |
| Managers’ report |
| page 2 |
| Fund’s investments |
| page 6 |
| Financial statements |
| page 1 0 |
| Notes to financial |
| statements |
| page 1 4 |
| Directors and officers |
| page 2 7 |
| For more information |
| page 3 2 |
Welcome
Dear Fellow Shareholders:
The financial markets surprised many investors in 2006 by beating their expectations. At the beginning of the year, fears abounded about rising inflation — with sky high energy prices — a faster-growing economy, a decline in the housing boom and more interest rate hikes from the Federal Reserve. But by June, the economic data suggested the desired “soft landing” for the economy, energy prices stabilized, corporate earnings remained strong and the Fed stopped raising rates. With that, the market took off, producing double-digit returns instead of the single-digit ones originally thought to be the best the market would do. The ascent was widespread and the broad Standard & Poor’s 500 Index returned 15.79%, including reinvested dividends.
In this environment, financial stocks outperformed the broader market, returning 19.21% for the year, propelled by capital-market-related financial companies. The Fund participated in the market’s advance, returning 15.92% at net asset value (NAV) and 20.99% at market value.
On February 5, 2007, John Hancock announced that after more than 20 years of distinguished service, Jim Schmidt will retire on April 30, 2007. Jim has served on the management team since 1991, and he leaves the Fund in the capable hands of co-managers Lisa Welch and Roger Hamilton, who have more than 46 years of combined investment experience. Lisa has been a member of the team since 1998 and has taken the lead in the day-to-day portfolio management and operations from the time she became a portfolio manager five years ago. Roger has been with John Hancock since 1994 and has been a member of the Fund’s management team since 2006.
I have thoroughly enjoyed working with Jim for the last 15 years and want to express our best wishes and sincere appreciation on behalf of the board of directors and all the shareholders in our fund. I know Jim has taken great pride in the team he has built and we all look forward to working closely with them.
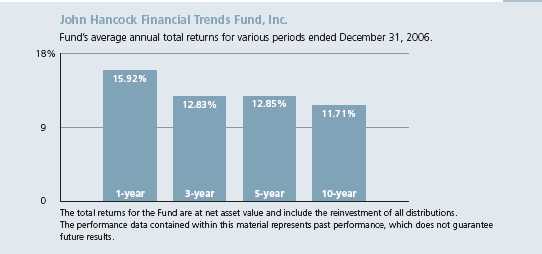
I encourage you to take the time to read the managers’ commentary closely to learn not only how your fund has performed over the last year, but also to appreciate that the long-term performance continues to be excellent. For each of the periods shown on the chart on the facing page, the Fund’s NAV return has surpassed (in some cases far surpassed) the returns of the S&P 500 Index.
As we begin 2007, I want to assure you that your Board of Directors continues to work hard on your behalf, putting your interests above all else.
Sincerely,

Franklin C. Golden
Chairman of John Hancock Financial Trends Fund, Inc.
This commentary reflects the Chairman’s views as of December 31, 2006. They are subject to change at any time.
Your fund at a glance
The Fund seeks long-term capital appreciation with current income as a secondary objective by investing at least 80% of its assets in stocks of U.S. and foreign financial services companies of any size.
Over the last twelve months
► Stocks performed well thanks to solid corporate earnings growth, a slowdown in inflation, moderating economic growth and an end to the Fed’s campaign for higher interest rates.
► Financial stocks outperformed the broader market because of solid returns by capital-market shares; banks lagged as the inverted yield curve hurt margins and deposit competition heated up.
► The Fund enjoyed solid absolute returns but lagged its benchmark because of an underweight to investment banks and an overweight to regional bank stocks.
| Top 10 holdings | ||||
| Bank of America Corp. | 4.2% | U.S. Bancorp. | 2.9% | |
| Zions Bancorp. | 3.1% | Wells Fargo & Co. | 2.8% | |
| Wachovia Corp. | 3.1% | Prudential Financial, Inc. | 2.6% | |
| Citigroup, Inc. | 3.0% | SunTrust Banks, Inc. | 2.5% | |
| Pinnacle Financial Partners, Inc. | 2.9% | Merrill Lynch & Co., Inc. | 2.4% | |
As a percentage of net assets on December 31, 2006.
1
Managers’ report
John Hancock
Financial Trends Fund, Inc.
After more than 20 years of distinguished service, James K. Schmidt will retire on April 30, 2007. The Fund will continue to be co-managed by Lisa Welch and Roger Hamilton. Ms. Welch has been a member of the management team since 1998 and has taken the lead in the day-to-day portfolio management and operations from the time she became a portfolio manager five years ago. Mr. Hamilton has been with John Hancock since 1994 and has been a member of the management team since 2006.
Stocks produced solid returns during 2006, when the Standard & Poor’s 500 Stock Index rose 15.79% . Corporate earnings growth remained healthy, while energy prices retreated from record highs and the Federal Reserve ended its long-running campaign for higher interest rates, holding the fed funds rate target steady at 5.25% since June. Economic growth slowed to a more moderate, sustainable pace, reflecting a slowdown in the housing market.
In this environment, financial shares outperformed, as the large-cap Standard & Poor’s 500 Financial Index returned 19.21%, finishing ahead of mid- and small-cap stocks in this sector. In terms of returns by industry, the good performance of global capital markets helped investment banks and brokers perform best. Other stocks with revenues tied to the financial markets — such as asset managers and custody banks and the big, diversified banks with exposure to capital-markets activity — produced attractive returns about in line with those of the index.
SCORECARD
| INVESTMENT | PERIOD’S PERFORMANCE. . . AND WHAT’S BEHIND THE NUMBERS | |
| Pinnacle Financial | ▲ | Up 33% on the year behind impressive revenue growth |
| Bank of America | ▲ | Better than expected earnings make this stock our top contributor |
| Legg Mason | ▼ | Trouble integrating new mutual fund products after big merger |
2

Portfolio Managers, MFC Global Investment Management (U.S.), LLC
James K. Schmidt, CFA, Lisa A. Welch and Roger C. Hamilton
Regional banks produced solid returns but lagged the index. A key theme in their underperformance was the inverted yield curve and an extremely competitive deposit pricing environment that put pressure on net interest margins. In addition, these tend to be small- and mid-cap institutions that didn’t benefit from the capital-market-driven returns of other financial shares.
Fund performance
For the year ended December 31, 2006, John Hancock Financial Trends Fund, Inc. posted total returns of 15.92% at net asset value (NAV) and 20.99% at market value. These results stack up well against the 15.79% return of the broader S&P 500 Index and the 16.84% average return of the open-end specialty-financial funds tracked by Morningstar, Inc. At the same time, the Standard & Poor’s 500 Financial Index returned 19.21% . The difference in the Fund’s NAV performance and its market performance stems from the fact that the market share price is subject to the dynamics of secondary market trading, which could cause it to trade at a discount or premium to the Fund’s NAV share price at any time.
“…financial shares outperformed,
as the large-cap Standard &
Poor’s 500 Financial Index
returned 19.21% ...”
The Fund’s underperformance of the financial index was a result of our positioning among investment banks and capital market-related shares, on the one hand, and an overweight to regional banks, on the other. In addition, we maintained a small- and mid-cap bias at a time when bigger was better.
Regional bank bias detracts
The portfolio’s bias toward medium- and small-sized banks is a result of the evolution of the Fund over time from a regional bank focus to a more
Financial Trends Fund, Inc.
3
broadly diversified financial services fund. Shareholders approved this change years ago to give us greater opportunity to add value to portfolio returns outside of one narrow industry segment. And it’s worth noting that the Fund has outperformed the broader market at net asset value — as measured by the S&P 500 Index — for the one-, three-, five- and 10-year periods ended December 31, 2006.
But while we’ve expanded the Fund’s holdings into other financial industries, we’ve maintained an overweight to regional banks because we believe there’s a compelling investment opportunity in these shares. In addition to solid business fundamentals, these stocks have been supported by a long-running trend toward consolidation in the industry. Most of our legacy holdings are in the Southeast, where we think the competitive landscape and attractive markets argue for above-average consolidation. In addition, these lenders carry attractive valuations with good franchises, making them attractive take-out candidates.
And while our overweight to regional banks detracted from results relative to the benchmark, we helped performance through good stock selection in this segment. In particular, such long-term holdings as Pinnacle Financial Partners, Inc. and Peoples BancTrust Co., Inc. were among the leading contributors to the Fund’s return for the year.
Merger and acquisition activity in this space also helped performance. Summit Bancshares, a long-time portfolio holding, was taken out by Cullen/Frost Bankers, Inc. during the period. Consolidation also benefited firms such as First Financial Holdings, Inc., as speculation about a takeover helped make this stock one of our top-ten contributors.
| INDUSTRY DISTRIBUTION1 | |
| Regional banks | 40% |
| Asset management & | |
| custody banks | 10% |
| Other diversified financial | |
| services | 9% |
| Diversified banks | 9% |
| Investment banking & | |
| brokerage | 9% |
| Life & health insurance | 5% |
| Thrifts & mortgage | |
| finance | 5% |
| Multi-line insurance | 4% |
| Property & casualty | |
| insurance | 3% |
| All other | 6% |
Return on capital
Many of the biggest contributors to the portfolio’s performance were in the investment banking, asset management and custody banks industry segments, or were money center banks such as Bank of America Corp., JPMorgan Chase & Co. and Citigroup, Inc., which saw a significant boost to their revenue from capital-markets activity.
We didn’t hold enough of these names, however, as our underweight in diversified banks and investment banks and brokers detracted from our relative results. In addition, some of the stocks
Financial Trends Fund, Inc.
4
we did own underperformed. For example, discount broker TD Ameritrade Holding Corp. was one of our leading detractors because of intense pricing competition in this space. Among asset managers, we owned Legg Mason, Inc., which underperformed because of disappointment around the performance of star manager Bill Miller. In addition, investors were concerned that the firm was slow to realize the benefits of acquiring Citigroup’s mutual fund business in 2005.
“Many of the biggest contributors
to the portfolio’s performance
were in the investment banking,
asset management and custody
banks industry segments…”
Outlook
We remain generally positive on the financials sector, though valuations in several industries are full and need solid earnings growth to sustain stock prices. However, it’s worth noting that the current environment of low inflation and moderate economic growth is favorable for exactly that.
That said, the environment for banks is likely to remain challenging in the near term because deposit competition and the inverted yield curve have margins under pressure. However, a more difficult business climate for banks tends to promote consolidation. These factors can support fund performance in an otherwise challenging environment, and are a positive argument for holding small- and mid-cap regional banks. Longer term, we see several compelling trends at work, including the growth of global capitalism, bank consolidation, the increasingly cashless society and the need for savings and retirement products.
This commentary reflects the views of the portfolio managers through the end of the Fund’s period discussed in this report. The managers’ statements reflect their own opinions. As such, they are in no way guarantees of future events, and are not intended to be used as investment advice or a recommendation regarding any specific security. They are also subject to change at any time as market and other conditions warrant.
Sector investing is subject to greater risks than the market as a whole.
1 As a percentage of net assets on December 31, 2006.
Financial Trends Fund, Inc.
5
Fund’s investments
F I N A N C I A L S T A T E M E N T S
Securities owned by the Fund on 12-31-06
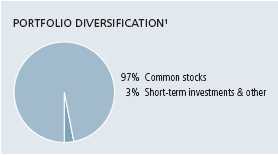
This schedule is divided into two main categories: common stocks and short-term
investments. Common stocks are further broken down by industry group. Short-term
investments, which represent the Fund’s cash position, are listed last.
| Issuer | Shares | Value |
| Common stocks 99.32% | $84,265,221 | |
| (Cost $40,440,527) | ||
| Aerospace & Defense 0.57% | 483,998 | |
| AerCap Holdings NV (Netherlands) (I) | 20,880 | 483,998 |
| Asset Management & Custody Banks 10.13% | 8,595,888 | |
| Affiliated Managers Group, Inc. (I)(L) | 16,700 | 1,755,671 |
| Bank of New York Co., Inc. (The) | 24,000 | 944,880 |
| Eaton Vance Corp. | 20,000 | 660,200 |
| Franklin Resources, Inc. | 11,500 | 1,266,955 |
| Kohlberg Capital Corp. (I) | 12,800 | 221,440 |
| Legg Mason, Inc. | 15,650 | 1,487,532 |
| Northern Trust Corp. | 5,000 | 303,450 |
| State Street Corp. | 29,000 | 1,955,760 |
| Consumer Finance 0.98% | 836,109 | |
| Capital One Financial Corp. | 10,884 | 836,109 |
| Diversified Banks 9.07% | 7,695,027 | |
| HSBC Holdings Plc, American Depositary Receipt (United Kingdom) (L) | 3,176 | 291,080 |
| U.S. Bancorp. | 67,500 | 2,442,825 |
| Wachovia Corp. | 45,653 | 2,599,938 |
| Wells Fargo & Co. | 66,400 | 2,361,184 |
| Diversified Capital Markets 0.71% | 603,300 | |
| UBS AG (Switzerland) | 10,000 | 603,300 |
| Insurance Brokers 0.66% | 558,548 | |
| Marsh & McLennan Cos., Inc. | 10,000 | 306,600 |
| National Financial Partners Corp. | 5,730 | 251,948 |
| Investment Banking & Brokerage 8.70% | 7,378,455 | |
| Goldman Sachs Group, Inc. (The) | 3,500 | 697,725 |
| KBW, Inc. (I) | 5,880 | 172,813 |
| Lehman Brothers Holdings, Inc. | 22,000 | 1,718,640 |
| Merrill Lynch & Co., Inc. | 22,000 | 2,048,200 |
| Morgan Stanley | 7,750 | 631,083 |
| Raymond James Financial, Inc. | 59,925 | 1,816,327 |
| TD Ameritrade Holding Corp. | 18,150 | 293,667 |
See notes to financial statements
Financial Trends Fund, Inc.
6
F I N A N C I A L S T A T E M E N T S
| Issuer | Shares | Value |
| Life & Health Insurance 5.53% | $4,691,789 | |
| AFLAC, Inc. | 25,000 | 1,150,000 |
| Prudential Financial, Inc. | 25,510 | 2,190,289 |
| StanCorp Financial Group, Inc. | 30,000 | 1,351,500 |
| Mortgage REIT’s 0.19% | 160,553 | |
| Alesco Financial, Inc. | 15,005 | 160,553 |
| Multi-Line Insurance 4.13% | 3,499,749 | |
| American International Group, Inc. | 17,000 | 1,218,220 |
| Genworth Financial, Inc. (Class A) | 15,550 | 531,966 |
| Hartford Financial Services Group, Inc. (The) | 18,750 | 1,749,563 |
| Other Diversified Financial Services 9.55% | 8,104,680 | |
| Bank of America Corp. | 66,008 | 3,524,167 |
| Citigroup, Inc. | 45,850 | 2,553,845 |
| JPMorgan Chase & Co. | 41,960 | 2,026,668 |
| Property & Casualty Insurance 3.00% | 2,547,596 | |
| Ambac Financial Group, Inc. | 7,000 | 623,490 |
| Assured Guaranty Ltd. (Bermuda) | 15,650 | 416,290 |
| Axis Capital Holdings Ltd. (Bermuda) | 11,500 | 383,755 |
| OneBeacon Insurance Group Ltd. (I) | 8,740 | 244,720 |
| ProAssurance Corp. (I) | 17,615 | 879,341 |
| Regional Banks 40.20% | 34,104,395 | |
| Alabama National Bancorp. | 9,550 | 656,372 |
| Ameris Bancorp. | 21,680 | 610,942 |
| BancorpSouth, Inc. | 19,167 | 514,059 |
| BB&T Corp. | 38,382 | 1,686,121 |
| BOK Financial Corp. | 26,776 | 1,472,144 |
| Capital City Bank Group, Inc. | 26,327 | 929,343 |
| City National Corp. | 18,550 | 1,320,760 |
| Colonial BancGroup, Inc. (The) | 51,112 | 1,315,623 |
| Commerce Bancshares, Inc. | 18,371 | 889,340 |
| Commercial Bankshares, Inc. | 35,551 | 1,349,160 |
| Compass Bancshares, Inc. | 23,025 | 1,373,441 |
| Cullen/Frost Bankers, Inc. | 9,171 | 511,925 |
| First Bancorp. of North Carolina | 18,532 | 404,739 |
| First Charter Corp. | 39,000 | 959,400 |
| First Horizon National Corp. | 20,580 | 859,832 |
| Hancock Holding Co. | 10,000 | 528,400 |
| LSB Bancshares, Inc. | 56,512 | 955,053 |
| M&T Bank Corp. | 6,500 | 794,040 |
| Marshall & Ilsley Corp. | 15,750 | 757,733 |
| National City Corp. | 13,000 | 475,280 |
| Peoples BancTrust Co., Inc. (The) | 52,800 | 1,337,952 |
| Pinnacle Financial Partners, Inc. (I) | 75,000 | 2,488,500 |
| PNC Financial Services Group, Inc. (The) | 19,150 | 1,417,866 |
See notes to financial statements
Financial Trends Fund, Inc.
7
F I N A N C I A L S T A T E M E N T S
| Issuer | Shares | Value | ||
| Regional Banks (continued) | ||||
| Provident Bankshares Corp. | 20,156 | $717,554 | ||
| Seacoast Banking Corp. of Florida | 69,520 | 1,724,096 | ||
| SunTrust Banks, Inc. | 25,556 | 2,158,204 | ||
| SVB Financial Group (I) | 22,500 | 1,048,950 | ||
| Synovus Financial Corp. | 20,100 | 619,683 | ||
| TCF Financial Corp. | 40,150 | 1,100,913 | ||
| Whitney Holding Corp. | 14,300 | 466,466 | ||
| Zions Bancorp. | 32,272 | 2,660,504 | ||
| Reinsurance 0.41% | 345,000 | |||
| RenaissanceRe Holdings Ltd. (Bermuda) | 5,750 | 345,000 | ||
| Specialized Finance 0.44% | 372,544 | |||
| CIT Group, Inc. | 6,680 | 372,544 | ||
| Thrifts & Mortgage Finance 5.05% | 4,287,590 | |||
| Countrywide Financial Corp. | 14,650 | 621,893 | ||
| First Financial Holdings, Inc. | 40,500 | 1,586,790 | ||
| Hudson City Bancorp., Inc. | 39,150 | 543,402 | ||
| South Street Financial Corp. | 95,000 | 875,900 | ||
| Washington Mutual, Inc. | 14,500 | 659,605 | ||
| Interest | Maturity | Par value | ||
| Issuer, description | rate | date | (000) | Value |
| Short-term investments 2.67% | $2,265,945 | |||
| (Cost $2,265,945) | ||||
| Certificates of Deposit 0.02% | 13,202 | |||
| First Piedmont | 2.600% | 09-30-07 | $2 | 2,344 |
| Home Federal Tennessee | 4.410 | 09-28-07 | 2 | 2,159 |
| Oconee Federal Savings Bank | 5.610 | 09-27-07 | 2 | 2,407 |
| Piedmont Federal Savings Bank | 4.200 | 10-09-07 | 2 | 2,251 |
| Security Savings Bank | 3.730 | 09-28-07 | 2 | 2,192 |
| Stephen Federal Bank | 4.000 | 10-11-07 | 2 | 1,849 |
See notes to financial statements
Financial Trends Fund, Inc.
8
F I N A N C I A L S T A T E M E N T S
| Interest | Par value | ||
| Issuer, description | rate | (000) | Value |
| Joint Repurchase Agreement 0.24% | $206,000 | ||
| Investment in a joint repurchase | |||
| agreement transaction with | |||
| Cantor Fitzgerald LP — Dated | |||
| 12-29-06 due 1-3-07 (secured by | |||
| U.S. Treasury Inflation Indexed | |||
| Notes 1.625% due 1-15-15, 2.500% | |||
| due 7-15-16 and 3.875% | |||
| due 1-15-09) | |||
| Maturity value: $206,141 | 4.920% | $206 | 206,000 |
| Shares | |||
| Cash Equivalents 2.41% | 2,046,743 | ||
| AIM Cash Investment Trust (T) | 2,046,743 | 2,046,743 | |
| Total investments (Cost $42,706,472) 101.99% | $86,531,166 | ||
| Other assets and liabilities, net (1.99%) | ($1,689,510) | ||
| Total net assets 100.00% | $84,841,656 | ||
(I) Non-income-producing security.
(L) All or a portion of this security is on loan as of December 31, 2006.
(T) Represents investment of securities lending collateral.
Parenthetical disclosure of a foreign country in the security description represents country of a foreign issuer.
The percentage shown for each investment category is the total value of that category as a percentage of the net assets of the Fund.
See notes to financial statements
Financial Trends Fund, Inc.
9
Financial statements
F I N A N C I A L S T A T E M E N T S
Statement of assets and liabilities 12-31-06
This Statement of Assets and Liabilities is the Fund’s balance sheet. It shows the value
of what the Fund owns, is due and owes. You’ll also find the net asset value for each
common share.
| Assets | |
| Investments, at value (cost $42,706,472) including $2,008,247 of securities loaned | $86,531,166 |
| Cash and cash equivalents | 5,103 |
| Receivable for investments sold | 329,156 |
| Dividends and interest receivable | 142,670 |
| Total assets | 87,008,095 |
| Liabilities | |
| Payable upon return of securities loaned | 2,046,743 |
| Payable to affiliates | |
| Management fees | 53,672 |
| Other | 15,845 |
| Other payables and accrued expenses | 50,179 |
| Total liabilities | 2,166,439 |
| Net assets | |
| Capital paid-in | 40,212,716 |
| Accumulated net realized gain on investments | 780,059 |
| Net unrealized appreciation of investments | 43,824,694 |
| Accumulated net investment income | 24,187 |
| Net assets | $84,841,656 |
| Net asset value per share | |
| Based on 3,993,124 shares outstanding — 50 million shares authorized | |
| with par value of $0.001 per share. | $21.25 |
See notes to financial statements
Financial Trends Fund, Inc.
10
F I N A N C I A L S T A T E M E N T S
Statement of operations For the year ended 12-31-06.
This Statement of Operations summarizes the Fund’s investment income earned
and expenses incurred in operating the Fund. It also shows net gains (losses) for
the period stated.
| Investment income | |
| Dividends | $1,921,850 |
| Interest | 78,481 |
| Securities lending | 1,710 |
| Total investment income | 2,002,041 |
| Expenses | |
| Investment management fees (Note 2) | 537,542 |
| Administration fees (Note 2) | 124,048 |
| Compliance fees | 2,341 |
| Directors’ fees | 179,533 |
| Professional fees | 83,268 |
| Custodian fees | 22,311 |
| Printing | 17,300 |
| Transfer agent fees | 12,550 |
| Securities lending fees | 64 |
| Miscellaneous | 20,991 |
| Total expenses | 999,948 |
| Net investment income | 1,002,093 |
| Realized and unrealized gain | |
| Net realized gain on investments | 4,127,322 |
| Change in net unrealized appreciation (depreciation) of investments | 6,630,982 |
| Net realized and unrealized gain | 10,758,304 |
| Increase in net assets from operations | $11,760,397 |
See notes to financial statements
Financial Trends Fund, Inc.
11
F I N A N C I A L S T A T E M E N T S
Statement of changes in net assets
These Statements of Changes in Net Assets show how the value of the Fund’s net assets
has changed during the last two periods. The difference reflects earnings less expenses,
any investment gains and losses, distributions, if any, paid to shareholders and the net of
Fund share transactions.
| Year | Year | |
| ended | ended | |
| 12-31-05 | 12-31-06 | |
| Increase (decrease) in net assets | ||
| From operations | ||
| Net investment income | $904,560 | $1,002,093 |
| Net realized gain | 1,433,399 | 4,127,322 |
| Change in net unrealized appreciation (depreciation) | 2,412,459 | 6,630,982 |
| Increase in net assets resulting from operations | 4,750,418 | 11,760,397 |
| Distributions to common shareholders | ||
| From net investment income | (878,487) | (1,038,212) |
| From net realized gain | (2,411,048) | (3,569,454) |
| (3,289,535) | (4,607,666) | |
| Net assets | ||
| Beginning of period | 76,228,042 | 77,688,925 |
| End of period1 | $77,688,925 | $84,841,656 |
1 Includes accumulated net investment income of $60,306 and $24,187, respectively.
See notes to financial statements
Financial Trends Fund, Inc.
12
F I N A N C I A L S T A T E M E N T S
Financial highlights
The Financial highlights show how the Fund’s net asset value for a share has changed
since the end of the previous period.
| COMMON SHARES | |||||
| Period ended | 12-31-021 | 12-31-031 | 12-31-041 | 12-31-05 | 12-31-06 |
| Per share operating performance | |||||
| Net asset value, beginning of period | $15.67 | $14.39 | $17.63 | $19.09 | $19.46 |
| Net investment income2 | 0.16 | 0.17 | 0.19 | 0.23 | 0.25 |
| Net realized and unrealized | |||||
| gain (loss) on investments | (0.66) | 3.813 | 2.44 | 0.96 | 2.69 |
| Total from investment operations | (0.50) | 3.98 | 2.63 | 1.19 | 2.94 |
| Less distributions | |||||
| From net investment income | (0.16) | (0.16) | (0.20) | (0.22) | (0.26) |
| From net realized gain | (0.62) | (0.58) | (0.97) | (0.60) | (0.89) |
| (0.78) | (0.74) | (1.17) | (0.82) | (1.15) | |
| Net asset value, end of period | $14.39 | $17.63 | $19.09 | $19.46 | $21.25 |
| Per share market value, end of period | $12.36 | $18.40 | $17.47 | $16.68 | $19.01 |
| Total return at market value4 (%) | (0.25) | 58.66 | 1.54 | 0.21 | 20.99 |
| Ratios and supplemental data | |||||
| Net assets, end of period | |||||
| (in millions) | $57 | $70 | $76 | $78 | $85 |
| Ratio of expenses to average | |||||
| net assets (%) | 1.16 | 1.20 | 1.22 | 1.18 | 1.21 |
| Ratio of net investment income | |||||
| to average net assets (%) | 1.04 | 1.04 | 1.04 | 1.21 | 1.21 |
| Portfolio turnover (%) | 42 | 26 | 10 | 4 | 10 |
1 Audited by previous auditor.
2 Based on the average of the shares outstanding.
3 Net of federal income taxes of $0.39 per share for the year ended 12-31-03, on net long-term capital gains retained by the Fund.
4 Assumes dividend reinvestment.
See notes to financial statements
Financial Trends Fund, Inc.
13
Notes to financial statements
Note 1
Accounting policies
John Hancock Financial Trends Fund, Inc. (the “Fund”) is a diversified closed-end management investment company registered under the Investment Company Act of 1940 (the “1940 Act”), as amended.
Significant accounting policies of the Fund
are as follows:
Valuation of investments
Securities in the Fund’s portfolio are valued on the basis of market quotations, valuations provided by independent pricing services or, if quotations are not readily available, or the value has been materially affected by events occurring after the closing of a foreign market, at fair value as determined in good faith in accordance with procedures approved by the Directors. Short-term debt investments which have a remaining maturing of 60 days or less may be valued at amortized cost, which approximates market value. Investments in AIM Cash Investment Trust are valued at their net asset value each business day.
Joint repurchase agreement
Pursuant to an exemptive order issued by the Securities and Exchange Commission, the Fund, along with other registered investment companies having a management contract with John Hancock Advisers, LLC (the “Adviser”), a wholly owned subsidiary of John Hancock Financial Services, Inc., a subsidiary of Manulife Financial Corporation (“MFC”), may participate in a joint repurchase agreement transaction. Aggregate cash balances are invested in one or more large repurchase agreements, whose underlying securities are obligations of the U.S. government and/or its agencies. The Fund’s custodian bank receives delivery of the underlying securities for the joint account on the Fund’s behalf. The Adviser is responsible for ensuring that the agreement is fully collateralized at all times.
Investment transactions
Investment transactions are accounted for on a trade date plus one basis for daily net asset value calculations. However, for financial reporting purposes, investment transactions are reported on trade date. Net realized gains and losses on sales of investments are determined on the identified cost basis.
Securities lending
The Fund may lend securities to certain quali-fied brokers who pay the Fund negotiated lender fees. The loans are collateralized at all times with cash or securities with a market value at least equal to the market value of the securities on loan. The market value of the loaned securities is determined at the close of business of the Fund and any additional required collateral is delivered to the Fund on the next business day. As with other extensions of credit, the Fund may bear the risk of delay of the loaned securities in recovery or even loss of rights in the collateral, should the borrower of the securities fail financially. On December 31, 2006, the Fund loaned securities having a market value of $2,008,247 collateralized by cash in the amount of $2,046,743. The cash collateral was invested in a short-term instrument. Securities lending expenses are paid by the Fund to the lending agent.
Federal income taxes
The Fund qualifies as a “regulated investment company” by complying with the applicable provisions of the Internal Revenue Code and will not be subject to federal income tax on taxable income that is distributed to shareholders. Therefore, no federal income tax provision is required.
New accounting pronouncements
In June 2006, Financial Accounting Standards Board (“FASB”) Interpretation No. 48, Accounting for Uncertainty in Income Taxes (the “Interpretation”) was issued, and is effective for fiscal years beginning after
Financial Trends Fund, Inc.
14
December 15, 2006 and is to be applied to all open tax years as of the effective date. The Interpretation prescribes a minimum threshold for financial statement recognition of the benefit of a tax position taken or expected to be taken in a tax return, and requires certain expanded disclosures. Management is currently evaluating the application of the Interpretation to the Fund, and has not at this time quantified the impact, if any, resulting from the adoption of the Interpretation on the Fund’s financial statements. The Fund will implement this pronouncement no later than June 29, 2007 and the effects will be noted in the Fund’s semiannual financial statements.
In September 2006, FASB Standard No. 157, Fair Value Measurements (“FAS 157”) was issued, and is effective for fiscal years beginning after November 15, 2007. FAS 157 defines fair value, establishing a framework for measuring fair value and expands disclosure about fair value measurements. Management is currently evaluating the application of FAS 157 to the Fund, and its impact, if any, resulting from the adoption of FAS 157 on the Fund’s financial statements.
Dividends, interest and distributions
Dividend income on investment securities is recorded on the ex-dividend date or, in the case of some foreign securities, on the date thereafter when the Fund identifies the dividend. Interest income on investment securities is recorded on the accrual basis. Foreign income may be subject to foreign withholding taxes, which are accrued as applicable.
The Fund records distributions to shareholders from net investment income and net realized gains, if any, on the ex-dividend date. During the year ended December 31, 2005, the tax character of distributions paid was as follows: ordinary income $991,732 and long-term capital gains $2,297,803. During the year ended December 31, 2006, the tax character of distributions paid was as follows: ordinary income $1,478,534 and long-term capital gains $3,129,132.
As of December 31, 2006, the components of distributable earnings on a tax basis included $235,281 of undistributed ordinary income and $574,153 of undistributed long-term gain.
Such distributions and distributable earnings, on a tax basis, are determined in conformity with income tax regulations, which may differ from accounting principles generally accepted in the United States of America. Distributions in excess of tax basis earnings and profits, if any, are reported in the Fund’s financial statements as a return of capital.
Use of estimates
The preparation of these financial statements, in accordance with accounting principles generally accepted in the United States of America, incorporates estimates made by management in determining the reported amount of assets, liabilities, revenues and expenses of the Fund. Actual results could differ from these estimates.
Note 2
Management and administration
fees and transactions with affiliates
and others
The Fund has an investment management contract with the Adviser, under which the Adviser furnishes office space, furnishings and equipment and provides the services of persons to manage the investment of the Fund’s assets and to continually review, supervise and administer the Fund’s investment program. Under the investment management agreement the Fund pays a monthly management fee to the Adviser at an annual rate of 0.65% of the Fund’s average weekly net asset value, or a flat annual fee of $50,000, whichever is higher. If total Fund expenses exceed 2% of the fund’s average weekly net asset value in any one year, the Fund may require the Adviser to reimburse the Fund for such excess, subject to a minimum fee of $50,000.
Effective December 31, 2005, the investment management teams of the Adviser were reorganized into Sovereign Asset Management LLC (“Sovereign”), a wholly owned indirect subsidiary of John Hancock Life Insurance Company (“JHLICO”), a subsidiary of MFC. The Adviser remains the principal advisor on the Fund and Sovereign acts as subadviser under the supervision of the Adviser. The
Financial Trends Fund, Inc.
15
restructuring did not have an impact on the Fund, which continues to be managed using the same investment philosophy and process. The Fund is not responsible for payment of the subadvisory fees.
Effective October 1, 2006, Sovereign changed its name to MFC Global Investment Management (U.S.), LLC.
The Fund has an administration agreement with the Adviser under which the Adviser provides certain administrative services required by the Fund. The Fund pays a monthly administration fee to the Adviser at an annual rate of 0.15% of the Fund’s average weekly net assets value, or a flat annual fee of $22,000, whichever is higher. The compensation for the year amounted to $124,048. The Fund also paid the Adviser the amount of $88 for certain publishing services, included in the printing fees. The Fund also reimbursed JHLICO for certain compliance costs, included in the Fund’s Statement of Operations.
The Fund does not pay remuneration to its Officers. Certain Officers of the Fund are officers of the Adviser.
Note 3
Fund share transactions
The Fund had no share transactions during the last two years.
The Fund from time-to-time may, but is not required to, make open market repurchases of its shares in order to attempt to reduce or eliminate the amount of any market value discount or to increase the net asset value of its shares, or both. In addition, the Board currently intends each quarter during periods when the Fund’s shares are trading at a discount from the net asset value to consider the making of tender offers. The Board may at any time, however, decide that the Fund should not make share repurchases or tender offers.
Note 4
Investment transactions
Purchases and proceeds from sales or maturities of securities, other than short-term securities and obligations of the U.S. government, during the year ended December 31, 2006, aggregated $8,303,691 and $12,299,245, respectively.
The cost of investments owned on December 31, 2006, including short-term investments, for federal income tax purposes, was $42,711,660. Gross unrealized appreciation of investments aggregated $43,819,506, resulting in net unrealized appreciation of $43,819,506. The difference between book basis and tax basis net unrealized appreciation of investments is attributable primarily to the tax deferral of losses on certain sales of securities.
Financial Trends Fund, Inc.
16
Auditors’ report
Report of Independent Registered Public Accounting Firm
To the Board of Trustees and Shareholders of John Hancock Financial Trends Fund, Inc.,
In our opinion, the accompanying statement of assets and liabilities, including the schedule of investments, and the related statements of operations and of changes in net assets and the financial highlights present fairly, in all material respects, the financial position of John Hancock Financial Trends Fund, Inc. (the “Fund”) at December 31, 2006, the results of its operations, the changes in its net assets and the financial highlights for the periods indicated, in conformity with accounting principles generally accepted in the United States of America. These financial statements and financial highlights (hereafter referred to as “financial statements”) are the responsibility of the Fund’s management; our responsibility is to express an opinion on these financial statements based on our audits. We conducted our audits of these financial statements in accordance with the standards of the Public Company Accounting Oversight Board (United States). Those standards require that we plan and perform the audit to obtain reasonable assurance about whether the financial statements are free of material misstatement. An audit includes examining, on a test basis, evidence supporting the amounts and disclosures in the financial statements, assessing the accounting principles used and significant estimates made by management, and evaluating the overall financial statement presentation. We believe that our audits, which included confirmation of securities at December 31, 2006 by correspondence with the custodian and brokers, provide a reasonable basis for our opinion. The financial highlights for each of the periods ended on or before December 31, 2004 were audited by another independent registered public accounting firm, whose report dated February 18, 2005 expressed unqualified opinions thereon.
PricewaterhouseCoopers LLP
Boston, Massachusetts
February 16, 2007
17
Tax information
Unaudited
For federal income tax purposes, the following information is furnished with respect to the distributions of the Fund, if any, paid during its taxable year ended December 31, 2006.
This Fund has designated distributions of $3,129,132 to shareholders as a long-term capital gain dividend.
With respect to the ordinary dividends paid by the Fund for the fiscal year ended December 31, 2006, 100.00% of the dividends qualify for the corporate dividends-received deduction.
The Fund hereby designates the maximum amount allowable of its net taxable income as qualified dividend income as provided in the Jobs and Growth Tax Relief Reconciliation Act of 2003. This amount were reflected on Form 1099-DIV for the calendar year 2006.
Shareholders were mailed a 2006 U.S. Treasury Department Form 1099-DIV in January 2007. This will reflect the total of all distributions that are taxable for calendar year 2006.
18
Investment objective and policy
The Fund’s primary investment objective is long-term capital appreciation. Its secondary investment objective is current income. The Fund will seek to achieve its primary investment objective of long-term capital appreciation by investing at least 80% (65% prior to January 25, 2002) of its assets in stocks of U.S. and foreign financial services companies of any size. These companies include banks, thrifts, finance companies, brokerage and advisory firms, real estate-related firms, insurance companies and financial holding companies. These companies are usually regulated by governmental or quasi-governmental entities, and as a result, are subject to the risk that regulatory developments will adversely affect them. With respect to the Fund’s investment policy of investing at least 80% of “assets” in equity securities, “assets” is defined as net assets plus the amount of any borrowings for investment purposes. The Fund will notify shareholders at least 60 days prior to any change in this policy. In abnormal market conditions, the Fund may take temporary defensive positions.
As such, the Fund may temporarily invest all of its assets in investment-grade, short-term securities. In such circumstances, the Fund may not achieve its objective. The Fund’s current investment restriction, relating to industry concentration, has been modified to remove the reference to the banking and savings industry so that it reads as follows: “Except for temporary defensive purposes, the Fund may not invest more than 25% of its total assets in any one industry or group of related industries except that the Fund will invest more than 25% of its assets in the financial services sector.”
Repurchase agreement
A repurchase agreement is a contract under which the Fund would acquire a security for a relatively short period (usually not more than seven days) subject to the obligation of the seller to repurchase and the Fund to resell such security at a fixed time and price (representing the Fund’s cost plus interest). The Fund will enter into repurchase agreements only with member banks of the Federal Reserve System and with “primary dealers” in U.S. government securities. The Adviser will continuously monitor the creditworthiness of the parties with whom the Fund enters into repurchase agreements.
Repurchase transactions must be fully collateralized at all times, but they involve some credit risk to the Fund if the other party defaults on its obligations and the Fund is delayed or prevented from liquidating the collateral. The Fund has established a procedure providing that the securities serving as collateral for each repurchase agreement must be delivered to the Fund’s custodian either physically or in book-entry form and that the collateral must be marked to market daily to ensure that each repurchase agreement is fully collateralized at all times. In the event of bankruptcy or other default by a seller on a repurchase agreement, the Fund could experience delays in liquidating the underlying securities and could experience losses, including the possible decline in the value of the underlying securities during the period while the Fund seeks to enforce its rights thereto, possible subnormal levels of income, lack of access to income during this period and t he expense of enforcing its rights.
Bylaws
In January 2003, the Board of Directors adopted several amendments to the Fund’s bylaws, including provisions relating to the calling of a special meeting and requiring advance notice of shareholder proposals or nominees for Director. The advance notice provisions in the bylaws require shareholders to notify the Fund in writing of any proposal that they intend to present at an annual meeting of shareholders, including any nominations for Director, between 90 and 120 days prior to the first anniversary of the mailing date of the notice from the prior year’s annual meeting of shareholders. The notification must be in the form prescribed by the bylaws. The advance notice provisions provide the Fund and its Directors with the opportunity to thoughtfully consider and address the matters proposed before the Fund prepares and mails its proxy statement to shareholders. Other amendments set forth the procedures that must be followed in order for a shareholder to call a special meeting of shareholders. The Fund is presently listed on NASDAQ and per a grandfathering provision it is not required to hold annual shareholder meetings. The Board
19
approved the above amendment to the Fund’s bylaws to provide a defined structure for the submission of shareholder proposals should the circumstances change and an annual meeting be required. Please contact the Secretary of the Fund for additional information about the advance notice requirements or the other amendments to the bylaws.
In November 2005, the Fund’s Board of Directors adopted several amendments to the Fund’s bylaws regarding the Chairman of the Board position: The Chairman of the Board shall at all times be a director who is not an interested person of the Fund as that term is defined by the Investment Company Act of 1940. The scope of the Chairman’s responsibilities and fiduciary obligations were further defined. Lastly, disclosure regarding the election, resignation and removal of the Chairman as well as the filling of a vacancy was added.
At a quarterly meeting of the Fund’s Board of Directors held February 13, 2006, the Board amended Article II Section 2 of the Fund’s bylaws to state that a special meeting of the stockholders, unless otherwise provided by law or by the Articles of Incorporation, may be called for any purpose or purposes by a majority of the Board of Directors, the President, or, subject to Section 2(c), by the Secretary of the Corporation upon the written request of stockholders entitled to cast at least 35% of all votes entitles to be cast at the meeting.
Dividends and distributions
During the year ended December 31, 2006, dividends from net investment income totaling $0.260 per share and capital gain distributions totaling $0.894 were paid to shareholders. The dates of payments and the amounts per share are as follows:
| INCOME | |
| PAYMENT DATE | DIVIDEND |
| August 10, 2006 | $0.130 |
| December 29, 2006 | 0.130 |
| CAPITAL GAIN | |
| PAYMENT DATE | DISTRIBUTION |
| August 10, 2006 | $0.057 |
| December 29, 2006 | 0.837 |
Dividend reinvestment plan
The Fund offers its registered shareholders an automatic Dividend Reinvestment Plan (the “Plan”), which enables each participating shareholder to have all dividends (including income dividends and/or capital gains distributions) payable in cash, reinvested by Mellon Investor Services (the “Plan Agent”) in shares of the Fund’s common stock. However, shareholders may elect not to enter into, or may terminate at any time without penalty, their participation in the Plan by notifying the Plan Agent in writing. Shareholders who do not participate in the Plan will receive all dividends in cash.
In the case of shareholders such as banks, brokers or nominees who hold shares for others who are the beneficial owners, the Plan Agent will administer the Plan on the basis of record ownership of shares. These record shareholders will receive dividends under the Plan on behalf of participating beneficial owners and cash on behalf of non-participating beneficial owners. These recordholders will then credit the beneficial owners’ accounts with the appropriate stock or cash distribution.
Whenever the market price of the Fund’s stock equals or exceeds net asset value per share, participating shareholders will be issued stock valued at the greater of (i) net asset value per share or (ii) 95% of the market price. If the net asset value per share of the Fund’s stock exceeds the market price per share, the Plan Agent shall make open market purchases of the Fund’s stock for each participating shareholder’s account. These purchases may begin no sooner than five business days prior to the payment date for the dividend and will end up to thirty days after the payment date. If shares cannot be purchased within thirty days after the payment date, the balance of shares will be purchased from the Fund at the average price of shares purchased on the open market. Each participating shareholder will be charged a pro rata share of brokerage commissions on all open market purchases.
The shares issued to participating shareholders, including fractional shares, will be held by the Plan Agent in the name of the shareholder. The Plan Agent will confirm each acquisition made for the account of the participating shareholders
20
as soon as practicable after the payment date of the distribution.
The reinvestment of dividends does not relieve participating shareholders of any federal, state or local income tax that may be due with respect to each dividend. Dividends reinvested in shares will be treated on your federal income tax return as though you had received a dividend in cash in an amount equal to the fair market value of the shares received, as determined by the prices for shares of the Fund on the Nasdaq National Market System as of the dividend payment date. Distributions from the Fund’s long-term capital gains will be taxable to you as long-term capital gains. The confirmation referred to above will contain all the information you will require for determining the cost basis of shares acquired and should be retained for that purpose. At year end, each account will be supplied with detailed information necessary to determine total tax liability for the calendar year.
All correspondence or additional information concerning the Plan should be directed to the Plan Agent, Mellon Bank, N.A., c/o Mellon Investor Services at P.O. Box 3338, South Hackensack, New Jersey 07606-1938 (Telephone: 1-800-852-0218).
Shareholder communication
and assistance
If you have any questions concerning the Fund, we will be pleased to assist you. If you hold shares in your own name and not with a brokerage firm, please address all notices, correspondence, questions or other communications regarding the Fund to the transfer agent at:
Mellon Investor Services
Newport Office Center VII
480 Washington Boulevard
Jersey City, NJ 07310
Telephone: 1-800-852-0218
If your shares are held with a brokerage firm, you should contact that firm, bank or other nominee for assistance.
21
Board Consideration of and
Continuation of Investment Advisory
Agreement: John Hancock Financial
Trends Fund, Inc.
Section 15(c) of the Investment Company Act of 1940 (the “1940 Act”) requires the Board of Directors (the “Board”) of John Hancock Financial Trends Fund, Inc. (the “Fund”), including a majority of the Directors who have no direct or indirect interest in the investment advisory agreement and are not “interested persons” of the Fund, as defined in the 1940 Act (the “Independent Directors”), annually to review and consider the continuation of the investment advisory agreement (the “Advisory Agreement”) with John Hancock Advisers, LLC (the “Adviser”) for the Fund.
At a meeting held on July 24, 2006, the Board, including the Independent Directors, considered the factors and reached the conclusions described below relating to the selection of the Adviser and the continuation of the Advisory Agreement. During such meeting, the Independent Directors also met in executive session with their independent legal counsel. In evaluating the Advisory Agreement, the Board, including the Independent Directors, reviewed a broad range of information requested for this purpose by the Independent Directors, including but not limited to the following: (i) The investment performance of the Fund and a broader universe of relevant funds (the “Universe”) selected by Morningstar Associates, LLC (“Morningstar”), an independent provider of investment company data for a range of periods, (ii) advisory and other fees incurred by, and the expense ratios of, the Fund and a group of comparable funds selected by Morningstar (the “Peer Gr oup”), (iii) the advisory fees of comparable portfolios of other clients of the Adviser, (iv) the Adviser’s financial results and condition, including its and certain of its affili-ates’ profitability from services performed for the Fund, (v) breakpoints in the Peer Group’s fees, (vi) the Adviser’s record of compliance with applicable laws and regulations, with the Fund’s investment policies and restrictions, and with the Fund’s Code of Ethics and the structure and responsibilities of the Adviser’s compliance department, (vii) the background and experience of senior management and investment professionals, and (viii) the nature, cost and character of advisory and non-investment management services provided by the Adviser and its affiliates.
The Board’s review and conclusions were based on a comprehensive consideration of all information presented to the Board at the July 24, 2006 meeting and at other meetings and times throughout the preceding year, and not the result of any single controlling factor. Most of the information and data was as of December 31, 2005; facts may have changed between that date and the date of this report. The key factors considered by the Board and the conclusions recorded are described below.
The nature, extent, and quality of the
services provided by the Adviser
In this regard, the Directors reviewed the services being provided by the Adviser and Sovereign Asset Management, LLC, an affiliate of the Adviser (the “Subadviser”) (See discussion below) to the Fund including, without limitation, their investment advisory and administrative services to the Fund, the terms of the Investment Advisory Agreement and the separate Administration Agreement between the Fund and the Adviser, the Adviser’s coordination of services for the Fund over the years, and its provision of officers to the Fund (including the Fund’s chief compliance officer). After reviewing the foregoing information, the Directors concluded that the quality, extent and nature of the services provided by the Advisor were satisfactory and adequate for the Fund.
The investment performance
of the Fund and Adviser
In this regard, the Directors compared the performance of the Fund with the performance of comparable indexes and the Peer Group. The Directors also considered the consistency of the Adviser’s management of the Fund with the Fund’s investment objective and policies, and long-term performance of the Fund. The Directors also considered the Fund’s historical discounts/premiums from net asset value, all the comparison information included in the Morningstar report and all the other information included in the materials provided to the Board prior to the meeting (the “Evaluation Materials”). Following further discussion, the Directors
22
concluded that the investment performance of the Fund and Adviser was satisfactory.
The costs of the services to be provided and
profits to be realized by the Adviser and its
affiliates from the relationship with the Fund
In this regard, the Directors considered the Adviser’s staffing, personnel and methods of operating; the financial condition of the Adviser and the level of commitment to the Fund and the Adviser by the principals of the Adviser; the asset levels of the Fund; and the overall expenses of the Fund. The Directors then compared the fees and expenses of the Fund (including the management fee) to other funds comparable to the Fund in terms of the type of fund, the style of investment management (including, in particular, other financial services funds) and the nature of the investment strategy and markets invested in, among other factors. To assist in its review, the Directors considered the information and comparisons included in the Morningstar report in the Evaluation Materials. Following this comparison and upon further consideration and discussion of the foregoing, the Directors concluded that the fees to be paid to the Adviser by the Fund were fair and reasonable.
The extent to which economies of scale
would be realized as the Fund grows and
whether advisory fee levels reflect these
economies of scale for the benefits of the
Fund’s investors
In this regard, the Directors considered the Fund’s fee arrangements with the Adviser, the Fund’s fee arrangements with other service providers, and the expense limits that are included in the Fund’s Investment Advisory Agreement. Following discussion of the Fund’s current and expected asset levels and expense caps, the Directors determined that, while the Fund does not have fee breakpoints, the Fund’s fee arrangements with the Adviser included provisions to protect the Fund from excessive fees at lower asset levels (subject to a $50,000 management fee floor) for the benefit of shareholders.
Other factors and broader review
As discussed above, the Board reviewed detailed materials received from the Adviser as part of the annual re-approval process under Section 15(c) of the 1940 Act. The Board also regularly reviews and assesses the quality of the services that the Fund receives throughout the year. In this regard, the Board reviews reports of the Adviser at least quarterly, which include, among other things, a detailed portfolio review, detailed fund performance reports and compliance reports. In addition, the Board meets with portfolio managers and senior investment officers at various times throughout the year.
After considering the above-described factors and based on its deliberations and its evaluation of the information described above, the Board concluded that approval of the continuation of the Advisory Agreement for the Fund was the in the best interest of the Fund and its shareholders. Accordingly, the Board unanimously approved the continuation of the Advisory Agreement.
Board Consideration of Subadvisory
Agreement with Sovereign Asset
Management, LLC.
At a meeting held on November 3, 2005, the Board reviewed a Subadvisory Agreement among the Fund, the Adviser and the Subadviser. At that meeting, the Adviser proposed, and the Board approved, a reorganization of the Adviser’s operations and the transfer to the Subadviser of all of the Adviser’s investment personnel. As a result of this restructuring, the Adviser remains the principal adviser to the Fund and the Subadviser acts as subadviser under the supervision of the Adviser. In evaluating the Subadviser Agreement, the Board relied upon the review that it conducted at the July 25, 2005 meeting, its familiarity with the operations and personnel transferred to Sovereign and representations by the Adviser that the reorganization would not result in a change in the quality of services provided under the Subadvisory Agreement or the personnel responsible for the day-to-day management of the Fund. The Board also reviewed an analysis of the fee paid by the Adviser to the Subadviser under the Subadvisory Agreement relative to subadvisory fees paid by the Adviser and its affiliates to third party sub-advisers and fees paid by a peer group of unaffiliated investment
23
companies. After considering the above-described factors and based on its deliberations and its evaluation of the information described above, the Board concluded that approval of the Subadvisory Agreement was the in the best interest of the Fund and its shareholders. Accordingly, the Board unanimously approved the Subadvisory Agreement, which became effective on December 31, 2005.
24
Information about the portfolio managers
Management Biographies and Fund ownership
Below is an alphabetical list of the portfolio managers who share joint responsibility for the day-to-day investment management of the Fund. It provides a brief summary of their business careers over the past five years and their range of beneficial share ownership in the Fund as of December 31, 2006.
James K. Schmidt, CFA
Executive Vice President, MFC Global Investment Management (U.S.), LLC since 2005
Executive Vice President, John Hancock Advisers, LLC (1992-2005)
Began business career in 1979
Joined fund team in 1991
Fund ownership — None
Lisa A. Welch
Vice President, MFC Global Investment Management (U.S.), LLC since 2005
Vice President, John Hancock Advisers, LLC (1998-2005)
Began business career in 1986
Joined fund team in 1998
Fund ownership — None
Roger C. Hamilton
Vice President, MFC Global Investment Management (U.S.), LLC
Vice President and Portfolio Manager, John Hancock Advisers, LLC (2003-2005)
Analyst, John Hancock Advisers, LLC (1994-2003)
Began business career in 1980
Joined fund team in 2006
Fund ownership — None
Other Accounts the Portfolio Managers are Managing
The table below indicates for each portfolio manager information about the accounts over which the portfolio manager has day-to-day investment responsibility. All information on the number of accounts and total assets in the table is as of December 31, 2006. For purposes of the table, “Other Pooled Investment Vehicles” may include investment partnerships and group trusts, and “Other Accounts” may include separate accounts for institutions or individuals, insurance company general or separate accounts, pension funds and other similar institutional accounts.
| P O R T F O L I O M A N A G E R | O T H E R A C C O U N T S M A N A G E D B Y T H E P O R T F O L I O M A N A G E R S |
| James K. Schmidt, CFA | Other Investment Companies: |
| 6 funds with assets of approximately $5.3 billion. | |
| Other Pooled Investment Vehicles: None | |
| Other Accounts: None | |
| Lisa A. Welch | Other Investment Companies: |
| 4 funds with assets of approximately $5.2 billion. | |
| Other Pooled Investment Vehicles: None | |
| Other Accounts: None | |
| Roger C. Hamilton | Other Investment Companies: |
| 3 funds with assets of approximately $1.7 billion. | |
| Other Pooled Investment Vehicles: None | |
| Other Accounts: 31 accounts with total assets of | |
| approximately $25 million | |
Neither the Adviser nor Subadviser receives a fee based upon the investment performance of any of the accounts included under “Other Accounts Managed by the Portfolio Managers” in the table above.
25
When a portfolio manager is responsible for the management of more than one account, the potential arises for the portfolio manager to favor one account over another. For the reasons outlined below, the Fund does not believe that any material conflicts are likely to arise out of a portfolio manager’s responsibility for the management of the Fund as well as one or more other accounts. The Adviser and the Subadviser have adopted procedures, overseen by the Chief Compliance Officer, that are intended to monitor compliance with the policies referred to in the following paragraphs:
• The Subadviser has policies that require a portfolio manager to allocate investment opportunities in an equitable manner and generally to allocate such investments proportionately among all accounts with similar investment objectives.
• When a portfolio manager intends to trade the same security for more than one account, the policies of the Subadviser generally require that such trades for the individual accounts are aggregated so each account receives the same price. Where not possible or may not result in the best possible price, the Subadviser will place the order in a manner intended to result in as favorable a price as possible for such client.
• The investment performance on specific accounts is not a factor in determining the portfolio manager’s compensation. See “Compensation of Portfolio Managers” below. Neither the Adviser nor the Subadviser receives a performance-based fee with respect any accounts managed by the Fund’s portfolio manager.
• The Subadviser imposes certain trading restrictions and reporting requirements for accounts in which a portfolio manager or certain family members have a personal interest in order to confirm that such accounts are not favored over other accounts.
• The Subadviser seeks to avoid portfolio manager assignments with potentially conflicting situations. However, where a portfolio manager is responsible for accounts with differing investment objectives and policies, it is possible that the portfolio manager will conclude that it is in the best interest of one account to sell a portfolio security while another account continues to hold or increase the holding in such security.
Compensation of Portfolio Managers
The Subadviser has adopted a system of compensation for portfolio managers and others involved in the investment process that is applied consistently among investment professionals. At the Subadviser, the structure of compensation of investment professionals is currently comprised of the following basic components: fixed base salary, and an annual investment bonus plan, as well as customary benefits that are offered generally to all full-time employees of the Subadviser. A limited number of senior portfolio managers, who serve as officers of both the Subadviser and its parent company, may also receive options or restricted stock grants of common shares of Manulife Financial.
Only investment professionals are eligible to participate in the Investment Bonus Plan on an annual basis. While the amount of any bonus is discretionary, the following factors are generally used in determining bonuses: 1) The investment performance of all accounts managed by the investment professional over one and three- year periods are considered. The pre-tax performance of each account is measured relative to an appropriate peer group benchmark. 2) The profitability of the Subadviser and its parent company are also considered in determining bonus awards, with greater emphasis placed upon the profitability of the Adviser. 3) The more intangible contributions of an investment professional to the Subadviser’s business, including the investment professional’s support of sales activities, new fund/strategy idea generation, professional growth and development, and management, where applicable, are evaluating in determining the amount of any bonus award.
While the profitability of the Subadviser and the investment performance of the accounts that the investment professionals maintain are factors in determining an investment professional’s overall compensation, the investment professional’s compensation is not linked directly to the net asset value of any fund.
26
Trustees Directors and Officers
This chart provides information about the Directors and Officers who oversee
your John Hancock fund. Officers elected by the Directors manage the day-to-day
operations of the Fund and execute policies formulated by the Directors.
Independent Directors
| Name, age | |
| Position(s) held with Fund | Director |
| Principal occupation(s) and other | of Fund |
| directorships during past 5 years | since1 |
| Franklin C. Golden, Born: 1950 | 1989 |
| Chairman and Director | |
| Managing Director, Wachovia Securities, Inc. (since 2001) (broker dealer); | |
| President, James Myers and Company (full-service broker dealer) (until 2001); | |
| President, Financial Trends Fund, Inc. (until 2001); Executive Vice President, IJL/ | |
| Wachovia (until 1991); Past Director and Chairman of the National Association | |
| of Securities Dealers (NASD) District 7 Business Conduct Committee. | |
| Robert G. Freedman, Born: 1938 | 1996 |
| Director | |
| Executive Vice President and Chief Investment Officer, Sovereign Asset | |
| Management and NM Capital Management, Inc. (until 2000); Vice Chairman | |
| and Chief Investment Officer, John Hancock Advisers, LLC (until 1998). | |
| Russell J. Page, Born: 1942 | 2003 |
| Director | |
| Principal, Rusty Page & Co. (equity markets consulting) (since 1996); Regional | |
| Board, BB&T Corp. (since 2004); Trustee, Appalachian Regional Healthcare | |
| Systems (since 2004); Director, Cannon Memorial Hospital (since 2003); | |
| NationsBank Equity Marketing Executive (until 1996), Nasdaq Stock Market | |
| Managing Director (until 2001). | |
| Fred G. Steingraber, Born: 1938 | 1989 |
| Director | |
| Chairman and Chief Executive Officer, A.T. Kearney, Inc. (management consult- | |
| ing) (retired 2002); Director, Maytag Corporation; Director, Supervisory Board | |
| of Continental AG; Director 3i PLC; Director, Elkay Manufacturing. | |
| Donald R. Tomlin, Born: 1933 | 1989 |
| Director | |
| Vice President of Livingston Group Asset Management Company (operating as | |
| Southport Capital Management) (since 2001); Managing Director, Southport | |
| Capital, Inc. (registered investment adviser) (until 2001); Managing Director | |
| and portfolio manager of Haven Capital Management, Inc. (until 1991); | |
| Principal and portfolio manager of Kleinwort Benson McCowan Inc. and its | |
| successor McCowan Associates, Inc. (until 1983). | |
27
Independent Directors (continued)
| Name, age | |
| Position(s) held with Fund | Director |
| Principal occupation(s) and other | of Fund |
| directorships during past 5 years | since1 |
| H. Hall Ware, III, Born: 1935 | 1989 |
| Director | |
| Attorney, private practice (since 2001); President, Odin Systems International, | |
| Inc. (1999-2001); Gilbert, Harrell, Gilbert, Sumerford & Martin, Attorneys | |
| (until 1999). | |
| Barry Evans, Born: 1960 | 2004 |
| President | |
| President, Chief Fixed Income Officer and Chief Operating Officer, MFC Global | |
| Investments (U.S.), LLC (since 2005); Senior Vice President, Chief Fixed Income | |
| Officer and Chief Operating Officer, John Hancock Advisers, LLC (the “Adviser”) | |
| (1986–2005) and each of the John Hancock funds (until 2006). | |
| William H. King, Born: 1952 | 1994 |
| Treasurer | |
| Vice President and Assistant Treasurer, the Adviser; Vice President and Assistant | |
| Treasurer of each of the John Hancock funds advised by the Adviser; Assistant | |
| Treasurer of each of the John Hancock funds (until 2001). | |
| Francis V. Knox, Jr., Born: 1947 | 2005 |
| Vice President and Chief Compliance Officer | |
| Vice President and Chief Compliance Officer for John Hancock Investment | |
| Company, John Hancock Life Insurance Company (U.S.A.), John Hancock Life | |
| Insurance Company and John Hancock Funds (since 2005); Vice President and | |
| Assistant Treasurer, Fidelity Group of Funds (until 2004); Vice President and | |
| Ethics & Compliance Officer, Fidelity Investments (until 2001). | |
| Thomas M. Kinzler, Born: 1955 | 2006 |
| Secretary and Chief Legal Officer | |
| Vice President and Counsel, John Hancock Life Insurance Company (U.S.A.) | |
| (since 2006); Secretary and Chief Legal Officer, John Hancock Funds, John | |
| Hancock Funds II, John Hancock Funds III and John Hancock Trust (since 2006); | |
| Vice President and Associate General Counsel, Massachusetts Mutual Life | |
| Insurance Company (1999–2006); Secretary and Chief Legal Counsel, MML | |
| Series Investment Fund (2000–2006); Secretary and Chief Legal Counsel, | |
| MassMutual Institutional Funds (2000–2004); Secretary and Chief Legal Counsel, | |
| MassMutual Select Funds and MassMutual Premier Funds (2004–2006). | |
The business address for all Directors and Officers is 601 Congress Street, Boston, Massachusetts 02210-2805.
1 Each Director serves until resignation, retirement age or until his or her successor is elected.
28
29
For more information
The Fund’s proxy voting policies, procedures and records are available without charge,
upon request:
| By phone | On the Fund’s Web site | On the SEC’s Web site |
| 1-800-225-5291 | www.jhfunds.com/proxy | www.sec.gov |
| Investment adviser | Transfer agent and registrar | Independent registered |
| John Hancock Advisers, LLC | Mellon Investor Services | public accounting firm |
| 601 Congress Street | Newport Office Center VII | PricewaterhouseCoopers LLP |
| Boston, MA 02210-2805 | 480 Washington Boulevard | 125 High Street |
| Jersey City, NJ 07310 | Boston, MA 02110 | |
| Subadviser | ||
| MFC Global Investment | Independent directors’ | Stock symbol |
| Management (U.S.), LLC | counsel | Listed Nasdaq Symbol: |
| 101 Huntington Avenue | Kilpatrick Stockton LLP | JHFT |
| Boston, MA 02199 | 1100 Peachtree Street | |
| Atlanta, Georgia 30309-4530 | For shareholder assistance | |
| Custodian | refer to page 21 | |
| The Bank of New York | Fund counsel | |
| One Wall Street | Wilmer Cutler Pickering | |
| New York, NY 10286 | Hale and Door LLP | |
| 60 State Street | ||
| Boston, MA 02109-1803 | ||
| How to contact us | ||
| Internet | www.jhfunds.com | |
| Regular mail: | ||
| Mellon Investor Services | ||
| Newport Office Center VII | ||
| 480 Washington Boulevard | ||
| Jersey City, NJ 07310 | ||
| Phone | Customer service representatives | 1-800-852-0218 |
| Portfolio commentary | 1-800-344-7054 | |
| 24-hour automated information | 1-800-843-0090 | |
| TDD line | 1-800-231-5469 | |
A listing of month-end portfolio holdings is available on our Web site, www.jhfunds.com. A more detailed portfolio holdings summary is available on a quarterly basis 60 days after the fiscal quarter on our Web site or upon request by calling 1-800-225-5291, or on the Securities and Exchange Commission’s Web site, www.sec.gov.
32
J O H N H A N C O C K F A M I L Y O F F U N D S
| EQUITY | INTERNATIONAL |
| Balanced Fund | Greater China Opportunities Fund |
| Classic Value Fund | International Allocation Portfolio |
| Classic Value Fund II | International Classic Value Fund |
| Core Equity Fund | International Core Fund |
| Focused Equity Fund | International Fund |
| Growth Fund | International Growth Fund |
| Growth Opportunities Fund | |
| Growth Trends Fund | INCOME |
| Intrinsic Value Fund | Bond Fund |
| Large Cap Equity Fund | Government Income Fund |
| Large Cap Select Fund | High Yield Fund |
| Mid Cap Equity Fund | Investment Grade Bond Fund |
| Mid Cap Growth Fund | Strategic Income Fund |
| Multi Cap Growth Fund | |
| Small Cap Equity Fund | TAX-FREE INCOME |
| Small Cap Fund | California Tax-Free Income Fund |
| Small Cap Intrinsic Value Fund | High Yield Municipal Bond Fund |
| Sovereign Investors Fund | Massachusetts Tax-Free Income Fund |
| U.S. Core Fund | New York Tax-Free Income Fund |
| U.S. Global Leaders Growth Fund | Tax-Free Bond Fund |
| Value Opportunities Fund | |
| MONEY MARKET | |
| ASSET ALLOCATION | Money Market Fund |
| Allocation Core Portfolio | U.S. Government Cash Reserve |
| Allocation Growth + Value Portfolio | |
| Lifecycle 2010 Portfolio | |
| Lifecycle 2015 Portfolio | CLOSED-END |
| Lifecycle 2020 Portfolio | Bank and Thrift Opportunity Fund |
| Lifecycle 2025 Portfolio | Financial Trends Fund, Inc. |
| Lifecycle 2030 Portfolio | Income Securities Trust |
| Lifecycle 2035 Portfolio | Investors Trust |
| Lifecycle 2040 Portfolio | Patriot Global Dividend Fund |
| Lifecycle 2045 Portfolio | Patriot Preferred Dividend Fund |
| Lifecycle Retirement Portfolio | Patriot Premium Dividend Fund I |
| Lifestyle Aggressive Portfolio | Patriot Premium Dividend Fund II |
| Lifestyle Balanced Portfolio | Patriot Select Dividend Fund |
| Lifestyle Conservative Portfolio | Preferred Income Fund |
| Lifestyle Growth Portfolio | Preferred Income II Fund |
| Lifestyle Moderate Portfolio | Preferred Income III Fund |
| Tax-Advantaged Dividend Income Fund | |
| SECTOR | |
| Financial Industries Fund | |
| Health Sciences Fund | |
| Real Estate Fund | |
| Regional Bank Fund | |
| Technology Fund | |
| Technology Leaders Fund |
For more complete information on any John Hancock Fund and an Open-End fund prospectus, which includes charges and expenses, call your financial professional, or John Hancock Funds at 1-800-225-5291 for Open-End fund information and 1-800-852-0218 for Closed-End fund information. Please read the Open-End fund prospectus carefully before investing or sending money.

1-800-852-0218
1-800-231-5469 TDD
1-800-843-0090 EASI-Line
www.jhfunds. com
PRESORTED
STANDARD
U.S. POSTAGE
PAID MIS
PT00A 12/06
2/07
ITEM 2. CODE OF ETHICS.
As of the end of the period, December 31, 2006, the registrant has adopted a code of ethics, as defined in Item 2 of Form N-CSR, that applies to its Chief Executive Officer, Chief Financial Officer and Treasurer (respectively, the principal executive officer, the principal financial officer and the principal accounting officer, the “Senior Financial Officers”). A copy of the code of ethics is filed as an exhibit to this Form N-CSR.
ITEM 3. AUDIT COMMITTEE FINANCIAL EXPERT.
Russell L. Page is the audit committee financial expert and is “independent”, pursuant to general instructions on Form N-CSR Item 3.
ITEM 4. PRINCIPAL ACCOUNTANT FEES AND SERVICES.
(a) Audit Fees
The aggregate fees billed for professional services rendered by the principal accountant(s) for the audit of the registrant’s annual financial statements or services that are normally provided by the accountant(s) in connection with statutory and regulatory filings or engagements amounted to $24,300 for the fiscal year ended December 31, 2005 and $24,300 for the fiscal year ended December 31, 2006. These fees were billed to the registrant and were approved by the registrant’s audit committee.
(b) Audit-Related Services
There were no audit-related fees during the fiscal year ended December 31, 2005 and fiscal year ended December 31, 2006 billed to the registrant or to the registrant's investment adviser (not including any sub-adviser whose role is primarily portfolio management and is subcontracted with or overseen by another investment adviser), and any entity controlling, controlled by, or under common control with the adviser that provides ongoing services to the registrant ("control affiliates").
(c) Tax Fees
The aggregate fees billed for professional services rendered by the principal accountant(s) for the tax compliance, tax advice and tax planning (“tax fees”) amounted to $2,500 for the fiscal year ended December 31, 2005 and $2,500 for the fiscal year ended December 31, 2006. The nature of the services comprising the tax fees was the review of the registrant’s income tax returns and tax distribution requirements. These fees were billed to the registrant and were approved by the registrant’s audit committee. There were no tax fees billed to the control affiliates.
(d) All Other Fees
There were no other fees during the fiscal year ended December 31, 2005 and fiscal year ended December 31, 2006 billed to the registrant or to the control affiliates.
(e)(1) See attachment "Approval of Audit, Audit-related, Tax and Other Services", with the audit committee pre-approval policies and procedures.
(e)(2) There were no fees that were approved by the audit committee pursuant to the de minimis exception for the fiscal years ended December 31, 2005 and December 31, 2006 on behalf of the registrant or on behalf of the control affiliates that relate directly to the operations and financial reporting of the registrant.
(f) According to the registrant’s principal accountant, for the fiscal year ended December 31, 2006, the percentage of hours spent on the audit of the registrant's financial statements for the most recent fiscal year that were attributed to work performed by persons who were not full-time, permanent employees of principal accountant was less than 50%.
(g) The aggregate non-audit fees billed by the registrant's accountant(s) for services rendered to the registrant and rendered to the registrant's control affiliates for each of the last two fiscal years of the registrant were $99,700 for the fiscal year ended December 31, 2005, and $872,192 for the fiscal year ended December 31, 2006.
(h) The audit committee of the registrant has considered the non-audit services provided by the registrant’s principal accountant(s) to the control affiliates and has determined that the services that were not pre-approved are compatible with maintaining the principal accountant(s)' independence.
ITEM 5. AUDIT COMMITTEE OF LISTED REGISTRANTS.
The registrant has a separately-designated standing audit committee comprised of independent trustees. The members of the audit committee are as follows:
Franklin C. Golden
Russell J. Page
Fred G. Steingraber
Donald R. Tomlin
H. Hall Ware
ITEM 6. SCHEDULE OF INVESTMENTS.
Not applicable.
ITEM 7. DISCLOSURE OF PROXY VOTING POLICIES AND PROCEDURES FOR CLOSED-END MANAGEMENT INVESTMENT COMPANIES.
See attached Exhibit “Proxy Voting Policies and Procedures”.
ITEM 8. PORTFOLIO MANAGERS OF CLOSED-END MANAGEMENT INVESTMENT COMPANIES.
Not applicable.
ITEM 9. PURCHASES OF EQUITY SECURITIES BY CLOSED-END MANAGEMENT INVESTMENT COMPANY AND AFFILIATED PURCHASERS.
Not applicable.
ITEM 10. SUBMISSION OF MATTERS TO A VOTE OF SECURITY HOLDERS.
(a) There were no material changes to previously disclosed John Hancock Funds -Governance Committee Charter.
ITEM 11. CONTROLS AND PROCEDURES.
(a) Based upon their evaluation of the registrant's disclosure controls and procedures as conducted within 90 days of the filing date of this Form N-CSR, the registrant's principal executive officer and principal accounting officer have concluded that those disclosure controls and procedures provide reasonable assurance that the material information required to be disclosed by the registrant on this report is recorded, processed, summarized and reported within the time periods specified in the Securities and Exchange Commission's rules and forms.
(b) There were no changes in the registrant's internal control over financial reporting that occurred during the registrant's most recent fiscal half-year (the registrant's second fiscal half-year in the case of an annual report) that have materially affected, or are reasonably likely to materially affect, the registrant's internal control over financial reporting.
ITEM 12. EXHIBITS.
(a)(1) Code of Ethics for Senior Financial Officers is attached.
(a)(2) Separate certifications for the registrant's principal executive officer and principal accounting officer, as required by Section 302 of the Sarbanes-Oxley Act of 2002 and Rule 30a-2(a) under the Investment Company Act of 1940, are attached.
(b) Separate certifications for the registrant's principal executive officer and principal accounting officer, as required by 18 U.S.C. Section 1350, as adopted pursuant to Section 906 of the Sarbanes-Oxley Act of 2002, and Rule 30a-2(b) under the Investment Company Act of 1940, are attached. The certifications furnished pursuant to this paragraph are not deemed to be "filed" for purposes of Section 18 of the Securities Exchange Act of 1934, or otherwise subject to the liability of that section. Such certifications are not deemed to be incorporated by reference into any filing under the Securities Act of 1933 or the Securities Exchange Act of 1934, except to the extent that the Registrant specifically incorporates them by reference.
(c)(1) Proxy Voting Policies and Procedures are attached.
(c)(2) Approval of Audit, Audit-related, Tax and Other Services is attached.
(c)(3) Submission of Matters to a Vote of Security Holders is attached. See attached “John Hancock Funds – Governance Committee Charter”.
(c)(4) Contact person at the registrant.
SIGNATURES
Pursuant to the requirements of the Securities Exchange Act of 1934 and the Investment Company Act of 1940, the registrant has duly caused this report to be signed on its behalf by the undersigned, thereunto duly authorized.
John Hancock Financial Trends Fund, Inc.
By: /s/ Barry H. Evans
-------------------------------------
Barry H. Evans
President
Date: February 27, 2007
Pursuant to the requirements of the Securities Exchange Act of 1934 and the Investment Company Act of 1940, this report has been signed below by the following persons on behalf of the registrant and in the capacities and on the dates indicated.
By: /s/ Barry H. Evans
-------------------------------------
Barry H. Evans
President
Date: February 27, 2007
By: /s/ William H. King
-------------------------------------
William H. King
Treasurer
Date: February 27, 2007