UNITED STATES
SECURITIES AND EXCHANGE COMMISSION
Washington, D.C. 20549
FORM N-CSR
CERTIFIED SHAREHOLDER REPORT OF REGISTERED
MANAGEMENT INVESTMENT COMPANIES
| | |
| Investment Company Act file number | | 811‑05845 |
| | |
|
| Invesco Senior Loan Fund |
| (Exact name of registrant as specified in charter) |
|
| 1555 Peachtree Street, N.E., Suite 1800 Atlanta, Georgia 30309 |
| (Address of principal executive offices) (Zip code) |
|
| Sheri Morris 1555 Peachtree Street, N.E., Suite 1800 Atlanta, Georgia 30309 |
| (Name and address of agent for service) |
| | | | |
| Registrant’s telephone number, including area code: | | (713) 626‑1919 |
| | |
| Date of fiscal year end: | | 2/28 | | |
| | |
| Date of reporting period: | | 2/28/23 | | |
| ITEM 1. | REPORTS TO STOCKHOLDERS. |
(a) The Registrant’s annual report transmitted to shareholders pursuant to Rule 30e‑1 under the Investment Company Act of 1940 is as follows:
| | |
| | |
| Annual Report to Shareholders | | February 28, 2023 |
Invesco Senior Loan Fund
Nasdaq:
A: VSLAX ∎ C: VSLCX ∎ Y: VSLYX ∎ IB: XPRTX ∎ IC: XSLCX
Management’s Discussion of Fund Performance
| | | | |
Performance summary | |
For the fiscal year ended February 28, 2023, Class A shares of Invesco Senior Loan Fund (the Fund), at net asset value (NAV), underperformed the Credit Suisse Leveraged Loan Index, the Fund’s style-specific benchmark. Your Fund’s long-term performance appears later in this report. | |
| | |
Fund vs. Indexes | | | | |
| Total returns, 2/28/22 to 2/28/23, at net asset value (NAV). Performance shown does not include applicable contingent deferred sales charges (CDSC) or front‑end sales charges, which would have reduced performance. | |
| |
| Class A Shares | | | -0.62 | % |
| Class C Shares | | | -1.50 | |
| Class Y Shares | | | -0.37 | |
| Class IB Shares | | | -0.36 | |
| Class IC Shares | | | -0.51 | |
Credit Suisse Leveraged Loan Indexq (Style-Specific Index) | | | 2.26 | |
Source(s): qBloomberg LP | | | | |
Market conditions and your Fund
During the fiscal year covered by this report, the senior loan market was characterized by risk aversion in reaction to escalating geopolitical turmoil in Ukraine, persistent inflation, rapidly escalating interest rate expectations, rising energy prices and a softening economic growth outlook. The confluence of these various pressures drove flows out of capital markets and caused risk premia to widen. Despite these circumstances, loans outperformed other risk assets through the end of the fiscal year. The past several months of the end of the fiscal year have seen a reversal in overall market performance, with the broad loan market up from their second quarter of 2022 lows. Senior loans’ defensive positioning at the top of the capital structure and floating rate feature benefited the asset class during these bouts of risk aversion and inflation jitters, while the current, relatively high, level of coupons helped the asset class maintain positive performance during the fiscal year relative to traditional asset classes.
Senior loans, as represented by the Credit Suisse Leveraged Loan Index, returned 2.26% during the Fund’s fiscal year.1 For the first month of 2022, loans performed well, continuing the 2021 trend of positive performance, however geopolitical turmoil and inflation began to influence performance by late February 2022. Loans suffered a weak second quarter of 2022, down 4.35%,1 driven largely by technical factors and not fundamentals. In particular, the risk‑off sentiment in other markets led to retail outflows and more importantly, a lack of new collateralized loan obligation (CLO)
creation (which typically represents 65% of loan demand) in May and June of 2022. At their low point, loan prices as of June 30, 2022, were implying a 7.9%1 default rate in the market, in excess of forecasted default rates for 2023 and the rolling twelve-month default rate.2 This has been fairly typical of other historical sell-offs where the market overshoots compensating investors for actual defaults and then rallies sharply as buyers step in. Since the end of June 2022, CLO creation has come back in earnest and for the second half of the fiscal year, supportive technical factors played a role as opportunistic CLO managers sought to buy assets for new structures despite a dearth of new issue supply. This increase in CLO demand, as well as supportive fundamentals and other technical drivers, enabled the loan market to produce only one month of negative returns between June 2022 and February 2023 and improving the average loan price from $91.96 to $93.49 as of fiscal year‑end.1 The increased interest from CLOs was at odds with retail mutual funds and ETFs, which recorded outflows for a tenth consecutive month in February 2023.4 Loans are up 3.21% for the first two months of 2023, having outperformed high-yield by approximately 70 basis points (bps) during the fiscal year and likewise outperformed high-yield during the full year 2022 by approximately 950 bps.1,3 During the fiscal year, BB‑, B‑ and CCC‑rated† loans returned 5.06%, 2.66% and ‑8.72%, respectively.1 Energy was the best performing sector, returning 9.38% for the fiscal year, while consumer durables was the worst performing sector, returning ‑3.62% for the same period.1
The loan market fundamentals have held up well over the fiscal year. As of the third quarter of 2022, overall leverage for loan issuers declined for a sixth consecutive quarter, while at the same time corporate profits remained relatively robust.4 The second quarter of 2022 saw interest coverage ratios reach a record high, despite continued rising rates, before creeping down in the second half of the calendar year.5 With approximately 4.8% of the market trading at distressed levels,1 and an inflation readings surprise in February causing investors to rethink the potential rate hiking cycle for 2023, the loan market is expected to experience moderately increasing levels of defaults, with most forecasts between a 3.0% to 3.5% in the last twelve months default rate by year‑end 2023, on par with the long-term average default rate of roughly 3.0%.4 Yields remain robust given the rise in interest rates, with average loan coupons continuing to outyield the average coupon for high-yield bonds.4
As of February 28, 2023, the 12‑month default rate was 1.02%.2 Issuer fundamentals ended the last quarter of 2022 with a strong ability to service their debt, even in a rising rate environment. Interest coverage ratios, while down from their recent highs, are currently 3.9 times,5 so companies continue to have the sufficient ability to absorb higher rates. Additionally, leverage levels have returned to pre‑pandemic levels as borrowers have repaired their balance sheets and pushed out their maturities. As of January 31, 2023, only 5.5% of outstanding loans mature in 2023 or 2024, so there is minimal refinancing risk in the market.4 The average price in the senior loan market was $93.49 as of February 28, 2023.1 Given the price of senior loans at the end of the fiscal year, they provided a 10.52% yield (represented by the yield to 3‑year life).1
During the fiscal year, the Fund employed leverage, which allowed us to enhance the Fund’s yield while keeping credit standards high relative to the benchmark. As of the close of the fiscal year, leverage accounted for approximately 16% of the Fund’s total assets. Leverage involves borrowing at a floating short-term rate and reinvesting the proceeds at a higher rate. Unlike other fixed income asset classes, using leverage in conjunction with senior loans does not involve the same degree of risk from rising short-term interest rates since the
2 Invesco Senior Loan Fund
income from senior loans generally adjusts to changes in interest rates, as do the rates which determine the Fund’s borrowing costs. (Similarly, should short-term rates fall, borrowing costs also would decline.) For more information about the Fund’s use of leverage and the associated risks, see the Notes to Financial Statements later in this report.
During the fiscal year ending February 28, 2023, QuarterNorth Energy, Aquadrill and Petroleum GEO‑Services ASA were the largest contributors to the Fund’s relative performance as compared to the benchmark, while IAP Worldwide Services, Crown Finance US and Riverbed Technology were the largest detractors from relative Fund performance.
In managing the Fund, we seek to take advantage of market opportunities by decreasing risk in the Fund when we believe senior loans are overbought and increasing risk when we believe they are oversold. We seek to efficiently allocate risk within the portfolio in order to maximize risk-adjusted returns through five different considerations consisting of credit selection, sector migration, risk positioning, asset selection and trading.
The senior loan asset class behaves differently from many traditional fixed income investments. The interest income generated by a portfolio of senior loans is usually determined by a fixed credit spread over a reference rate. Because senior loans generally have a very short duration and the coupons, or interest rates, are usually adjusted every 30 to 90 days as the reference rate changes, the yield on the portfolio adjusts. Interest rate risk refers to the tendency for traditional fixed income prices to decline when interest rates rise. For senior loans, however, interest rates and income are variable, and the prices of loans are therefore less sensitive to interest rate changes than traditional fixed income bonds. As a result, senior loans can provide a natural hedge against rising interest rates.
We are monitoring interest rates, the market, economic and geopolitical factors that may impact the direction, speed and magnitude of changes to interest rates across the maturity spectrum, including the potential impact of monetary policy changes by the US Federal Reserve and other central banks. If interest rates rise or fall faster than expected, markets may experience increased volatility, which may affect the value and/or liquidity of certain of the Fund’s investments and the market price of the Fund’s shares.
As always, we appreciate your continued participation in Invesco Senior Loan Fund.
| 1 | Source: Credit Suisse Leveraged Loan Index |
| 2 | Source: Morningstar LSTA US Leveraged Loan Index |
| 3 | Source: Credit Suisse High Yield Index |
† Source: S&P Global Ratings. A credit rating is an assessment provided by a nationally recognized statistical rating organization (NRSRO) of the creditworthiness of an issuer with respect to debt obligations, including specific securities, money market instruments or other debts. Ratings are measured on a scale that generally ranges from AAA (highest) to D (lowest); ratings are subject to change without notice. Not Rated indicates the debtor was not rated and should not be interpreted as indicating low quality. For more information on S&P Global Ratings’ rating methodology, please visit www.spglobal.com and select ’Understanding Credit Ratings’ under About Ratings on the homepage.
Portfolio manager(s):
Scott Baskind
Tom Ewald - Lead
Philip Yarrow
The views and opinions expressed in management’s discussion of Fund performance are those of Invesco Advisers, Inc. and its affiliates. These views and opinions are subject to change at any time based on factors such as market and economic conditions. These views and opinions may not be relied upon as investment advice or recommendations, or as an offer for a particular security. The information is not a complete analysis of every aspect of any market, country, industry, security or the Fund. Statements of fact are from sources considered reliable, but Invesco Advisers, Inc. makes no representation or warranty as to their completeness or accuracy. Although historical performance is no guarantee of future results, these insights may help you understand our investment management philosophy.
See important Fund and, if applicable, index disclosures later in this report.
3 Invesco Senior Loan Fund
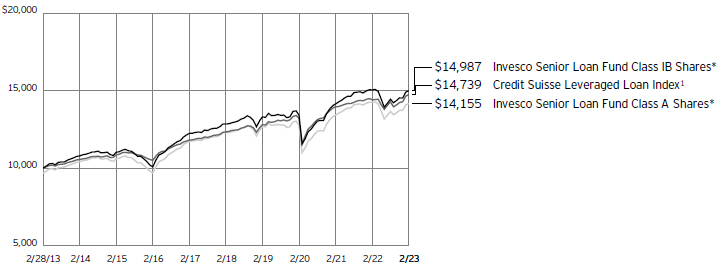
Your Fund’s Long-Term Performance
Results of a $10,000 Investment – Oldest Share Class(es)
Fund and index data from 2/28/13
1 Source: Bloomberg LP
* The Fund’s oldest share class (IB shares) does not have a sales charge; therefore, the second-oldest share class with a sales charge (Class A) is also included in the chart.
Past performance cannot guarantee future results.
The data shown in the chart include reinvested distributions, applicable sales charges and Fund expenses including
management fees. Index results include reinvested dividends, but they do not reflect sales charges. Performance of the peer group, if applicable, reflects Fund expenses and management fees;
performance of a market index does not. Performance shown in the chart does not reflect deduction of taxes a shareholder would pay on Fund distributions or sale of Fund shares.
| | | | |
| |
| Average Annual Total Returns | |
| As of 2/28/23, including maximum applicable sales charges | |
| Class A Shares | | | | |
| Inception (2/18/05) | | | 3.24 | % |
| 10 Years | | | 3.54 | |
| 5 Years | | | 2.19 | |
| 1 Year | | | -3.89 | |
| |
| Class C Shares | | | | |
| Inception (2/18/05) | | | 2.66 | % |
| 10 Years | | | 3.10 | |
| 5 Years | | | 2.10 | |
| 1 Year | | | -2.41 | |
| |
| Class Y Shares | | | | |
| Inception (11/8/13) | | | 3.84 | % |
| 5 Years | | | 3.14 | |
| 1 Year | | | -0.37 | |
| |
| Class IB Shares | | | | |
| Inception (10/4/89) | | | 4.71 | % |
| 10 Years | | | 4.13 | |
| 5 Years | | | 3.14 | |
| 1 Year | | | -0.36 | |
| |
| Class IC Shares | | | | |
| Inception (6/13/03) | | | 4.06 | % |
| 10 Years | | | 3.99 | |
| 5 Years | | | 2.99 | |
| 1 Year | | | -0.51 | |
The performance data quoted represent past performance and cannot guarantee future results; current performance may be lower or higher. Please visit invesco.com/performance for the most recent month‑end performance. Performance figures reflect reinvested distributions, changes in net asset value and the effect of the maximum sales charge unless otherwise stated. Performance figures do not reflect deduction of taxes a shareholder would pay on Fund distributions or sale of Fund shares. Investment return and principal value will fluctuate so that you may have a gain or loss when you sell shares.
Class A share performance reflects the maximum 3.25% sales charge. Class A shares have no early withdrawal charges, except that an early withdrawal charge of 1.00% may be imposed on certain repurchases of Class A shares made by the Fund within eighteen months of purchase upon which a sales charge was not paid; such charge is not reflected in the returns shown above. Class C share performance reflects a maximum early withdrawal charge of 1% for the first
year after purchase. Class IB shares and Class IC shares are not continuously offered. Class Y, Class IB and Class IC shares do not have a front‑end sales charge or a CDSC, therefore performance is at net asset value. Class Y, Class IB and Class IC shares do not have early withdrawal charges.
The performance of the Fund’s share classes will differ primarily due to different sales charge structures and class expenses.
Fund performance reflects any applicable fee waivers and/or expense reimbursements. Had the adviser not waived fees and/or reimbursed expenses currently or in the past, returns would have been lower. See current prospectus for more information.
4 Invesco Senior Loan Fund
Supplemental Information
Invesco Senior Loan Fund’s investment objective is to seek to provide a high level of current income, consistent with preservation of capital.
| ∎ | Unless otherwise stated, information presented in this report is as of February 28, 2023, and is based on total net assets. |
| ∎ | Unless otherwise noted, all data is provided by Invesco. |
| ∎ | To access your Fund’s reports/prospectus, visit invesco.com/fundreports. |
About indexes used in this report
| ∎ | The Credit Suisse Leveraged Loan Index represents tradable, senior-secured, US‑dollar‑denominated, noninvestment-grade loans. |
| ∎ | The Fund is not managed to track the performance of any particular index, including the index(es) described here, and consequently, the performance of the Fund may deviate significantly from the performance of the index(es). |
| ∎ | A direct investment cannot be made in an index. Unless otherwise indicated, index results include reinvested dividends, and they do not reflect sales charges. Performance of the peer group, if applicable, reflects fund expenses; performance of a market index does not. |
|
|
| This report must be accompanied or preceded by a currently effective Fund prospectus, which contains more complete information, including sales charges and expenses. Investors should read it carefully before investing. |
|
| NOT FDIC INSURED | MAY LOSE VALUE | NO BANK GUARANTEE |
5 Invesco Senior Loan Fund
Fund Information
Portfolio Composition†
| | |
| By credit quality | | % of total investments |
| BBB- | | 0.94% |
| BB+ | | 2.06 |
| BB | | 5.35 |
| BB- | | 7.97 |
| B+ | | 10.51 |
| B | | 21.20 |
| B- | | 19.81 |
| CCC+ | | 6.23 |
| CCC | | 2.50 |
| CCC- | | 0.30 |
| CC | | 0.06 |
| D | | 0.46 |
| Non‑Rated | | 13.41 |
| Equity | | 9.20 |
† Source: S&P Global Ratings. A credit rating is an assessment provided by a nationally recognized statistical rating organization of the creditworthiness of an issuer with respect to debt obligations, including specific securities, money market instruments or other debts. Ratings are measured on a scale that generally ranges from AAA (highest) to D (lowest); ratings are subject to change without notice. “Non‑Rated” indicates the debtor was not rated, and should not be interpreted as indicating low quality. For more information on S&P Global Ratings’ rating methodology, please visit spglobal.com and select “Understanding Credit Ratings” under About Ratings on the homepage.
Top Five Debt Issuers
| | | | |
| | | | | % of total net assets |
| 1. | | NAS LLC (d.b.a. Nationwide Marketing Group) | | 2.04% |
| 2. | | Monitronics International, Inc. | | 1.59 |
| 3. | | Crown Finance US, Inc. | | 1.38 |
| 4. | | HotelBeds | | 1.33 |
| 5. | | Al Aqua Merger Sub, Inc. | | 1.31 |
The Fund’s holdings are subject to change, and there is no assurance that the Fund will continue to hold any particular security.
Data presented here are as of February 28, 2023.
6 Invesco Senior Loan Fund
Schedule of Investments
February 28, 2023
| | | | | | | | | | | | | | |
| | | Interest
Rate | | | Maturity
Date | | | Principal Amount (000)(a) | | | Value |
Variable Rate Senior Loan Interests–100.89%(b)(c) | | | | | | | | | | | | | | |
| | | | |
| Aerospace & Defense–3.83% | | | | | | | | | | | | | | |
| Brown Group Holding LLC (Signature Aviation US Holdings, Inc.) | | | | | | | | | | | | | | |
| Incremental Term Loan B‑2 (1 mo. SOFR+ 3.75%) | | | 8.37% | | | | 07/01/2029 | | | | $ 824 | | | $ 825,346 |
| Term Loan (1 mo. USD LIBOR + 2.50%) | | | 7.13% | | | | 06/07/2028 | | | | 480 | | | 476,562 |
| Castlelake Aviation Ltd. | | | | | | | | | | | | | | |
| Term Loan (3 mo. USD LIBOR + 2.75%) | | | 7.52% | | | | 10/22/2026 | | | | 1,481 | | | 1,470,217 |
Term Loan(d) | | | - | | | | 10/22/2027 | | | | 1,066 | | | 1,056,063 |
| CEP IV Investment 16 S.a.r.l. (ADB Safegate) (Luxembourg), Term Loan B (3 mo. EURIBOR + 4.75%) | | | 6.72% | | | | 10/03/2026 | | | | EUR 161 | | | 144,134 |
| Dynasty Acquisition Co., Inc. | | | | | | | | | | | | | | |
| Term Loan B‑1 (1 mo. USD LIBOR + 3.50%) | | | 8.22% | | | | 04/08/2026 | | | | 254 | | | 249,355 |
| Term Loan B‑2 (1 mo. USD LIBOR + 3.50%) | | | 8.12% | | | | 04/08/2026 | | | | 136 | | | 133,176 |
| Gogo Intermediate Holdings LLC, Term Loan B (3 mo. USD LIBOR + 3.75%) | | | 8.70% | | | | 04/30/2028 | | | | 676 | | | 673,886 |
| Greenrock Finance, Inc. | | | | | | | | | | | | | | |
| Delayed Draw Term Loan (3 mo. SOFR + 4.25%) | | | 9.25% | | | | 06/21/2029 | | | | 109 | | | 108,057 |
| Term Loan B (3 mo. SOFR + 4.25%) | | | 8.93% | | | | 06/21/2029 | | | | 236 | | | 234,123 |
IAP Worldwide Services, Inc., Second Lien Term Loan (3 mo. USD LIBOR + 6.50%) (Acquired 07/18/2014‑02/08/2019; Cost $2,078,617)(e)(f) | | | 11.23% | | | | 07/18/2023 | | | | 2,085 | | | 2,085,084 |
| KKR Apple Bidco LLC | | | | | | | | | | | | | | |
| First Lien Term Loan (1 mo. SOFR + 2.75%) | | | 7.38% | | | | 09/22/2028 | | | | 520 | | | 517,915 |
| First Lien Term Loan (1 mo. SOFR+ 4.00%) | | | 8.62% | | | | 09/22/2028 | | | | 204 | | | 204,123 |
| Second Lien Term Loan (1 mo. USD LIBOR + 5.75%) | | | 10.38% | | | | 09/21/2029 | | | | 212 | | | 207,905 |
| Peraton Corp. | | | | | | | | | | | | | | |
| First Lien Term Loan B (1 mo. USD LIBOR + 3.75%) | | | 8.38% | | | | 02/01/2028 | | | | 155 | | | 153,673 |
| Second Lien Term Loan (1 mo. USD LIBOR + 7.75%) | | | 12.65% | | | | 02/01/2029 | | | | 1,296 | | | 1,273,587 |
| Propulsion (BC) Finco S.a.r.l. (Spain), Term Loan B (3 mo. SOFR + 4.00%) | | | 8.58% | | | | 09/13/2029 | | | | 353 | | | 350,889 |
Rand Parent LLC (Atlas Air), Term Loan B(d) | | | - | | | | 02/09/2030 | | | | 801 | | | 779,852 |
| Spirit AeroSystems, Inc., First Lien Term Loan (3 mo. SOFR + 4.50%) | | | 9.18% | | | | 01/14/2027 | | | | 857 | | | 859,128 |
| Transdigm, Inc. | | | | | | | | | | | | | | |
| Term Loan H (1 mo. SOFR + 3.25%) | | | 7.83% | | | | 02/28/2027 | | | | 68 | | | 68,580 |
| Term Loan I (1 mo. SOFR + 3.25%) | | | 7.82% | | | | 08/10/2028 | | | | 3,309 | | | 3,298,570 |
| | | | | | | | | | | | | | | 15,170,225 |
| | | | |
| Air Transport–4.08% | | | | | | | | | | | | | | |
| AAdvantage Loyalty IP Ltd. (American Airlines, Inc.), Term Loan (3 mo. USD LIBOR + 4.75%) | | | 9.56% | | | | 04/20/2028 | | | | 4,894 | | | 5,024,870 |
| Air Canada (Canada), Term Loan (3 mo. USD LIBOR + 3.50%) | | | 8.37% | | | | 08/11/2028 | | | | 999 | | | 1,000,020 |
American Airlines, Inc., Term Loan(d) | | | - | | | | 02/09/2028 | | | | 856 | | | 834,789 |
| Avolon TLB Borrower 1 (US) LLC, Term Loan B‑4 (1 mo. USD LIBOR + 1.50%) | | | 6.10% | | | | 02/12/2027 | | | | 185 | | | 183,434 |
| eTraveli Group (Sweden), Term Loan B‑1 (3 mo. EURIBOR + 4.00%) | | | 6.20% | | | | 08/02/2024 | | | | EUR 405 | | | 424,390 |
| Mileage Plus Holdings LLC/Mileage Plus Intellectual Property Assets Ltd., Term Loan (3 mo. USD LIBOR + 5.25%) | | | 10.00% | | | | 06/21/2027 | | | | 1,345 | | | 1,402,513 |
PrimeFlight Aviation Services, Inc., Term Loan (3 mo. SOFR + 5.50%)(e) | | | 10.30% | | | | 05/09/2024 | | | | 420 | | | 419,708 |
| SkyMiles IP Ltd. (Delta Air Lines, Inc.), Term Loan (3 mo. USD LIBOR + 3.75%) | | | 8.56% | | | | 10/20/2027 | | | | 683 | | | 707,739 |
| United Airlines, Inc., Term Loan B (3 mo. USD LIBOR + 3.75%) | | | 8.57% | | | | 04/21/2028 | | | | 4,601 | | | 4,605,397 |
| WestJet Airlines Ltd. (Canada), Term Loan (1 mo. USD LIBOR + 3.00%) | | | 7.59% | | | | 12/11/2026 | | | | 1,606 | | | 1,534,155 |
| | | | | | | | | | | | | | | 16,137,015 |
| | | | |
| Automotive–2.32% | | | | | | | | | | | | | | |
| Adient PLC, Term Loan B‑1 (1 mo. USD LIBOR + 3.25%) | | | 7.88% | | | | 04/10/2028 | | | | 1,252 | | | 1,252,892 |
| Autokiniton US Holdings, Inc., Term Loan B (1 mo. USD LIBOR + 4.50%) | | | 9.10% | | | | 04/06/2028 | | | | 1,900 | | | 1,888,518 |
See accompanying Notes to Financial Statements which are an integral part of the financial statements.
7 Invesco Senior Loan Fund
| | | | | | | | | | | | | | |
| | | Interest
Rate | | | Maturity
Date | | | Principal Amount (000)(a) | | | Value |
| Automotive–(continued) | | | | | | | | | | | | | | |
| BCA Marketplace (United Kingdom) | | | | | | | | | | | | | | |
| Second Lien Term Loan B (6 mo. SONIA + 7.50%) | | | 11.43% | | | | 07/27/2029 | | | | GBP 481 | | | $ 305,561 |
| Term Loan B (6 mo. SONIA + 4.75%) | | | 8.18% | | | | 07/28/2028 | | | | GBP 184 | | | 178,855 |
DexKo Global, Inc., First Lien Term Loan (1 mo. SOFR + 6.50%)(e) | | | 11.08% | | | | 10/04/2028 | | | | $ 184 | | | 175,361 |
| Driven Holdings LLC, Term Loan B (1 mo. USD LIBOR + 3.00%) | | | 7.74% | | | | 12/16/2028 | | | | 307 | | | 300,818 |
| First Brands Group Intermediate LLC | | | | | | | | | | | | | | |
| Term Loan B (6 mo. SOFR + 5.00%) | | | 10.25% | | | | 03/30/2027 | | | | 175 | | | 171,274 |
| Term Loan B (1 mo. SOFR + 5.00%) | | | 10.25% | | | | 03/30/2027 | | | | 1,232 | | | 1,180,291 |
| Garrett Borrowing LLC, Term Loan (3 mo. USD LIBOR + 3.25%) | | | 8.08% | | | | 04/30/2028 | | | | 288 | | | 285,261 |
| Highline Aftermarket Acquisition LLC, Term Loan (1 mo. USD LIBOR + 4.50%) | | | 9.13% | | | | 11/09/2027 | | | | 1,505 | | | 1,439,089 |
| Mavis Tire Express Services TopCo L.P., First Lien Term Loan (1 mo. SOFR + 4.00%) | | | 8.73% | | | | 05/04/2028 | | | | 1,598 | | | 1,550,524 |
| PowerStop LLC, Term Loan B (3 mo. USD LIBOR + 4.75%) | | | 9.70% | | | | 01/24/2029 | | | | 630 | | | 452,374 |
| | | | | | | | | | | | | | | 9,180,818 |
| | | | |
| Beverage & Tobacco–1.82% | | | | | | | | | | | | | | |
| AI Aqua Merger Sub, Inc. | | | | | | | | | | | | | | |
Delayed Draw Term Loan(d) | | | - | | | | 07/31/2028 | | | | 250 | | | 240,779 |
Incremental Term Loan B(d) | | | - | | | | 07/31/2028 | | | | 1,432 | | | 1,381,019 |
| Term Loan B (1 mo. USD LIBOR + 3.75%) | | | 8.32% | | | | 07/31/2028 | | | | 3,664 | | | 3,539,526 |
| Arctic Glacier U.S.A., Inc., Term Loan (3 mo. USD LIBOR + 3.50%) | | | 8.23% | | | | 03/20/2024 | | | | 772 | | | 718,472 |
| City Brewing Co. LLC, Term Loan B (1 mo. USD LIBOR + 3.50%) | | | 8.33% | | | | 03/31/2028 | | | | 1,391 | | | 687,858 |
| Naked Juice LLC (Tropicana), Second Lien Term Loan (3 mo. SOFR + 6.00%) | | | 10.68% | | | | 01/20/2030 | | | | 798 | | | 622,362 |
| | | | | | | | | | | | | | | 7,190,016 |
| | | | |
| Brokers, Dealers & Investment Houses–0.27% | | | | | | | | | | | | | | |
| AqGen Island Intermediate Holdings, Inc. | | | | | | | | | | | | | | |
| Second Lien Term Loan B (3 mo. USD LIBOR + 3.50%) | | | 8.25% | | | | 08/02/2028 | | | | 524 | | | 509,099 |
| Second Lien Term Loan B (3 mo. USD LIBOR + 6.50%) | | | 11.31% | | | | 08/05/2029 | | | | 21 | | | 18,641 |
| Zebra Buyer LLC, Term Loan (3 mo. SOFR + 4.00%) | | | 8.33% | | | | 11/01/2028 | | | | 540 | | | 541,779 |
| | | | | | | | | | | | | | | 1,069,519 |
| | | | |
| Building & Development–2.66% | | | | | | | | | | | | | | |
| Brookfield Retail Holdings VII Sub 3 LLC, Term Loan B (3 mo. USD LIBOR + 2.50%) | | | 7.22% | | | | 08/27/2025 | | | | 156 | | | 155,013 |
| Empire Today LLC, Term Loan B (1 mo. USD LIBOR + 5.00%) | | | 9.60% | | | | 04/01/2028 | | | | 1,677 | | | 1,359,070 |
| Icebox Holdco III, Inc. | | | | | | | | | | | | | | |
| First Lien Term Loan (3 mo. USD LIBOR + 3.50%) | | | 8.23% | | | | 12/22/2028 | | | | 989 | | | 939,493 |
Second Lien Term Loan (3 mo. USD LIBOR + 6.75%)(e) | | | 11.48% | | | | 12/21/2029 | | | | 302 | | | 269,659 |
LBM Holdings LLC, First Lien Term Loan(d) | | | - | | | | 12/17/2027 | | | | 1 | | | 1,032 |
| LHS Borrow LLC (Leaf Home Solutions), Term Loan (1 mo. SOFR + 4.75%) | | | 9.47% | | | | 02/16/2029 | | | | 2,003 | | | 1,654,924 |
Mayfair Mall LLC, Term Loan (1 mo. USD LIBOR + 3.25%)(e) | | | 7.37% | | | | 04/20/2023 | | | | 556 | | | 508,793 |
| Oldcastle BuildingEnvelope, Inc., Term Loan B (3 mo. SOFR + 4.50%) | | | 9.18% | | | | 04/29/2029 | | | | 1,238 | | | 1,202,122 |
| Quikrete Holdings, Inc. | | | | | | | | | | | | | | |
| First Lien Term Loan (3 mo. USD LIBOR + 2.63%) | | | 7.26% | | | | 02/01/2027 | | | | 611 | | | 606,306 |
| Term Loan B (1 mo. USD LIBOR + 3.00%) | | | 7.63% | | | | 06/11/2028 | | | | 1,285 | | | 1,282,352 |
| Re/Max LLC, Term Loan (1 mo. USD LIBOR + 2.50%) | | | 7.19% | | | | 07/21/2028 | | | | 1,385 | | | 1,326,327 |
| SRS Distribution, Inc., Term Loan (3 mo. SOFR + 3.50%) | | | 7.97% | | | | 06/02/2028 | | | | 191 | | | 184,460 |
| TAMKO Building Products LLC, Term Loan (3 mo. USD LIBOR + 3.00%) | | | 7.73% | | | | 05/29/2026 | | | | 165 | | | 163,558 |
| Werner FinCo L.P., Term Loan (3 mo. USD LIBOR + 4.00%) | | | 8.73% | | | | 07/24/2024 | | | | 906 | | | 850,201 |
| | | | | | | | | | | | | | | 10,503,310 |
| | | | |
| Business Equipment & Services–12.00% | | | | | | | | | | | | | | |
| Aegion Corp., Term Loan (1 mo. USD LIBOR + 4.75%) | | | 9.38% | | | | 05/17/2028 | | | | 485 | | | 473,815 |
See accompanying Notes to Financial Statements which are an integral part of the financial statements.
8 Invesco Senior Loan Fund
| | | | | | | | | | | | | | |
| | | Interest
Rate | | | Maturity
Date | | | Principal Amount (000)(a) | | | Value |
| Business Equipment & Services–(continued) | | | | | | | | | | | | | | |
| Allied Universal Holdco LLC (USAGM Holdco LLC/UNSEAM) | | | | | | | | | | | | | | |
| Term Loan (1 mo. USD LIBOR + 3.75%) | | | 8.47% | | | | 05/12/2028 | | | | $ 1,269 | | | $ 1,224,411 |
| Term Loan B (3 mo. EURIBOR + 3.75%) | | | 6.18% | | | | 05/12/2028 | | | | EUR 110 | | | 110,505 |
| Asurion LLC (fka Asurion Corp.), Term Loan B‑7 (1 mo. USD LIBOR + 3.00%) | | | 7.63% | | | | 11/03/2024 | | | | 200 | | | 199,862 |
| Camelot Finance L.P. | | | | | | | | | | | | | | |
| Incremental Term Loan (1 mo. USD LIBOR + 3.00%) | | | 7.63% | | | | 10/30/2026 | | | | 1,637 | | | 1,633,665 |
| Term Loan (1 mo. USD LIBOR + 3.00%) | | | 7.63% | | | | 10/30/2026 | | | | 1,154 | | | 1,151,429 |
Checkout Holding Corp., Term Loan(d) | | | - | | | | 06/30/2023 | | | | 18 | | | 18,241 |
| Cimpress USA, Inc., Term Loan B (1 mo. USD LIBOR + 3.50%) | | | 8.13% | | | | 05/17/2028 | | | | 741 | | | 673,442 |
| Constant Contact | | | | | | | | | | | | | | |
| Second Lien Term Loan (3 mo. USD LIBOR + 7.50%) | | | 12.31% | | | | 02/15/2029 | | | | 587 | | | 491,243 |
| Term Loan B (1 mo. USD LIBOR + 4.00%) | | | 8.81% | | | | 02/10/2028 | | | | 1,355 | | | 1,284,772 |
| Corp. Service Co., Term Loan B (1 mo. SOFR + 3.25%) | | | 7.97% | | | | 08/08/2029 | | | | 749 | | | 750,518 |
| CRCI Longhorn Holdings, Inc., Second Lien Term Loan (1 mo. USD LIBOR + 7.25%) | | | 11.88% | | | | 08/08/2026 | | | | 72 | | | 67,269 |
Creation Technologies, Inc., Term Loan B (3 mo. USD LIBOR + 5.50%)(e) | | | 10.28% | | | | 10/05/2028 | | | | 750 | | | 647,119 |
| Dakota Holding Corp., Second Lien Term Loan (1 mo. USD LIBOR + 6.75%) | | | 11.38% | | | | 04/07/2028 | | | | 353 | | | 331,589 |
| Dun & Bradstreet Corp. (The) | | | | | | | | | | | | | | |
| Incremental Term Loan B‑2 (1 mo. SOFR + 3.25%) | | | 7.85% | | | | 01/18/2029 | | | | 412 | | | 410,666 |
Revolver Loan (1 mo. USD LIBOR + 3.00%)(e) | | | 4.06% | | | | 09/11/2025 | | | | 312 | | | 308,501 |
Revolver Loan(e)(g) | | | 0.00% | | | | 09/11/2025 | | | | 1,808 | | | 1,789,307 |
| Term Loan (1 mo. USD LIBOR + 3.25%) | | | 7.87% | | | | 02/06/2026 | | | | 818 | | | 816,652 |
| Garda World Security Corp. (Canada) | | | | | | | | | | | | | | |
| Incremental Term Loan (1 mo. SOFR + 4.25%) | | | 8.81% | | | | 02/01/2029 | | | | 1,282 | | | 1,276,684 |
| Term Loan B‑2 (1 mo. USD LIBOR + 4.25%) | | | 8.91% | | | | 10/30/2026 | | | | 1,714 | | | 1,714,913 |
| GI Revelation Acquisition LLC, First Lien Term Loan (1 mo. USD LIBOR + 4.00%) | | | 8.63% | | | | 05/12/2028 | | | | 2,690 | | | 2,577,879 |
| Grandir (The Education Group) (France) | | | | | | | | | | | | | | |
| Delayed Draw Term Loan (3 mo. EURIBOR + 4.00%) | | | 6.70% | | | | 09/29/2028 | | | | EUR 35 | | | 35,772 |
| Term Loan B‑1 (3 mo. EURIBOR + 4.00%) | | | 6.70% | | | | 09/29/2028 | | | | EUR 209 | | | 214,633 |
| ION Trading Technologies S.a.r.l. (Luxembourg), Term Loan B (3 mo. EURIBOR + 4.25%) | | | 6.45% | | | | 04/01/2028 | | | | EUR 521 | | | 524,858 |
| Karman Buyer Corp., First Lien Term Loan B‑1 (1 mo. USD LIBOR + 4.50%) | | | 9.29% | | | | 10/28/2027 | | | | 1,620 | | | 1,339,672 |
| Konecta (Kronosnet CX Bidco 2022, S.L.) (Spain), Term Loan (3 mo. EURIBOR + 5.75%) | | | 8.20% | | | | 09/30/2029 | | | | EUR 102 | | | 100,725 |
| Monitronics International, Inc. | | | | | | | | | | | | | | |
Term Loan (3 mo. USD LIBOR + 7.50%)
(Acquired 08/30/2019‑01/28/2021; Cost $ 4,885,682)(f) | | | 12.33% | | | | 03/29/2024 | | | | 5,065 | | | 3,317,445 |
Term Loan (1 mo. USD LIBOR + 6.00%) (Acquired 08/28/2019‑04/27/2022; Cost $ 3,132,623)(e)(f) | | | 10.83% | | | | 07/03/2024 | | | | 3,129 | | | 2,972,275 |
| NAS LLC (d.b.a. Nationwide Marketing Group) | | | | | | | | | | | | | | |
Incremental Term Loan (3 mo. SOFR + 6.50%)(e) | | | 11.23% | | | | 06/03/2024 | | | | 1,725 | | | 1,699,529 |
Revolver Loan (1 mo. SOFR + 6.50%)(e) | | | 0.50% | | | | 06/03/2024 | | | | 103 | | | 101,179 |
Revolver Loan(e)(g) | | | 0.00% | | | | 06/03/2024 | | | | 411 | | | 404,714 |
Term Loan (3 mo. SOFR + 6.50%)(e) | | | 11.23% | | | | 06/03/2024 | | | | 4,970 | | | 4,895,101 |
Term Loan (3 mo. SOFR + 6.50%)(e) | | | 11.23% | | | | 06/03/2024 | | | | 944 | | | 929,934 |
| OCM System One Buyer CTB LLC, Term Loan (1 mo. USD LIBOR + 4.00%) | | | 8.73% | | | | 03/02/2028 | | | | 735 | | | 731,758 |
Orchid Merger Sub II LLC, Term Loan (6 mo. SOFR + 4.75%)(e) | | | 9.48% | | | | 07/27/2027 | | | | 1,618 | | | 1,399,470 |
Protect America, Revolver Loan(d)(e) | | | - | | | | 09/01/2024 | | | | 848 | | | 788,764 |
| QA Group (IndigoCyan) (Jersey), Term Loan B (3 mo. GBP LIBOR + 4.75%) | | | 8.80% | | | | 06/23/2024 | | | | GBP 2,109 | | | 2,446,891 |
| Sitel Worldwide Corp., Term Loan (1 mo. USD LIBOR + 3.75%) | | | 8.39% | | | | 08/28/2028 | | | | 204 | | | 203,944 |
| Skillsoft Corp., Term Loan (1 mo. SOFR + 4.75%) | | | 9.93% | | | | 07/14/2028 | | | | 588 | | | 510,036 |
| Solera (Polaris Newco LLC), Term Loan B (1 mo. SONIA + 5.25%) | | | 9.18% | | | | 06/05/2028 | | | | GBP 234 | | | 262,484 |
| Spin Holdco, Inc., Term Loan (3 mo. USD LIBOR + 4.00%) | | | 8.77% | | | | 03/04/2028 | | | | 3,959 | | | 3,353,774 |
| Tempo Acquisition LLC, Term Loan B (1 mo. SOFR + 3.00%) | | | 7.62% | | | | 08/31/2028 | | | | 33 | | | 32,544 |
See accompanying Notes to Financial Statements which are an integral part of the financial statements.
9 Invesco Senior Loan Fund
| | | | | | | | | | | | | | |
| | | Interest
Rate | | | Maturity
Date | | | Principal Amount (000)(a) | | | Value |
| Business Equipment & Services–(continued) | | | | | | | | | | | | | | |
| Thermostat Purchaser III, Inc. | | | | | | | | | | | | | | |
First Lien Delayed Draw Term Loan(e)(g) | | | 0.00% | | | | 08/31/2028 | | | | $ 78 | | | $ 74,968 |
Term Loan B(d)(e) | | | - | | | | 08/30/2028 | | | | 501 | | | 480,373 |
| Thevelia (US) LLC, First Lien Term Loan B (3 mo. SOFR+ 4.00%) | | | 8.73% | | | | 06/17/2029 | | | | 769 | | | 753,060 |
UnitedLex Corp., Term Loan (1 mo. USD LIBOR + 5.75%)(e) | | | 10.35% | | | | 03/20/2027 | | | | 528 | | | 486,119 |
| Virtusa Corp. | | | | | | | | | | | | | | |
| Incremental Term Loan B (1 mo. SOFR + 3.75%) | | | 8.47% | | | | 02/08/2029 | | | | 204 | | | 202,888 |
| Term Loan (1 mo. USD LIBOR + 3.75%) | | | 8.38% | | | | 02/11/2028 | | | | 654 | | | 651,957 |
| WebHelp (France), Term Loan B (1 mo. USD LIBOR + 4.00%) | | | 8.05% | | | | 08/04/2028 | | | | 623 | | | 604,402 |
| | | | | | | | | | | | | | | 47,471,751 |
| | | | |
| Cable & Satellite Television–1.75% | | | | | | | | | | | | | | |
Altice Financing S.A. (Luxembourg), Term Loan (3 mo. SOFR + 5.00%)(e) | | | 9.57% | | | | 10/31/2027 | | | | 322 | | | 321,330 |
| Atlantic Broadband Finance LLC, Incremental Term Loan B (1 mo. USD LIBOR + 2.50%) | | | 7.13% | | | | 09/01/2028 | | | | 100 | | | 98,615 |
| CSC Holdings LLC, Term Loan B (1 mo. SOFR + 4.50%) | | | 9.06% | | | | 01/15/2028 | | | | 926 | | | 869,158 |
| Numericable‑SFR S.A. (France) | | | | | | | | | | | | | | |
| Incremental Term Loan B‑13 (3 mo. USD LIBOR + 4.00%) | | | 8.86% | | | | 08/14/2026 | | | | 527 | | | 513,443 |
| Term Loan B‑11 (3 mo. USD LIBOR + 2.75%) | | | 7.58% | | | | 07/31/2025 | | | | 151 | | | 149,503 |
| ORBCOMM, Inc., Term Loan B (1 mo. USD LIBOR + 4.25%) | | | 8.88% | | | | 09/01/2028 | | | | 218 | | | 178,006 |
| Telenet - LG, Term Loan AR (6 mo. USD LIBOR + 2.00%) | | | 6.59% | | | | 04/30/2028 | | | | 205 | | | 200,327 |
| UPC - LG | | | | | | | | | | | | | | |
| Term Loan AT (1 mo. USD LIBOR + 2.25%) | | | 6.84% | | | | 04/30/2028 | | | | 193 | | | 189,859 |
| Term Loan AX (1 mo. USD LIBOR + 2.93%) | | | 7.51% | | | | 01/31/2029 | | | | 1,980 | | | 1,957,040 |
| Virgin Media 02 - LG (United Kingdom), Term Loan Q (1 mo. USD LIBOR + 3.25%) | | | 7.84% | | | | 01/31/2029 | | | | 2,443 | | | 2,435,408 |
| Vodafone Ziggo - LG, Term Loan I (1 mo. USD LIBOR + 2.50%) | | | 7.09% | | | | 04/30/2028 | | | | 27 | | | 26,198 |
| | | | | | | | | | | | | | | 6,938,887 |
| | | | |
| Chemicals & Plastics–4.02% | | | | | | | | | | | | | | |
| AkzoNoble Chemicals, Term Loan (3 mo. USD LIBOR + 2.75%) | | | 7.53% | | | | 10/01/2025 | | | | 850 | | | 846,581 |
| Aruba Investments, Inc., Second Lien Term Loan (1 mo. USD LIBOR + 7.75%) | | | 12.38% | | | | 11/24/2028 | | | | 611 | | | 555,747 |
| Arxada (Switzerland) | | | | | | | | | | | | | | |
| Term Loan B (3 mo. EURIBOR + 4.00%) | | | 6.20% | | | | 07/03/2028 | | | | EUR 184 | | | 183,570 |
| Term Loan B (3 mo. USD LIBOR + 4.00%) | | | 8.73% | | | | 07/03/2028 | | | | 121 | | | 114,835 |
| Ascend Performance Materials Operations LLC, Term Loan (6 mo. SOFR + 4.75%) | | | 8.83% | | | | 08/27/2026 | | | | 2,488 | | | 2,488,482 |
| Axalta Coating Systems U.S. Holdings, Inc., Term Loan B‑4 (1 mo. SOFR + 3.00%) | | | 7.51% | | | | 12/20/2029 | | | | 1,132 | | | 1,138,175 |
| BASF Construction Chemicals (Germany), Term Loan B‑3 (3 mo. USD LIBOR + 3.50%) | | | 7.17% | | | | 09/29/2027 | | | | 547 | | | 546,667 |
| BES (Discovery Purchaser Corp.) | | | | | | | | | | | | | | |
| First Lien Term Loan (1 mo. SOFR + 7.00%) | | | 11.59% | | | | 08/03/2030 | | | | 347 | | | 318,673 |
| Second Lien Term Loan (3 mo. SOFR + 4.38%) | | | 8.96% | | | | 10/03/2029 | | | | 420 | | | 403,180 |
Caldic (Pearls BidCo) (Netherlands), Term Loan B(d) | | | - | | | | 02/26/2029 | | | | 263 | | | 259,198 |
Charter NEX US, Inc., Term Loan B(d) | | | - | | | | 12/01/2027 | | | | 862 | | | 849,547 |
| Colouroz Investment LLC (Germany) | | | | | | | | | | | | | | |
PIK First Lien Term Loan C, 0.75% PIK Rate, 8.57% Cash Rate(h) | | | 0.75% | | | | 09/21/2023 | | | | 1 | | | 1,013 |
PIK First Lien Term Loan, 0.75% PIK Rate, 5.75% Cash Rate(h) | | | 0.75% | | | | 09/21/2023 | | | | EUR 0 | | | 64 |
PIK Second Lien Term Loan B‑2, 5.75% PIK Rate, 9.07% Cash Rate(h) | | | 5.75% | | | | 09/21/2024 | | | | 26 | | | 13,502 |
| Cyanco Intermediate 2 Corp., First Lien Term Loan (3 mo. USD LIBOR + 3.50%) | | | 8.13% | | | | 03/16/2025 | | | | 133 | | | 131,173 |
| Eastman Tire Additives (River Buyer, Inc.), First Lien Term Loan (1 mo. USD LIBOR + 5.25%) | | | 9.98% | | | | 11/01/2028 | | | | 1,523 | | | 1,390,548 |
| Fusion (Fusion UK Holding Ltd. & US HoldCo VAD, Inc.), Term Loan B (3 mo. SOFR+ 3.75%) | | | 8.30% | | | | 05/28/2029 | | | | 175 | | | 166,448 |
H.B. Fuller Co., Term Loan B(d) | | | - | | | | 02/08/2030 | | | | 354 | | | 356,936 |
| ICP Group Holdings LLC, First Lien Term Loan (3 mo. USD LIBOR + 3.75%) | | | 8.48% | | | | 12/29/2027 | | | | 523 | | | 442,875 |
| Ineos US Finance LLC | | | | | | | | | | | | | | |
Term Loan(d) | | | - | | | | 11/08/2027 | | | | 485 | | | 484,787 |
Term Loan(d) | | | - | | | | 02/09/2030 | | | | 755 | | | 750,448 |
See accompanying Notes to Financial Statements which are an integral part of the financial statements.
10 Invesco Senior Loan Fund
| | | | | | | | | | | | | | |
| | | Interest
Rate | | | Maturity
Date | | | Principal Amount (000)(a) | | | Value |
| Chemicals & Plastics–(continued) | | | | | | | | | | | | | | |
| Kersia International S.A.S. (Belgium), Term Loan B (3 mo. EURIBOR + 3.93%) | | | 6.13% | | | | 12/23/2027 | | | | EUR 187 | | | $ 184,915 |
| Lummus Technology (Illuminate Buyer LLC), Term Loan B (1 mo. USD LIBOR + 3.50%) | | | 8.13% | | | | 06/30/2027 | | | | $ 63 | | | 61,438 |
| Nobian Finance B.V., Term Loan B (3 mo. EURIBOR + 3.20%) | | | 5.40% | | | | 07/01/2026 | | | | EUR 789 | | | 796,498 |
| Potters Industries LLC, Term Loan B (3 mo. USD LIBOR + 4.00%) | | | 8.73% | | | | 12/14/2027 | | | | 425 | | | 425,511 |
| Proampac PG Borrower LLC, First Lien Term Loan (1 mo. USD LIBOR + 3.75%) | | | 8.58% | | | | 11/03/2025 | | | | 295 | | | 290,610 |
Quantix, Term Loan (3 mo. SOFR + 6.25%)(e) | | | 10.99% | | | | 05/03/2025 | | | | 2,014 | | | 1,973,694 |
| Timber Servicios Empresariales S.A. (Spain), Term Loan B (3 mo. EURIBOR + 4.75%) | | | 6.61% | | | | 02/17/2029 | | | | EUR 173 | | | 160,336 |
| W.R. Grace & Co., Term Loan B (3 mo. USD LIBOR + 3.75%) | | | 8.50% | | | | 09/22/2028 | | | | 570 | | | 567,760 |
| | | | | | | | | | | | | | | 15,903,211 |
| | | | |
| Clothing & Textiles–0.95% | | | | | | | | | | | | | | |
| ABG Intermediate Holdings 2 LLC | | | | | | | | | | | | | | |
| First Lien Term Loan B‑1 (1 mo. SOFR + 3.50%) | | | 8.22% | | | | 12/21/2028 | | | | 2,266 | | | 2,229,004 |
| Second Lien Term Loan (1 mo. SOFR + 6.00%) | | | 10.72% | | | | 12/20/2029 | | | | 405 | | | 376,490 |
| BK LC Lux SPV S.a.r.l. (Birkenstock), Term Loan B (1 mo. USD LIBOR + 3.25%) | | | 8.06% | | | | 04/28/2028 | | | | 1,101 | | | 1,094,651 |
| International Textile Group, Inc., First Lien Term Loan (3 mo. USD LIBOR + 5.00%) | | | 9.21% | | | | 05/01/2024 | | | | 117 | | | 74,687 |
| | | | | | | | | | | | | | | 3,774,832 |
| | | | |
| Conglomerates–0.27% | | | | | | | | | | | | | | |
| APi Group DE, Inc., Incremental Term Loan (1 mo. USD LIBOR + 2.75%) | | | 7.38% | | | | 01/03/2029 | | | | 474 | | | 474,151 |
| CeramTec (CTEC III GmbH) (Germany), Term Loan B (3 mo. EURIBOR + 3.75%) | | | 6.45% | | | | 03/16/2029 | | | | EUR 234 | | | 239,497 |
| Safe Fleet Holdings LLC | | | | | | | | | | | | | | |
Incremental First Lien Term Loan (1 mo. SOFR + 5.00%)(e) | | | 9.66% | | | | 02/23/2029 | | | | 170 | | | 168,880 |
| Second Lien Term Loan (3 mo. USD LIBOR + 6.75%) | | | 11.39% | | | | 02/02/2026 | | | | 192 | | | 175,097 |
| | | | | | | | | | | | | | | 1,057,625 |
| | | | |
| Containers & Glass Products–3.10% | | | | | | | | | | | | | | |
| Berlin Packaging LLC, Term Loan B‑5 (1 mo. USD LIBOR + 3.75%) | | | 8.48% | | | | 03/11/2028 | | | | 994 | | | 976,390 |
| Brook & Whittle Holding Corp., First Lien Term Loan (3 mo. SOFR + 4.00%) | | | 9.04% | | | | 12/14/2028 | | | | 603 | | | 553,305 |
Duran Group (Germany), Term Loan B‑2 (3 mo. USD LIBOR + 3.75%)
(Acquired 03/24/2017‑03/03/2021; Cost $2,491,825)(e)(f) | | | 7.88% | | | | 03/29/2024 | | | | 2,498 | | | 2,413,269 |
| Keter Group B.V. (Netherlands) | | | | | | | | | | | | | | |
Term Loan B‑1 (3 mo. EURIBOR + 4.25%) (Acquired 04/29/2022‑02/21/2023; Cost $822,770)(f) | | | 6.74% | | | | 10/31/2023 | | | | EUR 896 | | | 747,280 |
Term Loan B‑3 (3 mo. EURIBOR + 4.25%) (Acquired 02/21/2023; Cost $361,840)(f) | | | 6.20% | | | | 10/31/2023 | | | | EUR 425 | | | 354,757 |
| LABL, Inc. (Multi-Color), Term Loan (1 mo. USD LIBOR + 5.00%) | | | 9.63% | | | | 10/29/2028 | | | | 2,095 | | | 2,049,633 |
Libbey Glass, Inc., First Lien Term Loan (3 mo. SOFR + 3.75%)
(Acquired 11/22/2022‑02/22/2023; Cost $1,595,402)(f) | | | 4.75% | | | | 11/22/2027 | | | | 1,708 | | | 1,643,711 |
| Logoplaste (Mar Bidco S.a.r.l.) (Portugal), Term Loan B (1 mo. USD LIBOR + 4.30%) | | | 9.03% | | | | 07/07/2028 | | | | 418 | | | 388,358 |
| Mold-Rite Plastics LLC (Valcour Packaging LLC) | | | | | | | | | | | | | | |
First Lien Term Loan (1 mo. USD LIBOR + 3.75%)(e) | | | 7.98% | | | | 10/04/2028 | | | | 542 | | | 475,284 |
Second Lien Term Loan (6 mo. USD LIBOR + 7.00%)(e) | | | 11.23% | | | | 10/04/2029 | | | | 224 | | | 156,688 |
| Refresco Group N.V. (Netherlands), Term Loan B (3 mo. SOFR + 4.25%) | | | 9.01% | | | | 07/12/2029 | | | | 2,525 | | | 2,516,384 |
| | | | | | | | | | | | | | | 12,275,059 |
| | | | |
| Cosmetics & Toiletries–1.53% | | | | | | | | | | | | | | |
| Bausch and Lomb, Inc., Term Loan (1 mo. SOFR + 3.25%) | | | 7.84% | | | | 05/10/2027 | | | | 2,438 | | | 2,389,757 |
| Coty, Inc., Term Loan B (3 mo. USD LIBOR + 2.25%) | | | 6.84% | | | | 04/05/2025 | | | | 2,747 | | | 2,744,000 |
| Rodenstock (Germany), Term Loan B (3 mo. EURIBOR + 5.00%) | | | 7.49% | | | | 06/29/2028 | | | | EUR 765 | | | 693,376 |
| Wella (Rainbow FinCo S.a.r.l.), Term Loan B (6 mo. EURIBOR + 3.50%) | | | 6.70% | | | | 02/24/2029 | | | | EUR 220 | | | 224,204 |
| | | | | | | | | | | | | | | 6,051,337 |
See accompanying Notes to Financial Statements which are an integral part of the financial statements.
11 Invesco Senior Loan Fund
| | | | | | | | | | | | | | |
| | | Interest
Rate | | | Maturity
Date | | | Principal Amount (000)(a) | | | Value |
| Drugs–0.00% | | | | | | | | | | | | | | |
| Grifols Worldwide Operations USA, Inc., Term Loan B (1 mo. USD LIBOR + 2.00%) | | | 6.63% | | | | 11/15/2027 | | | | $ 5 | | | $ 4,641 |
| | | | |
| Ecological Services & Equipment–1.22% | | | | | | | | | | | | | | |
| Anticimex (Sweden) | | | | | | | | | | | | | | |
| First Lien Term Loan (3 mo. SOFR + 4.75%) | | | 9.74% | | | | 11/16/2028 | | | | 236 | | | 233,519 |
| Term Loan B‑4 (3 mo. USD LIBOR + 4.00%) | | | 8.95% | | | | 11/16/2028 | | | | 412 | | | 410,363 |
| EnergySolutions LLC, Term Loan (3 mo. USD LIBOR + 3.75%) | | | 8.48% | | | | 05/11/2025 | | | | 1,031 | | | 998,691 |
| GFL Environmental, Inc. (Canada), Term Loan B (1 mo. SOFR + 3.00%) | | | 7.72% | | | | 05/28/2027 | | | | 412 | | | 413,491 |
| Groundworks LLC | | | | | | | | | | | | | | |
Delayed Draw Term Loan (3 mo. USD LIBOR + 4.75%)(e) | | | 9.48% | | | | 01/17/2026 | | | | 28 | | | 28,067 |
Delayed Draw Term Loan (3 mo. USD LIBOR + 4.75%)(e) | | | 9.48% | | | | 01/17/2026 | | | | 1,086 | | | 1,085,725 |
Delayed Draw Term Loan(e)(g) | | | 0.00% | | | | 01/17/2026 | | | | 223 | | | 223,250 |
Term Loan (3 mo. USD LIBOR + 4.75%)(e) | | | 9.48% | | | | 01/17/2026 | | | | 50 | | | 49,779 |
Term Loan(e)(g) | | | 0.00% | | | | 03/14/2029 | | | | 50 | | | 48,384 |
Term Loan(e)(g) | | | 0.00% | | | | 03/14/2030 | | | | 156 | | | 151,199 |
| OGF (France), Term Loan B‑2 (6 mo. EURIBOR + 4.75%) | | | 7.11% | | | | 12/31/2025 | | | | EUR 166 | | | 163,536 |
| Patriot Container Corp., First Lien Term Loan (1 mo. USD LIBOR + 3.75%) | | | 8.47% | | | | 03/20/2025 | | | | 437 | | | 411,714 |
TruGreen L.P., Second Lien Term Loan (1 mo. USD LIBOR + 8.50%)(e) | | | 13.33% | | | | 11/02/2028 | | | | 827 | | | 595,587 |
| | | | | | | | | | | | | | | 4,813,305 |
| | | | |
| Electronics & Electrical–11.19% | | | | | | | | | | | | | | |
| Altar BidCo, Inc. (Brooks Automation, Inc.), Second Lien Term Loan (6 mo. SOFR + 5.60%) | | | 10.49% | | | | 02/01/2030 | | | | 206 | | | 182,400 |
| AppLovin Corp., Term Loan (3 mo. SOFR + 3.00%) | | | 9.50% | | | | 10/25/2028 | | | | 980 | | | 972,497 |
| Boxer Parent Co., Inc., Term Loan B (1 mo. EURIBOR + 4.00%) | | | 6.43% | | | | 10/02/2025 | | | | EUR 20 | | | 20,799 |
| Brave Parent Holdings, Inc., First Lien Term Loan (3 mo. USD LIBOR + 4.00%) | | | 8.63% | | | | 04/18/2025 | | | | 446 | | | 441,129 |
| CDK Global, Inc., First Lien Term Loan (3 mo. SOFR+ 4.50%) | | | 9.08% | | | | 07/06/2029 | | | | 837 | | | 835,463 |
| CommerceHub, Inc., Term Loan B (3 mo. USD LIBOR + 4.00%) | | | 8.78% | | | | 01/01/2028 | | | | 767 | | | 733,839 |
| CommScope, Inc., Term Loan (1 mo. USD LIBOR + 3.25%) | | | 7.88% | | | | 04/06/2026 | | | | 629 | | | 611,895 |
| ConnectWise LLC, Term Loan (3 mo. USD LIBOR + 3.50%) | | | 8.13% | | | | 10/01/2028 | | | | 340 | | | 324,112 |
Cornerstone OnDemand, First Lien Term Loan (1 mo. USD LIBOR + 3.75%) (Acquired 09/21/2021; Cost $451,629)(f) | | | 8.38% | | | | 10/16/2028 | | | | 453 | | | 420,516 |
| Delta Topco, Inc. (Infoblox, Inc.) | | | | | | | | | | | | | | |
| First Lien Term Loan (3 mo. USD LIBOR + 3.75%) | | | 8.15% | | | | 12/01/2027 | | | | 382 | | | 356,761 |
| Second Lien Term Loan (3 mo. USD LIBOR + 7.25%) | | | 11.65% | | | | 12/01/2028 | | | | 358 | | | 315,589 |
| Diebold Nixdorf, Inc. | | | | | | | | | | | | | | |
| Term Loan (1 mo. SOFR + 5.25%) | | | 10.48% | | | | 07/15/2025 | | | | 782 | | | 534,503 |
| Term Loan (1 mo. SOFR + 6.40%) | | | 11.63% | | | | 07/15/2025 | | | | 307 | | | 320,662 |
Digi International, Inc., Term Loan (6 mo. USD LIBOR + 5.00%)(e) | | | 9.63% | | | | 11/01/2028 | | | | 784 | | | 785,055 |
| E2Open LLC, Term Loan (3 mo. USD LIBOR + 3.50%) | | | 8.08% | | | | 02/04/2028 | | | | 1,370 | | | 1,364,981 |
| Emerald Technologies AcquisitionCo, Inc., Term Loan B (1 mo. SOFR + 6.25%) | | | 10.97% | | | | 12/29/2027 | | | | 196 | | | 184,114 |
| ETA Australia Holdings III Pty. Ltd. (Australia), First Lien Term Loan (1 mo. USD LIBOR + 4.00%) | | | 8.62% | | | | 05/06/2026 | | | | 82 | | | 78,883 |
| EverCommerce, Term Loan B (1 mo. USD LIBOR + 3.25%) | | | 7.88% | | | | 07/01/2028 | | | | 505 | | | 504,052 |
| Forcepoint, Term Loan (3 mo. USD LIBOR + 4.25%) | | | 9.08% | | | | 01/07/2028 | | | | 292 | | | 275,869 |
| Go Daddy Operating Co. LLC, Term Loan (1 mo. SOFR + 3.25%) | | | 8.06% | | | | 11/09/2029 | | | | 70 | | | 69,712 |
| GoTo Group, Inc. (LogMeIn), First Lien Term Loan (1 mo. USD LIBOR + 4.75%) | | | 9.38% | | | | 08/31/2027 | | | | 3,666 | | | 2,033,969 |
| Imperva, Inc., Second Lien Term Loan (3 mo. USD LIBOR + 7.75%) | | | 12.65% | | | | 01/11/2027 | | | | 988 | | | 740,683 |
| Inetum (Granite Fin Bidco SAS) (France), Term Loan B (3 mo. EURIBOR + 5.00%) | | | 7.06% | | | | 10/17/2028 | | | | EUR 274 | | | 276,845 |
| Infinite Electronics, Second Lien Term Loan (3 mo. USD LIBOR + 7.00%) | | | 11.73% | | | | 03/02/2029 | | | | 253 | | | 228,130 |
| Informatica Corp., Term Loan (1 mo. USD LIBOR + 2.75%) | | | 7.44% | | | | 10/15/2028 | | | | 355 | | | 355,286 |
| Learning Pool (Brook Bidco Ltd.) (United Kingdom) | | | | | | | | | | | | | | |
Term Loan (1 mo. SONIA + 7.25%)(e) | | | 10.80% | | | | 08/17/2028 | | | | GBP 319 | | | 375,519 |
Term Loan 2(d)(e) | | | - | | | | 08/17/2028 | | | | 411 | | | 394,283 |
Marcel Bidco LLC, Term Loan (1 mo. USD LIBOR + 4.00%)(e) | | | 8.42% | | | | 12/31/2027 | | | | 93 | | | 92,488 |
See accompanying Notes to Financial Statements which are an integral part of the financial statements.
12 Invesco Senior Loan Fund
| | | | | | | | | | | | | | |
| | | Interest
Rate | | | Maturity
Date | | | Principal Amount (000)(a) | | | Value |
| Electronics & Electrical–(continued) | | | | | | | | | | | | | | |
| Mavenir Systems, Inc., Term Loan B (3 mo. USD LIBOR + 4.75%) | | | 9.65% | | | | 08/13/2028 | | | | $ 1,661 | | | $ 1,121,294 |
Maverick Bidco, Inc. (Mitratech), Second Lien Term Loan (3 mo. USD LIBOR + 6.75%)(e) | | | 11.58% | | | | 05/18/2029 | | | | 49 | | | 44,265 |
| McAfee Enterprise | | | | | | | | | | | | | | |
| Second Lien Term Loan (1 mo. USD LIBOR + 8.25%) | | | 13.08% | | | | 07/27/2029 | | | | 628 | | | 495,594 |
| Term Loan B (1 mo. USD LIBOR + 4.75%) | | | 9.58% | | | | 07/27/2028 | | | | 605 | | | 517,511 |
| McAfee LLC, Term Loan B‑1 (1 mo. SOFR + 4.50%) | | | 8.42% | | | | 03/01/2029 | | | | 2,363 | | | 2,220,170 |
Natel Engineering Co., Inc., Term Loan (3 mo. USD LIBOR + 6.25%) (Acquired 04/25/2019‑02/01/2022; Cost $2,054,868)(f) | | | 10.42% | | | | 04/29/2026 | | | | 2,084 | | | 1,870,370 |
Native Instruments (Germany), Term Loan (3 mo. EURIBOR + 6.00%)(e) | | | 7.98% | | | | 03/03/2028 | | | | EUR 784 | | | 782,298 |
| NCR Corp., Term Loan B (3 mo. USD LIBOR + 2.50%) | | | 7.33% | | | | 08/28/2026 | | | | 645 | | | 641,563 |
| Oberthur Tech, Term Loan B (3 mo. USD LIBOR + 4.50%) | | | 9.23% | | | | 01/09/2026 | | | | 1,289 | | | 1,278,061 |
Open Text Corp. (Canada), Incremental Term Loan B(d) | | | - | | | | 08/27/2029 | | | | 2,023 | | | 2,022,627 |
| Optiv, Inc. | | | | | | | | | | | | | | |
| Second Lien Term Loan (3 mo. USD LIBOR + 7.25%) | | | 11.42% | | | | 01/31/2025 | | | | 490 | | | 456,315 |
| Term Loan (3 mo. USD LIBOR + 3.25%) | | | 7.42% | | | | 02/01/2024 | | | | 3,136 | | | 3,118,968 |
Project Accelerate Parent LLC, First Lien Term Loan (3 mo. USD LIBOR + 4.25%)(e) | | | 8.88% | | | | 01/02/2025 | | | | 1,188 | | | 1,158,591 |
| Proofpoint, Inc., Term Loan B (3 mo. USD LIBOR + 3.25%) | | | 7.88% | | | | 08/31/2028 | | | | 712 | | | 693,646 |
| Quest Software US Holdings, Inc. | | | | | | | | | | | | | | |
| Second Lien Term Loan (3 mo. SOFR+ 7.50%) | | | 12.33% | | | | 01/20/2030 | | | | 136 | | | 88,094 |
| Term Loan B (3 mo. SOFR + 4.25%) | | | 9.08% | | | | 01/19/2029 | | | | 3,035 | | | 2,622,905 |
| RealPage, Inc., Term Loan B (1 mo. USD LIBOR + 3.00%) | | | 7.63% | | | | 04/24/2028 | | | | 1,283 | | | 1,244,860 |
| Resideo Funding, Inc., Term Loan (1 mo. USD LIBOR + 2.25%) | | | 6.86% | | | | 02/11/2028 | | | | 0 | | | 11 |
Riverbed Technology, Inc., PIK Term Loan, 2.00% PIK Rate, 10.83% Cash Rate (Acquired 12/06/2021‑02/07/2023; Cost $3,931,221)(f)(h) | | | 2.00% | | | | 12/08/2026 | | | | 3,171 | | | 1,155,609 |
| Sandvine Corp. | | | | | | | | | | | | | | |
| First Lien Term Loan (3 mo. USD LIBOR + 4.50%) | | | 9.33% | | | | 10/31/2025 | | | | 1,349 | | | 1,279,987 |
| Second Lien Term Loan (1 mo. USD LIBOR + 8.00%) | | | 12.83% | | | | 11/02/2026 | | | | 190 | | | 169,295 |
| SmartBear (AQA Acquisition Holdings, Inc), Term Loan B (3 mo. USD LIBOR + 4.25%) | | | 9.20% | | | | 03/03/2028 | | | | 190 | | | 185,403 |
| SonicWall U.S. Holdings, Inc., First Lien Term Loan (3 mo. USD LIBOR + 3.75%) | | | 8.71% | | | | 05/16/2025 | | | | 130 | | | 128,445 |
| Ultimate Software Group, Inc. | | | | | | | | | | | | | | |
| First Lien Term Loan (1 mo. USD LIBOR + 3.75%) | | | 8.58% | | | | 05/04/2026 | | | | 1,561 | | | 1,543,548 |
| Second Lien Term Loan (3 mo. USD LIBOR + 5.25%) | | | 10.03% | | | | 05/03/2027 | | | | 154 | | | 150,922 |
| UST Holdings Ltd., Term Loan B (1 mo. USD LIBOR + 3.75%) | | | 8.48% | | | | 11/19/2028 | | | | 701 | | | 698,612 |
| Utimaco (Germany) | | | | | | | | | | | | | | |
Term Loan B (3 mo. EURIBOR + 6.25%)(e) | | | 8.95% | | | | 05/31/2029 | | | | EUR 1,940 | | | 1,965,497 |
Term Loan B (3 mo. SOFR + 6.25%)(e) | | | 11.20% | | | | 05/31/2029 | | | | 1,089 | | | 1,051,655 |
| Veritas US, Inc., Term Loan B (3 mo. USD LIBOR + 5.00%) | | | 9.73% | | | | 09/01/2025 | | | | 925 | | | 727,605 |
| WebPros, Term Loan (3 mo. USD LIBOR + 5.25%) | | | 9.98% | | | | 02/18/2027 | | | | 1,039 | | | 1,021,093 |
| | | | | | | | | | | | | | | 44,284,848 |
| | | | |
| Financial Intermediaries–0.80% | | | | | | | | | | | | | | |
| Edelman Financial Center LLC (The) | | | | | | | | | | | | | | |
| Incremental Term Loan (1 mo. USD LIBOR + 3.50%) | | | 8.13% | | | | 04/07/2028 | | | | 1,812 | | | 1,768,930 |
| Second Lien Term Loan (1 mo. USD LIBOR + 6.75%) | | | 11.38% | | | | 07/20/2026 | | | | 112 | | | 108,728 |
| LendingTree, Inc., First Lien Term Loan B (1 mo. USD LIBOR + 3.75%) | | | 8.39% | | | | 09/15/2028 | | | | 925 | | | 856,573 |
| Stiphout Finance LLC, Incremental Term Loan (1 mo. USD LIBOR + 3.75%) | | | 8.38% | | | | 10/26/2025 | | | | 122 | | | 121,380 |
| Tegra118 Wealth Solutions, Inc., Term Loan (1 mo. USD LIBOR + 4.00%) | | | 8.56% | | | | 02/18/2027 | | | | 321 | | | 313,582 |
| | | | | | | | | | | | | | | 3,169,193 |
| | | | |
| Food Products–2.80% | | | | | | | | | | | | | | |
| Arnott’s (Snacking Investments US LLC), Term Loan (1 mo. USD LIBOR + 4.00%) | | | 8.56% | | | | 12/18/2026 | | | | 942 | | | 940,511 |
| Biscuit Intl (Cookie Acq S.A.S., De Banketgroep Holding) (France), First Lien Term Loan (6 mo. EURIBOR + 4.00%) | | | 5.86% | | | | 02/15/2027 | | | | EUR 524 | | | 435,393 |
See accompanying Notes to Financial Statements which are an integral part of the financial statements.
13 Invesco Senior Loan Fund
| | | | | | | | | | | | | | |
| | | Interest
Rate | | | Maturity
Date | | | Principal Amount (000)(a) | | | Value |
| Food Products–(continued) | | | | | | | | | | | | | | |
| BrightPet (AMCP Pet Holdings, Inc.) | | | | | | | | | | | | | | |
Revolver Loan (3 mo. USD LIBOR + 6.25%)(e) | | | 11.06% | | | | 10/05/2026 | | | | $ 336 | | | $ 324,595 |
Term Loan B (3 mo. USD LIBOR + 6.25%)(e) | | | 10.98% | | | | 10/05/2026 | | | | 2,303 | | | 2,226,721 |
| Florida Food Products LLC | | | | | | | | | | | | | | |
First Lien Term Loan (1 mo. SOFR + 5.00%)(e) | | | 9.62% | | | | 10/18/2028 | | | | 419 | | | 391,284 |
First Lien Term Loan (1 mo. SOFR + 5.00%)(e) | | | 9.63% | | | | 10/18/2028 | | | | 3,060 | | | 2,861,051 |
| Second Lien Term Loan (1 mo. USD LIBOR + 8.00%) | | | 12.63% | | | | 10/08/2029 | | | | 609 | | | 548,312 |
| H‑Food Holdings LLC | | | | | | | | | | | | | | |
| Incremental Term Loan B‑3 (1 mo. USD LIBOR + 5.00%) | | | 9.63% | | | | 05/23/2025 | | | | 749 | | | 678,568 |
| Term Loan (3 mo. USD LIBOR + 3.69%) | | | 8.32% | | | | 05/23/2025 | | | | 571 | | | 514,898 |
| Nomad Foods US LLC (United Kingdom), Term Loan B (1 mo. SOFR + 3.75%) | | | 8.23% | | | | 11/10/2029 | | | | 310 | | | 310,847 |
| Panzani/Pimente (France), Term Loan B (3 mo. EURIBOR + 4.25%) | | | 6.45% | | | | 12/02/2028 | | | | EUR 174 | | | 180,313 |
| Shearer’s Foods LLC | | | | | | | | | | | | | | |
| Second Lien Term Loan (1 mo. USD LIBOR + 7.75%) | | | 12.39% | | | | 09/22/2028 | | | | 222 | | | 207,826 |
| Term Loan B (1 mo. USD LIBOR + 3.50%) | | | 8.13% | | | | 09/23/2027 | | | | 132 | | | 129,280 |
| Sigma Bidco B.V. (Netherlands) | | | | | | | | | | | | | | |
| Term Loan B‑1 (3 mo. EURIBOR + 3.50%) | | | 6.24% | | | | 07/02/2025 | | | | EUR 427 | | | 421,492 |
| Term Loan B‑2 (3 mo. USD LIBOR + 3.00%) | | | 7.46% | | | | 07/02/2025 | | | | 496 | | | 466,350 |
| Valeo Foods (Jersey) Ltd. (United Kingdom), First Lien Term Loan B (6 mo. EURIBOR + 4.00%) | | | 7.24% | | | | 09/29/2028 | | | | EUR 492 | | | 442,821 |
| | | | | | | | | | | | | | | 11,080,262 |
| | | | |
| Food Service–0.88% | | | | | | | | | | | | | | |
| Euro Garages (Netherlands) | | | | | | | | | | | | | | |
| Term Loan B (3 mo. USD LIBOR + 4.00%) | | | 9.15% | | | | 02/07/2025 | | | | 434 | | | 407,282 |
| Term Loan B (3 mo. USD LIBOR + 4.00%) | | | 8.73% | | | | 02/07/2025 | | | | 618 | | | 580,286 |
| Term Loan B (3 mo. USD LIBOR + 4.25%) | | | 8.98% | | | | 03/31/2026 | | | | 310 | | | 290,383 |
| Financiere Pax S.A.S., Term Loan B (6 mo. EURIBOR + 4.75%) | | | 7.19% | | | | 07/01/2026 | | | | EUR 1,400 | | | 1,353,528 |
| WW International, Inc., Term Loan B (1 mo. USD LIBOR + 3.50%) | | | 8.14% | | | | 04/13/2028 | | | | 1,457 | | | 846,609 |
| | | | | | | | | | | | | | | 3,478,088 |
| | | | |
| Health Care–3.41% | | | | | | | | | | | | | | |
| Acacium (Impala Bidco Ltd./ICS US, Inc.) (United Kingdom) | | | | | | | | | | | | | | |
| Term Loan (1 mo. SONIA + 4.75%) | | | 8.68% | | | | 06/08/2028 | | | | GBP 295 | | | 341,855 |
Term Loan (1 mo. SOFR + 5.25%)(e) | | | 9.15% | | | | 06/08/2028 | | | | 590 | | | 552,040 |
| Ascend Learning LLC, First Lien Term Loan (1 mo. USD LIBOR + 3.50%) | | | 8.12% | | | | 12/11/2028 | | | | 40 | | | 38,013 |
| athenahealth Group, Inc. | | | | | | | | | | | | | | |
| Term Loan (1 mo. SOFR + 3.50%) | | | 8.06% | | | | 02/15/2029 | | | | 2,630 | | | 2,440,555 |
Delayed Draw Term Loan(g) | | | 0.00% | | | | 02/15/2029 | | | | 322 | | | 299,063 |
| Biogroup‑LCD (France), Term Loan B (3 mo. EURIBOR + 3.25%) | | | 5.85% | | | | 02/09/2028 | | | | EUR 292 | | | 290,227 |
| Cerba (Chrome Bidco) (France), Term Loan (3 mo. EURIBOR + 4.00%) | | | 5.93% | | | | 02/14/2029 | | | | EUR 248 | | | 251,957 |
| Certara Holdco, Inc., Term Loan B (1 mo. USD LIBOR + 3.50%) | | | 8.13% | | | | 08/14/2026 | | | | 401 | | | 399,425 |
| Cheplapharm Arzneimittel GmbH (Germany), Term Loan B (3 mo. EURIBOR + 4.00%) | | | 6.30% | | | | 02/22/2029 | | | | EUR 312 | | | 321,612 |
| Dermatology Intermediate Holdings III, Inc. | | | | | | | | | | | | | | |
Delayed Draw Term Loan(d)(e) | | | - | | | | 03/31/2029 | | | | 12 | | | 11,522 |
Delayed Draw Term Loan(e)(g) | | | 0.00% | | | | 03/31/2029 | | | | 1 | | | 430 |
Term Loan B (1 mo. SOFR + 4.25%)(e) | | | 8.93% | | | | 03/23/2029 | | | | 65 | | | 63,624 |
| Ethypharm (Financiere Verdi, Orphea Ltf) (France), Term Loan B (3 mo. SONIA + 4.50%) | | | 7.93% | | | | 04/17/2028 | | | | GBP 371 | | | 397,636 |
| ExamWorks Group, Inc./Electron Bidco, Term Loan (1 mo. USD LIBOR + 3.00%) | | | 7.63% | | | | 11/01/2028 | | | | 275 | | | 273,039 |
| Explorer Holdings, Inc., First Lien Term Loan (1 mo. USD LIBOR + 4.50%) | | | 9.13% | | | | 02/04/2027 | | | | 1,017 | | | 939,188 |
| Gainwell Acquisition Corp., First Lien Term Loan B (3 mo. USD LIBOR + 4.00%) | | | 8.73% | | | | 10/01/2027 | | | | 514 | | | 496,071 |
| Global Medical Response, Inc. | | | | | | | | | | | | | | |
| Term Loan (1 mo. USD LIBOR + 4.25%) | | | 9.20% | | | | 03/14/2025 | | | | 311 | | | 248,922 |
| Term Loan (1 mo. USD LIBOR + 4.25%) | | | 8.83% | | | | 10/02/2025 | | | | 1,030 | | | 821,906 |
See accompanying Notes to Financial Statements which are an integral part of the financial statements.
14 Invesco Senior Loan Fund
| | | | | | | | | | | | | | |
| | | Interest
Rate | | | Maturity
Date | | | Principal Amount (000)(a) | | | Value |
| Health Care–(continued) | | | | | | | | | | | | | | |
| ICON PLC | | | | | | | | | | | | | | |
| Term Loan (3 mo. USD LIBOR + 2.25%) | | | 7.00% | | | | 07/03/2028 | | | | $ 13 | | | $ 13,064 |
| Term Loan (3 mo. USD LIBOR + 2.25%) | | | 7.00% | | | | 07/03/2028 | | | | 53 | | | 52,435 |
International SOS L.P., Term Loan B (3 mo. USD LIBOR + 3.75%)(e) | | | 8.50% | | | | 09/07/2028 | | | | 631 | | | 622,038 |
| MedAssets Software Intermediate Holdings, Inc. (nThrive TSG) | | | | | | | | | | | | | | |
| First Lien Term Loan (1 mo. USD LIBOR + 4.00%) | | | 8.63% | | | | 12/18/2028 | | | | 998 | | | 935,448 |
| Second Lien Term Loan (1 mo. USD LIBOR + 6.75%) | | | 11.38% | | | | 12/17/2029 | | | | 401 | | | 286,772 |
| MJH Healthcare Holdings LLC, Term Loan B (1 mo. SOFR + 3.50%) | | | 8.22% | | | | 01/28/2029 | | | | 107 | | | 105,359 |
| Neuraxpharm (Cerebro BidCo/Blitz F20‑80 GmbH) (Germany) | | | | | | | | | | | | | | |
| Term Loan B (3 mo. EURIBOR + 4.25%) | | | 6.74% | | | | 12/15/2027 | | | | EUR 138 | | | 144,081 |
| Term Loan B‑2 (3 mo. EURIBOR + 4.25%) | | | 6.74% | | | | 12/15/2027 | | | | EUR 80 | | | 83,227 |
| Nidda Healthcare Holding AG (Germany), Term Loan F (3 mo. SONIA + 4.50%) | | | 8.45% | | | | 08/21/2026 | | | | GBP 314 | | | 359,655 |
| Summit Behavioral Healthcare LLC, First Lien Term Loan (3 mo. USD LIBOR + 4.75%) | | | 9.88% | | | | 11/24/2028 | | | | 914 | | | 886,757 |
| TTF Holdings LLC (Soliant), Term Loan B (1 mo. USD LIBOR + 4.00%) | | | 8.69% | | | | 03/31/2028 | | | | 490 | | | 489,422 |
| Verscend Holding Corp., Term Loan B‑1 (1 mo. USD LIBOR + 4.00%) | | | 8.63% | | | | 08/27/2025 | | | | 768 | | | 768,813 |
| Women’s Care Holdings, Inc. LLC | | | | | | | | | | | | | | |
| First Lien Term Loan (6 mo. USD LIBOR + 4.50%) | | | 9.33% | | | | 01/15/2028 | | | | 342 | | | 321,562 |
| Second Lien Term Loan (1 mo. USD LIBOR + 8.25%) | | | 13.08% | | | | 01/15/2029 | | | | 235 | | | 213,418 |
| | | | | | | | | | | | | | | 13,469,136 |
| | | | |
| Home Furnishings–2.56% | | | | | | | | | | | | | | |
| Hilding Anders AB (Sweden) | | | | | | | | | | | | | | |
Term Loan (6 mo. EURIBOR + 5.00%) (Acquired 10/04/2022‑10/31/2022; Cost $ 155,086)(e)(f) | | | 7.12% | | | | 02/28/2026 | | | | EUR 213 | | | 147,445 |
Term Loan (6 mo. EURIBOR) (Acquired 10/04/2022‑10/31/2022; Cost $ 1,725)(e)(f) | | | 1.70% | | | | 02/26/2027 | | | | EUR 193 | | | 0 |
| Hunter Douglas Holding B.V., Term Loan B‑1 (3 mo. SOFR+ 3.50%) | | | 8.37% | | | | 02/26/2029 | | | | 2,617 | | | 2,415,242 |
| Hunter Douglas, Inc., First Lien Term Loan (3 mo. EURIBOR + 4.00%) | | | 6.67% | | | | 02/26/2029 | | | | EUR 1,317 | | | 1,276,142 |
| Mattress Holding Corp., Term Loan (6 mo. USD LIBOR + 4.25%) | | | 8.44% | | | | 09/25/2028 | | | | 2,145 | | | 2,030,093 |
| Serta Simmons Bedding LLC | | | | | | | | | | | | | | |
First Lien Term Loan(i)(j) | | | 0.00% | | | | 08/10/2023 | | | | 1,073 | | | 1,060,977 |
Second Lien Term Loan(i)(j) | | | 0.00% | | | | 08/10/2023 | | | | 1,743 | | | 977,264 |
| SIWF Holdings, Inc., Term Loan B (3 mo. USD LIBOR + 4.00%) | | | 8.75% | | | | 10/06/2028 | | | | 1,374 | | | 1,186,460 |
| TGP Holdings III LLC, Term Loan B (1 mo. USD LIBOR + 3.25%) | | | 8.08% | | | | 06/29/2028 | | | | 477 | | | 384,328 |
| VC GB Holdings, Inc., Second Lien Term Loan (3 mo. USD LIBOR + 6.75%) | | | 11.38% | | | | 07/01/2029 | | | | 319 | | | 253,401 |
| Weber-Stephen Products LLC | | | | | | | | | | | | | | |
| Incremental Term Loan B (1 mo. SOFR + 4.25%) | | | 8.97% | | | | 10/30/2027 | | | | 112 | | | 98,244 |
| Term Loan B (1 mo. USD LIBOR + 3.25%) | | | 7.88% | | | | 10/30/2027 | | | | 356 | | | 312,660 |
| | | | | | | | | | | | | | | 10,142,256 |
| | | | |
| Industrial Equipment–4.09% | | | | | | | | | | | | | | |
Chart Industries, Inc., Term Loan B (d) | | | - | | | | 12/08/2029 | | | | 920 | | | 920,804 |
| CIRCOR International, Inc., Term Loan (1 mo. USD LIBOR + 5.50%) | | | 10.13% | | | | 12/20/2028 | | | | 685 | | | 679,819 |
| Crosby US Acquisition Corp., First Lien Term Loan (1 mo. USD LIBOR + 4.75%) | | | 9.50% | | | | 06/26/2026 | | | | 228 | | | 222,937 |
| Delachaux Group S.A. (France), Term Loan B‑2 (3 mo. USD LIBOR + 4.50%) | | | 9.28% | | | | 04/16/2026 | | | | 320 | | | 306,584 |
| Deliver Buyer, Inc. (MHS Holdings), Term Loan B (3 mo. SOFR + 5.50%) | | | 10.08% | | | | 06/08/2029 | | | | 1,158 | | | 1,001,435 |
| DXP Enterprises, Inc., Term Loan (1 mo. SOFR + 4.75%) | | | 10.17% | | | | 12/23/2027 | | | | 858 | | | 845,064 |
Engineered Machinery Holdings, Inc., Second Lien Incremental Term Loan (3 mo. USD LIBOR + 6.00%)(e) | | | 10.73% | | | | 05/21/2029 | | | | 117 | | | 109,069 |
| Kantar (Summer BC Bidco) (United Kingdom) | | | | | | | | | | | | | | |
Term Loan B (3 mo. USD LIBOR + 5.00%)(e) | | | 9.77% | | | | 12/04/2026 | | | | 977 | | | 928,464 |
| Term Loan B‑3 (3 mo. EURIBOR + 4.25%) | | | 6.22% | | | | 12/04/2026 | | | | EUR 700 | | | 705,343 |
| Madison IAQ LLC, Term Loan (3 mo. USD LIBOR + 3.25%) | | | 7.99% | | | | 06/21/2028 | | | | 1,329 | | | 1,268,367 |
| MKS Instruments, Inc., Term Loan B (1 mo. SOFR + 2.75%) | | | 7.41% | | | | 08/17/2029 | | | | 38 | | | 37,924 |
See accompanying Notes to Financial Statements which are an integral part of the financial statements.
15 Invesco Senior Loan Fund
| | | | | | | | | | | | | | |
| | | Interest
Rate | | | Maturity
Date | | | Principal Amount (000)(a) | | | Value |
| Industrial Equipment–(continued) | | | | | | | | | | | | | | |
| MX Holdings US, Inc., Term Loan B‑1‑C (1 mo. USD LIBOR + 2.50%) | | | 7.13% | | | | 07/31/2025 | | | | $ 260 | | | $ 260,292 |
| New VAC US LLC, Term Loan B (3 mo. USD LIBOR + 4.00%) | | | 8.73% | | | | 03/08/2025 | | | | 775 | | | 697,241 |
| Robertshaw US Holding Corp. | | | | | | | | | | | | | | |
| First Lien Term Loan (3 mo. USD LIBOR + 3.50%) | | | 8.25% | | | | 02/28/2025 | | | | 2,967 | | | 1,658,932 |
| Second Lien Term Loan (3 mo. USD LIBOR + 8.00%) | | | 12.75% | | | | 02/28/2026 | | | | 777 | | | 268,942 |
| Tank Holding Corp. | | | | | | | | | | | | | | |
Revolver Loan (1 mo. SOFR + 6.00%)(e) | | | 12.25% | | | | 03/31/2028 | | | | 50 | | | 46,224 |
Revolver Loan(e)(g) | | | 0.00% | | | | 03/31/2028 | | | | 180 | | | 167,121 |
| Term Loan (1 mo. SOFR + 6.00%) | | | 10.47% | | | | 03/31/2028 | | | | 3,431 | | | 3,296,036 |
| Thyssenkrupp Elevators (Vertical Midco GmbH) (Germany), Term Loan B (6 mo. USD LIBOR + 3.50%) | | | 8.60% | | | | 07/31/2027 | | | | 1,994 | | | 1,953,596 |
| Victory Buyer LLC (Vantage Elevator) | | | | | | | | | | | | | | |
Second Lien Term Loan B (1 mo. USD LIBOR + 7.00%)(e) | | | 11.59% | | | | 11/19/2029 | | | | 165 | | | 132,972 |
Term Loan B (1 mo. USD LIBOR + 3.75%)(e) | | | 8.34% | | | | 11/15/2028 | | | | 768 | | | 675,971 |
| | | | | | | | | | | | | | | 16,183,137 |
| | | | |
| Insurance–1.42% | | | | | | | | | | | | | | |
| Acrisure LLC | | | | | | | | | | | | | | |
| First Lien Term Loan (1 mo. USD LIBOR + 3.50%) | | | 8.13% | | | | 02/15/2027 | | | | 1,152 | | | 1,103,154 |
| First Lien Term Loan (1 mo. USD LIBOR + 4.25%) | | | 8.88% | | | | 02/15/2027 | | | | 765 | | | 739,284 |
| Term Loan (1 mo. SOFR+ 5.75%) | | | 10.45% | | | | 02/15/2027 | | | | 720 | | | 721,552 |
| Alliant Holdings Intermediate LLC | | | | | | | | | | | | | | |
| Term Loan (1 mo. USD LIBOR + 3.25%) | | | 8.13% | | | | 05/09/2025 | | | | 37 | | | 36,665 |
| Term Loan (1 mo. USD LIBOR + 3.50%) | | | 8.09% | | | | 11/06/2027 | | | | 857 | | | 848,266 |
AmWINS Group LLC, Term Loan B(d) | | | - | | | | 02/19/2028 | | | | 426 | | | 425,111 |
| HUB International Ltd., Incremental Term Loan B‑3 (1 mo. USD LIBOR + 3.25%) | | | 7.23% | | | | 04/25/2025 | | | | 506 | | | 506,231 |
Sedgwick Claims Management Services, Inc., Term Loan B(d) | | | - | | | | 02/21/2028 | | | | 198 | | | 195,990 |
| USI, Inc. | | | | | | | | | | | | | | |
| Term Loan (1 mo. USD LIBOR + 3.25%) | | | 7.98% | | | | 12/02/2026 | | | | 334 | | | 333,511 |
| Term Loan (3 mo. SOFR + 3.75%) | | | 8.65% | | | | 11/22/2029 | | | | 725 | | | 724,818 |
| | | | | | | | | | | | | | | 5,634,582 |
| | | | |
| Leisure Goods, Activities & Movies–5.21% | | | | | | | | | | | | | | |
| Carnival Corp. | | | | | | | | | | | | | | |
| Incremental Term Loan (6 mo. USD LIBOR + 3.25%) | | | 7.88% | | | | 10/18/2028 | | | | 3,812 | | | 3,707,190 |
| Term Loan (6 mo. USD LIBOR + 3.00%) | | | 7.63% | | | | 06/30/2025 | | | | 259 | | | 255,828 |
| Crown Finance US, Inc. | | | | | | | | | | | | | | |
| DIP Term Loan (1 mo. SOFR + 10.00%) | | | 14.80% | | | | 09/07/2023 | | | | 4,439 | | | 4,538,988 |
First Lien Term Loan (Acquired 10/18/2019‑12/23/2022; Cost $2,223,970)(f)(i)(j) | | | 0.00% | | | | 09/30/2026 | | | | 2,558 | | | 417,932 |
Revolver Loan(d)(i) | | | - | | | | 03/02/2023 | | | | 608 | | | 102,261 |
Term Loan (Acquired 08/28/2020‑11/30/2022; Cost $335,125)(f)(i)(j) | | | 0.00% | | | | 02/28/2025 | | | | EUR 441 | | | 76,196 |
Term Loan (Acquired 09/13/2021‑02/24/2022; Cost $1,370,670)(f)(i)(j) | | | 0.00% | | | | 02/28/2025 | | | | 1,642 | | | 270,041 |
| CWGS Group LLC, Term Loan (1 mo. USD LIBOR + 2.50%) | | | 7.13% | | | | 06/03/2028 | | | | 801 | | | 717,848 |
| Delta 2 Lux S.a.r.l. (United Kingdom), First Lien Term Loan (1 mo. SOFR + 3.25%) | | | 8.06% | | | | 01/15/2030 | | | | 784 | | | 787,685 |
| Dorna Sports S.L. (Spain), Term Loan B (3 mo. EURIBOR + 3.50%) | | | 6.25% | | | | 03/30/2029 | | | | EUR 427 | | | 440,143 |
| Eagle Midco Ltd. (United Kingdom), Term Loan (3 mo. SONIA + 4.25%) | | | 8.71% | | | | 03/20/2028 | | | | GBP 233 | | | 263,177 |
| Fitness International LLC, Term Loan B (3 mo. USD LIBOR + 3.25%) | | | 8.08% | | | | 04/18/2025 | | | | 920 | | | 884,430 |
| Lakeland Tours LLC | | | | | | | | | | | | | | |
PIK Term Loan, 13.25% PIK Rate (Acquired 09/25/2020‑09/27/2022; Cost $134,626)(f)(h) | | | 13.25% | | | | 09/25/2027 | | | | 325 | | | 219,277 |
Third Lien Term Loan B (3 mo. USD LIBOR + 6.00%) (Acquired 09/25/2020‑10/31/2022; Cost $210,427)(e)(f) | | | 10.42% | | | | 09/25/2025 | | | | 271 | | | 246,556 |
See accompanying Notes to Financial Statements which are an integral part of the financial statements.
16 Invesco Senior Loan Fund
| | | | | | | | | | | | | | |
| | | Interest
Rate | | | Maturity
Date | | | Principal Amount (000)(a) | | | Value |
| Leisure Goods, Activities & Movies–(continued) | | | | | | | | | | | | | | |
Nord Anglia Education, Term Loan B(d) | | | - | | | | 01/25/2028 | | | | $ 339 | | | $ 339,395 |
OEG Borrower LLC (Opry Entertainment), Term Loan B (3 mo. SOFR+ 5.00%)(e) | | | 9.60% | | | | 05/20/2029 | | | | 850 | | | 847,552 |
Red Ventures LLC (New Imagitas, Inc.), Term Loan(d) | | | - | | | | 02/24/2030 | | | | 249 | | | 246,834 |
| Royal Caribbean Cruises | | | | | | | | | | | | | | |
Revolver Loan(d)(e) | | | - | | | | 04/05/2024 | | | | 2,206 | | | 2,112,569 |
Revolver Loan(d) | | | - | | | | 04/12/2024 | | | | 465 | | | 444,634 |
Revolver Loan(e)(g) | | | 0.00% | | | | 04/05/2024 | | | | 68 | | | 65,300 |
Revolver Loan(g) | | | 0.00% | | | | 04/12/2024 | | | | 130 | | | 123,998 |
| SeaWorld Parks & Entertainment, Inc., Term Loan B (1 mo. USD LIBOR + 3.00%) | | | 7.69% | | | | 08/25/2028 | | | | 460 | | | 459,427 |
| Six Flags Theme Parks, Inc., Term Loan B (3 mo. USD LIBOR + 1.75%) | | | 6.39% | | | | 04/17/2026 | | | | 229 | | | 225,570 |
| USF S&H Holdco LLC | | | | | | | | | | | | | | |
Term Loan A (3 mo. USD LIBOR + 8.00%)(e) | | | 18.67% | | | | 06/30/2025 | | | | 133 | | | 132,716 |
Term Loan A(e)(g) | | | 0.00% | | | | 06/30/2025 | | | | 162 | | | 162,334 |
Term Loan B (3 mo. USD LIBOR + 4.75%)(e) | | | 9.51% | | | | 06/30/2025 | | | | 1,698 | | | 1,698,291 |
| Vue International Bidco PLC (United Kingdom) | | | | | | | | | | | | | | |
| Term Loan (6 mo. EURIBOR + 8.00%) | | | 9.77% | | | | 06/30/2027 | | | | EUR 194 | | | 179,417 |
| Term Loan (3 mo. EURIBOR + 8.00%) | | | 4.35% | | | | 12/31/2027 | | | | EUR 988 | | | 658,515 |
| | | | | | | | | | | | | | | 20,624,104 |
| | | | |
| Lodging & Casinos–3.99% | | | | | | | | | | | | | | |
| Aimbridge Acquisition Co., Inc. | | | | | | | | | | | | | | |
| First Lien Term Loan (1 mo. USD LIBOR + 3.75%) | | | 8.38% | | | | 02/02/2026 | | | | 915 | | | 870,155 |
| First Lien Term Loan (1 mo. USD LIBOR + 4.75%) | | | 9.34% | | | | 02/02/2026 | | | | 1,128 | | | 1,075,321 |
| B&B Hotels S.A.S. (France) | | | | | | | | | | | | | | |
| Second Lien Term Loan A‑1 (3 mo. EURIBOR + 8.50%) | | | 10.89% | | | | 07/31/2027 | | | | EUR 387 | | | 407,892 |
| Term Loan B‑4 (6 mo. EURIBOR + 5.50%) | | | 7.89% | | | | 07/31/2026 | | | | EUR 401 | | | 422,119 |
| Bally’s Corp., Term Loan B (1 mo. USD LIBOR + 3.25%) | | | 7.85% | | | | 10/02/2028 | | | | 1,079 | | | 1,030,404 |
Caesars Entertainment, Inc., Term Loan B(d) | | | - | | | | 01/26/2030 | | | | 1,807 | | | 1,807,281 |
| Fertitta Entertainment LLC (Golden Nugget), Term Loan (1 mo. SOFR + 4.00%) | | | 8.62% | | | | 01/31/2029 | | | | 140 | | | 136,870 |
| Flutter Financing B.V. (Stars Group), Term Loan B (1 mo. SOFR + 3.25%) | | | 8.09% | | | | 07/04/2028 | | | | 1,101 | | | 1,102,687 |
| Four Seasons Holdings, Inc. (Canada), Term Loan (1 mo. SOFR + 3.25%) | | | 8.16% | | | | 11/30/2029 | | | | 228 | | | 229,277 |
| GVC Finance LLC, First Lien Term Loan (1 mo. SOFR + 3.50%) | | | 8.18% | | | | 10/31/2029 | | | | 1,268 | | | 1,268,472 |
| Hilton Grand Vacations Borrower LLC, Term Loan (1 mo. USD LIBOR + 3.00%) | | | 7.63% | | | | 08/02/2028 | | | | 516 | | | 515,700 |
| HotelBeds (United Kingdom) | | | | | | | | | | | | | | |
| Term Loan B (3 mo. EURIBOR + 4.25%) | | | 6.71% | | | | 09/12/2025 | | | | EUR 1,882 | | | 1,870,839 |
| Term Loan D (6 mo. EURIBOR + 5.50%) | | | 7.75% | | | | 09/12/2027 | | | | EUR 3,398 | | | 3,414,916 |
| PCI Gaming Authority, Term Loan B (3 mo. USD LIBOR + 2.50%) | | | 7.13% | | | | 05/29/2026 | | | | 63 | | | 63,028 |
| Scientific Games Lottery | | | | | | | | | | | | | | |
| Term Loan B (3 mo. EURIBOR + 4.00%) | | | 6.17% | | | | 01/31/2029 | | | | EUR 247 | | | 256,975 |
| Term Loan B (3 mo. SOFR + 3.50%) | | | 8.10% | | | | 04/04/2029 | | | | 959 | | | 944,233 |
| Travel + Leisure Co., Incremental Term Loan (1 mo. SOFR + 4.00%) | | | 8.61% | | | | 12/14/2029 | | | | 348 | | | 347,832 |
| | | | | | | | | | | | | | | 15,764,001 |
| | | | |
| Nonferrous Metals & Minerals–1.32% | | | | | | | | | | | | | | |
| American Rock Salt Co. LLC | | | | | | | | | | | | | | |
| First Lien Term Loan (1 mo. USD LIBOR + 4.00%) | | | 8.63% | | | | 06/09/2028 | | | | 374 | | | 362,573 |
Second Lien Term Loan (1 mo. USD LIBOR + 7.25%)(e) | | | 11.88% | | | | 06/11/2029 | | | | 57 | | | 54,247 |
| AZZ, Inc., Term Loan (1 mo. SOFR + 4.25%) | | | 8.97% | | | | 05/13/2029 | | | | 1,182 | | | 1,183,552 |
| Corialis (United Kingdom), Term Loan B (1 mo. SONIA + 4.40%) | | | 8.36% | | | | 07/06/2028 | | | | GBP 109 | | | 118,529 |
| Covia Holdings Corp., Term Loan (3 mo. USD LIBOR + 4.00%) | | | 8.78% | | | | 07/31/2026 | | | | 431 | | | 426,860 |
| Form Technologies LLC | | | | | | | | | | | | | | |
| First Lien Term Loan (3 mo. USD LIBOR + 4.50%) | | | 9.46% | | | | 07/19/2025 | | | | 1,029 | | | 942,773 |
First Lien Term Loan (3 mo. USD LIBOR + 9.00%)(e) | | | 13.96% | | | | 10/22/2025 | | | | 545 | | | 441,306 |
See accompanying Notes to Financial Statements which are an integral part of the financial statements.
17 Invesco Senior Loan Fund
| | | | | | | | | | | | | | |
| | | Interest
Rate | | | Maturity
Date | | | Principal Amount (000)(a) | | | Value |
| Nonferrous Metals & Minerals–(continued) | | | | | | | | | | | | | | |
| SCIH Salt Holdings Inc. (Kissner Group), Incremental First Lien Term Loan B‑1 (1 mo. USD LIBOR + 4.00%) | | | 8.83% | | | | 03/16/2027 | | | | $ 1,714 | | | $ 1,672,869 |
| | | | | | | | | | | | | | | 5,202,709 |
| | | | |
| Oil & Gas–3.69% | | | | | | | | | | | | | | |
Brazos Delaware II LLC, First Lien Term Loan (d) | | | - | | | | 02/01/2030 | | | | 1,007 | | | 1,001,814 |
| Glass Mountain Pipeline Holdings LLC, Term Loan (3 mo. USD LIBOR + 4.50%) | | | 9.14% | | | | 10/28/2027 | | | | 150 | | | 127,279 |
| Gulf Finance LLC, Term Loan (1 mo. USD LIBOR + 6.75%) | | | 11.48% | | | | 08/25/2026 | | | | 1,282 | | | 1,260,811 |
| McDermott International Ltd. | | | | | | | | | | | | | | |
LOC(g) | | | 0.00% | | | | 06/30/2024 | | | | 2,136 | | | 1,740,930 |
LOC (3 mo. USD LIBOR + 4.00%)(e) | | | 5.48% | | | | 06/30/2024 | | | | 999 | | | 698,963 |
PIK Term Loan, 3.00% PIK Rate, 5.63% Cash Rate(h) | | | 3.00% | | | | 06/30/2025 | | | | 512 | | | 340,028 |
| Term Loan (1 mo. USD LIBOR + 3.00%) | | | 7.63% | | | | 06/30/2024 | | | | 92 | | | 55,660 |
Par Petroleum LLC and Par Petroleum Finance Corp. (Par Pacific), Term Loan B(d) | | | - | | | | 02/14/2030 | | | | 1,167 | | | 1,154,810 |
| Petroleum GEO‑Services ASA (Norway) | | | | | | | | | | | | | | |
Term Loan (3 mo. SOFR + 6.75%) (Acquired 05/23/2022; Cost $469,170)(e)(f) | | | 11.33% | | | | 03/18/2024 | | | | 469 | | | 476,208 |
Term Loan (1 mo. USD LIBOR + 7.50%) (Acquired 01/29/2021‑02/09/2021; Cost $3,105,810)(f) | | | 12.14% | | | | 03/19/2024 | | | | 3,486 | | | 3,433,881 |
QuarterNorth Energy, Inc., Second Lien Term Loan (1 mo. USD LIBOR + 8.00%) (Acquired 08/03/2021‑10/14/2022; Cost $2,814,967)(f) | | | 12.63% | | | | 08/27/2026 | | | | 2,865 | | | 2,859,630 |
| TransMontaigne Partners LLC, Term Loan B (1 mo. USD LIBOR + 3.50%) | | | 8.09% | | | | 11/17/2028 | | | | 1,124 | | | 1,120,166 |
WhiteWater Whistler Holdings LLC, Term Loan B(d) | | | - | | | | 01/25/2030 | | | | 311 | | | 311,081 |
| | | | | | | | | | | | | | | 14,581,261 |
| | | | |
| Publishing–4.02% | | | | | | | | | | | | | | |
| Adtalem Global Education, Inc., Term Loan B (1 mo. USD LIBOR + 4.00%) | | | 8.63% | | | | 08/12/2028 | | | | 370 | | | 370,207 |
| Cengage Learning, Inc., Term Loan B (6 mo. USD LIBOR + 4.75%) | | | 9.88% | | | | 06/29/2026 | | | | 2,664 | | | 2,525,460 |
| Clear Channel Worldwide Holdings, Inc., Term Loan B (3 mo. USD LIBOR + 3.50%) | | | 8.33% | | | | 08/21/2026 | | | | 2,304 | | | 2,187,299 |
Dotdash Meredith, Inc., Term Loan B (1 mo. SOFR + 4.00%)(e) | | | 8.67% | | | | 12/01/2028 | | | | 2,978 | | | 2,635,872 |
| Harbor Purchaser, Inc. (Houghton Mifflin Harcourt) | | | | | | | | | | | | | | |
Second Lien Term Loan (1 mo. SOFR +8.50%)(e) | | | 13.12% | | | | 04/08/2030 | | | | 1,353 | | | 1,177,121 |
| Term Loan B (1 mo. SOFR + 5.25%) | | | 9.97% | | | | 04/09/2029 | | | | 2,784 | | | 2,561,331 |
| McGraw-Hill Education, Inc., Term Loan B (1 mo. USD LIBOR + 4.75%) | | | 9.38% | | | | 07/30/2028 | | | | 2,525 | | | 2,429,864 |
| Micro Holding L.P., Term Loan (1 mo. USD LIBOR + 3.75%) | | | 8.38% | | | | 09/13/2024 | | | | 2,032 | | | 2,020,557 |
| | | | | | | | | | | | | | | 15,907,711 |
| | | | |
| Radio & Television–0.97% | | | | | | | | | | | | | | |
Diamond Sports Holdings LLC, Second Lien Term Loan (1 mo. SOFR + 3.25%) (Acquired 03/01/2022; Cost $860,777)(f) | | | 8.03% | | | | 08/24/2026 | | | | 1,304 | | | 153,372 |
| Gray Television, Inc. | | | | | | | | | | | | | | |
| Term Loan C (1 mo. USD LIBOR + 2.50%) | | | 7.07% | | | | 01/02/2026 | | | | 11 | | | 10,680 |
| Term Loan D (1 mo. USD LIBOR + 3.00%) | | | 7.57% | | | | 12/01/2028 | | | | 1,216 | | | 1,204,169 |
| iHeartCommunications, Inc., Incremental Term Loan (1 mo. USD LIBOR + 3.25%) | | | 7.88% | | | | 05/01/2026 | | | | 220 | | | 214,891 |
| Sinclair Television Group, Inc. | | | | | | | | | | | | | | |
| Term Loan B‑2‑B (1 mo. USD LIBOR + 2.50%) | | | 7.14% | | | | 09/30/2026 | | | | 269 | | | 261,209 |
| Term Loan B‑3 (1 mo. USD LIBOR + 3.00%) | | | 7.64% | | | | 04/01/2028 | | | | 578 | | | 557,836 |
| Term Loan B‑4 (1 mo. SOFR + 3.75%) | | | 8.47% | | | | 04/21/2029 | | | | 1,202 | | | 1,174,375 |
| Univision Communications, Inc., First Lien Term Loan (1 mo. USD LIBOR + 3.25%) | | | 7.88% | | | | 05/05/2028 | | | | 267 | | | 263,884 |
| | | | | | | | | | | | | | | 3,840,416 |
| | | | |
| Retailers (except Food & Drug)–3.25% | | | | | | | | | | | | | | |
| Bass Pro Group LLC, Term Loan B‑2 (1 mo. USD LIBOR + 3.75%) | | | 8.38% | | | | 03/06/2028 | | | | 3,112 | | | 3,072,079 |
| CNT Holdings I Corp. (1‑800 Contacts), First Lien Term Loan (1 mo. USD LIBOR + 3.50%) | | | 8.13% | | | | 11/08/2027 | | | | 1,590 | | | 1,564,703 |
See accompanying Notes to Financial Statements which are an integral part of the financial statements.
18 Invesco Senior Loan Fund
| | | | | | | | | | | | | | |
| | | Interest
Rate | | | Maturity
Date | | | Principal Amount (000)(a) | | | Value |
| Retailers (except Food & Drug)–(continued) | | | | | | | | | | | | | | |
| Kirk Beauty One GmbH (Germany) | | | | | | | | | | | | | | |
| Term Loan B‑1 (6 mo. EURIBOR + 5.50%) | | | 7.45% | | | | 04/08/2026 | | | | EUR 298 | | | $ 300,879 |
| Term Loan B‑2 (6 mo. EURIBOR + 5.50%) | | | 7.45% | | | | 04/08/2026 | | | | EUR 171 | | | 173,196 |
| Term Loan B‑3 (3 mo. EURIBOR + 5.25%) | | | 7.45% | | | | 04/08/2026 | | | | EUR 333 | | | 336,353 |
| Term Loan B‑4 (6 mo. EURIBOR + 5.50%) | | | 7.45% | | | | 04/08/2026 | | | | EUR 526 | | | 531,570 |
| Term Loan B‑5 (6 mo. EURIBOR + 5.50%) | | | 7.45% | | | | 04/08/2026 | | | | EUR 117 | | | 118,228 |
| Petco Animal Supplies, Inc., First Lien Term loan (3 mo. SOFR + 3.25%) | | | 8.09% | | | | 03/02/2028 | | | | $ 1,472 | | | 1,459,093 |
| PetSmart LLC, Term Loan (1 mo. SOFR + 3.75%) | | | 8.47% | | | | 02/11/2028 | | | | 4,563 | | | 4,556,908 |
| Savers, Inc., Term Loan (3 mo. USD LIBOR + 5.50%) | | | 10.34% | | | | 04/26/2028 | | | | 748 | | | 741,430 |
| | | | | | | | | | | | | | | 12,854,439 |
| | | | |
| Surface Transport–2.26% | | | | | | | | | | | | | | |
| American Trailer World Corp., First Lien Term Loan (1 mo. SOFR + 3.75%) | | | 8.47% | | | | 03/03/2028 | | | | 732 | | | 650,747 |
| Carriage Purchaser, Inc., Term Loan B (1 mo. USD LIBOR + 4.25%) | | | 8.88% | | | | 09/30/2028 | | | | 251 | | | 247,518 |
| First Student Bidco, Inc. | | | | | | | | | | | | | | |
| Delayed Draw Term Loan (3 mo. SOFR + 4.00%) | | | 8.68% | | | | 07/21/2028 | | | | 113 | | | 110,550 |
| Incremental Term Loan B (3 mo. SOFR+ 4.00%) | | | 8.68% | | | | 07/21/2028 | | | | 1,630 | | | 1,591,915 |
| Term Loan B (3 mo. USD LIBOR + 3.00%) | | | 7.73% | | | | 07/21/2028 | | | | 1,156 | | | 1,105,860 |
| Term Loan C (3 mo. USD LIBOR + 3.00%) | | | 7.73% | | | | 07/21/2028 | | | | 431 | | | 412,327 |
| Hurtigruten (Explorer II AS) (Norway) | | | | | | | | | | | | | | |
Term Loan B (3 mo. EURIBOR + 4.00%) (Acquired 04/16/2021‑05/25/2021; Cost $2,070,245)(f) | | | 7.20% | | | | 02/24/2025 | | | | EUR 1,769 | | | 1,704,985 |
Term Loan C (3 mo. EURIBOR + 8.00%) (Acquired 10/05/2021; Cost $1,164,099)(f) | | | 10.63% | | | | 06/16/2023 | | | | EUR 1,000 | | | 1,054,394 |
| Novae LLC, Term Loan B (3 mo. SOFR+ 5.00%) | | | 9.70% | | | | 12/22/2028 | | | | 306 | | | 265,592 |
| PODS LLC | | | | | | | | | | | | | | |
Term Loan (1 mo. SOFR + 4.00%)(e) | | | 8.68% | | | | 04/01/2028 | | | | 861 | | | 856,496 |
| Term Loan B (1 mo. USD LIBOR + 3.00%) | | | 7.73% | | | | 04/01/2028 | | | | 117 | | | 114,798 |
| STG - XPOI Opportunity, Term Loan B (1 mo. SOFR + 6.00%) | | | 10.78% | | | | 04/30/2028 | | | | 864 | | | 828,015 |
| | | | | | | | | | | | | | | 8,943,197 |
| | | | |
| Telecommunications–6.54% | | | | | | | | | | | | | | |
| Avaya, Inc. | | | | | | | | | | | | | | |
DIP Term Loan(e)(i) | | | 12.56% | | | | 08/15/2023 | | | | 233 | | | 241,756 |
DIP Term Loan(e)(g)(i) | | | 0.00% | | | | 08/15/2023 | | | | 58 | | | 60,439 |
First Lien Term Loan(i)(j) | | | 0.00% | | | | 12/15/2027 | | | | 588 | | | 153,361 |
Term Loan B‑2(i)(j) | | | 0.00% | | | | 12/15/2027 | | | | 967 | | | 250,323 |
| Cablevision Lightpath LLC, Term Loan (1 mo. USD LIBOR + 3.25%) | | | 7.84% | | | | 11/30/2027 | | | | 523 | | | 520,471 |
CCI Buyer, Inc. (Consumer Cellular), Term Loan(d) | | | - | | | | 12/17/2027 | | | | 2,832 | | | 2,791,196 |
| CenturyLink, Inc. | | | | | | | | | | | | | | |
Term Loan A(d) | | | - | | | | 01/31/2025 | | | | 511 | | | 492,467 |
| Term Loan B (1 mo. USD LIBOR + 2.25%) | | | 6.88% | | | | 03/15/2027 | | | | 2,083 | | | 1,736,956 |
| Cincinnati Bell, Inc., Term Loan B‑2 (1 mo. SOFR + 3.25%) | | | 7.97% | | | | 11/22/2028 | | | | 18 | | | 18,214 |
| Crown Subsea Communications Holding, Inc. | | | | | | | | | | | | | | |
Incremental Term Loan(d) | | | - | | | | 04/27/2027 | | | | 581 | | | 573,020 |
| Term Loan (1 mo. SOFR + 4.75%) | | | 9.32% | | | | 04/27/2027 | | | | 858 | | | 845,786 |
| Eagle Broadband Investments LLC (Mega Broadband), Term Loan (3 mo. USD LIBOR + 3.00%) | | | 7.75% | | | | 11/12/2027 | | | | 109 | | | 107,894 |
| Frontier Communications Corp., Term Loan B (3 mo. USD LIBOR + 3.75%) | | | 8.50% | | | | 05/01/2028 | | | | 237 | | | 232,835 |
| Inmarsat Finance PLC (United Kingdom), Term Loan (1 mo. USD LIBOR + 3.50%) | | | 8.14% | | | | 12/11/2026 | | | | 1,142 | | | 1,124,991 |
| Intelsat Jackson Holdings S.A. (Luxembourg), Term Loan B (6 mo. SOFR + 4.25%) | | | 9.08% | | | | 02/01/2029 | | | | 3,308 | | | 3,275,647 |
| Iridium Satellite LLC, Term Loan B (1 mo. USD LIBOR + 2.50%) | | | 7.22% | | | | 11/04/2026 | | | | 25 | | | 25,318 |
| Level 3 Financing, Inc., Term Loan B (1 mo. USD LIBOR + 1.75%) | | | 6.38% | | | | 03/01/2027 | | | | 92 | | | 83,695 |
See accompanying Notes to Financial Statements which are an integral part of the financial statements.
19 Invesco Senior Loan Fund
| | | | | | | | | | | | | | |
| | | Interest
Rate | | | Maturity
Date | | | Principal Amount (000)(a) | | | Value |
| Telecommunications–(continued) | | | | | | | | | | | | | | |
| MLN US HoldCo LLC (dba Mitel) | | | | | | | | | | | | | | |
| First Lien Term Loan (6 mo. USD LIBOR + 4.50%) | | | 8.25% | | | | 11/30/2025 | | | | $ 23 | | | $ 6,824 |
First Lien Term Loan (6 mo. SOFR + 6.70%)(e) | | | 11.15% | | | | 11/01/2027 | | | | 3,429 | | | 2,486,136 |
| First Lien Term Loan (6 mo. SOFR + 9.25%) | | | 13.70% | | | | 11/01/2027 | | | | 1,357 | | | 1,037,691 |
| Term Loan (6 mo. SOFR + 6.44%) | | | 10.89% | | | | 11/01/2027 | | | | 1,459 | | | 1,429,874 |
| Radiate Holdco LLC, Term Loan B (1 mo. USD LIBOR + 3.25%) | | | 7.88% | | | | 09/25/2026 | | | | 1,167 | | | 972,068 |
| SBA Senior Finance II LLC, Term Loan (3 mo. USD LIBOR + 1.75%) | | | 6.41% | | | | 04/11/2025 | | | | 11 | | | 11,317 |
| Telesat LLC, Term Loan B‑5 (1 mo. USD LIBOR + 2.75%) | | | 7.58% | | | | 12/07/2026 | | | | 2,239 | | | 1,210,815 |
| U.S. Telepacific Corp., Term Loan (3 mo. SOFR + 1.15%) | | | 7.25% | | | | 05/01/2026 | | | | 2,954 | | | 945,297 |
| Viasat, Inc., Term Loan (1 mo. SOFR + 3.75%) | | | 9.23% | | | | 03/02/2029 | | | | 631 | | | 625,735 |
Voyage Digital (NC) Ltd., Term Loan B (3 mo. SOFR + 4.50%)(e) | | | 9.30% | | | | 05/10/2029 | | | | 841 | | | 834,402 |
| Windstream Services LLC, Term Loan (1 mo. SOFR + 6.25%) | | | 10.97% | | | | 09/21/2027 | | | | 2,165 | | | 1,949,487 |
| Zayo Group LLC, Incremental Term Loan (1 mo. SOFR + 4.25%) | | | 8.87% | | | | 03/09/2027 | | | | 2,117 | | | 1,811,774 |
| | | | | | | | | | | | | | | 25,855,789 |
| | | | |
| Utilities–2.67% | | | | | | | | | | | | | | |
| APLP Holdings L.P. (Canada), Term Loan (3 mo. USD LIBOR + 3.75%) | | | 8.48% | | | | 05/14/2027 | | | | 315 | | | 315,439 |
| Brookfield WEC Holdings, Inc. | | | | | | | | | | | | | | |
| First Lien Term Loan (1 mo. USD LIBOR + 2.75%) | | | 7.38% | | | | 08/01/2025 | | | | 341 | | | 340,668 |
| Incremental Term Loan (1 mo. SOFR+ 3.75%) | | | 8.37% | | | | 08/01/2025 | | | | 1,064 | | | 1,065,300 |
| Eastern Power LLC, Term Loan (3 mo. USD LIBOR + 3.75%) | | | 8.48% | | | | 10/02/2025 | | | | 1,079 | | | 984,561 |
| Generation Bridge LLC | | | | | | | | | | | | | | |
| Term Loan B (3 mo. USD LIBOR + 5.00%) | | | 9.73% | | | | 12/01/2028 | | | | 748 | | | 747,227 |
| Term Loan C (1 mo. USD LIBOR + 5.00%) | | | 9.73% | | | | 12/01/2028 | | | | 16 | | | 16,445 |
| Granite Generation LLC, Term Loan (1 mo. USD LIBOR + 3.75%) | | | 8.38% | | | | 11/09/2026 | | | | 1,842 | | | 1,768,932 |
| Innio Group Holding GmbH, Term Loan B (3 mo. EURIBOR + 3.75%) | | | 5.48% | | | | 10/31/2025 | | | | EUR 300 | | | 309,924 |
| KAMC Holdings, Inc. (Franklin Energy Group), First Lien Term Loan B (3 mo. USD LIBOR + 4.00%) | | | 8.95% | | | | 08/14/2026 | | | | 728 | | | 636,666 |
| Lightstone Holdco LLC | | | | | | | | | | | | | | |
| Term Loan B (1 mo. SOFR + 5.75%) | | | 10.37% | | | | 02/01/2027 | | | | 2,462 | | | 2,103,113 |
| Term Loan C (1 mo. SOFR + 5.75%) | | | 10.37% | | | | 02/01/2027 | | | | 139 | | | 118,951 |
Nautilus Power LLC, Term Loan (3 mo. USD LIBOR + 4.25%) (Acquired 04/28/2017‑05/22/2019; Cost $1,183,078)(f) | | | 8.88% | | | | 05/16/2024 | | | | 1,185 | | | 881,119 |
| Pike Corp., Term Loan (1 mo. SOFR+ 3.50%) | | | 8.12% | | | | 01/21/2028 | | | | 221 | | | 220,883 |
| Urbaser (Spain), Term Loan B (6 mo. EURIBOR + 4.18%) | | | 6.55% | | | | 10/23/2028 | | | | EUR 643 | | | 677,236 |
| USIC Holding, Inc. | | | | | | | | | | | | | | |
| First Lien Term Loan (1 mo. USD LIBOR + 3.50%) | | | 8.13% | | | | 05/12/2028 | | | | 231 | | | 224,517 |
| Second Lien Term Loan (1 mo. USD LIBOR + 6.50%) | | | 11.13% | | | | 05/14/2029 | | | | 172 | | | 159,870 |
| | | | | | | | | | | | | | | 10,570,851 |
| Total Variable Rate Senior Loan Interests (Cost $431,760,909) | | | | | | | | | | | | | | 399,127,531 |
| | | | |
| | | | | | | | | Shares | | | |
Common Stocks & Other Equity Interests–10.34%(k) | | | | | | | | | | | | | | |
| | | | |
| Aerospace & Defense–0.84% | | | | | | | | | | | | | | |
| | | |
IAP Worldwide Services, Inc. (Acquired 07/18/2014‑02/08/2019; Cost $587,458)(e)(f) | | | | | | | | 342 | | | 3,305,240 |
| | | | |
| Automotive–0.01% | | | | | | | | | | | | | | |
| | | | |
ThermaSys Corp. (Acquired 12/31/2018; Cost $474,958)(e)(f) | | | | | | | | | | | 676,996 | | | 20,310 |
| | | | |
| Building & Development–0.00% | | | | | | | | | | | | | | |
Haya (Holdco2 PLC/Real Estate SAU) (Acquired 06/14/2022; Cost $0)(e)(f) | | | | | | | | | | | 298 | | | 0 |
Lake at Las Vegas Joint Venture LLC, Class A (Acquired 07/15/2010;
Cost $7,938,060)(e)(f) | | | | | | | | | | | 780 | | | 0 |
| | | | |
Lake at Las Vegas Joint Venture LLC, Class B (Acquired 07/15/2010;
Cost $93,975)(e)(f) | | | | | | | | | | | 9 | | | 0 |
| | | | | | | | | | | | | | | 0 |
See accompanying Notes to Financial Statements which are an integral part of the financial statements.
20 Invesco Senior Loan Fund
| | | | | | | | | | | | |
| | | | | | | | Shares | | | Value |
| Business Equipment & Services–1.02% | | | | | | | | | | | | |
Checkout Holding Corp. (Acquired 02/15/2019; Cost $2,251,966)(f) | | | | | | | | | 6,741 | | | $ 2,106 |
My Alarm Center LLC, Class A (Acquired 03/09/2021‑12/03/2021; Cost $3,381,699)(e)(f) | | | | | | | | | 25,611 | | | 4,033,698 |
| | | | | | | | | | | | | 4,035,804 |
| | | | |
| Containers & Glass Products–0.02% | | | | | | | | | | | | |
Libbey Glass, Inc. (Acquired 11/13/2020‑02/10/2022; Cost $32,297)(f) | | | | | | | | | 7,940 | | | 68,482 |
| | | | |
| Electronics & Electrical–0.00% | | | | | | | | | | | | |
Riverbed Technology, Inc. (Acquired 12/06/2021; Cost $316,609)(e)(f) | | | | | | | | | 18,902 | | | 4,820 |
| | | | |
| Financial Intermediaries–0.06% | | | | | | | | | | | | |
RJO Holdings Corp.(e) | | | | | | | | | 2,851 | | | 136,875 |
RJO Holdings Corp., Class A(e) | | | | | | | | | 2,314 | | | 111,065 |
RJO Holdings Corp., Class B(e) | | | | | | | | | 3,000 | | | 30 |
| | | | | | | | | | | | | 247,970 |
| | | | |
| Health Care–0.01% | | | | | | | | | | | | |
Envigo RMS Holding Corp. (Acquired 04/29/2014; Cost $0)(e)(f) | | | | | | | | | 7,462 | | | 53,167 |
| | | | |
| Leisure Goods, Activities & Movies–0.50% | | | | | | | | | | | | |
Crown Finance US, Inc., Wts., expiring 11/23/2025 (Acquired 12/09/2020; Cost $0)(f)(i) | | | | | | | | | 171,770 | | | 0 |
USF S&H Holdco LLC (Acquired 12/02/2019; Cost $1,287,958)(e)(f) | | | | | | | | | 1,785 | | | 1,977,944 |
Vue International Bidco PLC(d)(e) | | | | | | | | | 987,581 | | | 0 |
| | | | | | | | | | | | | 1,977,944 |
| | | | |
| Lodging & Casinos–0.47% | | | | | | | | | | | | |
Bally’s Corp.(l) | | | | | | | | | 72,757 | | | 1,436,950 |
Caesars Entertainment, Inc.(l) | | | | | | | | | 8,413 | | | 427,044 |
| | | | | | | | | | | | | 1,863,994 |
| | | | |
| Oil & Gas–5.67% | | | | | | | | | | | | |
Aquadrill LLC (Acquired 05/27/2021; Cost $1,529,106)(f) | | | | | | | | | 49,326 | | | 2,778,706 |
HGIM Corp. (Acquired 07/02/2018‑08/31/2021; Cost $769,269)(e)(f) | | | | | | | | | 8,544 | | | 192,240 |
HGIM Corp., Wts., expiring 07/02/2043 (Acquired 07/02/2018; Cost $487,931)(e)(f) | | | | | | | | | 5,420 | | | 121,950 |
McDermott International Ltd.(l) | | | | | | | | | 210,471 | | | 81,978 |
McDermott International Ltd.(e) | | | | | | | | | 657,235 | | | 255,993 |
NexTier Oilfield Solutions, Inc.(l) | | | | | | | | | 44,006 | | | 401,775 |
Noble Corp. PLC(l) | | | | | | | | | 929 | | | 38,730 |
QuarterNorth Energy, Inc. (Acquired 06/02/2021‑10/29/2021; Cost $3,240,271)(e)(f) | | | | | | | | | 78,026 | | | 15,565,407 |
QuarterNorth Energy, Inc., Wts., expiring 08/27/2029 (Acquired 08/27/2021;
Cost $133,695)(e)(f) | | | | | | | | | 14,855 | | | 496,157 |
QuarterNorth Energy, Inc., Wts., expiring 08/27/2029 (Acquired 08/27/2021;
Cost $171,654)(e)(f) | | | | | | | | | 28,609 | | | 288,093 |
Samson Investment Co., Class A (Acquired 03/01/2017; Cost $3,246,273)(e)(f) | | | | | | | | | 84,254 | | | 52,659 |
Southcross Energy Partners L.P. (Acquired 08/05/2014‑10/29/2020;
Cost $759,465)(e)(f) | | | | | | | | | 73,367 | | | 550 |
Transocean Ltd.(l) | | | | | | | | | 191,873 | | | 1,341,192 |
Tribune Resources LLC (Acquired 04/03/2018; Cost $1,947,502)(f) | | | | | | | | | 382,888 | | | 801,768 |
Tribune Resources LLC, Wts., expiring 04/03/2023 (Acquired 04/03/2018;
Cost $8,198)(e)(f) | | | | | | | | | 99,132 | | | 2,478 |
| | | | | | | | | | | | | 22,419,676 |
| | | | |
| Radio & Television–0.19% | | | | | | | | | | | | |
iHeartMedia, Inc., Class A(l) | | | | | | | | | 101,257 | | | 735,126 |
iHeartMedia, Inc., Class B(e) | | | | | | | | | 17 | | | 123 |
| | | | | | | | | | | | | 735,249 |
See accompanying Notes to Financial Statements which are an integral part of the financial statements.
21 Invesco Senior Loan Fund
| | | | | | | | | | | | | | | | | | | | |
| | | | | | | | | Shares | | | Value | |
| | |
| Retailers (except Food & Drug)–0.09% | | | | | | | | | | | | | | | | | | | | |
Claire’s Stores, Inc. (Acquired 10/12/2018; Cost $716,681)(f) | | | | | | | | | | | | | | | 446 | | | $ | 221,142 | |
| | |
Toys ’R’ Us‑Delaware, Inc.(e) | | | | | | | | | | | | | | | 17 | | | | 41,827 | |
| | |
Vivarte S.A.S.(e) | | | | | | | | | | | | | | | 233,415 | | | | 109,725 | |
| | |
| | | | | | | | | | | | | | | | | | | 372,694 | |
| | |
| | | | | |
| Surface Transport–0.08% | | | | | | | | | | | | | | | | | | | | |
Commercial Barge Line Co. (Acquired 02/15/2018‑02/06/2020; Cost $420,320)(f) | | | | | | | | | | | | | | | 4,992 | | | | 147,264 | |
| | |
Commercial Barge Line Co., Series A, Wts., expiring 08/18/2030 (Acquired 02/03/2023; Cost $0)(f) | | | | | | | | | | | | | | | 19,526 | | | | 9,153 | |
| | |
Commercial Barge Line Co., Series B, Wts., expiring 04/30/2045 (Acquired 02/03/2023; Cost $0)(f) | | | | | | | | | | | | | | | 15,443 | | | | 9,652 | |
| | |
Commercial Barge Line Co., Wts., expiring 04/27/2045 (Acquired 02/15/2018‑02/06/2020; Cost $441,875)(f) | | | | | | | | | | | | | | | 5,248 | | | | 154,816 | |
| | |
| | | | | | | | | | | | | | | | | | | 320,885 | |
| | |
| | | | | |
| Utilities–1.38% | | | | | | | | | | | | | | | | | | | | |
| Vistra Corp. | | | | | | | | | | | | | | | 227,983 | | | | 5,013,346 | |
| | |
| Vistra Operations Co. LLC, Rts., expiring 12/31/2046 | | | | | | | | | | | | | | | 366,133 | | | | 451,625 | |
| | |
| | | | | | | | | | | | | | | | | | | 5,464,971 | |
| | |
| Total Common Stocks & Other Equity Interests (Cost $45,201,414) | | | | | | | | | | | | | | | | | | | 40,891,206 | |
| | |
| | | | |
| | | Interest
Rate | | | Maturity
Date | | | Principal Amount (000)(a) | | | | |
| U.S. Dollar Denominated Bonds & Notes–3.34% | | | | | | | | | | | | | | | | | | | | |
| | | | | |
| Aerospace & Defense–0.43% | | | | | | | | | | | | | | | | | | | | |
Maxar Technologies, Inc. (m) | | | 7.75 | % | | | 06/15/2027 | | | | | | | $ | 530 | | | | 554,690 | |
| | |
Rand Parent LLC(m) | | | 8.50 | % | | | 02/15/2030 | | | | | | | | 693 | | | | 666,146 | |
| | |
Spirit AeroSystems, Inc.(m) | | | 9.38 | % | | | 11/30/2029 | | | | | | | | 446 | | | | 471,645 | |
| | |
| | | | | | | | | | | | | | | | | | | 1,692,481 | |
| | |
| | | | | |
| Air Transport–0.08% | | | | | | | | | | | | | | | | | | | | |
Mesa Airlines, Inc., Class B (Acquired 11/25/2015; Cost $568,104)(e)(f) | | | 5.75 | % | | | 07/15/2025 | | | | | | | | 341 | | | | 330,366 | |
| | |
| | | | | |
| Building & Development–0.70% | | | | | | | | | | | | | | | | | | | | |
APCOA Parking Holdings GmbH (Germany) (m) | | | 4.63 | % | | | 01/15/2027 | | | | EUR | | | | 147 | | | | 134,336 | |
| | |
Brookfield Property REIT, Inc./BPR Cumulus LLC/BPR Nimbus LLC/GGSI Sellco LLC (Acquired 09/22/2021‑12/17/2021; Cost $1,041,663)(f)(m) | | | 4.50 | % | | | 04/01/2027 | | | | | | | | 1,045 | | | | 896,511 | |
| | |
Brookfield Property REIT, Inc./BPR Cumulus LLC/BPR Nimbus LLC/GGSI Sellco LLC (Acquired 10/13/2020‑11/19/2020; Cost $1,699,494)(f)(m) | | | 5.75 | % | | | 05/15/2026 | | | | | | | | 1,873 | | | | 1,726,334 | |
| | |
| | | | | | | | | | | | | | | | | | | 2,757,181 | |
| | |
| | | | | |
| Cable & Satellite Television–0.53% | | | | | | | | | | | | | | | | | | | | |
Altice Financing S.A. (Luxembourg) (m) | | | 5.75 | % | | | 08/15/2029 | | | | | | | | 22 | | | | 18,016 | |
| | |
Altice Financing S.A. (Luxembourg)(m) | | | 5.00 | % | | | 01/15/2028 | | | | | | | | 693 | | | | 575,731 | |
| | |
Altice France Holding S.A. (Luxembourg)(m) | | | 8.00 | % | | | 05/15/2027 | | | | EUR | | | | 336 | | | | 283,658 | |
| | |
Altice France S.A. (France)(m) | | | 5.50 | % | | | 01/15/2028 | | | | | | | | 328 | | | | 270,505 | |
| | |
Altice France S.A. (France)(m) | | | 5.50 | % | | | 10/15/2029 | | | | | | | | 305 | | | | 239,023 | |
| | |
Virgin Media Secured Finance PLC (United Kingdom)(m) | | | 4.50 | % | | | 08/15/2030 | | | | | | | | 849 | | | | 699,689 | |
| | |
| | | | | | | | | | | | | | | | | | | 2,086,622 | |
| | |
| | | | | |
| Chemicals & Plastics–0.21% | | | | | | | | | | | | | | | | | | | | |
SK Invictus Intermediate II S.a.r.l. (Luxembourg) (m) | | | 5.00 | % | | | 10/30/2029 | | | | | | | | 1,067 | | | | 850,111 | |
| | |
| | | | | |
| Food Service–0.12% | | | | | | | | | | | | | | | | | | | | |
eG Global Finance PLC (United Kingdom) (m) | | | 6.75 | % | | | 02/07/2025 | | | | | | | | 412 | | | | 372,325 | |
| | |
See accompanying Notes to Financial Statements which are an integral part of the financial statements.
22 Invesco Senior Loan Fund
| | | | | | | | | | | | | | | | | | | | |
| | | Interest
Rate | | | Maturity
Date | | | Principal Amount (000)(a) | | | Value | |
| | |
| Food Service–(continued) | | | | | | | | | | | | | | | | | | | | |
WW International, Inc.(m) | | | 4.50 | % | | | 04/15/2029 | | | | | | | $ | 225 | | | $ | 115,005 | |
| | |
| | | | | | | | | | | | | | | | | | | 487,330 | |
| | |
| | | | | |
| Health Care–0.06% | | | | | | | | | | | | | | | | | | | | |
Global Medical Response, Inc. (m) | | | 6.50 | % | | | 10/01/2025 | | | | | | | | 298 | | | | 223,834 | |
| | |
| | | | | |
| Industrial Equipment–0.02% | | | | | | | | | | | | | | | | | | | | |
Chart Industries, Inc. (m) | | | 7.50 | % | | | 01/01/2030 | | | | | | | | 93 | | | | 94,511 | |
| | |
| | | | | |
| Lodging & Casinos–0.06% | | | | | | | | | | | | | | | | | | | | |
Caesars Entertainment, Inc. (m) | | | 7.00 | % | | | 02/15/2030 | | | | | | | | 218 | | | | 219,891 | |
| | |
| | | | | |
| Publishing–0.44% | | | | | | | | | | | | | | | | | | | | |
McGraw-Hill Education, Inc. (m) | | | 5.75 | % | | | 08/01/2028 | | | | | | | | 1,990 | | | | 1,744,648 | |
| | |
| | | | | |
| Radio & Television–0.10% | | | | | | | | | | | | | | | | | | | | |
Diamond Sports Group LLC/Diamond Sports Finance Co. (Acquired 07/18/2019‑10/16/2020; Cost $773,023)(f)(m) | | | 5.38 | % | | | 08/15/2026 | | | | | | | | 825 | | | | 93,596 | |
| | |
iHeartCommunications, Inc.(m) | | | 4.75 | % | | | 01/15/2028 | | | | | | | | 194 | | | | 163,315 | |
| | |
Univision Communications, Inc.(m) | | | 7.38 | % | | | 06/30/2030 | | | | | | | | 133 | | | | 126,275 | |
| | |
| | | | | | | | | | | | | | | | | | | 383,186 | |
| | |
| | | | | |
| Retailers (except Food & Drug)–0.30% | | | | | | | | | | | | | | | | | | | | |
Evergreen Acqco 1 L.P./TVI, Inc. (m) | | | 9.75 | % | | | 04/26/2028 | | | | | | | | 1,216 | | | | 1,204,016 | |
| | |
| | | | | |
| Telecommunications–0.29% | | | | | | | | | | | | | | | | | | | | |
Connect Finco S.a.r.l./Connect US Finco LLC (United Kingdom) (m) | | | 6.75 | % | | | 10/01/2026 | | | | | | | | 352 | | | | 326,001 | |
| | |
Windstream Escrow LLC/Windstream Escrow Finance Corp.(m) | | | 7.75 | % | | | 08/15/2028 | | | | | | | | 1,007 | | | | 824,114 | |
| | |
| | | | | | | | | | | | | | | | | | | 1,150,115 | |
| | |
| Total U.S. Dollar Denominated Bonds & Notes (Cost $15,198,421) | | | | | | | | | | | | | | | | | | | 13,224,292 | |
| | |
| | | | | |
Non‑U.S. Dollar Denominated Bonds & Notes–3.34%(n) | | | | | | | | | | | | | | | | | | | | |
| | | | | |
| Automotive–0.27% | | | | | | | | | | | | | | | | | | | | |
Cabonline Group Holding AB (Sweden) (3 mo. STIBOR + 9.50%)(m)(o) | | | 12.37 | % | | | 04/19/2026 | | | | SEK | | | | 10,000 | | | | 878,869 | |
| | |
Leather 2 S.p.A. (Italy) (3 mo. EURIBOR + 4.50%)(m)(o) | | | 6.70 | % | | | 09/30/2028 | | | | EUR | | | | 206 | | | | 175,255 | |
| | |
| | | | | | | | | | | | | | | | | | | 1,054,124 | |
| | |
| | | | | |
| Building & Development–0.10% | | | | | | | | | | | | | | | | | | | | |
APCOA Parking Holdings GmbH (Germany) (3 mo. EURIBOR + 5.00%)(m)(o) | | | 7.29 | % | | | 01/15/2027 | | | | EUR | | | | 272 | | | | 281,638 | |
| | |
Haya (Holdco2 PLC/Real Estate SAU) (Spain) (Acquired 06/14/2022; Cost $179,969)(f)(o) | | | 10.95 | % | | | 11/30/2025 | | | | EUR | | | | 246 | | | | 102,012 | |
| | |
| | | | | | | | | | | | | | | | | | | 383,650 | |
| | |
| | | | | |
| Business Equipment & Services–0.18% | | | | | | | | | | | | | | | | | | | | |
Paganini Bidco S.p.A. (Italy) (3 mo. EURIBOR + 4.25%)(m)(o) | | | 6.73 | % | | | 10/30/2028 | | | | EUR | | | | 694 | | | | 720,280 | |
| | |
| | | | | |
| Cable & Satellite Television–0.21% | | | | | | | | | | | | | | | | | | | | |
Altice Financing S.A. (Luxembourg)(m) | | | 3.00 | % | | | 01/15/2028 | | | | EUR | | | | 260 | | | | 219,719 | |
| | |
Altice Finco S.A. (Luxembourg)(m) | | | 4.75 | % | | | 01/15/2028 | | | | EUR | | | | 756 | | | | 620,474 | |
| | |
| | | | | | | | | | | | | | | | | | | 840,193 | |
| | |
| | | | | |
| Chemicals & Plastics–0.09% | | | | | | | | | | | | | | | | | | | | |
Herens Midco S.a.r.l. (Luxembourg)(m) | | | 5.25 | % | | | 05/15/2029 | | | | EUR | | | | 506 | | | | 369,954 | |
| | |
| | | | | |
| Electronics & Electrical–0.34% | | | | | | | | | | | | | | | | | | | | |
| Castor SpA (Italy) | | | 6.25 | % | | | 02/15/2029 | | | | EUR | | | | 660 | | | | 680,162 | |
| | |
See accompanying Notes to Financial Statements which are an integral part of the financial statements.
23 Invesco Senior Loan Fund
| | | | | | | | | | | | | | | | | | | | |
| | | Interest
Rate | | | Maturity
Date | | | Principal Amount (000)(a) | | | Value | |
| | |
| Electronics & Electrical–(continued) | | | | | | | | | | | | | | | | | | | | |
Nobel Bidco B.V. (Netherlands)(m) | | | 3.13 | % | | | 06/15/2028 | | | | EUR | | | | 891 | | | $ | 662,310 | |
| | |
| | | | | | | | | | | | | | | | | | | 1,342,472 | |
| | |
| | | | | |
| Financial Intermediaries–1.00% | | | | | | | | | | | | | | | | | | | | |
AnaCap Financial Europe S.A. SICAV-RAIF (Italy) (3 mo. EURIBOR + 5.00%)(m)(o) | | | 7.48 | % | | | 08/01/2024 | | | | EUR | | | | 1,101 | | | | 971,891 | |
| | |
Garfunkelux Holdco 3 S.A. (Luxembourg) (3 mo. EURIBOR + 6.25%)(m)(o) | | | 8.73 | % | | | 05/01/2026 | | | | EUR | | | | 632 | | | | 589,687 | |
| | |
Garfunkelux Holdco 3 S.A. (Luxembourg)(m) | | | 6.75 | % | | | 11/01/2025 | | | | EUR | | | | 909 | | | | 791,494 | |
| | |
Kane Bidco Ltd. (United Kingdom)(m) | | | 5.00 | % | | | 02/15/2027 | | | | EUR | | | | 139 | | | | 137,380 | |
| | |
Kane Bidco Ltd. (United Kingdom)(m) | | | 6.50 | % | | | 02/15/2027 | | | | GBP | | | | 174 | | | | 191,070 | |
| | |
Sherwood Financing PLC (United Kingdom)(m) | | | 4.50 | % | | | 11/15/2026 | | | | EUR | | | | 200 | | | | 186,618 | |
| | |
Sherwood Financing PLC (United Kingdom)(m) | | | 6.00 | % | | | 11/15/2026 | | | | GBP | | | | 202 | | | | 202,642 | |
| | |
Sherwood Financing PLC (United Kingdom) (3 mo. EURIBOR + 4.63%)(m)(o) | | | 7.28 | % | | | 11/15/2027 | | | | EUR | | | | 891 | | | | 897,528 | |
| | |
| | | | | | | | | | | | | | | | | | | 3,968,310 | |
| | |
| | | | | |
| Health Care–0.13% | | | | | | | | | | | | | | | | | | | | |
Kepler S.p.A. (Italy) (3 mo. EURIBOR + 5.75%)(m)(o) | | | 7.80 | % | | | 05/15/2029 | | | | EUR | | | | 486 | | | | 508,388 | |
| | |
| | | | | |
| Home Furnishings–0.32% | | | | | | | | | | | | | | | | | | | | |
Ideal Standard International S.A. (Belgium)(m) | | | 6.38 | % | | | 07/30/2026 | | | | EUR | | | | 316 | | | | 188,810 | |
| | |
Very Group Funding PLC (The) (United Kingdom)(m) | | | 6.50 | % | | | 08/01/2026 | | | | GBP | | | | 1,101 | | | | 1,067,747 | |
| | |
| | | | | | | | | | | | | | | | | | | 1,256,557 | |
| | |
| | | | | |
| Industrial Equipment–0.10% | | | | | | | | | | | | | | | | | | | | |
Summer (BC) Holdco A S.a.r.l. (Luxembourg)(m) | | | 9.25 | % | | | 10/31/2027 | | | | EUR | | | | 450 | | | | 397,045 | |
| | |
| | | | | |
| Leisure Goods, Activities & Movies–0.11% | | | | | | | | | | | | | | | | | | | | |
Deuce Finco PLC (United Kingdom) (3 mo. EURIBOR + 4.75%)(m)(o) | | | 6.80 | % | | | 06/15/2027 | | | | EUR | | | | 211 | | | | 211,487 | |
| | |
Deuce Finco PLC (United Kingdom)(m) | | | 5.50 | % | | | 06/15/2027 | | | | GBP | | | | 211 | | | | 215,555 | |
| | |
| | | | | | | | | | | | | | | | | | | 427,042 | |
| | |
| | | | | |
| Retailers (except Food & Drug)–0.34% | | | | | | | | | | | | | | | | | | | | |
Douglas GmbH (Germany)(m) | | | 6.00 | % | | | 04/08/2026 | | | | EUR | | | | 788 | | | | 735,322 | |
| | |
Kirk Beauty SUN GmbH (Germany)(m) | | | 8.25 | % | | | 10/01/2026 | | | | EUR | | | | 734 | | | | 592,791 | |
| | |
| | | | | | | | | | | | | | | | | | | 1,328,113 | |
| | |
| | | | | |
| Surface Transport–0.15% | | | | | | | | | | | | | | | | | | | | |
Zenith Finco PLC (United Kingdom)(m) | | | 6.50 | % | | | 06/30/2027 | | | | GBP | | | | 632 | | | | 603,429 | |
| | |
| Total Non‑U.S. Dollar Denominated Bonds & Notes (Cost $16,712,518) | | | | | | | | | | | | | | | | | | | 13,199,557 | |
| | |
| | | | | |
| | | | | | | | | | | | Shares | | | | |
Preferred Stocks–0.75%(k) | | | | | | | | | | | | | | | | | | | | |
| | | | | |
| Automotive–0.00% | | | | | | | | | | | | | | | | | | | | |
ThermaSys Corp., Series A, Pfd. (Acquired 12/31/2018; Cost $151,015)(e)(f) | | | | | | | | | | | | | | | 144,220 | | | | 4,327 | |
| | |
| | | | | |
| Electronics & Electrical–0.00% | | | | | | | | | | | | | | | | | | | | |
Riverbed Technology, Inc., Pfd. (Acquired 12/06/2021; Cost $0)(e)(f) | | | | | | | | | | | | | | | 27,194 | | | | 6,934 | |
| | |
Riverbed Technology, Inc., Pfd.(e) | | | | | | | | | | | | | | | 8,195 | | | | 2,090 | |
| | |
| | | | | | | | | | | | | | | | | | | 9,024 | |
| | |
| | | | | |
| Financial Intermediaries–0.05% | | | | | | | | | | | | | | | | | | | | |
RJO Holdings Corp., Series A‑2, Pfd.(e) | | | | | | | | | | | | | | | 584 | | | | 208,492 | |
| | |
| | | | | |
| Oil & Gas–0.10% | | | | | | | | | | | | | | | | | | | | |
McDermott International Ltd., Pfd.(e) | | | | | | | | | | | | | | | 564 | | | | 366,547 | |
| | |
See accompanying Notes to Financial Statements which are an integral part of the financial statements.
24 Invesco Senior Loan Fund
| | | | | | | | | | | | | | | | |
| | | | | | | | | Shares | | | Value | |
| | |
| Oil & Gas–(continued) | | | | | | | | | | | | | | | | |
Southcross Energy Partners L.P., Series A, Pfd. (Acquired 05/07/2019‑08/23/2019;
Cost $291,940)(e)(f) | | | | | | | | | | | 292,193 | | | $ | 16,070 | |
| | |
| | | | | | | | | | | | | | | 382,617 | |
| | |
| | | | |
| Surface Transport–0.60% | | | | | | | | | | | | | | | | |
Commercial Barge Line Co., Series A, Pfd. (Acquired 02/15/2018‑02/06/2020; Cost $938,463)(f) | | | | | | | | | | | 18,575 | | | | 399,362 | |
| | |
Commercial Barge Line Co., Series A, Pfd., Wts., expiring 04/27/2045 (Acquired 02/15/2018‑02/06/2020; Cost $986,469)(f) | | | | | | | | | | | 19,526 | | | | 419,809 | |
| | |
Commercial Barge Line Co., Series B, Pfd. (Acquired 02/05/2020‑10/27/2020; Cost $505,738)(f) | | | | | | | | | | | 21,989 | | | | 901,549 | |
| | |
Commercial Barge Line Co., Series B, Pfd., Wts., expiring 04/27/2045 (Acquired 02/05/2020‑10/27/2020; Cost $355,189)(f) | | | | | | | | | | | 15,443 | | | | 633,163 | |
| | |
| | | | | | | | | | | | | | | 2,353,883 | |
| | |
| Total Preferred Stocks (Cost $3,474,663) | | | | | | | | | | | | | | | 2,958,343 | |
| | |
| | | | |
| | | Interest
Rate | | | Maturity
Date | | | Principal Amount (000)(a) | | | | |
| Municipal Obligations–0.45% | | | | | | | | | | | | | | | | |
| | | | |
| Arizona–0.45% | | | | | | | | | | | | | | | | |
Arizona (State of) Industrial Development Authority,(NewLife Forest Restoration, LLC), Series 2022, RB
(Acquired 02/22/2022; Cost $1,966,830) (Cost $1,069,699)(f)(m) | | | 9.00 | % | | | 01/01/2028 | | | $ | 2,154 | | | | 1,794,300 | |
| | |
TOTAL INVESTMENTS IN SECURITIES(p)-119.11%
(Cost $513,417,624) | | | | | | | | | | | | | | | 471,195,229 | |
| | |
| BORROWINGS-(20.85)% | | | | | | | | | | | | | | | (82,500,000 | ) |
| | |
| OTHER ASSETS LESS LIABILITIES-1.74% | | | | | | | | | | | | | | | 6,910,032 | |
| | |
| NET ASSETS-100.00% | | | | | | | | | | | | | | $ | 395,605,261 | |
| | |
| | |
| Investment Abbreviations: |
| |
| DIP | | – Debtor‑in‑Possession |
| EUR | | – Euro |
| EURIBOR | | – Euro Interbank Offered Rate |
| GBP | | – British Pound Sterling |
| LIBOR | | – London Interbank Offered Rate |
| LOC | | – Letter of Credit |
| Pfd. | | – Preferred |
| PIK | | – Pay‑in‑Kind |
| RB | | – Revenue Bonds |
| Rts. | | – Rights |
| SEK | | – Swedish Krona |
| SOFR | | – Secured Overnight Financing Rate |
| SONIA | | – Sterling Overnight Index Average |
| STIBOR | | – Stockholm Interbank Offered Rate |
| USD | | – U.S. Dollar |
| Wts. | | – Warrants |
See accompanying Notes to Financial Statements which are an integral part of the financial statements.
25 Invesco Senior Loan Fund
Notes to Schedule of Investments:
| (a) | Principal amounts are denominated in U.S. dollars unless otherwise noted. |
| (b) | Variable rate senior loan interests often require prepayments from excess cash flow or permit the borrower to repay at its election. The degree to which borrowers repay, whether as a contractual requirement or at their election, cannot be predicted with any accuracy. As a result, the actual remaining maturity may be substantially less than the stated maturities shown. However, it is anticipated that the variable rate senior loan interests will have an expected average life of three to five years. |
| (c) | Variable rate senior loan interests are, at present, not readily marketable, not registered under the Securities Act of 1933, as amended (the “1933 Act”) and may be subject to contractual and legal restrictions on sale. Variable rate senior loan interests in the Fund���s portfolio generally have variable rates which adjust to a base, such as the London Interbank Offered Rate (“LIBOR”), on set dates, typically every 30 days, but not greater than one year, and/or have interest rates that float at margin above a widely recognized base lending rate such as the Prime Rate of a designated U.S. bank. |
| (d) | This variable rate interest will settle after February 28, 2023, at which time the interest rate will be determined. |
| (e) | Security valued using significant unobservable inputs (Level 3). See Note 3. |
| (f) | Restricted security. The aggregate value of these securities at February 28, 2023 was $66,553,487, which represented 16.82% of the Fund’s Net Assets. |
| (g) | All or a portion of this holding is subject to unfunded loan commitments. Interest rate will be determined at the time of funding. See Note 7. |
| (h) | All or a portion of this security is Pay‑in‑Kind. Pay‑in‑Kind securities pay interest income in the form of securities. |
| (i) | The borrower has filed for protection in federal bankruptcy court. |
| (j) | Defaulted security. Currently, the issuer is in default with respect to principal and/or interest payments. The aggregate value of these securities at February 28, 2023 was $3,206,094, which represented less than 1% of the Fund’s Net Assets. |
| (k) | Securities acquired through the restructuring of senior loans. |
| (l) | Non‑income producing security. |
| (m) | Security purchased or received in a transaction exempt from registration under the 1933 Act. The security may be resold pursuant to an exemption from registration under the 1933 Act, typically to qualified institutional buyers. The aggregate value of these securities at February 28, 2023 was $27,105,609, which represented 6.85% of the Fund’s Net Assets. |
| (n) | Foreign denominated security. Principal amount is denominated in the currency indicated. |
| (o) | Interest or dividend rate is redetermined periodically. Rate shown is the rate in effect on February 28, 2023. |
| (p) | Calculated as a percentage of net assets. Amounts in excess of 100% are due to the Fund’s use of leverage. |
The aggregate value of securities considered illiquid at February 28, 2023 was $65,128,570, which represented 16.46% of the Fund’s Net Assets.
| | | | | | | | | | | | | | | | | | | | | | |
| Open Forward Foreign Currency Contracts | |
|
| | |
| | | | | | | | | | | | | | | | | Unrealized | |
| Settlement | | | | Contract to | | | Appreciation | |
| Date | | Counterparty | | | | | Deliver | | | | | | Receive | | | (Depreciation) | |
|
| | |
| Currency Risk | | | | | | | | | | | | | | | | | | | | | | |
|
| | |
| 04/28/2023 | | Barclays Bank PLC | | | EUR | | | | 667,080 | | | | USD | | | | 714,307 | | | $ | 6,376 | |
|
| | |
| 04/28/2023 | | Barclays Bank PLC | | | GBP | | | | 2,058,048 | | | | USD | | | | 2,493,921 | | | | 15,790 | |
|
| | |
| 03/31/2023 | | BNP Paribas S.A. | | | EUR | | | | 13,568,951 | | | | USD | | | | 14,822,583 | | | | 445,778 | |
|
| | |
| 03/31/2023 | | BNP Paribas S.A. | | | GBP | | | | 2,341,688 | | | | USD | | | | 2,890,499 | | | | 72,316 | |
|
| | |
| 04/28/2023 | | BNP Paribas S.A. | | | EUR | | | | 13,974,222 | | | | USD | | | | 14,939,644 | | | | 109,687 | |
|
| | |
| 04/28/2023 | | Canadian Imperial Bank of Commerce | | | GBP | | | | 2,089,231 | | | | USD | | | | 2,535,419 | | | | 19,740 | |
|
| | |
| 03/31/2023 | | Morgan Stanley and Co. International PLC | | | EUR | | | | 13,911,575 | | | | USD | | | | 15,212,181 | | | | 472,354 | |
|
| | |
| 03/31/2023 | | Morgan Stanley and Co. International PLC | | | GBP | | | | 167,600 | | | | USD | | | | 205,236 | | | | 3,532 | |
|
| | |
| 03/31/2023 | | Morgan Stanley and Co. International PLC | | | USD | | | | 43,167 | | | | GBP | | | | 35,884 | | | | 18 | |
|
| | |
| 04/28/2023 | | Morgan Stanley and Co. International PLC | | | EUR | | | | 13,951,215 | | | | USD | | | | 14,917,272 | | | | 111,730 | |
|
| | |
| 04/28/2023 | | Morgan Stanley and Co. International PLC | | | SEK | | | | 9,160,630 | | | | USD | | | | 889,647 | | | | 11,871 | |
|
| | |
| 03/31/2023 | | Royal Bank of Canada | | | EUR | | | | 14,233,570 | | | | USD | | | | 15,545,004 | | | | 464,010 | |
|
| | |
| 03/31/2023 | | Royal Bank of Canada | | | GBP | | | | 2,380,546 | | | | USD | | | | 2,931,809 | | | | 66,863 | |
|
| | |
| 04/28/2023 | | Royal Bank of Canada | | | EUR | | | | 13,974,222 | | | | USD | | | | 14,951,048 | | | | 121,092 | |
|
| | |
| 03/31/2023 | | State Street Bank & Trust Co. | | | SEK | | | | 9,309,201 | | | | USD | | | | 912,098 | | | | 21,450 | |
|
| | |
| 03/31/2023 | | Toronto-Dominion Bank (The) | | | GBP | | | | 2,341,688 | | | | USD | | | | 2,889,440 | | | | 71,258 | |
|
| | |
| 04/28/2023 | | Toronto-Dominion Bank (The) | | | GBP | | | | 2,089,231 | | | | USD | | | | 2,538,435 | | | | 22,757 | |
|
| | |
| Subtotal-Appreciation | | | | | | | | | | | | | | | | | | | 2,036,622 | |
|
| | |
| | | | | | |
| Currency Risk | | | | | | | | | | | | | | | | | | | | | | |
|
| | |
| 03/31/2023 | | Bank of America, N.A | | | USD | | | | 28,300 | | | | SEK | | | | 287,602 | | | | (784 | ) |
|
| | |
| 03/31/2023 | | Barclays Bank PLC | | | USD | | | | 2,476,192 | | | | GBP | | | | 2,044,609 | | | | (15,539 | ) |
|
| | |
| 03/31/2023 | | BNP Paribas S.A. | | | USD | | | | 14,915,538 | | | | EUR | | | | 13,974,222 | | | | (109,333 | ) |
|
| | |
| 03/31/2023 | | Canadian Imperial Bank of Commerce | | | USD | | | | 2,517,404 | | | | GBP | | | | 2,075,588 | | | | (19,468 | ) |
|
| | |
| 04/28/2023 | | Deutsche Bank AG | | | USD | | | | 595,062 | | | | EUR | | | | 556,435 | | | | (4,553 | ) |
|
| | |
| 04/28/2023 | | J.P. Morgan Chase Bank, N.A. | | | USD | | | | 2,132,517 | | | | EUR | | | | 2,000,000 | | | | (10,043 | ) |
|
| | |
See accompanying Notes to Financial Statements which are an integral part of the financial statements.
26 Invesco Senior Loan Fund
| | | | | | | | | | | | | | | | | | | | | | |
| Open Forward Foreign Currency Contracts-(continued) | |
|
| | |
| | | | | | | | | | | | | | | | | Unrealized | |
| Settlement | | | | Contract to | | | Appreciation | |
| Date | | Counterparty | | | | | Deliver | | | | | | Receive | | | (Depreciation) | |
|
| | |
| 03/31/2023 | | Morgan Stanley and Co. International PLC | | | GBP | | | | 88,280 | | | | USD | | | | 106,164 | | | $ | (79 | ) |
|
| | |
| 03/31/2023 | | Morgan Stanley and Co. International PLC | | | SEK | | | | 95,704 | | | | USD | | | | 9,032 | | | | (124 | ) |
|
| | |
| 03/31/2023 | | Morgan Stanley and Co. International PLC | | | USD | | | | 14,694,833 | | | | EUR | | | | 13,765,652 | | | | (109,616 | ) |
|
| | |
| 03/31/2023 | | Morgan Stanley and Co. International PLC | | | USD | | | | 1,343,564 | | | | GBP | | | | 1,088,133 | | | | (34,015 | ) |
|
| | |
| 03/31/2023 | | Morgan Stanley and Co. International PLC | | | USD | | | | 884,106 | | | | SEK | | | | 9,117,302 | | | | (11,818 | ) |
|
| | |
| 03/31/2023 | | Royal Bank of Canada | | | USD | | | | 14,926,984 | | | | EUR | | | | 13,974,222 | | | | (120,779 | ) |
|
| | |
| 03/31/2023 | | Toronto-Dominion Bank (The) | | | USD | | | | 2,520,399 | | | | GBP | | | | 2,075,588 | | | | (22,463 | ) |
|
| | |
| Subtotal-Depreciation | | | | | | | | | | | | | | | | | | | (458,614 | ) |
|
| | |
| Total Forward Foreign Currency Contracts | | | | | | | | | | | | | | | | | | $ | 1,578,008 | |
|
| | |
Abbreviations:
EUR –Euro
GBP –British Pound Sterling
SEK –Swedish Krona
USD –U.S. Dollar
See accompanying Notes to Financial Statements which are an integral part of the financial statements.
27 Invesco Senior Loan Fund
Statement of Assets and Liabilities
February 28, 2023
| | | | |
| Assets: | | | | |
Investments in unaffiliated securities, at value
(Cost $513,417,624) | | $ | 471,195,229 | |
| Other investments: | | | | |
| Unrealized appreciation on forward foreign currency contracts outstanding | | | 2,036,622 | |
| Cash | | | 13,684,856 | |
| Foreign currencies, at value (Cost $657,648) | | | 655,785 | |
| Receivable for: | | | | |
| Investments sold | | | 16,342,335 | |
| Fund shares sold | | | 53,526 | |
| Interest | | | 5,098,154 | |
Investments matured, at value
(Cost $15,329,350) | | | 605,497 | |
| Investment for trustee deferred compensation and retirement plans | | | 27,014 | |
| Other assets | | | 48,638 | |
| Total assets | | | 509,747,656 | |
| |
| Liabilities: | | | | |
| Other investments: | | | | |
| Unrealized depreciation on forward foreign currency contracts outstanding | | | 458,614 | |
| Payable for: | | | | |
| Borrowings | | | 82,500,000 | |
| Investments purchased | | | 22,773,530 | |
| Dividends | | | 1,024,114 | |
| Fund shares reacquired | | | 365 | |
| Accrued fees to affiliates | | | 264,386 | |
| Accrued interest expense | | | 854,468 | |
| Accrued trustees’ and officers’ fees and benefits | | | 1,639 | |
| Accrued other operating expenses | | | 557,147 | |
| Trustee deferred compensation and retirement plans | | | 73,276 | |
| Unfunded loan commitments | | | 5,634,856 | |
| Total liabilities | | | 114,142,395 | |
| Net assets applicable to common shares | | $ | 395,605,261 | |
| | | | |
| Net assets applicable to common shares consist of: | | | | |
| Shares of beneficial interest | | $ | 676,651,967 | |
| | |
| Distributable earnings (loss) | | | (281,046,706 | ) |
| | |
| | $ | 395,605,261 | |
| | |
| |
| Net Assets: | | | | |
| Class A | | $ | 50,489,486 | |
| | |
| Class C | | $ | 36,107,573 | |
| | |
| Class Y | | $ | 983,009 | |
| | |
| Class IB | | $ | 285,766,551 | |
| | |
| Class IC | | $ | 22,258,642 | |
| | |
| |
| Common shares outstanding, no par value, with an unlimited number of common shares authorized: | | | | |
| Class A | | | 8,599,125 | |
| | |
| Class C | | | 6,133,878 | |
| | |
| Class Y | | | 167,387 | |
| | |
| Class IB | | | 48,672,774 | |
| | |
| Class IC | | | 3,791,607 | |
| | |
| Class A: | | | | |
| Net asset value per share | | $ | 5.87 | |
| | |
Maximum offering price per share
(Net asset value of $5.87 ÷ 96.75%) | | $ | 6.07 | |
| | |
| Class C: | | | | |
| Net asset value and offering price per share | | $ | 5.89 | |
| | |
| Class Y: | | | | |
| Net asset value and offering price per share | | $ | 5.87 | |
| | |
| Class IB: | | | | |
| Net asset value and offering price per share | | $ | 5.87 | |
| | |
| Class IC: | | | | |
| Net asset value and offering price per share | | $ | 5.87 | |
| | |
See accompanying Notes to Financial Statements which are an integral part of the financial statements.
28 Invesco Senior Loan Fund
Statement of Operations
For the year ended February 28, 2023
| | | | |
| Investment income: | | | | |
| Interest | | $ | 36,910,148 | |
| | |
| Dividends | | | 1,289,722 | |
| | |
| Other income | | | 202,966 | |
| | |
| Total investment income | | | 38,402,836 | |
| | |
|
| Expenses: | |
| Advisory fees | | | 3,737,059 | |
| | |
| Administrative services fees | | | 1,032,833 | |
| | |
| Custodian fees | | | 75,687 | |
| | |
| Distribution fees: | | | | |
| Class A | | | 134,732 | |
| | |
| Class C | | | 395,647 | |
| | |
| Class IC | | | 34,762 | |
| | |
| Interest, facilities and maintenance fees | | | 3,301,076 | |
| | |
| Transfer agent fees | | | 401,253 | |
| | |
| Trustees’ and officers’ fees and benefits | | | 22,058 | |
| | |
| Registration and filing fees | | | 45,825 | |
| | |
| Reports to shareholders | | | 507,386 | |
| | |
| Professional services fees | | | 177,482 | |
| | |
| Other | | | 15,972 | |
| | |
| Total expenses | | | 9,881,772 | |
| | |
| Net investment income | | | 28,521,064 | |
| | |
|
| Realized and unrealized gain (loss) from: | |
| Net realized gain (loss) from: | | | | |
| Unaffiliated investment securities | | | (11,183,905 | ) |
| | |
| Foreign currencies | | | 298,991 | |
| | |
| Forward foreign currency contracts | | | 4,876,764 | |
| | |
| | | (6,008,150 | ) |
| | |
| Change in net unrealized appreciation (depreciation) of: | | | | |
| Unaffiliated investment securities | | | (26,780,625 | ) |
| | |
| Foreign currencies | | | (481,813 | ) |
| | |
| Forward foreign currency contracts | | | 1,075,007 | |
| | |
| | | (26,187,431 | ) |
| | |
| Net realized and unrealized gain (loss) | | | (32,195,581 | ) |
| | |
| Net increase (decrease) in net assets resulting from operations | | $ | (3,674,517 | ) |
| | |
See accompanying Notes to Financial Statements which are an integral part of the financial statements.
29 Invesco Senior Loan Fund
Statement of Changes in Net Assets
For the years ended February 28, 2023 and 2022
| | | | | | | | |
| | | 2023 | | | 2022 | |
| | |
| Operations: | |
| Net investment income | | $ | 28,521,064 | | | $ | 18,670,145 | |
| | |
| Net realized gain (loss) | | | (6,008,150 | ) | | | (6,971,428 | ) |
| | |
| Change in net unrealized appreciation (depreciation) | | | (26,187,431 | ) | | | 13,682,358 | |
| | |
| Net increase from payments by affiliates | | | – | | | | 874,000 | |
| | |
| Net increase (decrease) in net assets resulting from operations | | | (3,674,517 | ) | | | 26,255,075 | |
| | |
|
| Distributions to shareholders from distributable earnings: | |
| Class A | | | (4,428,637 | ) | | | (2,897,166 | ) |
| | |
| Class C | | | (2,947,658 | ) | | | (1,908,129 | ) |
| | |
| Class Y | | | (89,041 | ) | | | (76,822 | ) |
| | |
| Class IB | | | (25,369,125 | ) | | | (17,186,111 | ) |
| | |
| Class IC | | | (1,934,890 | ) | | | (1,318,835 | ) |
| | |
| Total distributions from distributable earnings | | | (34,769,351 | ) | | | (23,387,063 | ) |
| | |
|
| Return of capital: | |
| Class A | | | (340,351 | ) | | | – | |
| | |
| Class C | | | (226,534 | ) | | | – | |
| | |
| Class Y | | | (6,843 | ) | | | – | |
| | |
| Class IB | | | (1,949,671 | ) | | | – | |
| | |
| Class IC | | | (148,700 | ) | | | – | |
| | |
| Total return of capital | | | (2,672,099 | ) | | | – | |
| | |
| Total distributions | | | (37,441,450 | ) | | | (23,387,063 | ) |
| | |
|
| Share transactions–net: | |
| Class A | | | (3,195,720 | ) | | | (1,018,745 | ) |
| | |
| Class C | | | (4,666,346 | ) | | | (3,400,425 | ) |
| | |
| Class Y | | | 8,802 | | | | 36,695 | |
| | |
| Class IB | | | (9,101,956 | ) | | | (23,134,255 | ) |
| | |
| Class IC | | | (794,905 | ) | | | (2,253,511 | ) |
| | |
| Net increase (decrease) in net assets resulting from share transactions | | | (17,750,125 | ) | | | (29,770,241 | ) |
| | |
| Net increase (decrease) in net assets | | | (58,866,092 | ) | | | (26,902,229 | ) |
| | |
|
| Net assets: | |
| Beginning of year | | | 454,471,353 | | | | 481,373,582 | |
| | |
| End of year | | $ | 395,605,261 | | | $ | 454,471,353 | |
| | |
See accompanying Notes to Financial Statements which are an integral part of the financial statements.
30 Invesco Senior Loan Fund
Statement of Cash Flows
For the year ended February 28, 2023
| | | | |
| Cash provided by operating activities: | | | | |
| Net increase (decrease) in net assets resulting from operations | | $ | (3,674,517 | ) |
| | |
| |
| Adjustments to reconcile the change in net assets from operations to net cash provided by operating activities: | | | | |
| Purchases of investments | | | (212,136,154 | ) |
| | |
| Proceeds from sales of investments | | | 227,014,916 | |
| | |
| Proceeds from sales of short-term investments, net | | | 3,698,325 | |
| | |
| Amortization of premium on investment securities | | | 529,120 | |
| | |
| Accretion of discount on investment securities | | | (2,903,057 | ) |
| | |
| Net realized loss from investment securities | | | 11,183,905 | |
| | |
| Net change in unrealized depreciation on investment securities | | | 26,780,625 | |
| | |
| Net change in unrealized appreciation of forward foreign currency contracts | | | (1,075,007 | ) |
| | |
| Change in operating assets and liabilities: | | | | |
| | |
| Increase in receivables and other assets | | | (883,462 | ) |
| | |
| Increase in accrued expenses and other payables | | | 679,678 | |
| | |
| Net cash provided by operating activities | | | 49,214,372 | |
| | |
| |
| Cash provided by (used in) financing activities: | | | | |
| Dividends paid to shareholders from distributable earnings | | | (10,245,943 | ) |
| | |
| Return of capital | | | (2,672,099 | ) |
| | |
| Proceeds from shares of beneficial interest sold | | | 7,279,513 | |
| | |
| Disbursements from shares of beneficial interest reacquired | | | (49,159,850 | ) |
| | |
| Net cash provided by (used in) financing activities | | | (54,798,379 | ) |
| | |
| Net decrease in cash and cash equivalents | | | (5,584,007 | ) |
| | |
| Cash and cash equivalents at beginning of period | | | 19,924,648 | |
| | |
| Cash and cash equivalents at end of period | | $ | 14,340,641 | |
| | |
| |
| Non‑cash financing activities: | | | | |
| Value of shares of beneficial interest issued in reinvestment of dividends paid to shareholders | | $ | 24,099,096 | |
| | |
| |
| Supplemental disclosure of cash flow information: | | | | |
| Cash paid during the period for taxes | | $ | 11,707 | |
| | |
| Cash paid during the period for interest, facilities and maintenance fees | | $ | 2,515,193 | |
| | |
See accompanying Notes to Financial Statements which are an integral part of the financial statements.
31 Invesco Senior Loan Fund
Financial Highlights
The following schedule presents financial highlights for a share of the Fund outstanding throughout the periods indicated.
| | | | | | | | | | | | | | | | | | | | | | | | | | | | | | | | | | | | | | | | | | | | | | | | | | | | | | | | | | | | | | | | | | | | | | | | | | | | | | | | | | | | | |
| | | Net asset
value,
beginning
of period | | Net investment income(a) | | Net gains
(losses) on securities
(both realized and
unrealized) | | Total from investment operations | | Dividends from net investment income | | Return of capital | | Total distributions | | Net asset
value, end of period | | Total return (b) | | Net assets,
end of period (000’s omitted) | | Ratio of
expenses
to average net assets
with fee waivers
and/or
expenses
absorbed | | Ratio of
expenses
to average net assets without fee waivers and/or
expenses
absorbed | | Supplemental
ratio of
expenses to average net assets
with fee waivers (excluding
interest,
facilities and
maintenance
fees) | | Ratio of
net investment income to average net assets | | Portfolio turnover (c) | | Total
borrowings (000’s omitted) | | Asset Coverage per $1,000 unit of senior indebtedness (d) |
| Class A | | | | | | | | | | | | | | | | | | | | | | | | | | | | | | | | | | | | | | | | | | | | | | | | | | | | | | | | | | | | | | | | | | | | | | | | | | | | | | | | | | | | | |
| Year ended 02/28/23 | | | | $6.46 | | | | | $0.41 | | | | | $(0.46 | ) | | | | $(0.05 | ) | | | | $(0.50 | ) | | | | $(0.04 | ) | | | | $(0.54 | ) | | | | $5.87 | | | | | (0.46 | )% | | | | $ 50,489 | | | | | 2.50 | % | | | | 2.50 | % | | | | 1.70 | % | | | | 6.75 | % | | | | 24 | % | | | | $ 82,500 | | | | | $5,795 | |
| Year ended 02/28/22 | | | | 6.43 | | | | | 0.25 | | | | | 0.10 | | | | | 0.35 | | | | | (0.32 | ) | | | | – | | | | | (0.32 | ) | | | | 6.46 | | | | | 5.49 | (e)(f) | | | | 59,134 | | | | | 1.97 | (f) | | | | 1.97 | (f) | | | | 1.73 | (f) | | | | 3.86 | (f) | | | | 79 | | | | | 82,500 | | | | | 6,509 | |
| Year ended 02/28/21 | | | | 6.34 | | | | | 0.23 | | | | | 0.11 | | | | | 0.34 | | | | | (0.24 | ) | | | | (0.01 | ) | | | | (0.25 | ) | | | | 6.43 | | | | | 5.77 | (f) | | | | 59,821 | | | | | 2.05 | (f) | | | | 2.05 | (f) | | | | 1.71 | (f) | | | | 3.80 | (f) | | | | 64 | | | | | 82,500 | | | | | 6,835 | |
| Year ended 02/29/20 | | | | 6.61 | | | | | 0.30 | | | | | (0.26 | ) | | | | 0.04 | | | | | (0.31 | ) | | | | – | | | | | (0.31 | ) | | | | 6.34 | | | | | 0.58 | (f) | | | | 74,640 | | | | | 2.41 | (f) | | | | 2.41 | (f) | | | | 1.66 | (f) | | | | 4.62 | (f) | | | | 55 | | | | | 115,000 | | | | | 5,677 | |
| Year ended 02/28/19 | | | | 6.72 | | | | | 0.28 | | | | | (0.10 | ) | | | | 0.18 | | | | | (0.29 | ) | | | | – | | | | | (0.29 | ) | | | | 6.61 | | | | | 3.19 | (f) | | | | 90,789 | | | | | 2.46 | (f) | | | | 2.46 | (f) | | | | 1.71 | (f) | | | | 4.25 | (f) | | | | 44 | | | | | 160,000 | | | | | 5,009 | |
| Class C | | | | | | | | | | | | | | | | | | | | | | | | | | | | | | | | | | | | | | | | | | | | | | | | | | | | | | | | | | | | | | | | | | | | | | | | | | | | | | | | | | | | | |
| Year ended 02/28/23 | | | | 6.48 | | | | | 0.37 | | | | | (0.46 | ) | | | | (0.09 | ) | | | | (0.46 | ) | | | | (0.04 | ) | | | | (0.50 | ) | | | | 5.89 | | | | | (1.18 | ) | | | | 36,108 | | | | | 3.25 | | | | | 3.25 | | | | | 2.45 | | | | | 6.00 | | | | | 24 | | | | | 82,500 | | | | | 5,795 | |
| Year ended 02/28/22 | | | | 6.44 | | | | | 0.20 | | | | | 0.11 | | | | | 0.31 | | | | | (0.27 | ) | | | | ��� | | | | | (0.27 | ) | | | | 6.48 | | | | | 4.86 | (e)(f) | | | | 44,805 | | | | | 2.72 | (f) | | | | 2.72 | (f) | | | | 2.48 | (f) | | | | 3.11 | (f) | | | | 79 | | | | | 82,500 | | | | | 6,509 | |
| Year ended 02/28/21 | | | | 6.36 | | | | | 0.18 | | | | | 0.10 | | | | | 0.28 | | | | | (0.19 | ) | | | | (0.01 | ) | | | | (0.20 | ) | | | | 6.44 | | | | | 4.81 | (f) | | | | 47,919 | | | | | 2.80 | (f) | | | | 2.80 | (f) | | | | 2.46 | (f) | | | | 3.05 | (f) | | | | 64 | | | | | 82,500 | | | | | 6,835 | |
| Year ended 02/29/20 | | | | 6.63 | | | | | 0.25 | | | | | (0.26 | ) | | | | (0.01 | ) | | | | (0.26 | ) | | | | – | | | | | (0.26 | ) | | | | 6.36 | | | | | (0.16 | )(f) | | | | 58,449 | | | | | 3.16 | (f) | | | | 3.16 | (f) | | | | 2.41 | (f) | | | | 3.87 | (f) | | | | 55 | | | | | 115,000 | | | | | 5,677 | |
| Year ended 02/28/19 | | | | 6.73 | | | | | 0.23 | | | | | (0.09 | ) | | | | 0.14 | | | | | (0.24 | ) | | | | – | | | | | (0.24 | ) | | | | 6.63 | | | | | 2.50 | (f) | | | | 77,951 | | | | | 3.21 | (f) | | | | 3.21 | (f) | | | | 2.46 | (f) | | | | 3.50 | (f) | | | | 44 | | | | | 160,000 | | | | | 5,009 | |
| Class Y | | | | | | | | | | | | | | | | | | | | | | | | | | | | | | | | | | | | | | | | | | | | | | | | | | | | | | | | | | | | | | | | | | | | | | | | | | | | | | | | | | | | | |
| Year ended 02/28/23 | | | | 6.46 | | | | | 0.42 | | | | | (0.45 | ) | | | | (0.03 | ) | | | | (0.52 | ) | | | | (0.04 | ) | | | | (0.56 | ) | | | | 5.87 | | | | | (0.21 | ) | | | | 983 | | | | | 2.25 | | | | | 2.25 | | | | | 1.45 | | | | | 7.00 | | | | | 24 | | | | | 82,500 | | | | | 5,795 | |
| Year ended 02/28/22 | | | | 6.43 | | | | | 0.27 | | | | | 0.10 | | | | | 0.37 | | | | | (0.34 | ) | | | | – | | | | | (0.34 | ) | | | | 6.46 | | | | | 5.75 | (e) | | | | 1,077 | | | | | 1.72 | | | | | 1.72 | | | | | 1.48 | | | | | 4.11 | | | | | 79 | | | | | 82,500 | | | | | 6,509 | |
| Year ended 02/28/21 | | | | 6.34 | | | | | 0.24 | | | | | 0.11 | | | | | 0.35 | | | | | (0.25 | ) | | | | (0.01 | ) | | | | (0.26 | ) | | | | 6.43 | | | | | 6.04 | | | | | 1,045 | | | | | 1.80 | | | | | 1.80 | | | | | 1.46 | | | | | 4.05 | | | | | 64 | | | | | 82,500 | | | | | 6,835 | |
| Year ended 02/29/20 | | | | 6.61 | | | | | 0.32 | | | | | (0.26 | ) | | | | 0.06 | | | | | (0.33 | ) | | | | – | | | | | (0.33 | ) | | | | 6.34 | | | | | 0.83 | | | | | 2,436 | | | | | 2.16 | | | | | 2.16 | | | | | 1.41 | | | | | 4.87 | | | | | 55 | | | | | 115,000 | | | | | 5,677 | |
| Year ended 02/28/19 | | | | 6.72 | | | | | 0.30 | | | | | (0.10 | ) | | | | 0.20 | | | | | (0.31 | ) | | | | – | | | | | (0.31 | ) | | | | 6.61 | | | | | 3.47 | | | | | 2,894 | | | | | 2.21 | | | | | 2.21 | | | | | 1.46 | | | | | 4.50 | | | | | 44 | | | | | 160,000 | | | | | 5,009 | |
| Class IB | | | | | | | | | | | | | | | | | | | | | | | | | | | | | | | | | | | | | | | | | | | | | | | | | | | | | | | | | | | | | | | | | | | | | | | | | | | | | | | | | | | | | |
| Year ended 02/28/23 | | | | 6.46 | | | | | 0.42 | | | | | (0.45 | ) | | | | (0.03 | ) | | | | (0.52 | ) | | | | (0.04 | ) | | | | (0.56 | ) | | | | 5.87 | | | | | (0.21 | ) | | | | 285,767 | | | | | 2.25 | | | | | 2.25 | | | | | 1.45 | | | | | 7.00 | | | | | 24 | | | | | 82,500 | | | | | 5,795 | |
| Year ended 02/28/22 | | | | 6.43 | | | | | 0.27 | | | | | 0.10 | | | | | 0.37 | | | | | (0.34 | ) | | | | – | | | | | (0.34 | ) | | | | 6.46 | | | | | 5.75 | (e) | | | | 324,116 | | | | | 1.72 | | | | | 1.72 | | | | | 1.48 | | | | | 4.11 | | | | | 79 | | | | | 82,500 | | | | | 6,509 | |
| Year ended 02/28/21 | | | | 6.34 | | | | | 0.24 | | | | | 0.11 | | | | | 0.35 | | | | | (0.25 | ) | | | | (0.01 | ) | | | | (0.26 | ) | | | | 6.43 | | | | | 6.04 | | | | | 345,166 | | | | | 1.80 | | | | | 1.80 | | | | | 1.46 | | | | | 4.05 | | | | | 64 | | | | | 82,500 | | | | | 6,835 | |
| Year ended 02/29/20 | | | | 6.61 | | | | | 0.32 | | | | | (0.26 | ) | | | | 0.06 | | | | | (0.33 | ) | | | | – | | | | | (0.33 | ) | | | | 6.34 | | | | | 0.83 | | | | | 372,576 | | | | | 2.16 | | | | | 2.16 | | | | | 1.41 | | | | | 4.87 | | | | | 55 | | | | | 115,000 | | | | | 5,677 | |
| Year ended 02/28/19 | | | | 6.72 | | | | | 0.30 | | | | | (0.10 | ) | | | | 0.20 | | | | | (0.31 | ) | | | | – | | | | | (0.31 | ) | | | | 6.61 | | | | | 3.46 | | | | | 432,894 | | | | | 2.21 | | | | | 2.21 | | | | | 1.46 | | | | | 4.50 | | | | | 44 | | | | | 160,000 | | | | | 5,009 | |
| Class IC | | | | | | | | | | | | | | | | | | | | | | | | | | | | | | | | | | | | | | | | | | | | | | | | | | | | | | | | | | | | | | | | | | | | | | | | | | | | | | | | | | | | | |
| Year ended 02/28/23 | | | | 6.46 | | | | | 0.41 | | | | | (0.45 | ) | | | | (0.04 | ) | | | | (0.51 | ) | | | | (0.04 | ) | | | | (0.55 | ) | | | | 5.87 | | | | | (0.36 | ) | | | | 22,259 | | | | | 2.40 | | | | | 2.40 | | | | | 1.60 | | | | | 6.85 | | | | | 24 | | | | | 82,500 | | | | | 5,795 | |
| Year ended 02/28/22 | | | | 6.43 | | | | | 0.26 | | | | | 0.10 | | | | | 0.36 | | | | | (0.33 | ) | | | | – | | | | | (0.33 | ) | | | | 6.46 | | | | | 5.60 | (e)(f) | | | | 25,339 | | | | | 1.87 | (f) | | | | 1.87 | (f) | | | | 1.63 | (f) | | | | 3.96 | (f) | | | | 79 | | | | | 82,500 | | | | | 6,509 | |
| Year ended 02/28/21 | | | | 6.34 | | | | | 0.23 | | | | | 0.12 | | | | | 0.35 | | | | | (0.25 | ) | | | | (0.01 | ) | | | | (0.26 | ) | | | | 6.43 | | | | | 5.88 | (f) | | | | 27,422 | | | | | 1.95 | (f) | | | | 1.95 | (f) | | | | 1.61 | (f) | | | | 3.90 | (f) | | | | 64 | | | | | 82,500 | | | | | 6,835 | |
| Year ended 02/29/20 | | | | 6.61 | | | | | 0.31 | | | | | (0.26 | ) | | | | 0.05 | | | | | (0.32 | ) | | | | – | | | | | (0.32 | ) | | | | 6.34 | | | | | 0.68 | (f) | | | | 29,779 | | | | | 2.31 | (f) | | | | 2.31 | (f) | | | | 1.56 | (f) | | | | 4.72 | (f) | | | | 55 | | | | | 115,000 | | | | | 5,677 | |
| Year ended 02/28/19 | | | | 6.72 | | | | | 0.29 | | | | | (0.10 | ) | | | | 0.19 | | | | | (0.30 | ) | | | | – | | | | | (0.30 | ) | | | | 6.61 | | | | | 3.30 | (f) | | | | 36,854 | | | | | 2.36 | (f) | | | | 2.36 | (f) | | | | 1.61 | (f) | | | | 4.35 | (f) | | | | 44 | | | | | 160,000 | | | | | 5,009 | |
| (a) | Calculated using average shares outstanding. |
| (b) | Includes adjustments in accordance with accounting principles generally accepted in the United States of America and as such, the net asset value for financial reporting purposes and the returns based upon those net asset values may differ from the net asset value and returns for shareholder transactions. Does not include sales charges and is not annualized for periods less than one year, if applicable. |
| (c) | Portfolio turnover is calculated at the fund level and is not annualized for periods less than one year, if applicable. Calculation includes the proceeds from principal repayments and sales of variable rate senior loan interests. |
| (d) | Calculated by subtracting the Fund’s total liabilities (not including the Borrowings) from the Fund’s total assets and dividing by the total number of senior indebtedness units, where one unit equals $1,000 of senior indebtedness. |
| (e) | Amount includes the effect of the Adviser pay‑in for an economic loss of $0.01 per share. Had the pay‑in not been made, the total return would have been 5.32%, 4.70%, 5.59%, 5.59% and 5.43% for Class A, Class C, Class Y, Class IB and Class IC shares, respectively. |
| (f) | The total return, ratio of expenses to average net assets and ratio of net investment income to average net assets reflect actual 12b‑1 fees of 0.25% for Class A shares, 1.00% for Class C shares and 0.15% for Class IC shares for each of the years ended February 28, 2023, February 28, 2022, February 28, 2021, February 29, 2020 and February 28, 2019, respectively. |
See accompanying Notes to Financial Statements which are an integral part of the financial statements.
32 Invesco Senior Loan Fund
Notes to Financial Statements
February 28, 2023
NOTE 1–Significant Accounting Policies
Invesco Senior Loan Fund (the “Fund”) is a Delaware statutory trust registered under the Investment Company Act of 1940, as amended (the “1940 Act”), as a diversified, closed‑end management investment company that is operated as an interval fund and periodically offers its shares for repurchase.
The Fund’s investment objective is to provide a high level of current income, consistent with preservation of capital. The Fund’s investment adviser seeks to achieve the Fund’s investment objective by investing primarily in adjustable rate senior loans. The Fund invests primarily in adjustable rate senior loans (“Senior Loans”). Senior Loans are business loans that have a senior right to payment and are made to borrowers that may be corporations, partnerships, or other entities. These borrowers operate in a variety of industries and geographic regions. The Fund borrows money for investment purposes which may create the opportunity for enhanced return, but also should be considered a speculative technique and may increase the Fund’s volatility.
The Fund continuously offers Class A, Class C and Class Y shares. The Fund also has outstanding Class IB and Class IC shares which are not continuously offered. Each class of shares differs in its initial sales load, contingent deferred sales charges (“CDSC”), the allocation of class-specific expenses and voting rights on matters affecting a single class. Class C shares held for eight years after purchase are eligible for automatic conversion into Class A shares of the same Fund (the “Conversion Feature”). The automatic conversion pursuant to the Conversion Feature will generally occur at the end of the month following the eighth anniversary after a purchase of Class C shares.
The Fund is an investment company and accordingly follows the investment company accounting and reporting guidance in accordance with Financial Accounting Standards Board Accounting Standards Codification Topic 946, Financial Services – Investment Companies.
The following is a summary of the significant accounting policies followed by the Fund in the preparation of its financial statements.
| A. | Security Valuations – Variable rate senior loan interests are fair valued using quotes provided by an independent pricing service. Quotes provided by the pricing service may reflect appropriate factors such as ratings, tranche type, industry, company performance, spread, individual trading characteristics, institution‑size trading in similar groups of securities and other market data. |
Securities, including restricted securities, are valued according to the following policy. A security listed or traded on an exchange is generally valued at its trade price or official closing price that day as of the close of the exchange where the security is principally traded, or lacking any trades or official closing price on a particular day, the security may be valued at the closing bid price on that day. Securities traded in the over‑the‑counter market (but not securities reported on the NASDAQ Stock Exchange) are valued based on the prices furnished by independent pricing services, in which case the securities may be considered fair valued, or by market makers. Each security reported on the NASDAQ Stock Exchange is valued at the NASDAQ Official Closing Price (“NOCP”) as of the close of the customary trading session on the valuation date or absent a NOCP, at the closing bid price.
Futures contracts are valued at the daily settlement price set by an exchange on which they are principally traded. U.S. exchange-traded options are valued at the mean between the last bid and the asked prices from the exchange on which they are principally traded. Non‑U.S. exchange-traded options are valued at the final settlement price set by the exchange on which they trade. Options not listed on an exchange and swaps generally are valued using pricing provided from independent pricing services.
Securities of investment companies that are not exchange-traded (e.g., open‑end mutual funds) are valued using such company’s end‑of‑business‑day net asset value per share.
Fixed income securities (including convertible debt securities) generally are valued on the basis of prices provided by independent pricing services. Prices provided by the pricing service may be determined without exclusive reliance on quoted prices, and may reflect appropriate factors such as institution‑size trading in similar groups of securities, developments related to specific securities, dividend rate (for unlisted equities), yield (for debt obligations), quality, type of issue, coupon rate (for debt obligations), maturity (for debt obligations), individual trading characteristics and other market data. Pricing services generally value debt obligations assuming orderly transactions of institutional round lot size, but a fund may hold or transact in the same securities in smaller, odd lot sizes. Odd lots often trade at lower prices than institutional round lots, and their value may be adjusted accordingly. Debt obligations are subject to interest rate and credit risks. In addition, all debt obligations involve some risk of default with respect to interest and/or principal payments.
Swap agreements are fair valued using an evaluated quote, if available, provided by an independent pricing service. Evaluated quotes provided by the pricing service are valued based on a model which may include end‑of‑day net present values, spreads, ratings, industry, company performance and returns of referenced assets. Centrally cleared swap agreements are valued at the daily settlement price determined by the relevant exchange or clearinghouse.
Deposits, other obligations of U.S. and non‑U.S. banks and financial institutions are valued at their daily account value.
Foreign securities’ (including foreign exchange contracts) prices are converted into U.S. dollar amounts using the applicable exchange rates as of the close of the New York Stock Exchange (“NYSE”). If market quotations are available and reliable for foreign exchange-traded equity securities, the securities will be valued at the market quotations. Invesco Advisers, Inc. (the “Adviser” or “Invesco”) may use various pricing services to obtain market quotations as well as fair value prices. Because trading hours for certain foreign securities end before the close of the NYSE, closing market quotations may become not representative of market value in the Adviser’s judgment (“unreliable”). If, between the time trading ends on a particular security and the close of the customary trading session on the NYSE, a significant event occurs that makes the closing price of the security unreliable, the Adviser may fair value the security. If the event is likely to have affected the closing price of the security, the security will be valued at fair value in good faith in accordance with Board-approved policies and related Adviser procedures (“Valuation Procedures”). Adjustments to closing prices to reflect fair value may also be based on a screening process of an independent pricing service to indicate the degree of certainty, based on historical data, that the closing price in the principal market where a foreign security trades is not the current value as of the close of the NYSE. Foreign securities’ prices meeting the degree of certainty that the price is not reflective of current value will be priced at the indication of fair value from the independent pricing service. Multiple factors may be considered by the independent pricing service in determining adjustments to reflect fair value and may include information relating to sector indices, American Depositary Receipts and domestic and foreign index futures. Foreign securities may have additional risks including exchange rate changes, potential for sharply devalued currencies
33 Invesco Senior Loan Fund
and high inflation, political and economic upheaval, the relative lack of issuer information, relatively low market liquidity and the potential lack of strict financial and accounting controls and standards.
Unlisted securities will be valued using prices provided by independent pricing services or by another method that the Adviser, in its judgment, believes better reflects the security’s fair value in accordance with the Valuation Procedures.
Securities for which market prices are not provided by any of the above methods may be valued based upon quotes furnished by independent sources. The last bid price may be used to value equity securities. The mean between the last bid and asked prices may be used to value debt obligations, including corporate loans.
Securities for which market quotations are not readily available are fair valued by the Adviser in accordance with the Valuation Procedures. If a fair value price provided by a pricing service is unreliable, the Adviser will fair value the security using the Valuation Procedures. Issuer specific events, market trends, bid/asked quotes of brokers and information providers and other market data may be reviewed in the course of making a good faith determination of a security’s fair value.
The Fund may invest in securities that are subject to interest rate risk, meaning the risk that the prices will generally fall as interest rates rise and, conversely, the prices will generally rise as interest rates fall. Specific securities differ in their sensitivity to changes in interest rates depending on their individual characteristics. Changes in interest rates may result in increased market volatility, which may affect the value and/or liquidity of certain Fund investments.
Valuations change in response to many factors including the historical and prospective earnings of the issuer, the value of the issuer’s assets, general market conditions which are not specifically related to the particular issuer, such as real or perceived adverse economic conditions, changes in the general outlook for revenues or corporate earnings, changes in interest or currency rates, regional or global instability, natural or environmental disasters, widespread disease or other public health issues, war, acts of terrorism, significant governmental actions or adverse investor sentiment generally and market liquidity. Because of the inherent uncertainties of valuation, the values reflected in the financial statements may materially differ from the value received upon actual sale of those investments.
The price the Fund could receive upon the sale of any investment may differ from the Adviser’s valuation of the investment, particularly for securities that are valued using a fair valuation technique. When fair valuation techniques are applied, the Adviser uses available information, including both observable and unobservable inputs and assumptions, to determine a methodology that will result in a valuation that the Adviser believes approximates market value. Fund securities that are fair valued may be subject to greater fluctuation in their value from one day to the next than would be the case if market quotations were used. Because of the inherent uncertainties of valuation, and the degree of subjectivity in such decisions, the Fund could realize a greater or lesser than expected gain or loss upon the sale of the investment.
| B. | Securities Transactions and Investment Income – Securities transactions are accounted for on a trade date basis. Realized gains or losses on sales are computed on the basis of specific identification of the securities sold. Interest income (net of withholding tax, if any) is recorded on an accrual basis from settlement date and includes coupon interest and amortization of premium and accretion of discount on debt securities as applicable. Pay‑in‑kind interest income and non‑cash dividend income received in the form of securities in‑lieu of cash are recorded at the fair value of the securities received. Facility fees received may be amortized over the life of the loan. Dividend income (net of withholding tax, if any) is recorded on the ex‑dividend date. |
The Fund may periodically participate in litigation related to Fund investments. As such, the Fund may receive proceeds from litigation settlements. Any proceeds received are included in the Statement of Operations as realized gain (loss) for investments no longer held and as unrealized gain (loss) for investments still held.
Other income is comprised primarily of amendment fees which are recorded when received. Amendment fees are received in return for changes in the terms of the loan or note.
Brokerage commissions and mark ups are considered transaction costs and are recorded as an increase to the cost basis of securities purchased and/or a reduction of proceeds on a sale of securities. Such transaction costs are included in the determination of net realized and unrealized gain (loss) from investment securities reported in the Statement of Operations and the Statement of Changes in Net Assets and the net realized and unrealized gains (losses) on securities per share in the Financial Highlights. Transaction costs are included in the calculation of the Fund’s net asset value and, accordingly, they reduce the Fund’s total returns. These transaction costs are not considered operating expenses and are not reflected in net investment income reported in the Statement of Operations and the Statement of Changes in Net Assets, or the net investment income per share and the ratios of expenses and net investment income reported in the Financial Highlights, nor are they limited by any expense limitation arrangements between the Fund and the investment adviser.
The Fund allocates realized and unrealized capital gains and losses to a class based on the relative net assets of each class. The Fund allocates income to a class based on the relative value of the settled shares of each class.
| C. | Country Determination – For the purposes of making investment selection decisions and presentation in the Schedule of Investments, the investment adviser may determine the country in which an issuer is located and/or credit risk exposure based on various factors. These factors include the laws of the country under which the issuer is organized, where the issuer maintains a principal office, the country in which the issuer derives 50% or more of its total revenues, the country that has the primary market for the issuer’s securities and its “country of risk” as determined by a third party service provider, as well as other criteria. Among the other criteria that may be evaluated for making this determination are the country in which the issuer maintains 50% or more of its assets, the type of security, financial guarantees and enhancements, the nature of the collateral and the sponsor organization. Country of issuer and/or credit risk exposure has been determined to be the United States of America, unless otherwise noted. |
| D. | Distributions – Distributions from net investment income, if any, are declared daily and paid monthly. Distributions from net realized capital gain, if any, are generally declared and paid annually and recorded on the ex‑dividend date. The Fund may elect to treat a portion of the proceeds from redemptions as distributions for federal income tax purposes. |
| E. | Federal Income Taxes – The Fund intends to comply with the requirements of Subchapter M of the Internal Revenue Code of 1986, as amended (the “Internal Revenue Code”), necessary to qualify as a regulated investment company and to distribute substantially all of the Fund’s taxable earnings to shareholders. As such, the Fund will not be subject to federal income taxes on otherwise taxable income (including net realized capital gain) that is distributed to shareholders. Therefore, no provision for federal income taxes is recorded in the financial statements. |
The Fund recognizes the tax benefits of uncertain tax positions only when the position is more likely than not to be sustained. Management has analyzed the Fund’s uncertain tax positions and concluded that no liability for unrecognized tax benefits should be recorded related to uncertain
34 Invesco Senior Loan Fund
tax positions. Management is not aware of any tax positions for which it is reasonably possible that the total amounts of unrecognized tax benefits will change materially in the next 12 months.
The Fund files tax returns in the U.S. Federal jurisdiction and certain other jurisdictions. Generally, the Fund is subject to examinations by such taxing authorities for up to three years after the filing of the return for the tax period.
| F. | Interest, Facilities and Maintenance Fees – Interest, Facilities and Maintenance Fees include interest and related borrowing costs such as commitment fees, administrative expenses and other expenses associated with establishing and maintaining the line of credit. |
| G. | Accounting Estimates – The preparation of financial statements in conformity with accounting principles generally accepted in the United States of America (“GAAP”) requires management to make estimates and assumptions that affect the reported amounts of assets and liabilities at the date of the financial statements and the reported amounts of revenues and expenses during the reporting period including estimates and assumptions related to taxation. Actual results could differ from those estimates by a significant amount. In addition, the Fund monitors for material events or transactions that may occur or become known after the period‑end date and before the date the financial statements are released to print. |
| H. | Indemnifications – Under the Fund’s organizational documents, each Trustee, officer, employee or other agent of the Fund is indemnified against certain liabilities that may arise out of the performance of their duties to the Fund. Additionally, in the normal course of business, the Fund enters into contracts, including the Fund’s servicing agreements, that contain a variety of indemnification clauses. The Fund’s maximum exposure under these arrangements is unknown as this would involve future claims that may be made against the Fund that have not yet occurred. The risk of material loss as a result of such indemnification claims is considered remote. |
| I. | Cash and Cash Equivalents – For the purposes of the Statement of Cash Flows, the Fund defines Cash and Cash Equivalents as cash (including foreign currency), money market funds and other investments held in lieu of cash and excludes investments made with cash collateral received. |
| J. | Securities Purchased on a When-Issued and Delayed Delivery Basis – The Fund may purchase and sell interests in corporate loans and corporate debt securities and other portfolio securities on a when-issued and delayed delivery basis, with payment and delivery scheduled for a future date. No income accrues to the Fund on such interests or securities in connection with such transactions prior to the date the Fund actually takes delivery of such interests or securities. These transactions are subject to market fluctuations and are subject to the risk that the value at delivery may be more or less than the trade date purchase price. Although the Fund will generally purchase these securities with the intention of acquiring such securities, they may sell such securities prior to the settlement date. |
| K. | Foreign Currency Translations – Foreign currency is valued at the close of the NYSE based on quotations posted by banks and major currency dealers. Portfolio securities and other assets and liabilities denominated in foreign currencies are translated into U.S. dollar amounts at the date of valuation. Purchases and sales of portfolio securities (net of foreign taxes withheld on disposition) and income items denominated in foreign currencies are translated into U.S. dollar amounts on the respective dates of such transactions. The Fund does not separately account for the portion of the results of operations resulting from changes in foreign exchange rates on investments and the fluctuations arising from changes in market prices of securities held. The combined results of changes in foreign exchange rates and the fluctuation of market prices on investments (net of estimated foreign tax withholding) are included with the net realized and unrealized gain or loss from investments in the Statement of Operations. Reported net realized foreign currency gains or losses arise from (1) sales of foreign currencies, (2) currency gains or losses realized between the trade and settlement dates on securities transactions, and (3) the difference between the amounts of dividends, interest, and foreign withholding taxes recorded on the Fund’s books and the U.S. dollar equivalent of the amounts actually received or paid. Net unrealized foreign currency gains and losses arise from changes in the fair values of assets and liabilities, other than investments in securities at fiscal period end, resulting from changes in exchange rates. |
The Fund may invest in foreign securities, which may be subject to foreign taxes on income, gains on investments or currency repatriation, a portion of which may be recoverable. Foreign taxes, if any, are recorded based on the tax regulations and rates that exist in the foreign markets in which the Fund invests and are shown in the Statement of Operations.
| L. | Forward Foreign Currency Contracts – The Fund may engage in foreign currency transactions either on a spot (i.e. for prompt delivery and settlement) basis, or through forward foreign currency contracts, to manage or minimize currency or exchange rate risk. |
The Fund may also enter into forward foreign currency contracts for the purchase or sale of a security denominated in a foreign currency in order to “lock in” the U.S. dollar price of that security, or the Fund may also enter into forward foreign currency contracts that do not provide for physical exchange of the two currencies on the settlement date, but instead are settled by a single cash payment calculated as the difference between the agreed upon exchange rate and the spot rate at settlement based upon an agreed upon notional amount (non‑deliverable forwards).
A forward foreign currency contract is an obligation between two parties (“Counterparties”) to purchase or sell a specific currency for an agreed-upon price at a future date. The use of forward foreign currency contracts for hedging does not eliminate fluctuations in the price of the underlying securities the Fund owns or intends to acquire but establishes a rate of exchange in advance. Fluctuations in the value of these contracts are measured by the difference in the contract date and reporting date exchange rates and are recorded as unrealized appreciation (depreciation) until the contracts are closed. When the contracts are closed, realized gains (losses) are recorded. Realized and unrealized gains (losses) on the contracts are included in the Statement of Operations. The primary risks associated with forward foreign currency contracts include failure of the Counterparty to meet the terms of the contract and the value of the foreign currency changing unfavorably. These risks may be in excess of the amounts reflected in the Statement of Assets and Liabilities.
| M. | Industry Focus – To the extent that the Fund invests a greater amount of its assets in securities of issuers in the banking and financial services industries, the Fund’s performance will depend to a greater extent on the overall condition of those industries. The value of these securities can be sensitive to changes in government regulation, interest rates and economic downturns in the U.S. and abroad. |
| N. | Bank Loan Risk – Although the resale, or secondary market for floating rate loans has grown substantially over the past decade, both in overall size and number of market participants, there is no organized exchange or board of trade on which floating rate loans are traded. Instead, the secondary market for floating rate loans is a private, unregulated interdealer or interbank resale market. Such a market may therefore be subject to irregular trading activity, wide bid/ask spreads, and extended trade settlement periods, which may impair the Fund’s ability to sell bank loans within its desired time frame or at an acceptable price and its ability to accurately value existing and prospective investments. Extended trade settlement periods may result in cash not being immediately available to the Fund. As a result, the Fund may have to sell other investments or engage in borrowing transactions to raise cash to meet its obligations. Similar to other asset classes, bank loan funds may be exposed to |
35 Invesco Senior Loan Fund
| | counterparty credit risk, or the risk than an entity with which the Fund has unsettled or open transactions may fail to or be unable to perform on its commitments. The Fund seeks to manage counterparty credit risk by entering into transactions only with counterparties that it believes have the financial resources to honor their obligations and by monitoring the financial stability of those counterparties. |
| O. | LIBOR Risk – The Fund may have investments in financial instruments that utilize the London Interbank Offered Rate (“LIBOR”) as the reference or benchmark rate for variable interest rate calculations. LIBOR is intended to measure the rate generally at which banks can lend and borrow from one another in the relevant currency on an unsecured basis. The UK Financial Conduct Authority (“FCA”), the regulator that oversees LIBOR, announced that the majority of LIBOR rates would cease to be published or would no longer be representative on January 1, 2022. Although the publication of most LIBOR rates ceased at the end of 2021, a selection of widely used USD LIBOR rates continues to be published until June 2023 to allow for an orderly transition away from these rates. |
There remains uncertainty and risks relating to the continuing LIBOR transition and its effects on the Fund and the instruments in which the Fund invests. There can be no assurance that the composition or characteristics of any alternative reference rates (“ARRs”) or financial instruments in which the Fund invests that utilize ARRs will be similar to or produce the same value or economic equivalence as LIBOR or that these instruments will have the same volume or liquidity. Additionally, there remains uncertainty and risks relating to certain “legacy” USD LIBOR instruments that were issued or entered into before December 31, 2021 and the process by which a replacement interest rate will be identified and implemented into these instruments when USD LIBOR is ultimately discontinued. The effects of such uncertainty and risks in “legacy” USD LIBOR instruments held by the Fund could result in losses to the Fund.
| P. | Leverage Risk – The Fund may utilize leverage to seek to enhance the yield of the Fund by borrowing. There are risks associated with borrowing in an effort to increase the yield and distributions on the common shares, including that the costs of the financial leverage may exceed the income from investments purchased with such leverage proceeds, the higher volatility of the net asset value of the shares, and that fluctuations in the interest rates on the borrowing may affect the yield and distributions to the common shareholders. There can be no assurance that the Fund’s leverage strategy will be successful. |
| Q. | Other Risks - The Fund may invest all or substantially all of its assets in senior secured floating rate loans and senior secured debt securities that are determined to be rated below investment grade. These securities are generally considered to have speculative characteristics and are subject to greater risk of loss of principal and interest than higher rated securities. The value of lower quality debt securities and floating rate loans can be more volatile due to increased sensitivity to adverse issuer, political, regulatory, market or economic developments. |
The Fund invests in corporate loans from U.S. or non‑U.S. companies (the “Borrowers”). The investment of the Fund in a corporate loan may take the form of participation interests or assignments. If the Fund purchases a participation interest from a syndicate of lenders (“Lenders”) or one of the participants in the syndicate (“Participant”), one or more of which administers the loan on behalf of all the Lenders (the “Agent Bank”), the Fund would be required to rely on the Lender that sold the participation interest not only for the enforcement of the Fund’s rights against the Borrower but also for the receipt and processing of payments due to the Fund under the corporate loans. As such, the Fund is subject to the credit risk of the Borrower and the Participant. Lenders and Participants interposed between the Fund and a Borrower, together with Agent Banks, are referred to as “Intermediate Participants”.
Increases in the federal funds and equivalent foreign rates or other changes to monetary policy or regulatory actions may expose fixed income markets to heightened volatility and reduced liquidity for certain fixed income investments, particularly those with longer maturities. It is difficult to predict the impact of interest rate changes on various markets. In addition, decreases in fixed income dealer market-making capacity may also potentially lead to heightened volatility and reduced liquidity in the fixed income markets. As a result, the value of the Fund’s investments and share price may decline. Changes in central bank policies could also result in higher than normal redemptions by shareholders, which could potentially increase the Fund’s portfolio turnover rate and transaction costs.
Policy changes by the U.S. government or its regulatory agencies and political events within the U.S. and abroad may, among other things, affect investor and consumer confidence and increase volatility in the financial markets, perhaps suddenly and to a significant degree, which may adversely impact the Fund’s operations, universe of potential investment options, and return potential.
| R. | COVID‑19 Risk - The COVID‑19 strain of coronavirus has resulted in instances of market closures and dislocations, extreme volatility, liquidity constraints and increased trading costs. Efforts to contain its spread have resulted in travel restrictions, disruptions of healthcare systems, business operations (including business closures) and supply chains, layoffs, lower consumer demand and employee availability, and defaults and credit downgrades, among other significant economic impacts that have disrupted global economic activity across many industries. Such economic impacts may exacerbate other pre‑existing political, social and economic risks locally or globally and cause general concern and uncertainty. The full economic impact and ongoing effects of COVID‑19 (or other future epidemics or pandemics) at the macro-level and on individual businesses are unpredictable and may result in significant and prolonged effects on the Fund’s performance. |
NOTE 2–Advisory Fees and Other Fees Paid to Affiliates
The Fund has entered into a master investment advisory agreement with the Adviser. Under the terms of the investment advisory agreement, the Fund accrues daily and pays monthly an advisory fee to the Adviser based on the annual rate of the Fund’s average daily net assets as follows:
| | |
| Average Daily Net Assets | | Rate |
| |
| First $500 million | | 0.900% |
| |
| Next $1 billion | | 0.850% |
| |
| Next $1 billion | | 0.825% |
| |
| Next $500 million | | 0.800% |
| |
| Over $3 billion | | 0.775% |
For the year ended February 28, 2023, the effective advisory fee rate incurred by the Fund was 0.90%.
Under the terms of a master sub‑advisory agreement between the Adviser and each of Invesco Asset Management Deutschland GmbH, Invesco Asset Management Limited, Invesco Asset Management (Japan) Limited, Invesco Hong Kong Limited, Invesco Senior Secured Management, Inc. and Invesco Canada Ltd. (collectively, the “Affiliated Sub‑Advisers”) the Adviser, not the Fund, will pay 40% of the fees paid to the Adviser to any such Affiliated
36 Invesco Senior Loan Fund
Sub‑Adviser(s) that provide(s) discretionary investment management services to the Fund based on the percentage of assets allocated to such Affiliated Sub‑Adviser(s).
The Fund has entered into an administrative services agreement with Invesco pursuant to which the Fund has agreed to pay Invesco for certain administrative costs related to monitoring the provisions of the loan agreements and any agreements with respect to participations and assignments, record keeping responsibilities with respect to interests in Senior Loans in the Fund’s portfolio and providing certain services to the holders of the Fund’s securities. For the year ended February 28, 2023, expenses incurred under these agreements are shown in the Statement of Operations as Administrative services fees. Invesco has entered into a sub‑administration agreement whereby State Street Bank and Trust Company (“SSB”) serves as fund accountant and provides certain administrative services to the Fund. Pursuant to a custody agreement with the Fund, SSB also serves as the Fund’s custodian.
The Fund has entered into a transfer agency and service agreement with Invesco Investment Services, Inc. (“IIS”) pursuant to which the Fund has agreed to pay IIS a fee for providing transfer agency and shareholder services to the Fund and reimburse IIS for certain expenses incurred by IIS in the course of providing such services. For the year ended February 28, 2023, expenses incurred under these agreements are shown in the Statement of Operations as Transfer agent fees.
Shares of the Fund are distributed by Invesco Distributors, Inc. (“IDI”). The Fund has adopted a distribution plan pursuant to Rule 12b‑1 under the 1940 Act for Class A and Class C shares, and a service plan for Class A, Class C and Class IC shares (collectively, the “Plans”) to pay IDI for the sale, distribution, shareholder servicing and maintenance of shareholder accounts for these shares. Under the Plans, the Fund will incur annual fees of up to 0.25% of the average daily net assets of Class A shares and up to 1.00% of the average daily net assets of Class C shares and up to 0.15% (0.25% maximum) of the average daily net assets of Class IC shares. The fees are accrued daily and paid monthly.
With respect to Class C shares, the Fund is authorized to reimburse in future years any distribution related expenses that exceed the maximum annual reimbursement rate for such class, so long as such reimbursement does not cause the Fund to exceed the Class C maximum annual reimbursement rate, respectively. With respect to Class A shares, distribution related expenses that exceed the maximum annual reimbursement rate for such class are not carried forward to future years and the Fund will not reimburse IDI for any such expenses. For the year ended February 28, 2023, expenses incurred under these agreements are shown in the Statement of Operations as Distribution fees.
Front‑end sales commissions and CDSC (collectively, the “sales charges”) are not recorded as expenses of the Fund. Front‑end sales commissions are deducted from proceeds from the sales of Fund shares prior to investment in Class A shares of the Fund. CDSC are deducted from redemption proceeds prior to remittance to the shareholder. During the year ended February 28, 2023, IDI advised the Fund that IDI retained $4,182 in front‑end sales commissions from the sale of Class A shares and $3,593, $2,742 and $0 from Class A, Class C and Class IC shares, respectively, for CDSC imposed on redemptions by shareholders.
Certain officers and trustees of the Fund are officers and directors of the Adviser, IIS and/or IDI.
NOTE 3–Additional Valuation Information
GAAP defines fair value as the price that would be received to sell an asset or paid to transfer a liability in an orderly transaction between market participants at the measurement date, under current market conditions. GAAP establishes a hierarchy that prioritizes the inputs to valuation methods, giving the highest priority to readily available unadjusted quoted prices in an active market for identical assets (Level 1) and the lowest priority to significant unobservable inputs (Level 3), generally when market prices are not readily available. Based on the valuation inputs, the securities or other investments are tiered into one of three levels. Changes in valuation methods may result in transfers in or out of an investment’s assigned level:
| | |
| Level 1 - | | Prices are determined using quoted prices in an active market for identical assets. |
| Level 2 - | | Prices are determined using other significant observable inputs. Observable inputs are inputs that other market participants may use in pricing a security. These may include quoted prices for similar securities, interest rates, prepayment speeds, credit risk, yield curves, loss severities, default rates, discount rates, volatilities and others. |
| Level 3 - | | Prices are determined using significant unobservable inputs. In situations where quoted prices or observable inputs are unavailable (for example, when there is little or no market activity for an investment at the end of the period), unobservable inputs may be used. Unobservable inputs reflect the Adviser’s assumptions about the factors market participants would use in determining fair value of the securities or instruments and would be based on the best available information. |
The following is a summary of the tiered valuation input levels, as of February 28, 2023. The level assigned to the securities valuations may not be an indication of the risk or liquidity associated with investing in those securities. Because of the inherent uncertainties of valuation, the values reflected in the financial statements may materially differ from the value received upon actual sale of those investments.
| | | | | | | | | | | | | | | | | | | | | | | | | | |
| | | Level 1 | | | | | | Level 2 | | | | | | Level 3 | | | | | | Total |
| | | | | | | |
| Investments in Securities | | | | | | | | | | | | | | | | | | | | | | | | | | |
| | | | | | | |
| Variable Rate Senior Loan Interests | | $ | – | | | | | | | $ | 339,861,951 | | | | | | | $ | 59,265,580 | | | | | | | $399,127,531 |
| | | | | | | |
| Common Stocks & Other Equity Interests | | | 9,476,141 | | | | | | | | 4,644,714 | | | | | | | | 26,770,351 | | | | | | | 40,891,206 |
| | | | | | | |
| U.S. Dollar Denominated Bonds & Notes | | | – | | | | | | | | 12,893,926 | | | | | | | | 330,366 | | | | | | | 13,224,292 |
| | | | | | | |
| Non‑U.S. Dollar Denominated Bonds & Notes | | | – | | | | | | | | 13,199,557 | | | | | | | | – | | | | | | | 13,199,557 |
| | | | | | | |
| Preferred Stocks | | | – | | | | | | | | 2,353,883 | | | | | | | | 604,460 | | | | | | | 2,958,343 |
| | | | | | | |
| Municipal Obligations | | | – | | | | | | | | 1,794,300 | | | | | | | | – | | | | | | | 1,794,300 |
| | | | | | | |
| Total Investments in Securities | | | 9,476,141 | | | | | | | | 374,748,331 | | | | | | | | 86,970,757 | | | | | | | 471,195,229 |
| | | | | | | |
| Other Investments - Assets* | | | | | | | | | | | | | | | | | | | | | | | | | | |
| Investments Matured | | | – | | | | | | | | 158,341 | | | | | | | | 447,156 | | | | | | | 605,497 |
| Forward Foreign Currency Contracts | | | – | | | | | | | | 2,036,622 | | | | | | | | – | | | | | | | 2,036,622 |
| | | | – | | | | | | | | 2,194,963 | | | | | | | | 447,156 | | | | | | | 2,642,119 |
37 Invesco Senior Loan Fund
| | | | | | | | | | | | | | | | | | | | | | | | | | | | |
| | | Level 1 | | | | | | Level 2 | | | | | | Level 3 | | | | | | Total | |
| | |
| | | | | | | |
| Other Investments - Liabilities* | | | | | | | | | | | | | | | | | | | | | | | | | | | | |
| | |
| | | | | | | |
| Forward Foreign Currency Contracts | | $ | – | | | | | | | $ | (458,614 | ) | | | | | | $ | – | | | | | | | $ | (458,614 | ) |
| | |
| | | | | | | |
| Total Other Investments | | | – | | | | | | | | 1,736,349 | | | | | | | | 447,156 | | | | | | | | 2,183,505 | |
| | |
| | | | | | | |
| Total Investments | | $ | 9,476,141 | | | | | | | $ | 376,484,680 | | | | | | | $ | 87,417,913 | | | | | | | $ | 473,378,734 | |
| | |
| * | Forward foreign currency contracts are valued at unrealized appreciation (depreciation). Investments matured are shown at value. |
A reconciliation of Level 3 investments is presented when the Fund had a significant amount of Level 3 investments at the beginning and/or end of the reporting period in relation to net assets.
The following is a reconciliation of the fair valuations using significant unobservable inputs (Level 3) during the year ended February 28, 2023:
| | | | | | | | | | | | | | | | | | | | | | | | | | | | | | | | | | |
| | | | | | | | | | | | | | | | | | Change in | | | | | | | | | |
| | | | | | | | | | | | Accrued | | | Realized | | | Unrealized | | | Transfers | | | Transfers | | | |
| | | Value | | | Purchases | | | Proceeds | | | Discounts/ | | | Gain | | | Appreciation | | | into | | | out of | | | Value |
| | | 02/28/22 | | | at Cost | | | from Sales | | | Premiums | | | (Loss) | | | (Depreciation) | | | Level 3* | | | Level 3* | | | 02/28/23 |
| Variable Rate Senior Loan Interests | | $ | 62,917,390 | | | $ | 17,331,103 | | | $ | (18,433,742 | ) | | $ | 453,594 | | | $ | (271,341 | ) | | $ | (3,158,261 | ) | | $ | 13,536,186 | | | $ | (13,109,349 | ) | | $59,265,580 |
| Common Stocks & Other Equity Interests | | | 16,171,029 | | | | – | | | | – | | | | – | | | | (140,769 | ) | | | 6,488,882 | | | | 6,708,493 | | | | (2,457,284 | ) | | 26,770,351 |
| Preferred Stocks | | | 993,999 | | | | 154,688 | | | | (654,635 | ) | | | – | | | | 314,569 | | | | (673,065 | ) | | | 468,904 | | | | – | | | 604,460 |
| Investments Matured | | | 447,156 | | | | – | | | | – | | | | – | | | | – | | | | – | | | | – | | | | – | | | 447,156 |
| U.S. Dollar Denominated Bonds & Notes | | | 877,623 | | | | – | | | | (454,266 | ) | | | – | | | | – | | | | (92,991 | ) | | | – | | | | – | | | 330,366 |
| Total | | $ | 81,407,197 | | | $ | 17,485,791 | | | $ | (19,542,643 | ) | | $ | 453,594 | | | $ | (97,541 | ) | | $ | 2,564,565 | | | $ | 20,713,583 | | | $ | (15,566,633 | ) | | $87,417,913 |
| * | Transfers into and out of level 3 are due to increases or decreases in market activity impacting the available market inputs to determine the price. |
Securities determined to be Level 3 at the end of the reporting period were valued primarily by utilizing evaluated prices from a third-party vendor pricing service. A significant change in third-party pricing information could result in a lower or higher value in Level 3 investments.
The following table summarizes the valuation techniques and significant unobservable inputs used in determining fair value measurements for those investments classified as level 3 at period end:
| | | | | | | | | | | | |
| | | | | | | | | Range of | | | | |
| | | Fair Value | | Valuation | | Unobservable | | Unobservable | | Unobservable | | |
| | | at 02/28/23 | | Technique | | Inputs | | Inputs | | Input Used | | |
| QuarterNorth Energy, Inc. | | $15,565,407 | | Bid Offer | | Bid Offer Price | | N/A | | $199.49 | | (a) |
| NAS LLC (d.b.a. Nationwide Marketing Group), Term Loan | | 4,895,101 | | Valuation Service | | N/A | | N/A | | N/A | | (b) |
| (a) | QuarterNorth Energy, Inc. publicly announced that it has engaged a financial advisor to pursue a sale of the company. The Adviser values the common shares at the first round of bids for the sale of the business. The Adviser periodically reviews the financial statements and monitors such investments for additional market information of the occurrence of a significant event which would warrant a re‑evaluation of the security’s fair valuation. |
| (b) | Securities classified as Level 3 whose unadjusted values were provided by a pricing service and for which such inputs are unobservable. The valuations are based on certain methods used to determine market yields in order to establish a discount rate of return given market conditions and prevailing lending standards. Future expected cash flows are discounted back to the present value using these discount rates in the discounted cash flow analysis. The Adviser reviews the valuation reports provided by the valuation service on an on‑going basis and monitors such investments for additional information or the occurrence of a market event which would warrant a re‑evaluation of the security’s fair valuation. |
NOTE 4–Derivative Investments
The Fund may enter into an International Swaps and Derivatives Association Master Agreement (“ISDA Master Agreement”) under which a fund may trade OTC derivatives. An OTC transaction entered into under an ISDA Master Agreement typically involves a collateral posting arrangement, payment netting provisions and close‑out netting provisions. These netting provisions allow for reduction of credit risk through netting of contractual obligations. The enforceability of the netting provisions of the ISDA Master Agreement depends on the governing law of the ISDA Master Agreement, among other factors.
For financial reporting purposes, the Fund does not offset OTC derivative assets or liabilities that are subject to ISDA Master Agreements in the Statement of Assets and Liabilities.
Value of Derivative Investments at Period‑End
The table below summarizes the value of the Fund’s derivative investments, detailed by primary risk exposure, held as of February 28, 2023:
| | |
| | | Value |
| | | Currency |
| Derivative Assets | | Risk |
| Unrealized appreciation on forward foreign currency contracts outstanding | | $2,036,622 |
| Derivatives not subject to master netting agreements | | – |
| Total Derivative Assets subject to master netting agreements | | $2,036,622 |
38 Invesco Senior Loan Fund
| | | | |
| | | Value | |
| | | Currency | |
| Derivative Liabilities | | Risk | |
| | |
| |
| Unrealized depreciation on forward foreign currency contracts outstanding | | $ | (458,614 | ) |
| | |
| |
| Derivatives not subject to master netting agreements | | | – | |
| | |
| |
| Total Derivative Liabilities subject to master netting agreements | | $ | (458,614 | ) |
| | |
Offsetting Assets and Liabilities
The table below reflects the Fund’s exposure to Counterparties subject to either an ISDA Master Agreement or other agreement for OTC derivative transactions as of February 28, 2023.
| | | | | | | | | | | | | | | | | | | | |
| | | Financial | | | Financial | | | | | | | | | | | |
| | | Derivative | | | Derivative | | | | | | Collateral | | | |
| | | Assets | | | Liabilities | | | | | | (Received)/Pledged | | | |
| | | Forward Foreign | | | Forward Foreign | | | Net Value of | | | | | | | Net | |
| Counterparty | | Currency Contracts | | | Currency Contracts | | | Derivatives | | | Non‑Cash | | Cash | | Amount | |
| | |
| | | | | | |
| Bank of America, N.A | | $ | – | | | $ | (784) | | | $ | (784 | ) | | $– | | $– | | $ | (784 | ) |
| | |
| | | | | | |
| Barclays Bank PLC | | | 22,166 | | | | (15,539) | | | | 6,627 | | | – | | – | | | 6,627 | |
| | |
| | | | | | |
| BNP Paribas S.A. | | | 627,781 | | | | (109,333) | | | | 518,448 | | | – | | – | | | 518,448 | |
| | |
| | | | | | |
| Canadian Imperial Bank of Commerce | | | 19,740 | | | | (19,468) | | | | 272 | | | – | | – | | | 272 | |
| | |
| | | | | | |
| Deutsche Bank AG | | | – | | | | (4,553) | | | | (4,553 | ) | | – | | – | | | (4,553 | ) |
| | |
| | | | | | |
| J.P. Morgan Chase Bank, N.A. | | | – | | | | (10,043) | | | | (10,043 | ) | | – | | – | | | (10,043 | ) |
| | |
| | | | | | |
| Morgan Stanley and Co. International PLC | | | 599,505 | | | | (155,652) | | | | 443,853 | | | – | | – | | | 443,853 | |
| | |
| | | | | | |
| Royal Bank of Canada | | | 651,965 | | | | (120,779) | | | | 531,186 | | | – | | – | | | 531,186 | |
| | |
| | | | | | |
| State Street Bank & Trust Co. | | | 21,450 | | | | – | | | | 21,450 | | | – | | – | | | 21,450 | |
| | |
| | | | | | |
| Toronto-Dominion Bank (The) | | | 94,015 | | | | (22,463) | | | | 71,552 | | | – | | – | | | 71,552 | |
| | |
| | | | | | |
| Total | | $ | 2,036,622 | | | $ | (458,614) | | | $ | 1,578,008 | | | $– | | $– | | $ | 1,578,008 | |
| | |
Effect of Derivative Investments for the year ended February 28, 2023
The table below summarizes the gains (losses) on derivative investments, detailed by primary risk exposure, recognized in earnings during the period:
| | | | |
| | | Location of Gain on | |
| | | Statement of Operations | |
| | | Currency | |
| | | Risk | |
| Realized Gain: | | | | |
| Forward foreign currency contracts | | | $4,876,764 | |
| Change in Net Unrealized Appreciation: | | | | |
| Forward foreign currency contracts | | | 1,075,007 | |
| Total | | | $5,951,771 | |
The table below summarizes the average notional value of derivatives held during the period.
| | | | |
| | | Forward | |
| | | Foreign Currency | |
| | | Contracts | |
| Average notional value | | | $175,374,866 | |
NOTE 5–Trustees’ and Officers’ Fees and Benefits
Trustees’ and Officers’ Fees and Benefits include amounts accrued by the Fund to pay remuneration to certain Trustees and Officers of the Fund. Trustees have the option to defer compensation payable by the Fund, and “Trustees’ and Officers’ Fees and Benefits” includes amounts accrued by the Fund to fund such deferred compensation amounts.
NOTE 6–Cash Balances and Borrowings
Effective December 9, 2022, the Fund entered into a $90 million revolving credit and security agreement, which will expire on December 8, 2023. Prior to December 9, 2022, the revolving credit and security agreement permitted borrowings up to $180 million. The revolving credit and security agreement is secured by the assets of the Fund. The Fund is subject to certain covenants relating to the revolving credit and security agreement. Failure to comply with these restrictions could cause the acceleration of the repayment of the amount outstanding under the revolving credit and security agreement.
39 Invesco Senior Loan Fund
During the year ended February 28, 2023, the average daily balance of borrowing under the revolving credit and security agreement was $82,500,000 with an average interest rate of 3.47%. The carrying amount of the Fund’s payable for borrowings as reported on the Statement of Assets and Liabilities approximates its fair value. Expenses under the credit and security agreement are shown in the Statement of Operations as Interest, facilities and maintenance fees.
Additionally, the Fund is permitted to temporarily carry a negative or overdrawn balance in its account with SSB, the custodian bank. Such balances, if any at period‑end, are shown in the Statement of Assets and Liabilities under the payable caption Amount due custodian. To compensate the custodian bank for such overdrafts, the overdrawn Fund may either (1) leave funds as a compensating balance in the account so the custodian bank can be compensated by earning the additional interest; or (2) compensate by paying the custodian bank at a rate agreed upon by the custodian bank and Invesco, not to exceed the contractually agreed upon rate.
NOTE 7–Unfunded Loan Commitments
Pursuant to the terms of certain Senior Loan agreements, the Fund held the following unfunded loan commitments as of February 28, 2023. The Fund intends to reserve against such contingent obligations by designating cash, liquid securities and liquid Senior Loans as a reserve. Unfunded loan commitments are reflected as a liability on the Statement of Assets and Liabilities.
| | | | | | | | | | | | | | |
| | | | | | | | | | | Unrealized | |
| | | | | Unfunded Loan | | | | | | Appreciation | |
| Borrower | | Type | | Commitment | | | | | | (Depreciation) | |
| | |
| athenahealth Group, Inc. | | Delayed Draw Term Loan | | $ | 322,296 | | | | | | | $ | (23,233 | ) |
| | |
| Avaya, Inc. | | DIP Term Loan | | | 56,255 | | | | | | | | 4,184 | |
| | |
| Dermatology Intermediate Holdings III, Inc. | | Delayed Draw Term Loan | | | 437 | | | | | | | | (7 | ) |
| | |
| Dun & Bradstreet Corp. (The) | | Revolver Loan | | | 1,686,902 | | | | | | | | 102,405 | |
| | |
| Groundworks LLC | | Delayed Draw Term Loan | | | 221,743 | | | | | | | | 1,507 | |
| | |
| Groundworks LLC | | Term Loan | | | 151,199 | | | | | | | | 0 | |
| | |
| Groundworks LLC | | Term Loan | | | 48,384 | | | | | | | | 0 | |
| | |
| McDermott International Ltd. | | LOC | | | 2,136,110 | | | | | | | | (395,180 | ) |
| | |
| NAS LLC (d.b.a. Nationwide Marketing Group) | | Revolver Loan | | | 408,693 | | | | | | | | (3,979 | ) |
| | |
| Royal Caribbean Cruises | | Revolver Loan | | | 65,365 | | | | | | | | (65 | ) |
| | |
| Royal Caribbean Cruises | | Revolver Loan | | | 120,514 | | | | | | | | 3,484 | |
| | |
| Tank Holding Corp. | | Revolver Loan | | | 176,430 | | | | | | | | (9,309 | ) |
| | |
| Thermostat Purchaser III, Inc. | | First Lien Delayed Draw Term Loan | | | 78,194 | | | | | | | | (3,226 | ) |
| | |
| USF S&H Holdco LLC | | Term Loan A | | | 162,334 | | | | | | | | 0 | |
| | |
| | | | $ | 5,634,856 | | | | | | | $ | (323,419 | ) |
| | |
NOTE 8–Distributions to Shareholders and Tax Components of Net Assets
Tax Character of Distributions to Shareholders Paid During the Fiscal Years Ended February 28, 2023 and 2022:
| | | | | | | | | | |
| | | 2023 | | | | | | 2022 |
| Ordinary income* | | $ | 34,769,351 | | | | | | | $23,387,063 |
| Return of capital | | | 2,672,099 | | | | | | | – |
| Total distributions | | $ | 37,441,450 | | | | | | | $23,387,063 |
| * | Includes short-term capital gain distributions, if any. |
Tax Components of Net Assets at Period‑End:
| | | | |
| | | 2023 | |
| | |
| |
| Net unrealized appreciation (depreciation) – investments | | $ | (58,138,371 | ) |
| | |
| |
| Net unrealized appreciation (depreciation) – foreign currencies | | | (340,727 | ) |
| | |
| |
| Temporary book/tax differences | | | (66,043 | ) |
| | |
| |
| Capital loss carryforward | | | (222,501,565 | ) |
| | |
| |
| Shares of beneficial interest | | | 676,651,967 | |
| | |
| |
| Total net assets | | $ | 395,605,261 | |
| | |
The difference between book-basis and tax‑basis unrealized appreciation (depreciation) is due to differences in the timing of recognition of gains and losses on investments for tax and book purposes. The Fund’s net unrealized appreciation (depreciation) difference is attributable primarily to amortization and accretion on debt securities, defaulted bonds and derivative instruments.
The temporary book/tax differences are a result of timing differences between book and tax recognition of income and/or expenses. The Fund’s temporary book/tax differences are the result of the trustee deferral of compensation and retirement plan benefits.
Capital loss carryforward is calculated and reported as of a specific date. Results of transactions and other activity after that date may affect the amount of capital loss carryforward actually available for the Fund to utilize. The ability to utilize capital loss carryforward in the future may be limited under the Internal Revenue Code and related regulations based on the results of future transactions.
40 Invesco Senior Loan Fund
The Fund has a capital loss carryforward as of February 28, 2023, as follows:
| | | | | | | | | | | | | | | | | | |
| Capital Loss Carryforward* |
| Expiration | | Short-Term | | | | | | Long-Term | | | | | | Total |
| Not subject to expiration | | $ | 14,393,756 | | | | | | | $ | 208,107,809 | | | | | | | $222,501,565 |
| * | Capital loss carryforward is reduced for limitations, if any, to the extent required by the Internal Revenue Code and may be further limited depending upon a variety of factors, including the realization of net unrealized gains or losses as of the date of any reorganization. |
NOTE 9–Investment Transactions
The aggregate amount of investment securities (other than short-term securities, U.S. Government obligations and money market funds, if any) purchased and sold by the Fund during the year ended February 28, 2023 was $121,911,433 and $183,145,551, respectively. Cost of investments, including any derivatives, on a tax basis includes the adjustments for financial reporting purposes as of the most recently completed federal income tax reporting period‑end.
| | | | |
| Unrealized Appreciation (Depreciation) of Investments on a Tax Basis | | | |
| | |
| Aggregate unrealized appreciation of investments | | $ | 28,543,162 | |
| | |
| Aggregate unrealized (depreciation) of investments | | | (86,681,533 | ) |
| | |
| Net unrealized appreciation (depreciation) of investments | | $ | (58,138,371 | ) |
| | |
Cost of investments for tax purposes is $531,517,105.
NOTE 10–Reclassification of Permanent Differences
Primarily as a result of differing book/tax treatment of amortization and accretion on debt securities, foreign currency transactions and return of capital distributions , on February 28, 2023, undistributed net investment income was increased by $7,145,923, undistributed net realized gain (loss) was decreased by $4,473,823 and shares of beneficial interest was decreased by $2,672,100. This reclassification had no effect on the net assets of the Fund.
NOTE 11–Senior Loan Participation Commitments
The Fund invests in participations, assignments, or acts as a party to the primary lending syndicate of a Senior Loan interest to corporations, partnerships, and other entities. When the Fund purchases a participation of a Senior Loan interest, the Fund typically enters into a contractual agreement with the lender or other third party selling the participation, but not with the borrower directly. As such, the Fund assumes the credit risk of the borrower, selling participant or other persons interpositioned between the Fund and the borrower.
At the year ended February 28, 2023, the following sets forth the selling participants with respect to interest in Senior Loans purchased by the Fund on a participation basis.
| | | | | | | | | | |
| | | Principal | | | | | | |
| Selling Participant | | Amount | | | | | | Value |
| Bank of America, N.A. | | $ | 3,268,872 | | | | | | | $3,156,485 |
| Barclays Bank PLC | | | 2,136,110 | | | | | | | 1,772,971 |
NOTE 12–Dividends
The Fund declared the following monthly dividends from net investment income subsequent to February 28, 2023.
| | | | |
| | | | | Amount Per Share |
| Share Class | | Record Date | | Payable March 31, 2023 |
| |
| Class A | | Daily | | $0.0420 |
| |
| Class C | | Daily | | $0.0384 |
| |
| Class Y | | Daily | | $0.0432 |
| |
| Class IB | | Daily | | $0.0432 |
| |
| Class IC | | Daily | | $0.0425 |
| |
NOTE 13–Repurchase of Shares
The Fund has a policy of making monthly repurchase offers (“Repurchase Offers”) for the Fund’s common shares pursuant to Rule 23c‑3(b) of the 1940 Act.
The Repurchase Offers will be for between 5% and 25% of the Fund’s outstanding shares at net asset value (The Board of Trustees may authorize an additional 2%, if necessary, without extending the Repurchase Offers). The repurchase request deadline will be the third Friday of each calendar
41 Invesco Senior Loan Fund
month (or the preceding business day if such third Friday is not a business day). During the year ended February 28, 2023, the Fund had Repurchase Offers as follows:
| | | | | | | | | | |
| | | Percentage of | | | | | | | | |
| | | outstanding shares the | | | | | | | | Percentage of |
| | | Fund offered to | | | | Number of shares | | | | outstanding shares |
| Repurchase request deadlines | | repurchase | | | | tendered (all classes) | | | | tendered (all classes) |
| March 18, 2022 | | 6.0% | | | | 448,202 | | | | 0.6% |
| April 14, 2022 | | 6.0 | | | | 464,507 | | | | 0.7 |
| May 20, 2022 | | 6.0 | | | | 689,657 | | | | 1.0 |
| June 17, 2022 | | 6.0 | | | | 815,499 | | | | 1.2 |
| July 15, 2022 | | 6.0 | | | | 860,495 | | | | 1.2 |
| August 19, 2022 | | 6.0 | | | | 627,865 | | | | 0.9 |
| September 16, 2022 | | 6.0 | | | | 537,162 | | | | 0.8 |
| October 21, 2022 | | 6.0 | | | | 819,520 | | | | 1.2 |
| November 18, 2022 | | 6.0 | | | | 709,649 | | | | 1.0 |
| December 16, 2022 | | 6.0 | | | | 914,612 | | | | 1.4 |
| January 20, 2023 | | 6.0 | | | | 683,703 | | | | 1.0 |
| February 17, 2023 | | 6.0 | | | | 563,872 | | | | 0.8 |
NOTE 14–Share Information
| | | | | | | | | | | | | | | | | | | | |
| | | Summary of Share Activity | |
| | |
| | | Year ended | | | | | | Year ended | |
| | | February 28, 2023(a) | | | | | | February 28, 2022 | |
| | | Shares | | | Amount | | | | | | Shares | | | Amount | |
| | |
| Sold: | | | | | | | | | | | | | | | | | | | | |
| Class A | | | 895,123 | | | $ | 5,540,443 | | | | | | | | 1,138,902 | | | $ | 7,385,925 | |
| | |
| Class C | | | 197,424 | | | | 1,238,609 | | | | | | | | 411,282 | | | | 2,694,961 | |
| | |
| Class Y | | | 50,849 | | | | 308,647 | | | | | | | | 189,487 | | | | 1,239,653 | |
| | |
| Class IB | | | 36,722 | | | | 218,373 | | | | | | | | 47,195 | | | | 301,816 | |
| | |
| Class IC | | | 747 | | | | 4,438 | | | | | | | | 4,523 | | | | 29,293 | |
| | |
| | | | | |
| Issued as reinvestment of dividends: | | | | | | | | | | | | | | | | | | | | |
| Class A | | | 515,781 | | | | 3,057,598 | | | | | | | | 268,472 | | | | 1,749,239 | |
| | |
| Class C | | | 357,480 | | | | 2,121,998 | | | | | | | | 185,441 | | | | 1,211,276 | |
| | |
| Class Y | | | 7,073 | | | | 42,038 | | | | | | | | 8,284 | | | | 54,002 | |
| | |
| Class IB | | | 2,943,496 | | | | 17,440,366 | | | | | | | | 1,673,065 | | | | 10,761,089 | |
| | |
| Class IC | | | 242,618 | | | | 1,437,096 | | | | | | | | 134,002 | | | | 873,114 | |
| | |
| | | | | |
| Reacquired: | | | | | | | | | | | | | | | | | | | | |
| Class A | | | (1,962,024 | ) | | | (11,793,761 | ) | | | | | | | (1,563,896 | ) | | | (10,153,909 | ) |
| | |
| Class C | | | (1,336,433 | ) | | | (8,026,953 | ) | | | | | | | (1,117,433 | ) | | | (7,306,662 | ) |
| | |
| Class Y | | | (57,202 | ) | | | (341,883 | ) | | | | | | | (193,584 | ) | | | (1,256,960 | ) |
| | |
| Class IB | | | (4,459,744 | ) | | | (26,760,695 | ) | | | | | | | (5,264,266 | ) | | | (34,197,160 | ) |
| | |
| Class IC | | | (373,120 | ) | | | (2,236,439 | ) | | | | | | | (483,427 | ) | | | (3,155,918 | ) |
| | |
| Net increase (decrease) in share activity | | | (2,941,210 | ) | | $ | (17,750,125 | ) | | | | | | | (4,561,953 | ) | | $ | (29,770,241 | ) |
| | |
| (a) | There are entities that are record owners of more than 5% of the outstanding shares of the Fund and in the aggregate own 42% of the outstanding shares of the Fund. IDI has an agreement with these entities to sell Fund shares. The Fund, Invesco and/or Invesco affiliates may make payments to these entities, which are considered to be related to the Fund, for providing services to the Fund, Invesco and/or Invesco affiliates including but not limited to services such as securities brokerage, distribution, third party record keeping and account servicing. The Fund has no knowledge as to whether all or any portion of the shares owned of record by these entities are also owned beneficially. |
42 Invesco Senior Loan Fund
Report of Independent Registered Public Accounting Firm
To the Board of Trustees and Shareholders of Invesco Senior Loan Fund
Opinion on the Financial Statements
We have audited the accompanying statement of assets and liabilities, including the schedule of investments, of Invesco Senior Loan Fund (the “Fund”) as of February 28, 2023, the related statements of operations and cash flows for the year ended February 28, 2023, the statement of changes in net assets for each of the two years in the period ended February 28, 2023, including the related notes, and the financial highlights for each of the five years in the period ended February 28, 2023 (collectively referred to as the “financial statements”). In our opinion, the financial statements present fairly, in all material respects, the financial position of the Fund as of February 28, 2023, the results of its operations and its cash flows for the year then ended, the changes in its net assets for each of the two years in the period ended February 28, 2023 and the financial highlights for each of the five years in the period ended February 28, 2023 in conformity with accounting principles generally accepted in the United States of America.
Basis for Opinion
These financial statements are the responsibility of the Fund’s management. Our responsibility is to express an opinion on the Fund’s financial statements based on our audits. We are a public accounting firm registered with the Public Company Accounting Oversight Board (United States) (PCAOB) and are required to be independent with respect to the Fund in accordance with the U.S. federal securities laws and the applicable rules and regulations of the Securities and Exchange Commission and the PCAOB.
We conducted our audits of these financial statements in accordance with the standards of the PCAOB. Those standards require that we plan and perform the audit to obtain reasonable assurance about whether the financial statements are free of material misstatement, whether due to error or fraud.
Our audits included performing procedures to assess the risks of material misstatement of the financial statements, whether due to error or fraud, and performing procedures that respond to those risks. Such procedures included examining, on a test basis, evidence regarding the amounts and disclosures in the financial statements. Our audits also included evaluating the accounting principles used and significant estimates made by management, as well as evaluating the overall presentation of the financial statements. Our procedures included confirmation of securities owned as of February 28, 2023 by correspondence with the custodian, portfolio company investees, brokers and agent banks; when replies were not received from portfolio company investees, brokers or agent banks, we performed other auditing procedures. We believe that our audits provide a reasonable basis for our opinion.
/s/ PricewaterhouseCoopers LLP
Houston, Texas
April 26, 2023
We have served as the auditor of one or more of the investment companies in the Invesco group of investment companies since at least 1995. We have not been able to determine the specific year we began serving as auditor.
43 Invesco Senior Loan Fund
Calculating your ongoing Fund expenses
Example
As a shareholder of the Fund, you incur two types of costs: (1) transaction costs, which may include sales charges (loads) on purchase payments or contingent deferred sales charges on redemptions, if any; and (2) ongoing costs, including management fees, distribution and/or service (12b‑1) fees, and other Fund expenses. This example is intended to help you understand your ongoing costs (in dollars) of investing in the Fund and to compare these costs with ongoing costs of investing in other mutual funds. The example is based on an investment of $1,000 invested at the beginning of the period and held for the entire period September 1, 2022 through February 28, 2023.
Actual expenses
The table below provides information about actual account values and actual expenses. You may use the information in this table, together with the amount you invested, to estimate the expenses that you paid over the period. Simply divide your account value by $1,000 (for example, an $8,600 account value divided by $1,000 = 8.6), then multiply the result by the number in the table under the heading entitled “Actual Expenses Paid During Period” to estimate the expenses you paid on your account during this period.
Hypothetical example for comparison purposes
The table below also provides information about hypothetical account values and hypothetical expenses based on the Fund’s actual expense ratio and an assumed rate of return of 5% per year before expenses, which is not the Fund’s actual return.
The hypothetical account values and expenses may not be used to estimate the actual ending account balance or expenses you paid for the period. You may use this information to compare the ongoing costs of investing in the Fund and other funds. To do so, compare this 5% hypothetical example with the 5% hypothetical examples that appear in the shareholder reports of the other funds.
Please note that the expenses shown in the table are meant to highlight your ongoing costs only and do not reflect any transaction costs, such as sales charges (loads) on purchase payments or contingent deferred sales charges on redemptions, if any. Therefore, the hypothetical information is useful in comparing ongoing costs only, and will not help you determine the relative total costs of owning different funds. In addition, if these transaction costs were included, your costs would have been higher.
| | | | | | | | | | | | | | |
| | | | | | | | | HYPOTHETICAL | | | | |
| | | | | | | | | (5% annual return before | | |
| | | | | ACTUAL | | expenses) | | |
| | | Beginning | | Ending | | Expenses | | Ending | | Expenses | | Annualized |
| | | Account Value | | Account Value | | Paid During | | Account Value | | Paid During | | Expense |
| | | (09/01/22) | | (02/28/23)1 | | Period2 | | (02/28/23) | | Period2 | | Ratio |
| Class A | | $1,000.00 | | $1,036.20 | | $14.19 | | $1,010.86 | | $14.01 | | 2.81% |
| Class C | | 1,000.00 | | 1,030.70 | | 17.92 | | 1,007.14 | | 17.72 | | 3.56 |
| Class Y | | 1,000.00 | | 1,037.50 | | 12.93 | | 1,012.10 | | 12.77 | | 2.56 |
| Class IB | | 1,000.00 | | 1,037.50 | | 12.93 | | 1,012.10 | | 12.77 | | 2.56 |
| Class IC | | 1,000.00 | | 1,036.80 | | 13.69 | | 1,011.36 | | 13.51 | | 2.71 |
| 1 | The actual ending account value is based on the actual total return of the Fund for the period September 1, 2022 through February 28, 2023, after actual expenses and will differ from the hypothetical ending account value which is based on the Fund’s expense ratio and a hypothetical annual return of 5% before expenses. |
| 2 | Expenses are equal to the Fund’s annualized expense ratio as indicated above multiplied by the average account value over the period, multiplied by 181/365 to reflect the most recent fiscal half year. |
44 Invesco Senior Loan Fund
Tax Information
Form 1099‑DIV, Form 1042‑S and other year–end tax information provide shareholders with actual calendar year amounts that should be included in their tax returns. Shareholders should consult their tax advisers.
The following distribution information is being provided as required by the Internal Revenue Code or to meet a specific state’s requirement.
The Fund designates the following amounts or, if subsequently determined to be different, the maximum amount allowable for its fiscal year ended February 28, 2023:
| | | | | | | | | | |
| | | Federal and State Income Tax | | | | | | | | |
| | Qualified Dividend Income* | | | 4.19 | % | | | | |
| | Corporate Dividends Received Deduction* | | | 4.19 | % | | | | |
| | U.S. Treasury Obligations* | | | 0.00 | % | | | | |
| | Qualified Business Income* | | | 0.00 | % | | | | |
| | Business Interest Income* | | | 85.92 | % | | | | |
| |
| | * The above percentages are based on ordinary income dividends paid to shareholders during the Fund’s fiscal year. | |
45 Invesco Senior Loan Fund
Trustees and Officers
The address of each trustee and officer is 1331 Spring Street NW, Suite 2500, Atlanta, Georgia 30309. Generally, each trustee serves for a three year term or until his or her successor has been duly elected and qualified, and each officer serves for a one year term or until his or her successor has been duly elected and qualified. Column two below includes length of time served with predecessor entities, if any.
| | | | | | | | |
Name, Year of Birth and
Position(s)
Held with the Trust | | Trustee
and/or
Officer
Since | | Principal Occupation(s) During Past 5 Years | | Number of
Funds in
Fund Complex
Overseen by
Trustee | | Other
Directorship(s)
Held by Trustee
During Past 5
Years |
| Interested Trustee | | | | | | | | |
| Martin L. Flanagan1 - 1960 Trustee and Vice Chair | | 2014 | | Executive Director, Chief Executive Officer and President, Invesco Ltd. (ultimate parent of Invesco and a global investment management firm); Trustee and Vice Chair, The Invesco Funds; Vice Chair, Investment Company Institute; and Member of Executive Board, SMU Cox School of Business Formerly: Advisor to the Board, Invesco Advisers, Inc. (formerly known as Invesco Institutional (N.A.), Inc.); Chairman and Chief Executive Officer, Invesco Advisers, Inc. (registered investment adviser); Director, Chairman, Chief Executive Officer and President, Invesco Holding Company (US), Inc. (formerly IVZ Inc.) (holding company), Invesco Group Services, Inc. (service provider) and Invesco North American Holdings, Inc. (holding company); Director, Chief Executive Officer and President, Invesco Holding Company Limited (parent of Invesco and a global investment management firm); Director, Invesco Ltd.; Chairman, Investment Company Institute and President, Co‑Chief Executive Officer, Co‑President, Chief Operating Officer and Chief Financial Officer, Franklin Resources, Inc. (global investment management organization) | | 175 | | None |
| 1 | Mr. Flanagan is considered an interested person (within the meaning of Section 2(a)(19) of the 1940 Act) of the Trust because he is an officer of the Adviser to the Trust, and an officer and a director of Invesco Ltd., ultimate parent of the Adviser. |
T-1 Invesco Senior Loan Fund
Trustees and Officers–(continued)
| | | | | | | | |
Name, Year of Birth and
Position(s)
Held with the Trust | | Trustee
and/or
Officer
Since | | Principal Occupation(s) During Past 5 Years | | Number of
Funds in
Fund Complex
Overseen by
Trustee | | Other
Directorship(s)
Held by Trustee
During Past 5
Years |
| Independent Trustees | | | | |
Beth Ann Brown - 1968 Trustee (2019) and Chair (August 2022) | | 2019 | | Independent Consultant Formerly: Head of Intermediary Distribution, Managing Director, Strategic Relations, Managing Director, Head of National Accounts, Senior Vice President, National Account Manager and Senior Vice President, Key Account Manager, Columbia Management Investment Advisers LLC; Vice President, Key Account Manager, Liberty Funds Distributor, Inc.; and Trustee of certain Oppenheimer Funds | | 175 | | Director, Board of Directors of Caron Engineering Inc.; Advisor, Board of Advisors of Caron Engineering Inc.; President and Director, Acton Shapleigh Youth Conservation Corps (non‑profit) Formerly: President and Director Director of Grahamtastic Connection (non‑profit) |
Cynthia Hostetler - 1962 Trustee | | 2017 | | Non‑Executive Director and Trustee of a number of public and private business corporations Formerly: Director, Aberdeen Investment Funds (4 portfolios); Director, Artio Global Investment LLC (mutual fund complex); Director, Edgen Group, Inc. (specialized energy and infrastructure products distributor); Director, Genesee & Wyoming, Inc. (railroads); Head of Investment Funds and Private Equity, Overseas Private Investment Corporation; President, First Manhattan Bancorporation, Inc.; and Attorney, Simpson Thacher & Bartlett LLP | | 175 | | Resideo Technologies, Inc. (smart home technology); Vulcan Materials Company (construction materials company); Trilinc Global Impact Fund; Textainer Group Holdings, (shipping container leasing company); Investment Company Institute (professional organization); and Independent Directors Council (professional organization) |
Eli Jones - 1961 Trustee | | 2016 | | Professor and Dean Emeritus, Mays Business School-Texas A&M University Formerly: Dean of Mays Business School - Texas A&M University; Professor and Dean, Walton College of Business, University of Arkansas and E.J. Ourso College of Business, Louisiana State University; and Director, Arvest Bank | | 175 | | Insperity, Inc. (formerly known as Administaff) (human resources provider); Board Member of the regional board, First Financial Bank Texas; and Boad Member, First Financial Bankshares, Inc. Texas (FFIN) |
Elizabeth Krentzman - 1959 Trustee | | 2019 | | Formerly: Principal and Chief Regulatory Advisor for Asset Management Services and U.S. Mutual Fund Leader of Deloitte & Touche LLP; General Counsel of the Investment Company Institute (trade association); National Director of the Investment Management Regulatory Consulting Practice, Principal, Director and Senior Manager of Deloitte & Touche LLP; Assistant Director of the Division of Investment Management - Office of Disclosure and Investment Adviser Regulation of the U.S. Securities and Exchange Commission and various positions with the Division of Investment Management - Office of Regulatory Policy of the U.S. Securities and Exchange Commission; Associate at Ropes & Gray LLP; and Trustee of certain Oppenheimer Funds | | 175 | | Formerly: Member of the Cartica Funds Board of Directors (private investment fund); Trustee of the University of Florida National Board Foundation; and Member of the University of Florida Law Center Association, Inc. Board of Trustees, Audit Committee and Membership Committee |
Anthony J. LaCava, Jr. - 1956 Trustee | | 2019 | | Formerly: Director and Member of the Audit Committee, Blue Hills Bank (publicly traded financial institution) and Managing Partner, KPMG LLP | | 175 | | Blue Hills Bank; Member and Chairman, Bentley University, Business School Advisory Council; and Nominating Committee, KPMG LLP |
Prema Mathai-Davis - 1950 Trustee | | 2014 | | Retired Formerly: Co‑Founder & Partner of Quantalytics Research, LLC, (a FinTech Investment Research Platform for the Self-Directed Investor); Trustee of YWCA Retirement Fund; CEO of YWCA of the USA; Board member of the NY Metropolitan Transportation Authority; Commissioner of the NYC Department of Aging; and Board member of Johns Hopkins Bioethics Institute | | 175 | | Member of Board of Positive Planet US (non‑profit) and HealthCare Chaplaincy Network (non‑profit) |
T-2 Invesco Senior Loan Fund
Trustees and Officers–(continued)
| | | | | | | | |
Name, Year of Birth and
Position(s)
Held with the Trust | | Trustee
and/or
Officer
Since | | Principal Occupation(s) During Past 5 Years | | Number of
Funds in
Fund Complex
Overseen by
Trustee | | Other
Directorship(s)
Held by Trustee
During Past 5
Years |
| Independent Trustees–(continued) | | | | |
Joel W. Motley - 1952 Trustee | | 2019 | | Director of Office of Finance, Federal Home Loan Bank System; Managing Director of Carmona Motley Inc. (privately held financial advisor); Member of the Council on Foreign Relations and its Finance and Budget Committee; Chairman Emeritus of Board of Human Rights Watch and Member of its Investment Committee; and Member of Investment Committee Board of Historic Hudson Valley (non‑profit cultural organization); Member of the Board, Blue Ocean Acquisition Corp.; and Member of the Vestry and the Investment Committee of Trinity Church Wall Street. Formerly: Managing Director of Public Capital Advisors, LLC (privately held financial advisor); Managing Director of Carmona Motley Hoffman, Inc. (privately held financial advisor); Trustee of certain Oppenheimer Funds; and Director of Columbia Equity Financial Corp. (privately held financial advisor) | | 175 | | Member of Board of Trust for Mutual Understanding (non‑profit promoting the arts and environment); Member of Board of Greenwall Foundation (bioethics research foundation) and its Investment Committee; Member of Board of Friends of the LRC (non-profit legal advocacy); and Board Member and Investment Committee Member of Pulitzer Center for Crisis Reporting (non‑profit journalism) |
| Teresa M. Ressel - 1962 Trustee | | 2017 | | Non‑executive director and trustee of a number of public and private business corporations Formerly: Chief Executive Officer, UBS Securities LLC (investment banking); Chief Operating Officer, UBS AG Americas (investment banking); Sr. Management Team Olayan America, The Olayan Group (international investor/commercial/industrial); and Assistant Secretary for Management & Budget and Designated Chief Financial Officer, U.S. Department of Treasury | | 175 | | None |
| Robert C. Troccoli - 1949 Trustee | | 2016 | | Retired Formerly: Adjunct Professor, University of Denver - Daniels College of Business; and Managing Partner, KPMG LLP | | 175 | | None |
| Daniel S. Vandivort -1954 Trustee | | 2019 | | President, Flyway Advisory Services LLC (consulting and property management) Formerly: President and Chief Investment Officer, previously Head of Fixed Income, Weiss Peck and Greer/Robeco Investment Management; Trustee and Chair, Weiss Peck and Greer Funds Board; and various capacities at CS First Boston including Head of Fixed Income at First Boston Asset Management. | | 175 | | Formerly: Trustee and Governance Chair, Oppenheimer Funds; Treasurer, Chairman of the Audit and Finance Committee, Huntington Disease Foundation of America |
T-3 Invesco Senior Loan Fund
Trustees and Officers–(continued)
| | | | | | | | |
Name, Year of Birth and
Position(s)
Held with the Trust | | Trustee
and/or
Officer
Since | | Principal Occupation(s) During Past 5 Years | | Number of
Funds in
Fund Complex
Overseen by
Trustee | | Other
Directorship(s)
Held by Trustee
During Past 5
Years |
| Officers | | | | |
Sheri Morris - 1964 President and Principal Executive Officer | | 2010 | | Director, Invesco Trust Company; Head of Global Fund Services, Invesco Ltd.; President and Principal Executive Officer, The Invesco Funds; Vice President, Invesco Exchange-Traded Fund Trust, Invesco Exchange-Traded Fund Trust II, Invesco India Exchange-Traded Fund Trust, Invesco Actively Managed Exchange-Traded Fund Trust, Invesco Actively Managed Exchange-Traded Commodity Fund Trust and Invesco Exchange-Traded Self-Indexed Fund Trust; and Vice President, OppenheimerFunds, Inc. Formerly: Vice President, Treasurer and Principal Financial Officer, The Invesco Funds; Vice President, Invesco AIM Advisers, Inc., Invesco AIM Capital Management, Inc. and Invesco AIM Private Asset Management, Inc.; Assistant Vice President and Assistant Treasurer, The Invesco Funds; Vice President and Assistant Vice President, Invesco Advisers, Inc.; Assistant Vice President, Invesco AIM Capital Management, Inc. and Invesco AIM Private Asset Management, Inc.; Treasurer, Invesco Exchange-Traded Fund Trust, Invesco Exchange-Traded Fund Trust II, Invesco India Exchange-Traded Fund Trust and Invesco Actively Managed Exchange-Traded Fund Trust; and Senior Vice President, Invesco Advisers, Inc. (formerly known as Invesco Institutional (N.A.), Inc.) (registered investment adviser) | | N/A | | N/A |
Melanie Ringold - 1975 Senior Vice President, Chief Legal Officer and Secretary | | 2023 | | Head of Legal of the Americas, Invesco Ltd.; Senior Vice President and Secretary, Invesco Advisers, Inc. (formerly known as Invesco Institutional (N.A.), Inc.) (registered investment adviser); Secretary, Invesco Distributors, Inc. (formerly known as Invesco AIM Distributors, Inc.); Secretary, Invesco Investment Services, Inc. (formerly known as Invesco AIM Investment Services, Inc.); Senior Vice President, Chief Legal Officer and Secretary, The Invesco Funds; Secretary, Invesco Investment Advisers LLC, Invesco Capital Markets, Inc.; Chief Legal Officer, Invesco Exchange-Traded Fund Trust, Invesco Exchange-Traded Fund Trust II, Invesco India Exchange-Traded Fund Trust, Invesco Actively Managed Exchange-Traded Fund Trust, Invesco Actively Managed Exchange-Traded Commodity Fund Trust and Invesco Exchange-Traded Self-Indexed Fund Trust;Secretary and Vice President, Harbourview Asset Management Corporation; Secretary and Senior Vice President, OppenheimerFunds, Inc. and Invesco Managed Accounts, LLC; Secretary and Senior Vice President, OFI SteelPath, Inc.; Secretary and Senior Vice President, Oppenheimer Acquisition Corp.; Secretary, SteelPath Funds Remediation LLC; and Secretary and Senior Vice President, Trinity Investment Management Corporation Formerly: Assistant Secretary, Invesco Distributors, Inc.; Invesco Advisers, Inc. Invesco Investment Services, Inc., Invesco Capital Markets, Inc., Invesco Capital Management LLC and Invesco Investment Advisers LLC; and Assistant Secretary and Investment Vice President, Invesco Funds | | N/A | | N/A |
Andrew R. Schlossberg - 1974 Senior Vice President | | 2019 | | Senior Vice President, Invesco Group Services, Inc.; Head of the Americas and Senior Managing Director, Invesco Ltd.; Director and Senior Vice President, Invesco Advisers, Inc. (formerly known as Invesco Institutional (N.A.), Inc.) (registered investment adviser); Director and Chairman, Invesco Investment Services, Inc. (formerly known as Invesco AIM Investment Services, Inc.) (registered transfer agent); Senior Vice President, The Invesco Funds; and Director, Invesco Investment Advisers LLC (formerly known as Van Kampen Asset Management) Formerly: Director, President and Chairman, Invesco Insurance Agency, Inc.; Director, Invesco UK Limited; Director and Chief Executive, Invesco Asset Management Limited and Invesco Fund Managers Limited; Assistant Vice President, The Invesco Funds; Senior Vice President, Invesco Advisers, Inc. (formerly known as Invesco Institutional (N.A.), Inc.) (registered investment adviser); Director and Chief Executive, Invesco Administration Services Limited and Invesco Global Investment Funds Limited; Director, Invesco Distributors, Inc.; Head of EMEA, Invesco Ltd.; President, Invesco Actively Managed Exchange-Traded Commodity Fund Trust, Invesco Actively Managed Exchange-Traded Fund Trust, Invesco Exchange-Traded Fund Trust, Invesco Exchange-Traded Fund Trust II and Invesco India Exchange-Traded Fund Trust; and Managing Director and Principal Executive Officer, Invesco Capital Management LLC | | N/A | | N/A |
T-4 Invesco Senior Loan Fund
Trustees and Officers–(continued)
| | | | | | | | |
Name, Year of Birth and
Position(s)
Held with the Trust | | Trustee
and/or
Officer
Since | | Principal Occupation(s) During Past 5 Years | | Number of
Funds in
Fund Complex
Overseen by
Trustee | | Other
Directorship(s)
Held by Trustee
During Past 5
Years |
| Officers–(continued) | | | | | | | | |
John M. Zerr - 1962 Senior Vice President | | 2010 | | Chief Operating Officer of the Americas; Senior Vice President, Invesco Advisers, Inc. (formerly known as Invesco Institutional (N.A.), Inc.) (registered investment adviser); Senior Vice President, Invesco Distributors, Inc. (formerly known as Invesco AIM Distributors, Inc.); Director and Vice President, Invesco Investment Services, Inc. (formerly known as Invesco AIM Investment Services, Inc.) Senior Vice President, The Invesco Funds; Managing Director, Invesco Capital Management LLC; Director, Invesco Investment Advisers LLC (formerly known as Van Kampen Asset Management); Senior Vice President, Invesco Capital Markets, Inc. (formerly known as Van Kampen Funds Inc.); Manager, Invesco Indexing LLC; Manager, Invesco Specialized Products, LLC; Member, Invesco Canada Funds Advisory Board; Director, President and Chief Executive Officer, Invesco Corporate Class Inc. (corporate mutual fund company); and Director, Chairman, President and Chief Executive Officer, Invesco Canada Ltd. (formerly known as Invesco Trimark Ltd./Invesco Trimark Ltèe) (registered investment adviser and registered transfer agent); President, Invesco, Inc.; President, Invesco Global Direct Real Estate Feeder GP Ltd.; President, Invesco IP Holdings (Canada) Ltd; President, Invesco Global Direct Real Estate GP Ltd.; President, Invesco Financial Services Ltd. / Services Financiers Invesco Ltée; and Director and Chairman, Invesco Trust Company Formerly: President, Trimark Investments Ltd/Services Financiers Invesco Ltee; Director and Senior Vice President, Invesco Insurance Agency, Inc.; Director and Senior Vice President, Invesco Management Group, Inc. (formerly known as Invesco AIM Management Group, Inc.); Secretary and General Counsel, Invesco Management Group, Inc. (formerly known as Invesco AIM Management Group, Inc.); Secretary, Invesco Investment Services, Inc. (formerly known as Invesco AIM Investment Services, Inc.); Chief Legal Officer and Secretary, The Invesco Funds; Secretary and General Counsel, Invesco Investment Advisers LLC (formerly known as Van Kampen Asset Management); Secretary and General Counsel, Invesco Capital Markets, Inc. (formerly known as Van Kampen Funds Inc.); Chief Legal Officer, Invesco Exchange-Traded Fund Trust, Invesco Exchange-Traded Fund Trust II, Invesco India Exchange-Traded Fund Trust, Invesco Actively Managed Exchange-Traded Fund Trust, Invesco Actively Managed Exchange-Traded Commodity Fund Trust and Invesco Exchange-Traded Self-Indexed Fund Trust; Secretary, Invesco Indexing LLC; Director, Secretary, General Counsel and Senior Vice President, Van Kampen Exchange Corp.; Director, Vice President and Secretary, IVZ Distributors, Inc. (formerly known as INVESCO Distributors, Inc.); Director and Vice President, INVESCO Funds Group, Inc.; Director and Vice President, Van Kampen Advisors Inc.; Director, Vice President, Secretary and General Counsel, Van Kampen Investor Services Inc.;Director and Secretary, Invesco Distributors, Inc. (formerly known as Invesco AIM Distributors, Inc.); Director, Senior Vice President, General Counsel and Secretary, Invesco AIM Advisers, Inc. and Van Kampen Investments Inc.; Director, Vice President and Secretary, Fund Management Company; Director, Senior Vice President, Secretary, General Counsel and Vice President, Invesco AIM Capital Management, Inc.; and Chief Operating Officer and General Counsel, Liberty Ridge Capital, Inc. (an investment adviser) | | N/A | | N/A |
| Gregory G. McGreevey - 1962 Senior Vice President | | 2012 | | Senior Managing Director, Invesco Ltd.; Director, Chairman, President, and Chief Executive Officer, Invesco Advisers, Inc. (formerly known as Invesco Institutional (N.A.), Inc.) (registered investment adviser); Director, Invesco Mortgage Capital, Inc. and Invesco Senior Secured Management, Inc.; Senior Vice President, The Invesco Funds; President, SNW Asset Management Corporation and Invesco Managed Accounts, LLC; Chairman and Director, Invesco Private Capital, Inc.; Chairman and Director, INVESCO Private Capital Investments, Inc.; Chairman and Director, INVESCO Realty, Inc.; and Senior Vice President, Invesco Group Services, Inc. Formerly: Senior Vice President, Invesco Management Group, Inc. and Invesco Advisers, Inc.; Assistant Vice President, The Invesco Funds | | N/A | | N/A |
| Adrien Deberghes- 1967 Principal Financial Officer, Treasurer and Vice President | | 2020 | | Head of the Fund Office of the CFO and Fund Administration; Vice President, Invesco Advisers, Inc.; Principal Financial Officer, Treasurer and Vice President, The Invesco Funds; Vice President, Invesco Exchange-Traded Fund Trust, Invesco Exchange-Traded Fund Trust II, Invesco India Exchange-Traded Fund Trust, Invesco Actively Managed Exchange-Traded Fund Trust, Invesco Actively Managed Exchange-Traded Commodity Fund Trust and Invesco Exchange-Traded Self-Indexed Fund Trust Formerly: Senior Vice President and Treasurer, Fidelity Investments | | N/A | | N/A |
| Crissie M. Wisdom - 1969 Anti-Money Laundering Compliance Officer | | 2013 | | Anti-Money Laundering and OFAC Compliance Officer for Invesco U.S. entities including: Invesco Advisers, Inc. and its affiliates, Invesco Capital Markets, Inc., Invesco Distributors, Inc., Invesco Investment Services, Inc., The Invesco Funds, Invesco Capital Management, LLC, Invesco Trust Company; and Fraud Prevention Manager for Invesco Investment Services, Inc. | | N/A | | N/A |
T-5 Invesco Senior Loan Fund
Trustees and Officers–(continued)
| | | | | | | | |
Name, Year of Birth and
Position(s)
Held with the Trust | | Trustee
and/or
Officer
Since | | Principal Occupation(s) During Past 5 Years | | Number of
Funds in
Fund Complex
Overseen by
Trustee | | Other
Directorship(s)
Held by Trustee
During Past 5
Years |
| Officers–(continued) | | | | | | | | |
Todd F. Kuehl - 1969 Chief Compliance Officer and Senior Vice President | | 2020 | | Chief Compliance Officer, Invesco Advisers, Inc. (registered investment adviser); and Chief Compliance Officer and Senior Vice President, The Invesco Funds Formerly: Managing Director and Chief Compliance Officer, Legg Mason (Mutual Funds); Chief Compliance Officer, Legg Mason Private Portfolio Group (registered investment adviser) | | N/A | | N/A |
| James Bordewick, Jr. - 1959 Senior Vice President and Senior Officer | | 2022 | | Senior Vice President and Senior Officer, The Invesco Funds Formerly: Chief Legal Officer, KingsCrowd, Inc. (research and analytical platform for investment in private capital markets); Chief Operating Officer and Head of Legal and Regulatory, Netcapital (private capital investment platform); Managing Director, General Counsel of asset management and Chief Compliance Officer for asset management and private banking, Bank of America Corporation; Chief Legal Officer, Columbia Funds and BofA Funds; Senior Vice President and Associate General Counsel, MFS Investment Management; Chief Legal Officer, MFS Funds; Associate, Ropes & Gray; and Associate, Gaston Snow & Ely Bartlett | | N/A | | N/A |
| | | | | | |
| Office of the Fund | | Investment Adviser | | Distributor | | Auditors |
| 1331 Spring Street NW, Suite 2500 | | Invesco Advisers, Inc. | | Invesco Distributors, Inc. | | PricewaterhouseCoopers LLP |
| Atlanta, GA 30309 | | 1331 Spring Street NW, Suite 2500 | | 11 Greenway Plaza, Suite 1000 | | 1000 Louisiana Street, Suite 5800 |
| | Atlanta, GA 30309 | | Houston, TX 77046-1173 | | Houston, TX 77002-5021 |
| | | |
| Counsel to the Fund | | Investment Sub‑Adviser | | Transfer Agent | | Custodian |
| Stradley Ronon Stevens & Young, LLP | | Invesco Senior Secured Management, Inc. | | Invesco Investment Services, Inc. | | State Street Bank and Trust Company |
| 2005 Market Street, Suite 2600 | | 225 Liberty Street | | 11 Greenway Plaza, Suite 1000 | | 225 Franklin Street |
| Philadelphia, PA 19103-7018 | | New York, NY 10281 | | Houston, TX 77046-1173 | | Boston, MA 02110-2801 |
| | | |
| Counsel to the Independent Trustees | | | | | | |
| Sidley Austin LLP | | | | | | |
| 787 Seventh Avenue | | | | | | |
| New York, NY 10019 | | | | | | |
T-6 Invesco Senior Loan Fund
Go paperless with eDelivery
Visit invesco.com/edelivery to enjoy the convenience and security of anytime electronic access to your investment documents.
With eDelivery, you can elect to have any or all of the following materials delivered straight to your inbox to download, save and print from your own computer:
∎ Fund reports and prospectuses
∎ Quarterly statements
∎ Daily confirmations
∎ Tax forms
Invesco mailing information
Send general correspondence to Invesco Investment Services, Inc., P.O. Box 219078, Kansas City, MO 64121-9078.
Important notice regarding delivery of security holder documents
To reduce Fund expenses, only one copy of most shareholder documents may be mailed to shareholders with multiple accounts at the same address (Householding). Mailing of your shareholder documents may be householded indefinitely unless you instruct us otherwise. If you do not want the mailing of these documents to be combined with those for other members of your household, please contact Invesco Investment Services, Inc. at 800 959 4246 or contact your financial institution. We will begin sending you individual copies for each account within 30 days after receiving your request.
Fund holdings and proxy voting information
The Fund provides a complete list of its portfolio holdings four times each year, at the end of each fiscal quarter. For the second and fourth quarters, the list appears, respectively, in the Fund’s semiannual and annual reports to shareholders. For the first and third quarters, the Fund files the list with the Securities and Exchange Commission (SEC) as an exhibit to its reports on Form N‑PORT. The most recent list of portfolio holdings is available at invesco.com/completeqtrholdings. Shareholders can also look up the Fund’s Form N‑PORT filings on the SEC website, sec.gov. The SEC file numbers for the Fund are shown below.
A description of the policies and procedures that the Fund uses to determine how to vote proxies relating to portfolio securities is available without charge, upon request, from our Client Services department at 800 959 4246, or at invesco.com/corporate/about‑us/esg. The information is also available on the SEC website, sec.gov.
Information regarding how the Fund voted proxies related to its portfolio securities during the most recent 12‑month period ended June 30 is available at invesco.com/proxysearch. This information is also available on the SEC website, sec.gov.
Invesco Advisers, Inc. is an investment adviser; it provides investment advisory services to individual and institutional clients and does not sell securities. Invesco Distributors, Inc. is the US distributor for Invesco Ltd.’s retail mutual funds, exchange-traded funds and institutional money market funds. Both are wholly owned, indirect subsidiaries of Invesco Ltd.
| | | | |
| SEC file number(s): 811‑05845 | | Invesco Distributors, Inc. | | VK‑SLO‑AR‑1 |