UNITED STATES
SECURITIES AND EXCHANGE COMMISSION
Washington, D.C. 20549
FORM N-CSR
CERTIFIED SHAREHOLDER REPORT OF
REGISTERED MANAGEMENT INVESTMENT COMPANIES
Investment Company Act file number 811-5851
MFS INTERMARKET INCOME TRUST I
(Exact name of registrant as specified in charter)
111 Huntington Avenue, Boston, Massachusetts 02199
(Address of principal executive offices) (Zip code)
Susan S. Newton
Massachusetts Financial Services Company
111 Huntington Avenue
Boston, Massachusetts 02199
(Name and address of agents for service)
Registrant’s telephone number, including area code: (617) 954-5000
Date of fiscal year end: November 30
Date of reporting period: May 31, 2013
| ITEM 1. | REPORTS TO STOCKHOLDERS. |
SEMIANNUAL REPORT
May 31, 2013

MFS® INTERMARKET
INCOME TRUST I

CMK-SEM
MFS® INTERMARKET INCOME TRUST I
New York Stock Exchange Symbol: CMK
NOT FDIC INSURED Ÿ MAY LOSE VALUE Ÿ NO BANK GUARANTEE

LETTER FROM THE CHAIRMAN AND CEO
Dear Shareholders:
With the year almost half over, the global economy continues to grind forward slowly, weighed down by various austerity measures. The U.S. economy remains a steadying
force with resilient consumers, who took the payroll tax increase in stride and did not seem fazed by the sequestration’s early impact. The U.S. housing market recovery remains robust. With U.S. consumer sentiment rising to multi-year highs, the country’s economic outlook remains positive, except for an anticipated mid-year sequestration-related slowdown. However, market volatility has been heightened, with renewed expectations of a shift in U.S. Federal Reserve policy and a tapering of its monthly bond-buying program.
Japan has been another bright spot, with signs of a turnaround prompted by “Abenomics,” the stimulus policies of Prime
Minister Shinzo Abe. Consumer and business sentiment have risen, along with prospects for exporters, who gain as a devalued yen means less expensive products overseas and boosted sales. The Japanese stock market advanced more than 30% from January through May. However, doubts remain over whether Abenomics will succeed in lifting Japan out of its long-term deflationary slump. The major deterrent to global growth remains the eurozone’s chronic contraction, which has weighed on that 17-member region. China has seen its factory activity decelerate, which is worrisome news for the country’s trading partners.
As always, managing risk in the face of uncertainty remains a top priority for investors. At MFS®, our uniquely collaborative investment process employs integrated, global research and active risk management. Our global team of investment professionals shares ideas and evaluates opportunities across continents, investment disciplines and asset classes — all with a goal of building better insights, and ultimately better results, for our clients.
We are mindful of the many economic challenges investors face, and believe it is more important than ever to maintain a long-term view and employ time-tested principles, such as asset allocation and diversification. We remain confident that our unique approach can serve investors well as they work with their financial advisors to identify and pursue the most suitable opportunities.
Respectfully,

Robert J. Manning
Chairman and Chief Executive Officer
MFS Investment Management®
July 17, 2013
The opinions expressed in this letter are subject to change, may not be relied upon for investment advice, and no forecasts can be guaranteed.
1
PORTFOLIO COMPOSITION
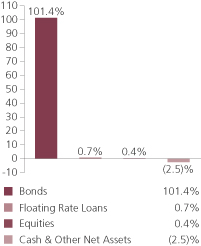
Portfolio structure (i)
| | | | |
| Fixed income sectors (i) | | | | |
| High Grade Corporates | | | 59.4% | |
| High Yield Corporates | | | 32.6% | |
| Non-U.S. Government Bonds | | | 9.6% | |
| Emerging Markets Bonds | | | 6.4% | |
| Mortgage-Backed Securities | | | 1.1% | |
| Floating Rate Loans | | | 0.7% | |
| Asset-Backed Securities | | | 0.6% | |
| Collateralized Debt Obligations | | | 0.5% | |
| Municipal Bonds | | | 0.4% | |
| U.S. Government Agencies (o) | | | 0.0% | |
| U.S. Treasury Securities | | | (9.2)% | |
| | | | |
| Composition including fixed income credit quality (a)(i) | |
| AAA | | | 3.5% | |
| AA | | | 6.3% | |
| A | | | 24.3% | |
| BBB | | | 41.3% | |
| BB | | | 14.9% | |
| B | | | 15.5% | |
| CCC | | | 4.3% | |
| Federal Agencies | | | 1.1% | |
| Not Rated | | | (9.1)% | |
| Non-Fixed Income | | | 0.4% | |
| Cash & Other | | | (2.5)% | |
| |
| Portfolio facts (i) | | | | |
| Average Duration (d) | | | 4.9 | |
| Average Effective Maturity (m) | | | 7.0 yrs. | |
|
| Issuer country weightings (i)(x) | |
| United States | | | 62.5% | |
| United Kingdom | | | 5.4% | |
| Netherlands | | | 3.7% | |
| Canada | | | 3.0% | |
| France | | | 2.5% | |
| Italy | | | 2.3% | |
| Russia | | | 2.1% | |
| Australia | | | 2.1% | |
| Spain | | | 1.9% | |
| Other Countries | | | 14.5% | |
2
Portfolio Composition – continued
| (a) | For all securities other than those specifically described below, ratings are assigned to underlying securities utilizing ratings from Moody’s, Fitch, and Standard & Poor’s rating agencies and applying the following hierarchy: If all three agencies provide a rating, the middle rating (after dropping the highest and lowest ratings) is assigned; if two of the three agencies rate a security, the lower of the two is assigned. Ratings are shown in the S&P and Fitch scale (e.g., AAA). Securities rated BBB or higher are considered investment grade. All ratings are subject to change. Federal Agencies includes rated and unrated U.S. Agency fixed-income securities, U.S. Agency mortgage-backed securities, and collateralized mortgage obligations of U.S. Agency mortgage-backed securities. Not Rated includes fixed income securities, including fixed income futures contracts, which have not been rated by any rating agency. Non-Fixed Income includes equity securities (including convertible bonds and equity derivatives) and commodities. Cash & Other includes cash, other assets less liabilities, offsets to derivative positions, and short-term securities. The fund may not hold all of these instruments. The fund is not rated by these agencies. |
| (d) | Duration is a measure of how much a bond’s price is likely to fluctuate with general changes in interest rates, e.g., if rates rise 1.00%, a bond with a 5-year duration is likely to lose about 5.00% of its value due to the interest rate move. |
| (i) | For purposes of this presentation, the components include the market value of securities, and reflect the impact of the equivalent exposure of derivative positions, if any. These amounts may be negative from time to time. The bond component will include any accrued interest amounts. Equivalent exposure is a calculated amount that translates the derivative position into a reasonable approximation of the amount of the underlying asset that the portfolio would have to hold at a given point in time to have the same price sensitivity that results from the portfolio’s ownership of the derivative contract. When dealing with derivatives, equivalent exposure is a more representative measure of the potential impact of a position on portfolio performance than market value. Where the fund holds convertible bonds, these are treated as part of the equity portion of the portfolio. |
| (m) | In determining an instrument’s effective maturity for purposes of calculating the fund’s dollar-weighted average effective maturity, MFS uses the instrument’s stated maturity or, if applicable, an earlier date on which MFS believes it is probable that a maturity-shortening device (such as a put, pre-refunding or prepayment) will cause the instrument to be repaid. Such an earlier date can be substantially shorter than the instrument’s stated maturity. |
| (x) | Represents the portfolio’s exposure to issuer countries as a percentage of a portfolio’s net assets. |
From time to time “Cash & Other Net Assets” may be negative due to borrowings for leverage transactions, timing of cash receipts, and/or equivalent exposure from any derivative holdings.
Percentages are based on net assets as of 5/31/13.
The portfolio is actively managed and current holdings may be different.
3
PORTFOLIO MANAGERS’ PROFILES
| | | | |
| William Adams | | — | | Investment Officer of MFS; employed in the investment management area of MFS since 2009. Portfolio Manager of the Fund since May 2011. |
| | |
| Ward Brown | | — | | Investment Officer of MFS; employed in the investment management area of MFS since 2008. Portfolio Manager of the Fund since February 2012. |
| | |
| James Calmas | | — | | Investment Officer of MFS; employed in the investment management area of MFS since 1988. Portfolio Manager of the Fund since June 2007. |
| | |
| David Cole | | — | | Investment Officer of MFS; employed in the investment management area of MFS since 2004. Portfolio Manager of the Fund since December 2011. |
| | |
| Matthew Ryan | | — | | Investment Officer of MFS; employed in the investment management area of MFS since 1997. Portfolio Manager of the Fund since February 2012. |
| | |
| Erik Weisman | | — | | Investment Officer of MFS; employed in the investment management area of MFS since 2002. Portfolio Manager of the Fund since December 2012. |
Note to Shareholders: Effective December 1, 2012, Erik Weisman is also a Portfolio Manager of the Fund.
OTHER NOTES
The fund’s shares may trade at a discount or premium to net asset value. Shareholders do not have the right to cause the fund to repurchase their shares at net asset value. When fund shares trade at a premium, buyers pay more than the net asset value of underlying fund shares, and shares purchased at a premium would receive less than the amount paid for them in the event of the fund’s liquidation. As a result, the total return that is calculated based on the net asset value and New York Stock Exchange price can be different.
The fund’s monthly distributions may include a return of capital to shareholders to the extent that distributions are in excess of the fund’s net investment income and net capital gains, determined in accordance with federal income tax regulations. Distributions that are treated for federal income tax purposes as a return of capital will reduce each shareholder’s basis in his or her shares and, to the extent the return of capital exceeds such basis, will be treated as gain to the shareholder from a sale of shares. Returns of shareholder capital have the effect of reducing the fund’s assets and increasing the fund’s expense ratio.
In accordance with Section 23(c) of the Investment Company Act of 1940, the fund hereby gives notice that it may from time to time repurchase shares of the fund in the open market at the option of the Board of Trustees and on such terms as the Trustees shall determine.
4
PORTFOLIO OF INVESTMENTS
5/31/13 (unaudited)
The Portfolio of Investments is a complete list of all securities owned by your fund. It is categorized by broad-based asset classes.
| | | | | | | | |
| Bonds - 109.2% | | | | | | | | |
| Issuer | | Shares/Par | | | Value ($) | |
| Aerospace - 0.9% | | | | | | | | |
| Bombardier, Inc., 4.25%, 2016 (n) | | $ | 22,000 | | | $ | 22,770 | |
| Bombardier, Inc., 7.5%, 2018 (n) | | | 260,000 | | | | 297,700 | |
| Bombardier, Inc., 7.75%, 2020 (n) | | | 75,000 | | | | 87,750 | |
| CPI International, Inc., 8%, 2018 | | | 105,000 | | | | 110,989 | |
| Huntington Ingalls Industries, Inc., 7.125%, 2021 | | | 220,000 | | | | 241,450 | |
| Kratos Defense & Security Solutions, Inc., 10%, 2017 | | | 155,000 | | | | 168,950 | |
| | | | | | | | |
| | | | | | | $ | 929,609 | |
| Apparel Manufacturers - 0.5% | | | | | | | | |
| Hanesbrands, Inc., 6.375%, 2020 | | $ | 85,000 | | | $ | 93,713 | |
| Jones Group, Inc., 6.875%, 2019 | | | 85,000 | | | | 90,844 | |
| PVH Corp., 7.375%, 2020 | | | 205,000 | | | | 227,038 | |
| PVH Corp., 4.5%, 2022 | | | 65,000 | | | | 64,838 | |
| | | | | | | | |
| | | | | | | $ | 476,433 | |
| Asset-Backed & Securitized - 1.1% | | | | | | | | |
| Anthracite Ltd., “A”, CDO, FRN, 0.556%, 2019 (z) | | $ | 82,924 | | | $ | 82,236 | |
| Capital Trust Realty Ltd., CDO, 5.16%, 2035 (n) | | | 84,271 | | | | 84,321 | |
| Crest Ltd., “A1” CDO, FRN, 0.763%, 2018 (z) | | | 33,518 | | | | 33,015 | |
| Equity One ABS, Inc., FRN, 4.205%, 2034 | | | 173,865 | | | | 172,864 | |
| GMAC Mortgage Corp. Loan Trust, FRN, 5.865%, 2034 | | | 150,341 | | | | 141,867 | |
| HLSS Servicer Advance Receivables Trust, 2013-T1, “A2”, 1.495%, 2046 (n) | | | 300,000 | | | | 302,070 | |
| Race Point CLO Ltd., “A1A”, FRN, 0.474%, 2021 (n) | | | 320,000 | | | | 316,399 | |
| | | | | | | | |
| | | | | | | $ | 1,132,772 | |
| Automotive - 2.8% | | | | | | | | |
| Accuride Corp., 9.5%, 2018 | | $ | 140,000 | | | $ | 145,950 | |
| Allison Transmission, Inc., 7.125%, 2019 (n) | | | 170,000 | | | | 182,750 | |
| Daimler Finance North America LLC, 1.875%, 2018 (n) | | | 521,000 | | | | 518,693 | |
| Daimler Finance North America LLC, FRN, 1.48%, 2013 (n) | | | 320,000 | | | | 320,788 | |
| Delphi Corp., 5%, 2023 | | | 90,000 | | | | 95,513 | |
| Ford Motor Credit Co. LLC, 12%, 2015 | | | 167,000 | | | | 199,759 | |
| Ford Motor Credit Co. LLC, 8.125%, 2020 | | | 100,000 | | | | 126,003 | |
| General Motors Financial Co., Inc., 6.75%, 2018 | | | 155,000 | | | | 176,700 | |
| General Motors Financial Co., Inc., 4.25%, 2023 (z) | | | 35,000 | | | | 34,125 | |
| Goodyear Tire & Rubber Co., 8.25%, 2020 | | | 25,000 | | | | 27,844 | |
| Goodyear Tire & Rubber Co., 6.5%, 2021 | | | 95,000 | | | | 99,988 | |
| Goodyear Tire & Rubber Co., 7%, 2022 | | | 40,000 | | | | 43,100 | |
| Harley-Davidson Financial Services, 3.875%, 2016 (n) | | | 450,000 | | | | 479,635 | |
5
Portfolio of Investments (unaudited) – continued
| | | | | | | | |
| Issuer | | Shares/Par | | | Value ($) | |
| Bonds - continued | | | | | | | | |
| Automotive - continued | | | | | | | | |
| Jaguar Land Rover PLC, 8.125%, 2021 (n) | | $ | 150,000 | | | $ | 169,125 | |
| Jaguar Land Rover PLC, 5.625%, 2023 (n) | | | 150,000 | | | | 153,375 | |
| Lear Corp., 8.125%, 2020 | | | 52,000 | | | | 57,720 | |
| Lear Corp., 4.75%, 2023 (n) | | | 25,000 | | | | 24,625 | |
| LKQ Corp., 4.75%, 2023 (z) | | | 10,000 | | | | 9,975 | |
| | | | | | | | |
| | | | | | | $ | 2,865,668 | |
| Biotechnology - 0.5% | | | | | | | | |
| Life Technologies Corp., 6%, 2020 | | $ | 400,000 | | | $ | 464,493 | |
| | |
| Broadcasting - 3.5% | | | | | | | | |
| Allbritton Communications Co., 8%, 2018 | | $ | 50,000 | | | $ | 54,000 | |
| AMC Networks, Inc., 7.75%, 2021 | | | 114,000 | | | | 129,105 | |
| CBS Corp., 5.75%, 2020 | | | 110,000 | | | | 127,372 | |
| CBS Corp., 3.375%, 2022 | | | 298,000 | | | | 298,325 | |
| Clear Channel Communications, Inc., 9%, 2021 | | | 118,000 | | | | 117,115 | |
| Clear Channel Worldwide Holdings, Inc., 6.5%, 2022 (n) | | | 25,000 | | | | 26,250 | |
| Clear Channel Worldwide Holdings, Inc., 6.5%, 2022 (n) | | | 90,000 | | | | 94,950 | |
| Clear Channel Worldwide Holdings, Inc., “A”, 7.625%, 2020 | | | 5,000 | | | | 5,288 | |
| Clear Channel Worldwide Holdings, Inc., “B”, 7.625%, 2020 | | | 30,000 | | | | 31,875 | |
| Hughes Network Systems LLC, 7.625%, 2021 | | | 60,000 | | | | 67,050 | |
| IAC/InterActiveCorp, 4.75%, 2022 (n) | | | 30,000 | | | | 29,475 | |
| Inmarsat Finance PLC, 7.375%, 2017 (n) | | | 130,000 | | | | 136,500 | |
| Intelsat Bermuda Ltd., 11.25%, 2017 | | | 108,000 | | | | 114,264 | |
| Intelsat Jackson Holdings S.A., 6.625%, 2022 (z) | | | 85,000 | | | | 88,506 | |
| Intelsat Jackson Holdings S.A., 6.625%, 2022 (n) | | | 45,000 | | | | 46,856 | |
| Intelsat S.A., 8.125%, 2023 (z) | | | 55,000 | | | | 58,850 | |
| LBI Media, Inc., 13.5% to 2015, 11.5% to 2020 (p)(z) | | | 39,318 | | | | 15,727 | |
| Liberty Media Corp., 8.5%, 2029 | | | 105,000 | | | | 116,550 | |
| Liberty Media Corp., 8.25%, 2030 | | | 35,000 | | | | 38,500 | |
| Local TV Finance LLC, 9.25%, 2015 (p)(z) | | | 91,767 | | | | 91,767 | |
| Netflix, Inc., 5.375%, 2021 (n) | | | 50,000 | | | | 50,750 | |
| News America, Inc., 8.5%, 2025 | | | 233,000 | | | | 310,295 | |
| Nexstar Broadcasting Group, Inc., 8.875%, 2017 | | | 45,000 | | | | 48,938 | |
| Nexstar Broadcasting Group, Inc., 6.875%, 2020 (n) | | | 35,000 | | | | 37,275 | |
| Sinclair Broadcast Group, Inc., 9.25%, 2017 (n) | | | 50,000 | | | | 53,500 | |
| Sinclair Broadcast Group, Inc., 8.375%, 2018 | | | 15,000 | | | | 16,575 | |
| SIRIUS XM Radio, Inc., 8.75%, 2015 (n) | | | 60,000 | | | | 66,750 | |
| SIRIUS XM Radio, Inc., 7.625%, 2018 (n) | | | 75,000 | | | | 82,500 | |
| SIRIUS XM Radio, Inc., 4.25%, 2020 (z) | | | 20,000 | | | | 19,600 | |
| SIRIUS XM Radio, Inc., 5.25%, 2022 (n) | | | 50,000 | | | | 51,375 | |
| Univision Communications, Inc., 6.875%, 2019 (n) | | | 125,000 | | | | 132,813 | |
| Univision Communications, Inc., 7.875%, 2020 (n) | | | 145,000 | | | | 158,775 | |
| Univision Communications, Inc., 8.5%, 2021 (n) | | | 75,000 | | | | 81,188 | |
6
Portfolio of Investments (unaudited) – continued
| | | | | | | | |
| Issuer | | Shares/Par | | | Value ($) | |
| Bonds - continued | | | | | | | | |
| Broadcasting - continued | | | | | | | | |
| Vivendi S.A., 4.75%, 2022 (n) | | $ | 330,000 | | | $ | 350,560 | |
| WPP Finance, 8%, 2014 | | | 400,000 | | | | 434,484 | |
| | | | | | | | |
| | | | | | | $ | 3,583,703 | |
| Brokerage & Asset Managers - 1.2% | | | | | | | | |
| Blackstone Holdings Finance Co. LLC, 4.75%, 2023 (n) | | $ | 301,000 | | | $ | 326,279 | |
| E*TRADE Financial Corp., 6.375%, 2019 | | | 225,000 | | | | 236,250 | |
| Invesco Finance PLC, 3.125%, 2022 | | | 274,000 | | | | 269,681 | |
| TD Ameritrade Holding Corp., 5.6%, 2019 | | | 350,000 | | | | 417,252 | |
| | | | | | | | |
| | | | | | | $ | 1,249,462 | |
| Building - 1.3% | | | | | | | | |
| ABC Supply Co., Inc., 5.625%, 2021 (z) | | $ | 20,000 | | | $ | 20,250 | |
| Boise Cascade Co., 6.375%, 2020 | | | 65,000 | | | | 69,713 | |
| Building Materials Holding Corp., 6.875%, 2018 (n) | | | 45,000 | | | | 48,038 | |
| Building Materials Holding Corp., 7%, 2020 (n) | | | 200,000 | | | | 214,000 | |
| Building Materials Holding Corp., 6.75%, 2021 (n) | | | 40,000 | | | | 43,300 | |
| CRH PLC, 8.125%, 2018 | | | 210,000 | | | | 261,358 | |
| HD Supply, Inc., 8.125%, 2019 | | | 50,000 | | | | 55,500 | |
| HD Supply, Inc., 11.5%, 2020 | | | 40,000 | | | | 47,000 | |
| HD Supply, Inc., 10.5%, 2021 | | | 5,000 | | | | 5,188 | |
| Nortek, Inc., 8.5%, 2021 | | | 150,000 | | | | 164,250 | |
| Owens Corning, Inc., 4.2%, 2022 | | | 166,000 | | | | 170,630 | |
| Roofing Supply Group LLC/Roofing Supply Finance, Inc., 10%, 2020 (n) | | | 30,000 | | | | 33,375 | |
| USG Corp., 6.3%, 2016 | | | 132,000 | | | | 139,590 | |
| USG Corp., 7.875%, 2020 (n) | | | 45,000 | | | | 50,597 | |
| | | | | | | | |
| | | | | | | $ | 1,322,789 | |
| Business Services - 1.0% | | | | | | | | |
| Equinix, Inc., 4.875%, 2020 | | $ | 55,000 | | | $ | 55,963 | |
| Fidelity National Information Services, Inc., 5%, 2022 | | | 90,000 | | | | 96,300 | |
| iGate Corp., 9%, 2016 | | | 205,000 | | | | 220,375 | |
| Iron Mountain, Inc., 8.375%, 2021 | | | 130,000 | | | | 141,213 | |
| Legend Acquisition Sub, Inc., 10.75%, 2020 (n) | | | 55,000 | | | | 46,750 | |
| Neustar, Inc., 4.5%, 2023 (n) | | | 55,000 | | | | 53,625 | |
| SunGard Data Systems, Inc., 7.375%, 2018 | | | 140,000 | | | | 149,100 | |
| Tencent Holdings Ltd., 3.375%, 2018 (n) | | | 209,000 | | | | 213,967 | |
| | | | | | | | |
| | | | | | | $ | 977,293 | |
| Cable TV - 2.7% | | | | | | | | |
| Bresnan Broadband Holdings LLC, 8%, 2018 (n) | | $ | 25,000 | | | $ | 27,063 | |
| CCO Holdings LLC, 8.125%, 2020 | | | 105,000 | | | | 117,338 | |
| CCO Holdings LLC, 7.375%, 2020 | | | 40,000 | | | | 44,650 | |
7
Portfolio of Investments (unaudited) – continued
| | | | | | | | |
| Issuer | | Shares/Par | | | Value ($) | |
| Bonds - continued | | | | | | | | |
| Cable TV - continued | | | | | | | | |
| CCO Holdings LLC, 6.5%, 2021 | | $ | 155,000 | | | $ | 166,625 | |
| CCO Holdings LLC, 5.125%, 2023 | | | 35,000 | | | | 34,300 | |
| CCO Holdings LLC/CCO Capital Corp., 5.75%, 2024 | | | 40,000 | | | | 40,400 | |
| Cequel Communications Holdings, 6.375%, 2020 (n) | | | 70,000 | | | | 73,150 | |
| Cox Communications, Inc., 3.25%, 2022 (n) | | | 413,000 | | | | 406,008 | |
| DIRECTV Holdings LLC, 5.875%, 2019 | | | 160,000 | | | | 188,259 | |
| DISH DBS Corp., 6.75%, 2021 | | | 55,000 | | | | 58,163 | |
| DISH DBS Corp., 5%, 2023 | | | 85,000 | | | | 80,325 | |
| EchoStar Corp., 7.125%, 2016 | | | 55,000 | | | | 60,225 | |
| NBCUniversal Enterprise, Inc., 1.974%, 2019 (n) | | | 247,000 | | | | 246,560 | |
| NBCUniversal Media LLC, 5.95%, 2041 | | | 367,000 | | | | 442,059 | |
| Time Warner Cable, Inc., 8.25%, 2019 | | | 110,000 | | | | 141,680 | |
| Time Warner Cable, Inc., 4%, 2021 | | | 170,000 | | | | 177,517 | |
| UPC Holding B.V., 9.875%, 2018 (n) | | | 100,000 | | | | 110,750 | |
| UPCB Finance III Ltd., 6.625%, 2020 (n) | | | 150,000 | | | | 159,750 | |
| Ziggo Bond Co. B.V., 8%, 2018 (n) | | EUR | 100,000 | | | | 140,860 | |
| | | | | | | | |
| | | | | | | $ | 2,715,682 | |
| Chemicals - 1.6% | | | | | | | | |
| Celanese U.S. Holdings LLC, 6.625%, 2018 | | $ | 165,000 | | | $ | 178,200 | |
| CF Industries, Inc., 3.45%, 2023 | | | 174,000 | | | | 171,823 | |
| Dow Chemical Co., 8.55%, 2019 | | | 540,000 | | | | 718,496 | |
| Hexion U.S. Finance Corp./Hexion Nova Scotia Finance, 8.875%, 2018 | | | 115,000 | | | | 120,031 | |
| Hexion U.S. Finance Corp./Hexion Nova Scotia Finance, 9%, 2020 | | | 65,000 | | | | 66,138 | |
| Huntsman International LLC, 8.625%, 2021 | | | 140,000 | | | | 156,450 | |
| Polypore International, Inc., 7.5%, 2017 | | | 50,000 | | | | 53,500 | |
| Sociedad Quimica y Minera de Chile S.A., 5.5%, 2020 (n) | | | 140,000 | | | | 156,796 | |
| | | | | | | | |
| | | | | | | $ | 1,621,434 | |
| Computer Software - 0.7% | | | | | | | | |
| Infor U.S., Inc., 11.5%, 2018 | | $ | 75,000 | | | $ | 87,938 | |
| Nuance Communications, Inc., 5.375%, 2020 (n) | | | 40,000 | | | | 40,500 | |
| Oracle Corp., 5.375%, 2040 | | | 244,000 | | | | 282,978 | |
| Syniverse Holdings, Inc., 9.125%, 2019 | | | 140,000 | | | | 152,950 | |
| TransUnion Holding Co., Inc., 9.625%, 2018 | | | 40,000 | | | | 43,100 | |
| TransUnion LLC/TransUnion Financing Corp., 11.375%, 2018 | | | 15,000 | | | | 16,950 | |
| Verisign, Inc., 4.625%, 2023 (n) | | | 45,000 | | | | 45,225 | |
| | | | | | | | |
| | | | | | | $ | 669,641 | |
| Computer Software - Systems - 0.3% | | | | | | | | |
| Audatex North America, Inc., 6.75%, 2018 (n) | | $ | 80,000 | | | $ | 85,100 | |
| CDW LLC/CDW Finance Corp., 12.535%, 2017 | | | 64,000 | | | | 68,800 | |
8
Portfolio of Investments (unaudited) – continued
| | | | | | | | |
| Issuer | | Shares/Par | | | Value ($) | |
| Bonds - continued | | | | | | | | |
| Computer Software - Systems - continued | | | | | | | | |
| CDW LLC/CDW Finance Corp., 8.5%, 2019 | | $ | 125,000 | | | $ | 138,281 | |
| | | | | | | | |
| | | | | | | $ | 292,181 | |
| Conglomerates - 1.4% | | | | | | | | |
| Amsted Industries, Inc., 8.125%, 2018 (n) | | $ | 175,000 | | | $ | 187,688 | |
| BC Mountain LLC, 7%, 2021 (n) | | | 50,000 | | | | 53,000 | |
| Dynacast International LLC, 9.25%, 2019 | | | 70,000 | | | | 77,175 | |
| Griffon Corp., 7.125%, 2018 | | | 140,000 | | | | 150,500 | |
| Ingersoll-Rand Global Holding Co. Ltd., 6%, 2013 | | | 290,000 | | | | 293,064 | |
| Ingersoll-Rand Global Holding Co. Ltd., 9.5%, 2014 | | | 472,000 | | | | 506,603 | |
| Silver II Borrower, 7.75%, 2020 (n) | | | 150,000 | | | | 155,625 | |
| | | | | | | | |
| | | | | | | $ | 1,423,655 | |
| Construction - 0.0% | | | | | | | | |
| Empresas ICA S.A.B. de C.V., 8.9%, 2021 | | $ | 25,000 | | | $ | 21,000 | |
| | |
| Consumer Products - 1.0% | | | | | | | | |
| Avon Products, Inc., 4.6%, 2020 | | $ | 303,000 | | | $ | 320,223 | |
| Elizabeth Arden, Inc., 7.375%, 2021 | | | 95,000 | | | | 105,806 | |
| Jarden Corp., 7.5%, 2020 | | | 100,000 | | | | 108,000 | |
| Libbey Glass, Inc., 6.875%, 2020 | | | 27,000 | | | | 29,228 | |
| Mattel, Inc., 5.45%, 2041 | | | 219,000 | | | | 237,063 | |
| Newell Rubbermaid, Inc., 2.05%, 2017 | | | 182,000 | | | | 181,411 | |
| Prestige Brands, Inc., 8.125%, 2020 | | | 40,000 | | | | 45,000 | |
| Spectrum Brands Escrow Corp., 6.375%, 2020 (n) | | | 30,000 | | | | 32,213 | |
| Spectrum Brands Escrow Corp., 6.625%, 2022 (n) | | | 5,000 | | | | 5,400 | |
| | | | | | | | |
| | | | | | | $ | 1,064,344 | |
| Consumer Services - 0.7% | | | | | | | | |
| Experian Finance PLC, 2.375%, 2017 (n) | | $ | 297,000 | | | $ | 299,381 | |
| QVC, Inc., 7.375%, 2020 (n) | | | 70,000 | | | | 77,349 | |
| Service Corp. International, 7%, 2017 | | | 255,000 | | | | 291,338 | |
| | | | | | | | |
| | | | | | | $ | 668,068 | |
| Containers - 0.7% | | | | | | | | |
| Ardagh Packaging Finance PLC, 9.125%, 2020 (n) | | $ | 200,000 | | | $ | 219,000 | |
| Ball Corp., 5%, 2022 | | | 52,000 | | | | 53,820 | |
| Ball Corp., 4%, 2023 | | | 25,000 | | | | 23,906 | |
| Berry Plastics Group, Inc., 9.5%, 2018 | | | 30,000 | | | | 32,850 | |
| Berry Plastics Group, Inc., 9.75%, 2021 | | | 35,000 | | | | 40,425 | |
| Crown Americas LLC, 4.5%, 2023 (n) | | | 60,000 | | | | 58,650 | |
| Reynolds Group, 7.125%, 2019 | | | 200,000 | | | | 213,000 | |
| Reynolds Group, 5.75%, 2020 | | | 55,000 | | | | 55,825 | |
| | | | | | | | |
| | | | | | | $ | 697,476 | |
9
Portfolio of Investments (unaudited) – continued
| | | | | | | | |
| Issuer | | Shares/Par | | | Value ($) | |
| Bonds - continued | | | | | | | | |
| Defense Electronics - 0.5% | | | | | | | | |
| BAE Systems Holdings, Inc., 6.375%, 2019 (n) | | $ | 300,000 | | | $ | 354,475 | |
| Ducommun, Inc., 9.75%, 2018 | | | 100,000 | | | | 111,000 | |
| | | | | | | | |
| | | | | | | $ | 465,475 | |
| Electrical Equipment - 0.5% | | | | | | | | |
| Arrow Electronics, Inc., 3%, 2018 | | $ | 105,000 | | | $ | 106,689 | |
| Avaya, Inc., 9.75%, 2015 | | | 40,000 | | | | 39,400 | |
| Avaya, Inc., 7%, 2019 (n) | | | 25,000 | | | | 23,313 | |
| Ericsson, Inc., 4.125%, 2022 | | | 298,000 | | | | 305,286 | |
| | | | | | | | |
| | | | | | | $ | 474,688 | |
| Electronics - 0.6% | | | | | | | | |
| Freescale Semiconductor, Inc., 9.25%, 2018 (n) | | $ | 130,000 | | | $ | 141,375 | |
| Nokia Corp., 5.375%, 2019 | | | 35,000 | | | | 34,300 | |
| Nokia Corp., 6.625%, 2039 | | | 25,000 | | | | 22,313 | |
| Sensata Technologies B.V., 6.5%, 2019 (n) | | | 260,000 | | | | 280,800 | |
| Tyco Electronics Group S.A., 3.5%, 2022 | | | 126,000 | | | | 125,902 | |
| | | | | | | | |
| | | | | | | $ | 604,690 | |
| Emerging Market Quasi-Sovereign - 3.6% | | | | | | | | |
| Comision Federal de Electricidad, 5.75%, 2042 (n) | | $ | 202,000 | | | $ | 208,060 | |
| Gaz Capital S.A., 3.85%, 2020 (n) | | | 280,000 | | | | 274,324 | |
| Gaz Capital S.A., 5.999%, 2021 (n) | | | 342,000 | | | | 377,825 | |
| Gaz Capital S.A., 4.95%, 2028 (n) | | | 239,000 | | | | 228,843 | |
| Korea Gas Corp., 2.25%, 2017 (n) | | | 370,000 | | | | 367,301 | |
| Petrobras Global Finance Co., 4.375%, 2023 | | | 16,000 | | | | 15,417 | |
| Petrobras International Finance Co., 7.875%, 2019 | | | 163,000 | | | | 196,814 | |
| Petrobras International Finance Co., 6.75%, 2041 | | | 167,000 | | | | 176,900 | |
| Petroleos Mexicanos, 5.5%, 2021 | | | 178,000 | | | | 197,580 | |
| Petroleos Mexicanos, 4.875%, 2022 | | | 110,000 | | | | 117,150 | |
| Petroleos Mexicanos, 6.5%, 2041 | | | 127,000 | | | | 142,240 | |
| PTT PLC, 3.375%, 2022 (n) | | | 200,000 | | | | 193,181 | |
| PTT PLC, 4.5%, 2042 (n) | | | 200,000 | | | | 176,453 | |
| Ras Laffan Liquefied Natural Gas Co. Ltd., 5.832%, 2016 (n) | | | 154,151 | | | | 165,326 | |
| Rosneft, 3.149%, 2017 (n) | | | 200,000 | | | | 200,476 | |
| Rosneft, 4.199%, 2022 (n) | | | 285,000 | | | | 272,175 | |
| Sinopec Capital (2013) Ltd., 3.125%, 2023 (n) | | | 200,000 | | | | 188,008 | |
| Sinopec Capital (2013) Ltd., 4.25%, 2043 (n) | | | 200,000 | | | | 179,877 | |
| | | | | | | | |
| | | | | | | $ | 3,677,950 | |
| Emerging Market Sovereign - 0.4% | | | | | | | | |
| Republic of Hungary, 5.375%, 2023 | | $ | 20,000 | | | $ | 19,925 | |
| Republic of Philippines, 6.375%, 2034 | | | 126,000 | | | | 160,808 | |
| Republic of Romania, 4.375%, 2023 (n) | | | 14,000 | | | | 13,851 | |
10
Portfolio of Investments (unaudited) – continued
| | | | | | | | |
| Issuer | | Shares/Par | | | Value ($) | |
| Bonds - continued | | | | | | | | |
| Emerging Market Sovereign - continued | | | | | | | | |
| Republic of Slovakia, 4.375%, 2022 (n) | | $ | 200,000 | | | $ | 213,540 | |
| | | | | | | | |
| | | | | | | $ | 408,124 | |
| Energy - Independent - 3.4% | | | | | | | | |
| Berry Petroleum Corp., 6.75%, 2020 | | $ | 20,000 | | | $ | 21,550 | |
| BreitBurn Energy Partners LP, 8.625%, 2020 | | | 45,000 | | | | 49,500 | |
| Breitburn Energy Partners LP, 7.875%, 2022 | | | 55,000 | | | | 59,675 | |
| Carrizo Oil & Gas, Inc., 8.625%, 2018 | | | 40,000 | | | | 43,600 | |
| Chaparral Energy, Inc., 7.625%, 2022 | | | 115,000 | | | | 124,200 | |
| Chesapeake Energy Corp., 6.875%, 2020 | | | 85,000 | | | | 95,625 | |
| Concho Resources, Inc., 8.625%, 2017 | | | 60,000 | | | | 63,975 | |
| Concho Resources, Inc., 6.5%, 2022 | | | 115,000 | | | | 124,200 | |
| Concho Resources, Inc., 5.5%, 2023 | | | 40,000 | | | | 40,900 | |
| Continental Resources, Inc., 8.25%, 2019 | | | 100,000 | | | | 111,000 | |
| Continental Resources, Inc., 7.375%, 2020 | | | 35,000 | | | | 39,463 | |
| Continental Resources, Inc., 4.5%, 2023 (z) | | | 21,000 | | | | 21,210 | |
| Denbury Resources, Inc., 8.25%, 2020 | | | 150,000 | | | | 168,000 | |
| Denbury Resources, Inc., 4.625%, 2023 | | | 35,000 | | | | 33,863 | |
| Energy XXI Gulf Coast, Inc., 9.25%, 2017 | | | 155,000 | | | | 172,050 | |
| EP Energy LLC, 9.375%, 2020 | | | 150,000 | | | | 170,063 | |
| EP Energy LLC, 7.75%, 2022 | | | 105,000 | | | | 117,075 | |
| EPL Oil & Gas, Inc., 8.25%, 2018 (n) | | | 75,000 | | | | 80,438 | |
| EQT Corp., 4.875%, 2021 | | | 198,000 | | | | 209,435 | |
| Halcon Resources Corp., 8.875%, 2021 | | | 75,000 | | | | 76,313 | |
| Harvest Operations Corp., 6.875%, 2017 | | | 155,000 | | | | 173,988 | |
| Hess Corp., 8.125%, 2019 | | | 120,000 | | | | 154,463 | |
| Hilcorp Energy I/Hilcorp Finance Co., 8%, 2020 (n) | | | 35,000 | | | | 38,675 | |
| Laredo Petroleum, Inc., 9.5%, 2019 | | | 65,000 | | | | 73,613 | |
| LINN Energy LLC, 6.5%, 2019 | | | 35,000 | | | | 35,613 | |
| LINN Energy LLC, 8.625%, 2020 | | | 75,000 | | | | 82,125 | |
| LINN Energy LLC, 7.75%, 2021 | | | 72,000 | | | | 76,320 | |
| MEG Energy Corp., 6.5%, 2021 (n) | | | 55,000 | | | | 56,925 | |
| Plains Exploration & Production Co., 6.125%, 2019 | | | 110,000 | | | | 120,725 | |
| Plains Exploration & Production Co., 8.625%, 2019 | | | 95,000 | | | | 107,113 | |
| Plains Exploration & Production Co., 6.5%, 2020 | | | 35,000 | | | | 38,763 | |
| QEP Resources, Inc., 6.875%, 2021 | | | 180,000 | | | | 201,600 | |
| Range Resources Corp., 8%, 2019 | | | 65,000 | | | | 70,850 | |
| Range Resources Corp., 5%, 2022 | | | 30,000 | | | | 30,450 | |
| Rosetta Resources, Inc., 5.625%, 2021 | | | 35,000 | | | | 35,088 | |
| Samson Investment Co., 9.75%, 2020 (n) | | | 110,000 | | | | 114,675 | |
| SandRidge Energy, Inc., 8.125%, 2022 | | | 100,000 | | | | 106,750 | |
| SM Energy Co., 6.5%, 2021 | | | 90,000 | | | | 98,325 | |
| Whiting Petroleum Corp., 6.5%, 2018 | | | 60,000 | | | | 64,200 | |
| | | | | | | | |
| | | | | | | $ | 3,502,396 | |
11
Portfolio of Investments (unaudited) – continued
| | | | | | | | |
| Issuer | | Shares/Par | | | Value ($) | |
| Bonds - continued | | | | | | | | |
| Energy - Integrated - 1.8% | | | | | | | | |
| BP Capital Markets PLC, 4.5%, 2020 | | $ | 106,000 | | | $ | 119,045 | |
| BP Capital Markets PLC, 4.742%, 2021 | | | 240,000 | | | | 270,358 | |
| Cenovus Energy, Inc., 4.5%, 2014 | | | 140,000 | | | | 146,405 | |
| Lukoil International Finance B.V., 3.416%, 2018 (n) | | | 214,000 | | | | 214,000 | |
| Lukoil International Finance B.V., 4.563%, 2023 (n) | | | 290,000 | | | | 280,575 | |
| Pacific Rubiales Energy Corp., 7.25%, 2021 (n) | | | 142,000 | | | | 159,040 | |
| Petro-Canada, 6.05%, 2018 | | | 500,000 | | | | 592,907 | |
| | | | | | | | |
| | | | | | | $ | 1,782,330 | |
| Engineering - Construction - 0.1% | | | | | | | | |
| BakerCorp International, Inc., 8.25%, 2019 | | $ | 85,000 | | | $ | 87,975 | |
| | |
| Entertainment - 0.5% | | | | | | | | |
| AMC Entertainment, Inc., 8.75%, 2019 | | $ | 155,000 | | | $ | 170,113 | |
| Cedar Fair LP, 9.125%, 2018 | | | 60,000 | | | | 66,600 | |
| Cedar Fair LP, 5.25%, 2021 (z) | | | 40,000 | | | | 40,000 | |
| Cinemark USA, Inc., 4.875%, 2023 (z) | | | 55,000 | | | | 54,794 | |
| Cinemark USA, Inc., 5.125%, 2022 | | | 20,000 | | | | 20,300 | |
| NAI Entertainment Holdings LLC, 8.25%, 2017 (n) | | | 35,000 | | | | 37,800 | |
| Six Flags Entertainment Corp., 5.25%, 2021 (n) | | | 95,000 | | | | 95,475 | |
| | | | | | | | |
| | | | | | | $ | 485,082 | |
| Financial Institutions - 3.9% | | | | | | | | |
| Aviation Capital Group, 4.625%, 2018 (n) | | $ | 60,000 | | | $ | 61,984 | |
| CIT Group, Inc., 5.25%, 2014 (n) | | | 50,000 | | | | 51,500 | |
| CIT Group, Inc., 5.25%, 2018 | | | 110,000 | | | | 118,250 | |
| CIT Group, Inc., 6.625%, 2018 (n) | | | 232,000 | | | | 261,000 | |
| CIT Group, Inc., 5.5%, 2019 (n) | | | 110,000 | | | | 119,075 | |
| CIT Group, Inc., 5%, 2022 | | | 65,000 | | | | 69,225 | |
| Credit Acceptance Corp., 9.125%, 2017 | | | 80,000 | | | | 86,400 | |
| General Electric Capital Corp., 6%, 2019 | | | 130,000 | | | | 155,985 | |
| General Electric Capital Corp., 5.5%, 2020 | | | 250,000 | | | | 292,003 | |
| General Electric Capital Corp., 3.1%, 2023 | | | 265,000 | | | | 257,262 | |
| General Electric Capital Corp., FRN, 1.13%, 2014 | | | 300,000 | | | | 301,525 | |
| Icahn Enterprises LP, 7.75%, 2016 | | | 20,000 | | | | 20,700 | |
| Icahn Enterprises LP, 8%, 2018 | | | 121,000 | | | | 128,260 | |
| International Lease Finance Corp., 4.875%, 2015 | | | 45,000 | | | | 46,913 | |
| International Lease Finance Corp., 8.625%, 2015 | | | 45,000 | | | | 50,681 | |
| International Lease Finance Corp., 7.125%, 2018 (n) | | | 152,000 | | | | 179,170 | |
| LeasePlan Corp. N.V., 3%, 2017 (n) | | | 280,000 | | | | 284,188 | |
| LeasePlan Corp. N.V., 2.5%, 2018 (z) | | | 200,000 | | | | 195,559 | |
| Nationstar Mortgage LLC/Capital Corp., 10.875%, 2015 | | | 135,000 | | | | 142,931 | |
| Nationstar Mortgage LLC/Capital Corp., 9.625%, 2019 (n) | | | 35,000 | | | | 40,075 | |
| Nationstar Mortgage LLC/Capital Corp., 7.875%, 2020 (n) | | | 50,000 | | | | 54,750 | |
12
Portfolio of Investments (unaudited) – continued
| | | | | | | | |
| Issuer | | Shares/Par | | | Value ($) | |
| Bonds - continued | | | | | | | | |
| Financial Institutions - continued | | | | | | | | |
| NYSE Euronext, 2%, 2017 | | $ | 224,000 | | | $ | 226,550 | |
| PHH Corp., 9.25%, 2016 | | | 55,000 | | | | 63,938 | |
| PHH Corp., 7.375%, 2019 | | | 65,000 | | | | 73,775 | |
| SLM Corp., 8.45%, 2018 | | | 170,000 | | | | 188,700 | |
| SLM Corp., 8%, 2020 | | | 195,000 | | | | 212,306 | |
| SLM Corp., 7.25%, 2022 | | | 60,000 | | | | 63,150 | |
| TMK Capital S.A., 6.75%, 2020 (n) | | | 256,000 | | | | 248,640 | |
| | | | | | | | |
| | | | | | | $ | 3,994,495 | |
| Food & Beverages - 2.4% | | | | | | | | |
| Anheuser-Busch InBev S.A., 7.75%, 2019 | | $ | 370,000 | | | $ | 479,505 | |
| ARAMARK Corp., 5.75%, 2020 (n) | | | 30,000 | | | | 31,050 | |
| B&G Foods, Inc., 7.625%, 2018 | | | 110,000 | | | | 118,388 | |
| B&G Foods, Inc., 4.625%, 2021 | | | 45,000 | | | | 44,888 | |
| Campbell Soup Co., 2.5%, 2022 | | | 168,000 | | | | 157,957 | |
| Conagra Foods, Inc., 3.2%, 2023 | | | 238,000 | | | | 234,495 | |
| Constellation Brands, Inc., 3.75%, 2021 | | | 10,000 | | | | 9,750 | |
| Constellation Brands, Inc., 4.25%, 2023 | | | 25,000 | | | | 24,563 | |
| Kraft Foods Group, Inc., 6.125%, 2018 | | | 130,000 | | | | 155,466 | |
| Mead Johnson Nutrition Co., “A”, 4.9%, 2019 | | | 85,000 | | | | 95,526 | |
| Mondelez International, Inc., 6.75%, 2014 | | | 150,000 | | �� | | 156,199 | |
| Pernod Ricard S.A., 5.75%, 2021 (n) | | | 156,000 | | | | 180,917 | |
| SABMiller Holdings, Inc., 3.75%, 2022 (n) | | | 414,000 | | | | 435,150 | |
| TreeHouse Foods, Inc., 7.75%, 2018 | | | 80,000 | | | | 86,200 | |
| Tyson Foods, Inc., 4.5%, 2022 | | | 202,000 | | | | 215,428 | |
| | | | | | | | |
| | | | | | | $ | 2,425,482 | |
| Food & Drug Stores - 0.6% | | | | | | | | |
| CVS Caremark Corp., 3.25%, 2015 | | $ | 180,000 | | | $ | 188,241 | |
| CVS Caremark Corp., 5.75%, 2041 | | | 350,000 | | | | 412,075 | |
| | | | | | | | |
| | | | | | | $ | 600,316 | |
| Forest & Paper Products - 0.3% | | | | | | | | |
| Boise, Inc., 8%, 2020 | | $ | 95,000 | | | $ | 105,450 | |
| Graphic Packaging Holding Co., 7.875%, 2018 | | | 60,000 | | | | 65,850 | |
| Smurfit Kappa Group PLC, 7.75%, 2019 (n) | | EUR | 100,000 | | | | 142,328 | |
| Tembec Industries, Inc., 11.25%, 2018 | | $ | 40,000 | | | | 44,000 | |
| | | | | | | | |
| | | | | | | $ | 357,628 | |
| Gaming & Lodging - 1.2% | | | | | | | | |
| Caesars Entertainment Operating Co., Inc., 8.5%, 2020 | | $ | 70,000 | | | $ | 66,675 | |
| Choice Hotels International, Inc., 5.75%, 2022 | | | 15,000 | | | | 16,650 | |
| CityCenter Holdings LLC, 10.75%, 2017 (p) | | | 35,000 | | | | 38,150 | |
| Fontainebleau Las Vegas Holdings LLC, 10.25%, 2015 (a)(d)(n) | | | 115,000 | | | | 72 | |
13
Portfolio of Investments (unaudited) – continued
| | | | | | | | |
| Issuer | | Shares/Par | | | Value ($) | |
| Bonds - continued | | | | | | | | |
| Gaming & Lodging - continued | | | | | | | | |
| GWR Operating Partnership LLP, 10.875%, 2017 | | $ | 50,000 | | | $ | 55,500 | |
| Host Hotels & Resorts, Inc., REIT, 5.25%, 2022 | | | 25,000 | | | | 27,409 | |
| Hyatt Hotels Corp., 3.375%, 2023 | | | 145,000 | | | | 140,445 | |
| Isle of Capri Casinos, Inc., 8.875%, 2020 | | | 85,000 | | | | 93,075 | |
| MGM Mirage, 6.625%, 2015 | | | 35,000 | | | | 37,975 | |
| MGM Resorts International, 11.375%, 2018 | | | 105,000 | | | | 135,975 | |
| MGM Resorts International, 6.625%, 2021 | | | 35,000 | | | | 37,931 | |
| NCL Corp., 5%, 2018 (n) | | | 30,000 | | | | 30,600 | |
| Penn National Gaming, Inc., 8.75%, 2019 | | | 145,000 | | | | 161,313 | |
| Pinnacle Entertainment, Inc., 8.75%, 2020 | | | 50,000 | | | | 54,563 | |
| Ryman Hospitality Properties, Inc., REIT, 5%, 2021 (z) | | | 40,000 | | | | 40,600 | |
| Seven Seas Cruises S. DE R.L., 9.125%, 2019 | | | 135,000 | | | | 147,488 | |
| Viking Cruises Ltd., 8.5%, 2022 (n) | | | 65,000 | | | | 73,125 | |
| Wynn Las Vegas LLC, 7.75%, 2020 | | | 90,000 | | | | 101,475 | |
| | | | | | | | |
| | | | | | | $ | 1,259,021 | |
| Industrial - 1.1% | | | | | | | | |
| Cornell University, 4.35%, 2014 | | $ | 240,000 | | | $ | 247,553 | |
| Dematic S.A., 7.75%, 2020 (z) | | | 65,000 | | | | 70,038 | |
| Johns Hopkins University, 5.25%, 2019 | | | 235,000 | | | | 278,227 | |
| Mueller Water Products, Inc., 8.75%, 2020 | | | 63,000 | | | | 71,190 | |
| Princeton University, 4.95%, 2019 | | | 310,000 | | | | 363,267 | |
| SPL Logistics Escrow LLC, 8.875%, 2020 (n) | | | 90,000 | | | | 94,275 | |
| | | | | | | | |
| | | | | | | $ | 1,124,550 | |
| Insurance - 2.0% | | | | | | | | |
| American International Group, Inc., 5.85%, 2018 | | $ | 200,000 | | | $ | 230,282 | |
| ING U.S., Inc., 2.9%, 2018 (n) | | | 164,000 | | | | 166,987 | |
| MetLife, Inc., 1.756%, 2017 | | | 82,000 | | | | 82,572 | |
| Metropolitan Life Global Funding I, 5.125%, 2014 (n) | | | 180,000 | | | | 188,236 | |
| Principal Financial Group, Inc., 8.875%, 2019 | | | 250,000 | | | | 333,504 | |
| Prudential Financial, Inc., 6.2%, 2015 | | | 450,000 | | | | 486,166 | |
| Unum Group, 7.125%, 2016 | | | 445,000 | | | | 516,210 | |
| | | | | | | | |
| | | | | | | $ | 2,003,957 | |
| Insurance - Property & Casualty - 2.9% | | | | | | | | |
| Aon Corp., 3.5%, 2015 | | $ | 350,000 | | | $ | 369,181 | |
| AXIS Capital Holdings Ltd., 5.75%, 2014 | | | 400,000 | | | | 426,777 | |
| CNA Financial Corp., 5.875%, 2020 | | | 390,000 | | | | 456,822 | |
| Liberty Mutual Group, Inc., 4.95%, 2022 (n) | | | 299,000 | | | | 325,706 | |
| Liberty Mutual Group, Inc., 10.75% to 2038, FRN to 2088 (n) | | | 150,000 | | | | 235,500 | |
| PartnerRe Ltd., 5.5%, 2020 | | | 257,000 | | | | 293,497 | |
| QBE Capital Funding III Ltd., FRN, 7.25%, 2041 (n) | | | 310,000 | | | | 334,025 | |
| ZFS Finance USA Trust V, 6.5% to 2017, FRN to 2067 (n) | | | 500,000 | | | | 545,000 | |
| | | | | | | | |
| | | | | | | $ | 2,986,508 | |
14
Portfolio of Investments (unaudited) – continued
| | | | | | | | |
| Issuer | | Shares/Par | | | Value ($) | |
| Bonds - continued | | | | | | | | |
| International Market Quasi-Sovereign - 2.2% | | | | | | | | |
| EDF Energies Nouvelles S.A., 6.5%, 2019 (n) | | $ | 450,000 | | | $ | 546,057 | |
| Eksportfinans A.S.A., 5.5%, 2016 | | | 295,000 | | | | 309,013 | |
| Eksportfinans A.S.A., 5.5%, 2017 | | | 80,000 | | | | 83,600 | |
| ING Bank N.V., 3.9%, 2014 (n) | | | 530,000 | | | | 544,318 | |
| Israel Electric Corp. Ltd., 6.7%, 2017 (n) | | | 236,000 | | | | 259,600 | |
| Vestjysk Bank A/S, FRN, 0.83%, 2013 (n) | | | 240,000 | | | | 240,057 | |
| Westpac Banking Corp., 3.45%, 2014 (n) | | | 220,000 | | | | 227,729 | |
| | | | | | | | |
| | | | | | | $ | 2,210,374 | |
| International Market Sovereign - 7.3% | | | | | | | | |
| Commonwealth of Australia, 5.75%, 2021 | | AUD | 95,000 | | | $ | 106,909 | |
| Federal Republic of Germany, 4.25%, 2018 | | EUR | 183,000 | | | | 282,285 | |
| Federal Republic of Germany, 6.25%, 2030 | | EUR | 154,000 | | | | 314,734 | |
| Government of Bermuda, 5.603%, 2020 (n) | | $ | 115,000 | | | | 130,813 | |
| Government of Canada, 4.5%, 2015 | | CAD | 171,000 | | | | 175,963 | |
| Government of Canada, 4.25%, 2018 | | CAD | 132,000 | | | | 143,767 | |
| Government of Canada, 5.75%, 2033 | | CAD | 31,000 | | | | 44,408 | |
| Government of Japan, 1.1%, 2020 | | JPY | 31,700,000 | | | | 325,847 | |
| Government of Japan, 2.1%, 2024 | | JPY | 15,050,000 | | | | 167,925 | |
| Government of Japan, 2.2%, 2027 | | JPY | 36,100,000 | | | | 404,296 | |
| Government of Japan, 2.4%, 2037 | | JPY | 37,300,000 | | | | 423,098 | |
| Government of Japan, 1.8%, 2043 | | JPY | 13,000,000 | | | | 130,561 | |
| Kingdom of Belgium, 5.5%, 2017 | | EUR | 236,000 | | | | 367,384 | |
| Kingdom of Denmark, 3%, 2021 | | DKK | 467,000 | | | | 93,095 | |
| Kingdom of Spain, 4.6%, 2019 | | EUR | 388,000 | | | | 531,063 | |
| Kingdom of Sweden, 5%, 2020 | | SEK | 315,000 | | | | 58,636 | |
| Kingdom of the Netherlands, 5.5%, 2028 | | EUR | 45,000 | | | | 82,292 | |
| Republic of Austria, 4.65%, 2018 | | EUR | 158,000 | | | | 241,750 | |
| Republic of Finland, 3.875%, 2017 | | EUR | 46,000 | | | | 68,036 | |
| Republic of France, 6%, 2025 | | EUR | 89,000 | | | | 160,761 | |
| Republic of France, 4.75%, 2035 | | EUR | 208,000 | | | | 347,458 | |
| Republic of Iceland, 4.875%, 2016 (n) | | $ | 166,000 | | | | 176,375 | |
| Republic of Ireland, 4.6%, 2016 | | EUR | 135,000 | | | | 190,837 | |
| Republic of Ireland, 4.5%, 2020 | | EUR | 68,000 | | | | 94,976 | |
| Republic of Italy, 4.25%, 2015 | | EUR | 181,000 | | | | 246,349 | |
| Republic of Italy, 5.25%, 2017 | | EUR | 539,000 | | | | 767,930 | |
| Republic of Italy, 3.75%, 2021 | | EUR | 310,000 | | | | 407,725 | |
| Republic of Portugal, 4.8%, 2020 | | EUR | 36,000 | | | | 45,696 | |
| State of Israel, 4%, 2022 | | $ | 254,000 | | | | 270,891 | |
| United Kingdom Treasury, 8%, 2021 | | GBP | 160,000 | | | | 358,632 | |
| United Kingdom Treasury, 4.25%, 2036 | | GBP | 148,000 | | | | 266,065 | |
| | | | | | | | |
| | | | | | | $ | 7,426,557 | |
| Internet - 0.2% | | | | | | | | |
| Baidu, Inc., 3.5%, 2022 | | $ | 200,000 | | | $ | 189,744 | |
15
Portfolio of Investments (unaudited) – continued
| | | | | | | | |
| Issuer | | Shares/Par | | | Value ($) | |
| Bonds - continued | | | | | | | | |
| Local Authorities - 0.7% | | | | | | | | |
| Louisiana Gas & Fuels Tax Rev. (Build America Bonds), FRN, 3%, 2043 | | $ | 310,000 | | | $ | 311,373 | |
| State of Illinois (Build America Bonds), 6.725%, 2035 | | | 345,000 | | | | 396,833 | |
| | | | | | | | |
| | | | | | | $ | 708,206 | |
| Machinery & Tools - 1.0% | | | | | | | | |
| Case New Holland, Inc., 7.875%, 2017 | | $ | 350,000 | | | $ | 411,250 | |
| CNH America LLC, 7.25%, 2016 | | | 50,000 | | | | 55,375 | |
| CNH Capital LLC, 3.875%, 2015 | | | 20,000 | | | | 20,450 | |
| CNH Capital LLC, 3.625%, 2018 (n) | | | 75,000 | | | | 75,563 | |
| H&E Equipment Services Co., 7%, 2022 | | | 90,000 | | | | 97,200 | |
| NESCO LLC/NESCO Holdings Corp., 11.75%, 2017 (n) | | | 115,000 | | | | 129,375 | |
| RSC Equipment Rental, Inc., 8.25%, 2021 | | | 115,000 | | | | 127,363 | |
| United Rentals North America, Inc., 5.75%, 2018 | | | 45,000 | | | | 48,038 | |
| United Rentals North America, Inc., 7.625%, 2022 | | | 45,000 | | | | 49,838 | |
| | | | | | | | |
| | | | | | | $ | 1,014,452 | |
| Major Banks - 9.5% | | | | | | | | |
| ABN AMRO Bank N.V., 3%, 2014 (n) | | $ | 400,000 | | | $ | 405,847 | |
| ABN AMRO Bank N.V., 4.25%, 2017 (n) | | | 400,000 | | | | 432,800 | |
| Bank of America Corp., 7.375%, 2014 | | | 280,000 | | | | 297,145 | |
| Bank of America Corp., 6.5%, 2016 | | | 430,000 | | | | 491,614 | |
| Bank of America Corp., 3.3%, 2023 | | | 501,000 | | | | 485,313 | |
| Bank of America Corp., FRN, 5.2%, 2049 | | | 75,000 | | | | 74,250 | |
| Barclays Bank PLC, 5.125%, 2020 | | | 340,000 | | | | 388,150 | |
| Barclays Bank PLC, FRN, 1.317%, 2014 | | | 190,000 | | | | 191,049 | |
| Commonwealth Bank of Australia, 5%, 2019 (n) | | | 320,000 | | | | 370,522 | |
| Credit Suisse New York, FRN, 1.237%, 2014 | | | 250,000 | | | | 251,261 | |
| DBS Bank Ltd., 2.35%, 2017 (n) | | | 400,000 | | | | 409,573 | |
| Goldman Sachs Group, Inc., 5.125%, 2015 | | | 200,000 | | | | 212,519 | |
| Goldman Sachs Group, Inc., 5.75%, 2022 | | | 409,000 | | | | 468,201 | |
| HSBC Holdings PLC, 4%, 2022 | | | 352,000 | | | | 373,200 | |
| HSBC USA, Inc., 4.875%, 2020 | | | 360,000 | | | | 400,542 | |
| ING Bank N.V., 3.75%, 2017 (n) | | | 407,000 | | | | 432,393 | |
| JPMorgan Chase & Co., 2%, 2017 | | | 150,000 | | | | 151,594 | |
| JPMorgan Chase & Co., 4.625%, 2021 | | | 360,000 | | | | 396,203 | |
| Macquarie Bank Ltd., 5%, 2017 (n) | | | 167,000 | | | | 183,357 | |
| Macquarie Group Ltd., 6%, 2020 (n) | | | 230,000 | | | | 251,172 | |
| Merrill Lynch & Co., Inc., 6.4%, 2017 | | | 40,000 | | | | 46,510 | |
| Morgan Stanley, 6%, 2014 | | | 160,000 | | | | 167,575 | |
| Morgan Stanley, 7.3%, 2019 | | | 110,000 | | | | 134,775 | |
| Morgan Stanley, 5.625%, 2019 | | | 180,000 | | | | 203,883 | |
| Morgan Stanley, FRN, 1.875%, 2014 | | | 260,000 | | | | 261,730 | |
16
Portfolio of Investments (unaudited) – continued
| | | | | | | | |
| Issuer | | Shares/Par | | | Value ($) | |
| Bonds - continued | | | | | | | | |
| Major Banks - continued | | | | | | | | |
| Morgan Stanley, FRN, 1.522%, 2016 | | $ | 270,000 | | | $ | 271,090 | |
| Royal Bank of Scotland Group PLC, 7.648% to 2031, FRN to 2049 | | | 210,000 | | | | 220,500 | |
| Royal Bank of Scotland PLC, 2.55%, 2015 | | | 94,000 | | | | 96,551 | |
| Santander International Debt S.A., 2.991%, 2013 (n) | | | 500,000 | �� | | | 502,468 | |
| Santander U.S. Debt S.A.U., 3.724%, 2015 (z) | | | 100,000 | | | | 101,620 | |
| Standard Chartered PLC, 3.85%, 2015 (n) | | | 290,000 | | | | 304,625 | |
| Wells Fargo & Co., 7.98% to 2018, FRN to 2049 | | | 141,000 | | | | 165,146 | |
| Westpac Banking Corp., 2%, 2017 | | | 450,000 | | | | 459,915 | |
| | | | | | | | |
| | | | | | | $ | 9,603,093 | |
| Medical & Health Technology & Services - 2.6% | | | | | | | | |
| AmSurg Corp., 5.625%, 2020 | | $ | 75,000 | | | $ | 78,000 | |
| Cardinal Health, Inc., 5.8%, 2016 | | | 279,000 | | | | 319,390 | |
| CDRT Holding Corp., 9.25%, 2017 (n)(p) | | | 20,000 | | | | 20,550 | |
| Davita, Inc., 6.375%, 2018 | | | 160,000 | | | | 170,000 | |
| Davita, Inc., 6.625%, 2020 | | | 140,000 | | | | 149,450 | |
| Fresenius Medical Care AG & Co. KGaA, 9%, 2015 (n) | | | 65,000 | | | | 74,750 | |
| Fresenius Medical Care Capital Trust III, 5.625%, 2019 (n) | | | 75,000 | | | | 82,313 | |
| Fresenius Medical Care Capital Trust III, 5.875%, 2022 (n) | | | 45,000 | | | | 50,400 | |
| HCA, Inc., 8.5%, 2019 | | | 270,000 | | | | 294,300 | |
| HCA, Inc., 7.5%, 2022 | | | 170,000 | | | | 198,050 | |
| HCA, Inc., 5.875%, 2022 | | | 90,000 | | | | 98,775 | |
| HealthSouth Corp., 8.125%, 2020 | | | 170,000 | | | | 188,275 | |
| IASIS Healthcare LLC/IASIS Capital Corp., 8.375%, 2019 | | | 80,000 | | | | 83,600 | |
| Kinetics Concepts, Inc., 12.5%, 2019 | | | 25,000 | | | | 25,750 | |
| McKesson Corp., 3.25%, 2016 | | | 340,000 | | | | 361,118 | |
| Tenet Healthcare Corp., 9.25%, 2015 | | | 65,000 | | | | 72,963 | |
| Tenet Healthcare Corp., 8%, 2020 | | | 65,000 | | | | 71,338 | |
| Tenet Healthcare Corp., 4.5%, 2021 (n) | | | 75,000 | | | | 73,688 | |
| Universal Health Services, Inc., 7%, 2018 | | | 70,000 | | | | 75,425 | |
| Universal Health Services, Inc., 7.625%, 2020 | | | 105,000 | | | | 113,138 | |
| | | | | | | | |
| | | | | | | $ | 2,601,273 | |
| Medical Equipment - 0.1% | | | | | | | | |
| Biomet, Inc., 6.5%, 2020 (n) | | $ | 70,000 | | | $ | 73,675 | |
| Physio-Control International, Inc., 9.875%, 2019 (n) | | | 55,000 | | | | 62,150 | |
| | | | | | | | |
| | | | | | | $ | 135,825 | |
| Metals & Mining - 1.9% | | | | | | | | |
| ArcelorMittal S.A., 7.25%, 2041 | | $ | 35,000 | | | $ | 34,125 | |
| Arch Coal, Inc., 7.25%, 2020 | | | 80,000 | | | | 71,600 | |
| Barrick Gold Corp., 4.1%, 2023 (n) | | | 416,000 | | | | 395,448 | |
| Century Aluminum Co., 7.5%, 2021 (z) | | | 55,000 | | | | 54,313 | |
| Cloud Peak Energy, Inc., 8.25%, 2017 | | | 175,000 | | | | 186,375 | |
17
Portfolio of Investments (unaudited) – continued
| | | | | | | | |
| Issuer | | Shares/Par | | | Value ($) | |
| Bonds - continued | | | | | | | | |
| Metals & Mining - continued | | | | | | | | |
| Cloud Peak Energy, Inc., 8.5%, 2019 | | $ | 15,000 | | | $ | 16,500 | |
| Commercial Metals Co., 4.875%, 2023 | | | 35,000 | | | | 33,338 | |
| Consol Energy, Inc., 8%, 2017 | | | 165,000 | | | | 176,550 | |
| Consol Energy, Inc., 8.25%, 2020 | | | 65,000 | | | | 71,825 | |
| Fortescue Metals Group Ltd., 8.25%, 2019 (n) | | | 70,000 | | | | 73,850 | |
| Freeport-McMoRan Copper & Gold, Inc., 2.375%, 2018 (n) | | | 150,000 | | | | 149,586 | |
| Freeport-McMoRan Copper & Gold, Inc., 3.1%, 2020 (n) | | | 250,000 | | | | 244,594 | |
| Glencore Funding LLC, FRN, 1.431%, 2016 (z) | | | 240,000 | | | | 239,998 | |
| Peabody Energy Corp., 6%, 2018 | | | 40,000 | | | | 42,800 | |
| Peabody Energy Corp., 6.25%, 2021 | | | 40,000 | | | | 41,800 | |
| Vale Overseas Ltd., 4.375%, 2022 | | | 141,000 | | | | 140,047 | |
| | | | | | | | |
| | | | | | | $ | 1,972,749 | |
| Miscellaneous Revenue - Other - 0.4% | | | | | | | | |
| Florida Hurricane Catastrophe Fund Finance Corp. Rev, “A”, 2.107%, 2018 | | $ | 390,000 | | | $ | 387,317 | |
| | |
| Mortgage-Backed - 1.1% | | | | | | | | |
| Fannie Mae, 6.5%, 2036 (f) | | $ | 240,227 | | | $ | 271,558 | |
| Fannie Mae, 6%, 2037 | | | 159,580 | | | | 173,885 | |
| Freddie Mac, 4.224%, 2020 | | | 275,759 | | | | 308,451 | |
| Ginnie Mae, 9%, 2016 | | | 18,881 | | | | 20,331 | |
| Ginnie Mae, 11%, 2019 | | | 181 | | | | 182 | |
| Ginnie Mae, 6.357%, 2058 | | | 296,007 | | | | 316,285 | |
| | | | | | | | |
| | | | | | | $ | 1,090,692 | |
| Municipals - 0.0% | | | | | | | | |
| New Jersey Tobacco Settlement Financing Corp., “1-A”, 4.5%, 2023 | | $ | 45,000 | | | $ | 44,714 | |
| | |
| Natural Gas - Distribution - 0.5% | | | | | | | | |
| AmeriGas Finance LLC, 6.75%, 2020 | | $ | 110,000 | | | $ | 119,900 | |
| Ferrellgas LP/Ferrellgas Finance Corp., 6.5%, 2021 | | | 55,000 | | | | 58,025 | |
| GDF Suez, 1.625%, 2017 (n) | | | 380,000 | | | | 380,353 | |
| | | | | | | | |
| | | | | | | $ | 558,278 | |
| Natural Gas - Pipeline - 3.0% | | | | | | | | |
| Access Midstream Partners Co., 4.875%, 2023 | | $ | 35,000 | | | $ | 34,563 | |
| Atlas Pipeline Partners LP, 4.75%, 2021 (z) | | | 25,000 | | | | 24,375 | |
| Colorado Interstate Gas Co., 6.8%, 2015 | | | 32,000 | | | | 36,429 | |
| Crosstex Energy, Inc., 8.875%, 2018 | | | 145,000 | | | | 155,875 | |
| DCP Midstream LLC, 3.875%, 2023 | | | 254,000 | | | | 249,221 | |
| El Paso Corp., 7%, 2017 | | | 145,000 | | | | 165,160 | |
| El Paso Corp., 7.75%, 2032 | | | 175,000 | | | | 196,488 | |
| Energy Transfer Equity LP, 7.5%, 2020 | | | 125,000 | | | | 143,438 | |
18
Portfolio of Investments (unaudited) – continued
| | | | | | | | |
| Issuer | | Shares/Par | | | Value ($) | |
| Bonds - continued | | | | | | | | |
| Natural Gas - Pipeline - continued | | | | | | | | |
| Energy Transfer Partners LP, 6.5%, 2042 | | $ | 348,000 | | | $ | 391,870 | |
| Enterprise Products Partners LP, 6.3%, 2017 | | | 400,000 | | | | 474,576 | |
| Enterprise Products Partners LP, 8.375% to 2016, FRN to 2066 | | | 59,000 | | | | 67,924 | |
| Enterprise Products Partners LP, 7.034% to 2018, FRN to 2068 | | | 38,000 | | | | 44,080 | |
| Inergy Midstream LP, 6%, 2020 (n) | | | 80,000 | | | | 83,600 | |
| Kinder Morgan Energy Partners LP, 6.375%, 2041 | | | 360,000 | | | | 423,863 | |
| MarkWest Energy Partners LP, 4.5%, 2023 | | | 66,000 | | | | 64,185 | |
| Sabine Pass Liquefaction, 5.625%, 2023 (z) | | | 100,000 | | | | 100,000 | |
| Sunoco Logistics Partner LP, 3.45%, 2023 | | | 246,000 | | | | 237,958 | |
| Williams Cos., Inc., 3.7%, 2023 | | | 116,000 | | | | 112,250 | |
| | | | | | | | |
| | | | | | | $ | 3,005,855 | |
| Network & Telecom - 1.7% | | | | | | | | |
| AT&T, Inc., 3.875%, 2021 | | $ | 480,000 | | | $ | 513,900 | |
| Centurylink, Inc., 7.65%, 2042 | | | 267,000 | | | | 265,665 | |
| Citizens Communications Co., 9%, 2031 | | | 60,000 | | | | 62,100 | |
| France Telecom, 4.375%, 2014 | | | 240,000 | | | | 248,771 | |
| Frontier Communications Corp., 8.125%, 2018 | | | 80,000 | | | | 91,900 | |
| Qwest Corp., 7.5%, 2014 | | | 1,000 | | | | 1,083 | |
| TW Telecom Holdings, Inc., 5.375%, 2022 | | | 35,000 | | | | 36,225 | |
| Verizon Communications, Inc., 8.75%, 2018 | | | 286,000 | | | | 381,213 | |
| Windstream Corp., 8.125%, 2018 | | | 15,000 | | | | 16,275 | |
| Windstream Corp., 7.75%, 2020 | | | 85,000 | | | | 90,738 | |
| Windstream Corp., 7.75%, 2021 | | | 25,000 | | | | 26,875 | |
| | | | | | | | |
| | | | | | | $ | 1,734,745 | |
| Oil Services - 1.1% | | | | | | | | |
| Bristow Group, Inc., 6.25%, 2022 | | $ | 75,000 | | | $ | 81,375 | |
| Chesapeake Energy Corp., 6.625%, 2019 (n) | | | 35,000 | | | | 36,750 | |
| Dresser-Rand Group, Inc., 6.5%, 2021 | | | 40,000 | | | | 43,300 | |
| Edgen Murray Corp., 8.75%, 2020 (n) | | | 110,000 | | | | 114,675 | |
| Shale-Inland Holdings LLC/Finance Co., 8.75%, 2019 (n) | | | 120,000 | | | | 126,300 | |
| Transocean, Inc., 2.5%, 2017 | | | 139,000 | | | | 140,284 | |
| Transocean, Inc., 6%, 2018 | | | 400,000 | | | | 458,662 | |
| Unit Corp., 6.625%, 2021 | | | 105,000 | | | | 110,250 | |
| | | | | | | | |
| | | | | | | $ | 1,111,596 | |
| Other Banks & Diversified Financials - 7.2% | | | | | | | | |
| Ally Financial, Inc., 5.5%, 2017 | | $ | 225,000 | | | $ | 240,750 | |
| Ally Financial, Inc., 6.25%, 2017 | | | 50,000 | | | | 55,027 | |
| Banco GNB Sudameris S.A., 3.875%, 2018 (n) | | | 28,000 | | | | 26,978 | |
| Bancolombia S.A., 5.95%, 2021 | | | 102,000 | | | | 111,690 | |
| Bancolombia S.A., 5.125%, 2022 | | | 10,000 | | | | 9,900 | |
| BB&T Corp., 2.05%, 2014 | | | 300,000 | | | | 304,348 | |
19
Portfolio of Investments (unaudited) – continued
| | | | | | | | |
| Issuer | | Shares/Par | | | Value ($) | |
| Bonds - continued | | | | | | | | |
| Other Banks & Diversified Financials - continued | | | | | | | | |
| BBVA Banco Continental S.A., 5%, 2022 (n) | | $ | 10,000 | | | $ | 10,210 | |
| BBVA Senior Finance S.A. Unipersonal, FRN, 2.399%, 2014 | | | 300,000 | | | | 302,285 | |
| Capital One Financial Corp., FRN, 1.427%, 2014 | | | 370,000 | | | | 373,552 | |
| Citigroup, Inc., 6.375%, 2014 | | | 230,000 | | | | 244,508 | |
| Citigroup, Inc., 6.01%, 2015 | | | 200,000 | | | | 215,306 | |
| Citigroup, Inc., 8.5%, 2019 | | | 373,000 | | | | 488,642 | |
| Danske Bank A/S, 3.75%, 2015 (n) | | | 510,000 | | | | 532,846 | |
| Deutsche Bank Capital Funding Trust, 5.33%, 2049 | | EUR | 250,000 | | | | 285,133 | |
| Groupe BPCE S.A., 12.5% to 2019, FRN to 2049 (n) | | $ | 243,000 | | | | 308,610 | |
| Intesa Sanpaolo S.p.A., 3.875%, 2018 | | | 248,000 | | | | 244,581 | |
| Intesa Sanpaolo S.p.A., FRN, 2.673%, 2014 (n) | | | 200,000 | | | | 201,014 | |
| LBG Capital No. 1 PLC, 7.875%, 2020 (n) | | | 100,000 | | | | 110,000 | |
| Lloyds TSB Bank PLC, 5.8%, 2020 (n) | | | 205,000 | | | | 239,023 | |
| PKO Finance AB, 4.63%, 2022 (n) | | | 13,000 | | | | 13,501 | |
| Rabobank Nederland N.V., 3.375%, 2017 | | | 242,000 | | | | 257,355 | |
| Rabobank Nederland N.V., 3.95%, 2022 | | | 384,000 | | | | 382,197 | |
| Santander Holdings USA, Inc., 4.625%, 2016 | | | 50,000 | | | | 53,490 | |
| Santander UK PLC, 8.963% to 2030, FRN to 2049 | | | 200,000 | | | | 244,600 | |
| SunTrust Banks, Inc., 3.5%, 2017 | | | 288,000 | | | | 306,606 | |
| Svenska Handelsbanken AB, 4.875%, 2014 (n) | | | 580,000 | | | | 604,859 | |
| Swedbank AB, 2.125%, 2017 (n) | | | 269,000 | | | | 272,446 | |
| U.S. Bancorp, 2.95%, 2022 | | | 192,000 | | | | 186,893 | |
| Union Bank, 3%, 2016 | | | 690,000 | | | | 727,214 | |
| | | | | | | | |
| | | | | | | $ | 7,353,564 | |
| Personal Computers & Peripherals - 0.4% | | | | | | | | |
| Equifax, Inc., 3.3%, 2022 | | $ | 208,000 | | | $ | 202,348 | |
| Motorola Solutions, Inc., 3.5%, 2023 | | | 161,000 | | | | 157,477 | |
| | | | | | | | |
| | | | | | | $ | 359,825 | |
| Pharmaceuticals - 1.4% | | | | | | | | |
| AbbVie, Inc., 2.9%, 2022 (n) | | $ | 330,000 | | | $ | 320,949 | |
| Celgene Corp., 2.45%, 2015 | | | 130,000 | | | | 134,294 | |
| Celgene Corp., 3.95%, 2020 | | | 300,000 | | | | 319,507 | |
| Hospira, Inc., 6.05%, 2017 | | | 130,000 | | | | 143,529 | |
| Pfizer, Inc., 6.2%, 2019 | | | 275,000 | | | | 339,136 | |
| Valeant Pharmaceuticals International, Inc., 7%, 2020 (n) | | | 95,000 | | | | 102,363 | |
| Valeant Pharmaceuticals International, Inc., 7.25%, 2022 (n) | | | 55,000 | | | | 59,675 | |
| | | | | | | | |
| | | | | | | $ | 1,419,453 | |
| Pollution Control - 0.5% | | | | | | | | |
| Heckmann Corp., 9.875%, 2018 | | $ | 70,000 | | | $ | 74,550 | |
| Heckmann Corp., 9.875%, 2018 (n) | | | 25,000 | | | | 26,438 | |
| Republic Services, Inc., 5.25%, 2021 | | | 320,000 | | | | 364,644 | |
| | | | | | | | |
| | | | | | | $ | 465,632 | |
20
Portfolio of Investments (unaudited) – continued
| | | | | | | | |
| Issuer | | Shares/Par | | | Value ($) | |
| Bonds - continued | | | | | | | | |
| Precious Metals & Minerals - 0.2% | | | | | | | | |
| Eldorado Gold Corp., 6.125%, 2020 (n) | | $ | 60,000 | | | $ | 60,900 | |
| IAMGOLD Corp., 6.75%, 2020 (n) | | | 118,000 | | | | 107,970 | |
| | | | | | | | |
| | | | | | | $ | 168,870 | |
| Printing & Publishing - 0.6% | | | | | | | | |
| American Media, Inc., 13.5%, 2018 (z) | | $ | 9,917 | | | $ | 9,520 | |
| Lamar Media Corp., 5%, 2023 | | | 35,000 | | | | 35,438 | |
| Nielsen Finance LLC, 7.75%, 2018 | | | 85,000 | | | | 93,500 | |
| Nielsen Finance LLC, 4.5%, 2020 (n) | | | 80,000 | | | | 80,200 | |
| Pearson Funding Five PLC, 3.25%, 2023 (z) | | | 200,000 | | | | 191,772 | |
| Pearson Funding Four PLC, 3.75%, 2022 (n) | | | 201,000 | | | | 204,823 | |
| | | | | | | | |
| | | | | | | $ | 615,253 | |
| Railroad & Shipping - 0.9% | | | | | | | | |
| Canadian Pacific Railway Co., 7.25%, 2019 | | $ | 250,000 | | | $ | 314,332 | |
| CSX Corp., 4.1%, 2044 | | | 605,000 | | | | 558,795 | |
| Kansas City Southern de Mexico S.A. de C.V., 6.125%, 2021 | | | 8,000 | | | | 9,020 | |
| Ultrapetrol (Bahamas) Ltd., 8.875%, 2021 (z) | | | 43,000 | | | | 43,753 | |
| Watco Cos. LLC, 6.375%, 2023 (n) | | | 15,000 | | | | 15,788 | |
| | | | | | | | |
| | | | | | | $ | 941,688 | |
| Real Estate - 3.4% | | | | | | | | |
| Boston Properties LP, REIT, 3.7%, 2018 | | $ | 193,000 | | | $ | 209,750 | |
| CNL Lifestyle Properties, Inc., REIT, 7.25%, 2019 | | | 50,000 | | | | 51,125 | |
| DDR Corp., 3.375%, 2023 | | | 416,000 | | | | 401,136 | |
| DDR Corp., REIT, 4.625%, 2022 | | | 364,000 | | | | 388,958 | |
| DuPont Fabros Technology, Inc., REIT, 8.5%, 2017 | | | 195,000 | | | | 208,650 | |
| ERP Operating, REIT, 5.125%, 2016 | | | 450,000 | | | | 498,665 | |
| ERP Properties, REIT, 7.75%, 2020 | | | 85,000 | | | | 100,737 | |
| Felcor Lodging LP, REIT, 5.625%, 2023 | | | 15,000 | | | | 15,263 | |
| HCP, Inc., REIT, 5.375%, 2021 | | | 283,000 | | | | 325,108 | |
| Health Care, Inc., REIT, 2.25%, 2018 | | | 119,000 | | | | 119,877 | |
| Kennedy Wilson, Inc., 8.75%, 2019 | | | 40,000 | | | | 43,900 | |
| Kimco Realty Corp., REIT, 6.875%, 2019 | | | 82,000 | | | | 102,225 | |
| MPT Operating Partnership LP, REIT, 6.875%, 2021 | | | 80,000 | | | | 88,400 | |
| MPT Operating Partnership LP, REIT, 6.375%, 2022 | | | 45,000 | | | | 49,275 | |
| Simon Property Group, Inc., REIT, 6.1%, 2016 | | | 500,000 | | | | 566,143 | |
| WEA Finance LLC, 6.75%, 2019 (n) | | | 250,000 | | | | 306,724 | |
| | | | | | | | |
| | | | | | | $ | 3,475,936 | |
| Retailers - 2.7% | | | | | | | | |
| Academy Ltd., 9.25%, 2019 (n) | | $ | 50,000 | | | $ | 56,000 | |
| AutoZone, Inc., 6.5%, 2014 | | | 420,000 | | | | 434,693 | |
| Burlington Coat Factory Warehouse Corp., 10%, 2019 | | | 95,000 | | | | 106,044 | |
21
Portfolio of Investments (unaudited) – continued
| | | | | | | | |
| Issuer | | Shares/Par | | | Value ($) | |
| Bonds - continued | | | | | | | | |
| Retailers - continued | | | | | | | | |
| CST Brands, Inc., 5%, 2023 (z) | | $ | 5,000 | | | $ | 5,050 | |
| Dollar General Corp., 4.125%, 2017 | | | 247,000 | | | | 268,060 | |
| Gap, Inc., 5.95%, 2021 | | | 379,000 | | | | 439,996 | |
| J. Crew Group, Inc., 8.125%, 2019 | | | 80,000 | | | | 85,200 | |
| Jo-Ann Stores Holdings, Inc., 9.75%, 2019 (p)(z) | | | 45,000 | | | | 47,869 | |
| Kohl’s Corp., 3.25%, 2023 | | | 319,000 | | | | 307,675 | |
| Limited Brands, Inc., 6.9%, 2017 | | | 70,000 | | | | 80,325 | |
| Limited Brands, Inc., 7%, 2020 | | | 35,000 | | | | 40,819 | |
| Limited Brands, Inc., 6.95%, 2033 | | | 40,000 | | | | 41,450 | |
| Macy’s, Inc., 7.875%, 2015 | | | 330,000 | | | | 376,224 | |
| Rite Aid Corp., 9.5%, 2017 | | | 35,000 | | | | 36,225 | |
| Rite Aid Corp., 9.25%, 2020 | | | 100,000 | | | | 112,875 | |
| Sally Beauty Holdings, Inc., 6.875%, 2019 | | | 40,000 | | | | 44,350 | |
| The Pantry, Inc., 8.375%, 2020 | | | 40,000 | | | | 43,750 | |
| Toys “R” Us Property Co. II LLC, 8.5%, 2017 | | | 55,000 | | | | 58,231 | |
| Toys “R” Us, Inc., 10.75%, 2017 | | | 145,000 | | | | 153,700 | |
| YCC Holdings LLC/Yankee Finance, Inc., 10.25%, 2016 (p) | | | 45,000 | | | | 46,294 | |
| | | | | | | | |
| | | | | | | $ | 2,784,830 | |
| Specialty Chemicals - 0.1% | | | | | | | | |
| Eagle Spinco, Inc., 4.625%, 2021 (n) | | $ | 15,000 | | | $ | 15,113 | |
| Koppers, Inc., 7.875%, 2019 | | | 55,000 | | | | 60,363 | |
| | | | | | | | |
| | | | | | | $ | 75,476 | |
| Specialty Stores - 0.2% | | | | | | | | |
| Michaels Stores, Inc., 11.375%, 2016 | | $ | 46,000 | | | $ | 48,128 | |
| Michaels Stores, Inc., 7.75%, 2018 | | | 115,000 | | | | 124,775 | |
| | | | | | | | |
| | | | | | | $ | 172,903 | |
| Supermarkets - 0.4% | | | | | | | | |
| Safeway, Inc., 6.25%, 2014 | | $ | 400,000 | | | $ | 415,806 | |
| | |
| Supranational - 0.4% | | | | | | | | |
| Corporacion Andina de Fomento, 4.375%, 2022 | | $ | 420,000 | | | $ | 447,563 | |
| | |
| Telecommunications - Wireless - 2.5% | | | | | | | | |
| American Tower Corp., REIT, 4.625%, 2015 | | $ | 180,000 | | | $ | 191,110 | |
| American Tower Corp., REIT, 4.7%, 2022 | | | 328,000 | | | | 348,331 | |
| Clearwire Corp., 12%, 2015 (n) | | | 95,000 | | | | 101,536 | |
| Cricket Communications, Inc., 7.75%, 2020 | | | 85,000 | | | | 84,788 | |
| Crown Castle International Corp., 7.125%, 2019 | | | 250,000 | | | | 271,250 | |
| Crown Castle International Corp., 5.25%, 2023 | | | 50,000 | | | | 50,625 | |
| Crown Castle Towers LLC, 6.113%, 2020 (n) | | | 363,000 | | | | 429,255 | |
| MetroPCS Wireless, Inc., 7.875%, 2018 | | | 75,000 | | | | 81,750 | |
22
Portfolio of Investments (unaudited) – continued
| | | | | | | | |
| Issuer | | Shares/Par | | | Value ($) | |
| Bonds - continued | | | | | | | | |
| Telecommunications - Wireless - continued | | | | | | | | |
| MetroPCS Wireless, Inc., 6.25%, 2021 (z) | | $ | 50,000 | | | $ | 52,375 | |
| Rogers Communications, Inc., 6.8%, 2018 | | | 200,000 | | | | 246,510 | |
| Sprint Capital Corp., 6.875%, 2028 | | | 100,000 | | | | 100,000 | |
| Sprint Nextel Corp., 6%, 2016 | | | 140,000 | | | | 151,200 | |
| Sprint Nextel Corp., 8.375%, 2017 | | | 95,000 | | | | 109,488 | |
| Sprint Nextel Corp., 9%, 2018 (n) | | | 25,000 | | | | 30,313 | |
| Sprint Nextel Corp., 6%, 2022 | | | 110,000 | | | | 113,300 | |
| Wind Acquisition Finance S.A., 11.75%, 2017 (n) | | | 130,000 | | | | 136,825 | |
| | | | | | | | |
| | | | | | | $ | 2,498,656 | |
| Telephone Services - 0.2% | | | | | | | | |
| Cogent Communications Group, Inc., 8.375%, 2018 (n) | | $ | 40,000 | | | $ | 44,600 | |
| Level 3 Financing, Inc., 9.375%, 2019 | | | 65,000 | | | | 71,663 | |
| Level 3 Financing, Inc., 8.625%, 2020 | | | 40,000 | | | | 44,000 | |
| | | | | | | | |
| | | | | | | $ | 160,263 | |
| Tobacco - 1.3% | | | | | | | | |
| Altria Group, Inc., 9.25%, 2019 | | $ | 138,000 | | | $ | 188,892 | |
| Lorillard Tobacco Co., 8.125%, 2019 | | | 194,000 | | | | 245,365 | |
| Lorillard Tobacco Co., 6.875%, 2020 | | | 170,000 | | | | 203,536 | |
| Reynolds American, Inc., 6.75%, 2017 | | | 300,000 | | | | 355,058 | |
| Reynolds American, Inc., 4.75%, 2042 | | | 403,000 | | | | 377,887 | |
| | | | | | | | |
| | | | | | | $ | 1,370,738 | |
| Transportation - Services - 1.2% | | | | | | | | |
| Avis Budget Car Rental LLC, 8.25%, 2019 | | $ | 65,000 | | | $ | 70,769 | |
| Avis Budget Car Rental LLC, 9.75%, 2020 | | | 35,000 | | | | 40,863 | |
| CEVA Group PLC, 8.375%, 2017 (n) | | | 230,000 | | | | 238,050 | |
| ERAC USA Finance Co., 6.375%, 2017 (n) | | | 340,000 | | | | 403,287 | |
| Navios Maritime Acquisition Corp., 8.625%, 2017 | | | 125,000 | | | | 129,375 | |
| Navios Maritime Holdings, Inc., 8.875%, 2017 | | | 40,000 | | | | 42,100 | |
| Navios South American Logistics, Inc., 9.25%, 2019 (n) | | | 9,000 | | | | 9,788 | |
| Navios South American Logistics, Inc., 9.25%, 2019 | | | 79,000 | | | | 85,913 | |
| Swift Services Holdings, Inc., 10%, 2018 | | | 180,000 | | | | 205,650 | |
| | | | | | | | |
| | | | | | | $ | 1,225,795 | |
| U.S. Government Agencies and Equivalents - 0.0% | | | | | | | | |
| National Credit Union Administration Guaranteed Note, 2.9%, 2020 | | $ | 20,000 | | | $ | 21,074 | |
| | |
| Utilities - Electric Power - 4.6% | | | | | | | | |
| AES Corp., 8%, 2017 | | $ | 20,000 | | | $ | 23,450 | |
| AES Corp., 7.375%, 2021 | | | 60,000 | | | | 70,200 | |
| AES Corp., 4.875%, 2023 | | | 5,000 | | | | 4,913 | |
| Calpine Corp., 7.875%, 2020 (n) | | | 203,000 | | | | 223,300 | |
23
Portfolio of Investments (unaudited) – continued
| | | | | | | | |
| Issuer | | Shares/Par | | | Value ($) | |
| Bonds - continued | | | | | | | | |
| Utilities - Electric Power - continued | | | | | | | | |
| CMS Energy Corp., 4.25%, 2015 | | $ | 250,000 | | | $ | 267,387 | |
| CMS Energy Corp., 5.05%, 2022 | | | 196,000 | | | | 221,308 | |
| Covanta Holding Corp., 7.25%, 2020 | | | 70,000 | | | | 76,476 | |
| Covanta Holding Corp., 6.375%, 2022 | | | 25,000 | | | | 26,968 | |
| Duke Energy Corp., 3.35%, 2015 | | | 380,000 | | | | 397,209 | |
| Enel Finance International S.A., 6.25%, 2017 (n) | | | 260,000 | | | | 293,093 | |
| Energy Future Holdings Corp., 10%, 2020 | | | 398,000 | | | | 453,223 | |
| Energy Future Holdings Corp., 10%, 2020 (n) | | | 85,000 | | | | 96,369 | |
| Energy Future Holdings Corp., 11.75%, 2022 (n) | | | 80,000 | | | | 91,100 | |
| Exelon Generation Co. LLC, 5.2%, 2019 | | | 150,000 | | | | 168,539 | |
| Exelon Generation Co. LLC, 4.25%, 2022 | | | 96,000 | | | | 99,423 | |
| Georgia Power Co., 6%, 2013 | | | 150,000 | | | | 153,272 | |
| Iberdrola Finance Ireland Ltd., 3.8%, 2014 (n) | | | 440,000 | | | | 453,649 | |
| NRG Energy, Inc., 8.25%, 2020 | | | 235,000 | | | | 263,494 | |
| Oncor Electric Delivery Co., 4.1%, 2022 | | | 302,000 | | | | 325,288 | |
| PPL WEM Holdings PLC, 3.9%, 2016 (n) | | | 430,000 | | | | 455,358 | |
| Progress Energy, Inc., 3.15%, 2022 | | | 452,000 | | | | 450,951 | |
| Texas Competitive Electric Holdings Co. LLC, 11.5%, 2020 (n) | | | 45,000 | | | | 35,325 | |
| | | | | | | | |
| | | | | | | $ | 4,650,295 | |
| Total Bonds (Identified Cost, $105,044,310) | | | | | | $ | 110,835,460 | |
| | |
| Floating Rate Loans (g)(r) - 0.7% | | | | | | | | |
| Aerospace - 0.1% | | | | | | | | |
| TransDigm, Inc., Term Loan C, 3.75%, 2020 | | $ | 51,196 | | | $ | 51,657 | |
| | |
| Building - 0.0% | | | | | | | | |
| ABC Supply Co., Inc., Term Loan, 3.5%, 2020 | | $ | 19,063 | | | $ | 19,131 | |
| | |
| Conglomerates - 0.1% | | | | | | | | |
| Silver II U.S. Holdings LLC, Term Loan, 4%, 2019 | | $ | 51,077 | | | $ | 51,062 | |
| | |
| Consumer Services - 0.0% | | | | | | | | |
| Realogy Corp., Term Loan, 4.5%, 2020 | | $ | 33,465 | | | $ | 33,766 | |
| | |
| Energy - Independent - 0.0% | | | | | | | | |
| MEG Energy Corp., Term Loan, 3.75%, 2020 | | $ | 49,451 | | | $ | 49,821 | |
| | |
| Entertainment - 0.0% | | | | | | | | |
| Cedar Fair LP, Term Loan B, 3.25%, 2020 | | $ | 43,439 | | | $ | 43,846 | |
| | |
| Financial Institutions - 0.0% | | | | | | | | |
| Springleaf Financial Funding Co., Term Loan, 5.5%, 2017 | | $ | 23,759 | | | $ | 23,811 | |
24
Portfolio of Investments (unaudited) – continued
| | | | | | | | |
| Issuer | | Shares/Par | | | Value ($) | |
| Floating Rate Loans (g)(r) - continued | | | | | | | | |
| Food & Beverages - 0.1% | | | | | | | | |
| Aramark Corp., Term Loan D, 4%, 2019 | | $ | 51,386 | | | $ | 51,925 | |
| H.J. Heinz Co., Term Loan B2, 2020 (o) | | | 28,809 | | | | 29,085 | |
| | | | | | | | |
| | | | | | | $ | 81,010 | |
| Machinery & Tools - 0.1% | | | | | | | | |
| Gardner Denver, Inc., Term Loan, 2014 (o) | | $ | 95,000 | | | $ | 95,000 | |
| | |
| Transportation - Services - 0.2% | | | | | | | | |
| Commercial Barge Line Co., Term Loan, 7.5%, 2019 | | $ | 162,540 | | | $ | 160,508 | |
| | |
| Utilities - Electric Power - 0.1% | | | | | | | | |
| Calpine Construction Finance Co. LP, Term Loan, 2020 (o) | | $ | 104,824 | | | $ | 104,116 | |
| Total Floating Rate Loans (Identified Cost, $712,072) | | | | | | $ | 713,728 | |
| | |
| Preferred Stocks - 0.1% | | | | | | | | |
| Other Banks & Diversified Financials - 0.1% | | | | | | | | |
| Ally Financial, Inc., 7% (z) | | | 50 | | | $ | 49,019 | |
| GMAC Capital Trust I, 8.125% | | | 3,075 | | | | 81,857 | |
| Total Preferred Stocks (Identified Cost, $125,004) | | | | | | $ | 130,876 | |
| | |
| Convertible Bonds - 0.1% | | | | | | | | |
| Network & Telecom - 0.1% | | | | | | | | |
Nortel Networks Corp., 2.125%, 2014 (a)(d)
(Identified Cost, $93,781) | | $ | 95,000 | | | $ | 92,031 | |
| | |
| Convertible Preferred Stocks - 0.1% | | | | | | | | |
| Automotive - 0.1% | | | | | | | | |
| General Motors Co., 4.75% (Identified Cost, $60,500) | | | 1,210 | | | $ | 59,060 | |
| | | | | | | | | | | | | | | | |
| | | | |
| | | Strike Price | | | First Exercise | | | | | | | |
| Warrants - 0.1% | | | | | | | | | | | | | | | | |
| Broadcasting - 0.1% | | | | | | | | | | | | | | | | |
New Young Broadcasting Holding Co., Inc. (1 share for 1 warrant) (a)
(Identified Cost, $23,144) | | $ | 0.01 | | | | 7/14/10 | | | | 12 | | | $ | 46,200 | |
| | |
| Common Stocks - 0.0% | | | | | | | | | |
| Automotive - 0.0% | | | | | | | | | |
| Accuride Corp. (a) | | | | 2,303 | | | $ | 11,791 | |
| | |
| Broadcasting - 0.0% | | | | | | | | | |
| New Young Broadcasting Holding Co., Inc. (a) | | | | 3 | | | $ | 11,550 | |
25
Portfolio of Investments (unaudited) – continued
| | | | | | | | |
| Issuer | | Shares/Par | | | Value ($) | |
| Common Stocks - continued | | | | | | | | |
| Printing & Publishing - 0.0% | | | | | | | | |
| American Media Operations, Inc. (a) | | | 2,541 | | | $ | 13,340 | |
| Total Common Stocks (Identified Cost, $67,744) | | | | | | $ | 36,681 | |
| | |
| Mutual Funds - 3.7% | | | | | | | | |
MFS Institutional Money Market Portfolio, 0.12%,
at Cost and Net Asset Value (v) | | | 3,703,717 | | | $ | 3,703,717 | |
| Total Investments (Identified Cost, $109,830,272) | | | | | | $ | 115,617,753 | |
| | |
| Other Assets, Less Liabilities - (14.0)% | | | | | | | (14,157,225 | ) |
| Net Assets - 100.0% | | | | | | $ | 101,460,528 | |
| (a) | Non-income producing security. |
| (d) | In default. Interest and/or scheduled principal payment(s) have been missed. |
| (f) | All or a portion of the security has been segregated as collateral for open futures contracts. |
| (g) | The rate shown represents a weighted average coupon rate on settled positions at period end, unless otherwise indicated. |
| (n) | Securities exempt from registration under Rule 144A of the Securities Act of 1933. These securities may be sold in the ordinary course of business in transactions exempt from registration, normally to qualified institutional buyers. At period end, the aggregate value of these securities was $31,373,280, representing 30.9% of net assets. |
| (o) | All or a portion of this position has not settled. Upon settlement date, interest rates for unsettled amounts will be determined. The rate shown, if any, represents the weighted average coupon rate for settled amounts. |
| (p) | Payment-in-kind security. |
| (r) | Remaining maturities of floating rate loans may be less than stated maturities shown as a result of contractual or optional prepayments by the borrower. Such prepayments cannot be predicted with certainty. These loans may be subject to restrictions on resale. Floating rate loans generally have rates of interest which are determined periodically by reference to a base lending rate plus a premium. |
| (v) | Underlying affiliated fund that is available only to investment companies managed by MFS. The rate quoted for the MFS Institutional Money Market Portfolio is the annualized seven-day yield of the fund at period end. |
| (z) | Restricted securities are not registered under the Securities Act of 1933 and are subject to legal restrictions on resale. These securities generally may be resold in transactions exempt from registration or to the public if the securities are subsequently registered. Disposal of these securities may involve time-consuming negotiations and prompt sale at an acceptable price may be difficult. The fund holds the following restricted securities: |
| | | | | | | | | | |
| Restricted Securities | | Acquisition Date | | Cost | | | Value | |
| ABC Supply Co., Inc., 5.625%, 2021 | | 4/04/13-4/18/13 | | | $20,124 | | | | $20,250 | |
| Ally Financial, Inc., 7% (Preferred Stock) | | 4/13/11-4/14/11 | | | 46,875 | | | | 49,019 | |
| American Media, Inc., 13.5%, 2018 | | 12/22/10 | | | 10,040 | | | | 9,520 | |
| Anthracite Ltd., “A”, CDO, FRN, 0.556%, 2019 | | 1/28/10 | | | 65,809 | | | | 82,236 | |
| Atlas Pipeline Partners LP, 4.75%, 2021 | | 5/07/13 | | | 25,000 | | | | 24,375 | |
26
Portfolio of Investments (unaudited) – continued
| | | | | | | | | | |
| Restricted Securities - continued | | Acquisition
Date | | Cost | | | Value | |
| CST Brands, Inc., 5%, 2023 | | 4/25/13 | | | $5,000 | | | | $5,050 | |
| Cedar Fair LP, 5.25%, 2021 | | 2/28/13-3/01/13 | | | 39,951 | | | | 40,000 | |
| Century Aluminum Co., 7.5%, 2021 | | 5/23/13 | | | 54,193 | | | | 54,313 | |
| Cinemark USA, Inc., 4.875%, 2023 | | 5/21/13 | | | 55,000 | | | | 54,794 | |
| Continental Resources, Inc., 4.5%, 2023 | | 4/02/13 | | | 21,000 | | | | 21,210 | |
| Crest Ltd., “A1” CDO, FRN, 0.763%, 2018 | | 1/21/10 | | | 27,494 | | | | 33,015 | |
| Dematic S.A., 7.75%, 2020 | | 12/13/12 | | | 65,000 | | | | 70,038 | |
| General Motors Financial Co., Inc., 4.25%, 2023 | | 5/07/13 | | | 35,000 | | | | 34,125 | |
| Glencore Funding LLC, FRN, 1.431%, 2016 | | 5/22/13 | | | 240,000 | | | | 239,998 | |
| Intelsat Jackson Holdings S.A., 6.625%, 2022 | | 5/21/13 | | | 90,314 | | | | 88,506 | |
| Intelsat S.A., 8.125%, 2023 | | 3/20/13 | | | 55,000 | | | | 58,850 | |
| Jo-Ann Stores Holdings, Inc., 9.75%, 2019 | | 3/27/13-5/28/13 | | | 47,937 | | | | 47,869 | |
| LBI Media, Inc., 13.5% to 2015, 11.5% to , 2020 | | 12/26/12-5/15/13 | | | 19,746 | | | | 15,727 | |
| LKQ Corp., 4.75%, 2023 | | 5/02/13 | | | 10,000 | | | | 9,975 | |
| LeasePlan Corp. N.V., 2.5%, 2018 | | 5/07/13 | | | 199,076 | | | | 195,559 | |
| Local TV Finance LLC, 9.25%, 2015 | | 5/02/07-2/06/13 | | | 92,340 | | | | 91,767 | |
| MetroPCS Wireless, Inc., 6.25%, 2021 | | 3/08/13 | | | 50,000 | | | | 52,375 | |
| Pearson Funding Five PLC, 3.25%, 2023 | | 5/01/13 | | | 199,747 | | | | 191,772 | |
| Ryman Hospitality Properties, Inc., REIT, 5%, 2021 | | 3/27/13-3/28/13 | | | 40,172 | | | | 40,600 | |
| SIRIUS XM Radio, Inc., 4.25%, 2020 | | 5/02/13 | | | 20,000 | | | | 19,600 | |
| Sabine Pass Liquefaction, 5.625%, 2023 | | 5/21/13 | | | 102,496 | | | | 100,000 | |
| Santander U.S. Debt S.A.U., 3.724%, 2015 | | 3/26/13 | | | 101,309 | | | | 101,620 | |
| Ultrapetrol (Bahamas) Ltd., 8.875%, 2021 | | 5/30/13 | | | 43,000 | | | | 43,753 | |
| Total Restricted Securities | | | | | | | | | $1,795,916 | |
| % of Net assets | | | | | | | | | 1.8% | |
The following abbreviations are used in this report and are defined:
| CDO | | Collateralized Debt Obligation |
| CLO | | Collateralized Loan Obligation |
| FRN | | Floating Rate Note. Interest rate resets periodically and may not be the rate reported at period end. |
| PLC | | Public Limited Company |
| REIT | | Real Estate Investment Trust |
Abbreviations indicate amounts shown in currencies other than the U.S. dollar. All amounts are stated in U.S. dollars unless otherwise indicated. A list of abbreviations is shown below:
27
Portfolio of Investments (unaudited) – continued
Derivative Contracts at 5/31/13
Forward Foreign Currency Exchange Contracts at 5/31/13
| | | | | | | | | | | | | | | | | | | | | | | | |
| Type | | Currency | | Counter-
party | | Contracts to
Deliver/
Receive | | | Settlement Date Range | | | In Exchange For | | | Contracts at Value | | | Net Unrealized Appreciation
(Depreciation) | |
| Asset Derivatives | | | | | | | | | | | | | |
| SELL | | AUD | | Goldman Sachs International | | | 21,459 | | | | 7/16/13 | | | | $21,883 | | | | $20,475 | | | | $1,408 | |
| SELL | | AUD | | Westpac Banking Corp. | | | 87,690 | | | | 7/16/13 | | | | 91,234 | | | | 83,672 | | | | 7,562 | |
| SELL | | CAD | | Goldman Sachs International | | | 48,928 | | | | 7/16/13 | | | | 48,490 | | | | 47,145 | | | | 1,345 | |
| SELL | | CAD | | Merrill Lynch International Bank | | | 331,015 | | | | 7/16/13 | | | | 324,822 | | | | 318,959 | | | | 5,863 | |
| SELL | | DKK | | Deutsche Bank AG | | | 518,529 | | | | 7/16/13 | | | | 90,916 | | | | 90,441 | | | | 475 | |
| SELL | | EUR | | Citibank N.A. | | | 331,801 | | | | 7/16/13 | | | | 434,376 | | | | 431,357 | | | | 3,019 | |
| SELL | | EUR | | Deutsche Bank AG | | | 473,198 | | | | 7/16/13 | | | | 618,955 | | | | 615,180 | | | | 3,775 | |
| SELL | | EUR | | Goldman Sachs International | | | 38,070 | | | | 7/16/13 | | | | 49,842 | | | | 49,493 | | | | 349 | |
| SELL | | EUR | | JPMorgan Chase Bank N.A. | | | 380,241 | | | | 7/16/13 | | | | 497,044 | | | | 494,332 | | | | 2,712 | |
| SELL | | GBP | | Credit Suisse Group | | | 356,523 | | | | 7/16/13 | | | | 546,332 | | | | 541,547 | | | | 4,785 | |
| SELL | | GBP | | Deutsche Bank AG | | | 356,523 | | | | 7/16/13 | | | | 546,346 | | | | 541,547 | | | | 4,799 | |
| SELL | | SEK | | Deutsche Bank AG | | | 383,803 | | | | 7/16/13 | | | | 59,863 | | | | 57,891 | | | | 1,972 | |
| | | | | | | | | | | | | | | | | | | | | | | | |
| | | | | | | | | | | | | | | | | | | | | | | $38,064 | |
| | | | | | | | | | | | | | | | | | | | | | | | |
| | | | |
| Liability Derivatives | | | | | | | | | | | | | |
| BUY | | EUR | | Deutsche Bank AG | | | 925,670 | | | | 7/16/13 | | | | $1,214,108 | | | | $1,203,415 | | | | $(10,693 | ) |
| BUY | | GBP | | Barclays Bank PLC | | | 266,308 | | | | 7/16/13 | | | | 414,251 | | | | 404,513 | | | | (9,738 | ) |
| BUY | | JPY | | Citibank N.A. | | | 57,078,930 | | | | 7/16/13 | | | | 577,593 | | | | 568,303 | | | | (9,290 | ) |
| BUY | | JPY | | Credit Suisse Group | | | 31,109,946 | | | | 7/16/13 | | | | 312,529 | | | | 309,745 | | | | (2,784 | ) |
| BUY | | JPY | | Goldman Sachs International | | | 10,680,460 | | | | 7/16/13 | | | | 107,963 | | | | 106,339 | | | | (1,624 | ) |
| BUY | | JPY | | Merrill Lynch International Bank | | | 31,109,946 | | | | 7/16/13 | | | | 312,451 | | | | 309,744 | | | | (2,707 | ) |
| | | | | | | | | | | | | | | | | | | | | | | | |
| | | | | | | | | | | | | | | | | | | | | | | $(36,836 | ) |
| | | | | | | | | | | | | | | | | | | | | | | | |
28
Portfolio of Investments (unaudited) – continued
Futures Contracts Outstanding at 5/31/13
| | | | | | | | | | | | | | | | |
| Description | | Currency | | | Contracts | | | Value | | Expiration Date | | Unrealized Appreciation (Depreciation) | |
| Asset Derivatives | | | | | | | | | | | | | | | | |
| Interest Rate Futures | | | | | | | | | | | | | |
| U.S. Treasury Note 10 yr (Short) | | | USD | | | | 72 | | | $9,303,750 | | September - 2013 | | | $13,810 | |
| | | | | | | | | | | | | | | | |
At May 31, 2013, the fund had liquid securities with an aggregate value of $88,266 to cover any commitments for certain derivative contracts.
See Notes to Financial Statements
29
Financial Statements
STATEMENT OF ASSETS AND LIABILITIES
At 5/31/13 (unaudited)
This statement represents your fund’s balance sheet, which details the assets and liabilities comprising the total value of the fund.
| | | | |
| Assets | | | | |
Investments- | | | | |
Non-affiliated issuers, at value (identified cost, $106,126,555) | | | $111,914,036 | |
Underlying affiliated funds, at cost and value | | | 3,703,717 | |
Total investments, at value (identified cost, $109,830,272) | | | $115,617,753 | |
Cash | | | 9,875 | |
Receivables for | | | | |
Forward foreign currency exchange contracts | | | 38,064 | |
Daily variation margin on open futures contracts | | | 19,125 | |
Investments sold | | | 250,055 | |
Interest and dividends | | | 1,412,888 | |
Other assets | | | 16,231 | |
Total assets | | | $117,363,991 | |
| Liabilities | | | | |
Notes payable | | | $15,100,000 | |
Payables for | | | | |
Distributions | | | 20,298 | |
Forward foreign currency exchange contracts | | | 36,836 | |
Investments purchased | | | 658,559 | |
Payable to affiliates | | | | |
Investment adviser | | | 4,311 | |
Transfer agent and dividend disbursing costs | | | 2,803 | |
Payable for independent Trustees’ compensation | | | 2,079 | |
Accrued interest expense | | | 12,246 | |
Accrued expenses and other liabilities | | | 66,331 | |
Total liabilities | | | $15,903,463 | |
Net assets | | | $101,460,528 | |
| Net assets consist of | | | | |
Paid-in capital | | | $101,509,602 | |
Unrealized appreciation (depreciation) on investments and translation of assets and liabilities in foreign currencies | | | 5,801,613 | |
Accumulated net realized gain (loss) on investments and foreign currency | | | (5,503,688 | ) |
Accumulated distributions in excess of net investment income | | | (346,999 | ) |
Net assets | | | $101,460,528 | |
Shares of beneficial interest outstanding | | | 10,842,500 | |
Net asset value per share (net assets of $101,460,528 / 10,842,500 shares of beneficial interest outstanding) | | | $9.36 | |
See Notes to Financial Statements
30
Financial Statements
STATEMENT OF OPERATIONS
Six months ended 5/31/13 (unaudited)
This statement describes how much your fund earned in investment income and accrued in expenses. It also describes any gains and/or losses generated by fund operations.
| | | | |
| Net investment income | | | | |
Income | | | | |
Interest | | | $2,762,034 | |
Dividends | | | 6,644 | |
Dividends from underlying affiliated funds | | | 2,051 | |
Total investment income | | | $2,770,729 | |
Expenses | | | | |
Management fee | | | $384,497 | |
Transfer agent and dividend disbursing costs | | | 9,839 | |
Administrative services fee | | | 12,004 | |
Independent Trustees’ compensation | | | 7,622 | |
Stock exchange fee | | | 11,832 | |
Custodian fee | | | 10,236 | |
Interest expense | | | 77,141 | |
Shareholder communications | | | 19,027 | |
Audit and tax fees | | | 34,034 | |
Legal fees | | | 10,948 | |
Miscellaneous | | | 13,507 | |
Total expenses | | | $590,687 | |
Fees paid indirectly | | | (51 | ) |
Reduction of expenses by investment adviser | | | (164 | ) |
Net expenses | | | $590,472 | |
Net investment income | | | $2,180,257 | |
| Realized and unrealized gain (loss) on investments and foreign currency | |
Realized gain (loss) (identified cost basis) | | | | |
Investments | | | $898,676 | |
Futures contracts | | | 79,710 | |
Foreign currency | | | (133,069 | ) |
Net realized gain (loss) on investments and foreign currency | | | $845,317 | |
Change in unrealized appreciation (depreciation) | | | | |
Investments | | | $(2,177,684 | ) |
Futures contracts | | | 20,917 | |
Translation of assets and liabilities in foreign currencies | | | 47,862 | |
Net unrealized gain (loss) on investments and foreign currency translation | | | $(2,108,905 | ) |
Net realized and unrealized gain (loss) on investments and foreign currency | | | $(1,263,588 | ) |
Change in net assets from operations | | | $916,669 | |
See Notes to Financial Statements
31
Financial Statements
STATEMENTS OF CHANGES IN NET ASSETS
These statements describe the increases and/or decreases in net assets resulting from operations, any distributions, and any shareholder transactions.
| | | | | | | | |
| Change in net assets | | Six months ended
5/31/13
(unaudited) | | | Year ended
11/30/12 | |
| From operations | | | | | | | | |
Net investment income | | | $2,180,257 | | | | $4,692,726 | |
Net realized gain (loss) on investments and foreign currency | | | 845,317 | | | | 1,669,588 | |
Net unrealized gain (loss) on investments and foreign currency translation | | | (2,108,905 | ) | | | 5,741,088 | |
Change in net assets from operations | | | $916,669 | | | | $12,103,402 | |
| Distributions declared to shareholders | | | | | | | | |
From net investment income | | | $(3,198,538 | ) | | | $(5,301,983 | ) |
Total change in net assets | | | $(2,281,869 | ) | | | $6,801,419 | |
| Net assets | | | | | | | | |
At beginning of period | | | 103,742,397 | | | | 96,940,978 | |
At end of period (including accumulated distributions in excess of net investment income of $346,999 and undistributed net investment income of $671,282, respectively) | | | $101,460,528 | | | | $103,742,397 | |
See Notes to Financial Statements
32
Financial Statements
STATEMENT OF CASH FLOWS
Six months ended 5/31/13 (unaudited)
This statement provides a summary of cash flows from investment activity for the fund.
| | | | |
| Cash flows from operating activities: | | | | |
Change in net assets from operations | | | $916,669 | |
| Adjustments to reconcile change in net assets from operations to net cash provided by operating activities: | | | | |
Purchase of investment securities | | | (22,123,219 | ) |
Proceeds from disposition of investment securities | | | 25,043,917 | |
Proceeds from futures contracts and swap agreements | | | 79,710 | |
Purchases of short-term investments, net | | | (2,174,866 | ) |
Realized gain/loss on investments | | | (898,676 | ) |
Realized gain/loss on futures contracts and swap agreements | | | (79,710 | ) |
Unrealized appreciation/depreciation on investments | | | 2,177,684 | |
Unrealized appreciation/depreciation on foreign currency contracts | | | (50,209 | ) |
Net amortization/accretion of income | | | 194,387 | |
Decrease in interest and dividends receivable | | | 82,070 | |
Decrease in accrued expenses and other liabilities | | | (17,255 | ) |
Increase in receivable for daily variation margin on open futures contracts | | | (19,125 | ) |
Decrease in payable for daily variation margin on open futures contracts | | | (4,594 | ) |
Increase in other assets | | | (12,688 | ) |
Net cash provided by operating activities | | | $3,114,095 | |
| Cash flows from financing activities: | | | | |
Distributions paid in cash | | | (3,201,974 | ) |
Decrease in interest payable | | | (1,380 | ) |
Net cash used by financing activities | | | $(3,203,354 | ) |
Net decrease in cash | | | $(89,259 | ) |
| Cash: | | | | |
Beginning of period | | | $99,134 | |
End of period | | | $9,875 | |
Supplemental disclosure of cash flow information:
Cash paid during the six months ended May 31, 2013 for interest was $78,521.
See Notes to Financial Statements
33
Financial Statements
FINANCIAL HIGHLIGHTS
The financial highlights table is intended to help you understand the fund’s financial performance for the semiannual period and the past 5 fiscal years. Certain information reflects financial results for a single fund share. The total returns in the table represent the rate by which an investor would have earned (or lost) on an investment in the fund share class (assuming reinvestment of all distributions) held for the entire period.
| | | | | | | | | | | | | | | | | | | | | | | | |
| | | Six months
ended
5/31/13 (unaudited) | | | Years ended 11/30 | |
| | | | 2012 | | | 2011 | | | 2010 | | | 2009 | | | 2008 | |
| | | | | | | | | | | | | | | | | |
Net asset value, beginning of period | | | $9.57 | | | | $8.94 | | | | $9.17 | | | | $8.86 | | | | $7.62 | | | | $9.03 | |
| Income (loss) from investment operations | | | | | | | | | | | | | |
Net investment income (d) | | | $0.20 | | | | $0.43 | | | | $0.43 | | | | $0.47 | | | | $0.49 | | | | $0.46 | |
Net realized and unrealized gain
(loss) on investments and foreign
currency | | | (0.11 | ) | | | 0.69 | | | | (0.19 | ) | | | 0.33 | | | | 1.50 | | | | (1.36 | ) |
Total from investment operations | | | $0.09 | | | | $1.12 | | | | $0.24 | | | | $0.80 | | | | $1.99 | | | | $(0.90 | ) |
| Less distributions declared to shareholders | | | | | | | | | | | | | | | | | | | | | |
From net investment income | | | $(0.30 | ) | | | $(0.49 | ) | | | $(0.48 | ) | | | $(0.49 | ) | | | $(0.63 | ) | | | $(0.51 | ) |
From tax return of capital | | | — | | | | — | | | | — | | | | — | | | | (0.12 | ) | | | — | |
Total distributions declared to shareholders | | | $(0.30 | ) | | | $(0.49 | ) | | | $(0.48 | ) | | | $(0.49 | ) | | | $(0.75 | ) | | | $(0.51 | ) |
Net increase from repurchase of capital
shares | | | $— | | | | $— | | | | $0.01 | | | | $— | | | | $0.00 | (w) | | | $0.00 | (w) |
Net asset value, end of period (x) | | | $9.36 | | | | $9.57 | | | | $8.94 | | | | $9.17 | | | | $8.86 | | | | $7.62 | |
Market value, end of period | | | $8.33 | | | | $8.86 | | | | $8.10 | | | | $8.38 | | | | $7.98 | | | | $5.94 | |
Total return at market value (%) | | | (2.76 | )(n) | | | 15.75 | | | | 2.45 | | | | 11.47 | | | | 48.70 | | | | (22.46 | ) |
Total return at net asset
value (%) (j)(r)(s)(x) | | | 1.16 | (n) | | | 13.28 | | | | 3.33 | | | | 9.86 | | | | 28.70 | | | | (9.78 | ) |
Ratios (%) (to average net assets)
and Supplemental data: | | | | | | | | | | | | | | | | | | | | | |
Expenses before expense reductions (f) | | | 1.15 | (a) | | | 1.18 | | | | 1.07 | | | | 1.11 | | | | 1.18 | | | | 1.17 | |
Expenses after expense reductions (f) | | | 1.15 | (a) | | | 1.18 | | | | 1.07 | | | | 1.10 | | | | 1.18 | | | | 1.17 | |
Net investment income | | | 4.25 | (a) | | | 4.64 | | | | 4.67 | | | | 5.23 | | | | 6.05 | | | | 5.35 | |
Portfolio turnover | | | 17 | (n) | | | 43 | | | | 38 | | | | 50 | | | | 63 | | | | 63 | |
Net assets at end of period
(000 omitted) | | | $101,461 | | | | $103,742 | | | | $96,941 | | | | $99,965 | | | | $96,625 | | | | $83,554 | |
34
Financial Highlights – continued
| | | | | | | | | | | | | | | | | | | | | | | | |
| | | Six months
ended
5/31/13 (unaudited) | | | Years ended 11/30 | |
| | | | 2012 | | | 2011 | | | 2010 | | | 2009 | | | 2008 | |
| | | | | | | | | | | | | | | | | |
| Supplemental Ratios (%): | | | | | | | | | | | | | | | | | | | | | | | | |
Ratio of expenses to average net
assets after expense reductions and
excluding interest expense (f) | | | 1.00 | (a) | | | 1.03 | | | | 0.98 | | | | 1.00 | | | | 1.09 | | | | N/A | |
| Senior Securities: | | | | | | | | | | | | | | | | | | | | | | | | |
Total notes payable outstanding
(000 omitted) | | | $15,100 | | | | $15,100 | | | | $9,100 | | | | $8,000 | | | | $8,000 | | | | $1,000 | |
Asset coverage per $1,000 of indebtedness (k) | | | $7,719 | | | | $7,870 | | | | $11,653 | | | | $13,496 | | | | $13,078 | | | | $84,554 | |
| (d) | Per share data is based on average shares outstanding. |
| (f) | Ratios do not reflect reductions from fees paid indirectly, if applicable. |
| (j) | Total return at net asset value is calculated using the net asset value of the fund, not the publicly traded price and therefore may be different than the total return at market value. |
| (k) | Calculated by subtracting the fund’s total liabilities (not including notes payable) from the fund’s total assets and dividing this number by the notes payable outstanding and then multiplying by 1,000. |
| (r) | Certain expenses have been reduced without which performance would have been lower. |
| (s) | From time to time the fund may receive proceeds from litigation settlements, without which performance would be lower. |
| (w) | Per share amount was less than $0.01. |
| (x) | The net asset values per share and total returns at net asset value per share have been calculated on net assets which include adjustments made in accordance with U.S. generally accepted accounting principles required at period end for financial reporting purposes. |
See Notes to Financial Statements
35
NOTES TO FINANCIAL STATEMENTS
(unaudited)
(1) Business and Organization
MFS InterMarket Income Trust I (the fund) is organized as a Massachusetts business trust and is registered under the Investment Company Act of 1940, as amended, as a closed-end management investment company.
(2) Significant Accounting Policies
General – The preparation of financial statements in conformity with U.S. generally accepted accounting principles requires management to make estimates and assumptions that affect the reported amounts of assets and liabilities, and disclosure of contingent assets and liabilities at the date of the financial statements and the reported amounts of revenues and expenses during the reporting period. Actual results could differ from those estimates. In the preparation of these financial statements, management has evaluated subsequent events occurring after the date of the fund��s Statement of Assets and Liabilities through the date that the financial statements were issued. The fund invests in high-yield securities rated below investment grade. Investments in high-yield securities involve greater degrees of credit and market risk than investments in higher-rated securities and tend to be more sensitive to economic conditions. The fund invests in foreign securities. Investments in foreign securities are vulnerable to the effects of changes in the relative values of the local currency and the U.S. dollar and to the effects of changes in each country’s legal, political, and economic environment.
In January 2013, the Financial Accounting Standards Board (FASB) issued Accounting Standards Update 2013-01 (“ASU 2013-01”) entitled Balance Sheet (Topic 210) – Clarifying the Scope of Disclosures about Offsetting Assets and Liabilities which is intended to clarify the scope of Accounting Standards Update 2011-11
(“ASU 2011-11”), Balance Sheet (Topic 210) – Disclosures about Offsetting Assets and Liabilities. Consistent with the effective date for ASU 2011-11, ASU 2013-01 is effective for annual reporting periods beginning on or after January 1, 2013, and interim periods within those annual periods. ASU 2013-01 limits the scope of ASU 2011-11’s disclosure requirements on offsetting to financial assets and financial liabilities related to derivatives, repurchase and reverse repurchase agreements, and securities lending and securities borrowing transactions. Although still evaluating the potential impact of these two ASUs to the fund, management expects that the impact of the fund’s adoption will be limited to additional financial statement disclosures.
In June 2013, FASB issued Accounting Standards Update 2013-08 Financial Services – Investment Companies (Topic 946) – Amendments to the Scope, Measurement, and Disclosure Requirements (“ASU 2013-08”) which is effective for interim and annual reporting periods in fiscal years that begin after December 15, 2013. ASU 2013-08 sets forth a methodology for determining whether an entity should be characterized as an investment company and prescribes fair value accounting for an investment company’s non-controlling ownership interest in another investment company. FASB has determined that a fund registered under the Investment Company Act of 1940 automatically meets ASU 2013-08’s criteria for an investment company. Although still evaluating the potential impacts of ASU 2013-08 to the fund, management expects that the impact of the fund’s adoption will be limited to additional financial statement disclosures.
36
Notes to Financial Statements (unaudited) – continued
Investment Valuations – Debt instruments and floating rate loans (other than short-term instruments), including restricted debt instruments, are generally valued at an evaluated or composite bid as provided by a third-party pricing service. Equity securities, including restricted equity securities, are generally valued at the last sale or official closing price as provided by a third-party pricing service on the market or exchange on which they are primarily traded. Equity securities, for which there were no sales reported that day, are generally valued at the last quoted daily bid quotation as provided by a third-party pricing service on the market or exchange on which such securities are primarily traded. Short-term instruments with a maturity at issuance of 60 days or less generally are valued at amortized cost, which approximates market value. Futures contracts are generally valued at last posted settlement price as provided by a third-party pricing service on the market on which they are primarily traded. Futures contracts for which there were no trades that day for a particular position are generally valued at the closing bid quotation as provided by a third-party pricing service on the market on which such futures contracts are primarily traded. Forward foreign currency exchange contracts are generally valued at the mean of bid and asked prices for the time period interpolated from rates provided by a third-party pricing service for proximate time periods. Open-end investment companies are generally valued at net asset value per share. Securities and other assets generally valued on the basis of information from a third-party pricing service may also be valued at a broker/dealer bid quotation. Values obtained from third-party pricing services can utilize both transaction data and market information such as yield, quality, coupon rate, maturity, type of issue, trading characteristics, and other market data. The values of foreign securities and other assets and liabilities expressed in foreign currencies are converted to U.S. dollars using the mean of bid and asked prices for rates provided by a third-party pricing service.
The Board of Trustees has delegated primary responsibility for determining or causing to be determined the value of the fund’s investments (including any fair valuation) to the adviser pursuant to valuation policies and procedures approved by the Board. If the adviser determines that reliable market quotations are not readily available, investments are valued at fair value as determined in good faith by the adviser in accordance with such procedures under the oversight of the Board of Trustees. Under the fund’s valuation policies and procedures, market quotations are not considered to be readily available for most types of debt instruments and floating rate loans and many types of derivatives. These investments are generally valued at fair value based on information from third-party pricing services. In addition, investments may be valued at fair value if the adviser determines that an investment’s value has been materially affected by events occurring after the close of the exchange or market on which the investment is principally traded (such as foreign exchange or market) and prior to the determination of the fund’s net asset value, or after the halting of trading of a specific security where trading does not resume prior to the close of the exchange or market on which the security is principally traded. The adviser generally relies on third-party pricing services or other information (such as the correlation with price movements of similar securities in the same or other markets; the type, cost and investment characteristics of the security; the business and financial condition of the issuer; and trading and other market data) to assist in determining whether to fair value and at what value to fair value an investment. The value of an investment for purposes of calculating the fund’s
37
Notes to Financial Statements (unaudited) – continued
net asset value can differ depending on the source and method used to determine value. When fair valuation is used, the value of an investment used to determine the fund’s net asset value may differ from quoted or published prices for the same investment. There can be no assurance that the fund could obtain the fair value assigned to an investment if it were to sell the investment at the same time at which the fund determines its net asset value per share.
Various inputs are used in determining the value of the fund’s assets or liabilities. These inputs are categorized into three broad levels. In certain cases, the inputs used to measure fair value may fall into different levels of the fair value hierarchy. In such cases, an investment’s level within the fair value hierarchy is based on the lowest level of input that is significant to the fair value measurement. The fund’s assessment of the significance of a particular input to the fair value measurement in its entirety requires judgment, and considers factors specific to the investment. Level 1 includes unadjusted quoted prices in active markets for identical assets or liabilities. Level 2 includes other significant observable market-based inputs (including quoted prices for similar securities, interest rates, prepayment speed, and credit risk). Level 3 includes unobservable inputs, which may include the adviser’s own assumptions in determining the fair value of investments. Other financial instruments are derivative instruments not reflected in total investments, such as futures contracts and forward foreign currency exchange contracts. The following is a summary of the levels used as of May 31, 2013 in valuing the fund’s assets or liabilities:
| | | | | | | | | | | | | | | | |
| Investments at Value | | Level 1 | | | Level 2 | | | Level 3 | | | Total | |
| Equity Securities | | | $152,708 | | | | $106,769 | | | | $13,340 | | | | $272,817 | |
| U.S. Treasury Bonds & U.S. Government Agency & Equivalents | | | — | | | | 21,074 | | | | — | | | | 21,074 | |
| Non-U.S. Sovereign Debt | | | — | | | | 14,170,568 | | | | — | | | | 14,170,568 | |
| Municipal Bonds | | | — | | | | 432,031 | | | | — | | | | 432,031 | |
| U.S. Corporate Bonds | | | — | | | | 70,781,265 | | | | — | | | | 70,781,265 | |
| Residential Mortgage-Backed Securities | | | — | | | | 1,405,423 | | | | — | | | | 1,405,423 | |
| Asset-Backed Securities (including CDOs) | | | — | | | | 818,041 | | | | — | | | | 818,041 | |
| Foreign Bonds | | | — | | | | 23,299,089 | | | | — | | | | 23,299,089 | |
| Floating Rate Loans | | | — | | | | 713,728 | | | | — | | | | 713,728 | |
| Mutual Funds | | | 3,703,717 | | | | — | | | | — | | | | 3,703,717 | |
| Total Investments | | | $3,856,425 | | | | $111,747,988 | | | | $13,340 | | | | $115,617,753 | |
| | | | |
| Other Financial Instruments | | | | | | | | | | | | |
| Futures Contracts | | | $13,810 | | | | $— | | | | $— | | | | $13,810 | |
| Forward Foreign Currency Exchange Contracts | | | — | | | | 1,228 | | | | — | | | | 1,228 | |
For further information regarding security characteristics, see the Portfolio of Investments.
38
Notes to Financial Statements (unaudited) – continued
The following is a reconciliation of level 3 assets for which significant unobservable inputs were used to determine fair value. The fund’s policy is to recognize transfers between the levels as of the end of the period. The table presents the activity of level 3 securities held at the beginning and the end of the period.
| | | | |
| | | Equity Securities | |
| Balance as of 11/30/12 | | | $12,070 | |
Change in unrealized appreciation (depreciation) | | | 1,270 | |
| Balance as of 5/31/13 | | | $13,340 | |
The net change in unrealized appreciation (depreciation) from investments still held as level 3 at May 31, 2013 is $1,270.
Foreign Currency Translation – Purchases and sales of foreign investments, income, and expenses are converted into U.S. dollars based upon currency exchange rates prevailing on the respective dates of such transactions or on the reporting date for foreign denominated receivables and payables. Gains and losses attributable to foreign currency exchange rates on sales of securities are recorded for financial statement purposes as net realized gains and losses on investments. Gains and losses attributable to foreign exchange rate movements on receivables, payables, income and expenses are recorded for financial statement purposes as foreign currency transaction gains and losses. That portion of both realized and unrealized gains and losses on investments that results from fluctuations in foreign currency exchange rates is not separately disclosed.
Derivatives – The fund uses derivatives for different purposes, primarily to increase or decrease exposure to a particular market or segment of the market, or security, to increase or decrease interest rate or currency exposure, or as alternatives to direct investments. Derivatives are used for hedging or non-hedging purposes. While hedging can reduce or eliminate losses, it can also reduce or eliminate gains. When the fund uses derivatives as an investment to increase market exposure, or for hedging purposes, gains and losses from derivative instruments may be substantially greater than the derivative’s original cost.
The derivative instruments used by the fund were futures contracts and forward foreign currency exchange contracts. The fund’s period end derivatives, as presented in the Portfolio of Investments and the associated Derivative Contract tables, generally are indicative of the volume of its derivative activity during the period.
The following table presents, by major type of derivative contract, the fair value, on a gross basis, of the asset and liability components of derivatives held by the fund at May 31, 2013 as reported in the Statement of Assets and Liabilities:
| | | | | | | | | | |
| | | | | Fair Value (a) | |
| Risk | | Derivative Contracts | | Asset Derivatives | | | Liability Derivatives | |
| Interest Rate | | Interest Rate Futures | | | $13,810 | | | | $— | |
| Foreign Exchange | | Forward Foreign Currency Exchange | | | 38,064 | | | | (36,836 | ) |
| Total | | | | | $51,874 | | | $ | (36,836 | ) |
| (a) | The value of futures contracts outstanding includes cumulative appreciation (depreciation) as reported in the fund’s Portfolio of Investments. Only the current day variation margin for futures contracts is separately reported within the fund’s Statement of Assets and Liabilities. |
39
Notes to Financial Statements (unaudited) – continued
The following table presents, by major type of derivative contract, the realized gain (loss) on derivatives held by the fund for the six months ended May 31, 2013 as reported in the Statement of Operations:
| | | | | | | | |
| Risk | | Futures
Contracts | | | Foreign
Currency | |
| Interest Rate | | | $79,710 | | | | $— | |
| Foreign Exchange | | | — | | | | (131,766 | ) |
| Total | | | $79,710 | | | | $(131,766 | ) |
The following table presents, by major type of derivative contract, the change in unrealized appreciation (depreciation) on derivatives held by the fund for the six months ended May 31, 2013 as reported in the Statement of Operations:
| | | | | | | | |
| Risk | | Futures
Contracts | | | Translation
of Assets and
Liabilities in
Foreign
Currencies | |
| Interest Rate | | | $20,917 | | | | $— | |
| Foreign Exchange | | | — | | | | 50,209 | |
| Total | | | $20,917 | | | | $50,209 | |
Derivative counterparty credit risk is managed through formal evaluation of the creditworthiness of all potential counterparties. On certain over-the-counter derivatives, the fund attempts to reduce its exposure to counterparty credit risk whenever possible
by entering into an International Swaps and Derivatives Association (ISDA) Master Agreement on a bilateral basis with each of the counterparties with whom it undertakes a significant volume of transactions. The ISDA Master Agreement gives each party to the agreement the right to terminate all transactions traded under such agreement if there is a certain deterioration in the credit quality of the other party. The ISDA Master Agreement gives the fund the right, upon an event of default by the applicable counterparty or a termination of the agreement, to close out all transactions traded under such agreement and to net amounts owed under each transaction to one net amount payable by one party to the other. This right to close out and net payments across all transactions traded under the ISDA Master Agreement could result in a reduction of the fund’s credit risk to such counterparty equal to any amounts payable by the fund under the applicable transactions, if any. However, absent an event of default by the counterparty or a termination of the agreement, the ISDA Master Agreement does not result in an offset of reported amounts of assets and liabilities in the Statement of Assets and Liabilities across transactions between the fund and the applicable counterparty.
Collateral requirements differ by type of derivative. Collateral or margin requirements are set by the broker or exchange clearing house for exchange traded derivatives (i.e., futures contracts and exchange-traded options) while collateral terms are contract specific for over-the-counter traded derivatives (i.e., forward foreign currency exchange contracts, swap agreements and over-the-counter options). For derivatives traded under an ISDA Master Agreement, the collateral requirements are netted across all transactions traded under such agreement and one amount is posted from one party to
40
Notes to Financial Statements (unaudited) – continued
the other to collateralize such obligations. Cash collateral that has been segregated to cover obligations of the fund under derivative contracts, if any, will be reported separately in the Statement of Assets and Liabilities as restricted cash. Securities collateral pledged for the same purpose, if any, is noted in the Portfolio of Investments.
Futures Contracts – The fund entered into futures contracts which may be used to hedge against or obtain broad market exposure, interest rate exposure, currency exposure, or to manage duration. A futures contract represents a commitment for the future purchase or sale of an asset at a specified price on a specified date.
Upon entering into a futures contract, the fund is required to deposit with the broker, either in cash or securities, an initial margin in an amount equal to a certain percentage of the notional amount of the contract. Subsequent payments (variation margin) are made or received by the fund each day, depending on the daily fluctuations in the value of the contract, and are recorded for financial statement purposes as unrealized gain or loss by the fund until the contract is closed or expires at which point the gain or loss on futures contracts is realized.
The fund bears the risk of interest rates, exchange rates or securities prices moving unexpectedly, in which case, the fund may not achieve the anticipated benefits of the futures contracts and may realize a loss. While futures contracts may present less counterparty risk to the fund since the contracts are exchange traded and the exchange’s clearinghouse guarantees payments to the broker, there is still counterparty credit risk due to the insolvency of the broker. The fund’s maximum risk of loss due to counterparty credit risk is equal to the margin posted by the fund to the broker plus any gains or minus any losses on the outstanding futures contracts.
Forward Foreign Currency Exchange Contracts – The fund entered into forward foreign currency exchange contracts for the purchase or sale of a specific foreign currency at a fixed price on a future date. These contracts may be used to hedge the fund’s currency risk or for non-hedging purposes. For hedging purposes, the fund may enter into contracts to deliver or receive foreign currency that the fund will receive from or use in its normal investment activities. The fund may also use contracts to hedge against declines in the value of foreign currency denominated securities due to unfavorable exchange rate movements. For non-hedging purposes, the fund may enter into contracts with the intent of changing the relative exposure of the fund’s portfolio of securities to different currencies to take advantage of anticipated exchange rate changes.
Forward foreign currency exchange contracts are adjusted by the daily exchange rate of the underlying currency and any unrealized gains or losses are recorded as a receivable or payable for forward foreign currency exchange contracts until the contract settlement date. On contract settlement date, any gain or loss on the contract is recorded as realized gains or losses on foreign currency.
Risks may arise upon entering into these contracts from unanticipated movements in the value of the contract and from the potential inability of counterparties to meet the terms of their contracts. Generally, the fund’s maximum risk due to counterparty credit risk is the unrealized gain on the contract due to the use of Continuous Linked Settlement, an industry accepted settlement system. This risk is mitigated in cases where there is an ISDA Master Agreement between the fund and the counterparty
41
Notes to Financial Statements (unaudited) – continued
providing for netting as described above and for posting of collateral by the counterparty to the fund to cover the fund’s exposure to the counterparty under such ISDA Master Agreement.
Loans and Other Direct Debt Instruments – The fund invests in loans and loan participations or other receivables. These investments may include standby financing commitments, including revolving credit facilities, which obligate the fund to supply additional cash to the borrower on demand. Loan participations involve a risk of insolvency of the lending bank or other financial intermediary.
Statement of Cash Flows – Information on financial transactions which have been settled through the receipt or disbursement of cash is presented in the Statement of Cash Flows. The cash amount shown in the Statement of Cash Flows is the amount included within the fund’s Statement of Assets and Liabilities and includes cash on hand at its custodian bank and does not include any short term investments.
Indemnifications – Under the fund’s organizational documents, its officers and Trustees may be indemnified against certain liabilities and expenses arising out of the performance of their duties to the fund. Additionally, in the normal course of business, the fund enters into agreements with service providers that may contain indemnification clauses. The fund’s maximum exposure under these agreements is unknown as this would involve future claims that may be made against the fund that have not yet occurred.
Investment Transactions and Income – Investment transactions are recorded on the trade date. Interest income is recorded on the accrual basis. All premium and discount is amortized or accreted for financial statement purposes in accordance with U.S. generally accepted accounting principles. The fund earns certain fees in connection with its floating rate loan purchasing activities. These fees are in addition to interest payments earned and may include amendment fees, commitment fees, facility fees, consent fees, and prepayment fees. Commitment fees are recorded on an accrual basis as income in the accompanying financial statements. Dividends received in cash are recorded on the ex-dividend date. Certain dividends from foreign securities will be recorded when the fund is informed of the dividend if such information is obtained subsequent to the ex-dividend date. Dividend and interest payments received in additional securities are recorded on the ex-dividend or ex-interest date in an amount equal to the value of the security on such date. Debt obligations may be placed on non-accrual status or set to accrue at a rate of interest less than the contractual coupon when the collection of all or a portion of interest has become doubtful. Interest income for those debt obligations may be further reduced by the write-off of the related interest receivables when deemed uncollectible.
The fund may receive proceeds from litigation settlements. Any proceeds received from litigation involving portfolio holdings are reflected in the Statement of Operations in realized gain/loss if the security has been disposed of by the fund or in unrealized gain/loss if the security is still held by the fund. Any other proceeds from litigation not related to portfolio holdings are reflected as other income in the Statement of Operations.
Fees Paid Indirectly – The fund’s custody fee may be reduced according to an arrangement that measures the value of cash deposited with the custodian by the fund. This amount, for the six months ended May 31, 2013, is shown as a reduction of total expenses in the Statement of Operations.
42
Notes to Financial Statements (unaudited) – continued
Tax Matters and Distributions – The fund intends to qualify as a regulated investment company, as defined under Subchapter M of the Internal Revenue Code, and to distribute all of its taxable income, including realized capital gains. As a result, no provision for federal income tax is required. The fund’s federal tax returns, when filed, will remain subject to examination by the Internal Revenue Service for a three year period.
Distributions to shareholders are recorded on the ex-dividend date. Income and capital gain distributions are determined in accordance with income tax regulations, which may differ from U.S. generally accepted accounting principles. Certain capital accounts in the financial statements are periodically adjusted for permanent differences in order to reflect their tax character. These adjustments have no impact on net assets or net asset value per share. Temporary differences which arise from recognizing certain items of income, expense, gain or loss in different periods for financial statement and tax purposes will reverse at some time in the future. Distributions in excess of net investment income or net realized gains are temporary overdistributions for financial statement purposes resulting from differences in the recognition or classification of income or distributions for financial statement and tax purposes.
Book/tax differences primarily relate to amortization and accretion of debt securities and derivative transactions.
The tax character of distributions made during the current period will be determined at fiscal year end. The tax character of distributions declared to shareholders for the last fiscal year is as follows:
| | | | |
| | | 11/30/12 | |
Ordinary income (including any
short-term capital gains) | | | $5,301,983 | |
The federal tax cost and the tax basis components of distributable earnings were as follows:
| | | | |
| As of 5/31/13 | | | |
| Cost of investments | | | $110,441,122 | |
| Gross appreciation | | | 6,387,322 | |
| Gross depreciation | | | (1,210,691 | ) |
| Net unrealized appreciation (depreciation) | | | $5,176,631 | |
| |
| As of 11/30/12 | | | |
| Undistributed ordinary income | | | 653,245 | |
| Capital loss carryforwards | | | (5,726,389 | ) |
| Post-October capital loss deferral | | | (35,289 | ) |
| Other temporary differences | | | (29,503 | ) |
| Net unrealized appreciation (depreciation) | | | 7,370,731 | |
The aggregate cost above includes prior fiscal year end tax adjustments, if applicable.
Under the Regulated Investment Company Modernization Act of 2010 (the “Act”), net capital losses recognized for fund fiscal years beginning after November 30, 2011 may be carried forward indefinitely, and their character is retained as short-term and/or
43
Notes to Financial Statements (unaudited) – continued
long-term losses (“post-enactment losses”). Previously, net capital losses were carried forward for eight years and treated as short-term losses (“pre-enactment losses”). As a transition rule, the Act requires that all post-enactment net capital losses be used before pre-enactment net capital losses.
As of November 30, 2012, the fund had capital loss carryforwards available to offset future realized gains. Such pre-enactment losses expire as follows:
| | | | |
| 11/30/14 | | | $(29,288 | ) |
| 11/30/16 | | | (1,946,452 | ) |
| 11/30/17 | | | (3,750,649 | ) |
| Total | | | $(5,726,389 | ) |
(3) Transactions with Affiliates
Investment Adviser – The fund has an investment advisory agreement with MFS to provide overall investment management and related administrative services and facilities to the fund. The management fee is computed daily and paid monthly at an annual rate of 0.75% of the fund’s average daily net assets.
Transfer Agent – The fund engages Computershare Trust Company, N.A. (“Computershare”) as the sole transfer agent for the fund. MFS Service Center, Inc. (MFSC) monitors and supervises the activities of Computershare for an agreed upon fee approved by the Board of Trustees. For the six months ended May 31, 2013, these fees paid to MFSC amounted to $3,348.
Administrator – MFS provides certain financial, legal, shareholder communications, compliance, and other administrative services to the fund. Under an administrative services agreement, the fund partially reimburses MFS the costs incurred to provide these services. The fund is charged an annual fixed amount of $17,500 plus a fee based on average daily net assets. The administrative services fee incurred for the six months ended May 31, 2013 was equivalent to an annual effective rate of 0.0234% of the fund’s average daily net assets.
Trustees’ and Officers’ Compensation – The fund pays compensation to independent Trustees in the form of a retainer, attendance fees, and additional compensation to Board and Committee chairpersons. The fund does not pay compensation directly to Trustees or officers of the fund who are also officers of the investment adviser, all of whom receive remuneration for their services to the fund from MFS. Certain officers and Trustees of the fund are officers or directors of MFS and MFSC.
Deferred Trustee Compensation – Prior to MFS’ appointment as investment adviser to the fund, the fund’s former independent Trustees participated in a Deferred Compensation Plan (the “Former Colonial Trustees Plan” or “Plan”). The fund’s current independent Trustees are not allowed to defer compensation under the Former Colonial Trustees Plan. Amounts deferred under the Plan are invested in shares of certain non-MFS funds selected by the former independent Trustees as notional investments. Deferred amounts represent an unsecured obligation of the fund until distributed in accordance with the Plan. Included in “Other assets” and “Payable for independent Trustees’ compensation” in the Statement of Assets and Liabilities is $1,693 of deferred Trustees’ compensation. There is no current year expense associated with the Former Colonial Trustees Plan.
44
Notes to Financial Statements (unaudited) – continued
Other – This fund and certain other funds managed by MFS (the funds) have entered into services agreements (the Agreements) which provide for payment of fees by the funds to Tarantino LLC and Griffin Compliance LLC in return for the provision of services of an Independent Chief Compliance Officer (ICCO) and Assistant ICCO, respectively, for the funds. The ICCO and Assistant ICCO are officers of the funds and the sole members of Tarantino LLC and Griffin Compliance LLC, respectively. The funds can terminate the Agreements with Tarantino LLC and Griffin Compliance LLC at any time under the terms of the Agreements. For the six months ended May 31, 2013, the aggregate fees paid by the fund to Tarantino LLC and Griffin Compliance LLC were $390 and are included in “Miscellaneous” expense in the Statement of Operations. MFS has agreed to reimburse the fund for a portion of the payments made by the fund in the amount of $164, which is shown as a reduction of total expenses in the Statement of Operations. Additionally, MFS has agreed to bear all expenses associated with office space, other administrative support, and supplies provided to the ICCO and Assistant ICCO.
The fund invests in the MFS Institutional Money Market Portfolio which is managed by MFS and seeks current income consistent with preservation of capital and liquidity. Income earned on this investment is included in “Dividends from underlying affiliated funds” in the Statement of Operations. This money market fund does not pay a management fee to MFS.
(4) Portfolio Securities
Purchases and sales of investments, other than short-term obligations, were as follows:
| | | | | | | | |
| | | Purchases | | | Sales | |
| U.S. Government securities | | | $— | | | | $599,671 | |
| Investments (non-U.S. Government securities) | | | $19,751,110 | | | | $21,774,824 | |
(5) Shares of Beneficial Interest
The fund’s Declaration of Trust permits the Trustees to issue an unlimited number of full and fractional shares of beneficial interest. The Trustees have authorized the repurchase by the fund of up to 10% annually of its own shares of beneficial interest. During the six months ended May 31, 2013 and the year ended November 30, 2012, there were no transactions in fund shares.
(6) Loan Agreement
The fund has a credit agreement with a bank for a revolving secured line of credit that can be drawn upon up to $20,000,000. At May 31, 2013, the fund had outstanding borrowings under this agreement in the amount of $15,100,000, which are secured by a lien on the fund’s assets. The loan’s carrying value in the fund’s Statement of Assets and Liabilities approximates its fair value. The loan value as of the reporting date is considered level 2 under the fair value hierarchy. The credit agreement matures on February 7, 2014. Borrowing under the agreement can be made for liquidity or leverage purposes. Interest is charged at a rate per annum equal to LIBOR plus an agreed upon spread or an alternate rate, at the option of the borrower, stated as the greater of Overnight LIBOR or the Federal Funds Rate each plus an agreed upon spread. The fund incurred interest expense of $77,141 during the period. The fund paid a commitment fee of $2,442 based on the average daily unused portion of the revolving
45
Notes to Financial Statements (unaudited) – continued
line of credit which is reported in “Miscellaneous” expense in the Statement of Operations. For the six months ended May 31, 2013, the average loan balance was $15,100,000 at a weighted average annual interest rate of 1.02%. The fund is subject to certain covenants including, but not limited to, requirements with respect to asset coverage, portfolio diversification and liquidity.
(7) Transactions in Underlying Affiliated Funds-Affiliated Issuers
An affiliated issuer may be considered one in which the fund owns 5% or more of the outstanding voting securities, or a company which is under common control. For the purposes of this report, the fund assumes the following to be an affiliated issuer:
| | | | | | | | | | | | | | | | |
| Underlying Affiliated Fund | | Beginning
Shares/Par
Amount | | | Acquisitions
Shares/Par
Amount | | | Dispositions
Shares/Par
Amount | | | Ending
Shares/Par
Amount | |
MFS Institutional Money Market Portfolio | | | 1,528,851 | | | | 16,817,663 | | | | (14,642,797 | ) | | | 3,703,717 | |
| | | | |
| Underlying Affiliated Fund | | Realized
Gain (Loss) | | | Capital Gain
Distributions | | | Dividend
Income | | | Ending
Value | |
MFS Institutional Money Market Portfolio | | | $— | | | | $— | | | | $2,051 | | | | $3,703,717 | |
46
REPORT OF INDEPENDENT REGISTERED PUBLIC ACCOUNTING FIRM
To the Board of Trustees and Shareholders of the MFS InterMarket Income Trust I:
We have reviewed the accompanying statement of assets and liabilities of the MFS InterMarket Income Trust I (the Fund), including the portfolio of investments, as of May 31, 2013, and the related statements of operations, changes in net assets, cash flows, and financial highlights for the six-month period ended May 31, 2013. These interim financial statements and financial highlights are the responsibility of the Fund’s management.
We conducted our review in accordance with the standards of the Public Company Accounting Oversight Board (United States). A review of interim financial information consists principally of applying analytical procedures and making inquiries of persons responsible for financial and accounting matters. It is substantially less in scope than an audit conducted in accordance with the standards of the Public Company Accounting Oversight Board (United States), the objective of which is the expression of an opinion regarding the financial statements taken as a whole. Accordingly, we do not express such an opinion.
Based on our review, we are not aware of any material modifications that should be made to the accompanying interim financial statements and financial highlights for them to be in conformity with U.S. generally accepted accounting principles.
We have previously audited, in accordance with the standards of the Public Company Accounting Oversight Board (United States), the statement of changes in net assets for the year ended November 30, 2012, and the financial highlights for each of the five years in the period ended November 30, 2012, and in our report dated January 15, 2013, we expressed an unqualified opinion on such statement of changes in net assets and financial highlights.

Boston, Massachusetts
July 17, 2013
47
BOARD REVIEW OF INVESTMENT ADVISORY AGREEMENT
A discussion regarding the Board’s most recent review and renewal of the fund’s Investment Advisory Agreement with MFS is available by clicking on the fund’s name under “Closed-End Funds” in the “Products” section of the MFS Web site (mfs.com).
PROXY VOTING POLICIES AND INFORMATION
A general description of the MFS funds’ proxy voting policies and procedures is available without charge, upon request, by calling 1-800-225-2606, by visiting the Proxy Voting section of mfs.com or by visiting the SEC’s Web site at http://www.sec.gov.
Information regarding how the fund voted proxies relating to portfolio securities during the twelve-month period ended June 30, 2012 is available without charge by visiting the Proxy Voting section of mfs.com or by visiting the SEC’s Web site at http://www.sec.gov.
QUARTERLY PORTFOLIO DISCLOSURE
The fund will file a complete schedule of portfolio holdings with the Securities and Exchange Commission (the Commission) for the first and third quarters of each fiscal year on Form N-Q. A shareholder can obtain the quarterly portfolio holdings report at mfs.com. The fund’s Form N-Q is also available on the EDGAR database on the Commission’s Internet Web site at http://www.sec.gov, and may be reviewed and copied at the:
Public Reference Room
Securities and Exchange Commission
100 F Street, NE, Room 1580
Washington, D.C. 20549
Information on the operation of the Public Reference Room may be obtained
by calling the Commission at 1-800-SEC-0330. Copies of the fund’s Form N-Q
also may be obtained, upon payment of a duplicating fee, by electronic request
at the following e-mail address: publicinfo@sec.gov or by writing the Public Reference Section at the above address.
FURTHER INFORMATION
From time to time, MFS may post important information about the fund or the MFS funds on the MFS web site (mfs.com). This information is available by visiting the “News & Commentary” section of mfs.com or by clicking on the fund’s name under “Closed-End Funds” in the “Products” section of mfs.com.
48

CONTACT US
TRANSFER AGENT, REGISTRAR, AND
DIVIDEND DISBURSING AGENT
CALL
1-800-637-2304
9 a.m. to 5 p.m. Eastern time
WRITE
Computershare Trust Company, N.A.
P.O. Box 43078
Providence, RI 02940-3078
New York Stock Exchange Symbol: CMK
During the period covered by this report, the Registrant has not amended any provision in its Code of Ethics (the “Code”) that relates to an element of the Code’s definitions enumerated in paragraph (b) of Item 2 of this Form N-CSR. During the period covered by this report, the Registrant did not grant a waiver, including an implicit waiver, from any provision of the Code.
| ITEM 3. | AUDIT COMMITTEE FINANCIAL EXPERT. |
Not applicable for semi-annual reports.
| ITEM 4. | PRINCIPAL ACCOUNTANT FEES AND SERVICES. |
Not applicable for semi-annual reports.
| ITEM 5. | AUDIT COMMITTEE OF LISTED REGISTRANTS. |
Not applicable for semi-annual reports.
| ITEM 6. | SCHEDULE OF INVESTMENTS. |
A schedule of investments for each series of the Registrant is included as part of the report to shareholders of such series under Item 1 of this Form N-CSR.
| ITEM 7. | DISCLOSURE OF PROXY VOTING POLICIES AND PROCEDURES FOR CLOSED-END MANAGEMENT INVESTMENT COMPANIES. |
Not applicable for semi-annual reports.
| ITEM 8. | PORTFOLIO MANAGERS OF CLOSED-END MANAGEMENT INVESTMENT COMPANIES. |
There were no changes during this period.
| ITEM 9. | PURCHASES OF EQUITY SECURITIES BY CLOSED-END MANAGEMENT INVESTMENT COMPANY AND AFFILIATED PURCHASERS. |
| | | | | | | | |
| MFS InterMarket Income Trust |
Period | | (a) Total number
of Shares
Purchased | | (b) Average
Price
Paid per
Share | | (c) Total
Number of
Shares
Purchased as
Part of Publicly
Announced
Plans or
Programs | | (d) Maximum
Number (or
Approximate
Dollar Value) of
Shares that May
Yet Be Purchased
under the Plans
or Programs |
12/01/12-12/31/12 | | 0 | | N/A | | 0 | | 1,084,250 |
1/01/13-1/31/13 | �� | 0 | | N/A | | 0 | | 1,084,250 |
2/01/13-2/28/13 | | 0 | | N/A | | 0 | | 1,084,250 |
3/01/13-3/31/13 | | 0 | | N/A | | 0 | | 1,084,250 |
4/01/13-4/30/13 | | 0 | | N/A | | 0 | | 1,084,250 |
5/01/13-5/31/13 | | 0 | | N/A | | 0 | | 1,084,250 |
| | | | | | | | |
Total | | 0 | | | | 0 | | |
| | | | | | | | |
Note: The Board of Trustees approves procedures to repurchase shares annually. The notification to shareholders of the program is part of the semi-annual and annual reports sent to shareholders. These annual programs begin on March 1st of each year. The programs conform to the conditions of Rule 10b-18 of the Securities Exchange Act of 1934 and limit the aggregate number of shares that may be purchased in each annual period (March 1 through the following February 28) to 10% of the Registrant’s outstanding shares as of the first day of the plan year (March 1). The aggregate number of shares available for purchase for the March 1, 2013 plan year is 1,084,250.
| ITEM 10. | SUBMISSION OF MATTERS TO A VOTE OF SECURITY HOLDERS. |
There were no material changes to the procedures by which shareholders may send recommendations to the Board for nominees to the Registrant’s Board since the Registrant last provided disclosure as to such procedures in response to the requirements of Item 407 (c)(2)(iv) of Regulation S-K or this Item.
| ITEM 11. | CONTROLS AND PROCEDURES. |
| (a) | Based upon their evaluation of the registrant’s disclosure controls and procedures (as defined in Rule 30a-3(c) under the Investment Company Act of 1940 (the “Act”)) as conducted within 90 days of the filing date of this Form N-CSR, the registrant’s principal financial officer and principal executive officer have concluded that those disclosure controls and procedures provide reasonable assurance that the material information required to be disclosed by the registrant on this report is recorded, processed, summarized and reported within the time periods specified in the Securities and Exchange Commission’s rules and forms. |
| (b) | There were no changes in the registrant’s internal controls over financial reporting (as defined in Rule 30a-3(d) under the Act) that occurred during the second fiscal quarter covered by the report that has materially affected, or is reasonably likely to materially affect, the registrant’s internal control over financial reporting. |
| (a) | File the exhibits listed below as part of this form. Letter or number the exhibits in the sequence indicated. |
| | (1) | Any code of ethics, or amendment thereto, that is the subject of the disclosure required by Item 2, to the extent that the registrant intends to satisfy the Item 2 requirements through filing of an exhibit. |
| | (2) | A separate certification for each principal executive officer and principal financial officer of the registrant as required by Rule 30a-2(a) under the Act (17 CFR 270.30a-2): Attached hereto. |
| (b) | If the report is filed under Section 13(a) or 15(d) of the Exchange Act, provide the certifications required by Rule 30a-2(b) under the Act (17 CFR 270.30a-2(b)), Rule 13a-14(b) or Rule 15d-14(b) under the Exchange Act (17 CFR 240.13a-14(b) or 240.15d-14(b)) and Section 1350 of Chapter 63 of Title 18 of the United States Code (18 U.S.C. 1350) as an exhibit. A certification furnished pursuant to this paragraph will not be deemed “filed” for the purposes of Section 18 of the Exchange Act (15 U.S.C. 78r), or otherwise subject to the liability of that section. Such certification will not be deemed to be incorporated by reference into any filing under the Securities Act of 1933 or the Exchange Act, except to the extent that the registrant specifically incorporates it by reference: Attached hereto. |
Notice
A copy of the Agreement and Declaration of Trust, as amended, of the Registrant is on file with the Secretary of State of the Commonwealth of Massachusetts and notice is hereby given that this instrument is executed on behalf of the Registrant by an officer of the Registrant as an officer and not individually and the obligations of or arising out of this instrument are not binding upon any of the Trustees or shareholders individually, but are binding only upon the assets and property of the respective constituent series of the Registrant.
SIGNATURES
Pursuant to the requirements of the Securities Exchange Act of 1934 and the Investment Company Act of 1940, the registrant has duly caused this report to be signed on its behalf by the undersigned, thereunto duly authorized.
Registrant MFS INTERMARKET INCOME TRUST I
| | |
| By (Signature and Title)* | | JOHN M. CORCORAN |
| | John M. Corcoran, President |
Date: July 17, 2013
Pursuant to the requirements of the Securities Exchange Act of 1934 and the Investment Company Act of 1940, this report has been signed below by the following persons on behalf of the registrant and in the capacities and on the dates indicated.
| | |
| By (Signature and Title)* | | JOHN M. CORCORAN |
| | John M. Corcoran, President (Principal Executive Officer) |
Date: July 17, 2013
| | |
| By (Signature and Title)* | | DAVID L. DILORENZO |
| | David L. DiLorenzo, Treasurer (Principal Financial Officer and Accounting Officer) |
Date: July 17, 2013
| * | Print name and title of each signing officer under his or her signature. |