Back to Contents
This report (“Annual Report”) comprises the annual report of Cable and Wireless plc in accordance with United Kingdom requirements. and, in substantial part, the Company’s Annual Report on Form 20-F in accordance with the requirements of the United States Securities and Exchange Commission (“SEC”). The 2005 Annual Review is published as a separate document.
It should be noted that the Company restated its 2004 Form 20-F filing to include amendments to certain figures included in the US GAAP Reconciliation of its Form 20-F originally filed on 21 June 2004. As such, only the amended 2004 form 20-F filed on 28 July 2005 will include figures for 2004 that are completely consistent with the historic figures shown in the US GAAP Reconciliation in this 2005 filing.
Unless otherwise stated in this Annual Report the terms “Cable & Wireless”, the “Group”, “it”, “we”, “us” and “our” refer to Cable and Wireless plc and its subsidaries, collectively. The term “Company” refers to Cable and Wireless plc.
Cable & Wireless prepares its financial information in accordance with UK Generally Accepted Accounting Principles (“UK GAAP”). Unless otherwise indicated, any reference in this report to Financial Statements is to the Financial Statements of Cable & Wireless (including the Notes to the financial statements) included in this report. UK GAAP differs from generally accepted accounting principles in the United States (“US GAAP”). The material differences between UK GAAP and US GAAP relevant to Cable & Wireless are explained on pages 144 to 152.
Cable & Wireless publishes its Financial Statements in pounds sterling (“£”). On 31 March 2005, the noon buying rate in New York City for cable transfers in pounds sterling as certified for customs purposes by the Federal Reserve Bank of New York was US$1.89 = £1. On 26 August 2005 the noon buying rate was US$1.81 = £1. For additional information on exchange rates between pounds sterling and the US dollar see exchange rates on page 156.
References to a year in this report are, unless otherwise indicated, references to the Company’s financial year ending 31 March of such year. In this report, financial and statistical information is, unless otherwise indicated, stated on the basis of the Group’s financial year.
This document is dated 20 September 2005 including the Legal proceedings section at pages 93 to 95. Note 33 to the Financial statements for the year ended 31 March 2005 discusses legal proceedings also but has not been updated to reflect most recent developments given that the Financial statements are dated 3 June 2005.
This document includes terms which may be specific to the industry, the Group or UK GAAP. A Glossary of terms is included on pages 162 to 165 to explain and define such terms or to give the US GAAP equivalent, as appropriate.
2 2005 Annual Report
Back to Contents
| | | |
| | | |
| | | Profile |
| | | | | |
| | | | | |
| | | 4 | | About us and highlights |
| | | 5 | | Chairman’s statement |
| | | 7 | | Chief Executive’s review |
| | | | | |
| | | Business overview |
| | | | | |
| | | 11 | | Introduction |
| | | 12 | | Geographic operations |
| | | 18 | | Services |
| | | 20 | | Regulatory framework |
| | | 23 | | History and development |
| | | | | of Cable & Wireless |
| | | | | |
| | | | | |
| | | | | |
| | | | | |
| | | | | |
| | | | | |
| | | | | |
| | | | | |
| | | | | |
| | | | | |
| | | | | |
| | | | | |
| | | | | |
| | | | | |
| | | | | |
| | | | | |
| | | | | |
Back to Contents
About usand highlights
About us
Cable & Wireless is the leading telecoms operator in the majority of countries in which it operates. It is the second largest fixed network telecoms operator in the UK.
Its principal operations are in the UK, the Caribbean, Panama, Macau and Monaco. It provides voice, data, broadband, internet protocol (“IP”) and mobile services to business and residential customers, fixed and mobile telecoms carriers, mobile operators and content, application and internet providers.
Its extensive international network conveys traffic between these operations and provides a platform from which to offer telecommunication services to other carriers.
Highlights
Cable & Wireless completed the second year of its turnaround programme with a robust financial performance and further progress in reshaping the Group. Key developments included:
| – | restructuring of UK operations around customer segments; |
| – | acquisition of Bulldog Communications and a controlling interest in Monaco Telecom; |
| – | expansion of National Telcos’ broadband and mobile activities; |
| – | completion of US exit for £220 million and withdrawal from Japanese domestic market; and |
We achieved further cost savings in the traditional legacy voice and data sectors. Led by a strengthened management team, we accelerated investment to position the Group for profitable growth in new services. Shortly after the year end, we announced a three-year plan to develop an IP-based Next Generation Network in the UK and confirmed that Bulldog had completed the first phase of its local loop unbundling programme ahead of schedule. In National Telcos, we have continued to invest in our broadband and mobile infrastructure.
| | Profit before tax and exceptionals
(continuing operations):a |
| | – | up 13 per cent to £361 million |
| | | |
| | Earnings per share (total Group): |
| | – | 13.0 pence per share |
| | | |
| | Full year dividend: |
| | – | up 21 per cent to 3.8 pence |
| | | |
| | a | This is a non-UK GAAP financial measure which is used by management as a key performance measure. A reconciliation is set out on page 87. |
Back to Contents
Chairman’s statement
Richard Lapthorne Chairman |
| | | |
| | – | Turnaround programme on track |
| | | |
| | – | Revenue from continuing operations stable at constant currency |
| | | |
| | – | Initiated £190 million investment in Next Generation Networks |
| | | |
| | – | Targeted National Telcos investment in broadband, IP and mobile |
The past 12 months have been a time of transition as Cable & Wireless entered a new phase in the three-year programme to revive the Group. By the end of the year, the Chief Executive and his new team were no longer preoccupied with the Group’s past, and had turned confidently to face the future.
A year of transition
Over the past year, management has delivered on the promises it made in June 2003. We completed our exit from the US market at considerably lower cost than originally expected. This allowed the Chief Executive to concentrate on the restructuring of our UK business and on defining a path to a sustainable position in this market. An enormous amount of work has gone into improving operations and tightening cost controls in the legacy businesses. Customer focus has been central to our new structures.
We are also seeing some excellent groundwork in network development. A prime example is our investment in Bulldog, the UK broadband operator we acquired last May. Bulldog gives us network access across the “last mile” to the customer, enabling us to offer an end-to-end service in competition with BT. Building our customer base in this way is an important goal as we embark upon investment of £190 million over three years in our UK IP-based Next Generation Network. This new technology offers network economies that will benefit our customers and improve our margins. In this context, we welcome Ofcom’s vision of a UK telecommunications market based on realistic and sustainable competition among players willing to invest in future technological strength.
Our financial disciplines and continued cost reduction have created a stable framework so that Cable & Wireless can move forward. Since November, a corporate reorganisation has refocused our activities on the key customer segments at the heart of our business. We are now well-placed to exploit rising global demand for broadband, IP and mobile services across the whole market, from large multinational corporations to residential users.
Outside the UK, our National Telcos have become more aggressive in dealing with competition. Co-operation and communication have also improved between our operations, so that these businesses can benefit from each others’ experiences of the rapidly liberalising telecom landscape. We are successfully capitalising on the controlling stake in Monaco Telecom acquired a year ago, and will take opportunities to expand our footprint into new geographies as appropriate.
The exit from the US and disposal of our Japanese business kept our cash intact, which allowed us, in November 2004, to launch a £250 million share buyback. As at March 2005 we had bought back 60.5 million shares, at an average price of 124.4 pence.
Back to Contents
Chairman’s statement
| Results and dividend | |
| The 2005 financial performance demonstrates our progress. Profit before taxation and exceptional items for continuing operations, for the year ended 31 March 2005, was £361 million. Revenue from continuing operations at £3,023 million, was stable at constant currency compared to 2004. | |
| | |
| The Board has recommended a full year dividend of 3.8 pence per share, after paying 1.16 pence per share at the interim stage. This represents a 21 per cent increase in the total dividend, indicating our confidence in the Group. | |
| | |
| The Board | |
| The Board was strengthened during the year. In July, George Battersby joined the executive team as Group Human Resources Director and in December, Harris Jones was appointed as Executive Director, International Businesses. We also appointed three new Non-executive Directors, Kate Nealon, Agnès Touraine and Clive Butler. Their combined experience has significantly broadened the skills of our Board as we undertake the next stage of the Group’s transformation. Kevin Loosemore resigned from the Board on 1 December 2004 and left Cable & Wireless at the end of the financial year, we would like to thank him for his contributions. Dr Janet Morgan retired from the Board in July 2004 having served 16 years during which time her contribution has been considerable, and for which we thank her. | |
| | |
| On page 36, our senior Non-executive Director reports on the four key aspects of good corporate governance. I am pleased to report that Cable & Wireless continues to operate governance to high standards. | |
| | |
| Our team | |
| Cost-cutting and corporate reorganisation has inevitably been unsettling for staff, and I want to thank our management and employees for meeting the challenges so far with resilience and determination. Their contribution has enabled us to strengthen our business for the future. | |
| | |
| Looking ahead | |
| Our markets continue to suffer from excess capacity and severe price competition. Performance improvement will come from efficiencies and cost-cutting, and a shift in our sales mix towards broadband, IP and mobile. We are in a unique position to help our customers embrace these new technologies and I look forward with confidence to the year ahead. | |
| | |
| Richard Lapthorne | |
| Chairman | |
Back to Contents
Chief Executive’s review
Francesco Caio Chief Executive Officer |
| | | |
| | | Focusing on margin |
| | | and investing in profitable growth |
| | | |
| | | |
| | | |
| | | |
| | | |
| We have defined a clear path for our business based around key trends in customer demand and the rapid shift in technology. It is key to our success to manage margins in traditional services and to be able to invest for profitable growth in new services. |
| | |
| In 2005 we made solid progress in strengthening Cable & Wireless’ competitive position: |
| | |
| – | we have focused the Group on markets where we have a relevant presence and can develop and maintain a sustainable position; |
| | |
| – | we completed the US exit and the sale of our domestic business in Japan; |
| | |
| – | we committed to invest £190 million over three years in a UK Next Generation Network to increase competitiveness and enhance financial performance; |
| | |
| – | we focused National Telcos to compete in the growth areas of mobile and broadband and continue to reduce costs; |
| | |
| – | we reshaped our UK business into four customer-focused segments, Enterprise, Business, Carrier Services and Bulldog, each led by experienced telecom professionals; and |
| | |
| – | in May 2005 we completed the first phase of Bulldog’s unbundling programme to cover 30 per cent of UK households, just a year after acquisition. |
| | |
| We streamlined central management and relocated our head office to Bracknell, reflecting our reduced cost base and a culture where the centre drives performance across the Group. Worldwide we are a leaner organisation, in line with our aim to be the lowest cost provider in all our markets. |
| | |
| Industry context |
| The telecoms industry is experiencing profound structural changes. There are common challenges and opportunities across the Group that have shaped our strategic priorities. Revenues from traditional services continue to decline, so we must protect margins by further forcing down costs. At the same time, we are pursuing growth. As new broadband, IP and mobile services replace legacy services we are investing to win customers in these highly competitive growth areas. |
| | |
| UK Group |
| Our UK operations are focused around the customer segments of Enterprise, Business and Carrier Services. At present, 67 per cent of our revenues in the UK are generated by switched voice services, however, we have adopted targeted strategies for each customer segment as they migrate to new technologies. These customers are also supported by our operations in Europe, Asia, and the US. |
Back to Contents
Chief Executive’s review
Enterprise
Enterprise provides integrated telecommunication services to large corporations and central government departments. The convergence of voice, data and internet access on IP-based services is reshaping the way many businesses operate. Migrating to IP offers lower costs and more sophisticated services, such as video-streaming, multi-party conferencing and remote access into corporate IT systems.
Enterprise won a number of new contracts with major customers. Although our current revenue is still generated primarily by traditional services – which are subject to continued decline – we have made solid gains in winning IP business, which now accounts for 13 per cent of Enterprise turnover.
Cable & Wireless has the network and the capabilities to support our biggest customers as they make the transition to new generation, IP-based technologies.
Business
Business addresses a market that includes a wide range of customers. In the last year we have focused on the top end of the segment and saw new business wins with Damovo, easyJet, Lothian Health Board and Littlewoods. Overall, however, revenue was reduced by severe competition. Pressure on revenues in legacy services has been higher than in Enterprise reflecting the fact that, as many customers only buy switched voice, they have higher price sensitivity and propensity to switch.
Take-up of IP is growing among our small business customers. We are developing a new portfolio of packaged and bundled products such as Intelligent Voice and Straight Talk. The services, including IP, are being designed for ease of implementation and use.
Carrier Services
Cable & Wireless has worldwide coverage across 200 countries and is one of the world’s largest carriers of international voice and data. Carrier Services generates 45 per cent of UK revenue and operates in a highly competitive market that continues to suffer from over-capacity and declining margins, although these have been partially offset by increased volumes. Our innovative customer solutions have won notable contracts. We now enable the Post Office to provide a fixed phone line service, and won an international termination deal with Skype, the Voice over IP (“VoIP”) operator for which we now transport around 100 million minutes a year. This year we will expand our services to international customers by offering wholesale VoIP. By taking a Group-wide view of network assets, Carrier Services aims to improve utilisation of our international network.
| | We continue to develop new services for mobile carriers and launched MMX, a platform to exchange pictures and multimedia messages developed with Vodafone. We operate one of the largest Global 3G roaming exchanges and support email roaming for a third of the world’s mobile networks. We also launched our Global Carrier multi-protocol label switching (“MPLS”) service, which can transmit any type of traffic in IP format, including time-sensitive and business-critical information and we have already signed up eight significant carriers.
Revenue declined following a fall in mobile termination rates, imposed on all carriers in the UK by Ofcom, but had no impact on profits. In Europe we downsized and refocused on the demands of a customer base of fewer, larger clients.
Bulldog
The acquisition in May 2004 of Bulldog, the broadband operator, was an important step in advancing our UK access strategy. Local loop unbundling (“LLU”) strengthens our presence in the valuable access network, while Bulldog’s appeal to the residential and small/home office market (the so-called SoHos) broadens our UK customer base. This additional traffic increases use of the existing core network and can, in future, migrate very simply to our Next Generation Network.
Through LLU, Bulldog puts its own equipment inside BT’s local exchanges to take control of the “last mile” copper link (the “local loop”) into the customer’s home or office. Access to this last mile improves our end-to-end control of the network resulting in lower outpayments to BT and, hence, higher gross margins. It also allows us to innovate, differentiate and control the end-to-end quality of our services to business and residential customers.
LLU enables Cable & Wireless to redefine its position in the telecom industry away from the alternative network model. We have the capability, the core network, and the funding to exploit unbundling. LLU enables us to make the most of these advantages to differentiate our business from our competitors.
Our unbundling programme has made rapid progress. We reached our initial target of 400 exchanges in May 2005, seven months ahead of the original timetable. The Bulldog team, under its new Chief Executive, is now progressing with plans to extend its UK coverage and intends to unbundle an additional 200 exchanges by March 2006 and a further 200 exchanges in the first half of 2006/07 bringing the total number of exchanges unbundled to 800. This will increase planned investment and start-up losses in 2005/06. |
Back to Contents
Bulldog’s dual super-fast 4Mbps broadband and voice telephony offer attracted early customer enthusiasm in the residential and SoHo markets and we quickly followed this with the release of 8Mbps across all 400 exchanges. As the roll-out progresses we have supported it with a broader commercial marketing programme. With the largest non-incumbent telecom network in the UK, our new end-to-end infrastructure has offered customers a real choice of total fixed voice and broadband provider for the first time.
Bulldog has similar characteristics to a start-up in the early days of mobile; it is marketing led, innovative, and offers customers a fast, convenient, good value service. For clarity of management and transparency, we are therefore reporting the results of Bulldog separately in our segmental analysis.
Next Generation Networks and Operations
In all our markets, we are an infrastructure-based competitor. Control of our own network is a key source of competitive advantage through which we can provide high-quality, cost-effective innovative services. The creation last year of an integrated management structure for network systems and operations has enabled us to enhance quality of service, identify investment priorities, reduce hand-offs and target cost reductions.
We have carried out a review of our existing UK network, and launched a programme to address operating costs, interconnection costs and loading. The first phase of this programme will cut costs by £50 million in 2006 enabling us to mitigate, to some extent, the continuing effects of price pressure.
The network review also demonstrated the significant benefits of moving to an IP-based Next Generation Network architecture, and the associated IT systems and processes. In April we announced investment of £190 million over three years to transform our core UK network into a single integrated IP platform, carrying voice, data and internet services.
This decision was driven by the shift in demand in all customer segments towards IP-based products, and the rapid advance in IP technologies. The development of new services will be supported by Bulldog’s expanding broadband access network, which will feed traffic into the IP core. We expect our new IP architecture to be in place by the end of 2008.
A large proportion of the anticipated £190 million capital expenditure on our Next Generation Network will replace expenditure that would otherwise have been needed to maintain our legacy system, leaving a net increase in planned investment over the three years of £35 million.
| | Over the next three years UK voice and data traffic will continue to migrate to IP. Cable & Wireless has the scale to lead this transformation. Our infrastructure size, combined with the efficiency of putting all traffic onto a single IP-based core network, will deliver significant economies. Our Next Generation Network will offer customers greater functionality and customised solutions, at an attractive price. The benefit for Cable & Wireless will be lower operating and maintenance costs, and a more flexible network that can accommodate significant growth in traffic at a much lower capital cost, offering the potential to achieve a higher margin.
Ofcom
The regulatory framework is fundamental to our business and our investment decisions. The strategic review by Ofcom, the telecom and media regulator, provides an opportunity to create a more transparent and effective regulatory regime in areas where BT still controls access to customers. The promised level playing field must become a reality. Establishing the appropriate structure and processes to obtain equality of access to BT’s local loop assets will enable the market to take the lead in setting prices for products and services where there is already competition.
We are encouraged by Ofcom’s emphasis on infrastructure-based competition. We are also pleased that the regulator has adopted the principle of equivalence as the tool to deliver parity in the market. Successfully implemented, this would require BT to offer regulated products to competitors at exactly the same price and quality of service as it does to BT’s own businesses. There should be no discrimination between non-BT customers and BT’s own operations when purchasing products such as wholesale broadband capacity and call origination. Our recent experience has shown considerable room for improvement in, for example, BT’s co-operation over local loop unbundling.
It is critical that equivalence is designed into BT’s planned 21st Century Network so that new barriers to entry are not created by BT’s migration to next generation systems. Fair infrastructure-based competition must be at the heart of the UK telecoms market if customers are to benefit from the variety of services that new technologies can offer and the UK is to recapture its pre-eminent position as a business location. |
Back to Contents
Chief Executive’s review
National Telcos
Cable & Wireless is the market leader in integrated fixed, broadband and mobile services in 34 countries. Our National Telcos have delivered solid results in the context of an increasingly liberalised environment. As at 31 March 2005 88 per cent of our National Telco revenues were generated by companies operating in liberalised markets although not all of these are yet fully competitive. Revenues increased by 10 per cent due to good performances in Panama and Rest of the World and the acquisition of Monaco Telecom. Mobile revenues grew by 26 per cent and data and IP revenues grew by 13 per cent year on year. (All revenue changes are expressed at constant currency.)
Our new leadership team aims to take advantage of the National Telcos’ breadth of operations. We believe that this increased cross-business co-operation, and sharing of knowledge and expertise across our geographies, will continue to sharpen performance.
Our National Telcos’ markets are at different stages of liberalisation. Each has its own customer profile but the competitive challenges they face are similar, and so must be the response:
| | |
| – | reducing the costs of legacy services, where margins are under pressure; |
| | |
| – | investing further in the key growth services of broadband, IP and mobile; and |
| | |
| – | developing sales and marketing skills to stay ahead of the competition. |
In broadband and IP we are leaders in most of our markets and are investing to meet growing demand. Many of the countries in which we operate still have relatively low take-up of broadband and IP services, and we are well positioned to offer services that assist customers in the transition. We have started to invest in IP backbones in countries where traffic volumes justify the expenditure, including in the Caribbean where hurricane damage has accelerated infrastructure replacement. Upgrades are underway in Monaco, Macau, the Cayman Islands and Grenada.
Across all the National Telcos, we have established tight financial discipline and control over investment. This has sharpened our focus on initiatives that produce results. We intend to expand broadband and mobile services and this strategy will determine our investment decisions. The future
Over the last two years we have created a more focused and streamlined platform, better equipped to face the challenges and opportunities from the rapidly transforming telecommunications industry.
Our markets will remain very challenging, but I believe that we can build on our early achievements. In the UK, our reorganisation will sharpen our customer focus and strengthen our competitive position. The investment in Bulldog and our Next Generation Network will further distinguish us from other UK operators. In our overseas businesses, we will strive to maintain profitable market leadership.
Francesco Caio
Chief Executive Officer
Back to Contents
Business overview
Introduction
Cable & Wireless is a leading international telecommunications company with principal operations in the United Kingdom, the Caribbean, Panama, Macau and Monaco. Cable & Wireless provides voice, data, internet protocol (“IP”) and mobile services to business and residential customers as well as to fixed and mobile telecommunications operators and content, application and internet providers.
Business overview
Cable & Wireless’ strategy is to exploit growing demand for broadband, IP and mobile services in markets where it can achieve significant scale. As a result, Cable & Wireless intends to be the number one or two operator in the principal markets in which it operates. To continue to achieve this as the telecommunications industry faces unprecedented changes in customer behaviour, technology and market structure, the Group must protect margins by reducing costs whilst accelerating investment to position itself for profitable growth in new services.
During the past two years, Cable & Wireless has pursued this strategy, exiting markets where it did not have a relevant position, reshaping its operations, investing for growth and streamlining the central office.
Exit from US and Japan
In 2005, the Group completed its exit from the United States and Japan, two markets where it did not have sufficient scale to sustain a competitive position. To exit the US, the Group agreed, at the request of the purchaser, to sell its business through a Chapter 11 process under the United States Bankruptcy Code. In Japan, the Group conducted a competitive auction process culminating in the sale of the Group’s Japanese subsidiary.
Reshaping the UK business
Following its review in 2004 of the dynamics of the UK market, the Group restructured its United Kingdom operations and in April 2005 announced a three-year plan to develop an IP-based Next Generation Network. In addition, the Group acquired Bulldog Communications Ltd (“Bulldog”) in May 2004, a UK-based broadband provider specialising in local loop unbundling (“LLU”). Through Bulldog and its investment in a Next Generation Network, Cable & Wireless is in the process of redefining its position in the UK telecom industry, moving away from the alternative network model. To effect this move, the UK is now structured around the following key customer segments:
| – | the Enterprise segment comprising businesses and institutions with the biggest telecoms spend in the UK. Cable & Wireless’ objective in Enterprise is to be the partner of choice in transitioning customers to new generation, IP-based technologies; |
| | |
| – | the Business segment, comprising small and medium-sized companies. Cable & Wireless aims to be a credible, strong supplier to small and medium-sized customers through targeted sales of bundled products, including IP services; |
| – | the Carrier Services segment comprising large telecoms companies that provide long distance international voice services; mobile operators buying international voice and transport services; and operators, including resellers and ISPs. Cable & Wireless’ objective in Carrier Services is to leverage the depth of its intercontinental network and advanced services to position the Group as the backbone of choice for mobile and other operators. In November 2004, management commenced a restructuring of its European operations to focus principally on Carrier Services; |
| | |
| – | the SoHo/consumer segment which Cable & Wireless addresses through Bulldog. Bulldog provides high speed data and voice services in the UK via LLU. |
The Group’s remaining operations in the United States, Europe and Asia provide international services to UK-based Enterprise and Carrier Services customers.
Relocation of Group Head Office
Consistent with the steps taken to reshape and re-focus Cable & Wireless, the Group has relocated its head office from central London. This move has combined corporate and UK functions and has resulted in a shift towards a more customer oriented, responsive culture.
National Telcos
Almost all the 34 national markets in which the National Telcos operate are now fully or partially liberalised and present very similar competitive challenges. For this reason Cable & Wireless’ strategy across the National Telcos is based on three principles: invest in key growth services of broadband, IP and mobile; lower costs on legacy services where margins are under pressure and develop sales and marketing skills.
In line with these principles, Cable & Wireless acquired Monaco Telecom in June 2004. Monaco Telecom is a fully integrated telecommunications company.
In addition, the Group completed the roll out of its GSM network across the National Telcos, improving coverage and services to residential and business customers across 22 businesses. The Group also launched proactive marketing initiatives to increase broadband penetration across the National Telcos.
Going forward, the Group aims to take advantage of the National Telcos’ breadth of operations, increasing cross-business cooperation and sharing knowledge and expertise across the National Telcos geographies to continue to improve performance.
Back to Contents
Business overview
Geographic operations
Cable & Wireless Group
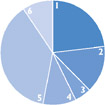
Cable & Wireless 2005 Turnover by geography
(Continuing operations)
Total turnover: £3,023 million
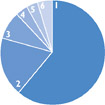 |
1. United Kingdom
2. Caribbean
3. Panama
4. Macau
5. Monaco
6. Rest of the World |
Cable & Wireless has principal operations in the United Kingdom, the Caribbean, Panama, Macau and Monaco. The Group’s operations are managed and reported on a country-based structure.
The Caribbean, Panama, Macau, Monaco and Rest of the World are collectively referred to as the National Telcos. For a discussion of Cable & Wireless’ turnover by geographic operation for the past three years, see Operating and financial review – Group turnover.
United Kingdom
United Kingdom 2005 Turnover by customer segment
Total turnover: £1,602 million
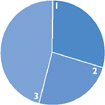 |
1. Enterprise
2. Business
3. Carrier services |
Cable & Wireless is the largest fixed voice telecommunications service provider in the United Kingdom after BT, the incumbent telecom operator.
The UK operation is structured around three key customer segments known as Enterprise, Business and Carrier Services. Additionally, the SoHo/Consumer customer segment is served through Bulldog. The UK sells voice and data services over fixed line networks using legacy and IP platforms.
The UK uses the United States (“CWAO”), Europe and Asia to provide services to UK-based Enterprise and Carrier Services customers with international service requirements. For this reason, the United States, Europe and Asia operations are managed from the UK and organised around the three relevant customer segments. This section discusses the customer segments in the UK and
provides an outline of the operations that support the UK, the United States, Europe and Asia. For a discussion on Bulldog and on the United States, Europe and Asia see page 13.
UK Enterprise (2005 Turnover: £475 million)
Cable & Wireless defines Enterprise customers as large national and international organisations where significant customisation of their telecommunications services is required. Enterprise customers purchase voice and data telecommunications services.
Enterprise customers typically buy telecommunications services from a variety of suppliers, although many have a longer-term relationship with a primary supplier. Enterprise customers often require interconnection between multiple sites, so deep network reach is important. As a result, Cable & Wireless generally competes against other operators with large networks. Price pressure continues to be significant in this market.
Cable & Wireless’ objective in the Enterprise market is to become the partner of choice for companies as they transition from voice and data services delivered over legacy platforms to new voice, data and integrated services delivered over IP-based platforms. Currently, fixed voice represents 54 per cent of total turnover for Enterprise customers in the UK.
Cable & Wireless addresses the needs of its UK-based Enterprise customers for international services through its presence in the United States, Europe and Asia.
UK Business (2005 Turnover: £394 million)
Cable & Wireless defines business customers as mid-sized companies who purchase voice and data services over legacy and IP-based platforms through direct or indirect sales channels. Often, Business customers are regional entities with one or a small number of sites. Cable & Wireless aims to serve these customers through standardised service offerings. This market attracts competition from operators with both large and relatively small networks.
Currently, fixed voice represents 39 per cent of total turnover for Business customers in the UK. Customers in the Business market are more easily able to switch providers, resulting in significant price pressure and high levels of churn across all services delivered over legacy platforms, particularly fixed voice services. The key area of growth in this market is voice, data and integrated services delivered over IP-based platforms. These platforms allow customers to access enhanced features such as voice, video and data provided through a single cost-effective platform.
UK Carrier Services (2005 Turnover: £733 million)
Cable & Wireless defines Carrier Services customers as large national and international telecommunications operators or resellers who purchase wholesale services mainly focusing on voice and data services delivered over legacy platforms.
Back to Contents
Carrier Services provide fixed voice and data services to the following types of customers:
| – | large international telecommunications operators, who buy fixed long distance and international fixed voice services; |
| | |
| – | national mobile operators, who buy both international voice and data transport/backbone services to allow them to connect their radio networks via the fixed infrastructure. To serve mobile operators in their migration to new “3G” networks, we have launched services that support international data roaming; |
| | |
| – | regional and domestic telecommunications operators to whom we sell fixed voice and data services; |
| | |
| – | virtual telecommunications operators and resellers, who purchase voice services using Carrier Pre-Select (“CPS”). CPS allows consumer calls to be automatically connected from the incumbent operator network to the network of a competing operator. Virtual operators purchase CPS services from Cable & Wireless and re-sell them under their own brands to residential customers; and |
| | |
| – | Internet Service Providers (“ISP”), who buy data and internet transport services. |
Currently, fixed voice represents 91 per cent of total UK Carrier Services turnover. The Carrier Services market is highly competitive and price sensitive. As a result, significant price declines have been seen in all key service areas.
Driven by the requirements of its Carrier Services customers, Cable & Wireless leverages its presence in the United States, Europe and Asia as well as the National Telcos to provide voice and data services internationally.
SoHo/Consumer (Bulldog)
2005 Total turnover: £11 million
In May 2004 Cable & Wireless acquired 100 per cent of Bulldog in order to capture the growth opportunity in broadband, leverage the Cable & Wireless backbone network and expand the Group’s IP network.
Bulldog provides IP services by way of broadband internet access to SoHo and residential customers. Bulldog uses full LLU to connect directly to customers, providing voice telephony and high speed internet access services independent of the incumbent operator.
Full LLU refers to the process by which providers, such as Bulldog install their own Digital Subscriber Line (“DSL”) equipment in rented space within an incumbent operator’s local exchanges. DSL technology allows Bulldog to deliver broadband capabilities to customers over ordinary copper telephone lines.
The ability to deliver IP services using its own network provides Bulldog with technological advantages over competitors reselling the incumbent’s products. This allows Bulldog to differentiate its service offerings, maintain full bandwidth control and own the customer from end-to-end.
In September 2004, Cable & Wireless announced the initial LLU plan for Bulldog including the target to unbundle 400 exchanges by December 2005. Bulldog had completed LLU on 252 exchanges as at 31 March 2005 and completed LLU on 400 exchanges in May 2005.
Cable & Wireless believes LLU is more than an opportunity to offer fast internet access. LLU can also provide a cost effective platform from which Cable & Wireless can launch a wide range of new and existing telecom services from voice to video.
United States (“CWAO”)
2005 Total turnover: £16 million
Cable & Wireless operates in the United States through its subsidiary Cable & Wireless Americas Operations, Inc. (“CWAO”).
CWAO operates a small, efficient and predominantly international network. The business provides US connectivity for data and IP services to Enterprise customers principally those based in the UK.
Europe
2005 Total turnover: £186 million
Cable & Wireless’ operations in continental Europe are in Germany, France, Spain and Italy, together with smaller operations in Russia, Belgium, The Netherlands, Switzerland and Sweden.
The continental European operations are focused on Carrier Services, and also support UK Enterprise customers. Carrier Services represents over 80 per cent of turnover in continental Europe. The main Carrier Services customers are mobile operators and other telecommunications operators.
Asia
2005 Total turnover: £39 million
Cable & Wireless’ operations in Asia span Australia, China, Hong Kong, India, Japan and Singapore and focus on Carrier Services and Enterprise segments. The Group’s network of 33 nodes in 13 countries provides a footprint across the entire region.
Following the disposal of the Group’s domestic business in Japan in February 2005, the Asia operations have been focused on serving Enterprise customers that require IP and managed data services to and from Asia (principally those based in the UK) and Carrier Services customers in Asia that require voice, IP and data services to the rest of the world.
Back to Contents
Business overview
Geographic operations
National Telcos
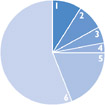
National Telcos 2005 Turnover by service
Total turnover: £1,191 million
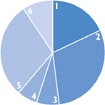 |
1. International Voice
2. Domestic Voice
3. Data
4. IP
5. Mobile
6. Other |
In the National Telcos, Cable & Wireless typically operates the domestic fixed line telecom network and associated international interconnect facilities. Its fixed and mobile voice, data and IP services meet the needs of corporate and residential customers, including the fast-growing demand for internet access through dial-up IP and broadband ADSL connections.
Almost all the 34 markets in which Cable & Wireless operates are fully or partially liberalised. The principal exception is Monaco Telecom which has an exclusive concession to operate international, domestic, data and mobile services until 2023. As competition has intensified across the National Telcos, Cable & Wireless has transformed its organisation, taking on its new competition by investing in innovation, such as GSM networks, managing and reducing costs, and marketing proactively.
Caribbean
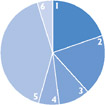
Caribbean 2005 Turnover by service
Total turnover: £550 million
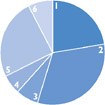 |
1. International Voice
2. Domestic Voice
3. Data
4. IP
5. Mobile
6. Other |
Overview
Cable & Wireless operates in 16 Caribbean countries providing domestic and international voice, data and IP services to residential and business customers. The Caribbean’s principal businesses are subsidiary operations in Jamaica, Barbados, and the Cayman Islands and an equity holding in Trinidad and Tobago.
In nearly all the Caribbean countries in which it operates, Cable & Wireless is the incumbent operator, providing domestic and international fixed and mobile voice and data services and IP
services. Liberalisation is at an advanced stage across the Caribbean with nearly all markets either fully liberalised or in transition to competitive markets. Further discussion on liberalisation is in Regulatory framework.
In response to growing competition and to customer demand, Cable & Wireless is increasingly focused on developing and enhancing its mobile and IP service offerings, whilst retaining its position in fixed voice services.
In order to develop and enhance mobile services in the Caribbean, Cable & Wireless continued its expansion of GSM mobile services to reach all 13 of the countries in which Cable & Wireless holds mobile licences. Cable & Wireless continues to enhance network coverage, capacity and roaming capabilities, enabling the launch of new products and services, including mobile email, prepaid pan-Caribbean roaming and mobile messaging services (“MMS”).
At 31 March 2005, there were over 900 GSM equipped sites in the Caribbean with land mass coverage on most islands between 65 per cent and 99 per cent. During the year, Cable & Wireless total mobile subscribers in these countries increased from 1,141,000 to 1,367,000.
During 2005, Cable & Wireless expanded its broadband capabilities across the Caribbean. Sales and marketing activities have been focused on the rebranding of broadband services. Investment has been focused on increasing the number of fixed lines enabled to deliver broadband service, average prices have been reduced and line speeds increased. DSL customers at 31 March 2005 were approximately 38,000, an increase of over 125 per cent from 31 March 2004.
In the Caribbean countries where Cable & Wireless provides domestic voice services, customers at 31 March 2005 totalled 735,000, an overall decrease of approximately 12 per cent in the year. This reduction is a result of customers substituting mobile services for fixed line services.
Jamaica
Cable & Wireless Jamaica Limited (“Cable & Wireless Jamaica”), a subsidiary of Cable & Wireless, is the incumbent operator and is the largest of Cable & Wireless’ Caribbean operations (by turnover) generating 37 per cent of the Caribbean’s turnover in 2005. Cable & Wireless Jamaica is the largest telecommunications company in Jamaica.
Cable & Wireless Jamaica provides domestic and international fixed and mobile voice and data services and IP services to residential and business customers.
The Jamaican market has been liberalising since March 2000. In addition to Cable & Wireless Jamaica, there are currently two active competitors in the mobile sector, 10 active ISPs (out of a total of 76 licensed parties), 32 licensed data service providers and two competitors in the domestic voice sector. The international carrier
Back to Contents
market has been liberalised since March 2003 and now comprises 68 licensed carriers, of which six are active and interconnect with Cable & Wireless Jamaica. Nine ISPs offer internet services to end customers over Cable & Wireless’ network.
Barbados
Cable & Wireless (Barbados) Limited (“Cable & Wireless Barbados”), a subsidiary of Cable & Wireless, is the incumbent operator and provides domestic and international fixed and mobile voice and data services and IP services to residential and business customers. Cable & Wireless Barbados generated 18 per cent of the Caribbean’s turnover in 2005. Cable & Wireless Barbados is the largest telecommunications company in Barbados.
The Barbados domestic fixed and mobile voice markets have been liberalising since August 2003, while liberalisation in the data and IP market has been longstanding. The domestic voice telecommunications market is now fully liberalised with three licensed operators, none of which were active at 31 March 2005. International services were liberalised in February 2005 with two licences issued and both operators active in the market using their own international facilities. Three mobile licences have been issued to competitors in Barbados and two are currently active in the market. Seven ISPs offer internet services to end customers over Cable & Wireless’ network.
Cayman Islands
Cable and Wireless (Cayman Islands) Limited (“Cable & Wireless Cayman Islands”), a wholly owned subsidiary of Cable & Wireless, is the incumbent operator and provides domestic and international fixed and mobile voice and data services and IP services to residential and business customers in the Cayman Islands. Cable & Wireless Cayman Islands generated 11 per cent of the Caribbean’s turnover in 2005. Cable & Wireless Cayman Islands is the largest telecommunications company in the Cayman Islands.
The Cayman Islands market was fully liberalised in early 2004. At 31 March 2005, 18 new entrants have been licensed in various telecommunications, broadcasting and other communication market sectors. Most licensees have multiple licences. In addition to Cable & Wireless Cayman Islands, there are currently two active competitors in the mobile sector (out of the six licensed); two active ISPs; three active fixed-wireless providers; and one active reseller of telephony services.
Trinidad and Tobago
Telecommunications Services of Trinidad and Tobago Limited (“TSTT”), a 49 per cent equity investment of Cable & Wireless, is the incumbent operator and provides domestic and international fixed and mobile voice and data services and IP services to residential and business customers. TSTT is the largest telecommunications company in Trinidad and Tobago.
The process of liberalisation is under way in the Trinidad and Tobago market although no additional licences have been issued. TSTT and Cable & Wireless are in negotiations with the government of
Trinidad and Tobago to ensure an orderly liberalisation.
Panama
Panama 2005 Turnover by service
Total turnover: £257 million
 |
1. International Voice
2. Domestic Voice
3. Data
4. IP
5. Mobile
6. Other |
Cable & Wireless Panama S.A. (“Cable & Wireless Panama”), a subsidiary of Cable & Wireless, is the incumbent operator and provides domestic and international voice, data and IP services to residential and business customers in Panama. Cable & Wireless Panama is the largest telecommunications company in Panama.
The telecoms market in Panama has been liberalising since 2003. International and domestic fixed line services are now fully liberalised, whilst Cable & Wireless Panama operates in a duopoly in the mobile market (with Telefonica) until 2008. Competition in fixed line voice services is concentrated in international and long distance services with 56 and 32 operators licensed in each segment, respectively. IP services have been liberalised for many years with 84 licensees.
In light of the increased competition and in line with customer demand Cable & Wireless Panama continues to focus on the development of its mobile and IP capabilities as well as maintaining high standards in customer service and retaining its market leading position in fixed line services.
In the year to March 2005, Cable & Wireless Panama continued its investment in GSM services to enable an expansion of capacity in order to meet the increase in demand for its services. Total mobile customers increased to 634,000 at 31 March 2005, an increase of 25 per cent over the prior year.
Cable & Wireless Panama has also invested in DSL services in the year. This investment has enabled the launch of a range of bundled IP solutions for business as well as an increase in access for residential customers. At the 31 March 2005, DSL customer numbers were 38,000 an increase of over 123 per cent in the year.
During the year to March 2005, Cable & Wireless Panama has continued to focus on retaining its market leading position in fixed line. Activities have focused on customer service improvement and customer retention. Fixed line customers in Panama have increased from 360,000 at 31 March 2004 to 383,000 at 31 March 2005.
Back to Contents
Business overview
Geographic operations
Macau
Macau 2005 Turnover by service
Total turnover: £117 million
 |
1. International Voice
2. Domestic Voice
3. Data
4. IP
5. Mobile
6. Other |
Companhia de Telecomunicações de Macau S.A.R.L. (“CTM”), a subsidiary of Cable & Wireless, is the incumbent operator in Macau offering international and domestic fixed and mobile voice and data and IP services to business and residential customers. In addition, CTM provides an international transit service through its nodes in Hong Kong and Singapore serving national and international carriers. CTM is the largest telecommunications company in Macau.
CTM is the exclusive provider of domestic fixed voice services in Macau, with the licence expiring in 2011. The remaining market segments are fully liberalised with active competition in most sectors from local and international operators.
In the mobile market Macau has issued two further licences for GSM technology and one other licence for CDMA technology.
The internet market was liberalised in October 2000. CTM is the leading provider with only one competitor in the dial-up internet access market, at present there is no active competition in the broadband DSL access market.
In response to changes in the competitive environment and customer demand, CTM continues to focus on enhancing its fixed line voice and data services whilst further developing capabilities in mobile and IP services.
The Macau government is considering the issue of a Third Generation Wireless (“3G”) licence. Licensing procedures for 3G are expected to be announced in the fourth quarter of calendar 2005.
Monaco Telecom
Monaco Telecom 2005 Turnover by service
Total turnover £100 million (9.5 months)
 |
1. International Voice
2. Domestic Voice
3. Data
4. IP
5. Mobile
6. Other |
Monaco Telecom S.A.M. (“Monaco Telecom”), a subsidiary of Cable & Wireless, was acquired on 18 June 2004. Monaco Telecom was created in 1997 following the privatisation of the incumbent operator. Monaco Telecom provides fixed and mobile voice and data services as well as IP services. It holds an exclusive licence to provide domestic and international fixed and mobile voice services, internet access and cable services in Monaco until 2023.
The focus within Monaco is on the quality of service while maintaining pricing parity with neighbouring countries. Outside Monaco, it is developing its international activities in network management and satellite services.
The primary growth opportunities within Monaco are focused on mobile and DSL. Since acquisition, mobile subscribers have increased 21 per cent to 35,000. During the same period, the DSL lines have increased 17 per cent to 7,500.
Monaco Telecom is also focused on maintaining its fixed turnover contribution from fixed to mobile substitution by creating value added services, customer service improvements, and high value product bundles. In addition, Monaco Telecom intends to leverage its wide portfolio of telecommunication services in the Principality by offering convergent communication services and billing.
Outside the Principality, Monaco Telecom has provided network services to a mobile network in Kosovo under a management contract since 2000. At the beginning of 2003, Monaco Telecom was awarded the second GSM licence in Afghanistan as the strategic partner in a consortium 51 per cent owned by the Aga Khan Fund for Economic Development. These contracts are included in Other turnover for financial reporting purposes.
Back to Contents
Rest of the World
Rest of the World 2005 Turnover by service
Total turnover: £167 million
 |
1. International Voice
2. Domestic Voice
3. Data
4. IP
5. Mobile
6. Other |
Overview
Rest of the World comprises Cable & Wireless’ subsidiary operations in Guernsey and the Maldives together with smaller operations in the Seychelles, Bermuda, Sakhalin in Russia, Diego Garcia, Falkland Islands, Fiji, Ascension, St Helena, Vanuatu, Solomon Islands, Jersey and the Isle of Man. Cable & Wireless also has an associate holding in Bahrain. Guernsey and the Maldives account for 60 per cent of the Rest of the World turnover.
In the geographies where Cable & Wireless operates, it is typically the incumbent operator, providing domestic and international fixed and mobile voice and data services as well as IP services. The status of liberalisation across the Rest of the World is varied. Most businesses however are currently in transition to liberalised markets. Further details on the liberalisation status of the Rest of the World can be found in the regulatory section on page 22.
Guernsey
Cable & Wireless operates in Guernsey through its wholly owned subsidiary Cable and Wireless Guernsey Ltd (“Cable & Wireless Guernsey”). Cable & Wireless Guernsey is the incumbent operator in Guernsey providing domestic and international fixed and mobile voice and data services and IP services to all residential, business and government customers.
The States of Guernsey liberalised the market in 2002.
At 31 March 2005, in addition to Cable & Wireless Guernsey, there were two competitors for domestic and international voice and one competitor for mobile.
Maldives
Cable & Wireless operates in the Maldives through its subsidiary Dhivehi Raajjeyge Gulhun Private Limited (“Dhiraagu”). Dhiraagu is the incumbent operator and provides domestic and international voice and mobile services and IP services to residential and business customers.
The Maldives began liberalisation in 2002. At 31 March 2005, in addition to Dhiraagu, there was one competitor in the IP market and one licence issued in the mobile market with competition expected to begin in the next fiscal year.
Bahrain
Cable & Wireless operates in Bahrain through its associate Bahrain Telecommunications Company B.S.C. (“Batelco”). Batelco provides domestic and international fixed and mobile voice and data and IP services to residential and business customers.
In Bahrain, competition in domestic mobile, in the form of MTC Vodafone, was introduced in 2003. Internet services were liberalised on a similar timeframe. In the summer of 2004 the market for international services and facilities was liberalised. In the second half of 2004 a licence to provide national fixed line services was put up for sale but as yet no additional licences have been awarded, resulting in Batelco currently being the only licence holder for the provision of domestic fixed line services and IP.
Back to Contents
Business overview
Services
Cable & Wireless 2005 Turnover by service
(Continuing operations)
Total turnover: £3,023 million
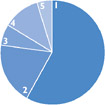 |
1. Voice
2. Data
3. IP
4. Mobile
5. Other |
Cable & Wireless provides voice, data, and IP services to business and residential customers across the world. The Group delivers these services over fixed line and mobile networks. The majority of services are delivered over traditional legacy platforms, with a small but growing proportion being delivered over IP-based platforms.
The term legacy platform generally refers to the existing communications and transmission infrastructure that underpins most telecom operator networks across the world that were deployed up until the late 1990’s. Each family of service delivered over legacy technology generally requires a proprietary platform to deliver service, resulting in multiple overlapping telecommunication networks.
The term internet protocol (“IP”) generally refers to a set of protocols or rules that govern how interconnected devices communicate. IP-based devices share data in ‘packets,’ or discrete bundles of data. IP networks allow the delivery of voice, video and data over the same network, allowing simplification of network design and operation, and supporting the delivery of new integrated services.
Historically, in many operations, Cable & Wireless was the incumbent operator, focusing on voice and data services over fixed lines on legacy platforms. Today, most markets in which Cable & Wireless operates have liberalised. New voice and data services delivered over mobile and IP networks are growing and over time, replacing services on our fixed line networks.
New IP-based platforms allow Cable & Wireless to deliver new types of integrated service that blur the old boundaries between voice and data/fixed and mobile and deliver seamless integrated communications to end users.
Voice services
Fixed voice
Cable & Wireless offers domestic and international voice services to residential, corporate and other telecommunication companies and service providers. In the UK, Cable & Wireless also provides services to non-telecommunication companies who provide residential telephony, but do not have their own network infrastructure.
The majority of fixed voice turnover is delivered over legacy platforms, using traditional copper telephone lines and switch networks.
Cable & Wireless also offers IP-based voice services, such as voice over IP (“VoIP”). These services can provide enhanced end user functionality (for example, providing better integration between customers’ own voice and data networks) at reduced cost.
Mobile voice
Cable & Wireless offers domestic and international mobile voice services to residential and business customers outside the United Kingdom. Cable & Wireless delivers voice services to mobile handsets through wireless technologies such as GSM.
Global system for mobile communications (“GSM”) is a standard for digital mobile telephone transmissions that allows global roaming and enhanced features for data transmission as compared with time division multiple access (“TDMA”) networks. Because of the increased turnover potential associated with GSM technologies, Cable & Wireless has been expanding its GSM networks throughout the National Telcos in recent years.
Data services
Fixed data
Cable & Wireless offers data services to businesses that operate over fixed-line networks using legacy platforms, including leased line services, and networking services based on Frame Relay and asynchronous transfer mode (“ATM”) technology.
Leased line services predominantly utilise a technology known as synchronous digital hierarchy (“SDH”) to deliver data from point-to-point.
Frame Relay and ATM services provide an additional layer of intelligence and functionality beyond leased lines, allowing customers to build and manage complex networks across multiple locations and to prioritise traffic flows through their network.
Cable & Wireless also offers ‘next generation’ data services, such as IP virtual private networks (“IP-VPN”) and internet services that are delivered over IP-based networks.
IP-VPN allows customers to replace traditional private data networks with virtual private networks (“VPN”) which can reduce the expense and complexity of private networks, while providing enhanced services such as the bundling of voice, video and data.
Back to Contents
Mobile data
Cable & Wireless offers a range of data services for its mobile customers utilising SMS and MMS based technologies.
IP Services
Cable & Wireless provides customised services to many of its large corporate customers. Typically, these involve the development of integrated voice, data transmission and/or data storage solutions that are uniquely configured for individual customers.
Increasingly, these service solutions are offered using IP-based platforms and technologies and include voice services such as VoIP and data services such as IP-VPN.
IP access solutions provide security services (such as managed firewalls), intrusion detection, scanning and analysis (such as email virus protection), and authentication and encryption services to control access into customers’ networks.
IP contact centres enable our customers to manage all contact with their customers including incoming and outbound calls, emails or web contact requests.
Bulldog and the National Telcos provide broadband services that include voice and internet access as well as dial-up narrowband internet access, that allow business and residential customers to access the internet from their business or home.
Back to Contents
Business overview
Regulatory framework
Cable & Wireless, like other international telecommunication providers around the world, faces various regulatory and market access constraints in various countries resulting from laws, public policies and licensing requirements. This reflects the perception of telecommunications as a public service, a history of special or exclusive rights to provide services and often, a move towards liberalisation. Generally, specialist telecommunications regulation is administered through enforcement of conditions contained in ‘authorisations’ or in operating and service licences held by the Group and its subsidiaries.
Most of the markets in which Cable & Wireless operates are fully liberalised although some are in transition to competitive markets, and a few small geographies are expected to remain monopolies for the foreseeable future. Where countries have moved to competitive environments, Cable & Wireless has actively engaged with governments in order to facilitate an orderly transition to a fully competitive environment. The discussions involve negotiating fair regulatory arrangements that provide for equal treatment during the transitional period and beyond.
In all jurisdictions where it operates, Cable & Wireless is required to comply with regulations that affect its business. The Group believes it complies in all material respects with all material regulatory obligations and where regulatory compliance issues emerge it takes action to ensure compliance.
Licensing
Cable & Wireless provides international and domestic telecommunications services under general authorisation regimes or licences in the jurisdictions in which it operates. These licences are either held by Cable & Wireless itself or by local operating entities owned either wholly or partly, directly or indirectly, by Cable & Wireless.
The Group believes it has all licences material to the running of its business. It is possible that from time to time, as further products and services are deployed or changed, additional licences or authorisations will be required. Where the Group identifies the need for further licences or authorisations, it intends to acquire such licences. The terms of the Group’s licences vary, although most remain in effect for a fixed period of 10 to 25 years, or for an indefinite period subject to notice of termination after a specified minimum period. Licence fees are sometimes required, either as a fixed annual fee or a fee equal to a percentage of the revenue or profits arising from the licence.
In 2003 the European Union established a harmonised framework for licensing laid out under the electronic communications directives. This has been transposed into national law by most of the member states. As a result these member states will no longer issue individual telecommunications licences to companies except in exceptional circumstances such as the allocation of spectrum. Therefore, for Cable & Wireless, most of the telecommunications licences it holds in EU member states, including those in the UK, have been revoked and replaced by the relevant general authorisations under the new
regulatory regime. Cable & Wireless will continue to offer telecommunications services subject to obligations set forth in general conditions as dictated by the relevant electronic communications directive and individual member states.
Outside the European Union, Cable & Wireless operates in Guernsey, the Isle of Man, Monaco, Norway, Russia and Switzerland with relevant licences and authorisations.
Some licences provide that, upon their termination, the relevant government may purchase, or have the option to purchase, the property, plant and equipment of the licensee in that territory at a fair market value. In some cases, where the Group owns an operating company jointly with government, that government has the right to purchase, at specified times, the whole or part of the Group’s shareholding in the operating company.
The international trend is for telecommunications liberalisation and the replacement of exclusive licences with non-exclusive licences alongside rules governing competition between operators. Jurisdictions that currently support monopoly provision may also decide to promote competition, and Cable & Wireless anticipates that some existing exclusive licences will not be renewed on an exclusive basis, or that governments will seek to withdraw their exclusivity before the licence expires, replacing the current operating licence with a non-exclusive licence.
The Group is committed to participating in discussions on the introduction of competition in any territory where its government wishes to do so.
There is no guarantee that an agreement to provide either a monopoly or franchised service will remain in effect for the full term of the agreement.
Regulation by jurisdiction
The regulatory institutions and policies of the jurisdictions in which the Group operates are varied.
Europe
The regulatory framework in member states of the European Union is harmonised by EU directives, though there are divergences in regulatory policy and practice between member states. Many member states have implemented, or are implementing, the directives of the European Union 2003 electronic communications package. This package seeks to harmonise telecommunications across the European Union, and involves the concept of Significant Market Power to determine which operators should have prior obligations placed on them, on the grounds that such operators might exploit that market position to the detriment of competition and therefore consumers. This speed of adoption of the electronic communications package varies significantly across the EU and this can affect the ability of the non-incumbents to compete.
Back to Contents
United Kingdom
The telecommunications market in the United Kingdom is governed by the EU communications package (described above) which has been transposed into national law by the Communications Act 2003 (“UK Comms Act”). The UK Comms Act sets the framework for the regulation of telecommunications and broadcasting markets as well as the civilian use of spectrum in the United Kingdom. Insofar as it applies to telecommunications markets, it updates the Telecommunications Act 1984 and transposes the EU electronic communications directives into UK law. It also lays out the powers and duties of the industry regulator, the Office of Communications (“Ofcom”).
Following reviews by Ofcom, BT has been designated as having Significant Market Power in a number of markets. BT is therefore required to provide cost-based interconnection for switched voice services and leased line access circuits (Partial Private Circuits) to providers of public electronic communications networks such as Cable & Wireless on non-discriminatory terms. Such services are subject to network charge controls. The network charge controls applying to BT are in the process of being reviewed. It is not yet clear what form the new controls will take given that over the likely four-year period of the next cap BT will be migrating from legacy to next generation networks.
Following the review of wholesale International Direct Dial (“IDD”) markets, Cable & Wireless has a designation of Significant Market Power on wholesale IDD routes from the United Kingdom to four destinations: Ascension, Diego Garcia, Montserrat and Turks & Caicos. The obligations associated with this designation are minimal.
In addition, in common with all other providers of fixed public voice networks in the United Kingdom, Cable & Wireless has been designated as having Significant Market Power (“SMP”) in the markets for geographic call termination on the UK network. As this designation has been applied to all operators, obligations are likely to be minimal and the Group expects that there will be little or no impact.
In early 2004, Ofcom undertook a Strategic Review of the UK Telecommunications market. This review is nearly complete, with Ofcom now consulting on its decision to accept BT’s voluntary undertakings in lieu of a reference to the Competition Commission pursuant to Section 154 of the Enterprise Act 2002.
BT’s undertakings offer to provide a number of existing regulated products on an Equivalence of Inputs (“EoI”) basis. This means that BT’s own business and other communications providers (such as Cable & Wireless) would be supplied with the same product, at the same price, using the same operational processes and systems. Where products are provided on an EoI basis, other communications providers would be in a position to compete more effectively with BT than today. The timetable for implementation of the Strategic Review recommendations is scheduled to continue to 2010.
BT has committed to provide products delivered over its Next Generation Network that are in markets where BT has been designated with SMP on an EoI basis. This is subject to some restrictions where provision of those products on an EoI basis would not be reasonably practical.
In addition, BT has committed to set up an Access Services Division under separate management, which would control and operate the local access network separately from other network assets.
BT’s undertakings, if accepted by Ofcom, would become legally binding, with breaches enforced through the High Court.
In those markets where BT has been designated with SMP and is subject to regulatory obligations, the designation and obligations will continue to remain in force subject to the standard process for removal of such obligations.
The Caribbean
Cable & Wireless has businesses in 16 countries in the Caribbean. Whilst in the past Cable & Wireless was exclusively licensed in the majority of these territories, nearly all are now either fully liberalised or are in transition to competitive markets. Cable & Wireless is engaged in ongoing dialogues with host governments and regulators to ensure that the regulatory environment is fair and consistent.
The regulatory frameworks in which the most significant Cable & Wireless Caribbean businesses operate are described in this section.
Cable & Wireless Jamaica operates in a fully liberalised market, regulated by the Office of Utilities Regulation.
Cable & Wireless Barbados is now operating in a fully liberalised market since the issuance of international licences to competitors in February 2005. The regulatory authority for fixed telecommunications in Barbados is the Fair Trading Commission. The Ministry of Industry and International Business regulates mobile telecommunications.
Cable & Wireless Cayman Islands operates in a fully liberalised market. Cable & Wireless Cayman Islands is subject to the regulation of the Information and Communications Technology Authority. Five member states of the Organisation of Eastern Caribbean States (Dominica, Grenada, St Kitts and Nevis, St Lucia, St Vincent and the Grenadines) are contracted in a single jurisdiction for telecommunications regulation with a regional regulator, the Eastern Caribbean Telecoms Authority (“ECTEL”), and are also subject to the jurisdiction of national regulators, the National Telecoms Regulatory Committees. Telecommunications markets in the ECTEL states are fully liberalised.
Japan
Following the sale of Cable & Wireless IDC Inc., Cable & Wireless UK applied for its own telecommunications registration with the Japanese Ministry of Internal Affairs and Communications. Cable & Wireless UK (Japan branch) was registered in September 2004 and
Back to Contents
Business overview
Regulatory framework
is authorised to provide certain telecommunications services in Japan including international and domestic data services, IP access and leased circuits.
The separation of telecommunication business licences between Type I (facilities) and Type II (services) was abolished in 2004. Telecommunication licences now are classified as notified or registered telecommunication licences.
United States
Cable & Wireless Americas Operations, Inc. provides international communications services to customers who require service to, from or through the United States. Under US law, the Federal Communications Commission (“FCC”) regulate interstate and international telecommunications services while state commissions regulate intrastate services. Non-dominant service providers such as CWAO are subject to a lesser degree of regulation than designated dominant service providers. CWAO also provides information services, which generally are not regulated in the United States.
The regulated telecommunications services provided by CWAO may be classified as either common carrier or private carrier services depending upon the nature of the service offering. As a general matter, US law requires that common carrier services be offered (a) upon reasonable request, (b) on rates, terms and classifications which are just and reasonable, (c) without unjust discrimination or undue preferences basis, and (d) pursuant to authorisation of the FCC. Private carriers generally are not subject to these requirements, but are required to make contributions to the federal universal service fund based on international and interstate telecommunications revenues, in the same manner as common carriers. Intrastate telecommunications services are subject to regulation by the relevant state public utility commission and may be subject to licensing requirements, tariffs, and/or subsidy mechanisms.
Other markets
Cable & Wireless Panama operates in a partially liberalised market. The regulator is Ente Regulador De Los Servicios Publicos. Cable & Wireless Panama is a full service provider across fixed line and mobile markets for business and residential customers. There has been increasing regulatory activity on the broadband front in 2005 with wholesale broadband services already being available and plans in place to introduce local loop unbundling. In the area of mobile the regulator has recently sought to introduce indirect access over mobile.
CTM has an exclusive concession agreement to provide fixed national and international services until 2011, however, a review will be undertaken in 2006 to determine the way forward in 2011. Mobile and IP services were liberalised in 2001. CTM is subject to the regulation of the Office for the Development of Telecommunications and Information Technology.
Cable & Wireless acquired Monaco Telecom in June 2004 with exclusive rights to provide fixed line, mobile, IP and cable services in Monaco. Monaco Telecom is regulated by the Direction de Telecommunications de Monaco, which is within the Ministry of State of the Principality of Monaco.
Batelco, a Cable & Wireless associate company in which Cable & Wireless has a holding of 20 per cent, operates in Bahrain where the market has been liberalised since July 2003. The Telecommunications Regulatory Authority regulates Batelco.
Cable & Wireless has smaller operations and interests in other countries, which are at varying stages of liberalisation.
Back to Contents
Business overview
History and development of Cable & Wireless
Cable & Wireless is an international telecommunications business with customers in some 80 countries. Its principal operations are in the United Kingdom, the Caribbean, Panama, Macau and Monaco. Cable & Wireless provides voice, data, and IP services to business and residential customers and wholesale services to fixed and mobile telecommunications operators, and content, application and internet providers.
For 130 years, Cable & Wireless has provided telecommunications services, networks and equipment to customers around the world. Except for 34 years as a state-owned company after the Second World War, Cable and Wireless plc has been incorporated in England and Wales as a public limited company.
Historically, in many of our operations, Cable & Wireless was the sole telecommunications provider (‘incumbent’ operator), focusing on switched voice and data services delivered over traditional phone lines (‘legacy’ platforms). Today, most markets in which Cable & Wireless operates have opened to competition (‘liberalised’) and market trends are moving away from these legacy platforms, toward new services delivered over IP networks.
Recent events
On 9 September 2005, Cable & Wireless announced that it intends to terminate its American Depository Receipt (“ADR”) programme on 13 December 2005 and to delist voluntarily from the New York Stock Exchange. ADR holders will be able to exchange their ADRs for Ordinary Shares in accordance with the timetable set out in the announcement as available on the Company’s website.
Following consumer issues in July and August, on 31 August 2005, the UK regulator Ofcom opened an investigation into Bulldog which will consider whether Bulldog contravened either General Condition 11.1, which prohibits Communications Providers from billing customers for services that have not beeen provided, or General Condition 14.2, which requires Communications Providers to establish and maintain complaints-handling procedures that conform to a Code of Practice. Cable & Wireless does not anticipate the outcome of this investigation will have a material effect on the results of the Group.
On 17 August 2005, Cable & Wireless announced that its subsidiary Great Eastern Telecommunications Limited (“GET”) signed a conditional agreement for the sale of its entire shareholding in MobileOne Limited (“M1”) representing approximately 12.1% of the issued and paid up capital of M1, for a total consideration of S$260.8 million (£87 million) of which S$133 million (£44.4 million) relates to Cable & Wireless’ 51% holding in GET.
Completion is conditional upon the purchaser obtaining approval for the acquisition of the stake in M1 from The Infocomm Development Authority of Singapore, which is anticipated by the end of September.
On 16 August 2005, Cable & Wireless announced an agreement to acquire 100% of the issued share capital of Chelys Limited
(“Energis”) on a debt and cash free basis save for Energis’ £37 million of finance lease obligations, for an initial cash consideration of £594 million. In addition, Cable & Wireless has agreed to pay contingent consideration of up to £80 million in the third year after completion. Completion of the acquisition is subject to Office of Fair Trading approval.
The contingent consideration will be paid in either cash or Cable & Wireless shares at the option of Cable & Wireless and will be determined by the level of Cable & Wireless’ share price in the third year after completion. On completion of the acquisition, Cable & Wireless may inject up to £35 million in cash to meet Energis’ short-term working capital needs.
Energis reports under UK GAAP and therefore the information available to prepare the following forward looking information is in accordance with UK GAAP. The combined entity will report under IFRS for fiscal year 2006. As a result, the forward looking information presented may differ on an IFRS basis.
The combination of Cable & Wireless’ UK operation and Energis is expected to enable total annual synergies of approximately £55 million in 2007 (£40 million operating cost and £15 million capital expenditure) rising to £80 million in 2008 (£55 million operating cost and £25 million capital expenditure) and to reduce headcount by around 700 by March 2008.
The expected capital expenditure synergies were determined on the basis that the two legacy networks would not be integrated but that the single NGN platform, being developed by Cable & Wireless, would serve the customer base of the combined business. The full potential of synergy benefits will be realised with completion of NGN in 2009.
One-off costs to realise the synergy benefits are expected to be between £75 million and £100 million over three years.
In 2005, Energis had revenue of £720 million and gross assets of £670 million. Cable & Wireless expects the performance of the Group in the second half of the 2005/06 financial year to be impacted by the transaction in the following ways:
| – | Elimination of the inter-company trading between the Group and Energis of approximately £10 million; |
| | |
| – | A reduction in combined UK earnings before interest, tax, depreciation and amortisation of approximately £5 million, due to the potential loss of certain dual sourcing reseller customers, likely retail customer terminations, initial disruption on order intake due to short-term uncertainty during integration together with a planned review of unprofitable commercial contracts following completion; |
| |
| – | Realisation of estimated capital expenditure synergies of £15 million; |
Back to Contents
Business overview
History and development of Cable & Wireless
| – | Integration charges of £40 million; and |
| | |
| – | A reduction in depreciation of Energis’ fixed assets of approximately £5 million to £10 million, subject to review following completion. |
Although Cable & Wireless continues to implement the previously announced cost reduction programmes, the integration of Energis is expected to delay some of the benefits of these initiatives. For this reason, savings in the UK and corporate are expected to be reduced by £15 million in the second half of the year.
As at 31 March 2005, Cable & Wireless had completed £75 million of its £250 million share repurchase programme, outlined in November 2004. Following the Energis acquisition the programme will remain in place but is unlikely to be used in the short term.
On completion of the Energis acquisition, John Pluthero will be appointed Executive Director UK Business and will join the Board of Cable & Wireless. He will be responsible for the combined UK operations of Cable & Wireless and Energis, excluding Bulldog Communications.
On 13 July 2005, Cable & Wireless announced the sale of its 61.4% interest in closed joint stock company Sakhalin Telecom Mobile (“STM”) and its participation interest of 60% in the limited liability company joint venture Sakhalin Telecom Limited (“ST”) to open joint stock company Vimpel-Communications for total consideration of £25 million (US$44 million), £23.8 million (US$41.8 million) of which was cash and £1.2 million (US$2.2 million) of which was a loan to be repaid within 70 days of completion.
On 17 February 2005, Cable & Wireless sold its Japanese domestic business, Cable & Wireless IDC Inc. (“IDC”) to Softbank Corp, for a consideration of £71.7 million comprising £62.3 million of cash and the assumption by Softbank of debt of £9.4 million. Results for IDC are included in discontinued operations.
On 28 January 2005, Cable & Wireless sold its 3.4 per cent stake in Intelsat (the satellite communications company) for cash consideration of £56 million (US$104.8 million).
On 18 June 2004, Cable & Wireless acquired 55 per cent of Monaco Telecom S.A.M. (“Monaco Telecom”), a Monaco based telecommunication service provider from Vivendi Universal, for a total consideration of £108 million (€162 million).
Simultaneously with the acquisition, Cable & Wireless transferred legal ownership of six per cent of the shares of Monaco Telecom to Compagnie Monegasque de Banque S.A.M. (“CMB”), an unrelated third party. Cable & Wireless contractually retained voting and economic rights in the shares as part of the arrangement. In addition, the six per cent interest is subject to certain put and call options that, together with the retained voting and economic rights, provide full management control of Monaco Telecom to Cable & Wireless.
Cable & Wireless has also entered into a shareholders’ agreement with the Principality of Monaco, which contains, among other provisions, a prohibition on either Cable & Wireless or the Principality (subject to certain limited exceptions) selling their shares in Monaco Telecom for five years, mutual pre-emption rights on transfer of shares and certain other limited rights in favour of the Principality. The Principality has a put option entitling it to put its 45 per cent shareholding in Monaco Telecom to Cable & Wireless at certain times after 1 January 2008. The exercise price under the put option is fair market value, taking into account the nature of the minority stake in Monaco Telecom.
Results for Monaco Telecom are discussed separately in the Operating and financial review.
On 28 May 2004, Cable & Wireless acquired 100 per cent of Bulldog Communications Limited (“Bulldog”), a company specialising in providing residential and business broadband services over its own network in the UK, for a consideration of £18.6 million. Results for Bulldog are discussed separately in the Operating and financial review.
In June 2003, Cable & Wireless announced that it planned to withdraw from the US domestic market. At the request of the purchaser of the Group’s US assets, certain of the Group’s US subsidiaries (Cable & Wireless Internet Services, Inc. and Cable & Wireless USA, Inc., collectively referred to as “CWA”) filed for Chapter 11 bankruptcy protection under the US Bankruptcy Code.
As a result of the subsequent auction process, on 23 January 2004, SAVVIS Communications Corporation (“SAVVIS”) entered into an agreement with CWA for SAVVIS to acquire substantially all of the assets of CWA for a sum of US$155 million in cash and approximately US$12.4 million of assumed liabilities.
In order to provide US connectivity for data and IP services to Cable & Wireless’ multinational customers based in the United Kingdom and other regions, Cable & Wireless continues to operate in the United States through its subsidiary Cable & Wireless Americas Operations, Inc. (“CWAO”).
On 13 July 2004, as part of the ongoing bankruptcy process to which CWA is subject, the US Bankruptcy Court confirmed a bankruptcy Plan of Liquidation (the “Liquidation Plan”) which provided for the transfer of the assets remaining in the bankruptcy estate to a liquidating trust for the benefit of creditors, named the Omega Liquidating Trust. The Omega Liquidating Trust’s operating committee includes a representative of Cable and Wireless plc. The Omega Liquidating Trust is in the process of determining final claim amounts and distributing the assets of the bankruptcy estate to the creditors. The process is expected to continue through 2006 and possibly beyond.
Back to Contents
Also, on 13 July 2004, as part of the Plan of Reorganisation (“Reorganisation Plan”), the US Bankruptcy Court approved a Global Settlement Agreement between Cable and Wireless plc and certain of its affiliates (collectively referred to as the “Named Participants”), CWA and the committee of unsecured creditors. Pursuant to the Global Settlement Agreement, as implemented by the Reorganisation Plan, the Named Participants agreed to reduce certain of their claims against CWA in exchange for releases from any liability from CWA and to assign a portion of the distributions to which they would otherwise be entitled in respect of their remaining claims to individual unsecured creditors who would grant the Named Participants individual releases for any claims they might have against them. More than 90 per cent in value of the unsecured claimants agreed to provide the release to the Named Participants. Under the asset purchase agreement with SAVVIS (completed on 8 March 2004 following SAVVIS’ success in the Chapter 11 based auction process for CWA assets), the Named Participants agreed to remain contingently liable until 5 September 2007 (subject to the earlier occurrence of certain events) for up to approximately US$104 million of guarantees and letters of credit in favour of CWA landlords, which SAVVIS has agreed in the asset purchase agreements to reimburse in the event of a call for payment. SAVVIS has also agreed to replace the Named Participants’ guarantees and letters of credit with direct SAVVIS guarantees and letters of credit by 23 July 2007.
Organisational structure
Cable & Wireless is a consolidated group of companies comprising subsidiaries, associates and joint ventures around the world. The companies listed below represent the largest of these:
| | |
|---|
|
| | | | Country of
incorporation | | Ownership
interest
per cent | |
| | | | | | | |
| | Subsidiarya | | | | | |
| | Bulldog Communications Limited | | England | | 100 | |
| | Cable & Wireless | | | | | |
| | Americas Operations, Inc. | | USA | | 100 | |
| | Cable & Wireless | | | | | |
| | (Barbados) Limited | | Barbados | | 81 | |
| | Cable and Wireless | | | | | |
| | (Cayman Islands) Limited | | Cayman Islands | | 100 | |
| | Cable and Wireless Guernsey Ltd | | Guernsey | | 100 | |
| | Cable & Wireless Jamaica Limited | | Jamaica | | 82 | |
| | Cable & Wireless Panama, S.A. | | Panama | | 49 | |
| | Cable & Wireless UK | | England | | 100 | |
| | Companhia de Telecomunicacoes | | | | | |
| | de Macau, S.A.R.L. | | Macau | | 51 | |
| | Dhivehi Raajjeyge Gulhun Private Limited | | Maldives | | 45 | |
| | Monaco Telecom S.A.M. | | Monaco | | 49 | |
| | | | | | | |
| | Joint ventureb | | | | | |
| | Telecommunications Services of | | Trinidad and | | | |
| | Trinidad and Tobago Limited | | Tobago | | 49 | |
| | | | | | | |
| | Associatec | | | | | |
| | Bahrain Telecommunications | | | | | |
| | Company B.S.C. | | Bahrain | | 20 | |
|
a Subsidiaries are entities that Cable & Wireless controls through a majority of voting rights, a majority of representation on the Board or through the right or actual exercise of management control over the operating and financial policies of the subsidiary with a view to gaining economic benefit from its activities. Results are consolidated for financial reporting purposes.
b Joint ventures are entities in which Cable & Wireless holds an interest on a long-term basis and are jointly controlled by Cable & Wireless and one or more others under a contractual arrangement. Results are accounted for under the gross equity method for financial reporting purposes. The gross equity method differs from the equity method only in that it requires additional disclosures of the share of gross assets and liabilities of ‘Interest in net assets of joint ventures’ and ‘Turnover of the Group including its share of joint ventures’ on the face of the balance sheet and profit and loss account respectively.
c. Associates are entities for which Cable & Wireless has at least a 20 per cent interest in the voting rights of the entity, held on a long-term basis and over which Cable & Wireless exercises significant influence, but not management control. Results are accounted for under the equity method for financial reporting purposes.
Back to Contents
| | | |
| | | |
| | | Corporate
governance |
| | | | | |
| | | | | |
| | | Corporate governance |
| | | 27 | | Corporate and social responsibility report |
| | | 31 | | Board of Directors |
| | | 33 | | Directors’ report |
| | | 42 | | Directors’ remuneration report |
| | | 55 | | Statement of Directors’ responsibilities |
| | | | | |
| | | | | |
| | | | | |
| | | | | |
| | | | | |
| | | | | |
| | | | | |
| | | | | |
| | | | | |
| | | | | |
| | | | | |
| | | | | |
| | | | | |
| | | | | |
| | | | | |
| | | | | |
| | | | | |
| | | | | |
| | | | | |
| | | | | |
Back to Contents
Corporate governance
Corporate and social responsibility report
Cable & Wireless is committed to effective management of social, ethical and environmental matters.The Board manages and monitors corporate responsibility through the Corporate Responsibility Steering Group, chaired by the Executive Deputy Chairman, Lord Robertson of Port Ellen.
Business principles
The Cable & Wireless Board Code of Business Principles, (December 2004) provides standards and guidelines for business conduct across the Group. It commits the business to ethical conduct and includes clear guidance on:
– corporate governance;
– community investment;
– employee relations and development;
– human rights;
– management of the Group’s environmental impact;
– occupational health & safety; and
– supplier, customer and other stakeholder relations.
The Board additionally has a Code of Ethics specifically applicable to the Chief Executive Officer and senior financial officers. Employees are encouraged to report any breach of the codes and can do so confidentially and anonymously through the Group’s whistle-blowing procedures. Both codes are available on the Company’s website.
Community investment
Cable & Wireless is committed to contributing positively to the communities around it.The Group’s community investments are run in partnership with voluntary and community based organisations, governments and charities and directed by a cross Group Community Investment Committee.
In 2005, Cable & Wireless’ total Group-wide community contributions were valued at £7.7 million, of which £6.4 million were cash charitable contributions. Of the total, £1.7 million was spent in the UK.
Most of Cable & Wireless’ business units undertake charitable and community initiatives with significant activity at Group level and in the UK, Barbados, Jamaica and Panama. Cable & Wireless has established charitable foundations in Panama, Jamaica and the Seychelles.
The Cable & Wireless community investment programme currently focuses on three main areas: addressing the “digital divide”; promoting safety and security in the use of the internet and information and communication technologies (“ICT”); and encouraging positive use of ICT.
Addressing the digital divide
Cable & Wireless works with governments, charities and voluntary organisations to enable those from underprivileged communities to use and benefit from access to ICT.
| – | Bracknell’s popular Cable & Wireless After School ICT Academy is based at the Group’s head office in Bracknell and helps 11 to 14 year olds to develop confidence in the use of technology and gain new skills. Cable & Wireless’ staff are volunteer mentors to the scheme;
|
| – | through WebPlay, Cable & Wireless enabled more than 3,000 underprivileged 8 to 12 year olds to learn through the creative use of ICT. The initiative supports national curriculum targets in literacy, technology and citizenship.Volunteer mentors from Cable & Wireless support the project; |
| | |
| – | in October 2004, Cable & Wireless supported Age Concern’s four-week Silver Surfers Festival.This provided free internet taster sessions for older people across 100 Age Concern centres in the UK; |
| | |
| – | the Cable & Wireless Panama Foundation works with the Ministry of Education to provide PCs and internet connectivity for 20,000 pupils in 14 schools across the country.The Foundation helped create a new IT suite in a rural primary school in Pacora, hailed by the Minister of Education as the country’s first ‘Technological Innovation Classroom’.The government hopes to replicate the model in schools across Panama; and |
| | |
| – | Cable & Wireless India has worked with the Christel House School, Bangalore to provide pupils with an internet-ready, fully equipped and maintained computer laboratory. |
Using the internet safely
The internet offers exciting opportunities but can have hidden dangers. Cable & Wireless works with its partners to protect children from unsuitable content and raise understanding of internet safety.
Run with internet charity Childnet International, the Cable & Wireless Childnet Academy 2005 highlighted positive use of the internet by young people, through an international web development competition for young people which attracted entries from 49 countries.The programme offered specialist web support, technical advice and leadership training.The winning websites can be seen at www.childnetacademy.org
Alongside the Childnet Academy 2005, the Cable & Wireless Jamaica Foundation, Childnet International and the British Council hosted a 180 strong policy conference to examine safe use of the internet by children and young people in Jamaica in March 2005. Policy makers, teachers and industry representatives shared best practice to ensure that young people in the Caribbean can use the internet safely.The Kidsmart Internet safety programme, supported by Cable & Wireless, offered internet safety guidelines to teachers, parents and pupils.
Back to Contents
Corporate governance
Corporate and social responsibility report
Disaster response
Following Hurricane Ivan in the Caribbean and the Asian Tsunami, Cable & Wireless made two US$1 million donations during 2005.
The first provided relief and reconstruction work in Cayman, Grenada and Jamaica following the devastation in September 2004. Cable & Wireless also provided immediate humanitarian supplies, telecoms equipment and expert help in the immediate aftermath of the hurricane and sent 30 tonnes of relief supplies to the affected region.
The second donation was made towards the reconstruction of the Maldives following the Tsunami in December 2004. Again this was in addition to support from Cable & Wireless’ engineers in restoring the communications networks to the devastated islands.The Maldives’ national telecommunications company, Dhiraagu, which is 45 per cent owned by Cable & Wireless, made a further US$1 million donation.
Employment
Workforce profile
At 31 March 2005, Cable & Wireless had 14,781 employees comprising – UK (4,499), US (41), Europe (423), Asia (221), Bulldog (505), Caribbean (4,147), Panama (1,818), Macau (932), Monaco (458), Rest of the World (1,411) and Other (326). In March 2005, across the Group, the male/female mix of the workforce was 66 per cent male to 34 per cent female.
Employment policies
Cable & Wireless’ employment policies comply with local requirements and meet standards of occupational health, safety and environment (“OHSE”), business ethics, diversity, disability, performance management and employee relations.
Cable & Wireless is committed to providing a working environment in which employees can realise their potential and contribute to business success.The Group aims to ensure that no employee, job applicant, customer or supplier is discriminated against.
The Group’s employment philosophy is underpinned by the principles of fostering diversity in its workforce.This enables the business to access the broadest possible pool of talent and sustain high-performance teams and to meet its aim of offering opportunities to all the local cultures in which we operate.
Employee consultation and employee relations
Cable & Wireless has formal and informal channels for employee consultation and communication.The Group values the participation of its employees and keeps them informed about the Group’s development. Cable & Wireless undertakes regular surveys to ascertain employee satisfaction and feeds back results to employees. In the UK and Europe employees are represented through the Employee Consultation Forum (“ECF”).There were no strikes or formal disputes during 2005.
Employees may join employee representative bodies or trade unions. Cable & Wireless recognises unions for collective bargaining purposes in some, but not all, the countries in which it operates.
Career development
We have introduced personal development plans for employees to help them reach their career development goals.The Group offers training and development opportunities to employees at all levels.
Human rights
Cable & Wireless supports the Universal Declaration of Human Rights and the ILO Core Conventions relating to freedom of association, the abolition of forced labour and the elimination of child labour.
Occupational health, safety and environment
Cable & Wireless has a comprehensive occupational health, safety and environmental programme to minimise the risks detailed below. OHSE process is the responsibility of the Group’s Corporate Responsibility Steering group chaired by the Executive Deputy Chairman, Lord Robertson.
The integrated OHSE Management System sets common Group standards, based on international standards (OHSAS 18001 and ISO 14001).These are supported by detailed local policies and procedures to ensure compliance with local legal requirements. The Group’s continual risk assessment procedures identify and manage potential hazards appropriately.
Performance targets
Cable & Wireless has identified key OHSE risks. In 2004 the Group set OHSE objectives in each of these areas:
| – | zero occupational health, safety, fire or environment prosecutions or notices from enforcing authorities; |
| | |
| – | zero fatal injuries to employees, customers, partners or contractors; |
| | |
| – | major injuries and lost time accidents to be reduced by 20 per cent before 2010 (against the 2003 baseline); |
| | |
| – | at least 25 per cent of National Businesses to attain ISO 14001 Environmental Management Standard certification by the end of 2008; |
| | |
| – | reduce energy consumption by 5 per cent during 2005 based on the 2003 baseline consumption; |
| | |
| – | increase the procurement of renewable energy to 25 per cent by 2010 (from 2004); |
| | |
| – | develop and report progress on plans to remove all HCFCs Group-wide by the end of 2010; |
| | |
| – | remove all CFCs and Halons Group-wide by the end of 2010; |
Back to Contents
| – | assess suppliers of defined goods and services to ensure their ability to manage OHSE risks; and |
| | |
| – | complete and report OHSE internal audits of all substantial national businesses. |
Performance Data
OHSE performance is measured via an annual data collection exercise. In 2005, Cable & Wireless recognised that, due to significant change in the business, a new approach to data collection was required. Accordingly, we limited data collection to four main areas of the business; UK, Caribbean, Panama and Macau.Thirteen of our businesses submitted data, equivalent to 79 per cent of the total business by turnover and 75 per cent of the total business by number of employees.
This change in the data collection process brings improved efficiency but means figures are not directly comparable with previous years’ results.
Further information can be found in the Cable & Wireless Occupational Health and Safety Report (OHSE) 2005, which will be available on the Company’s website in July 2005.
Performance against targets during 2005 is summarised as follows:
|
|---|
| | Target | | 2005
Actual1a | | 2004
Actual1b | | On target | |
|---|
| | Occupational Health and Safety | | | | | | | | | |
| | Prosecutions | | 0 | | 0 | | 0 | | Yes | |
| | Enforcement notices | | 0 | | 1 | 2 | 0 | | No | |
| | Fatal injury accidents (Cable & Wireless employees) | | 0 | | 0 | 3a | 0 | 3b | Yes | |
| | Lost time incident rate (per 10,000 employees)4 | | Reduce by 20% by | | | | | | | |
| | | | end 2010 over 2003 baseline | | 67.6 | 5 | 88.4 | | Yes | |
| | Environmental management | | | | | | | | | |
| | Per cent of businesses by turnover with ISO14001 | | 25% of businesses with | | | | | | | |
| | | | certification by end 2008 | | 12.4% | | 8.3% | | Yes | |
| | Energy and transport | | | | | | | | | |
| | CO2 per unit turnover (tonnes CO2/£1million turnover) | | Reduce by 5% in 2004/2005 | | | | | | | |
| | | | against 2003 baseline | | 74.9 | | 59.0 | | No | |
| | Per cent of electricity from renewable energy | | Increase use to 25% by 2010 | | 14.3% | | — | | Yes | |
| | HCFCs stored (kg) | | Remove all by 2010 | | 13,535 | | 31,500 | | Yes | |
| | CFCs stored (kg) | | Remove all by 2010 | | 4,122 | | 5,900 | | Yes | |
| | Halons stored (kg) | | Remove all by 2010 | | 27,544 | | 52,400 | | Yes | |
| | | | | | | | | | | |
| | Supplier and business unit assessment | | | | | | | | | |
| | Per cent of suppliers of defined goods audited | | Assess 100% of suppliers of | | | | | | | |
| | | | defined goods | | 100% | | 10.8% | | Yes | |
| | | | | | | | | | | |
| | Per cent of businesses by turnover conducting | | | | | | | | | |
| | OHSE internal audits | | Audit 100% of substantial | | | | | | | |
| | | | businesses | | 94.5% | | — | | Yes | |
|
| Notes: |
1a All normalised data is normalised against, or shown as a per cent of, the turnover of businesses participating in the data collection exercise. |
| |
1b All normalised data is normalised against the turnover of the total Group businesses. |
| |
2 Cable & Wireless UK was served with one improvement notice in October 2004 (see ‘Significant OHSE Incidents’). |
| |
3a There were no fatalities in Cable & Wireless businesses during the 2005 financial year. One incident was reported in which a contractor died as a result of a fall while working at one of Cable & Wireless’ sites in St Lucia. A full investigation following the accident demonstrated that Cable & Wireless bore no responsibility. |
| |
3b There were no fatalities in Cable & Wireless businesses during the 2004 financial year. Although an incident was reported in which two contractor employees died in a mud slide on a road, the full investigation showed that the employees were not engaged in work on behalf of Cable & Wireless, though the contractor had undertaken work for us in the past. |
| |
4 A lost time incident (LTI) is defined as any incident which results in an employee being absent for one day or more due to incapacity or ill health arising out of the incident and occurring within 24 hours of the incident.The lost time incident rate is defined as the number of LTI’s in the past 12 months divided by the working population, expressed as a rate per 10,000 employees. |
| |
5 This lost time incident rate is comparable with other telecom industry performance. |
Back to Contents
Corporate governance
Corporate and social responsibility report
Significant OHSE incidents
Cable & Wireless was served an improvement notice in October 2004 relating to the use of a domestic extractor within a UK office building. Although Cable & Wireless has fully complied with the improvement notice, the Company understands that the local council has initiated proceedings against the Company in respect of this incident. An internal investigation has been conducted and all recommendations for improvement have been implemented.
In January 2005 an oil spill occurred at a Cable & Wireless technical site in the UK. Cable & Wireless co-operated fully with the Environment Agency in the clean-up operation. An internal investigation into the incident has been conducted and recommendations for improvement are being implemented.
Purchasing and supply chain
Cable & Wireless is committed to fair relations with suppliers, customers and business partners.The Group’s purchasing and supply chain function has made significant effort in 2005 to encourage suppliers to respect the Group’s business principles and maintain high standards of social, ethical and environmental conduct.
The Group’s Responsible Procurement Policy is being piloted from April 2005. Suppliers and contractors will be requested to comply with the policy through amended contract terms.
All new suppliers will be required to comply with the policy and Cable & Wireless will work with existing suppliers unable to comply with the policy to help them to meet its requirements over a reasonable period.The full policy can be found on the Company’s website.
The Cable & Wireless Supplier Related Ethics Policy sets out rules and guidelines to ensure that all dealings with suppliers are entirely ethical.This policy has been communicated to all relevant UK employees and will be rolled out across the Group during 2006.
Mobile phone safety
Cable & Wireless monitors and manages issues related to concerns about possible adverse effects to human health from mobile phone use.
The Group tracks scientific and medical research, media, legal, regulatory and other developments as well as the public perception of risk arising from the use of mobile phones.
The scientific research on mobile phones and health has been reviewed by a number of independent expert scientific panels. None of these panels has concluded that the use of mobile phones is harmful.
Internet acceptable use
Cable & Wireless has an Internet Acceptable Use Policy (“AUP”). This confirms the sole responsibility of Cable & Wireless’ customers for their content and messages. It defines the activities which customers are prohibited from undertaking, such as those which violate the law or threaten the integrity of any network or computer system.The AUP is available on the Company’s website.
Stakeholder dialogue
Cable & Wireless engages with many external organisations, including non-governmental organisations, fund managers and rating agencies, regarding the Group’s corporate responsibility performance.
Cable & Wireless continues to be a constituent member of the FTSE4Good Index. Cable & Wireless performance during 2005 led to an improvement in the Group’s corporate responsibility rating by two of Europe’s leading rating agencies,Vigeo and Core Ratings.
Cable & Wireless scored 84.5 per cent in the Business in the Environment 2004 Index of Corporate Environmental Engagement. The average index score was 79 per cent.
Back to Contents
Corporate governance
Board of Directors
The following are the Company’s Directors and Company Secretary as at the date of this report.
Richard LapthorneN (62)
Non-executive Chairman; Chairman, Nominations Committee
Richard Lapthorne was appointed Chairman in January 2003. He is a Non-executive Chairman of Morse PLC, Arlington Securities Ltd and the New Look Group. He is a Non-executive Director of Oasis International Leasing in Abu Dhabi. Mr Lapthorne joined the Board of Amersham International plc in 1988 as a Non-executive Director and was Chairman from 1999 until May 2003. He was Finance Director of British Aerospace plc from July 1992 and Vice Chairman from April 1998 until he retired in September 1999 having previously been Finance Director of Courtaulds plc from 1986 to 1992. Richard Lapthorne was awarded the CBE for services to the British aerospace industry in 1997.
Francesco CaioN (48)
Chief Executive Officer
Francesco Caio was appointed Chief Executive Officer in April 2003. Prior to his appointment, Francesco Caio founded Netscalibur Italia, the European business telecommunications and internet service provider, in 2000 having previously been Chief Executive Officer of Merloni Elettrodomestici from 1997 to 2000. In 1996 he was Chief Executive Officer of Olivetti having previously headed its telecommunications and multimedia divisions. He led the creation and launch of Omnitel Pronto, Italy’s second largest mobile phone company before its acquisition by Vodafone, and was its first Chief Executive Officer from 1994 to 1996. He has also worked with McKinsey in London. He is a Non-executive Director of Netscalibur Italia SpA and a former Non-executive Director of Equant from 1998 to 2000, of Merloni Elettrodomestici from 2000 to 2004, and of Motorola from 2000 to 2003.
The Right Honourable Lord Robertson of
Port Ellen KT, GCMG (59)
Executive Deputy Chairman
Lord Robertson of Port Ellen was appointed Executive Deputy Chairman in February 2004. He was Secretary General of NATO and Chairman of the North Atlantic Council from October 1999 to December 2003, Secretary of State for Defence from 1997 to 1999 and Member of Parliament for Hamilton and Hamilton South from 1978 to 1999. He is a Non-executive Director of the Weir Group PLC and Smiths Group PLC, Strategic Advisor to the Royal Bank of Canada, Europe, a member of the Advisory Board of Englefield Capital and an advisor to BP plc.
Robert (Rob) Rowley (56)
Executive Deputy Chairman
Rob Rowley was appointed a Non-executive Director in September 2002 and became Chairman of the Audit Committee on 1 January 2003. Following a restructuring of the Board, he relinquished chairmanship of the Audit Committee and was appointed as Executive Deputy Chairman on 21 January 2003. He is a Non-executive Director of Prudential plc, where he is also Chairman of the Audit Committee,Taylor Nelson Sofres plc and Liberty International plc. He was on the Board of Reuters Group plc from 1990, serving as Finance Director from 1990 until 2000, then as Chief Executive of Reuterspace until he retired in 2001.
George Battersby (59)
Executive Director, Human Resources
George Battersby was appointed as Executive Director of Human Resources in July 2004. He has held senior human resources positions in a number of FTSE 100 companies over the past 20 years. Prior to joining Cable & Wireless he was Group Human Resources Director and a member of the Board of Amersham International plc. He is a Non-executive Director of SHL Group plc, a leading international HR consultancy, where he is Chairman of the Remuneration Committee and the Senior Independent Director.
Charles Herlinger (49)
Chief Financial Officer
Charles Herlinger was appointed Chief Financial Officer in December 2003. Prior to joining Cable & Wireless, he worked for Siemens AG, most recently as Corporate Vice President and Group Controller. He joined the Siemens Group in 1987 and was Director of the Overseas Mergers and Acquisitions Group between 1990 and 1993, Controller of Siemens Corporation from 1993 to 1995 and Chief Financial Officer and Executive Vice President of Siemens Energy and Automation from 1995 to 1998. From 1985 to 1987 he was Assistant Controller of L’Oréal in the United States. He qualified as a chartered accountant in the United Kingdom and as a certified public accountant in the United States with KPMG, for whom he worked from 1977 to 1985.
Harris Jones (43)
Executive Director, International Business
Harris Jones was appointed as Executive Director of International Business in December 2004. He has international experience in the telecoms industry as Chief Executive Officer of T-Mobile UK after its acquisition by Deutsche Telekom and, previously, as a senior executive with Omnipoint Communications and Sprint Spectrum. He is a Non-executive Director of Caracal, Inc.
Back to Contents
Corporate governance
Board of Directors
Bernard GrayA N R(44)
Non-executive Director; Chairman, Remuneration Committee
Bernard Gray was appointed a Non-executive Director in January 2003. He is Chief Executive of CMP Information, the UK publishing and events division of United Business Media and United Advertising Publications (“UBM”). Previous roles have included Special Adviser to the Secretary of State for Defence from 1997 to 1999 during the UK’s Strategic Defence Review and almost ten years with the Financial Times Group, including two years on the Lex column. He began his career in capital markets in London and New York.
Graham HoweA N R(44)
Non-executive Director; Senior Independent Director
Graham Howe was appointed a Non-executive Director in May 2003. Until 30 April 2003 he was Deputy Chief Executive Officer and Chief Operating Officer of Orange S.A., having joined them in 1992 as a founding Director. His previous experience includes senior positions at Hutchison Telecom, First Pacific Company and Touche Ross Management Consultants. He is also Chairman of Promethean Technologies Group Limited.
Kate NealonA R (52)
Non-executive Director
Kate Nealon was appointed a Non-executive Director on 18 January 2005. She is a US-qualified lawyer and has practised international banking and regulatory law in New York. She was Group Head of Legal and Compliance for Standard Chartered plc until 2004 and is currently Non-executive Director of HBOS plc, Monitor (the independent regulator of the NHS Foundation trusts) and a senior associate of the Judge Institute of Management at Cambridge University.
Anthony (Tony) RiceA N (53)
Non-executive Director; Chairman, Audit Committee
Tony Rice was appointed a Non-executive Director and Chairman of the Audit Committee in January 2003. He was a member of the Remuneration Committee until 1 May 2005. He has been Chief Executive of Tunstall Holdings Ltd since 2002. Prior to this role his career was largely spent with British Aerospace plc where he was Group Treasurer, Group Managing Director Commercial Aircraft and was involved in the financing and flotation of Orange SA.
Kasper RorstedA (43)
Non-executive Director, Chairman, Community Investment Committee
Kasper Rorsted was appointed a Non-executive Director in May 2003. He was a member of the Remuneration and Nominations Committees until 22 February 2005. He is Executive Vice President at Henkel KGaA having previously been Senior Vice President and General Manager, EMEA for Hewlett Packard following its merger with Compaq. He held various other senior management positions with Compaq since 1995 and has previous experience with Oracle, Digital and Ericsson.
Agnès TouraineA (50)
Non-executive Director
Agnès Touraine was appointed a Non-executive Director on 18 January 2005. Based in France, Agnès is Managing Partner of Act III Consultants, a Board member of Fondation de France and a Non-executive Director of Lastminute.com. She was previously Chairman and CEO of Vivendi Universal Publishing and held various senior executive positions with Lagardere Group. She began her career with McKinsey in Paris.
Clive ButlerA R (59)
Non-executive Director
Clive Butler was appointed a Non-executive Director on 1 May 2005. He was Corporate Development Director at Unilever until May 2005 and had served on the main board since 1992. During that period he also undertook the roles of Personnel Director and Category Director for Unilever’s Home and Personal Care division. He was a Non-executive Director of the Lloyds TSB group from 1996 until 2003 following the acquisition by Lloyds Bank of the TSB group, where he had been a Non-executive Director since 1993. He joined Unilever in 1970 and has worked with the company ever since, in a variety of marketing and general management roles, including positions in the USA, Zimbabwe and The Philippines.
Dr. Janet Morgan
Retired 22 July 2004.
Kevin Loosemore
Resigned 1 December 2004.
Andrew Garard (38)
Group General Counsel and Company Secretary
Andrew Garard was appointed Company Secretary in May 2004.
ADenotes membership of Audit Committee
NDenotes membership of Nominations Committee
RDenotes membership of Remuneration Committee
Back to Contents
Corporate governance
Directors’ report
The Directors submit their report and accounts for Cable and Wireless plc, together with the consolidated accounts of the Cable & Wireless Group of companies, for the year ended 31 March 2005. The Directors’ corporate governance and remuneration reports are set out on pages 35 and 42 respectively.
Principal activities and business review
Cable & Wireless is an international telecommunications company. Its principal operations are in the United Kingdom, the Caribbean, Panama, Macau and Monaco. Cable & Wireless provides voice, data and IP services to business and residential customers and wholesale services to carriers, mobile operators and content, application and internet providers.
Details of the Group’s performance during the year are contained in the Operating and financial review on pages 59 to 65.
Overseas trading branches of the Company exist in Ascension, Diego Garcia, Falkland Islands, Singapore and St. Helena.
Share capital
Details of shares issued during the year are shown in Note 23 to the accounts.
Acquisitions and disposals
Details of acquisitions and disposals in the year are set out in Business overview – Recent acquisitions and disposals on pages 23 to 24.
Results and dividends
The Group’s profit for the year after taxation and minority interests amounted to £302 million.
The Board recommended a final dividend for 2005 of 2.64 pence per Ordinary Share which was approved by shareholders at the 2005 Annual General Meeting (“AGM”), and was paid on 11 August 2005 to shareholders on the register at 8 July 2005. The total dividend for the year is 3.8 pence per Ordinary Share.
The Company offered a Scrip Dividend alternative for the final dividend payable on 11 August 2005. Full details are contained in the Scrip Dividend brochure which can be obtained from the Company’s Registrar, from the Company Secretary or from the Company’s website.
Directors
The following served as Directors of the Company during the year and subsequent to the year-end:
Richard Lapthorne
Francesco Caio
Lord Robertson of Port Ellen
Rob Rowley
George Battersby (appointed 27 July 2004)
Charles Herlinger
Harris Jones (appointed 1 December 2004)
Bernard Gray
Graham Howe
Kate Nealon (appointed 18 January 2005)
Tony Rice
Kasper Rorsted
Agnès Touraine (appointed 18 January 2005)
Clive Butler (appointed 1 May 2005)
Kevin Loosemore (resigned 1 December 2004)
Dr Janet Morgan (retired 22 July 2004)
Biographical details for the current Directors are set out on pages 31 to 32.
In accordance with the Company’s Articles, any Director appointed since the last AGM is required to retire and seek election by the shareholders at the next following AGM. Accordingly, George Battersby, Clive Butler, Harris Jones, Kate Nealon and Agnès Touraine, having been appointed Directors since the 2004 AGM retired at the 2005 AGM and, being eligible, were elected. The unexpired portion of the service contracts for George Battersby and Harris Jones is disclosed on page 46.
The Articles also require all Directors to retire every third year from when last elected by shareholders. In view of the fact that the Board of Directors has been reconstituted since January 2003, and to help stagger the re-election of Directors going forward, Francesco Caio, Bernard Gray and Tony Rice were re-elected as Directors of the Company at the 2005 AGM. All three are now subject to re-election at the 2008 AGM. The unexpired portion of the service contract for Francesco Caio is disclosed on page 46.
Disclosable interests
The Directors have no interest in the Ordinary Shares of the Company’s subsidiaries. The beneficial interests of the Directors and their immediate families in the Ordinary Shares of the Company are shown in the Directors’ remuneration report on page 48.
Employment policies
Details of employment policies are set out in Corporate and social responsibility report – Employment.
Back to Contents
Corporate governance
Directors’ report
Charitable and political donations
Details of charitable donations made during the year are given on page 27 in the Corporate and social responsibility report – Community investment.
The Group does not make any political donations and has no intention of making donations to what are generally regarded as political parties. As a precautionary measure and in light of the wide definitions of political organisations in The Political Parties, Elections and Referendums Act 2000 (the Act), a resolution to permit the Company to make political donations and incur political expenditure was passed at the 2004 AGM. The purpose of the resolution was to ensure that the Company did not unintentionally breach the Act.That resolution is valid for a period of four years from 22 July 2004 or until the date of the 2008 AGM, if earlier.
Payments to suppliers
In the United Kingdom, the Group agrees payment terms with its suppliers when it enters into binding purchase contracts.The Group seeks to abide by the payment terms agreed whenever it is satisfied that the supplier has provided the goods or services in accordance with the agreed terms and conditions.The Group seeks to treat all its suppliers fairly according to a standard which deals specifically with the payment of suppliers.The Group’s e-procurement procedure which is being adopted worldwide, standardises the procedures for procuring goods and services and the internal authorisations required to approve spending and supplier selection.
The Company had 53 days’ purchases (2004 – 65 days’ purchases) outstanding at 31 March 2005 based on the average daily amount invoiced by suppliers during the year ended 31 March 2005.
Acquisition of own shares
Following completion of the Group’s exit from the US, its decision to exit Japan and the realisation of cash through the sale of other investments, the Board decided to return £250 million to shareholders through a rolling share buyback programme. Following receipt of shareholder approval at the 2004 AGM, the Company commenced the share buyback programme on 16 November 2004. Between 16 November 2004 and 31 March 2005, the Company acquired 60,500,000 Ordinary Shares in the Company for an aggregate cost of £75 million.This number of Ordinary Shares represents 2.53 per cent of the Company’s total issued share capital as at 31 March 2005. As at 31 March 2005 and 26 August 2005, all Ordinary Shares purchased are held in treasury.
Substantial shareholdings
Except for the holdings of Ordinary Shares listed below, the Directors are not aware of any person or organisation holding 3 per cent or more of the Ordinary Share capital of the Company as at 26 August 2005, the latest practicable date prior to the issue of this report. Comparative figures for 2004 and 2003 are also given.
|
|---|
| 2005 | Number of
Cable & Wireless
Ordinary Shares | | Percentage of
Issued Ordinary
Share capital | |
|---|
| | | | | | | | |
| | Shareholder | | | | | | |
| | The Trustees of the BT | | | | | | |
| | Pension Scheme | | 107,151,284 | | | 4.46 | |
| | Legal & General Group plc | | 75,783,472 | | | 3.15 | |
|
|
|---|
|
|---|
| 2004 | Number of
Cable & Wireless
Ordinary Shares | | Percentage of
Issued Ordinary
Share capital | |
|---|
| | | | | | | | |
| | Shareholder | | | | | | |
| | Legal & General Group plc | | 106,545,863 | | | 4.47 | |
| | The Trustees of the BT | | | | | | |
| | Pension Scheme | | 79,356,278 | | | 3.33 | |
|
|---|
|
|---|
| 2003 | Number of
Cable & Wireless
Ordinary Shares | | Percentage of
Issued Ordinary
Share capital | |
|---|
| | | | | | | | |
| | Shareholder | | | | | | |
| | Franklin Resources, Inc. | | 108,105,460 | | | 4.54 | |
| | FMR Corporation & Fidelity | | | | | | |
| | International Ltd. | | 93,127,830 | | | 3.91 | |
| | Legal & General Investment | | | | | | |
| | Management | | 80,687,822 | | | 3.39 | |
|
|---|
The Company’s major shareholders do not have different voting rights from other holders of the Company’s Ordinary Shares.
Related Party Transactions
Transactions with joint ventures and associated companies
All transactions with joint ventures and associated companies arise in the normal course of business and primarily relate to fees for use of Cable & Wireless products and services, network and access charges.The aggregate transactions recorded by Cable & Wireless with joint ventures and associated companies, which are considered to be material, are disclosed below and in Notes 17, 19, 21 and 32 to the Financial statements.
Loans to joint ventures and associated companies, amounts owed by joint ventures and associated companies and owed to joint ventures and associated companies are set out in Note 32 to the Financial statements.
Transactions with Directors
Except as disclosed in the Directors’ remuneration report, as of 26 August 2005, neither the Company nor any of its subsidiaries was a party to any material transactions, or proposed transactions, in which any Director, any other Executive Officer, any spouse or child under 18 years of age of a Director or Executive Officer had or was to have a direct or indirect material interest.
During the years ended 31 March 2003, 31 March 2004 and 31 March 2005, and as of 26 August 2005, no Director nor any other Executive Officer, nor any associate of any Director or any other Executive Officer was indebted to the Company or any of its subsidiaries.
Back to Contents
Corporate governance
The Company is listed on the London Stock Exchange and also has a secondary listing on the New York Stock Exchange. As such, it is required to comply with the listing rules of the United Kingdom Listing Authority (“UKLA”) and with many of the provisions of the Sarbanes-Oxley Act (“Sarbanes-Oxley”) as well as the New York Stock Exchange’s corporate governance rules.
The Financial Services Authority requires UK listed companies to disclose whether they have complied with the provisions set out in section 1 of the UKLA’s Combined Code on Corporate Governance (“Combined Code”) and, where the provisions have not been complied with, to provide an explanation. Companies are also required to explain how they have applied the principles set out in the Combined Code.
The Board confirms that the Company was fully compliant with all the provisions of section 1 of the Combined Code throughout the period except as explained below.The Statement of Directors’ responsibilities in respect of the preparation of the financial statements is set out on page 55.
The Board
The Board firmly believes in good corporate governance and particularly that strong governance controls improve the performance of the business and enhance shareholder value.The Board’s role includes:
| – | deciding and reviewing on the strategy of the Group; |
| | |
| – | increasing shareholder value by assessing business opportunities and measuring and controlling associated risks; |
| | |
| – | ensuring compliance with legal, regulatory and corporate governance requirements; |
| | |
| – | promoting and maintaining good corporate citizenship and high standards of ethical behaviour by the Group’s employees; |
| | |
| – | providing the Chief Executive Officer with appropriate support to drive and improve the performance of the Group; |
| | |
| – | setting and monitoring challenging performance objectives and benchmarks for the Chief Executive Officer and the executive team; |
| | |
| – | setting an appropriate control environment within which executive management can operate; |
| | |
| – | constituting subcommittees of the Board covering remuneration, nominations and audit matters; and |
| | |
| – | the appointment and removal of the Company Secretary. |
The Board is chaired by Richard Lapthorne and Francesco Caio is the Chief Executive Officer. Rob Rowley and Lord Robertson of
Port Ellen are both Executive Deputy Chairmen. Charles Herlinger is Chief Financial Officer, George Battersby is Group Human Resources Director and Harris Jones is Executive Director of International Business. During the year to 31 March 2005, there were seven independent Non-executive Directors, namely: Bernard Gray, Graham Howe, Dr Janet Morgan (retired 22 July 2004), Kate Nealon (appointed 18 January 2005),Tony Rice, Kasper Rorsted and Agnès Touraine (appointed 18 January 2005). Clive Butler was appointed as an additional Non-executive Director on 1 May 2005. The Senior Independent Director is Graham Howe who is available to shareholders should they have concerns which contact through the normal channels of Chairman, Chief Executive Officer or Chief Financial Officer has failed to resolve or for which such contact is inappropriate. Full biographical details of each of the Directors are set out on pages 31 to 32.
The Combined Code states that at least half the Board, excluding the Chairman, should comprise Non-executive Directors determined by the Board to be independent.The Company did not comply with this provision for the period from 22 July 2004 to 17 January 2005.
During the period from 1 April 2004 to 22 July 2004 the Board comprised five Executive Directors namely, Francesco Caio, Charles Herlinger, Kevin Loosemore, Lord Robertson of Port Ellen and Rob Rowley and five Non-executive Directors, namely Bernard Gray, Graham Howe, Dr Janet Morgan,Tony Rice and Kasper Rorsted.
Dr Janet Morgan retired from the Board on 22 July 2004 at the conclusion of the Company’s 2004 AGM, on 27 July 2004 George Battersby was appointed as an additional Executive Director and on 1 December 2004, Harris Jones replaced Kevin Loosemore on the Board.
During the period from 22 July 2004 to 17 January 2005 the Nominations Committee undertook a formal and rigorous process to identify additional Non-executive candidates who possessed the skills, knowledge and experience required by the Company. Following the conclusion of that process Kate Nealon and Agnès Touraine were appointed as Non-executive Directors of the Company on 18 January 2005.
The Chairman’s role is to lead and manage the business of the Board of Directors in setting the strategy and delivering performance of the Group to its shareholders and other key stakeholders.The Chief Executive Officer is responsible for the performance of the Group to its shareholders and other key stakeholders.The division of responsibilities between the Chairman and Chief Executive Officer has been approved by the Board of Directors and is set out in writing. A copy of this is available from the Company Secretary or the Company’s website.The Board has nine scheduled meetings a year concentrating on strategy, financial and business performance. Additional Board meetings may be called as required to deal with specific matters. During the year under review there were no additional Board meetings.
The agendas for Board meetings are set by the Chairman in consultation with the Chief Executive Officer, Chief Financial Officer
Back to Contents
Corporate governance
Directors’ report
and Company Secretary. Formal minutes recording decisions of all Board and Committee meetings are prepared and circulated to each Director as appropriate. If a Director objects to a particular proposal this will be recorded in the minutes of Board or Committee meetings.There were no such objections during the year under review.
The Board considers that all of the Non-executive Directors who served during the year ended 31 March 2005, namely Bernard Gray, Graham Howe, Dr Janet Morgan (retired 22 July 2004), Kate Nealon (appointed 18 January 2005),Tony Rice, Kasper Rorsted and Agnès Touraine (appointed 18 January 2005) are independent. The Non-executive Directors come from diverse business backgrounds and have unique expertise covering finance, telecoms, IT and government relations. Each of the Non-executive Directors is of independent mind and character and actively contributes to the effective performance of the Board and its Committees.This combination of skills and expertise materially enhances the judgement and overall performance of the Board.
To enable Directors to perform their duties properly and to ensure the effective functioning of the Board and its Committees, they are given full and timely access to all relevant information. In addition, each of the Directors has access to the advice and services of the Company Secretary.
The Board has also adopted a procedure whereby Directors, including Non-executive Directors, may, in the furtherance of their duties, take independent professional advice on any matter at the Company’s expense.
On the appointment of a new Director, the Chairman is responsible for ensuring that an appropriate induction, involving meetings with other Directors, senior management and key advisers, is undertaken. In addition, the new Directors are provided with appropriate background materials covering the business, the financial performance of the Group and the legal and corporate governance environment. The Directors further receive appropriate ongoing briefings and information to enable them to perform their roles both on the Board and its principal Committees, involving internal briefings and external training where appropriate. On request, the Company is prepared to offer major shareholders the opportunity to meet new Non-executive Directors.
The Company maintains Directors’ and Officers’ liability insurance.
The Board has a formal schedule of matters reserved to it for decision including approval of matters such as:
| – | strategy and management; |
| | |
| – | structure and capital; |
| | |
| – | financial reporting and controls; |
| | |
| – | internal controls; |
| – | contracts and expenditure over a certain financial limit; |
| | |
| – | Board membership and other senior management appointments; |
| | |
| – | Director and senior executive remuneration; |
| | |
| – | delegation of authority; and |
| | |
| – | corporate governance. |
A copy of the formal schedule of matters reserved for the Board is available from the Company Secretary or the Company’s website.
The Board has delegated the responsibility for the day-to-day management of the Group to the Chief Executive Officer.The Chief Executive Officer is supported in this by the Executive Committee, which he chairs.The Executive Committee comprises all the Executive Directors of the Company together with the Group Director Strategy and Business Development, the Group Director Corporate and Public Affairs, the Group General Counsel, the Group Director Operations, the Group Director Sales and Marketing and the Head of Wholesale.
Additionally, specific responsibilities have been delegated to the Audit, Remuneration and Nominations Committees.
Under the direction and control of the Chairman, the Board considers its performance both as a group, as individual members and its various sub-committees.This involves regular discussions between the individual Board members and external support where necessary.
As part of the evaluation process, the Non-executive Directors meet independently to consider management performance and succession issues. The independent Non-executive Directors also appraise the Chairman’s performance and review the relationship between the Chairman and Chief Executive Officer to ensure that the relationship is working to promote the creation of shareholder value.
Statement from Independent Directors
During the year ended 31 March 2005, the Independent Directors met three times, in addition to Board meetings, to formally discuss governance issues: once with the Chairman and Chief Executive Officer present, once with the Chairman present and once on their own. After the third meeting, as during the previous year, Graham Howe, Senior Independent Director, provided feedback to the Board on the Independent Directors’ collective views of the following:
| – | the perceived quality of the relationship between the Chairman and the Chief Executive Officer; |
| | |
| – | the degree of openness between the Chief Executive Officer and the Board; |
Back to Contents
| – | the visibility of checks and balances within the Executive Directors’ team; and |
| | |
| – | whether all questions asked by the Non-executive Directors in the Board have been adequately addressed. |
The Independent Directors believe that the Company has an effective Board.
During the year under review, there has been greater emphasis placed on tackling real business issues rather than fire fighting on legacy which has led to a greater clarity of direction. Significant progress has also been made to create a more balanced management team both at the Board and the level below. Challenges remain, particularly around the pace that will be required to execute the priorities identified for the Group.
The Independent Directors believe that the quality of the relationship between the Chairman and the Chief Executive Officer remains a good one, characterised by mutual trust and frankness. The Chairman and Chief Executive Officer have complementary skill sets creating a balanced partnership.Their relationship continues to evolve as more of the initiative for strategic direction has now transferred to the Chief Executive Officer.
The Independent Directors continue to be comfortable with the degree of openness between the Chief Executive Officer and the Board.The quality of papers circulated to the Board prior to meetings and the presentations made at Board meetings have improved allowing more time to be allocated to discussion and debate.
During the year, the Executive team has been strengthened with Charles Herlinger, Chief Financial Officer, being in place for the full year (thereby improving internal procedures and financial disciplines), by the appointment of George Battersby as Group Human
Resources Director and by the appointment of Harris Jones to provide leadership to the Group’s international businesses. A Group Executive has been reconstituted to provide a formal framework for the Executive Directors to provide checks and balances on each other but at the Board this role is still largely undertaken by the Chairman and Chief Executive Officer.
The Independent Directors believe that all questions asked by them in the Board have been answered in an honest and constructive manner.Where some uncertainty has existed around questions not capable of being fully answered, the Independent Directors believe the answers given were appropriate to the circumstances.
Throughout the year ended 31 March 2005, a continued period of change for the Company, the significant efforts of the Board of Directors, its principal committees and the senior management team have satisfied the Independent Directors that the appropriate corporate governance controls have been effective.
An annual audit of investor opinion was commissioned on behalf of the Board.The audit took the form of structured interviews with individual, mainly institutional, investors through an independent external adviser.The report gathered opinion on strategy, operational performance, corporate governance and management capability from investors in the UK, Europe and North America. The non-attributable opinions, which were subsequently reported to the Board, gave the Board direct access to investor feedback.
Attendance
The Board requires all members to use their best endeavours to attend Board and Committee meetings and to devote sufficient time to the work of the Board to discharge their duties. A schedule setting out the attendance of Directors at Board and Committee meetings during the year (including those Directors who resigned during the year) is given below.
|
| | | | | Board
meetings | | | | Remuneration
Committee meetings | | | | Nominations
Committee meetings | | | | Audit
Committee meetings | |
| | |
| |
| |
| |
| |
| | | Attended | | Possible | | Attended | | Possible | | Attended | | Possible | | Attended | | Possible | |
| | | | | | | | | | | | | | | | | | | | | | |
| | Richard Lapthorne | | 9 | | 9 | | | — | | — | | | 4 | | 4 | | | 1 | | 1 | |
| | Francesco Caio | | 9 | | 9 | | | — | | — | | | 4 | | 4 | | | — | | — | |
| | Lord Robertson of Port Ellen | | 9 | | 9 | | | — | | — | | | — | | — | | | — | | — | |
| | Rob Rowley | | 8 | | 9 | | | — | | — | | | — | | — | | | — | | — | |
| | George Battersby | | 6 | | 6 | | | — | | — | | | — | | — | | | — | | — | |
| | Charles Herlinger | | 9 | | 9 | | | — | | — | | | — | | — | | | — | | — | |
| | Harris Jones | | 4 | | 4 | | | — | | — | | | — | | — | | | — | | — | |
| | Bernard Gray | | 9 | | 9 | | | 5 | | 5 | | | 4 | | 4 | | | 5 | | 5 | |
| | Graham Howe | | 9 | | 9 | | | 5 | | 5 | | | 4 | | 4 | | | 5 | | 5 | |
| | Kate Nealon | | 2 | | 2 | | | 1 | | 1 | | | — | | — | | | 1 | | 1 | |
| | Tony Rice | | 9 | | 9 | | | 5 | | 5 | | | 4 | | 4 | | | 5 | | 5 | |
| | Kasper Rorsted | | 9 | | 9 | | | 4 | | 4 | | | 4 | | 4 | | | 4 | | 5 | |
| | Agnès Touraine | | 2 | | 2 | | | — | | — | | | — | | — | | | 1 | | 1 | |
| | Kevin Loosemore | | 5 | | 5 | | | — | | — | | | — | | — | | | — | | — | |
| | Janet Morgan | | 3 | | 3 | | | 2 | | 2 | | | 1 | | 1 | | | 2 | | 2 | |
|
Back to Contents
Corporate governance
Directors’ report
Board Committees
Remuneration Committee
The Remuneration Committee determines and recommends to the Board the framework or broad policy for the remuneration and long-term incentive arrangements of the Company’s Chairman, Executive Directors and senior executives.The Remuneration Committee’s full terms of reference are available either from the Company Secretary or the Company’s website.
During the year ended 31 March 2005, the membership of the Remuneration Committee comprised Bernard Gray (Chairman), Graham Howe, Kate Nealon (appointed 22 February 2005), Dr Janet Morgan (resigned 22 July 2004),Tony Rice and Kasper Rorsted (resigned 22 February 2005). Subsequent to the year-end, Clive Butler was appointed and Tony Rice resigned from the Remuneration Committee on 1 May 2005.
The Chairman, Chief Executive Officer, Chief Financial Officer and Group Human Resources Director may be invited to attend and speak at meetings of the Remuneration Committee, but do not participate in any matter which impacts upon their own remuneration arrangements. Representatives from the Company’s remuneration consultants, New Bridge Street Consultants, attend meetings by invitation. Meetings are scheduled in February, March, May and June each year but may be held at other times.There were five meetings in the year ended 31 March 2005.
The Remuneration Committee is authorised to engage the services of external advisors as it deems necessary at the Company’s expense in order to carry out its function.
The Directors’ remuneration report on pages 42 to 54 includes details on remuneration policy, practices and the remuneration of the Directors.
Nominations Committee
The Nominations Committee reviews the composition of, and succession to, the Board and recommends to the Board appointments of Executive and Non-executive Directors following a formal and rigorous review process.This involves an ongoing assessment of the overall balance and performance of the Board and its individual members ensuring a strong executive and independent non-executive team, taking account of existing and proposed corporate governance requirements and emerging best practice.
The Nominations Committee in particular considers the experience and skills of individuals who may be suitable as Directors.
Members of the Nominations Committee abstain when matters affecting their own appointments are discussed.
The Nominations Committee’s full terms of reference are available either from the Company Secretary or the Company’s website.
The Nominations Committee is authorised to engage the services of external advisors as it deems necessary at the Company’s expense in order to carry out its function.
Until 22 February 2005, the Nominations Committee comprised Richard Lapthorne, who chairs the Nominations Committee, Francesco Caio (Chief Executive Officer) and any three of the following independent Non-executive Directors: Bernard Gray, Graham Howe, Kasper Rorsted and Tony Rice. From 22 February 2005 the composition of the Nominations Committee was amended to Richard Lapthorne (Chairman of the Committee), Francesco Caio (Chief Executive Office), Bernard Gray, Graham Howe and Tony Rice.
The Nominations Committee met four times during the year under review.
Audit Committee
The Audit Committee comprises all the independent Non-executive Directors of the Company, namely:Tony Rice (Chairman), Clive Butler (appointed 1 May 2005), Bernard Gray, Graham Howe, Dr Janet Morgan (retired 22 July 2004), Kate Nealon (appointed 18 January 2005), Kasper Rorsted and Agnès Touraine (appointed 18 January 2005).The Company’s Chairman, Richard Lapthorne, was a member of the Audit Committee until 5 May 2004 and the Company was not therefore compliant with the Combined Code principle on the membership of Audit Committees during the period 1 April to 5 May 2004. Since 5 May 2004 the Chairman and Executive Directors attend Audit Committee meetings by invitation but are not members.The Group Director of Internal Audit, Group General Counsel and representatives of the external auditors also attend by invitation. Other employees of the Company may be invited to attend as and when required.
The Combined Code requires the Board to be satisfied that at least one member of the Audit Committee has recent and relevant financial experience.The Board considers that there is a strong breadth of financial expertise across the Audit Committee and that, collectively, the members have the requisite skills and attributes to enable the Audit Committee to properly discharge its responsibilities, so it has concluded that it will not name any single member as having such experience.
The Audit Committee is authorised to engage the services of external advisers, as it deems necessary, at the Company’s expense in order to carry out its function.
The Audit Committee’s objectives are:
| – | to assist the Company in meeting its responsibilities in ensuring an effective system of internal control and compliance and accurate external financial reporting; and |
| | |
| – | to assist management in conducting and reporting the effective risk management of the Company and Group’s activities. |
The full written terms of reference of the Audit Committee are available from the Company Secretary or from the Company’s website. In summary the Audit Committee:
| – | reviews the financial integrity of the financial statements of the Company; |
Back to Contents
| – | reviews the Company’s compliance with legal and regulatory requirements arising from its listings in London and New York; |
| | |
| – | reviews material complaints regarding accounting, internal controls and auditing raised by the Company’s employees; |
| | |
| – | monitors the Company’s whistle-blowing procedures; |
| | |
| – | reviews the internal audit programme and considers the effectiveness of the internal audit function; |
| | |
| – | makes recommendations to the Board on the appointment of the Company’s auditors; |
| | |
| – | determines the level of audit fees and the scope of the audit in accordance with the authority given by the Company’s shareholders at every AGM; |
| | |
| – | assesses the independence of the auditors; and |
| | |
| – | reviews and agrees the process of the approval of audit and non-audit services provided by the auditors. |
Meetings
The Audit Committee met five times during the year under review. Attendance at these meetings is shown in the table on page 37.
Prior to each meeting, the Chairman of the Audit Committee meets with the Group Director of Internal Audit, Director of Group Accounting Services and with the external auditors without the presence of Executive management.The Chairman of the Audit Committee also has private meetings with the Chief Financial Officer before each Audit Committee meeting. In addition, the entire Committee will meet (i) the external auditors without the presence of management, and (ii) management without the presence of external auditors, at least annually.
The Audit Committee receives the following standing reports at each scheduled meeting:
| – | Report of the Chief Financial Officer; |
| | |
| – | Report of the external auditors; |
| | |
| – | Report of the Group Director of Internal Audit; and |
| | |
| – | Litigation Report, |
In addition, during the year under review, the Audit Committee considered and discussed the business set out below and made recommendations to the Board where appropriate:
| – | the full year results and Press Release together with the Annual Report and Accounts; |
| – | half year results and Press Release and quarterly trading statements; |
| | |
| – | presentation of the Group’s opening IFRS balance sheet in March 2005; |
| | |
| – | Group Risk Review updates; |
| | |
| – | the effectiveness of the employee “whistle-blowing” programme and resolution of matters raised through the whistle-blowing line and other channels; |
| | |
| – | corporate governance developments in UK and US arising from the revised Combined Code and the Sarbanes-Oxley Act 2002 including regular updates on the work being undertaken in connection with section 404 of the Sarbanes-Oxley Act; |
| | |
| – | developments in accounting standards including the preparation for adoption of International Financial Reporting Standards; |
| | |
| – | register of interests for Board and Senior Management; and |
| | |
| – | the effectiveness of the Internal Audit function and the external auditors. |
The Committee also received presentations on business continuity, fraud control, security and health and safety issues.
Financial reporting
The Audit Committee reviews and, where necessary, challenges the actions and judgements of management in relation to the interim and full year financial statements before submission to the Board. Particular attention is paid to critical accounting policies and practices and any changes; clarity of disclosure; compliance with accounting standards, stock exchange and other legal and regulatory requirements. In this, the Audit Committee is assisted by the Disclosure Committee, which is primarily responsible for identifying and considering disclosure control issues in connection with the preparation of all releases containing material financial information.
Internal audit
The Group monitors its internal controls through a programme of internal audits.The Internal Audit function is headed by the Group Director of Internal Audit who is supported by a team of auditors based in the UK and Jamaica.The Group’s Internal Audit function has a formal charter approved by the Board that describes its purpose, authority and responsibility. Its annual audit plan is approved by the Audit Committee and reporting to the Audit Committee is achieved through the submission and discussion of regular formal reports as well as private meetings between the Chairman of the Audit Committee and the Group Director of Internal Audit.
External audit
KPMG Audit Plc has acted as auditors for the Company since 1991. The Audit Committee has established a policy which is intended to
Back to Contents
Corporate governance
Directors’ report
maintain the independence of the Company’s auditors when acting as auditor of the Group accounts.The policy governs the provision of audit and non-audit services provided by the auditor and its associates to the Company and its subsidiaries.The policy clearly identifies those services which are permitted, and those which are prohibited from being provided by the auditor. In addition, the policy clearly sets out the procedure to be followed for the approval of all audit and non-audit services; all engagements with an expected value in excess of £250,000 require the prior approval of the Chairman of the Audit Committee. For the year ended 31 March 2005, fees for audit and audit related services of £4.6 million, of which £0.3 million related to the prior year, were approved by the Audit Committee. During the year, fees for non-audit work of £1.5 million were approved.The non-audit work mainly comprised tax compliance services.
Annual General Meeting
The Company’s Annual General Meeting (“AGM”) was held at the Queen Elizabeth II Conference Centre in London on 22 July 2005. Business at the Company’s AGM covered the Annual Report and Accounts, Directors’ Remuneration Report, final dividend, election/re-election of Directors, re-appointment of the auditors and authorisation for the Directors to set the auditors’ fees. Special business covered amendments to the rules of the Incentive Plan and Deferred Short Term Incentive Plan, a share buy back authority, an increase in the cap on total fees to Directors and amendments to the Articles of Association.
Full details and an explanation of these resolutions are set out in the Chairman’s Letter and Notice of AGM. At the AGM, a business review was presented to shareholders by the Chief Executive Officer. All Directors including the Chairman of the Audit and Remuneration Committees attended and were available to answer shareholders’ questions. All resolutions at the AGM were approved on a poll, in accordance with best practice. Results were announced to the London Stock Exchange and published on the Company’s website.
Apart from the AGM, the Company communicates with its shareholders by way of the Annual Report and Accounts or the Annual Review and Summary Financial Statements and interim financial statements.The Company’s website contains investor relations’ material including results presentations, dividends and share capital history. Additionally, the Company communicates with its institutional shareholders via regular briefings throughout the year but particularly at the time of the interim and year-end results. The Company clearly recognises the importance of maintaining a regular dialogue with shareholders to ensure that the Company’s strategy and performance are understood.
Internal control and risk management
The Board is responsible for the Group’s system of internal control and for reviewing its effectiveness on an ongoing basis.The Board has adopted a process for identifying, evaluating and managing the significant risks faced by the Group in accordance with the guidance of the Turnbull Committee on Internal Control.
The Board considers that the Group’s system of internal control is appropriately designed to manage, rather than eliminate, the risk of failure to achieve business objectives and provides reasonable but not absolute assurance against material misstatement or loss. The concept of reasonable assurance recognises that the cost of a control procedure should not exceed the expected benefits. Reviews of the Group’s systems of internal control are undertaken to improve them as necessary, taking into account emerging best practice. During the year and up to the date of this report procedures were in place throughout the Group to ensure compliance with the report of the Turnbull Committee.
Using a common risk management framework, each principal business and functional unit identifies risks that could impede the achievement of their objectives and records them in a Risk Register. For each significant risk, line managers document an overview of the risk, consider the effectiveness of the current mitigating controls in place and identify any improvement actions required. In addition to this, the Group’s Executive Directors monitor all significant risks through a structure of Risk Review Boards in each of the major business units.The Risk Review Boards comprise the Chief Executive Officer, Chief Financial Officer and other relevant senior executives of the business unit. A schedule of the Group’s risks, which covers significant operational, financial and strategic risks, is reviewed by the Audit Committee.
The past few years have been transitional ones for the Group, with the Company making a number of acquisitions and disposals and having undergone a number of restructurings. As with all acquisitions or reorganisations, the Company has dedicated resource to embed processes and controls across its businesses consistent with the standards acceptable to the Group. Over the last year this has been supported by the roll-out of a Financial Controls Toolkit to reinforce the standardisation of financial controls across the Group. Business units are now required to sign off compliance with the requirements of the Financial Controls Toolkit on an annual basis.
A control self-assessment exercise is conducted annually to complement the work of Group Internal Audit, the risk management framework and the external auditors.This exercise requires management to assess the effectiveness of their fundamental operating controls over all aspects of their operations, in addition to the financial controls covered by the Financial Controls Toolkit. Group Internal Audit considers the results of this exercise in planning their work for the forthcoming year.
At the end of the financial year, the finance and general management of operating units are required to sign a letter of representation to confirm that their financial reporting is based on sound data, that they are fully aware of their responsibility to operate internal control systems and that their results are properly stated in accordance with Group and statutory requirements.Additionally, a structure has been developed to assess the Group’s corporate social responsibility including social, environmental and ethical matters and this is covered in ‘Corporate governance – Corporate and social responsibility report’ on page 27.
Back to Contents
These procedures reflect the Group’s commitment to ensuring it has policies in place that ensure high standards of integrity and transparency throughout its operations. Further, when these procedures detect unauthorised management practices, the Group is committed to the correction of such events. The Group is also committed to analysing its internal controls to make them more robust and further limit the risk of such incidents. The Board believes such action properly reflects the Group’s commitment to financial discipline and integrity at all levels.
The responsibility for internal control procedures within joint ventures and associates rests, on the whole, with the senior management of those operations. Cable & Wireless monitors its investments and exerts influence through Board representation.
Under the US Sarbanes-Oxley Act of 2002, new and enhanced standards of corporate governance, and business and financial disclosure, apply to US public companies and non-US companies, including the Company, with securities registered in the United States. Where applicable the Group has developed policies and procedures to enable it to comply with the provisions of the Sarbanes-Oxley Act. The Group also has ongoing programmes in place, relating in particular to section 404, to enable it to comply with provisions of the Sarbanes-Oxley Act that will come into force in the future.
Going concern
After making enquiries the Directors have a reasonable expectation that the Group and Company have adequate resources to continue in operational existence for the foreseeable future and therefore continue to adopt the going concern basis in preparing the Financial statements on pages 97 to 152.
By order of the Board of Directors.
Andrew S Garard
Company Secretary
3 June 2005
Controls and procedures
The Company carried out an evaluation under the supervision and with the participation of the Company’s management, including the Chief Executive Officer and Chief Financial Officer, of the effectiveness of the design and operation of the Company’s disclosure controls and procedures as of 31 March 2005.There are inherent limitations to the effectiveness of any system of disclosure controls and procedures, including the possibility of human error and the circumvention or overriding of the controls and procedures. Accordingly, even effective disclosure controls and procedures can only provide reasonable assurance of achieving their control objectives. Based upon the Company’s evaluation, the Chief Executive Officer and Chief Financial Officer concluded that the disclosure controls and procedures as of 31 March 2005 were effective.
There were no changes in the Company’s internal control over financial reporting during the year ended 31 March 2005 that have materially affected, or are reasonably likely to materially affect, the Company’s internal control over financial reporting.
Back to Contents
Corporate governance
Directors’ remuneration report
This report sets out the policy and disclosures in relation to Directors’ remuneration. The Remuneration Report was approved at the Annual General Meeting (“AGM”) of the Company held on 22 July 2005 in accordance with the Directors’ Remuneration Report Regulations 2002. Full details of the resolution are set out in the Notice of AGM.
Composition and terms of reference of the
Remuneration Committee
The Remuneration Committee makes recommendations to the Board, within agreed terms of reference, on the Company’s framework of executive remuneration and on the specific remuneration of the Chairman and Executive Directors. The Remuneration Committee also monitors remuneration paid to members of the Executive Committee. During the year the Board approved all recommendations from the Remuneration Committee without amendment. The terms of reference for the Remuneration Committee are obtainable from the Company’s website or from the Company Secretary.
During the year ended 31 March 2005, the Remuneration Committee was comprised of independent Non-executive Directors, namely: Bernard Gray (Chairman), Graham Howe, Dr Janet Morgan (retired 22 July 2004), Tony Rice, Kasper Rorsted (until 22 March 2005) and Kate Nealon (from 22 March 2005).
In forming their recommendations, the Remuneration Committee received advice and information from the Chairman, the Chief Executive Officer, the Group Human Resources Director and the Group Director of Performance and Reward. The Remuneration Committee has appointed independent consultants, New Bridge Street Consultants LLP (“NBSC”), to provide advice on remuneration and share plans both for Executive Directors and the wider executive population. In addition they provide the Company with measurement of it’s relative total shareholder return (“TSR”) performance. NBSC’s terms of engagement are available on request from the Company Secretary.
The Chairman, Executive Directors and officers attending a meeting abstain from any discussion or decision on their own remuneration.
Statement of remuneration policy
Remuneration philosophy
Cable & Wireless is an international company, trading in some 80 countries around the world. Attracting, retaining and motivating high quality people is key to the Group’s success. Remuneration arrangements are designed to enable the Group to maintain a competitive position in each country in a cost-effective way and are reviewed annually against best practice.
The Company’s remuneration philosophy for Directors is based upon creating a strong link between performance and reward, underpinned by the following guiding principles:
| – | total reward levels should reflect the markets in which the Group competes. The Group’s competitive position is regularly monitored by independent analysis against comparator groups of companies selected on the basis of relevant size, business and geographic focus; |
| | |
| – | fixed salaries and benefits should be set with reference to the mid-market level compared with similar types of company; |
| | |
| – | the majority of total remuneration should only be receivable as a result of the Group achieving demanding performance targets; |
| | |
| – | an appropriate mix of short and long-term incentives should be set so that Directors are incentivised to maximise performance over both the short and medium term; and |
| | |
| – | the remuneration structure for Directors should be cascaded down to other senior executives in a consistent manner. |
During the year, the Remuneration Committee reviewed the current remuneration structure. A number of changes are proposed as a result of this review. These changes have been discussed with leading shareholders and their representative bodies, who have been generally supportive. In summary, proposals (outlined more fully below) comprise:
| – | Fixed remuneration (i.e. salary and pension) – frozen; |
| | |
| – | Annual bonus – potential unchanged; |
| | |
| – | Long-term incentives – restructured. Principal changes are a reduction in the proportion of awards vesting for median performance, the granting of performance shares to selected senior executives and an enhanced potential share match to encourage executive share investment. |
The overall impact of these changes is illustrated in the graph below for Francesco Caio. The graph demonstrates that for target performance, total remuneration would be enhanced by no more than a five per cent increase in base salary, however superior levels of performance would merit higher levels of reward.
| Illustration of impact of proposal for Francesco Caio |
| |

Total Remuneration (£000)
Lower Quartile
Median
Upper Quartile
Upper Decile
£1,000
£2,000
£7,000
£6,000
£5,000
£4,000
£3,000
Proposal (2/3rds of bonus invested)
Proposal (1/3rd of bonus invested)
Current + 5% salary increase
Back to Contents
Elements of remuneration
Executive Directors’ remuneration consists of salary, pension and other benefits, annual bonus and long-term incentives.
The Remuneration Committee believes that the majority of Executive Directors’ potential remuneration should be performance related. The appropriate mix and level of performance related awards may vary from year to year and between each Executive Director according to the judgement of the Remuneration Committee. The actual value delivered is dependent upon the achievement of stretching performance conditions. The chart below illustrates the average proportion of Executive Directors’ potential remuneration for 2006 that will be performance related.
Split of potential total remuneration
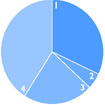 |
1. Salary
2. Pension
3. Performance-related
annual bonus
4. Performance-related
long-term incentives |
Figures reflect ‘on-target’ payment potential under the annual bonus plan and the ‘expected’ value of long-term incentive awards at the time of grant. It is assumed that one-third of the annual bonus is deferred into shares under the Deferred Short Term Incentive Plan.
Base salary
Base salaries are reviewed by reference to the mid-market of comparator groups of companies selected on the basis of comparable size, geographic spread and business focus. Individual salary decisions take into account personal contribution, business performance and the level of salary increases across the Group as a whole. Salaries are generally reviewed on an annual basis to take effect from 1 July or following a significant change in responsibilities.
Salaries were not increased in 2004 or on 1 July 2005 following the latest review. Accordingly, salaries for the forthcoming year will be:
| Francesco Caio | £ | 700,000 | |
| Harris Jones | £ | 500,000 | |
| Charles Herlinger | £ | 400,000 | |
| George Battersby | £ | 350,000 | |
| Rob Rowley | £ | 250,000 | |
| Lord Robertson of Port Ellen | *£ | 250,000 | |
* With effect from 1 March 2005, the Company increased the minimum working days for Lord Robertson from 80 to 100 per annum, resulting in a pro-rata salary increase from £200,000 to £250,000 per annum.
Executive Directors’ pensions are based only on their base salaries.
Short Term Incentive Plan and Deferred Short Term
Incentive Plan
Short Term Incentive Plan (“STIP”)
Individual awards under the STIP for 2006 will be based upon individual performance targets and annual performance against the following objective financial targets: profit before tax, revenue and net cash flow. The specific measures and targets are reviewed and set annually by the Remuneration Committee to reflect the key business priorities for the year in question.
| The structure of the STIP for 2006 is set out below: |
|
| | | | | Financial performance1
| | | | |
| | | | |
| | | Maximum
bonus
potential1
| |
| | Director | Personal
performance1 | | Target | | | Maximum | | | |
| | | | | | | | | | | | |
| | Francesco Caio/
Harris Jones | up to 37.5 | % | 67.5 | % | | 112.5 | % | | 150 | % |
| | Other Executive
Directors | up to 25 | % | 45 | % | | 75 | % | | 100 | % |
|
| |
| 1 As a percentage of salary. |
Back to Contents
Corporate governance
Directors’ remuneration report
Deferred Short Term Incentive Plan
Currently the Executive Directors and selected senior executives may elect to re-invest up to half of any STIP bonus into the Deferred Short Term Incentive Plan (“Deferred STIP”). Shareholder approval was obtained at the AGM to adjust the plan so that this executive population is required to compulsorily invest a third of any STIP bonus into the Deferred STIP and is given the opportunity to invest up to a further third.
The Deferred STIP is designed to encourage participants to invest in shares to align their interests more closely with those of shareholders. Under this plan any bonus deferred is used to purchase shares in the Company, which are held in trust for three years before being released to the participant.
Participants may also be awarded up to two matching shares for every one purchased share based on the relative TSR performance of the Company measured over a three-year period (see Performance conditions for share based awards). A dividend award supplement also operates on the Deferred STIP. Dividends that would have been paid on the purchased shares and the actual award of matching shares during the performance period are reinvested in additional shares.
Currently the matching award is provided on a net of tax basis. Shareholder approval was obtained at the AGM to adjust the plan so that the match is provided on a gross basis i.e. for every £100 of gross of tax bonus invested in the Deferred STIP, participants would be able to receive matching shares worth up to £200.
Long-term incentive awards under the
Incentive Plan 2001
Under the Incentive Plan 2001, the Remuneration Committee can make awards of share options, performance shares and restricted shares to Executive Directors and other senior executives. The Remuneration Committee’s intended award policy for 2006, which has been determined after considering personal and Group performance and total reward within comparator companies is outlined below.
Share Option Plan (“SOP”)
The SOP is the principal vehicle for long-term retention and incentivisation of the Executive Directors and other senior executives.
The plan rules limit the face value of shares that can be optioned to an individual in any year to 600 per cent of salary for the Chief Executive and 400 per cent of salary for other Executive Directors.
For the 2006 financial year, the Remuneration Committee currently intends to grant options over shares worth 300 per cent of salary to the Chief Executive and 250 per cent of salary to the other Executive Directors shortly after the AGM.
The vesting of share options granted under the SOP is subject to relative TSR performance conditions (see Performance conditions for share based awards).
Performance Share Plan (“PSP”)
Under the PSP, Executive Directors and other senior executives can receive awards of performance shares at nil cost.
The plan rules limit the value of shares that can be granted to an individual in any year to 100 per cent of salary. For the 2006 financial year, the Remuneration Committee currently intends to award shares worth 50 per cent of salary to Executive Directors shortly after the AGM.
The vesting of performance shares is subject to relative TSR performance conditions (see Performance conditions for share based awards). A dividend award supplement operates on the PSP. Dividends that would have been paid on the performance shares which vest, will be regarded as having been re-invested in additional shares.
Restricted Share Plan (“RSP”)
The RSP provides for awards of restricted shares, primarily as a retention or a recruitment tool to compensate for the forfeiture of long-term incentive arrangements when transferring to the Company. The Remuneration Committee, taking into account the previous arrangements of the new recruit, will set the quantum, performance measures and vesting schedule for any restricted share awards. There is currently no intention to make awards to any Executive Director in the forthcoming financial year.
Other plans
The Stock Appreciation Rights Plan (“SARP”) is used to exactly replicate the plans described above but rewards are delivered as a cash equivalent. It is used in exceptional cases only for countries in which tax or legal issues preclude the use of real shares or share options. No Executive Director has ever received awards under this plan.
Performance conditions for share based awards
TSR is the main performance measure used in the SOP, the Deferred STIP and the PSP as it provides an objective external measure of financial performance.
The Remuneration Committee believes that it is important to measure and reward relative performance against an appropriate set of companies. The Company’s relative TSR performance is assessed against a comparator group comprising the FTSE Global Telecoms Sector Index (“FTSE GTSI”), which provides a global benchmark of independently selected industry peers.
TSR is share price growth adjusted for dividends and capital actions. TSR performance is averaged over a three-month period at the beginning and end of the performance period. This moderates the effect of short-term share price volatility.
Back to Contents
Awards vest depending upon the Company’s TSR ranking relative to the comparator group at the end of a single three-year performance period.
Following feedback from leading investors, the vesting schedules outlined below for future SOP and PSP awards have been made significantly more challenging than was previously the case under these plans.
| Future vesting schedule |
|---|
|
|---|
| | Level of vesting under | |
|---|
| |
| |
|---|
| Ranking | Deferred STIP | | SOP | | PSP | |
|---|
| | | | | | | | | | | |
| | Below median | | No match | | | 0 | % | | 0 | % |
| | Median | | 1:2 match | | | 33.33 | % | | 33.33 | % |
| | Upper quartile | | 2:1 match | | | 100 | % | | 100 | % |
|
|---|
| Previous vesting schedule |
|---|
|
|---|
| | Level of vesting under | |
|---|
| |
| |
|---|
| Ranking | Deferred STIP | | SOP | | PSP | |
|---|
| | | | | | | | | | | |
| | Below median | | No match | | | 0 | % | | 0 | % |
| | Median | | 1:2 match | | | 50 | % | | 40 | % |
| | Upper quartile | | 2:1 match | | | 100 | % | | 100 | % |
|
|---|
In order for any matching shares, share options or performance shares to vest, the Remuneration Committee has now decided that it must also be satisfied that the underlying financial performance of the Group warrants the release of the shares determined by the Company’s TSR performance. The Committee has up to 12 months after the end of the performance period to judge the underlying performance. Specific Committee decisions will be explained in future Remuneration Reports.
Changes to the 2001 Incentive Plan to incorporate these tougher targets were approved by shareholders at the AGM.
Performance graphs
The graph below shows the change in value of a hypothetical £100 holding in the Company’s Ordinary Shares over five years relative to a broad equity market index. The FTSE 100 index was considered by the Remuneration Committee to be the most relevant index for this purpose as the Company is a constituent of the index and a five-year history is available.
|
| Total shareholder return | Source: Thomson Financial |
| |

Value (£)
£120
£80
£100
£60
£40
£20
£0
31 Mar 00
31 Mar 01
31 Mar 02
31 Mar 03
31 Mar 04
31 Mar 05
C & W
FTSE 100
| |
| This graph looks at the value, by 31 March 2005, of £100 invested in Cable & Wireless on 31 March 2000 compared with the value of £100 invested in the FTSE 100 Index. The other points plotted are the values at intervening financial year-ends. |
|
The following graph shows the change in value of a hypothetical £100 holding in Cable & Wireless Ordinary Shares over four years against the FTSE GTSI. The FTSE GTSI is the comparator group against which relative performance is assessed under the SOP, Deferred STIP and PSP. This index was only created in February 2001, therefore comparative TSR performance can only be provided for the last four financial years
|
| Total shareholder return | Source: Thomson Financial |
| |

Value (£)
£0
£20
£100
£80
£60
£40
31 Mar 01
31 Mar 05
31 Mar 02
31 Mar 03
31 Mar 04
C & W
FTSE 100
| |
| This graph looks at the value, by 31 March 2005, of £100 invested in Cable & Wireless on 31 March 2001 compared with the value of £100 invested in the FTSE Global Telecoms Index. The other points plotted are the values at intervening financial year-ends. |
|
Dilution
The Remuneration Committee ensures that at all times the number of new shares which may be issued under any share option or share-based plans, including all-employee plans, does not exceed the dilution limit of 10 per cent of the Company’s issued share capital over any ten-year rolling period. As at 31 March 2005, 2.7 per cent of the issued shared capital was available for issue under the Company’s share-based plans.
Awards under the various plans are funded by a mix of purchased and newly issued shares, as determined by the Remuneration Committee. Newly issued shares are subject to the dilution limit outlined above. Purchased shares, which are held by the Cable & Wireless Employee Share Ownership Plan Trust, are subject to a limit of 5 per cent of the issued Ordinary Share capital of the Company.
Pension and other benefits
Francesco Caio, Harris Jones, Charles Herlinger and George Battersby participate in the Cable & Wireless Lifetime Benefits Plan,
Back to Contents
Corporate governance
Directors’ remuneration report
a defined contribution scheme approved by the Inland Revenue. Robert Rowley and Lord Robertson of Port Ellen do not receive any Company provided pension benefits. Further details of the pension benefits earned in the year to 31 March 2005 can be found in the Directors’ Remuneration table on pages 49 to 50.
The Executive Directors are eligible to participate in employee benefit programmes including life, disability and health insurance plans and, where appropriate, receive relocation expenses. The value of these benefits is included in the Directors’ Remuneration table on pages 49 to 50.
Executive Directors are also eligible to participate in all-employee share schemes and savings plans applicable in their home countries. These include the Cable & Wireless Savings Related Share Options Scheme and the Cable & Wireless Share Purchase Plan – further details can be found in Note 23 to the Financial Statements.
Executive Directors’ service contracts
Policy
The Remuneration Committee’s policy is that new Executive Directors’ service contracts should contain a maximum notice period of one year. A longer notice period may apply initially, where this is required to secure the services of high calibre executives in exceptional circumstances, but in all cases the notice period will reduce to one year or less after two years.
In the event of early termination, the Remuneration Committee will, within legal constraints, determine the approach to be taken according to the circumstances of each individual case, taking full account of the departing Executive Director’s obligation to mitigate loss. Except in cases of early termination for cause, the Remuneration Committee will take into account the relevant Executive Director’s current salary, notice period and contractual benefits when calculating any liability of the Company. The principal contractual benefits provided in addition to salary are pension and life insurance. Annual bonuses and long-term incentives are granted at the discretion of the Remuneration Committee and therefore would be dealt with in accordance with the rules of the relevant schemes. A significant proportion of each Executive Director’s total remuneration is subject to performance conditions and therefore will not be payable to the extent that the relevant targets are not met.
Current Directors
Directors’ service contracts continue until their normal retirement date.
The service contracts of Executive Directors contain a clause that governs a change of control. In the event of a change of control of the Company, if the executive’s employment is adversely changed, then a change of control provision will be triggered.
In these circumstances, the executive will receive a payment equal to their notice period and a pro-rated bonus under the STIP (to the extent that the executive would have been awarded a bonus in respect of the year during which their employment terminates). The executive’s entitlements under the Deferred STIP, the PSP, the SOP and the RSP will be those applicable in the case of termination of employment by reason of redundancy or early retirement under the prevailing rules of each plan.
The Executive Directors’ service contracts contain no other provisions for compensation payable on early termination.
Former Directors
Kevin Loosemore’s contract was dated 2 April 2003 and continued until his departure as an employee on 31 March 2005. The notice period under contract was two years until 2 April 2005 and one year thereafter, however he agreed to a reduced period of one year. He resigned from the Board on 1 December 2004.
Chairman
The Chairman, Richard Lapthorne, has been appointed for an initial fixed term of three years from 10 January 2003 and continuing until terminated by either party. The appointment will be terminable by either party serving not less than six months’ prior written notice expiring on the anniversary of the appointment, save that no notice can take effect prior to the expiry of the initial three-year term. Richard Lapthorne receives an annual fee of £386,000, which is fixed for the three-year term.
The Chairman is committed to retaining at least 500,000 Ordinary Shares throughout his service as a Director.
If Richard Lapthorne’s appointment is terminated by reason of death
| |
|---|
| Current Directors |
|
|---|
| | Date of contract | | Notice period | |
|---|
| | | | | | |
| | Francesco Caio | 2 April 2003 | | One year | |
| | Harris Jones | 29 November 2004 | | Two years until June 2005, reducing to one year by June 2006 | |
| | Charles Herlinger | 26 July 2003 | | Two years until December 2005, one year thereafter | |
| | George Battersby | 27 July 2004 | | One year | |
| | Lord Robertson of Port Ellen | 1 February 2004 | | Fixed term until February 2007, one year thereafter | |
| | Rob Rowley | 1 February 2003 | | Fixed term until August 2005, six months thereafter | |
|
|---|
Back to Contents
or by the Company otherwise than by due notice or if there is a change of control, he or his personal representatives shall be entitled to an immediate payment equivalent to his fee for the balance of the period ending on the earliest date on which the appointment would have been terminated if the Company had given the requisite prior written notice, unless in the case of a change of control he remains a Chairman of the Company on similar terms.
Non-executive Directors
The Non-executive Directors do not have service contracts with the Company, but instead have letters of appointment, which are available at the Company’s registered office. Their fees are determined by the Board, within the limits set out in the Company’s Articles of Association, with Non-executive Directors abstaining from any discussion or decision on their fees. Fee levels reflect the Directors’ responsibilities, the committees on which they serve and the general market conditions for their services. Full details of the fees paid in the year ended 31 March 2005 are set out in the Directors’ Remuneration table and the associated notes on pages 49 to 50. The Non-executive Directors do not receive any pension.
Base fees paid to each Non-executive Director have been fixed for a three-year period from 1 March 2004 or date of appointment if later than 1 March 2004 at the following levels:
|
| | Tony Rice | £ | 90,000 | 1 |
| | Bernard Gray | £ | 75,000 | 2 |
| | Graham Howe | £ | 65,000 | |
| | Kasper Rorsted | £ | 65,000 | |
| | Kate Nealon | £ | 65,000 | |
| | Agnès Touraine | £ | 65,000 | |
|
1 Includes £25,000 for role as Chairman of the Group Audit Committee
2 Includes £10,000 for role as Chairman of the Remuneration
Committee
Bernard Gray and Tony Rice have been appointed for a three-year term commencing on 21 January 2003, with the expectation that a further three-year term will follow.
Graham Howe and Kasper Rorsted have been appointed for a three-year term commencing on 27 May 2003, with the expectation that a further three-year term will follow.
Kate Nealon and Agnès Touraine have been appointed for a three-year term commencing on 18 January 2005, with the expectation that a further three-year term will follow.
After two three-year terms, the period may be extended on an annual basis at the invitation of the Chairman. Termination of the appointment may be earlier at the discretion of either party on one month’s written notice.
None of the Non-executive Directors are entitled to any compensation if their appointment is terminated.
Of these Non-executive Directors the following have undertaken to purchase the following number of Ordinary Shares in the Company
on 4 June 2004, 4 June 2005 and 4 June 2006 at 103.5 pence per Ordinary Share:
|
| Director | Number of Ordinary Shares | |
|---|
| | | | | |
| | Bernard Gray | | 100,000 | |
| | Graham Howe | | 100,000 | |
| | Tony Rice | | 100,000 | |
| | Kasper Rorsted | | 30,000 | |
|
The Non-executive Directors are expected to hold the purchased Ordinary Shares for a minimum period of three years from the date of purchase and to hold a minimum of 30,000 shares throughout their service as a Director. None of the benefits under the arrangement is pensionable. There is no intention to offer similar share purchase arrangements to Non-executive Directors in the future.
Executive Directors’ shareholding requirement
The Company operates a policy of encouraging Executive Directors (including the Chief Executive) to closely align their interests with shareholders by requiring them to build up and maintain a holding of Ordinary Shares in the Company to the value of at least twice their base salary. This is to be achieved through the retention of any net awards received from the short and long-term incentive plans described above.
External Directorships
The Company allows Executive Directors to hold Non-executive directorship and retain the fees received from that role. Full time Executive Directors including the CEO, are only entitled to hold up to one external directorship.
The following provides details of Non-executive directorships held, and the annual fees for the financial year 2004/05.
| Francesco Caio | | | |
| Non-executive Director of Netscalibur Italia SpA | | No fee | |
| Harris Jones | | | |
| Non-executive Director of Caracal Inc | | No fee | |
| Lord Roberston | | | |
| Non-executive Director of Weir Group Plc including | | | |
| membership of the Nomination Committee | £ | 32,000 | |
| Non-executive Director of Smiths Group Plc | | | |
| including membership of the Audit and | | | |
| Nomination Committee | £ | 40,000 | |
| Rob Rowley | | | |
| Non-executive Director of Prudential Plc including | | | |
| Chairmanship of the Audit Committee | £ | 90,000 | |
| Non-executive directorship of Liberty International Plc, | | | |
| including membership of the Chairman’s Committee | £ | 24,390 | |
| Non-executive directorship of Taylor Nelson Sofres plc | | | |
| including membership of the Audit, Remuneration and | | | |
| Nomination Committees and senior Independent | | | |
| Directorship | £ | 38,750 | |
| George Battersby | | | |
| Non-executive Director of SHL Group Plc including | | | |
| Chairmanship of the Remuneration Committee | £ | 25,000 | |
Back to Contents
Corporate governance
Directors’ remuneration report
Directors’ shareholdings
The beneficial interests of the Directors and their immediate families in the Ordinary Shares of the Company were as follows:
|
|---|
| Director | As at
1 April 2004
(or date of
appointment
if later) | | Shares
acquired | | As at
31 March
2005 | | Per cent
of class | |
|---|
| | | | | | | | | | | | |
| | Richard Lapthorne2 | 2,600,000 | | | — | | | 2,600,000 | | * | |
| | Francesco Caio1 3 | 383,632 | | | 41,667 | | | 425,299 | | * | |
| | Lord Robertson of Port Ellen1 3 | — | | | 3,009 | | | 3,009 | | | |
| | Rob Rowley1 3 | 436,214 | | | 61,156 | | | 497,370 | | * | |
| | George Battersby1 | — | | | 1,318 | | | 1,318 | | | |
| | Charles Herlinger1 3 | — | | | 31,401 | | | 31,401 | | | |
| | Harris Jones1 | 220,750 | | | — | | | 220,750 | | | |
| | Bernard Gray | — | | | 100,000 | | | 100,000 | | | |
| | Graham Howe | — | | | 100,000 | | | 100,000 | | | |
| | Kate Nealon | — | | | — | | | — | | | |
| | Tony Rice | — | | | 100,000 | | | 100,000 | | | |
| | Kasper Rorsted | — | | | 30,000 | | | 30,000 | | | |
| | Agnès Touraine | — | | | — | | | — | | | |
|
|---|
1 As potential beneficiaries from outstanding awards, which may be satisfied by shares held by the Cable & Wireless Employee Share Ownership Trust, Francesco Caio, Charles Herlinger, Harris Jones, George Battersby, Lord Robertson of Port Ellen and Rob Rowley are deemed, by the Companies Act 1985, to have an interest in all of the Ordinary Shares held by the Trust, which at 31 March 2005, amounted to 54,759,057 shares.
2 1,000,000 of Richard Lapthorne’s shares will be returned to the Company if, before 10 January 2006, he ceases to be Chairman of the Company or fails to retain beneficial ownership of the 1,000,000 Ordinary Shares he acquired on 10 January 2003.
3 Included in the shares acquired during the year are shares purchased under the Deferred STIP and any dividends received on the purchased shares which are converted into additional shares.
* Less than one per cent
Between 31 March 2005 and 26 August 2005 there were the following changes to the Directors’ shareholdings: Rob Rowley purchased 479 Ordinary Shares, Charles Herlinger purchased 21 Ordinary Shares and George Battersby purchased 22 Ordinary Shares all under the Share Purchase Plan.
Back to Contents
Directors’ remuneration
The following sections of the Directors’ Remuneration Report have been subject to audit. |
|
|---|
| Name of Director | Salary and
fees
£ | | Bonuses
£ | | Other
benefits
Note 2
£ | | Compensation
for loss of
office
£ | | Pension
cash
allowance
Note 5
£ | | Total 2005
£ | | Total 2004
£ | | Employer
pension
contribution
2005
Note 5
£ | | Employer
pension
contribution
2004
£ | |
|---|
| | | | | | | | | | | | | | | | | | | | | | | | | | | | |
| Chairman | | | | | | | | | | | | | | | | | | | | | | | | | | | |
| Richard Lapthorne | | 386,000 | | | — | | | 10,520 | | | — | | | — | | | 396,520 | | | 394,949 | | | — | | | — | |
| | | | | | | | | | | | | | | | | | | | | | | | | | | | |
| Current Executive Directors | | | | | | | | | | | | | | | | | | | | | | | | | | | |
| Francesco Caio | | 700,000 | | | 854,000 | | | 195,907 | | | — | | | 175,000 | | | 1,924,907 | | | 2,188,278 | | | — | | | 116,666 | |
| Harris Jones | | 170,454 | | | 197,137 | | | 55,956 | | | — | | | 42,614 | | | 466,161 | | | — | | | — | | | — | |
| (from 1 December 2004) | | | | | | | | | | | | | | | | | | | | | | | | | | | |
| Charles Herlinger | | 400,000 | | | 320,000 | | | 408,487 | | | — | | | 56,000 | | | 1,184,487 | | | 278,112 | | | 44,012 | | | 14,666 | |
| Note 6 | | | | | | | | | | | | | | | | | | | | | | | | | | | |
| George Battersby | | 238,636 | | | 283,500 | | | 11,070 | | | — | | | 31,023 | | | 564,229 | | | — | | | 32,136 | | | — | |
| (from 27 July 2004) | | | | | | | | | | | | | | | | | | | | | | | | | | | |
| Note 7 | | | | | | | | | | | | | | | | | | | | | | | | | | | |
| Lord Robertson of Port Ellen | | 204,167 | | | 202,500 | | | 14,934 | | | — | | | — | | | 421,601 | | | 64,800 | | | — | | | — | |
| Rob Rowley | | 250,000 | | | 202,500 | | | 184 | | | — | | | — | | | 452,684 | | | 958,673 | | | — | | | — | |
| | | | | | | | | | | | | | | | | | | | | | | | | | | | |
| Current Non-executive Directors | | | | | | | | | | | | | | | | | | | | | | | | | | | |
| Bernard Gray | | 75,000 | | | — | | | 1,204 | | | — | | | — | | | 76,204 | | | 58,098 | | | — | | | — | |
| Graham Howe | | 65,000 | | | — | | | — | | | — | | | — | | | 65,000 | | | 43,674 | | | — | | | — | |
| Kate Nealon (from 18 January 2005) | | 13,412 | | | — | | | — | | | — | | | — | | | 13,412 | | | — | | | — | | | — | |
| Tony Rice | | 90,000 | | | — | | | — | | | — | | | — | | | 90,000 | | | 76,250 | | | — | | | — | |
| Kasper Rorsted | | 65,000 | | | — | | | 1,824 | | | — | | | — | | | 66,824 | | | 43,674 | | | — | | | — | |
| Agnès Touraine (from 18 January 2005) | | 13,412 | | | — | | | — | | | — | | | — | | | 13,412 | | | — | | | — | | | — | |
| | | | | | | | | | | | | | | | | | | | | | | | | | | | |
| Former Directors | | | | | | | | | | | | | | | | | | | | | | | | | | | |
| Kevin Loosemore | | 326,667 | | | 367,500 | | | 34,741 | | | 612,500 | | | 77,681 | | | 1,419,089 | | | 1,238,424 | | | 4,000 | | | 6,000 | |
| (until 1 December 2004) | | | | | | | | | | | | | | | | | | | | | | | | | | | |
| Note 3 | | | | | | | | | | | | | | | | | | | | | | | | | | | |
| Dr Janet Morgan | | 20,189 | | | — | | | 134 | | | — | | | — | | | 20,323 | | | 51,365 | | | — | | | — | |
| (until 22 July 2004) | | | | | | | | | | | | | | | | | | | | | | | | | | | |
| |
| Totals | | 3,017,937 | | | 2,427,137 | | | 734,961 | | | 612,500 | | | 382,318 | | | 7,174,853 | | | 5,396,297 | | | 80,148 | | | 137,332 | |
| |
Back to Contents
Corporate governance
Directors’ remuneration report
Notes
1. The aggregate emoluments of the Directors, which exclude compensation for loss of office, were £6,562,353 (2004 – £6,319,991).
2. In compliance with the Companies Act 1985, ‘Other benefits’ includes the reimbursement of costs associated with staff entertaining, relocation and the value of benefits in kind relating to Company provided life assurance, professional advice, travel and accommodation.
3. Kevin Loosemore resigned as a Director of the Company on 1 December 2004 but remained as an employee until 31 March 2005. The figures in the table above represent his earnings as a director. He also received salary of £163,333 and pension and other benefits of £41,124 (excluding bonus) as an employee during this financial year. Kevin Loosemore was contractually entitled to compensation for a notice period of two years but agreed to a reduced settlement. Compensation for loss of office in the table above, therefore, represents one year’s salary and employer’s pension contributions.
4. David Prince resigned as a Director of the Company on 30 November 2003 but remained an employee until 3 June 2004. He received a salary of £72,212, pension benefits of £16,236 and annual bonus of £201,771 as an employee during this financial year.
5. ‘Employer pension contributions’ list the Company contributions paid into Directors’ defined contribution pension plans. Company pension contributions that would otherwise have breached the Inland Revenue’s funding limit have instead been paid to the Director as an annual cash allowance. An amount of £12.5 million (2004 – £12.1 million) is included in provisions to cover the cost of former Directors’ pension entitlements.
6. Charles Herlinger was reimbursed for relocation and moving related expenses during the financial year that were incurred in 2003/04.
7. The performance bonus for George Battersby has not been pro-rated for the nine months that he served as a director. The Remuneration Committee felt that this was appropriate given the significant amount of time that he spent on Company business in the months prior to joining the Board on 27 July 2004 and for which he did not receive payment.
Back to Contents
| Directors’ share options | |
| |
| Name of Director | Scheme | | Grant date | | Date from
which first
exercisable
| | Date
of expiry
of option
| | Exercise
price
(pence)
| | Shares under
option at
1 April 2004
(or date of
appointment
if later)
| | Granted
between
1 April 2004
and
31 March
2005
| | Exercised | | Lapsed
cancelled or
forfeited
| | Shares under
option at
31 March 2005
(or date
of leaving
if earlier)
| |
| | | | | | | | | | | | | | | | | | | | | |
| Francesco Caio | | | | | | | | | | | | | | | | | | | | |
| | SOP Approved | | 26/6/03 | | 26/6/06 | | 25/6/10 | | 103.7 | | 28,929 | | — | | — | | — | | 28,929 | |
| | SOP Unapproved | | 26/6/03 | | 26/6/06 | | 25/6/10 | | 103.7 | | 2,671,167 | | — | | — | | — | | 2,671,167 | |
| | SOP Unapproved | | 3/8/04 | | 3/8/07 | | 2/8/11 | | 108 | | — | | 1,946,000 | | — | | — | | 1,946,000 | |
| | SAYE | | 4/7/03 | | 1/9/06 | | 28/2/07 | | 89 | | 10,393 | | — | | — | | — | | 10,393 | |
| |
| | | | | | | | | | | | 2,710,489 | | 1,946,000 | | — | | — | | 4,656,489 | |
| |
| Harris Jones | SOP Approved | | 1/12/04 | | 1/12/07 | | 30/11/11 | | 113.55 | | 26,420 | | — | | — | | — | | 26,420 | |
| (from 1 December 2004 ) | SOP Unapproved | | 1/12/04 | | 1/12/07 | | 30/11/11 | | 113.55 | | 1,734,918 | | — | | — | | — | | 1,734,918 | |
| |
| | | | | | | | | | | | 1,761,338 | | — | | — | | — | | 1,761,338 | |
| |
| Charles Herlinger | SOP Approved | | 15/12/03 | | 15/12/06 | | 14/12/10 | | 135.7 | | 22,107 | | — | | — | | — | | 22,107 | |
| | SOP Unapproved | | 15/12/03 | | 15/12/06 | | 14/12/10 | | 135.7 | | 1,156,964 | | — | | — | | — | | 1,156,964 | |
| | SOP Unapproved | | 3/8/04 | | 3/8/07 | | 2/8/11 | | 108 | | — | | 927,000 | | — | | — | | 927,000 | |
| | SAYE | | 30/6/04 | | 1/9/07 | | 29/2/08 | | 102.6 | | — | | 9,186 | | — | | — | | 9,186 | |
| |
| | | | | | | | | | | | 1,179,071 | | 936,186 | | — | | — | | 2,115,257 | |
| |
| George Battersby | SOP Approved | | 3/8/04 | | 3/8/07 | | 2/8/11 | | 108 | | — | | 27,777 | | — | | — | | 27,777 | |
| (from 27 July 2004 ) | SOP Unapproved | | 3/8/04 | | 3/8/07 | | 2/8/11 | | 108 | | — | | 783,223 | | — | | — | | 783,223 | |
| |
| | | | | | | | | | | | — | | 811,000 | | — | | — | | 811,000 | |
| |
| Kevin Loosemore | SOP Approved | | 26/6/03 | | 26/6/06 | | 25/6/10 | | 103.7 | | 28,929 | | — | | — | | — | | 28,929 | |
| (until 1 December 2004 ) | | | | | | | | | | | Note 4 | | | | | | | | | |
| | SOP Unapproved | | 26/6/03 | | 26/6/06 | | 26/6/10 | | 103.7 | | 1,861,139 | | — | | — | | — | | 1,861,139 | |
| | | | | | | | | | | | Note 4 | | | | | | | | | |
| | SOP Unapproved | | 3/8/04 | | 3/8/07 | | 2/8/11 | | 108 | | — | | 1,135,000 | | — | | (914,306) | | 220,694 | |
| | | | | | | | | | | | — | | Note 4 | | | | | | | |
| | SAYE | | 4/7/03 | | 1/9/06 | | 28/2/07 | | 89 | | 10,393 | | — | | — | | — | | 10,393 | |
| | | | | | | | | | | | Note 4 | | | | | | | | | |
| |
| | | | | | | | | | | | 1,900,461 | | 1,135,000 | | — | | (914,306) | | 2,121,155 | |
| |
| Lord Robertson of Port Ellen | SOP Approved | | 6/2/04 | | 6/2/07 | | 5/2/11 | | 143.25 | | 20,942 | | — | | — | | — | | 20,942 | |
| | SOP Unapproved | | 6/2/04 | | 6/2/07 | | 5/2/11 | | 143.25 | | 537,522 | | — | | — | | — | | 537,522 | |
| | SOP Unapproved | | 3/8/04 | | 3/8/07 | | 2/8/11 | | 108 | | — | | 463,000 | | — | | — | | 463,000 | |
| |
| | | | | | | | | | | | 558,464 | | 463,000 | | — | | — | | 1,021,464 | |
| |
| Rob Rowley | SOP Approved | | 26/6/03 | | 26/6/06 | | 25/6/10 | | 103.7 | | 28,929 | | — | | — | | — | | 28,929 | |
| | SOP Unapproved | | 26/6/03 | | 26/6/06 | | 25/6/10 | | 103.7 | | 935,391 | | — | | — | | — | | 935,391 | |
| | SOP Unapproved | | 3/8/04 | | 3/8/07 | | 2/8/11 | | 108 | | — | | 579,000 | | — | | — | | 579,000 | |
| | SAYE | | 4/7/03 | | 1/9/08 | | 28/2/09 | | 89 | | 17,893 | | — | | — | | — | | 17,893 | |
| |
| | | | | | | | | | | | 982,213 | | 579,000 | | — | | — | | 1,561,213 | |
| |
Back to Contents
Corporate governance
Directors’ remuneration report
Notes
1. SOP Approved and Unapproved – Inland Revenue approved and unapproved grants respectively made under the Share Option Plan (see page 44 for details). The vesting of options awarded under the SOP is subject to relative TSR performance conditions. Full vesting occurs only if the Company’s TSR performance ranks at or above the upper quartile of a comparator group comprising FTSE Global Telecoms companies. For median ranking, 50 per cent of the award vests. A sliding scale operates between median and upper quartile, and nothing vests for TSR performance below the median. For awards granted after May 2004, performance will be measured over a single three-year performance period. For earlier grants, performance is able to be re-tested until the fifth anniversary of the grant.
2. C&W SAYE – Cable & Wireless Save As You Earn share option scheme. These options are not subject to performance conditions because this is an all-employee scheme governed by specific tax legislation.
3. Nil price was paid by Directors for the award of the options listed in the table above.
4. In accordance with the rules of the SOP prevailing at the date of grant, the 2003 option grant for Kevin Loosemore is exercisable for 12 months until 31 March 2006. The outstanding 2004 option grant has been time pro-rated and will be exercisable for 24 months following the end of the normal performance period but only to the extent that the TSR performance condition is satisfied. In accordance with the rules of the SAYE scheme, these options are exercisable for 6 months until 30 September 2005.
5. The closing mid-market price of an Ordinary Share on 31 March 2005 was 129.25 pence. The highest closing mid-market price of an Ordinary Share during the year was 133.5 pence and lowest closing mid-market price was 96.50 pence.
6. No Directors had any gains on the exercise of share options in the years ended 31 March 2004 or 31 March 2005.
7. On 25 August 2005 the following Directors were granted Share Options in accordance with the Cable & Wireless Incentive Plan (see page 43 for details). The Options are exercisable from 25 August 2008 to 24 August 2012 subject to performance conditions during the performance period starting on 1 July 2005 and ending on 30 June 2008.
| Francesco Caio | | 1,364,522 | |
| Harris Jones | | 812,215 | |
| Charles Herlinger | | 649,772 | |
| George Battersby | | 568,551 | |
| Rob Rowley | | 406,107 | |
| Lord Robertson of Port Ellen | | 406,107 | |
Back to Contents
| Directors’ Deferred Short Term Incentive Plan (“STIP”) and Restricted Share Plan Awards | |
| |
| Name of Director | Scheme | | Award
date
| | Vesting
date
| | Market price
on date of
award
(pence)
| | Shares under
award at
1 April 2004
(or date of
appointment
if later)
| | Shares
awarded
between
1 April 2004
and
31 March
2005
| | Shares
vested
| | Shares
lapsed,
cancelled
or forfeited
| | Shares under
award at 31
March 2005
(or date of
cessation if
earlier)
| |
| | | | | | | | | | | | | | | | | | | |
| Francesco Caio | Restricted | | 4/6/03 | | 4/6/06 | | 97.75 | | 383,632 | | — | | — | | — | | 383,632 | |
| | Share Plan | | | | | | | | Note 1 | | | | | | | | | |
| | Deferred STIP | | 17/08/04 | | 25/6/07 | | 105.75 | | — | | 80,182 | | — | | — | | 80,182 | |
| | (matching shares) | | | | | | | | | | Note 6 | | | | | | | |
| | Deferred STIP | | 13/8/04 | | 25/6/07 | | 102.25 | | — | | 2,340 | | — | | — | | 2,340 | |
| | (matching dividend shares) | | | | | | | | | | | | | | | | | |
| | Deferred STIP | | 11/2/05 | | 25/6/07 | | 130 | | — | | 812 | | — | | — | | 812 | |
| | (matching dividend shares) | | | | | | | | | | | | | | | | | |
| |
| | | | | | | | | | 383,632 | | 83,334 | | — | | — | | 466,966 | |
| |
| Harris Jones | Restricted | | 1/12/04 | | 1/12/07 | | 113 | | 220,750 | | — | | — | | — | | 220,750 | |
| (from 1 December 2004) | Share Plan | | | | | | | | Note 2 | | | | | | | | | |
| | (matching shares) | | | | | | | | | | | | | | | | | |
| | Restricted share plan | | 1/12/04 | | 1/12/07 | | 113 | | 441,500 | | — | | — | | — | | 441,500 | |
| | (performance shares) | | | | | | | | Note 3 | | | | | | | | | |
| |
| | | | | | | | | | 662,250 | | — | | — | | — | | 662,250 | |
| |
| Charles Herlinger | Restricted | | 15/12/03 | | 1/12/06 | | 135.7 | | 250,000 | | — | | — | | — | | 250,000 | |
| | Share Plan | | | | | | | | Note 4 | | | | | | | | | |
| | Deferred STIP | | 17/08/04 | | 25/6/07 | | 105.75 | | — | | 57,944 | | — | | — | | 57,944 | |
| | (matching shares) | | | | | | | | | | Note 6 | | | | | | | |
| | Deferred STIP | | 13/8/04 | | 25/6/07 | | 102.25 | | — | | 1,691 | | — | | — | | 1,691 | |
| | (matching dividend shares) | | | | | | | | | | | | | | | | | |
| | Deferred STIP | | 11/2/05 | | 25/6/07 | | 130 | | — | | 586 | | — | | — | | 586 | |
| | (matching dividend shares) | | | | | | | | | | | | | | | | | |
| |
| | | | | | | | | | 250,000 | | 60,221 | | — | | — | | 310,221 | |
| |
| Kevin Loosemore | Restricted | | 4/6/03 | | 4/6/06 | | 97.75 | | 383,632 | | — | | 383,632 | | — | | — | |
| (until 1 December 2004) | Share Plan | | | | | | | | | | | | | | | | Note 7 | |
| Note 7 | | | | | | | | | | | | | | | | | | |
| | Restricted | | 31/7/03 | | 31/7/06 | | 113.5 | | 110,132 | | — | | 110,132 | | — | | — | |
| | Share Plan | | | | | | | | | | | | | | | | Note 7 | |
| | Deferred STIP | | 17/08/04 | | 25/6/07 | | 105.75 | | — | | 85,186 | | — | | 63,890 | | 21,296 | |
| | (matching shares) | | | | | | | | | | Note 6 | | | | | | | |
| | Deferred STIP | | 13/8/04 | | 25/6/07 | | 102.25 | | — | | 2,486 | | — | | — | | 2,486 | |
| | (matching dividend shares) | | | | | | | | | | | | | | | | | |
| | Deferred STIP | | 11/2/05 | | 25/6/07 | | 130 | | — | | 862 | | — | | — | | 862 | |
| | (matching dividend shares) | | | | | | | | | | | | | | | | | |
| |
| | | | | | | | | | 493,764 | | 88,534 | | 493,764 | | 63,890 | | 24,644 | |
| |
| Rob Rowley | Restricted | | 4/6/03 | | 4/6/06 | | 97.75 | | 383,632 | | — | | — | | — | | 383,632 | |
| | Share Plan | | | | | | | | Note 5 | | | | | | | | | |
| | Deferred STIP | | 17/08/04 | | 25/6/07 | | 105.75 | | — | | 115,104 | | — | | — | | 115,104 | |
| | (matching shares) | | | | | | | | | | Note 6 | | | | | | | |
| | Deferred STIP | | 13/8/04 | | 25/6/07 | | 102.25 | | — | | 3,360 | | — | | — | | 3,360 | |
| | (matching dividend shares) | | | | | | | | | | | | | | | | | |
| | Deferred STIP | | 11/2/05 | | 25/6/07 | | 130 | | — | | 1,166 | | — | | — | | 1,166 | |
| | (matching dividend shares) | | | | | | | | | | | | | | | | | |
| |
| | | | | | | | | | 383,632 | | 119,630 | | — | | — | | 503,262 | |
| |
| Lord Robertson of Port Ellen | Deferred STIP | | 17/08/04 | | 25/6/07 | | 105.75 | | — | | 5,792 | | — | | — | | 5,792 | |
| | (matching shares) | | | | | | | | | | Note 6 | | | | | | | |
| | Deferred STIP | | 13/8/04 | | 25/6/07 | | 102.25 | | — | | 169 | | — | | — | | 169 | |
| | (matching dividend shares) | | | | | | | | | | | | | | | | | |
| | Deferred STIP | | 11/2/05 | | 25/6/07 | | 130 | | — | | 58 | | — | | — | | 58 | |
| | (matching dividend shares) | | | | | | | | | | | | | | | | | |
| |
| | | | | | | | | | — | | 6,019 | | — | | — | | 6,019 | |
| |
Back to Contents
Corporate governance
Directors’ remuneration report
Notes
1. Subject to Francesco Caio remaining an employee of the Company and retaining beneficial ownership until 4 June 2006 of the 383,632 Ordinary Shares he acquired on 4 June 2003, the Company will deliver these restricted shares to him. No performance conditions are attached to this award since it represents compensation for arrangements forfeited on leaving his previous employer.
2. Subject to Harris Jones remaining an employee of the Company and retaining beneficial ownership until 1 December 2007 of the 220,750 Ordinary Shares he acquired on 1 December 2004, the Company will deliver these restricted shares to him. No performance conditions are attached to this award, as it was part of the terms felt to be necessary to secure his employment with the Company.
3. These performance share awards will be delivered by the Company to Harris Jones on the third anniversary of grant if he is still an employee of the Company, if he has retained beneficial ownership of the 220,750 Ordinary Shares he acquired on 1 December 2004 and if the Company’s TSR performance against a comparator group of FTSE Global Telecoms companies has been at least upper quartile. If TSR performance has been median, 25 per cent of the shares will be delivered, for performance between median and upper quartile, shares will be delivered on a pro-rata basis. No shares will be delivered for below median performance.
4. Subject to Charles Herlinger remaining an employee of the Company until December 2006 the Company will deliver these restricted shares to him. No other performance conditions are attached to this award.
5. Subject to Robert Rowley remaining an employee of the Company and retaining beneficial ownership until 4 June 2006 of the 383,632 Ordinary Shares he acquired on 4 June 2003, the Company will deliver these restricted shares to him. No other performance conditions are attached to this award.
6. These Deferred STIP matching awards will be delivered by the Company to the executive on the third anniversary of grant if the executive is still an employee of the Company, if the executive has retained beneficial ownership of the required number of Ordinary Shares and if the Company’s TSR performance against a comparator group of FTSE Global Telecoms companies has been at least upper quartile. The matching shares are based on one matching share for two purchased shares for median TSR performance, rising to two matching shares for one purchased share for performance at upper quartile or above. No matching shares are awarded for below median performance. A dividend award supplement also operates on the Plan. Dividends that would have been paid on purchased shares and the actual award of matching shares during the performance period are re-invested in additional shares.
7. Following the cessation of Kevin Loosemore’s employment on 31 March 2005, the Restricted Share Award with a value of £638,190 vested in full. The outstanding Deferred STIP awards (matching and dividend shares) were time pro-rated and remains subject to a TSR condition and will vest at the end of the performance period only to the extent that the condition is satisfied.
8. On 25 August 2005 the following Directors were granted performance share awards in accordance with the Cable & Wireless Incentive Plan (see page 43 for details). These awards will vest from 30 June 2008 subject to the performance conditions during the performance period starting on 1 July 2005 and ending on 30 June 2008.
| Francesco Caio | | 227,420 | |
| Harris Jones | | 162,443 | |
| Charles Herlinger | | 129,954 | |
| George Battersby | | 113,710 | |
| Rob Rowley | | 81,221 | |
| Lord Robertson of Port Ellen | | 81,221 | |
On behalf of the Board
Bernard Gray
Chairman, Remuneration Committee
3 June 2005
Back to Contents
Statement of Directors’ responsibilities in respect
of the preparation of the financial statements
United Kingdom company law requires the Directors to prepare financial statements for each financial year which give a true and fair view of the state of affairs of the Company and of the Group and of the profit or loss for that period. In preparing those Financial Statements, the Directors are required to:
| – | select suitable accounting policies and then apply them consistently; |
| | |
| – | make judgements and estimates that are reasonable and prudent; |
| | |
| – | state whether applicable accounting standards have been followed, subject to any material departures disclosed and explained in the financial statements; and |
| | |
| – | prepare the financial statements on the going concern basis unless it is inappropriate to presume that the Company or the Group will continue in business. |
The Directors are also responsible for keeping proper accounting records which disclose, with reasonable accuracy at any time, the financial position of the Company and of the Group and enable them to ensure that the financial statements comply with the Companies Act 1985. They have general responsibility for taking such steps as are reasonably open to them to safeguard the assets of the Group and to prevent and detect fraud and other irregularities.
The Directors confirm that they have complied with the above requirements in preparing the financial statements, and having a reasonable expectation that the Company has adequate resources to continue in operational existence for the foreseeable future, continue to adopt the going concern basis in preparing the financial statements.
Back to Contents
| | | |
| | | |
| | | Performance |
| | | | | |
| | | | | |
| | | |
| | | |
| | | Operating and
financial review |
| | | | | |
| | | 57 | | Overview |
| | | 59 | | Group financial performance |
| | | 66 | | Review by division |
| | | 75 | | Acquisitions |
| | | 76 | | Review by division – summary |
| | | 77 | | Liquidity and capital resources |
| | | 79 | | Capital expenditure |
| | | 80 | | Cash flow |
| | | 81 | | Property and network infrastructure |
| | | 82 | | Disclosures about market risk |
| | | 83 | | Five year summary |
| | | 84 | | Critical accounting policies |
| | | 87 | | Reconciliation of US GAAP and
of non-GAAP measures |
| | | 89 | | Risk factors |
| | | 93 | | Legal proceedings |
| | | | | |
| | | 96 | | Report of the independent public
accounting firm |
| | | | | |
| | | Financial statements |
| | | | | |
| | | 97 | | Consolidated profit and loss accounts |
| | | 100 | | Consolidated balance sheets |
| | | 101 | | Company balance sheets |
| | | 102 | | Consolidated cash flow statements |
| | | 103 | | Consolidated statements of total
recognised gains and losses |
| | | 104 | | Reconciliation of movements in
consolidated equity shareholders’ funds |
| | | 104 | | Reconciliation of movements in equity
shareholders’ funds for the Company |
| | | 105 | | Statement of accounting policies |
| | | 109 | | Notes to the financial statements |
| | | | | |
| | | | | |
Back to Contents
Overview
The following discussion on Operating and financial performance should be read in conjunction with the Business overview, the Financial statements and the notes thereto.
The Group’s continuing operations reported a profit before taxation and exceptional items of £361 million in 2005 as compared with £319 million in 2004 and £96 million in 2003. The Board has recommended the payment of a full year dividend of 3.8 pence per share. This represents a 21 per cent increase in the total dividend for 2005 compared with 2004.
| Continuing operations1 |
|
|---|
| | | 2005
£m | | 2004
£m | | 2003
£m | |
|---|
| | | | | | | | |
| | Group turnover | | 3,023 | | | 3,130 | | | 3,377 | |
| | | | | | | | | | | |
| | Profit before taxation and
exceptional items | | 361 | | | 319 | | | 96 | |
| |
| |
|
| | |
1 The full profit and loss account for the Group, which is prepared in accordance with UK GAAP, and from which the information above is extracted, is set out on pages 97 to 99 of the Financial statements. A reconciliation of ‘Continuing operations – Profit/(loss) before taxation and exceptional items’ to ‘Total Group – Profit/(loss) on ordinary activities before taxation’ for the three years presented, is set out on page 87 of the Operating and financial review. |
The markets in which the Group operates continued to suffer from excess capacity and price pressure. In this context, the Group has set priorities in efficiency and cost cutting as well as investing to continue to shift its revenue mix toward broadband, IP and mobile services.
In the year ended 31 March 2005, the Group completed the exit of its US domestic business, sold its Japanese business and entered the UK broadband market through the acquisition of Bulldog Communications Limited (“Bulldog”).
In the UK, the business has been reshaped around three customer-focused segments – Enterprise, Business and Carrier Services with Bulldog focused on the SoHo/Consumer segment. UK customers are also supported by the Group’s operations in Europe, Asia, and the US (CWAO), which are managed centrally from the UK.
The National Telcos have become more proactive in dealing with competition and have focused efforts on competing profitably in mobile and broadband, while continuing to pursue cost reduction. The National Telcos are seeking to reduce costs through a variety of initiatives including the ongoing consolidation of property portfolios and data centres, outsourcing the mobile supply chain in the Caribbean and leveraging the strengths of Group wide procurement.
Acquisitions and disposals
On 28 May 2004, the Group acquired Bulldog for a consideration of £18.6 million. Bulldog contributed turnover of £11 million and a total operating loss of £34 million for the period from acquisition to 31 March 2005.
On 18 June 2004, the Group acquired a 55 per cent economic interest in Monaco Telecom S.A.M (“Monaco Telecom”) for a total consideration of £108 million (€162 million). Monaco Telecom contributed turnover of £100 million and a total operating profit of £17 million for the period from acquisition to 31 March 2005.
On 17 February 2005, the Group completed the sale of its Japanese business, Cable & Wireless IDC Inc. (“IDC”) to Softbank Corp. for a consideration of £71.7 million comprising £62.3 million of cash and Softbank’s assumption of £9.4 million of debt. IDC contributed turnover of £199 million and a total operating profit of £13 million, from 1 April 2004 to disposal.
On 28 January 2005, the Group sold its 3.4 per cent stake in Intelsat (the satellite communications company) for cash consideration of £56 million (US$104.8 million).
United Kingdom
Total operating profit before exceptional items increased by £50 million to £82 million in 2005. The improvement in performance reflected reductions in operating costs and a lower depreciation charge following impairment write downs in the prior year. Turnover at £1,602 million was £59 million lower than 2004 primarily due to regulatory changes in fixed to mobile termination rates.
To reduce costs and protect margins, an in-depth review of the UK network was carried out and a programme was designed to address operating costs, interconnection costs and loading. As a result it is expected that the first phase of the programme will cut costs by £50 million in 2006. The Group believes these savings will mitigate the impact of continued pricing pressure.
This network review also supported the Group’s view of the benefits that can be achieved by moving to IP-based Next Generation Network architecture, and the associated IT systems and processes. In April 2005 we announced a programme to invest £190 million over three years to transform the core UK network into a single integrated IP platform. A large proportion of the planned expenditure is expected to replace expenditure that would otherwise have been necessary to maintain legacy UK systems. As a result the incremental spend associated with this Next Generation Network over the next three years is expected to be £35 million. The Group believes the benefit of this investment will give the ability to deliver next generation customer services over a less complex, highly scalable network capable of accommodating significant growth with lower operating and maintenance costs. The Group also believes the UK Next Generation Network will support customer demand for new services providing greater functionality and customised solutions on a competitive basis.
Back to Contents
Operating and financial review
Overview
Bulldog
The acquisition of Bulldog was an important step in advancing the Group’s access strategy. Local loop unbundling (“LLU”) strengthens Cable & Wireless’ presence in the access network market and addresses the needs of the SoHo/Consumer customer segment. The additional traffic would also increase the use of the existing core UK network.
LLU allows Bulldog to put its own equipment inside BT’s local exchanges to take control of the “last mile” copper link (the “local loop”) to the customer’s home or office. The Group believes access to the “last mile” improves end-to-end control of the network resulting in lower outpayments to BT and, hence, higher gross margins. The Group further believes this allows it to innovate, differentiate and control the end-to-end quality of services to business and residential customers.
In May 2005, Bulldog reached its initial target of unbundling 400 exchanges giving Bulldog coverage of 30 per cent of UK households.
It is now planned to unbundle an additional 200 exchanges by March 2006 and a further 200 exchanges in the first half of 2006/07 bringing the total number of exchanges unbundled to 800. This will increase the Group’s planned investment and start-up losses in 2006.
National Telcos
The National Telco markets are at different stages of liberalisation and each has its own customer profile, but their competitive challenges are similar. We expect to continue to respond to these challenges by:
| – | reducing the costs of legacy services, where margins are under pressure; |
| | |
| – | investing further in the key growth services of broadband, IP and mobile; and |
| | |
| – | developing sales and marketing skills to stay ahead of the competition. |
Many of the countries in which the National Telcos operate have relatively low take-up levels for broadband and IP. Cable & Wireless believes it is well positioned to offer services that assist customers in the transition. The Group has started to invest in IP backbones in those countries where traffic volumes justify the expenditure, including in the Caribbean where hurricane damage accelerated infrastructure replacement. Network upgrades are also under way in Monaco, Macau, the Cayman Islands and Grenada.
Hurricane Ivan adversely impacted Cayman and Grenada and, to a lesser extent, Jamaica. This resulted in exceptional operating costs of £18 million together with £3 million of asset write-offs and adversely impacted the Caribbean’s total operating profit before exceptional items by approximately £11 million.
Presentation of results
The analysis and commentary included in this Operating and financial review is based on the Group’s geographic operations and reflects the manner in which the business has been organised and managed. The results for IDC have been classified as discontinued and prior periods have been amended accordingly.
The Group’s operations are all considered to fall into one class of business, namely telecommunications.
The following sections set out, for each of the three years ended 31 March 2005, turnover, operating costs and operating profit or loss of the Group and of the operations: United Kingdom; CWAO; Europe; Asia; Bulldog; Caribbean; Panama; Macau; Monaco and Rest of the World.
Back to Contents
Group financial performancea
|
|---|
| | 2005
£m | | 2004
£m | | 2003
£m | |
|---|
| | | | |
|---|
| | Turnover | | | | | | | | | |
| | Continuing operations | | 3,023 | | | 3,130 | | | 3,377 | |
| |
| |
| | of which: continuing operations | | 2,912 | | | 3,130 | | | 3,377 | |
| | acquisitions1 | | 111 | | | — | | | — | |
| |
| |
| | Discontinued operations2 | | 199 | | | 541 | | | 1,014 | |
| |
| |
| | Group turnover | | 3,222 | | | 3,671 | | | 4,391 | |
| |
| |
| | Outpayments and network costs | | (1,763 | ) | | (2,005 | ) | | (2,453 | ) |
| | Staff costs | | (554 | ) | | (664 | ) | | (915 | ) |
| | Other | | (413 | ) | | (554 | ) | | (689 | ) |
| |
| |
| | Operating costs before depreciation, amortisation and exceptional items | | (2,730 | ) | | (3,223 | ) | | (4,057 | ) |
| | Depreciation (before exceptional items) | | (194 | ) | | (252 | ) | | (735 | ) |
| | Amortisation (before exceptional items) | | (7 | ) | | 3 | | | (126 | ) |
| | Share of operating profits in joint ventures and associates | | 40 | | | 41 | | | 75 | |
| |
| |
| | Total operating profit/(loss) before exceptional items | | 331 | | | 240 | | | (452 | ) |
| |
| |
| | of which: continuing operations (including 2005 acquisitions of (loss of £17 million)) | | 317 | | | 272 | | | (15 | ) |
| | discontinued operations | | 14 | | | (32 | ) | | (437 | ) |
| |
| |
| | Exceptional operating costs: | | | | | | | | | |
| | — depreciation | | (8 | ) | | (526 | ) | | (2,381 | ) |
| | — amortisation | | — | | | (10 | ) | | (2,725 | ) |
| | — other operating costs | | (145 | ) | | (244 | ) | | (442 | ) |
| |
| |
| | Total operating profit/(loss) | | 178 | | | (540 | ) | | (6,000 | ) |
| |
| |
| | of which: continuing operations (including 2005 acquisitions of (loss of £17 million)) | | 165 | | | (361 | ) | | (3,936 | ) |
| | discontinued operations | | 13 | | | (179 | ) | | (2,064 | ) |
| |
| |
| | Profit less (losses) on sale or termination of operations: non exceptional | | 3 | | | — | | | — | |
| | exceptional | | 116 | | | 250 | | | (147 | ) |
| | Profit less (losses) on disposal of fixed assets: non-exceptional | | 5 | | | 25 | | | — | |
| | exceptional | | 23 | | | 28 | | | 62 | |
| | Exceptional amounts written off investments | | — | | | — | | | (274 | ) |
| |
| |
| | Profit/(loss) on ordinary activities before interest | | 325 | | | (237 | ) | | (6,359 | ) |
| | Net interest and other similar income/(charges) | | 38 | | | 13 | | | 102 | |
| |
| |
| | Profit/(loss) on ordinary activities before taxation | | 363 | | | (224 | ) | | (6,257 | ) |
| | Tax on profit/(loss) on ordinary activities | | 14 | | | 12 | | | (36 | ) |
| |
| |
| | Profit/(loss) on ordinary activities after taxation | | 377 | | | (212 | ) | | (6,293 | ) |
| | Equity minority interests | | (75 | ) | | (25 | ) | | (124 | ) |
| |
| |
| | Profit/(loss) for the financial year | | 302 | | | (237 | ) | | (6,417 | ) |
| |
| |
|
| |
1 The Group acquired interests in Monaco Telecom and Bulldog Communications during the year. The effect of these acquisitions on the results for the year is set out on page 75. |
2 The Group sold its holdings in Cable & Wireless IDC Inc. (“IDC”) in Japan effective 17 February 2005. Under FRS 3 – “Reporting Financial Performance”, this business has been classified as discontinued. Comparatives for the years ended 31 March 2004 and 31 March 2003 have been amended accordingly. |
| |
a “Operating costs before depreciation, amortisation and exceptional items” is presented on the face of the profit and loss account. This is a non-UK GAAP financial measure which is used by management as a key performance measure. A reconciliation of the non-UK GAAP financial measure “Operating costs before depreciation, amortisation and exceptional items” to the GAAP financial measure of “Total operating costs”, by major geography, is set out on page 88 of the Operating and financial review. In accordance with guidance from the US Securities and Exchange Commission, as the Company presents an income statement with subtotals that exclude depreciation and amortisation, a reformatted condensed income statement in accordance with UK GAAP is included in the Summary of differences between United Kingdom and United States GAAP in Note 35. |
Back to Contents
Operating and financial review
Group financial performance
Year ended 31 March 2005 compared with year ended 31 March 2004
Cable & Wireless reported a profit for the year of £302 million compared with a loss for the year of £237 million in 2004, an improvement of £539 million. Depreciation and amortisation charges were £576 million lower in 2005 following significant impairment charges in 2004. The results in 2005 were further improved because of reduced other exceptional costs in 2005 at £145 million, compared with £244 million in 2004. Against this, the Group recorded exceptional credits of £116 million in 2005 compared with £250 million in 2004.
Continuing operations achieved a total operating profit before exceptional items of £317 million in 2005, compared with £272 million in 2004, an improvement of £45 million. The main drivers of the Group’s improved performance were the stronger UK performance together with the contribution from Monaco Telecom. These improvements were partially offset by the £11 million adverse impact on total operating profit before exceptional items in the Caribbean from Hurricane Ivan.
Total operating profit before exceptional items for discontinued operations was £14 million compared with losses of £32 million in 2004. In 2004, discontinued operations included the results of the Group’s operations in Japan (£(2) million), the US (£(40) million) and TeleYemen (£10 million).
Year ended 31 March 2004 compared with year ended 31 March 2003
Cable & Wireless reported a loss for the year of £237 million in 2004 compared with £6,417 million in 2003.
The Group’s total operating loss was £540 million in 2004, £5,460 million lower than in 2003 of which £1,885 million was attributable to the discontinued operations, mainly the United States.
Continuing operations reported a total operating loss of £361 million compared with £3,936 million in 2003. Tangible fixed asset and goodwill impairment charges of £414 million were recognised at 31 March 2004 and principally related to the businesses in the Caribbean, £207 million, the United Kingdom, £119 million and Panama, £65 million. This compares with tangible fixed asset and goodwill impairment charges of £3,770 million for continuing operations in 2003. In 2004, competition in the Caribbean and the consequent acceleration of the GSM roll-out led to a downward revision of expected cash flows from older TDMA assets. In the United Kingdom under-utilised cabling was written-down.
Total operating profit before exceptional items for continuing operations was £272 million in 2004 compared with a total operating loss before exceptionals in 2003 of £15 million. Charges for depreciation and amortisation before exceptional items decreased by £449 million, mainly reflecting the lower fixed asset base following asset impairments in 2003. Operating profit in continuing operations, before depreciation, amortisation and exceptional items was £453 million, £128 million or 22 per cent
lower than in 2003. A significant element of the National Telcos’ turnover and costs are denominated in currencies that are linked to the US dollar. As a consequence, reported results were adversely impacted by a 9 per cent strengthening of sterling against the US dollar and a 31 per cent strengthening against the Jamaica dollar. At constant currency, operating profit from continuing operations before exceptionals in 2004 more than doubled when compared with 2003.
| Group turnover |
|
|---|
| | 2005
£m | | 2004
£m | | 2003
£m | |
|---|
| | | | | | | | |
| | United Kingdom | | 1,602 | | | 1,661 | | | 1,684 | |
| | CWAO | | 16 | | | 11 | | | — | |
| | Europe | | 186 | | | 262 | | | 304 | |
| | Asia | | 39 | | | 32 | | | 79 | |
| | Bulldog | | 11 | | | — | | | — | |
| | | | | | | | | | | |
| | National Telcos | | | | | | | | | |
| |
| |
| | Caribbean | | 550 | | | 633 | | | 756 | |
| | Panama | | 257 | | | 265 | | | 279 | |
| | Macau | | 117 | | | 128 | | | 146 | |
| | Monaco | | 100 | | | — | | | — | |
| | Rest of the World | | 167 | | | 161 | | | 159 | |
| |
| |
| | Total National Telcos | | 1,191 | | | 1,187 | | | 1,340 | |
| | Inter-segment turnover | | (22 | ) | | (23 | ) | | (30 | ) |
| |
| |
| | Continuing operations | | 3,023 | | | 3,130 | | | 3,377 | |
| | Discontinued operations | | 199 | | | 541 | | | 1,014 | |
| |
| |
| | Group turnover | | 3,222 | | | 3,671 | | | 4,391 | |
| |
| |
|
Year ended 31 March 2005 compared with year ended 31 March 2004
Group turnover at £3,222 million in 2005 was £449 million, or 12 per cent, lower than in 2004. Turnover from continuing operations at £3,023 million, including £111 million from acquisitions made in the year, was £107 million or 3 per cent, lower in 2005 compared with 2004. At constant currency turnover from continuing operations was stable year on year.
Turnover in the United Kingdom at £1,602 million was £59 million lower in 2005 compared with 2004. This was principally due to the decline in Carrier Services turnover by 4 per cent to £733 million in 2005 following the regulated reduction in mobile termination rates from 1 September 2004. Business turnover in 2005 declined by 11 per cent, to £394 million, reflecting the high price erosion and churn levels experienced in this customer segment.
These reductions were partly offset by Enterprise turnover, which increased by 5 per cent to £475 million in 2005 as a result of continued expansion of sales to key financial services customers.
Back to Contents
The Caribbean turnover at £550 million in 2005 decreased by £83 million, or 13 per cent, compared with 2004. At constant currency, the Caribbean’s turnover decreased by 3 per cent in 2005 compared with 2004, reflecting the decline in international and domestic voice turnover throughout the year as well as the adverse impact of Hurricane Ivan, offset by growth in mobile turnover in 2005.
In Panama, international voice turnover fell by 22 per cent (14 per cent at constant currency) to £18 million and domestic voice turnover fell by 16 per cent (8 per cent at constant currency) to £117 million in 2005 due to increasing competition following the liberalisation of international and domestic voice services from 2 January 2003. These declines were in part offset by continued strong growth in mobile turnover which increased by 35 per cent (48 per cent at constant currency) to £77 million in 2005 reflecting strong growth in GSM mobile subscribers and an increase in the mobile market penetration in Panama. Data and IP and other turnover remained broadly stable at £45 million in 2005.
European turnover fell from £262 million in 2004 to £186 million primarily due to the full year impact of disposals of certain domestic businesses in continental Europe in 2004.
In 2005, discontinued operations included the turnover from the Group’s business in Japan. In 2004 and 2003, discontinued operations included the turnover of the Group’s discontinued operations in Japan, the US and Yemen.
Year ended 31 March 2004 compared with year ended 31 March 2003
Group turnover in 2004 was £3,671 million; £720 million or 16 per cent lower than in 2003. Of total turnover, £541 million related to discontinued operations in Japan, the United States and Yemen. Turnover from continuing operations decreased by £247 million, or 7 per cent, to £3,130 million in 2004 compared with 2003.
Caribbean turnover at reported rates was £123 million, or 16 per cent, lower in 2004 compared with 2003. At constant currency rates there was an underlying decrease of 1 per cent. International turnover at constant currency was 26 per cent lower reflecting increased competition in Jamaica following liberalisation and pre-emptive tariff reductions in other markets. There were offsetting increases in mobile, where the rollout of GSM in all major regions supported an increase in customer numbers, and domestic, due to rate rebalancing and increased volumes of interconnect as the number of competitors increased.
Turnover in Europe was £42 million or 14 per cent lower than in 2003. Increased Enterprise turnover was more than offset by a decline in Carrier Services and Business as a result of increased competition and the sale of domestic operations in some countries.
Turnover in the United Kingdom in 2004 was broadly in line with 2003 following several years of decline. Increased Carrier Services and Enterprise turnover was offset by reduced turnover from the Business segment.
Operating costs before depreciation, amortisation
and exceptional items |
|
|---|
| | | 2005
£m | | 2004
£m | | 2003
£m | |
| | | | | | | |
|---|
| | Outpayments and network costs1 | | 1,763 | | | 2,005 | | | 2,453 | |
| | Staff costs | | 554 | | | 664 | | | 915 | |
| | Other | | 413 | | | 554 | | | 689 | |
| |
| |
| | Total | | 2,730 | | | 3,223 | | | 4,057 | |
| |
| |
| | of which: | | | | | | | | | |
| | United Kingdom | | 1,452 | | | 1,560 | | | 1,568 | |
| | CWAO | | 21 | | | 27 | | | — | |
| | Europe | | 198 | | | 268 | | | 347 | |
| | Asia | | 33 | | | 33 | | | 100 | |
| | Bulldog | | 39 | | | — | | | — | |
| | | | | | | | | | | |
| | National Telcos | | | | | | | | | |
| |
| |
| | Caribbean | | 388 | | | 442 | | | 467 | |
| | Panama | | 151 | | | 156 | | | 143 | |
| | Macau | | 67 | | | 70 | | | 86 | |
| | Monaco | | 73 | | | — | | | — | |
| | Rest of the World | | 85 | | | 89 | | | 79 | |
| |
| |
| | Total National Telcos | | 764 | | | 757 | | | 775 | |
| | Other and eliminations | | 40 | | | 32 | | | 6 | |
| |
| |
| | Continuing operations | | 2,547 | | | 2,677 | | | 2,796 | |
| | Discontinued operations | | 183 | | | 546 | | | 1,261 | |
| |
| |
| | Total | | 2,730 | | | 3,223 | | | 4,057 | |
| |
| |
|
|---|
| | |
| 1 | Outpayments and network costs include customer acquisition costs and the cost of goods sold. |
Year ended 31 March 2005 compared with 31 March 2004.
Total operating costs before depreciation, amortisation and exceptional items were £2,730 million in 2005, £493 million or 15 per cent lower than 2004. Excluding discontinued operations, there was a decrease in 2005 of £130 million or 5 per cent compared with 2004.
Outpayments and network costs for continuing operations at £1,649 million were £96 million, or 6 per cent lower in 2005 compared with 2004. The increase of £68 million of outpayments and network costs associated with the consolidation of Monaco Telecom and Bulldog was more than offset by reductions in the United Kingdom (£92 million), Europe (£55 million) and Caribbean (£20 million). The reduction in costs was driven by reducing interconnect prices (regulatory and competition), cost savings initiatives and the full year impact of disposal of certain domestic businesses in continental Europe in 2004.
Staff costs for continuing operations increased marginally from £524 million in 2004 to £527 million in 2005, including £25 million of costs associated with Bulldog and Monaco Telecom. Adjusting for this, staff costs reduced by 4 per cent in 2005 compared with 2004.
Other costs for continuing operations fell by £37 million, or 9 per cent to £371 million, before adjusting for the impact of consolidating
Back to Contents
Operating and financial review
Group financial performance
Monaco Telecom and Bulldog (£19 million). The reduction predominantly related to one-off charges in 2004 together with the result of cost reduction initiatives across the Group.
Year ended 31 March 2004 compared with 31 March 2003
Total operating costs before depreciation, amortisation and exceptional items were £3,223 million in 2004, £834 million or 21 per cent lower than 2003. Excluding discontinued operations, there was a decrease in 2004 of £119 million or 4 per cent compared with 2003.
Outpayments and network costs for continuing operations at £1,745 million were £64 million lower in 2004 compared with 2003. Reductions in Europe (£44 million), Asia (£62 million) and the Caribbean (£37 million), were partly offset by a £48 million increase in the United Kingdom and a £23 million increase in respect of the newly created CWAO network. In Europe, network costs and outpayments fell reflecting the exit from domestic business and network rationalisation. The decrease in the Caribbean was primarily due to the impact of currency translation. UK network costs included £34 million in relation to an IBM contract that was terminated.
Staff costs for continuing operations at £524 million in 2004 were £67 million, or 11 per cent, lower than in 2003 reflecting the benefit of a 3,150 net reduction in headcount across the Group. In the UK, headcount at 31 March 2004 was 1,284 lower than at 31 March 2003 despite recruitment of an additional 603 staff to enhance the skills mix.
Other costs for continuing operations were broadly consistent year on year.
| Headcount — continuing operations1 |
|
|---|
| | | | 2005 | | | 2004 | | | 2003 | |
| | | | | | | | | | | |
| | United Kingdom | | 4,499 | | | 4,398 | | | 5,682 | |
| | CWAO | | 41 | | | 60 | | | — | |
| | Europe | | 423 | | | 519 | | | 1,136 | |
| | Asia | | 221 | | | 173 | | | 240 | |
| | Bulldog | | 505 | | | — | | | — | |
| | | | | | | | | | | |
| | National Telcos | | | | | | | | |
| |
| |
| | Caribbean | | 4,147 | | | 4,254 | | | 5,073 | |
| | Panama | | 1,818 | | | 1,881 | | | 2,218 | |
| | Macau | | 932 | | | 881 | | | 947 | |
| | Monaco | | 458 | | | — | | | — | |
| | Rest of the World | | 1,411 | | | 1,414 | | | 1,449 | |
| |
| |
| | Total National Telcos | | 8,766 | | | 8,430 | | | 9,687 | |
| | Other | | 326 | | | 285 | | | 270 | |
| |
| |
| | Total | | 14,781 | | | 13,865 | | | 17,015 | |
| |
| |
|
| | |
1 Headcount in the table above is stated at 31 March. Employee numbers set out in Note 6 to the Financial statements are based on the average monthly number of employees in each business, as required by the UK Companies Act. |
The increase in the United Kingdom headcount from 1 April 2004 to 31 March 2005 is attributable to the insourcing of an IT contract during the year together with the transfer of the Group IT department to the United Kingdom towards the end of 2005.
The net increase in the headcount for Other during the year is due to the formation of a National Telcos head office function, the insourcing of Coventry College, a training facility for the Group, and other one-off projects.
Back to Contents
| Depreciation before exceptional items |
|
| | | | 2005
£m | | | 2004
£m | | | 2003
£m | |
| | | | | | | | | | | |
| | United Kingdom | | 60 | | | 68 | | | 413 | |
| | Europe | | — | | | 1 | | | 28 | |
| | Asia | | 1 | | | 1 | | | 3 | |
| | Bulldog | | 2 | | | — | | | — | |
| | | | | | | | | | | |
| | National Telcos | | | | | | | | | |
| |
| |
| | Caribbean | | 58 | | | 76 | | | 74 | |
| | Panama | | 31 | | | 39 | | | 45 | |
| | Macau | | 15 | | | 18 | | | 18 | |
| | Monaco | | 6 | | | — | | | — | |
| | Rest of the World | | 18 | | | 20 | | | 22 | |
| |
| |
| | Total National Telcos | | 128 | | | 153 | | | 159 | |
| | Other | | 1 | | | 2 | | | 3 | |
| |
| |
| | Continuing operations | | 192 | | | 225 | | | 606 | |
| | Discontinued operations | | 2 | | | 27 | | | 129 | |
| |
| |
| | Total | | 194 | | | 252 | | | 735 | |
| |
| |
|
Year ended 31 March 2005 compared with year ended 31 March 2004
Depreciation before exceptional items at £194 million in 2005 was £58 million, or 23 per cent lower than in 2004. This decrease was mainly attributable to the lower fixed asset base following the impairments recorded in previous years.
Year ended 31 March 2004 compared with year ended 31 March 2003
Depreciation before exceptional items at £252 million in 2004 was £483 million lower than in 2003. This decrease was mainly attributable to the lower fixed asset base following the impairments in September 2002 and March 2003.
| Goodwill and other intangibles amortisation before exceptional items |
|
| | | | 2005
£m | | | 2004
£m | | | 2003
£m | |
| | | | | | | | | | | |
| | United Kingdom | | — | | | — | | | 62 | |
| | Asia | | — | | | — | | | 4 | |
| | Bulldog | | 4 | | | — | | | — | |
| | | | | | | | | | | |
| | National Telcos | | | | | | | | | |
| |
| |
| | Caribbean | | — | | | — | | | 1 | |
| | Monaco | | 5 | | | — | | | — | |
| | Rest of the World | | (2 | ) | | (3 | ) | | (2 | ) |
| |
| |
| | Total National Telcos | | 3 | | | (3 | ) | | (1 | ) |
| | Continuing operations | | 7 | | | (3 | ) | | 65 | |
| | Discontinued operations | | — | | | — | | | 61 | |
| |
| |
| | Total | | 7 | | | (3 | ) | | 126 | |
| |
| |
|
Year ended 31 March 2005 compared with year ended 31 March 2004
An amortisation charge of £9 million was recorded in respect of the goodwill and other intangibles arising on the acquisition of Monaco Telecom and Bulldog in 2005. The amortisation credit of £2 million relates to the negative goodwill arising on the acquisition of Guernsey in 2003.
Year ended 31 March 2004 compared with year ended 31 March 2003
Following the write-off of substantially all of the Group’s goodwill at 31 March 2003, the Group reported a goodwill credit of £3 million. The credit mainly relates to the amortisation of negative goodwill arising on the acquisition of Guernsey in 2003.
| Share of operating profits in joint ventures and associates |
|
| | | | 2005
£m | | | 2004
£m | | | 2003
£m | |
| | | | | | | | | | | |
| | United Kingdom | | (8 | ) | | (1 | ) | | — | |
| | | | | | | | | | | |
| | National Telcos | | | | | | | | | |
| |
| |
| | Caribbean | | 19 | | | 30 | | | 33 | |
| | Monaco | | 1 | | | — | | | — | |
| | Rest of the World | | 28 | | | 12 | | | 29 | |
| |
| |
| | Total National Telcos | | 48 | | | 42 | | | 62 | |
| | Other | | — | | | — | | | 13 | |
| |
| |
| | Total | | 40 | | | 41 | | | 75 | |
| |
| |
|
Year ended 31 March 2005 compared with year ended 31 March 2004
The Group’s share of operating profits in joint ventures and associates decreased by £1 million from £41 million in 2004 to £40 million in 2005. In the UK the loss of £8 million was primarily due to the impairment of a sub-sea cable held by the Apollo joint venture.
Back to Contents
Operating and financial review
Group financial performance
TSTT, the Group’s joint venture in Trinidad and Tobago recorded a redundancy provision in the second half of 2005. The Group’s share of this charge was £11 million. This accounted for the decline in the reported results for the Caribbean.
The increase in Rest of the World is due to the strong performance of Batelco, the Group’s associate in Bahrain.
Year ended 31 March 2004 compared with year ended 31 March 2003
The Group’s share of operating profits in joint ventures and associates fell by £34 million from £75 million in 2003 to £41 million in 2004. Rest of the World declined from £29 million in 2003 to £12 million mainly due to lower contribution from associates in Bahrain and Fiji reflecting increased competition and an impairment in the carrying value of associates.
| Exceptional operating costs before taxation |
|
| | | | 2005
£m | | | 2004
£m | | | 2003
£m | |
| | | | | | | | | | | |
| | Depreciation | | 8 | | | 526 | | | 2,381 | |
| | Amortisation | | — | | | 10 | | | 2,725 | |
| | Other | | 145 | | | 244 | | | 442 | |
| |
| |
| | Total | | 153 | | | 780 | | | 5,548 | |
| |
| |
| | United Kingdom | | 66 | | | 266 | | | 3,570 | |
| | CWAO | | (6 | ) | | — | | | — | |
| | Europe | | 38 | | | 7 | | | 298 | |
| | Asia | | 1 | | | 8 | | | 16 | |
| | | | | | | | | | | |
| | National Telcos | | | | | | | | | |
| |
| |
| | Caribbean | | 21 | | | 245 | | | 19 | |
| | Panama | | — | | | 73 | | | 14 | |
| | Macau | | — | | | 2 | | | — | |
| | Rest of the World | | 1 | | | 1 | | | 1 | |
| |
| |
| | Total National Telcos | | 22 | | | 321 | | | 34 | |
| | Other | | 31 | | | 31 | | | 3 | |
| |
| |
| | Continuing operations | | 152 | | | 633 | | | 3,921 | |
| | Discontinued operations | | 1 | | | 147 | | | 1,627 | |
| |
| |
| | Total | | 153 | | | 780 | | | 5,548 | |
| |
| |
|
Year ended 31 March 2005 compared with year ended 31 March 2004
Exceptional other operating costs of £145 million were charged in 2005. These costs include £68 million in respect of redundancy costs in continuing operations (United Kingdom £29 million, Europe £29 million, Asia £1 million, Other £9 million), £54 million in respect of property costs principally relating to the United Kingdom and Europe.
Hurricane Ivan and the Asian tsunami adversely impacted the Group’s operations in the Caribbean and Maldives, respectively. Exceptional restoration costs of £19 million were incurred in rectifying damage caused to the network and other assets of these operations.
In addition to the exceptional restoration charges noted above, the Group wrote off £3 million of assets that were damaged by the hurricane and tsunami and a further impairment charge of £5 million relating to the fixed assets of the Group’s European operations.
Year ended 31 March 2004 compared with year ended 31 March 2003
Exceptional operating costs of £780 million were charged in 2004. Fixed assets were impaired by a further £526 million: TDMA assets were impaired across the Caribbean and in Panama as the roll-out of GSM was accelerated to improve service levels; in Japan over-capacity and price reductions led to a downwards reassessment of future cash flows and in the United Kingdom under-utilised cabling was written off. Other exceptional operating costs of £244 million in 2004 related to the cost of restructuring Group businesses and included £113 million of redundancy costs and £92 million of property costs.
| Exceptional profit/(loss) on disposal or termination of operations |
|
| | | | 2005
£m | | | 2004
£m | | | 2003
£m | |
| | | | | | | | | | | |
| | Profit/(loss) on disposal or
termination of operations | | 116 | | | 250 | | | (147 | ) |
|
Year ended 31 March 2005 compared with year ended 31 March 2004
The Group realised an exceptional profit on disposal of its operations in Japan of £42 million in 2005. An exceptional credit of £66 million was recorded in respect of US domestic operations that were discontinued in the year ended 31 March 2004, principally comprising cash refunded to the Group as part of the Chapter 11 process. In addition, a gain of £8 million was recorded in respect of the sale or termination of Group operations being the net of previously accrued costs no longer required of £42 million partially offset by additional charges in the year of £34 million.
Year ended 31 March 2004 compared with year ended 31 March 2003
The Group realised an exceptional profit on disposal or termination of operations of £250 million in 2004, of which £191 million relates to the exit from the US business. In addition, £57 million of accrued costs relating to disposals in previous years, principally the disposal of the Group’s former UK cable business, have been released.
Back to Contents
| Profits less (losses) on disposal of fixed assets |
|
| | | | 2005
£m | | | 2004
£m | | | 2003
£m | |
| | | | | | | | | | | |
| | Non-exceptional | | 5 | | | 25 | | | — | |
| | Exceptional | | 23 | | | 28 | | | 62 | |
| |
| |
| | Total | | 28 | | | 53 | | | 62 | |
| |
| |
|
Year ended 31 March 2005 compared with year ended 31 March 2004
Non-exceptional profits on disposal of fixed assets largely relate to the sale of various trade investments and associates including the Group’s 3.4 per cent stake in Intelsat (the satellite communications company) and RTC, a Bulgarian associate.
The exceptional profit on disposal of fixed assets primarily relates to the disposal of a trade investment by the Japanese business prior to its disposal by the Group.
Year ended 31 March 2004 compared with year ended 31 March 2003
Non-exceptional profits on disposal of fixed assets primarily relate to the sale of various satellite interests and other investments. The exceptional profit on disposal of fixed assets includes £16 million, relating to the disposal of certain properties in the United States as part of the restructuring of the US business prior to its filing for Chapter 11, and £12 million mainly relating to the sale of properties in the United Kingdom and the Caribbean as part of the Group’s restructuring.
| Exceptional amounts written off investments |
|
| | | | 2005
£m | | | 2004
£m | | | 2003
£m | |
| | | | | | | | | | | |
| | Exceptional amounts written
off investments | | — | | | — | | | (274 | ) |
| |
| |
| | Total | | — | | | — | | | (274 | ) |
| |
| |
|
Year ended 31 March 2005 compared with year ended 31 March 2004
There were no exceptional amounts written off investments during 2005.
Year ended 31 March 2004 compared with year ended 31 March 2003
There were no exceptional amounts written off investments during 2004.
The current asset investments principally relating to PCCW Limited were written down by £274 million to market value at 31 March 2003. The PCCW shares were sold during the year ended 31 March 2004 for consideration of £229 million resulting in a loss of less than £1 million.
The profit and loss account in 2003 has been amended to reverse the £116 million impairment in respect of the Company’s Employee Share Option Plan Trust (“ESOP”) following the change in UK accounting rules in respect of ESOPs. See Note 24 of the Financial statements for further explanation.
|
| | | | 2005
£m | | | 2004
£m | | | 2003
£m | |
| | | | | | | | | | | |
| | Profit/(loss) on ordinary activities | | | | | | | | | |
| | before taxation | | 363 | | | (224) | | | (6,257) | |
| |
| |
| | Tax credit/(charge) on profit/(loss) | | | | | | | | | |
| | on ordinary activities | | 14 | | | 12 | | | (36) | |
| |
| |
| | Effective tax rate | | (3.9)% | | | 5.4% | | | (0.6)% | |
| |
| |
|
Year ended 31 March 2005 compared with year ended 31 March 2004
Including the impact of exceptional items, the effective tax rate for 2005 was (3.9) per cent compared to an effective tax rate in 2004 of 5.4 per cent. The effective tax rates excluding the impact of exceptional items and an exceptional tax credit in 2005 were 19.9 per cent in 2005 and 21.9 per cent in 2004.
The principal reason for the difference in the rates is the mix of profits and losses between countries with different tax rates.
The exceptional tax credit of £85 million relates to the settlement and clarification of various longstanding overseas tax items at less than their expected cost.
Year ended 31 March 2004 compared with year ended 31 March 2003
Tax credits of £12 million were generated in 2004 on a loss before tax of £224 million. The main reason for the tax rate of 5.4 per cent being lower than the UK standard rate of tax of 30 per cent was due to tax losses for which no benefit had been recognised in the year as realisation of the benefit was not considered probable. The losses were carried forward to future periods. Exceptional items on which tax relief is denied were lower than 2003 resulting in a positive tax rate in 2004 compared to a negative tax rate in 2003.
Back to Contents
Operating and financial review
Review by division
This section provides a discussion of Cable & Wireless’ results by division.
|
| | | | 2005
£m | | | 2004
£m | | | 2003
£m | |
| | | | | | | | | | | |
| | Turnover | | 1,602 | | | 1,661 | | | 1,684 | |
| | Costs | | | | | | | | | |
| |
| |
| | Outpayments and network costs1 | | (1,066 | ) | | (1,158 | ) | | (1,110 | ) |
| | Staff costs | | (248 | ) | | (254 | ) | | (292 | ) |
| | Other | | (138 | ) | | (148 | ) | | (166 | ) |
| |
| |
| | | | (1,452 | ) | | (1,560 | ) | | (1,568 | ) |
| | Depreciation before exceptional items | | (60 | ) | | (68 | ) | | (413 | ) |
| | Amortisation before exceptional items | | — | | | — | | | (62 | ) |
| | Joint ventures and associates | | (8 | ) | | (1 | ) | | — | |
| |
| |
| | | | | | | | | | | |
| | Total operating profit/(loss)
before exceptional items | | 82 | | | 32 | | | (359 | ) |
| | | | | | | | | | | |
| | Exceptional operating items | | | | | | | | | |
| | — depreciation | | — | | | (119 | ) | | (1,302 | ) |
| | — amortisation | | — | | | — | | | (2,194 | ) |
| | — other costs | | (66 | ) | | (147 | ) | | (74 | ) |
| |
| |
| | Total operating profit/(loss) | | 16 | | | (234 | ) | | (3,929 | ) |
| |
| |
|
1 Outpayments and network costs include customer acquisition costs and the cost of goods sold.
Year ended 31 March 2005 compared with year ended 31 March 2004
Total operating profit before exceptional items was £82 million in 2005 compared to £32 million in 2004. This improvement was primarily due to increased focus on cost savings during 2005. In addition, total operating profit before exceptional items was positively impacted by an £8 million depreciation benefit from the impairment taken in prior years.
Turnover at £1,602 million decreased by £59 million, or 4 per cent, in 2005 compared with 2004. Growth in Enterprise turnover was more than offset by declines in Carrier Services and Business turnover.
Enterprise turnover increased by 5 per cent to £475 million in 2005 as a result of the continued expansion of sales to key financial services customers. Against this, Business turnover declined to £394 million, a decrease of 11 per cent, compared with 2004 reflecting the high price erosion and churn levels experienced in this customer segment. Notwithstanding the
difficult trading conditions, recent initiatives undertaken in the UK have resulted in some noteworthy wins. For example, in April 2005 the UK executed a three-year contract with Scottish and Newcastle plc, valued at £2.1 million, to provide IP-VPN quality of service to integrate 66 of its manufacturing, distribution and sales sites to a single data network. Management anticipates the key areas of focus in Enterprise in 2006 include increased upselling to existing customers, particularly with new IP-based services.
Carrier Services turnover also declined from £763 million in 2004 to £733 million in 2005. This reduction was largely due to the regulated reduction in mobile termination rates in the UK from September 2004. Adjusting for this, Carrier Services turnover was stable in 2005 compared with 2004. To combat the loss of turnover following the reduction in mobile termination rates, the UK will seek to increase volumes in most of the key product sets and has extended contracts with existing customers such as Centrica and the Post Office in fixed line voice services. In 2006, management anticipates Carrier Services will continue to exploit its geographical reach and focus on driving improvements to cash margins.
Outpayments and network costs declined by 8 per cent in 2005 compared with 2004, due to the reduction in mobile termination rates referred to above and an increased focus on cost savings through network efficiency and vendor renegotiation programmes.
While staff and other costs declined by approximately 4 per cent in 2005 compared with 2004, staff costs increased in the second half of 2005 as a result of the transfer of costs relating to Cable & Wireless Group IT staff to the UK’s operating cost base.
The reduction in the non-exceptional depreciation charge from £68 million in 2004 to £60 million in 2005 is primarily attributable to the lower fixed asset base following the impairment of assets in 2004.
The loss of £8 million arising on joint ventures and associates was primarily due to the impairment of a sub-sea cable held by one of the UK’s joint ventures.
The UK reported a total operating profit of £16 million in 2005 compared with operating losses of £234 million in 2004. This was primarily due to a reduction in the total amount of exceptional charges from £266 million in 2004 to £66 million in 2005 together with the benefit of cost initiatives as set out above. The exceptional charges in 2005 relate to the costs of the ongoing restructuring of the UK business. This restructuring will continue through 2006.
Back to Contents
Year ended 31 March 2004 compared with year ended 31 March 2003
The UK reported a total operating profit before exceptional items of £32 million in 2004 compared with losses of £359 million in 2003. This improvement was primarily driven by the decrease in non-exceptional depreciation and amortisation charges in 2004 compared with 2003 (attributable to the reduced asset base following exceptional impairment charges in 2003) and the reduction in staff costs in 2004 compared with 2003 following the reduction in headcount year-on-year.
Turnover at £1,661 million in 2004 was broadly in line with 2003. Turnover in the six months to 31 March 2004 was £836 million, 1 per cent higher than in the first half of 2004.
A £79 million decline in Business turnover was partly offset by improvements in Carrier Services and Enterprise segments (£39 million and £17 million respectively).
The decline in UK Business turnover reflected the continued impact of customer churn and tariff erosion. However, action taken in the year, including increased investment in the sales acquisition team and the launch of new simplified products, stopped the downward trend of the last two years with second half 2004 Business turnover broadly in line with the first half.
Carrier Services turnover were £39 million higher in 2004 than in 2003. Voice was 5 per cent higher mainly reflecting increases in mobile transit traffic and sales to 118 (directory enquiry) service providers. The benefit of these increases was partly reduced by lower telebusiness and data services.
Operating costs before depreciation, amortisation and exceptional operating items were £8 million lower at £1,560 million in 2004.
Outpayments and network costs were £48 million higher in 2004 and included £34 million relating to an IBM contract. Staff costs were £38 million lower in 2004 compared with 2003 mainly due to the headcount reduction programme. Headcount at 31 March 2004 was 4,398 compared with 5,682 at 31 March 2003. Other costs were £18 million lower than in 2003 and included an £8 million reduction in property costs reflecting the benefits of property rationalisation. Depreciation and amortisation charges before exceptional items were £407 million lower in 2004 than 2003, largely due to the lower asset base following the 2003 impairment charges.
Total operating losses at £234 million in 2004 were £3,695 million lower than in 2003, primarily due to a £3,377 million reduction in the charge for fixed asset and goodwill impairments. Exceptional operating costs of £147 million in 2004 arose primarily as a consequence of the UK restructuring and related to property exit costs and severance payments.
|
| | | | 2005
£m | | | 2004
£m | | | 2003
£m | |
| | | | | | | | | | | |
| | Turnover | | 16 | | | 11 | | | — | |
| | Costs | | | | | | | | | |
| |
| |
| | Outpayments and network costs1 | | (14 | ) | | (23 | ) | | — | |
| | Staff costs | | (4 | ) | | (4 | ) | | — | |
| | Other | | (3 | ) | | — | | | — | |
| |
| |
| | | | (21 | ) | | (27 | ) | | — | |
| | Total operating loss before exceptional items | | (5 | ) | | (16 | ) | | — | |
| | Exceptional operating items | | | | | | | | | |
| | — other costs | | 6 | | | — | | | — | |
| |
| |
| | Total operating profit/(loss) | | 1 | | | (16 | ) | | — | |
| |
| |
|
| | | | |
| | | | |
| | |
1 Outpayments and network costs include customer acquisition costs and the cost of goods sold. |
Year ended 31 March 2005 compared with year ended 31 March 2004
Cable & Wireless Americas Operations, Inc (CWAO) started trading on 1 September 2003.
The US reported a total operating profit before exceptional items of £1 million in 2005 compared with losses of £16 million in 2004. The improvement in performance was primarily due to the successful migration of customers from the former Cable & Wireless US network (now owned by SAVVIS Communications) to CWAO’s purpose built network together with the release of £6 million of provisions held in respect of costs associated with the exit of the Group’s domestic US business in 2004.
Turnover in 2005 was £16 million, an increase of 45 per cent at reported rates (59 per cent at constant currency) compared with 2004. This was driven by a longer trading period in 2005, the successful migration of customers as noted above and the acquisition of Enterprise and Carrier customers.
Outpayments and network costs in 2005 declined by 39 per cent (33 per cent at constant currency) to £14 million compared with 2004. Taking into account the longer period in 2005 this significant reduction in cost followed the migration of the CWAO network.
Staff costs were stable at reported rates and declined by 9 per cent at constant currency due to headcount reductions during the year, offset by the longer trading period.
Back to Contents
Operating and financial review
Review by division
Year ended 31 March 2004
In line with its strategy to withdraw from its US domestic operations, Cable & Wireless formalised the ongoing commercial dealings between its US business (“CWA”) and the rest of the Cable & Wireless Group in September 2003. Under these arrangements, each party agreed to provide certain services to the other, including network capacity, for an interim period.
To facilitate the separation of CWA from the Group, Cable & Wireless incorporated a wholly owned subsidiary, Cable & Wireless Americas Operations, Inc. (“CWAO”) to provide ongoing US connectivity for data and IP services to Cable & Wireless’ multinational customers based in other regions (primarily those served by the UK, Europe and Asia operations). In addition, CWAO built a core network in the US comprising seven nodes in five cities and entered into access arrangements with third party carriers in order provide end-to-end services.
CWAO turnover of £11 million was derived from the provision of services to CWA from October 2003 together with the provision of services to other Cable & Wireless Group customers. Outpayments and network costs of £23 million included within operating costs represent the costs of CWAO’s core network plus amounts paid to CWA in accordance with the interim service arrangements described above.
|
| | | | 2005
£m | | | 2004
£m | | | 2003
£m | |
| | | | | | | | | | | |
| | Turnover | | 186 | | | 262 | | | 304 | |
| | Costs | | | | | | | | | |
| |
| |
| | Outpayments and network costs1 | | (143 | ) | | (198 | ) | | (242 | ) |
| | Staff costs | | (31 | ) | | (40 | ) | | (55 | ) |
| | Other | | (24 | ) | | (30 | ) | | (50 | ) |
| |
| |
| | | | (198 | ) | | (268 | ) | | (347 | ) |
| | Depreciation before exceptional items | | — | | | (1 | ) | | (28 | ) |
| |
| |
| | Total operating loss before
exceptional items | | (12 | ) | | (7 | ) | | (71 | ) |
| | Exceptional operating items | | | | | | | | | |
| | — depreciation | | (5 | ) | | — | | | (262 | ) |
| | — other costs | | (33 | ) | | (7 | ) | | (36 | ) |
| |
| |
| | Total operating loss | | (50 | ) | | (14 | ) | | (369 | ) |
| |
| |
|
| | |
1 Outpayments and network costs include customer acquisition costs and the cost of goods sold. |
Year ended 31 March 2005 compared with year ended 31 March 2004
Total operating losses before exceptional operating items for 2005 were £12 million compared to £7 million in 2004 due primarily to the decline in turnover, particularly in the Enterprise and Carrier Services customer segments.
Turnover for the year fell by £76 million to £186 million, a decline of 29 per cent compared with 2004. Enterprise turnover for the year declined by 45 per cent, or £18 million, to £22 million, reflecting the loss of a major contract and the full year impact of disposals of domestic operations in Sweden, Belgium, the Netherlands, Italy, Switzerland, France and Germany and the domestic data business in Russia. Business turnover also declined from £14 million in 2004 to £9 million in 2005 as a result of the full year impact of the disposals.
Carrier Services turnover at £155 million decreased by £53 million, or 25 per cent, in 2005 compared with 2004 as a result of aggressive price competition together with a shift in turnover mix from high turnover to low turnover destinations. Despite this decline, Europe has continued to market to new customers, recently winning a new contract with Belgacom to provide carrier multi-protocol label switching (“MPLS”) services.
Outpayments and network costs declined by £55 million, or 28 per cent, to £143 million in 2005 compared with 2004. This reduction in costs was primarily due to increased focus on cost savings through network efficiency and vendor renegotiation programmes as well as the impact of reducing the scale of operations in Europe.
Back to Contents
Staff costs at £31 million fell by £9 million, or 23 per cent compared with 2004 due to the full year impact of staff reductions achieved in 2005. Headcount in Europe has been reduced by 18 per cent from 1 April 2004 to 31 March 2005.
The fall in other costs in 2005 compared with 2004 reflects the reduction in the scale of operations in continental Europe.
Europe’s total operating loss increased from £14 million in 2004 to £50 million in 2005. The exceptional costs of £33 million recorded in 2005 related to the restructuring of the European operations to focus on Carrier Services. An exceptional depreciation charge of £5 million was recognised as a consequence of the restructuring. A headcount reduction of 46 per cent was announced in November 2004 and is scheduled to be completed by March 2006. Further reductions planned through 2006 are expected to lower costs in Europe by an annualised £15 million by end of 2006.
Year ended 31 March 2004 compared with year ended 31 March 2003
Total operating losses before operating exceptional items were £64 million lower in 2004 at £7 million: a £27 million reduction in the non-exceptional depreciation charge reflecting the prior year asset impairments, together with a £20 million reduction in other costs, more than offset a £42 million reduction in turnover.
Turnover in continental Europe in 2004 was £42 million, or 14 per cent, lower than in 2003. A £21 million increase in Enterprise turnover, reflecting the roll out of major contracts, was more than offset by declines in Carrier Services and Business as a result of increased competition and the disposal of domestic operations in Sweden, Belgium, the Netherlands, Italy, Switzerland, France and Germany and the domestic data business in Russia.
Continental Europe’s operating costs before depreciation, amortisation and exceptional operating items were £79 million or 23 per cent lower in 2004 than 2003. At constant currency rates, there was an underlying reduction of 29 per cent. Cost savings were achieved as a result of a reduction in employee numbers, property disposals and network rationalisation as well as the exit from domestic operations as described above. Headcount in continental Europe was 519 at 31 March 2004 compared with 1,136 at 31 March 2003.
Total operating losses at £14 million in 2004 were £355 million lower than in 2003 of which £262 million reflected exceptional asset impairments in 2003 that were not repeated in 2004.
|
| | | | 2005
£m | | | 2004
£m | | | 2003
£m | |
| | | | | | | | | | | |
| | Turnover | | 39 | | | 32 | | | 79 | |
| | Costs | | | | | | | | | |
| |
| |
| | Outpayments and network costs1 | | (19 | ) | | (21 | ) | | (83 | ) |
| | Staff costs | | (7 | ) | | (8 | ) | | (10 | ) |
| | Other | | (7 | ) | | (4 | ) | | (7 | ) |
| |
| |
| | | | (33 | ) | | (33 | ) | | (100 | ) |
| | Depreciation before exceptional items | | (1 | ) | | (1 | ) | | (3 | ) |
| | Amortisation before exceptional items | | — | | | — | | | (4 | ) |
| |
| |
| | Total operating profit/(loss)
before exceptional items | | 5 | | | (2 | ) | | (28 | ) |
| | Exceptional operating items | | | | | | | | | |
| | — depreciation | | — | | | (4 | ) | | (10 | ) |
| | — other costs | | (1 | ) | | (4 | ) | | (6 | ) |
| |
| |
| | Total operating profit/(loss) | | 4 | | | (10 | ) | | (44 | ) |
| |
| |
|
| | |
1 Outpayments and network costs include customer acquisition costs and the cost of goods sold. |
Year ended 31 March 2005 compared with year ended 31 March 2004
Following the disposal of the Group’s Japanese subsidiary, Cable & Wireless IDC Inc., on 17 February 2005, the Group continues to conduct business in the Enterprise and Carrier Services segments in Australia, China, Hong Kong, India, Japan and Singapore, together referred to as “Asia”.
Asia reported a total operating profit before exceptional items of £5 million in 2005 against losses of £2 million in 2004. The improvement in performance was predominantly driven by growth in turnover together with maintenance of the cost base through tight cost control. Asia’s total operating loss of £10 million in 2004 was after exceptional charges of £8 million in that year. In 2005 Asia reported a total operating profit of £4 million.
Turnover at £39 million, increased by 22 per cent (34 per cent at constant currency) compared to 2004. The growth in turnover was driven by a strong performance in both the Carrier Services and Enterprise customer segments. Enterprise turnover increased by £7 million to £34 million in 2005 due to improved marketing including the launch of new multi-protocol label switching (“MPLS”) and Managed Network Services within the region. Carrier Services turnover increased by £2 million to £5 million in 2005. The Business segment was sold as part of Cable & Wireless IDC Inc., resulting in a loss of £2 million of turnover year on year.
Back to Contents
Operating and financial review
Review by division
Outpayments and network costs declined by 10 per cent (1 per cent at constant currency) from 2005 compared with 2004 due to cost reduction initiatives. These initiatives also enabled a reduction in staff costs which declined by 13 per cent (4 per cent at constant currency) year on year.
Year ended 31 March 2004 compared with year ended 31 March 2003
Total operating losses before exceptional items for Asia were £2 million in 2004 compared with £28 million in 2003, a reduction of £26 million. The reduction was primarily due to the termination of the provision of local services in Hong Kong and the benefit of a reduction in headcount in 2004 compared with 2003. These factors together with the reduction in exceptional operating costs in 2004 compared with 2003 contributed to the reduction in total operating losses from £44 million in 2003 to £10 million in 2004.
Turnover fell from £79 million in 2003 to £32 million in 2004, a reduction of £47 million. The decline in turnover was primarily due to the termination of the provision of local services in Hong Kong and pricing pressures on globally managed contracts.
The migration of legacy accounts noted above also drove the fall in outpayments and network costs in 2004 compared with 2003 together with the benefit of a 28 per cent reduction in headcount from 1 April 2003 to 31 March 2004, lower property costs and a reduction in the bad debt charge.
|
| | | | 2005
£m | | | 2004
£m | | | 2003
£m | |
| | | | | | | | | | | |
| | Turnover | | 550 | | | 633 | | | 756 | |
| | Costs | | | | | | | | | |
| |
| |
| | Outpayments and network costs1 | | (183 | ) | | (203 | ) | | (240 | ) |
| | Staff costs | | (92 | ) | | (97 | ) | | (120 | ) |
| | Other | | (113 | ) | | (142 | ) | | (107 | ) |
| |
| |
| | | | (388 | ) | | (442 | ) | | (467 | ) |
| | Depreciation before exceptional items | | (58 | ) | | (76 | ) | | (74 | ) |
| | Amortisation before exceptional items | | — | | | — | | | (1 | ) |
| | Joint ventures and associates | | 19 | | | 30 | | | 33 | |
| |
| |
| | Total operating profit before
exceptional items | | 123 | | | 145 | | | 247 | |
| | Exceptional operating items | | | | | | | | | |
| | — depreciation | | (3 | ) | | (197 | ) | | — | |
| | — amortisation | | — | | | (10 | ) | | — | |
| | — other costs | | (18 | ) | | (38 | ) | | (19 | ) |
| |
| |
| | Total operating profit/(loss) | | 102 | | | (100 | ) | | 228 | |
| |
| |
|
| | |
1 Outpayments and network costs include customer acquisition costs and the cost of goods sold. |
Year ended 31 March 2005 compared with year ended 31 March 2004
Total operating profit before exceptional items declined from £145 million in 2004 to £123 million in 2005, a reduction of £22 million. In particular, the Caribbean’s performance was adversely affected by Hurricane Ivan with total operating profit before exceptional items being adversely impacted in the year by approximately £11 million. In addition, TSTT, a joint venture in Trinidad and Tobago, recorded a redundancy provision in the second half of 2005. The Group’s share of this charge was £11 million, further explaining the decline in the Caribbean’s total operating profit before exceptional items in 2005 compared with 2004.
The Caribbean’s turnover decreased to £550 million, a decrease of £83 million, or 13 per cent, in 2005 compared with 2004. At constant currency, the Caribbean’s turnover decreased by 3 per cent in 2005 compared with 2004. International voice turnover fell by £37 million, or 23 per cent (15 per cent at constant currency) to £123 million in 2005. This reflects the ongoing pressure on international settlement rates across all Caribbean markets and, specifically, a full year’s competition in Cayman, rate reductions in the East Caribbean as well as the regulatory reductions in international settlement rates implemented in Jamaica in June 2004. The Group expects continued pressure on international settlement rates as competition and the number of liberalised markets increase.
Back to Contents
Domestic voice turnover declined by £26 million to £178 million, a fall of 13 per cent (3 per cent at constant currency) compared to 2004 due to rate reductions in the East Caribbean as well as fixed to mobile substitution across the Caribbean. Patterns in more competitively mature markets indicate that fixed to mobile substitution is likely to continue.
Mobile turnover at £136 million increased by 6 per cent at constant currency (a 5 per cent decline at reported rates) compared with 2004. The East and North Caribbean delivered the strongest performances reflecting growth in GSM customer numbers and increases in international call turnover. Enhanced roaming capabilities and partnerships have also driven strong growth in roaming turnover across the Caribbean. Data and IP turnover at £71 million increased by 1 per cent (13 per cent at constant currency) in 2005 compared with 2004, due to ongoing growth in dial-up and ADSL customers partially offset by the impact of Hurricane Ivan. Against this, other turnover declined to £42 million in 2005 compared with £56 million in 2004.
Total operating costs before depreciation, amortisation and exceptional operating items were £388 million in 2005, a decline of 12 per cent (2 per cent at constant currency) compared with 2004. In line with the National Telcos broader objectives, the Group is working to continue to reduce operating costs going forward.
Outpayments and network costs were stable against 2004 at constant currency compared to a 3 per cent decline in turnover year on year, at constant currency, primarily reflecting increasingly aggressive international competition.
Staff costs at £92 million in 2005 decreased by 5 per cent at reported rates compared with 2004. At constant currency staff costs increased by 5 per cent in 2005 compared with 2004. This reflects efforts to increase the skill base of employees, together with wage inflation in Jamaica.
Other operating costs at £113 million fell by 20 per cent (12 per cent at constant currency) in 2005 compared with 2004. Adjusting for one-off charges in 2004, other operating costs were broadly flat at constant currency in 2005 compared with 2004.
Non-exceptional depreciation fell from £76 million in 2004 to £58 million in 2005, a decrease of £18 million, or 24 per cent. This reduction is attributable to the lower fixed asset base following the impairment of assets in 2004.
Total operating profit was £102 million in 2005 compared with losses of £100 million in 2004. The improvement was primarily due to a £204 million reduction in the charge for exceptional fixed asset and goodwill impairments in 2005 compared with 2004. The exceptional operating costs of £18 million in 2005 related to restoration of damage caused by Hurricane Ivan. In addition, exceptional asset write-downs of £3 million were recorded in respect of assets damaged by the hurricane.
Year ended 31 March 2004 compared with year ended 31 March 2003
Reported total operating profit before exceptional items in 2004 was £145 million, £102 million or 41 per cent lower than in 2003. Many of the Caribbean businesses operate in territories that have currencies linked directly or indirectly to the US dollar. Consequently, a 9 per cent strengthening of sterling against the US dollar and a 31 per cent strengthening against the Jamaica dollar had a significant impact on the reported results of the Caribbean. At constant currency, total operating profit before exceptional items in 2004 was 32 per cent lower than in 2003.
Turnover in 2004 was £633 million, 16 per cent lower than 2003 at reported rates and 1 per cent lower at constant currency.
International turnover declined by 26 per cent at constant currency reflecting increased competition following the liberalisation of the international fixed line market in Jamaica on 1 March 2003 and pre-emptive tariff reductions in other markets. Domestic turnover increased by 5 per cent at constant currency reflecting the impact of rate rebalancing and increased volumes of interconnect traffic driven by increasing numbers of competitors in the market. Mobile turnover increased by 19 per cent at constant currency due to increased customer numbers, supported by the launch of GSM services in all major regions. The mobile customer base at 31 March 2004 was 1,141,000 compared to 943,000 at 31 March 2003. Data and IP continued to deliver strong growth with turnover rising by 17 per cent at constant currency.
Operating costs before depreciation, amortisation and exceptional operating items at £442 million in 2004, were £25 million, or 5 per cent, lower than in 2003. At constant currency rates there was an underlying increase of 12 per cent compared with 2003.
Outpayments and network costs increased by 2 per cent at constant currency rates reflecting increased mobile handset subsidy costs as a result of intensified competition and the launch of GSM services in major regions.
Staff costs were £23 million lower in 2004 compared with 2003. At constant currency rates, staff costs were 6 per cent lower than 2003 reflecting the reduction in headcount to 4,254 from 5,073 in the prior year.
The Caribbean recorded a total operating loss of £100 million in 2004 compared with a profit of £228 million in 2003. Exceptional items of £245 million were charged in 2004 comprising a £197 million impairment charge, primarily due to the write-off of TDMA assets following the accelerated GSM roll-out in the region, and £38 million of restructuring costs.
Back to Contents
Operating and financial review
Review by division
|
|---|
| | | 2005
£m | | 2004
£m | | 2003
£m | |
|---|
| | | | | | | | | | | |
| | Turnover | | 257 | | | 265 | | | 279 | |
| | Costs | | | | | | | | | |
| |
| |
| | Outpayments and network costs1 | | (90 | ) | | (74 | ) | | (69 | ) |
| | Staff costs | | (23 | ) | | (27 | ) | | (33 | ) |
| | Other | | (38 | ) | | (55 | ) | | (41 | ) |
| |
| |
| | | | (151 | ) | | (156 | ) | | (143 | ) |
| | Depreciation before exceptional items | | (31 | ) | | (39 | ) | | (45 | ) |
| |
| |
| | Total operating profit before | | | | | | | | | |
| | exceptional items | | 75 | | | 70 | | | 91 | |
| | Exceptional operating items | | | | | | | | | |
| | — depreciation | | — | | | (65 | ) | | — | |
| | — other costs | | — | | | (8 | ) | | (14 | ) |
| |
| |
| | Total operating profit/(loss) | | 75 | | | (3 | ) | | 77 | |
| |
| |
|
| | |
1 Outpayments and network costs include customer acquisition costs and the cost of goods sold. |
Year ended 31 March 2005 compared with year ended 31 March 2004
Panama reported a total operating profit before exceptional items of £75 million in 2005 compared with £70 million in 2004.
Turnover at £257 million decreased by £8 million, or 3 per cent, in 2005 compared with 2004. At constant currency, turnover increased by 6 per cent in 2005 compared with 2004. This overall increase represents growth in Panama’s mobile and data and IP turnover during the year.
Domestic turnover fell by £22 million, or 16 per cent to £117 million and international turnover fell by £5 million, or 22 per cent to £18 million in 2005 compared with 2004. This was due to increasing competition following the liberalisation of international and domestic voice services from 2 January 2003. In addition, domestic voice turnover was adversely affected by fixed to mobile substitution, which particularly impacted payphone turnover.
The decline in international and domestic turnover was offset by continued strong growth in mobile turnover which increased by £20 million, or 35 per cent (48 per cent at constant currency) to £77 million in 2005 reflecting strong growth in GSM mobile subscribers and an increase in the mobile market penetration in Panama.
Data and IP turnover rose by 13 per cent at constant currency (3 per cent increase at reported rates) to £30 million in 2005 due to the completion of a number of major corporate projects now generating turnover and continued strong growth in internet turnover, particularly in ADSL service.
Operating costs before depreciation and exceptional items were £151 million, in 2005, a decrease of 3 per cent compared with 2004. At constant currency operating costs increased by 6 per cent in 2005 compared with 2004.
Outpayments and network costs increased by 22 per cent compared with 2004, reflecting changes in the sales mix as higher margin voice turnover was substituted for lower margin mobile and data and IP turnover. Further, competition has driven an increase in outpayments as more traffic now terminates on third party networks.
Staff costs fell by 15 per cent to £23 million in 2005 reflecting the impact of a 3 per cent reduction in headcount in 2005 compared with 2004 together with a reduction in temporary payroll.
Other costs at £38 million in 2005 decreased by £17 million, or 31 per cent compared with 2004. This reduction in costs is primarily due to cost reduction initiatives and the effect of a one-off charge for legal costs in 2004 associated with the settlement of legal proceedings in that year.
Non-exceptional depreciation fell by 21 per cent to £31 million in 2005 compared with 2004 due to the reduction in the fixed asset base following the impairment of assets in 2004. Nevertheless, there was an increase of 10 per cent at constant currency in the second half of 2005 as a result of new investments in GSM and ADSL networks.
Total operating profits of £75 million were reported in 2005 against losses of £3 million in 2004. The 2004 exceptional losses were after including exceptional charges of £73 million.
Year ended 31 March 2004 compared with year ended 31 March 2003
Total operating profit before exceptional items at £70 million in 2004 was £21 million, or 23 per cent, lower than in 2003. At constant currency rates, there was an underlying reduction of 16 per cent.
Turnover fell by 5 per cent in the year to £265 million but, at constant currency rates, rose by 4 per cent. Strong growth in mobile, reflecting the introduction of GSM, and data and IP turnover was only partly offset by lower international and domestic turnover due to increased competition following the liberalisation of these markets from January 2003.
Back to Contents
Operating costs before depreciation and exceptional items in 2004 were £13 million, or 9 per cent, higher than in 2003. There was an underlying increase of 19 per cent at constant currency rates. Outpayments and network costs increased by 17 per cent at constant currency rates reflecting changes in the sales mix and a consequent increase in mobile subscriber acquisition costs, and higher outpayments as more traffic terminated on third party networks following the introduction of competition. Staff costs fell as headcount was reduced from 2,218 to 1,881. Other costs in 2004 included a one-off £9 million cost associated with the settlement of a lawsuit.
Panama reported a total operating loss of £3 million in 2004 compared with a profit of £77 million in the prior year, mainly due to a £65 million exceptional impairment of fixed assets in 2004, together with an £8 million exceptional charge relating to staff rationalisation. These charges were required to write down assets and reduce staff costs to mitigate the absence of universal service law protection in Panama.
|
|---|
| | | 2005
£m | | 2004
£m | | 2003
£m | |
|---|
| | | | | | | | | | | |
| | Turnover | | 117 | | | 128 | | | 146 | |
| | Costs | | | | | | | | | |
| |
| |
| | Outpayments and network costs1 | | (48 | ) | | (51 | ) | | (57 | ) |
| | Staff costs | | (11 | ) | | (12 | ) | | (15 | ) |
| | Other | | (8 | ) | | (7 | ) | | (14 | ) |
| |
| |
| | | | (67 | ) | | (70 | ) | | (86 | ) |
| | Depreciation before exceptional items | | (15 | ) | | (18 | ) | | (18 | ) |
| |
| |
| | Total operating profit | | | | | | | | | |
| | before exceptional items | | 35 | | | 40 | | | 42 | |
| | Exceptional items | | | | | | | | | |
| | — depreciation | | — | | | (2 | ) | | — | |
| |
| |
| | Total operating profit | | 35 | | | 38 | | | 42 | |
| |
| |
|
| | |
1 Outpayments and network costs include customer acquisition costs and the cost of goods sold. |
Year ended 31 March 2005 compared with year ended 31 March 2004
Total operating profit before exceptional items at £35 million decreased by £5 million, or 13 per cent, at reported rates in 2005 compared with 2004. At constant currency, total operating profit declined by 4 per cent year on year.
Turnover decreased by £11 million, or 9 per cent, to £117 million in 2005. At constant currency turnover was flat year on year.
Operating costs before depreciation and exceptional items at £67 million, decreased by 4 per cent in 2005 compared with 2004. At constant currency operating costs before depreciation and exceptional items increased by 5 per cent compared with 2004. In 2005, outpayments and network costs rose by 3 per cent at constant currency due to an increase in cost of sales relating to enterprise solutions and mobile handsets sales. Staff costs were broadly consistent at constant currency. Other costs increased by 25 per cent at constant currency from 2004 due to higher marketing costs and repairs and maintenance.
Year ended 31 March 2004 compared with year ended 31 March 2003
Total operating profit before exceptional items in Macau fell by 5 per cent from £42 million in 2003 to £40 million in 2004. Turnover declined by 12 per cent or 4 per cent at constant currency rates reflecting increased competition.
Operating costs before depreciation, amortisation and exceptional items were £16 million lower in 2004 or 11 per cent at constant currency rates. This reduction included the benefit of lower marketing costs, reduced headcount, and general tightening of other operating expenses.
Back to Contents
|
|---|
| | | 2005
£m | | 2004
£m | | 2003
£m | |
|---|
| | | | | | | | | | | |
| | Turnover | | 167 | | | 161 | | | 159 | |
| | Costs | | | | | | | | | |
| |
| |
| | Outpayments and network costs1 | | (39 | ) | | (40 | ) | | (35 | ) |
| | Staff costs | | (27 | ) | | (27 | ) | | (28 | ) |
| | Other | | (19 | ) | | (22 | ) | | (16 | ) |
| |
| |
| | | | (85 | ) | | (89 | ) | | (79 | ) |
| | Depreciation before exceptional items | | (18 | ) | | (20 | ) | | (22 | ) |
| | Amortisation before exceptional items | | 2 | | | 3 | | | 2 | |
| | Joint ventures and associates | | 28 | | | 12 | | | 29 | |
| |
| |
| | Total operating profit
before exceptional items | | 94 | | | 67 | | | 89 | |
| | Exceptional operating items | | (1 | ) | | (1 | ) | | (1 | ) |
| |
| |
| | Total operating profit | | 93 | | | 66 | | | 88 | |
| |
| |
|---|
|
| | |
1 Outpayments and network costs include customer acquisition costs and the cost of goods sold. |
Year ended 31 March 2005 compared with year ended 31 March 2004
Rest of the World comprises Cable & Wireless’ businesses in Guernsey, Bahrain and the Maldives, together with smaller operations in the Seychelles, Bermuda, Sakhalin in Russia, Diego Garcia, Falkland Islands, Fiji, Ascension, St Helena, Vanuatu and Solomon Islands. Guernsey and the Maldives account for 60 per cent of the Rest of the World turnover.
Rest of the World reported a total operating profit before exceptional items of £94 million in 2005 compared with £67 million in 2004, an increase of £27 million, or 40 per cent. The increase was primarily due to a strong performance from Batelco, in Bahrain, an associate of the Group together with growth in turnover in the period.
Turnover increased by £6 million, or 4 per cent (11 per cent at constant currency), in 2005 compared with 2004. This turnover growth was due to the ongoing demand for mobile services in Sakhalin, the Maldives and Guernsey which offset a decline in international voice turnover.
Operating costs before depreciation, amortisation and exceptional items at £85 million, decreased by 4 per cent. However, at constant currency, total operating costs were broadly in line with 2004.
Year ended 31 March 2004 compared with year ended 31 March 2003
The total operating profit before exceptional items for the Rest of the World was £67 million in 2004 compared with £89 million in 2003.
Operating costs before depreciation, amortisation and exceptional items increased by 13 per cent from £79 million in 2003 to £89 million in 2004, including an increase in licence fee payments and administrative costs. The income from joint ventures and associates fell by 59 per cent from £29 million to £12 million due to increased competition and the impairment in carrying value of associates.
Back to Contents
Acquisitions
|
|---|
| | | 2005
£m | |
|---|
| | | | | |
| | Turnover | | 11 | |
| | Costs | | | |
| |
| |
| | Outpayments and network costs1 | | (13 | ) |
| | Staff costs | | (12 | ) |
| | Other | | (14 | ) |
| |
| |
| | | | (39 | ) |
| | Depreciation before exceptional items | | (2 | ) |
| | Amortisation before exceptional items | | (4 | ) |
| | Joint ventures and associates | | — | |
| |
| |
| | Total operating loss before exceptional items | | (34 | ) |
| | Exceptional operating items | | — | |
| |
| |
| | Total operating loss | | (34 | ) |
| |
| |
|
| | |
1 Outpayments and network costs include customer acquisition costs and the cost of goods sold. |
Cable & Wireless acquired Bulldog Communications on 28 May 2004.
Turnover for the ten months to 31 March 2005 was £11 million, reflecting strong demand in the SoHo/Consumer (small office or home office) and customer market for the high speed broadband services offered by Bulldog. In particular, Bulldog has seen high demand for its Inter@ctive and Super@ctive products both of which provide 4 Mbps broadband plus national and local phone calls.
Outpayments and network costs of £13 million represent the costs of Bulldog’s UK broadband network, including payments to Cable & Wireless UK for the utilisation of its voice and backbone network.
Staff costs of £12 million represent the recruitment and salary costs of the employee base that has grown significantly since the company’s acquisition.
Bulldog’s investment in advertising and marketing to increase its brand awareness, as well as the costs of external expertise engaged to review and develop Bulldog’s operational processes, are the most substantial components of the £14 million within other costs.
The depreciation charge of £2 million relates to the capital investment being made in the expansion of Bulldog’s local loop unbundled network and associated systems.
The amortisation charge of £4 million relates to the goodwill arising on the acquisition of Bulldog.
|
|---|
| | 2005
£m | |
|---|
| | | | | |
| | Turnover | | 100 | |
| | Costs | | | |
| |
| |
| | Outpayments and network costs1 | | (55 | ) |
| | Staff costs | | (13 | ) |
| | Other | | (5 | ) |
| |
| |
| | | | (73 | ) |
| | Depreciation before exceptional items | | (6 | ) |
| | Amortisation before exceptional items | | (5 | ) |
| | Joint ventures and associates | | 1 | |
| |
| |
| | Total operating profit before exceptional items | | 17 | |
| | Exceptional operating items | | — | |
| |
| |
| | Total operating profit | | 17 | |
| |
| |
|
|---|
| | |
1 Outpayments and network costs include customer acquisition costs and the cost of goods sold. |
Cable & Wireless acquired a 55 per cent economic interest in Monaco Telecom on 18 June 2004. Monaco Telecom is the national telecom operator in Monaco and reported a total operating profit before exceptional items of £17 million.
Monaco Telecom’s turnover for the nine months to 31 March 2005 of £100 million was derived from the provision of domestic fixed line, mobile and cable TV services together with the provision of mobile services in Afghanistan and Kosovo, as well as satellite and call centre services.
International and domestic voice turnover of £17 million were affected by fixed to mobile substitution within the Monaco Telecom customer base, as well as the reduction in internet dial-up as customers migrated from this service offering to the company’s ADSL offering (Data and IP turnover was £8 million). Mobile turnover at £19 million was driven by an increase in both prepaid and postpaid subscribers. Additionally, turnover of £56 million was earned from Monaco Telecom’s managed service contracts in Afghanistan and Kosovo together with satellite and call centre activities.
The outpayments and network costs of £55 million represent the costs of Monaco Telecom’s domestic and international network including payments to other operators for interconnect and roaming charges.
The staff and other costs of £18 million represent the salary costs of the employee base, as well as general administrative costs.
Depreciation of £6 million relates to the domestic and international networks of Monaco.
The amortisation charge of £5 million relates to the goodwill and other intangibles recorded on the acquisition of Monaco Telecom.
Back to Contents
Operating and financial review
Review by division – summary
The table below sets out a summary of the turnover and operating profit/(loss) before non-operating items, interest and taxation for continuing and discontinued operations.
| |
| Turnover and total operating profit/(loss) before non-operating items, interest and taxation by division |
|
|---|
| | 2005 | | 2004 | | 2003 | |
|---|
| |
| |
|---|
| | Turnover
£m | | Total
operating
profit/(loss)
£m | | Turnover
£m | | Total
operating
profit/(loss)
£m | | Turnover
£m | | Total
operating
profit/(loss)
£m | |
|---|
| | | | | | | | | | | | | | | | | | | | |
| | United Kingdom | | 1,602 | | | 16 | | | 1,661 | | | (234 | ) | | 1,684 | | | (3,929 | ) |
| | CWAO | | 16 | | | 1 | | | 11 | | | (16 | ) | | — | | | — | |
| | Europe | | 186 | | | (50 | ) | | 262 | | | (14 | ) | | 304 | | | (369 | ) |
| | Asia | | 39 | | | 4 | | | 32 | | | (10 | ) | | 79 | | | (44 | ) |
| | Bulldog | | 11 | | | (34 | ) | | — | | | — | | | — | | | — | |
| | | | | | | | | | | | | | | | | | | | |
| | National Telcos | | | | | | | | | | | | | | | | | | |
| |
| |
| | Caribbean | | 550 | | | 102 | | | 633 | | | (100 | ) | | 756 | | | 228 | |
| | Panama | | 257 | | | 75 | | | 265 | | | (3 | ) | | 279 | | | 77 | |
| | Macau | | 117 | | | 35 | | | 128 | | | 38 | | | 146 | | | 42 | |
| | Monaco | | 100 | | | 17 | | | — | | | — | | | — | | | — | |
| | Rest of the World | | 167 | | | 93 | | | 161 | | | 66 | | | 159 | | | 88 | |
| |
| |
| | Total National Telcos | | 1,191 | | | 322 | | | 1,187 | | | 1 | | | 1,340 | | | 435 | |
| | Other | | (22 | ) | | (94 | ) | | (23 | ) | | (88 | ) | | (30 | ) | | (29 | ) |
| |
| |
| | Continuing operations | | 3,023 | | | 165 | | | 3,130 | | | (361 | ) | | 3,377 | | | (3,936 | ) |
| | Discontinued operations | | 199 | | | 13 | | | 541 | | | (179 | ) | | 1,014 | | | (2,064 | ) |
| |
| |
| | Total | | 3,222 | | | 178 | | | 3,671 | | | (540 | ) | | 4,391 | | | (6,000 | ) |
| |
| |
|
Back to Contents
Liquidity and capital resources
Treasury policy
The Group’s treasury operations are managed on the basis of objectives, policies and authorities approved by Cable and Wireless plc’s Board of Directors.
Day-to-day management of treasury activities is delegated to the Chief Financial Officer and the Group Treasurer, within specified financial limits for each type of transaction and counterparty.
To the extent that subsidiary operating companies undertake treasury transactions, these are governed by Group policies and delegated authorities. Material subsidiary positions are approved and monitored by the Group treasury function. Where appropriate, each position and transaction is reported to the Board. All subsidiaries are required to report details of their cash, debt and hedging positions to Group treasury on a monthly basis.
The key responsibilities of the treasury function include funding, investment of cash and the management of interest rate and foreign currency risk. The majority of the Group’s funding (approximately 89 per cent at 31 March 2005) and cash resources (approximately 86 per cent at 31 March 2005) are managed centrally.
Wherever possible individual companies in the Group are funded in, and operate in, their functional currency, many of which are linked, directly or indirectly, to the US dollar.
Cable & Wireless only uses derivatives and financial instruments including forward foreign exchange contracts, interest rate swaps, cross currency swaps and options in the management of its foreign currency and interest rate exposures in accordance with strategies agreed from time to time by the Treasury Management Committee (comprising of the Chief Financial Officer, Group Treasurer and other senior financial managers as required) and subject to policies approved by the Board. Derivatives are not used for trading or speculative purposes and all material derivative transactions and positions are monitored and reported to the Board on a monthly basis. The Group does not have material derivative positions outstanding at 31 March 2005 as detailed in Note 25 to the Financial Statements.
Liquidity
At 31 March 2005, Cable & Wireless had Cash, Current asset investments and short-term deposits of £2,166 million (2004 – £2,367 million). This amount included £14 million (2004 – £12 million) of treasury instruments and £80 million (2004 – £50 million) of Credit Linked Notes.
This cash is a significant component of the Group’s overall liquidity and capital resources.
At 31 March 2005, approximately 86 per cent of the Group’s cash is held centrally and is predominantly invested in short-term bank deposits, commercial paper up to one year in maturity and AAA-rated money market funds.
In certain circumstances, it has been efficient to use surplus funds to repurchase bonds. To date £19.9 million of the £200 million 8.625 per cent bonds due 2019 have been bought back at an average price of 99.83 pence and £16 million of the £200 million 8.75 per cent bonds due 2012 have been bought back at an average price of 101.625 pence.
During 2005 the Group purchased £80 million of Credit Linked Notes issued by AA-rated banks and referenced to the Company’s £200 million bond which matures in 2012. This transaction has a similar economic effect to repurchasing the bonds for the period of the investment. Further information on these transactions is given in Note 20 to the Financial statements.
Certain foreign subsidiaries operate in jurisdictions which restrict the ability to repatriate cash to the parent company. £55 million of cash held in restricted jurisdictions is not included in Cash, current asset investments and short-term deposits at 31 March 2005 (2004 – £40 million). Included within short-term deposits are £42 million which is pledged as a cash collateral against bank loans and guarantees and £30 million held in the Group’s insurance subsidiary Pender against potential claim settlements.
Funding
At 31 March 2005, Cable & Wireless had gross debt of £824 million (2004 – £919 million, 2003 – £1,546 million).
The Group’s debt comprises both bank debt and publicly quoted bonds. Cable & Wireless’ debt has an average maturity of approximately seven years.
Approximately 75 per cent of the Group’s debt is represented by public bonds denominated in sterling. Two sterling denominated bonds of £184 million (after bonds bought back of £16 million) and £180 million (after bonds bought back of £20 million) mature in 2012 and 2019 respectively. The Group anticipates that the Group’s £258 million Unsecured Convertible Bonds will be redeemed at their principal amount in 2010 unless purchased, redeemed or converted to ordinary shares prior to maturity.
The remainder of the Group’s debt is made up of a loan of £121 million maturing in 2006, with the balance being mainly amortising loans.
Cable & Wireless believes that its capital resources are sufficient to meet its current and planned requirements for at least the next 12 months. The Group’s ability to meet long-term capital requirements beyond this 12-month period will depend on many factors both inside and outside of its control. Cable & Wireless cannot be certain that additional financing, if required, will be available on terms favourable to the Group, if at all.
Share Buy-Back Programme
During the year, a £250 million share buy-back programme was initiated. Shares repurchased are held as treasury shares. To date 60.5 million shares have been bought back at an average price of 124.41 pence (£75 million).
Back to Contents
Operating and financial review
Liquidity and capital resources
Interest rate management
At 31 March 2005, approximately 82 per cent of Group debt has been raised at fixed rates of interest with approximately 75 per cent raised as fixed rate bonds. As at 31 March 2005 the Group did not have any derivative contracts outstanding in relation to interest rate exposures arising from its debt (2004 – £10 million).
The Group’s cash resources currently earn interest at floating rates. In prior years, in a falling interest rate environment, the Group has actively hedged its return on cash resources with the use of interest rate swaps and forward rate agreements. No such hedges were used during 2005 and as at 31 March 2005 there are no derivative contracts outstanding in relation to the Group’s investments.
Exchange rate management
As at 31 March 2005 the Group has £23 million (2004 – £50 million, 2003 – £12 million) notional value of forward foreign exchange contracts for the purchase of currencies and £6 million (2004 – £28 million, 2003 – £nil) notional value of forward foreign exchange contracts for the sale of currencies.
As at 31 March 2005 the Group has £121 million (2004 – £121 million, 2003 – £502 million) notional value of cross currency swaps used in the management of its foreign currency debt obligations.
Borrowing facilities
The Group does not have any significant undrawn committed facilities as at 31 March 2005.
Credit ratings
The Company’s long-term credit ratings remained below investment grade during the year. Credit ratings at 26 August 2005 are detailed in the table below:
| Cable and Wireless plc’s debt ratings |
| |
|
| | Standard & Poor’s | | BB | |
| | Moody’s | | Ba3 | |
| | Fitch | | BB+ | |
|
Credit ratings below investment grade may limit future access to the debt capital markets and may increase both the future cost of funding and impact adversely the terms on which debt may be available. In addition, cash collateral or guarantees may be required to support any future credit terms.
The credit ratings do not have any impact on the interest cost of existing debt.
Other loans and contractual obligations under leases
Cable & Wireless’ loans and contractual obligations under finance and operating leases are analysed in Notes 21 and 27 to the Financial statements.
None of the above funding arrangements and facilities have covenants that are expected to restrict normal business activities.
Off-balance sheet arrangements
Operating leases
In the normal course of its business, Cable & Wireless and its subsidiaries enter into operating leases, relating to property, customer terminating equipment and other operational commitments. Minimum lease terms range from 1 year to 50 years. The effect such obligations are expected to have on liquidity and cash flow in future periods is set out in the contractual obligations table below.
Other commitments and contingent liabilities
Other commitments and contingent liabilities that have or are reasonably likely to have a current or future material effect on the Group’s financial condition, changes in financial condition, turnover or expenses, results of operations, liquidity, capital expenditures or capital resources are set out in Note 26 to the Financial Statements.
Contractual obligations
The following table sets out the Group’s known contractual obligations as at 31 March 2005: |
|
|---|
| | | Payments due by period | |
|---|
| | |
| |
|---|
| | | Total
£m | | Less
than
1 year
£m | | 2-3
years
£m | | 4-5
years
£m | | After
5 years
£m | |
|---|
| | Long-term debt,
including current
maturities | | 823 | | | 22 | | | 158 | | | 13 | | | 630 | |
| | Capital lease obligations | | 1 | | | 1 | | | — | | | — | | | — | |
| | Operating leases | | 446 | | | 89 | | | 121 | | | 85 | | | 151 | |
| | Other | | 49 | | | 49 | | | — | | | — | | | — | |
| |
| |
| | Total | | 1,319 | | | 161 | | | 279 | | | 98 | | | 781 | |
| |
| |
|
Operating lease commitments represent future minimum rental payments required under operating leases that have initial or remaining non cancellable lease terms in excess of one year at 31 March 2005.
The Group enters into a number of arrangements with other international carriers relating to the reciprocal transfer of telecommunications traffic between countries. Under these arrangements both parties are committed to transferring a minimum level of International Direct Dial traffic for termination on the other party’s network. Typically there is no net outflow of cash as a result of these transactions. These transactions are not included in the above table.
Back to Contents
Capital expenditure
Capital expenditure on plant, equipment and property totalled £344 million in 2005 compared with £342 million in 2004 and £810 million in 2003.
| All capital expenditure has been funded internally. |
|
|---|
| | | 2005
£m | | 2004
£m | |
|---|
| | | | | | | | |
| | United Kingdom | | 138 | | | 101 | |
| | CWAO | | — | | | — | |
| | Europe | | 2 | | | 7 | |
| | Asia | | 2 | | | 3 | |
| | Bulldog | | 27 | | | a | |
| | | | | | | | |
| | National Telcos | | | | | | |
| |
| |
| | Caribbean | | 86 | | | 134 | |
| | Panama | | 41 | | | 27 | |
| | Macau | | 9 | | | 16 | |
| | Monaco | | 5 | | | a | |
| | Rest of the World | | 20 | | | 18 | |
| |
| |
| | Total National Telcos | | 161 | | | 195 | |
| | Other | | 2 | | | 20 | |
| |
| |
| | Continuing operations | | 332 | | | 326 | |
| | Discontinued operations | | 12 | | | 16 | |
| |
| |
| | Group capital expenditure | | 344 | | | 342 | |
| |
| |
|
| | |
a Acquired in 2005, therefore no 2004 or 2003 capital expenditure. |
2003 capital expenditure (as previously reported) was £544 million in Cable & Wireless Global (United Kingdom, CWAO, Europe and Asia), £264 million in Cable & Wireless Regional (Caribbean, Panama, Macau and Rest of the World) and £2 million in Other.
Contracts placed for ongoing capital expenditure totalled £49 million at 31 March 2005.
The UK spent £138 million (2004 – £101 million) on capital expenditure in 2005 of which £48 million was spent on network, £39 million was spent on equipment required to connect customers to the network, £24 million was spent on business process transformation and £27 million was spent on other related business projects.
Asia spent £2 million (2004 – £3 million) on capital expenditure in 2005.
Bulldog spent £27 million on capital expenditure in 2005 on the expansion of its LLU network across the UK.
National Telcos spent £161 million (2004 – £195 million) on capital expenditure in 2005. Capital expenditure was primarily related to expanding and upgrading the existing GSM mobile and IP services.
In the next three years, Cable & Wireless plans to invest £190 million in a UK Next Generation Network (“NGN”), with £80 million planned to be spent in 2006. It is expected a large proportion of the NGN expenditure will replace legacy expenditure that the Group believes would otherwise have been required to maintain the efficiency of the current network. As a result, over the three-year period the Group expects a net increase in capital expenditure of approximately £35 million associated with NGN.
Back to Contents
Operating and financial review
Cash flow
| Summary consolidated cash flow statement |
|
|---|
| | | 2005
£m | | 2004
£m | | 2003
£m | |
|---|
| | | | | | | | | | | |
| | Net cash inflow from
operating activities | | 346 | | | 73 | | | 95 | |
| | Dividends, return on investments
and servicing of finance | | 15 | | | (32 | ) | | 65 | |
| | Taxation paid | | (60 | ) | | (43 | ) | | (438 | ) |
| | Capital expenditure | | (344 | ) | | (342 | ) | | (810 | ) |
| | Financial investment | | 76 | | | 301 | | | 595 | |
| | Acquisitions and disposals | | (35 | ) | | (118 | ) | | 110 | |
| | Equity dividends paid | | (97 | ) | | — | | | (119 | ) |
| | Movement in liquid resources | | 75 | | | 932 | | | (1,040 | ) |
| | Net financing repaid | | (153 | ) | | (582 | ) | | (578 | ) |
| |
| |
| | (Decrease)/increase in cash
in the year | | (177 | ) | | 189 | | | (2,120 | ) |
| |
| |
|
Year ended 31 March 2005 compared with year ended 31 March 2004
The decrease in cash of £177 million in the year is principally reflective of an equity dividend paid of £97 million, financing repayments of £153 million and £75 million of cash transferred from liquid resources.
Other operating and investing activities resulted in a broadly cash neutral position, including cash inflows from operating activities of £346 million, cash inflows from financial investment of £76 million, cash outflows in respect of capital expenditure £344 million and taxation paid £60 million.
Operating activities generated £346 million of cash in 2005, an increase of £273 million against the prior period principally due to improved performance following the exit of the Group’s US domestic operations.
Tax paid in 2005 relates in the main to settlement of liabilities in the Caribbean and other overseas businesses.
Capital expenditure of £344 million in the year was in line with 2004. In 2005, the Group continued to expand and enhance its mobile networks across the National Telcos in response to continued growth in customer demand. There has also been a shift to investment in fixed network, in particular in respect of local loop unbundling by Bulldog. Further, the Group’s focus on its restructuring and transformation has driven spend on systems improvements.
The cash inflow of £76 million in respect of financial investments relates to the disposal of non-core trade investments including the Group’s 3.4 per cent interest in Intelsat. In 2004 £229 million of financial investment cash inflows related to the proceeds on disposal of the Group’s shareholding in PCCW Limited.
The Group reinstated dividends in 2004 and in 2005 paid £97 million to its shareholders in respect of the final 2004 dividend and interim 2005 dividend.
Net financing repaid in 2005 of £153 million included the repurchase of shares for £74 million together with the repayment or repurchase of debt of £86 million.
Year ended 31 March 2004 compared with year ended 31 March 2003
The increase in cash of £189 million in the year principally reflects the transfer from liquid resources of cash totalling £932 million and the realisation of financial investments of £301 million, net of finance repayments of £582 million, capital expenditure of £342 million and net disposal costs of £118 million.
Operating activities generated £73 million of cash in 2004, a decline of £22 million against the prior period principally due to a reduction in working capital.
Tax paid in 2004 relates in the main to settlement of liabilities in the Caribbean and Rest of the World.
Capital expenditure of £342 million declined by £468 million from 2003. This reflects continued focus on the management of capital expenditure and its ability to generate a satisfactory return on investment.
Investment in the year included GSM networks rollout of £111 million in the Caribbean and Panama, together with expenditure on billing systems, network management systems, customer premises equipment and network terminating equipment.
Financial investment generated net cash of £301 million in 2004 of which £229 million related to the proceeds on disposal of the Group’s shareholding in PCCW Limited.
Liquid resources decreased by £932 million in 2004. On 1 April 2003 £1.5 billion held in escrow was released into cash.
Net financing repaid in 2004 of £582 million included long-term debt repayments of £863 million offset by long-term debt issued of £280 million.
Back to Contents
Property and network infrastructure
As at 31 March 2005, Cable & Wireless and its subsidiaries leased or owned some 241 principal properties. The majority of these properties are located in the United Kingdom, Panama and the Caribbean although the spread of properties extends across continental Europe, Asia, and islands in the Atlantic and Indian Oceans.
In addition to these properties, Cable & Wireless owns or leases in excess of 2,000 small technical sites that house equipment necessary to support its operations. In general, Cable & Wireless’ technical properties enjoy the protection of telecommunications legislation, which has the aim of ensuring the continuity of Cable & Wireless’ networks.
The size of Cable & Wireless’ property portfolio has increased marginally from the last financial year primarily as a consequence of the acquisition of additional technical sites in the Caribbean for the purposes of GSM rollout. Additional properties were also incorporated into the portfolio through the acquisition of Monaco Telecom.
A continuing rationalisation programme is still ongoing generally focusing on reducing office space to match Cable & Wireless’ reduced headcount and ongoing operational requirements, including the closure of the Group’s London headquarters and relocation to Bracknell. Acquisition of both office and technical sites occurs where required as referred to above.
In the Caribbean, Panama, Macau, Monaco and Rest of the World, Cable & Wireless typically operates as the domestic incumbent, owning and operating the domestic legacy switched voice networks and associated international interconnect facilities. Cable & Wireless also has international and domestic network facilities in the United Kingdom, Europe and the United States.
Cable & Wireless operates significant international submarine cable, and satellite systems. Many of Cable & Wireless’ subsidiaries and associates also own and operate mobile networks. Examples include Jamaica (GSM and TDMA) and Trinidad and Tobago (GSM and TDMA) in the Caribbean as well as Panama (GSM and TDMA), Macau (GSM), Monaco (partly owns and operates GSM, owns, but does not yet operate, UMTS), the Maldives (GSM) and Bahrain (GSM).
Cable & Wireless companies operate 20 data centres within its national and international operations offering a wide selection of web-based and hosting services.
Back to Contents
Operating and financial review
Disclosures about market risk
Credit risk
Cash deposits and other financial instruments give rise to credit risk, which represents the loss that would be recognised if a counterparty failed to perform as contracted.
The counterparties to all but a small proportion of the Group’s financial instruments are entities rated A1 short-term and/or AA- long-term by Standard and Poor’s (or equivalent by Moody’s and/or Fitch). The credit rating of these counterparties is monitored on an ongoing basis. The types of instrument used for investment of funds are prescribed in Group treasury policies approved by the Board with limits on the exposure to any one counterparty.
Interest rate risk
The Group is exposed to movements of interest rates on its debt, cash balances and derivative instruments. The treasury function seeks to reduce volatility by fixing a proportion of this interest rate exposure whilst taking account of prevailing market conditions as appropriate. There were no derivatives in place as at 31 March 2005 to manage the interest rate exposure on the Group’s investments or debt.
The Group has net floating rate investments of £2,020 million (£2,166 million of investments less £146 million of debt) hence, a 50 basis point decrease in average interest rates to which the Group is exposed (predominantly sterling) would reduce net interest income by approximately £10 million, impacting both earnings and cash flow. By way of illustration, between 31 March 2004 and 31 March 2005 sterling 3 month LIBOR increased from approximately 4.36 per cent to 4.98 per cent.
A reduction in interest rates would have an unfavourable impact upon the fair value of the Group’s fixed rate debt. However, no debt is held for trading purposes and it is intended that it will be kept in place until maturity, hence the exposure to fair value loss has not been modelled.
Exchange rate risk
Cable & Wireless trades in some 80 countries and much of its turnover is from international traffic flows settled in major currencies, principally US dollars. In addition, many of the currencies of the countries in which Cable & Wireless operates are linked, directly or indirectly, to the US dollar.
The Group is exposed to movements in exchange rates in relation to foreign currency payments, dividend income from foreign subsidiaries, reported profits of foreign subsidiaries and the net asset carrying value of foreign investments.
Where appropriate the Group manages its exposure to movements in exchange rates on a net basis and uses forward foreign exchange contracts and other derivative and financial instruments to reduce the exposures created where currencies do not naturally offset in the short term.
Where it is deemed appropriate the Group will undertake hedges to minimise the exposure to individual transactions that create significant foreign exchange exposures for the Group. In addition, overseas subsidiaries are generally financed in their domestic currency to minimise the impact of translation of foreign currency denominated borrowings.
As at 31 March 2005, the Group had in place net forward foreign exchange contracts amounting to £17 million, being £23 million bought and £6 million sold in the same currency against sterling. Consequently, there is no material exposure to movements in exchange rates on these instruments.
The reported profits of the Group are translated at average rates of exchange ruling during the year. Overseas earnings are predominantly in US dollars or currencies linked to the US dollar. In broad terms, based on the 2005 mix of profits, if the average sterling : US dollar rate for the year had been 5 cents higher, the effect would have been to reduce the reported operating profit before exceptional items by approximately £8 million. The Group does not undertake profit translation hedging activities.
As part of the overall policy of managing the exposure arising from foreign exchange movements relating to the net carrying value of overseas investments, the Group may, from time to time, elect to match certain foreign currency liabilities against the carrying value of foreign investments. Currently there are no external foreign currency liabilities matched against the carrying value of foreign investments.
The Group currently does not undertake any hedges of long-term currency trading flows.
Back to Contents
Five year summary
|
|---|
| | | 2005
£m | | 20045
£m | | 20035
£m | | 20025
£m | | 20015
£m | |
|---|
| | | (in £m except per share and per ADR data) | |
| | | | |
| | Profit and loss account year ending 31 March | | | | | | | | | | | | | | | |
| | Amounts in accordance with UK GAAP1 | | | | | | | | | | | | | | | |
| | Group turnover | | 3,222 | | | 3,671 | | | 4,391 | | | 5,748 | | | 7,851 | |
| | Group operating profit/(loss) | | 138 | | | (581 | ) | | (6,075 | ) | | (5,025 | ) | | (382 | ) |
| | Profit/(loss) before taxation | | 363 | | | (224 | ) | | (6,257 | ) | | (4,549 | ) | | 3,516 | |
| | Profit/(loss) after taxation | | 377 | | | (212 | ) | | (6,293 | ) | | (4,860 | ) | | 2,996 | |
| | Minority interests | | (75 | ) | | (25 | ) | | (124 | ) | | (94 | ) | | (258 | ) |
| | Profit/(loss) for the financial year | | 302 | | | (237 | ) | | (6,417 | ) | | (4,954 | ) | | 2,738 | |
| | Basic earnings/(loss) per share (EPS) | | 13.0 | p | | (10.2 | )p | | (275.4 | )p | | (181.2 | )p | | 100.3 | p |
| | Basic earnings/(loss) per ADR2 | | 39.0 | p | | (30.6 | )p | | (826.2 | )p | | (543.6 | )p | | 300.9 | p |
| | Diluted EPS | | 12.3 | p | | (10.2 | )p | | (275.4 | )p | | (181.2 | )p | | 99.2 | p |
| | Diluted earnings/(loss) per ADR2 | | 36.9 | p | | (30.6 | )p | | (826.2 | )p | | (543.6 | )p | | 297.6 | p |
| | Dividends per share3 | | 3.8 | p | | 3.15 | p | | 1.6 | p | | 16.5 | p | | 16.5 | p |
| | Dividends per ADR2 | | 11.4 | p | | 9.45 | p | | 4.8 | p | | 49.5 | p | | 49.5 | p |
| | | | | | | | | | | | | | | | | |
| | Amounts in accordance with US GAAP1 | | | | | | | | | | | | | | | |
| | Net profit/(loss) | | 333 | | | (371 | ) | | (6,239 | ) | | (5,371 | ) | | 2,716 | |
| | Basic EPS | | 14.3 | p | | (15.9 | )p | | (267.8 | )p | | (196.5 | )p | | 99.5 | p |
| | Basic earnings/(loss) per ADR2 | | 42.9 | p | | (47.7 | )p | | (803.3 | )p | | (589.5 | )p | | 298.5 | p |
| | Diluted EPS | | 12.5 | p | | (15.9 | )p | | (267.8 | )p | | (196.5 | )p | | 98.4 | p |
| | Diluted earnings/(loss) per ADR2 | | 37.5 | p | | (47.7 | )p | | (803.3 | )p | | (589.5 | )p | | 295.2 | p |
| | | | | | | | | | | | | | | | | |
| | Income from Continuing Operations6 | | | | | | | | | | | | | | | |
| | Group turnover | | 3,023 | | | 3,130 | | | 3,377 | | | 3,758 | | | 3,720 | |
| | Group operating profit/(loss) | | 125 | | | (402 | ) | | (4,011 | ) | | (2,641 | ) | | (309 | ) |
| | Group profit before taxation and exceptional items7 | | 361 | | | 319 | | | 96 | | | 240 | | | 316 | |
| | | | | | | | | | | | | | | | | |
| | Balance sheet data as at 31 March | | | | | | | | | | | | | | | |
| | Amounts in accordance with UK GAAP1 | | | | | | | | | | | | | | | |
| | Current assets4 | | 3,017 | | | 3,280 | | | 4,906 | | | 7,890 | | | 10,480 | |
| | Total assets | | 5,000 | | | 4,926 | | | 7,324 | | | 16,074 | | | 24,240 | |
| | Net assets | | 2,137 | | | 1,952 | | | 2,482 | | | 9,234 | | | 16,356 | |
| | Loans and obligations under finance leases: | | | | | | | | | | | | | | | |
| | – amounts falling due within one year | | 23 | | | 44 | | | 825 | | | 237 | | | 567 | |
| | – amounts falling due after more than one year | | 801 | | | 875 | | | 721 | | | 2,022 | | | 2,364 | |
| | Other creditors falling due within one year | | 1,511 | | | 1,624 | | | 2,450 | | | 3,734 | | | 4,069 | |
| | Creditors and provisions | | 2,863 | | | 2,974 | | | 4,842 | | | 6,840 | | | 7,884 | |
| | Equity shareholders’ funds | | 1,818 | | | 1,703 | | | 2,111 | | | 8,835 | | | 15,225 | |
| | Number of shares issued (million of shares) | | 2,395 | | | 2,385 | | | 2,383 | | | 2,382 | | | 2,801 | |
| | | | | | | | | | | | | | | | | |
| | Amounts in accordance with US GAAP1 | | | | | | | | | | | | | | | |
| | Shareholders’ equity | | 1,987 | | | 1,787 | | | 2,125 | | | 9,158 | | | 16,190 | |
|
|---|
| | |
1 The Financial Statements are prepared in accordance with UK GAAP, which differs in significant respects from US GAAP. See Note 35 “Summary of differences between United Kingdom and United States GAAP” to the Financial Statements. |
2 ADR (American Depositary Receipt) amounts have been computed on the basis that one ADR represents three Ordinary Shares of 25p each in the Company (“Ordinary Shares”). |
3 Dividends per share and per ADR are based on interim and final dividends paid per Ordinary Share before deduction of withholding taxes. See “Shareholder Information – Taxation”. |
4 Current assets exclude debtors due after more than one year. |
5 The balance sheets for 2004, 2003, 2002 and 2001 have been amended to reflect the change in accounting for ESOPs in light of the adoption of UITF 38 “Accounting for ESOP trusts”. The profit and loss account in 2003 has also been amended to reverse the £116 million impairment in the ESOP recognised in this year. The adoption of UITF 17 “Employee share schemes” did not have a material impact on the Group’s profit and loss account for the four years ended 31 March 2004. Accordingly, the profit and loss account has not been amended for the adoption of UITF 17. |
6 The Group sold its Japanese operations effective 17 February 2005. Under FRS 3 “Reporting Financial Performance”, these businesses have been classified as discontinued. Comparatives for the years ended 31 March 2001 to 31 March 2004 have been adjusted accordingly. |
7 This is a non-UK GAAP financial measure which is used by management as a key performance measure. A reconciliation is set out on page 87. |
Back to Contents
Operating and financial review
Critical accounting policies
In the preparation of Cable & Wireless’ consolidated financial statements a number of estimates and assumptions are made relating to the reporting of results of operations and financial condition. Results may differ significantly from those estimates under different assumptions and conditions. Cable & Wireless believes that the following discussion addresses its most critical accounting policies, which are those that are most important to the presentation of its consolidated financial condition and results. These particular policies require subjective and complex judgements, often as a result of the need to make estimates about the effect of matters that are inherently uncertain.
The policies below distinguish between UK GAAP and US GAAP accounting treatments where there are significant differences.
Valuation of tangible fixed assets and intangible assets (excluding goodwill)
Under UK GAAP, Cable & Wireless assesses the impairment of fixed assets and intangible assets (excluding goodwill) whenever events or changes in circumstances indicate that the carrying value may not be recoverable or otherwise as required by accounting standards. Factors that are considered important which could trigger an impairment review include the following:
| – | significant under-performance relative to expected historical or projected future operating results; |
| |
| – | significant changes in the use of its assets or the strategy for its overall business; |
| |
| – | significant changes in technology and regulatory environments; |
| |
| – | significant negative industry or economic trends; and |
| |
| – | significant decline in its stock price for a sustained period and its market capitalisation relative to net book value. |
Cable & Wireless determines any impairment by comparing the carrying values of each of Cable & Wireless’ income-generating units to their recoverable amounts (the higher of net realisable value and the present value of the future cash flows obtainable as a result of an asset’s continued use). During 2005, Cable & Wireless impaired tangible fixed assets by £8 million (2004 – £526 million, 2003 – £2,381 million). The impairment represented the amount by which the carrying value exceeded the present value of the estimated future cash flows.
Future cash flows were determined with reference to Cable & Wireless’ projections using discount rates from 8 per cent to 40 per cent which represent the estimated weighted average cost of capital for the respective businesses.
Under US GAAP, Cable & Wireless reviews long-lived assets, including property, plant and equipment and amortising intangible assets, for impairment whenever events or changes in circumstances indicate that the carrying value of an asset may not be recoverable.
Recoverability of assets that are held and used is measured by comparing the sum of the future undiscounted cash flows derived from an asset group to their carrying value. If the carrying value of the asset group exceeds the sum of the future undiscounted cash flows, impairment is considered to exist and an impairment charge is recognised for the amount by which the carrying value exceeds the present value of the estimated future cash flows.
The identification of impairment indicators, the estimation of future cash flows and the determination of fair values for assets of reporting units requires management to make significant judgements concerning the identification and validation of impairment indicators, the timing and amount of expected cash flows and applicable discount rates.
Valuation of assets for purchase accounting
Cable & Wireless allocates the cost of acquired companies to tangible and identifiable intangible assets and liabilities acquired by reference to their estimated fair values at the time of acquisition. The remaining amount is recorded as goodwill. Any value assigned to the identifiable assets is determined by reference to an active market, independent appraisal, or estimated by our management based on cash flow projections which include estimates and judgment regarding expectations for the economic useful lives of the products and technology acquired. In the latter situation, where appropriate, third party valuation specialists are involved.
The allocation of costs to identifiable assets under US GAAP may differ from the allocation under UK GAAP. Under UK GAAP, certain intangible assets are not distinguished by Cable & Wireless, such as brand name and customer base. Under US GAAP, these elements are recognised as separate intangible assets.
Accounting for valuation and recovery of goodwill
Goodwill usually arises in business combinations as noted above. Under UK GAAP, the useful life assigned to goodwill is an estimate that is based on the judgment of management at the time of acquisition. Goodwill is then amortised on a straight-line basis over its useful life. For US GAAP, goodwill is not amortised, but tested at least annually for impairment.
As noted above Cable & Wireless reviews, on a regular basis, the performance of its income generating units. Under UK GAAP, goodwill is allocated to the relevant income generating unit and assessed for impairment in the manner described under “Valuation of tangible fixed assets and intangible assets (excluding goodwill)”.
US GAAP requires that goodwill be tested for impairment at least annually using a two-step approach at the reporting unit level. In the first step, the fair value of the reporting unit is compared to its carrying value, including goodwill. The determination of fair value of each reporting unit, which requires significant judgement, is generally based on the present value of future cash flows. If the fair value exceeds the carrying value, no impairment loss is recognised. In the case that the fair value of the reporting unit is less than its carrying value, a second step is performed, which compares the implied fair
Back to Contents
value to the implied carrying value of the reporting units’ goodwill. The implied fair value of goodwill is determined based upon the difference between the fair value of the reporting unit and the fair value of the identifiable assets and liabilities of the reporting unit. If the implied fair value of goodwill is less than its carrying value, the difference is recorded as an impairment charge.
Depreciation and amortisation of fixed assets
Cable & Wireless assigns useful lives to fixed assets based on periodic studies of actual asset lives and the intended use for those assets for example, related to fixed assets purchased for specific customer contracts. Changes in circumstances such as technological advances, prospective economic utilisation and physical condition of the assets concerned could result in the actual useful lives differing from initial estimates. Where Cable & Wireless determines that the useful life of property and equipment should be shortened, Cable & Wireless depreciates the net book value in excess of the residual value over the revised remaining useful life, thereby increasing depreciation expense. Any change in asset lives would be reported in Cable & Wireless’ financial statements when the change in estimate is determined.
Revenue recognition
Revenue, which excludes value added tax or other sales taxes, represents the amount receivable in respect of telecommunications services provided to customers and is accounted for on the accruals basis to match revenue with provision of service. Revenue is recognised monthly as services are provided. Revenue in respect of services invoiced in advance is deferred and recognised on provision of the service. Revenue in respect of unbilled services is accrued.
Management’s judgement is required in assessing the application of the principles and the specific guidance in respect of Group revenues, including the presentation of turnover as principal or as agent in respect of income received from transmission of content provided by third parties.
Interconnection with other operators
In Cable & Wireless’ normal course of business it interconnects its networks with other telecommunications operators. In certain instances it uses estimates to determine the amount of income receivable from or payments to these other operators. The prices at which these services are charged are sometimes regulated and may be subject to retrospective adjustment. Estimates are used in assessing the likely effect of these adjustments. These interconnect transactions are distinguished from capacity sales which represent sales of Indefeasible Rights of Use (“IRUs”). IRUs give the purchaser the right to use a cable fibre or wavelength for a specified period of time.
Provision for bad and doubtful debts
The provision for bad and doubtful debts reflects management’s estimate of losses arising from the failure or inability of Cable & Wireless’ customers to make required payments. The provision is based on the ageing of customer accounts, customer credit worthiness and Cable & Wireless’ historical write-off
experience. Changes to the provision may be required if the financial condition of Cable & Wireless’ customers was to improve or deteriorate. An improvement in financial condition may result in lower actual write-offs. Historically, changes to the estimate of losses have not been material to the Group’s financial position and results.
Taxation
Cable & Wireless’ tax charge on ordinary activities is the sum of the total current and deferred tax charges. The calculation of Cable & Wireless’ total tax charge necessarily involves a degree of estimation and judgement in respect of certain items whose tax treatment cannot be finally determined until a formal resolution has been reached with the relevant tax authority or, as appropriate, through a formal legal process. The final resolution of some of these items may give rise to material profit and loss and/or cash flow variances.
The resolution of issues is not always within the control of Cable & Wireless and it is often dependent on the efficiency of the administrative and legal processes in the relevant taxing jurisdictions in which Cable & Wireless operates. Issues can, and therefore often do, take many years to resolve. Payments in respect of tax liabilities for an accounting period result from payments on account and on the final resolution of open items. As a result there can be substantial differences between the tax charge in the profit and loss account and tax payments.
Recognition of deferred tax assets
The recognition of deferred tax assets is based upon whether it is more likely than not that sufficient and suitable taxable profits will be available in the future, against which the reversal of timing differences can be deducted. Recognition therefore involves judgement regarding the future financial performance of the particular legal entity or tax group in which the deferred tax asset has been recognised.
Non-discounting of deferred tax assets and liabilities
UK GAAP permits, and US GAAP prescribes, calculating deferred taxation assets or liabilities on an undiscounted basis. It is Cable & Wireless’ accounting policy to measure deferred taxation on an undiscounted basis.
Back to Contents
Operating and financial review
Critical accounting policies
Exceptional items
Under UK GAAP, the Company classified the following income/(costs) as exceptional items:
|
|---|
| | | 2005
£m | | 2004
£m | | 2003
£m | |
|---|
| | | | | | | | |
|---|
| | Exceptional operating costs | | (145 | ) | | (244 | ) | | (442 | ) |
| | Exceptional depreciation | | (8 | ) | | (526 | ) | | (2,381 | ) |
| | Exceptional amortisation | | — | | | (10 | ) | | (2,725 | ) |
| | Exceptional profits less (losses) on
sale or termination of operations | | 116 | | | 250 | | | (147 | ) |
| | Exceptional amounts
written off investments | | — | | | — | | | (274 | ) |
| | Exceptional profits on disposal
of fixed assets | | 23 | | | 28 | | | 62 | |
| | Exceptional tax credit | | 85 | | | — | | | — | |
|
|---|
Judgement is required to classify such items as exceptional items. The Company is guided by FRS 3 “Reporting Financial Performance” which provides that material items which derive from events or transactions that fall within the ordinary activities are disclosed as exceptional items by virtue of their size or incidence such that the financial statements give a true and fair view.
Exceptional operating costs
In the year ended 31 March 2005 exceptional items included in other operating costs related principally to redundancy and reorganisation costs incurred. These provisions are based on various assumptions, including future severance costs, sublease or disposal costs and contractual termination costs. Such estimates are judgemental and may change based on actual experience.
Liabilities
The Company complies with FRS 12 “Provisions, contingent liabilities and contingent assets”. A provision is recognised when there is a constructive obligation in respect of a past event. Provisions and liabilities are recognised in respect of tax, pensions, transactions and restructurings. Management’s judgement is required to quantify such amounts.
Pensions
The regular cost of providing benefits under defined benefit schemes is charged to operating profit over the expected remaining service lives of the members of the schemes so as to achieve a constant percentage of pensionable pay. Variations from the regular cost arising from periodic actuarial valuations of the principal defined benefit schemes are allocated to operating profit over the expected remaining service lives of the members.
The expected cost of providing these defined benefit pensions will depend on an assessment of such factors as:
| – | the life expectancy of the members; |
| |
| – | the length of service; |
| |
| – | the rate of salary progression; |
| |
| – | the rate of return earned on assets in the future; and |
| |
| – | the rate used to discount future pension liabilities. |
The assumptions used by Cable & Wireless are set out in Note 8 to the Financial statements and are estimates chosen from a range of possible actuarial assumptions which may not necessarily be borne out in practice but are comparable to the median estimates in this regard used by other FTSE 100 companies. Changes to these assumptions could materially impact the size of the defined benefit schemes deficits of £185 million, calculated under FRS 17, “Retirement Benefits”, disclosed in Note 8.
International Financial Reporting Standards (“IFRS”)
EU regulated companies are required to file consolidated financial statements that have been prepared in accordance with IFRS for accounting periods beginning on or after 1 January 2005. Accordingly, IFRS will apply for the first time to Cable & Wireless’ consolidated financial statements for the year ending 31 March 2006. Consequently, all the Group’s public reporting in respect of accounting periods beginning on or after 1 April 2005 will be prepared in accordance with IFRS.
As reported last year, the Group has had in place a project to convert the Group’s financial statements together with the related underlying processes and systems to IFRS. The restatement of key financial information for the years ended 31 March 2004 and 2005 to IFRS is well under way. Unaudited IFRS financial information for the year ended 31 March 2004 was released on 31 March 2005 and is available on the Company’s website. Full 2005 IFRS information will be released before the Group’s interim announcement in November 2005.
The SEC has issued an accommodation for foreign private issuers preparing their first set of financial statements under IFRS which allows issuers to file two rather than three years of information. Cable & Wireless expects to take advantage of the accommodation and hence the Group’s date of transition to IFRS will be 1 April 2004. As noted above, the Group previously issued unaudited information to investors outlining the impact of the change to international standards on the financial statements for the year ended 31 March 2004; this assumed a transition date of 1 April 2003. The change in transition date to 1 April 2004 will have no effect on the net income from continuing activities reported under IFRS for the year ended 31 March 2005 or on net assets as at that date.
Back to Contents
Reconciliation of US GAAP and of non-GAAP
measures
US GAAP reconciliation
The Company prepares its consolidated financial statements in accordance with UK GAAP, which differs in significant respects from US GAAP, see Note 35 “Summary of differences between United Kingdom and United States GAAP”. A comparison of net loss and shareholders’ equity of Cable & Wireless when applying UK and US GAAP is provided in the table below:
|
|---|
| | Net profit/(loss) | UK GAAP
£m | | US GAAP
£m | |
|---|
| | | | | | | | |
| | Year ended 31 March 2005 | | 302 | | | 333 | |
| | Year ended 31 March 2004 | | (237 | ) | | (371 | ) |
| | Year ended 31 March 2003 | | (6,417 | ) | | (6,239 | ) |
| |
| |
|---|
| | | | | | | | |
| | Shareholders’ equity | UK GAAP
£m | | US GAAP
£m | |
|---|
| | | | | | | | |
| | As at 31 March 2005 | | 1,818 | | | 1,987 | |
| | As at 31 March 2004 | | 1,703 | | | 1,787 | |
| |
| |
|---|
|
|---|
Reconciliation of non-GAAP measures
Investors should consider non-GAAP financial measures in addition to, and not as a substitute for or as superior to, financial measures presented in accordance with GAAP.
Continuing operations – Profit/(loss) before taxation and exceptional items
Cable & Wireless uses ‘Continuing operations – Profit/(loss) before taxation and exceptional items’, a non-UK GAAP financial measure, as one of the key performance indicators for evaluating the underlying trading performance of the Group. Profit before taxation and exceptional items is also taken into account in assessing incentive payments. The Group believes that ‘Continuing operations – Profit/(loss) before taxation and exceptional items’ provides an important measure of the underlying trading performance of the Group.
The table below sets out a reconciliation of ‘Continuing operations – Profit/(loss) before taxation and exceptional items’ to ‘Total Group – Profit/(loss) on ordinary activities before taxation’.
| |
|
| | | 2005 | | 2004 | | 2003 | |
|---|
| | |
| |
|---|
| | | Continuing
£m | | Discon-
tinued
£m | | Total
Group
£m | | Continuing
£m | | Discon-
tinued
£m | | Total
Group
£m | | Continuing
£m | | Discon-
tinued
£m | | Total
Group
£m | |
|---|
| | | | | | | | | | | | | | | | | | | | | | | | | | | | | |
| | Profit/(loss) on ordinary activities
before taxation and exceptional items | | 361 | | | 16 | | | 377 | | | 319 | | | (41 | ) | | 278 | | | 96 | | | (446 | ) | | (350 | ) |
| | Less: Net interest and other similar
income | | (39 | ) | | 1 | | | (38 | ) | | (21 | ) | | 8 | | | (13 | ) | | (111 | ) | | 9 | | | (102 | ) |
| |
| |
| | Profit/(loss) on ordinary activities
before interest, taxation and
exceptional items | | 322 | | | 17 | | | 339 | | | 298 | | | (33 | ) | | 265 | | | (15 | ) | | (437 | ) | | (452 | ) |
| | Exceptional operating costs | | (144 | ) | | (1 | ) | | (145 | ) | | (219 | ) | | (25 | ) | | (244 | ) | | (151 | ) | | (291 | ) | | (442 | ) |
| | Exceptional depreciation | | (8 | ) | | — | | | (8 | ) | | (404 | ) | | (122 | ) | | (526 | ) | | (1,574 | ) | | (807 | ) | | (2,381 | ) |
| | Exceptional amortisation | | — | | | — | | | — | | | (10 | ) | | — | | | (10 | ) | | (2,196 | ) | | (529 | ) | | (2,725 | ) |
| | Exceptional profits less (losses) on
sale and termination of operations | | (14 | ) | | 130 | | | 116 | | | 2 | | | 248 | | | 250 | | | — | | | (147 | ) | | (147 | ) |
| | Exceptional profits less (losses) on
disposal of fixed assets | | 7 | | | 16 | | | 23 | | | 12 | | | 16 | | | 28 | | | 62 | | | — | | | 62 | |
| | Exceptional asset writedown | | — | | | — | | | — | | | — | | | — | | | — | | | (274 | ) | | — | | | (274 | ) |
| |
| |
| | Profit/(loss) on ordinary activities
before interest and taxation | | 163 | | | 162 | | | 325 | | | (321 | ) | | 84 | | | (237 | ) | | (4,148 | ) | | (2,211 | ) | | (6,359 | ) |
| | Net interest and other similar
income/(charges) | | 39 | | | (1 | ) | | 38 | | | 21 | | | (8 | ) | | 13 | | | 111 | | | (9 | ) | | 102 | |
| |
| |
| | Profit/(loss) on ordinary activities
before taxation | | 202 | | | 161 | | | 363 | | | (300 | ) | | 76 | | | (224 | ) | | (4,037 | ) | | (2,220 | ) | | (6,257 | ) |
| |
| |
|
Back to Contents
Reconciliation of US GAAP and of non-GAAP
measures
Operating costs before depreciation, amortisation and exceptional items
As noted earlier, the Group presents ‘Operating costs before depreciation, amortisation and exceptional items’. This is a non-UK GAAP financial measure that is used by management as a key performance measure. Cable & Wireless believes it appropriate to show operating costs excluding depreciation and amortisation because these items are non-cash in nature. This presentation is also consistent with the way that the Group’s financial performance is
measured by management and Cable & Wireless believes this presentation allows a more meaningful comparison to be made of the trading results of the Group for the three years presented.
The reconciliation of the non-UK GAAP financial measure of ‘Operating costs before depreciation, amortisation and exceptional items’ to the GAAP financial measure of ‘Total operating costs’, by major geography, is set out below:
| |
|
| | Year ended 31 March 2005 | | | | | | | | | |
|---|
| | | UK | | CWAO | | Europe | | Asia | | Bulldog | | National
Telcos | | Other | | Discontinued | | Total
Group | |
|---|
| | | | | | | | | | | | | | | | | | | | | | | | | | | | | |
| | Total operating costs before depreciation,
amortisation and exceptional items | | 1,452 | | | 21 | | | 198 | | | 33 | | | 39 | | | 764 | | | 40 | | | 183 | | | 2,730 | |
| | Exceptional items | | 66 | | | (6 | ) | | 38 | | | 1 | | | — | | | 22 | | | 31 | | | 1 | | | 153 | |
| | Depreciation | | 60 | | | — | | | — | | | 1 | | | 2 | | | 128 | | | 1 | | | 2 | | | 194 | |
| | Amortisation | | — | | | — | | | — | | | — | | | 4 | | | 3 | | | — | | | — | | | 7 | |
| |
| |
| | Total operating costs | | 1,578 | | | 15 | | | 236 | | | 35 | | | 45 | | | 917 | | | 72 | | | 186 | | | 3,084 | |
| |
| |
|
| |
|---|
|
|---|
| | Year ended 31 March 2004 | | | | | | | | |
|---|
| | | UK | | CWAO | | Europe | | Asia | | National
Telcos | | Other | | Discontinued | | Total
Group | |
|---|
| | | | | | | | | | | | | | | | | | | | | | | | | | |
| | Total operating costs before depreciation,
amortisation and exceptional items | | 1,560 | | | 27 | | | 268 | | | 33 | | | 757 | | | 32 | | | 546 | | | 3,223 | |
| | Exceptional items | | 266 | | | — | | | 7 | | | 8 | | | 321 | | | 31 | | | 147 | | | 780 | |
| | Depreciation | | 68 | | | — | | | 1 | | | 1 | | | 153 | | | 2 | | | 27 | | | 252 | |
| | Amortisation | | — | | | — | | | — | | | — | | | (3 | ) | | — | | | — | | | (3 | ) |
| |
| |
| | Total operating costs | | 1,894 | | | 27 | | | 276 | | | 42 | | | 1,228 | | | 65 | | | 720 | | | 4,252 | |
| |
| |
|
|---|
| |
|---|
|
|---|
| | Year ended 31 March 2003 | | | | | | | | |
|---|
| | | UK | | CWAO | | Europe | | Asia | | National
Telcos | | Other | | Discontinued | | Total
Group | |
|---|
| | | | | | | | | | | | | | | | | | | | | | | | | | |
| | Total operating costs before depreciation,
amortisation and exceptional items | | 1,568 | | | — | | | 347 | | | 100 | | | 775 | | | 6 | | | 1,261 | | | 4,057 | |
| | Exceptional items | | 3,570 | | | — | | | 298 | | | 16 | | | 34 | | | 3 | | | 1,627 | | | 5,548 | |
| | Depreciation | | 413 | | | — | | | 28 | | | 3 | | | 159 | | | 3 | | | 129 | | | 735 | |
| | Amortisation | | 62 | | | — | | | — | | | 4 | | | (1 | ) | | — | | | 61 | | | 126 | |
| |
| |
| | Total operating costs | | 5,613 | | | — | | | 673 | | | 123 | | | 967 | | | 12 | | | 3,078 | | | 10,466 | |
| |
| |
|
|---|
Back to Contents
Operating and financial review
Risk factors
In addition to the other information contained in this Annual Report, investors in Cable & Wireless should consider carefully the risks described below. The Group’s financial condition or results of operations could be materially adversely affected should any of these risks arise.
Risks specific to Cable & Wireless’ business
1. The restructuring of the Group may not result in an improvement to performance and financial position.
In June 2003 Cable & Wireless announced that it was undertaking, over a three year period, a restructuring of its businesses to improve its position in a rapidly changing market place. Cable & Wireless’ restructuring plans continue to be implemented and developed. In November 2004, a Group re-organisation was announced, which is intended to result in £35 million annualised cost savings by March 2006. Key elements of the reorganisation include a planned headcount reduction of 600 in the European business and head office and it is also planned to reduce headcount in the UK sales channels by 480 over the same period. Delays in implementation and integration of businesses may distract management from being able to concentrate on developing their businesses with certainty, or to pursue opportunities in their respective marketplaces. The forecast of savings for the year ending March 2006 was recently revised downward to £20 million in connection with the recently announced proposed acquisition of the share capital of Energis. As with the previously announced reorganisation, cost savings and operating synergies anticipated from the proposed Energis acquisition may not be realised in full; in addition, costs incurred in connection with integration and restructuring efforts may be higher than estimated.
In April 2005, Cable & Wireless announced the investment of £190 million, over the next three years, on a Next Generation Network (“NGN”) in the UK. NGN is designed to, among other things, protect margins in the UK. As highlighted in connection with the proposed acquisition of Energis, Cable & Wireless intends to migrate Energis customers to NGN, and the corresponding cost savings and capital expenditure synergies from the proposed acquisition therefore depend in part on NGN. However, NGN may fail to achieve the cost savings and synergies expected either from Cable & Wireless or Energis, costs incurred may be higher than expected and the efforts may fail to attract and keep new customers. Furthermore, any delay in the development or implementation of NGN could defer or reduce cost savings and synergies.
2. Transformation initiatives by the Group may not be successfully implemented.
The Group has been in rapid transition in the past few years, acquiring and disposing of a number of businesses, as well as adapting to a changing telecommunications business environment, and implementing a number of reorganisation initiatives as a result. In June 2003 Cable & Wireless announced its intention, over time, to expand its investment in national telecommunications operations, such as the Group’s investment in June 2004 in Monaco Telecom and its agreement to acquire the entire issued share capital of Energis announced in August 2005. This may include acquiring further entities and businesses.
The Group has in the past dedicated, and expects in the future to dedicate, significant resources to integrate any businesses that it has or will acquire and to effect any rationalisation of its operations. Implementation of both these elements is complex, time-consuming and expensive, and without proper planning and execution, could significantly disrupt the Group’s business.
In addition, the acquisition of Bulldog is an important step in advancing the Group’s access strategy. We believe LLU strengthens the Group’s presence in the access network market by enabling Bulldog to take control of the “last mile” copper link to the customer’s home or office. Our initiatives with Bulldog and LLU could fail and our investment in LLU may not achieve the expected return on investment or access to new markets.
The proposed acquisition of Energis is expected to generate significant synergy with the Group’s UK business, including through lower operating costs and capital expenditures for the combined business. If the synergies and savings are not realised, the Group may not achieve the expected benefits from the proposed acquisition.
3. Technological changes in communication and information technology may render the Group’s products and services obsolete or non-competitive resulting in an adverse impact on financial results.
The telecommunications industry is subject to rapid and significant changes in technology. The development of new technologies could render its current services obsolete and non-competitive and require the Group to write-down further the book values of investments it has made in existing technologies.
The Group’s business plan contemplates the introduction of services using new technologies and it may have to make substantial additional investments in new technologies in order to remain competitive. In particular, Cable & Wireless is investing in a broadband access network through Bulldog and a Next Generation Network in the UK, and has also invested in a GSM mobile network in the National Telcos. Such new technologies that the Group chooses to invest in may not prove to be successful, and the cost of implementation for emerging and future technologies could be significant and constitute a negative return on the investment.
In addition, Cable & Wireless may not receive the necessary licences to provide services based on new technologies in jurisdictions in which it operates. It may also be forced to change its product and service offerings or pay higher costs if the third-party technology that it employs changes or if the price of such technology increases. As a result, the Group could lose customers, fail to attract new customers or incur substantial costs to maintain its customer base.
4. Network and critical IT system failures may expose the Group to potential liability or loss of customers.
The Group’s operations are dependent upon networks which may or may not be controlled by Cable & Wireless. In addition, the Group is dependent on a number of critical IT systems to be able to conduct its business and process financial information. Catastrophic network failure, a major network interruption or an IT
Back to Contents
Operating and financial review
Risk factors
system failure may occur as a result of natural disasters, a loss of a major element of the network, security breaches, terrorist action or computer viruses. Such catastrophic failures or interruptions could result in the loss of customers as well as exposure to potential claims from customers based on the loss of service. A failure or interruption could also require expensive repairs or modifications to the Group’s assets and infrastructure.
5. Uninsured exposure to natural catastrophe (including Caribbean windstorm) insurance may continue to increase.
Due to increased levels of hurricane activity in certain areas in which the Group operates, the availability of windstorm, flood and earthquake insurance has decreased. Insurance deductibles for windstorm, flood and earthquake damage for certain areas in which the Group operates have increased and as a result, uninsured exposure to such losses will be higher in fiscal year 2006 than in prior years. In addition, certain other exclusions, including overhead cabling apply, which also increase the Group’s uninsured exposure.
Regulatory risk
6. Unforeseen changes in regulation and government policy in the countries in which Cable & Wireless operates may result in planned business objectives not being met.
The Group operates in some highly regulated markets, and its flexibility to manage its business can be constrained by regulation in these markets.
The Group’s ability to provide telecommunications services depends, in most countries, on receiving and maintaining government licences and authorisations.
Compliance with these licences and applicable local laws requires that Group companies obtain consents or approvals from regulatory authorities for certain activities.
Furthermore, regulatory regimes in some countries in which the Group operates are less well established than in other countries where competition in the telecommunications sector has been established for longer. As a result, the Group’s business in these countries could be subject to unexpected political, economic or legal developments that impact telecommunications regulations and lead to the Group being unable to acquire or retain the regulatory approvals necessary to its business. Failure to acquire and retain such consents and approvals or in other ways to comply with regulatory requirements could have a material adverse effect on its results or operations either in that jurisdiction or in aggregate.
Future regulation may materially impact the Group, for example by resulting in changes to the terms of interconnection agreements with other network operators and other similar agreements; imposing market-access barriers; setting price caps or other forms of price regulation; imposing limitations or investment obligations on construction of new facilities and restrictions on repatriation of cash. The number of regulatory measures may also significantly increase, or become significantly more onerous where jurisdictions in which the Group operates reform their telecommunications and related laws and regulations. Complying with new or more onerous regulations and restrictions may be costly for the Group, and may
have a material adverse effect on the Group’s financial results.
In the UK, the LLU initiative through Bulldog is an important step in advancing the Group’s access strategy. Ofcom’s commitment to ensuring “equality of access” is key to Bulldog’s success in LLU. However, there is no guarantee Ofcom will have the power to make the required changes to the regulatory or competitive framework to be able to deliver the competitive environment necessary, and therefore Bulldog may not reach the financial success it expects from LLU.
7. Exposure to other telecommunications operators and the behaviour of other market participants may have a detrimental effect on the Group’s operations.
The Group’s operations are, in part, dependent upon access to networks that it does not own or entirely control. In these cases, Cable & Wireless’ operations depend on network operators to provide interconnection services for the origination, carriage and/or termination of some of its telecommunications services.
The Group has experienced interconnection capacity shortages in the past, and it may do so again if it is unable to obtain and maintain the necessary interconnection and other transmission services in a timely fashion and on acceptable commercial terms in each country in which it intends to introduce or continue to offer its telecommunications services.
The Group may also be subject to the constraints, including financial constraints, of the relevant network operator, which may be unable to provide any or all of the capacity that the Group requests. If it cannot obtain the capacity it requires to adequately serve all of its existing customers or to connect all of its potential new customers, the Group may lose them to its competitors. All of this could have a material adverse effect on the Group’s financial results.
8. The Group may lose revenue if unlicensed operators are able to gain access to the Group’s network.
In certain markets where the Group operates, unlicensed operators may seek to gain access to the Group’s network unlawfully without paying for such access and/or usage. The Group has processes in place to identify and prevent such occurrences, but actions available to it may be limited by local regulation. To the extent that the Group’s efforts to prevent the unlawful conduct are not wholly successful, it may lose revenue and the Group’s financial performance may be adversely impacted.
Risks specific to the telecommunications industry
9. The Group’s operations could suffer from adverse effects of competition and price pressures on the demand for products and services.
The Group faces competition and downward pressure on prices in many areas and markets of its business. The Group’s competitors may be able to expand their network infrastructures and service offerings more quickly than the Group. The Group also believes the sector may experience consolidation in the near future, which could result, amongst other things, in competitors with greater scale that would make it more difficult for Cable & Wireless to compete effectively.
Back to Contents
As the markets for some of the Group’s services expand in certain locations, additional competition may emerge and existing competitors may commit more resources to the markets in which it participates. For example, governments in various countries in which the Group provides telecommunications services, in some cases on an exclusive basis and in others where it until recently provided services on an exclusive basis, have begun liberalising the telecommunications industry by introducing regulated competitive markets for some products and services in place of exclusive licences. The Group is not able to predict accurately the extent to which it will lose market share to some of the competitors entering the market as a result of this transformation and its operating results and revenues may be adversely affected.
10. Continued overcapacity and other factors could lead to lower prices for the Group’s products and services.
Many of the markets in which Cable & Wireless operates are experiencing considerable levels of overcapacity. Coupled with low levels of demand growth this has contributed to a severe price decline in these markets. This continuing trend could compel the Group to lower prices to prevent erosion of its market share or to continue attracting new customers.
If the current overcapacity situation is not resolved or worsens, prices may continue to decline in the affected regions and such price decline could have a material adverse effect on the Group’s financial results.
11. Mobile communications devices may pose health risks.
Media reports have suggested that radio frequency emissions from mobile telephone handsets and transmission facilities may pose various health risks, including cancer, and may interfere with various electronic medical devices, including hearing aids and pacemakers. Research and studies into the health risks posed by mobile telephone handsets and transmission facilities are ongoing. Cable & Wireless provides mobile services principally in the Caribbean, Panama, Macau and Monaco and also provides national and international network capacity to mobile operators. Cable & Wireless continues to monitor scientific and medical research and studies, media, legal, regulatory and other developments, as well as the public perception of risk arising from the use of mobile telephone handsets. Scientific research on mobile telephone handsets and health has been reviewed by a number of independent expert scientific panels. None of these panels has concluded that the use of mobile telephone handsets is harmful to health.
Nonetheless, increased speculation regarding health risks associated with mobile telephone handsets and transmission facilities or any subsequent substantiation of such risks could have a material adverse effect on the Group’s business including through:
| – | a reduction in the number of actual and potential customers; |
| |
| – | reduced usage per customer; |
| |
| – | exposure to potential litigation or other liability; |
| |
| – | regulatory intervention and new legislation; or |
| – | exposure to adverse publicity and damage to reputation. |
Legal and Other
12. The historic activities of the Group’s insurance subsidiary may result in material claims.
Pender Insurance Limited (“Pender”) is the company’s Isle of Man domiciled captive insurance company. Since its establishment in 1990 it has underwritten global insurances for both Cable & Wireless, and in later years, third party companies. It ceased to underwrite any new business from April 2003.
The insurances provided included property damage, business interruption, natural catastrophe, general liability, professional indemnity and directors’ and officers’ liability.
Pender purchased reinsurance for many of the risks it underwrote, including, from 2003, reinsurance via a telecommunications insurance industry mutual (“the Mutual”). Pender remains liable for all policies it underwrote in the first instance notwithstanding the reinsurances.
Pender has an independent board of directors and is managed by Thomas Miller Risk Management (Isle of Man). Pender’s risk exposures are identified and regularly monitored by the directors.
The significant key risks identified are as follows:
| – | failure of reinsurance (including reinsurances secured via the Mutual post-April 2003); |
| | |
| – | deterioration in known claims; and |
| | |
| – | notification of new claims under long tail “losses occurring” liability policies. |
Certain of Pender’s re-insurers have instituted proceedings seeking a declaration that they are entitled to avoid some of their re-insurance obligations.
If any of these risks materialise Pender may be subject to significant liabilities which its assets may not be sufficient to meet. Moreover, there can be no assurance that these arrangements will not have a material adverse effect on the financial condition of the Cable & Wireless Group.
The suit commenced by Cable and Wireless plc and Pender on 30 March 2004, against five companies and six individuals (five of whom were former Cable & Wireless employees) has now been widened to cover seven corporate defendants and nine individuals. Three of these defendants have lodged a counter-claim against the Company. The Cable & Wireless Board continues to believe that the circumstances giving rise to this suit have not had nor will have a material adverse effect on the Cable & Wireless Group.
13. The ongoing US Securities Act Class action might adversely impact the Group’s financial condition.
The class action detailed in “Operations and financial review – Legal proceedings” on page 93 was filed against the Company in the
Back to Contents
Operating and financial review
Risk factors
United States. If the settlement agreement for which all parties are seeking the Court’s approval does not reach the stage of receiving final Court approval for any reason, the plaintiffs may seek to appeal the initial decision of the District Court.
In addition, Cable & Wireless is from time to time involved in other material litigation, which if decided adversely to the Group could, individually or in the aggregate, adversely impact its financial condition or reputation.
14. The Group’s withdrawal from the US domestic market may result in unforeseen claims against Cable & Wireless.
Details of the Group’s withdrawal from the US domestic market through a Chapter 11 bankruptcy process of its US subsidiaries are set out in the Business overview – Acquisitions and disposals on page 23.
Although the Plan of Liquidation is ongoing and, as part of that plan, Cable and Wireless has taken measures to reduce its exposure to third party claims (by means of measures including the reduction of its claims against CWA in exchange for releases from any liability from CWA; and the assignment of a portion of the distributions, to which it would otherwise have been entitled, to individual unsecured creditors in exchange for individual releases for claims against the Company), there is no guarantee that Cable and Wireless plc will not be the target of claims from third parties who believe they might have contractual or other rights enforceable directly against the Company. In addition, despite the existence of contractual rights in its favour from SAVVIS in relation to the guarantees and letters of credit in favour of CWA landlords (as described in the Business overview), Cable and Wireless plc is subject to the risk that SAVVIS is unable to meet its contractual obligations to reimburse it for payments made under those guarantees and letters of credit.
15. Changes in the pension regulatory framework and volatility in the financial markets may require the Group to provide further cash funding to its pension funds.
Cable & Wireless currently maintains a number of defined benefit plans, which cover various categories of employees and retirees. The Group’s obligations to make contributions to fund benefit obligations under these plans are based on actuarial valuations, which themselves are based on certain assumptions about the long-term operation of the plans, including employee turnover and retirement rates, the performance of the financial markets, interest rates and expected longevity/mortality. If the actual operation of the plans differs from the assumptions, additional contributions may be required. The equity markets can be, and recently have been, volatile, and therefore the estimate of future contribution requirements can change significantly in a short period of time. Similarly, changes in interest rates may also impact funding requirements. In the UK, which has the most significant defined benefit scheme, changes to the regulatory environment, and the introduction of the Pension Act 2004 may also lead to an increasingly conservative actuarial valuation approach and investment strategy. If the Group is required to make significant contributions to fund the defined benefit plans, the financial position could be materially and adversely affected and the cash flow available for other uses may be significantly reduced.
16. Fluctuations in currency exchange rates in the countries where Cable & Wireless operates may adversely affect the Group’s reported results and financial condition.
A significant percentage of Cable & Wireless’ business is conducted outside the United Kingdom. The Group is thus exposed to movements in exchange rates in relation to foreign currency receipts and payments, dividend and other income from foreign subsidiaries, reported profits of foreign subsidiaries and the net asset carrying value of foreign investments.
The Group manages its exposure to movements in exchange rates on a net basis, and where appropriate, uses forward foreign exchange contracts and other derivative and financial instruments to reduce the exposure.
To the extent that this hedging activity does not cover the exposure, then the Group’s results of operations, cash generation and financial condition may be negatively impacted by currency exchange rate movements.
Back to Contents
Operating and financial review
Legal proceedings
Class action litigation against Cable and Wireless plc
Between December 2002 and February 2003, ten shareholder class action lawsuits were filed in the United States District Court for the Eastern District of Virginia naming Cable and Wireless plc and several of its officers and directors as defendants.
In March 2003, the Court consolidated all the cases into one action, styled as In re Cable and Wireless plc Securities Litigation, Civil Action No. 02-1860-A.
In May 2003, the lead plaintiffs filed a consolidated complaint that alleged violations of certain sections of the Securities and Exchange Act of 1934 and the rules promulgated thereunder. A central allegation was that the defendants made false and misleading statements about the Company’s financial condition by failing to disclose on a timely basis the existence of a tax indemnity and a ratings trigger to place money in escrow until any liability which the Company may have had under the tax indemnity was finally determined. The indemnity and ratings trigger appeared in an agreement reached in 1999 between the Company and Deutsche Telekom for the sale of the Company’s interest in the mobile telephone company that operated under the name One2One.
In addition to the allegations relating to the tax indemnity, the consolidated complaint also alleged that the defendants made false and misleading statements by: (1) failing to disclose certain lease liability commitments and (2) improperly recognising revenue received from sales of capacity to other carriers.
The plaintiffs sought unspecified money damages in their complaints.
The Company and the individual defendants filed motions to dismiss the class action complaint, which were heard on 31 October 2003. In March 2004 the Court issued orders granting the Company’s and the individual defendants’ motions to dismiss the complaint (but denying the defendants’ motion to dismiss the claims of foreign (non-US) purchasers for lack of subject matter jurisdiction). On 4 May 2004 and 5 June 2004, the Court issued memoranda opinions with regard to its previous orders. On 15 June 2004, the Court entered judgement for the Company and the individual defendants consistent with its March 2004 orders and memoranda opinions.
On 16 April 2004, plaintiffs filed an appeal of the District Court’s decision to the US Court of Appeals for the Fourth Circuit. On 3 May 2004, defendants filed a notice of cross-appeal with respect to the District Court’s order denying their motion to dismiss the claims of foreign (non-US) purchasers for lack of subject matter jurisdiction. While the case was pending on appeal, on 7 January 2005, the parties reached a preliminary agreement to settle the complaint on the basis of the defendants making a payment of US$7 million (£3.7 million) to the plaintiff class (with the support of the Company’s insurers) in full and final settlement of the complaint.
On 1 March 2005, the parties filed a stipulation with the Court of Appeals requesting that the Court of Appeals remand the case to the District Court for the limited purpose of considering the parties’
settlement. The Court of Appeals accordingly referred the case back to the District Court on 21 March 2005, for consideration of the settlement agreement. The District Court granted preliminary approval of the settlement by order dated 13 May 2005 and final approval by order dated 23 July 2005 thereby bringing the proceedings to a close.
Claim against the Minister of Finance and Economy, Panama
On 16 December 2002, a complaint was filed by two Panamanian lawyers exercising a public action at the Third Chamber of the Supreme Court of Justice of Panama questioning the law governing and rules of Public Bid No. 06 96 won by INTEL, S.A. (now Cable & Wireless Panama, S.A.). Complaints filed at the Third Chamber of the Supreme Court of Justice must be filed against the public officer who enacted the relevant regulation or act. This complaint was filed against the Minister of Finance and Economy in Panama specifically alleging that the Operating Agreement executed between Cable and Wireless (CALA Management Services) Limited and INTEL, S.A. (now Cable & Wireless Panama, S.A.) as part of the privatisation agreements was null and void ab initio, on the grounds that it had not been published in the Official Gazette in Panama.
The Operating Agreement enables Cable & Wireless Panama, S.A. to use the technical and management know-how of Cable and Wireless (CALA Management Services) Limited to fulfil more effectively its obligations under the concession granted to it by the Government of Panama to install, operate and exploit telecommunication services in Panama. Cable & Wireless Panama, S.A., due to its close interest in the outcome of the complaint, requested recognition by the Court and permission to participate in the proceedings. The Court agreed to this.
On 21 March 2003, the Court permitted the claim to proceed. Cable & Wireless Panama, S.A. filed an appeal against the admission of the claim to proceed, however the Court confirmed its decision to permit the claim to proceed on 17 March 2004.
As required by Panamanian law, the Administrations General Attorney has provided an opinion to the Court in defence of the law or regulation, which is the subject of the complaint. The Administrations General Attorney has opined that the Operating Agreement complied with all the requirements established by the law and by the rules of Public Bid No. 06 96 and was countersigned by the General Comptroller acting with due authorisation.
On 1 April 2005, Cable & Wireless Panama, S.A. tendered its response to the claim and submitted evidence for consideration by the Court. The plaintiff has requested that the effect of the Operating Agreement be suspended temporarily – an issue which the Court rejected on 10 March 2005. On 7 September 2005, the submission of evidence before the Court was completed. The Court is currently waiting to hear closing arguments.
Back to Contents
Operating and financial review
Legal proceedings
Panamanian counsel considers this claim to be without merit and none of Cable and Wireless plc, Cable & Wireless Panama, S.A. or Cable and Wireless (CALA Management Services) Limited is party to the complaint. If the complaint were to be successful, the concession under which Cable & Wireless Panama, S.A. operates would not be affected. However the Operating Agreement could be declared null and void and then the complainants could file a complaint against Cable and Wireless (CALA Management Services) Limited requiring the return of all management fees collected under the agreement since its execution on 20 May 1997. This would amount to approximately £60 million. In the event that this complaint should be successful, Cable & Wireless and its subsidiaries intend to vigorously pursue any legal recourse available to them.
Telecarrier Inc. vs. Cable & Wireless Panama, S.A.
On 5 May 2004, Telecarrier Inc. lodged a claim in the Sixth Circuit Civil Court of Panama alleging non-compliance by Cable & Wireless Panama, S.A. (“Cable & Wireless Panama”) with the Interconnection Agreement between the parties in connection with the invoicing and collection process. Telecarrier Inc. requested the Court to order the continued provision of a pre-determined billing and charging process and to prevent Cable & Wireless Panama from using an alternative process. They also claimed US$18 million (£9.6 million) damages and costs.
On 9 September 2004, Cable & Wireless Panama submitted a defence to the claim and on 30 December 2004, the parties presented a petition for suspension of the process for a period of 45 days to allow them to negotiate with each other. In a resolution dated 30 December 2004, the Court admitted the petition and negotiations with the plaintiff were initiated. The suspension period has expired. Negotiations between Cable & Wireless Panama and Telecarrier Inc. concluded and no agreement was reached. The Court re-opened proceedings on 13 May 2005. The process is pending the submission of evidence to the Court. On 25 August 2005, Telecarrier Inc. petitioned the Court to join the unjust enrichment claim brought by Cable & Wireless Panama with its non-compliance claim against Cable & Wireless Panama discussed above.
In a separate action, on 25 August 2004, Cable & Wireless Panama lodged a claim against Telecarrier Inc. in the Seventeenth Circuit Civil Court of Panama claiming unjustified enrichment by Telecarrier Inc. through the use of Cable & Wireless Panama’s fixed telephone network to allow the rerouting of traffic for internet public use. Cable & Wireless Panama is claiming US$14 million (£7.5 million).
The claim was admitted by the Court on 2 September 2004. On 23 December 2004, the parties agreed to suspend the process for a period of 30 days to allow for a period of negotiation – a move endorsed by the Court on 23 December 2004. Negotiations between Cable & Wireless Panama and Telecarrier Inc. concluded and no agreement was reached. The proceedings are pending the submission of evidence before the Court.
Arbitration between PT Cable, Inc., Cable and Wireless plc, Cable & Wireless IDC, Inc. and others
PT Cable, Inc., (“PT Cable”) the US end owner of NPC Cable System (spanning from the United States to Japan), initiated an ICC arbitration proceeding against Cable and Wireless plc, Japan Telecom IDC, Inc. (“IDC”) and other users of capacity on that system for unpaid operations and maintenance fees with respect to the US end. Cable & Wireless and all 14 other US end owners counter-claimed against PT Cable for overcharging operation and maintenance fees. PT Cable then cross-claimed against Cable & Wireless and IDC in their capacity as maintenance authorities and alleges that Cable & Wireless and IDC should be liable to contribute to any damages the Arbitrator may award against PT Cable.
Potential exposure of PT Cable is between US$13 million (£6.9 million) and US$33 million (£17.6 million). PT Cable’s counter-claim against Cable & Wireless and IDC is for an unquantified proportion of that amount.
PT Cable failed to pay its arbitration filing fees and earlier this year was placed into Chapter 7 liquidation proceedings. The arbitration is therefore currently stayed.
On 28 January 2005, AT&T Corp and Alascom, Inc. (“Claimants”) filed a Request for Arbitration before the ICC against Cable and Wireless plc and IDC (“Respondents”) relating to the Respondents’ alleged duties as Founding Signatories and Maintenance Authorities under the Construction and Maintenance Agreement for the NPC. The Claimants allege breach of contract, fraud, breaches of fiduciary duty and similar claims against the Respondents in connection with alleged overcharging of operations and maintenance fees by PT Cable. The complaint is for unquantified damages. The Company’s US Counsel has advised that, in their opinion, all of the Claimants’ claims are weak. The Company has filed its Answer to the Request for Arbitration and arbitrators are currently being selected.
As far as quantum of damages is concerned, AT&T’s claim is duplicative of the counter-claim by PT Cable in the first arbitration above (save that AT&T has claimed punitive damages). Therefore Cable & Wireless believes its exposure remains within the parameters of the estimate set out above.
Cable & Wireless will continue to vigorously defend its position in each of the arbitration proceedings brought against it.
Back to Contents
Pender Insurance Limited
Australia-Japan Cable Limited (“AJC”), a policyholder of Pender Insurance Limited (“Pender”) has brought proceedings in London against Pender and Cable & Wireless. AJC claims that it is entitled to insurance cover for loss of revenue following damage caused to an undersea cable by a cargo vessel. It also claims that, if it does not have such cover, Pender or Cable & Wireless is liable for its losses because of representations made to AJC that it was entitled to such insurance cover. The claim is for US$92 million (£49 million). Pender and Cable & Wireless have been advised by legal council that the claim is unmeritorious and accordingly are defending it vigorously. Certain of Pender’s re-insurers of the AJC risk have instituted proceedings seeking a declaration that they are entitled to avoid their obligations. Pender is also vigorously defending these proceedings.
On 3 June 2005, QBE International Insurance Limited (“QBE”) issued Pender with a request for arbitration on account of insurance premium payments of £36 million allegedly outstanding. Pender has received advice that this claim is substantially without merit and intends to defend it vigorously.
Pender has also been advised that, in the unlikely event of QBE recovering any funds as a result of this claim, it would be contractually obliged to pass such funds (less a small fee) under retrocession arrangements to Messenger Insurance PCC Limited (“Messenger”), one of the defendants to the proceedings brought by Pender and Cable and Wireless plc described on page 91. Pender has been advised that, given the strength of its misfeasance claims against Messenger, it would have a strong chance of recovering any such sums paid by QBE to Messenger arising out of the subject matter of the arbitration request.
Other litigation
From time to time, the Company and its subsidiaries are subject to legal or regulatory claims, proceedings, investigations or reviews. Other than the above, there are no pending claims, proceedings, investigations or reviews against the Company or any of its subsidiaries, which the Company believes will, if determined adversely to the Group, have a material adverse effect on the Group’s liquidity or operations.
Back to Contents
Report of the independent public accounting firm
To the Shareholders and Directors of
Cable and Wireless plc
We have audited the accompanying consolidated balance sheets of Cable and Wireless plc and subsidiaries as of 31 March 2005 and 2004, and related consolidated profit and loss accounts, statements of cash flows, statements of total recognised gains and losses and reconciliations of movements in shareholders’ funds for each of the years in the three-year period ended 31 March 2005. These consolidated financial statements are the responsibility of the Company’s management. Our responsibility is to express an opinion on these consolidated financial statements based on our audits.
We conducted our audits in accordance with the standards of the Public Company Accounting Oversight Board (United States). Those standards require that we plan and perform the audit to obtain reasonable assurance about whether the consolidated financial statements are free of material misstatement. An audit includes examination, on a test basis, of evidence supporting the amounts and disclosures in the consolidated financial statements. An audit also includes assessing the accounting principles used and significant estimates made by management, as well as evaluating the overall consolidated financial statements presentation. We believe that our audits provide a reasonable basis for our opinion.
In our opinion, based on our audits, the consolidated financial statements referred to above present fairly, in all material respects, the financial position of Cable and Wireless plc and subsidiaries as of 31 March 2005 and 2004 and the results of their operations and cash flows for each of the years in the three-year period ended 31 March 2005 in conformity with generally accepted accounting principles in the United Kingdom.
Accounting principles generally accepted in the United Kingdom vary in certain significant respects from accounting principles generally accepted in the United States of America. Information relating to the nature and effect of such differences is presented in Note 35 to the consolidated financial statements.
KPMG Audit Plc
Chartered Accountants
Registered Auditor
London
3 June 2005, except Note 35 to the consolidated Financial
Statements which is as of 9 August 2005.
Back to Contents
Consolidated profit
and loss accounts
For the year ended 31 March
| |
| |
|---|
| | | | Note | | | 2005
£m | | | 2004
£m | | | 2003
£m | |
|---|
| | | | | | | | | | | | | | |
| | Turnover of the Group including its share of joint ventures and associates | | 3 | | | 3,409 | | | 3,868 | | | 4,651 | |
| | Share of turnover of – joint ventures | | 17 | | | (127 | ) | | (136 | ) | | (195 | ) |
| | – associates | | 17 | | | (60 | ) | | (61 | ) | | (65 | ) |
| |
| |
|---|
| | Group turnover* | | 3, 4 | | | 3,222 | | | 3,671 | | | 4,391 | |
| | Operating costs before depreciation, amortisation and exceptional items | | 5 | | | (2,730 | ) | | (3,223 | ) | | (4,057 | ) |
| | Exceptional operating costs | | 5, 10 | | | (145 | ) | | (244 | ) | | (442 | ) |
| | Operating costs before depreciation and amortisation | | | | | (2,875 | ) | | (3,467 | ) | | (4,499 | ) |
| | Depreciation before exceptional items | | 5, 16 | | | (194 | ) | | (252 | ) | | (735 | ) |
| | Exceptional depreciation | | 5, 10, 16 | | | (8 | ) | | (526 | ) | | (2,381 | ) |
| | Depreciation | | | | | (202 | ) | | (778 | ) | | (3,116 | ) |
| | Amortisation before exceptional items | | 5, 15 | | | (7 | ) | | 3 | | | (126 | ) |
| | Exceptional amortisation | | 5, 10 | | | — | | | (10 | ) | | (2,725 | ) |
| | Amortisation | | | | | (7 | ) | | (7 | ) | | (2,851 | ) |
| |
| |
|---|
| | Total operating costs | | 5 | | | (3,084 | ) | | (4,252 | ) | | (10,466 | ) |
| |
| |
|---|
| | Group operating profit/(loss)* | | | | | 138 | | | (581 | ) | | (6,075 | ) |
| | Share of operating profits in joint ventures | | 17 | | | 16 | | | 23 | | | 53 | |
| | Share of operating profits in associates | | 17 | | | 24 | | | 18 | | | 22 | |
| |
| |
|---|
| | Total operating profit/(loss) | | | | | 178 | | | (540 | ) | | (6,000 | ) |
| | Profits less (losses) on sale and termination of operations before
exceptional items | | | | | 3 | | | — | | | — | |
| | Exceptional items | | 10 | | | 116 | | | 250 | | | (147 | ) |
| | Profits less (losses) on sale and termination of operations | | | | | 119 | | | 250 | | | (147 | ) |
| | Profits less (losses) on disposal of fixed assets before exceptional items | | 9 | | | 5 | | | 25 | | | — | |
| | Exceptional items | | 10 | | | 23 | | | 28 | | | 62 | |
| | Profits less (losses) on disposal of fixed assets | | | | | 28 | | | 53 | | | 62 | |
| | Exceptional amounts written off investments | | 10 | | | — | | | — | | | (274 | ) |
| |
| |
|---|
| | Profit/(loss) on ordinary activities before interest | | | | | 325 | | | (237 | ) | | (6,359 | ) |
| | Net interest and other similar income/(charges) | | | | | | | | | | | | |
| | – Group | | 11 | | | 38 | | | 13 | | | 103 | |
| | – Joint ventures and associates | | 17 | | | — | | | — | | | (1 | ) |
| | Total net interest and other similar income | | | | | 38 | | | 13 | | | 102 | |
| |
| |
|---|
| | Profit/(loss) on ordinary activities before taxation | | | | | 363 | | | (224 | ) | | (6,257 | ) |
| | Tax on profit/(loss) on ordinary activities | | 12 | | | 14 | | | 12 | | | (36 | ) |
| |
| |
|---|
| | Profit/(loss) on ordinary activities after taxation | | | | | 377 | | | (212 | ) | | (6,293 | ) |
| | Equity minority interests | | | | | (75 | ) | | (25 | ) | | (124 | ) |
| |
| |
|---|
| | Profit/(loss) for the financial year | | | | | 302 | | | (237 | ) | | (6,417 | ) |
| | Dividends | | 13 | | | (87 | ) | | (73 | ) | | (37 | ) |
| |
| |
|---|
| | Profit/(loss) for the year retained | | 24 | | | 215 | | | (310 | ) | | (6,454 | ) |
| |
| |
|---|
| | Basic earnings/(loss) per Ordinary Share | | 14 | | | 13.0 | p | | (10.2 | )p | | (275.4 | )p |
| | Diluted earnings/(loss) per Ordinary Share | | 14 | | | 12.3
| p | | (10.2 | )p | | (275.4 | )p |
| | Dividends per Ordinary Share | | | | | 3.8 | p | | 3.15 | p | | 1.6 | p |
| |
| |
|---|
| | | | | | | | | | | | | | |
| | The accompanying notes are an integral part of these Financial statements. |
| * | Refer to page 98 for continuing operations analysis and page 99 for discontinued operations analysis. |
Back to Contents
Consolidated profit and loss accounts:
Continuing operations
For the year ended 31 March
| |
| |
|---|
| | | Note | | Continuing
operations
£m | | Continuing
operations
Acquisitions
£m | | 2005
Continuing
operations
Total
£m | | 2004
Continuing
operations
£m | | 2003
Continuing
operations
£m | |
|---|
| | | | | | | | | | | | | | | | | | | | |
| | Turnover of the Group including its share of joint ventures and associates | | 3 | | | 3,099 | | | 111 | | | 3,210 | | | 3,327 | | | 3,637 | |
| | Share of turnover of – joint ventures | | 17 | | | (127 | ) | | — | | | (127 | ) | | (136 | ) | | (195 | ) |
| | – associates | | 17 | | | (60 | ) | | — | | | (60 | ) | | (61 | ) | | (65 | ) |
|
| |
|---|
| | Group turnover | | 3, 4 | | | 2,912 | | | 111 | | | 3,023 | | | 3,130 | | | 3,377 | |
| | Operating costs before depreciation, amortisation and exceptional items | | 5 | | | (2,435 | ) | | (112 | ) | | (2,547 | ) | | (2,677 | ) | | (2,796 | ) |
| | Exceptional operating costs | | 5, 10 | | | (144 | ) | | — | | | (144 | ) | | (219 | ) | | (151 | ) |
| | Operating costs before depreciation and amortisation | | | | | (2,579 | ) | | (112 | ) | | (2,691 | ) | | (2,896 | ) | | (2,947 | ) |
| | Depreciation before exceptional items | | 5,16 | | | (184 | ) | | (8 | ) | | (192 | ) | | (225 | ) | | (606 | ) |
| | Exceptional depreciation | | 5, 10, 16 | | | (8 | ) | | — | | | (8 | ) | | (404 | ) | | (1,574 | ) |
| | Depreciation | | | | | (192 | ) | | (8 | ) | | (200 | ) | | (629 | ) | | (2,180 | ) |
| | Amortisation before exceptional items | | 5, 15 | | | 2 | | | (9 | ) | | (7 | ) | | 3 | | | (65 | ) |
| | Exceptional amortisation | | 5, 10 | | | — | | | — | | | — | | | (10 | ) | | (2,196 | ) |
| | Amortisation | | | | | 2 | | | (9 | ) | | (7 | ) | | (7 | ) | | (2,261 | ) |
|
| |
|---|
| | Total operating costs | | 5 | | | (2,769 | ) | | (129 | ) | | (2,898 | ) | | (3,532 | ) | | (7,388 | ) |
|
| |
|---|
| | Group operating profit/(loss) | | | | | 143 | | | (18 | ) | | 125 | | | (402 | ) | | (4,011 | ) |
| | Share of operating profits in joint ventures | | 17 | | | 15 | | | 1 | | | 16 | | | 23 | | | 53 | |
| | Share of operating profits in associates | | 17 | | | 24 | | | — | | | 24 | | | 18 | | | 22 | |
|
| |
|---|
| | Total operating profit/(loss) | | | | | 182 | | | (17 | ) | | 165 | | | (361 | ) | | (3,936 | ) |
| | Exceptional profits less (losses) on sale and termination of operations | | 10 | | | (14 | ) | | — | | | (14 | ) | | 2 | | | — | |
| | Profits less (losses) on disposal of fixed assets before exceptional items | | 9 | | | 5 | | | — | | | 5 | | | 26 | | | — | |
| | Exceptional items | | 10 | | | 7 | | | — | | | 7 | | | 12 | | | 62 | |
| | Profits less (losses) on disposal of fixed assets | | | | | 12 | | | — | | | 12 | | | 38 | | | 62 | |
| | Exceptional amounts written off investments | | 10 | | | — | | | — | | | — | | | — | | | (274 | ) |
|
| |
|---|
| | Profit/(loss) on ordinary activities before interest | | | | | 180 | | | (17 | ) | | 163 | | | (321 | ) | | (4,148 | ) |
|
| |
|---|
| | | | | | | | | | | | | | | | | | | | |
| | The accompanying notes are an integral part of these Financial statements. |
Back to Contents
Consolidated profit and loss accounts:
Discontinued operations
For the year ended 31 March
| |
| |
|---|
| | | Note | | 2005
Discontinued
operations
£m | | 2004
Discontinued
operations
£m | | 2003
Discontinued
operations
£m | |
|---|
| | | | | | | | | | | | | | |
| | Turnover of the Group including its share of joint ventures and associates | | 3 | | | 199 | | | 541 | | | 1,014 | |
| | Share of turnover of – joint ventures | | 17 | | | — | | | — | | | — | |
| | – associates | | 17 | | | — | | | — | | | — | |
|
| |
|---|
| | Group turnover | | 3, 4 | | | 199 | | | 541 | | | 1,014 | |
| | Operating costs before depreciation, amortisation and exceptional items | | 5 | | | (183 | ) | | (546 | ) | | (1,261 | ) |
| | Exceptional operating costs | | 5, 10 | | | (1 | ) | | (25 | ) | | (291 | ) |
| | Operating costs before depreciation and amortisation | | | | | (184 | ) | | (571 | ) | | (1,552 | ) |
| | Depreciation before exceptional items | | 5, 16 | | | (2 | ) | | (27 | ) | | (129 | ) |
| | Exceptional depreciation | | 5, 10, 16 | | | — | | | (122 | ) | | (807 | ) |
| | Depreciation | | | | | (2 | ) | | (149 | ) | | (936 | ) |
| | Amortisation before exceptional items | | 5, 15 | | | — | | | — | | | (61 | ) |
| | Exceptional amortisation | | 5, 10 | | | — | | | — | | | (529 | ) |
| | Amortisation | | | | | — | | | — | | | (590 | ) |
|
| |
|---|
| | Total operating costs | | 5 | | | (186 | ) | | (720 | ) | | (3,078 | ) |
|
| |
|---|
| | Group operating profit/(loss) | | | | | 13 | | | (179 | ) | | (2,064 | ) |
| | Share of operating profits in joint ventures | | 17 | | | — | | | — | | | — | |
|
| |
|---|
| | Total operating profit/(loss) | | | | | 13 | | | (179 | ) | | (2,064 | ) |
| | Profits less (losses) on sale and termination of operations
before exceptional items | | | | | 3 | | | — | | | — | |
| | Exceptional items | | 10 | | | 130 | | | 248 | | | (147 | ) |
| | Profits less (losses) on sale and termination of operations | | | | | 133 | | | 248 | | | (147 | ) |
| | Profits less (losses) on disposal of fixed assets before exceptional items | | 9 | | | — | | | (1 | ) | | — | |
| | Exceptional items | | 10 | | | 16 | | | 16 | | | — | |
| | Profits less (losses) on disposal of fixed assets | | | | | 16 | | | 15 | | | — | |
|
| |
|---|
| | Profit/(loss) on ordinary activities before interest | | | | | 162 | | | 84 | | | (2,211 | ) |
|
| |
|---|
| | | | | | | | | | | | | | |
| | The accompanying notes are an integral part of these Financial statements. |
Back to Contents
Consolidated balance sheets
At 31 March
| |
| |
|---|
| | | Note | | 2005
£m | | 2004
£m | |
|---|
| | | | | | | | | | | |
| | Fixed assets | | | | | | | | | |
| | Intangible assets | | 15 | | | 91 | | | (9 | ) |
| | Tangible assets | | 16 | | | 1,379 | | | 1,214 | |
| | Interest in net assets of joint ventures* | | 17 | | | 128 | | | 132 | |
| | Investments in associates | | 17 | | | 80 | | | 75 | |
| | Loans to joint ventures and associates | | 17 | | | 1 | | | 1 | |
| | Other investments | | 17 | | | 20 | | | 58 | |
| | Total fixed asset investments | | | | | 229 | | | 266 | |
|
| |
|---|
| | | | | | | 1,699 | | | 1,471 | |
| |
| |
|---|
| | Current assets | | | | | | | | | |
| | Stocks | | 18 | | | 35 | | | 38 | |
| | Debtors – due within one year | | 19 | | | 816 | | | 875 | |
| | – due after more than one year | | 19 | | | 284 | | | 175 | |
| | | | | |
| |
| | | | | | | 1,100 | | | 1,050 | |
| | Current asset investments and short–term deposits | | 20 | | | 2,031 | | | 2,229 | |
| | Cash at bank and in hand | | | | | 135 | | | 138 | |
| | | | | | | 3,301 | | | 3 ,455 | |
| | Creditors: amounts falling due within one year | | 21 | | | (1,534 | ) | | (1,668 | ) |
|
| |
|---|
| | Net current assets | | | | | 1,767 | | | 1,787 | |
|
| |
|---|
| | Total assets less current liabilities | | | | | 3,466 | | | 3,258 | |
| | Creditors: amounts falling due after more than one year | | | | | | | | | |
| | Convertible debt | | 21 | | | (252 | ) | | (252 | ) |
| | Other creditors | | 21 | | | (549 | ) | | (623 | ) |
| | | | | | | (801 | ) | | (875 | ) |
| | Provisions for liabilities and charges | | 22 | | | (528 | ) | | (431 | ) |
|
| |
|---|
| | | | | | | (1,329 | ) | | (1,306 | ) |
|
| |
|---|
| | Net assets | | | | | 2,137 | | | 1,952 | |
|
| |
|---|
| | | | | | | | | | | |
| | Capital and reserves | | | | | | | | | |
| | Called up share capital | | 23 | | | 599 | | | 596 | |
| | Share premium account | | 24 | | | 8 | | | 2 | |
| | Special reserve | | 24 | | | 1,736 | | | 1,745 | |
| | Capital redemption reserve | | 24 | | | 105 | | | 105 | |
| | Profit and loss account | | 24 | | | (630 | ) | | (745 | ) |
|
| |
|---|
| | Equity shareholders’ funds | | | | | 1,818 | | | 1,703 | |
| | Equity minority interests | | | | | 319 | | | 249 | |
|
| |
|---|
| | Capital employed | | | | | 2,137 | | | 1,952 | |
| |
| |
|---|
| | | | | | | | | | | |
| * | Interests in net assets of joint ventures include the Group’s share of gross assets of joint ventures of £189 million (2004 – £190 million) and the Group’s share of gross liabilities of joint ventures of £61 million (2004 – £58 million) – see Note 17 |
| | | | | | | | | | | |
| | The accompanying notes are an integral part of these Financial statements. |
Back to Contents
Company balance sheets
At 31 March
| |
| |
|---|
| | | Note | | 2005
£m | | 2004
£m | |
|---|
| | | | | | | | | | | |
| | Fixed assets | | | | | | | | | |
| | Tangible assets | | 16 | | | 11 | | | 11 | |
| | Investments in subsidiaries | | 17 | | | 20,412 | | | 19,700 | |
| | Investments in associates | | 17 | | | 19 | | | 21 | |
| | Loans to joint ventures and associates | | 17 | | | 1 | | | 1 | |
| | Other investments | | 17 | | | — | | | 28 | |
| | Total fixed asset investments | | | | | 20,432 | | | 19,750 | |
|
| |
|---|
| | | | | | | 20,443 | | | 19,761 | |
| | Current assets | | | | | | | | | |
| | Debtors – due within one year | | 19 | | | 148 | | | 123 | |
| | – due after more than one year | | 19 | | | 142 | | | 102 | |
| | | | | |
| |
| | | | | | | 290 | | | 225 | |
| | Current asset investments and short–term deposits | | 20 | | | 1,819 | | | 2,133 | |
| | Cash at bank and in hand | | | | | 11 | | | 35 | |
| | | | | | | 2,120 | | | 2,393 | |
| | Creditors: amounts falling due within one year | | 21 | | | (332 | ) | | (515 | ) |
|
| |
|---|
| | Net current assets | | | | | 1,788 | | | 1,878 | |
|
| |
|---|
| | Total assets less current liabilities | | | | | 22,231 | | | 21,639 | |
| | Creditors: amounts falling due after more than one year | | | | | | | | | |
| | Convertible debt | | 21 | | | (252 | ) | | (252 | ) |
| | Other creditors | | 21 | | | (18,686 | ) | | (18,106 | ) |
| | | | | | | (18,938 | ) | | (18,358 | ) |
| | Provisions for liabilities and charges | | 22 | | | (184 | ) | | (174 | ) |
|
| |
|---|
| | | | | | | (19,122 | ) | | (18,532 | ) |
|
| |
|---|
| | Net assets | | | | | 3,109 | | | 3,107 | |
|
| |
|---|
| | | | | | | | | | | |
| | Capital and reserves | | | | | | | | | |
| | Called up share capital | | 23 | | | 599 | | | 596 | |
| | Share premium account | | 24 | | | 8 | | | 2 | |
| | Special reserve | | 24 | | | 1,736 | | | 1,745 | |
| | Capital redemption reserve | | 24 | | | 105 | | | 105 | |
| | Profit and loss account | | 24 | | | 661 | | | 659 | |
|
| |
|---|
| | Equity shareholders’ funds | | | | | 3,109 | | | 3,107 | |
|
| |
|---|
| | |
| | The accompanying notes are an integral part of these Financial statements. |
Back to Contents
Consolidated cash flow statements
For the year ended 31 March
| |
| |
|---|
| | | Note | | 2005
£m | | 2004
£m | | 2003
£m | |
|---|
| | | | | | | | | | | | | | |
| | Net cash inflow from operating activities | | 28 | | | 346 | | | 73 | | | 95 | |
| | Dividends from joint ventures and associates | | | | | | | | | | | | |
| | Dividends from joint ventures | | | | | 11 | | | 12 | | | 13 | |
| | Dividends from associates | | | | | 14 | | | 13 | | | 15 | |
| | | | | | | 25 | | | 25 | | | 28 | |
| | Returns on investments and servicing of finance | | | | | | | | | | | | |
| | Interest and similar income received | | | | | 89 | | | 103 | | | 197 | |
| | Interest paid | | | | | (68 | ) | | (89 | ) | | (88 | ) |
| | Net interest element of finance lease rentals paid | | | | | — | | | (1 | ) | | (2 | ) |
| | Dividends paid to minority interests | | | | | (35 | ) | | (75 | ) | | (70 | ) |
| | Income received from other investments | | | | | 4 | | | 5 | | | — | |
| | | | | | | (10 | ) | | (57 | ) | | 37 | |
| | Taxation | | | | | (60 | ) | | (43 | ) | | (438 | ) |
| | Capital expenditure and financial investment | | | | | | | | | | | | |
| | Purchase of tangible fixed assets | | | | | (344 | ) | | (342 | ) | | (810 | ) |
| | Sale of tangible fixed assets | | | | | 9 | | | 38 | | | 15 | |
| | Purchase of current asset investments | | | | | (1 | ) | | (1 | ) | | (3 | ) |
| | Purchase of investments | | | | | — | | | (4 | ) | | (38 | ) |
| | Sale of current asset investments | | | | | — | | | 229 | | | 600 | |
| | Sale of investments | | | | | 68 | | | 39 | | | 11 | |
| | Investment in joint venture | | | | | — | | | — | | | 10 | |
| | | | | | | (268 | ) | | (41 | ) | | (215 | ) |
| | Acquisitions and disposals | | | | | | | | | | | | |
| | Disposal of subsidiary undertakings | | | | | 96 | | | (120 | ) | | 14 | |
| | Purchase of shareholdings in subsidiary undertakings | | | | | (131 | ) | | (5 | ) | | 2 | |
| | Receipts from sale of associates | | | | | 7 | | | 7 | | | 94 | |
| | Purchase of associate undertakings | | | | | (7 | ) | | — | | | — | |
| | | | | | | (35 | ) | | (118 | ) | | 110 | |
| | Equity dividends paid to shareholders | | | | | (97 | ) | | — | | | (119 | ) |
| | Management of liquid resources | | | | | | | | | | | | |
| | Movement in liquid resources (net) | | 30 | | | 75 | | | 932 | | | (1,040 | ) |
| | | | | | | | | | | | | | |
| | Financing | | | | | | | | | | | | |
| | Purchase of own shares | | | | | (74 | ) | | — | | | — | |
| | Issue of ordinary share capital | | | | | 6 | | | 2 | | | 1 | |
| | Capital element of finance lease rental repayments | | | | | — | | | (1 | ) | | (18 | ) |
| | Other long term debt issued | | | | | 1 | | | 280 | | | 88 | |
| | Long term debt repaid | | | | | (86 | ) | | (863 | ) | | (649 | ) |
| | | | | | | (153 | ) | | (582 | ) | | (578 | ) |
|
| |
|---|
| | (Decrease)/increase in cash in the year | | 29 | | | (177 | ) | | 189 | | | (2,120 | ) |
|
| |
|---|
| | | | | | | | | | | | | | |
| | The accompanying notes are an integral part of these Financial statements. | | | | |
Back to Contents
Consolidated statements of
total recognised gains and losses
For the year ended 31 March
| |
|---|
| 2005
£m | | 2004
£m | | 2003
£m | |
|---|
| | | | | | | | | | |
| Profit/(loss) for the financial year | | 302 | | | (237 | ) | | (6,417 | ) |
Currency translation differences on foreign currency net investments and
related borrowings | | (37 | ) | | (97 | ) | | (240 | ) |
| |
|---|
| Total gains/(losses) relating to the period | | 265 | | | (334 | ) | | (6,657 | ) |
| Prior year adjustment (Note 24) | | 119 | | | | | | | |
| | | | | | | |
| Total losses recognised since last annual report | | 384 | | | | | | | |
| | | | | | | |
| | | | | | | | | | |
| The accompanying notes are an integral part of these Financial statements. |
Back to Contents
Reconciliation of movements in
consolidated equity shareholders’ funds
For the year ended 31 March
| |
|---|
| 2005
£m | | 2004
£m | | 2003
£m | |
|---|
| | | | | | | | | | |
| Profit/(loss) for the financial year | | 302 | | | (237 | ) | | (6,417 | ) |
| Dividends – interim | | (27 | ) | | — | | | (37 | ) |
| – final | | (60 | ) | | (73 | ) | | — | |
| |
|---|
| Profit/(loss) for the year carried forward | | 215 | | | (310 | ) | | (6,454 | ) |
| Other recognised gains and losses relating to the year | | (37 | ) | | (97 | ) | | (240 | ) |
| New share capital issued | | 9 | | | 2 | | | 1 | |
| Purchase of own shares (Note 23) | | (75 | ) | | — | | | — | |
| Own shares purchased and held in ESOP trust | | — | | | (4 | ) | | (38 | ) |
| Own shares released on vesting of share awards | | 3 | | | 1 | | | 7 | |
| |
|---|
| Net increase/(decrease) in equity shareholders’ funds | | 115 | | | (408 | ) | | (6,724 | ) |
| Opening equity shareholders’ funds (prior year adjusted – Note 24) | | 1,703 | | | 2,111 | | | 8,835 | |
| |
|---|
| Closing equity shareholders’ funds | | 1,818 | | | 1,703 | | | 2,111 | |
| |
|---|
| | | | | | | | | | |
Reconciliation of movements in equity
shareholders’ funds for the Company
For the year ended 31 March
| |
|---|
| 2005
£m | | 2004
£m | | 2003
£m | |
|---|
| | | | | | | | | | |
| Profit/(loss) for the financial year | | 152 | | | 585 | | | (7,523 | ) |
| Dividends – interim | | (27 | ) | | — | | | (37 | ) |
| – final | | (60 | ) | | (73 | ) | | — | |
| |
|---|
| Profit/(loss) for the year carried forward | | 65 | | | 512 | | | (7,560 | ) |
| Other recognised gains relating to the year | | — | | | — | | | 17 | |
| Revaluation | | — | | | (1,020 | ) | | 223 | |
| New share capital issued | | 9 | | | 2 | | | 1 | |
| Purchase of own shares (Note 23) | | (75 | ) | | — | | | — | |
| Own shares purchased and held in ESOP trust | | — | | | (4 | ) | | (38 | ) |
| Own shares released on vesting of share awards | | 3 | | | 1 | | | 7 | |
| |
|---|
| Net decrease in equity shareholders’ funds | | 2 | | | (509 | ) | | (7,350 | ) |
| Opening equity shareholders’ funds (prior year adjusted – Note 24) | | 3,107 | | | 3,616 | | | 10,966 | |
| |
|---|
| Closing equity shareholders’ funds | | 3,109 | | | 3,107 | | | 3,616 | |
| |
|---|
| The accompanying notes are an integral part of these Financial statements. | |
|---|
Back to Contents
Statement of accounting policies
Basis of preparation
The Financial Statements are prepared in accordance with applicable accounting standards and the provisions of the Companies Act, and on the historical cost basis, except for the revaluation of investments in subsidiaries in the Company’s accounts.
The accompanying consolidated Financial statements have been prepared in accordance with generally accepted accounting principles in the United Kingdom (UK GAAP) which differ in certain material respects from generally accepted accounting principles in the United States (US GAAP) (see Note 35 “Summary of differences between United Kingdom and United States GAAP”).
The consolidated profit and loss accounts on pages 97 and 99 comply with UK GAAP and UK Companies Act requirements and the directors believe they are in the most appropriate format for shareholders to understand the results of our business. Depreciation and amortisation (including exceptional amounts) are presented on the face of the profit and loss accounts because these items are non-cash income. Exceptional operating costs are also presented on the face of the profit and loss accounts because these amounts relate to events that are not expected to recur. This presentation is also consistent with the way that the financial performance is measured by management and Cable & Wireless believes this presentation allows a more meaningful comparison to be made of the trading results of the Group for the three years presented.
Use of estimates
The preparation of Financial Statements in accordance with generally accepted accounting principles requires management to make estimates and assumptions that affect the reported amounts of assets and liabilities at the date of the Financial Statements and the reported amounts of revenues and expenses during the reporting period. Actual results could differ from these estimates.
FRS 18, “Accounting policies” requires that a description of the impact of any change in estimation techniques should be provided where the change has a material impact on the reported results for the period.
New accounting standards
The following new accounting standards were adopted during the year:
The Group has adopted Urgent Issues Task Force (UITF) 38, “Accounting for ESOP trusts” and UITF 17 (revised), “Employee share schemes” in these Financial Statements. This has resulted in the adoption of a revised accounting policy for employee share awards in the year. Details of the effect of prior year adjustments are given in Note 24.
The adoption of UITF 38 resulted in a decrease to shareholders’ funds representing the reclassification of shares by the ESOP trust held from fixed asset investments to the profit and loss reserve.
Under the revised UITF 17 accounting policy, the estimated cost of share awards is charged to the profit and loss account over the period from the grant date to the date of expected vesting (where there are no performance conditions) or the performance period where relevant. The accrued employee entitlement is recorded as a credit within shareholders’ funds. The estimated cost of awards is based upon the market value of the shares at the grant date or the difference between the exercise price and the market price at the date of granting the award, adjusted to reflect the impact of performance conditions where applicable.
Where shares are satisfied by on-market purchases the cost of acquiring the shares is deducted from shareholders’ funds. The difference between the consideration paid for the shares and the cost of the awards is transferred to retained earnings when the shares vest unconditionally.
In prior years the estimated cost of share awards was initially charged to profit and recorded as a provision using the market value of shares at the grant date. Where awards were satisfied by on-market purchases, the cost was subsequently adjusted to the actual consideration for shares purchased.
The Group has elected not to early adopt FRS 20, “Share based payment” for the year ended 31 March 2005.
Basis of consolidation
The Group Financial Statements comprise a consolidation of the accounts of the Company and all its subsidiaries and include the Group’s share of the results and net assets of its joint ventures and associates. The accounts of principal subsidiaries, joint ventures and associates are made up to 31 March. In the year ended 31 March 2004 Cable & Wireless USA, Inc. and Cable & Wireless Internet Services, Inc. (together with certain of their affiliates), were deconsolidated on 8 December 2003 (the date on which these companies filed for Chapter 11 bankruptcy protection under the US Bankruptcy Code).
Where subsidiaries, joint ventures or associates have been acquired during the year, goodwill, being the difference between the fair value of consideration given and the fair values attributed to the separable net assets acquired, is capitalised on the balance sheet and amortised through the profit and loss account.
Foreign currencies
Average rates of exchange ruling during the year are used to translate the profit and loss accounts of overseas subsidiaries, joint ventures and associates. Foreign currency assets and liabilities are translated at year end rates and any exchange differences arising are dealt with through the profit and loss account.
Back to Contents
Statement of accounting policies
The net investments in the Group’s overseas subsidiaries, joint ventures and associates are translated into sterling at year end rates of exchange. Exchange differences resulting from the translation of opening net investments at rates ruling at the beginning and end of the year, together with the differences between profit and loss accounts translated at average rates and year end rates, are dealt with as movements in Group reserves.
Where net investments are matched in whole or in part by foreign currency borrowings, the exchange differences arising on the retranslation of such borrowings are also recorded as movements on Group reserves and any excess taken to the profit and loss account.
All other exchange differences are dealt with through the profit and loss account.
Tangible fixed assets and depreciation
Tangible fixed assets are stated at cost less depreciation. The cost of fixed assets includes directly attributable labour and overhead costs. Interest that is directly attributable and incurred up to the time that separately identifiable major capital projects are ready for service is also capitalised as part of the cost of assets. Where the Group has a legal or constructive obligation to dismantle and remove its assets and restore the relevant sites, a provision is made for the estimated costs of the asset retirement obligation. The present value of the asset retirement obligation is capitalised as part of the initial cost of the asset.
Depreciation is not provided on freehold land or projects under construction. On other tangible fixed assets, depreciation is provided on the difference between the cost of tangible fixed assets and the estimated residual value, in equal annual instalments over the estimated useful lives of the assets. Depreciation commences when the assets are ready for use. Assets lives are:
| |
| |
|---|
| | | Lives | |
|---|
| | | | |
| | Cables | up to 20 years | |
| | Network equipment | 3 to 25 years | |
| | Ducting | 40 years | |
| | Freehold buildings | 40 years | |
| | Leasehold land and buildings | up to 40 years or
term of lease if less | |
| |
| |
Profits and losses on disposals of tangible fixed assets are determined by reference to sale proceeds and net book values.
Intangible fixed assets
From 1 April 1998 intangible fixed assets acquired have been recorded at cost and amortised on a straight line basis over their estimated useful life, not exceeding 20 years. Intangible fixed assets primarily comprise goodwill arising on the acquisition of businesses.
Goodwill arising on acquisition prior to 1 April 1998 was eliminated directly against reserves. This goodwill has been written off as a matter of accounting policy. The profit or loss on the disposal of all or part of a previously acquired business is calculated after taking account of the gross amount of any goodwill previously eliminated directly against reserves.
Asset impairment
Intangible and tangible fixed assets are reviewed for impairment when events or changes in circumstances indicate that the carrying amount of the fixed asset may not be recoverable. Where an impairment indicator is identified, the carrying value of the income generating unit is compared with its recoverable amount. Where the recoverable amount is less than the carrying value an impairment is recognised.
Fixed asset investments
Joint ventures and associates are accounted for in the Group accounts under the gross equity and equity methods of accounting respectively.
Other fixed asset investments in the Group accounts are stated at cost less amounts written off in respect of any impairments.
Investments in subsidiaries are included in the Company balance sheet at valuation.
Current asset investments
Current asset investments are stated at the lower of cost and net realisable value.
Tax
The charge for tax is based on the result for the year and takes into account tax deferred due to timing differences between the treatment of certain items for tax and accounting purposes.
Deferred tax assets are recognised to the extent that they are regarded as recoverable. Deferred tax assets are regarded as recoverable to the extent that on the basis of all available evidence, it can be regarded as more likely than not that there will be suitable taxable profits from which the future reversal of the underlying timing differences can be deducted.
Back to Contents
Except where otherwise required by accounting standards, full provision without discounting is made for all timing differences that have arisen but not reversed at the balance sheet date.
Stocks
Stocks of equipment, held for use in the maintenance and expansion of the Group’s telecommunications systems, are stated at cost, including appropriate allocation of labour and overheads, less provision for deterioration and obsolescence. Stocks held for resale are stated at the lower of cost and net realisable value.
Discontinued operations
The Group complies with FRS 3 “Reporting financial performance”, in determining the classification of operations as discontinued or continuing.
Group turnover
Group turnover, which excludes discounts, value added tax and similar sales taxes, represents the amount receivable in respect of telecommunications services and equipment provided to customers and is accounted for on the accruals basis. It includes sales to joint ventures and associated companies but does not include sales by joint ventures and associated companies or sales between Group companies.
Turnover from voice, data and IP services is recognised as the services are provided. In respect of services invoiced in advance, amounts are deferred until provision of the service.
Amounts payable by and to telecommunications operators of national and international networks are recognised as services are provided. Charges are negotiated separately and are subject to continual review. Turnover generated through the provision of these services is accounted for gross of any amounts payable to other telecommunications operators for interconnect fees.
Mobile turnover comprises amounts charged to customers in respect of monthly access charges, airtime usage, messaging, the provision of other mobile telecommunications services, including data services and information provision and turnover from the sale of equipment, including handsets.
The Group earns revenue from the transmission of content on its network originated by third-party providers. The Group assesses whether revenue should be recorded gross as principal or net as agent, based on the features of such arrangements including the following indicators:
| – whether the Group holds itself out as an agent; |
| – establishment of the price; |
| – provision of customer remedies; |
| – performance of part of the service; and |
| – assumption of credit risk. |
Mobile monthly access charges are invoiced and recorded as part of a periodic billing cycle. Airtime, either from contract customers as part of the invoiced amount, or from pre-paid customers through the sale of pre-paid top-up cards, is recorded in the period in which the customer uses the service. Unbilled turnover resulting from mobile services provided to contract customers from the billing cycle date to the end of each period is accrued. Unearned monthly access charges relating to periods after each accounting period are deferred.
Turnover from sales of telecommunication equipment is recognised upon delivery to the customer.
The total consideration on arrangements with multiple turnover-generating activities (generally the sale of telecom equipment and ongoing service) is allocated to those components that are capable of operating independently based on the fair value of the components. Turnover from the sale of the telecom equipment and services is recognised on the basis set out above.
Sales of network capacity to third parties pursuant to IRUs are accounted for as sales and recognised at the time of delivery and acceptance where:
| – the purchaser’s right of use is exclusive and irrecoverable; |
| – the asset is specific and separable; |
| – the term of the contract is for the major part of the asset’s useful economic life; |
| – the attributable costs of carrying value can be measured reliably; |
| – no significant risks are retained by the Group; and |
| – the asset is identified as held for sale and categorised to stock. |
Turnover arising from the provision of other services, including maintenance contracts, is recognised evenly over the periods in which the service is provided.
Back to Contents
Statement of accounting policies
Pensions
The regular cost of providing benefits under defined benefit schemes is charged to operating profit over the expected remaining service lives of the members of the schemes so as to achieve a constant percentage of pensionable pay. Variations from the regular cost arising from periodic actuarial valuations of the principal defined benefit schemes are allocated to operating profit over the expected remaining service lives of the members.
The cost of providing benefits under defined contribution schemes is charged as it becomes payable.
The Group has applied the transitional arrangements of FRS 17 “Retirement benefits” and appropriate additional disclosures have been included in Note 8.
Leased assets
Where assets are financed by leasing agreements that give rights approximating to ownership, the assets are treated as if they had been purchased outright. The amount capitalised is the present value of the minimum lease payments payable during the lease term. The corresponding lease commitments are shown as obligations to the lessor. Lease payments are split between capital and interest elements using the annuity method. Depreciation on the relevant assets and interest are charged to the profit and loss account. All other leases are operating leases and the rentals are charged to operating profit on a straight-line basis over the lease term.
Debt issue costs
The costs of issue of capital instruments are charged to the profit and loss account over the life of the instrument. Debt issued is initially recorded net of these issue costs.
Debtors
Debtors are stated at the invoiced amount less provisions for accounts that are estimated by management to be doubtful. Provisions are maintained in respect of bad and doubtful debts for estimated losses resulting from the inability of customers to make required payments. Estimates are based on the ageing of the debt balances and historical experience.
Derivatives
Swaps and forward rate agreements
The net interest paid or received under any interest rate and cross currency swaps and forward rate agreements (“FRAs”) is recorded on an accruals basis and included within net interest in the profit and loss account.
The notional amounts of interest rate swaps and FRAs are not recorded on the balance sheet. Cross currency swaps are used to hedge the initial draw down and final repayment of certain foreign currency denominated debt, and the related foreign currency interest flows.
Forward exchange contracts
Forward exchange contracts are carried on the balance sheet at the difference between the amounts of the payable and receivable currency revalued at the closing exchange rate. The interest differential, being the difference between the contract rate and the spot rate on the date of entering into the forward exchange contract, is charged to the profit and loss account as interest over the life of the contract.
Exchange gains and losses
Exchange gains and losses on revaluation and maturity of any forward exchange contracts and cross currency swaps are treated according to the underlying exposure they hedge:
| – | for any contracts that hedge firm third party commitments the exchange gains and losses are recognised in the profit and loss account in the same period as the underlying transaction; |
| – | for any contracts over underlying currency assets or liabilities the exchange gains and losses are offset against the equal and opposite exchange gains or losses arising on the retranslation of the underlying assets or liabilities; |
| – | for any contracts taken out to hedge overseas equity investments the exchange gains and losses are taken to reserves to offset against the exchange differences arising on the retranslation of the net assets of the investments on consolidation; and |
| – | for any contracts that hedge general trading flows the exchange gains or losses are taken to the profit and loss account in the period in which they arise. |
Where the underlying exposure changes, or ceases to exist, the contract would be terminated and the exchange gain or loss arising taken to the profit and loss account.
Liquid resources
Liquid resources comprise current asset investments and short term deposits, which are readily convertible into known amounts of cash at or close to their carrying value.
Employee Share Option Plan Trust (ESOP)
The financial statements of the Group include the assets and related liabilities of the Cable & Wireless Employee Share Ownership Plan Trust. Under the requirements of UITF 38 “Accounting for ESOP trusts” are stated at cost and deducted from equity shareholders’ funds.
Back to Contents
Notes to the financial statements
1 Company’s profit and loss account
The Company has taken advantage of the exemption contained in s230 of the Companies Act 1985 from presenting its own profit and loss account. The profit for the year of the Company amounted to £152 million (2004 – £585 million, 2003 – loss of £7,523 million).
2 Historical cost profits and losses
There is no difference between the Group results as reported and on the historical cost bassis. Accordingly no additional note of historical cost profits and losses has been prepared.
3 Turnover
The Group’s operations are all considered to fall into one class of business, namely telecommunications.
4 Segmental information
Cable & Wireless is an international telecommunications company. During the year ended 31 March 2005, the Group was organised into the following segments, namely the United Kingdom, CWAO, Europe (excluding Monaco), Asia, Bulldog (acquired during the year) and the National Telcos. Historically the results of Japan and Asia were reported as a separate segment. Following the disposal of Japan during the year, Asia is now reported as a separate segment. The results for Japan have been included in discontinued operations for all three years presented.
United Kingdom, CWAO, Europe and Asia, provide communications solutions to business and wholesale customers offering IP, data and voice products. Bulldog provides broadband and voice services to consumers and small businesses in the UK. The National Telcos companies that are located in the Caribbean, Panama, Macau, Monaco (acquired in the year), the Middle East, South East Asia and in the Pacific, Indian and Atlantic Oceans provide a full range of telecommunications services to both consumer and business customers, including fixed and mobile voice, data and IP.
Other and eliminations includes unallocated corporate expenses, inter-segment eliminations recorded on consolidation and net operating assets that are not allocated to segments. Turnover is reported in the geography in which the services are delivered. The segmental information below has been presented on that basis and comparative information has been amended accordingly. The accounting policies adopted by each of the segments are described in the “Statement of Accounting Policies”.
Details of Group turnover, contributions to profit/(loss) on ordinary activities before interest and taxation, net operating assets/(liabilities) by geographical region are as follows:
Turnover | | | | | | |
|---|
| |
|---|
| Geographical area | 2005
£m | | 2004
£m | | 2003
£m | |
|---|
| | | | | | | | | | |
| United Kingdom | | 1,602 | | | 1,661 | | | 1,684 | |
| CWAO | | 16 | | | 11 | | | — | |
| Europe | | 186 | | | 262 | | | 304 | |
| Asia | | 39 | | | 32 | | | 79 | |
| Bulldog | | 11 | | | — | | | — | |
| | | | | | | | | | |
| National Telcos | | | | | | | | | |
| – Caribbean | | 550 | | | 633 | | | 756 | |
| – Panama | | 257 | | | 265 | | | 279 | |
| – Macau | | 117 | | | 128 | | | 146 | |
| – Monaco | | 100 | | | — | | | — | |
| – Rest of the World | | 167 | | | 161 | | | 159 | |
| |
|---|
| Total National Telcos | | 1,191 | | | 1,187 | | | 1,340 | |
| Inter-segment turnover | | (22 | ) | | (23 | ) | | (30 | ) |
| |
|---|
| Continuing operations | | 3,023 | | | 3,130 | | | 3,377 | |
| |
|---|
| Discontinued operations | | 199 | | | 541 | | | 1,014 | |
| |
|---|
| Group turnover | | 3,222 | | | 3,671 | | | 4,391 | |
| |
|---|
The Group turnover figure disclosed represents turnover of the Company and its subsidiaries allocated to the location to which telecommunications services were delivered. International telecommunications traffic which the Group may be responsible for carrying on part of its route would not necessarily originate in that location. The Group does not have access to information on the original source or ultimate destination of international telecommunications traffic.
Back to Contents
Notes to the financial statements
Discontinued operations comprise sales in Japan £199 million (2004 – Japan £254 million, United States £242 million and Yemen £45 million, 2003 – Japan £300 million, United States £644 million and Yemen £70 million).
There were no capacity sales recorded within turnover in 2005, 2004 and 2003.
| Profit/(loss) on ordinary activities before interest |
| |
|---|
| | 2005 | | 2004 | | 2003 | |
|---|
| |
| |
| |
| |
|---|
| Profit/(loss)
on ordinary
operating
activities
before
exceptional
items and
interest
£m | | Exceptional
items
£m | | Profit/(loss)
on ordinary
activities
before
interest
£m | | Profit/(loss)
on ordinary
operating
activities
before
exceptional
items and
interest
£m | | Exceptional
items
£m | | Profit/(loss)
on ordinary
activities
before
interest
£m | | Profit/(loss)
on ordinary
operating
activities
before
exceptional
items and
interest
£m | | Exceptional
items
£m | | Profit/(loss)
on ordinary
activities
before
interest
£m | |
|---|
| Geographical area | | | | | | | | | | | | | | | | | | | | | | | | | | | |
| United Kingdom | | 92 | | | (66 | ) | | 26 | | | 33 | | | (256 | ) | | (223 | ) | | (359 | ) | | (3,570 | ) | | (3,929 | ) |
| CWAO | | (8 | ) | | 6 | | | (2 | ) | | (16 | ) | | — | | | (16 | ) | | — | | | — | | | — | |
| Europe | | (12 | ) | | (38 | ) | | (50 | ) | | (4 | ) | | (2 | ) | | (6 | ) | | (71 | ) | | (298 | ) | | (369 | ) |
| Asia | | 5 | | | (1 | ) | | 4 | | | 4 | | | (8 | ) | | (4 | ) | | (28 | ) | | (16 | ) | | (44 | ) |
| Bulldog | | (34 | ) | | — | | | (34 | ) | | — | | | — | | | — | | | — | | | — | | | — | |
| | | | | | | | | | | | | | | | | | | | | | | | | | | | |
| National Telcos | | | | | | | | | | | | | | | | | | | | | | | | | | | |
| – Caribbean | | 108 | | | (24 | ) | | 84 | | | 115 | | | (243 | ) | | (128 | ) | | 214 | | | (19 | ) | | 195 | |
| – Panama | | 71 | | | — | | | 71 | | | 70 | | | (73 | ) | | (3 | ) | | 91 | | | (14 | ) | | 77 | |
| – Macau | | 37 | | | — | | | 37 | | | 40 | | | (2 | ) | | 38 | | | 42 | | | — | | | 42 | |
| – Monaco | | 16 | | | — | | | 16 | | | — | | | — | | | — | | | — | | | — | | | — | |
| – Rest of the World | | 66 | | | (1 | ) | | 65 | | | 55 | | | (1 | ) | | 54 | | | 60 | | | (1 | ) | | 59 | |
| |
|---|
| Total National Telcos | | 298 | | | (25 | ) | | 273 | | | 280 | | | (319 | ) | | (39 | ) | | 407 | | | (34 | ) | | 373 | |
| Other and eliminations | | (59 | ) | | (35 | ) | | (94 | ) | | (40 | ) | | (34 | ) | | (74 | ) | | (39 | ) | | (269 | ) | | (308 | ) |
| Joint ventures and associates | | 40 | | | — | | | 40 | | | 41 | | | — | | | 41 | | | 75 | | | 54 | | | 129 | |
| |
|---|
| Continuing operations | | 322 | | | (159 | ) | | 163 | | | 298 | | | (619 | ) | | (321 | ) | | (15 | ) | | (4,133 | ) | | (4,148 | ) |
| Discontinued operations | | 17 | | | 145 | | | 162 | | | (33 | ) | | 117 | | | 84 | | | (437 | ) | | (1,774 | ) | | (2,211 | ) |
| |
|---|
| | | 339 | | | (14 | ) | | 325 | | | 265 | | | (502 | ) | | (237 | ) | | (452 | ) | | (5,907 | ) | | (6,359 | ) |
| |
|---|
Discontinued operations include the profit/(loss) on ordinary activities before interest of Japan £71 million, United States £66 million, Other £22 million and Yemen £3 million (2004 – Japan £(127) million, United States £144 million, Other £57 million and Yemen £10 million, 2003 – Japan £(222) million, United States £(2,091) million, Other £84 million and Yemen £18 million.
The exceptional items are described fully in Note 10. Segmental information in respect of the Group’s investments in joint ventures and associates is given in Note 17.
Financing is dealt with at a Group level and therefore net interest and other similar income/(charges) has not been allocated to a geographic region.
Back to Contents
| | | | | |
|---|
| Net operating assets/(liabilities) | | | | |
|---|
| |
|---|
| 2005
£m | | 2004
£m | |
|---|
| | | | | | | |
Geographical area
| | | | | | |
| United Kingdom | | (33 | ) | | (176 | ) |
| CWAO | | (7 | ) | | (33 | ) |
| Europe | | (70 | ) | | (57 | ) |
| Asia | | 13 | | | 12 | |
| Bulldog | | 49 | | | — | |
| | | | | | | |
| National Telcos | | | | | | |
| – Caribbean | | 372 | | | 370 | |
| – Panama | | 252 | | | 287 | |
| – Macau | | 40 | | | 48 | |
| – Monaco | | 72 | | | — | |
| – Rest of the World | | 97 | | | 88 | |
| |
|---|
| Total National Telcos | | 833 | | | 793 | |
| Continuing operations | | 785 | | | 539 | |
| Discontinued operations | | — | | | 20 | |
| |
|---|
| Net operating assets | | 785 | | | 559 | |
| |
|---|
| Other and eliminations | | 1,352 | | | 1,393 | |
| |
|---|
| Net assets | | 2,137 | | | 1,952 | |
| |
|---|
| | | | | | | |
| Other and eliminations comprise assets and liabilities that cannot practicably be divided between the segments. The assets and liabilities are: |
| |
| 2005
£m | | 2004
£m | |
|---|
| | | | | | | |
| Tangible assets (including projects under construction) | | 247 | | | 194 | |
| Fixed asset investments | | 229 | | | 266 | |
| Debtors | | 215 | | | 203 | |
| Current asset investments and short–term deposits | | 2,031 | | | 2,229 | |
| Cash at bank and in hand | | 5 | | | 35 | |
| Creditors: amounts falling due within one year | | (335 | ) | | (448 | ) |
| Creditors: amounts falling due after more than one year | | (801 | ) | | (875 | ) |
| Provisions | | (239 | ) | | (211 | ) |
| |
|---|
| | | 1,352 | | | 1,393 | |
| |
|---|
| |
| 5 Operating costs |
| |
| Profit/(loss) on ordinary activities is stated after charging/(crediting): |
| |
|---|
| Continuing operations
before exceptional
items | | Discontinued
operations
before
exceptional
items | | Operating
exceptional
items
(Note 10) | | 2005 | |
|---|
| | £m | | £m | | £m | | £m | | £m | |
| | |
| | | | | | | | | | |
| | | Acquisitions
| | | | | | | | | | |
| | | | | | | | | | | | | | | | |
| Outpayments to other telecommunications | | | | | | | | | | | | | | | |
| administrations and carriers | | 1,054 | | | 53 | | | 93 | | | — | | | 1,200 | |
| Other network costs | | 199 | | | 14 | | | 14 | | | 8 | | | 235 | |
| Cost of sales relating to equipment sales and rentals | | 259 | | | 1 | | | 5 | | | — | | | 265 | |
| Employee costs | | 467 | | | 25 | | | 26 | | | 70 | | | 588 | |
| Pension costs | | 35 | | | — | | | 1 | | | — | | | 36 | |
| Property rentals, taxes and utility costs | | 70 | | | 2 | | | 15 | | | 56 | | | 143 | |
| Depreciation and impairment of owned tangible fixed assets | | 184 | | | 8 | | | 2 | | | 8 | | | 202 | |
| Amortisation and impairment of capitalised goodwill | | (2 | ) | | 9 | | | — | | | — | | | 7 | |
| Operating lease rentals: | | | | | | | | | | | | | | | |
| – network, plant and equipment | | 69 | | | — | | | 2 | | | — | | | 71 | |
| – other | | 40 | | | 1 | | | — | | | — | | | 41 | |
| Other operating costs | | 242 | | | 16 | | | 27 | | | 11 | | | 296 | |
| |
|---|
| | | 2,617 | | | 129 | | | 185 | | | 153 | | | 3,084 | |
| |
|---|
Back to Contents
Notes to the financial statements
| Profit/(loss) on ordinary activities is stated after charging/(crediting): |
| |
|---|
| | Continuing
operations
before
exceptional
items
£m | | Discontinued
operations
before
exceptional
items
£m | | Operating
exceptional
items
(Note 10)
£m | | 2004
£m | | Continuing
operations
before
exceptional
items
£m | | Discontinued
operations
before
exceptional
items
£m | | Operating
exceptional
items
(Note 10)
£m | | 2003
£m | |
|---|
| | | | | | | | | | | | | | | | | | | | | | | | | |
Outpayments to other telecommunications
administrations and carriers | | 1,100 | | | 157 | | | — | | | 1,257 | | | 1,161 | | | 514 | | | — | | | 1,675 | |
| Other network costs | | 335 | | | 21 | | | — | | | 356 | | | 275 | | | 7 | | | — | | | 282 | |
| Cost of sales relating to equipment sales and rentals | | 232 | | | 1 | | | 13 | | | 246 | | | 276 | | | 18 | | | — | | | 294 | |
| Employee costs | | 482 | | | 135 | | | 110 | | | 727 | | | 549 | | | 303 | | | 90 | | | 942 | |
| Pension costs | | 43 | | | 4 | | | 3 | | | 50 | | | 42 | | | 21 | | | — | | | 63 | |
| Property rentals, taxes and utility costs | | 53 | | | 38 | | | 92 | | | 183 | | | 83 | | | 103 | | | 211 | | | 397 | |
| Depreciation and impairment of owned tangible fixed assets | | 225 | | | 27 | | | 526 | | | 778 | | | 607 | | | 118 | | | 2,381 | | | 3,106 | |
Depreciation of tangible fixed assets held under
financeleases (plant and equipment) | | — | | | — | | | — | | | — | | | (1 | ) | | 11 | | | — | | | 10 | |
| Amortisation and impairment of capitalised goodwill | | (3 | ) | | — | | | 10 | | | 7 | | | 65 | | | 61 | | | 2,725 | | | 2,851 | |
| Operating lease rentals: | | | | | | | | | | | | | | | | | | | | | | | | |
| – network, plant and equipment | | 83 | | | 87 | | | — | | | 170 | | | 85 | | | 94 | | | — | | | 179 | |
| – other | | 59 | | | 34 | | | — | | | 93 | | | 52 | | | 43 | | | 28 | | | 123 | |
| Other operating costs | | 290 | | | 69 | | | 26 | | | 385 | | | 273 | | | 158 | | | 113 | | | 544 | |
| |
|---|
| | | 2,899 | | | 573 | | | 780 | | | 4,252 | | | 3,467 | | | 1,451 | | | 5,548 | | | 10,466 | |
| |
|---|
The remuneration of the auditors and their associates in respect of audit services provided to the Group during the year was £3.2 million, including £0.3 million relating to 2004 (2004 – £3.2 million, 2003 – £4.9 million), and includes £0.8 million (2004 – £0.8 million, 2003 – £1.1 million) for the Company. Regulatory reporting fees principally related to compliance with International Financial Reporting Standards and the review of interim financial statements. The remuneration of the auditors and their associates in respect of non-audit services to the Company and its UK subsidiaries during the year was £0.9 million (2004 – £1.6 million, 2003 – £3.6 million) and to overseas subsidiaries £0.6 million (2004 – £1.5 million, 2003 – £1.4 million) as summarised below:
| |
|---|
| 2005
£m | | 2004
£m | | 2003
£m | |
|---|
| | | | | | | | | | |
| Audit services | | | | | | | | | |
| – Statutory audit services | | 3.2 | | | 3.2 | | | 4.9 | |
| – Audit-related regulatory reporting | | 1.4 | | | 0.4 | | | — | |
| |
|---|
| | | 4.6 | | | 3.6 | | | 4.9 | |
| Further assurance services | | 0.2 | | | 0.8 | | | 1.3 | |
| Tax services – Compliance | | 1.0 | | | 1.0 | | | 1.1 | |
| Tax services – Advisory services | | 0.2 | | | 1.2 | | | 1.4 | |
| Other services | | 0.1 | | | 0.1 | | | 1.2 | |
| |
|---|
| | | 6.1 | | | 6.7 | | | 9.9 | |
| |
|---|
These services are subject to the Company’s policy for approving audit and non-audit services as set out on pages 39 to 40.
Back to Contents
| 6 Employees |
| The average monthly number of persons employed by the Group during the year was: | | | | | | |
|---|
| |
|---|
| 2005
Number | | 2004
Number | | 2003
Number | |
|---|
| | | | | | | | | | |
| United Kingdom | | 4,485 | | | 4,991 | | | 6,147 | |
| CWAO | | 44 | | | 34 | | | — | |
| Europe | | 474 | | | 576 | | | 1,002 | |
| Asia | | 221 | | | 239 | | | 236 | |
| Bulldog (pro-rated) | | 223 | | | — | | | — | |
| | | | | | | | | | |
| National Telcos | | | | | | | | | |
| – Caribbean | | 4,149 | | | 4,363 | | | 5,198 | |
| – Panama | | 1,894 | | | 1,983 | | | 2,717 | |
| – Macau | | 908 | | | 922 | | | 947 | |
| – Monaco (pro-rated) | | 434 | | | — | | | — | |
| – Rest of the World | | 1,426 | | | 1,426 | | | 1,073 | |
| |
|---|
| Total National Telcos | | 8,811 | | | 8,694 | | | 9,935 | |
| Other | | 329 | | | 237 | | | 377 | |
| |
|---|
| Continuing operations | | 14,587 | | | 14,771 | | | 17,697 | |
| Discontinued operations (pro-rated) | | 647 | | | 2,659 | | | 5,694 | |
| |
|---|
| | | 15,234 | | | 17,430 | | | 23,391 | |
| |
|---|
At the beginning of 2005, an IT contract was insourced, increasing the headcount within Other. Towards the end of 2005, this group was transferred to the UK. The movement of these personnel to and from Other during the year has led to the overall increase in the average number of employees within Other 2005 compared with 2004.
| The aggregate remuneration and associated costs of Group employees, including amounts capitalised, were: |
| |
|---|
| 2005
£m | | 2004
£m | | 2003
£m | |
|---|
| | | | | | | | | | |
| Salaries and wages | | 505 | | | 675 | | | 895 | |
| Social security costs | | 44 | | | 61 | | | 71 | |
| Pension costs | | | | | | | | | |
| – Principal schemes (Note 8) | | 23 | | | 24 | | | 31 | |
| – Other costs including defined contribution schemes | | 13 | | | 26 | | | 32 | |
| |
|---|
| | | 585 | | | 786 | | | 1,029 | |
| |
|---|
7 Directors’ remuneration and shareholdings
Information covering Directors’ remuneration (including pension entitlements), interest in shares and interests in share options (including in each case those arising under the Share Option Plan, Restricted Shares and Performance Share Plan) is included in the Directors’ remuneration report on pages 42 to 54.
8 Pensions
Defined benefit schemes
The Company and its principal subsidiaries operate pension and other retirement schemes that cover the majority of employees of the Group. These schemes include both the defined benefit type, whereby retirement benefits are based on the employee’s final remuneration and length of service, and defined contribution schemes, whereby retirement benefits reflect the accumulated value of agreed contributions paid by, and in respect of, employees. With the exception of the unfunded, unapproved retirement benefit schemes, the remaining schemes are funded through separate trustee administered schemes. Contributions to the defined benefit schemes are made in accordance with the recommendations of independent actuaries who value the schemes at regular intervals, usually triennially.
An actuarial valuation of the principal United Kingdom defined benefit pension scheme (“the Scheme”) was prepared at 31 March 2002 for the purpose of UK Statement of Standard Accounting Practice 24 “Accounting for pension costs” (“SSAP 24”).
Back to Contents
Notes to the financial statements
The valuation of the Scheme disclosed a shortfall in the market value of the Scheme’s assets compared with the accrued liabilities. This was principally due to the fall in the Scheme’s asset values following the fall in global equity markets between 1 April 1999 and 31 March 2002. Thus, with agreement from the actuary, the Company increased its contributions to the Scheme to 20 per cent of salary with effect from 1 April 2002, and made a contribution to the Scheme of £47 million in December 2002 in respect of the shortfall. The latest actuarial valuation of the UK defined benefit scheme is in progress, based on the position at 31 March 2005. The Group contributed £100 million in February 2005 to the UK fund in anticipation of this valuation. The Scheme was valued using the projected unit method and the principal assumptions were that future investment returns on existing assets would, on average, be 3.2 per cent a year above the level of price inflation, that the return on new investments would be 3.9 per cent a year above price inflation, that general salary growth would be 1.7 per cent a year above price inflation, and that inflation related pension increases would generally be in line with price inflation. The market value of the Scheme’s investments at the valuation date was £1,401 million. The Scheme also holds some insurance policies, which had an assessed value of £11 million. The total value of the assets was 97 per cent of the value of the aggregate benefits that had accrued to members of the Scheme, allowing for expected future earnings increases in the case of employees.
The assumptions used for calculating the pension cost for accounting purposes differ from the funding assumptions in that the assumed return on existing assets is 3.3 per cent a year above price inflation. In the Financial Statements, the deficit in the Scheme is spread over the remaining service lives of the employed members. Under those assumptions as at 31 March 2002, the total value of the investments was 99 per cent of the value of the aggregate benefits that had accrued to members of the Scheme.
| The principal pension costs as shown in Note 6 comprise: |
| |
|---|
| 2005
£m | | 2004
£m | | 2003
£m | |
|---|
| | | | | | | | | | |
| Regular costs | | 17 | | | 17 | | | 22 | |
| Variation from regular costs (including interest) | | 6 | | | 7 | | | 9 | |
| |
|---|
| | | 23 | | | 24 | | | 31 | |
| |
|---|
Pension schemes other than the Scheme are accounted for on the basis of local custom and practice. Pension prepayments relating to the Scheme of £202 million (2004 – £102 million, 2003 – £112 million) are included in other prepayments and accrued income (Note 19). Provisions for obligations to pay terminal gratuities on retirement to staff who are not members of the pension and retirement schemes are included in provisions for pensions (Note 22).
Defined contribution schemes
The pension cost for the year for the defined contribution schemes was £13 million (2004 – £26 million, 2003 – £19 million).
Disclosures in respect of FRS 17 – “Retirement benefits”
The above figures have been prepared in accordance with the requirements of SSAP 24. FRS 17 has been published in the United Kingdom, however, its full introduction has been deferred. The accounting requirements of FRS 17 are broadly as follows:
| – | pension scheme assets are valued at market values at the balance sheet date; |
| – | pension scheme liabilities are measured using the projected unit method and discounted at the current rate of return on high quality (AA) corporate bonds of equivalent term and currency to the liability; |
| – | for accounting periods beginning on or after 1 January 2005 the pension scheme surplus (to the extent it is considered recoverable) or deficit will be recognised in full and presented on the face of the balance sheet; and |
| – | the movement in the scheme surplus/deficit will be split between operating charges, financing items and, in the statement of total recognised gains and losses, actuarial gains and losses. |
The transitional disclosures in respect of FRS 17 are set out below:
Back to Contents
| Qualified independent actuaries, Watson Wyatt LLP, updated the actuarial valuations of the major defined benefit schemes operated by the Group to 31 March 2005. The main financial assumptions in accordance with FRS 17 are as follows: | |
|---|
| |
|---|
| At 31 March 2005 | | At 31 March 2004 | | At 31 March 2003 | |
|---|
| |
| |
| |
| |
|---|
| UK
% | | Rest of
Group
% | | UK
% | | Rest of
Group
% | | UK
% | | Rest of
Group
% | |
|---|
| | | | | | | | | | | | | | | | | | | |
| Inflation assumption | | 2.7 | | | 3.9 | | | 2.8 | | | 3.8 | | | 2.5 | | | 4.3 | |
| Rate of increase in salaries | | 3.2 | | | 5.9 | | | 4.6 | | | 5.4 | | | 4.3 | | | 5.6 | |
| Pension increases | | 2.7–3.0 | | | 2.9 | | | 2.8–3.0 | | | 3.5 | | | 2.5–3.0 | | | 3.6 | |
| Discount rate | | 5.4 | | | 7.2 | | | 5.5 | | | 6.4 | | | 5.5 | | | 6.9 | |
| Long term expected rate of return on: | | | | | | | | | | | | | | | | | | |
| Equities | | 8.0 | | | 8.3 | | | 8.0 | | | 9.0 | | | 8.5 | | | 9.1 | |
| Bonds | | 4.9 | | | 6.2 | | | 5.0 | | | 6.6 | | | 5.0 | | | 7.1 | |
| Property | | 6.5 | | | 5.2 | | | — | | | — | | | — | | | — | |
| Other | | 4.0 | | | 4.6 | | | 4.0 | | | 4.8 | | | 4.0 | | | 4.8 | |
| |
|---|
The assumptions used by the actuaries are the best estimates chosen from a range of possible actuarial assumptions which may not necessarily be borne out in practice. The assumptions shown above for the Rest of Group represent a weighted average of the assumptions used for the individual funds.
The UK defined benefit scheme is closed to new entrants and under the projected unit method for closed schemes the current service cost will increase as the members of the scheme approach retirement.
| The assets and liabilities in respect of the defined benefit schemes operated by the Group are as follows: |
| |
|---|
| | At 31 March 2005 | | At 31 March 2004 | | At 31 March 2003 | |
|---|
| |
| |
| |
| |
|---|
| UK
£m | | Rest of
Group
£m | | UK
£m | | Rest of
Group
£m | | UK
£m | | Rest of
Group
£m | |
|---|
| | | | | | | | | | | | | | | | | | | |
| Equities | | 879 | | | 75 | | | 965 | | | 84 | | | 855 | | | 61 | |
| Bonds | | 539 | | | 52 | | | 353 | | | 56 | | | 246 | | | 56 | |
| Property | | 94 | | | 24 | | | — | | | — | | | — | | | — | |
| Other | | 103 | | | 65 | | | 90 | | | 52 | | | 53 | | | 36 | |
| |
|---|
| Total fair value of scheme assets | | 1,615 | | | 216 | | | 1,408 | | | 192 | | | 1,154 | | | 153 | |
| Present value of funded scheme liabilities | | (1,775 | ) | | (172 | ) | | (1,744 | ) | | (213 | ) | | (1,630 | ) | | (207 | ) |
| |
|---|
| (Deficit)/surplus in funded defined benefit schemes | | (160 | ) | | 44 | | | (336 | ) | | (21 | ) | | (476 | ) | | (54 | ) |
| Unrecognisable surplus in funded defined benefit schemes | | — | | | (34 | ) | | — | | | — | | | — | | | — | |
| Deficit in unfunded schemes | | (20 | ) | | (15 | ) | | (20 | ) | | (26 | ) | | (18 | ) | | (30 | ) |
| |
|---|
| Total deficit in defined benefit schemes | | (180 | ) | | (5 | ) | | (356 | ) | | (47 | ) | | (494 | ) | | (84 | ) |
| Deferred tax liability | | — | | | (3 | ) | | — | | | — | | | — | | | — | |
| |
|---|
| Net liability | | (180 | ) | | (8 | ) | | (356 | ) | | (47 | ) | | (494 | ) | | (84 | ) |
| |
|---|
At 31 March 2005, the pension deficit calculated under FRS 17 for the funded defined benefit pension schemes was £160 million in respect of the principal UK scheme (2004 – £336 million, 2003 – £476 million) and a surplus/(deficit) of £10 million in respect of the Rest of the Group (2004 – £(21) million, 2003 – £(54) million). The deficit in unfunded defined benefit schemes at 31 March 2005 was £35 million in respect of the Group (2004 – £46 million, 2003 – £48 million), including £20 million in respect of the UK (2004 – £20 million, 2003 – £18 million), and £15 million in respect of the Rest of the Group (2004 – £26 million, 2003 – £30 million).
A deferred tax liability of £3 million would be recognised at 31 March 2005 if the pension deficit of the Rest of the Group was reflected in the Financial statements.
Back to Contents
Notes to the financial statements
| If the above amounts were recognised in the Financial Statements, the Group’s shareholders’ funds at 31 March 2005, 31 March 2004 and 31 March 2003 would be as follows: | |
| |
| | 2005
£m | | 2004
£m | | 2003
£m | |
| | | | | | | | | | |
| Shareholders' funds as presented | | 1,818 | | | 1,703 | | | 2,111 | |
| Less: SSAP 24 net assets | | (176 | ) | | (52 | ) | | (71 | ) |
| |
| Shareholders' funds excluding SSAP 24 net assets | | 1,642 | | | 1,651 | | | 2,040 | |
| FRS 17 retirement benefits net liability | | (188 | ) | | (403 | ) | | (578 | ) |
| |
| Shareholders' funds including FRS 17 retirement benefits net liability | | 1,454 | | | 1,248 | | | 1,462 | |
| |
Under the transitional requirements of FRS 17, the following disclosures are given to show the impact on the profit and loss account and statement of total recognised gains and losses if FRS 17 had been adopted in full. These amounts have not been included in the profit and loss account or the statement of total recognised gains and losses.
| Analysis of amounts that would be charged to operating profit for the years ended 31 March 2005, 31 March 2004 and 31 March 2003 in respect of defined benefit schemes is as follows: | |
| |
| | 2005 | | 2004 | | 2003 | |
| |
| |
| |
| |
| | UK
£m | | Rest of
Group
£m | | Total
£m | | UK
£m | | Rest of
Group
£m | | Total
£m | | UK
£m
| | Rest of
Group
£m | | Total
£m | |
| | | | | | | | | | | | | | | | | | | | | | | | | | | | |
| Current service cost | | 21 | | | 6 | | | 27 | | | 24 | | | 10 | | | 34 | | | 27 | | | 17 | | | 44 | |
| Past service cost | | — | | | — | | | — | | | — | | | 5 | | | 5 | | | — | | | — | | | — | |
| |
| Total charged to operating profit | | 21 | | | 6 | | | 27 | | | 24 | | | 15 | | | 39 | | | 27 | | | 17 | | | 44 | |
| |
| | |
| Analysis of other amounts that would be charged to the profit and loss account for the years ended 31 March 2005, 31 March 2004, and 31 March 2003 is as follows: | |
| |
| | 2005 | | 2004 | | 2003 | |
| |
| |
| |
| |
| | UK
£m | | Rest of
Group
£m | | Total
£m | | UK
£m | | Rest of
Group
£m | | Total
£m | | UK
£m | | Rest of
Group
£m | | Total
£m | |
| | | | | | | | | | | | | | | | | | | | | | | | | | | | |
| Loss/(gain) on curtailment | | 1 | | | (2 | ) | | (1 | ) | | 1 | | | (4 | ) | | (3 | ) | | — | | | (3 | ) | | (3 | ) |
| |
| | |
| Analysis of amounts that would be charged/(credited) to other finance income for the years ended 31 March 2005, 31 March 2004 and 31 March 2003 is as follows: | |
| |
| | 2005 | | 2004 | | 2003 | |
| |
| |
| |
| |
| | UK
£m | | Rest of
Group
£m | | Total
£m | | UK
£m | | Rest of
Group
£m | | Total
£m | | UK
£m | | Rest of
Group
£m | | Total
£m | |
| | | | | | | | | | | | | | | | | | | | | | | | | | | | |
| Interest on pension scheme liabilities | | 95 | | | 12 | | | 107 | | | 90 | | | 15 | | | 105 | | | 84 | | | 14 | | | 98 | |
| Expected return on pension scheme assets | | (97 | ) | | (16 | ) | | (113 | ) | | (86 | ) | | (11 | ) | | (97 | ) | | (102 | ) | | (12 | ) | | (114 | ) |
| |
| Net return | | (2 | ) | | (4 | ) | | (6 | ) | | 4 | | | 4 | | | 8 | | | (18 | ) | | 2 | | | (16 | ) |
| |
Back to Contents
| | |
| Analysis of amounts that would be recognised in the statement of total recognised gains and losses for the years ended 31 March 2005, 31 March 2004 and 31 March 2003 is as follows: | |
| |
| | 2005 | | 2004 | | 2003 | |
| |
| |
| |
| |
| | UK
£m | | Rest of
Group
£m | | Total
£m | | UK
£m | | Rest of
Group
£m | | Total
£m | | UK
£m | | Rest of
Group
£m | | Total
£m | |
| | | | | | | | | | | | | | | | | | | | | | | | | | | | |
| Actual return less expected return on pension scheme assets | | 45 | | | 12 | | | 57 | | | 192 | | | 41 | | | 233 | | | (380 | ) | | (16 | ) | | (396 | ) |
| Experience gains/(losses) on scheme liabilities | | 35 | | | 9 | | | 44 | | | 47 | | | (8 | ) | | 39 | | | (18 | ) | | (12 | ) | | (30 | ) |
Changes in the assumptions underlying the
present value of the scheme liabilities | | (1 | ) | | 35 | | | 34 | | | (91 | ) | | (3 | ) | | (94 | ) | | (111 | ) | | (7 | ) | | (118 | ) |
| Gain arising from divestiture | | — | | | 10 | | | 10 | | | — | | | — | | | — | | | — | | | — | | | — | |
| Change in unrecognisable surplus | | — | | | (35 | ) | | (35 | ) | | — | | | — | | | — | | | — | | | — | | | — | |
| |
Total actuarial gain/(loss) recognised
in the statement of total recognised
gains and losses | | 79 | | | 31 | | | 110 | | | 148 | | | 30 | | | 178 | | | (509 | ) | | (35 | ) | | (544 | ) |
| |
| | |
| History of experience gains and losses for the years ended 31 March 2005, 31 March 2004 and 31 March 2003 is as follows: | |
| |
| | 2005 | |
| |
| |
| | UK | | Rest of Group | | Total | |
| | £m | | % | | £m | | % | | £m | | % | |
Difference between expected and actual
return on scheme assets | | 45 | | | 3 | | | 12 | | | 6 | | | 57 | | | 3 | |
| Experience gains/(losses) on scheme liabilities | | 35 | | | 2 | | | 9 | | | 5 | | | 44 | | | 3 | |
Total actuarial gain recognised
in the statement of total recognised
gains and losses | | 79 | | | 4 | | | 31 | | | 11 | | | 110 | | | 6 | |
| |
| | |
| |
| | 2004 | | 2003 | |
| |
| |
| |
| | UK | | Rest of Group | | Total | | UK | | Rest of Group | | Total | |
| | £m | | % | | £m | | % | | £m | | % | | £m | | % | | £m | | % | | £m | | % | |
| | | | | | | | | | | | | | | | | | | | | | | | | | | | | | | | | | | | | |
Difference between expected and actual
return on scheme assets | | 192 | | | 14 | | | 41 | | | 21 | | | 233 | | | 15 | | | (380 | ) | | (33 | ) | | (16 | ) | | (10 | ) | | (396 | ) | | (30 | ) |
| Experience gains/(losses) on scheme liabilities | | 47 | | | 3 | | | (8 | ) | | (3 | ) | | 39 | | | 2 | | | (18 | ) | | (1 | ) | | (12 | ) | | (5 | ) | | (30 | ) | | (1 | ) |
Total actuarial gain/(loss) recognised
in the statement of total recognised
gains and losses | | 148 | | | 8 | | | 30 | | | 12 | | | 178 | | | 9 | | | (509 | ) | | (31 | ) | | (35 | ) | | (15 | ) | | (544 | ) | | (29 | ) |
| |
| | |
| Analysis of movement in the balance sheet deficit as at 31 March 2005, 31 March 2004 and 31 March 2003 is as follows: | |
| |
| | 2005 | | 2004 | | 2003 | |
| |
| |
| |
| |
| | UK
£m | | Rest of
Group
£m | | Total
£m | | UK
£m | | Rest of
Group
£m | | Total
£m | | UK
£m | | Rest of
Group
£m | | Total
£m | |
| | | | | | | | | | | | | | | | | | | | | | | | | | | | |
| Deficit at beginning of the year | | (356 | ) | | (47 | ) | | (403 | ) | | (494 | ) | | (84 | ) | | (578 | ) | | (48 | ) | | (28 | ) | | (76 | ) |
| Contributions made | | 117 | | | 11 | | | 128 | | | 19 | | | 19 | | | 38 | | | 72 | | | 15 | | | 87 | |
| Current service costs | | (21 | ) | | (6 | ) | | (27 | ) | | (24 | ) | | (10 | ) | | (34 | ) | | (27 | ) | | (17 | ) | | (44 | ) |
| Past service costs | | — | | | — | | | — | | | — | | | (5 | ) | | (5 | ) | | — | | | — | | | — | |
| Curtailment (loss)/gain | | (1 | ) | | 2 | | | 1 | | | (1 | ) | | 4 | | | 3 | | | — | | | 3 | | | 3 | |
| Other finance (charge)/income | | 2 | | | 4 | | | 6 | | | (4 | ) | | (4 | ) | | (8 | ) | | 18 | | | (2 | ) | | 16 | |
| Actuarial gain/(loss) | | 79 | | | 31 | | | 110 | | | 148 | | | 30 | | | 178 | | | (509 | ) | | (35 | ) | | (544 | ) |
| Other movements | | — | | | — | | | — | | | — | | | (6 | ) | | (6 | ) | | — | | | (26 | ) | | (26 | ) |
| Exchange gain | | — | | | — | | | — | | | — | | | 9 | | | 9 | | | — | | | 6 | | | 6 | |
| Tax charge | | — | | | (3 | ) | | (3 | ) | | — | | | — | | | — | | | — | | | — | | | — | |
| |
| Deficit at end of the year | | (180 | ) | | (8 | ) | | (188 | ) | | (356 | ) | | (47 | ) | | (403 | ) | | (494 | ) | | (84 | ) | | (578 | ) |
| |
| | |
Other movements consist of acquisitions and certain immaterial overseas schemes, which had not previously been included.
| |
Back to Contents
Notes to the financial statements
9 Profits less (losses) on disposal of fixed assets
Profits less (losses) on disposal of fixed assets before exceptional items amount to £5 million (2004 – £25 million, 2003 – £nil). The tax charge attributable is £nil (2004 – £nil, 2003 – £nil) and the minority interest is £1 million (2004 – £nil, 2003 – £nil).
| 10 Exceptional items | |
| Exceptional items before exceptional tax credit (see Note 12), in 2005, 2004 and 2003 comprise: | |
| |
| | | | 2005 | | 2004 | |
| | | |
| |
| |
| | Note | | Exceptional
items
£m | | Taxation
£m | | Minority
interest
£m | | Total
£m | | Exceptional
items
£m | | Taxation
£m | | Minority
interest
£m
| | Total
£m | |
| Operating items | | | | | | | | | | | | | | | | | | |
| Other operating costs | (i), (v) | | (145 | ) | 4 | | 3 | | (138 | ) | (244 | ) | 9 | | 9 | | (226 | ) |
Fixed asset impairment and amounts
written off | (ii), (vi) | | (8 | ) | — | | — | | (8 | ) | (526 | ) | 64 | | 41 | | (421 | ) |
| Goodwill impairment charge | (vi) | | — | | — | | — | | — | | (10 | ) | — | | — | | (10 | ) |
| |
| | | | (153 | ) | 4 | | 3 | | (146 | ) | (780 | ) | 73 | | 50 | | (657 | ) |
| Non operating items | | | | | | | | | | | | | | | | | | |
Profits less (losses) on sale and termination
of operations | (iii), (vii) | | 116 | | — | | — | | 116 | | 250 | | — | | — | | 250 | |
| Profits less (losses) on disposal of fixed assets | (iv), (viii) | | 23 | | — | | — | | 23 | | 28 | | — | | — | | 28 | |
| |
| | | | (14 | ) | 4 | | 3 | | (7 | ) | (502 | ) | 73 | | 50 | | (379 | ) |
| |
| | |
| |
| | | | | | | | 2003 | | | | | | | |
| | | |
| |
| | Note | | Exceptional
items
£m | | Taxation
£m | | Minority
interest
£m | | Total
£m | |
| Operating items | | | | | | | | | | | | | | | |
| Other operating costs | | (ix) | | | (442 | ) | | 10 | | | 11 | | | (421 | ) |
| Fixed asset impairment and amounts written off | | (x) | | | (2,381 | ) | | 48 | | | — | | | (2,333 | ) |
| Goodwill impairment charge | | (x) | | | (2,725 | ) | | — | | | — | | | (2,725 | ) |
| |
| | | | | | (5,548 | ) | | 58 | | | 11 | | | (5,479 | ) |
| Non operating items | | | | | | | | | | | | | | | |
| Profits less (losses) on sale and termination of operations | | (xi) | | | (147 | ) | | — | | | — | | | (147 | ) |
| Profits less (losses) on disposal of fixed assets | | (xii) | | | 62 | | | — | | | (33 | ) | | 29 | |
| Investments amounts written of | | (xiii) | | | (274 | ) | | — | | | — | | | (274 | ) |
| |
| | | | | | (5,907 | ) | | 58 | | | (22 | ) | | (5,871 | ) |
| |
| | |
| Year ended 31 March 2005 |
| (i) | Exceptional items included in other operating costs principally relate to the cost of restructuring Group businesses. These costs include £68 million in respect of redundancy costs in continuing businesses (United Kingdom £29 million, Europe £29 million, Asia £1 million, Other £9 million) and £54 million in respect of property costs (United Kingdom £23 million, Europe £10 million and Other £21 million). |
| | |
| | Other exceptional operating costs include the net of provision releases of £15 million, charges of £11 million relating to onerous network costs in the UK business and other restructuring charges in the UK business of £8 million. |
| | |
| | Hurricane Ivan and Asian tsunami adversely impacted the Group’s operations in the Caribbean and Maldives, respectively. Exceptional restoration costs of £19 million were incurred in rectifying damage caused to the network and other assets of these operations, comprising network related costs £12 million, employee costs £2 million, property £2 million and other £3 million. |
| | |
| (ii) | In addition to the exceptional restoration charges noted above, an impairment charge of £3 million was recognised relating to fixed assets that were damaged by the hurricane and tsunami. |
| | |
| | As a consequence of the restructuring in the Group’s European operations an impairment charge of £5 million was recognised in respect of fixed assets. This charge has been determined in accordance with FRS 11 “Impairment of fixed assets and goodwill” as part of a Group-wide impairment review, which involved, amongst other factors, using discount rates of 8 to 40 per cent depending on the cost of capital of the respective businesses. |
Back to Contents
| (iii) | On 17 February 2005, the Group disposed of its Japanese operations, Cable & Wireless IDC, Inc. A gain of £42 million was recorded on disposal of this business within discontinued operations. An exceptional credit of £66 million was recorded in respect of US domestic operations that were discontinued in the year ended 31 March 2004, principally comprising cash refunded to the Group as part of the Chapter 11 process. In addition a net gain of £8 million was recorded in respect of the sale or termination of Group operations, being the net of previously accrued costs no longer required (£42 million) partially offset by additional charges in the year (£34 million). |
| | |
| (iv) | The gain on the disposal of fixed assets comprises £16 million relating to the disposal of a trade investment by Cable & Wireless, IDC Inc. prior to its disposal by the Group, £10 million relating to the release of costs accrued on the disposal of investments in previous years no longer required offset by a £3 million write-off of assets physically destroyed by Hurricane Ivan. |
| | |
| Year ended 31 March 2004 |
| (v) | Exceptional items included in other operating costs principally relate to the cost of restructuring Group businesses. These costs include £93 million in respect of redundancy costs in continuing businesses (United Kingdom £48 million, Panama £7 million, Caribbean £25 million, Japan £5 million, Other £8 million), £92 million in respect of property costs principally relating to the United Kingdom and £24 million of other costs of restructuring incurred by the UK and European businesses. |
| | |
| | Other exceptional costs include £13 million of customer acquisition costs no longer recoverable in light of circumstances that have given rise to certain fixed asset impairments. |
| | |
| | Exceptional costs of restructuring the discontinued US business prior to its disposal totalled £22 million principally relating to employee costs. |
| | |
| (vi) | The Group carried out a review to determine whether there has been an impairment of its fixed assets and goodwill. The carrying values of fixed assets of each of the Group’s income generating units have been compared with their recoverable amounts, represented by their value in use to the Group. The charge has been determined in accordance with FRS 11 “Impairment of fixed assets and goodwill” which involved, amongst other factors, using discount rates of between 10.5 and 20 per cent depending on the cost of capital of the respective businesses. |
| | |
| | The result of this assessment was a charge of £10 million in respect of goodwill in Jamaica and £526 million in respect of depreciation of fixed assets throughout the Group. Tax credits of £64 million are available on the National Telecommunications companies’ depreciation impairment charges. |
| | |
| | The depreciation impairment charge arose in the United Kingdom (£119 million), Japan (£126 million), Caribbean (£197 million), Panama (£65 million) and Macau and the Rest of the World (£19 million). |
| |
| (vii) | On 8 December 2003 the Group’s US business filed for Chapter 11 bankruptcy protection under the US Bankruptcy Code. The effect of the filing for Chapter 11 together with the sale agreement with Gores was that the Group’s ability to control Cable & Wireless USA, Inc. and Cable & Wireless Internet Services, Inc. and their subsidiaries (“CW America”) was severely restricted. Accordingly, the Group has deconsolidated Cable & Wireless USA, Inc. and Cable & Wireless Internet Services, Inc. and their subsidiaries from 8 December 2003. |
| | |
| | The gain on the exit of the US business of £191 million reflects the deconsolidation of third party net liabilities net of costs of exit. |
| | |
| | In addition, £57 million of accrued costs relating to disposals in previous years, principally the disposal of the consumer operations of Cable & Wireless Communications plc on 30 May 2000, have been released. |
| | |
| | A £2 million gain arose on the disposal of certain European businesses after taking account of the release of provisions relating to these businesses. |
| |
| (viii) | The gain on the disposal of fixed assets comprises £16 million relating to the disposal of certain properties in the United States as part of the restructuring of the US business prior to deconsolidation, and £12 million principally comprising disposal of properties in the United Kingdom and the Caribbean as part of restructuring. |
| (ix) | The Group announced a restructuring in the United Kingdom, United States, Japan/Asia and Europe on 13 November 2002. Exceptional costs in the period of £248 million associated with this restructuring include £182 million in respect of property costs, £52 million in respect of redundancy costs and £14 million of other costs. |
| | |
| | Other exceptional costs relate to integration costs of Digital Island and the business activities of Exodus of £31 million, redundancy costs of £38 million principally in the Caribbean, Panama and Macau, £44 million of provisions in respect of rentals on vacant properties and £81 million in respect of onerous network contracts and distressed carrier asset write offs. |
Back to Contents
Notes to the financial statements
| (x) | The Group carried out a review to determine whether there had been an impairment of its fixed assets and goodwill. The carrying values of fixed assets and goodwill of each of the Group’s income generating units was compared to their recoverable amounts, represented by their value in use to the Group. The charge was determined in accordance with FRS 11 which involved, amongst other factors, using a growth rate of 2.5 per cent after five years (based on a nominal increase in GDP for the countries in which the Group operates) and a discount rate of 14 per cent. The resulting charge was £12 million in respect of goodwill and £1,479 million in respect of fixed assets. This charge was in addition to the charge of £2,713 million in respect of goodwill and £787 million in respect of fixed assets recognised at the half year. Exceptional depreciation also includes the write off of redundant fixed assets of £58 million. Tax credits of £48 million were available on £191 million of the impairment charge, which was disclosed in the 2002 Group Financial Statements. |
| | |
| (xi) | The Group has exited its US retail voice business, as announced on 15 May 2002. The exceptional costs associated with this amount to £288 million and include exit costs of £200 million, redundant fixed asset write downs of £57 million included in the exceptional depreciation charge and other write downs of £31 million. In addition, £84 million of accrued costs relating to disposals in previous years, principally the disposal of the consumer operations of Cable & Wireless Communications plc on 30 May 2000, have been released. |
| | |
| (xii) | The profit of £62 million on disposal of fixed assets principally comprises a £54 million gain on the sale of part of the Group’s interest in MobileOne (Asia) Pte Ltd. |
| |
| (xiii) | The current asset investments principally relating to PCCW Limited have been written down by £274 million to market value at 31 March 2003. |
| |
| 11 Net interest and other similar income/(charges) |
| |
| | 2005
£m
| | 2004
£m
| | 2003
£m
| |
| Interest receivable and similar income | | | | | | | | | |
| Deposits and short-term loan interest and similar income | | 103 | | | 108 | | | 198 | |
| Exchange losses on retranslation of foreign currency denominated loans and deposits | | — | | | (5 | ) | | (9 | ) |
| Dividends from fixed asset investments | | 4 | | | — | | | — | |
| |
| | | 107 | | | 103 | | | 189 | |
| |
| Interest payable and other similar charges | | | | | | | | | |
| Finance charges on leases | | — | | | (1 | ) | | (3 | ) |
| Bank loans and overdrafts | | (9 | ) | | (21 | ) | | (23 | ) |
| Other loans | | (61 | ) | | (63 | ) | | (62 | ) |
| Unwinding of discount in provisions | | (1 | ) | | (8 | ) | | (3 | ) |
| |
| | | (71 | ) | | (93 | ) | | (91 | ) |
| Less: Interest capitalised | | 2 | | | 3 | | | 5 | |
| |
| | | (69 | ) | | (90 | ) | | (86 | ) |
| |
| Net interest and other similar income | | 38 | | | 13 | | | 103 | |
| |
| | |
| Tax relief of £nil is available on interest capitalised in the year ended 31 March 2005 (2004 – £nil, 2003 – £nil). Interest has been capitalised at a rate of 6 per cent (2004 – 6 per cent, 2003 – 6 per cent). |
Back to Contents
12 Tax on profit/(loss) on ordinary activities |
| The charge for tax, based on the Group profit/(loss) for the year, comprises: |
| | |
| | 2005 | | 2004 | | 2003
| |
| |
| |
| |
| |
| United Kingdom | Taxation
before
exceptional
tax credit
£m | | Exceptional
tax credit
£m | | Total
£m | | £m | | £m | |
| Corporate tax at 30% (2004 – 30%, 2003 – 30%) | | | | | | | | | | | | | | | |
| Current | | 4 | | | — | | | 4 | | | 28 | | | 39 | |
| Double taxation relief | | (4 | ) | | — | | | (4 | ) | | (28 | ) | | (39 | ) |
| Deferred | | — | | | — | | | — | | | — | | | 1 | |
| Adjustments in respect of prior years | | | | | | | | | | | | | | | |
| – current | | — | | | — | | | — | | | (64 | ) | | (54 | ) |
| – deferred | | — | | | — | | | — | | | — | | | (7 | ) |
| |
| | | — | | | — | | | — | | | (64 | ) | | (60 | ) |
| Overseas | | | | | | | | | | | | | | | |
| Current | | 51 | | | — | | | 51 | | | 42 | | | 65 | |
| Deferred | | 8 | | | — | | | 8 | | | (60 | ) | | 26 | |
| Adjustments in respect of prior years | | | | | | | | | | | | | | | |
| – current | | (11 | ) | | (85 | ) | | (96 | ) | | 63 | | | 43 | |
| – deferred | | 16 | | | — | | | 16 | | | (3 | ) | | (51 | ) |
| |
| | | 64 | | | (85 | ) | | (21 | ) | | 42 | | | 83 | |
| Joint ventures and associates | | | | | | | | | | | | | | | |
| Joint ventures | | 7 | | | — | | | 7 | | | 10 | | | 13 | |
| |
| | | 7 | | | — | | | 7 | | | 10 | | | 13 | |
| |
| Tax on profit/(loss) on ordinary activities | | 71 | | | (85 | ) | | (14 | ) | | (12 | ) | | 36 | |
| |
| |
The Group’s effective tax rate varies from the statutory tax rate as a result of the following factors: |
| |
|---|
| | 2005 | | 2004 | | 2003 | |
|---|
|
| |
| |
| |
|---|
| Taxation
before
exceptional
tax credit
% | | Exceptional
tax
credit
% | | Total
% | | % | | % | |
|---|
| | | | | | |
|---|
| UK corporation tax rate | | 30.0 | | | — | | | 30.0 | | | 30.0 | | | 30.0 | |
| Income/expenses not taxable/allowable – permanent | | 18.1 | | | — | | | 18.1 | | | (16.9 | ) | | (12.9 | ) |
| Income/expenses not taxable/allowable – timing | | (26.3 | ) | | — | | | (26.3 | ) | | (25.2 | ) | | (17.4 | ) |
| Tax losses not utilised | | 1.9 | | | — | | | 1.9 | | | (27.6 | ) | | (6.6 | ) |
| Tax rate differences | | (5.6 | ) | | — | | | (5.6 | ) | | 13.1 | | | 5.7 | |
| Utilisation of tax losses brought forward | | (2.3 | ) | | — | | | (2.3 | ) | | 3.5 | | | — | |
| Adjustments to tax charge in respect of previous periods | | (2.9 | ) | | (23.4 | ) | | (26.3 | ) | | 0.4 | | | 0.2 | |
| |
|---|
| Effective current tax rate on ordinary activities | | 12.9 | | | (23.4 | ) | | (10.5 | ) | | (22.7 | ) | | (1.0 | ) |
| |
|---|
The exceptional tax credit of £85 million relates to the settlement and clarification of various long-standing overseas tax items at less than their expected cost.
| 13 Dividends |
| |
|---|
| 2005
£m | | 2004
£m | | 2003
£m | |
|---|
| | | | |
|---|
| Interim paid | | 27 | | | — | | | 37 | |
| Final proposed | | 60 | | | 73 | | | — | |
| |
| | | 87 | | | 73 | | | 37 | |
| |
The Cable & Wireless Employee Share Ownership Plan Trust waived its right to dividends on the shares held in the trust. During the year 14,076 of shareholders owning 105,537,992 of shares elected to take all or part of their dividends in shares (see Note 23).
Back to Contents
Notes to the financial statements
14 Earnings/(loss) per share
Basic earnings/(loss) per Ordinary Share is calculated by dividing the earnings attributable to ordinary shareholders by the weighted average number of Ordinary Shares in issue during the year, excluding those held in the employee share trust and Treasury shares (Note 24) which are treated as cancelled.
For diluted earnings per Ordinary Share, the weighted average number of Ordinary Shares in issue is adjusted to assume conversion of all dilutive potential Ordinary Shares. The Group has two classes of dilutive potential Ordinary Shares: certain of the share options granted to employees and the shares issuable on conversion of the Group’s convertible debt.
| The table below sets out the reconciliation of the earnings and weighted average number of shares used in the calculations: |
| |
|---|
| 2005
£m | | 2004
£m | | 2003
£m | |
|---|
| | | | |
|---|
| Profit/(loss) for the financial year attributable to shareholders | | 302 | | | (237 | ) | | (6,417 | ) |
| Effect of diluted securities | | | | | | | | | |
| Interest saved | | 8 | | | — | | | — | |
| |
|---|
| Adjusted profit/(loss) (diluted EPS) | | 310 | | | (237 | ) | | (6,417 | ) |
| |
|---|
| Basic weighted average number of shares | | 2,322,458,697 | | | 2,327,738,940 | | | 2,329,814,506 | |
| Effect of diluted securities | | | | | | | | | |
| Share options | | 27,511,135 | | | — | | | — | |
| Convertible loan note | | 177,733,748 | | | — | | | — | |
| |
|---|
| Diluted weighted average number of shares | | 2,527,703,580 | | | 2,327,738,940 | | | 2,329,814,506 | |
| |
|---|
| Basic earnings/(loss) per Ordinary Share | | 13.0 | p | | (10.2 | )p | | (275.4 | )p |
| |
|---|
| Diluted earnings/(loss) per Ordinary Share | | 12.3 | p | | (10.2 | )p | | (275.4 | )p |
| |
|---|
Basic and diluted loss per Ordinary Share are equal in periods where there is no impact of dilution on the loss for the financial year nor the weighted average number of shares.
| 15 Intangible fixed assets |
| |
| Negative
goodwill
£m | | Positive
goodwill
£m | | Licences
and other
intangibles
£m | | Total
£m | |
|---|
| Cost | | | | | | | | | | | | |
| At 1 April 2004 | | (14 | ) | | 3,889 | | | 9 | | | 3,884 | |
| Acquisitions | | — | | | 91 | | | 12 | | | 103 | |
| Disposals | | — | | | (276 | ) | | — | | | (276 | ) |
| Exchange adjustments | | — | | | 4 | | | — | | | 4 | |
| |
| At 31 March 2005 | | (14 | ) | | 3,708 | | | 21 | | | 3,715 | |
| |
| Amortisation | | | | | | | | | | | | |
| At 1 April 2004 | | 5 | | | (3,889 | ) | | (9 | ) | | (3,893 | ) |
| Disposals | | — | | | 276 | | | — | | | 276 | |
| Credit/(charge) for the year – amortisation | | 2 | | | (7 | ) | | (2 | ) | | (7 | ) |
| |
| At 31 March 2005 | | 7 | | | (3,620 | ) | | (11 | ) | | (3,624 | ) |
| |
| Net book value | | | | | | | | | | | | |
| At 31 March 2005 | | (7 | ) | | 88 | | | 10 | | | 91 | |
| |
| At 31 March 2004 | | (9 | ) | | — | | | — | | | (9 | ) |
| |
| | | | |
Negative goodwill is being amortised on a straight-line basis over five years. The goodwill arising on the acquisitions of Monaco Telecom and Bulldog (see Note 31) is being amortised on a straight-line basis over 18.6 and 5 years, respectively. These periods are the periods over which the Directors estimate that the values of the underlying businesses acquired are expected to exceed the value of the underlying assets.
Other intangible assets include intellectual property and international managed service contracts recognised in respect of the acquisition of XM Mobile B.V., and Monaco Telecom, respectively. These are being amortised on a straight-line basis over their useful economic lives (between 1 and 5 years).
Disposals relate to goodwill that arose on the acquisition of Cable & Wireless IDC Inc. This goodwill was fully impaired through the profit and loss account in prior years.
Back to Contents
| 16 Tangible fixed assets |
| |
| Group | | Company | |
|---|
|
| |
| |
|---|
| Land and |
|---|