Cable & Wireless Public Limited (CWP) Inactive
Filed: 28 Jul 05, 12:00am
As filed with the Securities and Exchange Commission on June 21, 2004
UNITED STATES
SECURITIES AND EXCHANGE COMMISSION
WASHINGTON, D.C. 20549
FORM 20-F/A
(amendment No. 1)
| (Mark One) | |
| REGISTRATION STATEMENT PURSUANT TO SECTION 12(b) OR (g) OF THE SECURITIES EXCHANGE ACT OF 1934 | |
| OR | |
 | ANNUAL REPORT PURSUANT TO SECTION 13 OR 15(d) OF THE SECURITIES EXCHANGE ACT OF 1934 |
| OR | |
| TRANSITION REPORT PURSUANT TO SECTION 13 OR 15(d) OF THE SECURITIES EXCHANGE ACT OF 1934 For the transition period from N/A to N/A |
Commission file number: 1-10309
CABLE AND WIRELESS PUBLIC LIMITED COMPANY
(Exact name of Registrant as specified in its charter)
ENGLAND AND WALES
(Jurisdiction of incorporation or organization)
124 Theobalds Road, London WC1X 8RX, United Kingdom
(Address of principal executive offices)
Securities registered or to be registered pursuant to Section 12(b) of the Act
| Title of each class | Name of each exchange on which registered |
| American Depositary Shares | New York Stock Exchange |
| Ordinary Shares of nominal value 25 pence each | New York Stock Exchange* |
Securities registered or to be registered pursuant to Section 12(g) of the Act.
None
(Title of Class)
Securities for which there is a reporting obligation pursuant to Section 15(d) of the Act.
None
(Title of Class)
Indicate the number of outstanding shares of each of the issuer’s classes of capital
or common stock as of the close of the period covered by the annual report.
2,385,467,990 Ordinary Shares of nominal value 25p each
Indicate by check mark whether the registrant (1) has filed all reports required to be filed by Section 13 or 15(d) of the Securities Exchange Act of 1934 during the preceding 12 months (or for such shorter period that the registrant was required to file such reports), and (2) has been subject to such filing requirements for the past 90 days.
Yes ![]() No
No ![]()
Indicate by check mark which financial statement item the registrant has elected to follow:
Item 17 ![]() Item 18
Item 18 ![]()
C&W regularly evaluates the effectiveness of its internal controls over financial reporting and disclosure controls and procedures, including in connection with the filing of, and certification with respect to, its annual report and Form 20-F. Through an ongoing programme of review, C&W identified certain corrections to the reported US GAAP reconciliation of its 2004 and 2003 financial results. Although the Company believes that these adjustments are not material to the 2004 results, the Company has nevertheless determined that it would be appropriate to take account of these corrections in connection with re-filing the 2004 20-F. The adjustments, and changes in respect of clarification of disclosures, made in the US GAAP reconciliation footnote to the financial statements are the only changes made to the amended Form 20-F filed on January 18, 2005. Since filing its annual report on Form 20-F on June 21, 2004, Cable and Wireless plc has filed additional information about the Company and its more recent results of operations on Form 6-K.
C&W has already taken measures in connection with its internal controls and disclosure controls and procedures as it has deemed appropriate to enhance its controls and to address any deficiencies and weaknesses that have been identified. Among other things, C&W has enhanced its controls by including additional US GAAP resources in the preparation of its US GAAP reconciliation, in both the Group’s business units and also in the central external financial reporting team. Management believes that these improvements help to enhance controls over financial reporting and disclosure.
This report (“Annual Report”) comprises the annual report of Cable and Wireless plc in accordance with United Kingdom requirements and, in substantial part, its annual report on Form 20-F in accordance with the requirements of the United States Securities and Exchange Commission (“SEC”). The Annual Review 2004 is published as a separate document.
In this report references to the ‘Company’ are to Cable and Wireless plc, and references to the ‘Group’, ‘Cable & Wireless Group’ and ‘Cable & Wireless’ are to the Company, its consolidated subsidiaries and associated companies and joint ventures unless the context otherwise requires. References to ‘Cable & Wireless Group Companies’ are to any companies within the Cable & Wireless Group.
Cable & Wireless prepares its financial information in accordance with UK Generally Accepted Accounting Principles (“UK GAAP”). Unless otherwise indicated, any reference in this report to Financial Statements is to the Financial Statements of Cable & Wireless (including the Notes to the Financial Statements) included in this report. UK GAAP differs from generally accepted accounting principles in the United States (“US GAAP”). The material differences between UK GAAP and US GAAP relevant to Cable & Wireless are explained on pages 141 to 149.
Cable & Wireless publishes its Financial Statements in pounds sterling (“£”). On 31 March 2004, the noon buying rate in New York City for cable transfers in pounds sterling as certified for customs purposes by the Federal Reserve Bank of New York was US $1.84 = £1. On 1 June 2004 the noon buying rate was US$1.84 = £1. For additional information on exchange rates between pounds sterling and the US dollar see exchange rates on page 152.
References to a year in this report are, unless otherwise indicated, references to the Company’s financial year ending 31 March of such year. In this report, financial and statistical information is, unless otherwise indicated, stated on the basis of the Company’s financial year.
This document is dated 21 June 2004 including the Legal Proceedings section at pages 18 to 21. Note 30 to the Financial Statements for the year ended 31 March 2004 discusses legal proceedings also but has not been updated to reflect most recent developments given that the Financial Statements are dated 1 June 2004.
cautionary statement regarding forward-looking statements
CAUTIONARY STATEMENT REGARDING FORWARD-LOOKING STATEMENTS
This Annual Report contains certain forward-looking statements with respect to the financial condition, results of operation and business of Cable & Wireless.
Statements that are not historical facts, including statements about Cable & Wireless’ beliefs and expectations, are forward-looking statements. Words such as ‘believes’, ‘anticipates’, ‘expects’, ‘intends’ and ‘plans’ and similar expressions are intended to identify forward- looking statements, but are not the exclusive means of identifying such statements. These statements are based on current plans, estimates and projections and, therefore, undue reliance should not be placed on them. Forward-looking statements speak only as of the date they are made, and you should not assume that they have been revised or updated in the light of new information or future events.
Written and/or oral forward-looking statements may also be made in, amongst others, the periodic reports to the Securities and Exchange Commission on Forms 6-K, summary financial statements to shareholders, proxy statements, offering circulars and prospectuses, press releases and other written materials and in oral statements made by Cable & Wireless’ Directors, officers or employees to third parties, including financial analysts.
Forward-looking statements involve inherent risks and uncertainties. Cable & Wireless cautions investors that a number of factors could cause actual results to differ, in some instances materially, from those anticipated or implied in any forward-looking statement. These factors include:
Risks specific to Cable & Wireless’ business |
| • | failure to improve the performance and financial position of the Group successfully or to adapt as needed to changing market conditions could adversely affect the Group’s business, results of operations and potential for growth; |
| • | transformation initiatives can lead to execution risk; |
| • | US exit; |
| • | the Group may not be able to adapt adequately to technological changes in communication and information technology; |
| • | the Group’s results depend on the introduction of appropriate new products and services as the industry undergoes rapid changes; |
| • | network failure may expose the Group to potential liability or loss of customers; |
| • | dependency on key personnel and skills; |
| • | the Group is reliant on third parties for certain activities under outsourcing contracts; failure of those third parties to provide the contracted services may expose the Group to additional cost and liability; |
| • | the Group is dependent on a number of critical IT systems to be able to conduct its business and process financial information; |
Regulatory risk |
| • | Cable & Wireless’ business may be materially adversely affected by changes in regulation and government policy in the countries in which it operates; |
| • | exposure to other telecommunications operators and the behaviour of other market participants may have a detrimental effect on the Group’s operations; |
| • | the Group may lose revenue if unlicensed operators are able to gain access to the Group’s network; |
Risks specific to the telecommunications industry |
| • | the Group’s business may be affected by a business downturn; |
| • | generally unfavourable telecommunications market conditions may adversely affect the Group’s financial condition and results of operations; |
| • | the Group’s operations could suffer from adverse effects of competition and price pressures on the demand for products and services; |
| • | competitors of Cable & Wireless may gain competitive advantage by successfully completing a restructuring or bankruptcy reorganisation process; |
| • | continued overcapacity and other factors could lead to lower prices for the Group’s products and services; |
Legal and other |
| • | the Group may not have or be unable to obtain sufficient insurance to cover all foreseeable risks; |
| • | the historic activities of the Group’s insurance subsidiary may result in material claims; |
| • | volatility in the financial markets may require the Group to provide further cash funding to its pension funds; |
| • | fluctuations in currency exchange rates may adversely affect the Group’s reported results and financial condition; |
| • | class actions may adversely impact the Group’s financial condition; and |
| • | mobile communications devices may pose health risks. |
Trends and factors that are expected to particularly affect Cable & Wireless’ results are discussed in more detail elsewhere in this Annual Report, including, without limitation, in the Business Description and the Operating and Financial Review.
corporate overview
CONTENTS
| 4 | ||
| 6 | ||
| 8 | ||
| 14 | ||
| 17 | ||
| 18 | ||
| 22 | ||
| 24 | ||
| 32 | ||
| 38 | ||
| 41 | ||
| 41 | ||
| 43 | ||
| 44 | ||
| 46 | ||
| 47 | ||
| 53 | ||
| 57 | ||
| 59 | ||
| 66 | ||
| 81 | ||
| 82 | ||
| 84 | ||
| 87 | ||
| 88 | ||
| 89 | ||
| 90 | ||
| 91 | ||
| 92 | ||
| 97 | ||
| 150 | ||
| 151 | ||
| 152 | ||
| 152 | ||
| 153 | ||
| 155 | ||
| 155 | ||
| 156 | ||
| 158 | ||
| Inside back cover | ||
| – Registrar | ||
| – Scrip dividend scheme/dividend reinvestment plan | ||
| – Financial calendar | ||
| – ShareGIFT | ||
| – Company Secretary and registered office | ||
| – American Depositary Receipts | ||
| – Global Invest Direct facility | ||
| – Investor relations |
corporate overview
The telecommunications industry continues to face challenging market conditions. Revenues from traditional voice services continue their gradual decline in favour of a variety of mobile and IP services. Trends indicate that increased volumes of voice and data traffic will be carried over IP networks and, while traditional voice will continue to be important, reduced demand will keep margins under pressure. As the telecommunications landscape evolves it will be those providers that can address the needs of customers in their migration to new low-cost, more flexible IP based solutions that will prosper.
In the past year, significant restructuring has been initiated in line with the priorities set by management in June 2003. The first step in this process was to re-organise the Group on a geographic basis, enabling management to examine the market dynamics and regulatory environment faced by each business unit. The objective was to begin to stabilise operations by introducing new management, reducing costs, controlling cash and, most importantly, addressing customer needs.
National Telcos |
Liberalisation progressed in most markets in which the Group operates, leading to greater competitive pressure for most National Telco businesses. In response, the Group is developing operating priorities to limit margin erosion and maximise cash flow. In the Caribbean, where liberalisation is advanced, senior management have increased their involvement in the businesses to ensure better co-ordination and accountability. The regional management structure was delayered and a local Head of Operations for the Caribbean was appointed. Initiatives were also undertaken to address the growth in demand for mobile services through an accelerated roll out of the GSM network and a refocusing of sales and marketing programmes to serve the most attractive customer segments. Across all National Telcos, common metrics are being introduced to measure and drive performance and to facilitate the transfer of skills and experience between business units.
In June 2004, Cable & Wireless acquired a controlling stake in Monaco Telecom from Vivendi Universal. Monaco Telecom has the exclusive licence to provide fixed line, mobile, internet access and cable services in Monaco until at least 2014.
UK Business |
In June 2003, management outlined a three-year transformation plan for the UK business. The objective in year one was to stabilise operations by reducing capital expenditure and operating costs, introducing new skills and
redesigning systems and processes. The benefits of the initiatives taken in these areas are reflected in the financial performance of the UK business this year. The business achieved stable revenues after several years of decline and tightened control of capital expenditure, which together have led to the generation of a pre- exceptional operating profit and of break-even cash flow.
The UK business has been restructured around three customer segments, Enterprise, Business and Carrier Services. Enterprise customers are estimated to comprise the top 550 businesses and institutions that together represent 50 per cent of the UK’s annual telecommunications business market. Products and services based on internet protocol (IP) are increasingly critical to this segment.
In the UK the majority of data traffic has yet to migrate to IP and this presents an important opportunity. Cable & Wireless has an established position in this segment. Its strength in voice services, its IP backbone, skills and experience enable it to partner Enterprise customers beginning their migration to new IP services.
An estimated 400,000 Business customers represent the remaining 50 per cent of the annual telecommunications business revenue in the UK. Cable & Wireless serves between 10 and 15 per cent of these customers and has renewed its focus on this segment. Business customers require cost effective voice services and, until recently, made limited use of data. However, the acceleration of broadband penetration in the UK has the potential to change the economics of access for Business customers, providing high-quality, low-cost voice and data applications on a single platform. Cable & Wireless’ acquisition of Bulldog Communications in May 2004 strengthens its opportunities to meet the growing demand for broadband access. In addition, the changes to the regulation of local loop unbundling have the potential to reduce the cost of access and increase penetration.
The Carrier Services segment, which generates close to 50 per cent of revenues in the UK business, was also important to the stabilisation of the UK business during the year as it enabled the business to utilise available network capacity for short-term wholesale contracts. Continued opportunities in this segment are offered by new entrants to consumer telecommunications using carrier pre-select services, the growth in demand for mobile services and the increasing demand for IP and broadband.
Europe and Japan |
In continental Europe, the Group primarily provides services to other licensed telecommunications operators and to
corporate overview
multinational corporations some of which are headquartered in the UK.
Cable & Wireless IDC provides international voice and data services to companies in Japan and South East Asia. The markets in which it operates are dominated by Nippon Telegraph and Telephone Corporation.
Both operations have achieved significant cost reductions during the year and cost containment will continue to be an area of focus.
The Group continues to face challenges in implementing its strategic initiatives including those linked to the rapid changes in the telecommunications industry, global economic conditions and the markets in which the Group operates. The Group remains committed to capitalising on its core skills and its key customers. Please see ‘Risk Factors’ for further commentary on certain of the challenges facing the Group.
business description
BUSINESS DESCRIPTION
This section contains:
| SUMMARY |
Cable & Wireless is an international telecommunications business with annual revenue of £3.7 billion in the year to 31 March 2004, of which £3.4 billion related to continuing operations, and customers in some 80 countries. Headquartered in London, Cable & Wireless’ principal operations are in the United Kingdom, Europe, the Caribbean, Panama, Macau and Japan. Cable & Wireless provides voice, data and IP services to business and residential customers and wholesale services to carriers, mobile operators and content, application and internet providers.
History
For over 120 years, Cable & Wireless has provided telecommunications services, networks and equipment to business and residential customers around the world. Except for some 30 years as a state-owned company after the Second World War, Cable & Wireless has been a publicly owned limited company since its earliest days.
In the United Kingdom, Cable & Wireless, through Mercury Communications, was an early competitor in the liberalised telecommunications market. In April 1997, Cable & Wireless Communications plc (“CWC”) was formed by the merger of Mercury Communications with Nynex CableComms, Bell Cablemedia and Videotron.
In September 1998, Cable & Wireless acquired MCI Telecommunication Corporation’s internet business in the United States and worldwide. In June 1999, Cable & Wireless acquired International Digital Communications Inc. (now re-named Cable & Wireless IDC Inc.), one of Japan’s international telecommunications carriers.
In October 1999, Cable & Wireless completed the sale of its interest in One2One, its UK mobile phone business, to Deutsche Telekom. One2One was a joint venture with MediaOne Group Inc and the joint venture partners received £6.9 billion in cash.
In May 2000, Cable & Wireless took full ownership of the corporate, business, IP and wholesale operations of CWC (CWC DataCo), while the consumer telephone, internet and cable TV operations (CWC ConsumerCo) were acquired by ntl Incorporated.
In August 2000, Cable & Wireless disposed of its interest in Cable & Wireless HKT Limited (based in Hong Kong) to a subsidiary of PCCW Limited. Cable & Wireless received cash and shares in PCCW equivalent to an interest of approximately 20 per cent in the enlarged company. The PCCW shares were subsequently sold by Cable & Wireless in September 2000 and June 2003 for a total consideration of approximately £1,160 million.
In September 2001, Cable & Wireless disposed of its interest in Cable & Wireless Optus Limited (based in Australia) to a subsidiary of Singapore Telecommunications Limited (SingTel). Cable & Wireless received cash and SingTel shares and bonds, which were subsequently sold.
The web services and hosting businesses, Digital Island, Inc. and selected assets and the majority of business activities of EXDS, Inc (formerly Exodus Communications, Inc) were acquired in 2002.
Recent acquisitions and disposals |
In June 2003, Cable & Wireless announced that it planned to withdraw from the US domestic market. On 8 December 2003, Cable & Wireless USA, Inc. and Cable & Wireless Internet Services, Inc. (together, with certain of their affiliates, referred to as “Cable & Wireless America” or “CWA”) entered into an agreement with an affiliate of Gores Technologies LLC (“Gores”) to sell substantially all of the assets of CWA for a sum of US$125 million, subject to higher and better offers pursuant to a court-supervised competitive auction conducted under Section 363 of the US Bankruptcy Code. On that date, and at the request of Gores, CWA filed for Chapter 11 bankruptcy protection under the US Bankruptcy Code.
As a result of the subsequent auction process, on 23 January 2004, SAVVIS Communications Corporation (“SAVVIS”) entered into an agreement with CWA for SAVVIS to acquire substantially all of the assets of CWA for a sum of US$155 million in cash and approximately US$12.4 million of assumed liabilities. The contract contained certain conditions of a standard nature, including regulatory approvals. All of the conditions to the sale were satisfied and completion of the sale was announced on 8 March 2004.
Page 6
business description
Cable & Wireless understands that the proceeds of the sale will be applied to satisfy outstanding liabilities of CWA and the remaining assets of CWA will be wound down by the CWA estate.
The CWA estate is responsible for dealing with creditors and related aspects of the Chapter 11 process. The CWA estate has filed a Plan of Liquidation and associated documents with the US Bankruptcy Court. The Plan, which is supported by the CWA Creditors’ Committee and by Cable and Wireless plc, is subject to approval by relevant classes of creditors and the US Bankruptcy Court in due course. Copies of the Plan are publicly available. If the Plan is approved, among other things:
| • | certain classes of creditors will receive a monetary return from the estate; |
| • | any claims which creditors have against the estate will be released; |
| • | claims of Cable and Wireless plc and its non-bankrupt affiliates against the CWA estate will be settled and potential claims of the CWA estate against Cable and Wireless plc and such affiliates will be released; and |
| • | all shares held in CWA (including those held by Cable & Wireless affiliates) will be cancelled. |
As of 8 December 2003 the CWA entities were deconsolidated from the Group. These entities have separate boards and are no longer subject to Cable & Wireless Group operating requirements. CWA is subject to the jurisdiction of the US Bankruptcy Court. Accordingly, apart from certain financial discussions, references to CWA in this document are limited.
In order to provide US connectivity for data and IP services to Cable & Wireless’ multinational customers based in the United Kingdom and other regions, Cable & Wireless continues to operate in the United States.
The licences held by TeleYemen, Cable & Wireless’ subsidiary in Yemen, expired on 31 December 2003 and the Group ceased operations in Yemen from that date.
In addition, during 2004 the Group disposed of certain domestic businesses in Sweden, Belgium, the Netherlands, Italy, Switzerland, France and Germany and the domestic data business in Russia.
On 28 May 2004, Cable & Wireless announced the purchase of the share capital of Bulldog Communications Limited (“Bulldog”), a UK company specialising in the provision of broadband services, for a sum of £18.6 million. Bulldog offers a wide range of high-speed broadband services using digital subscriber line technology, both on the basis of BT
wholesale tariffs and, increasingly, as a principal, having installed its own equipment in 38 BT exchanges in central London under Local Loop Unbundling regulation.
On 2 June 2004 Cable and Wireless announced the purchase of a 55 per cent stake in Monaco Telecom S.A (“Monaco Telecom”) from Vivendi Universal for a total consideration of Euro 162 million, through the acquisition of 100 per cent of the issued share capital of Compagnie Monegasque de Communication.
The transaction was completed on 18 June 2004.
On completion, Cable & Wireless transferred a 6 per cent stake in Monaco Telecom to Compagnie Monégasque de Banque S.A.M (“CMB”) for consideration of Euro 18 million. CMB is Cable & Wireless’ financial partner in Monaco Telecom and its 6 per cent stake is subject to certain put and call agreements with Cable & Wireless. Cable & Wireless has full management control of Monaco Telecom.
Cable & Wireless has entered into a shareholders’ agreement with the Principality, which contains, among other provisions, a prohibition on either Cable & Wireless or the Principality (subject to certain limited exceptions) selling their shares in Monaco Telecom for 5 years, mutual pre-emption rights on the transfer of shares and certain other limited rights in favour of the Principality. The Principality also has a put option entitling it to put its 45 per cent shareholding in Monaco Telecom at certain times after 1 January 2008. The exercise price under the put option is fair market value, taking into account the nature of the minority stake in Monaco Telecom.
Monaco Telecom is an integrated telecommunications operator created in 1997 following the privatisation of the Principality’s incumbent public telecommunications operator. Monaco Telecom has a licence to provide public telecommunications services throughout Monaco, with exclusive rights to provide fixed line, mobile, internet access, and cable services in Monaco until at least 2014. Internationally, Monaco Telecom has operated a mobile network in Kosovo since 2000, under a management contract and at the beginning of 2003 it was awarded the second GSM licence in Afghanistan as the strategic partner in a consortium 51 per cent owned by the Aga Khan Fund for Economic Development.
For the year ended 31 December 2003, Monaco Telecom reported consolidated turnover of Euro 172 million, net profit of Euro 18 million, and had Euro 74 million of net assets at that date which included Euro 73 million of cash.
Page 7
business description
Capital expenditure |
Capital expenditure on plant, equipment and property totalled £0.3 billion in 2004 compared with £0.8 billion in 2003 and £1.9 billion in 2002.
Cable & Wireless’ capital expenditure in 2004 included the following third party investments:
| • | network build, totalling £70 million, mainly relating to international and pan-regional capacity as well as the UK network; |
| • | the continued rollout out of the GSM mobile network primarily in the Caribbean and Panama and upgrades to existing networks, totalling £120 million; |
| • | information technology (“IT”), totalling £79 million, including expenditure on billing systems, network management systems, and IT support for capital projects; and |
| • | network terminating equipment and customer premises equipment totalling £72 million. |
The above numbers include working capital allocations.
| BUSINESS OVERVIEW |
Products and services |
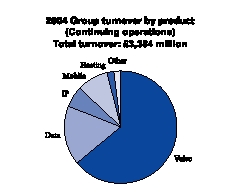
Cable & Wireless provides a variety of services including voice, data, IP and mobile to its customers through its national and international operations.
Voice |
Cable & Wireless offers domestic and international voice services via switched and dedicated facilities to residential, business, corporate and multinational customers.
Through its Carrier Services operations, Cable & Wireless provides wholesale services and interconnect to mobile operators and carriers with customers including incumbent former monopolies, mobile operators and regional telecommunications companies and service providers.
Cable & Wireless offers mobile voice and messaging services, principally using GSM (Global System for Mobile Communications) and TDMA (Time Division Multiple Access) technology. As at 31 March 2004, Cable & Wireless subsidiaries, branches and associates provided mobile telecommunications services to 3.1 million customers around the world, of which some one million relates to associate companies.
In countries where Cable & Wireless is the local incumbent operator, such as the Caribbean, Panama and Macau, customers are typically served through Cable & Wireless’
own fixed line and mobile network facilities. In other regions, customers are primarily connected to the Cable & Wireless network via third party local loops and leased line facilities or directly via fibre or microwave links.
Data |
Cable & Wireless has a portfolio of data services including traditional data transport services (frame relay) and national and international switched and dedicated services based on ATM (Asynchronous Transfer Mode, a high speed digital transmission technology).
IP |
Cable & Wireless focuses on three IP product sets: IP communications that enable customers to migrate from traditional telecommunications services to IP services with improved functionality; access solutions; and transit to IP networks and the internet. Access solutions include value-added security services such as managed firewalls, intrusion detection and response, scanning and analysis (such as email virus protection) and authentication and encryption services.
Cable & Wireless’ IP-VPN QoS solution delivers these products through a multi protocol switching based IP solution which creates virtual private networks and allows customers to prioritise traffic to best fit their business needs. IP-VPN QoS delivers a secure intranet environment over which voice, video, data and other traffic can flow and can incorporate business partners and remote workers as well as the customers’ own sites.
In the Caribbean, Panama, Macau and Rest of the World, Cable & Wireless also provides residential and business customers with dial-up IP and other internet services, including broadband ADSL (Asymmetrical Digital Subscriber Line) solutions.
Page 8
business description
Geographic operations |
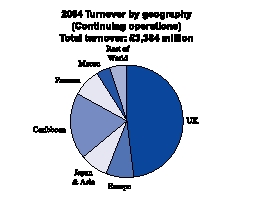
Cable & Wireless’ principal operations are in the United Kingdom, Europe, the Caribbean, Japan, Panama and Macau. Rest of the World comprises the Group’s operations in Guernsey, Bahrain and the Maldives, together with smaller operations in the Seychelles, Bermuda, Sakhalin in Russia, Diego Garcia, Falkland Islands, Fiji, Ascension, St Helena, Vanuatu and the Solomon Islands.
Cable & Wireless provides voice, data and IP services to large corporate customers, business and residential customers. In addition, the United Kingdom, the Caribbean, Panama and Macau provide specialist wholesale services to carriers, mobile operators and content, application and internet providers.
For a discussion of Cable & Wireless’ revenue by geographic market for the past three years, see Operating and Financial Review – Group Turnover.
United Kingdom |
Overview |
The UK telecommunications market is mature with a considerable number of competitors, significant network capacity and competitive pricing. In the United Kingdom, Cable & Wireless is the largest fixed line telecommunications services provider after BT.
The UK business provides a full range of services to businesses, from international and domestic voice, data and IP services to complex web hosting solutions and professional services.
Significant progress has been made in transforming the UK business with the exit or sale of 34 properties, the insourcing of some IT activities and an overall headcount reduction of approximately 1,280, net of recruitment activities to enhance the skill mix of the business. With the cash position of the business stabilised and the asset base realigned, future capital expenditure will be focused on the delivery of new capabilities and system improvements.
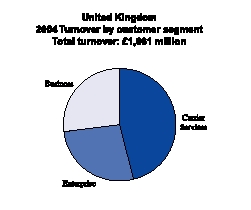
Enterprise (Revenue £453 million) |
Enterprise generates approximately 27 per cent of the UK business’ revenues. This segment comprises large national and international businesses which purchase telecommunications services in the business’ territories. In the UK market, Enterprise customers represent 50 per cent of the telecommunications market spend from businesses with more than five employees. Companies in this segment buy telecommunications services from a variety of suppliers, although many have a longer-term relationship with a primary supplier.
The UK business has a number two position in the enterprise segment in the UK market. For approximately 50 enterprises, Cable & Wireless UK supplies over half of their requirements and is the main partner in developing and managing their telecommunication networks. For other enterprise customers in the UK market, Cable & Wireless is typically the second provider of voice based services.
Cable & Wireless’ objective in the enterprise market is to become the partner of choice for more companies as they transition from legacy voice to IP. Cable & Wireless believes that this will lead to a gradual shift in the revenue mix away from switched voice. However, switched voice will continue to generate the majority of revenues in the shorter term.
A key step in achieving this objective was the creation of a separate professional services division in April 2004. Cable & Wireless’ professional services offering includes consultancy, project management and a portfolio of managed services for a broad range of customers which builds on component products such as Home and Remote Working, Customer Interaction Management Services (Call Centres), Business Continuity and Security Services.
The professional services division includes the UK Infrastructure services group which provides a single source for hardware installation and the maintenance of voice, data and cabling systems, together with systems development and
Page 9
business description
integration services for information and communications technologies.
Business (Revenue £445 million) |
Services to Business customers generated some 27 per cent of the UK revenues. Cable & Wireless provides both voice and data services to the business segment, with voice representing over 80 per cent of total Business revenues. However, customers are increasingly beginning to purchase voice and data as a bundled service to simplify the purchasing process. There is rapid growth in demand for new services including:
| • | the replacement of leased lines with ADSL and symmetric digital subscriber lines; |
| • | combination of voice and data on a single network; and |
| • | increased bandwidth. |
Carrier Services (Revenue £763 million) |
Carrier Services generate approximately half of Cable & Wireless UK business’ revenue. This market is highly competitive.
The UK Carrier Services’ operations serve customers in three main segments:
| • | large international telecommunications companies, mainly focused on long distance international voice; |
| • | national mobile operators, buying international voice and transport/backbone services, which are one of the fastest growing sectors in the United Kingdom; there is also small but increasing demand from the mobile operators for new data services such as Roaming for data, GSM, short messaging services (“SMS”) and multimedia messaging services; and |
| • | regional and domestic operators, including resellers and ISPs. |
Carrier Services also provide carrier pre-select services (a method of indirect voice access) to UK providers who resell telecommunication services under their own brands to residential customers. This enables UK residential consumers to select an alternative operator to BT for their voice calls in advance, without having to dial additional codes or programming on-site equipment.
US network |
Cable & Wireless continues to operate in the US market through a small, predominantly international network. The business provides US connectivity for data and IP services to Cable & Wireless’ multinational customers based in other regions; primarily those served by the United Kingdom and Japan.
Europe |
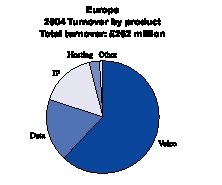
The principal operations in continental Europe are in Germany, France, Spain and Italy, together with smaller operations in Russia, Belgium, the Netherlands, Switzerland and Sweden.
The continental European telecommunications market comprises EU countries which are mature and fully liberalised; mature and competitive non-EU markets; and the liberalising markets of Eastern Europe.
During the last 12 months the continental European operations have been refocused on Enterprise customers and the existing wholesale business. Cable & Wireless Europe has withdrawn from the provision of IP and data connectivity services to small and medium sized business customers. In Spain, Cable & Wireless has retained its network integration business, which operates across all segments of the Spanish market.
The continental European reorganisation has resulted in a reduction in the European network coverage, a reduction in work force from 1,136 to 519 employees and a reduction in customers from 29,000 to fewer than 1,000.
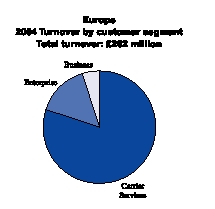
Carrier Services (Revenue £208 million) |
Carrier Services’ revenues represent over three-quarters of revenue in continental Europe. The main Carrier Services’ customers are mobile operators and telecommunications operators.
Page 10
business description
Caribbean |
![]()
Cable & Wireless operates in 16 Caribbean countries. The following statements apply to these countries unless otherwise stated. The principal businesses are in Jamaica (82 per cent owned), Barbados (81 per cent owned), the Cayman Islands (100 per cent owned) and Trinidad and Tobago (49 per cent owned).
In nearly all of the Caribbean countries in which it operates, Cable & Wireless is the incumbent, fixed and mobile operator providing some or all of the domestic and international telecommunications services.
In the Caribbean countries where Cable & Wireless’ subsidiaries and branches provide domestic telephone services, the number of telephone lines in service totalled approximately 830,000 at 31 March 2004, an overall decrease of approximately 30,000 in the year. During the same period, Cable & Wireless’ mobile subscribers of these territories increased from 943,000 to 1,141,000.
Cable & Wireless has mobile licenses in all of its Caribbean countries with the exception of the British Virgin Islands, Guadaloupe and Martinique. The Caribbean operations provide a range of mobile services, including pre- and post-paid services, SMS and international inbound and outbound roaming.
Cable & Wireless has accelerated its investment in a new GSM network in the Caribbean. At 31 March 2004 GSM services had been launched commercially in Jamaica, Barbados, the Cayman Islands, St Lucia, Grenada, Dominica and St Vincent.
At 31 March 2004, there were over 500 base stations with land mass coverage typically ranging from 60 per cent to 90 per cent. GSM technology provides higher transmission speeds enabling Cable & Wireless to offer new mobile services including internet access, multimedia messaging and E-banking.
The Caribbean operations also provide a full range of internet services to customers, including dial-up, directconnect, web hosting, web-site design and ADSL services which provide broadband access.
As at 31 March 2004 a significant proportion of Caribbean revenues were exposed to competition with most markets in which Cable & Wireless operates fully liberalised. Others are in transition from monopoly environments to competitive markets. Cable & Wireless is engaged in dialogue with those host governments to provide for an orderly liberalisation.
The table below shows the dates of market liberalisation for the principal Caribbean operations.
Country | National | International | Mobile | Data & Internet | |||||||||
| Jamaica | Sep-01 | Mar-03 | Mar-00 | Mar-00 | |||||||||
| Barbados | Nov-03 | See Note 1 | Aug-03 | Long standing | |||||||||
| Trinidad and Tobago | See Note 2 | See Note 2 | See Note 2 | Long standing | |||||||||
| Cayman | July-03 | April-04 | Feb-04 | Nov-03 | |||||||||
| Note 1: Under discussion with the Government of Barbados and the Government of Barbados has expressed its intention to introduce competition in international services in July 2004. |
| Note 2: In Trinidad and Tobago the Government is in the process of finalising the passage of the Telecommunications Act 2001. Thereafter, management believes that the mobile market will be liberalised within one year, with national and international market sectors to follow, although no timetable has yet been announced. |
Jamaica |
Jamaica is the largest of the Caribbean operations generating 38 per cent of the Caribbean’s revenue in 2004. Cable & Wireless holds an 82 per cent interest in Cable & Wireless Jamaica Limited, the largest provider of telecommunications services in Jamaica.
Cable & Wireless Jamaica provides domestic and international fixed line, internet, data and mobile telecommunication services to residential and business customers. In additon to Cable & Wireless Jamaica, there are currently two active competitors in the mobile sector (with a third licence recently announced), ten active “ISPs” (out of a total of 64 licensed parties), 27 licensed data service providers and one competitor in the domestic fixed line sector, as well as a number of resellers. The international carrier market has been liberalised since March 2003 and now comprises 59 licensed carriers, of which 14 are active and interconnect with Cable & Wireless Jamaica.
Barbados |
Cable & Wireless (Barbados) Limited is 81 per cent owned by Cable & Wireless and provides domestic and international fixed line, internet, data and mobile telecommunications services to residential and business customers.
Page 11
business description
Three mobile licences have been issued to competitors in Barbados and two of these competitors launched services in February 2004. Four ISPs offer internet services to end customers over Cable & Wireless’ network. The domestic telecommunications market is now fully liberalised. The introduction of competition in international services is currently under discussion with the Government which has expressed its intention to introduce such competition in July 2004.
Cayman Islands |
Cable and Wireless (Cayman Islands) Limited provides domestic, international, internet, data and mobile services to residential and business customers in the Cayman Islands. In July 2003, the Government of the Cayman Islands and Cable & Wireless agreed terms under which Cable & Wireless would surrender its exclusivity. The market is now fully liberalised. At 31 March 2004, 20 new entrants had been licensed in various telecommunications, broadcasting and other communication market sectors.
Trinidad and Tobago |
In Trinidad and Tobago Cable & Wireless operates through its 49 per cent owned joint venture, Telecommunications Services of Trinidad and Tobago Limited (“TSTT”). The controlling 51 per cent shareholding is owned by National Enterprises Limited, a public company with majority state ownership. TSTT provides domestic and international fixed line, internet, data and mobile telecommunications services to residential and business customers. TSTT contributed 21 per cent of the Caribbean’s operating profit in 2004.
Japan and Asia |

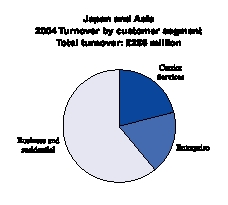
Overview |
The Japan division comprises Cable & Wireless’ operations in Japan and Asia, excluding Macau. Japan accounts for over 88 per cent of the division’s revenue.
Business and residential (Revenue £174 million) |
Cable & Wireless IDC Inc. sells voice, data, IP and hosting products to the small and medium sized business market in Japan through its own sales force and also through a variety of agents and partners. Smaller business customers and residential customers are served mainly through indirect channels and resellers. Cable & Wireless IDC Inc. had 75,000 residential and 22,000 business customers as at
31 March 2004.
Carrier Services (Revenue £60 million) |
Cable & Wireless’ operations in Japan and Asia sell voice, IP and data products to other operators and ISPs.
Enterprise (Revenue £52 million) |
Cable & Wireless IDC Inc., together with operations in Hong Kong, Singapore, Australia and India provide corporate enterprises with international networking services. In addition, these operations offer full design and management services for a variety of IP based solutions.
Page 12
business description
Panama |
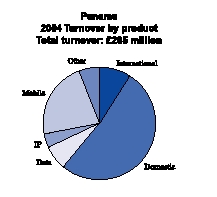
Cable & Wireless owns a 49 per cent interest in, has management control of and consequently consolidates, the largest telecommunications company in Panama, Cable & Wireless Panama S.A. The Panamanian Government holds 49 per cent of the shares while the remaining two per cent are held by the company’s employees through a trust fund.
As at 31 March 2004, some 50 competitors had over 100 licences to offer basic voice telephony services. Cable & Wireless Panama is in the process of negotiating interconnection agreements with several of these operators. At 31 March 2004, competition in fixed line services was largely confined to international and national long-distance services.
Cable & Wireless has one direct mobile competitor in Panama. Current regulations provide for a duopoly within mobile until 2007.
Cable & Wireless Panama provides a full range of internet services to customers, including dial-up, web hosting, web-site design and broadband access. The internet sector has been competitive for many years and at 31 March 2004 there were some 13 internet access providers and 130 internet/web related service competitors in the sector.
Macau |
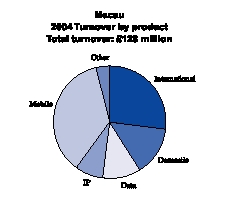
In Macau, Cable & Wireless’ subsidiary is Companhia de Telecomunicações de Macau S.A.R.L. (“CTM”). CTM is managed and 51 per cent owned by Cable & Wireless. The other shareholders of CTM are Portugal Telecom Group, 28 per cent, CITIC Pacific Limited, 20 per cent, and Direcção dos Serviços de Correios de Macau, one per cent.
In Macau, CTM is the domestic incumbent offering a full range of international and domestic, fixed, internet, data and mobile services.
CTM owns and operates fully digital domestic fixed line networks and international interconnect facilities via microwave, satellite systems and international submarine and land cables. CTM has exclusive rights to operate local and international fixed telecommunications services within, to and from Macau until the end of 2011 when the asset may revert to the Macau Government at zero value. The exclusivity is to be reviewed by the Macau Government and CTM in 2006 and its conditions may be changed subject to agreement. The Macau Government has the right to redeem the concession in 2006 with one year prior notice subject to compensation as set out in the relevant Concession Agreement. In 2003, the government enacted the External Facilities Act, which provides for competition in leased lines and transit services. As at 1 June 2004, no licence had been issued under the Act.
CTM operates a GSM mobile network. The mobile market was liberalised in 2001 and two competitors launched services in August 2001. CTM has two main competitors. CTM retains a significant market share. In the Macau telecommunications market, mobiles outnumber fixed lines. The government is considering the issue of Third Generation Wireless (“3G”) and Code Division Multiple Access licences. As at 1 June 2004 no tender arrangements had been announced.
CTM also operates a data centre offering a wide selection of web-based and hosting services and an ATM network for broadband ADSL access.
Page 13
business description
Rest of the World |
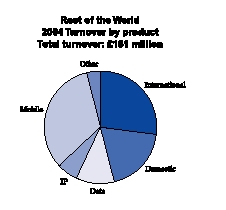
Rest of the World comprises Cable & Wireless’ businesses in Guernsey, Bahrain and the Maldives, together with smaller operations in the Seychelles, Bermuda, Sakhalin in Russia, Diego Garcia, Falkland Islands, Fiji, Ascension, St Helena, Vanuatu and Solomon Islands. Guernsey and the Maldives account for 54 per cent of the Rest of the World revenue.
Guernsey |
Cable & Wireless owns 100 per cent of Cable and Wireless Guernsey Ltd (“C&W Guernsey”). C&W Guernsey is the incumbent operator in Guernsey providing fixed and mobile voice and data services to all segments of the market, including residential, businesses and government. Another provider is planning to launch 3G mobile services in summer 2004 in line with the States of Guernsey’s liberalisation policy.
Maldives |
Cable & Wireless has a 45 per cent interest in, and management control of, Dhivehi Raajjeyge Gulhun Private Limited (“Dhiraagu”). The remaining 55 per cent are held by the government of the Maldives. Dhiraagu provides exclusive domestic and international fixed and mobile telecommunication services to residential and business customers. The government has announced its intention to license a second mobile operator and has invited bids to
undertake a feasibility study. Internet services were liberalised in January 2003.
Bahrain |
Cable & Wireless owns 20 per cent of its associate Bahrain Telecommunications Company (“Batelco”). Batelco provides domestic and international fixed line and mobile telecommunication, data and internet services to residential and business customers. The Government of Bahrain has announced its intention to sell its equity holding in Batelco. The Government has a holding of 36.67 per cent. The telecommunications market in Bahrain has begun to be liberalised, with MTC Vodafone launching a mobile service in December 2003.
Infrastructure |
In the Caribbean, Panama, Macau and Rest of the World, Cable & Wireless typically operates as the domestic incumbent, owning and operating the domestic fixed line networks and associated international interconnect facilities. Cable & Wireless also has international and domestic network facilities in the United Kingdom, Japan, continental Europe and the United States.
Cable & Wireless operates significant international submarine cable and satellite systems. Many of Cable & Wireless’ subsidiaries and associates also own and operate mobile networks. Examples include Jamaica (GSM and TDMA) and Trinidad and Tobago (GSM and TDMA) in the Caribbean as well as Panama (GSM and TDMA), Macau (GSM), the Maldives (GSM) and Bahrain (GSM).
Cable & Wireless continues to expand its GSM network in the Caribbean and has rolled out GSM networks in Jamaica, Barbados, Cayman, St Lucia, Dominica, Grenada and St Vincent with further GSM launches planned across the Caribbean during 2004.
Cable & Wireless companies also operate some 20 data centres within its national and international operations offering a wide selection of web-based and hosting services.
| REGULATORY FRAMEWORK |
Cable & Wireless, like other international telecommunication providers, faces regulatory and market access constraints in various countries resulting from laws, public policies and licensing requirements. This reflects the perception of telecommunications as a public service, a history of special or exclusive rights to provide services and, often, a structured move towards liberalisation and the introduction of competition. Generally, specialist telecommunications
regulation is administered through enforcement of conditions contained in operating and service licences held by the Group and its subsidiaries.
Many of the markets in which Cable & Wireless operates are in transition from monopoly environments to competitive markets. With the global trend towards liberalisation, Cable & Wireless is engaged with host governments, who want to
Page 14
business description
modify exclusive licences, in order to facilitate an orderly transition to a fully competitive environment. The discussions involve negotiating revised regulatory arrangements which provide for equal treatment and opportunity during the transitional period.
In all jurisdictions where it operates, Cable & Wireless is required to comply with regulations which affect its business. The Group believes it complies in all material respects with all material regulatory obligations and where regulatory compliance issues emerge it takes action to ensure compliance.
Licensing |
Cable & Wireless provides international and domestic telecommunications services under exclusive and non-exclusive licences in the jurisdictions in which it operates. These licences are either held by Cable & Wireless itself or by local operating entities owned either wholly or partly, directly or indirectly, by Cable & Wireless.
The Group believes it has all licences material to the running of its business. It is possible that from time to time, as further products and services are deployed or changed, additional licences or authorisations will be required. Where the Group identifies the need for further licences or authorisations, it intends to acquire such licences. The terms of the Group’s licences vary, although most remain in effect for a fixed period of 10 to 25 years, or for an indefinite period subject to notice of termination after a specified minimum period. Licence fees are sometimes required, either as a fixed annual fee or a fee equal to a percentage of the revenue or profits arising from the licence.
Following the implementation of the European Union electronic communications directive, which was intended to be transposed into national law by member states by 25 July 2003, member states of the European Union will no longer issue individual telecommunications licences to companies except in exceptional circumstances such as the allocation of spectrum. Therefore, Cable & Wireless expects that substantially all telecommunications licences it holds in EU member states will be revoked. Cable & Wireless will continue to offer telecommunications services subject to obligations set forth in general conditions as dictated by the electronic communications directive and individual member states.
Some licences provide that, upon their termination, the relevant government may purchase, or have the option to purchase, the property, plant and equipment of the licensee in that territory at a fair market value. In some cases, where the Group owns an operating company jointly with government, that government has the right to purchase, at
specified times, the whole or part of the Group’s shareholding in the operating company.
The international trend is for telecommunications liberalisation and the replacement of exclusive licences with non-exclusive licences alongside rules governing competition between operators. Jurisdictions that currently support monopoly provision may also decide to promote competition, and Cable & Wireless anticipates that some existing exclusive licences will not be renewed on an exclusive basis or that governments will seek to withdraw their exclusivity before the licence expires.
The Group is committed to participating in discussions on the introduction of competition in any territory where its government wishes to do so.
There is no guarantee that an agreement to provide either a monopoly or franchised service will remain in effect for the full term of the agreement.
Regulation by jurisdiction |
The regulatory institutions and policies of the jurisdictions in which the Group operates are varied.
Europe |
Following the transposition of the EU electronic communications directives into national laws, member states will no longer require market entrants to hold an individual licence. Instead, providers of electronic communications networks and services are regulated through general authorisations. Accordingly the individual licences that Cable & Wireless holds in EU member states have been or will be revoked in the near future. Outside the European Union, Cable & Wireless operates in Guernsey, the Isle of Man, Norway, Russia and Switzerland with relevant licences and authorisations.
The regulatory framework in member states of the European Union is harmonised by EU directives though there are divergences in regulatory policy and practice between member states. The directives of the European Union 2003 electronic communications package were adopted by the European Union in February 2002 and seek to harmonise telecommunications across the European Union. Member states were required to implement the directives by 25 July 2003, although many have not met this requirement. The legislative package involves the concept of significant market power to determine which operators should have prior obligations placed on them, on the grounds that such operators might exploit that market position to the detriment of competition and therefore consumers.
Page 15
business description
United Kingdom |
The telecommunications market in the United Kingdom is regulated primarily under the Communications Act 2003 (“UK Comms Act”). The UK Comms Act sets the framework for the regulation of telecommunications broadcasting markets as well as the civilian use of spectrum in the United Kingdom. Insofar as it applies to telecommunications markets, it updates the Telecommunications Act 1984 and transposes the EU electronic communications directives into UK law. It also lays out the powers and duties of the industry regulator, the Office of Communications (“Ofcom”).
Following reviews by Ofcom, BT has been designated as having Significant Market Power in a number of markets. BT is therefore required to provide cost-based interconnection for switched voice services and leased line access circuits (Partial Private Circuits) to providers of public electronic communications networks such as Cable & Wireless on non-discriminatory terms. Such services are subject to network charge controls.
Following the review of wholesale International Direct Dial (“IDD”) markets, Cable & Wireless has a designation of Significant Market Power on wholesale IDD routes from the United Kingdom to four destinations: Ascension, Diego Garcia, Montserrat and Turks & Caicos. The obligations associated with this designation are minimal.
In addition, in common with all other providers of fixed public voice networks in the United Kingdom, Cable & Wireless has been designated as having Significant Market Power in the markets for geographic call termination on the UK network. As this designation has been applied to all operators, obligations are likely to be minimal and the Group expects that there will be little or no impact.
Ofcom has launched a review of the UK telecommunications regulatory framework which Cable & Wireless understands is scheduled to be completed by end of calendar year 2004.
The Caribbean |
Cable & Wireless has businesses in 16 countries in the Caribbean. Cable & Wireless is, or has been, exclusively licensed in the majority of these territories which are now either fully liberalised or are in transition. Cable & Wireless is engaged in ongoing dialogues with host governments to facilitate an orderly transition to liberalisation.
The regulatory frameworks in which the most significant Cable & Wireless Caribbean businesses operate are described in this section.
Cable & Wireless Jamaica operates in a fully liberalised market, regulated by the Office of Utilities Regulation.
Cable & Wireless Barbados operates in fully liberalised fixed line and mobile domestic markets. The international market is scheduled to be liberalised later in 2004. The regulatory authority for fixed telecommunications in Barbados is the Fair Trading Commission. Mobile telecommunications are regulated by the Ministry of Industry and International Business.
Cable & Wireless Cayman Islands operates in a fully liberalised market. Cable & Wireless Cayman Islands is subject to the regulation of the Information and Communications Technology Authority.
Five member states of the Organisation of Eastern Caribbean States (Dominica, Grenada, St Kitts and Nevis, St Lucia, St Vincent and the Grenadines) are contracted in a single jurisdiction for telecommunications regulation with a regional regulator, the Eastern Caribbean Telecoms Authority (“ECTEL”), and are also subject to the jurisdiction of national regulators, the National Telecoms Regulatory Committees. Telecommunications markets in the ECTEL states are fully liberalised.
Japan |
Cable & Wireless IDC is a registered telecommunications business and is approved by the Ministry of Public Management, Home Affairs, Posts and Telecommunications. Among the services Cable & Wireless IDC provides in Japan are web hosting, international and domestic voice and data services, IP access, managed corporate services, and wholesale services to other carriers in the Asian region.
Substantial revisions to the Telecommunication Business Law came into effect as of 1 April 2004. Under these revisions, the separation of telecommunication business licences between Type I (facilities) and Type II (services) was abolished. Telecommunication licences now are classified as notified or registered telecommunication licences. The revisions also introduced a significant degree of tariff deregulation, relieving non-dominant operators of the need to file tariffs.
Interconnection charges for origination and termination of traffic on the networks of Nippon Telegraph and Telephone (“NTT”) East Corporation and NTT West Corporation impact the profitability of Cable & Wireless IDC’s voice business. The Ministry of Public Management, Home Affairs, Posts and Telecommunications regulates these interconnection charges. Certain interconnection charges used by Cable & Wireless IDC’s voice services were retroactively adjusted to reflect actual traffic trends resulting in an increase of approximately 10 per cent from 1 April 2003 compared to the prior year. There is the possibility of further retrospective increases later in 2004.
business description
United States |
As discussed more fully at the beginning of this section, on 23 January 2004, Cable & Wireless Internet Services, Inc. and Cable & Wireless USA, Inc. together with certain of their affiliates referred to as “CWA” entered into an agreement with SAVVIS Communications Corporation (“SAVVIS”) for SAVVIS to acquire substantially all of the assets of CWA. This followed the sale process under Chapter 11, Section 363 of the US Bankruptcy Code. All of the conditions to the sale were satisfied and the completion of the sale was announced on 8 March 2004.
In order to provide US connectivity for data and IP services to Cable & Wireless’ multinational customers based in other regions, Cable & Wireless continues to operate in the United States through its subsidiary Cable & Wireless Americas Operations, Inc. (“CWAO”). CWAO provides international, interstate and intrastate communications services to customers who require service to, from or through the United States. Under US law, interstate and international telecommunications services are regulated by the Federal Communications Commission (“FCC”) while intrastate services are regulated by state commissions. Non-dominant service providers such as CWAO are subject to a lesser degree of regulation than designated dominant service providers. CWAO also provides information services which generally are not regulated in the United States.
The regulated telecommunications services provided by CWAO may be classified as either common carrier or private carrier services depending upon the nature of the service offering. As a general matter, US law requires that common carrier services be offered (a) upon reasonable request, (b) on rates, terms and classifications which are just and reasonable, (c) without unjust discrimination or undue preferences basis, and (d) pursuant to authorisation of the FCC. Private carriers generally are not subject to these requirements, but are required to make contributions to the federal universal
service fund based on international and interstate telecommunications revenues, in the same manner as common carriers. Intrastate telecommunications services are subject to regulation by the relevant state public utility commission and may be subject to licensing requirements, tariffs, and/or subsidy mechanisms.
Other markets |
Cable & Wireless Panama operates in a fully liberalised market. The regulator is Ente Regulador De Los Servicios Publicos.
CTM Macau has an exclusive concession agreement to provide fixed national and international services until 2011 (subject to review in 2006). Mobile and IP services were liberalised in 2001. CTM Macau is subject to the regulation of the Office for the Development of Telecommunications and Information Technology.
Batelco, a Cable & Wireless associate company in which Cable & Wireless has a holding of 20 per cent, operates in Bahrain where the market is in the process of liberalisation. Currently there is competition in domestic mobile and internet services with the remainder of services liberalising in July 2004. Batelco is regulated by the Telecommunications Regulatory Authority.
The licence TeleYemen held for operating the international carrier in Yemen expired at the end of 2003. As a consequence Cable & Wireless has now exited that market.
Cable & Wireless has smaller operations and interests in other countries, which are at varying stages of liberalisation.
| PROPERTY |
As at 31 March 2004, Cable & Wireless and its subsidiaries lease or own in excess of 2,000 properties. The majority of sites are located in the United Kingdom, Panama and the Caribbean although the spread of properties extends across continental Europe, Asia, and islands in the Atlantic and Indian Oceans. Numerically, the bulk of properties are small technical sites, which house equipment necessary to support Cable & Wireless’ operations. In general, Cable & Wireless’ technical properties enjoy the protection of telecommunications legislation, which has the aim of ensuring the continuity of Cable & Wireless’ networks.
The size of Cable & Wireless’ property portfolio has reduced significantly over the last financial year primarily as a consequence of the disposal of the US domestic business together with other smaller operations in and around Europe. Additionally, a continuing rationalisation programme is being carried out, generally focusing on reducing office space, to match Cable & Wireless’ reduced headcount and ongoing operational requirements. Acquisition of both office and technical sites occurs where required.
business description
LEGAL PROCEEDINGS |
Class action litigation against Cable and Wireless plc |
Between December 2002 and February 2003, 10 shareholder class action lawsuits were filed in the United States District Court for the Eastern District of Virginia naming Cable and Wireless plc and several of its officers and directors as defendants.
In March 2003, the Court consolidated all of the cases into one action, styled as In re Cable and Wireless plc Securities Litigation, Civil Action No. 02-1860-A.
In May 2003, the lead plaintiffs filed a consolidated complaint that alleged violations of certain sections of the Securities and Exchange Act of 1934 and the rules promulgated thereunder. A central allegation was that the defendants made false and misleading statements about the Company’s financial condition by failing to disclose on a timely basis the existence of a tax indemnity and a ratings trigger to place money in escrow until any liability which the Company may have had under the tax indemnity was finally determined. The indemnity and ratings trigger appeared in an agreement reached in 1999 between the Company and Deutsche Telekom for the sale of the Company’s interest in the mobile telephone company that operated under the name One2One.
In addition to the allegations relating to the tax indemnity, the consolidated complaint also alleged that the defendants made false and misleading statements by: (1) failing to disclose certain lease liability commitments and (2) improperly recognising revenue received from sales of capacity to other carriers.
The plaintiffs sought unspecified money damages in their complaints.
The Company (and related individuals) filed motions to dismiss the class action complaint, which were heard on 31 October 2003. In March 2004, the Court issued orders in respect of the motions to dismiss.
The Court orders state in summary that:
| • | the defendants’ motions (including Cable and Wireless plc) to dismiss the consolidated class action complaint are granted; |
| • | the motion of Sir Ralph Robins, the Company’s former chairman, to dismiss the claims against him for lack of personal jurisdiction is granted; and |
| • | the defendants’ alternative motions to dismiss the claims of foreign (non-US) purchasers for lack of subject matter jurisdiction are denied. |
On 5 May 2004, the Court issued a Memorandum of Opinion, which dealt with the motion of Sir Ralph Robins to dismiss. The Opinion held that the Court has neither specific nor general jurisdiction over Sir Ralph Robins because his contacts with the United States were minimal.
In addition, on 15 June 2004, the Court issued a Memorandum of Opinion and Orders relating to the previous orders issued in March 2004. The Court stated that it would not grant leave to amend the complaint and ordered that judgement be entered against the plaintiffs. The Court found that the complaint, which alleged violations of US securities laws, failed to state a claim. The Memorandum of Opinion and Orders issued on 15 June 2004 disposed of all remaining claims in the case against Cable and Wireless plc, subject to appeal.
Resolution of dispute with IBM UK Limited |
Disputes between (1) Cable and Wireless plc and IBM United Kingdom Limited, (2) Cable & Wireless USA, Inc. and International Business Machines Corporation and (3) IBM Japan Limited and Cable & Wireless IDC Incorporated (collectively “Cable & Wireless” and “IBM” respectively) arose out of a Global Framework Agreement (“GFA”) dated 20 December 2000, and related agreements, pursuant to which IBM agreed to supply to Cable & Wireless information technology services.
On 8 September 2003, an amicable resolution of the matters in dispute was agreed upon by Cable & Wireless and IBM – the terms of which are confidential – following which, by consent, Cable & Wireless and IBM entered a Tomlin Order at the High Court of England and Wales. The effect of that order was to stay the legal proceedings, which existed between Cable & Wireless and IBM in relation to the disputes. On 31 December 2003, the terms of the GFA expired (Cable & Wireless having given notice to terminate the same in June 2003) and in January 2004, all services previously provided by IBM under the terms of the GFA were insourced back to Cable & Wireless.
Class action securities litigation against Digital Island, Inc., Cable & Wireless and others |
Digital Island Inc. (“Digital Island”), Cable and Wireless plc, Dali Acquisition Corp. (“Dali”) (a former subsidiary of Cable & Wireless which subsequently merged with Digital Island to form Cable & Wireless Internet Services, Inc.), and certain of the then present and former directors of Digital Island, were named as defendants in six separate putative class action lawsuits alleging various claims arising out of Cable & Wireless’ acquisition of Digital Island in August 2001. Three of the lawsuits were filed in the US District
business description
Court for the District of Delaware and three were filed in the Delaware Court of Chancery. The three federal lawsuits were consolidated into a single case.
The federal suit alleged that the defendants violated federal securities laws by failing to disclose on a timely basis that Digital Island had entered into certain business agreements with Bloomberg, L.P., and Major League Baseball. It further alleged that compensation agreements with certain officers and/or directors of the company violated the federal securities ‘all-holders’ rule. One state lawsuit alleged violations of Delaware law based upon similar allegations.
The other two state lawsuits alleged various violations of Delaware law against the same corporate defendants and the present and former Digital Island directors, including that they failed to disclose all material facts relating to Digital Island’s relationship with Microsoft, and that they failed to obtain a fair price for Digital Island shares.
On 10 September 2002, a federal District Court granted the defendants’ motion to dismiss the federal lawsuits with prejudice. Plaintiffs appealed the decision to the US Circuit Court of Appeals for the Third Circuit. On 6 February 2004, the US Circuit Court of Appeals for the Third Circuit upheld the decision of the federal District Court that the lawsuits be dismissed. This decision is final as to Cable and Wireless plc.
Litigation with Cibertec Internacional, S.A. and Inversiones Kamasu, S.A. |
Cibertec Internacional, S.A. and Inversiones Kamasu, S.A. initiated proceedings against Cable & Wireless Panama, S.A. and Cable and Wireless (CALA Management Services) Limited in Panama on 29 October 1999. The claim was for approximately US$125 million and alleged breach of contract. On 18 December 2002, the Civil Circuit Judge of the First Judicial Circuit of Panama handed down a decision against Cable & Wireless Panama, S.A. awarding damages of US$67,255,000, including moral damages and costs. The judge dismissed the complaint against Cable and Wireless (CALA Management Services) Limited.
Cable & Wireless Panama, S.A. subsequently appealed the judgment on 3 December 2002 and the parties settled the case on 28 October 2003. The settlement was approved by the First Superior Court of Panama on 6 November 2003. Under the terms of the settlement, Cable & Wireless Panama, S.A. did not accept or recognise any liability to the plaintiffs but voluntarily agreed to make a payment of US$14.5 million to the plaintiffs. The plaintiffs have waived all claims in this matter against Cable & Wireless Panama, S.A. and Cable and Wireless (CALA Management Services) Limited.
Claim against the Minister of Finance and Economy, Panama |
On 16 December 2002, a complaint was filed by two Panamanian lawyers exercising a public action at the Third Chamber of the Supreme Court of Justice of Panama questioning the law governing and rules of Public Bid No. 06 96 won by INTEL, S.A. (now Cable & Wireless Panama, S.A.). Complaints filed at the Third Chamber of the Supreme Court of Justice must be filed against the public officer who enacted the relevant regulation of act. This complaint was filed against the Minister of Finance and Economy in Panama specifically alleging that the Operating Agreement executed between Cable and Wireless (CALA Management Services) Limited and INTEL, S.A. (now Cable & Wireless Panama, S.A.) as part of the privatisation agreements was null and void ab initio, on the grounds that it had not been published in the Official Gazette in Panama.
The Operating Agreement enables Cable & Wireless Panama, S.A. to use the technical and management know-how of Cable and Wireless (CALA Management Services) Limited to more effectively fulfil its obligations under the concession granted to it by the Government of Panama to install, operate and exploit telecommunication services in Panama. Cable & Wireless Panama, S.A., due to its close interest in the outcome of the complaint requested recognition by the Court and permission to participate in the proceedings. The Court agreed to this.
On 21 March 2003, the Court permitted the claim to proceed. Cable & Wireless Panama, S.A. filed an appeal against the admission of the claim to proceed, however the Court confirmed its decision to permit the claim to proceed on 17 March 2004.
As required by Panamanian law, the Administrations General Attorney has provided an opinion to the Court in defence of the law or regulation which is the subject of the complaint. The Administrations General Attorney has opined that the Operating Agreement complied with all the requirements established by the law and by the rules of Public Bid No. 06 96 and was countersigned by the General Comptroller acting with due authorisation.
The proceedings are on-going.
Panamanian counsel consider this claim to be without merit and none of Cable and Wireless plc, Cable & Wireless Panama, S.A. or Cable and Wireless (CALA Management Services) Limited is party to the complaint. However, if the complaint were to be successful, the concession under which Cable & Wireless Panama, S.A. operates will not be affected, however the Operating Agreement could be declared null and void and then the complainants could file a complaint against Cable and Wireless (CALA Management
business description
Services) Limited requiring the return of all management fees collected under the agreement since its execution on 20 May 1997. This would amount to approximately £60 million. In the event that this complaint is successful, Cable & Wireless and its subsidiaries intend to vigorously pursue any legal recourse available to them.
Claim by Caribtel (Caribbean) Limited |
On 9 May 2003, Caribtel (Caribbean) Limited, a telecommunications operator specialising in calling cards, filed a suit against Cable & Wireless Jamaica Limited in the Supreme Court of Judicature of Jamaica. Caribtel has alleged that Cable & Wireless Jamaica Limited wrongfully disconnected Caribtel’s local access telephone services, resulting in a breach of contract and a violation of the Jamaican Fair Competition Act and the Telecommunications Act. Caribtel is claiming US$50 million of lost income to its pre-paid local access calling card business for the period from 25 April 2003 to 25 April 2006. Caribtel has also claimed aggravated and/or exemplary damages of Jamaica $300 million and is seeking injunctive relief to require Cable & Wireless Jamaica Limited to reinstate Caribtel’s local access telephone service.
On 22 May 2003, Caribtel presented a petition for injunctive relief before the Supreme Court of Jamaica requesting that Cable & Wireless Jamaica Limited be required to reinstate Caribtel’s local access telephone service; be restrained from disconnecting any other telecommunications facility currently supplied to Caribtel’s business premises until trial; and be prevented from calling on a prior bank guarantee that Caribtel had provided to Cable & Wireless Jamaica Limited in conjunction with a settlement agreement entered into between the parties in February 2003 relating to breaches of contract by Caribtel in December 2002. The injunctions were not granted by the Court. However, Cable & Wireless Jamaica Limited gave an undertaking that it would not disconnect the direct internet access facility pending a hearing scheduled for 2 June 2003.
Prior to the hearing of 2 June 2003, Caribtel approached Cable & Wireless Jamaica Limited with a view to arriving at a settlement. The parties entered into negotiations as a result of which the matter was taken off the Court list by consent of both parties. Once an indirect access product had been finalised and approved by the Office of Utilities Regulation in Jamaica, a settlement agreement was executed between Caribtel and Cable & Wireless Jamaica Limited on 30 July 2003.
Under that settlement agreement Caribtel has withdrawn its claim against Cable & Wireless Jamaica Limited and treats the claim as settled. Cable & Wireless Jamaica Limited is not required to make any payment to Caribtel,
however Caribtel is to refrain from using the Dedicated Internet Access (“DIA”) facility in breach of the service provider agreement and upon execution of a new agreement for Dedicated Internet for Voice and Data incorporating a DIA facility, the existing DIA agreement will be terminated.
Arbitration between Tilts Communications A/S/Cable and Wireless plc/Sonera OY and Republic of Latvia/Lattelekom SIA |
In September 2001, Cable and Wireless plc was joined as a party to an arbitration in connection with its former participation with Sonera OY (“Sonera”) in the joint venture Tilts Communications A/S (“Tilts”).
Through Tilts, Cable and Wireless plc and Sonera purchased a 49 per cent shareholding in a Latvian telecommunications company, Lattelekom SIA in 1994. Cable and Wireless plc sold its interest in Tilts to Sonera in June 1998.
On 3 March 2004, all of the parties in the arbitration signed a Settlement Agreement, which settled all past and present claims. The successor entity to Sonera, TeliaSonera AB, agreed to pay The Republic of Latvia Latvian Lat1 million under the Settlement Agreement. Cable and Wireless plc was not required to pay any sums to settle the arbitration. Sonera (and subsequently TeliaSonera AB) indemnified Cable & Wireless for any of its liabilities including costs incurred in the arbitration and, to date, has paid a substantial amount of these costs.
Arbitration between PT Cable, Inc., Cable and Wireless plc, Cable & Wireless IDC, Inc. and others |
PT Cable, Inc., (“PT Cable”) the US end owner of NPC Cable System (spanning from the United States to Japan), has initiated an arbitration proceeding against the Company, Cable & Wireless IDC, Inc. (“IDC”) and other users of capacity on that system for unpaid operations and maintenance fees with respect to the US end. To date, the unpaid component by Cable & Wireless is less than US$2 million. Cable & Wireless and all 14 other owners have counter-claimed against PT Cable for overcharging operation and maintenance fees. PT Cable is cross-claiming against Cable & Wireless and IDC in their capacity as maintenance authorities and alleges that the Company and IDC should be liable to contribute to any damages the Arbitrator may award against PT Cable. Three arbitrators have been appointed and are in the process of preparing the terms of reference for the proceeding.
Potential exposure of PT Cable is between US$13 million and US$33 million. PT Cable’s counter-claim against Cable & Wireless and IDC is for an unquantifiable proportion of that amount.
business description
Pender Insurance Limited |
Legal proceedings have recently been filed and served against Cable & Wireless Group’s wholly owned insurance subsidiary, Pender Insurance Limited (“Pender”) by a former policy holder of Pender. As these claims have not yet been fully quantified or substantiated by the plaintiff, it remains impracticable to estimate their financial effects. Pender intends to vigorously defend these proceedings.
From time to time, the Company and its subsidiaries are subject to legal or regulatory claims, proceedings, investigations or reviews. Other than the above, there are nopending claims, proceedings investigations or reviews against the Company or any of its subsidiaries, which the Company believes will if determined adversely to the Group have a material adverse effect on the Group’s liquidity or results of operation.
As a result of the deconsolidation arising from the withdrawal from the US domestic market, there are no legal proceedings involving CWA (being Cable & Wireless USA, Inc., Cable & Wireless Internet Services, Inc., together with certain of their affiliates) set out in this section.
Page 21
operating and financial review
| OPERATING AND FINANCIAL REVIEW |
This section contains:
| 22 | ||
| 24 | ||
| 32 | ||
| 38 | ||
| 41 |
The following discussion should be read in conjunction with the Financial Statements and notes thereto included elsewhere in this Annual Report. These financial statements have been prepared in accordance with UK GAAP, which differs in significant respects from US GAAP. The principal
| 41 | ||
| 43 | ||
| 44 | ||
| 46 | ||
| 47 |
differences between UK GAAP and US GAAP, as they relate to Cable & Wireless, are described and reconciliations of net income and shareholders’ equity to US GAAP are set out in Note 36 of Notes to the Financial Statements.
| OVERVIEW |
Cable & Wireless reported a total operating loss of £540 million in 2004. Industry conditions remain challenging and a further £526 million of tangible fixed asset impairments were recognised together with £244 million of exceptional costs related to restructuring activities across the Group.
In June 2003, the Company announced:
| • | that the Group would withdraw from the United States domestic market; |
| • | take steps to radically improve the unsatisfactory results in the United Kingdom; and |
| • | build upon its strong positions in national telecommunications companies round the world. |
US exit |
On 8 December 2003, Cable & Wireless’ former US business filed for Chapter 11 bankruptcy protection under the US Bankruptcy Code. Following a court-supervised auction process, substantially all of the assets of the US domestic business were sold to SAVVIS Communications Corporation and the completion of the sale was announced in March 2004. The total cash costs of this exit are expected to be under £300 million.
In order to provide US connectivity for data and IP services to Cable & Wireless’ multinational customers based in the United Kingdom and other regions, Cable & Wireless continues to operate in the United States.
United Kingdom |
Trading conditions in the United Kingdom and across Europe have remained challenging due to over-capacity and the consequent price pressure on traditional services, particularly long distance voice. However, as broadband access has increased across Europe, demand for core IP services, particularly IP-VPN has grown. Overall, the market
Against this background, UK revenues were broadly in line with 2003; headcount has been reduced; and operating cash flow has improved. The 2004 operating loss of £234 million is significantly lower than 2003 and, excluding the costs of the major restructuring and further asset impairments, the UK division reported a profit of £32 million.
Caribbean |
In the Caribbean, the liberalisation process has continued with over 70 per cent of the Group’s revenues in this region now exposed to competition. To remain competitive, the Group has reduced headcount, delayered and simplified the management structure, and accelerated the rollout of GSM networks in the region.
Presentation of results |
The analysis and commentary included in this Operating and Financial Review is based on the Group’s geographic divisions and reflects the manner in which the business has been organised and managed since June 2003. Prior period results are reported in line with this new structure.
On 8 December 2003, Cable & Wireless’ former US business filed for Chapter 11 bankruptcy protection under the US Bankruptcy Code and, under UK GAAP, was deconsolidated from the Group results from that date.
At 31 December 2003, the licences held by Cable & Wireless’ subsidiary in the Yemen expired and the Group ceased to operate in Yemen from that date.
In this Operating and Financial Review the results of the former US domestic business and Yemen businesses are
Page 22
operating and financial review
reported within discontinued operations and comparatives have been restated accordingly.
The comparative data for the geographic regions have also been restated to reflect:
| • | a change in the basis of revenue and cost allocation for globally managed customers such that revenue and costs are now allocated based on where the service is delivered rather than where the account is managed; and |
| • | the results of Cable & Wireless’ operations in Bermuda are now reported within Rest of the World to reflect the |
| current management structure. In 2003, the Bermuda results were reported within the Caribbean. |
The Group’s operations are all considered to fall into one class of business, namely telecommunications.
The following sections set out, for each of the three years ended 31 March 2004, turnover, operating costs and operating profit or loss of the Group and of the operations: United Kingdom; US network; Europe; Caribbean; Japan and Asia; Panama; Macau; and Rest of the World.
Page 23
operating and financial review
| GROUP OPERATING PERFORMANCE |
| 2004 | 2003 | 2002 | ||||||||
| £m | £m | £m | ||||||||
Turnover | ||||||||||
| Continuing operations | 3,384 | 3,677 | 4,084 | |||||||
Discontinued operations1 | 287 | 714 | 1,664 | |||||||
Group turnover | 3,671 | 4,391 | 5,748 | |||||||
| Outpayments and network costs | (2,005 | ) | (2,453 | ) | (3,248 | ) | ||||
| Staff costs | (664 | ) | (915 | ) | (988 | ) | ||||
| Other | (554 | ) | (689 | ) | (777 | ) | ||||
Operating costs before depreciation, amortisation and exceptional items | (3,223 | ) | (4,057 | ) | (5,013 | ) | ||||
| Depreciation (before exceptional items) | (252 | ) | (735 | ) | (1,072 | ) | ||||
| Amortisation (before exceptional items) | 3 | (126 | ) | (562 | ) | |||||
| Share of operating profits in joint ventures and associates | 41 | 75 | 115 | |||||||
Operating profit/(loss) before exceptionals | 240 | (452 | ) | (784 | ) | |||||
| of which: | continuing operations | 270 | (32 | ) | (33 | ) | ||||
| discontinued operations | (30 | ) | (420 | ) | (751 | ) | ||||
| Exceptional operating costs: | ||||||||||
| – depreciation | (526 | ) | (2,381 | ) | (1,909 | ) | ||||
| – amortisation | (10 | ) | (2,725 | ) | (2,007 | ) | ||||
| – other operating costs | (244 | ) | (442 | ) | (210 | ) | ||||
Total operating loss | (540 | ) | (6,000 | ) | (4,910 | ) | ||||
| of which: | continuing operations | (488 | ) | (4,158 | ) | (2,603 | ) | |||
| discontinued operations | (52 | ) | (1,842 | ) | (2,307 | ) | ||||
| Exceptional profit/(loss) on sale or termination of operations | 250 | (147 | ) | 1,057 | ||||||
| Profit less (losses) on disposal of fixed assets: | non-exceptional | 25 | – | (7 | ) | |||||
| exceptional | 28 | 62 | – | |||||||
| Exceptional write down of investments | – | (390 | ) | (904 | ) | |||||
Loss on ordinary activities before interest | (237 | ) | (6,475 | ) | (4,764 | ) | ||||
| Net interest and other similar income/charges | 13 | 102 | 215 | |||||||
Loss on ordinary activities before taxation | (224 | ) | (6,373 | ) | (4,549 | ) | ||||
| Tax on loss on ordinary activities | 12 | (36 | ) | (311 | ) | |||||
Loss on ordinary activities after taxation | (212 | ) | (6,409 | ) | (4,860 | ) | ||||
| Equity minority interests | (25 | ) | (124 | ) | (94 | ) | ||||
Loss for the financial year | (237 | ) | (6,533 | ) | (4,954 | ) | ||||
| 1 | In December 2003, Cable & Wireless’ US operations filed for Chapter 11 bankruptcy protection under the US Bankruptcy Code and were deconsolidated from 8 December. At 31 December 2003, the licences held by TeleYemen, Cable & Wireless’ subsidiary in Yemen, expired and the Group ceased operations in Yemen from that date. Under FRS 3 – ‘Reporting Financial Performance’, these businesses have been classified as discontinued. Comparatives for the years ended 31 March 2003 and 31 March 2002 have been adjusted accordingly. |
Page 24
operating and financial review
Year ended 31 March 2004 compared with year ended 31 March 2003 |
Cable & Wireless reported a loss on ordinary activities before taxation of £224 million in 2004. Continuing operations’ profit before taxation and excluding exceptional items was £317 million.
Cable & Wireless reported a total operating loss of £540 million in 2004, £5,460 million lower than in 2003 of which £1,790 million was attributable to the discontinued operations, mainly the United States.
Continuing businesses reported an operating loss of £488 million compared with £4,158 million in 2003. Tangible fixed asset impairment charges of £526 million were recognised at 31 March 2004 and principally related to the businesses in the Caribbean, £197 million, Japan, £126 million, and the United Kingdom, £119 million. Competition in the Caribbean and the consequent acceleration of the GSM roll-out led to a downward revision of expected cash flows from older TDMA assets. In Japan over-capacity and price reductions led to a reassessment of cash flows and in the United Kingdom under-utilised cabling was written-down.
Operating profit before exceptionals from continuing operations was £270 million in 2004 compared with an operating loss before exceptionals in 2003 of £32 million. Charges for depreciation and amortisation before exceptionals decreased by £483 million, mainly reflecting the lower fixed asset base following asset impairments in 2003. Operating profit in continuing operations, before depreciation, amortisation and exceptionals was £476 million; £147 million or 24 per cent lower than in 2003. A significant element of the national telcos’ revenues and costs are denominated in currencies that are linked to the US dollar. As a consequence, reported results were adversely impacted by a 9 per cent strengthening of sterling against the US dollar and a 31 per cent strengthening against the Jamaica dollar. At constant currency, operating profit from continuing operations before exceptionals in 2004 more than doubled when compared with 2003.
Year ended 31 March 2003 compared with year ended 31 March 2002 |
Cable & Wireless recorded a total operating loss of £6,000 million in 2003, compared with £4,910 million in 2002. Exceptional costs of £5,548 million were charged in 2003 reflecting the difficult trading conditions in the telecommunications sector, particularly the markets in which the United Kingdom, Japan and Europe operate. Goodwill of £2,713 million was written off at 30 September 2002 and fixed assets were impaired by a further £787 million. Additional impairment charges of £1,491 million were
Total operating losses before exceptionals at £452 million in 2003 were £332 million lower than in 2002. There was a £773 million reduction in the charge for depreciation and amortisation before exceptionals reflecting the lower fixed asset base following asset impairments in March and September 2002. Operating profit in continuing operations, before depreciation, amortisation and exceptionals, deteriorated. The UK operating profit before depreciation, amortisation and exceptionals, at £116 million in 2003 was £183 million lower than 2002 reflecting a 23 per cent decrease in wholesale revenues and a change in mix towards lower margin products, together with reduced revenues from business customers.
Group turnover |
| 2004 | 2003 | 2002 | ||||||
| £m | £m | £m | ||||||
| | ||||||||
| United Kingdom | 1,661 | 1,684 | 1,985 | |||||
| US network | 11 | – | – | |||||
| Europe | 262 | 304 | 314 | |||||
| Caribbean | 633 | 756 | 825 | |||||
| Japan and Asia | 286 | 379 | 432 | |||||
| Panama | 265 | 279 | 296 | |||||
| Macau | 128 | 146 | 145 | |||||
| Rest of the World | 161 | 159 | 138 | |||||
| Other | (23 | ) | (30 | ) | (51 | ) | ||
| Continuing operations | 3,384 | 3,677 | 4,084 | |||||
| Discontinued operations | 287 | 714 | 1,664 | |||||
Group turnover | 3,671 | 4,391 | 5,748 | |||||
Year ended 31 March 2004 compared with year ended 31 March 2003 |
Group turnover in 2004 was £3,671 million; £720 million or 16 per cent lower than in 2003. Of this decrease £427 million related to discontinued operations in the United States and Yemen. There was a decrease of £293 million, or 8 per cent, in revenue from continuing operations in 2004 compared with 2003.
Caribbean revenues at reported rates were £123 million, or 16 per cent, lower in 2004 compared with 2003. At constant currency rates there was an underlying decrease of 1 per cent. International revenues at constant currency were 26 per cent lower reflecting increased competition in Jamaica following liberalisation and pre-emptive tariff reductions in
Page 25
operating and financial review
other markets. There were offsetting increases in mobile, where the rollout of GSM in all major regions supported an increase in customer numbers, and domestic, due to rate rebalancing and increased volumes of interconnect as the number of competitors increased.
Turnover in Japan and Asia was £93 million lower in 2004 than 2003 reflecting the termination of the provision of local services in Hong Kong, the migration of customers to their own networks and increased competition.
Revenues in Europe were £42 million or 14 per cent lower than in 2003. Increased Enterprise revenues were more than offset by a decline in Carrier Services and Business as a result of increased competition and the sale of domestic operations in some countries.
Revenues in the United Kingdom in 2004 were broadly in line with 2003 following several years of decline. Increased Carrier Services and Enterprise revenues were offset by reduced revenues from the Business segment.
Year ended 31 March 2003 compared with year ended 31 March 2002 |
Group turnover at £4,391 million in 2003 was £1,357 million, or 24 per cent, lower than in 2002 primarily due to discontinued operations in Australia and the United States.
Turnover from continuing operations was £407 million, or 10 per cent, lower in 2003 compared with 2002, reflecting excess capacity and downward pricing pressure in Cable & Wireless’ trading environment.
Turnover in the United Kingdom at £1,684 million was £301 million lower in 2003 compared with 2002. Reductions in Carrier Services and Business revenues, of £216 million and £217 million lower than 2002 respectively, were only partly offset by a £132 million increase in Enterprise.
The reduction in UK Carrier Services’ revenues reflected in part the migration of national interconnect business to carriers’ own networks and a change in the mix of international voice traffic, from mobile to fixed, which generates lower revenue per minute.
The reduction in UK Business revenues compared with 2002 reflected continued pricing pressure and the impact of a 2002 management decision to focus on high margin services with growth potential.
The increase in Enterprise revenues was partly due to a focus on higher value managed services and away from more commoditised products, together with new contract wins and increased business with existing clients.
The Caribbean reported a £69 million, or 8 per cent, decrease in revenues in 2003 compared with 2002. The results were affected by an 8 per cent devaluation in the US dollar against sterling and a 14 per cent devaluation in the Jamaica dollar. At constant exchange rates, the Caribbean’s revenue increased by 1 per cent in 2003 compared with 2002. A 26 per cent increase in mobile revenues, reflecting a 65 per cent increase in the subscriber base, and a 6 per cent increase in domestic voice were offset by an 8 per cent fall in international revenue, due partly to the liberalisation process and partly to continuing pressure on settlement rates.
Operating costs before depreciation, amortisation and exceptional items |
| 2004 | 2003 | 2002 | ||||||||
| £m | £m | £m | ||||||||
Outpayments and network costs1 | 2,005 | 2,453 | 3,248 | |||||||
| Staff costs | 664 | 915 | 988 | |||||||
| Other | 554 | 689 | 777 | |||||||
Total | 3,223 | 4,057 | 5,013 | |||||||
| of which: | ||||||||||
| United Kingdom | 1,560 | 1,568 | 1,686 | |||||||
| US network | 27 | – | – | |||||||
| Europe | 268 | 347 | 337 | |||||||
| Caribbean | 442 | 467 | 480 | |||||||
| Japan and Asia | 264 | 358 | 363 | |||||||
| Panama | 156 | 143 | 163 | |||||||
| Macau | 70 | 86 | 87 | |||||||
| Rest of the World | 89 | 79 | 78 | |||||||
| Other | 32 | 6 | (2 | ) | ||||||
| Continuing operations | 2,908 | 3,054 | 3,192 | |||||||
| Discontinued operations | 315 | 1,003 | 1,821 | |||||||
Total | 3,223 | 4,057 | 5,013 | |||||||
| 1 | Outpayments and network costs include customer acquisition costs and the cost of goods sold. |
operating and financial review
Headcount-continuing operations |
| 31 March | 2004 | 2003 | 2002 | |||||||
| United Kingdom | 4,398 | 5,682 | 6,084 | |||||||
| US network | 60 | – | – | |||||||
| Europe | 519 | 1,136 | 1,390 | |||||||
| Caribbean | 4,254 | 5,073 | 5,553 | |||||||
| Japan and Asia | 862 | 1,157 | 1,262 | |||||||
| Panama | 1,881 | 2,218 | 3,216 | |||||||
| Macau | 881 | 947 | 979 | |||||||
| Rest of the World | 1,414 | 1,449 | 1,186 | |||||||
| Other | 285 | 270 | 45 | |||||||
Total | 14,554 | 17,932 | 19,715 | |||||||
Year ended 31 March 2004 compared with 31 March 2003 |
Total operating costs before depreciation, amortisation and exceptionals were £3,223 million in 2004, £834 million or 21 per cent lower than 2003. Excluding discontinued operations, there was a decrease in 2004 of £146 million or 5 per cent compared with 2003.
Outpayments and network costs for continuing operations were £83 million lower in 2004. Reductions in Japan, £81 million, Europe, £44 million and the Caribbean, £37 million, were partly offset by a £48 million increase in the United Kingdom and a £23 million increase in respect of the newly created US network. In Japan outpayments fell in line with revenues. In Europe, network costs and outpayments fell reflecting the exit from domestic business and network rationalisation. The decrease in the Caribbean was primarily due to the impact of currency translation. UK network costs included £34 million in relation to an IBM contract that was terminated.
Staff costs for continuing operations in 2004 were £73 million, or 11 per cent, lower than in 2003 reflecting the benefit of a 3,378 net reduction in headcount savings across the Group. The UK operation’s plan to reduce headcount by 1,500 by March 2005, announced in June 2003, is ahead of target. Headcount at 31 March 2004 was 1,284 lower than at 31 March 2003 despite recruitment of an additional 603 staff to enhance the skills mix.
Other costs were £135 million lower in 2004 than in 2003 of which £105 million was attributable to property costs.
Year ended 31 March 2003 compared with year ended 31 March 2002 |
Total operating costs before depreciation, amortisation and exceptional items at £4,057 million in 2003 were £956 million or 19 per cent lower than in 2002.
Excluding discontinued operations, operating costs before depreciation, amortisation and exceptional items of £3,054 million in 2003 were £138 million lower than in 2002.
Outpayments and network costs for continuing operations were £1,966 million in 2003, £213 million or 10 per cent lower than in 2002, principally reflecting a £198 million reduction in such costs for the United Kingdom. This reduction was largely due to lower volumes of voice traffic and the benefit of network streamlining.
Outpayments and network costs in the Caribbean at £240 million in 2003 were in line with 2002. At constant exchange rates, there was an underlying increase in outpayments and network costs of 9 per cent mainly due to increased volumes and third party terminations, particularly in mobile and in fixed to mobile traffic, network expansion and customer acquisition costs, including mobile handset subsidies.
Staff costs for continuing operations were £14 million, or 2 per cent, lower in 2003 compared with 2002 including the benefit of headcount reductions. Year end headcount was 17,932 at 31 March 2003 compared with 19,715 at 31 March 2002.
Other costs for continuing operations were £89 million higher in 2003 compared with 2002. This included the effect in 2002 of a release of bad debt provisions raised in prior years.
Depreciation before exceptional items |
| 2004 | 2003 | 2002 | ||||||||
| £m | £m | £m | ||||||||
| United Kingdom | 68 | 413 | 424 | |||||||
| Europe | 1 | 28 | 49 | |||||||
| Caribbean | 76 | 74 | 92 | |||||||
| Japan and Asia | 26 | 62 | 35 | |||||||
| Panama | 39 | 45 | 52 | |||||||
| Macau | 18 | 18 | 20 | |||||||
| Rest of the World | 20 | 22 | 17 | |||||||
| Other | 2 | 3 | 4 | |||||||
| Discontinued businesses | 2 | 70 | 379 | |||||||
Total | 252 | 735 | 1,072 | |||||||
operating and financial review
Year ended 31 March 2004 compared with year ended 31 March 2003 |
Depreciation before exceptional items at £252 million in 2004 was £483 million lower than in 2003. This decrease was mainly attributable to the lower fixed asset base following the impairments in September 2002 and March 2003.
Year ended 31 March 2003 compared with year ended 31 March 2002 |
Depreciation before exceptional items at £735 million in 2003 was £337 million lower than in 2002 of which £309 million related to discontinued businesses.
Goodwill amortisation before exceptional items |
| 2004 | 2003 | 2002 | ||||||||
| £m | £m | £m | ||||||||
| United Kingdom | – | 62 | 211 | |||||||
| Europe | – | – | 67 | |||||||
| Caribbean | – | 1 | 1 | |||||||
| Japan and Asia | – | 4 | 24 | |||||||
| Rest of the World | (3 | ) | (2 | ) | – | |||||
| Discontinued businesses | – | 61 | 259 | |||||||
Total | (3 | ) | 126 | 562 | ||||||
Year ended 31 March 2004 compared with year ended 31 March 2003 |
Following the write off of substantially all of the Group’s goodwill at 31 March 2003, the Group reported a goodwill credit of £3 million. The credit mainly relates to the amortisation of negative goodwill arising on the acquisition of Guernsey in 2003.
Year ended 31 March 2003 compared with year ended 31 March 2002 |
Goodwill amortisation of £126 million in 2003 was £436 million lower than in 2002. The reduction reflected lower goodwill carried on the balance sheet in 2003 following the impairments booked in March and September 2002. As a result of these impairments, substantially all goodwill of the Group had been fully written off by the year end.
Share of operating profits in joint ventures and associates |
| 2004 | 2003 | 2002 | ||||||||
| £m | £m | £m | ||||||||
| United Kingdom | (1 | ) | – | (6 | ) | |||||
| Caribbean | 30 | 33 | 34 | |||||||
| Rest of the World | 12 | 29 | 26 | |||||||
| Other | – | 13 | 17 | |||||||
| Discontinued businesses | – | – | 44 | |||||||
Total | 41 | 75 | 115 | |||||||
Year ended 31 March 2004 compared with year ended 31 March 2003 |
The Group’s share of operating profits in joint ventures and associates fell by £34 million from £75 million in 2003 to £41 million in 2004. Rest of the World declined from £29 million in 2003 to £12 million mainly due to lower contribution from associates in Bahrain and Fiji reflecting increased competition and an impairment in the carrying value of associates.
Year ended 31 March 2003 compared with year ended 31 March 2002 |
The Group’s share of operating profits in joint ventures and associates was £40 million lower in 2003 at £75 million of which £44 million related to discontinued operations.
In December 2002, as part of the Initial Public Offering of shares in the Group’s Singapore associate, MobileOne Limited, Cable & Wireless sold 60 per cent of its stake in that company, realising a profit of £54 million before minority interests. The remaining Cable & Wireless shareholding in Mobile One is now classified as a trade investment.
operating and financial review
Exceptional operating costs |
| 2004 | 2003 | 2002 | ||||||||
| £m | £m | £m | ||||||||
| Depreciation | 526 | 2,381 | 1,909 | |||||||
| Amortisation | 10 | 2,725 | 2,007 | |||||||
| Other | 244 | 442 | 210 | |||||||
| Total | 780 | 5,548 | 4,126 | |||||||
| United Kingdom | 266 | 3,570 | 1,821 | |||||||
| Europe | 7 | 298 | 401 | |||||||
| Caribbean | 245 | 19 | 172 | |||||||
| Japan and Asia | 133 | 221 | 157 | |||||||
| Panama | 73 | 14 | 19 | |||||||
| Macau | 2 | – | – | |||||||
| Rest of the World | 1 | 1 | – | |||||||
| Other | 31 | 3 | – | |||||||
| Continuing operations | 758 | 4,126 | 2,570 | |||||||
| Discontinued businesses | 22 | 1,422 | 1,556 | |||||||
Total | 780 | 5,548 | 4,126 | |||||||
Year ended 31 March 2004 compared with year ended 31 March 2003 |
Exceptional operating costs of £780 million were charged in 2004. Fixed assets were impaired by a further £526 million: TDMA assets were impaired across the Caribbean and in Panama as the roll-out of GSM was accelerated to improve service levels; in Japan over-capacity and price reductions led to a downwards reassessment of future cash flows and in the United Kingdom under-utilised cabling was written off. Other exceptional operating costs of £244 million in 2004 related to the cost of restructuring Group businesses and included £113 million of redundancy costs and £92 million of property costs.
Year ended 31 March 2003 compared with year ended 31 March 2002 |
Difficult trading conditions in Cable & Wireless’ markets led to further fixed asset and goodwill impairment charges in 2003 as forecast revenues were revised downwards and the Group’s cost of capital increased.
In September 2002, fixed assets were impaired by £787 million and the remaining goodwill of the Group was substantially written off. These impairments arose as estimates of future revenues were revised downwards. The goodwill write-off largely related to CWC DataCo acquired as part of the Cable & Wireless Communications restructuring in May 2000.
At 31 March 2003, a further fixed asset impairment charge of £1,594 million arose. Continued problems in the market led to revenue forecasts being further reduced.
Other exceptional operating costs of £442 million mainly related to the costs of exiting and restructuring primarily in the US business.
Exceptional profit/(loss) on disposal or termination of operations |
| 2004 | 2003 | 2002 | ||||||||
| £m | £m | £m | ||||||||
Profit/(loss) on disposal or termination of operations | 250 | (147 | ) | 1,057 | ||||||
Year ended 31 March 2004 compared with year ended 31 March 2003 |
The Group realised an exceptional profit on disposal or termination of operations of £250 million in 2004, of which £191 million relates to the exit from the US business. In addition, £57 million of accrued costs relating to disposals in previous years, principally the disposal of CWC ConsumerCo, have been released.
Year ended 31 March 2003 compared with year ended 31 March 2002 |
In 2003, a loss on disposal of operations of £231 million, which related to the termination of the US voice retail business was partly offset by a release of accrued costs relating to disposals in previous years.
Profit on disposals of operations in 2002 represented a £1,057 million profit on the sale of the Group’s 52.5 per cent investment in Optus.
Profits less (losses) on disposal of fixed assets |
| 2004 | 2003 | 2002 | ||||||||
| £m | £m | £m | ||||||||
| Non-exceptional | 25 | – | (7 | ) | ||||||
| Exceptional | 28 | 62 | – | |||||||
Total | 53 | 62 | (7 | ) | ||||||
Year ended 31 March 2004 compared with year ended 31 March 2003 |
Non-exceptional profits on disposal of fixed assets primarily relate to the sale of various satellite interests and other investments.
operating and financial review
The exceptional profit on disposal of fixed assets includes £16 million, relating to the disposal of certain properties in the United States as part of the restructuring of the US business prior to its filing for Chapter 11, and £12 million mainly relating to the sale of properties in the United Kingdom and the Caribbean as part of the Group’s restructuring.
Year ended 31 March 2003 compared with year ended 31 March 2002 |
In 2003, the Group recorded a £54 million profit before minority interests on the sale of 60 per cent of its stake in MobileOne Limited.
Exceptional write down of investments |
| 2004 | 2003 | 2002 | ||||||||
| £m | £m | £m | ||||||||
| Exceptional write-down of investments | – | (390 | ) | (904 | ) | |||||
Total | – | (390 | ) | (904 | ) | |||||
Year ended 31 March 2004 |
There were no exceptional write-downs of investments during 2004.
Year ended 31 March 2003 compared with year ended 31 March 2002 |
The current asset investments principally relating to PCCW Limited were written down by £274 million to market value at 31 March 2003. In addition, the shares held by the Employee Share Ownership Plan Trust were written down by £116 million to market value at 31 March 2003.
The £904 million charge in 2002 relates to write-downs of the Group’s investments in ntl Incorporated, CMGI Inc. and Pacific Century Cyber Works.
Exceptional Costs – Summary |
| 2004 | 2003 | 2002 | |||||||||||||||||
| Continuing | Discontinued | Continuing | Discontinued | Continuing | Discontinued | ||||||||||||||
| £m | £m | £m | £m | £m | £m | ||||||||||||||
| Exceptional operating costs | (758 | ) | (22 | ) | (4,126 | ) | (1,422 | ) | (2,570 | ) | (1,556 | ) | |||||||
| Exceptional profits less (losses) on sale/termination of operations | 2 | 248 | – | (147 | ) | – | 1,057 | ||||||||||||
| Exceptional profits less (losses) on disposal of fixed assets | 12 | 16 | 62 | – | – | – | |||||||||||||
| Exceptional write down of investments | – | – | (390 | ) | – | (904 | ) | – | |||||||||||
Total | (744 | ) | 242 | (4,454 | ) | (1,569 | ) | (3,474 | ) | (499 | ) | ||||||||
operating and financial review
Taxation |
| 2004 | 2003 | 2002 | ||||||||
| £m | £m | £m | ||||||||
| Loss on ordinary activities before taxation | (224 | ) | (6,373 | ) | (4,549 | ) | ||||
| Tax on loss on ordinary activities | 12 | (36 | ) | (311 | ) | |||||
| Effective tax rate | 5.4% | (0.6)% | (6.8)% | |||||||
Year ended 31 March 2004 compared with year ended 31 March 2003 |
Tax credits of £12 million have been generated in 2004 on a loss before tax of £224 million. The main reason for the tax rate of 5.4 per cent being lower than the UK standard rate of tax of 30 per cent is due to tax losses for which no benefit has been recognised in the year as realisation of the benefit is not considered probable. These losses have been carried
forward to future periods. Exceptional items on which tax relief is denied are lower than 2003 resulting in a positive tax rate in 2004 compared to a negative tax rate in 2003.
Year ended 31 March 2003 compared with year ended 31 March 2002 |
A tax charge of £36 million arose in 2003 on the loss before tax of £6,373 million. The Group continued to generate tax losses in 2003 for which no immediate benefit was recognised, as realisation of the benefit is not considered probable. These tax losses have been carried forward to future periods. The negative tax rate of 0.6 per cent in 2003 is lower than the negative tax rate of 6.8 per cent for 2002, primarily because the tax charge on exceptional items is lower than 2002 due to there being no material disposals of investments in 2003. The tax charge on exceptional items in 2002 could not be reduced by surplus tax losses, as they arose in different jurisdictions. As with 2002, in the United Kingdom, tax relief is denied on certain costs and provisions, including the amortisation and write down of goodwill and fixed asset write-downs.
Page 31
operating and financial review
| REVIEW BY DIVISION |
| This section provides a discussion of Cable & Wireless’ results by division. |
Turnover and total operating (loss)/profit by division |
| 2004 | 2003 | 2002 | |||||||||||||||||
| Turnover £m | Operating (loss)/profit £m | Turnover £m | Operating (loss)/profit £m | Turnover £m | Operating (loss)/profit £m | ||||||||||||||
| United Kingdom | 1,661 | (234 | ) | 1,684 | (3,929 | ) | 1,985 | (2,163 | ) | ||||||||||
| US network | 11 | (16 | ) | – | – | – | – | ||||||||||||
| Europe | 262 | (14 | ) | 304 | (369 | ) | 314 | (540 | ) | ||||||||||
| Caribbean | 633 | (100 | ) | 756 | 228 | 825 | 114 | ||||||||||||
| Japan and Asia | 286 | (137 | ) | 379 | (266 | ) | 432 | (147 | ) | ||||||||||
| Panama | 265 | (3 | ) | 279 | 77 | 296 | 62 | ||||||||||||
| Macau | 128 | 38 | 146 | 42 | 145 | 38 | |||||||||||||
| Rest of the World | 161 | 66 | 159 | 88 | 138 | 69 | |||||||||||||
| Other | (23 | ) | (88 | ) | (30 | ) | (29 | ) | (51 | ) | (36 | ) | |||||||
| Continuing businesses | 3,384 | (488 | ) | 3,677 | (4,158 | ) | 4,084 | (2,603 | ) | ||||||||||
| Discontinued | 287 | (52 | ) | 714 | (1,842 | ) | 1,664 | (2,307 | ) | ||||||||||
Total | 3,671 | (540 | ) | 4,391 | (6,000 | ) | 5,748 | (4,910 | ) | ||||||||||
United Kingdom |
| 2004 | 2003 | 2002 | ||||||||
| £m | £m | £m | ||||||||
| Turnover | 1,661 | 1,684 | 1,985 | |||||||
| Costs | ||||||||||
Outpayments and network costs1 | (1,158 | ) | (1,110 | ) | (1,308 | ) | ||||
| Staff costs | (254 | ) | (292 | ) | (297 | ) | ||||
| Other | (148 | ) | (166 | ) | (81 | ) | ||||
| (1,560 | ) | (1,568 | ) | (1,686 | ) | |||||
| Depreciation before exceptionals | (68 | ) | (413 | ) | (424 | ) | ||||
| Amortisation before exceptionals | – | (62 | ) | (211 | ) | |||||
| Joint ventures and associates | (1 | ) | – | (6 | ) | |||||
| Operating profit/(loss) before exceptionals | 32 | (359 | ) | (342 | ) | |||||
| Exceptional items | ||||||||||
| – depreciation | (119 | ) | (1,302 | ) | (664 | ) | ||||
| – amortisation | – | (2,194 | ) | (997 | ) | |||||
| – other operating costs | (147 | ) | (74 | ) | (160 | ) | ||||
Operating loss | (234 | ) | (3,929 | ) | (2,163 | ) | ||||
| 1 | Outpayments and network costs include customer acquisition costs and the cost of goods sold. |
Year ended 31 March 2004 compared with year ended 31 March 2003 |
Operating losses at £234 million in 2004 were £3,695 million lower than in 2003, primarily due to a £3,377 million reduction in the charge for fixed asset and goodwill impairments. Exceptional operating costs of £147 million in 2004 arose primarily as a consequence of the UK restructuring and related to property exit costs and severance payments. Before exceptional costs, the UK division reported an operating profit of £32 million.
Turnover at £1,661 million in 2004 was broadly in line with 2003. Revenue in the six months to 31 March 2004 was £836 million, 1 per cent higher than in the first half of 2004.
A £79 million decline in Business revenues was partly offset by improvements in Carrier Services and Enterprise segments (£39 million and £17 million respectively).
The decline in UK Business revenues reflected the continued impact of customer churn and tariff erosion. However, action taken in the year, including increased investment in the sales acquisition team and the launch of new simplified products, stopped the downward trend of the last two years with second half 2004 Business revenues broadly in line with the first half.
Carrier Services revenues were £39 million higher in 2004 than in 2003. Voice was 5 per cent higher mainly reflecting increases in mobile transit traffic and sales to 118 (directory
Page 32
operating and financial review
enquiry) service providers. The benefit of these increases was partly reduced by lower telebusiness and data services.
Operating costs, before depreciation, amortisation and exceptional costs were £8 million lower at £1,560 million in 2004.
Outpayments and network costs were £48 million higher in 2004 and included £34 million relating to an IBM contract. Staff costs were £38 million lower in 2004 compared with 2003 mainly due to the headcount reduction programme. Headcount at 31 March 2004 was 4,398 compared with 5,682 at 31 March 2003. Other costs were £18 million lower than in 2003 and included an £8 million reduction in property costs reflecting the benefits of property rationalisation. Depreciation and amortisation charges were £407 million lower in 2004 than 2003, largely due to the lower asset base following the 2003 impairment charges.
Year ended 31 March 2003 compared with year ended 31 March 2002 |
UK operating losses rose by £1,766 million in 2003 as further fixed asset and goodwill impairment charges were recognised. Operating losses before exceptional items at £359 million in 2003 were £17 million higher than in 2002. The benefit of reduced charges for depreciation and goodwill amortisation in 2003, following asset impairments in March and September 2002, was more than offset by a £183 million reduction in the UK division’s operating profit before exceptionals, depreciation, amortisation and joint ventures and associates to £116 million in 2003. This reduction was largely due to a poor business performance, particularly in Carrier Services.
Turnover was £301 million lower in 2003 compared with 2002. Reductions in Carrier Services and Business revenues reflected in part the migration of national interconnect business to carriers’ own networks and a change in the mix of international voice traffic, from mobile to fixed, which generates lower revenue per minute. The reduction in UK Carrier Services revenues compared with 2002 also reflected continued pricing pressure and the impact of a 2002 management decision to focus on high margin services with growth potential. These decreases were partly offset by an increase in Enterprise revenues, due partly to a focus on higher value managed services and away from more commoditised products, together with new contract wins and increased business with existing clients.
Operating costs before depreciation, amortisation and exceptional items in the UK were £118 million lower in 2003 compared with 2002: this increase was largely attributable to a reduction in outpayments and network costs arising due to lower volumes of voice traffic and network streamlining.
US network |
| 2004 | 2003 | 2002 | ||||||||
| £m | £m | £m | ||||||||
| Turnover | 11 | – | – | |||||||
| Operating costs | (27 | ) | – | – | ||||||
Operating loss | (16 | ) | – | – | ||||||
In line with its strategy to withdraw from its US domestic operations, Cable & Wireless formalised the ongoing commercial dealings between its US business (“CWA”) and the rest of the Cable & Wireless Group in September 2003. Under these arrangements, each party agreed to provide certain interim services to the other, including network capacity, for an interim period.
To facilitate the separation of CWA from the Group, Cable & Wireless incorporated a wholly owned subsidiary, Cable & Wireless Americas Operations, Inc. (“CWAO”) to provide ongoing US connectivity for data and IP services to Cable & Wireless’ multinational customers based in other regions (primarily those served by the UK, Europe and Japan and Asia operations). In addition, CWAO built a core network in the US comprising seven nodes in five cities and entered into access arrangements with third party carriers in order provide end-to-end services.
CWAO revenue of £11 million was derived from the provision of services to CWA from October 2003 together with the provision of services to other Cable & Wireless Group customers. Outpayments and network costs of £23 million included within operating costs represent the costs of CWAO’s core network plus amounts paid to CWA in accordance with the interim service arrangements described above.
Page 33
operating and financial review
Europe |
| 2004 | 2003 | 2002 | ||||||||
| £m | £m | £m | ||||||||
| Turnover | 262 | 304 | 314 | |||||||
| Costs | ||||||||||
Outpayments and network costs1 | (198 | ) | (242 | ) | (243 | ) | ||||
| Staff costs | (40 | ) | (55 | ) | (64 | ) | ||||
| Other | (30 | ) | (50 | ) | (30 | ) | ||||
| (268 | ) | (347 | ) | (337 | ) | |||||
| Depreciation before exceptionals | (1 | ) | (28 | ) | (49 | ) | ||||
| Amortisation before exceptionals | – | – | (67 | ) | ||||||
| Operating loss before exceptionals | (7 | ) | (71 | ) | (139 | ) | ||||
| Exceptional items | ||||||||||
| – depreciation | – | (262 | ) | (211 | ) | |||||
| – amortisation | – | – | (190 | ) | ||||||
| – other operating costs | (7 | ) | (36 | ) | – | |||||
Operating loss | (14 | ) | (369 | ) | (540 | ) | ||||
| 1 | Outpayments and network costs include customer acquisition costs and the cost of goods sold. |
Year ended 31 March 2004 compared with year ended 31 March 2003 |
Operating losses at £14 million in 2004 were £355 million lower than in 2003 of which £262 million reflected asset impairments in 2003 that were not repeated in 2004. Operating losses before exceptionals were £64 million lower in 2004 at £7 million: a £27 million reduction in the depreciation charge reflecting the prior year asset impairments, together with a £79 million reduction in other costs, more than offset a £42 million reduction in revenues.
Revenues in continental Europe in 2004 were £42 million, or 14 per cent, lower than in 2003. A £21 million increase in Enterprise revenues, reflecting the roll out of major contracts, was more than offset by declines in Carrier Services and Business as a result of increased competition and the disposal of domestic operations in Sweden, Belgium, the Netherlands, Italy, Switzerland, France and Germany and the domestic data business in Russia.
Continental Europe’s operating costs before depreciation, amortisation and exceptionals were £79 million or 23 per cent lower in 2004 than 2003. At constant currency rates, there was an underlying reduction of 29 per cent. Cost savings were achieved as a result of a reduction in employee numbers, property disposals and network rationalisation as
well as the exit from domestic operations as described above. Headcount in continental Europe was 519 at 31 March 2004 compared with 1,136 at 31 March 2003.
Year ended 31 March 2003 compared with year ended 31 March 2002 |
Operating losses were £171 million lower in 2003 compared with 2002 mainly due to the non-recurrence of a £190 million goodwill impairment charge in 2002.
Caribbean |
| 2004 | 2003 | 2002 | ||||||||
| £m | £m | £m | ||||||||
| Turnover | 633 | 756 | 825 | |||||||
| Costs | ||||||||||
Outpayments and network costs1 | (203 | ) | (240 | ) | (243 | ) | ||||
| Staff costs | (97 | ) | (120 | ) | (127 | ) | ||||
| Other | (142 | ) | (107 | ) | (110 | ) | ||||
| (442 | ) | (467 | ) | (480 | ) | |||||
| Depreciation before exceptionals | (76 | ) | (74 | ) | (92 | ) | ||||
| Amortisation before exceptionals | – | (1 | ) | (1 | ) | |||||
| Joint ventures and associates | 30 | 33 | 34 | |||||||
| Operating profit before exceptionals | 145 | 247 | 286 | |||||||
| Exceptional items | ||||||||||
| – depreciation | (197 | ) | – | (172 | ) | |||||
| – amortisation | (10 | ) | – | – | ||||||
| – other operating costs | (38 | ) | (19 | ) | – | |||||
Operating (loss)/profit | (100 | ) | 228 | 114 | ||||||
| 1 | Outpayments and network costs include customer acquisition costs and the cost of goods sold. |
Year ended 31 March 2004 compared with year ended 31 March 2003 |
The Caribbean recorded an operating loss of £100 million in 2004 compared with an operating profit of £228 million in 2003. Exceptional costs of £245 million were charged in 2004 comprising a £197 million impairment charge, primarily due to the write-off of TDMA assets following the accelerated GSM roll-out in the region, and £38 million of restructuring costs.
Reported operating profit before exceptionals in 2004 was £145 million, £102 million or 41 per cent lower than in 2003. Many of the Caribbean businesses operate in territories that have currencies linked directly or indirectly to
Page 34
operating and financial review
the US dollar. Consequently, a 9 per cent strengthening of sterling against the US dollar and a 31 per cent strengthening against the Jamaica dollar had a significant impact on the reported results of the Caribbean. At constant currency, operating profit before exceptionals in 2004 was 32 per cent lower than in 2003.
Revenue in 2004 was £633 million, 16 per cent lower than 2003 at reported rates and one per cent lower at constant currency.
International revenue declined by 26 per cent at constant currency reflecting increased competition following the liberalisation of the international fixed line market in Jamaica on 1 March 2003 and pre-emptive tariff reductions in other markets. Domestic revenue increased by 5 per cent at constant currency reflecting the impact of rate rebalancing and increased volumes of interconnect traffic driven by increasing numbers of competitors in the market. Mobile revenue increased by 19 per cent at constant currency due to increased customer numbers, supported by the launch of GSM services in all major regions. The mobile customer base at 31 March 2004 was 1,141,000 compared to 943,000 at 31 March 2003. Data and IP continued to deliver strong growth with revenue rising by 17 per cent at constant currency.
Operating costs before depreciation, amortisation and exceptional items at £442 million in 2004, were £25 million, or 5 per cent, lower than in 2003. At constant currency rates there was an underlying increase of 12 per cent compared with 2003. Outpayments and network costs increased by 2 per cent at constant currency rates reflecting increased mobile handset subsidy costs as a result of intensified competition and the launch of GSM services in major regions.
Staff costs were £23 million lower in 2004 compared with 2003. At constant currency rates, staff costs were 6 per cent lower than 2003 reflecting the reduction in headcount to 4,254 from 5,073 in the prior year.
Year ended 31 March 2003 compared with year ended 31 March 2002 |
Turnover at £756 million in 2003 was £69 million or 8 per cent lower than in 2002. At constant currency rates, turnover was 1 per cent higher mainly due to a 26 per cent increase in mobile revenues. Despite competition the mobile subscriber base increased by 65 per cent to 943,000 subscribers. International voice revenues were 8 per cent lower at constant exchange rates largely due to declining tariffs reflecting tariff rebalancing, the removal of cross subsidies between international and domestic services. There was a 6 per cent increase in domestic voice revenues, which
reflected the impact of rebalancing and market growth, particularly in fixed to mobile traffic.
Operating costs before depreciation, amortisation and exceptional items were £467 million in 2003, £13 million or 3 per cent lower than in 2002. At constant exchange rates, operating costs were 7 per cent higher in 2003 than 2002 primarily due to increased outpayments and network costs. The growth in outpayments and network costs was mainly attributable to the revenue growth against a background of liberalisation leading to increased traffic volumes, customer numbers and terminations on third party networks. In addition, customer acquisition costs, including mobile handset subsidies rose.
In the Caribbean, operating profit at £228 million in 2003 was £114 million or 100 per cent higher than in 2002. This increase was largely attributable to the non-recurrence of a £172 million impairment charge to write-down network and TDMA assets in 2002, partly offset by £19 million of exceptional costs relating to reorganisation and redundancy incurred in 2003.
Japan and Asia |
| 2004 | 2003 | 2002 | ||||||||
| £m | £m | £m | ||||||||
| Turnover | 286 | 379 | 432 | |||||||
| Costs | ||||||||||
Outpayments and network costs1 | (159 | ) | (240 | ) | (261 | ) | ||||
| Staff costs | (46 | ) | (54 | ) | (43 | ) | ||||
| Other | (59 | ) | (64 | ) | (59 | ) | ||||
| (264 | ) | (358 | ) | (363 | ) | |||||
| Depreciation before exceptionals | (26 | ) | (62 | ) | (35 | ) | ||||
| Amortisation before exceptionals | – | (4 | ) | (24 | ) | |||||
| Joint ventures and associates | – | – | – | |||||||
| Operating (loss)/profit before exceptionals | (4 | ) | (45 | ) | 10 | |||||
| Exceptional items | ||||||||||
| – depreciation | (126 | ) | (145 | ) | (33 | ) | ||||
| – amortisation | – | (61 | ) | (124 | ) | |||||
| – other operating costs | (7 | ) | (15 | ) | – | |||||
Operating loss | (137 | ) | (266 | ) | (147 | ) | ||||
| 1 | Outpayments and network costs include customer acquisition costs and the cost of goods sold. |
Page 35
operating and financial review
Year ended 31 March 2004 compared with year ended 31 March 2003 |
Operating losses in Japan and Asia have reduced by £129 million or 48 per cent since 2003 to £137 million in 2004, of which £88 million was attributable to lower exceptional charges. Operating losses before exceptional charges of £4 million in 2004 were £41 million lower than in 2003. This decrease was primarily attributable to a £40 million reduction in the depreciation and amortisation charges reflecting the asset impairments in 2003.
Operating profit before depreciation, amortisation and exceptionals in 2004 at £22 million was broadly in line with 2003 as the benefit of a £94 million reduction in the cost base offset a £93 million reduction in revenues.
Enterprise revenues were £44 million lower reflecting the termination of the provision of local services in Hong Kong, pricing pressures on globally managed contracts and the termination of a major contract. Carrier Services and Business revenues also fell, by £32 million and £17 million respectively, as customers migrated to their own networks and competition increased.
The lower cost base in 2004 reflected the benefit of a 25 per cent reduction in headcount, reduced outpayments associated with the decline in revenues, low property costs and a reduction in the bad debt charge.
Year ended 31 March 2003 compared with year ended 31 March 2002 |
In Japan, operating losses at £266 million in 2003 were £119 million or 81 per cent higher than in 2002 mainly due to increased charges for asset impairment and lower revenues, particularly in Carrier Services.
Panama |
| 2004 | 2003 | 2002 | ||||||||
| £m | £m | £m | ||||||||
| Turnover | 265 | 279 | 296 | |||||||
| Costs | ||||||||||
Outpayments and network costs1 | (74 | ) | (69 | ) | (73 | ) | ||||
| Staff costs | (27 | ) | (33 | ) | (43 | ) | ||||
| Other | (55 | ) | (41 | ) | (47 | ) | ||||
| (156 | ) | (143 | ) | (163 | ) | |||||
| Depreciation before exceptionals | (39 | ) | (45 | ) | (52 | ) | ||||
| Amortisation before exceptionals | – | – | – | |||||||
| Joint ventures and associates | – | – | – | |||||||
| Operating profit before exceptionals | 70 | 91 | 81 | |||||||
| Exceptional items | ||||||||||
| – depreciation | (65 | ) | – | (19 | ) | |||||
| – amortisation | – | – | – | |||||||
| – other operating costs | (8 | ) | (14 | ) | – | |||||
Operating (loss)/profit | (3 | ) | 77 | 62 | ||||||
| 1 | Outpayments and network costs include customer acquisition costs and the cost of goods sold. |
Year ended 31 March 2004 compared with year ended 31 March 2003 |
Panama reported an operating loss of £3 million in 2004 compared with a £77 million operating profit in the prior year, mainly due to a £65 million impairment of fixed assets in 2004, together with an £8 million exceptional charge relating to staff rationalisation. These charges have been required to write down assets and reduce staff costs to mitigate the absence of universal service law protection in Panama. Operating profit before exceptionals in 2004 was £21 million, or 23 per cent, lower than in 2003. At constant currency rates, there was an underlying reduction of 16 per cent.
Revenue fell by 5 per cent in the year to £265 million but, at constant currency rates, rose by 4 per cent. Strong growth in mobile, reflecting the introduction of GSM, and data and IP revenues was only partly offset by lower international and domestic revenues due to increased competition following the liberalisation of these markets from January 2003.
Operating costs before depreciation, amortisation and exceptional items in 2004 were £13 million, or 9 per cent, higher than in 2003. There was an underlying increase of 19 per cent at constant currency rates. Outpayments and
Page 36
operating and financial review
network costs increased by 17 per cent at constant currency rates reflecting changes in the sales mix and a consequent increase in mobile subscriber acquisition costs, and higher outpayments as more traffic terminated on third party networks following the introduction of competition. Staff costs fell as headcount was reduced from 2,218 to 1,881. Other costs in 2004 included a one-off £9 million cost associated with the settlement of a lawsuit.
Year ended 31 March 2003 compared with year ended 31 March 2002 |
In Panama, operating profit at £77 million in 2003 was £15 million or 24 per cent higher than in 2002. At constant currency rates there was a 33 per cent increase in operating profit in 2003 compared with 2002. This increase was largely attributable to lower outpayments, headcount savings and reduced depreciation and exceptional charges.
Macau |
| 2004 | 2003 | 2002 | ||||||||
| £m | £m | £m | ||||||||
| Turnover | 128 | 146 | 145 | |||||||
| Costs | ||||||||||
Outpayments and network costs1 | (51 | ) | (57 | ) | (58 | ) | ||||
| Staff costs | (12 | ) | (15 | ) | (16 | ) | ||||
| Other | (7 | ) | (14 | ) | (13 | ) | ||||
| (70 | ) | (86 | ) | (87 | ) | |||||
| Depreciation before exceptionals | (18 | ) | (18 | ) | (20 | ) | ||||
| Amortisation before exceptionals | – | – | – | |||||||
| Joint ventures and associates | – | – | – | |||||||
| Operating profit before exceptionals | 40 | 42 | 38 | |||||||
| Exceptional items | ||||||||||
| – depreciation | (2 | ) | – | – | ||||||
| – amortisation | – | – | – | |||||||
| – other operating costs | – | – | – | |||||||
Operating profit | 38 | 42 | 38 | |||||||
| 1 | Outpayments and network costs include customer acquisition costs and the cost of goods sold. |
Year ended 31 March 2004 compared with year ended 31 March 2003 |
Operating profit in Macau fell by 10 per cent from £42 million in 2003 to £38 million in 2004. Revenues
declined by 12 per cent or 4 per cent at constant currency rates reflecting increased competition. Operating costs before depreciation, amortisation and exceptional charges were £16 million lower in 2004 or 11 per cent at constant currency rates. This reduction included the benefit of lower marketing costs, reduced headcount, and general tightening of other operating expenses.
Year ended 31 March 2003 compared with year ended 31 March 2002 |
Macau’s operating profit at £42 million in 2003 was £4 million or 11 per cent higher than in 2002. At constant currency rates there was an 18 per cent increase in operating profit. This increase reflected a good performance in data and IP, driven by growing demand for broadband services and other value added internet services.
Rest of the World |
| 2004 | 2003 | 2002 | ||||||||
| £m | £m | £m | ||||||||
| Turnover | 161 | 159 | 138 | |||||||
| Costs | ||||||||||
Outpayments and network costs1 | (40 | ) | (35 | ) | (40 | ) | ||||
| Staff costs | (27 | ) | (28 | ) | (20 | ) | ||||
| Other | (22 | ) | (16 | ) | (18 | ) | ||||
| (89 | ) | (79 | ) | (78 | ) | |||||
| Depreciation before exceptionals | (20 | ) | (22 | ) | (17 | ) | ||||
| Amortisation before exceptionals | 3 | 2 | – | |||||||
| Joint ventures and associates | 12 | 29 | 26 | |||||||
| Operating profit before exceptionals | 67 | 89 | 69 | |||||||
| Exceptional items | (1 | ) | (1 | ) | – | |||||
Operating profit | 66 | 88 | 69 | |||||||
| 1 | Outpayments and network costs include customer acquisition costs and the cost of goods sold. |
Year ended 31 March 2004 compared with year ended 31 March 2003 |
Rest of the World comprises Cable & Wireless’ businesses in Guernsey, Bahrain and the Maldives, together with smaller operations in the Seychelles, Bermuda, Sakhalin in Russia, Diego Garcia, Falkland Islands, Fiji, Ascension, St Helena, Vanuatu and Solomon Islands. Guernsey and the Maldives account for 54 per cent of the Rest of the World revenue.
Page 37
operating and financial review
The operating profit for the Rest of the World was £66 million in 2004 compared with £88 million in 2003.
Operating costs increased by 13 per cent from £79 million in 2003 to £89 million in 2004, including an increase in licence fee payments and administrative costs. The income from joint ventures and associates fell by 59 per cent from £29 million to £12 million due to increased competition and the impairment in carrying value of associates.
Year ended 31 March 2003 compared with year ended 31 March 2002 |
Rest of the World delivered operating profit of £88 million in 2003, £19 million or 28 per cent higher than in 2002. At constant currency rates, operating profit in 2003 was 41 per cent higher than in 2002. A good performance in the Maldives and Bahrain and the inclusion of ten months’ activity for Cable & Wireless Guernsey were offset by mixed performances in the smaller territories.
| LIQUIDITY AND CAPITAL RESOURCES |
Treasury policy |
The Group’s treasury operations are managed on the basis of objectives, policies and authorities approved by Cable and Wireless plc’s Board of Directors.
Day to day management of treasury activities is monitored by the Treasury Management Committee, which comprises the Chief Financial Officer, the Group Treasurer and senior financial management.
To the extent that subsidiary operating companies undertake treasury transactions, these are governed by policies that are consistent with Group policy. All material transactions and positions are monitored by the Group treasury function, and where appropriate, reported to the Board. Additionally, all subsidiaries are required to report details of their cash, debt and hedging positions to Group treasury on a monthly basis.
The key responsibilities of the treasury function include funding, investment of surplus cash and the management of interest rate and foreign currency risk. The majority of the Group’s funding (approximately 84 per cent) and cash resources (approximately 92 per cent) are managed centrally.
Wherever possible individual companies in the Group are funded in, and operate in, their functional currency, many of which are linked, directly or indirectly, to the US dollar.
Cable & Wireless only uses derivatives and financial instruments including forward foreign exchange contracts, interest rate swaps, cross currency swaps and options in the management of its foreign currency and interest rate exposures in accordance with strategies agreed by the Treasury Management Committee and subject to policies approved by the Board. Derivatives are not used for trading or speculative purposes and all material derivative transactions and positions are monitored and reported to the Board. The Group does not have material derivative positions outstanding at 31 March 2004 as outlined in Note 25 to the Financial Statements.
Investment of surplus cash |
At 31 March 2004, Cable & Wireless had gross cash (including treasury instruments held as current asset investments) of £2,367 million (2003 – £3,165 million, 2002 – £4,888 million).
This surplus cash is a significant component of the Group’s overall liquidity and capital resources. Approximately 92 per cent of the Group’s cash is held centrally and is predominantly invested in short term bank deposits up to one year and AAA-rated money market funds.
In certain circumstances, it has been efficient to use surplus funds to repurchase bonds. A total of US$800 million of the US$1,504 million zero coupon exchangeable bonds was bought back at an average of 97 per cent of face value prior to final redemption in June 2003. In addition, a total of US$19 million of the US$400 million bond was bought back prior to final redemption in December 2003.
During 2002 the Group purchased £75 million of Credit Linked Notes issued by an AA-rated bank and referenced to the Company’s £200 million bond, which matures in 2012. This transaction has a similar economic effect to repurchasing the bonds for the period of the investment. In September 2003, £25 million of the Credit Linked Notes matured. Further information on these transactions is given in Note 25 to the Accounts.
Certain foreign subsidiaries operate in jurisdictions which may, and do, restrict the ability to repatriate cash to the parent company. In addition, some of the Group’s cash is required as cash collateral.
Page 38
operating and financial review
Restricted cash |
| 2004 | 2003 | ||||||
| £m | £m | ||||||
| Restricted jurisdictions | – | 49 | |||||
| Cash collateral | 40 | 30 | |||||
Total restricted cash | 40 | 79 | |||||
Amounts previously reported as held in restricted jurisdictions are not included in gross cash at 31 March 2004.
Funding |
At 31 March 2004, Cable & Wireless had gross debt of £919 million (2003 – £1,546 million, 2002 – £2,259 million).
The Group’s debt comprises both bank debt and publicly quoted bonds of which £44 million matures during the financial year to 31 March 2005. Cable & Wireless’ debt has an average maturity of approximately eight years.
Approximately 71 per cent of the Group’s debt is represented by public bonds denominated in sterling. During July 2003 the Group raised £258 million through the issue of sterling denominated Unsecured Convertible Bonds, which unless purchased, redeemed early or converted, will be redeemed at their principal amount in 2010. A further two sterling denominated bonds of £200 million each mature in 2012 and 2019 respectively.
The remainder of the Group debt represents primarily amortising loans with the exception of a loan of £121 million maturing in 2006.
On 9 June 2003, the US$1,504 million zero coupon exchangeable bonds, which were exchangeable into ordinary shares of PCCW, were redeemed at their principal amount. Prior to redemption the Group purchased US$800 million of the principal amount of the bonds at a discount to their face value.
On 16 December 2003, the US$400 million bonds were redeemed at their principal amount.
Cable & Wireless believes that its capital resources are sufficient to meet its current and planned requirements for at least the next 12 months. The Group’s ability to meet long-term capital requirements beyond this 12-month period will depend on many factors both inside and outside of its control. Cable & Wireless cannot be certain that additional financing, if required, will be available on terms favourable to the Group, if at all.
Interest rate management |
Approximately 82 per cent of Group debt has been raised at fixed rates of interest with approximately 71 per cent raised as fixed rate bonds.
The Group’s cash resources currently earn interest at floating rates. In prior years, in a falling interest rate environment, the Group has actively hedged its return on cash resources with the use of interest rate swaps and forward rate agreements.
As at 31 March 2004 the Group has £10 million (2003 – £12 million) notional value of derivative contracts outstanding used in the management of its floating interest rate exposures in respect of debt. As at 31 March 2004 the Group does not have any derivative contracts outstanding used in the management of its floating rate exposures in respect of investments (2003 – £1,999 million notional value).
Exchange rate management |
As at 31 March 2004 the Group has £50 million (2003 – £23 million) notional value of forward foreign exchange contracts for the purchase of currencies and £28 million (2003 – nil) notional value of forward foreign exchange contracts for the sale of currencies used in the management of its foreign currency trading exposures.
As at 31 March 2004 the Group has £121 million (2003 – £502 million) notional value of cross currency swaps used in the management of its foreign currency debt obligations. Prior year numbers also included forward foreign exchange contracts.
Borrowing facilities |
The Group does not have any significant undrawn committed facilities as at 31 March 2004.
Credit ratings |
The Company’s long-term credit ratings remained below investment grade during the year. Credit ratings at 1 June 2004 are detailed in the table below:
Cable and Wireless plc’s debt ratings | ||||
| Standard & Poor’s | BB | |||
| Moody’s | Ba3 | |||
| Fitch | BB+ | |||
Credit ratings below investment grade may limit future access to the debt capital markets and may both increase the future cost of funding and impact adversely the terms on which debt may be available. In addition, cash collateral or
Page 39
operating and financial review
guarantees may be required to support any future credit terms.
The current ratings do not have an impact on the interest cost of existing debt, 71 per cent of which is in the form of long-term bonds that bear interest at fixed rates.
Other loans and contractual obligations under leases |
Cable & Wireless’ loans and contractual obligations under finance and operating leases are analysed in Notes 21 and 27 to the Financial Statements.
None of the above funding arrangements and facilities has covenants that are expected to restrict normal business activities.
Off-balance sheet arrangements |
Operating leases |
In the normal course of its business, Cable & Wireless and its subsidiaries enter into operating leases, relating to property, customer terminating equipment and other operational commitments. Minimum lease terms range from 1 year to 50 years. The effect such obligations are expected to have on liquidity and cash flow in future periods is set out in the contractual obligations table below.
In addition, under certain property operating leases Cable & Wireless and its subsidiaries could be required to make payments to lessors at the end of the lease to restore the condition of the properties. These amounts will not be known until the leases expire.
Monaco Telecom |
On 2 June 2004 Cable and Wireless announced the purchase of a 55 per cent stake in Monaco Telecom S.A (“Monaco Telecom”) from Vivendi Universal for a total consideration of Euro 162 million, through the acquisition of 100 per cent of the issued share capital of Compagnie Monegasque de Communication.
The transaction was completed on 18 June 2004.
On completion, Cable & Wireless transferred a 6 per cent stake in Monaco Telecom to Compagnie Monégasque de Banque S.A.M (“CMB”) for consideration of Euro 18 million. CMB is Cable & Wireless’ financial partner in
Monaco Telecom and its 6 per cent stake is subject to certain put and call agreements with Cable & Wireless. Cable & Wireless has full management control of Monaco Telecom.
Monaco Telecom is 45 per cent owned by the Principality of Monaco (the “Principality”). Cable & Wireless has entered into a shareholders’ agreement with the Principality in which the Principality has a put option entitling it to put its 45 per cent shareholding in Monaco Telecom at certain times after 1 January 2008. The exercise price under the put option is fair market value, taking into account the nature of the minority stake in Monaco Telecom.
Other commitments and contingent liabilities |
Other commitments and contingent liabilities that have or are reasonably likely to have a current or future material effect on the Group’s financial condition, changes in financial condition, revenues or expenses, results of operations, liquidity, capital expenditures or capital resources are set out in Note 26 to the Financial Statements.
Contractual obligations |
The following table sets out the Group’s known contractual obligations as at 31 March 2004:
| Payments due by period | ||||||||||||||||
| Total | Less than 1 year | 2-4 years | 4-5 years | After 5 years | ||||||||||||
| Long-term debt, including current maturities | 911 | 41 | 170 | 25 | 675 | |||||||||||
| Capital lease obligations | 8 | 3 | 3 | 1 | 1 | |||||||||||
| Operating leases | 571 | 122 | 135 | 100 | 214 | |||||||||||
| Other | 34 | 34 | – | – | – | |||||||||||
Total | 1,524 | 200 | 308 | 126 | 890 | |||||||||||
The Group enters into a number of arrangements with other international carriers relating to the reciprocal transfer of telecommunications traffic between countries. Under these arrangements both parties are committed to transferring a minimum level of International Direct Dial traffic for termination on the other party’s network. Typically there is no net outflow of cash as a result of these transactions. These transactions are not included in the above table.
Page 40
operating and financial review
| CASH FLOW |
| Summary consolidated cash flow statement | ||||||||||
| 2004 | 2003 | 2002 | ||||||||
| £m | £m | £m | ||||||||
| Net cash inflows from operating activities | 73 | 95 | 94 | |||||||
| Return on investments and servicing of finance | (32 | ) | 65 | 159 | ||||||
| Taxation paid | (43 | ) | (438 | ) | (139 | ) | ||||
| Capital expenditure | (342 | ) | (810 | ) | (1,868 | ) | ||||
| Financial investment | 301 | 595 | 194 | |||||||
| Acquisitions and disposals | (118 | ) | 110 | 1,845 | ||||||
| Equity dividends paid | – | (119 | ) | (669 | ) | |||||
| Movement in liquid resources | 932 | (1,040 | ) | 2,586 | ||||||
| Net financing repaid | (582 | ) | (578 | ) | (567 | ) | ||||
Increase/(decrease) in cash in the year | 189 | (2,120 | ) | 1,635 | ||||||
The increase in cash of £189 million in the year principally reflects the transfer from liquid resources of cash totalling £932 million and the realisation of financial investments of £301 million, net of finance repayments of £582 million, capital expenditure of £342 million and net disposal costs of £118 million.
Operating activities generated £73 million of cash in 2004, a decline of £22 million against the prior period principally due to a reduction in working capital.
Tax paid in 2004 relates in the main to settlement of liabilities in the Caribbean and Rest of the World.
Capital expenditure of £342 million declined by £468 million from 2003. This reflects continued focus on the management of capital expenditure and its ability to generate a satisfactory return on investment.
Investment in the year included GSM networks rollout of £111 million in the Caribbean and Panama, together with expenditure on billing systems, network management systems, customer premises equipment and network terminating equipment.
Financial investment generated net cash of £301 million in 2004 of which £229 million related to the proceeds on disposal of the Group’s shareholding in PCCW.
Liquid resources decreased by £932 million in 2004. On 1 April 2003 £1.5 billion held in escrow was released into cash.
Net financing repaid in 2004 of £582 million included long-term debt repayments of £863 million offset by long-term debt issued of £280 million.
| DISCLOSURES ABOUT MARKET RISK |
Credit risk |
Cash deposits and other financial instruments give rise to credit risk, which represents the loss that would be recognised if a counterparty failed to perform as contracted.
The counterparties to the Group’s financial instruments are major international institutions and the credit rating of these counterparties is monitored on a regular basis in accordance with guidelines established by the Board. The types of instrument used for investment of funds are prescribed in Group treasury policies with limits on the exposure to any one counterparty.
Interest rate risk |
The Group is exposed to movements of interest rates on its debt, surplus cash balances and derivative instruments. The treasury function seeks to reduce volatility by fixing a proportion of interest rates in advance taking account of prevailing market conditions as appropriate.
Taking account of such actions, a 50 basis point increase in interest rates to which the Group is exposed would increase
net interest income by approximately £10 million. A 50 basis point reduction in interest rates would reduce net interest income by the same amount.
Exchange rate risk |
Cable & Wireless trades in some 80 countries and much of its revenue is from international traffic flows settled in major currencies, principally US dollars. In addition, many of the currencies of the countries in which Cable & Wireless operates are linked, directly or indirectly, to the US dollar.
The Group is exposed to movements in exchange rates in relation to foreign currency payments, dividend income from foreign subsidiaries, reported profits of foreign subsidiaries and the net asset carrying value of foreign investments.
Where appropriate the Group manages its exposure to movements in exchange rates on a net basis and uses forward foreign exchange contracts and other derivative and financial instruments to reduce the exposures created where currencies do not naturally offset in the short term. The
Page 41
operating and financial review
Group currently does not undertake any hedges of long-term currency trading flows.
Where it is deemed appropriate the Group will undertake hedges to minimise the exposure to individual transactions that create significant foreign exchange exposures for the Group.
The reported profits of the Group are translated at average rates of exchange ruling during the year. In broad terms, based on the 2004 mix of profits, the impact of a unilateral 1 per cent weakening of sterling would have been to reduce the operating profit before exceptional items by approximately £2 million. The Group does not undertake profit translation hedging activities.
Overseas subsidiaries are generally financed in their domestic currency. However, in Jamaica it is impractical to implement this policy due to limited availability of local currency funding. Consequently Cable & Wireless Jamaica is predominantly funded with foreign currency borrowings.
As part of the overall policy of managing the exposure arising from foreign exchange movements relating to the net carrying value of overseas investments, the Group may, from time to time, elect to match certain foreign currency liabilities against the carrying value of foreign investments. Currently there are no external foreign currency liabilities matched against the carrying value of foreign investments.
Page 42
operating and financial review
| FIVE YEAR SUMMARY |
| PROFIT AND LOSS ACCOUNT YEAR ENDING 31 MARCH | ||||||||||||||||||||||||
| 2004 | 2003 | 2002 | 5 | 2001 | 5 | 2000 | ||||||||||||||||||
| £m | £m | £m | £m | £m | ||||||||||||||||||||
| (in £m except per share and per ADR data) | ||||||||||||||||||||||||
| Amounts in accordance with UK GAAP1 | ||||||||||||||||||||||||
| Group turnover | 3,671 | 4,391 | 5,748 | 7,851 | 9,201 | |||||||||||||||||||
| Group operating loss | (581 | ) | (6,075 | ) | (5,025 | ) | (382 | ) | (350 | ) | ||||||||||||||
| (Loss)/profit before taxation | (224 | ) | (6,373 | ) | (4,549 | ) | 3,516 | 4,089 | ||||||||||||||||
| (Loss)/profit after taxation | (212 | ) | (6,409 | ) | (4,860 | ) | 2,996 | 3,768 | ||||||||||||||||
| Minority interests | (25 | ) | (124 | ) | (94 | ) | (258 | ) | 150 | |||||||||||||||
| (Loss)/profit for the financial year | (237 | ) | (6,533 | ) | (4,954 | ) | 2,738 | 3,918 | ||||||||||||||||
| Basic (loss)/earnings per share (EPS) | (10.2 | )p | (280.4 | )p | (181.2 | )p | 100.3 | p | 161.6 | p | ||||||||||||||
| Basic (loss)/earnings per ADR2 | (30.6 | )p | (841.2 | )p | (543.6 | )p | 300.9 | p | 484.8 | p | ||||||||||||||
| Diluted EPS | (10.2 | )p | (280.4 | )p | (181.2 | )p | 99.2 | p | 158.7 | p | ||||||||||||||
| Diluted (loss)/earnings per ADR2 | (30.6 | )p | (841.2 | )p | (543.6 | )p | 297.6 | p | 476.1 | p | ||||||||||||||
| Dividends per share3 | 3.15 | p | 1.6 | p | 16.5 | p | 16.5 | p | 15.0 | p | ||||||||||||||
| Dividends per ADR2 | 9.45 | p | 4.8 | p | 49.5 | p | 49.5 | p | 45.0 | p | ||||||||||||||
| Amounts in accordance with US GAAP (as restated)1 | ||||||||||||||||||||||||
| Net (loss)/income | (371 | ) | (6,239 | ) | (5,371 | ) | 2,716 | 3,538 | ||||||||||||||||
| Basic EPS | (15.9 | )p | (267.8 | )p | (196.5 | )p | 99.5 | p | 145.9 | p | ||||||||||||||
| Basic (loss)/earnings per ADR2 | (47.8 | )p | (803.3 | )p | (589.5 | )p | 298.5 | p | 437.7 | p | ||||||||||||||
| Diluted EPS | (15.9 | )p | (267.8 | )p | (196.5 | )p | 98.4 | p | 143.2 | p | ||||||||||||||
| Diluted (loss)/earnings per ADR2 | (47.8 | )p | (803.3 | )p | (589.5 | )p | 295.2 | p | 429.6 | p | ||||||||||||||
| Income from Continuing Operations in accordance with UK GAAP6 | ||||||||||||||||||||||||
| Group turnover | 3,384 | 3,677 | 4,084 | 4,111 | 3,648 | |||||||||||||||||||
| Group operating loss | (529 | ) | (4,233 | ) | (2,674 | ) | (338 | ) | (1,008 | ) | ||||||||||||||
| BALANCE SHEET DATA AS AT 31 MARCH | ||||||||||||||||||||||||
| Amounts in accordance with UK GAAP1 | ||||||||||||||||||||||||
| Current assets4 | 3,280 | 4,906 | 7,890 | 10,480 | 7,087 | |||||||||||||||||||
| Total assets | 4,967 | 7,362 | 16,197 | 24,267 | 21,528 | |||||||||||||||||||
| Net assets | 1,993 | 2,520 | 9,357 | 16,383 | 10,775 | |||||||||||||||||||
| Loans and obligations under finance leases: | ||||||||||||||||||||||||
| – amounts falling due within one year | 44 | 825 | 237 | 567 | 761 | |||||||||||||||||||
| – amounts falling due after more than one year | 875 | 721 | 2,022 | 2,364 | 5,484 | |||||||||||||||||||
| Other creditors falling due within one year | 1,624 | 2,450 | 3,734 | 4,069 | 3,784 | |||||||||||||||||||
| Creditors and provisions | 2,974 | 4,842 | 6,840 | 7,884 | 10,403 | |||||||||||||||||||
| Equity shareholders’ funds | 1,744 | 2,149 | 8,958 | 15,252 | 7,746 | |||||||||||||||||||
| Called up share capital and reserves | 2,448 | 2,446 | 2,445 | 5,570 | 2,199 | |||||||||||||||||||
| Number of shares issued (million of shares) | 2,385 | 2,383 | 2,382 | 2,801 | 2,440 | |||||||||||||||||||
| Amounts in accordance with US GAAP (as restated) 1 | ||||||||||||||||||||||||
| Shareholders’ equity | 1,787 | 2,125 | 9,158 | 16,190 | 9,840 | |||||||||||||||||||
| 1 | The Financial Statements are prepared in accordance with UK GAAP, which differs in significant respects from US GAAP. See Note 36 ‘Summary of differences between United Kingdom and United States GAAP’ to the Financial Statements. |
| 2 | ADR (American Depositary Receipt) amounts have been computed on the basis that one ADR represents three Ordinary Shares of 25p each in the Company (“Ordinary Shares”). |
| 3 | Dividends per share and per ADR are based on interim and final dividends paid per Ordinary Share before deduction of withholding taxes. See ‘Shareholder Information – Taxation’. |
| 4 | Current assets exclude debtors due after more than one year. |
| 5 | The results for 2002 and 2001 and balance sheet for 2002 have been adjusted to reflect the change in accounting policy for capacity sales in light of the adoption of UITF Abstract 36 ‘Contracts for sales of capacity’ and related consequential effects. |
| 6 | In December 2003, Cable & Wireless’ US operations filed for Chapter 11 bankruptcy protection under the US Bankruptcy Code and were deconsolidated from 8 December. At 31 December 2003, the licences held by TeleYemen, Cable & Wireless’ subsidiary in Yemen, expired and the Group ceased operations in Yemen from that date. Under FRS 3 – ‘Reporting Financial Performance’, these businesses have been classified as discontinued. Comparatives for the years ended 31 March 2000 to 31 March 2003 have been adjusted accordingly. |
Page 43
operating and financial review
| CRITICAL ACCOUNTING POLICIES |
In the preparation of Cable & Wireless’ consolidated financial statements a number of estimates and assumptions are made relating to the reporting of results of operations and financial condition. Results may differ significantly from those estimates under different assumptions and conditions. Cable & Wireless believes that the following discussion addresses its most critical accounting policies, which are those that are most important to the presentation of its consolidated financial condition and results. These particular policies require subjective and complex judgements, often as a result of the need to make estimates about the effect of matters that are inherently uncertain.
Valuation of fixed assets and goodwill |
Cable & Wireless assesses the impairment of fixed assets and goodwill whenever events or changes in circumstances indicate that the carrying value may not be recoverable or otherwise as required by accounting standards. Factors that are considered important which could trigger an impairment review include the following:
| • | significant under-performance relative to expected historical or projected future operating results; |
| • | significant changes in the use of its assets or the strategy for its overall business; |
| • | significant changes in technology and regulatory environments; |
| • | significant negative industry or economic trends; and |
| • | significant decline in its stock price for a sustained period and its market capitalisation relative to net book value. |
Cable & Wireless determines any impairment by comparing the carrying values of each of Cable & Wireless’ income generating units to their recoverable amounts (the higher of net realisable value and the present value of the future cash flows obtainable as a result of an asset’s continued use). During 2004, Cable & Wireless impaired tangible fixed assets by £526 million (2003 – £2,381 million, 2002 – £1,909 million) and goodwill by £10 million (2003 – £2,725 million, 2002 – £2,007 million). The impairment represented the amount by which the carrying value exceeded the present value of the estimated future cash flows.
Future cash flows were determined with reference to Cable & Wireless’ five year projections using discount rates from 10.5 per cent to 20 per cent which represent the estimated weighted average cost of capital for the respective businesses. Changes to the assumptions used by management to determine the level of impairment required such as the discount rate could significantly affect Cable & Wireless’ results.
Depreciation and amortisation of fixed assets |
Cable & Wireless assigns useful lives to fixed assets based on periodic studies of actual asset lives and the intended use for those assets for example, related to fixed assets purchased for specific customer contracts. Changes in circumstances such as technological advances, prospective economic utilisation and physical condition of the assets concerned could result in the actual useful lives differing from initial estimates. Where Cable & Wireless determines that the useful life of property and equipment should be shortened, Cable & Wireless depreciates the net book value in excess of the residual value over the revised remaining useful life, thereby increasing depreciation expense. Any change in asset lives would be reported in Cable & Wireless’ financial statements when the change in estimate is determined. There have been no significant changes in asset lives during the periods presented other than that the asset lives of TDMA mobile assets have been revised downwards in light of technological change in the current period.
Revenue recognition |
Revenue, which excludes value added tax or other sales taxes, represents the amount receivable in respect of telecommunications services provided to customers and is accounted for on the accruals basis to match revenues with provision of service. Revenue is recognised monthly as services are provided. Revenue in respect of services invoiced in advance is deferred and recognised on provision of the service. Revenue in respect of unbilled services is accrued.
An Amendment to FRS 5 ‘Reporting the substance of transactions: Revenue Recognition’ which is effective for periods ending on or after 23 December 2003 was issued in November 2003. The Amendment deals with revenue recognition from the supply of goods or services to customers.
Management’s judgement is required in assessing the application of the principles and the specific guidance in respect of Group revenues. This is particularly relevant for the Group with regard to the presentation of turnover as principal or as agent in respect of income received from transmission of content provided by third parties.
Interconnection with other operators |
In Cable & Wireless’ normal course of business it interconnects its networks with other telecommunications operators. In certain instances it uses estimates to determine the amount of income receivable from or payments to these other operators. The prices at which these services are charged are sometimes regulated and may be subject to
Page 44
operating and financial review
retrospective adjustment. Estimates are used in assessing the likely effect of these adjustments.
These interconnect transactions are distinguished from capacity sales which represent sales of Indefeasible Rights of Use (“IRUs”). IRUs give the purchaser the right to use a cable fibre or wavelength for a specified period of time. There were no capacity sales in 2004.
Exceptional items |
Under UK GAAP, the Company classified the following income/(costs) as exceptional items:
| 2004 | 2003 | 2002 | ||||||||
| £m | £m | £m | ||||||||
| Exceptional operating costs | (244 | ) | (442 | ) | (210 | ) | ||||
| Exceptional depreciation | (526 | ) | (2,381 | ) | (1,909 | ) | ||||
| Exceptional amortisation | (10 | ) | (2,725 | ) | (2,007 | ) | ||||
| Exceptional profits less (losses) on sale or termination of operations | 250 | (147 | ) | 1,057 | ||||||
| Exceptional write down of investments | – | (390 | ) | (904 | ) | |||||
| Exceptional profits on disposal of fixed assets | 28 | 62 | – | |||||||
Judgement is required to classify such items as exceptional items. The Company is guided by FRS 3 ‘Reporting Financial Performance’ which provides that material items which derive from events or transactions that fall within the ordinary activities are disclosed as exceptional items by virtue of their size or incidence such that the financial statements give a true and fair view. Exceptional depreciation and amortisation arise from the impairment review discussed above within ‘Valuation of fixed assets and goodwill’.
Exceptional operating costs |
In the year ended 31 March 2004 exceptional items included in other operating costs related principally to impaired assets and redundancy and reorganisation costs incurred during the year. These provisions are based on various assumptions, including future severance costs, sublease or disposal costs and contractual termination costs. Such estimates are judgmental and may change based on actual experience.
Liabilities |
The Company complies with FRS 12 ‘Provisions, contingent liabilities and contingent assets’. A provision is recognised when there is a constructive obligation in respect of a past event. Provisions and liabilities are recognised in respect of tax, pensions, transactions and restructurings. Management’s judgement is required to quantify such amounts.
Pensions |
The regular cost of providing benefits under defined benefit schemes is charged to operating profit over the expected remaining service lives of the members of the schemes so as to achieve a constant percentage of pensionable pay. Variations from the regular cost arising from periodic actuarial valuations of the principal defined benefit schemes are allocated to operating profit over the expected remaining service lives of the members.
The expected cost of providing these defined benefit pensions will depend on an assessment of such factors as:
| • | the life expectancy of the members; |
| • | the length of service; |
| • | the rate of salary progression; |
| • | the rate of return earned on assets in the future; and |
| • | the rate used to discount future pension liabilities. |
The assumptions used by Cable & Wireless are set out in Note 8 to the accounts and are estimates chosen from a range of possible actuarial assumptions which may not necessarily be borne out in practice but are comparable to the median estimates in this regard used by other FTSE 100 companies. Changes to these assumptions could materially impact the size of the defined benefit scheme deficit of £403 million, calculated under FRS 17, ‘Retirement Benefits’, disclosed in Note 8.
International Financial Reporting Standards |
Cable & Wireless will be required to adopt International Financial Reporting Standards (“IFRS”) with effect from 1 April 2005. An initial assessment of the impact on Cable & Wireless’ financial statements and the underlying processes and systems has been made. A detailed implementation plan is now in progress to enable the preparation of the Group’s financial statements under IFRS for periods from 1 April 2005, together with relevant comparatives.
Page 45
operating and financial review
| US GAAP RECONCILIATION |
The Company prepares its consolidated financial statements in accordance with UK GAAP, which differs in significant respects from US GAAP, see Note 36 ‘Summary of differences between United Kingdom and United States GAAP’. A comparison of net loss and shareholders’ equity of Cable & Wireless when applying UK and US GAAP is provided in the table below:
| Net loss | |||||||
| UK GAAP | US GAAP | ||||||
| £m | £m | ||||||
| Year ended 31 March 2004 (as restated) | (237 | ) | (371 | ) | |||
| Year ended 31 March 2003 (as restated) | (6,533 | ) | (6,239 | ) | |||
| Year ended 31 March 2002 | (4,954 | ) | (5,371 | ) |
| Shareholders’ equity | |||||||
| UK GAAP | US GAAP | ||||||
| as restated | |||||||
| £m | £m | ||||||
| As at 31 March 2004 | 1,744 | 1,787 | |||||
| As at 31 March 2003 | 2,149 | 2,125 | |||||
Recently issued accounting standards
In April 2003, the FASB issued SFAS No.149, Amendment of Statement 133 on Derivative Instruments and Hedging Activities. SFAS 149 amends and clarifies accounting for derivative instruments, including certain derivative instruments embedded in other contracts, and for hedging
activities under SFAS 133. SFAS 149 is effective for contracts entered into or modified after 30 June 2003 and for hedging relationships designated after 30 June 2003. The adoption of SFAS 149 did not have a material impact on the Group’s Financial Statements.
In May 2003, the FASB issued SFAS No. 150, Accounting for Certain Financial Instruments with characteristics of both Liabilities and Equity. SFAS 150 improves the accounting for certain financial instruments that, under previous guidance, issuers could account for as equity. SFAS 150 requires these instruments be classified as liabilities in the balance sheet. SFAS 150 is effective from 15 June 2003. The adoption of SFAS 150 did not have a material impact on the Group’s Financial Statements.
In December 2003, the FASB issued Summary of Interpretation No. 46R, Consolidation of Variable Interest Entities. FIN 46R addresses identification of variable interest entities and explains how an enterprise should assess whether it is the primary beneficiary of such entities. The Interpretation requires consolidation of variable interest entities by primary beneficiaries and provides guidance thereon. For entities that have, or potentially have, interests in variable interest entities FIN 46R was effective for periods ending on or after 15 December 2003. Application for all other types of entities is required for periods ending on or after 15 March 2004. The adoption of Summary of Interpretation No. 46R did not have a material impact on the Group’s Financial Statements.
Page 46
operating and financial review
| RISK FACTORS |
In addition to the other information contained in this Annual Report, investors in Cable & Wireless should consider carefully the risks described below. The Group’s financial condition or results of operations could be materially adversely affected should any of these risks arise. The risks described below are not the only risks facing the Group. Additional risks not currently known to the Group or risks that the Group currently regards as immaterial could also have a material adverse effect on the Group’s financial condition or results of operations.
Risks specific to Cable & Wireless’ business |
Failure to improve the performance and financial position of the Group successfully or to adapt as needed to changing market conditions could adversely affect the Group’s business, results of operations and potential for growth. |
In June 2003 Cable & Wireless announced that it was undertaking, over a three year period, a restructuring of its businesses to improve its position in a rapidly changing market place. Cable & Wireless’ plans for the implementation of this restructuring are incomplete in many respects, and the success of the restructuring will depend in part on factors that are beyond the Group’s control. Delays in implementation may lead to management not being able to concentrate on developing their businesses with certainty, or to pursue opportunities in their respective marketplaces. It may lead to staff retention problems, or staff resistance, such as industrial action or non-compliance with Group policies. Efforts to achieve desired cost savings are based on certain assumptions regarding the cost structure of the business which may or may not be correct. In addition, costs incurred in connection with restructuring efforts may be higher than estimated. Furthermore, as Cable & Wireless refines the plans for its restructuring, the Group may encounter significant obstacles that it has not yet anticipated and that prevent it from fully implementing the restructuring or fully achieving its strategic goals. As a result, the Group cannot assure shareholders that the goals of its strategy or restructuring plan will be fully achieved. Cable & Wireless also cannot assure shareholders that completion of the restructuring will result in the success of its strategy.
Transformation initiatives can lead to execution risk. |
The Group has been in rapid transition in the past few years, acquiring and disposing of a number of businesses, as well as implementing a number of reorganisation initiatives. In June 2003 Cable & Wireless announced its intention, over time, to expand its investment in national telecommunications operations. This may include acquiring further entities and businesses.
The Group has in the past and expects in the future to dedicate significant resources to integrate any businesses that it has or will acquire and to effect any rationalisation of its operations. There is an ongoing programme of internal transformation that seeks to create the structures and processes needed for the future of Cable & Wireless. Implementation of both these elements is complex, time-consuming and expensive, and without proper planning and execution, could significantly disrupt the Group’s business. The challenges involved include:
| • | combining service and product offerings and convincing customers and distributors not to defer purchasing decisions or not to switch to other suppliers due to uncertainty about the direction of the Group’s product offerings and our willingness to support and service existing products; this could result in incurring additional obligations in order to address customer uncertainty; |
| • | demonstrating to customers and distributors that the transaction or organisational changes will not result in adverse changes in service standards or business focus and helping customers conduct business easily; |
| • | consolidating, rationalising and improving corporate and subsidiary IT infrastructure, including implementing information and contract management and system processes that enable increased customer satisfaction, improved productivity, lower costs, more direct sales and improved inventory management; |
| • | consolidating and improving administrative infrastructure, including IT systems, and maintaining adequate controls throughout the integration; |
| • | coordinating sales and marketing efforts to communicate the Group’s strategy effectively; |
| • | preserving distribution, marketing or other important relationships and resolving potential conflicts that may arise; |
| • | minimising the diversion of management attention from ongoing business concerns; |
| • | coordinating and combining operations, subsidiaries, relationships and facilities, which may be subject to additional constraints imposed by local laws and regulations and also may result in contract terminations or renegotiations and labour and tax law implications; and |
| • | managing integration issues shortly after or pending the completion of other independent reorganisations. |
US exit |
In June 2003, Cable & Wireless announced that it planned to withdraw from the US domestic market. On 8 December 2003 CWA filed for Chapter 11 bankruptcy protection under
Page 47
operating and financial review
the US Bankruptcy Code. As a result of the court sanctioned auction process that ensued, SAVVIS Communications Corporation acquired substantially all of the assets of CWA for a sum of US$155 million in cash and approximately US$12.4 million of assumed liabilities on 8 March 2004.
Cable & Wireless understands that the proceeds will be applied to satisfy outstanding liabilities of CWA and the remaining assets of CWA will be wound down by the CWA estate. The CWA estate is responsible for dealing with creditors and related aspects of the Chapter 11 process. The CWA estate has filed a Plan of Liquidation and associated documents with the US Bankruptcy Court. There is no guarantee that the Plan of Liquidation will be implemented as currently set forth or on the timetable currently contemplated or at all. If the Plan of Liquidation is not implemented claims against CWA, Cable and Wireless plc and its non-bankrupt affiliates will not be released. As a result of Cable & Wireless’ withdrawal from the US domestic market, the Company has had to initiate a customer migration programme. Their customers may decline to migrate their business to the remaining Cable & Wireless network in the United States. Cable & Wireless’ failure to implement the Plan of Liquidation, obtain the releases contemplated by the Plan or retain its customers may adversely impact the Group’s financial condition.
The Group may not be able to adapt adequately to technological changes in communication and information technology. |
The telecommunications industry is subject to rapid and significant changes in technology. The development of new technologies could render its current services obsolete and non-competitive and require the Group to write-down further the book values of investments it has made in existing technologies. The Group’s business plan contemplates the introduction of services using new technologies and it may have to make substantial additional investments in new technologies in order to remain competitive. New technologies that it chooses to acquire may not prove to be successful, and the cost of implementation for emerging and future technologies could be significant and constitute a negative return on the investment. In addition, Cable & Wireless may not receive the necessary licences to provide services based on new technologies in jurisdictions in which it operates. It may also be forced to change its product and service offerings or pay higher costs if the third-party technology that it employs changes or if the price of such technology increases. As a result, the Group could lose customers, fail to attract new customers or incur substantial costs to maintain its customer base. Any such occurrence could have a material adverse effect on the Group’s financial results.
The Group’s results depend on the introduction of appropriate new products and services as the industry undergoes rapid changes. |
All sectors in which Cable & Wireless operates are characterised by changing customer demand for new products and services as new technologies become available.
If the new products and services that the Group develops and implements do not meet the demands of its existing and target customers, then the Group may not be able to recover its costs in developing such new products and services and it may lose market share. This could result in a material adverse effect on the Group’s financial results.
Network failure may expose the Group to potential liability or loss of customers. |
The Group’s operations are dependent upon networks, which may or may not be controlled by Cable & Wireless. Catastrophic network failure or a major network interruption may occur as a result of natural disasters, a loss of a major element of the network, security breaches, terrorist action or computer viruses. These failures or interruptions could cause delays or service interruptions resulting in the loss of customers. They could also expose the Group to claims from customers or could require expensive repairs or modifications, any of which could have a material adverse effect on the Group’s business.
Dependency on key personnel and skills. |
A number of key executive officers manage the Group’s businesses. In addition, the Group’s future success will depend in a large part on its continued ability to attract and retain highly skilled and qualified personnel, including those with project management experience and skills. The loss of key personnel or an inability to attract personnel of suitable calibre could have a material adverse effect on the business of Cable & Wireless.
The Group is reliant on third parties for certain activities under outsourcing contracts. Failure of those third parties to provide the contracted services may expose the Group to additional cost and liability. |
The Group has outsourced a number of support activities to third parties. In the event that the outsourcing company fails to deliver the contracted services, the Group may incur additional costs as it attempts to find an alternate supplier and its financial results might be adversely impacted.
Page 48
operating and financial review
The Group is dependent on a number of critical IT systems to be able to conduct its business and process financial information. |
In carrying out its business, the Group is dependent on the availability and reliability of a number of IT systems. In the event that any of these systems fail and disaster recovery and business continuity plans are ineffective, the Group may be exposed to additional costs and liabilities. In addition, many of these IT systems, such as billing, are legacy systems that operate on different platforms. The Group may be exposed to additional costs and liabilities in endeavouring to upgrade or integrate systems and may sustain costs or liabilities as a result of the inefficiencies posed by having multiple systems that in some instances cannot be readily reconciled.
Regulatory risk |
Cable & Wireless’ business may be materially adversely affected by changes in regulation and government policy in the countries in which it operates. |
The Group operates in some highly regulated markets, and its flexibility to manage its business can be constrained by regulation in these markets.
The Group’s ability to provide telecommunications services depends in most countries on receiving and maintaining government licences and authorisations. Failure to acquire and retain necessary regulatory approvals could impair its results of operations. Furthermore, regulatory regimes in some countries in which the Group operates are often less well established than in other countries where competition in the telecommunications sector has been established for longer. As a result, its business in these countries could be subject to unexpected political, economic or legal developments that impact telecommunications regulations and lead to the Group being unable to acquire or retain the regulatory approvals necessary to its business. Any such development could have a material adverse effect on its results or operations either in that jurisdiction or in aggregate.
The Group operates in a number of markets in which it has or, until recently had, exclusive licences for the provision of telecommunications networks and services. In the majority of these markets, the group is working with local governments and regulators to facilitate liberalisation of these markets. Liberalisation usually results in the imposition of new regulatory requirements on group companies. These new requirements are associated with the large or dominant market position which group companies have as a legacy of their exclusivity.
In other jurisdictions, the Group is dependent upon access to interconnection services and leased lines supplied under
regulated terms and conditions by local or national incumbent telecommunications operators.
Future regulation may materially impact the Group, for example by resulting in changes to the terms of interconnection agreements with other network operators and other similar agreements; imposing market-access barriers; setting price caps or other forms of price regulation; imposing limitations or investment obligations on construction of new facilities. The number of regulatory measures may also significantly increase, or become significantly more onerous as the jurisdictions in which the Group operates reform their telecommunications and related laws and regulations. Complying with new or more onerous regulations and restrictions may be costly for the Group, and may adversely impact the results of the Group’s operations and business condition.
Exposure to other telecommunications operators and the behaviour of other market participants may have a detrimental effect on the Group’s operations. |
The Group’s operations are, in part, dependent upon access to networks that it does not own or entirely control. Cable & Wireless’ operations depend on network operators to provide interconnection services for the origination, carriage and/or termination of some of its telecommunications services.
The Group has experienced interconnection capacity shortages in the past, and it may do so again if it is unable to obtain and maintain the necessary interconnection and other transmission services in a timely fashion and on acceptable commercial terms in each country in which it intends to introduce or continue to offer its telecommunications services. The Group may also be subject to the constraints, including financial constraints, of the relevant network operator, which may be unable to provide any or all of the capacity that the Group requests. If it cannot obtain the capacity it requires to adequately serve all of its existing customers or to connect all of its potential new customers, the Group may lose them to its competitors. All of this could adversely affect the Group’s business, financial condition and results of operations.
The Group may lose revenue if unlicensed operators are able to gain access to the Group’s network. |
In certain markets where the Group operates it suffers from revenue leakage where operators gain illegal access to its network. The Group takes considerable action to identify and prevent such occurrences, but the level of actions available to it may be limited by local regulation. To the extent that the Group’s efforts are not wholly successful, it may lose revenue and the Group’s financial performance be adversely impacted.
Page 49
operating and financial review
Risks specific to the telecommunications industry |
The Group’s business may be affected by a business downturn. |
A significant percentage of the Group’s revenue is generated by providing business customers with telecommunications, IP, voice, data, managed hosting services and content delivery.
Any slowdown in capital spending by service providers and other customers may affect revenues more than currently expected. Moreover, economic and geopolitical uncertainties and their potential impact on customer demand, create uncertainty as to market demand. As a result, revenues and operating results for a particular period can be difficult to predict. In addition, there can be no certainty as to the severity or duration of the current industry adjustment and the downturn in the business environment. The Group’s revenues and operating results have been and may continue to be materially and adversely affected by the continued reductions in demand from its customers.
In addition, a business downturn or fear of terrorist attacks may reduce the number of international tourists. This may depress local economies in some areas where the Group has businesses (for example in the Caribbean) and consequently adversely impact the financial results of the Group’s operations.
Generally unfavourable telecommunications market conditions may adversely affect the Group’s financial condition and results of operations. |
The telecommunications industry is currently facing unfavourable market conditions, including amongst other factors, the decline in demand for certain telecommunications products and services, pricing pressures and over-capacity. These market conditions have precipitated, in recent times, bankruptcy and insolvency filings by several telecommunications companies. In some cases the Group has outstanding debts with these companies and may not be able to collect all the debts due.
Some telecommunications markets in which the Group operates are in very early stages of development. If unfavourable market conditions prevent some or all of these markets from developing, or if they develop more slowly than Cable & Wireless anticipates, then the Group’s results of operations could be materially adversely affected.
The Group’s operations could suffer from adverse effects of competition and price pressures on the demand for products and services. |
The Group faces competition and downward pressure on prices in many areas and markets of its business. The Group’s competitors may be able to expand their network
infrastructures and service offerings more quickly than the Group. In addition, some competitors have entered and will likely continue to enter into joint ventures or alliances to provide additional services against which the Group may be unable to compete. The Group also believes the sector may experience consolidation in the near future, which could result, amongst other things, in further competition that would make it more difficult for Cable & Wireless to compete effectively.
As the markets for some of the Group’s services expand in certain locations, additional competition may emerge and existing competitors may commit more resources to the markets in which it participates. For example, governments in various countries in which the Group provides telecommunications services, in some cases on an exclusive basis and in others where it until recently provided services on an exclusive basis, have begun liberalising the telecommunications industry by introducing regulated competitive markets for some products and services in place of exclusive licences. The Group may lose market share to some of the competitors entering the market as a result of this transformation and its operating results and revenues may be adversely affected.
Competitors of Cable & Wireless may gain competitive advantage by successfully completing a restructuring or bankruptcy reorganisation process. |
Certain of the Group’s competitors in the United States have filed for Chapter 11 Bankruptcy protection under the US Bankruptcy Code. There is a possibility that where such competitors emerge from their restructuring with a significantly lower cost base than Cable & Wireless they will be able to compete more effectively than the Group. This could result in the Group losing market share which could in turn negatively impact the Group’s financial condition and results of operations.
In addition, given its own recent losses, the Group may lose customers to competitors if the customers have significant concerns over the future financial strengths and strategy of the Group.
Continued overcapacity and other factors could lead to lower prices for the Group’s products and services. |
The transatlantic, pan-European and US markets are all currently experiencing considerable levels of overcapacity. Overcapacity coupled with low levels of demand growth contributed to a severe price decline in these markets. This in turn has recently resulted in many network operators becoming financially distressed and filing for bankruptcy or Chapter 11 protection. This could compel the Group to lower prices to prevent erosion of its market share or to continue attracting new customers.
Page 50
operating and financial review
If the Group is forced to lower its prices the financial condition and results of operations may be adversely affected.
If the current overcapacity situation is not resolved or worsens, prices may continue to decline in the affected regions and such price decline could have a material adverse effect on the Group’s operations.
Legal and Other |
The Group may not have or may be unable to obtain sufficient insurance to cover all foreseeable risks. |
Cable and Wireless plc is a commercial organisation and, as such, takes risk based decisions on the purchase of insurance. The Group buys insurance appropriate to a group the size, nature and geographical spread of Cable and Wireless, and monitors the availability of coverage and the security of its insurers and reinsurers. It does not insure every risk that may affect the business even if insurance is available at commercial rates. Professional insurance brokers are used to assist in this process.
Since 1 April 2003 Cable and Wireless plc has purchased the majority of its commercial insurances via the telecommunications mutual, Pender Mutual Insurance Company Limited (“PMIC”). This vehicle was established in 2003 by some 45 telecommunications companies worldwide, including Cable and Wireless plc, for the purpose of providing insurance to its members. The concept of mutuality is the sharing of similar superior risks. The availability of insurance protection via this vehicle has advantages, such as coverage not typically available in the general market; and certain limitations, including the possibility of coverage limits being exhausted by other members of PMIC. The non-availability of this facility would potentially result in increased premiums to the Group. The Cable & Wireless Group’s wholly owned insurance subsidiary, Pender Insurance Limited, reinsures certain risks to PMIC.
The historic activities of the Group’s insurance subsidiary may result in material claims. |
Pender Insurance Limited (“Pender”) was established in the Isle of Man in 1990 to provide insurance to the Cable & Wireless Group and is regulated by the Isle of Man Insurance and Pensions Authority. It provided cover for various types of potential claims against or losses incurred by the Cable & Wireless Group. The cover included, for example, catastrophe cover, property damage, business interruption, professional indemnity and directors’ and officers’ liability.
Since September 2003 Pender has been managed by Thomas Miller Risk Management (Isle of Man) Ltd. The majority of
Pender’s directors are independent and based in the Isle of Man. It was advised by insurance and reinsurance brokers and service providers in the placing of its cover. Some of its operations were carried out by Cable & Wireless Group personnel under contract to Pender.
During calendar year 1997, Pender began to write policies for other companies connected with the telecommunications industry on a shared limits basis. Pender off-laid some of its exposure under these policies to the insurance market by way of reinsurance. However, Pender retained some exposure itself. Notwithstanding the reinsurance, Pender remains legally liable for all its policies.
With effect from 1 April 2003, Pender entered into an agreement with PMIC by which risks under the unexpired portions of the policies written in favour of the 43 Pender policyholders (including Cable & Wireless) were transferred to PMIC. PMIC is owned by the majority of the former Pender policyholders (including Cable & Wireless) and certain new members who joined on or after 1 April 2003. Following transfer of risk in the outstanding policies to PMIC, Pender notified and sought written releases from liability from all of its former policyholders in recognition of the assumption of risk by PMIC.
A majority, but not all, of Pender’s former policyholders supplied Pender with written releases in the requested form. Pender purchased limited reinsurance from PMIC to cover any remaining exposure to the former policyholders arising in respect of post 1 April 2003 claims. However, since the cover provided by Pender was wider than the reinsurance cover made available by PMIC, there is a risk that any claim successfully brought against Pender might not be fully covered by reinsurance.
From 1 April 2003, Pender began running off the pre 1 April 2003 insurance claims and has not taken on any new business for non-Cable & Wireless Group companies since then. Certain of Pender’s pre-existing policies with third parties are still current. The reinsurance provided by PMIC provides cover for a number of these policies.
The adverse factors that have affected the telecommunications industry in recent years, particularly as a result of US securities class actions, led to a significant increase in the seriousness of insurance claims against Pender prior to 1 April 2003, testing policy terms and limits.
One such insurance claim arose under a directors’ and officers’ liability policy issued to Global Crossing Inc. This claim was paid during the year at a cost, net of reinsurance recoveries, to Pender of approximately £19 million. Pender expects to recover further sums from its reinsurers in support of this settlement to reduce the net cost of the settlement to the company further.
Page 51
operating and financial review
Certain other insurance claims, notified by policyholders prior to 1 April 2003, remain with Pender, but as these claims have not yet been fully quantified or substantiated by the claimants, it remains impracticable to estimate their financial effects. In the event that Pender is unable to resist these insurance claims successfully and, in those cases where reinsurance exists, its reinsurance cover were to prove inadequate, Pender may be subject to significant liabilities which its assets may not be sufficient to meet. Moreover, there can be no assurance that these arrangements will not have a material adverse effect on the financial condition of the Cable & Wireless Group.
Pursuant to an internal investigation of the management practices at Pender, Cable & Wireless commenced suit, on 30 March 2004, against five companies and six individuals (five of whom were former Cable & Wireless employees). The Cable & Wireless Board does not believe that the circumstances giving rise to this suit have had or will have a material adverse effect on the Cable & Wireless Group.
Volatility in the financial markets may require the Group to provide further cash funding to its pension funds. |
Cable & Wireless currently maintains various defined benefit plans, which cover various categories of employees and retirees. The Group’s obligations to make contributions to fund benefit obligations under these plans are based on actuarial valuations, which themselves are based on certain assumptions about the long-term operation of the plans, including employee turnover and retirement rates, the performance of the financial markets, interest rates and expected longevity/mortality. If the actual operation of the plans differs from the assumptions, additional contributions may be required. The equity markets can be, and recently have been, volatile, and therefore the estimate of future contribution requirements can change significantly in a short period of time. Similarly, changes in interest rates may also impact funding requirements. If the Group is required to make significant contributions to fund the defined benefit plans, the reported results could be materially and adversely affected and the cash flow available for other uses may be significantly reduced.
Fluctuations in currency exchange rates may adversely affect the Group’s reported results and financial condition. |
A significant percentage of Cable & Wireless’ business is conducted outside the United Kingdom. The Group is thus exposed to movements in exchange rates in relation to foreign currency receipts and payments, dividend income from foreign subsidiaries, reported profits of foreign subsidiaries and the net asset carrying value of foreign investments.
The Group manages its exposure to movements in exchange rates on a net basis and uses forward foreign exchange contracts and other derivative and financial instruments to reduce the exposure.
To the extent that this hedging activity does not cover the exposure then the Group’s results of operations and financial condition may be negatively impacted by currency exchange rate movements.
Class actions may adversely impact the Group’s financial condition. |
The class actions detailed in ‘Business Description – Legal Proceedings’ have been filed against members of the Group in the United States. If any such class action is upheld by the US courts, it could, individually or in the aggregate, adversely impact on the Group’s financial condition. In addition, Cable & Wireless is from time to time involved in other material litigation, which if decided adversely to the Group could, individually or in the aggregate, adversely impact its financial condition or reputation.
Mobile communications devices may pose health risks. |
Media reports have suggested that radio frequency emissions from mobile telephone handsets and transmission facilities may pose various health risks, including cancer, and may interfere with various electronic medical devices, including hearing aids and pacemakers. Research and studies into the health risks posed by mobile telephone handsets and transmission facilities are ongoing. Cable & Wireless provides mobile services principally in the Caribbean, Panama and Macau and also provides national and international network capacity to mobile operators. Cable & Wireless continues to monitor scientific and medical research and studies, media, legal, regulatory and other developments, as well as the public perception of risk arising from the use of mobile telephone handsets. Scientific research on mobile telephone handsets and health has been reviewed by a number of independent expert scientific panels. None of these panels has concluded that the use of mobile telephone handsets is harmful to health.
Nonetheless, increased speculation regarding health risks associated with mobile telephone handsets and transmission facilities or any subsequent substantiation of such risks could have a material adverse effect on the Group’s business including through:
| • | a reduction in the number of actual and potential customers; |
| • | reduced usage per customer; |
| • | exposure to potential litigation or other liability; |
| • | regulatory intervention and new legislation; or |
| • | exposure to adverse publicity and damage to reputation. |
Page 52
corporate governance
This section contains:
| SOCIAL, ENVIRONMENTAL AND ETHICAL REPORT |
Cable & Wireless recognises the importance of building sound relationships with all of its stakeholders and is committed to approaching social, ethical and environmental matters in the same way as it approaches core business activities. The Board therefore sets standards of behaviour that go beyond minimum legal standards.
Board review of social, environmental and ethical issues |
The Board of Cable and Wireless plc takes regular account of the significance of social, ethical and environmental matters to the business. The Board identifies and assesses whether there are any potential significant risks to the Company’s short and long term value arising from social, environmental and ethical matters, as well as opportunities to enhance value that may arise from an appropriate response.
Specifically the Board:
| • | receives a report from management on the Group’s social, ethical and environmental performance on an annual basis and more frequently if required; |
| • | appointed Lord Robertson of Port Ellen to be responsible for social, ethical and environmental matters from March 2004; |
| • | arranged for the co-ordination and management of social, ethical and environmental matters to be carried out by an internal Corporate Responsibility Steering Group, to be chaired by Lord Robertson of Port Ellen and include representation from across the Group. The Steering Group is responsible for identifying emerging corporate responsibility issues which are material to the business, creating a system to monitor, manage and evaluate corporate responsibility activity and for reporting and communication on corporate responsibility issues; and |
| • | has ensured that the company’s risk management process includes an assessment of social, ethical and environmental risk. |
The Board has identified the following social, ethical and environmental issues as being of significant importance to the business:
Ethics |
Cable & Wireless has a Group-wide Ethics Policy, which was adopted by the Board to provide a set of standards and guidelines for the way that Cable & Wireless and its employees should operate. The Ethics Policy covers a range of issues including employee conduct, non- discrimination, health, safety and environmental obligations. The Company recognises that the Corporate Responsibility Steering Group’s work, and in particular on ethics, will evolve over time. The Company is committed to the continuous improvement of its Ethics Policy and its practical implementation. Breaches of the Ethics Policy are viewed seriously. During the year disciplinary action has been taken in respect of breaches of Company policy.
The Ethics Policy contains notification procedures setting out a variety of channels through which employees can raise concerns related to ethical conduct. The intention is that issues are generally dealt with at local business unit level but employees are also able to raise issues with the Chairman or Chief Executive Officer of Cable and Wireless plc or through other contacts at head office, as named in the Ethics Policy. A full version of the Ethics Policy is available on www.cw.com.
In addition to the Group’s Ethics Policy, which applies to all Group employees, pursuant to the requirements of the US Sarbanes Oxley Act of 2002, the Board has adopted a Code of Ethics specifically applicable to the Chief Executive Officer, the Chief Financial Officer, the heads of Group finance functions and the finance heads of each geographic division. This Code of Ethics is available on www.cw.com.
Community investment |
Good corporate citizenship has been part of the corporate ethos of Cable & Wireless for more than a century. As a major business, Cable & Wireless makes a substantial economic contribution to the many communities in which it operates. At the same time, its own business success depends upon the economic and social well-being of those same communities.
This mutual dependence is at the heart of Cable & Wireless’ commitment to make a positive social contribution to the communities in which it operates. As a result, Cable &
Page 53
corporate governance
Wireless has developed a community investment programme that is designed to support local communities and respond to their needs.
Despite difficult business conditions in recent years, Cable & Wireless has maintained its community activities and in January 2004 published Making a Difference: Cable & Wireless in the Community – the Group’s second community report providing details of community investment activity across the Group during 2003.
Community contribution |
In 2004 Cable & Wireless’ total Group wide community contribution was valued at £5.1 million. Of this £1.1 million was spent in the United Kingdom.
In line with business activities – and to help achieve the greatest impact and return from each investment – the Cable & Wireless community investment programme focuses on three main areas:
| • | addressing the digital divide; |
| • | internet safety and security; and |
| • | encouraging positive use of the internet and information communications technologies. |
Addressing the digital divide |
Cable & Wireless recognises that information and communications technologies (“ICT”) have an immense impact on almost all of our lives. The rapid development of ICT has brought significant advantage to those who have access to such technology and is playing a positive role in furthering personal, social and economic development.
Yet those with internet access make up only 19 per cent of the world’s population, leaving the majority unable to take advantage of ICT and at the wrong side of a growing ‘digital divide’. Cable & Wireless is working with governments, non-profit organisations and others to enable those from underprivileged communities to acquire the skills they need and gain access to ICT.
New ways of learning for disadvantaged children |
Cable & Wireless is working with UK children’s charity, NCH to demonstrate how ICT can help children with profound learning disabilities to communicate and learn. As part of NCH’s ‘Access to IT’ initiative, Cable & Wireless has enabled specially adapted ICT equipment to be installed at NCH’s Warren Park children’s centre in South London. The initiative, which has attracted support from a consortium of IT and telecoms companies, involves five pilot projects, each of which will showcase the significant difference that ICT can make to the learning and social outcomes of disadvantaged children.
A high-speed grid for learning |
In conjunction with the States of Guernsey Education Council, Cable & Wireless is creating a high-speed network for the benefit of schools and students in the Bailiwick. When Cable & Wireless took responsibility for the Island’s telecoms in 2002 it was able to complete a wide area network to link 27 schools and 9,000 students and teachers on the islands of Guernsey, Alderney and Herm. The network provides fast internet access and allows schools to share resources, helping to create an IT-literate community that is well ahead of the rest of the United Kingdom in its use of broadband technology.
Never too old to surf |
In May 2003, Cable & Wireless supported UK Online’s ‘Get Started’ campaign to encourage non-users to experience the internet for the first time. As part of the campaign, Cable & Wireless teamed up with Age Concern, Microsoft and the Office of the e-Envoy to offer older people free web taster sessions. Age Concern’s Silver Surfer Festival proved highly successful in encouraging over 65s, of whom 85 per cent have never used the web, to sample the internet.
Developing potential in Jamaica |
To build upon its commitment to provide free internet access to schools in Jamaica, Cable & Wireless established the Cable & Wireless Jamaica Foundation in November 2003. The Foundation, which will be endowed by a J$20million donation from the Company, aims to create opportunities for the positive development of young people in Jamaica, with a focus on education and sport. Following on from the success of the Group’s first charitable foundation in Panama, the Jamaica Foundation plans to expand access to ICT by providing computers and internet access through schools and libraries across the island using a number of innovative programmes.
Using the internet safely and securely |
The internet has transformed the way that people communicate, learn and interact. With its wealth of content, it can be a positive resource, offering exciting opportunities at home and in the classroom. Yet the web can also have hidden dangers. Cable & Wireless is working with industry partners to protect children from unsuitable content and raise awareness and understanding of internet safety issues.
Promoting internet safety in schools |
As part of this commitment, Cable & Wireless is working with children’s internet charity, Childnet International to help young people stay safe on-line. With further support from the Department for Education and Skills, Childnet International has developed Kidsmart; a school based
Page 54
corporate governance
internet safety programme. As part of the initiative, Childnet International has developed an interactive internet safety website www.kidsmart.org.uk together with internet safety guides for teachers, parents and pupils.
Promoting internet content labelling |
Cable & Wireless is working in conjunction with the Internet Content Rating Association (“ICRA”) and the Internet Watch Foundation (“IWF”) to help protect young people from harmful internet content. During 2003, Cable & Wireless continued to assist ICRA with the development of a self-labelling system, which allows website owners to rate their own content and label their websites accordingly. Cable & Wireless is also a founder member of the IWF, an industry funded body that operates a UK hotline for internet users to report potentially illegal content. IWF works closely with the police and internet service providers to trace and remove illegal content from the internet.
Encouraging positive use of the internet and ICT |
Cable & Wireless recognises the positive role that ICT can play in facilitating personal, social and economic development. It is working with charities and other community based organisations to develop innovative internet content and encourage individuals to use ICT for positive social purposes.
Inspiring young people |
As part of this commitment, Cable & Wireless is working in conjunction with children’s internet charity, Childnet International, to encourage young people to develop innovative on-line content and help those from disadvantaged backgrounds and developing countries to explore their ideas on the internet. Childnet invites young web developers from around the world to enter an annual international competition to win a place at the Cable & Wireless Childnet Academy.
The first Childnet Academy, held in London in April 2004, brought together web creators from the United Kingdom, Australia, India, Panama and Jamaica. As part of the initiative, winners receive a share of a £30,000 web development fund and the opportunity to receive specialist web support, technical advice and training from a team of internet experts.
New help for dyslexic learners |
Cable & Wireless is also working with Brussels based charity, Dyslexia International Tools & Technologies (“DITT”) to raise awareness of dyslexia and use ICT to help dyslexic learners. With help from Cable & Wireless, DITT has created an interactive self-help CD-ROM for young dyslexic learners. The Mystery of the Lost Letters has been
produced by the BBC and incorporates Hergé’s famous Tintin and Snowy illustrations to guide dyslexic learners through a series of activities. The multimedia e-learning resource is helping dyslexic learners to identify their individual learning style, find ways of coping with dyslexia and gain the skills and confidence to succeed.
Bringing arts and ICT together |
Cable & Wireless is working with internet based arts education initiative, WebPlay to provide an opportunity for 3,000 pupils to communicate and learn through the creative use of ICT. WebPlay enables eight to twelve year olds to work with children from other schools around the world to learn about theatre and produce and perform plays in collaboration with a professional theatre company. The initiative, which focuses on UK schools in areas of high social and economic disadvantage, develops national curriculum targets in literacy, technology and citizenship. Importantly it provides an opportunity for schools creatively to integrate ICT across classroom teaching and learning.
Sharing eye health expertise with the developing world |
In a new initiative, Cable & Wireless is helping Moorfields Eye Hospital to use the internet to share the knowledge and advice of its consultant eye specialists with hospitals in the developing world. The two-year initiative is enabling clinicians in South Africa, Tanzania, Gambia and Ghana to send digital images and case histories to the specialist team at the world-renowned eye hospital via a secure internet site. The project will enable Moorfields to evaluate the potential and cost-effectiveness of using the web to share specialist medical knowledge in this field and evaluate how secondary consultation and knowledge sharing is enhancing local diagnosis.
Employment issues |
Cable & Wireless operates throughout the world and has a range of employment policies that meet local conditions and requirements. There are policies that address health, safety and environment, business ethics, diversity, disability, performance management, harassment and employee relations’ issues.
Both formal and informal channels for employee consultation and communication have been in place for many years and Cable & Wireless regularly consults employees and their representatives on matters affecting them and their future interests. The Group values the involvement of its employees and continues to keep them informed. Cable & Wireless aims to pay market competitive rates and, as a matter of policy, does not employ child labour. Employees are free to join employee representative
Page 55
corporate governance
bodies or trade unions or not as they wish. Training and development opportunities are open to all employees.
The Group gives particular attention to the employment of disabled people. Applicants who are disabled and those who become disabled during employment are offered the widest range of training and opportunities appropriate to their skills.
Occupational health, safety and environment |
Cable & Wireless has a long history of treating occupational health, safety, fire and environmental (“OHSE”) risks responsibly. Appropriate priority is given to OHSE risks, with the aim of promoting a culture of business responsibility as well as enlisting the commitment of employees, suppliers and business partners.
Group policies on OHSE aim to establish a set of common minimum standards. Group policies are supported by more detailed policies and procedures within the national businesses.
OHSE management system |
In 2003, Cable & Wireless embarked on implementing an improved, integrated OHSE management system across the Group’s national businesses, with the management team of each business responsible for its implementation and operation. This system is based on the international health and management system specification OHSAS 18001 and environmental standard ISO 14001.
Within the management system, national businesses adopt a continual risk assessment approach, ensuring that potential hazards arising from work activities are identified, assessed and managed in proportion to the risks that they present. To underpin this approach, the Group is committed to maintaining legal compliance and continual performance improvement.
Cable & Wireless has set targets for all majority-owned operations relating to the implementation of the management system and the improvement of performance in key OHSE risk areas. In addition, Cable & Wireless encourages its businesses to set their own improvement targets and requires them to report their progress centrally at the end of each year.
OHSE reporting |
Cable & Wireless believes in making information on OHSE performance available to our stakeholders.
To date, we have published five Annual Environmental Reports, documenting our targets and performance and providing details of progress and new commitments for the coming year. Last year, the content was extended to include an Occupational Health and Safety Report. The sixth report,
covering Cable & Wireless’ progress in 2003 and programme for 2004 will be published on the Cable & Wireless website in July 2004.
Cable & Wireless scored 92 per cent in the Business in the Environment 2003 Index of Corporate Environmental Engagement and Performance. The average overall Index score was 79 per cent.
External involvement and recognition |
Cable & Wireless believes that all members of the telecommunications industry – whether network service providers, suppliers or manufacturers – have a responsibility for sustainability. Cable & Wireless is working with its partners in the industry to identify best practice so that all can learn without compromising competitive advantage.
Cable & Wireless is also involved with, or is a member of, a range of external leading organisations. These include: the Institution of Occupational Safety and Health; the Faculty of Occupational Medicine; Mobile Operators Association; the Institute of Fire Prevention Officers; the Institute of Fire Engineers; the European Telecommunications Network Operators Sustainability Group and the Royal Society for the Prevention of Accidents.
In the United Kingdom, Cable & Wireless was awarded its sixth consecutive Royal Society for the Prevention of Accidents Gold Award for 2003 in recognition of continuous improvement in performance.
Cable & Wireless was also a key participant in the Global e-Sustainability Initiative to produce a set of sustainability reporting guidelines for the telecommunications industry (based on guidelines developed under the Global Reporting Initiative).
Mobile phone safety |
As a provider of mobile phone services, Cable & Wireless has pro-actively monitored and managed issues related to the alleged effects of mobile phones for many years.
Cable & Wireless believes that the safety of customers, employees and the general public is of paramount importance. The Group continues to track scientific and medical research, media, legal, regulatory and other developments as well as the public perception of risk arising from the use of mobile phones. The scientific research on mobile phones and health has been reviewed by a number of independent expert scientific panels. None of these panels has concluded that the use of mobile phones is harmful to health.
Page 56
corporate governance
Internet acceptable use |
Cable & Wireless has an Internet Acceptable Use Policy (“AUP”) which is designed to protect and limit exposure to legal action. The policy confirms that Cable & Wireless customers are solely responsible for their content and messages. It contains a list of activities which customers are
prohibited from undertaking, such as those which violate the law or threaten the integrity of any network or computer system. As part of the policy, Cable & Wireless encourages customers to label their content using a self-rating system, such as that provided by the Internet Content Rating Association. The AUP is publicly available on www.cw.com.
| DIRECTORS AND SENIOR MANAGEMENT |
The following are the Company’s directors and senior management as at the date of this report.
Richard Lapthorne |
Non-executive Chairman; Chairman, Nominations Committee
Richard Lapthorne was appointed to the Board as Chairman in January 2003. Richard Lapthorne is a Non-executive Chairman of Morse PLC, Avecia plc, and Oasis International Leasing in Abu Dhabi, Vice Chairman of JP Morgan Investment Bank and the former Chairman of Amersham International plc. Richard Lapthorne joined the Board of Amersham International plc in 1988 as a Non-executive Director and became Chairman in 1999, holding this office until May 2003. He was Finance Director of British Aerospace plc from July 1992 and was appointed Vice Chairman in April 1998 before retiring in September 1999. He was awarded the CBE for services to the British aerospace industry in 1997. He was Finance Director of Courtaulds plc from 1986 to 1992, having previously been Group Financial Controller. Age 61.
Robert Rowley |
Executive Deputy Chairman
Robert Rowley was appointed a Non-executive Director in September 2002 and became Chairman of the Audit Committee on 1 January 2003. Following a restructuring of the Board, he relinquished his Chairmanship of the Audit Committee and was appointed as Executive Deputy Chairman on 21 January 2003. Robert Rowley is a Non-executive Director of Prudential plc, where he is Chairman of the Audit Committee, Taylor Nelson Sofres plc and Liberty International plc. He was on the Board of Reuters from 1990, serving as Finance Director of Reuters Group from 1990 until 2000, then as Chief Executive of Reuterspace until he retired in 2001. Age 54.
The Right Honourable Lord Robertson of Port Ellen G.C.M.G. |
Executive Deputy Chairman
Lord Robertson of Port Ellen was appointed to the Board as Executive Deputy Chairman on 1 February 2004. Lord
Robertson of Port Ellen was Secretary General of NATO and Chairman of the North Atlantic Council from October 1999 to December 2003, Secretary of State for Defence from 1997 to 1999 and Member of Parliament for Hamilton and Hamilton South from 1978 to 1999. He is a Non-executive Director of the Weir Group PLC and Smiths Group PLC, Strategic Advisor to the Royal Bank of Canada, Europe and a member of the Advisory Board of Englefield Capital. Age 58.
Francesco Caio |
Chief Executive Officer
Francesco Caio was appointed to the Board as Chief Executive Officer in April 2003. Francesco Caio founded Netscalibur Italia, the European business telecommunications and internet service provider, in 2000. From 1997 to 2000 he was Chief Executive Officer of Merloni Elettrodomestici, one of Europe’s leading household appliance companies. In 1996 he was Chief Executive Officer of Olivetti having previously headed the telecommunications and multimedia divisions. He led the creation and launch of Omnitel Pronto, Italy’s second largest mobile phone company before its acquisition by Mannesmann, and was its first Chief Executive Officer from 1994 to 1996. He has also worked with McKinsey in London. Francesco Caio is a Non-executive Director of Netscalibur Italia SpA, and a former Non-executive Director of Merloni Elettrodomestici and was a Board member of Motorola between November 2000 and May 2003. Age 46.
Kevin Loosemore |
Chief Operating Officer
Kevin Loosemore was appointed to the Board as Chief Operating Officer in April 2003. Kevin Loosemore was appointed Corporate Vice President and General Manager, Europe, Middle East and Africa (“EMEA”), Global Telecommunications Solutions Sector, Motorola in June 2001, becoming President, EMEA in September 2001 and President, Motorola Professional Services Group. Kevin Loosemore was previously Chief Executive Officer of IBM UK from 2000 to 2001 and Managing Director for De La Rue Card Systems from 1997 to 1999. He began his career with IBM in 1981, remaining with them until 1997. Kevin Loosemore is a Non-executive Director of The Big Food Group plc. Age 45.
Page 57
corporate governance
Charles Herlinger |
Chief Financial Officer
Charles Herlinger was appointed Chief Financial Officer and a member of the Board on 1 December 2003. Prior to joining Cable & Wireless, Charles Herlinger worked for Siemens AG, most recently as Corporate Vice President and Group Controller. Between 1995 and 1998, he was Chief Financial Officer and Executive Vice President Siemens Energy and Automation. From 1993 to 1995 he was Controller of Siemens Corporation. Between 1990 and 1993, he was Director of the Overseas Mergers and Acquisitions Group. He joined the Siemens group in 1987. From 1985 to 1987 Charles Herlinger was with L’Oréal as Assistant Controller in the United States. He qualified as a chartered accountant in the United Kingdom and as a certified public accountant in the United States with KPMG, with whom he worked from 1977 to 1985. Age 48.
Bernard Gray |
Non-executive Director; Chairman, Remuneration Committee
Bernard Gray was appointed a Non-executive Director in January 2003 and is Chairman of the Remuneration and a member of the Audit and Nominations Committees. Bernard Gray is Chief Executive Officer of CMP Information, the UK publishing and events division of United Business Media (“UBM”). Prior to his current role, he was Director of Group Strategy for UBM. Previous roles have included Special Advisor to the Secretary of State for Defence from 1997 to 1999 during the UK’s Strategic Defence Review and almost 10 years with the Financial Times Group, including two years on the Lex column. Bernard Gray began his career working in capital markets in London and New York. Age 43.
Graham Howe |
Non-executive Director; Senior Independent Director
Graham Howe was appointed a Non-executive Director in May 2003. He is a member of the Audit, Remuneration and Nominations Committees and is the nominated Senior Independent Director. Until 30 April 2003 Graham Howe was Deputy Chief Executive Officer and Chief Operating Officer of Orange S.A., having joined them in 1992 as one of the founding Directors. His previous experience includes senior positions at Hutchison Telecom, First Pacific Company and Touche Ross Management Consultants. Age 43.
Kasper Rorsted |
Non-executive Director, Chairman, Community Investment Committee
Kasper Rorsted was appointed a Non-executive Director in May 2003. He is a member of the Audit, Remuneration and Nominations Committees. Kasper Rorsted is Senior Vice President and General Manager, EMEA for Hewlett Packard holding this role since the merger of Hewlett Packard and Compaq in May 2002. He was previously with Compaq as Vice President and General Manager for EMEA having held various other senior management positions since 1995. He has previous experience with Oracle, Digital and Ericsson. Age 42.
Dr Janet Morgan |
Non-executive Director
Janet Morgan was appointed a Non-executive Director in 1988. She is a member of the Audit, Remuneration and Nominations Committees. She will retire as a Director of the Company at the 2004 Annual General Meeting. Janet Morgan is also a Non-executive Director of the Scottish American Investment Trust plc, the Scottish Oriental Smaller Companies Investment Trust plc, BPB plc, Murray International Investment Trust plc and Stagecoach plc and is Chairman of the Nuclear Generation Decommissioning Fund Ltd. Age 58.
Anthony Rice |
Non-executive Director; Chairman, Audit Committee
Anthony Rice was appointed a Non-executive Director and Chairman of the Audit Committee in January 2003. He is also a member of the Remuneration and Nominations Committees. He is Chief Executive of Tunstall Holdings Ltd and prior to taking up this role in 2002 his career has largely been spent with British Aerospace plc from 1986 to 2002. In this role he was at various times Group Treasurer, Group Managing Director Commercial Aircraft and was involved in the financing and flotation of Orange plc. He is a Non-executive Director of Atlantic Coast Airlines. Age 52.
Andrew Garard |
Group General Counsel and Company Secretary
Andrew Garard was appointed Company Secretary on 1 May 2004. Age 37.
Page 58
corporate governance
| DIRECTORS’ REPORT |
Principal activities and business review |
Cable & Wireless is an international telecommunications company. Its principal operations are in the United Kingdom (including Europe and the United States), the Caribbean, Japan, Panama and Macau. Cable & Wireless provides voice, data and IP services to business and residential customers and wholesale services to carriers, mobile operators and content, application and internet providers.
Details of the Group’s performance during the year are contained in the Operating and Financial Review on pages 22 to 52.
Overseas trading branches of the Company exist in Ascension, Diego Garcia, Falkland Islands, Singapore and St. Helena.
Share capital |
Details of shares issued during the year are shown in Note 23 to the Financial Statements.
Acquisitions and disposals |
Details of acquisitions and disposals in the year are set out in ‘Business Description - Recent acquisitions and disposals’.
Results and dividends |
The Group’s loss for the year after taxation and minority interests amounted to £237 million.
To give greater financial flexibility the Board decided in June 2003 to suspend dividends for 12 months. However, the Board has recommended a full year dividend for 2004 of 3.15p per Ordinary Share (consisting of 2.1p final dividend and 1.05p interim dividend) which subject to approval by shareholders at the 2004 Annual General Meeting (“AGM”), will be paid on 13 August 2004 to shareholders on the register at 23 July 2004.
Subject to shareholder approval at the AGM, the Company will introduce a Scrip Dividend Scheme for the full year dividend payable on 13 August 2004 and all future dividends. The dividend reinvestment plan has been suspended and, subject to the approval and introduction of the Scrip Dividend Scheme, will be terminated. Full details are contained in a brochure called “Scrip Dividend Scheme” and a copy can be obtained from the Company’s Registrar or from the Company Secretary.
Directors |
The following served as Directors of the Company during the year under review:
Sir Winfried Bischoff (resigned 25 July 2003)
Francesco Caio (appointed 4 April 2003)
Adrian Chamberlain (resigned 3 September 2003)
Bernard Gray
Charles Herlinger (appointed 1 December 2003)
Graham Howe (appointed 27 May 2003)
Richard Lapthorne
Robert Lerwill (resigned 3 June 2003)
Kevin Loosemore (appointed 2 April 2003)
Dr Janet Morgan
David Prince (resigned 1 December 2003)
Anthony Rice
Lord Robertson of Port Ellen (appointed 1 February 2004)
Kasper Rorsted (appointed 27 May 2003)
Robert Rowley
Graham Wallace (resigned 4 April 2003)
Biographical details for the current Directors are set out on pages 57 to 58.
In accordance with the Company’s Articles, Dr Janet Morgan will be retiring at the 2004 AGM and will not be offering herself for re-election. Charles Herlinger and Lord Robertson of Port Ellen, having been appointed Directors since the 2003 AGM will also retire at the 2004 AGM and, being eligible will offer themselves for election. The unexpired portion of the service contracts for Charles Herlinger and Lord Robertson of Port Ellen is disclosed on page 70. Due to the Board of Directors being reconstituted since January 2003, it is proposed that Richard Lapthorne and Graham Howe should seek re-election at the 2004 AGM notwithstanding the fact that they were elected by shareholders at the 2003 AGM. Following this, Richard Lapthorne and Graham Howe will be subject to re-election at the 2007 AGM. This will help stagger the re-election of Directors going forward.
Disclosable interests |
The Directors have no interest in the Ordinary Shares of the Company’s subsidiaries. The beneficial interests of the Directors and their immediate families in the Ordinary Shares of the Company are shown in the Directors’ Remuneration Report on page 73.
Employment policies |
Details of employment policies are set out in ‘Social, Environmental and Ethical Report – Employment Issues’.
Page 59
corporate governance
Charitable and political donations and community responsibility |
During the year, £1.1 million was donated for charitable purposes in the United Kingdom. World wide, including the United Kingdom, the total expenditure on donations and sponsorship for the benefit of the community amounted to £5.1 million. The Company has made no donations to political parties in the United Kingdom. It is not proposed to change the Company’s policy of not making contributions to any political party. However as a precautionary measure in light of the wide definitions in The Political Parties, Elections and Referendums Act 2000, a resolution to permit the Company to make political donations and incur political expenditure will be proposed at the 2004 AGM. Full details of this are given in the Chairman’s letter accompanying the Notice of AGM.
Payments to suppliers |
In the United Kingdom, the Group agrees payment terms with its suppliers when it enters into binding purchase contracts. The Group seeks to abide by the payment terms agreed with suppliers whenever it is satisfied that the supplier has provided the goods or services in accordance with the agreed terms and conditions. The Group seeks to treat all its suppliers fairly and has a standard, which deals specifically with the payment of suppliers. The Group has established an e-procurement procedure which is being adopted worldwide. The e- procurement procedure standardises across the Group the procedures for procuring goods and services and the internal authorisations required to approve spending and supplier selection.
The Company had 65 days’ purchases (2003 – 70 days’ purchases) outstanding at 31 March 2004 based on the average daily amount invoiced by suppliers during the year ended 31 March 2004.
Substantial shareholdings |
Except for the holdings of Ordinary Shares listed below, the Directors are not aware of any person holding three per cent or more of the Ordinary Share capital of the Company as at 1 June 2004, the latest practicable date prior to the issue of this report. Comparative figures for 2003 and 2002 are also given.
2004 | Number of Cable & Wireless Ordinary Shares | Percentage of Issued Ordinary Share capital | |||||
Shareholder | |||||||
| Legal & General Group plc | 106,545,863 | 4.47 | |||||
| The Trustees of the BT Pension Scheme | 79,356,278 | 3.33 | |||||
2003 | Number of Cable & Wireless Ordinary Shares | Percentage of Issued Ordinary Share capital | |||||
Shareholder | |||||||
| Franklin Resources, Inc. | 108,105,460 | 4.54 | |||||
| FMR Corporation & Fidelity International Ltd. | 93,127,830 | 3.91 | |||||
| Legal & General Investment Management | 80,687,822 | 3.39 | |||||
2002 | Number of Cable & Wireless Ordinary Shares | Percentage of Issued Ordinary Share capital | |||||
Shareholder | |||||||
| Franklin Resources, Inc. | 237,485,398 | 9.97 | |||||
| Verizon Inc (Bell Atlantic Corporation) | 128,378,147 | 5.39 | |||||
| Legal & General Investment Management | 78,079,443 | 3.28 | |||||
| Prudential Plc | 74,004,717 | 3.11 | |||||
Related Party Transactions |
Transactions with joint ventures and associated companies |
All transactions with joint ventures and associated companies arise in the normal course of business. The aggregate transactions recorded by Cable & Wireless with joint ventures and associated companies, which are considered to be material, are disclosed below and in Notes 17, 20 and 21 to the Financial Statements.
| For the year ended 31 March | 2004 | 2003 | 2002 | |||||||
| £m | £m | £m | ||||||||
| Turnover | 1 | 2 | 7 | |||||||
| Outpayments | 2 | 4 | 6 | |||||||
| Other operating expenses payable | – | – | 2 | |||||||
| Dividends received | 25 | 28 | 26 | |||||||
| Purchase of fixed assets | – | – | 4 | |||||||
Loans to joint ventures and associated companies, amounts owed by joint ventures and associated companies and owed to joint ventures and associated companies are set out in the Notes to the Financial Statements contained herein. The
Page 60
corporate governance
largest loan amount outstanding since 1 April 2003 was £1 million. The amount outstanding at 1 June 2004 was £1 million. The interest rate on the loan is nil.
Transactions with Directors |
Except as disclosed in the Directors’ Remuneration Report, as of 1 June 2004, neither the Company nor any of its subsidiaries was a party to any material transactions, or proposed transactions, in which any Director, any other Executive Officer, any spouse or child under 18 years of age of a Director or Executive Officer had or was to have a direct or indirect material interest.
During the years ended 31 March 2002, 31 March 2003 and 31 March 2004, and as of 1 June 2004, no Director nor any other Executive Officer, nor any associate of any Director or any other Executive Officer was indebted to the Company or any of its subsidiaries.
Corporate governance |
Good corporate governance has been and remains the responsibility of the whole Board of Directors. The governance environment has undergone a significant change since the Company’s last published Annual Report, notably with the publication of the new Combined Code in July 2003 which came into effect for reporting years beginning on or after 1 November 2003. The Company is still required to report on compliance with the existing Combined Code for the financial year ended 31 March 2004.
However, the Company is reviewing the new Combined Code and is considering any changes it will need to make to its governance structure to implement the new Combined Code. It is intended that the Company’s Corporate Governance Report for the financial year ending 31 March 2005 will refer to the Company’s compliance with the new Combined Code and include the additional disclosures it will be required to make.
Due to the Company’s listing on the London Stock Exchange it is required to comply with the listing rules of the United Kingdom Listing Authority (“UKLA”). In addition due to the Company’s listing on the New York Stock Exchange, it is also required to comply with many of the provisions of the Sarbanes-Oxley Act (“Sarbanes-Oxley”) as well as the New York Stock Exchange’s corporate governance rules.
The Company monitors compliance with such rules applicable to foreign registrants and is in compliance with the rules that are currently in force. The Company follows UK corporate governance practice, except as set out under Compliance below, which does not differ significantly from the corporate governance standards set out in section 303A
of the New York Stock Exchange Listed Company Manual, except that in the UK it is recommended that the nomination committee be comprised of a majority, rather than entirely, of independent non-executive directors.
The following sections of the Annual Report set out the Company’s existing corporate governance structure and compliance with the existing Combined Code. It also covers progress towards compliance with the relevant provisions of Sarbanes-Oxley and the New York Stock Exchange’s corporate governance rules.
Compliance |
The Board confirms that the Company was fully compliant with all the provisions of section one of the existing Combined Code throughout the period with the exception of Directors’ service contracts, as set out on pages 70 to 73. The Statement of Directors’ Responsibilities for preparing the financial statements is set out on page 81.
The Board |
The Board firmly believes in good corporate governance and particularly that strong governance controls improve the performance of the business and enhance shareholder value. The Board’s role includes:
| • | reviewing and deciding on the strategy of the Group; |
| • | increasing shareholder value by assessing business opportunities and measuring and controlling associated risks; |
| • | ensuring compliance with legal, regulatory and corporate governance requirements; |
| • | promoting and maintaining good corporate citizenship and high standards of ethical behaviour by the Group’s employees; |
| • | providing the Chief Executive Officer with appropriate support to drive and improve the performance of the Group; |
| • | setting and monitoring challenging performance objectives and benchmarks for the Chief Executive Officer and the executive team; |
| • | setting an appropriate control environment within which executive management can operate; |
| • | constituting subcommittees of the Board covering remuneration, nominations and audit matters; and |
| • | the appointment and removal of the Company Secretary. |
The Board is chaired by Richard Lapthorne, Francesco Caio is the Chief Executive Officer and Kevin Loosemore is Chief Operating Officer. Rob Rowley and Lord Robertson of Port Ellen are both Executive Deputy Chairmen. Charles Herlinger is Chief Financial Officer. There are five independent Non-executive Directors, namely: Bernard Gray,
Page 61
corporate governance
Graham Howe, Dr Janet Morgan, Anthony Rice and Kasper Rorsted. Graham Howe is the Senior Independent Director. Up to the date of his resignation on 25 July 2003, Sir Winfried Bischoff was the nominated Senior Independent Director and was considered by the Board to be independent. The Chairman’s role is to lead and manage the business of the Board of Directors in setting the strategy and delivering performance of the Group to its shareholders and other key stakeholders. The Chief Executive Officer is responsible for the performance of the Group to its shareholders and other key stakeholders. The division of responsibilities between the Chairman and Chief Executive Officer has been approved by the Board of Directors and is set out in writing. A copy of this is available from the Company Secretary or the Company’s website. Full biographical details of each of the Directors are set out on pages 57 to 58. The Board has nine scheduled meetings a year concentrating on strategy, financial and business performance. Additional Board meetings are called as required to deal with specific matters. During the year under review there were a total of 21 Board meetings.
The agenda for Board meetings are set by the Chairman in consultation with the Chief Executive Officer, Chief Financial Officer and Company Secretary. Formal minutes recording decisions of all Board and Committee meetings are prepared and circulated to each Director as appropriate. If a Director objects to a particular proposal this will be recorded in the minutes of Board or Committee meetings. There were no such objections in the year under review.
The Board considers that all of the Non-executive Directors are independent, namely Bernard Gray, Anthony Rice, Kasper Rorsted, Graham Howe and Dr Janet Morgan. The Non-executive Directors come from diverse business backgrounds and each has unique expertise covering finance, telecoms, IT and government relations. This combination of skills and expertise materially enhances the judgement and overall performance of the Board.
With the exception of Dr Janet Morgan, all of the Non-executive Directors have been appointed since January 2003. Dr Janet Morgan has served as a Director of the Company since 1988. She is due to retire from the Board at the AGM to be held on 22 July 2004. Each of the Non-executive Directors is of independent mind and character and actively contributes to the effective performance of the Board and its Committees.
The Board has a formal schedule of matters reserved to it for decision including approval of matters such as:
| • | strategy and objectives; |
| • | annual budgets; |
| • | dividends; |
| • | acquisitions and disposals of businesses; |
| • | expenditure over a certain financial limit; |
| • | financial results; and |
| • | appointments to the Board. |
A copy of the formal schedule of matters reserved for the Board is available from the Company Secretary or the Company’s website.
The Board additionally delegates specific responsibilities to Board committees, notably the Audit, Remuneration and Nominations Committees.
To enable Directors to perform their duties properly and to ensure the effective functioning of the Board and its Committees, they are given full and timely access to all relevant information. In addition, each of the Directors has access to the advice and services of the Company Secretary.
On joining the Board and under the direction of the Chairman, a new Director receives appropriate induction, involving meetings with other Directors, senior management and key advisors. In addition, the new Directors are provided with appropriate background materials covering the business, the financial performance of the Company and the legal and corporate governance environment. The Directors further receive appropriate ongoing briefings and information to enable them to perform their roles both on the Board and its principal Committees. This involves both internal briefings and external training where appropriate.
The Board has adopted a procedure whereby Directors may, in the furtherance of their duties, take independent professional advice on any matter at the Company’s expense.
The Company additionally maintains Directors’ and Officers’ liability insurance.
Under the direction and control of the Chairman, the Board considers its performance both as a group and as individual members. This involves regular discussions between the individual Board members. The Board will also consider the need for external support in conducting an annual evaluation of its performance.
Page 62
corporate governance
As part of the evaluation process, the independent Non-executive Directors meet privately without the Chairman, and as a group with the Chairman, as necessary, at least once a year, and similarly with both the Chairman and the Chief Executive Officer, to consider management performance and succession issues. The independent Non-executive Directors also review annually the relationship between the Chairman and Chief Executive Officer to ensure that the relationship is working to promote the creation of shareholder value.
Statement from Independent Directors |
The Independent Directors meet three times during the year in addition to Board meetings to formally discuss governance issues – once with the Chairman and Chief Executive Officer present, once with the Chairman present, and once on their own. After the third meeting, Graham Howe, Senior Independent Director, provided feedback to the Board on the Independent Directors’ collective views of the following:
| • | the perceived quality of the relationship between the Chairman and the Chief Executive Officer; |
| • | the degree of openness between the Chief Executive Officer and the Board; |
| • | the visibility of checks and balances within the Executive directors’ team; and |
| • | whether all questions asked by the Non-executive Directors in the Board have been adequately addressed. |
From January to the beginning of April 2003, the Company was searching for a new Chief Executive Officer under the guidance of the Chairman, Richard Lapthorne. During this period, the Chairman effectively led the executive management in the running of the business. With the appointment of Francesco Caio as Chief Executive Officer on 4 April 2004 and the appointment of an entirely new executive team, there has been a conscious effort by the Chairman to step back and create the necessary space for the Chief Executive Officer to run the business. The Chairman and the Chief Executive Officer have complementary skills and their relationship is a good one.
The Chief Executive Officer is by nature open with the Board and no circumstances have arisen during the year where the Board doubted this. The year has been characterised by the sheer quantity of issues needing to be addressed. This has sometimes led to crowded agendas and there have been many additional meetings.
The Company has seen a significant amount of organisational change during the past year with the appointment of an entirely new executive team. Throughout this period of change, the primary governance checks and balances were managed by the Chairman and the Chief
Executive Officer with the appropriate level of support from the Board of Directors, its principal committees (in particular the Audit Committee) and the senior management team.
There have been no questions raised at the Board or its committees that have been inadequately addressed by the Executive Directors. This is not to say that all questions were capable of being answered fully at the time. The Company was managing itself through risk and uncertain situations where knowledge grew over time.
Despite this period of change for the Company, through the significant efforts of the Board of Directors, its principal committees and the senior management team, the Independent Directors are satisfied that the appropriate corporate governance controls have been effective during the year ended 31 March 2004.
Board Committees |
| REMUNERATION COMMITTEE |
The Remuneration Committee determines and recommends to the Board the framework or broad policy for the remuneration and long term incentive arrangements of the Company’s Chairman, Executive Directors and senior executives. The Committee’s full terms of reference are available either from the Company Secretary or the Company’s website. The Committee currently comprises all the independent Non-executive Directors of the Company, namely: Bernard Gray (Chairman), Dr Janet Morgan, Anthony Rice, Graham Howe and Kasper Rorsted. Sir Winfried Bischoff was Chairman until his resignation on 25 July 2003. The Chairman, Chief Executive Officer and HR Director may be invited to attend and speak at meetings of the Committee, but do not participate in any matter which impacts upon their own remuneration arrangements. Meetings are scheduled in February, March, May and June each year but may be held at other times. There were seven meetings in the year ended 31 March 2004.
The Directors’ Remuneration Report on pages 66 to 80 includes details on remuneration policy, practices and the remuneration of the Directors.
| NOMINATIONS COMMITTEE |
The Nominations Committee reviews the composition of, and succession to, the Board and recommends to the Board appointments of Executive and Non-executive Directors following a formal and rigorous review process. This involves an ongoing assessment of the overall balance and performance of the Board and its individual members ensuring a strong executive and independent non-executive team. This takes account of existing and proposed corporate governance requirements and emerging best practice.
Page 63
corporate governance
The Committee in particular considers the experience and skills of individuals who may be suitable as Directors.
Members of the Committee abstain when matters affecting their own appointments are discussed. The Committee is authorised to engage the services of external advisors as it deems necessary at the Company’s expense in order to carry out is function.
Any Director appointed since the last AGM is required, under the Company’s Articles of Association, to retire and seek election by the shareholders at the next AGM. The Articles also require that all Directors retire every third year from when last elected by the shareholders. Due to the Board of Directors being re-constituted since January 2003, it is proposed that Richard Lapthorne and Graham Howe should seek re-election at the 2004 AGM, notwithstanding the fact that they were elected by shareholders at the 2003 AGM. Both will be subject to re-election at the 2007 AGM. This will help stagger the re-election of Directors going forward.
The Committee currently comprises the Chairman, Richard Lapthorne, who also chairs the Committee, the Chief Executive Officer, Francesco Caio and any three of the independent Non-executive Directors (namely Bernard Gray, Graham Howe, Dr Janet Morgan, Kasper Rorsted and Anthony Rice). The composition of the committee was changed during the year under review to reflect emerging best practice.
The Committee met three times during the year under review.
The Committee’s full terms of reference are available either from the Company Secretary or the Company’s website.
| AUDIT COMMITTEE |
The Audit Committee currently comprises all the independent Non-executive Directors of the Company, namely: Anthony Rice (Chairman), Bernard Gray, Graham Howe, Dr Janet Morgan and Kasper Rorsted. The Chairman, Richard Lapthorne who was a member of the Committee until 5 May 2004, and the Executive Directors attend the meetings of the Committee by invitation but are not members. The Group Director of Internal Audit, Group General Counsel and representatives of the Company’s auditors, KPMG Audit Plc, also attend meetings by invitation. Other employees of the Company may be invited to attend meetings as and when required.
The Board considers that the membership of the Committee as a whole has sufficient recent and relevant financial experience to discharge its function, but it has concluded
that it will not name any single member as having such experience.
The Committee’s full terms of reference are available from either the Company Secretary or the Company’s website. In summary the Committee:
| • | makes recommendations to the Board on the appointment of the Company’s auditors; the Board seeks shareholder approval at every AGM for the appointment of the Company’s auditors; |
| • | determines the level of audit fees and the scope of the audit in accordance with the authority given by the Company’s shareholders at every AGM; |
| • | assesses the independence of the auditors; |
| • | reviews and agrees the process for the approval of audit and non-audit services provided by the auditors; |
| • | reviews the internal audit programme and considers the effectiveness of the internal audit function; |
| • | reviews the financial integrity of the financial statements of the Company; |
| • | reviews the Company’s compliance with legal and regulatory requirements arising from its listings in London and New York; |
| • | reviews material complaints regarding accounting, internal controls and auditing raised by the Company’s employees; and |
| • | monitors the Company’s whistle blowing procedures. |
The Audit Committee has established a policy which is intended to maintain the independence of the Company’s auditors when acting as auditor of the Group accounts. The policy governs the provision of audit and non-audit services provided by the auditor and its associates to the Company and its subsidiaries. The policy clearly identifies those services which are permitted and those which are prohibited from being provided by the auditor. In addition, the policy clearly sets out the procedure to be followed for the approval of all audit and non-audit services.
The Committee is authorised to engage the services of external advisers, as it deems necessary, at the Company’s expense in order to carry out its function.
The Committee met seven times during the year under review.
Annual General Meeting |
Business at the Company’s AGM, to be held on 22 July 2004, will cover the Annual Report and Accounts, Directors’ Remuneration Report, election/re-election of Directors, the re-appointment of the auditors, the authorisation for the Directors to set the auditors’ fees and the full year dividend. Special business will cover scrip dividend authority, share buy back authority, amendment to the Articles of
Page 64
corporate governance
Association, authority to offer the Incentive Plan in France, general authority for political donations and amendment to the rules of the Incentive Plan and Deferred Short Term Incentive Plan.
Full details and an explanation of these resolutions are set out in the Chairman’s Letter and Notice of AGM. At the AGM, a business review is presented to shareholders by the Chief Executive Officer. All Directors including the Chairman of the Audit and Remuneration Committees attend and are available to answer shareholders’ questions. All resolutions at the AGM are taken on a poll, in accordance with best practice. Results are announced to the London Stock Exchange and published on the Company’s website.
Apart from the AGM, the Company communicates with its shareholders by way of the Annual Report or the Annual Review and Summary Financial Statements. The Company’s web site also contains investor relations’ material including results’ presentations, dividends and share capital history. In addition, the Company communicates with its institutional shareholders through regular analyst and broker meetings throughout the year. Furthermore, an independent survey of investors’ views on the Company and its management is conducted each year and this is reported back to the full Board. Finally all analysts’ reports are circulated to the Board of Directors, including the Non-executive Directors. The Company clearly recognises the importance of maintaining a regular dialogue with shareholders to ensure that the Company’s strategy and performance are understood.
Internal control and risk management |
The Board is responsible for the Group’s system of internal control and for reviewing its effectiveness. The Board confirms that it has adopted a process for identifying, evaluating and managing the significant risks faced by the Group in accordance with the guidance of the Turnbull Committee on Internal Control.
The Board considers that the Group’s system of internal control is appropriately designed to manage, rather than eliminate, the risk of failure to achieve business objectives and provides reasonable but not absolute assurance against material misstatement or loss. The concept of reasonable assurance recognises that the cost of a control procedure should not exceed the expected benefits. The Board reviews the Group’s systems of internal control to improve them as necessary, taking into account emerging best practice. During the year and up to the date of this report procedures were in place throughout the Group to ensure compliance with the report of the Turnbull Committee.
Using a common risk management framework, each principal business and functional unit identifies risks that
could impede the achievement of their objectives and records them in a Risk Register. For each significant risk, line managers document an overview of the risk, consider the effectiveness of the current mitigating controls in place and identify any improvement actions required. In addition to this, the Group’s Executive Directors monitor all significant risks through a structure of Risk Review Boards. The Risk Review Boards comprise the Chief Executive Officer, Chief Financial Officer and other relevant senior executives. There is also a schedule of the Group’s risks that covers significant operational, financial and strategic risks and this is reviewed by the Group Audit Committee. A risk assessment process is also adopted as an integral part of major capital or change programmes. The Company recognises that the Risk Review Board’s work evolves over time and it is committed to continuous improvement of the Risk Review Board’s processes.
The past few years have been transitional ones for the Group, with the Company making a number of acquisitions and disposals and having undergone a number of restructurings. As with all acquisitions or reorganisations, the Company has had to dedicate resources to try and bring the embedded processes and controls across its businesses up to standards acceptable to the Group.
A comprehensive control self-assessment exercise is conducted annually to complement the work of Group Internal Audit, the risk management framework and the external auditors. This exercise requires management to assess the effectiveness of their fundamental operating controls over all aspects of their operations, not just financial controls. The results of this exercise are considered by Group Internal Audit in planning their work for the forthcoming year.
In addition to the self-assessment and management review procedures, the Group monitors its internal financial control system through a programme of internal audits. The Group’s Internal Audit function has a formal charter approved by the Board that describes its purpose, authority and responsibility. Its annual audit plan is approved by the Group Audit Committee. It supports the Board in assessing key internal controls through a structured review programme.
At the end of the financial year, the finance and general management of operating units are required to sign a letter of representation to confirm that their financial reporting is based on sound data, that they are fully aware of their responsibility to operate internal control systems and that their results are properly stated in accordance with Group and statutory requirements. Additionally, a structure has been developed to assess the Group’s corporate social responsibility including social, environmental and ethical
Page 65
corporate governance
matters and this is covered in ‘Corporate Governance – Social, Environmental and Ethical Report’ on page 53.
These procedures reflect the Group’s commitment to ensuring it has policies in place that ensure high standards of integrity and transparency throughout the Group’s operations. Further, when these procedures detect unauthorised management practices, the Group is committed to the correction of such events. For example, on 30 March 2004, Cable & Wireless announced it had completed an extensive internal investigation into the operations at its insurance subsidiary Pender. As a result of that investigation, Cable & Wireless has commenced legal action against five companies and six individuals (of whom five were former Cable & Wireless employees). The Board believes such action properly reflects the Group’s commitment to financial discipline and integrity at all levels.
The responsibility for internal control procedures within joint ventures and associates rests, on the whole, with the senior management of those operations. Cable & Wireless monitors its investments and exerts influence through Board representation.
Under the US Sarbanes-Oxley Act of 2002, new and enhanced standards of corporate governance, and business and financial disclosure, apply to US public companies and non-US companies, including the Company, with securities registered in the United States. Some of the new standards and rules affecting the Group are already in force and others will come into force in the future.
Going concern |
After making enquiries the Directors have a reasonable expectation that the Group and Company have adequate resources to continue in operational existence for the foreseeable future and therefore continue to adopt the going concern basis in preparing the Financial Statements on pages 84 to 148.
By order of the Board of Directors.
Andrew S Garard
Company Secretary
1 June 2004
Sarbanes-Oxley confirmation |
The Company carried out an evaluation under the supervision and with the participation of the Company’s management, including the Chief Executive Officer and Chief Financial Officer, of the effectiveness of the design and operation of the Company’s disclosure controls and procedures as of 31 March 2004. There are inherent limitations to the effectiveness of any system of disclosure controls and procedures, including the possibility of human error and the circumvention or overriding of the controls and procedures. Accordingly, even effective disclosure controls and procedures can only provide reasonable assurance of achieving their control objectives. Based upon the Company’s evaluation, the Chief Executive Officer and Chief Financial Officer concluded that the disclosure controls and procedures as of 31 March 2004 were effective to provide reasonable assurance that information required to be disclosed in the reports the Company files and submits under the Securities Exchange Act of 1934, as amended, is recorded, processed, summarised and reported as and when required.
There were no changes in the Company’s internal control over financial reporting during the year ended 31 March 2004 that have materially affected, or are reasonably likely to materially affect, the Company’s internal control over financial reporting.
| DIRECTORS’ REMUNERATION REPORT |
This report sets out the policy and disclosures in relation to Directors’ remuneration. The Remuneration Report will be subject to an advisory vote at the Annual General Meeting of the Company to be held on 22 July 2004 in accordance with the Directors’ Remuneration Report Regulations 2002. Full details of the resolution are set out in the Notice of Annual General Meeting.
Composition and terms of reference of the Remuneration Committee |
The Remuneration Committee (“the Committee”) makes recommendations to the Board, within agreed terms of reference, on the Company’s framework of executive remuneration and on the specific remuneration of the Chairman and Executive Directors. During the year the Board approved all recommendations without amendment. The terms of reference for the Committee are obtainable from the Company’s website or from the Company Secretary.
The Committee comprises all of the independent Non-executive Directors, namely: Bernard Gray (Chairman from 25 July 2003), Graham Howe (from 27 May 2003), Dr Janet Morgan, Anthony Rice, Kasper Rorsted (from 27 May 2003) and Sir Winfried Bischoff (Chairman and Committee member until 25 July 2003). Richard Lapthorne served on the Committee as a member until 31 March 2004. All were
members of the Remuneration Committee during the year ended 31 March 2004.
In forming their recommendations, the Committee received advice and information from the Chief Executive Officer, Francesco Caio, the Chief Operating Officer, Kevin Loosemore, the Group Company Secretary, and Group Human Resources. The Remuneration Committee has appointed independent consultants, New Bridge Street Consultants LLP, to provide advice on remuneration and share plans both for Executive Directors and the wider executive population. In addition they provide the Company with measurement of its relative total shareholder return (“TSR”) performance. The Committee also consulted the following advisors in relation to executive remuneration during the year ended 31 March 2004:
| • | Allen & Overy who also provide the Company with corporate legal advice; |
| • | Manches; and |
| • | Speechly Bircham, who also provide the Company with corporate legal advice and share scheme services. |
The Chairman, Executive Directors and officers attending a meeting abstain from any discussion or decision on their own remuneration or the design or operation of any incentive schemes from which they may derive benefit.
Page 66
corporate governance
Statement of remuneration policy |
Remuneration philosophy |
Cable & Wireless is an international company, operating in some 80 countries around the world. Attracting, retaining and motivating high quality people is key to the Company’s success. Remuneration arrangements are designed to enable the Company to maintain a competitive position in each country in a cost-effective way and are reviewed annually against best practice.
The Company’s remuneration philosophy for Directors is based upon creating a strong link between performance and reward, underpinned by the following guiding principles:
| • | total reward levels should reflect the markets in which the Company competes. The Company’s competitive position is regularly monitored by independent analysis against comparator groups of companies selected on the basis of relevant size, business and geographic focus; |
| • | the majority of total direct remuneration for executives should be linked to the achievement of demanding performance targets; |
| • | fixed salaries and benefits should be set at mid-market level against the comparator groups; and |
| • | an appropriate mix of short and long-term incentives should be set so that total direct remuneration falls between mid-market and upper quartile if business and personal performance are good. |
Elements of remuneration |
Executive Directors’ direct remuneration consists of salary, annual bonus and long-term incentives.
The Remuneration Committee believes that the majority of Executive Directors’ direct remuneration should be performance related. The appropriate mix and level of performance related awards may vary from year to year and between each Executive Director according to the judgement of the Committee. The actual value delivered is dependent upon the achievement of stretching performance conditions.
The chart below illustrates that approximately 60 per cent of Executive Directors’ potential direct remuneration is performance related.
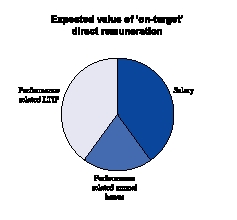
Figures reflect ‘on-target’ payment potential under the annual bonus plan and the expected value of ‘on-target’ share option and deferred bonus awards at the time of grant. It is assumed that 50 per cent of the annual bonus is deferred under the Deferred Short Term Incentive Plan.
Base salary |
Base salaries are reviewed by reference to the median of comparator groups selected on the basis of comparable size, geographic spread and business focus. Individual salary decisions take into account personal contribution, business performance and the level of salary increases across the Company as a whole. Salaries are generally reviewed on an annual basis to take effect from 1 July or following a significant change in responsibilities.
Salaries will not be increased on 1 July 2004 following the latest review. Accordingly, salaries for the forthcoming year will be:
| Francesco Caio | £700,000 |
| Kevin Loosemore | £490,000 |
| Charles Herlinger | £400,000 |
| Robert Rowley | £250,000 |
| Lord Robertson of Port Ellen | £200,000 |
Executive Directors’ pensions are based only on their base salaries.
Page 67
corporate governance
Short Term Incentive Plan and Deferred Short Term Incentive Plan |
Short Term Incentive Plan (“STIP”) |
Individual awards under the STIP are based upon annual performance against objective financial targets such as net cash flow and profit before tax, and specific developmental milestones. The specific measures and targets are reviewed and set annually by the Remuneration Committee to reflect the key business priorities for the year in question.
The target cash bonus payable under the STIP is 50 per cent of base salary, and the normal maximum is 100 per cent of base salary.
The Chief Executive Officer, Francesco Caio, is eligible to receive an additional bonus of up to 50 per cent of base salary at the discretion of the Remuneration Committee subject to the achievement of specific strategic events.
Deferred Short Term Incentive Plan |
The Executive Directors and selected senior executives may elect to re-invest up to half of any STIP bonus after tax and national insurance into the Deferred Short Term Incentive Plan (“Deferred STIP”).
The Deferred STIP is designed to encourage participants to invest in shares to align their interests more closely with those of shareholders. Under this plan any net bonus deferred is used to purchase shares in the Company, which are held in trust for three years before being released to the participant.
Participants may also be awarded matching shares based on the relative TSR performance of the Company measured over the three-year period (see Performance Conditions for Share Based Awards). Matching shares are based on one matching share for two purchased shares for median TSR performance, rising to two matching shares for one purchased share for TSR performance at upper quartile or above. No matching shares are awarded for TSR performance below the median. A dividend award supplement also operates on the Deferred STIP. Dividends that would have been paid on the purchased shares and the actual award of matching shares during the performance period are reinvested in additional shares.
Share Option Plan |
The Share Option Plan (“SOP”) is the principal vehicle for long-term retention and incentivisation of the Executive Directors and other senior executives.
The Remuneration Committee determines the level of any award each year by reference to total reward within the comparator groups measured using Black-Scholes
methodology. Individual awards are moderated to reflect personal and Company performance, and are subject to an annual plan limit of share options with a face value of six times salary for the Chief Executive Officer and four times salary for other Executive Directors.
The Committee currently intends to make the award of share options for the 2004/5 financial year at a level of 3 x salary for the Chief Executive and 2.5 x salary for the other Executive Directors shortly following the forthcoming Annual General Meeting.
The vesting of share options awarded to the Executive Directors is subject to relative TSR performance conditions (see Performance Conditions for Share Based Awards). Full vesting occurs only if the TSR performance of the Company meets or exceeds the upper quartile on the third anniversary of the date of grant. Where TSR performance meets the median, 50 per cent of the initial award vests. A sliding scale operates between median and upper quartile, and nothing vests for TSR performance below the median. With effect from May 2004 the Remuneration Committee has agreed that performance re-testing will be removed from all future grants of share options. Previously granted share options are able to be re-tested until the fifth anniversary of the grant.
Other plans |
Details of other plans are as follows:
| • | the Restricted Share Plan (“RSP”) provides for awards of restricted shares, primarily as a retention or a recruitment tool to compensate for the forfeiture of long-term incentive arrangements when transferring to Cable & Wireless. The Remuneration Committee, taking into account the previous arrangements of the new recruit, will set the quantum, performance measures and vesting schedule for any restricted share awards. There is currently no intention to make awards to any Executive Director in the forthcoming financial year; |
| • | under the terms of the Performance Share Plan (“PSP”), former Executive Directors have been awarded shares at nil cost, subject to certain performance requirements. The level of any award is determined by the Remuneration Committee each year by reference to total remuneration within a market peer group, subject to an overriding annual limit of shares with a face value of one times salary for any participant. The vesting of awarded shares is subject to relative TSR performance conditions (see Performance Conditions for Share Based Awards). Full vesting occurs only if the TSR performance of the Company meets or exceeds the upper quartile on the third |
Page 68
corporate governance
| anniversary of the date of award. Where TSR performance meets the median, 40 per cent of the initial award vests. A sliding scale operates between median and upper quartile, and nothing vests for TSR performance below the median. A dividend award supplement operates on the PSP. Dividends that would have been paid on the performance shares which vest, will be regarded as having been re-invested in additional shares. The last award was made under this plan in May 2002 and there is currently no intention to use this plan in the forthcoming financial year; and |
| • | the Stock Appreciation Rights Plan (“SARP”) is used to exactly replicate the plans described above but rewards are delivered as a cash equivalent. It is used in exceptional cases only for countries in which tax or legal issues preclude the use of real shares or share options. No Executive Director has ever received awards under this plan. |
Performance conditions for share based awards |
TSR is the performance measure used in the SOP, the Deferred STIP and the PSP as it provides an objective external measure of financial performance.
The Remuneration Committee believes that it is important to measure and reward relative performance against an appropriate set of companies. The Company’s relative TSR performance is assessed against the FTSE Global Telecoms Sector Index (“FTSE GTSI”), which provides a global benchmark of independently selected industry peers.
The Committee considered moving from this index to the FTSE 100 index, but during consultation shareholders expressed the view that they would prefer to retain the existing comparator group.
TSR is share price growth adjusted for dividends and capital actions. TSR performance is averaged over a three-month period at the beginning and end of the measurement period. This moderates the effect of short-term share price volatility. It is assumed that dividends are re- invested at the closing share price on the day the share price goes ‘ex-dividend’.
Performance graphs |
The graph below shows the change in value of a hypothetical £100 holding in Cable & Wireless Ordinary Shares over five years relative to a broad equity market index. The FTSE 100 index was considered by the Remuneration Committee to be the most relevant index for this purpose as the Company is a constituent of the index and a five-year history is available.
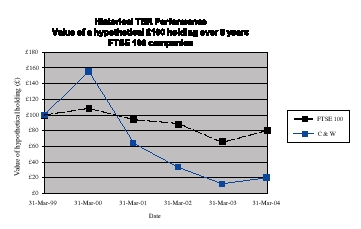
The following graph shows the change in value of a hypothetical £100 holding in Cable & Wireless Ordinary Shares over three years against the FTSE GTSI. The FTSE GTSI is the comparator group against which relative performance is assessed under the Company’s current SOP, Deferred STIP and PSP. This index was only created in February 2001, therefore comparative TSR performance can only be provided for the last three financial years.
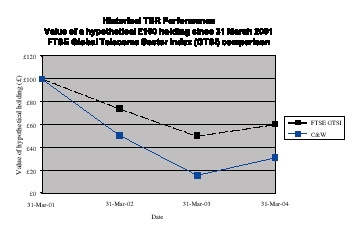
Dilution |
The Remuneration Committee ensures that at all times the number of new shares which may be issued under any share option or share-based plans, including all-employee plans, does not exceed the dilution limit of 10 per cent of the Company’s issued share capital over any 10 year rolling period. As at 31 March 2004, 1.47 per cent of the issued
Page 69
corporate governance
shared capital was available for issue under the Company’s share-based plans.
Awards under the various plans are funded by a mix of purchased and newly issued shares, as determined by the Remuneration Committee. Newly issued shares are subject to the dilution limit outlined above. Purchased shares, which are held by the Cable & Wireless Employee Share Ownership Trust, are subject to a limit of five per cent of the issued Ordinary Share capital of the Company.
Pension and other benefits |
Francesco Caio, Kevin Loosemore and Charles Herlinger participate in the Cable & Wireless Lifetime Benefits Plan, a defined contribution scheme approved by the Inland Revenue. Robert Rowley and Lord Robertson of Port Ellen do not receive any Company provided pension benefits. Further details of the pension benefits earned in the year to 31 March 2004 can be found on page 74.
The Executive Directors are eligible to participate in employee benefit programmes including life, disability and health insurance plans and, where appropriate, receive relocation expenses. The value of these benefits is included in the Directors’ Remuneration table on pages 74 to 75.
Executive Directors are also eligible to participate in all-employee share schemes and savings plans applicable in their home countries. These include the Cable & Wireless Savings Related Share Options Scheme and the Cable & Wireless Share Purchase Plan – further details can be found in Note 23 to the Financial Statements.
Executive Directors’ service contracts |
Policy |
The Remuneration Committee’s policy is that new Executive Directors’ service contracts should contain a maximum notice period of one year. A longer notice period may apply initially, where this is required to secure the services of high calibre executives in exceptional circumstances, but in all cases the notice period will reduce to one year or less after two years.
In the event of early termination, the Remuneration Committee will, within legal constraints, determine the approach to be taken according to the circumstances of each individual case, taking full account of the departing Executive Director’s obligation to mitigate loss. Except in cases of early termination for cause, the Committee will take into account the relevant Executive Director’s current salary, notice period and contractual benefits when calculating any liability of the Company. The principal contractual benefits provided in addition to salary are pension and life insurance. Annual bonuses and long-term incentives are granted at the
discretion of the Committee and therefore would be dealt with in accordance with the rules of the relevant schemes. A significant proportion of each Executive Director’s total remuneration is subject to performance conditions and therefore will not be payable to the extent that the relevant targets are not met.
Current Directors |
Francesco Caio’s contract is dated 2 April 2003 and continues until his normal retirement date of 1 September 2017. The notice period under contract is two years until 2 April 2005 and one year thereafter. At 31 March 2004, the unexpired term of his service contract was 13 years and five months.
Charles Herlinger’s contract is dated 26 July 2003 and continues until his normal retirement date of 1 December 2015. The notice period under contract is two years until 1 December 2005 and one year thereafter. At 31 March 2004, the unexpired term of his service contract was 11 years and 8 months.
Kevin Loosemore’s contract is dated 2 April 2003 and continues until his normal retirement date of 1 February 2019. The notice period under contract is two years until 2 April 2005 and one year thereafter. At 31 March 2004, the unexpired term of his service contract was 14 years and 10 months.
Lord Robertson of Port Ellen’s contract is dated 1 February 2004 and is for a fixed term of three years from 1 February 2004. It continues after the end of the fixed term until terminated by either party by giving one year’s written notice on or at any time after the end of the first three years. At 31 March 2004, the unexpired term of his service contract was two years and 10 months.
Robert Rowley’s contract is dated 1 February 2003 and continues until his normal retirement date of 1 September 2009. The contract is for a fixed term of 30 months from the commencement date and continuing after the end of the fixed term until terminated by either party giving six months notice expiring on or at any time after the end of the fixed term. At 31 March 2004, the unexpired term of the service contract was five years and five months.
The service contracts of Francesco Caio, Kevin Loosemore, Charles Herlinger and David Prince (see below) contain a clause that governs a change of control. In the event of a change of control of the Company, if the executive’s employment is adversely changed, then a change of control provision will be triggered.
In these circumstances, the executive will receive a payment equal to their notice period and, except in the case of David
Page 70
corporate governance
Prince, a pro-rated bonus under the STIP (to the extent that the executive would have been awarded a bonus in respect of the year during which their employment terminates). The executive’s entitlements under the Deferred STIP, the PSP, the SOP and the restricted share plan will be those applicable in the case of termination of employment by reason of redundancy or early retirement under the prevailing rules of each plan.
Also in these circumstances the service contracts of Lord Robertson of Port Ellen and Robert Rowley include a provision for the payments of salary only in lieu of any unexpired term or notice at the Company’s discretion.
The Executive Directors’ service contracts contain no other provisions for compensation payable on early termination.
Former Directors |
Adrian Chamberlain’s contract was dated 14 May 2002 and continued until his departure as a Director and employee on 3 September 2003. The notice period under the contract was one year.
Robert Lerwill’s contract was dated 6 January 1997 and continued until his departure as an employee on 30 September 2003. The notice period under contract was two years from the Company to the Executive and one year from the Executive to the Company. He resigned from the Board on 3 June 2003 but continued as an employee until 30 September 2003.
David Prince’s contract is dated 14 May 2002. The notice period under contract is one year. At 31 March 2004, the unexpired term of his service contract was seven years and three months. He resigned from the Board on 1 December 2003 but will remain with the Company as an employee until 3 June 2004.
Graham Wallace’s contract was dated 21 January 1997 and contained a notice period of two years. He resigned from the Board on 4 April 2003, remaining available for a period to support the Chairman and the new Chief Executive Officer. His employment was terminated on 20 July 2003.
Chairman |
The Chairman, Richard Lapthorne, has been appointed for an initial fixed term of three years from 10 January 2003 and continuing until terminated by either party. The appointment will be terminable by either party serving not less than six months’ prior written notice expiring on the anniversary of the appointment, save that no notice can take effect prior to the expiry of the initial three-year term.
The following arrangements for Richard Lapthorne were made to secure his appointment given the general turmoil in
the telecommunications industry, the associated decline in the share price of the Company and the retirement of the former Chairman, Sir Ralph Robins. The Directors considered the arrangements to be in the best interests of the Company’s shareholders to secure Mr Lapthorne’s services. None of the benefits under the arrangement is pensionable.
On his appointment, the Company granted Richard Lapthorne an option to acquire 1,000,000 Ordinary Shares in the Company (“the Investment Shares”) at a price of 57 pence per Ordinary Share (the closing mid-market price per share on 10 January 2003) within 30 days of his appointment. He exercised the option immediately to satisfy the agreement to acquire 1,000,000 Ordinary Shares in the Company.
Subject to Richard Lapthorne remaining a Director and Chairman of the Company and retaining beneficial ownership of all of the Investment Shares until 10 January 2006, the Company agreed to deliver 1,000,000 Ordinary Shares to him (“the Matching Shares”).
As his appointment continues, Richard Lapthorne agreed to acquire from the Company 200,000 Ordinary Shares in the Company (“the Annual Acquisition of Shares”) on the following dates at the lower of the mid-market price or:
| a) | 10 January 2004 – 57 pence per Ordinary Share; |
| b) | 10 January 2005 – 63 pence per Ordinary Share; |
| c) | 10 January 2006 – 78 pence per Ordinary Share; |
| d) | each subsequent anniversary with the price increasing 15 pence per Ordinary Share. |
Following discussion with shareholders, the Company brought forward the Annual Acquisition of Shares (a to c above) and the delivery of Matching Shares to the Chairman. Subsequent Annual Acquisition of Shares at prices above 78p were then cancelled. As a result, on 17 March 2004 Richard Lapthorne acquired 1,600,000 Ordinary Shares under these arrangements.
1,000,000 of the shares were acquired for nil consideration and comprise the Matching Shares. These shares will be forfeited if, before 10 January 2006, Richard Lapthorne either resigns as Chairman of the Company or ceases to retain the 1,000,000 Investment Shares purchased at the time of his appointment.
The remaining 600,000 Ordinary Shares were acquired at the following prices:
200,000 Ordinary Shares at 57 pence each;
200,000 Ordinary Shares at 63 pence each; and
200,000 Ordinary Shares at 78 pence each.
The Chairman is committed to retaining at least 500,000 Ordinary Shares throughout his service as a Director.
Page 71
corporate governance
If Richard Lapthorne’s appointment is terminated by reason of death or by the Company otherwise than by due notice or if there is a change of control, he or his personal representatives shall be entitled to an immediate payment equivalent to his fee for the balance of the period ending on the earliest date on which the appointment would have been terminated if the Company had given the requisite prior written notice, unless in the case of a change of control he remains a Chairman of the Company on similar terms.
Non-executive Directors |
The Non-executive Directors do not have service contracts with the Company, but instead have letters of appointment. Their fees are determined by the Board, within the limits set out in the Company’s Articles of Association, with Non-executive Directors abstaining from any discussion or decision on their fees. Fee levels reflect the Directors’ responsibilities, the committees on which they serve and the general market conditions for their services. Full details of the fees paid in the year ended 31 March 2004 are set out in the Directors’ Remuneration table and the associated notes on pages 74 to 75. The Non-executive Directors do not receive any pension.
Base fees paid to each Non-executive Director have been increased by £15,000 with effect from 1 March 2004 to the following levels:
| Anthony Rice | £90,000 | 1 | ||
| Bernard Gray | £75,000 | 2 | ||
| Graham Howe | £65,000 | |||
| Dr Janet Morgan | £65,000 | |||
| Kasper Rorsted | £65,000 | |||
| 1 | Includes £25,000 for role as Chairman of the Group Audit Committee |
| 2 | Includes £10,000 for role as Chairman of the Remuneration Committee |
This increase reflects the increased commitments and demands placed upon each of the Non-executive Directors in performing their duties on the Board and its principal committees, particularly given the increasing demands on their time in the current governance environment. The increase will apply for three years at which point fee levels will be revisited.
Sir Winfried Bischoff and Dr Janet Morgan were appointed for two three-year terms commencing on 31 January 1991 and 1 December 1988 respectively on the basis that they would serve for six years and thereafter by annual renewal with the approval of the Chairman. Sir Winfried Bischoff retired from the Board with effect from 25 July 2003. Dr Janet Morgan will retire from the Board on 22 July 2004.
Bernard Gray and Anthony Rice have been appointed for a three year term commencing on 21 January 2003, with the expectation that a further three-year term will follow. After two three-year terms, the period may be extended on an annual basis at the invitation of the Chairman. Termination of the appointment may be earlier at the discretion of either party on one month’s written notice, but total service will not exceed nine years.
Graham Howe and Kasper Rorsted have been appointed for a three year term commencing on 27 May 2003, with the expectation that a further three-year term will follow. After two three-year terms, the period may be extended on an annual basis at the invitation of the Chairman. Termination of the appointment may be earlier at the discretion of either party on one month’s written notice, but total service will not exceed nine years.
At the time of the appointment of the Non-executive Directors in 2003, the Company put in place the following share purchase arrangements for Bernard Gray, Graham Howe, Dr Janet Morgan, Anthony Rice and Kasper Rorsted. These arrangements were felt necessary to secure or retain their appointments as Non-executive Directors of the Company given the general turmoil in the telecommunications industry, the associated decline in the share price of the Company and the re-structuring of the Company’s Board of Directors.
Each of these Non-executive Directors undertook to purchase a specified number of Ordinary Shares in the Company on 4 June 2004, and on the anniversary of this date until 4 June 2006 inclusive:
| Director | Number of Ordinary Shares | |||
| Bernard Gray | 100,000 | |||
| Graham Howe | 100,000 | |||
| Dr Janet Morgan | 30,000 | |||
| Anthony Rice | 100,000 | |||
| Kasper Rorsted | 30,000 | |||
The purchase price for the Ordinary Shares to be purchased on 4 June 2004, 4 June 2005 and 4 June 2006 was originally set to be the lower of the closing mid-market price on such dates or the closing mid-market price on 4 June 2003 (103.5 pence). Following consultation with shareholders, the Board of Directors approved and the Non-executive Directors agreed to waive their entitlement to purchase the shares at the closing mid-market price on 4 June 2004, 2005 and 2006 if lower than 103.5 pence. Consequently the shares will be
Page 72
corporate governance
purchased on the agreed dates at 103.5 pence per Ordinary Share.
Due to her impending retirement from the Board at the close of the 2004 Annual General Meeting, Dr Janet Morgan will not be purchasing any shares under this arrangement.
The Non-executive Directors are expected to hold the purchased Ordinary Shares for a minimum period of three years from the date of purchase and to hold a minimum of 30,000 shares throughout their service as a Director. None of the benefits under the arrangement is pensionable. All other aspects of the arrangement remain unaltered. There is no intention to offer similar share purchase arrangements to Non-executive Directors in the future.
Bernard Gray, Graham Howe, Dr Janet Morgan, Anthony Rice and Kasper Rorsted are not entitled to any compensation if their appointment is terminated.
Executive Directors’ shareholding requirement |
The Company operates a policy of encouraging Executive Directors (including the Chief Executive Officer) to closely align their interests with shareholders’ by requiring them to build up and maintain a holding of Ordinary Shares in the Company to the value of at least twice their base salary. This is to be achieved through the retention of any net awards received from the short and long-term incentive plans described above.
Directors’ shareholdings |
The beneficial interests of the Directors and their immediate families in the Ordinary Shares of the Company were as follows:
| Director | As at 1 April 2003 (or date of appointment if later) | Shares acquired | As at 31 March 2004 | |||||||
| Francesco Caio (appointed 4 April 2003) | – | 383,632 | 383,632 | |||||||
| Bernard Gray | – | – | – | |||||||
| Charles Herlinger (appointed 1 December 2003) | – | – | – | |||||||
| Graham Howe (appointed 27 May 2003) | – | – | – | |||||||
| Richard Lapthorne | 1,000,000 | 1,600,000 | 2,600,000 | |||||||
| Kevin Loosemore (appointed 2 April 2003) | – | 493,764 | 493,764 | |||||||
| Dr Janet Morgan | 6,160 | – | 6,160 | |||||||
| Anthony Rice | – | – | – | |||||||
| Lord Robertson of Port Ellen (appointed 1 February 2004) | – | – | – | |||||||
| Kasper Rorsted (appointed 27 May 2003) | – | – | – | |||||||
| Robert Rowley | 51,696 | 384,518 | 436,214 | |||||||
Between 31 March 2004 and 1 June 2004 there were the following changes to the Directors’ shareholdings: Robert Rowley purchased 203 Ordinary Shares under the Share Purchase Plan.
Page 73
corporate governance
Directors’ remuneration |
The following sections of the Directors’ Remuneration Report have been subject to audit.
| Salary and fees | Bonuses | Other Benefits Note 2 | Compen- sation for loss of office | Pension cash allowance Note 3 | Total 2004 | Total 2003 | Employer pension contribution 2004 Note 11 | Employer pension contribution 2003 Note 11 | ||||||||||||||||||||
| Name of Director | £ | £ | £ | £ | £ | £ | £ | £ | £ | |||||||||||||||||||
Chairman | ||||||||||||||||||||||||||||
| Richard Lapthorne | 386,000 | – | 8,949 | – | – | 394,949 | 87,208 | – | – | |||||||||||||||||||
Current Executive Directors | ||||||||||||||||||||||||||||
| Francesco Caio | 700,000 | 1,245,800 | 184,145 | – | 58,333 | 2,188,278 | – | 116,666 | – | |||||||||||||||||||
| (from 4 April 2003) | ||||||||||||||||||||||||||||
Note 4 | ||||||||||||||||||||||||||||
| Charles Herlinger | 133,333 | 125,866 | 246 | – | 18,667 | 278,112 | – | 14,666 | – | |||||||||||||||||||
| (from 1 December 2003) | ||||||||||||||||||||||||||||
| Kevin Loosemore | 490,000 | 462,560 | 169,342 | – | 116,522 | 1,238,424 | – | 6,000 | – | |||||||||||||||||||
| (from 2 April 2003) | ||||||||||||||||||||||||||||
| Lord Robertson of Port Ellen | 33,333 | 31,467 | – | – | – | 64,800 | – | – | – | |||||||||||||||||||
| (from 1 February 2004) | ||||||||||||||||||||||||||||
| Robert Rowley | 458,333 | 500,000 | 340 | – | – | 958,673 | 189,167 | – | – | |||||||||||||||||||
Note 5 | ||||||||||||||||||||||||||||
Current Non-executive Directors | ||||||||||||||||||||||||||||
| Bernard Gray | 58,098 | – | – | – | – | 58,098 | 9,964 | – | – | |||||||||||||||||||
| Graham Howe | 43,674 | – | – | – | – | 43,674 | – | – | – | |||||||||||||||||||
| (from 27 May 2003) | ||||||||||||||||||||||||||||
| Dr Janet Morgan | 51,250 | – | 115 | – | – | 51,365 | 34,124 | – | – | |||||||||||||||||||
| Anthony Rice | 76,250 | – | – | – | – | 76,250 | 14,946 | – | – | |||||||||||||||||||
| Kasper Rorsted | 43,674 | – | – | – | – | 43,674 | – | – | – | |||||||||||||||||||
| (from 27 May 2003) | ||||||||||||||||||||||||||||
Former Directors | ||||||||||||||||||||||||||||
| Sir Winfried Bischoff | 12,739 | – | – | – | – | 12,739 | 41,708 | – | – | |||||||||||||||||||
| (until 25 July 2003) | ||||||||||||||||||||||||||||
| Adrian Chamberlain | 149,811 | 75,000 | 4,170 | 262,500 | – | 491,481 | 316,420 | – | – | |||||||||||||||||||
| (until 3 September 2003) | ||||||||||||||||||||||||||||
Note 6 | ||||||||||||||||||||||||||||
| Robert Lerwill | 79,008 | – | 16,981 | 340,962 | – | 436,951 | 592,560 | – | – | |||||||||||||||||||
| (until 3 June 2003) | ||||||||||||||||||||||||||||
Note 7 | ||||||||||||||||||||||||||||
| David Prince | 267,176 | 201,771 | 54,053 | – | 50,763 | 573,763 | 316,541 | 29,389 | 90,000 | |||||||||||||||||||
| (until 1 December 2003) | ||||||||||||||||||||||||||||
Note 8 | ||||||||||||||||||||||||||||
| Graham Wallace | 11,801 | – | 421 | 387,500 | – | 399,722 | 816,417 | – | – | |||||||||||||||||||
| (until 4 April 2003) | ||||||||||||||||||||||||||||
Note 9 | ||||||||||||||||||||||||||||
Totals | 2,994,480 | 2,642,464 | 438,762 | 990,962 | 244,285 | 7,310,953 | 2,419,055 | 166,721 | 90,000 | |||||||||||||||||||
Page 74
corporate governance
Notes |
| 1. | The aggregate emoluments of the Directors, which excludes compensation for loss of office, were £6,319,991 (2003 – £3,226,142, which includes emoluments of £807,087 paid to Directors who resigned during the year ended 31 March 2003). |
| 2. | In compliance with the Companies Act 1985, ‘Other benefits’ includes the reimbursement of costs associated with staff entertaining, relocation and the value of benefits in kind relating to Company provided life assurance, professional advice, travel and accommodation. |
| 3. | Company pension contributions that would otherwise have breached the Inland Revenue’s funding limit have instead been paid to the Director as an annual cash allowance. |
| 4. | In recognition of arrangements with his previous employer that were forfeited on joining the Company, Francesco Caio received a one-off payment of £375,000 that had to be invested in Ordinary Shares of the Company. In addition he received a performance related bonus of £870,800 for the 2003/4 financial year. |
| 5. | With effect from his appointment as part-time Executive Deputy Chairman on 1 February 2003, Robert Rowley received an annual salary of £250,000. His annual salary was increased to £500,000 during the period 1 June 2003 to 31 March 2004 (with a £500,000 bonus potential) to reflect his full-time involvement in the Company’s exit from the US businesses. His annual salary reverted to £250,000 with effect from 1 April 2004. |
| 6. | Under the terms of his severance agreement, on leaving the Company as a Director and employee on 3 September 2003 Mr Chamberlain received a cash payment of £262,500, equivalent to nine months’ salary, in lieu of notice. He also received additional pension credit, equivalent to nine months’ pensionable service, the capital value of which was £90,000. In addition, he was paid a bonus of £75,000 in recognition of his contribution to the restructuring of the Company over the previous year. |
| 7. | Robert Lerwill resigned from the Board on 3 June 2003 but continued as an employee until 30 September 2003. Mr Lerwill, whose contract included a two-year notice period, agreed to waive a significant portion of his contractual entitlements and accordingly received a cash payment of £337,500, equivalent to nine months salary, in lieu of notice. He also received a payment of £3,462 as liquidation of unused leave entitlement and an additional pension credit, equivalent to 18 months’ pensionable service, the capital value of which was £407,000. |
| 8. | David Prince received salary payments of £267,176 for the period up to his resignation from the Board on 1 December 2003, and an additional £132,824 for the period up to 31 March 2004. His employment ends on 3 June 2004. |
| 9. | Graham Wallace resigned from the Board on 4 April 2003 but continued as an employee until 20 July 2003. Mr Wallace, whose contract included a two-year notice period, agreed to waive a significant proportion of his contractual entitlements and accordingly received a cash payment of £387,500, equivalent to six months’ salary, in lieu of notice. He also received additional pension credit, equivalent to 14 months’ pensionable service, the capital value of which was £500,000. |
| 10. | Bonus awards for the current Executive Directors reflect over-achievement against the profit before tax and net cash flow financial performance targets set by the Committee. The level of performance against the targets was sufficient to generate bonuses equivalent to 94.4% of the maximum payment potential under the bonus plan. The targets were toughened during the year for items which were either unbudgeted or were not quantified at the time of their original approval. Francesco Caio’s bonus award includes an additional 30 per cent of salary to reflect the achievement of specific strategic targets. |
| Robert Rowley’s bonus award reflects the agreement made at the time of his change in status and salary during the year and his achievements in the Company’s exit from the US businesses. |
| 11. | ‘Employer pension contributions’ list the Company contributions paid into Directors’ defined contribution pension plans. Benefits accrued by former Directors in defined benefit pension plans are detailed in the Directors’ Pension Entitlements section of the report on page 80. |
Page 75
corporate governance
Directors’ share options |
| Name of Director | Scheme | Grant date | Date from which first exercisable | Date of expiry of option | Exercise price (pence) | Shares under option at 1 April 2003 (or date of appointment if later) | Granted between 1 April 2003 and 31 March 2004 | Exercised | Lapsed cancelled or forfeited | Shares under option at 31 March 2004 (or date of leaving if earlier) | |||||||||||||||||||||
Francesco Caio | SOP Approved | 26/6/03 | 26/6/06 | 25/6/10 | 103.7 | – | 28,929 | – | – | 28,929 | |||||||||||||||||||||
(from 4 April 2003) | SOP Unapproved | 26/6/03 | 26/6/06 | 25/6/10 | 103.7 | – | 2,671,167 | – | – | 2,671,167 | |||||||||||||||||||||
| SAYE | 4/7/03 | 1/9/06 | 28/2/07 | 89 | – | 10,393 | – | – | 10,393 | ||||||||||||||||||||||
| – | 2,710,489 | – | – | 2,710,489 | |||||||||||||||||||||||||||
Adrian Chamberlain | SOP Unapproved | 27/7/01 | 27/7/04 | 26/7/08 | 340 | 176,471 | – | – | – | 176,471 | |||||||||||||||||||||
(until 3 September 2003) | SOP Unapproved | 23/5/02 | 23/5/05 | 22/5/09 | 262 | 201,000 | – | – | – | 201,000 | |||||||||||||||||||||
Note 4 | SOP Unapproved | 23/5/02 | 23/5/05 | 22/5/09 | 204.05 | 258,000 | – | – | – | 258,000 | |||||||||||||||||||||
| C&W RESOS | 22/12/99 | 22/12/02 | 21/12/09 | 982 | 3,054 | – | – | – | 3,054 | ||||||||||||||||||||||
| C&W RESOS | 25/5/00 | 25/5/03 | 24/5/10 | 966.2 | 1 | – | – | – | 1 | ||||||||||||||||||||||
| C&W SESOS | 3/7/96 | 3/7/99 | 2/7/03 | 420.5 | 25,000 | – | – | 25,000 | – | ||||||||||||||||||||||
| C&W SESOS | 13/6/97 | 13/6/00 | 12/6/04 | 553.3 | 49,000 | – | – | – | 49,000 | ||||||||||||||||||||||
| C&W SESOS | 22/12/99 | 22/12/02 | 21/12/06 | 982 | 16,294 | – | – | – | 16,294 | ||||||||||||||||||||||
| C&W SESOS | 25/5/00 | 25/5/03 | 24/5/07 | 966.2 | 9,832 | – | – | – | 9,832 | ||||||||||||||||||||||
| C&W SAYE | 18/12/98 | 1/3/04 | 31/8/04 | 558.64 | 2,295 | – | – | 2,295 | – | ||||||||||||||||||||||
| C&W SAYE | 16/6/00 | 1/9/05 | 28/2/06 | 985.92 | 410 | – | – | 410 | – | ||||||||||||||||||||||
| 741,357 | – | – | 27,705 | 713,652 | |||||||||||||||||||||||||||
Charles Herlinger | SOP Approved | 15/12/03 | 15/12/06 | 14/12/10 | 135.7 | – | 22,107 | – | – | 22,107 | |||||||||||||||||||||
(from 1 December 2003) | SOP Unapproved | 15/12/03 | 15/12/06 | 14/12/10 | 135.7 | – | 1,156,964 | – | – | 1,156,964 | |||||||||||||||||||||
| – | 1,179,071 | – | – | 1,179,071 | |||||||||||||||||||||||||||
Robert Lerwill | SOP Unapproved | 27/7/01 | 27/7/04 | 26/7/08 | 340 | 470,588 | – | – | – | 470,588 | |||||||||||||||||||||
(until 3 June 2003) | SOP Unapproved | 23/5/02 | 23/5/05 | 22/5/09 | 262 | 258,000 | – | – | – | 258,000 | |||||||||||||||||||||
Note 5 | SOP Unapproved | 23/5/02 | 23/5/05 | 22/5/09 | 204.05 | 331,000 | – | – | – | 331,000 | |||||||||||||||||||||
| C&W RESOS | 25/5/00 | 25/5/03 | 24/5/10 | 966.2 | 3,104 | – | – | – | 3,104 | ||||||||||||||||||||||
| C&W SESOS | 8/1/97 | 8/1/00 | 7/1/04 | 472.4 | 112,853 | – | – | 112,853 | – | ||||||||||||||||||||||
| C&W SESOS | 8/6/98 | 8/6/01 | 7/6/05 | 704.6 | 40,000 | – | – | – | 40,000 | ||||||||||||||||||||||
| C&W SESOS | 19/5/99 | 19/5/02 | 18/5/06 | 810.7 | 43,150 | – | – | – | 43,150 | ||||||||||||||||||||||
| C&W SESOS | 25/5/00 | 25/5/03 | 24/5/07 | 966.2 | 50,456 | – | – | – | 50,456 | ||||||||||||||||||||||
| C&W SESOS | 25/5/00 | 25/5/03 | 24/5/07 | 966.2 | 35,132 | – | – | – | 35,132 | ||||||||||||||||||||||
| C&W SAYE | 14/6/02 | 1/9/05 | 28/2/06 | 158.36 | 5,998 | – | – | 5,998 | – | ||||||||||||||||||||||
| 1,350,281 | – | – | 118,851 | 1,231,430 | |||||||||||||||||||||||||||
Kevin Loosemore | SOP Approved | 26/6/03 | 26/6/06 | 25/6/10 | 103.7 | – | 28,929 | – | – | 28,929 | |||||||||||||||||||||
(from 2 April 2003) | SOP Unapproved | 26/6/03 | 26/6/06 | 26/6/10 | 103.7 | – | 1,861,139 | – | – | 1,861,139 | |||||||||||||||||||||
| SAYE | 4/7/03 | 1/9/06 | 28/2/07 | 89 | – | 10,393 | – | – | 10,393 | ||||||||||||||||||||||
| – | 1,900,461 | – | – | 1,900,461 | |||||||||||||||||||||||||||
David Prince | SOP Approved | 1/7/02 | 1/7/05 | 30/6/09 | 166.8 | 17,985 | – | – | – | 17,985 | |||||||||||||||||||||
(until 1 December 2003) | SOP Unapproved | 1/7/02 | 1/7/05 | 30/6/09 | 166.8 | 342,015 | – | – | – | 342,015 | |||||||||||||||||||||
Note 6 | SOP Unapproved | 1/7/02 | 1/7/05 | 30/6/09 | 262 | 229,000 | – | – | – | 229,000 | |||||||||||||||||||||
| 589,000 | – | – | – | 589,000 | |||||||||||||||||||||||||||
Lord Robertson of Port Ellen | SOP Approved | 6/2/04 | 6/2/07 | 5/2/11 | 143.25 | – | 20,942 | – | – | 20,942 | |||||||||||||||||||||
(from 1 February 2004) | SOP Unapproved | 6/2/04 | 6/2/07 | 5/2/11 | 143.25 | – | 537,522 | – | – | 537,522 | |||||||||||||||||||||
| – | 558,464 | – | – | 558,464 | |||||||||||||||||||||||||||
Robert Rowley | SOP Approved | 26/6/03 | 26/6/06 | 25/6/10 | 103.7 | – | 28,929 | – | – | 28,929 | |||||||||||||||||||||
| SOP Unapproved | 26/6/03 | 26/6/06 | 25/6/10 | 103.7 | – | 935,391 | – | – | 935,391 | ||||||||||||||||||||||
| SAYE | 4/7/03 | 1/9/08 | 28/2/09 | 89 | – | 17,893 | – | – | 17,893 | ||||||||||||||||||||||
| – | 982,213 | – | – | 982,213 | |||||||||||||||||||||||||||
Graham Wallace | SOP Unapproved | 27/7/01 | 27/7/04 | 26/7/08 | 340 | 1,367,647 | – | – | 1,367,647 | – | |||||||||||||||||||||
(until 4 April 2003) | SOP Unapproved | 23/5/02 | 23/5/05 | 22/5/09 | 262 | 592,000 | – | – | 592,000 | – | |||||||||||||||||||||
Note 7 | SOP Unapproved | 23/5/02 | 23/5/05 | 22/5/09 | 204.05 | 760,000 | – | – | 760,000 | – | |||||||||||||||||||||
| C&W RESOS | 13/6/97 | 13/6/00 | 12/6/07 | 553.3 | 5,422 | – | – | 5,422 | – | ||||||||||||||||||||||
| C&W SESOS | 13/6/97 | 13/6/00 | 12/6/04 | 553.3 | 169,578 | – | – | 169,578 | – | ||||||||||||||||||||||
| C&W SESOS | 8/6/98 | 8/6/01 | 7/6/05 | 704.60 | 40,000 | – | – | 40,000 | – | ||||||||||||||||||||||
| C&W SESOS | 25/2/99 | 25/2/02 | 23/2/06 | 848.8 | 182,597 | – | – | 182,597 | – | ||||||||||||||||||||||
| C&W SESOS | 19/5/99 | 19/5/02 | 18/5/06 | 810.7 | 88,800 | – | – | 88,800 | – | ||||||||||||||||||||||
| C&W SESOS | 25/5/00 | 25/5/03 | 24/5/07 | 966.2 | 108,673 | – | – | 108,673 | – | ||||||||||||||||||||||
| C&W SESOS | 25/5/00 | 25/5/03 | 24/5/07 | 966.2 | 71,370 | – | – | 71,370 | – | ||||||||||||||||||||||
| C&W SAYE | 15/6/01 | 1/9/06 | 28/2/07 | 357.92 | 4,714 | – | – | 4,714 | – | ||||||||||||||||||||||
| C&W SAYE | 14/6/02 | 1/9/07 | 28/2/08 | 158.36 | 10,450 | – | – | 10,450 | – | ||||||||||||||||||||||
| 3,401,251 | – | – | 3,401,251 | – | |||||||||||||||||||||||||||
Page 76
corporate governance
Notes |
| 1. |
| • | SOP Approved and Unapproved – Inland Revenue approved and unapproved grants respectively made under the Share Option Plan (see pages 125 to 126 for details). |
| • | C&W RESOS and C&W SESOS – Cable & Wireless Revenue Approved Share Option Scheme and Cable & Wireless Senior Employees’ Share Option Scheme respectively. Prior to July 2001, Cable & Wireless granted share options under these share option plans. Options awarded under these plans between June 1999 and July 2001 are subject to performance conditions based upon Cable & Wireless’ TSR performance relative to the FTSE 100 Index, underpinned by real growth in EBITDA and turnover. For full vesting, Cable & Wireless’ TSR performance has to achieve at least upper quartile level against the FTSE 100 between the third and fifth anniversaries of the date of grant. Half the award vests for TSR performance at the median level, with a sliding scale between median and upper quartile. If the performance conditions are not met by the fifth anniversary of the date of grant, the options lapse. RESOS and SESOS options granted before June 1999 become exercisable if growth in the Company’s published Earnings Per Share (excluding exceptional items) measured over any period of three consecutive financial years, commencing not earlier than the financial year in which the option was granted, exceeds by not less than six per cent of the percentage growth of the Retail Price Index over the same three year period. |
| • | C&W SAYE – Cable & Wireless Save As You Earn share option scheme. These options are not subject to performance conditions because this is an all-employee scheme governed by specific tax legislation. | |
| 2. | Nil price was paid by Directors for the award of the options listed in the table above. |
| 3. | The closing mid-market price of an Ordinary Share on 31 March 2004 was 129.75 pence. The highest closing mid-market price of an Ordinary Share during the year was 153.5 pence and lowest closing mid-market price was 71 pence. There were no changes to the Directors’ share options from 31 March 2004 to 1 June 2004. |
| 4. | In accordance with the rules of the Company’s share option plans, the share options held by Adrian Chamberlain may be exercised within specified periods from his date of leaving the Company, 3 September 2003, and will not be subject to performance conditions. He may exercise his C&W RESOS, C&W SESOS and SOP Unapproved share options on or before 2 September 2004. The SAYE share options lapsed in accordance with the rules of that Scheme. |
| 5. | In accordance with the rules of the Company’s share option plans, the share options held by Robert Lerwill may be exercised within specified periods from his date of leaving the Company, 30 September 2003, and will not be subject to performance conditions. He may exercise his C&W RESOS, C&W SESOS and SOP Unapproved share options on or before 29 September 2004. The SAYE share options lapsed in accordance with the rules of that Scheme. |
| 6. | In accordance with the rules of the Company’s share option plans, the share options held by David Prince may be exercised within specified periods from his date of leaving the Company, 3 June 2004, and will not be subject to performance conditions. He may exercise his Cable & Wireless SOP Approved and Unapproved share options on or before 2 June 2005. |
| 7. | Under the severance terms agreed with Graham Wallace all of his share options lapsed from the date his employment with the Company ended, 20 July 2003. |
| 8. | No Directors had any gains on the exercise of share options in the year ended 31 March 2003. |
Page 77
corporate governance
Directors’ Performance Share Plan (“PSP”), Deferred Short Term Incentive Plan (“STIP”) and Restricted Share Plan Awards |
| Name of Director | Scheme | Award date | Vesting date | Market price on date of award (pence) | Shares under award at 1 April 2003 (or date of appointment if later) | Shares awarded between 1 April 2003 and 31 March 2004 | Shares vested | Shares Lapsed, Cancelled or Forfeited | Shares under award at 31 March 2004 (or date of cessation if earlier) | |||||||||||||||||||
Francesco Caio | Restricted | 4/6/03 | 4/6/06 | 97.75 | – | 383,632 | – | – | 383,632 | |||||||||||||||||||
(from 4 April 2003) | Share Plan | Note 1 | ||||||||||||||||||||||||||
| – | 383,632 | – | – | 383,632 | ||||||||||||||||||||||||
Adrian Chamberlain | PSP | 1/4/00 | 31/3/03 | 1271 | 7,474 | – | – | 7,474 | – | |||||||||||||||||||
(until 3 September 2003) | Note 2 | |||||||||||||||||||||||||||
| PSP | 27/7/01 | 27/7/04 | 340 | 58,824 | – | – | 17,974 | 40,850 | ||||||||||||||||||||
| Note 3 | ||||||||||||||||||||||||||||
| PSP | 23/5/02 | 23/5/05 | 204.05 | 171,600 | – | – | 100,100 | 71,500 | ||||||||||||||||||||
| Note 3 | ||||||||||||||||||||||||||||
| 237,898 | – | – | 125,548 | 112,350 | ||||||||||||||||||||||||
| Charles Herlinger (from 1 December 2003) | Restricted Share Plan | 15/12/03 | 01/12/06 | 135.7 | – | 250,000 Note 4 | – | – | 250,000 | |||||||||||||||||||
| – | 250,000 | – | – | 250,000 | ||||||||||||||||||||||||
Richard Lapthorne | Matching Shares | 10/1/03 | 10/1/06 | 57 | 1,000,000 | – | 1,000,000 Note 5 | – | – | |||||||||||||||||||
| 1,000,000 | – | 1,000,000 | – | – | ||||||||||||||||||||||||
Robert Lerwill | PSP | 1/4/00 | 31/3/03 | 1271 | 27,144 | – | – | 27,144 | – | |||||||||||||||||||
(until 3 June 2003) | Note 2 | |||||||||||||||||||||||||||
| PSP | 27/7/01 | 27/7/04 | 340 | 117,647 | – | – | 32,680 | 84,967 | ||||||||||||||||||||
| Note 6 | ||||||||||||||||||||||||||||
| PSP | 23/5/02 | 23/5/05 | 204.05 | 220,600 | – | – | 122,556 | 98,044 | ||||||||||||||||||||
| Note 6 | ||||||||||||||||||||||||||||
| Deferred STIP | 23/5/02 | 23/5/05 | 204.05 | 29,406 | – | 29,406 | – | – | ||||||||||||||||||||
| Note 7 | ||||||||||||||||||||||||||||
| 394,797 | – | 29,406 | 182,380 | 183,011 | ||||||||||||||||||||||||
Kevin Loosemore | Restricted | 4/6/03 | 4/6/06 | 97.75 | – | 383,632 | – | – | 383,632 | |||||||||||||||||||
(from 2 April 2003) | Share Plan | Note 8 | ||||||||||||||||||||||||||
| Restricted Share Plan | 31/7/03 | 31/7/06 | 113.5 | – | 110,132 Note 8 | – | – | 110,132 | ||||||||||||||||||||
| – | 493,764 | – | – | 493,764 | ||||||||||||||||||||||||
David Prince | PSP | 23/5/02 | 23/5/05 | 204.05 | 196,100 | – | – | – | 196,100 | |||||||||||||||||||
(until 1 December 2003) | Note 9 | |||||||||||||||||||||||||||
| Restricted Share Plan | 1/7/02 | 30/6/03 | 166.8 | 82,434 Note 10 | – | 82,434 | – | – | ||||||||||||||||||||
| Restricted Share Plan | 1/7/02 | 30/6/04 | 166.8 | 82,434 Note 10 | – | – | – | 82,434 | ||||||||||||||||||||
| 360,968 | – | 82,434 | – | 278,534 | ||||||||||||||||||||||||
Robert Rowley | Restricted Share Plan | 4/6/03 | 4/6/06 | 97.75 | – | 383,632 Note 11 | – | – | 383,632 | |||||||||||||||||||
| – | 383,632 | – | – | 383,632 | ||||||||||||||||||||||||
Graham Wallace | PSP | 1/4/00 | 31/3/03 | 1271 | 55,075 | – | – | 55,075 | – | |||||||||||||||||||
(until 4 April 2003) | Note 2 | |||||||||||||||||||||||||||
| PSP | 27/7/01 | 27/7/04 | 340 | 227,941 | – | – | 227,941 | – | ||||||||||||||||||||
| Note 12 | ||||||||||||||||||||||||||||
| PSP | 23/5/02 | 23/5/05 | 204.05 | 379,900 | – | – | 379,900 | – | ||||||||||||||||||||
| Note 12 | ||||||||||||||||||||||||||||
| 662,916 | – | – | 662,916 | – | ||||||||||||||||||||||||
Page 78
corporate governance
Notes |
| 1. | Subject to Francesco Caio remaining an employee of the Company and retaining beneficial ownership until 4 June 2006 of the 383,632 Ordinary Shares he acquired on 4 June 2003, the Company will deliver 383,632 Ordinary Shares to him. No performance conditions are attached to this award since it represents compensation for arrangements forfeited on leaving his previous employer. |
| 2. | The contingent awards made on 1 April 2000 under the Performance Share Plan lapsed on 1 April 2003 having failed to achieve the required performance conditions. |
| 3. | The unvested contingent awards made to Adrian Chamberlain under the Performance Share Plan were pro-rated to reflect the number of completed months membership in each Plan at the date his employment with the Company ended on 3 September 2003. Vesting of these pro-rated awards at the end of the performance periods will continue to be subject to the originally specified performance conditions. |
| 4. | Charles Herlinger was awarded 250,000 restricted shares on 15 December 2003 following his appointment as a Director of the Company on 1 December 2003. Subject to Mr Herlinger remaining an employee of the Company the restricted shares will vest on 14 December 2006. No other performance conditions are attached to this award. |
| 5. | Subject to Richard Lapthorne remaining a Director and Chairman of the Company and retaining beneficial ownership until 10 January 2006 of the 1,000,000 Ordinary Shares he acquired on appointment on 10 January 2003, the Company agreed to deliver 1,000,000 Ordinary Shares to him. No other performance conditions were attached to this award of Matching Shares. Following discussion with shareholders the Company brought forward the granting of Matching Shares to Mr Lapthorne, and as a result on 17 March 2004 he acquired 1,000,000 Ordinary Shares for nil consideration. These shares will be forfeited if, before 10 January 2006 Mr Lapthorne resigns as Chairman of the Company or ceases to retain the 1,000,000 Investment Shares purchased at the time of his appointment. |
| 6. | The unvested contingent awards made to Robert Lerwill under the Performance Share Plan were pro-rated to reflect the number of completed months membership in each Plan at the date his employment with the Company ended on 30 September 2003. Vesting of these pro-rated awards at the end of the performance periods will continue to be subject to the originally specified performance conditions. |
| 7. | In accordance with the rules of the Deferred Short Term Incentive Plan, 29,406 Ordinary Shares were transferred to Robert Lerwill on 30 September 2003 at a price of 113.75 pence. In addition, 1,405 Ordinary Shares representing re-invested dividends on the 29,406 Ordinary Shares were also transferred to Mr Lerwill in accordance with the rules of the Plan. |
| 8. | Subject to Kevin Loosemore remaining an employee of the Company and retaining beneficial ownership until 4 June 2006 of the 383,632 Ordinary Shares he acquired on 4 June 2003, the Company will deliver 383,632 Ordinary Shares to him. Subject to Mr Loosemore remaining an employee of the Company and retaining beneficial ownership until 1 August 2006 of the 110,132 Ordinary Shares he acquired on 31 July 2003, the Company will deliver 110,132 Ordinary Shares to him. No other performance conditions are attached to these awards. |
| 9. | The unvested contingent award made to David Prince under the Performance Share Plan will be pro-rated to reflect the number of completed months membership in the Plan at the date his employment with the Company ends on 3 June 2004. Vesting of the pro-rated award at the end of the performance period will continue to be subject to the originally specified performance conditions. |
| 10. | David Prince was awarded 164,868 restricted shares on his appointment as a Director of the Company on 1 July 2002. 82,434 of these restricted shares vested on 30 June 2003 at a price of 113 pence, and 82,434 vest on his date of leaving the Company, 3 June 2004, in accordance with the rules of the Company’s restricted share plan. No performance conditions were attached to these awards since they represent compensation for benefits forfeited on leaving his previous employer. |
| 11. | Subject to Robert Rowley remaining an employee of the Company and retaining beneficial ownership until 4 June 2006 of the 383,632 Ordinary Shares he acquired on 4 June 2003, the Company will deliver 383,632 Ordinary Shares to him. No other performance conditions are attached to this award. |
| 12. | Under the severance terms agreed with Graham Wallace, all of his contingent awards under the Performance Share Plan lapsed from the date his employment with the Company ended, 20 July 2003. |
There were no changes to the Directors’ PSP and Restricted Share Awards from 31 March 2004 to 1 June 2004.
Page 79
corporate governance
Directors’ pension entitlements |
Francesco Caio, Charles Herlinger, Kevin Loosemore and David Prince participate in defined contribution pension schemes. Adrian Chamberlain, Robert Lerwill and Graham Wallace participated in defined benefit pension schemes. Lord Robertson of Port Ellen and Robert Rowley do not participate in Company pension schemes.
Defined benefit pensions |
Pension values for the year ended 31 March 2004 were as follows:
| Accrued benefits at 31 March 2004 (or date of cessation if earlier) | Increase in accrued benefits during the year (including inflation) | Transfer value of accrued benefits at 31 March 2004 (or date of cessation if earlier) | Transfer value of accrued benefits at 1 April 2003 | Increase/(decrease) in transfer value less Directors’ contributions | ||||||||||||
| Name of Director | £ | £ | £ | £ | £ | |||||||||||
| Adrian Chamberlain | 93,427 | 27,531 | 992,143 | 782,063 | 202,845 | |||||||||||
| Robert Lerwill | 111,228 | 29,594 | 1,394,227 | 1,193,081 | 201,146 | |||||||||||
| Graham Wallace | 231,294 | – | 3,355,037 | 3,917,131 | (562,094 | ) | ||||||||||
The transfer value of £3,355,037 is based on benefits accrued when Mr Wallace resigned his directorship on 4 April 2003. The transfer value has fallen because of a change in the actuary’s basis for calculating transfer values which took effect from 1 April 2004. His accrued benefits at this date were the same as those accrued at 31 March 2003. He subsequently retired from the Company on 20 July 2003 with an immediate pension of £222,116 per annum. This figure is not directly comparable with the accrued pension of £231,294 shown in the 31 March 2003 accounts, which would have been paid from his 60th birthday (26 May 2008).
Adrian Chamberlain contributed £7,433 to his pension during the year ended 31 March 2004. Robert Lerwill and Graham Wallace had non-contributory pensions.
The difference between transfer values of the accrued benefits at the beginning and end of the year have been calculated on the basis of actuarial advice in accordance with Actuarial Guidance Note GN11, less Directors’ contributions.
The table below provides supplementary disclosures on Directors’ pensions required by the Listing Rules of the Financial Services Authority:
| Increase in accrued benefits during the year (excluding inflation) | Transfer value of the increase in accrued benefits less Directors’ contributions (excluding inflation) | ||||||
| Name of Director | £ | £ | |||||
| Adrian Chamberlain | 26,938 | 289,315 | |||||
| Robert Lerwill | 29,455 | 369,212 | |||||
| Graham Wallace | – | – | |||||
Defined contribution pensions |
Company contributions are listed in the Directors’ Remuneration table on pages 74 to 75.
Former Directors’ pensions |
An amount of £12.1 million (2003 – £4.7 million) is included in provisions to cover the cost of former Directors’ pension entitlements.
On behalf of the Board
Bernard Gray
Chairman, Remuneration Committee
1 June 2004
Page 80
directors’ responsibilities in respect of the preparation of the financial statements
DIRECTORS’ RESPONSIBILITIES IN RESPECT OF THE PREPARATION OF THE FINANCIAL STATEMENTS
United Kingdom company law requires the Directors to prepare financial statements for each financial year which give a true and fair view of the state of affairs of the Company and of the Group and of the profit or loss for that period. In preparing those Financial Statements, the Directors are required to:
| • | select suitable accounting policies and then apply them consistently; |
| • | make judgements and estimates that are reasonable and prudent; |
| • | state whether applicable accounting standards have been followed, subject to any material departures disclosed and explained in the financial statements; and |
| • | prepare the financial statements on the going concern basis unless it is inappropriate to presume that the Group will continue in business. |
The Directors are responsible for keeping proper accounting records which disclose, with reasonable accuracy at any time, the financial position of the Company and enable them to ensure that the financial statements comply with the Companies Act 1985. They have general responsibility for taking such steps as are reasonably open to them to safeguard the assets of the Group and to prevent and detect fraud and other irregularities.
Page 81
Report of the independent public accounting firm
REPORT OF THE INDEPENDENT PUBLIC ACCOUNTING FIRM
To the Shareholders and Directors of Cable and Wireless plc
We have audited the accompanying consolidated balance sheets of Cable and Wireless plc and subsidiaries as of 31 March 2004 and 2003, and related consolidated profit and loss accounts, statements of cash flows, statements of total recognised gains and losses and reconciliations of movements in shareholders’ funds for each of the years in the three year period ended 31 March 2004. These consolidated financial statements are the responsibility of the Company’s management. Our responsibility is to express an opinion on these consolidated financial statements based on our audits.
We conducted our audits in accordance with generally accepted auditing standards in the United Kingdom and with the Standards of the Public Company Accounting Oversight Board in the United States of America. Those standards require that we plan and perform the audit to obtain reasonable assurance about whether the consolidated financial statements are free of material misstatement. An audit includes examination, on a test basis, of evidence supporting the amounts and disclosures in the consolidated financial statements. An audit also includes assessing the accounting principles used and significant estimates made by management, as well as evaluating the overall consolidated financial statements presentation. We believe that our audit provides a reasonable basis for our opinion.
In our opinion, based on our audits, the consolidated financial statements referred to above present fairly, in all material respects, the financial position of Cable and Wireless plc and subsidiaries as of 31 March 2004 and 2003 and the results of their operations and cash flows for each of the years in the three year period ended 31 March 2004 in conformity with generally accepted accounting principles in the United Kingdom.
Page 82
Report of the independent public accounting firm
Accounting principles generally accepted in the United Kingdom vary in certain significant respects from accounting principles generally accepted in the United States of America. Information relating to the nature and effect of such differences is presented in Note 36 to the consolidated financial statements. As discussed in Note 36 to the consolidated financial statements certain US GAAP information for the years ended 31 March 2004 and 2003 has been restated.
KPMG Audit Plc
Chartered Accountants
Registered Auditor
London
1 June 2004, except as to the restatement discussed in Note 36 to the consolidated financial statements which is as of 22 July 2005.
Page 83
consolidated profit and loss account
CONSOLIDATED PROFIT AND LOSS ACCOUNT FOR THE YEAR ENDED 31 MARCH
| 2004 | 2003 | 2002 | ||||||||||||
| Note | £m | £m | £m | |||||||||||
Turnover of the Group including its share of joint ventures and associates | 3 | 3,868 | 4,651 | 6,098 | ||||||||||
| Share of turnover of | – joint ventures | 17 | (136 | ) | (195 | ) | (285 | ) | ||||||
| – associates | 17 | (61 | ) | (65 | ) | (65 | ) | |||||||
Group turnover * | 3,4 | 3,671 | 4,391 | 5,748 | ||||||||||
| Operating costs before depreciation, amortisation and exceptional items | 5 | (3,223 | ) | (4,057 | ) | (5,013 | ) | |||||||
| Exceptional operating costs | 5,10 | (244 | ) | (442 | ) | (210 | ) | |||||||
| Operating costs before depreciation and amortisation | (3,467 | ) | (4,499 | ) | (5,223 | ) | ||||||||
| Depreciation before exceptional items | 5,16 | (252 | ) | (735 | ) | (1,072 | ) | |||||||
| Exceptional depreciation | 5,10,16 | (526 | ) | (2,381 | ) | (1,909 | ) | |||||||
| Depreciation | (778 | ) | (3,116 | ) | (2,981 | ) | ||||||||
| Amortisation of capitalised goodwill before exceptional items | 5,15 | 3 | (126 | ) | (562 | ) | ||||||||
| Exceptional amortisation | 5,10,15 | (10 | ) | (2,725 | ) | (2,007 | ) | |||||||
| Amortisation | (7 | ) | (2,851 | ) | (2,569 | ) | ||||||||
Total operating costs | 5 | (4,252 | ) | (10,466 | ) | (10,773 | ) | |||||||
Group operating loss * | (581 | ) | (6,075 | ) | (5,025 | ) | ||||||||
| Share of operating profits in joint ventures | 17 | 23 | 53 | 95 | ||||||||||
| Share of operating profits in associates | 17 | 18 | 22 | 20 | ||||||||||
Total operating loss | (540 | ) | (6,000 | ) | (4,910 | ) | ||||||||
| Exceptional profits less (losses) on sale and termination of operations | 10 | 250 | (147 | ) | 1,057 | |||||||||
| Profits less (losses) on disposal of fixed assets before exceptional items | 9 | 25 | – | (7 | ) | |||||||||
| Exceptional items | 10 | 28 | 62 | – | ||||||||||
| Profits less (losses) on disposal of fixed assets | 53 | 62 | (7 | ) | ||||||||||
| Exceptional write down of investments | 10 | – | (390 | ) | (904 | ) | ||||||||
Loss on ordinary activities before interest | (237 | ) | (6,475 | ) | (4,764 | ) | ||||||||
| Net interest and other similar income/(charges) | ||||||||||||||
| – Group | 11 | 13 | 103 | 227 | ||||||||||
| – Joint ventures and associates | 17 | – | (1 | ) | (12 | ) | ||||||||
| Total net interest and other similar income | 13 | 102 | 215 | |||||||||||
Loss on ordinary activities before taxation | (224 | ) | (6,373 | ) | (4,549 | ) | ||||||||
| Tax on loss on ordinary activities | 9,10,12 | 12 | (36 | ) | (311 | ) | ||||||||
Loss on ordinary activities after taxation | (212 | ) | (6,409 | ) | (4,860 | ) | ||||||||
| Equity minority interests | (25 | ) | (124 | ) | (94 | ) | ||||||||
Loss for the financial year | (237 | ) | (6,533 | ) | (4,954 | ) | ||||||||
| Dividends | 13 | (73 | ) | (37 | ) | (427 | ) | |||||||
Loss for the year retained | 24 | (310 | ) | (6,570 | ) | (5,381 | ) | |||||||
Basic loss per Ordinary Share | 14 | (10.2 | )p | (280.4 | )p | (181.2 | )p | |||||||
| Basic earnings/(loss) per Ordinary Share before exceptional items and goodwill amortisation | 14 | 6.0 | p | (18.0 | )p | (8.4 | )p | |||||||
| Diluted loss per Ordinary Share | 14 | (10.2 | )p | (280.4 | )p | (181.2 | )p | |||||||
Dividends per Ordinary Share | 3.15 | p | 1.6 | p | 16.5 | p | ||||||||
The accompanying notes are an integral part of these Financial Statements.
| * | Refer to page 85 for continuing operations analysis and page 86 for discontinued operations analysis. |
Page 84
consolidated profit and loss account
CONTINUING OPERATIONS FOR THE YEAR ENDED 31 MARCH
| 2004 | 2003 | 2002 | ||||||||||||
| Continuing | Continuing | Continuing | ||||||||||||
| operations | operations | operations | ||||||||||||
| Note | £m | £m | £m | |||||||||||
Turnover of the Group including its share of joint ventures and associates | 3 | 3,581 | 3,937 | 4,365 | ||||||||||
| Share of turnover of | – joint ventures | 17 | (136 | ) | (195 | ) | (216 | ) | ||||||
| – associates | 17 | (61 | ) | (65 | ) | (65 | ) | |||||||
Group turnover | 3,4 | 3,384 | 3,677 | 4,084 | ||||||||||
| Operating costs before depreciation, amortisation and exceptional items | 5 | (2,908 | ) | (3,054 | ) | (3,192 | ) | |||||||
| Exceptional operating costs | 5,10 | (222 | ) | (160 | ) | (160 | ) | |||||||
| Operating costs before depreciation and amortisation | (3,130 | ) | (3,214 | ) | (3,352 | ) | ||||||||
| Depreciation before exceptional items | 5 | (250 | ) | (665 | ) | (693 | ) | |||||||
| Exceptional depreciation | 5,10,16 | (526 | ) | (1,709 | ) | (1,099 | ) | |||||||
| Depreciation | (776 | ) | (2,374 | ) | (1,792 | ) | ||||||||
| Amortisation of capitalised goodwill before exceptional items | 5,15 | 3 | (65 | ) | (303 | ) | ||||||||
| Exceptional amortisation | 5,10,15 | (10 | ) | (2,257 | ) | (1,311 | ) | |||||||
| Amortisation | (7 | ) | (2,322 | ) | (1,614 | ) | ||||||||
Total operating costs | 5 | (3,913 | ) | (7,910 | ) | (6,758 | ) | |||||||
Group operating loss | (529 | ) | (4,233 | ) | (2,674 | ) | ||||||||
| Share of operating profits in joint ventures | 17 | 23 | 53 | 51 | ||||||||||
| Share of operating profits in associates | 17 | 18 | 22 | 20 | ||||||||||
Total operating loss | (488 | ) | (4,158 | ) | (2,603 | ) | ||||||||
| Exceptional profits less (losses) on sale and termination of operations | 10 | 2 | – | – | ||||||||||
| Profits less (losses) on disposal of fixed assets before exceptional items | 9 | 26 | – | (10 | ) | |||||||||
| Exceptional items | 10 | 12 | 62 | – | ||||||||||
| Profits less (losses) on disposal of fixed assets | 38 | 62 | (10 | ) | ||||||||||
| Exceptional write down of investments | 10 | – | (390 | ) | (904 | ) | ||||||||
Loss on ordinary activities before interest | (448 | ) | (4,486 | ) | (3,517 | ) | ||||||||
The accompanying notes are an integral part of these Financial Statements.
Page 85
consolidated profit and loss account
DISCONTINUED OPERATIONS FOR THE YEAR ENDED 31 MARCH
| 2004 | 2003 | 2002 | ||||||||||||
| Discontinued | Discontinued | Discontinued | ||||||||||||
| operations | operations | operations | ||||||||||||
| Note | £m | £m | £m | |||||||||||
Turnover of the Group including its share of joint ventures and associates | 3 | 287 | 714 | 1,733 | ||||||||||
| Share of turnover of | – joint ventures | 17 | – | – | (69 | ) | ||||||||
| – associates | 17 | – | – | – | ||||||||||
Group turnover | 3,4 | 287 | 714 | 1,664 | ||||||||||
| Operating costs before depreciation, amortisation and exceptional items | 5 | (315 | ) | (1,003 | ) | (1,821 | ) | |||||||
| Exceptional operating costs | 5,10 | (22 | ) | (282 | ) | (50 | ) | |||||||
| Operating costs before depreciation and amortisation | (337 | ) | (1,285 | ) | (1,871 | ) | ||||||||
| Depreciation before exceptional items | 5 | (2 | ) | (70 | ) | (379 | ) | |||||||
| Exceptional depreciation | 5,10 | – | (672 | ) | (810 | ) | ||||||||
| Depreciation | (2 | ) | (742 | ) | (1,189 | ) | ||||||||
| Amortisation of capitalised goodwill before exceptional items | 5 | – | (61 | ) | (259 | ) | ||||||||
| Exceptional amortisation | 5,10 | – | (468 | ) | (696 | ) | ||||||||
| Amortisation | – | (529 | ) | (955 | ) | |||||||||
Total operating costs | 5 | (339 | ) | (2,556 | ) | (4,015 | ) | |||||||
Group operating loss | (52 | ) | (1,842 | ) | (2,351 | ) | ||||||||
| Share of operating profits in joint ventures | 17 | – | – | 44 | ||||||||||
Total operating loss | (52 | ) | (1,842 | ) | (2,307 | ) | ||||||||
| Exceptional profits less (losses) on sale and termination of operations | 10 | 248 | (147 | ) | 1,057 | |||||||||
| Profits less (losses) on disposal of fixed assets before exceptional items | 9 | (1 | ) | – | 3 | |||||||||
| Exceptional items | 10 | 16 | – | – | ||||||||||
| Profits less (losses) on disposal of fixed assets | 15 | – | 3 | |||||||||||
Profit/(loss) on ordinary activities before interest | 211 | (1,989 | ) | (1,247 | ) | |||||||||
The accompanying notes are an integral part of these Financial Statements.
Page 86
consolidated balance sheet
CONSOLIDATED BALANCE SHEET AT 31 MARCH
| 2004 | 2003 | ||||||||||
| Note | £m | £m | |||||||||
Fixed assets | |||||||||||
| Intangible assets | 15 | (9 | ) | (2 | ) | ||||||
| Tangible assets | 16 | 1,214 | 1,937 | ||||||||
| Loans to joint ventures and associates | 17 | 1 | 1 | ||||||||
| Interest in net assets of joint ventures * | 17 | 132 | 148 | ||||||||
| Investments in associates | 17 | 75 | 83 | ||||||||
| Other investments | 17 | 99 | 123 | ||||||||
| Total fixed asset investments | 307 | 355 | |||||||||
| 1,512 | 2,290 | ||||||||||
Current assets | |||||||||||
| Stocks | 18 | 38 | 51 | ||||||||
| Current asset investments | 19 | 12 | 246 | ||||||||
| Debtors | – due within one year | 20 | 875 | 1,455 | |||||||
| – due after more than one year | 20 | 175 | 166 | ||||||||
| Short term deposits | 2,217 | 2,958 | |||||||||
| Cash at bank and in hand | 138 | 196 | |||||||||
| 3,455 | 5,072 | ||||||||||
Creditors: amounts falling due within one year | 21 | (1,668 | ) | (3,275 | ) | ||||||
Net current assets | 1,787 | 1,797 | |||||||||
Total assets less current liabilities | 3,299 | 4,087 | |||||||||
Creditors: amounts falling due after more than one year | |||||||||||
| Convertible debt | 21 | (252 | ) | – | |||||||
| Other creditors | 21 | (623 | ) | (807 | ) | ||||||
| (875 | ) | (807 | ) | ||||||||
Provisions for liabilities and charges | 22 | (431 | ) | (760 | ) | ||||||
| (1,306 | ) | (1,567 | ) | ||||||||
Net assets | 1,993 | 2,520 | |||||||||
Capital and reserves | |||||||||||
| Called up share capital | 23 | 596 | 596 | ||||||||
| Share premium account | 24 | 2 | 1,745 | ||||||||
| Special reserve | 24 | 1,745 | – | ||||||||
| Capital redemption reserve | 24 | 105 | 105 | ||||||||
| Profit and loss account | 24 | (704 | ) | (297 | ) | ||||||
Equity shareholders’ funds | 1,744 | 2,149 | |||||||||
Equity minority interests | 249 | 371 | |||||||||
Capital employed | 1,993 | 2,520 | |||||||||
| * | Interests in net assets of joint ventures include the Group’s share of gross assets of joint ventures of £190 million (2003 – £224 million) and the Group’s share of gross liabilities of joint ventures of £58 million (2003 – £76 million) – see Note 17. |
The accompanying notes are an integral part of these Financial Statements.
Page 87
company balance sheet
COMPANY BALANCE SHEET AT 31 MARCH
| Note | 2004 | 2003 | |||||||||
| £m | £m | ||||||||||
Fixed assets | |||||||||||
| Tangible assets | 16 | 11 | 22 | ||||||||
| Loans to joint ventures and associates | 17 | 1 | 1 | ||||||||
| Investments in associates | 17 | 21 | 24 | ||||||||
| Investments in subsidiaries | 17 | 19,700 | 18,116 | ||||||||
| Other investments | 17 | 69 | 85 | ||||||||
| Total fixed asset investments | 19,791 | 18,226 | |||||||||
| 19,802 | 18,248 | ||||||||||
Current assets | |||||||||||
| Stock | 18 | – | 1 | ||||||||
| Current asset investments | 19 | 12 | 11 | ||||||||
| Debtors | – due within one year | 20 | 123 | 154 | |||||||
| – due after more than one year | 20 | 102 | 90 | ||||||||
| Short term deposits | 2,121 | 2,755 | |||||||||
| Cash at bank and in hand | 35 | 28 | |||||||||
| 2,393 | 3,039 | ||||||||||
Creditors: amounts falling due within one year | 21 | (515 | ) | (1,132 | ) | ||||||
Net current assets | 1,878 | 1,907 | |||||||||
Total assets less current liabilities | 21,680 | 20,155 | |||||||||
Creditors: amounts falling due after more than one year | |||||||||||
| Convertible debt | 21 | (252 | ) | – | |||||||
| Other creditors | 21 | (18,106 | ) | (16,482 | ) | ||||||
| (18,358 | ) | (16,482 | ) | ||||||||
Provisions for liabilities and charges | 22 | (174 | ) | (19 | ) | ||||||
| (18,532 | ) | (16,501 | ) | ||||||||
Net assets | 3,148 | 3,654 | |||||||||
Capital and reserves | |||||||||||
| Called up share capital | 23 | 596 | 596 | ||||||||
| Share premium account | 24 | 2 | 1,745 | ||||||||
| Special reserve | 24 | 1,745 | – | ||||||||
| Revaluation reserve | 24 | – | 9,379 | ||||||||
| Capital redemption reserve | 24 | 105 | 105 | ||||||||
| Profit and loss account | 24 | 700 | (8,171 | ) | |||||||
Equity shareholders’ funds | 3,148 | 3,654 | |||||||||
The accompanying notes are an integral part of these Financial Statements.
Page 88
consolidated cash flow statement
CONSOLIDATED CASH FLOW STATEMENT FOR THE YEAR ENDED 31 MARCH
| 2004 | 2003 | 2002 | |||||||||||
| Note | £m | £m | £m | ||||||||||
Net cash inflow from operating activities | 28 | 73 | 95 | 94 | |||||||||
| Dividends from joint ventures | 12 | 13 | 11 | ||||||||||
| Dividends from associates | 13 | 15 | 15 | ||||||||||
| 25 | 28 | 26 | |||||||||||
Returns on investments and servicing of finance | |||||||||||||
| Interest and similar income received | 103 | 197 | 383 | ||||||||||
| Interest paid | (89 | ) | (88 | ) | (238 | ) | |||||||
| Net interest element of finance lease rentals paid | (1 | ) | (2 | ) | (5 | ) | |||||||
| Dividends paid to minorities | (75 | ) | (70 | ) | (61 | ) | |||||||
| Dividends received from preference shares | – | – | 54 | ||||||||||
| Income received from other investments | 5 | – | – | ||||||||||
| (57 | ) | 37 | 133 | ||||||||||
Taxation | (43 | ) | (438 | ) | (139 | ) | |||||||
Capital expenditure and financial investment | |||||||||||||
| Purchase of tangible fixed assets | (342 | ) | (810 | ) | (1,868 | ) | |||||||
| Sale of tangible fixed assets | 38 | 15 | 21 | ||||||||||
| Purchase of current asset investments | (1 | ) | (3 | ) | (608 | ) | |||||||
| Purchase of investments | (4 | ) | (38 | ) | (121 | ) | |||||||
| Sale of current asset investments | 229 | 600 | – | ||||||||||
| Sale of investments | 39 | 11 | 900 | ||||||||||
| Loans to joint ventures and associates | – | 10 | 2 | ||||||||||
| (41 | ) | (215 | ) | (1,674 | ) | ||||||||
Acquisitions and disposals | |||||||||||||
| Disposal of subsidiary undertakings (net of cash disposed and disposal costs) | (120 | ) | 14 | 2,372 | |||||||||
| Purchase of selected assets and business activities of Exodus | – | – | (478 | ) | |||||||||
| Purchase of shareholdings in subsidiary undertakings (net of cash received) | (5 | ) | 2 | (49 | ) | ||||||||
| Receipts from sale of associates | 7 | 94 | – | ||||||||||
| (118 | ) | 110 | 1,845 | ||||||||||
Equity dividends paid to shareholders | – | (119 | ) | (669 | ) | ||||||||
Management of liquid resources | |||||||||||||
| Movement in short term investments and fixed deposits (net) | 30 | 932 | (1,040 | ) | 2,586 | ||||||||
Financing | |||||||||||||
| Purchase of own shares | – | – | (1,107 | ) | |||||||||
| Issue of ordinary share capital | 2 | 1 | 2 | ||||||||||
| Capital element of finance lease rental repayments | (1 | ) | (18 | ) | (15 | ) | |||||||
| Other long term debt issued | 280 | 88 | 1,338 | ||||||||||
| Long term debt repaid | (863 | ) | (649 | ) | (785 | ) | |||||||
| (582 | ) | (578 | ) | (567 | ) | ||||||||
Increase/(decrease) in cash in the year | 29 | 189 | (2,120 | ) | 1,635 | ||||||||
The accompanying notes are an integral part of these Financial Statements.
Page 89
statement of total recognised gains and losses
CONSOLIDATED STATEMENT OF TOTAL RECOGNISED GAINS AND LOSSES FOR THE YEAR ENDED 31 MARCH
| 2004 | 2003 | 2002 | ||||||||
| £m | £m | £m | ||||||||
| Loss for the financial year | (237 | ) | (6,533 | ) | (4,954 | ) | ||||
| Currency translation differences on foreign currency net investments and related borrowings | (97 | ) | (240 | ) | 20 | |||||
| Tax charge on translation differences taken to reserves | – | – | (3 | ) | ||||||
Total losses recognised since last annual report | (334 | ) | (6,773 | ) | (4,937 | ) | ||||
Page 90
movements in equity shareholders’ funds
RECONCILIATION OF MOVEMENTS IN CONSOLIDATED EQUITY SHAREHOLDERS’
FUNDS FOR THE YEAR ENDED 31 MARCH
| 2004 | 2003 | ||||||
| £m | £m | ||||||
| Loss for the financial year | (237 | ) | (6,533 | ) | |||
| Dividends – interim | – | (37 | ) | ||||
Dividends – full | (73 | ) | – | ||||
| Loss for the year carried forward | (310 | ) | (6,570 | ) | |||
| Other recognised gains and losses relating to the year | (97 | ) | (240 | ) | |||
| New share capital issued | 2 | 1 | |||||
| Net decrease in equity shareholders’ funds | (405 | ) | (6,809 | ) | |||
| Opening equity shareholders’ funds | 2,149 | 8,958 | |||||
Closing equity shareholders’ funds | 1,744 | 2,149 | |||||
RECONCILIATION OF MOVEMENTS IN EQUITY SHAREHOLDERS’ FUNDS FOR THE
COMPANY FOR THE YEAR ENDED 31 MARCH
| 2004 | 2003 | ||||||
| £m | £m | ||||||
| Profit/(loss) for the financial year | 585 | (7,639 | ) | ||||
| Dividends – interim | – | (37 | ) | ||||
Dividends – full | (73 | ) | – | ||||
| Profit/(loss) for the year carried forward | 512 | (7,676 | ) | ||||
| Other recognised gains relating to the year | – | 17 | |||||
| Revaluation | (1,020 | ) | 223 | ||||
| New share capital issued | 2 | 1 | |||||
| Net decrease in equity shareholders’ funds | (506 | ) | (7,435 | ) | |||
| Opening equity shareholders’ funds | 3,654 | 11,089 | |||||
Closing equity shareholders’ funds | 3,148 | 3,654 | |||||
The accompanying notes are an integral part of these Financial Statements.
Page 91
statement of accounting policies
STATEMENT OF ACCOUNTING POLICIES
Basis of preparation |
The Financial Statements are prepared in accordance with applicable accounting standards and on the historical cost basis except for the revaluation of investments in subsidiaries in the Company’s accounts.
The accompanying consolidated Financial Statements have been prepared in accordance with generally accepted accounting principles in the United Kingdom (UK GAAP) which differ in certain significant respects from generally accepted accounting principles in the United States (US GAAP), (see Note 36 – ‘Summary of differences between United Kingdom and United States GAAP’).
The preparation of Financial Statements in accordance with generally accepted accounting principles requires management to make estimates and assumptions that affect the reported amounts of assets and liabilities at the date of the Financial Statements and the reported amounts of revenues and expenses during the reporting period. Actual results could differ from these estimates.
New accounting standards |
The following new accounting standards were adopted during the year:
UITF Abstract 37 ‘Purchases and sales of own shares’ is applicable for accounting periods ending on or after 23 December 2003. The Group has adopted UITF Abstract 37 for the year ended 31 March 2004.
The abstract requires the consideration paid or received from the purchase or sale of the Company’s own shares to be shown separately in the reconciliation of shareholders’ funds, with no gain recognised in the profit and loss account or statement of total recognised gains and losses. Shares held are no longer treated as assets but instead consideration paid is shown as a deduction from reserves.
The abstract does not apply to an entity’s own shares held by an ESOP trust and therefore, as the Group has no other holdings of its own shares, there is no impact of adoption on the reported results of the Group.
Application Note G to FRS 5 ‘Reporting the substance of transactions’ is applicable for accounting periods ending on or after 23 December 2003. The Group has adopted the Application Note to FRS 5 for the year ended 31 March 2004.
The Application Note sets out the basic principles of revenue recognition and specifically addresses the following arrangements which give rise to turnover: long term contractual performance; separation and linking of contractual arrangements; bill and hold arrangements; sales with a right of return; and presentation of turnover as principal or agent. There is no material impact of adoption on the reported results of the Group.
In addition, the following new accounting standard has been issued and revised but has not yet been adopted:
UITF Abstract 38 ‘Accounting for ESOP Trusts’ and related amendments to UITF Abstract 17 ‘Employee shares scheme’. This standard brings the accounting for ESOP trusts in line with accounting for treasury shares in UITF 37. The abstract is mandatory for accounting periods ending on or after 22 June 2004.
The Group has elected not to early adopt UITF Abstract 38 for the year ended 31 March 2004.
Basis of consolidation |
With the exception of Cable & Wireless USA, Inc. and Cable & Wireless Internet Services, Inc. (together with certain of their affiliates), which were deconsolidated on 8 December 2003 (the date on which these companies filed for Chapter 11 bankruptcy protection under the US Bankruptcy Code), the Group Financial Statements comprise a consolidation of the accounts of the Company and all its subsidiaries and include the Group’s share of the results and net assets of its joint ventures and associates. The accounts of principal subsidiaries, joint ventures and associates are made up to 31 March.
Page 92
statement of accounting policies
Where subsidiaries, joint ventures or associates have been acquired during the year, goodwill, being the difference between the fair value of consideration given and the fair values attributed to the separable net assets acquired, is capitalised on the balance sheet and amortised through the profit and loss account.
For acquisitions made before 1 April 1998, goodwill was written off directly to reserves. Goodwill written off directly to reserves is reinstated in the profit and loss account when the related business is sold.
Foreign currencies |
Average rates of exchange ruling during the year are used to translate the profit and loss accounts of overseas subsidiaries, joint ventures and associates. Foreign currency assets and liabilities are translated at year end rates and any exchange differences arising are dealt with through the profit and loss account.
The net investments in the Group’s overseas subsidiaries, joint ventures and associates are translated into sterling at year end rates of exchange. Exchange differences resulting from the translation of opening net investments at rates ruling at the beginning and end of the year, together with the differences between profit and loss accounts translated at average rates and year end rates, are dealt with as movements in Group reserves.
Where net investments are matched in whole or in part by foreign currency borrowings, the exchange differences arising on the retranslation of such borrowings are also recorded as movements on Group reserves and any excess taken to the profit and loss account.
All other exchange differences are dealt with through the profit and loss account.
Tangible fixed assets and depreciation |
Tangible fixed assets are stated at cost less depreciation. The cost of fixed assets includes directly attributable labour and overhead costs. Interest incurred up to the time that separately identifiable major capital projects are ready for service is also capitalised as part of the cost of assets.
Depreciation is not provided on freehold land or projects under construction. On other tangible fixed assets, depreciation is provided on the difference between the cost of tangible fixed assets and the estimated residual value, in equal annual instalments over the estimated useful lives of the assets. These lives are:
| Lives | ||||
| Cables | up to 20 years | |||
| Network equipment | 3 to 25 years | |||
| Ducting | 40 years | |||
| Freehold buildings | 40 years | |||
| Leasehold land and buildings | up to 40 years or term of lease if less | |||
Surpluses and deficits on disposals of tangible fixed assets are determined by reference to sale proceeds and net book values.
Intangible fixed assets |
From 1 April 1998 intangible fixed assets acquired have been recorded at cost and amortised on a straight line basis over their estimated useful life, not exceeding 20 years. Intangible fixed assets primarily comprise goodwill arising on the acquisition of businesses.
Goodwill arising on acquisition prior to 1 April 1998 was eliminated directly against reserves. The profit or loss on the disposal of all or part of a previously acquired business is calculated after taking account of the gross amount of any goodwill previously eliminated directly against reserves.
Page 93
statement of accounting policies
Asset impairment |
Intangible and tangible fixed assets are reviewed for impairment when events or changes in circumstances indicate that the carrying amount of the fixed asset may not be recoverable. Where an impairment indicator is identified, the carrying value of the income generating unit is compared with its recoverable amount. Where the recoverable amount is less than the carrying value an impairment is recognised.
Fixed asset investments |
Joint ventures and associates are accounted for in the Group accounts under the gross equity and equity methods of accounting respectively.
Other fixed asset investments in the Group accounts are stated at cost less amounts written off in respect of any impairments.
Investments in subsidiaries are included in the Company balance sheet at valuation.
Current asset investments |
Current asset investments are stated at the lower of cost and net realisable value.
Tax |
The charge for tax is based on the result for the year and takes into account tax deferred due to timing differences between the treatment of certain items for tax and accounting purposes.
Deferred tax assets are recognised to the extent that they are regarded as recoverable. Deferred tax assets are regarded as recoverable to the extent that on the basis of all available evidence, it can be regarded as more likely than not that there will be suitable taxable profits from which the future reversal of the underlying timing differences can be deducted.
Except where otherwise required by accounting standards, full provision without discounting is made for all timing differences that have arisen but not reversed at the balance sheet date.
Stocks |
Stocks of equipment, held for use in the maintenance and expansion of the Group’s telecommunications systems, are stated at cost, including appropriate allocation of labour and overheads, less provision for deterioration and obsolescence. Stocks held for resale are stated at the lower of cost and net realisable value.
Discontinued operations |
The Group complies with FRS3 ‘Reporting financial performance’, in determining the classification of operations as discontinued or continuing.
Group turnover |
Group turnover, which excludes discounts, value added tax and similar sales taxes, represents the amount receivable in respect of telecommunications services provided to customers and is accounted for on the accruals basis, to match revenues with provision of service. It includes sales to joint ventures and associated companies but does not include sales by joint ventures and associated companies or sales between Group companies.
Turnover from voice, data and IP services are recognised as the services are provided. In respect of services invoiced in advance, amounts are deferred until provision of the service.
Amounts payable by and to telecommunications operators of national and international networks are recognised as services are provided. Charges are negotiated separately and are subject to continual review. Revenues generated through the provision
Page 94
statement of accounting policies
of these services are accounted for gross of any amounts payable to other telecommunications operators for interconnect fees.
The Group earns revenue from the transmission of content on its network originated by third-party providers. The Group assesses whether revenue should be recorded gross as principal or net as agent, based on the features of such arrangements including the following indicators:
• whether the Group holds itself out as an agent;
• establishment of the price;
• provision of customer remedies;
• performance of part of the service; and
• assumption of credit risk.
Mobile revenues comprise amounts charged to customers in respect of monthly access charges, airtime usage, messaging, the provision of other mobile telecommunications services, including data services and information provision, fees for connecting customers to a mobile network and revenues from the sale of equipment, including handsets.
Mobile monthly access charges are invoiced and recorded as part of a periodic billing cycle. Airtime, either from contract customers as part of the invoiced amount, or prepaid customers through the sale of prepaid top-up cards is recorded in the period in which the customer uses the service. Unbilled turnover resulting from mobile services provided to contract customers from the billing cycle date to the end of each period is accrued. Unearned monthly access charges relating to periods after each accounting period are deferred.
Revenues from sales of telecommunication equipment are recognised upon delivery to the customer. Connection revenues are recognised upon connection of the customer to the network. Costs of connecting a customer to a network are also charged to the profit and loss account at the point when the customer connects to the network.
Sales of network capacity to third parties pursuant to IRUs are accounted for as sales and recognised at the time of delivery and acceptance where:
• the purchaser’s right of use is exclusive and irrecoverable;
• the asset is specific and separable;
• the term of the contract is for the major part of the asset’s useful economic life;
• the attributable costs of carrying value can be measured reliably; and
• no significant risks are retained by the Group.
Capacity sales are made out of network capacity and infrastructure held as stock for re-sale. Transfers are made from fixed assets to stock at cost on completion of construction based on an estimate of what will be sold to third parties under IRU contracts (which typically form part of the original investment criteria). The cost of the construction is apportioned on a pro rata basis between stock and fixed assets. Income relating to operations and maintenance contracts is spread over the period of the contract.
Revenues or gains in respect of contracts involving the provision of capacity in exchange for receiving capacity, or other services, are not recognised on the basis that the capacity does not have a readily ascertainable market value as defined in accounting standards.
Revenues arising from the provision of other services, including maintenance contracts, are recognised evenly over the periods in which the service is provided.
Pensions |
The regular cost of providing benefits under defined benefit schemes is charged to operating profit over the expected remaining service lives of the members of the schemes so as to achieve a constant percentage of pensionable pay. Variations from the regular cost arising from periodic actuarial valuations of the principal defined benefit schemes are allocated to operating profit over the expected remaining service lives of the members.
The cost of providing benefits under defined contribution schemes is charged as it becomes payable.
Page 95
statement of accounting policies
The Group has applied the transitional arrangements of FRS17 ‘Retirement benefits’ and appropriate additional disclosures have been included in Note 8.
Leased assets |
Where assets are financed by leasing agreements that give rights approximating to ownership, the assets are treated as if they had been purchased outright. The amount capitalised is the present value of the minimum lease payments payable during the lease term. The corresponding lease commitments are shown as obligations to the lessor. Lease payments are split between capital and interest elements using the annuity method. Depreciation on the relevant assets and interest are charged to the profit and loss account. All other leases are operating leases and the rentals are charged to operating profit on a straight line basis over the lease term.
Debt issue costs |
The costs of issue of capital instruments such as bonds and debentures are charged to the profit and loss account over the life of the instrument.
Derivatives |
Swaps and forward rate agreements |
The net interest paid or received under interest rate and cross currency swaps and forward rate agreements (“FRAs”) is recorded on an accruals basis and included within net interest in the profit and loss account.
The notional amounts of interest rate swaps and FRAs are not recorded on the balance sheet. Cross currency swaps are used to hedge the initial draw down and final repayment of foreign currency denominated debt, as well as the foreign currency interest flows.
Forward exchange contracts |
Forward exchange contracts are carried on the balance sheet at the difference between the amounts of the payable and receivable currency revalued at the closing exchange rate. The interest differential, being the difference between the contract rate and the spot rate on the date of entering into the forward exchange contract, is charged to the profit and loss account as interest over the life of the contract.
Exchange gains and losses |
Exchange gains and losses on revaluation and maturity of forward exchange contracts and cross currency swaps are treated differently depending on the underlying exposure they hedge:
| • | for contracts that hedge firm third party commitments the exchange gains and losses are recognised in the profit and loss account in the same period as the underlying transaction; |
| • | for contracts over underlying currency assets or liabilities the exchange gains and losses are offset against the equal and opposite exchange gains or losses arising on the retranslation of the underlying assets or liabilities; |
| • | for contracts taken out to hedge overseas equity investments the exchange gains and losses are taken to reserves to offset against the exchange differences arising on the retranslation of the net assets of the investments on consolidation; and |
| • | for contracts that hedge general trading flows the exchange gains or losses are taken to the profit and loss account in the period in which they arise. |
Where the underlying exposure changes, or ceases to exist, the contract would be terminated and the exchange gain or loss arising taken to the profit and loss account.
Page 96
notes to the financial statements
NOTES TO THE FINANCIAL STATEMENTS
| 1 | Company’s profit and loss account |
The Company has taken advantage of the exemption contained in s230 of the Companies Act 1985 from presenting its own profit and loss account. The profit for the year of the Company amounted to £585 million (2003 – loss of £7,639 million, 2002 – loss of £6,696 million).
| 2 | Historical cost profits and losses |
There is no difference between the Group results as reported and on the historical cost basis. Accordingly no additional note of historical cost profits and losses has been prepared.
| 3 | Turnover |
The Group’s operations are all considered to fall into one class of business, namely telecommunications.
| 4 | Segmental information |
Cable & Wireless is an international telecommunications company. In the year ended 31 March 2004 the Group was operated on geographic lines. The UK, European and Japanese businesses provide communications solutions to business and wholesale customers offering IP, data and voice products. The National Telecommunications companies that are located in the Caribbean, Panama, Macau, the Middle East, South East Asia and in the Pacific, Indian and Atlantic Oceans provided a full range of telecommunications services to both consumer and business customers, including fixed and mobile voice, data and IP.
Turnover is reported in the geography in which the services are delivered. In previous periods revenue was reported in the geography in which customers were managed. Turnover for 2002 and 2003 has been adjusted to reflect where services were delivered.
Details of Group turnover, contributions to profit/(loss) on ordinary activities before interest and taxation, net operating assets/(liabilities) by geographical region are as follows:
| 2004 | 2003 | 2002 | ||||||||
| Turnover | £m | £m | £m | |||||||
Geographical area | ||||||||||
| United Kingdom and United States | ||||||||||
| – United Kingdom | 1,661 | 1,684 | 1,985 | |||||||
| – US network | 11 | – | – | |||||||
| 1,672 | 1,684 | 1,985 | ||||||||
| Europe | 262 | 304 | 314 | |||||||
| Caribbean | 633 | 756 | 825 | |||||||
| Japan and Asia | 286 | 379 | 432 | |||||||
| Panama | 265 | 279 | 296 | |||||||
| Macau | 128 | 146 | 145 | |||||||
| Rest of the World | 161 | 159 | 138 | |||||||
| Inter-regional turnover | (23 | ) | (30 | ) | (51 | ) | ||||
| Continuing operations | 3,384 | 3,677 | 4,084 | |||||||
| Discontinued operations | 287 | 714 | 1,664 | |||||||
Group turnover | 3,671 | 4,391 | 5,748 | |||||||
The Group turnover figure disclosed represents turnover of the Company and its subsidiaries allocated to the location to which telecommunications services were delivered. It does not follow, however, that international telecommunications traffic which the Group may be responsible for carrying on part of its route would necessarily originate in that location. The Group does not have access to information on the original source or ultimate destination of international telecommunications traffic.
Page 97
notes to the financial statements
Discontinued operations comprise sales in the United States £242 million and Yemen £45 million (2003 – United States £644 million and Yemen £70 million, 2002 – United States £821 million, Australia £764 million and Yemen £79 million).
Cash capacity sales of £nil (2003 – £nil, 2002 – £29 million) are included within Group turnover, with attributable cost of sales of £nil (2003 – £nil, 2002 – £10 million).
Loss on ordinary activities before interest and taxation |
| Profit/(loss) on ordinary activities before interest, taxation and exceptional | Exceptional | Profit/(loss) on ordinary activities before interest and taxation | ||||||||||||||
| items | items | 2004 | 2003 | 2002 | ||||||||||||
| £m | £m | £m | £m | £m | ||||||||||||
Geographical area | ||||||||||||||||
| United Kingdom and United States | ||||||||||||||||
| – United Kingdom | 33 | (256 | ) | (223 | ) | (3,929 | ) | (2,180 | ) | |||||||
| – US network | (16 | ) | – | (16 | ) | – | – | |||||||||
| 17 | (256 | ) | (239 | ) | (3,929 | ) | (2,180 | ) | ||||||||
| Europe | (4 | ) | (2 | ) | (6 | ) | (369 | ) | (540 | ) | ||||||
| Caribbean | 115 | (243 | ) | (128 | ) | 195 | 80 | |||||||||
| Japan and Asia | 2 | (133 | ) | (131 | ) | (266 | ) | (147 | ) | |||||||
| Panama | 70 | (73 | ) | (3 | ) | 77 | 62 | |||||||||
| Macau | 40 | (2 | ) | 38 | 42 | 38 | ||||||||||
| Rest of the World | 55 | (1 | ) | 54 | 59 | 43 | ||||||||||
| Other | (40 | ) | (34 | ) | (74 | ) | (424 | ) | (944 | ) | ||||||
| Joint ventures and associates | 41 | – | 41 | 129 | 71 | |||||||||||
| Continuing operations | 296 | (744 | ) | (448 | ) | (4,486 | ) | (3,517 | ) | |||||||
| Discontinued operations | (31 | ) | 242 | 211 | (1,989 | ) | (1,247 | ) | ||||||||
| 265 | (502 | ) | (237 | ) | (6,475 | ) | (4,764 | ) | ||||||||
The exceptional items are described fully in Note 10.
Segmental information in respect of the Group’s investments in joint ventures and associates is given in Note 17.
Financing is dealt with at a Group level and therefore net interest and other similar income/(charges) cannot be allocated to a geographic region.
Page 98
notes to the financial statements
Net operating assets/(liabilities) |
| 2004 | 2003 | ||||||
| £m | £m | ||||||
Geographical area | |||||||
| United Kingdom and United States | |||||||
| – United Kingdom | (176 | ) | (83 | ) | |||
| – US network | (33 | ) | – | ||||
| (209 | ) | (83 | ) | ||||
| Europe | (57 | ) | (60 | ) | |||
| Caribbean | 370 | 567 | |||||
| Japan and Asia | 32 | 114 | |||||
| Panama | 287 | 336 | |||||
| Macau | 48 | 42 | |||||
| Rest of the World | 88 | 95 | |||||
| Other | (7 | ) | (227 | ) | |||
| Continuing operations | 552 | 784 | |||||
| Discontinued operations | – | (735 | ) | ||||
| 552 | 49 | ||||||
| Other net assets | 1,441 | 2,471 | |||||
Net assets | 1,993 | 2,520 | |||||
Other net assets include tangible fixed assets not yet in service, fixed asset investments, current asset investments, short term deposits less loans and overdrafts.
Page 99
notes to the financial statements
| 5 | Operating costs |
| Continuing operations before exceptional items | Exceptional items (Note 10) | Discontinued operations before exceptional items | 2004 | Continuing operations before exceptional items | Exceptional items (Note 10) | Discontinued operations before exceptional items | 2003 | ||||||||||||||||||
| £m | £m | £m | £m | £m | £m | £m | £m | ||||||||||||||||||
| Outpayments to other telecommunications administrations and carriers | 1,213 | – | 44 | 1,257 | 1,272 | – | 403 | 1,675 | |||||||||||||||||
| Other network costs | 270 | – | 15 | 285 | 275 | – | 7 | 282 | |||||||||||||||||
| Cost of sales relating to equipment sales and rentals | 303 | 13 | 1 | 317 | 276 | – | 18 | 294 | |||||||||||||||||
| Employee costs | 518 | 110 | 99 | 727 | 591 | 90 | 261 | 942 | |||||||||||||||||
| Pension costs | 44 | 3 | 3 | 50 | 44 | – | 19 | 63 | |||||||||||||||||
| Property rentals, taxes and utility costs | 59 | 92 | 32 | 183 | 101 | 211 | 85 | 397 | |||||||||||||||||
| Depreciation and impairment of owned tangible fixed assets | 250 | 526 | 2 | 778 | 659 | 2,381 | 66 | 3,106 | |||||||||||||||||
| Depreciation of tangible fixed assets held under finance leases | – | – | – | – | 6 | – | 4 | 10 | |||||||||||||||||
| Amortisation and impairment of capitalised goodwill | (3 | ) | 10 | – | 7 | 65 | 2,725 | 61 | 2,851 | ||||||||||||||||
| Operating lease rentals: | |||||||||||||||||||||||||
| – network, plant and equipment | 104 | – | 66 | 170 | 119 | – | 60 | 179 | |||||||||||||||||
| – other | 71 | – | 22 | 93 | 52 | 28 | 43 | 123 | |||||||||||||||||
| Other operating costs | 326 | 26 | 33 | 385 | 324 | 113 | 107 | 544 | |||||||||||||||||
| 3,155 | 780 | 317 | 4,252 | 3,784 | 5,548 | 1,134 | 10,466 | ||||||||||||||||||
| Continuing operations before exceptional items | Exceptional items (Note10) | Discontinued operations before exceptional items | 2002 | ||||||||||
| £m | £m | £m | £m | ||||||||||
| Outpayments to other telecommunications administrations and carriers | 1,538 | – | 854 | 2,392 | |||||||||
| Other network costs | 232 | – | 69 | 301 | |||||||||
| Cost of sales relating to equipment sales and rentals | 127 | – | 38 | 165 | |||||||||
| Employee costs | 619 | – | 323 | 942 | |||||||||
| Pension costs | 30 | – | 16 | 46 | |||||||||
| Property rentals, taxes and utility costs | 74 | – | 79 | 153 | |||||||||
| Depreciation and impairment of owned tangible fixed assets | 684 | 1,909 | 369 | 2,962 | |||||||||
| Depreciation of tangible fixed assets held under finance leases | 9 | – | 10 | 19 | |||||||||
| Amortisation of capitalised goodwill | 303 | 2,007 | 259 | 2,569 | |||||||||
| Operating lease rentals: | |||||||||||||
| – network, plant and equipment | 113 | – | 59 | 172 | |||||||||
| – other | 42 | – | 45 | 87 | |||||||||
| Other operating costs | 417 | 210 | 338 | 965 | |||||||||
| 4,188 | 4,126 | 2,459 | 10,773 | ||||||||||
Page 100
notes to the financial statements
All exceptional items relate to continuing operations except £22 million of costs relating to the restructuring of the US discontinued business, principally property and employee costs (2003 – depreciation £57 million, 2002 – other operating costs £6 million, depreciation £87 million and amortisation £213 million).
The remuneration of the auditors and their associates in respect of audit services provided to the Group during the year was £3.2 million (2003 – £4.9 million, 2002 – £2.6 million) and includes £0.8 million (2003 – £1.1 million, 2002 – £0.4 million) for the Company. The remuneration of the auditors and their associates in respect of non-audit services to the Company and its UK subsidiaries during the year was £1.6 million (2003 – £3.6 million, 2002 – £3.8 million) and to overseas subsidiaries £1.5 million (2003 – £1.4 million, 2002 – £1.8 million) as summarised below:
| 2004 | 2003 | 2002 | ||||||||
| £m | £m | £m | ||||||||
| Further assurance services | 0.8 | 1.3 | 0.9 | |||||||
| Tax services – compliance | 1.0 | 1.1 | 0.2 | |||||||
| Tax services – advisory services | 1.2 | 1.4 | 0.8 | |||||||
| Other services | 0.1 | 1.2 | 3.7 | |||||||
| 3.1 | 5.0 | 5.6 | ||||||||
| 6 | Employees |
The average monthly number of persons employed by the Group during the year was:
| 2004 | 2003 | 2002 | ||||||||
| Number | Number | Number | ||||||||
| United Kingdom and United States | ||||||||||
| – United Kingdom | 4,991 | 6,147 | 7,657 | |||||||
| – US network | 34 | – | – | |||||||
| 5,025 | 6,147 | 7,657 | ||||||||
| Europe | 576 | 1,139 | 1,206 | |||||||
| Caribbean | 4,363 | 5,198 | 5,527 | |||||||
| Japan and Asia | 1,034 | 1,257 | 1,559 | |||||||
| Panama | 1,983 | 2,717 | 3,443 | |||||||
| Macau | 922 | 947 | 979 | |||||||
| Rest of the World | 1,426 | 1,312 | 1,675 | |||||||
| Other | 237 | 210 | 239 | |||||||
| Discontinued operations (pro-rated) | 1,864 | 4,464 | 8,176 | |||||||
| 17,430 | 23,391 | 30,461 | ||||||||
Page 101
notes to the financial statements
The aggregate remuneration and associated costs of Group employees, including amounts capitalised, were:
| 2004 | 2003 | 2002 | ||||||||
| £m | £m | £m | ||||||||
| Salaries and wages | 675 | 895 | 1,003 | |||||||
| Social security costs | 61 | 71 | 99 | |||||||
| Pension costs | ||||||||||
| – Principal schemes (Note 8) | 24 | 31 | 12 | |||||||
| – Other costs including defined contribution schemes | 26 | 32 | 34 | |||||||
| 786 | 1,029 | 1,148 | ||||||||
| 7 | Directors’ remuneration and shareholdings |
Information covering Directors’ remuneration (including pension entitlements), interest in shares and interests in share options (including in each case those arising under the Share Option Plan, Restricted Shares and Performance Share Plan) is included in the Directors’ Remuneration Report on pages 66 to 80.
| 8 | Pensions |
Defined benefit schemes |
The Company and its principal subsidiaries operate pension and other retirement schemes that cover the majority of employees of the Group. These schemes include both the defined benefit type, whereby retirement benefits are based on the employee’s final remuneration and length of service, and defined contribution schemes, whereby retirement benefits reflect the accumulated value of agreed contributions paid by, and in respect of, employees. With the exception of the unfunded, unapproved retirement benefit schemes, the remaining schemes are funded through separate trustee administered schemes. Contributions to the defined benefit schemes are made in accordance with the recommendations of independent actuaries who value the schemes at regular intervals, usually triennially.
An actuarial valuation of the principal United Kingdom defined benefit pension scheme (“the Scheme”) was prepared at 31 March 2002 for the purpose of UK Statement of Standard Accounting Practice 24 (“SSAP 24”) ‘Accounting for pension costs’.
The valuation of the Scheme disclosed a shortfall in the market value of the Scheme’s assets compared with the accrued liabilities. This was principally due to the fall in the Scheme’s asset values following the fall in global equity markets between 1 April 1999 and 31 March 2002. Thus, with agreement from the actuary, the Company increased its contributions to the Scheme to 20 per cent of salary with effect from 1 April 2002, and made a one-off contribution to the Scheme of £47 million in December 2002 in respect of the shortfall.
The Scheme was valued using the projected unit method and the principal assumptions were that future investment returns on existing assets would, on average, be 3.2 per cent a year above the level of price inflation, that the return on new investments would be 3.9 per cent a year above price inflation, that general salary growth would be 1.7 per cent a year above price inflation, and that inflation related pension increases would generally be in line with price inflation. The market value of the Scheme’s investments at the valuation date was £1,401 million. The Scheme also holds some insurance policies, which had an assessed value of £11 million. The total value of the assets was 97 per cent of the value of the aggregate benefits that had accrued to members of the Scheme, allowing for expected future earnings increases in the case of employees.
The assumptions used for calculating the pension cost for accounting purposes differ from the funding assumptions in that the assumed return on existing assets is 3.3 per cent a year above price inflation. In the Financial Statements, the deficit in the Scheme is spread over the remaining service lives of the employed members. Under those assumptions as at 31 March 2002, the total value of the investments was 99 per cent of the value of the aggregate benefits that had accrued to members of the Scheme.
Page 102
notes to the financial statements
The principal pension costs as shown in Note 6 comprise:
| 2004 | 2003 | ||||||
| £m | £m | ||||||
| Regular costs | 17 | 22 | |||||
| Variation from regular costs (including interest) | 7 | 9 | |||||
| 24 | 31 | ||||||
Pension schemes other than the principal scheme are accounted for on the basis of local custom and practice. Pension prepayments relating to the Scheme of £102 million (2003 – £112 million, 2002 – £72 million) are included in other debtors (Note 20). Provisions for obligations to pay terminal gratuities on retirement to staff who are not members of the pension and retirement schemes are included in provisions for pensions (Note 22).
Defined contribution schemes |
The pension cost for the year for the defined contribution schemes was £26 million (2003 – £19 million, 2002 – £10 million).
Disclosures in respect of FRS17 – ‘Retirement benefits’ |
The above figures have been prepared in accordance with the requirements of SSAP 24. FRS 17 has been published in the United Kingdom, however, its full introduction has been deferred. The accounting requirements of FRS 17 are broadly as follows:
| • | pension scheme assets are valued at market values at the balance sheet date; |
| • | pension scheme liabilities are measured using a projected unit method and discounted at the current rate of return on high quality (AA) corporate bonds of equivalent term and currency to the liability; |
| • | for accounting periods beginning on or after 1 January 2005 the pension scheme surplus (to the extent it is considered recoverable) or deficit will be recognised in full and presented on the face of the balance sheet; and |
| • | the movement in the scheme surplus/deficit will be split between operating charges, financing items and, in the statement of total recognised gains and losses, actuarial gains and losses. |
The transitional disclosures in respect of FRS 17 are set out below:
Qualified independent actuaries, Watson Wyatt LLP, updated the actuarial valuations of the major defined benefit schemes operated by the Group to 31 March 2004. The main financial assumptions in accordance with FRS 17 are as follows:
| At 31 March 2004 | At 31 March 2003 | At 31 March 2002 | |||||||||||||||||
| UK | Rest of Group | UK | Rest of Group | UK | Rest of Group | ||||||||||||||
| % | % | % | % | % | % | ||||||||||||||
| Inflation assumption | 2.8 | 3.8 | 2.5 | 4.3 | 2.5 | 4.9 | |||||||||||||
| Rate of increase in salaries | 4.6 | 5.4 | 4.3 | 5.6 | 4.3 | 6.3 | |||||||||||||
| Pension increases | 2.8-3.0 | 3.5 | 2.5-3.0 | 3.6 | 2.5-3.0 | 3.6 | |||||||||||||
| Discount rate | 5.5 | 6.4 | 5.5 | 6.9 | 5.8 | 7.5 | |||||||||||||
| Long term expected rate of return on: | |||||||||||||||||||
| – Equities | 8.0 | 9.0 | 8.5 | 9.1 | 7.8 | 9.6 | |||||||||||||
| – Bonds | 5.0 | 6.6 | 5.0 | 7.1 | 5.5 | 7.3 | |||||||||||||
| – Other | 4.0 | 4.8 | 4.0 | 4.8 | 4.5 | 4.6 | |||||||||||||
Page 103
notes to the financial statements
The assumptions used by the actuaries are the best estimates chosen from a range of possible actuarial assumptions which may not necessarily be borne out in practice. The assumptions shown above for the Rest of Group represent a weighted average of the assumptions used for the individual funds.
The UK defined benefit scheme is closed to new entrants and under the projected unit method for closed schemes the current service cost will increase as the members of the scheme approach retirement.
The assets and liabilities of the defined benefit schemes operated by the Group are as follows:
| At 31 March 2004 | At 31 March 2003 | At 31 March 2002 | |||||||||||||||||
| UK | Rest of Group | UK | Rest of Group | UK | Rest of Group | ||||||||||||||
| £m | £m | £m | £m | £m | £m | ||||||||||||||
| Equities | 965 | 84 | 855 | 61 | 1,130 | 56 | |||||||||||||
| Bonds | 353 | 56 | 246 | 56 | 262 | 54 | |||||||||||||
| Other | 90 | 52 | 53 | 36 | 9 | 30 | |||||||||||||
| Total fair value of scheme assets | 1,408 | 192 | 1,154 | 153 | 1,401 | 140 | |||||||||||||
| Present value of scheme liabilities | (1,744 | ) | (213 | ) | (1,630 | ) | (207 | ) | (1,434 | ) | (154 | ) | |||||||
| Deficit in funded defined benefit schemes | (336 | ) | (21 | ) | (476 | ) | (54 | ) | (33 | ) | (14 | ) | |||||||
| Deficit in unfunded defined benefit schemes | (20 | ) | (26 | ) | (18 | ) | (30 | ) | (15 | ) | (14 | ) | |||||||
Total deficit in defined benefit schemes | (356 | ) | (47 | ) | (494 | ) | (84 | ) | (48 | ) | (28 | ) | |||||||
No material deferred tax asset would be recognised at 31 March 2004 if this liability were reflected in the Financial Statements. There will be a consequential impact on reserves once this liability is reflected in the Financial Statements.
If the above amounts were recognised in the Financial Statements, the Group’s shareholders’ funds at 31 March 2004 and 31 March 2003 would be as follows:
| 2004 | 2003 | ||||||
| £m | £m | ||||||
| Shareholders’ funds as presented | 1,744 | 2,149 | |||||
| Less: SSAP 24 net assets | (52 | ) | (71 | ) | |||
| Shareholders funds’ excluding SSAP 24 net assets | 1,692 | 2,078 | |||||
| FRS 17 retirement benefits net liability | (403 | ) | (578 | ) | |||
Shareholders’ funds including FRS 17 retirement benefits net liability | 1,289 | 1,500 | |||||
Under the transitional requirements of FRS 17, the following disclosures are given to show the impact on the profit and loss account and statement of total recognised gains and losses if FRS 17 had been adopted in full. These amounts have not been included in the profit and loss account or the statement of total recognised gains and losses.
Page 104
notes to the financial statements
Analysis of amounts that would be charged to operating profit for the years ended 31 March 2004 and 31 March 2003 in respect of defined benefit schemes is as follows:
| 2004 | 2003 | ||||||||||||||||||
| Rest of | Rest of | ||||||||||||||||||
| UK | Group | Total | UK | Group | Total | ||||||||||||||
| £m | £m | £m | £m | £m | £m | ||||||||||||||
| Current service cost | 24 | 10 | 34 | 27 | 17 | 44 | |||||||||||||
| Past service cost | – | 5 | 5 | – | – | – | |||||||||||||
Total charged to operating profit | 24 | 15 | 39 | 27 | 17 | 44 | |||||||||||||
Analysis of other amounts that would be charged to the profit and loss account for the years ended 31 March 2004 and 31 March 2003 is as follows:
| 2004 | 2003 | ||||||||||||||||||
| Rest of | Rest of | ||||||||||||||||||
| UK | Group | Total | UK | Group | Total | ||||||||||||||
| £m | £m | £m | £m | £m | £m | ||||||||||||||
Loss/(gain) on curtailment | 1 | (4 | ) | (3 | ) | – | (3 | ) | (3 | ) | |||||||||
Analysis of amounts that would be charged/(credited) to other finance income for the years ended 31 March 2004 and 31 March 2003 is as follows:
| 2004 | 2003 | ||||||||||||||||||
| Rest of | Rest of | ||||||||||||||||||
| UK | Group | Total | UK | Group | Total | ||||||||||||||
| £m | £m | £m | £m | £m | £m | ||||||||||||||
| Interest on pension scheme liabilities | 90 | 15 | 105 | 84 | 14 | 98 | |||||||||||||
| Expected return on pension scheme assets | (86 | ) | (11 | ) | (97 | ) | (102 | ) | (12 | ) | (114 | ) | |||||||
Net return | 4 | 4 | 8 | (18 | ) | 2 | (16 | ) | |||||||||||
Page 105
notes to the financial statements
Analysis of amounts that would be recognised in the statement of total recognised gains and losses for the years ended 31 March 2004 and 31 March 2003 is as follows:
| 2004 | 2003 | ||||||||||||||||||
| Rest of | Rest of | ||||||||||||||||||
| UK | Group | Total | UK | Group | Total | ||||||||||||||
| £m | £m | £m | £m | £m | £m | ||||||||||||||
| Actual return less expected return on pension scheme assets | 192 | 41 | 233 | (380 | ) | (16 | ) | (396 | ) | ||||||||||
| Experience gains/(losses) on scheme liabilities | 47 | (8 | ) | 39 | (18 | ) | (12 | ) | (30 | ) | |||||||||
| Changes in the assumptions underlying the present value of the scheme liabilities | (91 | ) | (3 | ) | (94 | ) | (111 | ) | (7 | ) | (118 | ) | |||||||
Total actuarial gain/(loss) recognised in the statement of total recognised gains and losses | 148 | 30 | 178 | (509 | ) | (35 | ) | (544 | ) | ||||||||||
History of experience gains and losses for the years ended 31 March 2004 and 31 March 2003 is as follows:
| 2004 | 2003 | ||||||||||||||||||||||||||||||||||||
| UK | Rest of Group | Total | UK | Rest of Group | Total | ||||||||||||||||||||||||||||||||
| £m | % | £m | % | £m | % | £m | % | £m | % | £m | % | ||||||||||||||||||||||||||
| Difference between expected and actual return on scheme assets | 192 | 14 | 41 | 21 | 233 | 15 | (380 | ) | (33 | ) | (16 | ) | (10 | ) | (396 | ) | (30 | ) | |||||||||||||||||||
| Experience gains/(losses) on scheme liabilities | 47 | 3 | (8 | ) | (3 | ) | 39 | 2 | (18 | ) | (1 | ) | (12 | ) | (5 | ) | (30 | ) | (1 | ) | |||||||||||||||||
Total actuarial gain/(loss) recognised in the statement of total recognised gains and losses | 148 | 8 | 30 | 12 | 178 | 9 | (509 | ) | (31 | ) | (35 | ) | (15 | ) | (544 | ) | (29 | ) | |||||||||||||||||||
Analysis of movement in the deficit during the years ended 31 March 2004 and 31 March 2003 is as follows:
| 2004 | 2003 | ||||||||||||||||||
| Rest of | Rest of | ||||||||||||||||||
| UK | Group | Total | UK | Group | Total | ||||||||||||||
| £m | £m | £m | £m | £m | £m | ||||||||||||||
| Deficit at beginning of the year | (494 | ) | (84 | ) | (578 | ) | (48 | ) | (28 | ) | (76 | ) | |||||||
| Contributions made | 19 | 19 | 38 | 72 | 15 | 87 | |||||||||||||
| Current service costs | (24 | ) | (10 | ) | (34 | ) | (27 | ) | (17 | ) | (44 | ) | |||||||
| Past service costs | – | (5 | ) | (5 | ) | – | – | – | |||||||||||
| Curtailment (loss)/gain | (1 | ) | 4 | 3 | – | 3 | 3 | ||||||||||||
| Other finance (charge)/income | (4 | ) | (4 | ) | (8 | ) | 18 | (2 | ) | 16 | |||||||||
| Actuarial gain/(loss) | 148 | 30 | 178 | (509 | ) | (35 | ) | (544 | ) | ||||||||||
| Other movements | – | (6 | ) | (6 | ) | – | (26 | ) | (26 | ) | |||||||||
| Exchange gain | – | 9 | 9 | – | 6 | 6 | |||||||||||||
Deficit at end of the year | (356 | ) | (47 | ) | (403 | ) | (494 | ) | (84 | ) | (578 | ) | |||||||
Other movements consist of acquisitions and certain immaterial overseas schemes, which had not previously been included.
Page 106
notes to the financial statements
| 9 | Profits less (losses) on disposal of fixed assets |
Profits less (losses) on disposal of fixed assets before exceptional items amount to £25 million (2003 – £nil, 2002 loss of £7 million). The tax charge attributable is £nil (2003 – £nil, 2002 – £nil) and the minority interest is £nil (2003 – £nil, 2002 – £1 million).
| 10 | Exceptional items |
Exceptional items in 2004, 2003 and 2002 comprise:
| Note | Exceptional items £m | Taxation £m | Minority interest £m | Total 2004 £m | Exceptional items £m | Taxation £m | Minority interest £m | Total 2003 £m | ||||||||||||||||||||
Operating items | ||||||||||||||||||||||||||||
| Other operating costs | (i), (v) | (244 | ) | 9 | 9 | (226 | ) | (442 | ) | 10 | 11 | (421 | ) | |||||||||||||||
| Fixed asset impairment and amounts written off | (ii), (vi), (vii) | (526 | ) | 64 | 41 | (421 | ) | (2,381 | ) | 48 | – | (2,333 | ) | |||||||||||||||
| Goodwill impairment charge | (ii), (vi) | (10 | ) | – | – | (10 | ) | (2,725 | ) | – | – | (2,725 | ) | |||||||||||||||
| (780 | ) | 73 | 50 | (657 | ) | (5,548 | ) | 58 | 11 | (5,479 | ) | |||||||||||||||||
Non operating items | ||||||||||||||||||||||||||||
| Profits less (losses) on sale and termination of operations | (iii) | 250 | – | – | 250 | (147 | ) | – | – | (147 | ) | |||||||||||||||||
| Profits less (losses) on disposal of fixed assets | (iv), (viii) | 28 | – | – | 28 | 62 | – | (33 | ) | 29 | ||||||||||||||||||
| Write down of investments | (ix) | – | – | – | – | (390 | ) | – | – | (390 | ) | |||||||||||||||||
| (502 | ) | 73 | 50 | (379 | ) | (6,023 | ) | 58 | (22 | ) | (5,987 | ) | ||||||||||||||||
| Note | Exceptional items £m | Taxation £m | Minority interest £m | Total 2002 £m | ||||||||||||
Operating items | ||||||||||||||||
| Other operating costs | (x) | (210 | ) | – | 3 | (207 | ) | |||||||||
| Fixed asset impairment and amounts written off | (xi) | (1,909 | ) | – | 28 | (1,881 | ) | |||||||||
| Goodwill impairment charge | (xi) | (2,007 | ) | – | – | (2,007 | ) | |||||||||
| (4,126 | ) | – | 31 | (4,095 | ) | |||||||||||
Non operating items | ||||||||||||||||
| Profits less (losses) on sale and termination of operations | (xii) | 1,057 | (228 | ) | 7 | 836 | ||||||||||
| Write down of investments | (xiii) | (904 | ) | – | – | (904 | ) | |||||||||
| (3,973 | ) | (228 | ) | 38 | (4,163 | ) | ||||||||||
Year ended 31 March 2004 |
| (i) | Exceptional items included in other operating costs principally relate to the cost of restructuring Group businesses. These costs include £93 million in respect of redundancy costs in continuing businesses (United Kingdom £48 million, Panama £7 million, Caribbean £25 million, Japan £5 million, Other £8 million), £92 million in respect of property costs principally relating to the United Kingdom and £24 million of other costs of restructuring incurred by the UK and European businesses. |
| Other exceptional costs include £13 million of customer acquisition costs no longer recoverable in light of circumstances that have given rise to certain fixed asset impairments. |
Page 107
notes to the financial statements
| Exceptional costs of restructuring the discontinued US business prior to its disposal totalled £22 million principally relating to employee costs. |
| (ii) | The Group has carried out a review to determine whether there has been an impairment of its fixed assets and goodwill. The carrying values of fixed assets of each of the Group’s income generating units have been compared with their recoverable amounts, represented by their value in use to the Group. The charge has been determined in accordance with FRS11 ‘Impairment of fixed assets and goodwill’ which involved, amongst other factors, using discount rates of between 10.5 and 20 per cent depending on the cost of capital of the respective businesses. |
| The result of this assessment was a charge of £10 million in respect of goodwill in Jamaica and £526 million in respect of depreciation of fixed assets throughout the Group. Tax credits of £64 million are available on the National Telecommunications companies’ depreciation impairment charges. |
| The depreciation impairment charge arose in the United Kingdom (£119 million), Japan (£126 million), Caribbean (£197 million), Panama (£65 million) and Macau and the Rest of the World (£19 million). |
| (iii) | On 8 December 2003 the Group’s US business filed for Chapter 11 bankruptcy protection under the US Bankruptcy Code. The effect of the filing for Chapter 11 together with the sale agreement with Gores was that the Group’s ability to control Cable & Wireless USA, Inc. and Cable & Wireless Internet Services, Inc. and their subsidiaries (‘CW America’) was severely restricted. Accordingly, the Group has deconsolidated Cable & Wireless USA, Inc. and Cable & Wireless Internet Services, Inc. and their subsidiaries from 8 December 2003. |
| The gain on the exit of the US business of £191 million reflects the deconsolidation of third party net liabilities net of costs of exit. |
| In addition £57 million of accrued costs relating to disposals in previous years, principally the disposal of the consumer operations of Cable & Wireless Communications plc on 30 May 2000, have been released (Discontinued £57 million). |
| A £2 million gain arose on the disposal of certain European businesses after taking account of the release of provisions relating to these businesses. |
| (iv) | The gain on the disposal of fixed assets comprises £16 million relating to the disposal of certain properties in the United States as part of the restructuring of the US business prior to deconsolidation, and £12 million principally comprising disposal of properties in the United Kingdom and the Caribbean as part of restructuring. |
Year ended 31 March 2003 |
| (v) | The Group announced a restructuring in the United Kingdom, United States, Japan/Asia and Europe on 13 November 2002. Exceptional costs in the period of £248 million associated with this restructuring include £182 million in respect of property costs, £52 million in respect of redundancy costs and £14 million of other costs. |
| Other exceptional costs relate to integration costs of Digital Island and the business activities of Exodus of £31 million, redundancy costs of £38 million principally in the Caribbean, Panama and Macau, £44 million of provisions in respect of rentals on vacant properties and £81 million in respect of onerous network contracts and distressed carrier asset write offs. |
| (vi) | The Group carried out a review to determine whether there had been an impairment of its fixed assets and goodwill. The carrying values of fixed assets and goodwill of each of the Group’s income generating units was compared to their recoverable amounts, represented by their value in use to the Group. The charge was determined in accordance with FRS 11 which involved, amongst other factors, using a growth rate of 2.5 per cent after five years (based on a nominal increase in GDP for the countries in which the Group operates) and a discount rate of 14 per cent. The resulting charge was £12 million in respect of goodwill and £1,479 million in respect of fixed assets. This charge was in addition to the charge of £2,713 million in respect of goodwill and £787 million in respect of fixed assets recognised at the half year. Exceptional depreciation also includes the write-off of redundant fixed assets of £58 million. Tax credits of £48 million were available on £191 million of the impairment charge, which was disclosed in the 2002 Group Financial Statements. |
| (vii) | The Group has exited its US retail voice business, as announced on 15 May 2002. The exceptional costs associated with this amount to £288 million and include exit costs of £200 million, redundant fixed asset write downs of £57 million |
Page 108
notes to the financial statements
| included in the exceptional depreciation charge and other write downs of £31 million. In addition, £84 million of accrued costs relating to disposals in previous years, principally the disposal of the consumer operations of Cable & Wireless Communications plc on 30 May 2000, have been released (Discontinued £204 million). |
| (viii) | The profit of £62 million on disposal of fixed assets principally comprises a £54 million gain on the sale of part of the Group’s interest in MobileOne (Asia) Pte Ltd. |
| (ix) | The current asset investments principally relating to PCCW Limited have been written down by £274 million to market value at 31 March 2003. The shares held by the Employee Share Ownership Plan Trust have been written down by £116 million to market value at 31 March 2003. |
Year ended 31 March 2002 |
| (x) | Exceptional items included in other operating costs related principally to provisions in respect of ongoing obligations associated with businesses withdrawn from and redundant assets (US discontinued operations £6 million), costs associated with the integration of the Web hosting businesses (£44 million) and redundancy and reorganisation costs incurred (£48 million). |
| (xi) | The Group carried out a review as at 31 March 2002 to determine whether there had been an impairment of its fixed assets and goodwill. The carrying values of fixed assets and goodwill of each of the Group’s income generating units were compared to their recoverable amounts, represented by their value in use to the Group. In accordance with FRS 11, the value in use of each of the Group’s income generating units was determined with reference to the Group’s five year projections, which had been approved by the Board, using a growth rate of 2.5 per cent in the period beyond the Group’s five year projections (based on a nominal increase in GDP for the countries in which the Group operates), and an average discount rate of 11 per cent. The resulting charge was £2,007 million in respect of goodwill and £1,780 million in respect of fixed assets, including £87 million in respect of fixed assets in discontinued operations. In addition, £129 million of fixed assets withdrawn from service were written off at 30 September 2001. |
| (xii) | The Group disposed of its interest in Cable & Wireless Optus Limited to Singapore Telecommunications Limited (“SingTel”) on 6 September 2001 resulting in a gain of £1,057 million. The consideration received included shares and bonds issued by SingTel which were converted into cash. |
| (xiii) | Current asset investments held in ntl Incorporated and CMGI, Inc. were written down to nil value and the investment in PCCW was written down to estimated realisable value. |
Page 109
notes to the financial statements
| 11 | Net interest and other similar income/(charges) |
| 2004 | 2003 | 2002 | ||||||||
| £m | £m | £m | ||||||||
Interest receivable and similar income | ||||||||||
| Deposits and short term loan interest and similar income | 108 | 198 | 319 | |||||||
| Preference share dividends | – | – | 54 | |||||||
| Share of profits of international telecommunications satellite organisations | – | – | 4 | |||||||
| Exchange losses on retranslation of foreign currency denominated loans and deposits | (5 | ) | (9 | ) | – | |||||
| 103 | 189 | 377 | ||||||||
Interest payable and other similar charges | ||||||||||
| Finance charges on leases | (1 | ) | (3 | ) | (5 | ) | ||||
| Bank loans and overdrafts | (21 | ) | (23 | ) | (57 | ) | ||||
| Other loans | (63 | ) | (62 | ) | (99 | ) | ||||
| Discount charge | (8 | ) | (3 | ) | – | |||||
| (93 | ) | (91 | ) | (161 | ) | |||||
| Less: Interest capitalised | 3 | 5 | 11 | |||||||
| (90 | ) | (86 | ) | (150 | ) | |||||
Net interest and other similar income | 13 | 103 | 227 | |||||||
No tax relief is available on interest capitalised in the year ended 31 March 2004.
Page 110
| notes to the financial statements |
| 12 | Tax on loss on ordinary activities |
The charge for tax, based on the Group loss for the year, comprises:
| 2004 | 2003 | 2002 | |||||
| £m | £m | £m | |||||
United Kingdom | |||||||
| Corporate tax at 30% (2003 – 30%, 2002 – 30%) | |||||||
| Current | 28 | 39 | 59 | ||||
| Double taxation relief | (28 | ) | (39 | ) | (37 | ) | |
| Deferred | – | 1 | (7 | ) | |||
| Adjustments in respect of prior years – current | (64 | ) | (54 | ) | (18 | ) | |
| Adjustments in respect of prior years – deferred | – | (7 | ) | – | |||
| (64 | ) | (60 | ) | (3 | ) | ||
Overseas | |||||||
| Current | 42 | 65 | 295 | ||||
| Deferred | (60 | ) | 26 | 11 | |||
| Adjustments in respect of prior years – current | 63 | 43 | 19 | ||||
| Adjustments in respect of prior years – deferred | (3 | ) | (51 | ) | (31 | ) | |
| 42 | 83 | 294 | |||||
Joint ventures and associates | |||||||
| Joint ventures | 10 | 13 | 20 | ||||
| 10 | 13 | 20 | |||||
Tax on loss on ordinary activities | (12 | ) | 36 | 311 | |||
The Group’s effective tax rate varies from the statutory tax rate as a result of the following factors:
| 2004 | 2003 | 2002 | ||||
| % | % | % | ||||
| Statutory tax rate | 30.0 | 30.0 | 30.0 | |||
| Income/expenses not taxable/allowable – permanent | (16.9 | ) | (12.9 | ) | (21.9 | ) |
| Income/expenses not taxable/allowable – timing | (25.2 | ) | (17.4 | ) | (11.9 | ) |
| Tax losses not utilised | (27.6 | ) | (6.6 | ) | (9.1 | ) |
| Tax rate differences | 13.1 | 5.7 | 5.5 | |||
| Utilisation of tax losses brought forward | 3.5 | – | – | |||
| Adjustments to tax charge in respect of previous periods | 0.4 | 0.2 | – | |||
Current tax rate | (22.7 | ) | (1.0 | ) | (7.4 | ) |
| Page 111 |
| notes to the financial statements |
| 13 | Dividends |
| 2004 | 2003 | 2002 | ||||
| £m | £m | £m | ||||
| Interim | – | 37 | 40 | |||
| Special interim | – | – | 304 | |||
| Final | – | – | 83 | |||
| Full | 73 | – | – | |||
| 73 | 37 | 427 | ||||
| 14 | Earnings/(loss) per share |
| 2004 | 2003 | 2002 | ||||
| £m | £m | £m | ||||
| Profit/(loss) before exceptional items and goodwill amortisation | 139 | (420 | ) | (229 | ) | |
| Exceptional items after tax and minority interests (Note 10) | (379 | ) | (5,987 | ) | (4,163 | ) |
| Amortisation of goodwill before exceptional items, after tax and minority interests | 3 | (126 | ) | (562 | ) | |
| Basic and diluted loss for the financial year attributable to shareholders | (237 | ) | (6,533 | ) | (4,954 | ) |
| Basic and diluted weighted average number of shares in issue | 2,327,738,940 | 2,329,814,506 | 2,733,445,915 | |||
| Basic earnings/(loss) of total Group per Ordinary Share before exceptional items and goodwill amortisation | 6.0 | p | (18.0 | )p | (8.4 | )p |
| Basic loss per Ordinary Share on exceptional items after tax and minorities | (16.3 | )p | (257.0 | )p | (152.3 | )p |
| Basic earnings/(loss) per Ordinary Share on goodwill amortisation after tax and minorities | 0.1 | p | (5.4 | )p | (20.5 | )p |
| Basic and diluted loss per Ordinary Share | (10.2 | )p | (280.4 | )p | (181.2 | )p |
Basic and diluted loss per Ordinary Share are equal in all periods as there is no impact of dilution on the loss for the financial year nor the weighted average number of shares.
Basic and diluted loss per Ordinary Share are based on the (loss)/profit for the year attributable to shareholders. Basic and diluted (loss)/earnings per Ordinary Share before exceptional items and goodwill amortisation is based on the weighted average number of shares in issue and has been provided in order to show the effects of exceptional items and the amortisation of capitalised goodwill on reported earnings.
| Page 112 |
| notes to the financial statements |
| 15 | Intangible fixed assets |
| Negative goodwill | Positive goodwill | Licences and other intangibles | Total | ||||||
| £m | £m | £m | £m | ||||||
Cost | |||||||||
| At 1 April 2003 | (14 | ) | 6,141 | 9 | 6,136 | ||||
| Disposals | – | (2,252 | ) | – | (2,252 | ) | |||
At 31 March 2004 | (14 | ) | 3,889 | 9 | 3,884 | ||||
Amortisation | |||||||||
| At 1 April 2003 | 2 | (6,131 | ) | (9 | ) | (6,138 | ) | ||
| Credit/(charge) for the year – amortisation | 3 | – | – | 3 | |||||
| Credit/(charge) for the year – exceptional amortisation | – | (10 | ) | – | (10 | ) | |||
| Disposals | – | 2,252 | – | 2,252 | |||||
At 31 March 2004 | 5 | (3,889 | ) | (9 | ) | (3,893 | ) | ||
Net book value | |||||||||
At 31 March 2004 | (9 | ) | – | – | (9 | ) | |||
| At 31 March 2003 | (12 | ) | 10 | – | (2 | ) | |||
Negative goodwill is being amortised over five years, reflecting the nature of the business acquired.
| Page 113 |
| notes to the financial statements |
| 16 | Tangible fixed assets |
| Group | Company | |||||||||||||||
| Land and buildings | Plant and equipment | Projects under construction | Total | Land and buildings | Plant and equipment | Projects under construction | Total | |||||||||
| £m | £m | £m | £m | £m | £m | £m | £m | |||||||||
Cost | ||||||||||||||||
| At 1 April 2003 | 827 | 9,871 | 753 | 11,451 | 2 | 62 | 4 | 68 | ||||||||
| Additions | 3 | 84 | 206 | 293 | – | 17 | – | 17 | ||||||||
| Disposals | (244 | ) | (1,885 | ) | (41 | ) | (2,170 | ) | – | – | – | – | ||||
| Transfers | 66 | 348 | (414 | ) | – | – | – | – | – | |||||||
| Exchange and other adjustments | (59 | ) | (615 | ) | (49 | ) | (723 | ) | – | (3 | ) | – | (3 | ) | ||
At 31 March 2004 | 593 | 7,803 | 455 | 8,851 | 2 | 76 | 4 | 82 | ||||||||
Depreciation | ||||||||||||||||
| At 1 April 2003 | 496 | 9,018 | – | 9,514 | 1 | 45 | – | 46 | ||||||||
| Charge for the year | 21 | 231 | – | 252 | – | 5 | – | 5 | ||||||||
| Impairment - exceptional depreciation | 103 | 265 | 158 | 526 | – | 21 | – | 21 | ||||||||
| Disposals | (238 | ) | (1,907 | ) | – | (2,145 | ) | – | – | – | – | |||||
| Transfers | 41 | (37 | ) | (4 | ) | – | – | – | – | – | ||||||
| Exchange and other adjustments | (40 | ) | (470 | ) | – | (510 | ) | – | (1 | ) | – | (1 | ) | |||
At 31 March 2004 | 383 | 7,100 | 154 | 7,637 | 1 | 70 | – | 71 | ||||||||
Net book value | ||||||||||||||||
At 31 March 2004 | 210 | 703 | 301 | 1,214 | 1 | 6 | 4 | 11 | ||||||||
| At 31 March 2003 | 331 | 853 | 753 | 1,937 | 1 | 17 | 4 | 22 | ||||||||
Included in the cost of tangible fixed assets is £48 million (2003 – £78 million) relating to assets held under finance leases. Accumulated depreciation on these assets is £46 million (2003 – £74 million).
Included within additions is interest and own work capitalised of £3 million (2003 – £5 million) and £42 million (2003 – £102 million) respectively.
| Group | Company | |||||||
| 2004 | 2003 | 2004 | 2003 | |||||
| £m | £m | £m | £m | |||||
Land and buildings at net book value | ||||||||
| Freeholds | 175 | 194 | 1 | 1 | ||||
| Long leaseholds | 2 | 52 | – | – | ||||
| Short leaseholds | 33 | 85 | – | – | ||||
| 210 | 331 | 1 | 1 | |||||
| Page 114 |
| notes to the financial statements |
| 17 | Fixed asset investments |
| Group | Company | |||||||||||||
| Joint ventures and associates | Other investments | Total | Joint ventures and associates | Subsidiary undertakings | Other investments | Total | ||||||||
| £m | £m | £m | £m | £m | £m | £m | ||||||||
Cost/valuation | ||||||||||||||
| At 1 April 2003 | 83 | 273 | 356 | 33 | 27,221 | 201 | 27,455 | |||||||
| Additions | – | 5 | 5 | – | 16,122 | 4 | 16,126 | |||||||
| Transfers | – | (1 | ) | (1 | ) | – | – | – | – | |||||
| Disposals | (6 | ) | (29 | ) | (35 | ) | (7 | ) | (26,051 | ) | (18 | ) | (26,076 | ) |
| Revaluation | – | – | – | – | (1,020 | ) | – | (1,020 | ) | |||||
| Exchange adjustments | (6 | ) | (6 | ) | (12 | ) | – | – | – | – | ||||
At 31 March 2004 | 71 | 242 | 313 | 26 | 16,272 | 187 | 16,485 | |||||||
Loans | ||||||||||||||
| At 1 April 2003 | 1 | – | 1 | 1 | 5,719 | – | 5,720 | |||||||
| Additions | – | – | – | – | 12,542 | – | 12,542 | |||||||
| Loans repaid and transferred | – | – | – | – | (5,554 | ) | – | (5,554 | ) | |||||
At 31 March 2004 | 1 | – | 1 | 1 | 12,707 | – | 12,708 | |||||||
| �� | ||||||||||||||
Provisions and amounts written off | ||||||||||||||
| At 1 April 2003 | (45 | ) | (150 | ) | (195 | ) | (9 | ) | (14,824 | ) | (116 | ) | (14,949 | ) |
| Increase in year | – | (2 | ) | (2 | ) | – | (9,225 | ) | – | (9,225 | ) | |||
| Disposals | 5 | 6 | 11 | 4 | 14,770 | (2 | ) | 14,772 | ||||||
| Exchange adjustments | – | 3 | 3 | – | – | – | – | |||||||
At 31 March 2004 | (40 | ) | (143 | ) | (183 | ) | (5 | ) | (9,279 | ) | (118 | ) | (9,402 | ) |
Share of post acquisition reserves | ||||||||||||||
| At 1 April 2003 | 193 | – | 193 | – | – | – | – | |||||||
| Share of retained profit | 6 | – | 6 | – | – | – | – | |||||||
| Disposals | 2 | – | 2 | – | – | – | – | |||||||
| Exchange adjustments | (25 | ) | – | (25 | ) | – | – | – | – | |||||
At 31 March 2004 | 176 | – | 176 | – | – | – | – | |||||||
Net book value | ||||||||||||||
At 31 March 2004 | 208 | 99 | 307 | 22 | 19,700 | 69 | 19,791 | |||||||
| At 31 March 2003 | 232 | 123 | 355 | 25 | 18,116 | 85 | 18,226 | |||||||
Following an internal reorganisation, substantially all of the Company’s investments were transferred to a wholly owned intermediate holding company during the year.
| Page 115 |
| notes to the financial statements |
| Group | Company | |||||||||||||||
| Joint ventures and associates | Other investments | Joint ventures and associates | Other investments | |||||||||||||
| 2004 | 2003 | 2004 | 2003 | 2004 | 2003 | 2004 | 2003 | |||||||||
| £m | £m | £m | £m | £m | £m | £m | £m | |||||||||
Investments at net book value | ||||||||||||||||
| Listed shares | 77 | 84 | 19 | 21 | 17 | 17 | – | – | ||||||||
| Unlisted shares | 130 | 147 | 39 | 64 | 4 | 7 | 28 | 47 | ||||||||
| Loans | 1 | 1 | – | – | 1 | 1 | – | – | ||||||||
| Listed ESOP shares (Note 23) | – | – | 41 | 38 | – | – | 41 | 38 | ||||||||
| 208 | 232 | 99 | 123 | 22 | 25 | 69 | 85 | |||||||||
The market value of the Group’s holdings in listed shares was £193 million (2003 – £196 million) for joint ventures and associates and £73 million (2003 – £62 million) for other investments. The market value of the Company’s holdings in listed shares of joint ventures and associates was £193 million (2003 – £196 million).
Reconciliation of Group share of profits less (losses) of joint ventures and associates with post acquisition retained reserves
| Joint ventures | Associates | 2004 | Joint ventures | Associates | 2003 | Joint ventures | Associates | 2002 | ||||||||||
| £m | £m | £m | £m | £m | £m | £m | £m | £m | ||||||||||
| Share of turnover | 136 | 61 | 197 | 195 | 65 | 260 | 285 | 65 | 350 | |||||||||
| Operating costs | (113 | ) | (43 | ) | (156 | ) | (142 | ) | (43 | ) | (185 | ) | (190 | ) | (45 | ) | (235 | ) |
| Operating profits less (losses) | 23 | 18 | 41 | 53 | 22 | 75 | 95 | 20 | 115 | |||||||||
| Net interest | – | – | – | (2 | ) | 1 | (1 | ) | (12 | ) | – | (12 | ) | |||||
| Share of profits less (losses) before tax | 23 | 18 | 41 | 51 | 23 | 74 | 83 | 20 | 103 | |||||||||
| Taxation charge | (10 | ) | – | (10 | ) | (13 | ) | – | (13 | ) | (20 | ) | – | (20 | ) | |||
| Dividends paid to Group companies | (12 | ) | (13 | ) | (25 | ) | (13 | ) | (15 | ) | (28 | ) | (11 | ) | (15 | ) | (26 | ) |
| Share of retained profits | 1 | 5 | 6 | 25 | 8 | 33 | 52 | 5 | 57 | |||||||||
| Page 116 |
| notes to the financial statements |
Segmental analysis of Group share of turnover and operating profits/(losses) of joint ventures and associates
| Turnover | Operating profit/(loss) | |||||||||||
| 2004 | 2003 | 2002 | 2004 | 2003 | 2002 | |||||||
| £m | £m | £m | £m | £m | £m | |||||||
| United Kingdom | 6 | 6 | – | (1 | ) | – | (6 | ) | ||||
| Caribbean | 108 | 111 | 109 | 30 | 33 | 34 | ||||||
| Other | – | 52 | 75 | – | 13 | 17 | ||||||
| Rest of the World | 83 | 91 | 97 | 12 | 29 | 26 | ||||||
| Continuing operations | 197 | 260 | 281 | 41 | 75 | 71 | ||||||
| Discontinued operations | – | – | 69 | – | – | 44 | ||||||
| 197 | 260 | 350 | 41 | 75 | 115 | |||||||
Group share of net assets of joint ventures and associates
| Joint ventures | Associates | 2004 | Joint ventures | Associates | 2003 | |||||||
| £m | £m | £m | £m | £m | £m | |||||||
| Fixed assets | 152 | 55 | 207 | 177 | 67 | 244 | ||||||
| Current assets | 38 | 39 | 77 | 47 | 35 | 82 | ||||||
| Group share of gross assets | 190 | 94 | 284 | 224 | 102 | 326 | ||||||
| Current borrowings | (7 | ) | – | (7 | ) | (5 | ) | – | (5 | ) | ||
| Other current liabilities | (24 | ) | (18 | ) | (42 | ) | (33 | ) | (19 | ) | (52 | ) |
| Long term borrowings | (16 | ) | (1 | ) | (17 | ) | (25 | ) | – | (25 | ) | |
| Other long term liabilities | (11 | ) | – | (11 | ) | (13 | ) | – | (13 | ) | ||
| Group share of gross liabilities | (58 | ) | (19 | ) | (77 | ) | (76 | ) | (19 | ) | (95 | ) |
| Share of net assets | 132 | 75 | 207 | 148 | 83 | 231 | ||||||
Segmental analysis of the Group share of net assets of joint ventures and associates
| Joint ventures | Associates | 2004 | Joint ventures | Associates | 2003 | |||||||
| £m | £m | £m | £m | £m | £m | |||||||
| United Kingdom | – | – | – | – | – | – | ||||||
| Caribbean | 115 | – | 115 | 121 | – | 121 | ||||||
| Other | – | – | – | – | – | – | ||||||
| Rest of the World | 17 | 75 | 92 | 27 | 83 | 110 | ||||||
| 132 | 75 | 207 | 148 | 83 | 231 | |||||||
| Page 117 |
| notes to the financial statements |
| 18 | Stocks |
Stocks comprise network equipment and items held for resale.
| 19 | Current asset investments |
Current asset investments comprise £12 million of gilts (Company – £12 million).
| 20 | Debtors |
| Group | Company | |||||||
| 2004 | 2003 | 2004 | 2003 | |||||
| £m | £m | £m | £m | |||||
Amounts falling due within one year | ||||||||
| Trade debtors | 591 | 962 | 2 | 3 | ||||
| Amounts owed by subsidiary undertakings | – | – | 72 | 82 | ||||
| Amounts owed by joint ventures and associates | 5 | 8 | 5 | 5 | ||||
| Other taxation and social security | 7 | 11 | – | – | ||||
| Other debtors | 149 | 229 | 36 | 58 | ||||
| Prepayments and accrued income | 119 | 241 | 8 | 6 | ||||
| Lease payments receivable | 4 | 4 | – | – | ||||
| 875 | 1,455 | 123 | 154 | |||||
Amounts falling due after more than one year | ||||||||
| Deferred taxation | 28 | 1 | – | – | ||||
| Other taxation and social security | 17 | 15 | – | – | ||||
| Other debtors | 22 | 45 | – | – | ||||
| Prepayments and accrued income | 103 | 101 | 102 | 90 | ||||
| Lease payments receivable | 5 | 4 | – | – | ||||
| 175 | 166 | 102 | 90 | |||||
Total debtors | 1,050 | 1,621 | 225 | 244 | ||||
| Page 118 |
| notes to the financial statements |
| 21 | Creditors |
| Group | Company | |||||||
| 2004 | 2003 | 2004 | 2003 | |||||
Amounts falling due within one year | £m | £m | £m | £m | ||||
Loans and obligations under finance leases | ||||||||
| Bank loans and overdrafts | 1 | 2 | – | – | ||||
| Current instalments due on loans | 40 | 810 | – | 716 | ||||
| Obligations under finance leases | 3 | 13 | – | – | ||||
| 44 | 825 | – | 716 | |||||
Other creditors | ||||||||
| Payments received on account | 6 | 16 | – | – | ||||
| Trade creditors | 465 | 846 | – | – | ||||
| Amounts owed to subsidiary undertakings | – | – | 61 | 51 | ||||
| Dividends payable | 73 | – | 73 | – | ||||
| Other taxation and social security | 302 | 286 | 205 | 131 | ||||
| Other creditors | 154 | 445 | 66 | 135 | ||||
| Accruals and deferred income | 624 | 857 | 110 | 99 | ||||
| 1,624 | 2,450 | 515 | 416 | |||||
Total creditors falling due within one year | 1,668 | 3,275 | 515 | 1,132 | ||||
| Page 119 |
| notes to the financial statements |
| Group | Company | |||||||
| 2004 | 2003 | 2004 | 2003 | |||||
Amounts falling due after more than one year | £m | £m | £m | £m | ||||
Other loans | ||||||||
| Sterling repayable at various dates up to 2019 | 520 | 786 | 320 | 586 | ||||
| US dollars repayable at various dates up to 2038 | 125 | 666 | – | 449 | ||||
| Other currencies repayable at various dates up to 2017 | 13 | 74 | – | – | ||||
| 4 per cent convertible unsecured bond due 2010 | 252 | – | 252 | – | ||||
| 910 | 1,526 | 572 | 1,035 | |||||
| Less: Current instalments due | (40 | ) | (810 | ) | – | (716 | ) | |
| 870 | 716 | 572 | 319 | |||||
| Obligations under finance leases | 5 | 5 | – | – | ||||
| Total other loans and obligations under finance leases | 875 | 721 | 572 | 319 | ||||
Other creditors | ||||||||
| Other taxation and social security | – | 74 | – | 74 | ||||
| Amounts owed to subsidiary undertakings | – | – | 17,786 | 16,089 | ||||
| Other creditors | – | 11 | – | – | ||||
| Accruals and deferred income | – | 1 | – | – | ||||
| – | 86 | 17,786 | 16,163 | |||||
Total creditors falling due after more than one year | 875 | 807 | 18,358 | 16,482 | ||||
The Articles of Association of the Company permit borrowing up to two and a half times the capital and reserves of the Group.
On 9 June 2003, the US$1,504 million zero coupon exchangeable bonds, which were exchangeable into Ordinary Shares of PCCW, were redeemed at their principal amount. Prior to redemption the Group purchased US$800 million of the principal amount of the bonds at a discount to their face value.
On 16 July 2003 £257,714,000 4 per cent convertible unsecured bonds were issued at par. Subject to Cable & Wireless’ right to make a cash alternative election, each bond entitles the holder to: i) convert the conversion amount of such bond into fully paid Ordinary Shares of 25 pence each at the rate of 457.930 Ordinary Shares for each £1,000 held at an initial conversion price of £1.45 per Ordinary Share; and ii) to have redeemed the cash settled amount of such bond in accordance with the terms and conditions (representing 231.724 Ordinary Shares for each £1,000 held at the initial conversion price of £1.45 per Ordinary Share), at any time prior to 9 July 2010. Full conversion of the bonds would result in an additional 177,733,748 shares being issued.
After 16 July 2007, if Cable & Wireless’ share price exceeds an amount calculated in accordance with the terms and conditions for a specified number of days, Cable & Wireless has the right to give not less than 30 days and not more than 90 days notice that it will redeem all unconverted bonds still outstanding on a given date at par plus accrued interest. If the bonds have not been converted, purchased and cancelled or redeemed by 16 July 2010, they will be redeemed at par on that date.
| Page 120 |
| notes to the financial statements |
The finance costs charged in the profit and loss accounts comprise the aggregate of the coupon and the proportion of issue costs that relate to the financial year.
| Group | Company | |||||||
| 2004 | 2003 | 2004 | 2003 | |||||
| £m | £m | £m | £m | |||||
Payment profile of total other loans and obligations under finance leases | ||||||||
| In more than one year but not more than two years | 31 | 56 | – | – | ||||
| In more than two years but not more than five years | 169 | 26 | 121 | 121 | ||||
| In more than five years | 675 | 639 | 451 | 198 | ||||
| 875 | 721 | 572 | 319 | |||||
Interest is payable on loans and obligations falling due after more than five years at rates of between 4 per cent and 8.75 per cent.
Any borrowing, the liability of which is swapped into another currency, is accounted for as a liability in the swap currency and not in the original currency of denomination.
Borrowings totalling £9 million are secured on assets of the Group (2003 – £26 million).
| Page 121 |
| notes to the financial statements |
| 22 | Provisions for liabilities and charges |
| At 1 April 2003 | Additions | Releases | Amounts used | Disposals | Transfer to deferred tax debtor | Foreign exchange | At 31 March 2004 | |||||||||||
| Note | £m | £m | £m | £m | ��m | £m | £m | £m | ||||||||||
Group | ||||||||||||||||||
| Deferred taxation | (i) | 67 | – | – | (63 | ) | – | 27 | (6 | ) | 25 | |||||||
| Pensions | (ii) | 39 | 22 | (1 | ) | (2 | ) | (7 | ) | – | (1 | ) | 50 | |||||
| Redundancy | (iii) | 44 | 110 | (8 | ) | (112 | ) | (4 | ) | – | (3 | ) | 27 | |||||
| Property | (iv) | 405 | 187 | (49 | ) | (88 | ) | (262 | ) | – | (42 | ) | 151 | |||||
| Network | (v) | 182 | 148 | (1 | ) | (175 | ) | (19 | ) | – | (8 | ) | 127 | |||||
| Other | (vi) | 23 | 83 | – | (54 | ) | – | – | (1 | ) | 51 | |||||||
| 760 | 550 | (59 | ) | (494 | ) | (292 | ) | 27 | (61 | ) | 431 | |||||||
| At 1 April 2003 | Additions | Amounts used | At 31 March 2004 | ||||||||
| Note | £m | £m | £m | £m | |||||||
Company | |||||||||||
| Deferred taxation | (i) | 1 | – | – | 1 | ||||||
| Pensions | (ii) | 18 | 22 | – | 40 | ||||||
| Redundancy | (iii) | – | 8 | – | 8 | ||||||
| Property | (iv) | – | 81 | (36 | ) | 45 | |||||
| Network | (v) | – | 49 | – | 49 | ||||||
| Other | (vi) | – | 54 | (23 | ) | 31 | |||||
| 19 | 214 | (59 | ) | 174 | |||||||
| (i) | Deferred taxation |
The movement in the Group deferred tax balance from £67 million to £25 million during the year includes £63 million credited in the profit and loss account (Company – £nil) and £6 million relating to foreign exchange (Company – £nil). The deferred tax balance relates to surplus capital allowances of £22 million (Company – £1 million) and other timing differences £3 million (Company – £nil).
No deferred tax is recognised on the unremitted earnings of overseas subsidiaries, joint ventures and associates. Due to the availability of losses and other reliefs, and the reinvestment of earnings, no tax is expected to be payable on them in the foreseeable future.
As at 31 March 2004, the Group had tax losses to carry forward of approximately £10.6 billion (2003 – £6.9 billion). These principally arise in overseas holding companies where the opportunity to utilise benefit from these losses is considered remote. Consequently no deferred tax asset has been recognised in respect of tax losses carried forward. A deferred tax asset is regarded as recoverable and therefore recognised only when, on the basis of all available evidence, it can be regarded as more likely than not that there will be suitable taxable profits from which the future reversal of the underlying timing differences can be deducted. Included in debtors falling due after more than one year (Note 20) are deferred tax debtors of £28 million relating to surplus capital allowances.
| (ii) | Pensions |
The Group operates various unfunded pension plans. Provision is made for the expected cost of meeting the associated liabilities. In view of their long term nature, the timing of utilisation of these provisions is uncertain. Included within this provision is an amount of £12.1 million (2003 – £4.7 million) to cover the cost of former Directors’ pension entitlements.
| Page 122 |
| notes to the financial statements |
| (iii) | Redundancy |
Provision has been made for the cost of redundancies announced during the year, which are expected to be utilised within 12 months.
| (iv) | Property |
Provision has been made for the lower of the best estimate of the unavoidable lease payments or cost of exit in respect of vacant properties. Unavoidable lease payments represents the difference between the rentals due and any income expected to be derived from the vacant properties being sub-let. The provision is expected to be utilised over the shorter of the period to exit and the lease contract life.
| (v) | Network |
Provision has been made for the best estimate of the unavoidable costs associated with redundant network capacity. The provision is expected to be utilised over the shorter of the period to exit and the lease contract life.
| (vi) | Other |
Group Other provisions include amounts relating to the disposal of the US discontinued businesses, which are expected to be utilised within 12 months and amounts relating to specific claims held against the Group’s insurance subsidiary.
| 23 | Called up share capital |
| 2004 £m | 2003 £m | ||||
Authorised | |||||
| 3,500,000,000 Ordinary Shares of 25p each | |||||
| (2003 – 3,500,000,000 Ordinary Shares of 25p each) | 875 | 875 | |||
Allotted, called up and fully paid | |||||
| 2,385,467,990 Ordinary Shares of 25p each | |||||
| (2003 – 2,383,124,694 Ordinary Shares of 25p each) | 596 | 596 | |||
Purchases and allotments of Ordinary Shares of 25p each were made during the year in respect of the following:
| Number of shares allotted | Gross consideration received £ | ||||
| C&W Revenue Approved Share Option Scheme | 7 | 37 | |||
| C&W Employee Stock Purchase Plan | 1,124,106 | 860,173 | |||
| C&W Savings Related Share Option Scheme | 237,557 | 91,364 | |||
| C&W Global Savings Related Share Option Scheme | 31,626 | 12,798 | |||
| C&W Share Option Plan (Unapproved) | 950,000 | 985,150 | |||
| Total | 2,343,296 | 1,949,522 | |||
| Page 123 |
| notes to the financial statements |
At 31 March 2004 outstanding options granted under share option schemes to subscribe for Ordinary Shares were as follows:
| Number of shares | Price | Remaining period | |||||
| C&W Senior Employees’ Share Option Scheme (SESOS) | 975,095 | 548.5 to 553.3p | 2004 | ||||
| 579,697 | 537.2 to 716.3p | 2004-2005 | |||||
| 2,297,640 | 767.5 to 982.0p | 2004-2006 | |||||
| 7,685,443 | 885.7 to 1311.9p | 2004-2007 | |||||
| 1,266,336 | 470.6 to 798.05p | 2004-2008 | |||||
| C&W Savings Related Share Option Scheme (SAYE) | 44,926 | 376.56p | 2004 | ||||
| 47,499 | 394.48 to 427.84p | 2004-2005 | |||||
| 230,903 | 533.68 to 558.64p | 2004-2006 | |||||
| 124,314 | 625.36 to 687.68p | 2004-2007 | |||||
| 69,385 | 761.76 to 985.92p | 2004-2008 | |||||
| 363,554 | 357.92p | 2004-2009 | |||||
| 1,297,632 | 158.36 to 274.64p | 2005-2009 | |||||
| 20,875,351 | 36.96p | 2006-2010 | |||||
| 6,910,471 | 89p | 2006-2011 | * | ||||
| 1,655,108 | 107.56p | 2007-2012 | * | ||||
| C&W Revenue Approved Share Option Scheme (RESOS) | 241,889 | 446.5p | 2004 | ||||
| 328,935 | 413.7p | 2004-2005 | |||||
| 291,533 | 420.5p | 2004-2006 | |||||
| 594,849 | 548.5 to 553.3p | 2004-2007 | |||||
| 140,394 | 704.6p | 2004-2008 | |||||
| 524,968 | 767.50 to 982.0p | 2004-2009 | |||||
| 4,648,797 | 907.8 to 1311.9p | 2004-2010 | |||||
| 401,391 | 470.6 to 760.9p | 2004-2011 | |||||
| C&W Share Option Plan (Approved and Unapproved) | 47,221,006 | 333.60 to 355.288p | 2004-2008 | ||||
| 11,700,379 | 163.25 to 219.70p | 2004-2009 | |||||
| 16,860,688 | 158.6875 to 262p | 2005-2009 | |||||
| 1,700,000 | 103.70 to 112.85p | 2004-2010 | |||||
| 31,626,545 | 103.70 to 135.70p | 2006-2010 | * | ||||
| 1,503,818 | 128.70 to 143.25p | 2007-2011 | * | ||||
| C&W Global Savings Related Share Option Scheme (GSAYE) | 180,211 | 386.32 to 777.20p | 2004 | ||||
| 1,393,599 | 229.92 to 687.68p | 2004-2005 | |||||
| 5,743,300 | 36.96 to 985.92p | 2005-2006 | |||||
| 517,528 | 135.86 to 687.68p | 2006-2007 | |||||
| 2,938,659 | 89 to 107.56p | 2006-2007 | * | ||||
| 2,609,652 | 36.96 to 985.92p | 2007-2008 | |||||
| 58,563 | 95.27p | 2007-2008 | * | ||||
| 787,154 | 89 to 107.56p | 2008-2009 | * | ||||
| 6,839 | 89p | 2010-2011 | * | ||||
| * Granted during the year ended 31 March 2004. |
| Page 124 |
| notes to the financial statements |
The Cable & Wireless Employee Share Ownership Plan Trust
The Cable & Wireless Employee Share Ownership Plan Trust (“the Trust”) is a discretionary trust which has been funded by loans from the Company to acquire shares in Cable and Wireless plc. The Trust held 56,120,783 shares (2003 – 54,738,313 shares) valued at £73 million (2003 – £38 million) on 31 March 2004. The cost of running the Trust is included in the profit and loss account. The Trustees of the plan may notionally allocate Ordinary Shares in the Company annually to Executive Directors or other senior executives and other key staff. Shares are held in trust until such time as they may be transferred to employees in accordance with the terms of the Performance Share Plan, the Restricted Share Plan, the Deferred Short Term Incentive Plan, details of which are given in the Directors’ Remuneration Report, and the Share Option Plan, details of which are given below. The shares will be provided from existing Ordinary Shares in issue acquired by the Trustees. The expected cost of all these shares is charged to the profit and loss account over the life of the relevant scheme. Surplus shares may be held to satisfy future awards. The Trust has waived its rights to dividends. At 31 March 2004, there were 6,029,721 shares under contingent awards in relation to the Performance Share Plan, 2,017,103 shares under restricted share awards in relation to the Restricted Share Plan, and 5,554,484 shares under options in relation to the Share Option Plan.
Cable & Wireless Savings Related Share Option Scheme and Cable & Wireless Global Savings Related Share Option Scheme
Under the Cable & Wireless Savings Related Share Option Scheme (“SAYE scheme”), UK employees can enter a savings contract with a bank to save regular monthly sums of between £5 and £250 for a period of either three or five years. At the end of the savings contract, the participant receives interest from the bank on their savings. The savings and the interest may then be used to exercise an option over Ordinary Shares of the Company which are issued at a discount of 20 per cent to the market value of the Company’s Ordinary Shares at the date of grant. The Company has extended the SAYE scheme to its overseas employees by the Cable & Wireless Global Savings Related Share Option Scheme (“GSAYE scheme”). The GSAYE scheme is offered throughout the Group’s territories (excluding the United Kingdom) and it operates along similar lines to the SAYE scheme with local variances to accommodate local legal and tax considerations.
The Group has taken advantage of the exemption contained in UITF Abstract 17 – ‘Employee share schemes’ not to recognise a charge to the profit and loss account in respect of its Inland Revenue approved SAYE scheme.
Cable & Wireless Revenue Approved Share Option Scheme and Cable & Wireless Senior Employees’ Share Option Scheme
Prior to July 2001, Cable & Wireless granted share options under the Cable & Wireless Senior Employees’ Share Option Scheme (“SESOS”) and the Cable & Wireless Revenue Approved Share Option Scheme (“RESOS”). Options awarded under these plans between June 1999 and July 2001 are subject to performance conditions based on Cable & Wireless’ Total Shareholder Return (“TSR”) performance relative to the FTSE 100 Index, underpinned by real growth in EBITDA and turnover. For full vesting, Cable & Wireless’ TSR must achieve at least upper quartile level against the FTSE 100 between the third and fifth anniversaries of the date of grant. Half vesting applies for TSR at the median level, with a sliding scale between median and upper quartile. If the performance conditions are not met by the fifth anniversary of the date of grant, the options lapse. As at the date of this report, no such options have achieved their performance conditions.
Options granted under RESOS and SESOS before June 1999 became exercisable if growth in Company’s published earnings per share (excluding exceptional items) measured over any period of three consecutive financial years, commencing not earlier than the financial year in which the option was granted, exceeded by not less than six per cent the percentage growth of the Retail Price Index over the same three year period. All such options became exercisable in full. No further grants will be made under the RESOS and SESOS plans.
Cable & Wireless Share Option Plan
The Share Option Plan is the principal vehicle for long-term retention and incentivisation for the Executive Directors, other executives and key staff. The level of any award is determined by the Remuneration Committee each year by reference to total remuneration within a market peer group, subject to an overriding annual limit of six times salary for the Chief Executive Officer and four times salary for other Executive Directors.
The vesting of share options awarded to the Executive Directors and to all employees outside the United States is subject to relative TSR performance conditions. Full vesting occurs only if the TSR performance of the Company meets or exceeds the
| Page 125 |
| notes to the financial statements |
upper quartile between the third and fifth anniversaries of the date of grant. Where TSR performance meets the median, 50 per cent of the initial award vests. A sliding scale operates between median and upper quartile, and nothing vests for TSR performance below the median. If performance conditions have not been met by the fifth anniversary of the date of grant, the options lapse. With effect from May 2004 the re-testing of performance conditions for share options granted from that date will cease. If performance conditions for such options have not been met by the third anniversary of the date of grant the option lapses.
Performance conditions are applied in determining the level of awards to employees in the United States, but do not normally apply to the vesting of such awards. In addition, 25 per cent of awards to employees in the United States vest on the first anniversary of the date of the grant with a further 25 per cent on each subsequent anniversary. These terms reflect normal practice in the United States.
Cable & Wireless Employee Stock Purchase Plan
The Company offered employees of its US subsidiaries the Cable & Wireless Employee Stock Purchase Plan (“ESPP”) which was a section 423 qualified plan under the US Internal Revenue Code 1986. Under the ESPP, employees could save over a one year period sums of between US$10 and US$800 per payroll payment. At the end of each period the employees had the option to purchase ADRs in the Company at a 15 per cent discount to the market price of an ADR at the date of grant. Each ADR represents three Ordinary Shares in the Company. The ESPP was terminated on 30 September 2003.
Cable & Wireless Share Purchase Plan
The Company also offers its employees who are chargeable to income tax, under Section 15 Income Tax (Earnings and Pensions) Act 2003, the Cable & Wireless Share Purchase Plan (“the Plan”) which is a Revenue Approved Share Incentive Plan. Under the Plan, employees can contribute up to a value of £1,500 or 10 per cent of salary each tax year, (whichever is the lower) to buy partnership shares in the Company. Shares are held in a UK resident trust and can be withdrawn from the trust at any time, but there may be pay as you earn taxation and national insurance contributions payable in such events if the shares have not been held in the trust for five years. Dividends on the partnership shares are reinvested in additional Dividend Shares.
| Page 126 |
| notes to the financial statements |
| 24 | Reserves |
| Group | |||||||||||||
| Share premium | Special reserve | Capital redemption reserve | Profit and loss account | ||||||||||
| £m | £m | £m | £m | ||||||||||
| At 1 April 2003 | 1,745 | – | 105 | (297 | ) | ||||||||
| Issued in year | 2 | – | – | – | |||||||||
| Transfers | (1,745 | ) | 1,745 | – | – | ||||||||
| Exchange adjustments | – | – | – | (97 | ) | ||||||||
| Loss for the year retained | – | – | – | (310 | ) | ||||||||
At 31 March 2004 | 2 | 1,745 | 105 | (704 | ) | ||||||||
| Company | ||||||||||||||||
| Share premium | Special reserve | Revaluation reserve | Capital redemption reserve | Profit and loss account | ||||||||||||
| £m | £m | £m | £m | £m | ||||||||||||
| At 1 April 2003 | 1,745 | – | 9,379 | 105 | (8,171 | ) | ||||||||||
| Issued in year | 2 | – | – | – | – | |||||||||||
| Revaluation | – | – | (1,020 | ) | – | – | ||||||||||
| Transfers | (1,745 | ) | 1,745 | – | – | – | ||||||||||
| Group reorganisation | – | – | (8,359 | ) | – | 8,359 | ||||||||||
| Profit for the year retained | – | – | – | – | 512 | |||||||||||
At 31 March 2004 | 2 | 1,745 | – | 105 | 700 | |||||||||||
Following an internal reorganisation, substantially all of the Company’s investments were transferred to a new wholly owned intermediate holding company during the year. This reorganisation led to the elimination of unrealised losses relating to certain intercompany investments and of the revaluation reserve.
The special reserve relates to the cancellation of share premium account approved by the Company at the 2003 Annual General Meeting and confirmed by the Court in February 2004. It will be reduced from time to time by the amount of any increase in the paid up share capital and share premium account of the Company after 20 February 2004 resulting from the issue of new shares for cash or other new consideration. However, the special reserve will not be treated as realised profits of the Company until any debt or claim against the Company outstanding as at 20 February 2004 has been repaid or remedied.
Exchange adjustments in the Group are net of exchange profits of £nil (2003 – £20 million, 2002 – £27 million) on foreign currency borrowings. The cumulative amount of goodwill charged to reserves in prior years as a result of acquisitions, net of goodwill written back through the profit and loss account and statement of total recognised gains and losses, amounted to £475 million (2003 – £475 million, 2002 – £475 million). Of this amount £441 million (2003 – £441 million, 2002 – £441 million) related to joint ventures and associates.
| 25 | Financial instruments |
An outline of the objectives, policies and strategies pursued by the Group in relation to financial instruments is set out under ‘Liquidity and Capital Resources’ and ‘Disclosures about Market Risk’ within the Operating and Financial Review.
For the purpose of the disclosures that follow in this note, short term debtors and creditors that arise directly from the Group’s operations have been excluded from financial assets and liabilities as permitted under FRS 13 ‘Derivatives and other financial instruments: disclosures’ except for currency risk disclosures. The disclosures therefore focus on those financial
| Page 127 |
| notes to the financial statements |
instruments which play a significant medium to long term role in the financial risk profile of the Group. An analysis of the carrying value of all financial assets and liabilities is given in the fair value table on page 131.
Interest rate management
The interest rate profile of the financial liabilities of the Group at 31 March 2004, after taking account of interest rate swaps and cross currency interest rate swaps, is set out in the table below:
| Floating rate | Fixed rate | Non-interest bearing | 2004 | Floating rate | Fixed rate | Non-interest bearing | 2003 | ||||||||||||||||||
| Currency | £m | £m | £m | £m | £m | £m | £m | £m | |||||||||||||||||
| Sterling | 121 | 653 | – | 774 | 121 | 667 | – | 788 | |||||||||||||||||
| US$ | 46 | 81 | – | 127 | 104 | 119 | 449 | 672 | |||||||||||||||||
| Yen | – | 15 | – | 15 | – | 74 | – | 74 | |||||||||||||||||
| Other | 2 | 1 | – | 3 | 7 | 5 | – | 12 | |||||||||||||||||
| 169 | 750 | – | 919 | 232 | 865 | 449 | 1,546 | ||||||||||||||||||
The floating rate financial liabilities comprise bank borrowings bearing interest at rates fixed in advance for periods ranging from one week to six months by reference to LIBOR for sterling and US dollar borrowings.
On 16 July 2003 £257,714,000 4 per cent convertible unsecured bonds were issued at par. Subject to Cable & Wireless’ right to make a cash alternative election, each bond entitles the holder to: i) convert the conversion amount of such bond into fully paid Ordinary Shares of 25 pence each at the rate of 457.930 Ordinary Shares for each £1,000 held at an initial conversion price of £1.45 per Ordinary Share; and ii) to have redeemed the cash settled amount of such bond in accordance with the terms and conditions (representing 231.724 Ordinary Shares for each £1,000 held at an initial conversion price of £1.45 per Ordinary Share), at any time prior to 9 July 2010. Full conversion of the bonds would result in an additional 177,733,748 shares being issued.
After 16 July 2007 if Cable & Wireless’ share price exceeds an amount calculated in accordance with the terms and conditions for a specified number of days, Cable & Wireless has the right to give not less than 30 days and not more than 90 days notice that it will redeem all unconverted bonds still outstanding on a given date at par plus accrued interest. If the bonds have not been converted, purchased or redeemed by 16 July 2010, they will be redeemed at par on that date.
The finance cost charged in the profit and loss account comprises the aggregate of the coupon and the proportion of issue costs that relate to the financial year.
The non-interest bearing financial liabilities reported in the prior year comprise £449 million of zero coupon exchangeable bonds, which were exchangeable into ordinary shares of PCCW. The bonds were issued on 9 April 2001 at 100 per cent of their US$1,504 million principal amount. Prior to redemption at par on 9 June 2003 the Group purchased US$800 million of the principal amount of the bonds at a discount to their face value.
| Page 128 |
| notes to the financial statements |
The weighted average interest rates for the fixed rate financial liabilities of the Group at 31 March 2004, together with the periods for which the rates were fixed, are set out in the table below:
| 2004 | 2003 | ||||||||||||
| Currency | Weighted average interest rate % | Weighted average period for which rate is fixed Months | Weighted average interest rate % | Weighted average period for which rate is fixed Months | |||||||||
| Sterling | 6.9 | 116 | 7.9 | 95 | |||||||||
| US$ | 5.4 | 76 | 5.4 | 82 | |||||||||
| Yen | 3.5 | 80 | 3.7 | 62 | |||||||||
| Other | 10.0 | 34 | 10.9 | 114 | |||||||||
| 6.7 | 111 | 7.3 | 91 | ||||||||||
The interest and other similar income rate profile of the financial assets of the Group at 31 March 2004, after taking account of interest rate swaps, is set out in the table below:
| Floating rate | Non-interest bearing | 2004 | Floating rate | Non-interest bearing | 2003 | ||||||||||||||
| Currency | £m | £m | £m | £m | £m | £m | |||||||||||||
| Sterling | 2,178 | 71 | �� | 2,249 | 2,404 | 87 | 2,491 | ||||||||||||
| US$ | 136 | 6 | 142 | 623 | 11 | 634 | |||||||||||||
| Yen | 8 | 1 | 9 | 12 | 1 | 13 | |||||||||||||
| HK$ | 2 | 17 | 19 | 1 | 254 | 255 | |||||||||||||
| Other | 43 | 3 | 46 | 125 | 5 | 130 | |||||||||||||
| 2,367 | 98 | 2,465 | 3,165 | 358 | 3,523 | ||||||||||||||
The floating rate financial assets principally comprise cash and short term deposits. Of the total, approximately 92 per cent is held by the Group’s central treasury operations as sterling and US dollar cash deposits with short term maturities based on LIBOR and maturities ranging between one and 12 months.
At 31 March 2004, the Group had no financial assets upon which fixed income was earned during that year. The non-interest bearing financial assets are held in the form of shares.
In the prior year the Company purchased £75 million of credit linked notes issued by an AA-rated bank and referenced to the £200 million bond maturing in 2012. Two notes of £25 million and £50 million were purchased with maturities of September 2003 and July 2004 respectively. The transactions have a similar economic effect to repurchasing the referenced bonds for the period of the investment. The notes pay interest at an average rate of LIBOR plus 151 basis points.
In return for receiving interest on the credit linked notes at rates in excess of LIBOR the final redemption to be received by the Company is determined by certain circumstances related to the credit risk of the Company. These circumstances arise if there has been a ‘credit event’ as defined in the terms of the note, in which case the counterparties may redeem the notes at less than par value. A credit event arises in the event of any of the following circumstances in respect of Cable and Wireless plc only:
| • | bankruptcy; |
| • | failure to make any payment due under any of its debt obligations, after expiration of any grace period and subject to a threshold of £25 million; and |
| • | restructuring of any of its debt subject to a threshold of £25 million. |
| Page 129 |
| notes to the financial statements |
If a credit event should take place, the credit linked note is unlikely to be redeemed for cash. Instead the Company is likely to receive its own bonds or debt obligations with a par value equivalent to that of the credit linked notes in settlement of redemption of the note.
In September 2003 the note of £25 million was redeemed at par.
Exchange risk management
The following table shows the Group’s currency exposures at 31 March 2004 on currency transactions that give rise to the net currency gains and losses recognised in the profit and loss account. Such exposures comprise the monetary assets and liabilities of the Group that are not denominated in the functional currency of the operating company involved.
| Net foreign currency monetary assets/(liabilities) in £m | |||||||||||||||||||||||||||||||
| 2004 | 2003 | ||||||||||||||||||||||||||||||
| Functional currency of the operating company | US$ | Sterling | Euro | Other | Total | US$ | Sterling | Euro | Other | Total | |||||||||||||||||||||
| Sterling | 24 | – | 2 | – | 26 | 20 | – | 2 | 2 | 24 | |||||||||||||||||||||
| Yen | (2 | ) | – | – | – | (2 | ) | (12 | ) | – | – | (3 | ) | (15 | ) | ||||||||||||||||
| HK$ | 3 | – | – | 1 | 4 | 3 | 3 | – | – | 6 | |||||||||||||||||||||
| Euro | 2 | (1 | ) | – | – | 1 | (1 | ) | (4 | ) | – | 1 | (4 | ) | |||||||||||||||||
| Other | 8 | 9 | (2 | ) | – | 15 | (26 | ) | 10 | (3 | ) | 9 | (10 | ) | |||||||||||||||||
| 35 | 8 | – | 1 | 44 | (16 | ) | 9 | (1 | ) | 9 | 1 | ||||||||||||||||||||
The amounts shown in the table above take into account the effect of any cross currency swaps, forward exchange contracts and other derivatives entered into to manage these currency exposures.
Maturity of financial liabilities
The maturity profiles of the Group’s financial liabilities, as listed in the fair value table below are disclosed in Note 21.
Borrowing facilities
The undrawn committed facilities available at 31 March 2004, in respect of which all conditions precedent had been met at that date, were as follows:
| 2004 | 2003 | ||||||
| £m | £m | ||||||
| Expiring within one year | – | 30 | |||||
| Page 130 |
| notes to the financial statements |
Fair value
The estimated fair value of the Group’s financial instruments are summarised below:
| 2004 | 2003 | ||||||||
| Carrying | Estimated | Carrying | Estimated | ||||||
| amount | fair value | amount | fair value | ||||||
| £m | £m | £m | £m | ||||||
Primary financial instruments held or issued to finance the Group’s operations | |||||||||
| Trade investments | 58 | 111 | 85 | 126 | |||||
| Cash | 138 | 138 | 196 | 196 | |||||
| Short term deposits | 2,217 | 2,217 | 2,958 | 2,958 | |||||
| Current asset investments | 12 | 12 | 246 | 246 | |||||
| Loans and obligations under finance leases due within one year | (44 | ) | (44 | ) | (376 | ) | (378 | ) | |
| Convertible bonds | (252 | ) | (300 | ) | (449 | ) | (447 | ) | |
| Other loans and obligations under finance leases due after more than one year | (623 | ) | (656 | ) | (721 | ) | (681 | ) | |
| Other creditors falling due after more than one year | – | – | (86 | ) | (86 | ) | |||
Derivative financial instruments held to manage interest rate and currency exposure | |||||||||
| Forward rate agreements, interest rate swaps | – assets | – | – | – | 3 | ||||
| – (liabilities) | – | – | – | (1 | ) | ||||
| Cross currency swaps | – assets | – | – | 1 | 1 | ||||
| – (liabilities) | (18 | ) | (18 | ) | (16 | ) | (16 | ) | |
| Forward exchange contracts | – | – | 7 | 4 | |||||
Trade investments
Trade investments above are detailed in Note 17 but exclude ESOP shares carried at £41 million (2003 – £38 million) with a fair value of £73 million (2003 – £38 million). The fair value is based on year end quoted prices for listed investments and estimates of likely sales proceeds for other investments.
Cash at bank and in hand, short term deposits and short term borrowings
The carrying value approximates to fair value either because of the short maturity of the instruments or because the interest rate on investments is reset after periods not greater than six months.
Current asset investments
The fair value is based on market value or estimates of likely sales proceeds.
Convertible bonds and other long term debt
The fair value is based on quoted market prices or, where these are not available, on the quoted market prices of comparable debt issued by other companies.
Forward rate agreements, interest rate and cross currency swaps
The fair value of forward rate agreements, interest rate and cross currency swaps is the estimated amount which the Group would expect to pay or receive were it to terminate the swaps at the balance sheet date. This takes into consideration current interest rates, current exchange rates and the current creditworthiness of the counterparties. The nominal value of swaps at 31 March 2004 was £131 million (2003 – £2,146 million).
Forward exchange contracts
The value of these contracts is the estimated amount, which the Group would expect to pay or receive on the termination of the contracts. This takes into consideration current interest rates and current exchange rates. At 31 March 2004 the Group had £78 million of such contracts outstanding (2003 – £406 million).
| Page 131 |
| notes to the financial statements |
Hedges
Gains and losses on instruments used for hedging are not recognised until the exposure that is being hedged is itself recognised. Unrecognised gains and losses on instruments used for hedging (excluding hedges that have been accounted for by adjusting the carrying value of a fixed asset recognised on the balance sheet), and on the underlying asset or liability, are as follows:
| 2004 | 2003 | |||||||||||
| Net | Net | |||||||||||
| gains/ | gains/ | |||||||||||
| Gains | (Losses) | (losses) | Gains | (Losses) | (losses) | |||||||
| £m | £m | £m | £m | £m | £m | |||||||
Unrecognised gains and losses on hedges | ||||||||||||
| At 1 April | 3 | (4 | ) | (1 | ) | 88 | (72 | ) | 16 | |||
| Recognised during the year | (3 | ) | 4 | 1 | (85 | ) | 68 | (17 | ) | |||
At 31 March | – | – | – | 3 | (4 | ) | (1 | ) | ||||
| 26 | Commitments and contingent liabilities |
Commitments
Capital commitments at the end of the financial year, for which no provision has been made, are as follows:
| Group | Company | |||||||
| 2004 | 2003 | 2004 | 2003 | |||||
| £m | £m | £m | £m | |||||
Contracted | 34 | 135 | – | – | ||||
In addition to the capital commitments above the Group has a number of operating commitments arising in the ordinary course of the Group’s business. The most significant of these relate to network operating and maintenance costs. In the event of default of another party, the Group may be liable to additional contributions under the terms of the agreements.
Contingent liabilities
Contingent liabilities at the end of the financial year for which no disclosure has been made elsewhere in the Financial Statements are as follows:
| Group | Company | |||||||
| 2004 | 2003 | 2004 | 2003 | |||||
| £m | £m | £m | £m | |||||
| Trading guarantees | 142 | 181 | 142 | 181 | ||||
| Other guarantees | 14 | – | 353 | 489 | ||||
| 156 | 181 | 495 | 670 | |||||
| Page 132 |
| notes to the financial statements |
Trading guarantees principally comprise performance bonds or contracts issued in the normal course of business guaranteeing the Group will meet its obligations to complete projects in accordance with the contractual terms and conditions. The guarantees also enable the customer to obtain repayment of any advance payment in the event of the relevant subsidiary failing to carry out its contractual obligations in full. Some of these guarantees are uncapped.
The nature of contracts includes projects, service level agreements, installation of equipment, surveys, purchase of equipment and transportation of materials. The guarantees contain a clause that they will be terminated on final acceptance of work to be done under the contract.
Other guarantees include guarantees in respect of the financial obligations of subsidiary undertakings principally in respect of leases, borrowings and letters of credit.
Pender Insurance Limited (“Pender”), the Group’s Isle of Man insurance subsidiary, has written policies in favour of the Group and third parties. Potentially significant insurance claims have been made against Pender under certain of these third party policies. Pender is currently taking legal advice and has notified its reinsurers where appropriate. As certain of the insurance claims have not yet been fully quantified or substantiated by the claimants, it is not currently practicable to estimate their financial effects.
Other matters
In addition the Company has given guarantees and indemnities in relation to a number of disposals of subsidiary undertakings in prior years as is considered standard practice in such agreements. Generally, liability has been capped at no more than the value of the sales proceeds, although some uncapped indemnities have been given.
In relation to the sale of CWC ConsumerCo, the Company gave a number of standard warranties and indemnities. There is no time limit or cap that applies generally.
The Company also gives warranties and indemnities in relation to certain agreements including facility sharing agreements. Some of these arrangements do not contain liability caps.
| 27 | Leases |
Group operating lease commitments payable in the following year, analysed according to the period in which each lease expires are as set out below:
| Land and buildings | Other assets | |||||||
| 2004 | 2003 | 2004 | 2003 | |||||
| £m | £m | £m | £m | |||||
| Expiring within one year | 9 | 17 | 37 | 49 | ||||
| Expiring in years two to five | 25 | 44 | 19 | 34 | ||||
| Expiring thereafter | 35 | 97 | 7 | 23 | ||||
| 69 | 158 | 63 | 106 | |||||
The Company had no operating lease commitments payable (2003 – £nil).
In addition, a provision totalling £12 million has been made for amounts guaranteed in respect of operating leases of the former US operation.
| Page 133 |
| notes to the financial statements |
| 28 | Reconciliation of Group operating loss to net cash inflow from operating activities |
| For the year ended 31 March | 2004 | 2003 | 2002 | |||
| £m | £m | £m | ||||
| Group operating loss | (581 | ) | (6,075 | ) | (5,025 | ) |
| Add back non-cash items: | ||||||
| Depreciation and amortisation (before exceptional items) | 249 | 861 | 1,634 | |||
| Exceptional non-cash items | 574 | 5,446 | 3,916 | |||
| Other non-cash items | – | 27 | 197 | |||
| Decrease/(increase) in stocks | 11 | 33 | (90 | ) | ||
| Decrease/(increase) in debtors | 508 | 882 | (182 | ) | ||
| Decrease in creditors | (565 | ) | (893 | ) | (156 | ) |
| Fundamental reorganisation costs | – | (89 | ) | (133 | ) | |
| Net cash outflow in respect of provisions | (123 | ) | (97 | ) | (67 | ) |
Net cash inflow from operating activities | 73 | 95 | 94 | |||
| 29 | Reconciliation of net cash flow to movement in net funds |
| For the year ended 31 March | 2004 | 2003 | 2002 | |||
| £m | £m | £m | ||||
| Increase/(decrease) in cash in the year | 189 | (2,120 | ) | 1,635 | ||
| Cash outflow/(inflow) resulting from decrease/(increase) in debt and lease financing | 582 | 581 | (538 | ) | ||
| Cash (inflow)/outflow resulting from (decrease)/increase in liquid resources (Note 32) | (932 | ) | 1,040 | (2,586 | ) | |
| Decrease in net funds resulting from cash flows | (161 | ) | (499 | ) | (1,489 | ) |
| Borrowings of businesses acquired and disposed | – | – | 1,239 | |||
| Liquid resources of businesses acquired and disposed | (19 | ) | – | – | ||
| Translation and other differences | 8 | 87 | (22 | ) | ||
| Movement in net funds in the year | (172 | ) | (412 | ) | (272 | ) |
| Net funds at 1 April | 1,608 | 2,020 | 2,292 | |||
Net funds at 31 March | 1,436 | 1,608 | 2,020 | |||
| Page 134 |
| notes to the financial statements |
| 30 | Analysis of changes in net funds |
| Acquisitions | At | |||||||||
| At 1 April | and | Exchange | 31 March | |||||||
| 2003 | Cash flow | disposals | movements | 2004 | ||||||
| £m | £m | £m | £m | £m | ||||||
| Cash at bank and in hand | 196 | (42 | ) | – | (16 | ) | 138 | |||
| Short term deposits repayable on demand | 140 | 230 | – | (9 | ) | 361 | ||||
| Bank overdrafts | (2 | ) | 1 | – | – | (1 | ) | |||
| 334 | 189 | – | (25 | ) | 498 | |||||
| Liquid resources (Note 32) | 2,818 | (932 | ) | (19 | ) | (11 | ) | 1,856 | ||
| Debt due within 1 year | (823 | ) | 764 | – | 16 | (43 | ) | |||
| Debt due after 1 year | (721 | ) | (182 | ) | – | 28 | (875 | ) | ||
| Total debt | (1,544 | ) | 582 | – | 44 | (918 | ) | |||
Total net funds | 1,608 | (161 | ) | (19 | ) | 8 | 1,436 | |||
| 31 | Sale of subsidiary undertakings |
| Cable & | ||||||
| Wireless | ||||||
| America | Other | Total | ||||
| £m | £m | £m | ||||
| Consideration received | – | 26 | 26 | |||
| Fixed assets | (2 | ) | (9 | ) | (11 | ) |
| Net current liabilities | 133 | 52 | 185 | |||
| Net debt/cash | (6 | ) | (4 | ) | (10 | ) |
| Other long term creditors | 332 | – | 332 | |||
| Cost of exit/transaction costs | (266 | ) | (6 | ) | (272 | ) |
Profit on disposal | 191 | 59 | 250 | |||
Contributions to the cash flow from material disposals during the year were as follows: net operating cash outflow of £298 million, £nil in respect of returns on financing and servicing of investments and servicing of finance, £nil in respect of taxation and £5 million for capital expenditure.
| Page 135 |
| notes to the financial statements |
| 32 | Liquid resources |
Liquid resources comprise short term deposits, which are readily convertible into known amounts of cash at or close to their carrying value.
Included within liquid resources are amounts totalling £34 million (2003 – £48 million) held by the Group’s insurance subsidiary. These assets are actively managed to meet insurance liabilities. These assets are required to meet insurance solvency requirements and, as a result, are not all readily available for the general purposes of the Group. Other short term deposits typically include bank deposits, excluding those which are repayable on demand, commercial paper and government securities. These deposits have short maturities and a high turnover arising from rollover as part of the Group’s treasury management activities.
| 33 | Related party transactions |
Transactions with joint ventures and associates |
All transactions with joint ventures and associates arise in the normal course of business. The aggregate transactions recorded by the Group with joint ventures and associates, which are considered to be material and which have not been disclosed elsewhere in the financial statements, are summarised below:
| 2004 | 2003 | ||||
| For the year ended 31 March | £m | £m | |||
| Turnover | 1 | 2 | |||
| Outpayments | 2 | 4 | |||
| Dividends received | 25 | 28 | |||
Amounts owed by joint ventures and associates are set out in Note 20.
Transactions with Directors |
There were no material transactions with Directors, except for those relating to remuneration and shareholdings disclosed in the Directors’ Remuneration Report on pages 66 to 80.
| 34 | Legal proceedings |
Class action litigation against Cable and Wireless plc |
Between December 2002 and February 2003, 10 shareholder class action lawsuits were filed in the United States District Court for the Eastern District of Virginia naming Cable and Wireless plc and several of its officers and directors as defendants.
In March 2003, the Court consolidated all of the cases into one action, styled as In re Cable and Wireless plc Securities Litigation, Civil Action No. 02-1860-A. In May 2003, the lead plaintiffs filed a consolidated complaint that alleged violations of certain sections of the Securities and Exchange Act of 1934 and the rules promulgated thereunder. A central allegation was that the defendants made false and misleading statements about the Company’s financial condition by failing to disclose on a timely basis the existence of a tax indemnity and a ratings trigger to place money in escrow until any liability which the Company may have had under the tax indemnity was finally determined. The indemnity and ratings trigger appeared in an agreement reached in 1999 between the Company and Deutsche Telekom for the sale of the Company’s interest in the mobile telephone company that operated under the name One2One.
In addition to the allegations relating to the tax indemnity, the consolidated complaint also alleged that the defendants made false and misleading statements by: (1) failing to disclose certain lease liability commitments and (2) improperly recognising revenue received from sales of capacity to other carriers.
The plaintiffs sought unspecified money damages in their complaints.
| Page 136 |
| notes to the financial statements |
The Company (and related individuals) filed motions to dismiss the class action complaint, which were heard on 31 October 2003. On 17 March 2004, the Court issued orders in respect of the motions to dismiss.
The Court orders state in summary that:
| • | the defendants’ motions (including Cable and Wireless plc) to dismiss the consolidated class action complaint are granted; |
| • | the motion of Sir Ralph Robins, the Company’s former chairman, to dismiss the claims against him for lack of personal jurisdiction is granted; and |
| • | the defendants’ alternative motions to dismiss the claims of foreign (non-US) purchasers for lack of subject matter jurisdiction are denied. |
On 5 May 2004, the Court issued a Memorandum Opinion which dealt solely with the motion of Sir Ralph Robins to dismiss. The Opinion held that the Court has neither specific nor general jurisdiction over Sir Ralph Robins because his contacts with the United States were minimal. However, the Company is unable to assess the effect of the other orders without a separate Court Memorandum of Opinion setting forth the reasons for these other orders. The Court has indicated that these Opinions will be forthcoming although no time frame has been set.
If, upon receipt and analysis of the subsequent Court Memoranda of Opinion, the Company's motion to dismiss the class action complaint should prove not to have been completely successful, Cable & Wireless believes that it has meritorious defences to these claims and will continue to vigorously defend itself in this litigation.
In addition, on 15 June 2004, the Court issued a Memorandum of Opinion and Orders relating to the previous orders issued in March 2004. The Court stated that it would not grant leave to amend the complaint and ordered that judgement be entered against the plaintiffs. The Court found that the complaint, which alleged violations of US securities laws, failed to state a claim. The Memorandum of Opinion and Orders issued on 15 June 2004 disposed of all remaining claims in the case against Cable and Wireless plc, subject to appeal.
Resolution of dispute with IBM UK Limited |
Disputes between (1) Cable and Wireless plc and IBM United Kingdom Limited, (2) Cable & Wireless USA, Inc. and International Business Machines Corporation and (3) IBM Japan Limited and Cable & Wireless IDC Incorporated (collectively “Cable & Wireless” and “IBM” respectively) arose out of a Global Framework Agreement (“GFA”) dated 20 December 2000, and related agreements, pursuant to which IBM agreed to supply to Cable & Wireless information technology services.
On 8 September 2003, an amicable resolution of the matters in dispute was agreed upon by Cable & Wireless and IBM – the terms of which are confidential – following which, by consent, Cable & Wireless and IBM entered a Tomlin Order at the High Court of England and Wales. The effect of that order was to stay the legal proceedings, which existed between Cable & Wireless and IBM in relation to the disputes. On 31 December 2003, the terms of the GFA expired (Cable & Wireless having given notice to terminate the same in June 2003) and in January 2004, all services previously provided by IBM under the terms of the GFA were insourced back to Cable & Wireless.
Class action securities litigation against Digital Island, Inc., Cable & Wireless and others |
Digital Island Inc. (“Digital Island”), Cable and Wireless plc, Dali Acquisition Corp. (“Dali”) (a former subsidiary of Cable & Wireless which subsequently merged with Digital Island to form Cable & Wireless Internet Services, Inc.), and certain of the then present and former directors of Digital Island, were named as defendants in six separate putative class action lawsuits alleging various claims arising out of Cable & Wireless’ acquisition of Digital Island in August 2001. Three of the lawsuits were filed in the US District Court for the District of Delaware and three were filed in the Delaware Court of Chancery. The three federal lawsuits were consolidated into a single case.
The federal suit alleged that the defendants violated federal securities laws by failing to disclose on a timely basis that Digital Island had entered into certain business agreements with Bloomberg, L.P., and Major League Baseball. It further alleged that compensation agreements with certain officers and/or directors of the company violated the federal securities ‘all-holders’ rule. One state lawsuit alleged violations of Delaware law based upon similar allegations.
The other two state lawsuits alleged various violations of Delaware law against the same corporate defendants and the present and former Digital Island directors, including that they failed to disclose all material facts relating to Digital Island’s relationship with Microsoft, and that they failed to obtain a fair price for Digital Island shares.
| Page 137 |
| notes to the financial statements |
On 10 September 2002, a federal District Court granted the defendants’ motion to dismiss the federal lawsuits with prejudice. Plaintiffs appealed the decision to the US Circuit Court of Appeals for the Third Circuit. On 6 February 2004, the US Circuit Court of Appeals for the Third Circuit upheld the decision of the federal District Court that the lawsuits be dismissed. This decision is final as to Cable and Wireless plc.
Litigation with Cibertec Internacional, S.A. and Inversiones Kamasu, S.A. |
Cibertec Internacional, S.A. and Inversiones Kamasu, S.A. initiated proceedings against Cable & Wireless Panama, S.A. and Cable and Wireless (CALA Management Services) Limited in Panama on 29 October 1999. The claim was for approximately US$125 million and alleged breach of contract. On 18 December 2002, the Civil Circuit Judge of the First Judicial Circuit of Panama handed down a decision against Cable & Wireless Panama, S.A. awarding damages of US$67,255,000, including moral damages and costs. The judge dismissed the complaint against Cable and Wireless (CALA Management Services) Limited.
Cable & Wireless Panama, S.A. subsequently appealed the judgment on 3 December 2002 and the parties settled the case on 28 October 2003. The settlement was approved by the First Superior Court of Panama on 6 November 2003. Under the terms of the settlement, Cable & Wireless Panama, S.A. did not accept or recognise any liability to the plaintiffs but voluntarily agreed to make a payment of US$14.5 million to the plaintiffs. The plaintiffs have waived all claims in this matter against Cable & Wireless Panama, S.A. and Cable and Wireless (CALA Management Services) Limited.
Claim against the Minister of Finance and Economy, Panama |
On 16 December 2002, a complaint was filed by two Panamanian lawyers exercising a public action at the Third Chamber of the Supreme Court of Justice of Panama questioning the law governing and rules of Public Bid No. 06 96 won by INTEL, S.A. (now Cable & Wireless Panama, S.A.). Complaints filed at the Third Chamber of the Supreme Court of Justice must be filed against the public officer who enacted the relevant regulation of act. This complaint was filed against the Minister of Finance and Economy in Panama specifically alleging that the Operating Agreement executed between Cable and Wireless (CALA Management Services) Limited and INTEL, S.A. (now Cable & Wireless Panama, S.A.) as part of the privatisation agreements was null and void ab initio, on the grounds that it had not been published in the Official Gazette in Panama.
The Operating Agreement enables Cable & Wireless Panama, S.A. to use the technical and management know-how of Cable and Wireless (CALA Management Services) Limited to more effectively fulfil its obligations under the concession granted to it by the Government of Panama to install, operate and exploit telecommunication services in Panama. Cable & Wireless Panama, S.A., due to its close interest in the outcome of the complaint requested recognition by the Court and permission to participate in the proceedings. The Court agreed to this.
On 21 March 2003, the Court permitted the claim to proceed. Cable & Wireless Panama, S.A. filed an appeal against the admission of the claim to proceed, however the Court confirmed its decision to permit the claim to proceed on 17 March 2004.
As required by Panamanian law, the Administrations General Attorney has provided an opinion to the Court in defence of the law or regulation which is the subject of the complaint. The Administrations General Attorney has opined that the Operating Agreement complied with all the requirements established by the law and by the rules of Public Bid No. 06 96 and was countersigned by the General Comptroller acting with due authorisation.
The proceedings are on-going.
Panamanian counsel consider this claim to be without merit and none of Cable and Wireless plc, Cable & Wireless Panama, S.A. or Cable and Wireless (CALA Management Services) Limited is party to the complaint. However, if the complaint were to be successful, the concession under which Cable & Wireless Panama, S.A. operates will not be affected, however the Operating Agreement could be declared null and void and then the complainants could file a complaint against Cable and Wireless (CALA Management Services) Limited requiring the return of all management fees collected under the agreement since its execution on 20 May 1997. This would amount to approximately £60 million. In the event that this complaint is successful, Cable & Wireless and its subsidiaries intend to vigorously pursue any legal recourse available to them.
| Page 138 |
| notes to the financial statements |
Claim by Caribtel (Caribbean) Limited |
On 9 May 2003, Caribtel (Caribbean) Limited, a telecommunications operator specialising in calling cards, filed a suit against Cable & Wireless Jamaica Limited in the Supreme Court of Judicature of Jamaica. Caribtel has alleged that Cable & Wireless Jamaica Limited wrongfully disconnected Caribtel’s local access telephone services, resulting in a breach of contract and a violation of the Jamaican Fair Competition Act and the Telecommunications Act. Caribtel is claiming US$50 million of lost income to its pre-paid local access calling card business for the period from 25 April 2003 to 25 April 2006. Caribtel has also claimed aggravated and/or exemplary damages of Jamaica $300 million and is seeking injunctive relief to require Cable & Wireless Jamaica Limited to reinstate Caribtel’s local access telephone service.
On 22 May 2003, Caribtel presented a petition for injunctive relief before the Supreme Court of Jamaica requesting that Cable & Wireless Jamaica Limited be required to reinstate Caribtel’s local access telephone service; be restrained from disconnecting any other telecommunications facility currently supplied to Caribtel’s business premises until trial; and be prevented from calling on a prior bank guarantee that Caribtel had provided to Cable & Wireless Jamaica Limited in conjunction with a settlement agreement entered into between the parties in February 2003 relating to breaches of contract by Caribtel in December 2002. The injunctions were not granted by the Court. However, Cable & Wireless Jamaica Limited gave an undertaking that it would not disconnect the direct internet access facility pending a hearing scheduled for 2 June 2003.
Prior to the hearing of 2 June 2003, Caribtel approached Cable & Wireless Jamaica Limited with a view to arriving at a settlement. The parties entered into negotiations as a result of which the matter was taken off the Court list by consent of both parties. Once an indirect access product had been finalised and approved by the Office of Utilities Regulation in Jamaica, a settlement agreement was executed between Caribtel and Cable & Wireless Jamaica Limited on 30 July 2003.
Under that settlement agreement Caribtel has withdrawn its claim against Cable & Wireless Jamaica Limited and treats the claim as settled. Cable & Wireless Jamaica Limited is not required to make any payment to Caribtel, however Caribtel is to refrain from using the Dedicated Internet Access (“DIA”) facility in breach of the service provider agreement and upon execution of a new agreement for Dedicated Internet for Voice and Data incorporating a DIA facility, the existing DIA agreement will be terminated.
Arbitration between Tilts Communications A/S/Cable and Wireless plc/Sonera OY and Republic of Latvia/Lattelekom SIA |
In September 2001, Cable and Wireless plc was joined as a party to an arbitration in connection with its former participation with Sonera OY (“Sonera”) in the joint venture Tilts Communications A/S (“Tilts”).
Through Tilts, Cable and Wireless plc and Sonera purchased a 49 per cent shareholding in a Latvian telecommunications company, Lattelekom SIA in 1994. Cable and Wireless plc sold its interest in Tilts to Sonera in June 1998.
On 3 March 2004, all of the parties in the arbitration signed a Settlement Agreement, which settled all past and present claims. The successor entity to Sonera, TeliaSonera AB, agreed to pay The Republic of Latvia Latvian Lat1 million under the Settlement Agreement. Cable and Wireless plc was not required to pay any sums to settle the arbitration. Sonera (and subsequently TeliaSonera AB) indemnified Cable & Wireless for any of its liabilities including costs incurred in the arbitration and, to date, has paid a substantial amount of these costs.
Arbitration between PT Cable, Inc., Cable and Wireless plc, Cable & Wireless IDC, Inc. and others |
PT Cable, Inc., (“PT Cable”) the US end owner of NPC Cable System (spanning from the United States to Japan), has initiated an arbitration proceeding against the Company, Cable & Wireless IDC, Inc. (“IDC”) and other users of capacity on that system for unpaid operations and maintenance fees with respect to the US end. To date, the unpaid component by Cable & Wireless is less than US$2 million. Cable & Wireless and all 14 other owners have counter-claimed against PT Cable for overcharging operation and maintenance fees. PT Cable is cross-claiming against Cable & Wireless and IDC in their capacity as maintenance authorities and alleges that the Company and IDC should be liable to contribute to any damages the Arbitrator may award against PT Cable. Three arbitrators have been appointed and are in the process of preparing the terms of reference for the proceeding.
Potential exposure of PT Cable is between US$13 million and US$33 million. PT Cable’s counter-claim against Cable & Wireless and IDC is for an unquantifiable proportion of that amount.
| Page 139 |
| notes to the financial statements |
From time to time, the Company and its subsidiaries are subject to legal or regulatory claims, proceedings, investigations or reviews. Other than the above, there are no pending claims, proceedings investigations or reviews against the Company or any of its subsidiaries, which the Company believes will if determined adversely to the Group have a material adverse effect on the Group’s liquidity or results of operation.
As a result of the deconsolidation arising from the withdrawal from the US domestic market, there are no legal proceedings involving CWA (being Cable & Wireless USA, Inc., Cable & Wireless Internet Services, Inc., together with certain of their affiliates) set out in this section.
| 35 | Subsidiary undertakings, joint ventures and associates at 31 March 2004 |
| Ownership | ||||||||||||||||
| | ||||||||||||||||
Subsidiaries | Local currency | Issued Share Capital (million) | Direct | Via subsidiaries | Class of shares | Country of incorporation | Area of operation | |||||||||
| Cable & Wireless UK | £ | 3,033 | – | 100 | % | Ordinary | England | UK | ||||||||
| Cable & Wireless Jamaica Limited | J$ | 16,817 | – | 82 | % | Ordinary | Jamaica | Jamaica | ||||||||
| Cable and Wireless (Cayman Islands) Limited | Cay$ | – | – | 100 | % | Ordinary | Cayman Islands | Cayman Islands | ||||||||
Cable & Wireless Panama, S.A.a | Balboa | 316 | – | 49 | % | Ordinary | Panama | Panama | ||||||||
Companhia de Telecomunicacoes de Macau, S.A.R.L.b | Pataca | 150 | – | 51 | % | Ordinary | Macau | Macau and China | ||||||||
| Cable & Wireless IDC Inc. | Yen | 36,200 | – | 98 | % | Ordinary | Japan | Japan | ||||||||
| Cable & Wireless (Barbados) Limited | B$ | – | – | 81 | % | Ordinary | Barbados | Barbados | ||||||||
| Cable and Wireless (West Indies) Limited | £ | 5 | – | 100 | % | Ordinary | England | Caribbean | ||||||||
Dhivehi Raajjeyge Gulhun Private Limitedbc | Rufiya | 190 | – | 45 | % | Ordinary | Maldives | Maldives | ||||||||
Joint ventures | ||||||||||||||||
Telecommunications Services of Trinidad and Tobago Limitedd | T$ | 283 | – | 49 | % | Ordinary | Trinidad and Tobago | Trinidad and Tobago | ||||||||
Associates | ||||||||||||||||
Bahrain Telecommunications Company B.S.C.b | Dinar | 100 | 20 | % | – | Ordinary | Bahrain | Bahrain | ||||||||
| Notes | |
| The Group comprises a large number of companies and it is not practical to include all of them in this list. The list therefore, only includes those companies whose results or financial position, in the opinion of the Directors, principally affects the figures shown in the Group’s Financial Statements. | |
| Full details of all subsidiary undertakings, joint ventures, associates and trade investments will be attached to the Company’s Annual Return, to be filed with the Registrar of Companies in England and Wales. | |
| a | The Group regards this company as a subsidiary because it controls the majority of the Board of Directors through a shareholders’ agreement. |
| b | This company had a financial year end of 31 December 2003 due to the requirements of the shareholders’ agreement. |
| c | The Group regards this company as a subsidiary undertaking because it exercises dominant influence through a management agreement. |
| d | This company is audited by a firm other than KPMG International member firms. |
| Page 140 |
| notes to the financial statements |
| 36 | Summary of differences between United Kingdom and United States GAAP |
| Basis of preparation | |
The Group prepares its consolidated accounts in accordance with generally accepted accounting principles (“GAAP”) in the United Kingdom, which differ in certain material respects from US GAAP. The following is a summary of the significant differences applicable to the Group and the adjustments necessary to present net income and shareholders’ equity in accordance with US GAAP are shown on pages 147 to 149.
UK GAAP | US GAAP | |
| Goodwill Goodwill arising on acquisitions prior to 1 April 1998 was eliminated directly against reserves. Amounts are transferred from reserves and charged through the profit and loss account when the related investments are sold or written down as a result of an impairment. Following the adoption of FRS 10 ‘Goodwill and intangible assets’, goodwill arising after 31 March 1998 is capitalised and amortised through the profit and loss account over the intangible assets’ estimated useful economic lives. The profit or loss on the disposal of all or part of a previously acquired business is calculated after taking account of the gross amount of any goodwill previously eliminated directly against reserves and not already charged to the profit and loss account. An adjustment to profit or loss on disposal is required in respect of the unamortised portion of goodwill. | For acquisitions completed prior to 1 July 2001, goodwill was capitalised and amortised by charges against income over the period over which the benefit arises. Goodwill acquired prior to 30 June 2001 ceased to be amortised from 31 March 2002. For acquisitions completed after 1 July 2001, Statement of Financial Accounting Standards (“SFAS”) 141 ‘Business Combinations’ and SFAS 142 ‘Goodwill and Other Intangible Assets’ require that goodwill is not amortised. From 1 April 2002 all goodwill is tested at least annually for impairment. For purposes of US GAAP reporting, we consider individual country operations to be a ‘reporting unit’ because they are separate businesses for which discrete financial information is available and for which segment management regularly reviews the operating results. To measure impairment, the fair value of the reporting unit is estimated by using a valuation model based on cash flow projections. This is compared to its carrying value. If the fair value of the tested reporting unit is less than its carrying value, the implied fair value of the goodwill (i.e. the residual after allocating the fair value of a reporting unit to all of the assets and liabilities, including unrecorded intangible assets) is compared to the carrying value of the goodwill. If the carrying value of the tested goodwill exceeds the implied fair value of that goodwill, an impairment loss is recognised in an amount equal to that excess. Certain elements of goodwill under UK GAAP must be classified as other intangible assets under US GAAP, which are also capitalised and amortised over their estimated useful economic lives. | |
| Customer acquisition costs | ||
| Customer acquisition costs are written off over the expected customer life, subject to an assessment of recoverability. | Customer acquisition costs are written off over the initial contract period where an asset is deemed to be recoverable from the future earnings to be made from the customer over the contractual period and that collectability is reasonably assured. Where there is no persuasive evidence of a contractual arrangement (e.g. prepay cell phones) and collectability is not reasonably assured the customer acquisition costs are not deferred. | |
| Restructuring | ||
| Redundancy provisions relating to a restructuring can only be recognised once an entity has a constructive obligation in respect of a past event. This is the case where an entity has raised a valid expectation in those affected that it will carry out the restructuring and has in place a detailed formal plan. | If there is a requirement for future service, the company should accrue the liability over the future service period. Employees are required to render ‘future service’ if they must render service until they are terminated and the service period extends beyond a minimum retention period, limited to 60 days unless a contract or law mandates otherwise.
| |
| Page 141 |
| notes to the financial statements |
UK GAAP | US GAAP | |
| Restructuring (cont.) | ||
| The costs of terminating property leases under a restructuring may be recognised when the decision to restructure has been taken. | The costs of terminating property leases may not be recognised until the contract has been terminated and liabilities for remaining lease rentals are not recognised until the property is physically vacated. If a property has been vacated, but the contract has not been terminated, a liability for the fair value of the future costs is recognised but must be reduced by the estimated sublease income that could reasonably be obtained. | |
| Onerous contracts | ||
| If an entity has a contract that is onerous, the present obligation under the contract should be recognised and measured as a provision. An onerous contract is one where the unavoidable costs of meeting the obligations under it exceed the expected benefits to be received. | The costs of an onerous contract will be recognised as they are incurred. | |
| Derivative and hedge accounting Derivative instruments are recorded at appropriate historical cost amounts, with fair values shown as a disclosure item. Profits and losses from hedging activities are matched with the underlying cash flows and profits being hedged. | In accordance with SFAS 133 ‘Accounting for Derivative Instruments and Hedging Activities’ all derivatives are recognised on the balance sheet at their fair value. The accounting for subsequent changes in the fair value of a derivative (that is, gains and losses) depends on the intended use: | ||
| The notional amounts of interest rate swaps and forward rate agreements are not recorded on the balance sheet. Forward exchange contracts are carried on the balance sheet at the difference between the amounts of the payable and receivable currency revalued at the closing exchange rate. | |||
| • | if a derivative is designated as either a hedge of the fair value of a recognised asset or liability or of an unrecognised firm commitment (‘fair value hedge’), gains or losses are recorded in earnings together with the gain or loss on the hedged asset or liability or unrecognised firm commitment; | ||
| • | if the derivative is designated as a hedge of a forecasted transaction or the variability of cash flows to be received or paid related to a recognised asset or liability (‘cash flow hedge’), any gain or loss is included as a component of other comprehensive income and recycled to earnings when the forecasted transaction affects earnings; | ||
| • | if the derivative is designated as a hedge of a net investment in a foreign operation, any gain or loss is included as a component of other comprehensive income, together with the associated gain or loss on the hedged item; and | ||
| • | changes in the fair values of derivatives that do not qualify as a hedge, together with the ineffective portion of any hedges, are reported in current period earnings. | ||
| Capitalisation of interest | |||
Interest costs that are directly attributable and incremental are capitalised up to the time an asset is made ready for service as part of the cost of fixed assets.
| Interest cost must be capitalised, even where debt funding is not specifically directly attributable to an asset, where a time period is required to get the asset ready for intended use, as part of the cost of acquiring and making ready for use certain qualifying assets. | ||
| Page 142 |
| notes to the financial statements |
UK GAAP | US GAAP | |
| Deferred tax | ||
| Deferred taxes relating to investments in subsidiaries, joint ventures or associates are only provided for to the extent that dividends have been accrued as receivable or a binding agreement to distribute the past earnings has been entered into by the joint venture or associate. | Deferred taxes relating to investments in joint ventures or associates must be recognised, with limited exceptions. | |
| Marketable securities | ||
| Investments in marketable securities are recorded at historical cost less provision for impairments in value. A loss resulting from a decline in fair value that is judged to be other than temporary is recorded in earnings. | Investments classified as available for sale are reported at fair value, with unrealised gains or losses reported as a separate component of shareholders’ equity. | |
| Defined benefit schemes | ||
| The expected cost of pensions is charged to the profit and loss account so as to spread the cost of pensions over the expected service lives of employees. Scheme assets are valued based on projected future income streams discounted at a long-term rate of return. Liabilities are valued on an actuarial basis discounted using a long-term rate. Surpluses arising from actuarial valuations are similarly spread. | Pension costs are determined in accordance with SFAS 87 ‘Employers’ Accounting for Pensions’. SFAS 87 requires a similar method of actuarial valuation for liabilities but requires assets to be valued at fair market rates and liabilities to be discounted using current settlement rates for high-quality bonds. Cumulative experience gains or losses are amortised to income, over a maximum period of the average remaining service life of employees, if they exceed a minimum threshold of 10 per cent of the greater of plan assets or obligations. Adjustments to plan benefits affecting current participants (unrecognised prior service costs) are also generally recognised over the average remaining service life of company employees. When the accumulated benefit obligation exceeds the fair value of plan assets, the excess must be recognised as an additional liability with an offsetting intangible asset. However, any intangible asset recognised cannot exceed the amount of unrecognised prior service cost and the excess of the additional liability above the intangible asset is charged to other comprehensive income. | |
| ESOP shares | ||
| ESOP shares are carried as fixed asset investments. | ESOP shares are treated as a reduction of shareholders’ equity. | |
| Gain on sale of subsidiary | ||
Changes to the value of any share consideration received between the transaction date and the end of any mandatory retention period are included as part of the gain on sale of the subsidiary. | The value of the consideration received (i.e. marketable securities of the buyer) is measured and recognised at the date of the transaction. | |
| Page 143 |
| notes to the financial statements |
UK GAAP | US GAAP | ||
| Gain on sale of subsidiary (cont.) | |||
| Exchange gains and losses on the retranslation of the net assets and results of foreign subsidiary and associated undertakings and joint ventures are recognised in the statement of total recognised gains and losses as incurred, and are therefore excluded from the gain or loss arising on subsequent sale or liquidation. | Exchange gains and losses on the retranslation of the net assets and results of foreign subsidiary and associated undertakings are accumulated as a separate component of shareholders’ equity and included in the gain or loss on sale or liquidation. | ||
| Proposed final dividends | |||
| Dividends declared after the period end are recorded in the period to which they relate. | Dividends are recorded in the period in which they are declared. | ||
| Capacity sales | |||
| Revenues or gains in respect of capacity sales to carriers from whom capacity or other services were also acquired are no longer recognised as the transactions are not considered to meet all the conditions required under the UITF Abstract 36, ‘Contracts for sales of capacity’, in particular the requirement for the capacity provided or received to have a readily ascertainable market value as set out in FRS 10. The Group’s cash sales to carriers with no related purchase continue to be recognised at the time of delivery and acceptance where: | Under US GAAP, cash sales of capacity entered into after the issuance of Financial Accounting Standards Board (“FASB”) Interpretation No. 43 in June 1999 are required to be accounted for as operating leases, unless title is transferred to the lessee by the end of the lease term. The IRU sales that Cable & Wireless enters into generally do not contain such title- transfer clauses, and accordingly, the related IRU revenue, which is recognised up-front for UK purposes, is deferred and recognised on a straight-line basis over the term of the contract for US purposes. Exchanges of capacity for capacity on alternative routes are recognised only if the fair value of the assets can be established by reference to comparable cash transactions. To be considered comparable for US reporting, transactions must generally occur in the same quarter, be for similar fibres, with similar transmission features, over similar distances with counterparties of a similar credit quality. In the absence of such comparable cash sales, the exchanges generally receive no accounting recognition. No revenue or net income on exchanges of capacity is recognised under either UK or US GAAP. | ||
| • | the purchaser’s right of use is exclusive and irrevocable; | ||
| • | the asset is specific and separable; | ||
| • | the term of the contract is for the major part of the asset’s useful economic life; | ||
| • | the attributable cost of carrying value can be measured reliably; and | ||
| • | no significant risks are retained by the Group. | ||
| Income relating to operations and maintenance contracts is spread over the period of the contract. | |||
| Stock based compensation | |||
| Where share options are issued with an exercise price below market value on the date of grant, the discount will be charged to the profit and loss account over the vesting period. For long- term incentive schemes, the fair value of the shares awarded is charged to the profit and loss account over the vesting period. To the extent that the number of options/shares that will be granted/awarded changes as performance conditions are met or not met, the compensation charge is adjusted based on the original fair value at the date of grant. SAYE type schemes are exempt from the requirement to recognise a charge to the profit and loss account. | The Group has elected to continue to apply the provisions of Accounting Principles Board (“APB”) No. 25 ‘Accounting for Stock Issued to Employees’ as permitted by SFAS 123. To the extent that the number of options/shares that will be granted/awarded changes as performance conditions are met or not met, the Company follows ‘variable plan’ accounting and a compensation charge is adjusted based on the fair value at the date of change. The Cable & Wireless SAYE Scheme is not exempt and the discount is accrued over the vesting period of the grant using variable plan accounting. | ||
| Page 144 |
| notes to the financial statements |
UK GAAP | US GAAP | |
| Operating leases | ||
| In respect of operating leases, disclosure is required of the payments (for all leases including those with an initial minimum lease term of less than one year) which are committed to be made during the next year, analysed by the period in which the commitment expires (see Note 27). | In respect of operating leases with an initial minimum lease term in excess of one year, disclosure is required of the total payments due over the non-cancellable period of the lease. | |
| US discontinued operations | ||
| Under UK GAAP, a subsidiary should be excluded from consolidation where severe long-term restrictions substantially hinder the rights of the parent undertaking over the assets or management of the subsidiary undertaking. Under UK GAAP, the Group has recognised a gain as a result of deconsolidating CWA’s net liabilities. | SFAS 140 ‘Accounting for Transfers and Servicing of Financial Assets and Extinguishment of Liabilities’, provides that a debtor shall only recognise a gain on the extinguishment of a liability if either the debtor pays the creditor and is relieved of the obligation or the debtor is legally released from being the primary obligor under the liability, either judicially or by the creditor. | |
| Convertible Debt | ||
| Under UK GAAP, the 4 per cent convertible debt is recorded as a liability on the balance sheet. Interest is charged to the profit and loss account over the term of the debt. | Under US GAAP, the 4 per cent convertible debt is recorded as a liability on the balance sheet. Under certain circumstances, including in the event of a change of control of the Company, the holders may receive part settlement in cash. The conversion feature has been accounted for as an embedded derivative in accordance with SFAS 133, ‘Accounting for Derivative Instruments and Hedging Activities’. The carrying value of the debt has been discounted to reflect the initial fair value of the derivative. | |
| Impairment of Fixed assets | ||
| Under UK GAAP impairment is determined by comparing the carrying values of each income generating unit to their recoverable amounts (the higher of net realisable value and the present value of the future cash flows obtainable as a result of an asset’s continued use). Impairment is recognised for the amount by which the carrying value exceeds the present value of the estimated future cash flows. | Under US GAAP, in accordance with SFAS 144, long-lived assets, tangible assets and amortising intangible assets, are reviewed for impairment whenever events or changes in circumstances indicate that the carrying value of an asset may not be recoverable. Impairment is measured by comparing the sum of the future undiscounted cash flows derived from an asset group to their carrying value. If the carrying value of the asset group exceeds the sum of the future undiscounted cash flows, impairment is considered to exist and an impairment charge is recognised for the amount by which the carrying value exceeds the present value of the estimated future cash flows. | |
| Page 145 |
| notes to the financial statements |
Cash flows
The cash flow statement is prepared in accordance with the UK Financial Reporting Standard No. 1 Revised (“FRS 1”), ‘Cash flow statements’ for UK GAAP reporting. Its objective and principles are similar to those set out in SFAS 95 ‘Statement of cash flows’. The principal difference between the standards is in respect of classification. Under FRS 1 Revised, the Group presents its cash flows for: operating activities; returns on investments and servicing of finance; taxation; capital expenditure and financial investment; acquisitions and disposals; equity dividends paid; management of liquid resources; and financing. SFAS 95 requires only three categories of cash flow activity: operating; investing; and financing.
Summary consolidated cash flow information as presented in accordance with US GAAP is provided below:
| 2004 | 2003 | 2002 | |||||
| £m | £m | £m | |||||
| Cash was (used in)/provided by: | |||||||
| Operating activities | 200 | (679 | ) | 2,358 | |||
| Investing activities | (134 | ) | (77 | ) | 251 | ||
| Financing activities | 123 | (1,364 | ) | (974 | ) | ||
| Net (decrease)/increase in cash | 189 | (2,120 | ) | 1,635 | |||
| Exchange movements | (25 | ) | 9 | 13 | |||
| Cash at the beginning of year | 334 | 2,445 | 797 | ||||
Cash at end of year | 498 | 334 | 2,445 | ||||
| Page 146 |
| notes to the financial statements |
Net income reconciliation
The effects of these different accounting principles are as follows:
| 2004 | 2003 | 2002 | |||||
| As restated | As restated | ||||||
| £m | £m | £m | |||||
| Continuing operations | (380 | ) | (4,867 | ) | (3,099 | ) | |
| Discontinued operations | 143 | (1,666 | ) | (1,855 | ) | ||
| Loss as reported under UK GAAP | (237 | ) | (6,533 | ) | (4,954 | ) | |
| US GAAP adjustments: | |||||||
| US discontinued operations | (156 | ) | — | — | |||
| Capacity sales | 2 | 2 | (13 | ) | |||
| Customer acquisition costs | 11 | (5 | ) | 16 | |||
| Pension costs | (39 | ) | 18 | (15 | ) | ||
| Stock based compensation | 7 | (4 | ) | (26 | ) | ||
| Partial depreciation | — | — | (3 | ) | |||
| Amortisation and impairment of goodwill and other intangible assets | (1 | ) | 53 | (242 | ) | ||
| Gain on sale of subsidiary | — | — | 33 | ||||
| Restructuring costs and onerous contracts | (2 | ) | 149 | (69 | ) | ||
| Impairment | 96 | — | — | ||||
| Derivative and hedge accounting | (3 | ) | (59 | ) | 64 | ||
| ESOP shares | — | 120 | — | ||||
| Capitalisation of interest | 10 | (6 | ) | (28 | ) | ||
| Marketable securities | (6 | ) | (21 | ) | (126 | ) | |
| Amortisation of discount on Convertible Debt | (5 | ) | — | — | |||
| Deferred tax – tax effect of US GAAP reconciling items | (25 | ) | 58 | (27 | ) | ||
| Other | (10 | ) | 10 | (10 | ) | ||
| Minority interests on reconciling items | (13 | ) | (21 | ) | 21 | ||
| Net loss under US GAAP before cumulative effect of change in accounting principle | (371 | ) | (6,239 | ) | (5,379 | ) | |
| Cumulative effect of change in accounting principle, for derivatives in 2002 | — | — | 8 | ||||
| Net loss under US GAAP | (371 | ) | (6,239 | ) | (5,371 | ) | |
| Continuing operations | (342 | ) | (4,757 | ) | (3,269 | ) | |
| Discontinued operations | (29 | ) | (1,482 | ) | (2,102 | ) | |
| (371 | ) | (6,239 | ) | (5,371 | ) | ||
| Basic and diluted loss per Ordinary share under US GAAP: | |||||||
| Continuing operations | (14.7 | )p | (204.2 | )p | (119.6 | )p | |
| Discontinued operations | (1.2 | )p | (63.6 | )p | (76.9 | )p | |
| Loss per share | (15.9 | )p | (267.8 | )p | (196.5 | )p | |
| Basic and diluted loss per ADR* under US GAAP: | |||||||
| Continuing operations | (44.1 | )p | (612.5 | )p | (358.8 | )p | |
| Discontinued operations | (3.7 | )p | (190.8 | )p | (230.7 | )p | |
| Loss per ADR* | (47.8 | )p | (803.3 | )p | (589.5 | )p | |
| * Computed on the basis that one American Depositary Receipt (“ADR”) represents three Ordinary Shares. |
Restatement
The Group has identified four errors in its US GAAP reconciliation relating to the amounts written off investments, impairment, derivatives and minority interests. The US GAAP reconciliation for 2004 and 2003 has been restated. These reconciliation adjustments do not affect the Group’s financial results under UK GAAP.
| Page 147 |
| notes to the financial statements |
Effect of restatement
The effect of the restatement on loss from continuing operations is analysis as follows:
| 2004 | 2003 | 2002 | |||||
| £m | £m | £m | |||||
| Loss from continuing operations under US GAAP as previously reported | (307 | ) | (4,732 | ) | (3,269 | ) | |
| Amounts written off investments (i) | 25 | (25 | ) | — | |||
| Impairment (ii) | (35 | ) | — | — | |||
| Derivatives (iii) | (6 | ) | — | — | |||
| Minority interest (iv) | (19 | ) | — | — | |||
| Loss from continuing operations under US GAAP as restated | (342 | ) | (4,757 | ) | (3,269 | ) | |
| Basic and diluted loss per Ordinary share from continuing operations under US GAAP as previously reported | (13.2 | )p | (203.1 | )p | (119.6 | )p | |
| Effect of restatements | (1.5 | )p | (1.1 | )p | — | ||
| As restated | (14.7 | )p | (204.2 | )p | (119.6 | )p | |
| Basic and diluted loss per ADR from continuing operations under US GAAP as previously reported | (39.6 | )p | (609.3 | )p | (358.8 | )p | |
| Effect of restatements | (4.5 | )p | (3.3 | )p | — | ||
| As restated | (44.1 | )p | (612.6 | )p | (358.8 | )p | |
| (i) | Amounts written off investments– The Group has corrected the amount written off marketable securities in 2004 and 2003 to reflect the realisation of a £25 million loss in 2003. Previously this loss had been treated as temporary and had been retained within Other Comprehensive Income (‘OCI’) at 31 March 2003. The loss on disposal of these marketable securities in 2004 has been reduced accordingly. |
| (ii) | Impairment–The impairment charge in 2004 has been increased to correct the fair value of the Group’s Japanese business at 31 March 2004 to the amount recorded under UK GAAP. |
| (iii) | Derivatives– A charge has been recorded to recognise the effect relating to a conversion feature of the Company’s 4 per cent convertible debt that has been accounted for as an embedded derivative. |
| (iv) | Minority interest –An adjustment has been recorded to correct an error in the presentation of the minority interest impact of US GAAP reconciling items in 2004. |
| Page 148 |
| notes to the financial statements |
Shareholders’ equity reconciliation
| 2004 | 2003 | ||||
| As restated | As restated | ||||
| £m | £m | ||||
| Shareholders’ equity as reported under UK GAAP | 1,744 | 2,149 | |||
| US GAAP adjustments: | |||||
| Reconsolidation of US discontinued operations | (29 | ) | — | ||
| Capacity sales | (25 | ) | (27 | ) | |
| Customer acquisition costs | — | (11 | ) | ||
| Pension costs | (392 | ) | (454 | ) | |
| Restructuring costs and onerous contracts | 70 | 146 | |||
| Impairment | 96 | — | |||
| Goodwill and other intangible assets | 264 | 307 | |||
| Derivative and hedge accounting | (1 | ) | (1 | ) | |
| Capitalisation of interest | 26 | 16 | |||
| Gain on marketable securities | 54 | 42 | |||
| Amortisation of discount on Convertible Debt | (5 | ) | — | ||
| Deferred tax – tax effect of US GAAP reconciling items | (25 | ) | — | ||
| Proposed final dividend | 73 | — | |||
| ESOP shares | (41 | ) | (38 | ) | |
| Other | (10 | ) | (5 | ) | |
| Minority interests on reconciling items | (12 | ) | 1 | ||
| Shareholders’ equity under US GAAP | 1,787 | 2,125 | |||
Restatement
The effect of the restatement on shareholders equity is analysed as follows:
| 2004 | 2003 | ||||
| £m | £m | ||||
| Shareholder’s equity under US GAAP, as previously reported | 1,847 | 2,125 | |||
| Impairment (ii) | (35 | ) | — | ||
| Derivative (iii) | (6 | ) | — | ||
| Minority interest (iv) | (19 | ) | — | ||
| Shareholders’ equity under US GAAP, as restated | 1,787 | 2,125 | |||
The correction of the write down of investments had no impact on shareholders equity under US GAAP as previously reported.
Recently issued US accounting standards
In April 2003, the FASB issued SFAS 149, ‘Amendment of Statement 133 on Derivative Instruments and Hedging Activities’. SFAS 149 amends and clarifies accounting for derivative instruments, including certain derivative instruments embedded in other contracts, and for hedging activities under SFAS 133. SFAS 149 is effective for contracts entered into or modified after 30 June 2003 and for hedging relationships designated after 30 June 2003. The adoption of SFAS 149 did not have a material impact on the Group’s Financial Statements.
In May 2003, the FASB issued SFAS 150, ‘Accounting for Certain Financial Instruments with Characteristics of both Liabilities and Equity’. SFAS 150 improves the accounting for certain financial instruments that, under previous guidance, issuers could account for as equity. SFAS 150 requires these instruments to be classified as liabilities in the balance sheet. SFAS 150 is effective from 15 June 2003. SFAS 150 did not have a material impact on the Group’s Financial Statements.
In December 2003, the FASB issued Summary of Interpretation (“FIN”) No. 46R, Consolidation of Variable Interest Entities. FIN 46R addresses identification of variable interest entities and explains how an enterprise should assess whether it is the primary beneficiary of such entities. The Interpretation requires consolidation of variable interest entities by primary beneficiaries and provides guidance thereon. For entities that have, or potentially have, interests in variable interest entities FIN 46R was effective for periods ending on or after 15 December 2003. Application for all other types of entities is required for periods ending on or after 15 March 2004. The adoption of FIN 46R did not have a material impact on the Group’s Financial Statements.
| Page 149 |
| shareholder information |
This section contains information about:
| TRADING MARKET |
The principal trading market for the Ordinary Shares is the London Stock Exchange on which 8,541,106,954 Ordinary Shares were traded during the period from 1 April 2003 to 31 March 2004. As at 31 March 2004, the Company had a market capitalisation of approximately £3.09 billion (US$5.69 billion, based on the Noon Buying Rate on 31 March 2004).
American Depositary Receipts (“ADRs”), each representing three Ordinary Shares, have been issued by JP Morgan Chase Bank as Depositary (formerly Citibank N.A.) and are listed on the New York Stock Exchange under the symbol CWP.
The table below sets forth, for the fiscal quarters indicated, the high and low middle market quotations for the Ordinary Shares on the London Stock Exchange as reported on its Daily Official List and the high and low market quotations for the ADRs on the New York Stock Exchange.
| Pence Per Ordinary Share | US$ Per ADR | ||||||||
| High | Low | High | Low | ||||||
| Year ended 31 March 2000 | 1,561.5 | 658.0 | 74.5 | 31.4 | |||||
| Year ended 31 March 2001 | 1,325.0 | 430.0 | 56.4 | 18.3 | |||||
| Year ended 31 March 2002 | 531.5 | 207.0 | 22.9 | 8.9 | |||||
| Year ended 31 March 2003 | 223.0 | 41.0 | 10.3 | 1.9 | |||||
| Year ended 31 March 2004 | 153.5 | 71.0 | 8.7 | 3.4 | |||||
| Year ended 31 March 2003 | |||||||||
| First quarter | 223.0 | 163.2 | 9.6 | 7.5 | |||||
| Second quarter | 179.2 | 114.4 | 8.3 | 5.4 | |||||
| Third quarter | 153.4 | 41.0 | 7.2 | 1.9 | |||||
| Fourth quarter | 73.2 | 46.0 | 3.5 | 2.2 | |||||
| Year ended 31 March 2004 | |||||||||
| First quarter | 115.5 | 71.0 | 5.7 | 3.4 | |||||
| Second quarter | 127.0 | 109.0 | 6.0 | 5.4 | |||||
| Third quarter | 140.8 | 114.8 | 7.1 | 5.7 | |||||
| Fourth quarter | 153.5 | 122.3 | 8.7 | 3.4 | |||||
| Pence Per Ordinary Share | US$ Per ADR | ||||||||
| High | Low | High | Low | ||||||
| December 2003 | 138.5 | 126.5 | 7.4 | 6.5 | |||||
| January 2004 | 150.5 | 132.5 | 8.4 | 7.1 | |||||
| February 2004 | 153.5 | 140.3 | 8.9 | 7.6 | |||||
| March 2004 | 142.0 | 122.3 | 7.9 | 6.7 | |||||
| April 2004 | 133.5 | 119.5 | 7.3 | 6.3 | |||||
| May 2004 | 127.3 | 115.8 | 6.8 | 6.1 | |||||
At 1 June 2004, 863,206 Ordinary Shares were held in the United States representing 0.03 per cent of the total number of issued and outstanding Ordinary Shares on that date. These Ordinary Shares were held by 750 holders of record. At 1 June 2004, 33,735,561 ADRs (representing 101,206,683 Ordinary Shares) were held in the United States by 2,016 holders of record. Since certain of such Ordinary Shares (or ADRs, as the case may be) are held by broker nominees, the number of holders of record may not be representative of the number of beneficial owners. At 1 June 2004, the Company had 143,991 shareholders of record.
Distribution and classification of ordinary shareholdings |
| At 31 March 2004 | Number of Accounts | % of total | Number of Shares | % of total | |||||
| Up to 1,000 shares | 98,114 | 66.95 | 44,707,031 | 1.87 | |||||
| 1,001 - 10,000 | 45,533 | 31.08 | 109,845,160 | 4.60 | |||||
| 10,001 - 100,000 | 2,004 | 1.37 | 53,070,909 | 2.22 | |||||
| 100,001 - 1,000,000 | 596 | 0.41 | 216,379,096 | 9.07 | |||||
| 1,000,001 and over | 276 | 0.19 | 1,961,465,794 | 82.24 | |||||
Total | 146,523 | 100.00 | 2,385,467,990 | 100.00 | |||||
| Individuals | 129,809 | 88.60 | 153,793,428 | 6.45 | |||||
| Corporate bodies | 2,014 | 1.38 | 110,565,207 | 4.65 | |||||
| Banks/nominee companies | 14,656 | 10.00 | 2,112,018,581 | 88.53 | |||||
| Insurance companies/ pension funds | 44 | 0.02 | 9,090,774 | 0.37 | |||||
Total | 146,523 | 100.00 | 2,385,467,990 | 100.00 | |||||
| Page 150 |
| shareholder information |
| DIVIDENDS |
The table below sets out the sterling amounts of interim, final and total gross dividends paid per Ordinary Share and also the US dollar amounts per American Depositary Share (“ADS”) evidenced by ADRs (each representing three Ordinary Shares) translated at the Noon Buying Rate at 31 March each year.
To give greater financial flexibility during the current transitional period, the Board decided in June 2003 to
suspend dividends for 12 months. However, the Board recommended a full year dividend for the year ended 31 March 2004 of 3.15p per share consisting of 1.05p for the interim dividend and 2.10p for the final dividend.
There are currently no UK governmental restrictions on dividend payments to non-UK shareholders applicable to the Company.
| Year ended 31 March | Pence per Ordinary Share | US dollars per ADR | ||||||||||||||
| Interim | Special | Final | Total | Interim | Special | Final | Total | |||||||||
| 2000 | 4.50 | – | 10.50 | 15.00 | 0.21 | – | 0.50 | 0.71 | ||||||||
| 2001 | 4.95 | – | 11.55 | 16.50 | 0.21 | – | 0.49 | 0.70 | ||||||||
| 2002 | 1.50 | 11.50 | * | 3.50 | 16.50 | 0.06 | 0.49 | 0.15 | 0.70 | |||||||
| 2003 | 1.60 | – | – | 1.60 | 0.08 | – | – | 0.08 | ||||||||
| 2004 | 1.05 | – | 2.10 | 3.15 | 0.06 | – | 0.12 | 0.17 | ||||||||
| * Paid at the same time as the interim dividend. |
| Page 151 |
| shareholder information |
| EXCHANGE RATE INFORMATION |
The Company presents its Consolidated Financial Statements in pounds sterling (£). In this Annual Report, references to ‘£’, ‘pound(s) sterling’, ‘GBP’, ‘pence’ and ‘p’ are to the lawful currency of the United Kingdom, references to ‘US$’, ‘US dollars’, ‘cents’ and ‘c’ are to the lawful currency of the United States. This Annual Report contains translations of certain pound sterling amounts into US dollars at specified rates solely for the convenience of the reader. These translations should not be construed as representations that the pound sterling amounts actually represent such US dollar amounts or could be converted into US dollars at the rate indicated. Unless otherwise indicated, the translation of pounds sterling into such US dollars have been made at the Noon Buying Rate in New York City for cable transfers in pounds sterling as certified for customs purposes by the Federal Reserve Bank of New York in effect on 31 March 2004, which was £1.00 to US$1.84.
The following table sets forth the high and low Noon Buying Rates for pounds sterling expressed in US dollars per £1.00 for the previous six months:
| High | Low | |||
| December 2003 | 1.78 | 1.72 | ||
| January 2004 | 1.85 | 1.79 | ||
| February 2004 | 1.90 | 1.82 | ||
| March 2004 | 1.87 | 1.79 | ||
| April 2004 | 1.86 | 1.77 | ||
| May 2004 | 1.79 | 1.75 | ||
The following table sets forth, for the periods indicated, the average, high, low and period-end Noon Buying Rates for pounds sterling expressed in US dollars per £1.00:
| Year ended 31 March | Average1 | High | Low | Period End | ||||
| 2000 | 1.61 | 1.68 | 1.55 | 1.59 | ||||
| 2001 | 1.47 | 1.60 | 1.40 | 1.42 | ||||
| 2002 | 1.43 | 1.48 | 1.37 | 1.43 | ||||
| 2003 | 1.55 | 1.65 | 1.43 | 1.58 | ||||
| 2004 | 1.70 | 1.90 | 1.55 | 1.84 | ||||
| 1 The average of the Noon Buying Rates on the last day of each full month during the relevant period. |
On 1 June 2004 the Noon Buying Rate was £1.00 to US$1.84. A substantial portion of Cable & Wireless’ assets, gross turnover and operating costs are denominated in currencies other than pound sterling. See ‘Operating and Financial Review – Disclosures about Market Risk’.
| EXCHANGE CONTROLS AND OTHER LIMITATIONS AFFECTING SECURITY HOLDERS |
Certain of the countries in which Cable & Wireless and its associated companies operate have exchange controls. Operations in the countries that currently have exchange controls are not, however, material to the business of Cable
& Wireless and its associated companies, and the controls themselves have not materially restricted payments within Cable & Wireless and its associated companies.
| Page 152 |
| shareholder information |
| TAXATION |
The following is a summary, under current law, of the principal UK and US federal income tax considerations relating to an investment by a US taxpayer in Ordinary Shares or ADRs. This summary applies to investors only if:
| • | they are individual US citizens or residents, US corporations, or otherwise subject to US federal income tax on a net income basis in respect of the Ordinary Shares or ADRs; |
| • | they hold the Ordinary Shares or ADRs as a capital asset for tax purposes; and |
| • | they are not resident or ordinarily resident in the United Kingdom for UK tax purposes, and do not hold the Ordinary Shares or ADRs for the purposes of a trade, profession, or vocation that they carry on in the United Kingdom through a branch or agency. |
This summary does not purport to be a comprehensive description of all of the tax considerations that may be relevant to any particular investor, and does not address the tax treatment of investors that are subject to special rules. It is assumed that investors are familiar with the tax rules applicable to investments in securities generally and with any special rules to which they may be subject. In particular, the discussion does not address the tax treatment of investors that are subject to special rules, such as banks, insurance companies, dealers in securities or currencies, persons that elect mark-to-market treatment, persons that hold Ordinary Shares or ADRs as a position in a straddle, conversion transaction, synthetic security, or other integrated financial transaction, and persons whose functional currency is not the US dollar.
The discussion is based on laws, treaties, judicial decisions, and regulatory interpretations in effect on the date of this document, all of which are subject to change. On 31 March 2003, representatives of the United Kingdom and United States exchanged instruments of ratification for a new income tax convention (“the New Treaty”). The New Treaty has the force and effect of law in respect of withholding taxes on dividends from 1 May 2003. As discussed below, investors will no longer be entitled to claim a special foreign tax credit in respect of dividends that was available under the terms of the prior treaty, except for a limited period of time during which investors may elect to apply the entirety of the prior treaty in preference to the New Treaty.
Investors should consult their own advisers regarding the tax consequences of the acquisition, ownership, and disposition of the Ordinary Shares or ADRs in the light of their particular circumstances, including the effect of any state, local, or other national laws.
| UK Taxation |
| Dividends |
Under current UK taxation legislation, no tax is required to be withheld at source from cash dividend payments on the Ordinary Shares or ADRs.
| Capital Gains |
Subject to the following, if investors are not resident or ordinarily resident in the United Kingdom for UK tax purposes they will not generally be liable to UK tax on gains realised or accrued on the disposal of Ordinary Shares or ADRs, unless they carry on a trade, profession, or vocation in the United Kingdom through a branch or agency and the Ordinary Shares or ADRs are used in or for the purposes of the trade, profession, or vocation or are used or held for the purposes of the branch or agency or acquired for use by or for the purposes of the branch or agency. Particular rules may apply to investors who have previously been resident in the United Kingdom, who dispose of Ordinary Share or ADRs while they are not so resident, and who subsequently again become resident in the United Kingdom within specified time periods. Such rules may have the effect of subjecting such an investor to United Kingdom capital gains tax in the year in which they again become resident in the United Kingdom.
| Inheritance Tax |
Ordinary Shares or ADRs held by an individual who is domiciled in the United States for purposes of the current estate and gift tax convention between the United Kingdom and the United States and is not a national of the United Kingdom for such purposes do not generally attract UK inheritance tax on the individual’s death or on transfer during his lifetime.
| Stamp Duty And Stamp Duty Reserve Tax |
UK stamp duty reserve tax (“SDRT”) is chargeable where Ordinary Shares are issued or transferred to the depositary or nominee or agent for the depositary pursuant to an arrangement under which the depositary issues depositary receipts (such as the ADRs). The SDRT, payable by the depositary, will generally be 1.5 per cent of the purchase or issue price of the Ordinary Shares. In certain circumstances, the transfer to the depositary’s nominee or agent may give rise to a liability to ad valorem stamp duty, in which case the SDRT charge is reduced or eliminated accordingly. Such SDRT or stamp duty liability will ordinarily (in accordance with the terms of the deposit agreement) be charged to the person to whom ADRs are delivered in connection with the deposit of Ordinary Shares.
| Page 153 |
| shareholder information |
No UK stamp duty is payable on any transfer of an ADR provided that the ADR and any separate instrument of transfer is executed and remains outside the United Kingdom. Nor is any agreement for transfer of ADRs subject to SDRT. However, if the seller of an ADR fulfils his obligations by requiring the transfer of the underlying Ordinary Shares (whether or not to the purchaser), the transfer instrument is, it is thought, subject to stamp duty at approximately 0.5 per cent of the purchase price. A transfer of Ordinary Shares which does not complete a sale is dutiable at the fixed rate of £5.
If Ordinary Shares themselves are sold, SDRT at 0.5 per cent of the consideration will, subject to exceptions, be payable, generally by the purchaser. If, within six years of the date on which the agreement is made or (if later) becomes unconditional, the Ordinary Shares are transferred to the person with whom the agreement is made or (where the agreement was to transfer the Ordinary Shares to that person’s nominee) his nominee and the transfer instrument is stamped on payment of the applicable stamp duty (approximately 0.5 per cent of the consideration), the stamp duty will cancel the SDRT charge and the SDRT may be repaid on making of a claim within the six year period.
| US Federal Income Taxation |
| General |
Beneficial owners of ADRs will be treated as owners of the underlying Ordinary Shares for US federal income tax purposes and for purposes of the Current Treaty. Deposits and withdrawals of Ordinary Shares in exchange for ADRs will not result in the realisation of gain or loss for US federal income tax purposes.
| Dividends |
If Cable & Wireless pays dividends, investors must include those dividends in their income for US federal income tax purposes when they receive them. The dividends will be treated as foreign source income. Investors should determine the amount of their dividend income by converting pounds sterling into US dollars at the exchange rate in effect on the date of their (or the depositary’s, in the case of ADRs) receipt of the dividend. Subject to certain exceptions for positions that are hedged or held for less than 61 days, an individual US holder generally will be subject to US taxation at a maximum rate of 15 per cent in respect of dividends received after 2002 and before 2009.
| Special Foreign Tax Credit Benefits Under Prior Treaty |
Investors who qualified for benefits under the income tax convention between the United States and the United Kingdom in force before 31 March 2003 may be eligible, subject to generally applicable limitations, to receive a special US foreign tax credit equal to one-ninth of the amount of certain cash dividends that they receive on the Ordinary Shares or ADRs, so long as they make an election to include in their income, as an additional notional dividend, an amount equal to the tax credit. This foreign tax credit benefit is generally only available with respect to dividends paid before 1 May 2003, unless an investor elects to apply the prior income tax convention in its entirety for an optional 12 month extension period. Investors should consult their own tax advisers regarding their potential eligibility for this foreign tax credit benefit.
| Capital Gains |
If investors sell their Ordinary Shares or ADRs, investors will recognise capital gain or loss. Gain on the sale of Ordinary Shares or ADRs held for more than one year will be treated as long-term capital gain. The net amount of long-term capital gain realised by a non-corporate holder generally is subject to taxation at a maximum rate of 20 per cent; however, net long-term capital gain recognised after 5 May 2003 and before 2009 generally is subject to taxation at a maximum rate of 15 per cent. An investor’s ability to offset capital losses against ordinary income is subject to limitations.
| US Information Reporting And Backup Withholding Rules |
Payments in respect of the Ordinary Shares or ADRs that are made within the United States or through certain US-related financial intermediaries are subject to information reporting and may be subject to backup withholding unless the holder (1) is a corporation or other exempt recipient or (2) provides a taxpayer identification number and certifies that no loss of exemption from backup withholding has occurred. Holders that are not US persons generally are not subject to information reporting or backup withholding. However, such a holder may be required to provide a certification of its non-US status in connection with payments received within the United States or through a US-related financial intermediary.
| Page 154 |
| shareholder information |
| MEMORANDUM AND ARTICLES OF ASSOCIATION |
The Memorandum and Articles of Association are registered with the Registrar of Companies of England and Wales and the registered number of the Company is 238525. The summary of the material terms of Cable and Wireless plc’s Memorandum and Articles of Association contained in the
Company’s Annual Report on Form 20-F for the year ended 31 March 2002 under the caption ‘Memorandum and Articles of Association’ is incorporated within this document by reference.
| MATERIAL CONTRACTS |
US Exit
As part of the Group’s withdrawal from the US domestic market described in Corporate Overview, a Separation Agreement amongst Cable and Wireless plc, Cable & Wireless Americas Operations Inc., Cable & Wireless Holdings, Inc., Cable & Wireless USA, Inc. and Cable & Wireless Internet Services, Inc. was entered into on 17 September 2003, with effect from 1 July 2003. This agreement formalised the separation of the business of Cable & Wireless USA, Inc. and Cable & Wireless Internet Services, Inc. together with certain of their affiliates referred to as “Cable & Wireless America” from the businesses of the rest of Cable & Wireless and set out the steps each was taking to ensure service continuity for their respective customers.
Following the auction described in Corporate Overview, Cable & Wireless USA, Inc. and Cable & Wireless Internet Services, Inc., entered into an agreement on 23 January 2004
with SAVVIS Communications Corporation (“SAVVIS”), for SAVVIS to acquire substantially all of the assets of Cable & Wireless America for a sum of US$155 million in cash and approximately US$12.4 million of assumed liabilities. The contract contained certain conditions of a standard nature, including regulatory approvals. All of the conditions to the sale were satisfied and the completion of the sale was announced on 8 March 2004. Pursuant to the terms of the sale agreement, SAVVIS began funding the operating expenses of the purchased business on 28 January 2004.
A Transitional Services Agreement between Cable and Wireless plc and SAVVIS was entered into on 13 February 2004 which formalised the steps that each of Cable and Wireless plc and SAVVIS was taking to ensure service continuity for the customers of both entities.
| Page 155 |
| cross reference guide to form 20-F |
CROSS REFERENCE GUIDE TO FORM 20-F |
| Item | Page | ||
| 1. | Identity of directors, senior management and advisers | n/a | |
| 2. | Offer statistics and expected timetable | n/a | |
| 3. | Key information | ||
| Selected financial data | 43 | ||
| Exchange rates | 151 | ||
| Capitalisation and indebtedness | n/a | ||
| Reasons for offer and use of proceeds | n/a | ||
| Risk factors | 47 | ||
| 4. | Information on the company | ||
| History and development of the company | 6 | ||
| Principal capital expenditure | 8 | ||
| Business overview | 8 | ||
| Organisational structure | 8 | ||
| Property, plant and equipment | 14 and 17 | ||
| 5. | Operating and financial review and prospects | ||
| Operating results | 24 | ||
| Liquidity and capital resources | 38 | ||
| Research and development, patents and licences etc | n/a | ||
| Trend information | 4 and 5 | ||
| Off-balance sheet arrangements | 40 | ||
| Tabular disclosure of contractual obligations | 40 | ||
| 6. | Directors, senior management and employees | ||
| Directors and senior management | 57 | ||
| Compensation | 66 | ||
| Board practices | 61 | ||
| Employees | 55 | ||
| Share ownership | 73 | ||
| 7. | Major shareholders and related party transactions | ||
| Major shareholders | 60 | ||
| Related party transactions | 60 | ||
| Interests of experts and counsel | n/a | ||
| 8. | Financial information | ||
| Consolidated accounts and other financial information | See item 17 | ||
| Legal proceedings | 18 | ||
| Dividend policy | 59 | ||
| Significant changes | 4 and 5 | ||
| 9. | The offer and listing | ||
| Offer and listing details – price history of stock | 150 | ||
| Plan of distribution | n/a | ||
| Markets | 150 | ||
| Selling shareholders | n/a | ||
| Dilution | n/a | ||
| Expenses of the issue | n/a | ||
| Page 156 |
| cross reference guide to form 20-F |
| Item | Page | ||
| 10. | Additional information | ||
| Share capital | n/a | ||
| Memorandum and Articles of Association | 154 | ||
| Material contracts | 154 | ||
| Exchange controls | 151 | ||
| Taxation | 152 | ||
| Dividends and paying agents | n/a | ||
| Statement by experts | n/a | ||
| Documents on display | filed separately | ||
| Subsidiary information | n/a | ||
| 11. | Quantitative and qualitative disclosures about market risk | 41 | |
| 12. | Description of securities other than equity securities | n/a | |
| 13. | Defaults, dividend arrearages and delinquencies | n/a | |
| 14. | Material modifications to the rights of security holders and use of proceeds | n/a | |
| 15. | Controls and procedures | 65 | |
| 16A. | Audit committee financial expert | 64 | |
| 16B. | Code of ethics | 53 | |
| 16C. | Principal accountant fees and services | 101 | |
| 16D. | Exemptions from the listing standards for audit committees | n/a | |
| 16E. | Purchases of equity securities by the issuer and affiliated purchasers | n/a | |
| 17. | Financial statements | 84 | |
| 18. | Financial statements | n/a | |
| 19. | Exhibits | * | |
| * | Filed separately with the Securities and Exchange Commission |
Page 157
| glossary of terms |
GLOSSARY OF TERMS
| Terms used in this Annual Report | Brief description of meaning or US equivalent | |
| ACCESS SERVICES | Services giving customers the ability to connect to the internet. | |
| ADRs | American Depositary Receipts evidencing ADSs. | |
| ADSL | Asymmetric Digital Subscriber Line: a transmission technology that transforms existing copper wires from a subscriber’s premises to the local exchange into high bandwidth lines. | |
| ADSs | American Depositary Shares, each of which represents three Ordinary Shares. | |
| ATM | Asynchronous Transfer Mode: a high-speed transmission technology for transporting voice, data and video in digital format. | |
| BACKBONE | A high-capacity network linking networks of lower capacity, such as LANs. | |
| BANDWIDTH | The information-carrying capacity of a network. | |
| BROADBAND | A broadband network is one on which a number of independent, simultaneous data flows are transmitted on each cable. | |
| CALLED-UP SHARE CAPITAL | Ordinary Shares, issued and fully paid. | |
| CAPACITY SALES | Sales of transmission space on a network to business and wholesale customers. | |
| CAPITAL ALLOWANCES | Tax term equivalent to US tax depreciation allowances. | |
| CASH AT BANK AND IN HAND | Cash. | |
| CDMA | Code Division Multiple Access: a technology used in mobile communications. | |
| CHAPTER 11 | Restructuring under Chapter 11 of the US Bankruptcy Code. | |
| COMPANY | Cable and Wireless plc. | |
| CONNECTIVITY | Providing customers with access to the internet. | |
| CONTENT DELIVERY/ DISTRIBUTION | Service providing geographically diverse distribution of web pages to the end user. | |
| CORPORATION TAX | Income tax. | |
| CREDITORS: AMOUNTS FALLING DUE AFTER MORE THAN ONE YEAR | Long-term debt. | |
| CREDITORS: AMOUNTS FALLING DUE WITHIN ONE YEAR | Current liabilities. | |
| DIAL-UP IP | Dial-up access to the internet via telephone lines. | |
| DIGITAL | Sound, text or video coded into binary form, a series of 1s and 0s, to enable more effective transmission. |
Page 158
| glossary of terms |
| Terms used in this Annual Report | Brief description of meaning or US equivalent | |
| FIBRE OPTIC | The use of special glass fibres to transmit laser light pulses, giving the ‘on’ and ‘off’ signals of digital information. | |
| FINANCE LEASE | Capital lease. | |
| FRAME RELAY | A high-speed data transmission technology. | |
| FREEHOLD | Ownership with absolute rights in perpetuity. | |
| GSM | Global system for mobile communications: a standard for digital mobile telephone transmissions at a frequency of 850 MHz, 900 MHz, 1800 MHz or 1900 MHz. | |
| INTELLIGENT NETWORK | A network where the transmission logic is located separately from the switching equipment, greatly simplifying the provision of value added services. | |
| INTERCONNECT | Connection arrangements between carriers. | |
| INTEREST RECEIVABLE | Interest income. | |
| INTERNET | The system comprising all networks interconnected using IP. The internet supports access to databases, web-sites, email, and file downloading worldwide. | |
| IP | Internet Protocol: the data transmission standard on which the internet is based. | |
| IP DEDICATED ACCESS | Direct access to the internet. | |
| IP TRANSIT | Transmission of IP traffic across the network backbone. | |
| IP-VPN | An internet based network used to provide companies with an internal communications system linking employees in different offices worldwide. | |
| IRU | Indefeasible Rights of Use: the right to use a cable fibre or wavelength for a fixed period of time. | |
| ISP | Internet Service Provider: a business that provides internet access to users. It may also provide additional services such as web-hosting. | |
| LAN | Local Area Network: a network that covers only short distances (usually less than 1 km) and is normally confined to one building or site. | |
| MANAGED HOSTING | A service where customer websites are hosted, maintained and managed by Cable & Wireless. | |
| MPLS | Multi Protocol Label Switching: technology for enhancing the speed and management of network traffic. | |
| NETWORK COSTS | Network costs include bandwidth, operating and maintenance of equipment, software and cables, wayleaves, customer acquisition costs, cost of goods sold, licences and associated royalties payable to government. |
Page 159
| glossary of terms |
| Terms used in this Annual Report | Brief description of meaning or US equivalent | |
| NODES | Connecting points on a network. | |
| NOON BUY ING RATE | The Noon Buying Rate in the City of New York for cable transfers in pounds sterling as certified for customs purposes by the Federal Reserve Bank of New York on the date specified. | |
| OFCOM | The Office of Communications in the United Kingdom: the independent regulatory body set up under the Communications Act 2003 which has responsibility for the enforcement and monitoring, and where appropriate initiating modification, of telecommunications licences in the United Kingdom. | |
| ORDINARY SHARES | Ordinary Shares of 25p each in the capital of the Company. | |
| OUTPAYMENTS | Payments to other network operators to carry traffic on behalf of Cable & Wireless. | |
| PSTN | Public Switched Telephone Network: telecommunications lines and exchanges to which the public connects to make domestic voice and facsimile calls and to access international telecommunications networks. | |
| PROFIT | Income. | |
| PROFIT AND LOSS ACCOUNT | Income statement. | |
| PRO FIT AND LOSS ACCOUNT | Retained earnings. | |
| (Under ‘Capital and Reserves’) | ||
| PROFIT ATTRIBUTA BLE TO ORDINARY SHAREHOLDERS | Net income. | |
| PROPOSED DIVIDEND | Dividend declared by directors but not yet approved by shareholders. | |
| RESELLERS | Businesses that provide communication services to consumers by buying capacity from network operators and selling it on. | |
| SETTLEMENT RATES | Amount per call minute paid by an originating international carrier to a terminating international carrier for carrying international voice traffic. | |
| SHARE CAPITAL | Ordinary Shares, capital stock or common stock issued and fully paid. | |
| SHARE PREMIUM ACCOUNT | Additional paid-in capital or paid-in surplus (not distributable). | |
| SMS | Short Messaging Service: SMS permits the transmission of text messages to and from mobile handsets. | |
| STOCKS | Inventories. | |
| TANGIBLE FIXED ASSETS | Property, plant and equipment. | |
| TDMA | Time Division Multiple Access: technology used in mobile communications. | |
| TRADE CREDITORS | Accounts payable. | |
| TRADE DEBTORS | Accounts receivable. |
Page 160
| glossary of terms |
| Terms used in this Annual Report | Brief description of meaning or US equivalent | |
| TURNOVER | Operating revenue. | |
| VPN | Virtual Private Network: a corporate network provided to a customer by a telecommunications operator using elements of the PSTN. To the customer it offers all the features of a private network, such as direct dialling between offices in different countries. | |
| WAVELENGTHS | A measurement of capacity on a network. | |
| WEB-HOSTING | Service providing facilities to hold customer websites. |
Page 161
REGISTRAR
The Company’s share register is administered by Lloyds TSB Registrars. All queries about your shareholding should be addressed to:
Lloyds TSB Registrars
The Causeway
Worthing
West Sussex
BN99 6DA
Telephone 0870 600 3975 (UK shareholders)
+44 1903 502541 (Overseas shareholders)
Shareholders can view up-to-date information about their own shareholding by viewing ‘Shareview’ (www.shareview.co.uk). Shareholders registered with Shareview can elect to receive shareholder communications in electronic form.
SCRIP DIVIDEND SCHEME/DIVIDEND REINVESTMENT PLAN
Subject to shareholder approval at the Annual General Meeting to be held on 22 July 2004, the Company will introduce a scrip dividend scheme for the full year dividend payable on 13 August 2004 and all future dividends. The dividend reinvestment plan has been suspended and, subject to the approval and introduction of the scrip dividend scheme, will be terminated. Full details are contained in a brochure called ‘The Scrip Dividend Scheme’ sent to shareholders with this Annual Report and a copy can be obtained from the Company’s Registrar at the address above or from the Company Secretary.
FINANCIAL CALENDAR |
| Last date for election to join scrip dividend | 16 July 2004 | |
| Quarter 1 results update | 21 July 2004 | |
| Ex-dividend date | 21 July 2004 | |
| AGM | 22 July 2004 | |
| Record date | 23 July 2004 | |
| Payment of full year dividend | 13 August 2004 | |
| Payment of full year dividend to ADR holders | 23 August 2004 | |
| Announcement of interim results 2004 | 10 November 2004 |
SHAREGIFT
If you have a small number of shares whose value makes it uneconomic to sell them, you may wish to consider donating them to charity under ShareGift, a charity share donation scheme administered by The Orr Mackintosh Foundation. The relevant share transfer forms may be obtained from the Registrars, the Company Secretary’s Office or the Investor
Relations section of the Company’s website. Further information is available from the Company’s website (www.cw.com) or from ShareGift on +44 (0)20 7337 0501 (www.sharegift.org).
COMPANY SECRETARY AND REGISTERED OFFICE
Mr Andrew S Garard is the Company Secretary.
The Company’s Registered Office and address for correspondence is:
124 Theobalds Road
London
WC1X 8RX
Tel +44 (0)20 7315 4000
AMERICAN DEPOSITARY RECEIPTS
Holders of American Depositary Receipts
JP Morgan is the depositary for Cable and Wireless plc American Depositary Receipts.
Details on the Company’s ADR programme can be obtained from:
JP Morgan Chase Bank
4 New York Plaza
New York 10004
Tel 001 800 990 1135
or from their website (www.adr.com)
GLOBAL INVEST DIRECT FACILITYThe Global Invest Direct Facility is administered by JP Morgan and enables ADR holders to purchase additional ADRs, reinvest dividends, deposit certificates for safekeeping and sell ADRs in an efficient manner. Details can be obtained from JP Morgan by calling 0800 428 4237 or from their website (www.adr.com).
INVESTOR RELATIONSEnquiries may be directed to:
Director, Investor Relations
124 Theobalds Road
London
WC1X 8RX
Or
Email: Investor-Relations.C&WPLC@plc.cwplc.com
SIGNATURES
The registrant hereby certifies that it meets all of the requirements for filing on Form 20-F and that it has duly caused and authorized the undersigned to sign this annual report on its behalf.
| CABLE AND WIRELESS PUBLIC LIMITED COMPANY (Registrant) | ||
| By | /s/ Francesco Caio | |
| Francesco Caio | ||
| Title: | Chief Executive Officer | |
| July 28, 2005 |
EXHIBIT INDEX
| Exhibit No. | Description |
| 1* | Memorandum and Articles of Association of Cable & Wireless plc. (incorporated by reference to Cable & Wireless’ Annual Report on Form 20-F filed September 30, 2002) |
| 4.1* | Amended and Restated Asset Purchase Agreement by and among Cable & Wireless USA, Inc., Cable & Wireless Internet Services, Inc. and Savvis Asset Holdings, Inc. dated as of January 23, 2004 (the registrant agrees to furnish supplementally a copy of any omitted schedule or exhibit to this Agreement to the Securities and Exchange Commission upon request). |
| 8* | Significant subsidiaries as of 31 March 2004. |
| 12.1 | Certification of the Principal Executive Officer pursuant to Section 302 of the Sarbanes-Oxley Act of 2002. |
| 12.2 | Certification of the Principal Financial Officer pursuant to Section 302 of the Sarbanes-Oxley Act of 2002. |
| 13 | Certification pursuant to 18 U.S.C. 1350, as adopted pursuant to Section 906 of the Sarbanes-Oxley Act of 2002. |
* Filed previously. Unless otherwise set forth above, each exhibit is incorporated by reference to the Cable and Wireless Annual Report on Form 20-F filed June 21, 2004.