Exhibit 99.3

Annual Report and Accounts 2004
Royal Dutch Petroleum Company
N.V. Koninklijke Nederlandsche Petroleum Maatschappij

About this report
Welcome to the Annual Report and Accounts 2004 for Royal Dutch Petroleum Company. In this report you will find information relating to the Royal Dutch/Shell Group of Companies on pages 6 to 103, including a review of the 2004 operational and financial performance of the businesses. On pages 1 to 5 and 104 to 136, you will find information about Royal Dutch Petroleum Company, one of the Parent Companies of the Royal Dutch/Shell Group.

Shell’s operations
The Royal Dutch/Shell Group of Companies consists of the upstream businesses of Exploration & Production and Gas & Power and the downstream businesses of Oil Products and Chemicals. We also have interests in other industry segments such as Renewables and Hydrogen. For more information on Shell’s operations, see pages 8 and 9 of this report.
1 
What’s in this report
| | | | | |
| Royal Dutch Petroleum Company |
| | 2 | | | Message to shareholders |
| | 4 | | | Financial highlights |
| | 5 | | | Unification of Royal Dutch and Shell Transport |
| Royal Dutch/Shell Group |
| | 6 | | | The Boards of the Parent Companies |
| | 8 | | | What we do |
| | 9 | | | Where we are |
| | 10 | | | Operational and Financial Review |
| | 10 | | | Strategy |
| | 12 | | | Contributing to sustainable development |
| | 13 | | | Market overview |
| | 14 | | | Summary of Group results |
| | 16 | | | Upstream: Exploration & Production |
| | 22 | | | Upstream: Gas & Power |
| | 26 | | | Downstream: Oil Products |
| | 30 | | | Downstream: Chemicals |
| | 32 | | | Other industry segments and Corporate |
| | 34 | | | Liquidity and capital resources |
| | 37 | | | Other matters |
| | 42 | | | Critical accounting estimates |
| | 45 | | | Controls and procedures |
| | 48 | | | Report of the Registered Independent Public Accounting Firms on the US GAAP Financial Statements |
| | 49 | | | US GAAP Financial Statements and Notes |
| | 82 | | | Report of the Independent Auditors (Netherlands GAAP) |
| | 83 | | | Netherlands GAAP Financial Statements and Notes |
| | 92 | | | Supplementary information — Oil and Gas (unaudited) |
| Royal Dutch Petroleum Company |
| | 104 | | | Report of the Supervisory Board |
| | 105 | | | Annual Report |
| | 106 | | | Annual Accounts |
| | 108 | | | Notes to the Annual Accounts |
| | 115 | | | Corporate governance |
| | 121 | | | Remuneration Report |
| | 133 | | | Group share plans |
| | 134 | | | Other information |
| | 135 | | | Report of the Independent Auditors |
| | 136 | | | Shareholder information |
Report structure
Royal Dutch Petroleum Company owns 60% of the Royal Dutch/Shell Group. Throughout this report, page markers are used to identify sections that relate to these entities:
| | | |
 | | Royal Dutch Petroleum Company |
 | | Royal Dutch/Shell Group |
The companies in which Royal Dutch Petroleum Company and The “Shell” Transport and Trading Company, p.l.c. directly or indirectly own investments are separate and distinct entities. But in this report the collective expressions “Shell”, “Group” and “Royal Dutch/Shell Group of Companies” are sometimes used for convenience in contexts where reference is made to the companies of the Royal Dutch/Shell Group in general. Likewise the words “we”, “us” and “our” are used in some places to refer to companies of the Royal Dutch/Shell Group in general, and in others to those who work in those companies. Those expressions are also used where no useful purpose is served by identifying a particular company or companies.
The shell pictured on the cover of this report isMitra mitrafrom the Indo-Pacific region and the Galapagos Islands.
 2 Royal Dutch Petroleum Company
Message to shareholders

Message from the Chairman
2004 was one of the most challenging years in the Group’s history. However, it was also a year when we took important steps to deal with the difficulties we faced and to strengthen the foundations of the Royal Dutch/Shell Group for the future. At the same time, we maintained our focus on the fundamentals of our business: in 2004 we had record income and good performance across all of our businesses.
Addressing the issues arising from the recategorisation of the Group’s proved hydrocarbon reserves was a key priority. We made major improvements to the way we record, review and audit our reserves. I believe we now have a thorough and rigorous system in place that meets the relevant regulatory and legal requirements and that we can now begin to put these issues behind us. We have also refocused our upstream strategy, increasing capital investment to replenish our resource base.
We undertook a far reaching review of the structure and governance of the Group which has resulted in the proposals for unification that are being put to shareholders at meetings on June 28, 2005. This is a historic step that your Board believes offers the opportunity to bring greater clarity, simplicity and accountability to the governance and management of your company.
I am confident that the steps we are now taking will enable us to take full advantage of the outstanding skills of our people and the value of our assets to seize the exciting opportunities ahead.
/s/ Aad Jacobs
Aad Jacobs
Chairman of Royal Dutch
April 27, 2005

Message from the Group Chief Executive
The past year has been one of real contrasts. We faced very difficult issues arising from the recategorisation of our proved reserves but also delivered record earnings in line with our business strategy. At the same time, we made sweeping proposals to clarify and simplify the Group’s structure and to strengthen our business for the future.
Our performance in 2004 reflected the progress we made in delivering our strategy of more upstream and profitable downstream. We reported record net income of $18.2 billion, a 48% increase on 2003 and generated more than $33 billion in cash. This strong performance and cash generation is enabling us to pay more than $10 billion in dividends in 2005 and to relaunch our share buyback programme, while investing some $15 billion to build for the future.
Results in the Downstream and Gas & Power in 2004 were particularly strong. Higher prices and higher margins, as well as improved operational performance, meant that earnings in the Oil Products business more than doubled. In Gas & Power, we continued to build on our industry leading position in liquefied natural gas (LNG), with 9% volume growth and new projects added to our portfolio.
In Oil Products, the premium fuels programme continued to be popular with customers, not least in the USA where we launched Shell V-Power which quickly became the best selling premium gasoline. We took a number of important steps during the year to build our presence in the key growth markets including an agreement with Sinopec to develop 500 retail stations in China.
Message to shareholders 3
Financial highlights
Total Dividenda
per ordinary share
€1.79
Earnings
net income
$18,183 millionb
| a | | A second interim dividend of€1.04 was made payable to shareholders in March 2005. |
| |
| b | | Based on accounting principles generally accepted in the US. |
We continued to make good progress in reshaping the portfolio through divestments of under-performing assets.
It was encouraging that, after several difficult years, the Chemicals business showed significant success with a profit of $930 million. The main opportunities for growth in Chemicals are in Asia Pacific and we made good progress on the construction of the Nanhai plant, which is on time and on budget. The plant is scheduled to be commissioned at the end of 2005 and will serve China’s growing domestic petrochemical market.
In Exploration & Production, earnings were strong and production, considering divestments, was broadly the same as in 2003. A number of new fields started production including Jintan in Malaysia, the Goldeneye field in the North Sea and Holstein in the Gulf of Mexico. Production from the West Salym field in Siberia also began, a year earlier than planned. We continued to invest in developments that will deliver long-term value and final investment decisions were taken on the Kashagan project in Kazakhstan and the Pohokura gas development in New Zealand. We made significant additions to our overall acreage positions and participated in 31 successful exploration wells.
We completed the review of our proved reserves and I am confident that we now have the people, processes and systems in place to ensure that our reserves are recorded in a rigorous and accurate way. In the next five years we will unlock 13 billion barrels of oil equivalent in new resources through the development of identified projects in our portfolio. We also decided to increase our spend for exploration for oil and gas.
Gas & Power had another successful year with a 9% increase in LNG volumes, further reinforcing our leading position in this growing market. We made significant progress in selling LNG from the Sakhalin II facility which will start production in 2007. The majority of the plant’s LNG has now been sold to customers in Japan, Korea, and in a highly significant deal, to North America. This will be the first time that Russian gas has been sold in the North American market.
We continued to invest for the future with the final investment decision being made for a sixth train of the LNG plant in Nigeria and the agreement to build a LNG plant in Qatar. Acknowledging that a key part of the growth in global energy demand will be met by natural gas, our strategy will continue to build on our leading positions in the LNG and gas to liquids markets.
In line with our business strategy we plan to increase total investment in the upstream to some $12 billion a year. This will ensure we are positioned to seize the opportunities in a growing energy market where oil and gas prices are likely to remain relatively high.
We also made progress in embedding a culture change throughout the Group. The Executive Committee has taken the lead in rolling out “Enterprise First” based on three principles: leadership, accountability and teamwork, starting with the senior management, and through them, across the Group. The adoption of these behaviours will be critical to our future success.
I was very honoured to be appointed the Group’s first Chief Executive in October 2004. I believe that our results demonstrate that Shell retains the fundamental strengths on which to build for the future. Our employees are one of those core strengths and I would like to thank them for their hard work and dedication, especially because 2004 was a difficult year for all employees.
While I know that there will be many challenges ahead, I am fully committed to driving the actions that will transform our business, meet your expectations and help us move ahead of the competition.
/s/ Jeroen van der Veer
Jeroen van der Veer
President of Royal Dutch
and Group Chief Executive
April 27, 2005
4 Royal Dutch Petroleum Company
Financial highlights
Group financial highlights:
Royal Dutch/Shell Group of Companies (US GAAP)
Information prior to 2004 for the Group has been restated where applicable to take account of the restatements as described in Note 2 to the Financial Statements of the Royal Dutch/Shell Group of Companies (see pages 52 to 55).
Parent Company financial highlights:
Royal Dutch Petroleum Company (Netherlands GAAP)
Information prior to 2004 has been restated for comparative purposes.
| a | | Basic earnings per share. |
| |
| b | | Includes interim dividend at€0.75 ($0.90) made payable in September 2004 and a second interim dividend at€1.04 ($1.33) made payable in March 2005. This together will constitute the total dividend for 2004, subject to finalisation by the General Meeting of Shareholders to be held on June 28, 2005. |
Throughout this report, a billion = 1,000 million.
GAAP = generally accepted accounting principles.
Unification of Royal Dutch and Shell Transport 5
Unification of Royal Dutch and Shell Transport
“Your Boards believe that these proposals are in the best interests of shareholders and the Directors unanimously recommend that Royal Dutch shareholders vote in favour of the resolutions to be proposed at the meeting on June 28, 2005 and accept the Royal Dutch offer.”
Aad Jacobs
Chairman of Royal Dutch
A review of the structure and governance of the Shell Group was carried out during 2004 by a steering group drawn from the Boards of the Group’s two parent companies, Royal Dutch Petroleum Company (Royal Dutch) and The “Shell” Transport and Trading Company, p.l.c. (Shell Transport). Chaired by Lord Kerr, its remit was to consider how best to simplify the structures of the companies, the Boards and management of the Group; how to improve the decision making processes and the personal accountability of management; and how to enhance leadership of the Group. The steering group heard the views of a large number of institutional shareholders and shareholder groups and considered a wide range of solutions, in the end opting for the simplest, cleanest and clearest. The steering group’s final recommendations received the unanimous support of the Boards and were announced on October 28, 2004.
The Boards’ proposal to shareholders is for the unification of the two existing parent companies, Royal Dutch and Shell Transport, under a single new parent company, Royal Dutch Shell plc.
Royal Dutch Shell is incorporated in England and Wales and has a single corporate headquarters and its tax domicile in the Netherlands. Royal Dutch Shell will have a single tier 15-person board with a majority of independent non-executive directors, headed by a non-executive chairman. A single Chief Executive leads the Executive Committee, whose members report to him.
The Boards believe that this proposal will strengthen the Group in a number of ways. It will provide a clearer and simpler structure with a single smaller board and a simplified senior management structure. The lines of accountability will be clearer with the Executive Committee reporting to the Chief Executive, who in turn will report to the unified single board and non-executive chairman, who are accountable to shareholders. Efficiencies will be achieved by reducing duplication and centralising functions in one headquarters in The Hague.
The Executive Committee has already been established and Jeroen van der Veer has been appointed as the Group’s first Chief Executive. He has full executive authority and a remit to drive the implementation of strategy, operational delivery and cultural change.
Royal Dutch is seeking shareholder approval of the proposed unification. The implementation agreement, which outlines how the proposals would be implemented, will be put to shareholders for approval at the General Meeting on June 28, 2005. Holders of Royal Dutch shares will be invited to tender their shares in exchange for shares of Royal Dutch Shell plc. More information on the proposals is available on www.shell.com/unification.
If the proposals are approved by shareholders of both Royal Dutch and Shell Transport, the conditions of the Royal Dutch offer are satisfied or, to the extent permitted, waived and the Shell Transport scheme of arrangement is approved by the High Court, implementation of the new structure is expected to take place in July 2005 (subject to the satisfaction or waiver of all other conditions).
 6 Royal Dutch/Shell Group of Companies
The Boards of the Parent Companies
As at April 2005

Royal Dutch Supervisory Board
Aad Jacobs
Chairman
Maarten van den Bergh
Wim Kok
Jonkheer Aarnout Loudon
Professor Hubert Markl
Christine Morin-Postel
Lawrence Ricciardi
Royal Dutch Board of Management
Jeroen van der Veer
President of Royal Dutch and
Group Chief Executive
Linda Cook
Rob Routs
Shell Transport Non-executive Directors
Lord Oxburgh
Chairman
Teymour Alireza
Sir Peter Burt
Dr Eileen Buttle
Luis Giusti
Nina Henderson
Sir Peter Job
Lord Kerr of Kinlochard
Sir Mark Moody-Stuart
Shell Transport Managing Directors
Malcolm Brinded
Peter Voser
Company Secretary, Royal Dutch
Michiel Brandjes
Joined the Group in 1980 as a Legal Adviser. General Attorney of the Company since May 2003. Appointed Company Secretary of Royal Dutch in February 2004.
Company Secretary, Shell Transport
Jyoti Munsiff
Joined the Group in 1969 as a Legal Adviser. Appointed Company Secretary of Shell Transport in 1993.
Key to Committee membership
| n | | Group Audit Committee |
| + | | Remuneration and Succession Review Committee |
| # | | Social Responsibility Committee |
| ø | | Shell Transport Nomination Committee |
The Boards of the Parent Companies are denoted as follows:
 Royal Dutch
 Shell Transport
The Boards of the Parent Companies 7
The members of the Supervisory Board and the Board of Management of Royal Dutch Petroleum Company and the Directors and Managing Directors of The “Shell” Transport and Trading Company, p.l.c. meet regularly during the year to discuss reviews and reports on the business and plans of the Royal Dutch/Shell Group.
 Aad Jacobsn
Chairman of the Supervisory Board of Royal Dutch
Born May 28, 1936. A Dutch national, appointed a member of the Supervisory Board in 1998 and Chairman in 2002. Due to retire in 2006. Previously Chairman of the Board of Management of ING Group. Chairman of the Supervisory Boards of Joh. Enschedé, Imtech and VNU; Vice-Chairman of the Supervisory Boards of Buhrmann and IHC Caland and a member of the Supervisory Board of ING Group.
 Lord Oxburgh KBE FRSø
Non-executive Chairman of Shell Transport
Born November 2, 1934. A British national, appointed a Director in 1996 and Non-executive Chairman in March 2004. Pursuant to the Articles of Association, he will retire in 2005 by virtue of age (70 years) and will stand for re-election at the 2005 AGM. Held a number of scientific and university appointments including Chief Scientific Advisor, Ministry of Defence and Rector, Imperial College of Science, Technology and Medicine.
 Jeroen van der Veer
President of Royal Dutch and Group Chief Executive
Born October 27, 1947. A Dutch national, appointed President of Royal Dutch in 2000, having been a Managing Director of Royal Dutch since 1997. Appointed Group Chief Executive in October 2004. Joined the Group in 1971 in refinery process design and held a number of senior management positions around the world. Also a member of the Supervisory Board of De Nederlandsche Bank (until September 2004) and a Non-executive Director of Unilever.
 Teymour Alireza#
Non-executive Director of Shell Transport
Born September 7, 1939. A Saudi Arabian national, appointed a Director in 1997. Latest date for retirement by rotation 2005. President and Deputy Chairman of The Alireza Group. Also Chairman of the National Pipe Company Ltd, Saudi Arabia and a Director of Arabian Gulf Investments (Far East) Ltd and of Riyad Bank Saudi Arabia. Member of the International Board of Trustees of the World Wide Fund for Nature.
 Maarten van den Bergh +#
Member of the Supervisory Board of Royal Dutch
Born April 19, 1942. A Dutch national, appointed a member of the Supervisory Board in 2000 and 2004. Due to retire in 2008. Managing Director of Royal Dutch from 1992 to 2000 and President from 1998 to 2000. Chairman of the Board of Directors of Lloyds TSB and a member of the Boards of Directors of BT and British Airways.
 Malcolm Brinded CBE FREng
Managing Director of Shell Transport and Executive Director
Born March 18, 1953. A British national, was appointed a Director and Managing Director of Shell Transport in March 2004. Latest date for retirement by rotation 2007. Previously a Managing Director of Royal Dutch since 2002. Joined the Group in 1974 and has held various positions around the world. Country Chair for Shell in the UK from 1999 to 2002 and Director of Planning, Environment and External Affairs at Shell International Ltd from 2001 to 2002.
 Sir Peter Burt FRSEø
Non-executive Director of Shell Transport
Born March 6, 1944. A British national, appointed a Director in 2002. Latest date for retirement by rotation 2006. Joined the Bank of Scotland in 1975 and rose to become Chief General Manager. Appointed Group Chief Executive and in 2001 became Executive Deputy Chairman of HBOS plc and Governor of the Bank of Scotland, retired in 2003. Chairman of Gleacher Shacklock Limited and a director of a number of charitable organisations. In February 2004 he was appointed Non-executive Chairman of ITV plc.
 Dr Eileen Buttle CBE#
Non-executive Director of Shell Transport
Born October 19, 1937. A British national, appointed a Director in 1998 following retirement from a career of public scientific appointments. Latest date for retirement by rotation 2007. Member of a number of UK Government and European Union advisory committees on environmental aspects of UK and European research and of Boards of Trustees of environmental non-governmental organisations.
 Linda Cook
Managing Director of Royal Dutch and Executive Director
Born June 4, 1958. A US national, appointed a Managing Director of Royal Dutch in August 2004. President and Chief Executive Officer and a member of the Board of Directors of Shell Canada Ltd from August 2003 to July 2004. Joined Shell Oil Company in Houston in 1980, and worked for Shell Oil Company in Houston and California in a variety of technical and managerial positions. Member of the Society of Petroleum Engineers and member of the Board of Directors of The Boeing Company.
 Luis Giustin
Non-executive Director of Shell Transport
Born November 27, 1944. A Venezuelan national, appointed a Director in 2000. Latest date for retirement by rotation 2007. Chairman and Chief Executive Officer of Petróleos de Venezuela, SA (PDVSA) from 1994 to 1999. Before joining PDVSA in 1976, worked for the Venezuelan Shell oil company. Member of the Board of Governors of the Centre for Global Energy Studies in London. Senior Advisor at the Center for Strategic and International Studies in Washington DC.
 Mary R. (Nina) Hendersonn+
Non-executive Director of Shell Transport
Born July 6, 1950. A US national, appointed a Director in 2001. Latest date for retirement by rotation 2007. Previously President of a major division and Corporate Vice-President of Bestfoods, a major US foods company, responsible for worldwide core business development. Non-executive Director of Pactiv Corporation, AXA Financial Inc., Del Monte Foods Company and Visiting Nurse Service of New York.
 Sir Peter Job KBE +ø
Non-executive Director of Shell Transport
Born July 13, 1941. A British national, appointed a Director in 2001. Latest date for retirement by rotation 2005. Previously Chief Executive of Reuters plc. Non-executive Director of Schroders plc, TIBCO Software Inc., Instinet Group Inc., and a member of the Supervisory Board of Deutsche Bank AG.
 Lord Kerr of Kinlochard GCMG +ø
Non-executive Director of Shell Transport
Born February 22, 1942. A British national, appointed a Director in 2002. Latest date for retirement by rotation 2006. A member of the UK Diplomatic Service from 1966 to 2002 (and its Head from 1997 to 2002), he was successively UK Permanent Representative to the EU, British Ambassador to the USA, Foreign Office Permanent Under Secretary of State and Secretary-General of the European Convention. Non-executive Director of Rio Tinto, Scottish American Investment Trust plc and Chairman of Court/Council of Imperial College. Trustee of the National Gallery and of the Rhodes Trust.
 Wim Kok#
Member of the Supervisory Board of Royal Dutch
Born September 29, 1938. A Dutch national, appointed a member of the Supervisory Board with effect from 2003. Due to retire by rotation in 2007. Chaired the Confederation of Dutch trade unions (FNV) before becoming a member of the Lower House of Parliament and parliamentary leader of the Partij van de Arbeid (Labour Party). Appointed Minister of Finance in 1989 and Prime Minister in 1994, serving for two periods of government up to July 2002. Member of the Supervisory Boards of ING Group, KLM and TPG.
 Jonkheer Aarnout Loudon +#
Member of the Supervisory Board of Royal Dutch
Born December 10, 1936. A Dutch national, appointed a member of the Supervisory Board in 1997. Due to retire in 2007. Member of the Board of Management of Akzo from 1977 to 1994 (Akzo Nobel as from 1994) and its Chairman from 1982 to 1994. Chairman of the Supervisory Boards of ABN AMRO Bank and Akzo Nobel and a member of the International Advisory Board of Allianz.
 Professor Hubert Markl +
Member of the Supervisory Board of Royal Dutch
Born August 17, 1938. A German national, appointed a member of the Supervisory Board in 2002. Due to retire by rotation in 2006. President of the Max-Planck-Gesellschaft from 1996 to 2002. Professor of Biology at the University of Constance from 1974 to 2003. Member of the Supervisory Boards of Aventis, BMW, and Münchener Rückversicherungs-Gesellschaft.
 Sir Mark Moody-Stuart KCMG#
Non-executive Director of Shell Transport
Born September 15, 1940. A British national, appointed a Non-executive Director in 2001. Latest date for retirement by rotation 2005. Appointed a Managing Director in 1991 and Chairman of Shell Transport from 1997 to 2001. Chairman of Anglo American plc and a Director of HSBC Holdings plc and Accenture. Member of the UN Secretary General’s Advisory Council for the Global Compact from 2001 to 2004.
 Christine Morin-Posteln
Member of the Supervisory Board of Royal Dutch
Born October 6, 1946. A French national, appointed a member of the Supervisory Board in July, 2004. Due to retire by rotation in 2008. Formerly Chief Executive of Société Générale de Belgique and Executive Vice-President and member of the Executive Committee of Suez. Member of the Board of Alcan Inc., 3i Group plc and Pilkington plc.
 Lawrence Ricciardin
Member of the Supervisory Board of Royal Dutch
Born August 14, 1940. A US national, appointed a member of the Supervisory Board in 2001. Due to retire by rotation in 2005. Previously President of RJR Nabisco, Inc. and subsequently Senior Vice-President and General Counsel of IBM. Senior Advisor to the law firm Jones Day and to Lazard Frères & Co. Member of the Board of Directors of The Reader’s Digest Association, Inc.
 Rob Routs
Managing Director of Royal Dutch and Executive Director
Born September 10, 1946. A Dutch national, appointed a Managing Director of Royal Dutch with effect from 2003. Joined the Group in 1971. Held various positions in the Netherlands, Canada and the USA. Previously President and Chief Executive Officer of Shell Oil Products USA and President of Shell Oil Company and Country Chair for Shell in the USA.
 Peter Voser
Managing Director of Shell Transport and Chief Financial Officer
Born August 29, 1958. A Swiss national, appointed a Managing Director of Shell Transport and Chief Financial Officer (CFO) in October 2004. Latest date for retirement by rotation 2008. In 2002, joined the Asea Brown Boveri (ABB) Group of Companies, based in Switzerland as CFO and Member of the Group Executive Committee. Also responsible for ABB’s Group IT and the Oil, Gas and Petrochemicals business. Originally joined the Royal Dutch/Shell Group in 1982 where he held a variety of finance and business roles in Switzerland, UK, Argentina and Chile, including CFO of Oil Products. Member of the Board of Directors of UBS AG.
8 Royal Dutch/Shell Group of Companies
What we do
Though we are probably best known to the public for our service stations and for finding and producing oil and natural gas, our activities result in many other products that play a role in people’s everyday lives.
Upstream
Shell’s upstream businesses explore for and extract oil and natural gas, and build and operate the infrastructure necessary to deliver these hydrocarbons to market. Activities also include marketing and trading of natural gas and electricity, as well as converting natural gas to liquids to provide cleaner fuels.
| | | | | |
Exploration & Production | | | | |
| Employees (thousand) | | | 17 | |
| Capital investment ($ million) | | | 9,868 | |
| |
Gas & Power | | | | |
| Employees (thousand) | | | 2 | |
| Capital investment ($ million) | | | 1,633 | |
| |
Downstream
Shell’s downstream businesses engage in refining crude oil into a range of products including fuels, lubricants and petrochemicals. The Group operates the largest single brand retail network, with over 46,000 service stations.
| | | | | |
Oil Products | | | | |
| Employees (thousand) | | | 76 | |
| Capital investment ($ million) | | | 2,466 | |
| |
Chemicals | | | | |
| Employees (thousand) | | | 8 | |
| Capital investment ($ million) | | | 705 | |
| |
Everyday products
Shell’s products play a part in people’s everyday lives:
| – | | fuels and lubricants used in cars, trucks, buses and planes; |
| |
| – | | natural gas, wind power and solar panels used to generate electricity for industrial and domestic use; and |
| |
| – | | base chemicals and intermediates used to manufacture household products, from detergents to CDs to toys. |
Renewables and Hydrogen
The activities covered in Shell’s new energy portfolio aim to build a commercially viable business based on hydrogen and renewable sources. Part of this portfolio includes producing wind and solar energy used to generate electricity and finding solutions to develop hydrogen as a cleaner and more efficient fuel.
| | | | | |
Corporate and Other | | | | |
| Employees (thousand) | | | 9 | |
| Capital investment ($ million) | | | 243 | |
| |


Find out more
www.shell.com/aboutshell
Where we are 9
Where we are
Shell is a global group of energy and petrochemical companies, operating in more than 140 countries and territories and employing more than 112,000 people.
10 Royal Dutch/Shell Group of Companies
Operational and Financial Review
The Royal Dutch/Shell Group of Companies consists of the upstream businesses of Exploration & Production and Gas & Power and the downstream businesses of Oil Products and Chemicals. We also have interests in other industry segments such as Renewables and Hydrogen.
Upstream and Downstream
An energy company’s upstream activities consist of the exploration, production and transportation of oil and natural gas. Its downstream activities consist of the refining, processing, distribution and marketing of that oil and gas.
Strategy
Over time, and across the commodity price cycle, the Group has achieved higher earnings, cash flow and returns on investment in the Exploration & Production business compared with the other businesses, and sees significant growth potential in demand for natural gas. The downstream businesses continue to offer attractive returns and growth potential in certain business lines and geographies, and provide useful balance in the portfolio to reduce exposure to commodity price movements. The Group’s core competencies include the application of technology, financial and project management skills to large oil and gas projects; the ability to develop and manage a diverse and international business portfolio; and the development of customer-focused businesses built around the strength of the Shell brand.
Our strategy is clear: more upstream, profitable downstream. We intend to focus on areas with high growth potential and where we can capture value from a higher oil and gas price environment. The strategy will be achieved through the following actions:
Reshaping our portfolio
We are strengthening our portfolio through an active programme of divestments and selective focused acquisitions. We have increased our capital expenditure to about $15 billion per year for the medium term, and in the period from 2004 to 2006 will be selling non-strategic or under-performing assets with proceeds targeted at $12 to $15 billion. Most of the increased capital expenditure will be in the upstream, where we expect higher returns. We are growing our upstream business in areas of resource opportunity such as Russia, the Middle East and West Africa, and our downstream business in markets such as Asia Pacific where we see significant potential for growth. We also intend to generate new income streams from
Regaining upstream strength:
Finding new resources
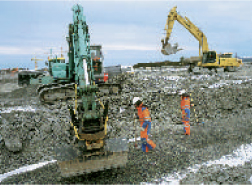
Construction work for the Ormen Lange field, Norway
Ormen Lange is Europe’s second largest offshore gas field. It is situated in an area where climatic and oceanographic conditions make it one of the most challenging developments in the world.
One of our key challenges is to improve our reserves replacement ratio and build our oil and gas resources for the future. Over the next five years, we will be investing $10 billion a year to provide the infrastructure and facilities to unlock 13 billion barrels of new resources.
This activity will include investment to sustain production from our existing positions in Europe, the Americas, Brunei, Malaysia, Oman and onshore Nigeria. We are also making significant investments in new positions such as offshore Nigeria and Kashagan in Kazakhstan. We will develop our strength further in integrated gas developments in LNG, GTL and in pipeline gas from developments such as Ormen Lange. Finally, we will increase our focus on new unconventional developments such as oil sands.
Total exploration and appraisal expenditure will rise to $1.5 billion a year, most of which will be spent on acquiring new acreage and drilling new prospects, with a focus on larger exploration opportunities in fewer countries. In 2004 we have made discoveries in 14 countries and have made positive appraisals of finds in the Gulf of Mexico, Kazakhstan and Malaysia. Over recent years we have increased the drilling of exploration prospects where we expect to find more than 100 million barrels. We drilled 12 of these prospects in 2003 and 15 in 2004 and we expect to drill 15 to 20 of these each year.
Find out more
www.shell.com/ep
Operational and Financial Review 11
technologies such as oil sands production and gas to liquids conversion; by providing oil and gas processing services; and from energy sources such as wind, hydrogen and solar power.
Raising our operational performance
Our strategy is underpinned by a focus on achieving the highest standards of performance and operational excellence across all of our business activities. A measure of operational performance for each business has been built into employee compensation systems, encouraging everyone in the organisation to make this a priority. Project delivery and execution has also become increasingly important as we take on larger and more complex projects. We are channelling more resources into this area and providing additional staff training. To deliver our strategy we must complete projects on time, on specification and on budget. Operational performance also means delivering competitive returns and strong cash generation.
Creating the culture and organisation to deliver
Through simplifying our structure and standardising processes across businesses and around the world, we are creating a more dynamic, responsive organisation. The three principles of leadership, accountability and teamwork form the basis of a culture change that is being embedded throughout the Group by the Executive Committee and other senior leaders. The appointment of a single Group Chief Executive to lead this process is proving to be an enabler for driving these changes.
“Improved performance will underpin all of our activities with the goal of achieving top quartile performance in all our businesses.”
Jeroen van der Veer
Group Chief Executive
More profitable downstream:
Securing the benefits of integration

A joint oil and chemicals site, Deer Park, Texas, USA
Having a facility that is fully integrated from raw materials to end products at one site means we can operate at lower cost to produce chemicals such as phenol, used to manufacture everyday goods like compact discs, computers and car headlights.
Shell’s downstream business refines some 4.4 million barrels a day of crude oil, produces some 20 million tonnes per year of chemical products and sells 145 billion litres of fuel a year at our 46,000 service stations.
This business operates in an increasingly competitive and challenging environment where our customers are becoming more discerning and where the pressures on costs are growing. If we are to meet our strategic objective of more profitable downstream we need to ensure that we manage those activities in a way that meets those challenges. That is why we have established a new global downstream organisation that integrates some activities of our Chemicals and Oil Products businesses.
There are obvious immediate practical benefits to this approach where refineries and petrochemicals plants are on the same sites and can share services. The new structure is also making it easier to adopt best practice quickly across all our operations wherever they are in the world. This helps to improve reliability and operational performance at our manufacturing sites. Equally, by standardising and simplifying business processes we can provide a more responsive and effective service to our customers.
We believe that the new downstream global strategy will reduce costs, improve the service we provide to our customers and help us to retain our position as a market leader in the downstream sector.
Find out more
www.shelldeerpark.com
12 Royal Dutch/Shell Group of Companies
Contributing to sustainable development
The Group first made a formal commitment to contribute to sustainable development in 1997. As an energy producer we know we have a fundamental role in developing ways of meeting the world’s growing energy needs in environmentally and socially responsible ways.

Part of building the Sinopec and Shell Coal Gasification Joint Venture in Hunan Province, China involved relocating a community. We worked with our partners and the community to ensure that those affected received quality new housing with livelihood opportunities.
We have worked hard to integrate sustainable development into all of the Group’s activities from project development, to the day-to-day operation of our facilities, as well as the services and products we supply to our customers. That means we listen and respond to the views of stakeholders and work in partnership with them. In this way we are developing and implementing ways of reducing the impact of our activities and ensuring we make a positive contribution to the communities in which we work.
Our commitment to sustainable development is also reflected in the work we do to develop cleaner fuels, improve the energy efficiency of our activities and apply new technology to manage and mitigate the effect of our operations on the environment.
We believe that this approach will become increasingly important as we face the challenge of meeting the world’s rapidly increasing demand for energy. We also believe that it will provide real competitive advantages that will be a key part in the future success and profitability of our business.
We report in more detail on this work in The Shell Report which can be found at www.shell.com/shellreport.
“Sustainable development is an important enabler of our business strategy and we are working to ensure it is integrated into all of our activities.”
Jeroen van der Veer
Group Chief Executive
Using the market to help the environment:
Leading the way in EU emissions trading
Shell believes that market mechanisms, such as emissions trading, are a powerful way of delivering reductions in polluting emissions and supporting the commercial development of renewable forms of energy.
We were one of the first businesses to develop trading mechanisms as a way of reducing the impact on the environment of our activity, setting up an environmental products trading business in 2001. That business now trades in a range of products across 15 different markets worldwide. We have gained valuable experience in these markets through participation in the UK Emissions Trading System and through advance trading in the European Emissions trading system. This system caps the greenhouse gas emissions of all member states and provides them with a defined quantity of carbon dioxide (CO2) emissions to allocate to companies operating in their country. These allocations can then be sold or bought by the companies themselves. By limiting the amount of CO2 emissions but allowing trading of allowances, a market will be created in which companies will have an incentive to reduce emissions.
Currently Shell has 28 facilities under the scheme, covering about a fifth of its worldwide operational emissions. We see the trading scheme as an effective way of providing further incentives for our energy efficiency programmes and we will continue to use our long experience in energy trading to play an active part in this new market.
Find out more
www.shell.com/envandsociety
Operational and Financial Review 13
Market overview
We use a variety of tools to monitor external factors and understand their implications. Factors such as oil and natural gas prices, costs of materials and services and demand for our products have a significant impact on the Group’s success.
World economy
Global economic output grew by 5% in 2004, the fastest rate of growth for two decades. This increase reflected strong growth in the USA, as well as increased activity in Europe, Japan and China. We are expecting growth to slow during 2005, reflecting more moderate expansion in the USA and European economies. China’s economy is expected to avoid the risk of overheating and see growth moderating to about 8% in 2005.
While the outlook for 2005 is positive, there are some risks that could affect the rate of global economic growth. These risks include the decline in the US dollar, a rise in protectionism, geopolitical uncertainties and financial turbulence in emerging markets such as China.
Oil and natural gas prices
Oil prices strengthened considerably in 2004 driven by significant growth in global demand, particularly from China and the USA; low US stocks of oil and natural gas; a decline in spare OPEC crude production capacity; geopolitical tensions and disruptions in supply caused by hurricanes in the Gulf of Mexico.
Oil demand growth in 2005 is expected to be lower than in 2004 but still above the average level for the past decade. Crude prices in 2005 will be influenced by the rate of global economic growth, particularly in the USA and China. Other factors affecting prices will include the pace of Iraqi oil export recovery and OPEC supply policy. Disruption to supply as a result of political and security issues would lead to price volatility and upward pressure on prices.
Henry Hub natural gas prices in the USA increased from $5.63 per million British thermal unit (Btu) in 2003 to $5.87 per million Btu in 2004. In 2005 Henry Hub prices are expected to reflect supply and demand in the USA where the development of domestic supply, demand levels from weather conditions and the rate of economic growth will be important. Prices in other markets are expected to remain largely linked to oil prices.
General industry factors
Demand for oil and natural gas is likely to continue to increase in both the short and medium-term, with particularly strong growth in emerging economies such as China and India. The International Energy Agency estimates that global energy demand could grow by almost 60% by 2030 and, within that overall total, oil demand could increase by up to 45% and natural gas demand could double. Meeting that increasing energy demand will require significant levels of new investment across all parts of the industry.
The refining and marketing environment is characterised by intensifying competition from industry consolidation and new entrants and changing and increasingly complex patterns of supply and demand. A fundamental shift in the pattern of demand is taking place as traditional markets in Western Europe and the USA see demand growth slowing while markets in Asia Pacific are experiencing significant growth. In 2004, a shortage of capacity relative to growing demand led to strong refining margins.
The business environment for chemicals has become more positive but remains cyclical. The central driver of growth in the business remains the overall pace of global economic activity.
14 Royal Dutch/Shell Group of Companies
Summary of Group results
2004 was a year of extremes, with the reserves recategorisation on one hand, and record net income and cash generation on the other.
“These strong results were, of course, largely the result of high oil and natural gas prices, but they also reflect our financial and operational strengths and the way we are improving our operational performance.”
Jeroen van der Veer
Group Chief Executive
| | | | | | | | | | | | | |
| | | | | | | | | | | $ million | |
| | | | | | | 2003 | | | 2002 | |
| Earnings | | 2004 | | | As restateda | | | As restateda | |
| |
| Income from continuing operations | | | 16,623 | | | | 12,033 | | | | 9,469 | |
| Income from discontinued operations | | | 1,560 | | | | 25 | | | | 187 | |
| Cumulative effect of a change in accounting principle | | | — | | | | 255 | | | | — | |
| |
Net income | | | 18,183 | | | | 12,313 | | | | 9,656 | |
| |
Change from previous year | | | +48 | % | | | +28 | % | | | -6 | % |
| |
| a | | See Note 2 to the Group Financial Statements. |
The Group’s net income in 2004 was $18.2 billion, an increase of 48% from 2003. These earnings reflect higher realised oil and gas prices in Exploration & Production and higher LNG volumes and prices in Gas & Power, as well as increases in refining margins and trading profits in Oil Products and higher volumes and margins in Chemicals.
Exploration & Production earnings were $9,315 million, 4% higher than in 2003. Production in 2004 was broadly unchanged compared to 2003, excluding the impact of divestments, price effects and hurricanes in the Gulf of Mexico. The decline in production in mature areas was largely offset by the start of production in new fields.
Hydrocarbon prices were higher in 2004 than in 2003 with Brent crude prices averaging $38.30 a barrel compared with $28.85 in 2003 and West Texas Intermediate prices averaging $41.50 a barrel in 2004 compared with $31.05 in 2003. Prices reflected the effect of strong US and Chinese demand, geopolitical uncertainty in a number of producer countries, disruptions to production as a result of the hurricanes in the Gulf of Mexico, and lower OPEC spare production capacity. The benefits of higher oil and gas prices were offset by lower hydrocarbon production, higher costs and depreciation, and an increase in the overall effective tax rate.
Earnings in Gas & Power were $2,155 million, 6% lower than in 2003. Earnings in 2003 included gains of $1,120 million mainly related to divestments (Ruhrgas), divestment gains in 2004 were $772 million. Earnings in 2004 reflected a 9% increase in LNG volumes and an 8% increase in LNG prices.
Oil Products earnings increased by 164% compared with 2003, to $7,537 million, benefiting significantly from higher refining margins and increased trading earnings. These results included divestment gains of $1,038 million and net charges of $403 million.
Earnings in Chemicals were $930 million, after a $565 million write-down in the carrying amount of Basell. This impairment followed the announcement in 2004 of a review of strategic alternatives regarding this joint venture. In 2003 a loss of $209 million for Chemicals included $478 million in asset restructuring and impairment charges. The improvement in earnings from 2003 was due to volume growth and higher margins.
The results discussed above include income from discontinued operations of $1,560 million in 2004, including gains on the disposal of such operations which are described in Note 4 to the Group Financial Statements.
Capital investment1in 2004 was $14.9 billion compared with $14.3 billion in 2003. Gross proceeds from divestments were $7.6 billion and cashflow from operating activities was $25.6 billion, an increase of 18% from 2003. At the end of 2004 the total debt ratio2was
| 1 | | Capital investment is capital expenditure, exploration expense and investments in associated companies. |
| |
| 2 | | The total debt ratio is defined as short-term plus long-term debt as a percentage of capital employed. Capital employed is Group net assets before deduction of minority interests, plus short-term and long-term debt. |
Operational and Financial Review 15
13.8% compared with 21.0% in 2003. Cash and cash equivalents were $8.5 billion compared with $2.0 billion in 2003.
It is expected that at least $10 billion, subject to exchange rates, will be returned to shareholders in dividends in 2005. The share buyback programme was relaunched on February 3, 2005.
In view of the inappropriate overstatement of unaudited proved reserves information, it was decided to restate the Financial Statements of the Group, and each of the Parent Companies, for prior periods (the Financial Restatements) to reflect the impact of the Reserves Restatements on those Financial Statements (as announced on April 19, 2004 and February 3, 2005).
See page 45 regarding “Investigation and report to the Group Audit Committee; management changes” for additional detail regarding the Group Audit Committee’s investigation arising out of the Reserves Restatements.
All Group financial information contained in this section is presented in accordance with accounting principles generally accepted in the United States. The restatements described above are reflected in prior period information where applicable.
Reserves
On January 9, 2004, the Group announced the removal of approximately 3.9 billion barrels of oil equivalent (boe) originally reported as proved reserves at December 31, 2002. As a result of further field level reviews concluded in April 2004, the Group determined to restate both the Financial Statements (the First Financial Restatement) and the unaudited disclosures contained in the supplementary information accompanying the Financial Statements (the First Reserves Restatement) to reflect the removal of 4.47 billion boe originally reported as proved reserves as at December 31, 2002.
On February 3, 2005 as a result of reservoir level reviews conducted from July to December 2004 of substantially all of the Group’s proved reserves volumes, the Group announced the removal of approximately 1.37 billion boe of oil and natural gas that were originally reported as proved reserves as at December 31, 2003. The Group has restated the unaudited oil and natural gas reserves disclosures contained in the supplementary information accompanying the Group Financial Statements (the Second Reserves Restatement) to remove these volumes at the earliest date on which they did not represent “proved reserves” within the applicable rules of the United States Securities and Exchange Commission (which in many cases is the date on which the volumes were initially booked as reserves). Approximately 57% of the de-booked volumes were previously booked as proved undeveloped reserves and 43% of the de-booked volumes were previously booked as proved developed reserves.
In view of the inappropriate overstatement of unaudited proved reserves information the Financial Statements of the Group and each of the Parent Companies for the year ended December 2003 and prior periods have been restated (the Second Financial Restatement) to reflect the impact of the Second Reserves Restatement on those Financial Statements.
For further information on the Reserves Restatements and Financial Restatements see Note 2 to the Group Financial Statements on pages 52 to 55.
16 Royal Dutch/Shell Group of Companies
Upstream: Exploration & Production
Performance for the year was strong in terms of cash generation and the progress made on new business milestones. However, the SEC proved reserves reduction and the low 2004 reserves replacement ratio were clearly disappointing.
Our Exploration & Production business searches for and recovers oil and natural gas around the world and is active in more than 36 countries. The majority of these activities are carried out in ventures with external partners.
“The E&P business retains a sound foundation of assets, positions and people. We have some way to go, but we will regain our competitive strength.”
Malcolm Brinded
Executive Director,
Exploration & Production

Malcolm Brinded
Executive Director, Exploration & Production
| | | | | | | | | | | | | |
| | | | | | | | | | | $ million | |
| | | | | | | 2003 | | | 2002 | |
| Earnings | | 2004 | | | As restateda | | | As restateda | |
| |
| Net proceeds (including inter-segment sales) | | | 39,644 | | | | 32,468 | | | | 26,320 | |
| Purchases (including change in inventories) | | | (2,658 | ) | | | (1,535 | ) | | | (1,050 | ) |
| Exploration | | | (1,823 | ) | | | (1,475 | ) | | | (1,052 | ) |
| Depreciation | | | (7,457 | ) | | | (7,316 | ) | | | (5,556 | ) |
| Operating expenses | | | (9,320 | ) | | | (7,174 | ) | | | (6,686 | ) |
| |
| Operating profit of Group companies | | | 18,386 | | | | 14,968 | | | | 11,976 | |
| Group share of operating profit of associated companies | | | 2,438 | | | | 1,857 | | | | 1,316 | |
| |
| Operating profit | | | 20,824 | | | | 16,825 | | | | 13,292 | |
| Other income/(expense) | | | 166 | | | | 72 | | | | 73 | |
| Taxation | | | (12,033 | ) | | | (8,307 | ) | | | (6,724 | ) |
| Income from continuing operations | | | 8,957 | | | | 8,590 | | | | 6,641 | |
| Income from discontinued operations, net of tax | | | 358 | | | | 78 | | | | 85 | |
| Cumulative effect of a change in accounting principle | | | — | | | | 255 | | | | — | |
| |
Segment earnings | | | 9,315 | | | | 8,923 | | | | 6,726 | |
| |
| a | | See Note 2 to the Group Financial Statements. |
Earnings
Segment earnings in 2004 were $9,315 million, 4% higher than in 2003. The benefits of higher oil and gas prices were partly offset by lower hydrocarbon production, higher costs and depreciation, and an increase in the overall effective tax rate.
Earnings included divestment gains of $740 million, of which $330 million relates to divestment gains from discontinued operations and relates to divestments of operations in Angola, Bangladesh, Egypt and Thailand. The balance of the $740 million relates to divestment gains in countries where there is continued investment in operations and which do not qualify as discontinued operations under US GAAP.
Compared with 2003, costs and depreciation were higher, mainly as a result of exchange rate movements and higher activity in our growth areas. The increase in the effective tax rate was mainly driven by the impact of higher hydrocarbon prices, an increase in the tax burden in Denmark and lower tax credits than in 2003.
Write-offs of exploration properties, rights and concessions in 2004 of some $300 million due to unsuccessful drilling were in line with similar write-offs in 2003. Earnings in 2003 included a credit of $255 million resulting from a change in accounting for asset retirement obligations.
Prices
Oil prices increased significantly in 2004 with Brent crude prices averaging $38.30 a barrel
Operational and Financial Review 17
in 2004 compared with $28.85 in 2003, while West Texas Intermediate averaged $41.50 a barrel compared with $31.05 in 2003. These increases reflected strong US and Chinese demand; geopolitical uncertainty in a number of producer countries; falling spare OPEC crude production capacity and the effect on oil stocks of the hurricanes in the Gulf of Mexico.
The Group’s overall realised oil prices were $35.61 a barrel up from $27.50 in 2003. In the USA realised oil prices averaged $36.15 a barrel compared with $27.24 a year earlier, and outside the USA realised prices averaged $35.53 compared with $27.54 in 2003. Realised oil prices differ from published crude oil prices because the quality, and therefore price, of actual crude oil produced differs from the quoted blends. In general, the Group produces crude oil of a lower quality than the quoted blends. The Group’s overall realised gas prices averaged $3.59 per thousand standard cubic feet compared with $3.30 in 2003.
Production
Total underlying hydrocarbon production (including oil sands) was 3% lower in 2004 than in 2003, at 3,772 thousand boe per day.1Production was affected by divestments of 76,000 boe per day, the impact of higher prices on our entitlements from production sharing contracts (PSCs) and hurricanes in the Gulf of Mexico. Excluding these effects, production was unchanged from 2003.
Oil production was 5% lower in 2004 than in 2003, mainly due to field declines in the USA, Norway and Oman, as well as lower production from fields in the UK. Production was also affected by lower entitlements from PSC operations as a result of higher oil prices.
Natural gas production was approximately the same as in 2003. Additional production from new fields, as well as high demand towards the end of the year, were offset by field declines in the USA and the UK, the effect of divestments, Gulf of Mexico hurricanes and lower entitlements from PSCs.
Various new fields started production during the year, including Jintan and Serai in Sarawak, Malaysia and Goldeneye, Scoter and Howe in the UK. In the Gulf of Mexico, production began at the Holstein, Llano and Glider fields. Oil production from the West Salym field in Russia also began, a year earlier than planned.
Building a long history:
A new discovery in Brunei

Sally Kapal, a production operator on Ampa 6.
Ampa 6 is one of Shell’s offshore production platforms in Brunei. Over 80% of the employees of Brunei Shell are Bruneian.
In 2004 Shell celebrated 75 years of production in Brunei. In a joint venture with the Brunei government, we operate 15 oil and natural gas fields, which makes Brunei the Group’s largest source of oil in the Asia Pacific region.
The mature fields in Brunei have been complemented by a potentially significant new discovery in what is known as the Seria North flank. The Seria field was first discovered in 1929 in a coastal area onshore and has been a significant producer of oil and natural gas for many years. The latest find is in an area three kilometres offshore that had not previously been drilled and, while more appraisal work needs to be done, current indications suggest that there could be up to 100 million barrels of oil in the whole of the Seria North flank.
The exploration of the area is making use of the most advanced technology including the use of what is known as a fish hook well. This type of well follows a U shape and means that the Seria North flank can be developed from a drilling rig onshore. This use of existing infrastructure and facilities is a very efficient way of extending and developing the life of the field.
Find out more
www.shell.com/ep
A number of fields increased production over the year. These included the Bijupirá-Salema field in Brazil, the Na Kika and Habanero fields in the USA, the EA field in Nigeria and the Athabasca Oil Sands Project in Canada. These increases, along with production from new fields, added 221,000 boe per day of production.
Capital investment and portfolio actions
Capital investment in 2004 of $8.8 billion (excluding the contribution of our minority partners in Sakhalin) was similar to 2003 and included exploration expense of $1.1 billion.
The final investment decision was taken for the Kashagan project in Kazakhstan (Group interest 16.7%) which is expected to start production in 2008. The development of the Pohokura gas field
| 1 | | Natural gas has been converted to crude oil equivalent using a factor of 5,800 standard cubic feet per barrel. |
18 Royal Dutch/Shell Group of Companies
Upstream: Exploration & Production
continued
in New Zealand (Group interest 48%) was agreed and the field is expected to produce its first gas in 2006. Planning permission was granted for the terminal that will receive gas from the offshore Corrib development in Ireland (Group interest 45%).
In Oman agreements were signed with the government to extend the terms of Petroleum Development Oman’s (PDO) concession until 2044. PDO (Group interest 34%) produces from 100 fields in the concession area. A Heads of Agreement was signed with the Libyan National Oil Company to establish a long-term strategic partnership that could open up opportunities to develop Libya’s gas and LNG business.
Plans were announced to increase bitumen production at the Athabasca Oil Sands Project (Group interest 47%) from 155,000 barrels a day capacity now to between 270,000 and 290,000 barrels a day by 2010. This will involve work to expand the Muskeg River mine and to add a third hydro-conversion unit to the Scotford Upgrader.
In 2004, important progress was made on the Sakhalin project in eastern Russia. The main concrete construction work of the base substructure for the Lunskoye offshore gas production platform was completed. In March 2005, plans were announced to re-route the offshore pipelines to help protect the endangered western grey whale. This massive project still targets start-up by the end of 2007 but there are significant cost pressures in what is one of the largest single foreign investment projects in Russia.
Divestments included the sale of upstream assets in Angola, Thailand, Bangladesh, Egypt and the UK. In addition, an agreement was reached to sell the Schooner and Ketch fields in the UK.
Operational and Financial Review 19

Aif K. Lillebo, Head of External Affairs, A/S Norske Shell, Ormen Lange construction, Norway
The giant Ormen Lange gas field in the Norwegian Sea could cover 20% of the UK’s gas requirements for up to 40 years.
Exploration
During 2004, we participated in 31 successful exploration wells. These included discoveries in Nigeria, Malaysia, Oman, the USA, the UK, the Netherlands, Brunei, Gabon, Egypt, Russia and Canada. All discoveries will now be appraised in order to establish the precise extent of the reserves they contain. Overall volumes found were less than in recent years, although the success rate continued to be good.
We made significant additions to our overall acreage positions with new exploration licences in the UK, Brazil, the Gulf of Mexico and Norway and additional oil sands acreage was acquired in Canada.
Reserves
As described under Note 2 to the Group Financial Statements on pages 52 to 55, this report, including the discussion below, gives effect to a restatement of proved oil and gas reserves. See “Supplementary information — Oil and Gas (unaudited)” on pages 92 to 103.
During 2004, a total of 212 million boe was added to proved developed and undeveloped reserves by Group companies (a reduction of 151 million barrels of oil and natural gas liquids and an increase of 2,108 thousand million standard cubic feet of natural gas), including 417 million boe from organic activities (which includes all activities other than purchases and sales of minerals in place). The net addition to proved developed and undeveloped reserves (calculated before production) consisted of reductions of 218 million boe from revisions and 205 million boe net from divestments and acquisitions, and additions of 15 million boe from improved recovery, and 620 million boe from extensions and discoveries. There was a net addition of 774 million boe to proved developed reserves and a net reduction of 562 million boe to proved undeveloped reserves.
During the same period, the Group share of proved developed and undeveloped reserve additions by associated companies was 39 million boe (20 million barrels of oil and natural gas liquids and 108 thousand million standard cubic feet of natural gas). The Group’s share of net additions to proved developed and undeveloped reserves by associated companies consisted of a reduction of 10 million boe from acquisitions and divestments, and additions of 2 million boe from revisions, 46 million boe from improved recovery and 1 million boe from extensions and discoveries. There was a net addition of 33 million boe to proved developed reserves and a net addition of 6 million boe to proved undeveloped reserves.
The most significant 2004 additions arose from new sales agreements covering gas volumes to
20 Royal Dutch/Shell Group of Companies
Upstream: Exploration & Production
continued
be produced from the Sakhalin development in Russia, a concession extension in Oman and taking the final investment decision for the Kashagan field in Kazakhstan.
The high level of year-end prices adversely affected proved reserve entitlements that are determined on the basis of production sharing arrangements, and the ability to book proved reserves associated with a heavy oil project in Canada (Peace River).
The gas volumes booked for the Sakhalin project following new sales agreements will be produced after the start of gas production from the Lunskoye field in Sakhalin, currently expected by the end of 2007. The oil volumes booked in the Kashagan field will be produced following field start-up in 2008. The volumes booked following the concession extension are expected to be produced after 2012. The rest of the reserves additions during 2004 are expected to be produced over time as development activities continue and/or production facilities are expanded or upgraded. The most significant movement from proved undeveloped to proved developed reserves is the result of installing compression facilities in the Groningen field, the Netherlands.
At December 31, 2004, after taking account of Group companies’ 2004 net additions to proved developed and undeveloped reserves of 212 million boe and production of 1,222 million boe, total proved reserves for Group companies of 10,231 million boe was 12% lower than at December 31, 2003. At the same date, after taking into account the Group’s share of associated companies’ net additions of 39 million boe and production of 126 million boe, the Group’s share of total proved developed and undeveloped reserves of associated companies of 1,652 million boe was 22% higher than December 31, 2003.
For the three years ended December 31, 2004, Group companies had net additions to proved reserves of 1,838 million boe and total production of 3,812 million boe, which resulted in a 19% decline in total proved reserves from December 31, 2001 to December 31, 2004. For the same period, the Group’s share of net additions to proved reserves by associated companies was 475 million boe and the Group’s share of production by these companies was 390 million boe, which resulted in a 40% increase in the Group’s share of proved reserves of associated companies. These changes in proved reserves include the effect of transferring a company in the Middle East from Group to associated company status as at December 31, 2004.
As at December 31, 2004, the Group’s proved developed and undeveloped reserves (excluding proved reserves of associated companies) were equivalent to 8.4 years of production (based on 2004 production).
The rate at which the Group (and associated companies) are developing proved reserves over a particular period may not necessarily be indicative of the rate at which hydrocarbon resources are being discovered for a number of reasons, including the technical nature of the definition of proved reserves and the differing time periods needed to develop proved reserves in different regions and under differing geologic, economic and regulatory conditions. However, the current level of reserves replacement by the Group and associated companies is clearly a concern and reflects the exploration strategy in the late 1990s and our relatively low investment in the post 1998 period. Exploration and appraisal has since been refocused and investment levels have increased. We consider it vital to improve reserves replacement in the coming years.
Outlook and strategy
Oil prices averaged about $10 a barrel higher in 2004 than in 2003. The high prices reflected high growth in global oil demand, most significantly from China and the USA. Upward pressure on prices also came from geopolitical tensions in the world, and the disruption to production caused by hurricanes in the Gulf of Mexico during the autumn and subsequent decline in the level of oil stocks in the USA.
We believe that crude prices in 2005 will be influenced by the pace of Iraqi oil export recovery, OPEC supply policy, the rate of global economic expansion, particularly in the USA and China, and the severity of the northern hemisphere winter. Natural gas prices in the USA will be affected by weather conditions and the rate of economic
Operational and Financial Review 21
growth. Prices in other markets are expected to remain linked to oil prices (see page 37 for more on prices).
We believe that growing global energy demand and the increased upstream investment required to meet that demand means that oil prices have shifted to a higher level for the medium term.
Our strategy is focused on improving our basic underlying strengths in operational performance and project delivery, and replenishing our portfolio. The Group will work towards this by adding new acreage, pursuing an aggressive exploration programme, investing in organic growth, opening up new positions and making selective focused acquisitions.
The strategy seeks to position the Group in four strategic areas: existing oil; new material oil; integrated gas and unconventional oil. To deliver this strategy, capital investment in Exploration & Production will be increased to some $10 billion a year (excluding investment by our minority partners in Sakhalin).
The Group will seek to sustain long-term production from existing assets where we have significant positions and can benefit from higher prices (such as in the USA and the UK). Investments in new material oil projects such as Kashagan in Kazakhstan and offshore Nigeria also form a key part of our strategy.
We believe that natural gas demand will continue to grow at a faster rate than oil demand, therefore we will look for more integrated gas positions to take advantage of this growth, extending our leadership position in LNG, and securing emerging opportunities in Gas to Liquids production. Our major presence across the value chain from exploration to the production and supply of natural gas enables us to maximise the value from projects such as Sakhalin. We intend to build on our existing strength in unconventional oil technology and the success of the Athabasca Oil Sands Project, and look for more of these opportunities.
We will continue to focus on reducing costs through improving management of the supply chain, and standardising processes globally. Ensuring improved and consistent project delivery is a key priority. We will be providing additional resources in Exploration & Production through redeployment and external recruitment.
Our production forecast for 2005 to 2006 remains in the range of 3.5 to 3.8 million boe a day. After that we expect production to grow and reach between 3.8 and 4.0 million boe a day by 2009. Our longer term production aspiration is some 4.5 to 5.0 million boe a day by 2014.
Divestments will be made in areas where we see little growth potential or strategic fit. We expect to deliver around $5 billion of upstream divestments and swaps between 2004 and 2006. Following the successful divestments of 2004, more emphasis will be given to swaps. Focused acquisitions will be considered, especially those which provide price and exploration upside, which fit the strategic themes we target and where we can see clear scope for long-term value growth.
Unlocking new resources in Russia:
Salym starts production

Construction of essential field infrastructure facilities, Salym, Russia
The Salym project is an important step forward in the development of Shell’s presence in Russia, a country of high strategic importance for the Group.
The Salym project in western Siberia is a $1 billion joint venture between Shell and the Russian oil company, OAO NK Evikohn and is Shell’s second largest investment in Russia (after Sakhalin). The rapid pace of the development of these complex fields shows the value that can be gained from combining Shell’s international experience with the long established expertise of the Siberian oil industry.
The Salym group of fields is estimated to have more than 800 million barrels of producible oil and natural gas resources and to have a life of over 30 years. They cover three areas, Upper Salym, West Salym and Vadelyp. Production started from the Upper Salym field in 2003, from West Salym, the biggest field, at the end of 2004, and will be followed by Vadelyp in 2006. The development will have 213 production wells across the three fields, from which production is expected to reach 120,000 barrels of oil a day and 20 million cubic feet of natural gas. All this work is being carried out to high environmental standards and in a way that seeks to make a positive contribution to the local community.
Exploration is continuing in the area and a new prospect has been found in the Upper Salym field. While testing is continuing to establish the extent and nature of this discovery, it is an encouraging find. This underlines that the area has major potential for further development and reinforces Shell’s role in the massive and still growing Russian upstream industry.
Find out more
www.shell.com/ep
22 Royal Dutch/Shell Group of Companies
Upstream: Gas & Power
The drivers behind the strong performance for 2004 are LNG volume growth, record realised prices and higher dividends from joint ventures.
Our Gas & Power business liquefies and transports natural gas, and develops natural gas markets and infrastructure including gas-fired power plants. It also markets and trades natural gas and electricity and converts natural gas to liquids to provide clean fuels. The majority of activities, in particular liquefied natural gas (LNG), are carried out by associated companies.
“My personal top three priorities for 2005 are improvement in safety performance, operational excellence and accessing material new natural gas positions for the Group.”
Linda Cook
Executive Director, Gas & Power

Linda Cook
Executive Director, Gas & Power
| | | | | | | | | | | | | |
| | | | | | | | | | | $ million | |
| | | | | | | 2003 | | | 2002 | |
| Earnings | | 2004 | | | As reclassifieda | | | As reclassifieda | |
| |
| Net proceeds (including inter-segment sales) | | | 10,814 | | | | 8,227 | | | | 4,874 | |
| Purchases (including change in inventories) | | | (8,700 | ) | | | (6,460 | ) | | | (3,754 | ) |
| Depreciation | | | (263 | ) | | | (116 | ) | | | (116 | ) |
| Operating expenses | | | (1,520 | ) | | | (1,141 | ) | | | (915 | ) |
| |
| Operating profit of Group companies | | | 331 | | | | 510 | | | | 89 | |
| Group share of operating profit of associated companies | | | 1,384 | | | | 871 | | | | 729 | |
| |
| Operating profit | | | 1,715 | | | | 1,381 | | | | 818 | |
| Other income/(expense) | | | 783 | | | | 1,343 | | | | 124 | |
| Taxation | | | (429 | ) | | | (454 | ) | | | (195 | ) |
| |
| Income from continuing operations | | | 2,069 | | | | 2,270 | | | | 747 | |
| Income from discontinued operations, net of tax | | | 86 | | | | 19 | | | | 27 | |
| |
Segment earnings | | | 2,155 | | | | 2,289 | | | | 774 | |
| |
| a | | See Note 2 to the Group Financial Statements. |
Earnings
Segment earnings in 2004 were $2,155 million, 6% lower than in 2003. Earnings in 2003 included gains of $1,120 million mainly related to divestments (Ruhrgas) whereas divestment gains in 2004 were $772 million. Excluding these gains, earnings in 2004 were up 18% on 2003. Earnings in 2004 reflected a 9% increase in LNG volumes resulting from strong Asia Pacific demand, Malaysia Tiga volume ramp-up, Australia North West Shelf train 4 start-up, the impact of full year operations of Nigeria LNG train 3, and an 8% increase in LNG prices. Gas to Liquids (GTL) income was also higher as a result of increased asset utilisation and margins from our Bintulu plant in Malaysia. Marketing and trading income was lower. Depreciation and operating expenses were higher, due to increased volumes and also due to the capitalisation of tolling arrangements on September 30, 2003. Compared to 2003, taxation charges were lower, mainly as a result of a higher proportion of earnings being subject to lower tax rates.
Total LNG sales volume (Group share) for the year increased by 9% to a record 10.15 million tonnes. This increase reflected the start of production from the fourth train in the North West Shelf Venture in Australia (Group interest 22%), increased production from the Malaysia Tiga project (Group interest 15%) and the effect of a full year’s production from the third train of Nigeria LNG (Group interest 26%).
Capital investment and portfolio actions
Capital investment in 2004 (including loans to associated companies) was $1,633 million, up 8% from $1,511 million in 2003.
Operational and Financial Review 23
The final investment decision was taken on Nigeria LNG train 6 (Group interest 26%) which is expected to start production in 2007 with a capacity of 4 million tonnes per annum (mtpa) of LNG and 1mtpa of natural gas liquids. This will give Nigeria LNG a total capacity of 22mtpa of LNG and 5mtpa of natural gas liquids.
In Australia, train 4 of the North West Shelf Venture started production, giving the venture a capacity of 12mtpa of LNG and 5mtpa of natural gas liquids.
Considerable progress was made in LNG marketing during 2004. New long-term contracts were signed for the Australian North West Shelf Venture to supply 0.6mtpa of LNG to the Chubu Electric Company of Japan and 0.5mtpa to the Kansai Electric Power Company from 2009. An agreement was also reached to supply 3.5mtpa for 25 years to China’s first LNG terminal in Guangdong. The Malaysia Tiga LNG project signed an agreement to supply 2.8mtpa to Kogas in Korea between 2005 and 2008.
Sakhalin Energy (Group interest 55%) finalised a number of agreements to supply LNG from the Sakhalin II project. A total of 5mtpa has now been sold under long-term contracts, including contracts to supply Japanese customers: Toho Gas (up to 0.3mtpa for 20 years); Tokyo Electric (1.5mtpa over 22 years); and Kyushu Electric Power Company (0.5mtpa over 20 years). In a pioneering agreement Shell Eastern Trading Ltd agreed to buy 37 million tonnes of LNG from Sakhalin over a 20-year period to supply a new import terminal in Baja California, Mexico. This will be the first time that Russian natural gas will be sold into the North American market.
Shell signed an agreement for 50% of the capacity of a new LNG import terminal in Baja California, Mexico. The terminal is designed to have a capacity of 7.5mtpa and is expected to be operational from 2008. The capacity will be used to supply LNG from Sakhalin and other Shell projects to the Mexican and US natural gas markets. Shell also leads a joint venture (Group interest 50%) that is building a 3.3mtpa LNG import terminal on Mexico’s east coast at Altamira (Group capacity 75%).
Another Shell joint venture announced plans to develop a 7.5mtpa offshore LNG import terminal in Long Island Sound in the USA (Group capacity 100%). If regulatory approval is given, the terminal, called Broadwater Energy, could start operation in 2010. Permits for the Gulf Landing offshore LNG import terminal in the Gulf of Mexico were received in early 2005 and the Hazira terminal in India is on target to receive its first cargo in 2005.
Shell also acquired an 11% indirect interest in the Qalhat LNG project in Oman with a total capacity of 3.3mtpa. First deliveries are expected in 2006.
An integrated development and production sharing agreement was signed between Shell and Qatar Petroleum to develop the Pearl GTL plant at Ras Laffan in Qatar, for which a final
Developing a global LNG business:
New projects in North America

Mateo Lopez, Managing Director, Altamira LNG Import Terminal
The construction at Altamira, on the east coast of Mexico, is only a part of Shell’s broader strategy to establish a network of LNG terminals in North America.
Global demand for liquefied natural gas (LNG) is expected to double during this decade. The increases will be seen in all major markets but the fastest growth will be in North America where Shell has several import projects at different stages of development that will build on our leading role in the global LNG business.
Shell is already supplying LNG to the US market through an existing regasification terminal at Cove Point in Maryland and supplies to Elba Island in Georgia are set to begin in 2006. We have proposals for new terminals at Gulf Landing in the Gulf of Mexico and for the Broadwater project in Long Island Sound.
In Mexico we are involved in two new LNG import terminals with the first at Altamira on the east coast. This will initially receive much of its natural gas from Shell’s LNG plant in Nigeria to supply the growing Mexican market and is expected to start operations towards the end of 2006. The second terminal, at Baja California on Mexico’s west coast, will be supplied through a historic development with LNG from the Sakhalin project in Russia. While Russia has been supplying natural gas to Europe for more than 30 years this is the first time that Russian natural gas has been sold into the North American market. The agreement will see 37 million tonnes of LNG being supplied from Sakhalin to Baja over a 20-year period. Longer-term supplies to Baja are also expected from Shell’s other LNG projects in Asia Pacific.
Find out more
www.shell.com/lng
24 Royal Dutch/Shell Group of Companies
Upstream: Gas & Power
continued
investment decision is expected to be taken in 2006. When fully operational, the plant will have the capacity to produce 140,000 barrels per day of GTL products including transport fuels. The fuels can be used in conventional diesel engines and produce very low emissions and therefore have the potential to reduce pollution in major cities. A number of GTL Fuel trials were carried out in London, California and Shanghai.
We sold a number of assets in 2004 with a net divestment gain of $772 million, including interests in Distrigas SA and Fluxys SA in Belgium, Verbundnetz Gas and Avalon AG in Germany and, in the USA, Tenaska Gateway Partners Ltd, part of our holding in Enterprise Products Partners L.P., and the majority of our gas transmission business in the Gulf of Mexico. InterGen (Group interest 68%) reduced its interests in a number of power plants across the world. In April 2005, Shell and Bechtel Enterprises Energy B.V. signed an agreement to sell InterGen N.V. including 10 of its power plants for $1.75 billion. Excluded from the sale are InterGen’s assets in the United States, Colombia, and Turkey, which will be reorganised prior to financial closing and retained by Shell and Bechtel pending further review. The transaction is expected to close mid-2005 and is subject to certain conditions and regulatory approvals. In November 2004, we announced a Heads of Agreement for restructuring the ownership in Nederlandse Gasunie, under which the Group’s interest in Gasunie’s gas transportation business will be transferred to the Dutch state. On completion of this transaction, expected in mid-2005 pending government approval, the Dutch state will make a total net payment of€2.78 billion (Group share 50%).
Supporting sustainable transport:
GTL comes to China

Shanghai, China
A cleaner alternative, GTL Fuels are being tested in large cities such as Shanghai.
The world’s largest cities face real challenges in improving local air quality. Shell’s Gas to Liquids (GTL) Fuel could play an important part in meeting that challenge. GTL is a liquid fuel produced from natural gas that can be used in vehicles with conventional diesel engines. GTL offers a practical and cost-effective way of reducing vehicle emissions.
Trials in cities around the world, using fuel produced at our plant in Bintulu, Malaysia, have already shown the benefits GTL Fuel can bring in reducing emissions. In addition, Shell is working with a number of vehicle manufacturers to develop advanced engines to improve both performance and reduce polluting emissions further.
Trials with GTL Fuel in 2004 included London buses, cars in Shanghai at the Michelin Bibendum Challenge, and trucks in California. At the Michelin Bibendum Challenge, the world’s premier clean vehicle event held in Shanghai in 2004, GTL Fuel was used in the latest Audi diesel cars. The international event includes a rally, exhibition and technical competition designed to test a range of new engine technologies and fuels. Emissions tests demonstrated that GTL Fuel reduced emissions of particulates, nitrogen oxide, carbon monoxide and hydrocarbons significantly below standard European diesel and resulted in Audi winning their class in the competition.
GTL Fuel blends are already on sale in a number of countries and, when the planned Pearl GTL project in Qatar starts production late in this decade, will be available on a larger scale across the world.
Find out more
www.shell.com/gtl
Operational and Financial Review 25

Sam Singh, master of a Shell G Class LNG carrier
Sam’s ship is just one of our specialised fleet that carries over nine million tonnes of LNG around the world every year.
Outlook and strategy
Demand for natural gas is expected to grow at a faster rate than that for oil in the medium term. There is likely to be particularly strong growth in global LNG demand which we expect to more than double over the next decade. We expect growth in the traditional European and Asian markets as well as from new markets in the USA, China and India. The overall natural gas business environment is likely to continue to become increasingly competitive. Continued focus on major project management and maintaining operational efficiency will be important in order to deliver low cost and reliable supplies to our customers.
One of the principal challenges and risks in the Gas & Power business is to ensure the development of assets in each part of the LNG value chain is aligned with market growth. Other challenges include ensuring that capital projects are delivered on schedule and within budget and that new business development opportunities are secured in an increasingly competitive environment.
Gas & Power’s strategy is to maintain its leadership position in the industry by accessing and creating value from new natural gas resources. Over the past five years Shell associate projects have delivered eight new LNG trains, overall under budget and on schedule. We have delivered an average of 13% growth per annum in the LNG volumes sold from 1999 to 2004.
We intend to invest selectively in power generation assets that help us deliver value from our natural gas positions. We expect that our investment in GTL will open up new markets for natural gas and the planned Pearl GTL project in Qatar has the potential to deliver considerable value.
Our investment decisions will be made in an integrated way that allows us to optimise our presence throughout the gas value chain. Examples of this approach include the Nigeria LNG plant expansions, partially enabled as a result of our success in gaining access to the key North American LNG market. The Sakhalin project similarly benefits from our ability to secure customers both in the traditional Asian markets and in North America through our Baja California terminal capacity.
We intend to increase capital investment in Gas & Power over the coming years. We expect our equity share of LNG capacity to increase by an average of 14% per year from 2003 through 2008. This increase is expected to come from projects already under construction including those in Oman, Nigeria and Sakhalin. We also believe there will be significant potential for further growth from additional expansions and new facilities beyond this period.
26 Royal Dutch/Shell Group of Companies
Downstream: Oil Products
Underlying the 2004 results was improved asset utilisation which enabled the business to capture more benefits of high margins.
Our Oil Products business markets fuels and lubricants for domestic and industrial use and for the range of transport modes from road to shipping and aviation. It also refines, supplies, trades and ships crude oil and petroleum products.
“Our priorities for 2005 include strengthening our position for the long term in those markets that offer good profitability and potential for growth, and developing distinctive customer value propositions. The new global organisation is an important enabler in these activities.”
Rob Routs
Executive Director,
Oil Products and Chemicals

Rob Routs
Executive Director, Oil Products and Chemicals
| | | | | | | | | | | | | |
| | | | | | | | | | | $ million | |
| | | | | | | 2003 | | | 2002 | |
| Earnings | | 2004 | | | As reclassifieda | | | As reclassifieda | |
| |
| Net proceeds (including inter-segment sales) | | | 218,930 | | | | 162,491 | | | | 135,761 | |
| Purchases (including change in inventories) | | | (192,802 | ) | | | (142,432 | ) | | | (118,446 | ) |
| |
| Gross margin | | | 26,128 | | | | 20,059 | | | | 17,315 | |
| Depreciation | | | (3,056 | ) | | | (2,717 | ) | | | (2,262 | ) |
| Operating expenses | | | (15,920 | ) | | | (14,167 | ) | | | (12,044 | ) |
| |
| Operating profit of Group companies | | | 7,152 | | | | 3,175 | | | | 3,009 | |
| Group share of operating profit of associated companies | | | 1,749 | | | | 910 | | | | 554 | |
| |
| Operating profit | | | 8,901 | | | | 4,085 | | | | 3,563 | |
| Other income/(expense) | | | 71 | | | | (62 | ) | | | (57 | ) |
| Taxation | | | (2,691 | ) | | | (1,202 | ) | | | (1,021 | ) |
| |
| Income from continuing operations | | | 6,281 | | | | 2,821 | | | | 2,485 | |
| Income from discontinued operations, net of tax | | | 1,256 | | | | 39 | | | | 142 | |
| |
Segment earnings | | | 7,537 | | | | 2,860 | | | | 2,627 | |
| |
| a | | See Note 2 to the Group Financial Statements. |
Earnings
Segment earnings were $7,537 million, an increase of 164% over 2003. Earnings from continuing operations were $6,281 million compared to $2,821 million in 2003 and reflected higher refining margins and increased trading earnings. Earnings from continuing operations included net gains of $157 million from portfolio actions and $403 million of charges related to the impairment of a number of refining and retail assets as well as various tax, legal, severance and environmental costs.
Earnings from discontinued operations in 2004 were $1,256 million. This included net gains of $881 million relating to divestments in Latin America, Europe and the USA, in line with the Group’s strategy of increasing profitability through greater focus on core assets.
Gross margin (calculated as net proceeds minus purchases) increased by $6,069 million, primarily driven by strong refining margins in all regions. Marketing margins increased outside of the USA while within the USA margins declined. Higher refining margins were a result of exceptional demand for oil products in the USA and China, lower oil stocks in the USA and lower refinery availability in the Atlantic basin. The disruption caused to supplies by hurricanes in the Gulf of Mexico also affected prices during the autumn.
Operating expenses were $1,753 million higher in 2004, an increase of 12% over 2003.
Operational and Financial Review 27
Achieving operational excellence:
Effective refinery maintenance

Joanne Mase, apprentice process operator, Stanlow Refinery, UK
Stanlow employs some 800 people, processes 12 million tonnes of crude a year, and manufactures a range of oil products including about one-sixth of Britain’s petrol.
Improving performance at refineries and chemicals plants is key to our success, especially in a high oil price environment. This means both reducing the unplanned interruptions to operations and ensuring that planned maintenance is carried out on schedule.
One initiative called Global Asset Management Excellence (GAME) is helping to tackle these issues by focusing on improving the reliability of equipment by standardising processes with a focus on reducing costly equipment failures. That means that by 2008, when the programme is in place across the world, the processes used in a refinery in Europe will be the same as those in the USA. This standardisation and reduction in variability will help us to address problems more quickly and to manage operations more efficiently.
This is one element in a range of work that is being undertaken to bring all our refineries up to the highest standards of operational performance. The benefits of this approach have already been seen at the Stanlow refinery in northwest England. Every three years a major project, known as a turnaround, takes place to inspect, maintain and upgrade the equipment at the refinery. The most recent turnaround took place in early 2004 and was a huge undertaking, costing £18 million and involving 1,500 contractors. The project was extremely successful, meeting its environmental, safety and quality targets, and completing operations in a record time, allowing the plant to restart production on schedule.
Find out more
www.shell.com/stanlow
28 Royal Dutch/Shell Group of Companies
Downstream: Oil Products
continued
Approximately 90% of the increase in operating expenses was related to businesses outside the USA. Higher operating expenses were offset by strong margins. The weakening US dollar contributed 59% of the increase in operating expenses since a large percentage of Oil Products operating expense is incurred outside the USA. The remainder of the increase in operating expenses reflects higher costs associated with refinery maintenance activity, portfolio restructuring, pension funding and provisions for environmental and legal settlements. Operating expenses as a percentage of gross margin decreased from 71% in 2003, to 61% in 2004.
There was increased income from associated companies of $839 million due to higher refining margins in all regions.
Depreciation in 2004 increased by $339 million compared to 2003 primarily due to higher impairment provisions on certain refining and marketing assets. The impairment of the refining assets mainly reflects expected weak local market conditions and prices for the refineries’ products. The marketing assets are held for sale and were written down to expected net realisable value.
Potential risks to future earnings centre around the level of refining and marketing margins. Earnings will also be impacted by the level of refinery availability.
Capital investment and portfolio actions
Capital investment in 2004 was $2.5 billion compared with $2.4 billion in 2003. The main areas of investment were in manufacturing and retail and included spending on refinery maintenance and projects and investment to maintain and upgrade retail networks.
The rebranding of the retail network in the USA and Europe continued. In the USA, more than 12,000 sites have either been rebranded from Texaco to Shell or upgraded to the new Shell image and style. Shell is the leading brand of gasoline in the USA, having a greater market share and higher volume of sales than any other brand.
The launch of V-Power in the USA, which is now the best-selling premium gasoline in the USA, is part of the continued work to extend our presence in the premium fuels market. A V-Power diesel blend, with a Gas to Liquids component, was successfully launched in Germany and the Netherlands.
Looking to growth markets:
New developments in Asia

Shell Service Station, Subang Jaya, Malaysia
Increasing our presence in the Asian market is key to the success of the downstream strategy.
In the highly competitive oil products market it is especially important that we increase our presence in selected markets which are seeing growth in demand and reduce our assets in markets where returns are less attractive.
As a result, we are expanding our presence in Asian markets which look set to see significant economic growth in the years ahead. This will build on the success we have already had in establishing new positions in this region. These include the agreement we have signed with Sinopec to provide 500 retail stations in Jiangsu province which will give us a presence in China’s rapidly growing transport fuels sector. Other investments are developing new downstream activity elsewhere in the region. We have gained the first foreign retail marketing licence in India and the first retail service station opened in Bangalore in late 2004. In Indonesia, another market with enormous potential, we have been awarded a licence to develop a fuels marketing and retailing business.
At the same time we have sold assets in Spain, Portugal and South America where analysis of the particular markets showed that returns were less attractive and the potential for growth was limited.
Find out more
www.shell.com/china-en
Operational and Financial Review 29

Clive McDonald, Shell Fuels Research Team
Creating high performance grades that drive Formula One has enabled the development of more efficient engine technology, which also means less CO2 emissions.
In line with our strategy of reshaping our portfolio and focusing on selected markets, several divestments were made. The sale of the retail and commercial assets in Portugal and of the assets onshore in Spain were completed. In the first quarter of 2005 we completed the sale of the offshore assets in Spain. We will continue to operate in Spain through our LPG, Lubricants, Aviation and Marine businesses. A portion of the Group’s ownership of Showa Shell in Japan was sold, reducing the Group’s interest from 50% to approximately 40%. The sale of the Group’s interest in the Rayong refinery in Thailand was completed. The Delaware City refinery and the Great Plains and Midwest product pipelines in the USA were sold. We announced that we were considering options for the LPG business including the possibility of a sale.
Outlook and strategy
We expect refining margins in 2005 to be influenced strongly by the pace of global economic expansion, particularly in China and the USA, the impact of high oil prices on product demand and the degree of severity of the northern hemisphere winter. Marketing margins will continue to be influenced by oil price volatility and exchange rates and will be subject to intense competition.
A key element in the strategy is the creation of one downstream organisation that integrates the Oil Products and Chemicals businesses. We believe this will help to optimise our refining and chemicals facilities, standardise our processes and improve services to customers. At the same time, work will continue over the next two years to sell or improve under-performing assets. This will be underpinned by a focus on improving operational performance and delivering cost reductions.
We intend to continue to improve our delivery to customers through more streamlined business processes for ordering, pricing and payment. We will also look to build on the success of differentiated fuels. These fuels have been an important driver of value in the business, with differentiated fuels, such as V-Power, now available in more than 40 markets around the world.
We believe the downstream integration will provide a platform for future growth in selected markets where we see the greatest opportunities. In particular, we intend to focus on Asian markets where there is significant potential for growth. By the end of the decade we expect to significantly increase our capital employed in Asia.
30 Royal Dutch/Shell Group of Companies
Downstream: Chemicals
The 2004 results were a great achievement for Chemicals. Highlights included improved operating rates, strong cash generation and strengthening the portfolio with new investments.
Our Chemicals business produces and sells petrochemicals to industrial customers globally. Chemicals’ products are widely used in plastics, coatings and detergents, which in turn are used in products such as fibres and textiles, thermal and electrical insulation, medical equipment and sterile supplies, computers, lighter and more efficient vehicles, paints and biodegradable detergents.
Earnings
| | | | | | | | | | | | | |
| | | | | | | | | | | $ million | |
| | | 2004 | | | 2003 | | | 2002 | |
| |
| Net proceeds (including inter-segment sales) | | | 29,497 | | | | 20,817 | | | | 15,207 | |
| Purchases (including change in inventories) | | | (24,363 | ) | | | (16,952 | ) | | | (12,035 | ) |
| Depreciation | | | (544 | ) | | | (678 | ) | | | (401 | ) |
| Other cost of sales | | | (2,452 | ) | | | (2,234 | ) | | | (1,518 | ) |
| Operating expenses | | | (893 | ) | | | (1,065 | ) | | | (815 | ) |
| |
| Operating profit of Group companies | | | 1,245 | | | | (112 | ) | | | 438 | |
| Group share of operating profit of associated companies | | | 94 | | | | (165 | ) | | | 213 | |
| |
| Operating profit | | | 1,339 | | | | (277 | ) | | | 651 | |
| Other income/(expense) | | | (15 | ) | | | (43 | ) | | | (13 | ) |
| Taxation | | | (394 | ) | | | 111 | | | | (73 | ) |
| |
Segment earnings | | | 930 | | | | (209 | ) | | | 565 | |
| |
Earnings
Segment earnings in 2004 showed a profit of $930 million after a charge of $565 million for impairment in the Basell investment (recorded within Group share of operating profit of associated companies). This compares with a loss of $209 million in 2003, when earnings were affected by charges of $478 million for asset restructuring and impairment and a net charge of $71 million relating to environmental and litigation provisions and a loss on the sale of a minority interest in a divested business, which was partly offset by various tax credits.
The improvement in earnings in 2004 was attributable to improved industry conditions leading to higher operating rates and more favourable margins. Sales volumes of chemical products increased by 5% reflecting higher demand and additional capacity. Asset utilisation was 3% higher on average, reflecting higher operating rates in the second and third quarters of 2004, although in both the first and the fourth quarters cracker availability in Europe and in the USA was reduced by both planned and unplanned downtime. The improvement in operating rates was driven primarily by the recovery in the petrochemicals industry which led to strong demand growth. The more favourable margins (defined as proceeds less cost of feedstock, energy and distribution per tonne of product sold) were mainly due to a 35% increase in unit proceeds from higher price realisations, which outweighed the increased cost of chemical feed stocks.
The impairment of Basell followed the announcement in 2004 of a review of strategic alternatives regarding this joint venture, and the reduction of the carrying amount of the Group’s investment in Basell at December 31, 2004 to its currently expected net realisable value.
Capital investment and portfolio actions
Capital investment, including new loans to associated companies, was $705 million in 2004 compared with $599 million in 2003.
We continued to meet our financing commitments towards the ongoing construction at the Nanhai petrochemicals plant in southern China (Group interest 50%). The project is on schedule to be commissioned towards the end of 2005. We also announced the next phase in the development of our chemicals facilities in Singapore, involving detailed design and engineering work. Subject to the final investment decision, the project will include modifications and additions to the existing Bukom refinery and a new world-scale ethylene cracker.
In North America, production started at two joint venture manufacturing facilities. PTT PolyCanada started production of Corterra, a product used in the manufacture of textiles and carpets. The production of butadiene, used in the manufacture of rubber and plastics products,
Operational and Financial Review 31
| a | | Excluding volumes from chemical feedstock trading and non-chemical by-products. |
started at the Sabina Petrochemicals plant in the USA. The cracker expansion at Deer Park in Texas, which added 550,000 tonnes of ethylene capacity to the existing plant, became operational at the end of the first quarter of 2004. In the Netherlands, a new ethylene oxide reactor began operations and the ethylene glycol plant was expanded, increasing production by over 20%.
Shell and BASF announced the review of strategic options for the Basell joint venture. Options being considered include the sale of the companies’ stakes or an equity market transaction. The global catalyst regeneration business was divested and operations at CS Metals ceased.
Outlook and strategy
2004 saw a recovery in the petrochemicals industry, with generally strong demand growth improving capacity utilisation and margins despite high crude and US gas prices. In the short term, capacity to supply increased demand is expected to remain low until new capacity becomes available. The principal medium-term risks facing the business are the levels and volatility of feedstock costs and the balance between demand, affected by the pace of economic growth, and supply, affected by industry capacity and operating rates.
Asia, and in particular China, continues to be one of the strongest drivers of petrochemical demand growth. Over the next two years, the petrochemicals industry in China will see production commence at three large new petrochemicals plants, including Shell’s Nanhai joint venture project. In the Middle East, the petrochemicals industry has a number of new investments that are being developed and that are expected to start production towards the end of the decade.
We will continue to focus on our cracker and first-line derivatives portfolio and delivering bulk petrochemicals to large industrial customers. The integration of the Oil Products and Chemicals businesses is expected to provide further opportunities to achieve cost efficiencies from shared services and common manufacturing sites, and from improved use of hydrocarbon resources on integrated sites. In the short term, our strategic priorities will be the successful completion and start-up of the Nanhai petrochemicals complex, and the strengthening of our asset base in North America and Europe. In the medium term, we continue to develop further growth options to focus our investment on growth markets.
Meeting the growing demand in China:
Nanhai nears completion

Dramatic growth in use of consumer products
Increasing disposable incomes mean that the Chinese are buying more consumer products such as mobile phones, computers and televisions.
China is one of the fastest growing economies in the world, with most forecasters predicting growth in GDP in excess of 8% for the next few years. With a population of 1.3 billion, that growth in prosperity is opening up a huge new market for a whole range of consumer products.
This includes products made by the petrochemicals industry which range from plastics to paints and from carpets to cars. At the moment much of China’s demand for petrochemicals is met from imports. From 2006, the Nanhai complex at Daya Bay, Guangdong province, in which Shell has a 50% share, will have the capacity to produce 2.3 million tonnes of chemicals a year to supply that domestic market.
China currently uses about 1kg per head of plastics products a year compared to 40kg in Western Europe. The location of the Nanhai complex in Guangdong, the province where economic growth and petrochemical demand are predicted to grow most rapidly, means it is ideally placed to supply customers in South China.
The plant will have the capacity to produce a range of different chemicals, including 800,000 tonnes a year of ethylene which is used to make a wide range of derivatives products, for which demand in China is forecast to more than double by 2010. The complex will also produce styrene, which is used in the production of materials such as polystyrene; propylene oxide that is used in foam and adhesives; mono-ethylene glycol that is used in the textile industry; and polyethylene and polypropylene that can be used in a range of plastics, film and packaging applications.
Find out more
www.shell.com/chemicals
32 Royal Dutch/Shell Group of Companies
Other industry segments and Corporate
Other industry segments include Renewables and Hydrogen. Renewables works to develop businesses based on renewable sources of energy, including wind and solar power. Hydrogen works to develop business opportunities in hydrogen and fuel cell technology.
Earnings
| | | | | | | | | | | | | | | | | | | | | | | | | |
| | | | | | | | | | | | | | | | | | | | | | | $ million | |
| | | | | | | | | | | 2003 | | | 2002 | |
| | | 2004 | | | As reclassifieda | | | As reclassifieda | |
| | | Other | | | | | | | Other | | | | | | | Other | | | | |
| | | industry | | | | | | | industry | | | | | | | industry | | | | |
| | | segments | | | Corporate | | | segments | | | Corporate | | | segments | | | Corporate | |
| |
| Income from continuing operations | | | (141 | ) | | | (847 | ) | | | (267 | ) | | | (819 | ) | | | (110 | ) | | | (684 | ) |
| Income from discontinued operations, net of tax | | | — | | | | (52 | ) | | | — | | | | (98 | ) | | | — | | | | (67 | ) |
| |
Segment earnings | | | (141 | ) | | | (899 | ) | | | (267 | ) | | | (917 | ) | | | (110 | ) | | | (751 | ) |
| |
| a | | See Note 2 to the Group Financial Statements. |
Earnings
Other industry segments consist of the combined results of the Group’s Renewables, Hydrogen and Consumer businesses. Segment earnings for 2004 showed a loss of $141 million compared with a loss of $267 million in 2003, which included the effect of a Shell Solar goodwill impairment of $127 million. The Consumer business was integrated into the Oil Products business during 2004.
Corporate is a non-operating segment consisting primarily of interest expense on Group debt and certain other non-allocated costs of the Group. Corporate net costs were $899 million compared with $917 million in 2003.
Renewables and Hydrogen
Good progress was made in sales of solar products where volumes increased by 50% driven mainly by a strong German market. Shell Solar continued to develop technological improvements to increase the efficiency of solar panels. These included the launch of a new range of solar products, Shell PowerMax, which offers improved efficiency for off-grid applications. While Shell maintains its view on the long-term potential of solar energy as one of the more promising technologies in the field of renewable energy, the industry faced persistent production overcapacity, strong competition and uncertain market circumstances.
Expanding the solar business:
The world’s largest solar park

Solar power station, Leipzig, Germany
The solar power station will save some 3,700 tonnes of carbon dioxide emissions annually.
Shell Solar is one of the world’s leading solar businesses, with operations in 75 countries around the world. It has supplied solar solutions in projects ranging from providing panels to individual households in rural areas, to large scale installations that can supply power to the national electricity grids.
In 2004, Shell Solar, along with its partners GEOSOL and WestFonds, opened the world’s largest solar park at Leipzig in Germany. This five megawatt power plant is connected to the national grid and will produce enough electricity to supply about 1,800 homes. The plant consists of 33,500 solar modules, or panels, on a 21 hectare site on land reclaimed from a former coal mine. It is estimated that the power station will reduce carbon dioxide emissions by 3,700 tonnes a year.
These projects are an important way of improving the efficiency and cost effectiveness of solar operations and so in turn help to increase the demand for solar power.
Find out more
www.shell.com/solar
Operational and Financial Review 33
The Wind business in the USA saw the Colorado Green and Brazos wind parks coming into full production. The White Deer wind park was put into a joint venture with Entergy, and partial shareholdings in the Whitewater Hill, Cabazon Pass and Rock Rover assets were sold, as had been previously planned. Wind production was affected by lower than expected wind speeds and lower availability mainly due to transmission upgrading at Whitewater Hill and Cabazon Pass.
Shell Hydrogen continued to work with governments and vehicle manufacturers to develop projects to support the viability of hydrogen as a transport fuel. These included the opening of an integrated hydrogen station in Washington, DC and the launch of the hydrogen “lighthouse project” concept. These are large-scale demonstration projects to create mini-networks of hydrogen fuelling stations in specific cities or regions, the first of which will be developed in New York jointly with General Motors.
Developing an infrastructure for hydrogen:
Hydrogen station opens in Washington, DC

Hydrogen fuel cell car in Washington, DC
Fuel cell technology uses oxygen and hydrogen to produce energy offering a cleaner alternative to conventional fuels.
Hydrogen fuel cell vehicles can be found on the road in a number of cities around the world as part of partnership projects supported by Shell Hydrogen.
These include a project in Washington, DC where Shell Hydrogen and General Motors are running a trial of six fuel cell vehicles to demonstrate how hydrogen cars operate in everyday road conditions. These vehicles fill up alongside conventional cars at a service station in the city. This is the world’s first integrated station and by placing the hydrogen dispenser within a conventional fuel station, the project highlights the progress that has been made in providing a fuelling infrastructure for hydrogen vehicles.
By bringing together energy companies, governments and car manufacturers in these kinds of projects Shell Hydrogen believes we can help to accelerate the development of hydrogen as a commercially viable transport fuel. That work is now being extended in what is known as a ‘lighthouse project’ in New York that will develop a network of hydrogen fuelling stations to supply a fleet of hydrogen fuel cell cars.
Find out more
www.shell.com/hydrogen
34 Royal Dutch/Shell Group of Companies
Liquidity and capital resources
Statement of cash flows
Cash flow provided by operating activities reached a record level of $25.6 billion in 2004 compared with $21.7 billion in 2003. Net income increased to $18.2 billion in 2004 from $12.3 billion in 2003, reflecting higher realised prices in Exploration & Production and higher refining margins in Oil Products. Additionally, $7.6 billion of cash flows were realised in 2004 through sales of assets (2003: $4.5 billion). Cash flow in 2004 has mainly been deployed for capital expenditure ($12.7 billion), debt repayment ($4.8 billion) and dividends paid to Parent Companies ($8.5 billion). In 2004, dividends to the Parent Companies included amounts required to fund share buybacks. Royal Dutch and Shell Transport paid dividends to their shareholders totalling $7.6 billion (2003: $6.4 billion; 2002: $5.5 billion) as well as executing $0.8 billion of share buybacks (excluding the purchase of shares by Group companies to cover stock option obligations).
Outlook
In general, the most significant factors affecting year-to-year comparisons of cash flow provided by operating activities are changes in realised prices for crude oil and natural gas, crude oil and natural gas production levels and refining and marketing margins. These factors are also the most significant affecting net income. Acquisitions and divestments can affect the comparability of cash flows in the year of the transaction. On a longer-term basis, the ability to replace proved reserves that are produced affects cash provided by operating activities, as well as net income.
Because the contribution of Exploration & Production to earnings is larger than the Group’s other businesses, changes affecting Exploration & Production, particularly changes in realised crude oil and natural gas prices and production levels, have a significant impact on the overall Group results. While Exploration & Production benefits from higher realised crude oil and natural gas prices, the extent of such benefit (and the extent of a detriment from a decline in these prices) is dependent on the extent to which the prices of individual types of crude oil follow the Brent benchmark, the dynamics of production sharing contracts, the existence of agreements with governments or national oil companies that have limited sensitivity to crude oil price, tax impacts, the extent to which changes in crude oil price flow through into operating costs and the impacts of natural gas prices. Therefore, changes in benchmark prices for crude oil and natural gas only provide a broad indicator of changes in the earnings experienced in any particular period by Exploration & Production.
In Oil Products, our second largest business, changes in any one of a range of factors derived from either within or beyond the industry can influence margins in the short or long term. The precise impact of any such change at a given point in time is dependent upon other prevailing conditions and the elasticity of the oil markets. For example, a sudden decrease in crude oil and/or natural gas prices would in the very short term lead to an increase in combined refining and marketing margins until responding downward price corrections materialise in the international oil products markets. The converse arises for sudden crude or natural gas price increases. The duration and impact of these dynamics is in turn a function of a number of factors determining the market response, including whether a change in crude price affects all crude types or only a specific grade, regional and global crude oil and refined products stocks, and the collective speed of response of the industry refiners and product marketers to adjust their operations. It should be noted that commonly agreed benchmarks for refinery and marketing margins do not exist in the way that Brent crude oil prices and Henry Hub natural gas prices in the USA serve as benchmarks in the Exploration & Production business.
In the longer term, reserve replacement will affect the ability of the Group to continue to maintain or increase production levels in Exploration & Production, which in turn will affect the Group’s cash flow provided by operating activities and net income. The field decline rate for Exploration & Production’s existing business is approximately 6 to 8% per year. The Group will need to take measures to maintain or increase production levels and cash flows in future periods, which measures may include developing new fields, continuing to develop and apply new technologies and recovery processes to existing fields, and making selective focused acquisitions. The Group’s goal is to offset declines from production and increase reserve replacements. However, volume increases are subject to a variety of risks and other factors, including the uncertainties of exploration, project execution, operational interruptions, reservoir performance and regulatory changes. The Group currently expects overall production to decrease in 2005 and then to increase beginning in 2006 as additional production from new projects begins to come on stream.
The Group has a diverse portfolio of development projects and exploration opportunities, which helps mitigate the overall political and technical risks of Exploration & Production and the associated cash flow provided by operating activities. As a result of its financial strength and debt capacity, the risk associated with delay or failure of any single project would not have a significant impact on the Group’s liquidity or ability to generate sufficient cash flows for operations and fixed commitments.
It is the Group’s intention to continue to divest and, where appropriate, make selective focused acquisitions as part of active portfolio management. However, the Group does not generally expect that the purchase and sale of assets in the normal course of business will have a significant adverse effect on cash flow provided by operating activities. The number of divestments
Operational and Financial Review 35
will depend on market opportunities and are recorded as assets held for sale where appropriate.
The Group manages its portfolio of businesses to balance cash flow provided by operating activities against uses of cash over time based on conservative assumptions relating to crude oil prices relative to average historic crude oil prices. From 1984 through 2004, the Brent crude oil price has averaged around $20 a barrel, from 1994 through 2004 it averaged approximately $23 a barrel and from 1999 through 2004 the price averaged approximately $27 a barrel.
Financial condition and liquidity
Cash and cash equivalents amounted to $8.5 billion at the end of 2004 (2003: $2.0 billion). Total short and long-term debt fell $5.7 billion between 2003 and 2004, reflecting net repayment of $4.4 billion together with the deconsolidation of $1.3 billion of debt relating to the disposal of the Group’s interest in the Rayong Refining Company.
Total debt at the end of 2004 amounted to $14.4 billion and the Group’s total debt ratio1decreased from 21.0% in 2003 to 13.8% in 2004. The current level of the debt ratio falls below the medium-term gearing objective of the Group, which establishes a target gearing2of between 20% and 25% (inclusive of certain off-balance sheet obligations of a financing nature). The total debt outstanding (excluding capital leases) at December 31, 2004 will mature as follows: 42% in 2005, 17% in 2006, 18% in 2007, 1% in 2008 and 22% in 2009 and beyond.
The Group currently satisfies its funding requirements from the substantial cash generated within its business and through external debt. The Group’s external debt is principally financed through two commercial paper programmes, which are issued on a short-term basis (generally for up to six months), and a euro medium-term note programme, each guaranteed jointly and severally by The Shell Petroleum Company Limited and Shell Petroleum N.V. Each of the two commercial paper programmes and the medium-term note programme are for up to $10 billion in value. Other than described below, these programmes do not have committed support from a bank as the Group considers the costs involved in securing such support are unnecessary given the Group’s current credit rating.
The debt programmes consist of:
| – | | a Global Commercial Paper Programme, exempt from registration under section 3(a)(3) of the US Securities Act 1933, that assigns the use of the proceeds from the programme to the funding of ‘current transactions’ of the issuer, with maturities not exceeding 364 days; |
| |
| – | | a section 4(2) Commercial Paper Programme which can be used to finance non-current transactions. The maximum maturity of commercial paper issued under the programme has been limited to 397 days; and |
| |
| – | | a euro medium-term note programme. |
The Group expects to be able to continue to utilise these facilities in circumstances where it is not in possession of undisclosed price sensitive information which would impact the prospective purchasers of the relevant debt security. The Group will also evaluate other debt issuance options.
The Group currently maintains $2.5 billion of committed bank facilities, as well as internally-available liquidity (some $1 billion), to provide back-up coverage for commercial paper maturing within 30 days. Aside from this facility and certain borrowing in local subsidiaries, the Group does not have committed bank facilities as this is not considered to be a cost effective form of financing for the Group given its size, credit rating and cash generative nature.
The maturity profile of the Group’s outstanding commercial paper is actively managed to ensure that the amount of commercial paper maturing within 30 days remains consistent with the level of supporting liquidity. The committed facilities, which are with a number of international banks, are renewed on an annual basis. The Group expects to be able to renew these facilities on commercially acceptable terms. The Group expects that commercial paper borrowings in 2005 could range up to $5.0 billion.
While the Group is subject to restrictions, such as foreign withholding taxes, on the ability of subsidiaries to transfer funds to their parent companies in the form of cash dividends, loans or advances, such restrictions are not expected to have a material impact on the ability of the Group to meet its cash obligations.
The Group is of the opinion that it has sufficient working capital for its present requirements, that is at least the next 12 months from the date of this report.
Credit ratings
On February 4, 2005, Standard & Poor’s Ratings Services (S&P) downgraded to “AA” from “AA+” its long-term ratings on the Royal Dutch/Shell Group of Companies (through a downgrade of the Group Holding Companies, Shell Petroleum N.V. and The Shell Petroleum Co. Ltd and their subsidiary Shell Oil Company). Moody’s Investors Services (Moody’s) continues to rate the long-term debt of Shell Finance (Netherlands) B.V. and Shell Finance (U.K.) PLC, the guaranteed subsidiaries of the Group Holding Companies, as “Aa1”. The credit ratings given to the commercial paper programmes of the guaranteed subsidiaries have been confirmed by S&P and Moody’s at their original levels of “A-1+” and “Prime-1”, respectively.
Capital investment and dividends
Group companies’ capital expenditure, exploration expense, new investments in associated companies and other investments increased by $0.7 billion to $14.9 billion in 2004.
| 1 | | The total debt ratio is defined as short-term plus long-term debt as a percentage of capital employed. Capital employed is Group net assets before deduction of minority interests, plus short-term and long-term debt. |
| |
| 2 | | Gearing is defined as the ratio of debt to capital employed (or debt/debt and equity). |
36 Royal Dutch/Shell Group of Companies
Liquidity and capital resources
continued
Exploration & Production expenditures of $9.9 billion (2003: $9.3 billion) accounted for more than half the total capital investment. Gas & Power accounted for $1.6 billion (2003: $1.5 billion); Oil Products investment amounted to $2.5 billion (2003: $2.4 billion); Chemicals investment was $0.7 billion (2003: $0.6 billion) and investment in other segments was $0.2 billion (2003: $0.4 billion).
Capital investment of some $15 billion (excluding contribution of the Group’s minority partners in Sakhalin) on average is required each year to grow the capital base in light of expected dividend payments, taking into account an expected $12 to $15 billion of divestments over the period 2004 to 2006. After dividends and capital investment, the priority for using cash generated is to maintain a prudent balance sheet. Both the medium and long-term focus will remain on improving the underlying operational performance in order to continue to deliver consistently strong cash flows.
Capital investment (excluding the contribution of the Group’s minority partners in Sakhalin) in 2005 is estimated to be $15 billion, with Exploration & Production continuing to account for the majority of this amount. The Parent Companies have announced the relaunch of their share buyback programmes, with a return of surplus cash to shareholders in 2005 in the range of $3 to $5 billion, assuming continued high oil prices. It is expected that the Group companies’ investment programme will be financed largely from internally generated funds.
The aim of the Royal Dutch/Shell Group of Companies is to provide per share increase in dividends at least in line with inflation of the currencies of the Parent Companies’ base countries over a period of years. Upon completion of the transaction described under “Unification Proposal” on page 52, Royal Dutch Shell will declare its dividend in euros. In setting the level of the dividend, consistent with Royal Dutch and Shell Transport’s historical dividend policy, the Royal Dutch Shell Board will seek to increase dividends at least in line with inflation over time.
Guarantees and other off-balance sheet obligations
Guarantees at December 31, 2004 were $2.9 billion (2003: $3.4 billion). At December 31, 2004, $1.7 billion were guarantees of debt of associated companies, $0.5 billion were guarantees for customs duties and other tax liabilities and $0.7 billion were other guarantees. Guarantees of debt of associated companies mainly related to Nanhai ($0.8 billion) and InterGen ($0.4 billion). Guarantees at December 31, 2003 were $3.4 billion (2002: $4.1 billion). At December 31, 2003, $1.8 billion were guarantees of debt of associated companies, $0.7 billion were guarantees for customs duties and other tax liabilities and $0.9 billion were other guarantees. Guarantees of debt of associated companies mainly related to InterGen ($1.2 billion) and Nanhai ($0.4 billion).
Contractual obligations
The table below summarises Group companies’ principal contractual obligations at December 31, 2004, by expected settlement period. The amounts presented have not been offset by any committed third party revenues in relation to these obligations.
| | | | | | | | | | | | | | | | | | | | | |
| | | | | | | | | | | | | | | | | | | $ billion | |
| | | | | | | | | | | | | | | | | | | After | |
| | | | | | | Within | | | 2-3 years | | | 4-5 years | | | 5 years | |
| | | | | | | 1 year | | | (2006/ | | | (2008/ | | | (beyond | |
| | | Total | | | (2005) | | | 2007) | | | 2009) | | | 2009) | |
| |
Long-term debta | | | 9.2 | | | | 1.2 | | | | 4.4 | | | | 0.7 | | | | 2.9 | |
Capital leasesb | | | 1.2 | | | | 0.1 | | | | 0.1 | | | | 0.1 | | | | 0.9 | |
Operating leasesc | | | 9.9 | | | | 1.7 | | | | 2.2 | | | | 1.5 | | | | 4.5 | |
Purchase obligationsd | | | 203.6 | | | | 75.0 | | | | 37.7 | | | | 26.6 | | | | 64.3 | |
Other long-term contractual liabilitiese | | | 0.9 | | | | 0.2 | | | | 0.4 | | | | 0.1 | | | | 0.2 | |
| |
Total | | | 224.8 | | | | 78.2 | | | | 44.8 | | | | 29.0 | | | | 72.8 | |
| |
| a | | The total figure is comprised of $8.0 billion of long-term debt (debentures, other loans, other credit instruments and amounts due to banks), plus $1.2 billion of long-term debt due within one year. The total figure excludes $0.7 billion of long-term capitalised lease obligations. See Note 16 to the Group Financial Statements. |
| |
| b | | Includes executory costs and interest. See Note 17 to the Group Financial Statements. |
| |
| c | | See Note 17 to the Group Financial Statements. |
| |
| d | | Includes any agreement to purchase goods and services that is enforceable, legally binding and specifies all significant terms, including: fixed or minimum quantities to be purchased; fixed, minimum or variable price provisions; and the approximate timing of the purchase. The amounts include $5.5 billion of purchase obligations associated with financing arrangements, which are disclosed in Note 17 to the Group Financial Statements. Raw materials and finished products account for 91% of total purchase obligations. |
| |
| e | | Includes all obligations included in “Long-term liabilities-Other” on the Statement of Assets and Liabilities of the Group that are contractually fixed as to timing and amount. In addition to these amounts, the Group has certain obligations that are not contractually fixed as to timing and amount, including contributions to defined benefit pension plans estimated to be $1.4 billion (see Note 21 to the Group Financial Statements) and obligations associated with assets retirements (see Note 24 to the Group Financial Statements). |
The table above excludes interest expense related to long-term debt estimated to be $0.4 billion in 2005, $0.7 billion in 2006/2007 and $0.6 billion in 2008/2009 (assuming interest rates with respect to variable interest rate long-term debt remain constant and there is no change in aggregate principal amount of long-term debt other than repayment at scheduled maturity as reflected in the table).
Operational and Financial Review 37
Other matters
Financial framework
The Group manages its business to deliver strong cash flows to fund investment and growth based on cautious assumptions relating to crude oil prices. Our strong cash position in 2004, with operational cash flow of $26 billion, gives the Group the financial flexibility both to fund capital investment and to return cash to shareholders.
Following the completion of the Transaction described on page 52 under “Unification Proposal”, Royal Dutch Shell plc, consistent with Royal Dutch’s and Shell Transport’s historical dividend policy, has announced it will seek to increase dividends at least in line with inflation over time. The base for the 2005 financial year will be the dividend paid by Royal Dutch in respect of the financial year ending December 31, 2004. With the adoption of quarterly dividends in 2005, Royal Dutch and Shell Transport will pay dividends in respect of the first quarter of 2005. Royal Dutch Shell plc will take these dividends into account when determining the dividends which will be declared for the remainder of the year. In 2004 the dividends paid out to shareholders exceeded $7.1 billion. As a result of the transition to the payment of quarterly dividends, the Group expects to return at least $10 billion cash to shareholders from dividends during 2005, subject to exchange rates. Given the strong cash and debt position from 2004, the share buyback programme was relaunched on February 3, 2005, with the return of surplus cash to shareholders for the year 2005 expected to be in the range of $3 to $5 billion, assuming high oil prices.
Capital investment of some $15 billion (excluding contribution of the Group’s minority partners in Sakhalin) on average is required each year to grow the capital base in light of expected dividend payments, taking into account an expected $12 to $15 billion of divestments over the period 2004 to 2006. After dividends and capital investment, the priority for using cash generated is to maintain a prudent balance sheet. Both the medium and long-term focus will remain on improving the underlying operational performance in order to continue to deliver consistently strong cash flows.
Over the past 20 years the Brent crude oil price has averaged around $20 a barrel and over the past five years the price averaged approximately $27 a barrel. We expect that crude oil prices in 2005 will be influenced by developments in the key oil producing countries, the pace of Iraqi crude export recovery, and by the rate of the global economic recovery, particularly in the USA and China. Natural gas prices in the USA are expected to remain well above pre-2000 levels, due to higher demand resulting from a more general recovery of the global economy, while prices in other major markets are expected to retain an oil-price linkage.
The Group uses a range of prices for crude oil to test opportunities on the downside and look at the upside of potential projects. The Group plans for the medium term at $25 a barrel, screens for resilience to price downside at $20 a barrel, and tests for response to price upside at a range of higher prices. This method is applied to understand the composition of projects in the portfolio and how these respond over a broad range of prices or margins. The crude oil price outlook for 2005 will likely be impacted by developments in the Middle East and Venezuela.
Crude oil reference price conditions are determined after careful assessment of short, medium and long-term drivers of oil and gas prices under different sets of assumptions, yielding a range of prices to be used in evaluation. With regard to 2004, crude oil prices were higher than the conservative expectations of our reference price conditions. Historical analysis, trends and statistical volatility are part of this assessment, as well as analysis of global and regional economic conditions, geopolitics, OPEC actions, supply and demand. Sensitivity analyses are used to test the impact of low price drivers (economic weakness, rapid resumption of Iraqi production, greater than expected increase in non-OPEC production) and high price drivers (greater than expected economic growth, slower than expected resumption of Iraqi production). Short-term events (such as relatively warm winters or cool summers and the resulting effects on demand and inventory levels) contribute to volatility.
As described in Note 3 to the Group Financial Statements under the heading “Accounting Policies — Revenue Recognition” on pages 55 and 56, the Group reports certain buy/sell contracts for feedstock, principally crude oil, and finished products mainly in the Oil Products segment on a gross basis in the Statement of Income. These contracts are entered into with the same counterparty either concurrently or in contemplation of one another. However, they are separately invoiced and settled and there is no legal right of offset. If these contracts were required to be reported net, it is estimated that net proceeds and cost of sales for 2004 would be reduced by $24,744 million and $24,719 million respectively (2003: $19,795 million and $19,713 million, respectively; 2002: $14,267 million and $14,419 million, respectively) with no impact on net income.
38 Royal Dutch/Shell Group of Companies
Other matters
continued
Risk management and internal control
The Group’s approach to internal control is based on the underlying principle of line management’s accountability for risk and control management. The Group’s risk and internal control policy explicitly states that the Group has a risk-based approach to internal control and that management in the Group is responsible for implementing, operating and monitoring the system of internal control, which is designed to provide reasonable but not absolute assurance of achieving business objectives.
The Group’s approach to internal control includes a number of general and specific risk management processes and policies. Within the essential framework provided by the Statement of General Business Principles, primary control mechanisms include strong functional leadership, adequate resourcing by competent staff, and self-appraisal processes in combination with strict accountability for results. These mechanisms are underpinned by established Group policies, standards and guidance material that relate to particular types of risk, structured investment decision processes, timely and effective reporting systems and active performance monitoring.
Examples of specific risk management mechanisms include:
| – | | regular review of significant risks by the Executive Committee and the Group Audit Committee; |
| |
| – | | a common health, safety and environment (HSE) policy, a common requirement for HSE management systems, and external certification of the environmental component of such systems for major installations; |
| |
| – | | a financial control handbook that establishes standards for the application of internal financial controls; |
| |
| – | | arrangements for the management of property, liability and treasury risks; and |
| |
| – | | a business control incident reporting process that enables monitoring and appropriate follow-up actions for incidents arising as a result of control breakdowns. Lessons learned from these incidents are used to improve the Group’s overall control framework. |
In the context of reserves, examples of specific risk management mechanisms include:
| – | | oversight of the process for approving the booking of proved reserves by the Global Exploration & Production Reserves Committee (the Reserves Committee); |
| |
| – | | Group guidelines for booking proved reserves that conform fully with applicable SEC rules and guidance and clarify criteria for booking and de-booking proved reserves (and the distinctions between regulatory requirements and the Group’s internal reserves classifications); |
| |
| – | | training of reserves guidelines users; |
| |
| – | | responsibility on the local Chief Reservoir Engineer for ensuring that reserves bookings and de-bookings are compliant with SEC rules and that any booking and de-booking decisions are only made with appropriate, auditable documentation and after completion of the appropriate challenge processes; |
| |
| – | | business and financial responsibility on the local Regional Technical Director and Regional Finance Director, respectively, for the decisions of their Chief Reservoir Engineer; |
| |
| – | | responsibility for booking and de-booking decisions with the Chief Financial Officer of Exploration & Production and the Director of Technology of Exploration & Production, working together with the Group Reserves Co-ordinator and the other members of the Reserves Committee; |
| |
| – | | approval by the Group’s Executive Committee of the reserves bookings and de-bookings taken by Exploration & Production; and |
| |
| – | | final review by the Group Audit Committee. |
A formalised self-appraisal and assurance letter process is in place. Annually, the management of every business unit provides assurance as to the adequacy of governance arrangements, risk and internal control management, HSE management, financial controls and reporting, treasury management, brand management and information management. Country Chairs also provide assurance regarding compliance with the Statement of General Business Principles and other important topics. As part of this process, business integrity concerns or instances of bribery or illegal payments are to be reported. Assurance letter results, including any material qualifications, are reviewed by the Group Audit Committee and support representations made to the external auditors.
Operational and Financial Review 39
In addition to these structured self-appraisals, the assurance framework relies on objective appraisals by internal audit. The results of internal audit’s risk-based reviews of Group operations provide the Group Audit Committee with an independent view regarding the effectiveness of risk and control management systems.
These established review, reporting and assurance processes enable the Conference (a meeting of the Executive and Non-executive Directors) to regularly consider the overall effectiveness of the system of internal control and to perform a full annual review of the system’s effectiveness.
Taken together, these processes and practices provide confirmation to the Group Holding Companies that relevant policies are adopted and procedures implemented with respect to risk and control management.
As discussed in “Controls and Procedures” on pages 45 to 47 the Parent Companies determined, based largely on the investigation and report to the Group Audit Committee, that there were deficiencies and material weaknesses in the internal controls relating to proved reserve bookings and disclosure controls that allowed volumes of oil and gas to be improperly booked and maintained as proved reserves, which also had an effect on the Group Financial Statements.
Property and liability risks
The Group’s Operating Companies insure against most major property and liability risks with the Group’s captive insurance companies. These companies reinsure part of their major catastrophe risks with a variety of international insurers. The effect of these arrangements is that uninsured losses for any one incident are unlikely to exceed $400 million.
Treasury and trading risks
As further discussed in Note 29 to the Group Financial Statements on page 80, Group companies, in the normal course of their business, use financial instruments of various kinds for the purposes of managing exposure to currency, commodity price and interest rate movements.
The Group has Treasury Guidelines applicable to all Group companies and each Group company is required to adopt a treasury policy consistent with these guidelines. These policies cover financing structure, foreign exchange and interest rate risk management, insurance, counterparty risk management and derivative instruments, as well as the treasury control framework. Wherever possible, treasury operations are operated through specialist Group regional organisations without removing from each Group company the responsibility to formulate and implement appropriate treasury policies.
Each Group company measures its foreign currency exposures against the underlying currency of its business (its functional currency), reports foreign exchange gains and losses against its functional currency and has hedging and treasury policies in place which are designed to manage foreign exchange exposure so defined. The functional currency for most upstream companies and for other companies with significant international business is the US dollar, but other companies usually have their local currency as their functional currency.
The financing of most Operating Companies is structured on a floating-rate basis and, except in special cases, further interest rate risk management is discouraged.
Apart from forward foreign exchange contracts to meet known commitments, the use of derivative financial instruments by most Group companies is not permitted by their treasury policy.
Specific Group companies have a mandate to operate as traders in crude oil, natural gas, oil products and other energy-related products, using commodity swaps, options and futures as a means of managing price and timing risks arising from this trading. In effecting these transactions, the companies concerned operate within procedures and policies designed to ensure that risks, including those relating to the default of counterparties, are minimised. The Group measures exposure to the market when trading. Exposure to substantial trading losses is considered limited with the Group’s approach to risk.
Other than in exceptional cases, the use of external derivative instruments is generally confined to specialist oil and gas trading and central treasury organisations which have appropriate skills, experience, supervision and control and reporting systems.
Pension funds
It is expected that the actuarial valuations of the Group’s four main pension funds in aggregate at the end of 2004 will show an increased surplus of assets over liabilities compared with the end of 2003, mainly resulting from the investment performance during 2004. These actuarial valuations, rather than the Group
40 Royal Dutch/Shell Group of Companies
Other matters
continued
accounting policy FAS 87 measure (Note 21 to the Group Financial Statements on pages 67 to 70), are the basis on which the funds’ trustees manage the funds and define the required contributions from the member companies.
Environmental and decommissioning costs
Group companies are present in more than 140 countries and territories throughout the world and are subject to a number of different environmental laws, regulations and reporting requirements. It is the responsibility of each Group company to implement a health, safety and environmental management system that is suited to its particular circumstances.
The costs of prevention, control, abatement or elimination of releases into the air and water, as well as the disposal and handling of waste at operating facilities, are considered to be an ordinary part of business. As such, these amounts are included within operating expenses. An estimate of the order of magnitude of amounts incurred in 2004 for Group companies, based on allocations and managerial judgment, is $1.4 billion (2003: $1.3 billion).
Expenditures of a capital nature to limit or monitor hazardous substances or releases, include both remedial measures on existing plants and integral features of new plants. Whilst some environmental expenditures are discrete and readily identifiable, others must be reasonably estimated or allocated based on technical and financial judgments which develop over time. Consistent with this, estimated environmental capital expenditures made by companies with major capital programmes during 2004 were $0.7 billion (2003: $0.7 billion). Those Group companies are expected to incur environmental capital costs of at least $0.5 billion during 2005 and 2006.
It is not possible to predict with certainty the magnitude of the effect of required investments in existing facilities on Group companies’ future earnings, since this will depend, amongst other things, on the ability to recover the higher costs from consumers and through fiscal incentives offered by governments.
Nevertheless, it is anticipated that over time there will be no material impact on the total of Group companies’ earnings. These risks are comparable to those faced by other companies in similar businesses.
At the end of 2004, the total liabilities being carried for environmental clean-up were $907 million (2003: $972 million). In 2004, there were payments of $244 million and increases in provisions of $161 million. The Group introduced US accounting standard FAS 143 (Asset Retirement Obligations) with effect from January 1, 2003 (see Note 24 to the Group Financial Statements on page 73). The fair value of the obligations being carried for expenditures on decommissioning and site restoration, including oil and gas platforms, at December 31, 2004 amounted to $5,894 million (2003: $4,044 million).
Employees
There has been an overall decrease in the number of employees in the Group during 2004. This is mainly as a result of divestments within Oil Products. The main divestments were in Peru, Thailand, Spain, Portugal and the USA.
Research and development costs
The Group’s research and development (R&D) programmes are designed to enable the Group to reduce costs and improve operations. Total R&D expenses for 2004 were $553 million, (2003: $584 million).
Foreign exchange volatility
Foreign exchange exposures are managed within the Group on an entity by entity basis. The Group recognises and expects that Group profitability and the Group’s assets and liabilities will vary on consolidation as a result of foreign exchange movements.
International Financial Reporting Standards
Under a 2002 European Union (EU) Regulation, publicly-listed companies in the EU will be required to prepare consolidated financial statements in accordance with International Financial Reporting Standards (IFRS) from 2005. The Group’s IFRS implementation project is on target to meet the EU requirement.
With effect from the first quarter of 2005, the Group has released its quarterly (unaudited) results under IFRS, and has released comparative data for 2004, together with reconciliations to opening January 1, 2004 and to 2004 data previously published in accordance with accounting principles generally accepted in the United States (US GAAP). The 2005 Financial Statements of the Group or, subject to completion of the Transaction described
Operational and Financial Review 41
under the heading “Unification Proposal” on page 52, of its successor, will be prepared under IFRS, with appropriate reconciliations to US GAAP.
The total impact on net assets at transition on January 1, 2004 is a reduction of $4.7 billion, mainly resulting from the recognition of unrecognised gains and losses on postretirement benefits at the date of transition of $4.9 billion. This has no impact on the actuarial position or funding of the pension funds, which continue to be well funded.
There have been various amendments during 2004 to International Accounting Standards 32 and 39 relating to the accounting for financial instruments. The Group has applied the option to continue with its existing policy (under which derivatives defined under US GAAP, other than those meeting the normal purchases and sales exception, are already recognised on the balance sheet at fair value) for 2004 and to implement consequential changes to accounting policy arising from these standards with effect from January 1, 2005. The main impact on transition was an increase in assets and equity of $0.8 billion as a result of the IFRS requirement to recognise unquoted investments at fair value where estimable, rather than at cost under US GAAP.
The adoption of IFRS will have no impact on the Group’s financial framework, strategy or underlying cash flows. However, net income will differ resulting from the IFRS requirements to expense stock options, to capitalise major inspection costs, to provide for additional impairments and to reverse previous impairments where applicable and (mainly as a consequence of the transition adjustment) there will be an impact on pension costs. However, as stated above there will be no impact on the actuarial position of funding of the pension funds, which continue to be well funded.
Cautionary statement
The Operational and Financial Review and other sections of this report contain forward-looking statements, that are subject to risk factors associated with the oil, gas, power, chemicals and renewables businesses. It is believed that the expectations reflected in these statements are reasonable, but may be affected by a variety of variables which could cause actual results, trends or reserves replacement to differ materially, including, but not limited to: price fluctuations, actual demand, currency fluctuations, drilling and production results, reserve estimates, loss of market, industry competition, environmental risks, physical risks, risks associated with the identification of suitable potential acquisition properties and targets and the successful negotiation and consummation of transactions, the risk of doing business in developing countries, legislative, fiscal and regulatory developments including potential litigation and regulatory effects arising from recategorisation of reserves, economic and financial market conditions in various countries and regions, political risks, project delay or advancement, approvals and cost estimates.
42 Royal Dutch/Shell Group of Companies
Critical accounting estimates
In order to prepare the Group Financial Statements in conformity with generally accepted accounting principles in the Netherlands and the United States, management of the Group has to make estimates and judgments. The matters described below are considered to be the most critical in understanding the judgments that are involved in preparing the Group Financial Statements and the uncertainties that could impact the amounts reported on the results of operations, financial condition and cash flows. Accounting policies are described in Note 3 and Note 31 to the Group Financial Statements.
Estimation of oil and natural gas reserves
Oil and gas reserves are key elements in the Group’s investment decision-making process. They are also an important element in testing for impairment. Changes in proved oil and natural gas reserves will also affect the standardised measure of discounted cash flows presented in “Supplementary information – Oil and Gas (unaudited)” (see pages 92 to 103) and changes in proved oil and natural gas reserves, particularly proved developed reserves, will affect unit-of-production depreciation charges to income.
Proved oil and gas reserves are the estimated quantities of crude oil, natural gas and natural gas liquids which geological and engineering data demonstrate with reasonable certainty to be recoverable in future years from known reservoirs under existing economic and operating conditions, ie, prices and costs as of the date the estimate is made. Proved developed reserves are reserves that can be expected to be recovered through existing wells with existing equipment and operating methods. Estimates of oil and natural gas reserves are inherently imprecise, require the application of judgment and are subject to future revision. Accordingly, financial and accounting measures (such as the standardised measure of discounted cash flows, depreciation, depletion and amortisation charges, and decommissioning provisions) that are based on proved reserves are also subject to change.
Proved reserves are estimated by reference to available reservoir and well information, including production and pressure trends for producing reservoirs and, in some cases, subject to definitional limits, to similar data from other producing reservoirs. Proved reserves estimates are attributed to future development projects only where there is a significant commitment to project funding and execution and for which applicable governmental and regulatory approvals have been secured or are reasonably certain to be secured. Furthermore, estimates of proved reserves only include volumes for which access to market is assured with reasonable certainty. All proved reserve estimates are subject to revision, either upward or downward, based on new information, such as from development drilling and production activities or from changes in economic factors, including product prices, contract terms or development plans. In general, changes in the technical maturity of hydrocarbon reserves resulting from new information becoming available from development and production activities have tended to be the most significant cause of annual revisions.
In general, estimates of reserves for undeveloped or partially developed fields are subject to greater uncertainty over their future life than estimates of reserves for fields that are substantially developed and depleted. As a field goes into production, the amount of proved reserves will be subject to future revision once additional information becomes available through, for example, the drilling of additional wells or the observation of long-term reservoir performance under producing conditions. As those fields are further developed, new information may lead to revisions.
As announced on January 9, 2004, March 18, 2004, April 19, 2004, October 28, 2004, November 26, 2004 and February 3, 2005 the Group reviewed its proved reserves (with the assistance of external consultants) during the period from late 2003 to December 2004. These reviews lead to the First Reserves Restatement, which was reflected in the 2003 Annual Report and Accounts and the Annual Report on Form 20-F, as filed with the Securities and Exchange Commission (SEC) on June 30, 2004, and to the Second Reserves Restatement which was reflected in Amendment No. 2 to the 2003 Annual Report on Form 20-F, as filed with the SEC on March 7, 2005. As at December 31, 2003, after giving effect to the First Reserves Restatement and the Second Reserves Restatement, the proportion of the Group’s total proved reserves that was categorised as proved developed reserves was 57%, the remaining 43% being proved undeveloped reserves.
As noted above, changes in the estimated amounts of proved reserves can have a significant impact on the standardised measure of discounted cash flows presented under “Supplementary information — Oil and Gas (unaudited)” beginning on page 92. The First Reserves Restatement and the Second Reserves Restatement resulted in a 17% reduction in the standardised measure as at the end of 2002. Apart from the effects of the Reserves Restatements, however, revisions to proved reserves have had a relatively modest impact on standardised measure compared to changes in prices and costs, sales and transfers and income tax. A summary of changes to the standardised measure is given on page 102.
Operational and Financial Review 43
Changes to the Group’s estimates of proved reserves, particularly proved developed reserves, also affect the amount of depreciation, depletion and amortisation recorded in the Group’s financial statements for fixed assets related to hydrocarbon production activities. These changes most often result from production and revisions. However, the Reserves Restatements also affected proved developed reserves. A reduction in proved developed reserves will increase depreciation, depletion and amortisation charges (assuming constant production) and reduce net income.
Exploration costs
Capitalised exploration drilling costs more than 12 months old are expensed under Group accounting policy unless (i) they are in an area requiring major capital expenditure before production can begin and (ii) they have found commercially producible quantities of reserves and (iii) they are subject to further exploration or appraisal activity in that either drilling of additional exploratory wells is under way or firmly planned for the near future. In making decisions about whether to continue to capitalise exploration drilling costs for a period longer than 12 months, it is necessary to make judgments about the satisfaction of each of these conditions. If there is a change in one of these judgments in a subsequent period, then the related capitalised exploration drilling costs would be expensed in that period, resulting in a charge to net income. As at December 31, 2004, the Group has $789 million of capitalised exploration drilling costs. Write-offs of previously capitalised exploration drilling costs in 2004 amounted to $432 million pre-tax.
An amendment (FAS 19-1 “Accounting for Suspended Well Costs”) to FASB Statement No. 19 “Financial Accounting and Reporting by Oil and Gas Producing Companies” has been issued. This could result in the continued inclusion, on a prospective basis, of the cost of certain exploratory wells in tangible fixed assets beyond 12 months which do not meet the current requirements given above if both sufficient reserves have been found to justify completion as a producing well, and sufficient progress is being made towards assessing the reserves and the economic and operating viability of the project (see Note 3 to the Group Financial Statements). This would result in lower write-offs if proved reserves are ultimately determined, with a consequential increase in depreciation, depletion and amortisation of future periods.
Recoverability of assets
For oil and gas properties with no proved reserves, the capitalisation of exploration costs and the basis for carrying those costs on the balance sheet are explained in Note 3 to the Group Financial Statements. For properties with proved reserves, the carrying amounts of major fixed assets are reviewed for possible impairment annually, while all assets are reviewed whenever events or changes in circumstances indicate that the carrying amounts for those assets may not be recoverable. If assets are determined to be impaired (i.e. the estimated undiscounted cash flows related to such assets are less than the carrying amounts of such assets), the carrying amounts of those assets are written down to fair value, usually determined as the amount of estimated discounted future cash flows. For this purpose, assets are grouped based on separately identifiable and largely independent cash flows. Impairments can also occur when decisions are taken to dispose of assets.
Estimates of future cash flows are based on management estimates of future commodity prices, market supply and demand, product margins and, in the case of oil and gas properties, the expected future production volumes. Other factors that can lead to changes in estimates include restructuring plans and variations in regulatory environments. Expected future production volumes, which include both proved reserves as well as volumes that are expected to constitute proved reserves in the future, are used for testing asset recoverability because the Group believes this to be the most appropriate indicator of expected future cash flows, used as a measure of fair value. Estimates of future cash flows are risk weighted and consistent with those used in Group companies’ business plans. A discount rate based on the Group’s risk free rate is used in impairment testing, adapted where required to specific local circumstances. Changes in the discount rate can result from inflation rates, individual country risks and currency risks. The Group reviews the discount rate to be applied on an annual basis but the risk free rate has been stable in recent years.
Asset impairments have the potential to significantly impact net income. For example, there were significant charges in 2003 ($1,376 million pre-tax) and the changes in estimates that most precipitated those impairments were in relation to future production outlooks and economic conditions, and portfolio actions (particularly in Oil Products due to the announced closure of the Bakersfield refinery). This resulted in certain asset-specific impairments in Exploration & Production (totalling $698 million), Oil Products, Chemicals and Other industry segments. There were also significant write-downs in the carrying amounts of certain associated companies in 2003 as a result of a reassessment of future business conditions. These comprised Basell in Chemicals ($286 million after tax) and InterGen ($200 million) and Cuiaba ($115 million) in Gas & Power.
As described above, the Group has a portfolio of assets across a number of business lines and geographic regions. The factors that influence estimated future cash flows from assets also vary depending on the nature of the business activity in which those assets are used and geographical market conditions impacting the businesses in which assets are used. This wide business and geographic spread is such that it is not practicable to determine the likelihood or magnitude of impairments under different sets of assumptions. The assumption on future oil prices tends to be stable because the Group does not consider short-term increases or decreases in prices as being indicative of long-term levels. At the end of 2004 the estimated oil and gas prices used for asset recoverability testing were lower than prices prevailing in the market at that time.
Provisions and liabilities
Provisions are recognised for the future decommissioning and restoration of oil and gas production facilities and pipelines at the
44 Royal Dutch/Shell Group of Companies
Critical accounting estimates
continued
end of their economic lives. The estimated cost is provided over the life of the proved developed reserves on a unit-of-production basis. Changes in the estimates of costs to be incurred, proved developed reserves or in the rate of production will therefore impact net income over the remaining economic life of oil and gas assets.
Other provisions and liabilities are recognised in the period when it becomes probable that there will be a future outflow of funds resulting from past operations or events which can be reasonably estimated. The timing of recognition requires the application of judgment to existing facts and circumstances, which can be subject to change.
Estimates of the amounts of provisions and liabilities recognised are based on current legal and constructive requirements, technology and price levels. Because actual outflows can differ from estimates due to changes in laws, regulations, public expectations, technology, prices and conditions, and can take place many years in the future, the carrying amounts of provisions and liabilities are regularly reviewed and adjusted to take account of such changes.
In relation to decommissioning and restoration costs, the estimated interest rate used in discounting the cash flows is reviewed at least annually. The interest rate used to determine the balance sheet obligation at December 31, 2004, was 6%.
As further described in Note 28 to the Group Financial Statements, the Group is subject to claims and actions. The facts and circumstances relating to particular cases are evaluated in determining whether it is “probable” that there will be a future outflow of funds and, once established, whether a provision relating to a specific litigation is sufficient. Accordingly, significant management judgment relating to contingent liabilities is required since the outcome of litigation is difficult to predict. Despite this uncertainty, actual payments related to litigation during the three years ended December 31, 2004 have not been material to the Group’s financial condition or results of operations.
Notwithstanding the possibility of outcomes outside expected ranges, in recent years the Group’s experience has been that estimates used in determining the appropriate levels of provisions have been materially adequate in anticipating actual outcomes.
A change in estimate of a recognised provision or liability would result in a charge or credit to net income in the period in which the change occurs (with the exception of decommissioning and restoration costs as described above).
Employee retirement plans
Retirement plans are provided for permanent employees of all major Group companies and generally provide defined benefits based on employees’ years of service and average final remuneration. The plans are typically structured as separate legal entities managed by trustees.
The amounts reported for the Group’s employee retirement plans are disclosed in Note 21 to the Group Financial Statements, and are calculated in line with Statement of Financial Accounting Standards No. 87 (FAS 87). These calculations require assumptions to be made of future outcomes, the principal ones being in respect of increases in remuneration and pension benefit levels, the expected long-term return on plan assets and the discount rate used to convert future cash flows to current values. The assumptions used vary for the different plans as they are determined in consultation with independent actuaries in the light of local conditions. The assumptions are reviewed annually. Expected rates of return on plan assets are calculated based on a projection of real long-term bond yields and an equity risk premium which are combined with local inflation assumptions and applied to the actual asset mix of each plan. The amount of the expected return on plan assets is calculated using the expected rate of return for the year and the market-related value at the beginning of the year. Discount rates used to calculate year-end liabilities are based on prevailing AA long-term corporate bond rates at year end. Weighted average values for the assumptions used are contained in Note 21 to the Group Financial Statements. The main change in 2004 was a 0.5% reduction in the discount rate used to calculate year-end liabilities reflecting lower long-term interest rates.
Pension cost under FAS 87 primarily represents the increase in actuarial present value of the obligation for benefits earned on employee service during the year and the interest on the obligation in respect of employee service in previous years, net of the expected return on plan assets. The FAS 87 calculations are sensitive to changes in the underlying assumptions. A change of one percentage point in the expected rate of return on plan assets would result in a change in pension cost charged to income of approximately $500 million (pre-tax) per annum. FAS 87 generally reduces income volatility because unexpected changes in the amounts of plan assets and liabilities (actuarial gains and losses) are amortised over the average remaining employee work life.
The trustees manage the pension funds and set the required contributions from Group companies based on independent actuarial valuation rather than the FAS 87 measures.
Operational and Financial Review 45
Controls and procedures
As of the end of the period covered by this Report, the management of each of the Parent Companies (with the participation in the case of Royal Dutch of its President and Managing Director and the Group Chief Financial Officer and, in the case of Shell Transport its Managing Director and the Group Chief Financial Officer) conducted an evaluation pursuant to Rule 13a-15 promulgated under the Securities Exchange Act of 1934, as amended (the Exchange Act), of the effectiveness of the design and operation of the disclosure controls and procedures of the Parent Companies and the Group. Based on this evaluation, the President and Managing Director of Royal Dutch, the Managing Director of Shell Transport and the Group Chief Financial Officer concluded that, as of the end of the period covered by this report, such disclosure controls and procedures were effective to provide reasonable assurance that information required to be disclosed by each of the Parent Companies in reports they file or submit under the Exchange Act is recorded, processed, summarised and reported, within the time periods specified in the rules and forms of the Securities and Exchange Commission (SEC).
In making the evaluation, the Companies have considered matters relating to the Reserves Restatements, including action taken during 2004 to identify deficiencies and enhance the effectiveness of disclosure controls and procedures. The Executive Committee noted the implementation of a number of structural enhancements designed to address improvement needs identified by a special report to the Group Audit Committee. Further steps will be taken through the course of 2005 to embed, sustain and build upon the enhancements made to date.
Except as described below, there has not been any change in the internal controls over financial reporting of the Group or either Parent Company that occurred during the period covered by this report that has materially affected, or is reasonably likely to affect, such internal controls over financial reporting.
Investigation and Report to the Group Audit Committee; management changes
Following the January 9, 2004 announcement of the reserves recategorisation, the Group Audit Committee (GAC) appointed Davis Polk & Wardwell to lead an independent review of the facts and circumstances surrounding the recategorisation, and to report its findings and any proposed remedial actions to the GAC for its consideration. That report, dated March 31, 2004, was presented to the GAC and subsequently to the Supervisory Board of Royal Dutch and Non-executive Directors of Shell Transport. The report was accepted in full by the GAC on April 15, 2004 and by the members of the Supervisory Board of Royal Dutch and the Non-executive Directors of Shell Transport (the Parent Company Boards) on April 16, 2004.
Following an interim report to the GAC dated March 1, 2004, which was presented to the Parent Company Boards on March 2, 2004, Sir Philip Watts, Chairman of the Committee of Managing Directors and Walter van de Vijver, Chief Executive of Exploration & Production, submitted their resignations on March 3, 2004 from all Director and officer positions within the Group and the Parent Companies. Following acceptance of the final report to the GAC by the members of the Supervisory Board of Royal Dutch and the Non-executive Directors of Shell Transport, Judith Boynton stepped aside as Group Chief Financial Officer and as Group Managing Director and Managing Director of Shell Transport on April 18, 2004. She remained with the Group in an advisory capacity reporting to the Chief Executive, Jeroen van der Veer. Ms Boynton left the Group, by mutual agreement, effective December 31, 2004.
Jeroen van der Veer, President and Managing Director of Royal Dutch, succeeded Sir Philip Watts as Chairman of the Group’s Committee of Managing Directors1; Lord Oxburgh was appointed Non-executive Chairman of Shell Transport and Chairman of Conference; and Malcolm Brinded was appointed Chief Executive of Exploration & Production, a Director of Shell Transport and Vice-Chairman of the Committee of Managing Directors. Mr Brinded resigned from his position as a Managing Director of Royal Dutch. On June 23, 2004, Peter Voser was appointed Group Chief Financial Officer and a Director of Shell Transport with effect from October 4, 2004. Linda Cook was appointed a Managing Director of Royal Dutch on August 1, 2004.
Deficiencies relating to reserves reporting
As described in greater detail on page 52, this Report gives effect to the Reserves Restatements and the Financial Restatements. In connection with the First Reserves Restatement, Royal Dutch and Shell Transport determined, based largely upon the investigation for the comparative periods and a report to the GAC, that there were deficiencies and material weaknesses in the internal controls relating to proved reserves bookings and disclosure controls that allowed volumes of oil and gas to be improperly booked and maintained as proved reserves. The inappropriate booking of certain proved reserves had an effect on the Group Financial Statements, mainly understating depreciation, depletion and amortisation. To eliminate the effects on the financial statements of the inappropriate reserves bookings, Royal Dutch and Shell Transport elected to make the First Financial Restatement. The identified deficiencies and material weaknesses relating to the booking of proved reserves consist of the following:
| – | | the Group’s guidelines for booking proved reserves were inadequate in several respects, including (i) containing inconsistencies with the SEC’s rules and published guidance |
| 1 | | On October 28, 2005, Jeroen van der Veer was appointed Group Chief Executive (see page 5). |
46 Royal Dutch/Shell Group of Companies
Controls and procedures
continued
| | | relating to proved reserves and (ii) failing to clearly and sufficiently impart these requirements and guidance to users of the guidelines; |
| |
| – | | there was a lack of appropriate resources and a confusion of roles and responsibilities with respect to the Group Reserves Co-ordinator and the Group Reserves Auditor; |
| |
| – | | the Group’s Committee of Managing Directors and the Parent Company Boards were not provided with appropriate information to inform disclosure judgments; |
| |
| – | | there were weaknesses in the finance function whereby the Chief Financial Officers of the businesses did not have direct reporting responsibility to the Group Chief Financial Officer; |
| |
| – | | there were unclear lines of responsibility for booking proved reserves; |
| |
| – | | there was a lack of understanding at various levels of the Group of the meaning and importance of disclosure obligations under the SEC’s rules and published guidance relating to proved reserves; and |
| |
| – | | there was a control environment that did not emphasise the paramount importance of the compliance element of proved reserves decisions. |
Remedial actions taken in 2004
To address the weaknesses in the controls relating to reserves bookings identified above, the Parent Companies and the Group implemented a number of remedial actions. During March 2004 through April 2004, the Group conducted an extensive special review of the global reserves portfolio with the assistance of external reserve consultants, Ryder Scott Company. During July 2004 through December 2004, asset teams in each operating unit, using the revised guidelines and assisted in certain cases by external consultants, undertook a reservoir-by-reservoir review of substantially all of the Group’s proved reserves volumes reported as at December 31, 2003, as part of the Group’s annual reserves determination process. In addition, teams from internal audit, assisted by separate external consultants, conducted on-site reviews as part of an audit process that covered approximately 90% of such originally reported proved reserves. These reviews led to the Second Reserves Restatement. See “Supplementary information — Oil and Gas (unaudited)” on pages 92 to 103. The Parent Companies and the Group also effected the management changes described above under “Investigation and Report to Group Audit Committee; management changes”. In addition, as discussed in the report to the GAC, the following remedial actions were taken or are in progress:
| – | | Global Reserves Committee.The Group established the Global Exploration & Production Reserves Committee (the “Reserves Committee”) in order to improve consistency of standards and their application across the Group’s operations globally and strengthen the oversight of the process for approving the booking of proved reserves. |
| |
| – | | Group Reserves Guidelines.The Group’s guidelines for booking proved reserves have been revised with the assistance of independent petroleum engineers and counsel to ensure that these guidelines conform fully with applicable SEC rules and guidance, clarify the criteria for booking and de-booking of proved reserves (and the distinctions between regulatory requirements and the Group’s internal reserves classifications) and improve their utility for all users. It is expected that future revisions of the guidelines will occur only as necessary and as early as possible in the year to allow engineers to understand the implications well in advance of the submission of reserves volumes at year-end. |
| |
| – | | Training Reserves Guidelines Users.In 2004, the Group began, and in early 2005 completed training approximately 3,000 employees in the use of the revised Group Reserves Guidelines. |
| |
| – | | Overhaul of the office of Group Reserves Co-ordinator.Given the technical and compliance elements of reserves determinations, the Group Reserves Co-ordinator will no longer report to business planning or strategy executives in Exploration & Production but to the Director of Technology. More staff have been and will be employed to resource the vital function of the Group Reserves Co-ordinator who will also regularly use independent petroleum engineers as deemed necessary, including for the systematic training of engineers in the field. The Group Reserves Co-ordinator is responsible for the revision and ongoing maintenance and application of the Group’s Guidelines, and as such is responsible for identifying and resolving difficult areas of interpretation with the Reserves Committee and the Group Reserves Auditor as well as for identifying training needs and facilitating training sessions from both a technical and regulatory perspective. The Group Reserves Co-ordinator also has an obligation to liaise with internal legal staff on disclosure judgments on the basis of technical compliance and/or materiality. |
| |
| – | | Overhaul of the office of Group Reserves Auditor.The Group Reserves Auditor function has been assigned additional employees so that the audit cycle of the Group’s reserves can be made more frequent and each audit can be made more rigorous. The Group Reserves Auditor and his or her staff now report to the Group Chief Internal Auditor to increase the independence of the Group Reserves Auditor function. The Group Reserves Auditor also regularly uses independent external petroleum engineers to complement and develop in-house expertise. |
Operational and Financial Review 47
| – | | Clarification of roles and responsibilities of the Group Reserves Auditor and the Group Reserves Co-ordinator.The roles of the Group Reserves Auditor and Group Reserves Co-ordinator have been redefined to make clear that they must retain a respectful separation and independence so as to allow the Group Reserves Auditor to challenge the Group Reserves Co-ordinator and Exploration & Production reserve booking decisions more effectively as parts of the Group internal audit function. |
| |
| – | | Removal of reserves from scorecards.Scorecards are used internally to gauge the performance of the Group’s businesses against identified goals for purposes of management evaluation and for calculating management bonuses. Reserves bookings have been removed from performance scorecards of individuals associated with the reserves assurance process, including senior executives. |
| |
| – | | Improved visibility and accounting of reserves issues by senior management and Directors.The Group’s Executive Committee (prior to October 2004, the Group’s Committee of Managing Directors) collectively approve the reserve bookings and de-bookings taken by Exploration & Production. Following this approval, a review of the overall outcome is considered by the Group Audit Committee. |
| |
| – | | Enhanced accountability of Business CFOs to the Group CFO. The Chief Financial Officers of the businesses now report directly to the Group Chief Financial Officer. This reorganisation is designed to improve the ability of the Group Chief Financial Officer to have effective oversight of financial issues relating to the business units. It also enables the Group Chief Financial Officer, in turn, to inform colleagues and Directors of important disclosure issues, as required. |
| |
| – | | Strengthening of line responsibilities for reserve reporting.The line authorities and accountabilities for reserve reporting have been reinforced as follows: |
| | – | | to clarify that the local Chief Reservoir Engineer is responsible for ensuring that reserves bookings and de-bookings are compliant with SEC rules and requiring that any booking and de-booking decisions are only made with appropriate, auditable documentation and after completion of the appropriate challenge processes; |
| |
| | – | | to place business and financial responsibility on the Regional Technical Director and Regional Finance Director, respectively, for the decisions of their Chief Reservoir Engineer; |
| |
| | – | | to clarify that responsibility for booking and de-booking decisions rests with the Chief Financial Officer of Exploration & Production and the Director of Technology of Exploration & Production, working together with the Group Reserves Co-ordinator and the other members of the Reserves Committee; |
| |
| | – | | to provide for the approval of these decisions by the Group’s Executive Committee; and |
| |
| | – | | finally, to provide for final review by the Group Audit Committee. |
| – | | Enhancement of the Legal Function.To improve the ability of the senior management to benefit from appropriate legal advice, provision has been made for the Group Legal Director to have the ability to attend meetings of the Group’s Executive Committee, the Conference and the Parent Company Boards. Similarly, the General Counsel of the various businesses, who attend the executive committee meetings of those businesses, have been expressly given the task of identifying disclosure issues for consideration at a higher level. All lawyers at the Group level and the Parent Companies, including the Corporate Secretaries of the Parent Companies, now report to the Group Legal Director, except to the extent inappropriate under applicable legal and fiduciary requirements or governance codes when they report directly to the Parent Company Boards. The legal function has been given responsibility for actively identifying training needs in areas of disclosure, reporting obligations and corporate governance and devising training programmes to address those needs. |
| |
| – | | Enhancement of the Disclosure Committee.The role of the Group’s existing Disclosure Committee has been enhanced and the Committee is now chaired by the Group Legal Director. The Disclosure Committee has also been given regular access to the Group’s Executive Committee to assess the adequacy of disclosures and ensure the awareness and approval of the Group’s Executive Committee of those disclosures. In carrying out its responsibility to ensure accuracy, completeness and consistency with other disclosures, the Disclosure Committee will be asked to provide a second level of control over the substantive content of disclosures. |
| |
| – | | Reduction of Job Rotation.The Group examines the tenure of individuals in key functions. While it is important for numerous reasons to expose people to different experiences within the Group, it is accepted that the period of rotation of certain positions should be extended and, upon rotation, complete and detailed handover notes should form the basis for a formal transfer. |
| |
| – | | Document Retention Policy.A consistent policy has been prepared to be put into place. Following implementation, this policy will be disseminated throughout the Group. |
| |
| – | | Promoting Communication and Compliance.Group-wide communications have taken place, and will continue, in which the Group’s senior management emphasises to all employees that integrity and compliance concerns must be raised with the internal audit or legal functions, and must be investigated thoroughly and openly, regardless of who is involved. This policy will be communicated forcefully and frequently. Moreover, a working group of senior executives has been formed to evaluate ways to enhance the effectiveness of the Group’s compliance efforts and to promote consistent communication of compliance requirements throughout the Group. A Group Compliance Officer was appointed in January 2005. |
48 Royal Dutch/Shell Group of Companies
Report of the Registered Independent Public Accounting Firms on the US GAAP Financial Statements
To Royal Dutch Petroleum Company and The “Shell” Transport and Trading Company, p.l.c.
We have audited the Financial Statements appearing on pages 49 to 81 of the Royal Dutch/Shell Group of Companies for the years 2004, 2003, and 2002. The preparation of the Financial Statements is the responsibility of management. Our responsibility is to express an opinion on the Financial Statements based on our audits.
We conducted our audits in accordance with the Standards of the Public Company Accounting Oversight Board (United States). Those standards require that we plan and perform the audit to obtain reasonable assurance about whether the Financial Statements are free of material misstatement. An audit includes examining, on a test basis, evidence supporting the amounts and disclosures in the Financial Statements. An audit also includes assessing the accounting principles used and significant estimates made by management in the preparation of the Financial Statements, as well as evaluating the overall Financial Statement presentation. We believe that our audits provide a reasonable basis for our opinion.
In our opinion, the Financial Statements referred to above present fairly, in all material respects, the financial position of the Royal Dutch/Shell Group of Companies at December 31, 2004 and 2003 and the results of its operations and its cash flows for each of the three years in the period ended December 31, 2004 in accordance with generally accepted accounting principles in the United States of America.
As discussed in Note 2 on pages 52 to 55, the Group has restated its Financial Statements for the two years ended December 31, 2003, to correct for the financial impact of the Second Reserves Restatement.
As discussed in Note 3 on pages 55 to 59, the Group adopted the provisions of Statement of Financial Accounting Standard No. 143 “Accounting for Asset Retirement Obligations” as of January 1, 2003; the Group adopted the provisions of Financial Accounting Standards Board Interpretation No. 46 “Consolidation of Variable Interest Entities — an interpretation of ARB51” as of September 30, 2003.
KPMG Accountants N.V.
The Hague – The Netherlands
Registered independent public accounting firm
PricewaterhouseCoopers LLP
London – United Kingdom
Registered independent public accounting firm
April 27, 2005
US GAAP Financial Statements 49
US GAAP Financial Statements
| | | | | | | | | | | | | | | | | |
| Statement of Income | | $ million | |
| | | | | | | | | | | 2003 | | | 2002 | |
| | | Note | | | 2004 | | | As restated | a | | As restated | a |
| |
| Sales proceeds | | | | | | | 337,522 | | | | 263,889 | | | | 218,287 | |
| Sales taxes, excise duties and similar levies | | | | | | | 72,332 | | | | 65,527 | | | | 54,834 | |
| |
Net proceedsb | | | | | | | 265,190 | | | | 198,362 | | | | 163,453 | |
Cost of salesc | | | | | | | 221,678 | | | | 165,147 | | | | 135,658 | |
| |
Gross profit | | | | | | | 43,512 | | | | 33,215 | | | | 27,795 | |
| Selling and distribution expenses | | | | | | | 12,340 | | | | 11,409 | | | | 9,617 | |
| Administrative expenses | | | | | | | 2,516 | | | | 1,870 | | | | 1,587 | |
| Exploration | | | | | | | 1,823 | | | | 1,475 | | | | 1,052 | |
| Research and development | | | | | | | 553 | | | | 584 | | | | 472 | |
| |
| Operating profit of Group companies | | | | | | | 26,280 | | | | 17,877 | | | | 15,067 | |
| Share of operating profit of associated companies | | | 7 | | | | 5,653 | | | | 3,446 | | | | 2,792 | |
| |
Operating profit | | | | | | | 31,933 | | | | 21,323 | | | | 17,859 | |
| Interest and other income | | | 8 | | | | 1,705 | | | | 1,967 | | | | 748 | |
| Interest expense | | | 9 | | | | 1,214 | | | | 1,324 | | | | 1,291 | |
| Currency exchange gains/(losses) | | | | | | | (39 | ) | | | (231 | ) | | | (25 | ) |
| |
Income before taxation | | | | | | | 32,385 | | | | 21,735 | | | | 17,291 | |
| Taxation | | | 10 | | | | 15,136 | | | | 9,349 | | | | 7,647 | |
| |
| Income after taxation | | | | | | | 17,249 | | | | 12,386 | | | | 9,644 | |
| Income applicable to minority interests | | | | | | | 626 | | | | 353 | | | | 175 | |
| |
Income from continuing operations | | | | | | | 16,623 | | | | 12,033 | | | | 9,469 | |
| Income from discontinued operations, net of tax | | | 4 | | | | 1,560 | | | | 25 | | | | 187 | |
| Cumulative effect of a change in accounting principle, net of tax | | | 3 | | | | — | | | | 255 | | | | — | |
| |
Net income | | | | | | | 18,183 | | | | 12,313 | | | | 9,656 | |
| |
| | | | | | | | | | | | | | | | | |
| Statement of Comprehensive Income and Parent Companies’ interest in Group net assets | | | $ million | |
| | | | | | | | | | | 2003 | | | 2002 | |
| | | Note | | | 2004 | | | As restated | | | As restated | |
| |
Net income | | | | | | | 18,183 | | | | 12,313 | | | | 9,656 | |
| Other comprehensive income, net of tax: | | | 6 | | | | | | | | | | | | | |
| currency translation differences | | | 20 | | | | 3,148 | | | | 5,102 | | | | 2,432 | |
| unrealised gains/(losses) on securities | | | | | | | (350 | ) | | | 689 | | | | 25 | |
| unrealised gains/(losses) on cash flow hedges | | | | | | | 31 | | | | 51 | | | | (225 | ) |
| minimum pension liability adjustments | | | | | | | (185 | ) | | | 358 | | | | (1,475 | ) |
| |
Comprehensive income | | | | | | | 20,827 | | | | 18,513 | | | | 10,413 | |
| Distributions to Parent Companies | | | | | | | (7,989 | ) | | | (5,660 | ) | | | (5,435 | ) |
| Increase in Parent Companies’ shares held, net of dividends received | | | 23 | | | | (759 | ) | | | (631 | ) | | | (844 | ) |
| Loss on sale of Parent Companies’ shares | | | | | | | — | | | | (1 | ) | | | — | |
| Parent Companies’ interest in Group net assets at January 1 | | | | | | | 72,497 | | | | 60,276 | | | | 56,142 | |
Parent Companies’ interest in Group net assets at December 31 | | | 5 | | | | 84,576 | | | | 72,497 | | | | 60,276 | |
| |
| |
| a See Note 2. | |
| |
| b Includes net proceeds related to buy/sell contracts: | | | 3 | | | | 24,744 | | | | 19,795 | | | | 14,267 | |
| |
| c Includes costs related to buy/sell contracts: | | | 3 | | | | 24,719 | | | | 19,713 | | | | 14,419 | |
The Notes on pages 52 to 81 are an integral part of these statements.
50 Royal Dutch/Shell Group of Companies
| | | | | | | | | | | | | |
| Statement of Assets and Liabilities | | $ million | |
| | | | | | | | | | | Dec 31, | |
| | | | | | | Dec 31, | | | 2003 | |
| | | Note | | | 2004 | | | As restated | a |
| |
Fixed assets | | | | | | | | | | | | |
| Tangible assets | | | 11 | | | | 88,940 | | | | 87,088 | |
| Intangible assets | | | 11 | | | | 4,890 | | | | 4,735 | |
| Investments: | | | | | | | | | | | | |
| associated companies | | | 7 | | | | 19,743 | | | | 19,371 | |
| securities | | | 15 | | | | 1,627 | | | | 2,317 | |
| other | | | | | | | 1,121 | | | | 1,086 | |
| |
Total fixed assets | | | | | | | 116,321 | | | | 114,597 | |
| |
Other long-term assets | | | | | | | | | | | | |
| Prepaid pension costs | | | 21 | | | | 8,278 | | | | 6,516 | |
| Deferred taxation | | | 10 | | | | 1,995 | | | | 2,092 | |
| Other | | | 12 | | | | 4,369 | | | | 2,741 | |
| |
Total other long-term assets | | | | | | | 14,642 | | | | 11,349 | |
| |
Current assets | | | | | | | | | | | | |
| Inventories | | | 13 | | | | 15,391 | | | | 12,690 | |
| Accounts receivable | | | 14 | | | | 37,998 | | | | 28,969 | |
| Cash and cash equivalents | | | 15 | | | | 8,459 | | | | 1,952 | |
| |
Total current assets | | | | | | | 61,848 | | | | 43,611 | |
| |
Current liabilities:amounts due within one year | | | | | | | | | | | | |
| Short-term debt | | | 16 | | | | 5,822 | | | | 11,027 | |
| Accounts payable and accrued liabilities | | | 18 | | | | 40,207 | | | | 32,347 | |
| Taxes payable | | | 10 | | | | 9,885 | | | | 5,927 | |
| Dividends payable to Parent Companies | | | | | | | 4,750 | | | | 5,123 | |
| |
Total current liabilities | | | | | | | 60,664 | | | | 54,424 | |
| |
Net current assets/(liabilities) | | | | | | | 1,184 | | | | (10,813 | ) |
| |
Total assets less current liabilities | | | | | | | 132,147 | | | | 115,133 | |
| |
Long-term liabilities:amounts due after more than one year | | | | | | | | | | | | |
| Long-term debt | | | 16 | | | | 8,600 | | | | 9,100 | |
| Other | | | 19 | | | | 8,065 | | | | 6,054 | |
| |
| | | | | | | | 16,665 | | | | 15,154 | |
| |
Provisions | | | | | | | | | | | | |
| Deferred taxation | | | 10 | | | | 14,844 | | | | 15,185 | |
| Pensions and similar obligations | | | 21 | | | | 5,044 | | | | 4,927 | |
| Decommissioning and restoration costs | | | 24 | | | | 5,709 | | | | 3,955 | |
| |
| | | | | | | | 25,597 | | | | 24,067 | |
| |
Group net assets before minority interests | | | | | | | 89,885 | | | | 75,912 | |
| Minority interests | | | | | | | 5,309 | | | | 3,415 | |
| |
Net assets | | | | | | | 84,576 | | | | 72,497 | |
| |
The Notes on pages 52 to 81 are an integral part of these statements.
US GAAP Financial Statements 51
| | | | | | | | | | | | | | | | | |
| Statement of Cash Flows(see Note 20) | | $ million | |
| | | | | | | | | | | 2003 | | | 2002 | |
| | | Note | | | 2004 | | | As restated | | | As restated | |
| |
Cash flow provided by operating activities | | | | | | | | | | | | | | | | |
| Net income | | | | | | | 18,183 | | | | 12,313 | | | | 9,656 | |
| Adjustments to reconcile net income to cash flow provided by operating activities | | | | | | | | | | | | | | | | |
| Depreciation, depletion and amortisation | | | 11 | | | | 12,273 | | | | 11,711 | | | | 8,739 | |
| Profit on sale of assets | | | | | | | (3,033 | ) | | | (2,141 | ) | | | (367 | ) |
| Movements in: | | | | | | | | | | | | | | | | |
| inventories | | | | | | | (2,731 | ) | | | (236 | ) | | | (2,079 | ) |
| accounts receivable | | | | | | | (8,462 | ) | | | 1,834 | | | | (5,830 | ) |
| accounts payable and accrued liabilities | | | | | | | 7,708 | | | | (212 | ) | | | 6,989 | |
| taxes payable | | | | | | | 2,999 | | | | (218 | ) | | | (735 | ) |
| Associated companies: dividends more/(less) than net income | | | 7 | | | | 258 | | | | 511 | | | | 117 | |
| Deferred taxation and other provisions | | | | | | | (524 | ) | | | (621 | ) | | | 423 | |
| Long-term liabilities and other | | | | | | | (1,798 | ) | | | (1,588 | ) | | | (805 | ) |
| Income applicable to minority interests | | | | | | | 714 | | | | 366 | | | | 175 | |
| |
Cash flow provided by operating activities | | | | | | | 25,587 | | | | 21,719 | | | | 16,283 | |
| |
Cash flow used in investing activities | | | | | | | | | | | | | | | | |
| Capital expenditure (including capitalised leases) | | | 11 | | | | (12,734 | ) | | | (12,252 | ) | | | (12,102 | ) |
| Acquisitions (Enterprise Oil, Pennzoil-Quaker State and additional shares in Equilon) | | | | | | | | | | | | | | | (8,925 | ) |
| Proceeds from sale of assets | | | | | | | 5,078 | | | | 2,286 | | | | 1,099 | |
| New investments in associated companies | | | 7 | | | | (1,058 | ) | | | (983 | ) | | | (1,289 | ) |
| Disposals of investments in associated companies | | | | | | | 1,328 | | | | 708 | | | | 501 | |
| Proceeds from sale and other movements in investments | | | | | | | 1,743 | | | | 1,989 | | | | 83 | |
| |
Cash flow used in investing activities | | | | | | | (5,643 | ) | | | (8,252 | ) | | | (20,633 | ) |
| |
Cash flow used in financing activities | | | | | | | | | | | | | | | | |
| Long-term debt (including short-term part): | | | | | | | | | | | | | | | | |
| new borrowings | | | | | | | 544 | | | | 572 | | | | 5,267 | |
| repayments | | | | | | | (1,688 | ) | | | (2,740 | ) | | | (5,610 | ) |
| |
| | | | | | | | (1,144 | ) | | | (2,168 | ) | | | (343 | ) |
| Net increase/(decrease) in short-term debt | | | | | | | (3,701 | ) | | | (2,507 | ) | | | 7,058 | |
| Change in minority interests | | | | | | | 807 | | | | (1,363 | ) | | | 421 | |
| Dividends paid to: | | | | | | | | | | | | | | | | |
| Parent Companies | | | | | | | (8,490 | ) | | | (6,248 | ) | | | (6,961 | ) |
| minority interests | | | | | | | (264 | ) | | | (300 | ) | | | (228 | ) |
| |
Cash flow used in financing activities | | | | | | | (12,792 | ) | | | (12,586 | ) | | | (53 | ) |
| |
Parent Companies’ shares: net sales/(purchases) and dividends received | | | | | | | (758 | ) | | | (633 | ) | | | (864 | ) |
| Currency translation differences relating to cash and cash equivalents | | | | | | | 113 | | | | 148 | | | | 153 | |
| |
Increase/(decrease) in cash and cash equivalents | | | | | | | 6,507 | | | | 396 | | | | (5,114 | ) |
| |
| Cash and cash equivalents at January 1 | | | | | | | 1,952 | | | | 1,556 | | | | 6,670 | |
| |
| Cash and cash equivalents at December 31 | | | | | | | 8,459 | | | | 1,952 | | | | 1,556 | |
| |
The Notes on pages 52 to 81 are an integral part of these statements.
52 Royal Dutch/Shell Group of Companies
Notes to the US GAAP Financial Statements
1 The Royal Dutch/Shell Group of Companies
The Parent Companies, Royal Dutch Petroleum Company (Royal Dutch) and The “Shell” Transport and Trading Company, p.l.c. (Shell Transport) are holding companies which together own, directly or indirectly, investments in numerous companies known collectively as the Royal Dutch/Shell Group. Group companies are engaged in all principal aspects of the oil and natural gas industry. They also have interests in chemicals and additional interests in power generation and renewable energy (chiefly in wind and solar energy). The Group conducts its business through five principal segments, Exploration & Production, Gas & Power, Oil Products, Chemicals and Other industry segments. These activities are conducted in more than 140 countries and territories and are subject to changing economic, regulatory and political conditions.
Arrangements between Royal Dutch and Shell Transport provide,inter alia, that notwithstanding variations in shareholdings, Royal Dutch and Shell Transport shall share in the aggregate net assets and in the aggregate dividends and interest received from Group companies in the proportion of 60:40. It is further arranged that the burden of all taxes in the nature of, or corresponding to, an income tax leviable in respect of such dividends and interest shall fall in the same proportion. Dividends are paid by Group companies to Royal Dutch and Shell Transport in euros and pounds sterling, respectively. The division of Group net assets between the Parent Companies and movements therein, including movements resulting from Group net income and distributions to the Parent Companies, are disclosed in Note 30 to these Financial Statements.
Unification Proposal
On October 28, 2004, the Royal Dutch and Shell Transport Boards announced that they had unanimously agreed, in principle, to propose to their shareholders a transaction (the “Transaction”) through which each Parent Company will become a subsidiary of Royal Dutch Shell plc, which will become a publicly-listed company incorporated in England and Wales and headquartered and tax resident in the Netherlands (“Royal Dutch Shell”).
Reflecting the existing 60:40 ownership by Royal Dutch and Shell Transport of the Group, it is proposed that Royal Dutch shareholders will be offered 60% of the ordinary share capital in Royal Dutch Shell and Shell Transport shareholders will receive 40% of the ordinary share capital in Royal Dutch Shell. To implement the proposal, it is intended that (i) Royal Dutch Shell will make an offer to acquire all of the issued and outstanding ordinary shares of Royal Dutch in exchange for Royal Dutch Shell Class A ordinary shares or American depositary shares (“ADSs”) representing Royal Dutch Shell Class A ordinary shares and (ii) Royal Dutch Shell will become the parent company of Shell Transport pursuant to a United Kingdom reorganisational procedure referred to as a “scheme of arrangement” under section 425 of the UK Companies Act 1985, as amended. As a result of the scheme of arrangement, holders of Shell Transport Ordinary shares (and holders of Shell Transport bearer warrants) will receive Royal Dutch Shell Class B ordinary shares and holders of Shell Transport ADSs will receive ADSs representing Royal Dutch Shell Class B ordinary shares. The Class A ordinary shares and Class B ordinary shares will have identical voting rights and will vote together as a single class on all matters, including the election of Directors, unless a matter affects the rights of one class as a separate class. Class A ordinary shares and Class B ordinary shares will have identical rights upon a liquidation of Royal Dutch Shell and dividends declared on each will be equivalent in amount. However, for tax purposes, holders of Class A ordinary shares will receive Dutch source dividends, while holders of Class B ordinary shares will receive dividends that are UK source to the extent that these dividends are paid through a dividend access mechanism to be established. Implementation of the Transaction will be the subject of appropriate consultation with relevant employee representative bodies as required as well as the satisfaction of certain other conditions. It is currently expected that the Transaction will be completed in July 2005.
2 Restatement of previously issued Financial Statements
First Reserves Restatement
On January 9, 2004, the Group announced the removal from proved reserves of approximately 3.9 billion barrels of oil equivalent (boe) of oil and natural gas that were originally reported as of December 31, 2002. As a result of further field level reviews concluded in April 2004 with the assistance of external petroleum consultants of over 90% of the Group’s proved reserves volumes (collectively, the First Half Review), the Group determined to increase the total volume of reserves to be removed from the proved category to 4.47 billion boe and to restate the unaudited oil and natural gas reserves disclosures contained in the supplementary information accompanying the Financial Statements (the First Reserves Restatement) to give effect to the removal of these volumes as of the earliest date on which they did not represent “proved reserves” within the applicable rules of the Securities and Exchange Commission (SEC) (which in many cases
Notes to the US GAAP Financial Statements 53
is the date on which the volumes were initially booked as proved reserves). 12% of the volumes de-booked as of December 31, 2002 as part of the First Reserves Restatement had been in the proved developed reserves category and 88% had been categorised as proved undeveloped reserves. The effects of First Reserves Restatement were reflected in the 2003 Annual Report and Accounts and the 2003 Annual Report on Form 20-F as originally filed with the SEC on June 30, 2004.
Following the January 9, 2004 announcement of the initial reserves recategorisation, the Group Audit Committee (GAC) appointed Davis Polk & Wardwell to lead an independent review of the facts and circumstances surrounding the recategorisation, and to report its findings and any proposed remedial actions to the GAC for its consideration. Based largely on the Davis Polk & Wardwell report, the Parent Companies, Royal Dutch and Shell Transport, determined that the principal causes that permitted the initial booking and maintenance of the volumes impacted by the First Reserves Restatement as proved reserves are as follows:
| – | | the Group’s guidelines for booking proved reserves were inadequate in several respects, including (i) containing inconsistencies with the SEC’s rules and published guidance relating to proved reserves and (ii) failing to clearly and sufficiently impart these requirements and guidance to users of the guidelines. In addition, users of the guidelines in certain cases misapplied or disregarded SEC rules and published guidance and in some cases only applied changes in the guidelines prospectively rather than retrospectively. There was also insufficient knowledge and training among users of the guidelines of the SEC requirements relating to proved reserves; |
| |
| – | | executives and employees encouraged the booking of proved reserves, while discouraging the de-booking of previously booked reserves. This fostered an atmosphere that failed to emphasise the paramount importance of the compliance element of proved reserves decisions; and |
| |
| – | | there were other material weaknesses in the Group’s controls relating to the booking of proved reserves, including insufficient resources allocated to the Group Reserves Auditor and Group Reserves Co-ordinator functions, a lack of clarity in the allocation of responsibilities between the Group Reserves Auditor and the Group Reserves Co-ordinator and a lack of direct reporting responsibility of the Group Reserves Auditor to the Group internal audit function and of the business Chief Financial Officers to the Group Chief Financial Officer. |
Second Reserves Restatement
On February 3, 2005, as a result of reservoir level reviews conducted during July 2004 through December 2004 of substantially all of the Group’s proved reserves volumes reported as at December 31, 2003 (collectively, the Second Half Review), the Group announced that it would remove from proved reserves an additional 1,371 million boe of oil and natural gas that were reported as at December 31, 2003 and further restate the unaudited oil and natural gas reserves disclosures contained in the supplementary information accompanying the Financial Statements (the Second Reserves Restatement and, together with the First Reserves Restatement, the Reserves Restatements) to give effect to the removal of these volumes as of the earliest date on which they did not represent “proved reserves” within the applicable rules of the SEC (which in many cases is the date on which the volumes were initially booked as proved reserves). 43% of the volumes de-booked as of December 31, 2003 as part of the Second Reserves Restatement had been categorised as proved developed reserves and 57% had been categorised as proved undeveloped reserves. The effects of the Second Reserves Restatement are reflected in the comparative periods presented in these Financial Statements. These effects were also reflected in Amendment No. 2 to the 2003 Annual Report on Form 20-F, as filed with the SEC on March 7, 2005.
Second Financial Restatement
In view of the inappropriate overstatement of unaudited proved reserves information resulting in the Second Reserves Restatement, it was determined to restate the Financial Statements of the Group and each of the Parent Companies for the year ended December 31, 2003 and prior periods (the Second Financial Restatement) to reflect the impact of the Second Reserves Restatement on those Financial Statements (as announced on February 3, 2005). This overstatement of unaudited proved reserves information had the effect of understating the depreciation, depletion and amortisation charges related to Exploration & Production in each of the years covered by the Second Financial Restatement. As capitalised costs relating to Exploration & Production were amortised across fewer proved reserves (following the Second Reserves Restatement), depreciation, depletion and amortisation associated with annual production volumes increased proportionally.
54 Royal Dutch/Shell Group of Companies
2 Restatement of previously issued Financial Statementscontinued
The effect of the Second Financial Restatement was to reduce net income in 2003 by $183 million (2002: $66 million), of which additional depreciation in 2003 was $289 million (2002: $118 million), and to reduce the previously reported net assets as at December 31, 2003 by $351 million. The effects of the Second Financial Restatement are reflected in the comparative periods presented in these Financial Statements. These effects were also reflected in Amendment No. 2 to the 2003 Annual Report on Form 20-F, as filed with the SEC on March 7, 2005. The impact on the information included in these Financial Statements is summarised in the tables below:
| | | | | | | | | | | | | | | | | | | | | | | | | | | | | | | | | | | | | | | | | |
| | | $ million | |
| | | 2003 | | | 2002 | |
| | | | | | | | | | | | | | | Reclassification | | | | | | | | | | | | | | | | | | | Reclassification | | | | |
| | | As | | | Second | | | | | | | for | | | | | | | As | | | Second | | | | | | | for | | | | |
| | | originally | | | Reserves | | | | | | | discontinued | | | | | | | previously | | | Reserves | | | | | | | discontinued | | | | |
| Statement of Income | | reporteda | | | Restatement | | | As restated | | | operationsb | | | As restated | | | restateda | | | Restatement | | | As restated | | | operationsb | | | As restated | |
| |
| Net proceeds | | | 201,728 | | | | — | | | | 201,728 | | | | (3,366 | ) | | | 198,362 | | | | 166,601 | | | | — | | | | 166,601 | | | | (3,148 | ) | | | 163,453 | |
| Cost of sales | | | 167,500 | | | | 289 | | | | 167,789 | | | | (2,642 | ) | | | 165,147 | | | | 137,997 | | | | 118 | | | | 138,115 | | | | (2,457 | ) | | | 135,658 | |
| Exploration | | | 1,476 | | | | — | | | | 1,476 | | | | (1 | ) | | | 1,475 | | | | 1,073 | | | | — | | | | 1,073 | | | | (21 | ) | | | 1,052 | |
| Other operating expenses | | | 14,428 | | | | — | | | | 14,428 | | | | (565 | ) | | | 13,863 | | | | 12,027 | | | | — | | | | 12,027 | | | | (351 | ) | | | 11,676 | |
| Share of operating profit of associated companies | | | 3,484 | | | | (19 | ) | | | 3,465 | | | | (19 | ) | | | 3,446 | | | | 2,822 | | | | (6 | ) | | | 2,816 | | | | (24 | ) | | | 2,792 | |
| |
Operating profit | | | 21,808 | | | | (308 | ) | | | 21,500 | | | | (177 | ) | | | 21,323 | | | | 18,326 | | | | (124 | ) | | | 18,202 | | | | (343 | ) | | | 17,859 | |
| Net interest (income)/expense and currency exchange (gains)/losses | | | (370 | ) | | | — | | | | (370 | ) | | | (42 | ) | | | (412 | ) | | | 629 | | | | — | | | | 629 | | | | (61 | ) | | | 568 | |
| |
Income before taxation | | | 22,178 | | | | (308 | ) | | | 21,870 | | | | (135 | ) | | | 21,735 | | | | 17,697 | | | | (124 | ) | | | 17,573 | | | | (282 | ) | | | 17,291 | |
| Taxation | | | 9,572 | | | | (126 | ) | | | 9,446 | | | | (97 | ) | | | 9,349 | | | | 7,796 | | | | (54 | ) | | | 7,742 | | | | (95 | ) | | | 7,647 | |
| Minority interests | | | 365 | | | | 1 | | | | 366 | | | | (13 | ) | | | 353 | | | | 179 | | | | (4 | ) | | | 175 | | | | — | | | | 175 | |
| |
Income from continuing operations | | | 12,241 | | | | (183 | ) | | | 12,058 | | | | (25 | ) | | | 12,033 | | | | 9,722 | | | | (66 | ) | | | 9,656 | | | | (187 | ) | | | 9,469 | |
| Income from discontinued operations, net of tax | | | — | | | | — | | | | — | | | | 25 | | | | 25 | | | | — | | | | — | | | | — | | | | 187 | | | | 187 | |
| Cumulative effect of a change in accounting principle, net of tax | | | 255 | | | | — | | | | 255 | | | | — | | | | 255 | | | | — | | | | — | | | | — | | | | — | | | | — | |
| |
Net income | | | 12,496 | | | | (183 | ) | | | 12,313 | | | | — | | | | 12,313 | | | | 9,722 | | | | (66 | ) | | | 9,656 | | | | — | | | | 9,656 | |
| |
| a | | As reported in the 2003 Annual Report and Accounts and the 2003 Annual Report on Form 20-F, as filed with the SEC on June 30, 2004. |
| |
| b | | As a consequence of the separate reporting of income from discontinued operations (see Note 4), information for comparative periods has been reclassified where necessary. |
The financial effect of the First Reserves Restatement was to reduce net income in 2002 by $108 million, all of which was reflected in the 2003 Annual Report and Accounts and the 2003 Annual Report on Form 20-F, as originally filed with the SEC on June 30, 2004. The combined financial effect of the First Reserves Restatement and the Second Reserves Restatement was a reduction in net income of $183 million in 2003 (2002: $174 million).
| | | | | | | | | | | | | | | | | | | | | | | | | |
| | | $ million | |
| | | 2003 | | | 2002 | |
| | | As | | | Second | | | | | | | As | | | Second | | | | |
| | | originally | | | Reserves | | | As | | | previously | | | Reserves | | | As | |
| Earnings by industry segment | | reporteda | | | Restatement | | | restated | | | restateda | | | Restatement | | | restated | |
| |
| Exploration & Production | | | 9,105 | | | | (182 | ) | | | 8,923 | | | | 6,796 | | | | (70 | ) | | | 6,726 | |
| Gas & Power | | | 2,289 | | | | — | | | | 2,289 | | | | 774 | | | | — | | | | 774 | |
| Oil Products | | | 2,860 | | | | — | | | | 2,860 | | | | 2,627 | | | | — | | | | 2,627 | |
| Chemicals | | | (209 | ) | | | — | | | | (209 | ) | | | 565 | | | | — | | | | 565 | |
| Corporate and Other | | | (1,184 | ) | | | — | | | | (1,184 | ) | | | (861 | ) | | | — | | | | (861 | ) |
| Minority interests | | | (365 | ) | | | (1 | ) | | | (366 | ) | | | (179 | ) | | | 4 | | | | (175 | ) |
| |
Net income | | | 12,496 | | | | (183 | ) | | | 12,313 | | | | 9,722 | | | | (66 | ) | | | 9,656 | |
| |
| a | | As reported in the 2003 Annual Report and Accounts and the 2003 Annual Report on Form 20-F, as filed with the SEC on June 30, 2004. |
The financial effect of the First Reserves Restatement was a reduction in Exploration & Production earnings of $101 million and an increase in minority interests of $7 million in 2002, all of which was reflected in the 2003 Annual Report and Accounts and the 2003 Annual Report on Form 20-F, as originally filed with the SEC on June 30, 2004. The combined financial effect of the First Reserves Restatement and the Second Reserves Restatement was a reduction in Exploration & Production earnings of $182 million in 2003 (2002: $171 million) and an increase in minority interests of $1 million in 2003 (2002: $3 million).
Notes to the US GAAP Financial Statements 55
| | | | | | | | | | | | | | | | | | | | | |
| | | $ million | |
| | | December 31, 2003 | |
| | | As | | | Second | | | | | | | Reclassification | | | | |
| | | originally | | | Reserves | | | | | | | for deferred | | | | |
| Statement of Assets and Liabilities | | reporteda | | | Restatement | | | As restated | | | taxb | | | As restated | |
| |
| Fixed assets | | | | | | | | | | | | | | | | | | | | |
| Tangible | | | 87,701 | | | | (613 | ) | | | 87,088 | | | | — | | | | 87,088 | |
| Intangible | | | 4,735 | | | | — | | | | 4,735 | | | | — | | | | 4,735 | |
| Investments | | | 22,787 | | | | (13 | ) | | | 22,774 | | | | — | | | | 22,774 | |
| Other long-term assets | | | 9,257 | | | | — | | | | 9,257 | | | | 2,092 | | | | 11,349 | |
| Current assets | | | 43,611 | | | | — | | | | 43,611 | | | | — | | | | 43,611 | |
| Current liabilities | | | 54,424 | | | | — | | | | 54,424 | | | | — | | | | 54,424 | |
| Long-term liabilities | | | 15,154 | | | | — | | | | 15,154 | | | | — | | | | 15,154 | |
| Provisions | | | | | | | | | | | | | | | | | | | | |
| Deferred taxation | | | 13,355 | | | | (262 | ) | | | 13,093 | | | | 2,092 | | | | 15,185 | |
| Pensions and decommissioning | | | 8,882 | | | | — | | | | 8,882 | | | | — | | | | 8,882 | |
| Minority interests | | | 3,428 | | | | (13 | ) | | | 3,415 | | | | — | | | | 3,415 | |
| |
Net assets | | | 72,848 | | | | (351 | ) | | | 72,497 | | | | — | | | | 72,497 | |
| |
| a | | As reported in the 2003 Annual Report and Accounts and the 2003 Annual Report on Form 20-F, as filed with the SEC on June 30, 2004. |
| |
| b | | Deferred tax assets and liabilities are presented at December 31, 2004 separately in the Statement of Assets and Liabilities, with reclassification of the prior year. |
| | | | | | | | | |
| | | $ million | |
| Parent Companies’ interest in Group net assets | | 2003 | | | 2002 | |
At December 31 as originally reported
(2003)/previously restated (2002)a | | | 72,848 | | | | 60,444 | |
| Effect of the Second Reserves Restatement: | | | | | | | | |
| Interest at the beginning of the year | | | (168 | ) | | | (102 | )b |
| Net income for the year | | | (183 | ) | | | (66 | ) |
| |
At December 31 as restated | | | 72,497 | | | | 60,276 | |
| |
| a | | As reported in the 2003 Annual Report and Accounts and the 2003 Annual Report on Form 20-F, as filed with the SEC on June 30, 2004. |
| |
| b | | Cumulative effect as at January 1, 2002. |
The financial effect of the First Reserves Restatement was to reduce the previously reported net assets as at December 31, 2002 by $276 million, all of which was reflected in the 2003 Annual Report and Accounts and the 2003 Annual Report on Form 20-F, as originally filed with the SEC on June 30, 2004. The combined financial effect of the First Reserves Restatement and the Second Reserves Restatement was a reduction in Group net assets of $627 million at December 31, 2003 (2002: $444 million).
Amounts relating to prior periods have been restated in the following notes where applicable.
3 Accounting policies
Nature of the Financial Statements
The accounts of the Parent Companies are not included in the Financial Statements, the objective of which is to demonstrate the financial position, results of operations and cash flows of a group of undertakings in which each Parent Company has an interest in common whilst maintaining its separate identity. The Financial Statements reflect an aggregation in US dollars of the accounts of companies in which Royal Dutch and Shell Transport together, either directly or indirectly, have control either through a majority of the voting rights or the right to exercise a controlling influence or to obtain the majority of the benefits and be exposed to the majority of the risks.
US accounting pronouncement FIN 46 (Consolidation of Variable Interest Entities) was implemented in 2003 with a consequential increase in the Group’s tangible fixed assets and debt of $3.4 billion as of September 30, 2003, mainly relating to power generation contracts (‘‘tolling agreements’’) which were previously accounted for as executory contracts and marked to market.
Investments in companies over which Group companies have significant influence but not control are classified as associated companies and are accounted for on the equity basis. Investments in companies over which the Group has no significant influence are stated at cost and dividends received from these companies are accounted for when received. Certain joint ventures in oil and natural gas production activities are taken up in the Financial Statements in proportion to the relevant Group interest.
The Financial Statements are presented in accordance with US GAAP, with separate Financial Statements presented under Netherlands GAAP beginning on page 83.
The preparation of Financial Statements in conformity with generally accepted accounting principles requires management to make estimates and judgments that affect the amounts reported in the Financial Statements and Notes thereto. Actual results could differ from those estimates.
The Financial Statements have been prepared under the historical cost convention.
Currency translation
Assets and liabilities of non-US dollar Group companies are translated to US dollars at year-end rates of exchange, whilst their statements of income and cash flows are translated at quarterly average rates. Translation differences arising on aggregation are taken directly to a currency translation differences account, which forms part of Parent Companies’ interest in Group net assets. Upon divestment or liquidation of a non-US dollar Group company, cumulative currency translation differences related to that company are taken to income.
The US dollar equivalents of exchange gains and losses arising as a result of foreign currency transactions (including those in respect of inter-company balances unless related to transactions of a long-term investment nature) are included in Group net income.
Revenue recognition
Sales of oil, natural gas, chemicals and all other products are recorded when title passes to the customer. Revenue from the production of oil and natural gas properties in which the Group has an interest with other producers are recognised on the basis of the Group’s working interest (entitlement method). The difference between actual production and net working interest volumes is not significant. Gains and losses on derivatives contracts and contracts involved in energy trading and risk management are shown net in the Statement of Income if these contracts are held for trading purposes. Purchase and sale of
56 Royal Dutch/Shell Group of Companies
3 Accounting policiescontinued
hydrocarbons under exchange contracts that are necessary to obtain or reposition feedstock utilised in the Group’s refinery operations are shown net in the Statement of Income. Sales between Group companies, as disclosed in the segment information, are based on prices generally equivalent to commercially available prices.
In Exploration & Production and Gas & Power title typically passes (and revenues are recognised) when product is physically transferred into a vessel, pipe or other delivery mechanism. For sales by refining companies, title typically passes (and revenues are recognised) either when product is placed onboard a vessel or offloaded from the vessel, depending on the contractually agreed terms. Revenues on wholesale sales of oil products and chemicals are recognised when transfer of ownership occurs and title is passed, either at the point of delivery or the point of receipt, depending on contractual conditions.
In November 2004, FASB’s Emerging Issues Task Force (EITF) discussed EITF Issue No. 04-13 “Accounting for Purchases and Sales of Inventory with the Same Counterparty”, in order to consider whether or not “buy/sell” contractual arrangements should be reported net in the Statement of Income and accounted for as nonmonetary transactions. There was a further EITF meeting in March 2005 but no consensus was reached on this issue and further discussion is planned.
Buy/sell contractual arrangements in this context are defined as those entered into concurrently or in contemplation of one another with the same counterparty.
Buy/sell contracts are entered into by some Group companies for feedstock, principally crude oil, and finished products mainly in the Oil Products segment, and are reported gross in the Statement of Income. Title of the commodity passes to the buyer on delivery, purchases and sales may not necessarily take place at the same time and amounts are separately invoiced and settled; there is no legal right of offset. The Group considers therefore that these are not nonmonetary transactions and are then outside the scope of APB Opinion No. 29 “Accounting for Nonmonetary Transactions”. In addition, the guidance provided in EITF No. 99-19 “Reporting Revenue Gross as a Principal versus Net as an Agent”, EITF No. 02-3 “Issues Involved in Accounting for Derivative Contracts Held for Trading Purposes and Contracts Involved in Energy Trading and Risk Management Activities” and EITF No. 03-11 “Reporting Realized Gains and Losses on Derivative Instruments That Are Subject to FASB Statement No. 133 and Not Held for Trading Purposes as Defined in Issue No. 02-3” has been considered in determining the presentation of the results of the Group’s operations. As a result of a communication to the oil and gas industry issued by the US Securities and Exchange Commission in February 2005 requesting additional disclosures regarding buy/sell contracts, the Group reviewed such contracts and has estimated that, if buy/sell contracts were required to be reported net, net proceeds and cost of sales for 2004 would be reduced by approximately $24,744 million and $24,719 million, respectively (2003: $19,795 million and $19,713 million, respectively; 2002: $14,267 million and $14,419 million, respectively) with no impact on net income.
Such arrangements should be distinguished from purchases and sales under exchange contracts to obtain or reposition feedstock for refinery operations and which are, as described above, shown net in the Statement of Income. The obligations of each party are not independent and settlement is based on volumes.
Depreciation, depletion and amortisation
Tangible fixed assets related to oil and natural gas production activities are depreciated on a unit-of-production basis over the proved developed reserves of the field concerned, except in the case of assets whose useful life is shorter than the lifetime of the field, in which case the straight-line method is applied. Rights and concessions are depleted on the unit-of-production basis over the total proved reserves of the relevant area. Unproved properties are amortised as required by particular circumstances. Other tangible fixed assets are generally depreciated on a straight-line basis over their estimated useful lives which is generally 20 years for refineries and chemicals plants, and 15 years for retail service station facilities. Goodwill and other intangible fixed assets with an indefinite life are not amortised but tested for impairment annually. Other intangible fixed assets are amortised on a straight-line basis over their estimated useful lives (with a maximum of 40 years).
Recoverability of assets
Other than properties with no proved reserves (where the basis for carrying costs on the balance sheet is explained under “Exploration costs”), the carrying amounts of major Exploration & Production fixed assets are reviewed for possible impairment annually, while all assets are reviewed whenever events or changes in circumstances indicate that the carrying amounts for those assets may not be recoverable. If assets are determined to be impaired, the carrying amounts of those assets are written down to fair value, usually determined as the amount of estimated discounted future cash flows. For this purpose, assets are grouped based on separately identifiable and largely independent cash flows. Assets held for sale are written down to the amount of estimated net realisable value.
Estimates of future cash flows used in the evaluation for impairment for assets related to hydrocarbon production are made using risk assessments on field and reservoir performance and include outlooks on proved reserves and unproved volumes, which are then discounted or risk-weighted utilising the
Notes to the US GAAP Financial Statements 57
results from projections of geological, production, recovery and economic factors.
Administrative expenses
Administrative expenses are those which do not relate directly to the activities of a single business segment and include expenses incurred in the management and co-ordination of multi-segment enterprises.
Exploration costs
Group companies follow the successful efforts method of accounting for oil and natural gas exploration costs. Exploration costs are charged to income when incurred, except that exploratory drilling costs are included in tangible fixed assets, pending determination of proved reserves. Exploration wells that are more than 12 months old are expensed unless (a) (i) they are in an area requiring major capital expenditure before production can begin and (ii) they have found commercially producible quantities of reserves and (iii) they are subject to further exploration or appraisal activity in that either drilling of additional exploratory wells is under way or firmly planned for the near future, or (b) proved reserves are booked within 12 months following the completion of exploratory drilling.
Management makes quarterly assessments of the amounts included within tangible fixed assets to determine whether capitalisation is initially appropriate and can continue. Exploration wells capitalised beyond 12 months are subject to additional judgment as to whether the facts and circumstances have changed and therefore whether the conditions described in (a) and (b) no longer apply.
An amendment (FAS 19-1 “Accounting for Suspended Well Costs”) to FASB Statement No. 19 “Financial Accounting and Reporting by Oil and Gas Producing Companies” has been issued. This could result, on a prospective basis, in the continued inclusion of the cost of certain exploratory wells in tangible fixed assets beyond 12 months which do not meet the current requirements given in (a) and (b) above. Under the proposal amounts remain capitalised beyond 12 months if both sufficient reserves have been found to justify completion as a producing well, and sufficient progress is being made towards assessing the reserves and the economic and operating viability of the project (which does not include delay for the possibility of a change in circumstances beyond an entity’s control, for example an increase in oil and/or gas prices).
If this amendment had been reflected in the Group accounting policy, there would not have been a significant effect on the Financial Statements presented; certain write-offs may not have been required which would result in subsequent additional depreciation, depletion and amortisation charges in future years.
Research and development
Research and development expenditure is charged to income as incurred, with the exception of that on buildings and major items of equipment which have alternative use.
Deferred taxation
Deferred taxation is provided using the comprehensive liability method of accounting for income taxes based on provisions of enacted laws. Recognition is given to deferred tax assets and liabilities for the expected future tax consequences of events that have been recognised in the Financial Statements or in the tax returns. In estimating these tax consequences, consideration is given to expected future events. The measurement of deferred tax assets is reduced, if necessary, by a valuation allowance representing the amount of any tax benefits for which there is uncertainty of realisation. Deferred tax assets and liabilities are presented separately in the Statement of Assets and Liabilities except where there is a right of set-off within fiscal jurisdictions.
Leasing
Agreements under which Group companies make payments to owners in return for the right to use an asset for a period are accounted for as leases. Leases that transfer substantially all the risks and benefits of ownership are recorded at inception as capital leases within tangible fixed assets and debt. All other leases are recorded as operating leases and the costs are charged to income as incurred.
Interest capitalisation
Interest is capitalised, as an increase in tangible fixed assets, on significant capital projects during construction. Interest is also capitalised, as an increase in investments in associated companies, on funds invested by Group companies which are used by associated companies for significant capital projects during construction.
Securities
Securities of a trading nature are carried at fair value with unrealised holding gains and losses being included in net income. Securities intended to be held to maturity are carried at cost, unless permanently impaired in which case they are carried at fair value. All other securities are classified as available for sale and are carried at fair value, with unrealised holding gains and losses being taken directly to Parent Companies’ interest in Group net assets. Upon sale or maturity, the net gains and losses are included in net income.
Short-term securities with a maturity from acquisition of three months or less and that are readily convertible into known amounts of cash are classified as cash equivalents. Securities forming part of a portfolio which is required to be held long term are classified under fixed assets – investments.
Parent Companies’ shares held by Group companies are not included in the Group’s net assets but reflected as a deduction from Parent Companies’ interest in Group net assets.
58 Royal Dutch/Shell Group of Companies
3 Accounting policiescontinued
Cash flows resulting from movements in securities of a trading nature are reported under cash flow provided by operating activities while cash flows resulting from movements in other securities are reported under cash flow used in investing activities.
Inventories
Inventories are stated at cost to the Group or net realisable value, whichever is lower. Such cost is determined by the first-in first-out (FIFO) method and comprises direct purchase costs, cost of production, transportation and manufacturing expenses and taxes.
Derivative instruments
Group companies use derivatives in the management of interest rate risk, foreign currency risk and commodity price risk. The carrying amount of all derivatives, other than those meeting the normal purchases and sales exception, is measured using market prices. Those derivatives qualifying and designated as hedges are either: (i) a hedge of the fair value of a recognised asset or liability or of an unrecognised firm commitment (“fair value” hedge), or (ii) a hedge of the variability of cash flows to be received or paid related to a recognised asset or liability or a forecasted transaction (“cash flow” hedge), or (iii) a hedge of the foreign currency exposure of an unrecognised firm commitment or an available for sale security (“foreign currency fair value” hedge) or the foreign currency exposure of a foreign currency denominated forecasted transaction (“foreign currency cash flow” hedge).
A change in the carrying amount of a fair value hedge is taken to income, together with the consequential adjustment to the carrying amount of the hedged item. The effective portion of a change in the carrying amount of a cash flow hedge is recorded in other comprehensive income, until income reflects the variability of underlying cash flows; any ineffective portion is taken to income. A change in the carrying amount of a foreign currency hedge is recorded on the basis of whether the hedge is a fair value hedge or a cash flow hedge. A change in the carrying amount of other derivatives is taken to income.
Group companies formally document all relationships between hedging instruments and hedged items, as well as risk management objectives and strategies for undertaking various hedge transactions. The effectiveness of a hedge is also continually assessed. When effectiveness ceases, hedge accounting is discontinued.
Environmental expenditures
Liabilities for environmental remediation resulting from ongoing or past operations or events are recognised in the period in which an obligation, legal or constructive, to a third party arises and the amount can be reasonably estimated. Measurement of liabilities is based on current legal requirements and existing technology. Recognition of any joint and several liability is based upon Group companies’ best estimate of their final pro rata share of the liability. Liabilities are determined independently of expected insurance recoveries. Recoveries are recognised and reported as separate events and brought into account when reasonably certain of realisation. The carrying amount of liabilities is regularly reviewed and adjusted for new facts or changes in law or technology.
Employee retirement plans
Retirement plans to which employees contribute and many non-contributory plans are generally funded by payments to independent trusts. Where, due to local conditions, a plan is not funded, a provision which is not less than the present value of accumulated pension benefits, based on present salary levels, is included in the Financial Statements. Valuations of both funded and unfunded plans are carried out by independent actuaries.
For plans which define the amount of pension benefit to be provided, pension cost primarily represents the increase in actuarial present value of the obligation for pension benefits based on employee service during the year and the interest on this obligation in respect of employee service in previous years, net of the expected return on plan assets.
For plans where benefits depend solely on the amount contributed to the employee’s account and the returns earned on investments of those contributions, pension cost is the amount contributed by Group companies for the period.
Postretirement benefits other than pensions
Some Group companies provide certain postretirement healthcare and life insurance benefits to retirees, the entitlement to which is usually based on the employee remaining in service up to retirement age and the completion of a minimum service period. The expected costs of these benefits are accrued over the periods employees render service to the Group. These plans are not funded. A provision is included in the Financial Statements which is sufficient to cover the present value of the accumulated postretirement benefit obligation based on current assumptions. Valuations of these obligations are carried out by independent actuaries.
Stock-based compensation plans
Group companies account for stock-based compensation plans in accordance with the intrinsic value method. This method requires no recognition of compensation expense for plans where the exercise price is not at a discount to the market value at the date of the grant, and the number of options is fixed on the date of grant. However, recognition of compensation expense is required for variable award (performance-related) plans over the vesting periods of such plans, based on the then current market values of the underlying stock.
Decommissioning and restoration costs
Estimated decommissioning and restoration costs are based on current requirements, technology and price levels and are stated at fair value, and the associated asset retirement costs are capitalised
Notes to the US GAAP Financial Statements 59
as part of the carrying amount of the related tangible fixed assets. In respect of oil and natural gas production activities, the fair value calculation of the liability is based on the economic life of the production assets and discounted using the credit-adjusted risk-free rate for the Group. For tangible fixed assets not directly associated with mineral reserves, the liability, once an obligation, whether legal or constructive, crystallises, is recognised in the period when a reasonable estimate of the fair value can be made. The obligation is reflected under provisions in the Statement of Assets and Liabilities. The effects of changes resulting from revisions to the timing or the amount of the original estimate of the liability are incorporated on a prospective basis.
This policy reflects US accounting standard FAS 143 (“Asset Retirement Obligations”) which was effective for the Group from the beginning of 2003 and resulted in a credit to income of $255 million after tax, which was reported in 2003 as a cumulative effect of a change in accounting principle.
Acquisitions
Acquisitions are accounted for using the purchase method. Assets acquired and liabilities assumed are recognised at their fair value at the date of acquisition; the amount of the purchase consideration above this value is reflected as goodwill.
Discontinued operations
Discontinued operations comprise the activities of Group companies, which therefore do not include associated companies or other investments, which have been disposed of during the year, or remain held for sale at year end, and which are significant for the Group and can be clearly distinguished, operationally and for financial statement purposes from other Group operations. The Group does not retain, in the case of discontinued operations which have been disposed of, and will not retain, following such sale in the case of discontinued operations held for sale, any residual interest in such operations.
Reclassifications
Certain prior year amounts have been reclassified to conform with current year presentation.
International Financial Reporting Standards
Under a 2002 EU Regulation, publicly-listed companies in the European Union will be required to prepare consolidated financial statements in accordance with International Financial Reporting Standards (IFRS) from 2005. The 2005 Financial Statements of the Group or, subject to completion of the Transaction described in Note 1, of its successor, will be prepared under IFRS and will include comparative data for 2004, together with reconciliations to opening balances as at January 1, 2004 and to 2004 data previously published in accordance with accounting principles generally accepted in the United States (US GAAP).
4 Discontinued operations
The activities of certain Group companies were disposed of during 2004 or remain as held for sale at December 31, 2004. Those activities reported as discontinued operations in the Statement of Income comprise: certain operations in Angola, Bangladesh, Egypt and Thailand in the Exploration & Production segment, as part of the ongoing strategy to divest assets where little growth potential is seen for the Group and where there is little strategic fit in relation to the cost of managing those assets; in the USA in Gas & Power, pipelines which were no longer viewed as integral to continued optimisation of the Group’s existing developments and production in the Gulf of Mexico; and in the Caribbean, Peru, Portugal, Romania, Spain, Thailand, Venezuela and the US in Oil Products in line with the strategy of increasing the Group’s profitability through greater focus on key countries and core assets. All of these were disposed of in 2004 except some operations in the Caribbean, Portugal, Romania and Spain, with a carrying amount as at December 31, 2004 of $0.3 billion, which are expected to be sold in 2005.
Income from discontinued operations comprises:
| | | | | | | | | | | | | |
| | | $ million | |
| | | 2004 | | | 2003 | | | 2002 | |
| |
| Income before taxation from discontinued operations (including gains on disposal of $1,564 million in 2004 and impairments of $88 million in 2003 and $9 million in 2002) | | | 1,980 | | | | 135 | | | | 282 | |
| Taxation | | | 332 | | | | 97 | | | | 95 | |
| Minority interests | | | 88 | | | | 13 | | | | – | |
| |
| Income from discontinued operations, net of tax | | | 1,560 | | | | 25 | | | | 187 | |
| |
Net proceeds of discontinued operations in 2004 (up to the date of disposal, where applicable), excluding proceeds of the disposal of such operations, were $3.5 billion (2003: $3.4 billion; 2002: $3.1 billion).
Income from discontinued operations by segment is given in Note 25(b).
5 Parent Companies’ interest in Group net assets
| | | | | | | | | | | | | |
| | | $ million | |
| | | | | | | 2003 | | | 2002 | |
| | | 2004 | | | As restated | | | As restated | |
| |
| Invested by Parent Companies | | | 741 | | | | 741 | | | | 741 | |
| Retained earnings of Group companies | | | 85,100 | | | | 74,906 | | | | 68,254 | |
| Parent Companies’ shares held, net of dividends received (Note 23) | | | (4,187 | ) | | | (3,428 | ) | | | (2,797 | ) |
| Cumulative currency translation differences | | | 4,356 | | | | 1,208 | | | | (3,894 | ) |
| Unrealised gains/(losses) on: | | | | | | | | | | | | |
| securities (Note 15) | | | 350 | | | | 700 | | | | 11 | |
| cash flow hedges | | | (157 | ) | | | (188 | ) | | | (239 | ) |
| Minimum pension liability adjustments | | | (1,627 | ) | | | (1,442 | ) | | | (1,800 | ) |
| |
| Balance at December 31 | | | 84,576 | | | | 72,497 | | | | 60,276 | |
| |
60 Royal Dutch/Shell Group of Companies
5 Parent Companies’ interest in Group net assetscontinued
Earnings retained by the subsidiary and associated companies of the Group Holding Companies (namely Shell Petroleum N.V. and The Shell Petroleum Company Limited) and Shell Petroleum Inc. amounted to $34,374 million at December 31, 2004 (2003: $25,210 million; 2002: $18,060 million). A portion of these retained earnings will flow up to the Group Holding Companies without tax cost. The balance of these retained earnings have been, or will be, substantially reinvested by the companies concerned and provision has not been made for taxes on possible future distribution of these undistributed earnings as it is not meaningful to provide for these taxes nor is it practicable to estimate their full amount or the withholding tax element.
6 Other comprehensive income
| | | | | | | | | | | | | |
| | | $ million | |
| | | | Net credit/(charge) | |
| 2004 | | Pre-tax | | | Tax | | | After tax | |
| |
| Currency translation differences arising during the year | | | 2,925 | | | | 70 | | | | 2,995 | |
| Net (gains)/losses realised in net income | | | 153 | | | | — | | | | 153 | |
| |
| Currency translation differences net | | | 3,078 | | | | 70 | | | | 3,148 | |
| |
| Unrealised gains/(losses) on securities arising during the year | | | 109 | | | | (3 | ) | | | 106 | |
| Net (gains)/losses realised in net income | | | (464 | ) | | | 8 | | | | (456 | ) |
| |
| Unrealised gains/(losses) on securities net | | | (355 | ) | | | 5 | | | | (350 | ) |
| |
| Unrealised gains/(losses) on cash flow hedges arising during the year | | | 35 | | | | (6 | ) | | | 29 | |
| Net (gains)/losses realised in net income | | | 2 | | | | — | | | | 2 | |
| |
| Unrealised gains/(losses) on cash flow hedges net | | | 37 | | | | (6 | ) | | | 31 | |
| |
| Minimum pension liability adjustments | | | (289 | ) | | | 104 | | | | (185 | ) |
| |
| Other comprehensive income | | | 2,471 | | | | 173 | | | | 2,644 | |
| |
| | | | | | | | | | | | | |
| | | $ million | |
| | | | Net credit/(charge) | |
| 2003 | | Pre-tax | | | Tax | | | After tax | |
| |
| Currency translation differences arising during the year | | | 5,418 | | | | (360 | ) | | | 5,058 | |
| Net (gains)/losses realised in net income | | | 44 | | | | — | | | | 44 | |
| Currency translation differences net | | | 5,462 | | | | (360 | ) | | | 5,102 | |
| |
| Unrealised gains/(losses) on securities arising during the year | | | 746 | | | | (16 | ) | | | 730 | |
| Net (gains)/losses realised in net income | | | (41 | ) | | | — | | | | (41 | ) |
| |
| Unrealised gains/(losses) on securities net | | | 705 | | | | (16 | ) | | | 689 | |
| Unrealised gains/(losses) on cash flow hedges arising during the year | | | 51 | | | | (3 | ) | | | 48 | |
| Net (gains)/losses realised in net income | | | 3 | | | | — | | | | 3 | |
| |
| Unrealised gains/(losses) on cash flow hedges net | | | 54 | | | | (3 | ) | | | 51 | |
| |
| Minimum pension liability adjustments | | | 669 | | | | (311 | ) | | | 358 | |
| |
| Other comprehensive income | | | 6,890 | | | | (690 | ) | | | 6,200 | |
| |
| | | | | | | | | | | | | |
| | | $ million | |
| | | | Net credit/(charge) | |
| 2002 | | Pre-tax | | | Tax | | | After tax | |
| |
| Currency translation differences arising during the year | | | 2,773 | | | | (303 | ) | | | 2,470 | |
| Net (gains)/losses realised in net income | | | (38 | ) | | | — | | | | (38 | ) |
| Currency translation differences net | | | 2,735 | | | | (303 | ) | | | 2,432 | |
| |
| Unrealised gains/(losses) on securities arising during the year | | | 26 | | | | 10 | | | | 36 | |
| Net (gains)/losses realised in net income | | | (12 | ) | | | 1 | | | | (11 | ) |
| |
| Unrealised gains/(losses) on securities net | | | 14 | | | | 11 | | | | 25 | |
| |
| Unrealised gains/(losses) on cash flow hedges arising during the year | | | (209 | ) | | | (7 | ) | | | (216 | ) |
| Net (gains)/losses realised in net income | | | (9 | ) | | | — | | | | (9 | ) |
| Unrealised gains/(losses) on cash flow hedges net | | | (218 | ) | | | (7 | ) | | | (225 | ) |
| |
| Minimum pension liability adjustments | | | (2,446 | ) | | | 971 | | | | (1,475 | ) |
| |
| Other comprehensive income | | | 85 | | | | 672 | | | | 757 | |
| |
| | | | | | | | | | | | | |
| | | | | | | 2004 | | | 2003 | |
| |
| Rates of exchange at December 31 were: | | | €/$ | | | | 0.73 | | | | 0.79 | |
| | | | £/$ | | | | 0.52 | | | | 0.56 | |
| |
7 Associated companies
(a) Income
Associated companies engage in similar businesses to Group companies and play an important part in the overall operating activities of the Group. Consequently, the Group share of operating profits arising from associated companies is seen as a contribution to the total Group operating profit and is shown as such in the Statement of Income. The Group share of interest income, interest expense, currency exchange gains/losses and taxation of associated companies has been included within those items in the Statement of Income.
A summarised Statement of Income with respect to the Group share of net income from associated companies, together with a segment analysis, is set out below:
| | | | | | | | | | | | | |
| | | $ million | |
| | | | | | | 2003 | | | 2002 | |
| | | 2004 | | | As restateda | | | As restateda | |
| |
| Net proceeds | | | 53,544 | | | | 44,422 | | | | 33,467 | |
| Cost of sales | | | 43,694 | | | | 37,084 | | | | 26,744 | |
| |
| Gross profit | | | 9,850 | | | | 7,338 | | | | 6,723 | |
| Other operating expenses | | | 4,197 | | | | 3,892 | | | | 3,931 | |
| |
| Operating profit | | | 5,653 | | | | 3,446 | | | | 2,792 | |
| Interest and other income | | | 173 | | | | 228 | | | | 102 | |
| Interest expense | | | 580 | | | | 540 | | | | 451 | |
| Currency exchange gains/(losses) | | | 20 | | | | (3 | ) | | | (15 | ) |
| |
| Income before taxation | | | 5,266 | | | | 3,131 | | | | 2,428 | |
| Taxation | | | 2,065 | | | | 1,463 | | | | 990 | |
| |
| Income from continuing operations | | | 3,201 | | | | 1,668 | | | | 1,438 | |
| Income from discontinued operations, net of tax | | | 13 | | | | 13 | | | | 16 | |
| |
| Net income | | | 3,214 | | | | 1,681 | | | | 1,454 | |
| |
| a | | See Note 2 to the Group Financial Statements. |
Notes to the US GAAP Financial Statements 61
| | | | | | | | | | | | | |
| | | $ million | |
| | | | | | | 2003 | | | 2002 | |
| Income by segment | | 2004 | | | As restated | | | As restated | |
| |
| Exploration & Production | | | 1,145 | | | | 800 | | | | 541 | |
| Gas & Power | | | 1,142 | | | | 650 | | | | 589 | |
| Oil Products | | | 1,253 | | | | 632 | | | | 448 | |
| Chemicals | | | (7 | ) | | | (169 | ) | | | 153 | |
| Corporate and Other | | | (319 | ) | | | (232 | ) | | | (277 | ) |
| |
| | | | 3,214 | | | | 1,681 | | | | 1,454 | |
| |
(b) Investments
| | | | | | | | | | | | | | | | | |
| | | $ million | |
| | | | | | | | | | | | | | | 2003 | |
| | | 2004 | | | As restated | |
| | | Shares | | | Loans | | | Total | | | Total | |
| |
| At January 1 | | | 16,800 | | | | 2,571 | | | | 19,371 | | | | 17,945 | |
| New investments | | | 681 | | | | 377 | | | | 1,058 | | | | 983 | |
| Net asset transfers to/(from) associates, disposals and other movements | | | (649 | ) | | | (284 | ) | | | (933 | ) | | | (173 | ) |
| Net income | | | 3,214 | | | | – | | | | 3,214 | | | | 1,681 | |
| Dividends | | | (3,472 | ) | | | – | | | | (3,472 | ) | | | (2,192 | ) |
| Currency translation differences | | | 455 | | | | 50 | | | | 505 | | | | 1,127 | |
| |
| At December 31 | | | 17,029 | | | | 2,714 | | | | 19,743 | | | | 19,371 | |
| |
Net income for 2004 includes a $565 million write-down in the carrying amount of Basell (Chemicals). This impairment followed the announcement in 2004 of a review of strategic alternatives regarding this joint venture, and the carrying amount of the Group’s investment in Basell at December 31, 2004 is at expected net realisable value.
Net income for 2003 includes a $286 million write-down in the carrying amount of Basell (Chemicals) reflecting a reassessment of the outlook for the business, a $200 million write-down in the carrying amount of InterGen (Gas & Power) due to poor power market conditions, mainly in the US merchant power segment, and a $115 million write-down in the carrying amount of the Cuiaba power assets in South America (Gas & Power) in light of a reappraisal of the commercial outlook.
A summarised Statement of Assets and Liabilities with respect to the Group share of investments in associated companies is set out below:
| | | | | | | | | |
| | | $ million | |
| | | | | | | 2003 | |
| | | 2004 | | | As restated | |
| |
| Fixed assets | | | 28,665 | | | | 30,892 | |
| Current assets | | | 10,427 | | | | 8,248 | |
| |
| Total assets | | | 39,092 | | | | 39,140 | |
| Current liabilities | | | 7,559 | | | | 8,745 | |
| Long-term liabilities | | | 11,790 | | | | 11,024 | |
| |
| Net assets | | | 19,743 | | | | 19,371 | |
| |
An analysis by segment is shown in Note 25.
The Group’s major investments in associated companies at December 31, 2004 comprised:
| | | | | | | | | |
| Segment | | | | | | |
| Name | | Group interest | | | Country of incorporation | |
| |
| Exploration & Production | | | | | | | | |
| Aera | | | 52 | % | | USA |
| Brunei Shell | | | 50 | % | | Brunei |
| Woodside | | | 34 | % | | Australia |
| |
| Gas & Power | | | | | | | | |
| InterGen | | | 68 | % | | The Netherlands |
| Nigeria LNG | | | 26 | % | | Nigeria |
| Oman LNG | | | 30 | % | | Oman |
| |
| Oil Products | | | | | | | | |
| Motiva | | | 50 | % | | USA |
| Showa Shell | | | 40 | % | | Japan |
| |
| Chemicals | | | | | | | | |
| Basell | | | 50 | % | | The Netherlands |
| Saudi Petrochemical | | | 50 | % | | Saudi Arabia |
| Infineum | | | 50 | % | | The Netherlands |
| |
Although the Group has a 52% investment in Aera and a 68% investment in InterGen, the governing agreements and constitutive documents for these entities do not allow the Group to control these entities, as voting control is either split 50:50 between the shareholders or requires unanimous approval of the shareholders or their representatives and, therefore, these entities have not been consolidated.
(c) Transactions between Group companies and associated companies
Transactions between Group and associated companies mainly comprise sales and purchases of goods and services in the ordinary course of business and in total amounted to:
| | | | | | | | | | | | | |
| | | $ million | |
| | | 2004 | | | 2003 | | | 2002 | |
| |
| Charges to associated companies | | | 14,018 | | | | 18,155 | | | | 10,573 | |
| Charges from associated companies | | | 12,373 | | | | 8,608 | | | | 5,623 | |
| |
Balances outstanding at December 31, 2004 and 2003 in respect of the above transactions are shown in Notes 14 and 18.
8 Interest and other income
| | | | | | | | | | | | | |
| | | $ million | |
| | | | | | | 2003 as | | | 2002 as | |
| | | 2004 | | | reclassifieda | | | reclassifieda | |
| |
| Group companies | | | | | | | | | | | | |
| Interest income | | | 432 | | | | 325 | | | | 487 | |
| Other income | | | 1,100 | | | | 1,414 | | | | 159 | |
| |
| | | | 1,532 | | | | 1,739 | | | | 646 | |
| Associated companies | | | 173 | | | | 228 | | | | 102 | |
| |
| | | | 1,705 | | | | 1,967 | | | | 748 | |
| |
| a | | See Note 2 to the Group Financial Statements. |
Other income in 2004 includes gains from the disposal of the Group’s interest in Sinopec ($0.3 billion), and Fluxys and Distrigas ($0.5 billion). Other income in 2003 included a $1.3 billion gain from the disposal of the Group’s interest in Ruhrgas.
62 Royal Dutch/Shell Group of Companies
9 Interest expense
| | | | | | | | | | | | | |
| | | $ million | |
| | | | | | | 2003 As | | | 2002 As | |
| | | 2004 | | | reclassifieda | | | reclassifieda | |
| |
| Group companies | | | | | | | | | | | | |
| Interest incurred | | | 840 | | | | 828 | | | | 883 | |
lessinterest capitalised | | | 206 | | | | 44 | | | | 43 | |
| |
| | | | 634 | | | | 784 | | | | 840 | |
| Associated companies | | | 580 | | | | 540 | | | | 451 | |
| |
| | | | 1,214 | | | | 1,324 | | | | 1,291 | |
| |
a See Note 2 to the Group Financial Statements.
10 Taxation
(a) Taxation charge for the year
| | | | | | | | | | | | | |
| | | $ million | |
| | | | | | | 2003 | | | 2002 | |
| | | 2004 | | | As restateda | | | As restateda | |
| |
| Group companies | | | | | | | | | | | | |
| Current tax charge | | | 13,584 | | | | 8,197 | | | | 6,650 | |
| Deferred tax charge/(credit) | | | (513 | ) | | | (311 | ) | | | 7 | |
| |
| | | | 13,071 | | | | 7,886 | | | | 6,657 | |
| Associated companies | | | 2,065 | | | | 1,463 | | | | 990 | |
| |
| | | | 15,136 | | | | 9,349 | | | | 7,647 | |
| |
a See Note 2 to the Group Financial Statements.
Reconciliations of the expected tax charge of Group companies to the actual tax charge are as follows:
| | | | | | | | | | | | | |
| | | $ million | |
| | | | | | | 2003 | | | 2002 | |
| | | 2004 | | | As restated | | | As restated | |
| |
| Expected tax charge at statutory rates | | | 13,717 | | | | 8,910 | | | | 6,504 | |
| Adjustments in respect of prior years | | | (52 | ) | | | 166 | | | | (252 | ) |
| Other reconciling items | | | (594 | ) | | | (1,190 | ) | | | 405 | |
| |
| Taxation charge of Group companies | | | 13,071 | | | | 7,886 | | | | 6,657 | |
| |
The taxation charge of Group companies includes not only income taxes of general application but also income taxes at special rates levied on income from Exploration & Production activities and various additional income and other taxes to which these activities are subject.
Tax adjustments in respect of prior years relate to events in the current period and reflect the effects of changes in rules, facts or other factors compared to those used in establishing the tax position or deferred tax balance.
Other reconciling items in 2004 mainly comprise the effects of disposals during the year that were taxed below the statutory rate.
Other reconciling items in 2003 include the effects of disposals during the year that were taxed below the statutory rate (including $534 million from the disposal of the Group’s interest in Ruhrgas), in addition to $442 million relating to the effects on deferred tax accounts of legislative changes to certain ring-fencing arrangements.
Other reconciling items in 2002 include $415 million due to the increase in the UK upstream corporate tax rate during the year.
(b) Taxes payable
| | | | | | | | | |
| | | $ million | |
| | | 2004 | | | 2003 | |
| |
| Taxes on activities of Group companies | | | 5,606 | | | | 2,148 | |
| Sales taxes, excise duties and similar levies and social law taxes | | | 4,279 | | | | 3,779 | |
| |
| | | | 9,885 | | | | 5,927 | |
| |
(c) Provision for deferred taxation
The provision for deferred taxation comprises the following tax effects of temporary differences:
| | | | | | | | | |
| | | $ million | |
| | | | | | | 2003 | |
| | | 2004 | | | As restated | |
| |
| Tangible and intangible fixed assets | | | 17,738 | | | | 17,365 | |
| Pensions and similar obligations | | | 2,653 | | | | 2,118 | |
| Other items | | | 2,568 | | | | 2,649 | |
| |
| Total deferred tax liabilities | | | 22,959 | | | | 22,132 | |
| |
| Tax losses carried forward | | | (4,214 | ) | | | (3,876 | ) |
Foreign tax creditsa | | | (2,042 | ) | | | (1,633 | ) |
US trademarkb | | | (247 | ) | | | (309 | ) |
| Provisions | | | | | | | | |
| Pensions and similar obligations | | | (1,228 | ) | | | (1,329 | ) |
| Decommissioning and restoration costs | | | (2,191 | ) | | | (1,934 | ) |
| Environmental and other provisions | | | (455 | ) | | | (334 | ) |
| Tangible and intangible fixed assets | | | (461 | ) | | | (153 | ) |
| Other items | | | (3,266 | ) | | | (3,268 | ) |
| |
| Total deferred tax assets | | | (14,104 | ) | | | (12,836 | ) |
| Asset valuation allowance | | | 3,994 | | | | 3,797 | |
| |
| Deferred tax assets net of valuation allowance | | | (10,110 | ) | | | (9,039 | ) |
| |
| Net deferred tax liability | | | 12,849 | | | | 13,093 | |
| |
| Presented in the Statement of Assets and Liabilities as: | | | | | | | | |
| |
| Deferred tax assets | | | 1,995 | | | | 2,092 | |
| Deferred tax liabilities | | | 14,844 | | | | 15,185 | |
| |
| a | | Foreign tax credits represent surplus credits arising in holding and sub-holding Group companies on income from other jurisdictions. A valuation allowance has been recorded against the substantial part of these balances in both 2004 and 2003. |
| |
| b | | Deferred tax asset created upon transfer of US trademark rights from a US wholly-owned Group company to a Netherlands wholly-owned Group company. |
The Group has tax losses carried forward amounting to $12,705 million at December 31, 2004. Of these, $10,470 million can be carried forward indefinitely. The remaining $2,235 million expires in the following years:
| | | | | |
| | | $ million | |
| |
| 2005 | | | 702 | |
| 2006 | | | 239 | |
| 2007 | | | 452 | |
| 2008 | | | 70 | |
| 2009-2013 | | | 404 | |
| 2014-2019 | | | 368 | |
| |
Notes to the US GAAP Financial Statements 63
11 Tangible and intangible fixed assets
| | | | | | | | | | | | | | | | | | | | | | | | | |
| | | | | | | | | | | | | | | | | | | | | | | $ million | |
| | | | | | | | | | | | | | | | | | | 2004 | | | 2003 | |
| | | | | | | | | |
| | | | | | | | | | | Other | | | Total | | | Total | | | Total Group | |
| | | Tangible | | | Goodwill | | | intangibles | | | intangibles | | | Group | | | As restated | |
| |
Cost | | | | | | | | | | | | | | | | | | | | | | | | |
| At January 1 | | | 181,685 | | | | 4,011 | | | | 2,998 | | | | 7,009 | | | | 188,694 | | | | 163,957 | |
| Capital expenditure | | | 12,440 | | | | 3 | | | | 291 | | | | 294 | | | | 12,734 | | | | 12,252 | |
Sales, retirements and other movementsa | | | (9,345 | ) | | | (44 | ) | | | 102 | | | | 58 | | | | (9,287 | ) | | | (1,770 | ) |
| Currency translation differences | | | 8,382 | | | | 62 | | | | 81 | | | | 143 | | | | 8,525 | | | | 14,255 | |
| |
| At December 31 | | | 193,162 | | | | 4,032 | | | | 3,472 | | | | 7,504 | | | | 200,666 | | | | 188,694 | |
| |
Depreciation | | | | | | | | | | | | | | | | | | | | | | | | |
| At January 1 | | | 94,597 | | | | 1,336 | | | | 938 | | | | 2,274 | | | | 96,871 | | | | 80,898 | |
| Depreciation, depletion and amortisation charge | | | 11,945 | | | | — | | | | 328 | | | | 328 | | | | 12,273 | | | | 11,711 | |
| Sales, retirements and other movements | | | (7,310 | ) | | | (37 | ) | | | (38 | ) | | | (75 | ) | | | (7,385 | ) | | | (3,711 | ) |
| Currency translation differences | | | 4,990 | | | | 42 | | | | 45 | | | | 87 | | | | 5,077 | | | | 7,973 | |
| |
| At December 31 | | | 104,222 | | | | 1,341 | | | | 1,273 | | | | 2,614 | | | | 106,836 | | | | 96,871 | |
| |
Net 2004 | | | 88,940 | b | | | 2,691 | | | | 2,199 | | | | 4,890 | | | | 93,830 | | | | | |
| |
| Net 2003 (as restated) | | | 87,088 | b | | | 2,675 | | | | 2,060 | | | | 4,735 | | | | | | | | 91,823 | |
| |
| a | | Sales, retirements and other movements in 2003 include the effect of a change in accounting policy for certain long-term agreements (see Note 3). |
| |
| b | | Tangible fixed assets at December 31, 2004 include rights and concessions of $11.1 billion (2003: $12.0 billion). |
Other intangible fixed assets at December 31, 2004 include $0.8 billion (2003: $0.8 billion) in respect of Pennzoil-Quaker State trademarks acquired in 2002. The trademarks are being amortised over an estimated useful life of 40 years. Continued brand maintenance in addition to the established long-term leadership of these brands in automotive lubricants and vehicle care markets support this estimate.
Tangible fixed assets at year end, capital expenditure, together with new investments in associated companies, and the depreciation, depletion and amortisation charges are shown in Note 25, classified, consistent with oil and natural gas industry practice, according to operating activities. Such a classification, rather than one according to type of asset, is given in order to permit a better comparison with other companies having similar activities.
The net balances at December 31 include:
| | | | | | | | | |
| | | | | | | $ million | |
| | | 2004 | | | 2003 | |
| |
| Capitalised costs in respect of assets not yet used in operations | | | | | | | | |
| Unproved properties | | | 2,844 | | | | 4,576 | |
| Proved properties under development and other assets in the course of construction | | | 13,491 | | | | 12,680 | |
| |
| | | | 16,335 | | | | 17,256 | |
| |
Unproved properties include capitalised exploratory well costs, for which the amounts at December 31, 2004, 2003 and 2002, and movements during 2004, 2003 and 2002 are given in the following table:
| | | | | | | | | | | | | |
| | | | | | | | | | | $ million | |
| | | 2004 | | | 2003 | | | 2002 | |
| |
| At January 1 | | | 771 | | | | 720 | | | | 515 | |
| Additions pending determination of proved reserves | | | 566 | | | | 501 | | | | 568 | |
| Amounts charged to expense | | | (432 | ) | | | (449 | ) | | | (393 | ) |
| Reclassifications to productive wells on determination of proved reserves | | | (94 | ) | | | (56 | ) | | | (24 | ) |
| Other movements, including acquisitions, disposals and currency translation effects | | | (22 | ) | | | 55 | | | | 54 | |
| |
| At December 31 | | | 789 | | | | 771 | | | | 720 | |
| |
There are no amounts remaining capitalised (a) in areas requiring major capital expenditure before production can begin, where neither drilling of additional exploratory wells is underway nor firmly planned for the near future, or (b) beyond 12 months in areas not requiring major capital expenditure before production can begin.
64 Royal Dutch/Shell Group of Companies
11 Tangible and intangible fixed assetscontinued
Depreciation, depletion and amortisation charges for the year are included within the following headings in the Statement of Income:
| | | | | | | | | | | | | |
| | | | | | | | | | | $ million | |
| | | | | | | 2003 | | | 2002 | |
| | | 2004 | | | As restateda | | | As restateda | |
| |
| Cost of sales | | | 9,876 | | | | 9,702 | | | | 7,312 | |
| Selling and distribution expenses | | | 1,438 | | | | 1,229 | | | | 1,041 | |
| Administrative expenses | | | 121 | | | | 121 | | | | 62 | |
| Exploration | | | 684 | | | | 411 | | | | 80 | |
| Research and development | | | 33 | | | | 28 | | | | 33 | |
| |
| Depreciation, depletion and amortisation: | | | | | | | | | | | | |
| from continuing operations | | | 12,152 | | | | 11,491 | | | | 8,528 | |
| from discontinued operations | | | 121 | | | | 220 | | | | 211 | |
| |
| | | | 12,273 | | | | 11,711 | | | | 8,739 | |
| |
| a | | See Note 2 to the Group Financial Statements. |
Depreciation, depletion and amortisation charges for 2004 include $617 million (2003: $1,249 million; 2002: $191 million) relating to the impairment of tangible fixed assets, and $5 million (2003: $127 million; 2002: $6 million) relating to the impairment of intangible fixed assets. Such charges are recorded within cost of sales. The impairment charges relate to assets held for use (2004: $229 million; 2003: $1,169 million; 2002: $105 million) and to assets held for sale (2004: $393 million; 2003: $207 million; 2002: $92 million).
For 2004, the majority of the impairment charges were in Oil Products ($579 million) and were related to the deterioration in the local operating environment for certain refinery assets and writing down to expected proceeds of marketing assets held for sale.
For 2003, the impairments were incurred in Exploration & Production ($698 million, mainly due to lower production outlooks in the UK and South America), in Oil Products ($331 million, mainly due to the announced closure of the Bakersfield refinery and the impact of local economic conditions in Latin America), in Chemicals ($220 million, mainly in CS Metals, as anticipated benefits from a prototype technology did not meet performance expectations) and in Renewables ($127 million for Shell Solar following an extensive review to assess the value of the business).
For 2002, the majority of the impairment charges (in total $197 million) were in Oil Products, reflecting plans in the USA to close surplus base oil production facilities, the closure of the Pililla base oil and bitumen refinery in the Philippines and a change in outlook for liquefied petroleum gas assets in Argentina coupled with the country’s economic downturn.
Depreciation, depletion and amortisation charges for 2004 also included $570 million relating to the write-off of various exploration properties mainly in Ireland, Norway and the United Kingdom, where new information during the year from exploratory work confirmed lower than expected volume projections (2003: $366 million, mainly in Brazil and Ireland).
12 Other long-term assets
Reflecting their non-current nature, deferred charges and prepayments due after one year and other non-current assets are presented separately as part of “Other long-term assets”. At December 31, 2004 these include $3,221 million (2003: $1,989 million) of deferred charges and prepayments (including amounts in respect of risk management activities).
13 Inventories
| | | | | | | | | |
| | | | | | | $ million | |
| | | 2004 | | | 2003 | |
| |
| Inventories of oil and chemicals | | | 14,488 | | | | 11,742 | |
| Inventories of materials | | | 903 | | | | 948 | |
| |
| | | | 15,391 | | | | 12,690 | |
| |
14 Accounts receivable
| | | | | | | | | |
| | | | | | | $ million | |
| | | 2004 | | | 2003 | |
| |
| Trade receivables | | | 23,626 | | | | 17,523 | |
| Amounts owed by associated companies | | | 2,619 | | | | 2,094 | |
| Other receivables | | | 3,996 | | | | 3,602 | |
| Deferred charges and prepayments | | | 7,757 | | | | 5,750 | |
| |
| | | | 37,998 | | | | 28,969 | |
| |
Provisions for doubtful items deducted from accounts receivable amounted to $564 million at December 31, 2004 (2003: $557 million). Deferred charges and prepayments include amounts in respect of risk management activities.
15 Securities
Investments — securities mainly comprises a portfolio of equity and debt securities required to be held long term by the Group insurance companies as security for their insurance activities, for which the fair value of $1,408 million at December 31, 2004 includes an unrealised gain of $346 million.
$125 million (2003: $125 million) of these securities are debt securities classified as held-to-maturity, with maturity falling between one and five years. The remainder are classified as available for sale, of which $688 million at December 31, 2004 (2003: $638 million) are debt securities. Of the available for sale securities, the maturities of $21 million fall within one year, $411 million fall between one year and five years, and $256 million exceed five years.
The carrying amount of securities classified as cash equivalent is $1,477 million at December 31, 2004 (2003: $107 million), all of which are debt securities classified as available for sale.
Total securities at December 31, 2004 amounting to $814 million (2003: $1,557 million) are listed on recognised stock exchanges.
During 2004, a Group company disposed of an equity investment, resulting in the reclassification of an unrealised gain of $348 million from Other comprehensive income to Net income.
Notes to the US GAAP Financial Statements 65
16 Debt
| | | | | | | | | |
| | | | | | | $ million | |
| | | 2004 | | | 2003 | |
| |
| Debentures and other loans | | | 4,661 | | | | 8,181 | |
| Amounts due to banks and other credit institutions (including long-term debt due within one year) | | | 1,108 | | | | 2,737 | |
| |
| | | | 5,769 | | | | 10,918 | |
| Capitalised lease obligations | | | 53 | | | | 109 | |
| |
Short-term debt | | | 5,822 | | | | 11,027 | |
lesslong-term debt due within one year | | | 1,291 | | | | 1,874 | |
| |
| Short-term debt excluding long-term debt due within one year | | | 4,531 | | | | 9,153 | |
| |
Short-term debt at December 31, 2003 included $1.3 billion of non-recourse debt owed by a Group company, for which a covenant had been breached in 2001. During 2004, this company was disposed of and this debt was relieved in its entirety.
Short-term debenture balances fell during the year as a consequence of the Group’s reduced need for commercial paper financing.
The following relates only to short-term debt excluding long-term debt due within one year:
| | | | | | | | | |
| | | | | | | $ million | |
| | | 2004 | | | 2003 | |
| |
| Maximum amount outstanding at the end of any quarter | | | 6,688 | | | | 9,159 | |
| Average amount outstanding | | | 6,507 | | | | 8,554 | |
| Amounts due to banks and other credit institutions | | | 812 | | | | 2,657 | |
| Unused lines of short-term credit | | | 4,023 | | | | 3,916 | |
| Approximate average interest rate on: | | | | | | | | |
| average amount outstanding | | | 3 | % | | | 3 | % |
| amount outstanding at December 31 | | | 3 | % | | | 2 | % |
| |
The amount outstanding at December 31, 2004 includes $3,315 million of fixed rate and $252 million of variable rate US dollar debt at an average interest rate of 2% and 9% respectively.
| | | | | | | | | |
| | | | | | | $ million | |
| | | 2004 | | | 2003 | |
| |
| Debentures and other loans | | | 4,204 | | | | 4,868 | |
| Amounts due to banks and other credit institutions | | | 3,744 | | | | 3,724 | |
| |
| | | | 7,948 | | | | 8,592 | |
| Capitalised lease obligations | | | 652 | | | | 508 | |
| |
Long-term debt | | | 8,600 | | | | 9,100 | |
addlong-term debt due within one year | | | 1,291 | | | | 1,874 | |
| |
| Long-term debt including long-term debt due within one year | | | 9,891 | | | | 10,974 | |
| |
The following relates to long-term debt including the short-term part but excluding capitalised lease obligations.
The amount at December 31, 2004 of $9,186 million (2003: $10,357 million) comprises:
| | | | | | | | | |
| | | | | | | Average | |
| | | $ million | | | interest rate | |
| |
| US dollar denominated debt | | | | | | | | |
| Fixed rate | | | 4,925 | | | | 6 | % |
| Variable rate | | | 697 | | | | 4 | % |
| Non-dollar denominated debt | | | | | | | | |
| Fixed rate | | | 3,101 | | | | 4 | % |
| Variable rate | | | 463 | | | | 5 | % |
| |
| | | | 9,186 | | | | | |
| |
The approximate weighted average interest rate in 2004 was 5% for both US dollar debt and total debt.
The aggregate maturities of long-term debts are:
| | | | | |
| | | $ million | |
| |
| 2005 | | | 1,238 | |
| 2006 | | | 1,884 | |
| 2007 | | | 2,474 | |
| 2008 | | | 530 | |
| 2009 | | | 117 | |
| 2010 and after | | | 2,943 | |
| |
| | | | 9,186 | |
| |
During 2004, the Medium Term Note and Commercial Paper Facilities have been increased to a total level of $30.0 billion. As at December 31, 2004, debt outstanding under central borrowing programmes, which includes these facilities, totalled $8.3 billion with the remaining indebtedness raised by Group companies with no recourse beyond the immediate borrower and/or the local assets.
In accordance with the risk management policy, Group companies have entered into interest rate swap agreements against most of the fixed rate debt. The use of interest rate swaps is further discussed in Note 29.
66 Royal Dutch/Shell Group of Companies
17 Commitments
The future minimum lease payments under operating leases and capital leases and the present value of net minimum capital lease payments at December 31, 2004 are as follows:
| | | | | | | | | |
| | | | | | | $ million | |
| | | Operating | | | Capital | |
| | | leases | | | leases | |
| |
| 2005 | | | 1,744 | | | | 105 | |
| 2006 | | | 1,203 | | | | 73 | |
| 2007 | | | 958 | | | | 67 | |
| 2008 | | | 781 | | | | 61 | |
| 2009 | | | 709 | | | | 58 | |
| 2010 and after | | | 4,460 | | | | 852 | |
| |
| Total minimum payments | | | 9,855 | | | | 1,216 | |
| |
lessexecutory costs and interest | | | | | | | 511 | |
| |
| Present value of net minimum capital lease payments | | | | | | | 705 | |
| |
The figures above for operating lease payments represent minimum commitments existing at December 31, 2004 and are not a forecast of future total rental expense.
Total rental expense for all operating leases was as follows:
| | | | | | | | | | | | | |
| | | | | | | | | | | $ million | |
| | | 2004 | | | 2003 | | | 2002 | |
| |
| Minimum rentals | | | 2,140 | | | | 2,135 | | | | 1,557 | |
| Contingent rentals | | | 75 | | | | 60 | | | | 104 | |
| Sub-lease rentals | | | (198 | ) | | | (198 | ) | | | (300 | ) |
| |
| | | | 2,017 | | | | 1,997 | | | | 1,361 | |
| |
| (b) | | Long-term purchase obligations |
Group companies have unconditional long-term purchase obligations associated with financing arrangements. The aggregate amount of payments required under such obligations at December 31, 2004 is as follows:
| | | | | |
| | | $ million | |
| 2005 | | | 461 | |
| 2006 | | | 420 | |
| 2007 | | | 413 | |
| 2008 | | | 385 | |
| 2009 | | | 380 | |
| 2010 and after | | | 3,437 | |
| |
| | | | 5,496 | |
| |
The agreements under which these unconditional purchase obligations arise relate mainly to the purchase of chemicals feedstock, utilities and to the use of pipelines.
Payments under these agreements, which include additional sums depending upon actual quantities of supplies, amounted to $542 million in 2004 (2003: $252 million).
18 Accounts payable and accrued liabilities
| | | | | | | | | |
| | | | | | | $ million | |
| | | 2004 | | | 2003 | |
| |
| Trade payables | | | 18,716 | | | | 14,110 | |
| Amounts due to associated companies | | | 1,927 | | | | 1,829 | |
| Pensions and similar obligations | | | 286 | | | | 261 | |
| Other payables | | | 11,620 | | | | 8,832 | |
| Accruals and deferred income | | | 7,658 | | | | 7,315 | |
| |
| | | | 40,207 | | | | 32,347 | |
| |
Other payables include amounts in respect of risk management activities.
19 Long-term liabilities – Other
| | | | | | | | | |
| | | | | | | $ million | |
| | | 2004 | | | 2003 | |
| |
| Risk management activities | | | 1,801 | | | | 439 | |
| Deferred income | | | 1,501 | | | | 1,354 | |
| Environmental liabilities | | | 664 | | | | 676 | |
| Deposits for return items | | | 603 | | | | 566 | |
| Liabilities under staff benefit plans | | | 541 | | | | 315 | |
| Advance payments received under long-term supply contracts | | | 354 | | | | 315 | |
| Redundancy liabilities | | | 127 | | | | 165 | |
| Other | | | 2,474 | | | | 2,224 | |
| |
| | | | 8,065 | | | | 6,054 | |
| |
These amounts include $1,222 million at December 31, 2004 (2003: $1,305 million) which does not fall due until more than five years after the respective balance sheet dates.
20 Statement of cash flows
This statement reflects the cash flows arising from the activities of Group companies as measured in their own currencies, translated to US dollars at quarterly average rates of exchange.
Accordingly, the cash flows recorded in the Statement of Cash Flows exclude both the currency translation differences which arise as a result of translating the assets and liabilities of non-US dollar Group companies to US dollars at year-end rates of exchange (except for those arising on cash and cash equivalents) and non-cash investing and financing activities. These currency translation differences and non-cash investing and financing activities must therefore be added to the cash flow movements at average rates in order to arrive at the movements derived from the Statement of Assets and Liabilities.
Notes to the US GAAP Financial Statements 67
2004
| | | | | | | | | | | | | | | | | |
| | | | | | | | | | | | | | | $ million | |
| | | | | | | | | | | | | | | Movements | |
| | | Movements | | | Movements | | | | | | | derived from | |
| | | derived from | | | arising from | | | | | | | Statement of | |
| | | Statement of | | | currency | | | Non-cash | | | Assets and | |
| | | Cash Flows | | | translation | | | movements | | | Liabilities | |
| |
| Tangible and intangible fixed assets | | | (2,627 | ) | | | 3,448 | | | | 1,186 | | | | 2,007 | |
| Investments | | | (599 | ) | | | 122 | | | | 194 | | | | (283 | ) |
| Other long-term assets | | | 2,459 | | | | 598 | | | | 236 | | | | 3,293 | |
| Inventories | | | 2,731 | | | | 691 | | | | (721 | ) | | | 2,701 | |
| Accounts receivable | | | 8,462 | | | | 1,327 | | | | (760 | ) | | | 9,029 | |
| Cash and cash equivalents | | | 6,394 | | | | 113 | | | | — | | | | 6,507 | |
| Short-term debt | | | 3,701 | | | | (414 | ) | | | 1,335 | | | | 4,622 | |
| Short-term part of long-term debt | | | 672 | | | | (89 | ) | | | — | | | | 583 | |
| Accounts payable and accrued liabilities | | | (7,708 | ) | | | (784 | ) | | | 632 | | | | (7,860 | ) |
| Taxes payable | | | (2,999 | ) | | | (577 | ) | | | (382 | ) | | | (3,958 | ) |
| Long-term debt | | | 817 | | | | (357 | ) | | | 40 | | | | 500 | |
| Other long-term liabilities | | | (1,442 | ) | | | (247 | ) | | | (322 | ) | | | (2,011 | ) |
| Deferred taxation | | | 672 | | | | (673 | ) | | | 342 | | | | 341 | |
| Other provisions | | | (148 | ) | | | (471 | ) | | | (1,252 | ) | | | (1,871 | ) |
| Minority interests | | | (1,257 | ) | | | (109 | ) | | | (528 | ) | | | (1,894 | ) |
| Other items | | | (193 | ) | | | 193 | | | | — | | | | — | |
| Dividends to Parent Companies in excess of retained earnings movements | | | 501 | | | | (128 | ) | | | — | | | | 373 | |
| Adjustment for Parent Companies’ shares and Other comprehensive income excluding currency translation differences | | | 758 | | | | 505 | | | | — | | | | — | |
| | | | | | | | | | | | | | | | |
| | | | | | | | | | | | — | | | | | |
| | | | | | | | | | | | | | | |
| Movement in retained earnings of Group companies (Note 5) | | | 10,194 | | | | | | | | | | | | | |
| | | | | | | | | | | | | | | |
| Movement in cumulative currency translation differences (Note 6) | | | | | | | 3,148 | | | | | | | | | |
| | | | | | | | | | | | | | | |
| Movement in net assets (Note 5) | | | | | | | | | | | | | | | 12,079 | |
| | | | | | | | | | | | | | | | |
| |
Income taxes paid by Group companies totalled $11.6 billion in 2004 (2003: $8.6 billion; 2002: $6.7 billion). Interest paid by Group companies was $0.9 billion in 2004 (2003: $0.9 billion; 2002: $1.0 billion).
The main non-cash movements relate to the impact on the Statement of Assets and Liabilities of divestments, particularly of the Group’s interest in the Rayong Refinery which held $1.3 billion of short-term debt. There was also a review of the estimated provision for decommissioning and restoration costs during 2004 based on current experience and techniques which resulted in an increase of approximately $1.1 billion in both the provision and the corresponding tangible fixed assets.
21 Employee retirement plans and other postretirement benefits
Retirement plans are provided for permanent employees of all major Group companies. The nature of such plans varies according to the legal and fiscal requirements and economic conditions of the country in which the employees are engaged. Generally, the plans provide defined benefits based on employees’ years of service and average final remuneration. The principal plans in the Group use a December 31 measurement date.
Some Group companies have established unfunded defined benefit plans to provide certain postretirement healthcare and life insurance benefits to their retirees, the entitlement to which is usually based on the employee remaining in service up to retirement age and the completion of a minimum service period.
The Group has accounted for the impact of the United States Medicare Prescription Drug, Improvement and Modernization (“Medicare”) Act of 2003, with effect from January 1, 2004. The impact was a $300 million reduction in the accumulated postretirement benefit obligation at January 1, 2004 and a $52 million reduction in postretirement benefit cost for 2004. There was no reduction to accumulated postretirement benefit obligations of $159 million at January 1, 2004, for certain separately administered retiree benefit plans which must be analysed under final government regulations. The first subsidies arising from the Medicare Act are expected to be received in 2006.
68 Royal Dutch/Shell Group of Companies
21 Employee retirement plans and other postretirement benefitscontinued
| | | | | | | | | | | | | | | | | | | | | | | | | | | | | | | | | |
| | | | | | | | | | | | | | | | | | | | | | | | | | | | | | | $ million | |
| | | | | | | | | | | Other benefits | |
| | | Pension benefits | | | 2004 | | | 2003 | |
| | | 2004 | | | 2003 | | | USA | | | Other | | | Total | | | USA | | | Other | | | Total | |
| |
Change in benefit obligation | | | | | | | | | | | | | | | | | | | | | | | | | | | | | | | | |
| Obligations for benefits based on employee service to date at January 1 | | | 46,476 | | | | 39,109 | | | | 2,520 | | | | 512 | | | | 3,032 | | | | 2,068 | | | | 377 | | | | 2,445 | |
| Increase in present value of the obligation for benefits based on employee service during the year | | | 1,086 | | | | 991 | | | | 35 | | | | 16 | | | | 51 | | | | 37 | | | | 15 | | | | 52 | |
| Interest on the obligation for benefits in respect of employee service in previous years | | | 2,529 | | | | 2,333 | | | | 139 | | | | 28 | | | | 167 | | | | 141 | | | | 24 | | | | 165 | |
| Benefit payments made | | | (2,350 | ) | | | (2,034 | ) | | | (119 | ) | | | (28 | ) | | | (147 | ) | | | (95 | ) | | | (25 | ) | | | (120 | ) |
| Currency translation effects | | | 3,461 | | | | 5,333 | | | | — | | | | 40 | | | | 40 | | | | — | | | | 78 | | | | 78 | |
Other componentsa | | | 3,620 | | | | 744 | | | | (66 | ) | | | 43 | | | | (23 | ) | | | 369 | | | | 43 | | | | 412 | |
| |
| Obligations for benefits based on employee service to date at December 31 | | | 54,822 | | | | 46,476 | | | | 2,509 | | | | 611 | | | | 3,120 | | | | 2,520 | | | | 512 | | | | 3,032 | |
| |
Change in plan assets | | | | | | | | | | | | | | | | | | | | | | | | | | | | | | | | |
| Plan assets held in trust at fair value at January 1 | | | 43,960 | | | | 33,035 | | | | | | | | | | | | | | | | | | | | | | | | | |
| Actual return on plan assets | | | 5,262 | | | | 6,598 | | | | | | | | | | | | | | | | | | | | | | | | | |
| Employer contributions | | | 1,562 | | | | 1,275 | | | | | | | | | | | | | | | | | | | | | | | | | |
| Plan participants’ contributions | | | 56 | | | | 40 | | | | | | | | | | | | | | | | | | | | | | | | | |
| Benefit payments made | | | (2,350 | ) | | | (2,034 | ) | | | | | | | | | | | | | | | | | | | | | | | | |
| Currency translation effects | | | 3,367 | | | | 4,911 | | | | | | | | | | | | | | | | | | | | | | | | | |
Other componentsa | | | 17 | | | | 135 | | | | | | | | | | | | | | | | | | | | | | | | | |
| |
| Plan assets held in trust at fair value at December 31 | | | 51,874 | | | | 43,960 | | | | | | | | | | | | | | | | | | | | | | | | | |
| |
Plan assets in excess of/(less than) the present value of obligations for benefits at December 31 | | | (2,948 | ) | | | (2,516 | ) | | | (2,509 | ) | | | (611 | ) | | | (3,120 | ) | | | (2,520 | ) | | | (512 | ) | | | (3,032 | ) |
| Unrecognised net (gains)/losses remaining from the adoption of current method of determining pension costs | | | 3 | | | | 5 | | | | | | | | | | | | | | | | | | | | | | | | | |
| Unrecognised net (gains)/losses since adoption | | | 9,888 | | | | 7,295 | | | | 727 | | | | 186 | | | | 913 | | | | 876 | | | | 149 | | | | 1,025 | |
| Unrecognised prior service cost/(credit) | | | 1,185 | | | | 1,258 | | | | (34 | ) | | | 2 | | | | (32 | ) | | | (82 | ) | | | — | | | | (82 | ) |
| |
| Net amount recognised | | | 8,128 | | | | 6,042 | | | | (1,816 | ) | | | (423 | ) | | | (2,239 | ) | | | (1,726 | ) | | | (363 | ) | | | (2,089 | ) |
| |
Amounts recognised in the Statement of Assets and Liabilities: | | | | | | | | | | | | | | | | | | | | | | | | | | | | | | | | |
| Intangible assets | | | 353 | | | | 326 | | | | | | | | | | | | | | | | | | | | | | | | | |
| Prepaid benefit costs | | | 8,278 | | | | 6,516 | | | | | | | | | | | | | | | | | | | | | | | | | |
| Accrued benefit liabilities: | | | | | | | | | | | | | | | | | | | | | | | | | | | | | | | | |
| Short-term | | | (213 | ) | | | (182 | ) | | | (40 | ) | | | (33 | ) | | | (73 | ) | | | (51 | ) | | | (28 | ) | | | (79 | ) |
| Long-term | | | (2,878 | ) | | | (2,917 | ) | | | (1,776 | ) | | | (390 | ) | | | (2,166 | ) | | | (1,675 | ) | | | (335 | ) | | | (2,010 | ) |
| |
| | | | 5,540 | | | | 3,743 | | | | (1,816 | ) | | | (423 | ) | | | (2,239 | ) | | | (1,726 | ) | | | (363 | ) | | | (2,089 | ) |
Amount recognised in Parent Companies’ interest in Group net assets: | | | | | | | | | | | | | | | | | | | | | | | | | | | | | | | | |
| Accumulated other comprehensive income | | | 2,588 | | | | 2,299 | | | | | | | | | | | | | | | | | | | | | | | | | |
| Net amount recognised | | | 8,128 | | | | 6,042 | | | | (1,816 | ) | | | (423 | ) | | | (2,239 | ) | | | (1,726 | ) | | | (363 | ) | | | (2,089 | ) |
| |
| a | | Other components comprises mainly the effect of changes in actuarial assumptions, most notably the discount rate and in 2004 the impact of accounting for the US Medicare Act on the accumulated postretirement benefit obligation at January 1. |
Additional information on pension benefits
| | | | | | | | | |
| | | | | | | $ million | |
| | | 2004 | | | 2003 | |
| |
| Obligation for pension benefits in respect of unfunded plans | | | 2,032 | | | | 2,155 | |
| Accumulated benefit obligation | | | 48,654 | | | | 41,865 | |
| For employee retirement plans with projected benefit obligation in excess of plan assets, the respective amounts are: | | | | | | | | |
| Projected benefit obligation | | | 36,246 | | | | 30,291 | |
| Plan assets | | | 33,646 | | | | 28,176 | |
| For employee retirement plans with accumulated benefit obligation in excess of plan assets, the respective amounts are: | | | | | | | | |
| Accumulated benefit obligation | | | 11,844 | | | | 10,452 | |
| Plan assets | | | 10,734 | | | | 9,356 | |
| |
Notes to the US GAAP Financial Statements 69
Employer contributions to defined benefit pension plans during 2005 are estimated to be $1.4 billion. The following benefit payments, which reflect expected future service, as appropriate, are expected to be paid:
| | | | | | | | | | | | | | | | | |
| | | | | | | | | | | | | | | $ million | |
| | | Pension | | | | Other benefits | |
| | | benefits | | | USA | | | Other | | | Total | |
| |
| 2005 | | | 2,584 | | | | 132 | | | | 32 | | | | 164 | |
| 2006 | | | 2,664 | | | | 135 | | | | 33 | | | | 168 | |
| 2007 | | | 2,738 | | | | 147 | | | | 33 | | | | 180 | |
| 2008 | | | 2,829 | | | | 157 | | | | 34 | | | | 191 | |
| 2009 | | | 2,908 | | | | 165 | | | | 35 | | | | 200 | |
| 2010-2014 | | | 15,759 | | | | 905 | | | | 178 | | | | 1,083 | |
| |
Benefit costs for the year comprise:
| | | | | | | | | | | | | | | | | | | | | | | | | | | | | | | | | | | | | | | | | | | | | | | | | |
| | | | | | | | | | | | | | | | | | | | | | | | | | | | | | | | | | | | | | | | | | | | | | | $ million | |
| | | | | | | | | | | | | | | Other benefits | |
| | | | Pension benefits | | | 2004 | | | 2003 | | | 2002 | |
| | | 2004 | | | 2003 | | | 2002 | | | USA | | | Other | | | Total | | | USA | | | Other | | | Total | | | USA | | | Other | | | Total | |
| |
| Service cost | | | 1,086 | | | | 991 | | | | 899 | | | | 35 | | | | 16 | | | | 51 | | | | 37 | | | | 15 | | | | 52 | | | | 32 | | | | 7 | | | | 39 | |
| Interest cost | | | 2,529 | | | | 2,333 | | | | 2,001 | | | | 139 | | | | 28 | | | | 167 | | | | 141 | | | | 24 | | | | 165 | | | | 111 | | | | 21 | | | | 132 | |
| Expected return on plan assets | | | (3,894 | ) | | | (3,547 | ) | | | (3,339 | ) | | | | | | | | | | | | | | | | | | | | | | | | | | | | | | | | | | | | |
| Other components | | | 317 | | | | 303 | | | | (100 | ) | | | 41 | | | | 8 | | | | 49 | | | | 66 | | | | 4 | | | | 70 | | | | 76 | | | | 7 | | | | 83 | |
| |
| Cost of defined benefit plans | | | 38 | | | | 80 | | | | (539 | ) | | | 215 | | | | 52 | | | | 267 | | | | 244 | | | | 43 | | | | 287 | | | | 219 | | | | 35 | | | | 254 | |
| Payments to defined contribution plans | | | 221 | | | | 171 | | | | 84 | | | | | | | | | | | | | | | | | | | | | | | | | | | | | | | | | | | | | |
| |
| | | | 259 | | | | 251 | | | | (455 | ) | | | 215 | | | | 52 | | | | 267 | | | | 244 | | | | 43 | | | | 287 | | | | 219 | | | | 35 | | | | 254 | |
| |
Discount rates, projected rates of remuneration growth and expected rates of return on plan assets vary for the different plans as they are determined in the light of local conditions. Expected rates of return on plan assets are calculated using a common assumption-setting process based on a projection of real long-term bond yields and an equity risk premium which are combined with local inflation assumptions and applied to each plan’s actual asset mix. The weighted averages applicable for the principal plans in the Group are:
| | | | | | | | | | | | | | | | | | | | | | | | | | | | | | | | | | | | | |
| | | | | | | | | | | | | | | | Other benefits | |
| | | | Pension benefits | | | | 2004 | | | | 2003 | | | | 2002 | |
| | | 2004 | | | 2003 | | | 2002 | | | USA | | | Other | | | USA | | | Other | | | USA | | | Other | |
| |
Assumptions used to determine benefit obligations at December 31 | | | | | | | | | | | | | | | | | | | | | | | | | | | | | | | | | | | | |
| Discount rate | | | 5.1 | % | | | 5.6 | % | | | 5.9 | % | | | 5.8 | % | | | 5.0 | % | | | 6.0 | % | | | 5.6 | % | | | 6.5 | % | | | 5.6 | % |
| Projected rate of remuneration growth | | | 3.8 | % | | | 3.9 | % | | | 4.0 | % | | | | | | | | | | | | | | | | | | | | | | | | |
| |
Assumptions used to determine benefit costs for year ended December 31 | | | | | | | | | | | | | | | | | | | | | | | | | | | | | | | | | | | | |
| Discount rate | | | 5.6 | % | | | 5.9 | % | | | 6.0 | % | | | 6.0 | % | | | 5.6 | % | | | 6.5 | % | | | 5.6 | % | | | 7.0 | % | | | 6.0 | % |
| Expected rate of return on plan assets | | | 7.6 | % | | | 7.9 | % | | | 8.0 | % | | | | | | | | | | | | | | | | | | | | | | | | |
| Projected rate of remuneration growth | | | 3.9 | % | | | 4.0 | % | | | 4.0 | % | | | | | | | | | | | | | | | | | | | | | | | | |
| |
Healthcare cost trend rates | | | | | | | | | | | | | | | | | | | | | | | | | | | | | | | | | | | | |
| Healthcare cost trend rate in year after reporting year | | | | | | | | | | | | | | | 10.0 | % | | | 3.7 | % | | | 10.0 | % | | | 3.9 | % | | | 7.8 | % | | | 4.6 | % |
| Ultimate healthcare cost trend rate | | | | | | | | | | | | | | | 5.0 | % | | | 2.9 | % | | | 5.0 | % | | | 2.9 | % | | | 5.0 | % | | | 2.9 | % |
| Year ultimate healthcare cost trend rate is applicable | | | | | | | | | | | | | | | 2012 | | | | 2007 | | | | 2011 | | | | 2006 | | | | 2010 | | | | 2004 | |
| |
The effect of a one percentage point increase/(decrease) in the annual rate of increase in the assumed healthcare cost trend rates would be to increase/(decrease) annual postretirement benefit cost by approximately $35 million/($25 million) and the accumulated postretirement benefit obligation by approximately $456 million/($374 million).
70 Royal Dutch/Shell Group of Companies
21 Employee retirement plans and other postretirement benefitscontinued
Weighted-average plan asset allocations by asset category and the target allocation for December 31, 2004 for the principal pension plans in the Group are:
| | | | | | | | | | | | | |
| | | Target | | | Percentage of plan | |
| | | allocation | | | assets at December 31 | |
| | | 2004 | | | 2004 | | | 2003 | |
| |
| Equity securities | | | 72 | % | | | 73 | % | | | 73 | % |
| Debt securities | | | 23 | % | | | 21 | % | | | 22 | % |
| Real estate | | | 2 | % | | | 2 | % | | | 2 | % |
| Other | | | 3 | % | | | 4 | % | | | 3 | % |
| |
| Total | | | 100 | % | | | 100 | % | | | 100 | % |
| |
Plan long-term investment strategies are generally determined by the responsible Pension Fund Trustees using a structured asset-liability modelling approach to determine the asset mix which best meets the objectives of optimising investment return and maintaining adequate funding levels.
22 Employee emoluments and numbers
| | | | | | | | | | | | | |
| | | | | | | | | | | $ million | |
| | | 2004 | | | 2003 | | | 2002 | |
| |
| Remuneration | | | 8,125 | | | | 7,477 | | | | 6,096 | |
| Social law taxes | | | 695 | | | | 660 | | | | 518 | |
| Pensions and similar obligations (Note 21) | | | 526 | | | | 538 | | | | (201 | ) |
| |
| | | | 9,346 | | | | 8,675 | | | | 6,413 | |
| |
| | | | | | | | | | | | | |
| | | | | | | | | | | thousands | |
| | | 2004 | | | 2003 | | | 2002 | |
| |
| Exploration & Production | | | 17 | | | | 17 | | | | 17 | |
| Gas & Power | | | 2 | | | | 2 | | | | 2 | |
| Oil Products | | | 78 | | | | 82 | | | | 75 | |
| Chemicals | | | 8 | | | | 9 | | | | 9 | |
| Corporate and Other | | | 9 | | | | 9 | | | | 8 | |
| |
| | | | 114 | | | | 119 | | | | 111 | |
| |
| | | | | | | | | | | | | |
| | | | | | | | | | | thousands | |
| | | 2004 | | | 2003 | | | 2002 | |
| |
| Exploration & Production | | | 17 | | | | 17 | | | | 17 | |
| Gas & Power | | | 2 | | | | 2 | | | | 2 | |
| Oil Products | | | 76 | | | | 82 | | | | 80 | |
| Chemicals | | | 8 | | | | 9 | | | | 9 | |
| Corporate and Other | | | 9 | | | | 9 | | | | 8 | |
| |
| | | | 112 | | | | 119 | | | | 116 | |
| |
In addition to remuneration above, there were charges for redundancy of $526 million in 2004 (2003: $291 million; 2002: $215 million).
The charges relate to 4,000 employees in 2004 (mainly in the Oil Products segment, primarily due to portfolio restructuring, and in the Corporate and Other segment due to restructuring in information and technology), 2,000 employees in 2003 (mainly in the Exploration & Production and Oil Products segments) and 2,600 employees in 2002 (mainly in the Exploration & Production and Oil Products segments). The liabilities for redundancies at December 31, 2004 and 2003, and movements during 2004 and 2003 are given in the following table:
| | | | | | | | | |
| | | | | | | $ million | |
| | | 2004 | | | 2003 | |
| |
| At January 1 | | | 494 | | | | 395 | |
| Charges | | | 526 | | | | 291 | |
| Payments | | | (394 | ) | | | (245 | ) |
| Other movements and currency translation effects | | | (29 | ) | | | 53 | |
| |
| At December 31 | | | 597 | | | | 494 | |
| |
Notes to the US GAAP Financial Statements 71
23 Stock-based compensation plans and Parent Companies’ shares held by Group companies
Stock-based compensation plans
Certain Group companies have in place various stock-based plans for senior staff and other employees of those and other Group companies. Details of the principal plans are given below.
The Group Stock Option Plans offer eligible employees options over Royal Dutch ordinary shares (Royal Dutch shares) or Shell Transport Ordinary shares (Shell Transport shares) at a price not less than the fair market value of the shares at the date the options were granted. The options are exercisable three years from grant, except for those granted under the US plans, which vest a third per year for three years. The options lapse ten years after grant, however, leaving Group employment may cause options to lapse earlier. For Group Executive Directors and the most senior executives, 100% of the options granted in 2003 (and in subsequent years) are subject to performance conditions.
Under the Restricted Stock Plan, grants are made on a highly selective basis to senior staff. A maximum of 250,000 Royal Dutch shares (or equivalent value in Shell Transport shares) can be granted under the plan in any year. Shares are granted subject to a three-year restriction period and the number of shares awarded is based on the share price at the start of the restricted period. The shares, together with additional shares equivalent to the value of the dividends payable over the restriction period, are released to the individual at the end of the three-year period.
The following table shows for 2003 and 2004, in respect of option plans, the number of shares under option at the beginning of the year, the number of options granted, exercised and expired during the year and the number of shares under option at the end of the year, together with their weighted average exercise price translated at the respective year-end exchange rates:
| | | | | | | | | | | | | | | | | | | | | | | | | |
| | | Royal Dutch shares | | | Shell Transport shares | | | Shell Canada common sharesa | |
| | | Weighted | | | Weighted | | | Weighted | |
| | | average | | | average | | | average | |
| | | Number | | | exercise price | | | Number | | | exercise price | | | Number | | | exercise price | |
| | | (thousands) | | | ($) | | | (thousands) | | | ($) | | | (thousands) | | | ($) | |
| |
| Under option at January 1, 2003 | | | 33,381 | | | | 59.86 | | | | 101,447 | | | | 8.26 | | | | 4,777 | | | | 21.71 | |
| Granted | | | 15,643 | | | | 45.13 | | | | 41,893 | | | | 6.74 | | | | 1,674 | | | | 35.65 | |
| Exercised | | | — | | | | — | | | | (192 | ) | | | 6.47 | | | | (505 | ) | | | 22.88 | |
| Expired | | | (1,003 | ) | | | 64.03 | | | | (2,813 | ) | | | 8.92 | | | | (73 | ) | | | 26.03 | |
| |
Under option at December 31, 2003b | | | 48,021 | | | | 60.09 | | | | 140,335 | | | | 8.44 | | | | 5,873 | | | | 29.43 | |
| |
| Granted | | | 14,816 | | | | 52.42 | | | | 42,998 | | | | 7.47 | | | | 1,697 | | | | 45.99 | |
| Exercised | | | (495 | ) | | | 47.20 | | | | (1,341 | ) | | | 7.10 | | | | (1,175 | ) | | | 22.73 | |
| Expired | | | (1,644 | ) | | | 68.14 | | �� | | (6,033 | ) | | | 9.69 | | | | (285 | ) | | | 25.85 | |
| |
Under option at December 31, 2004b | | | 60,698 | | | | 60.56 | | | | 175,959 | | | | 8.73 | | | | 6,110 | | | | 37.17 | |
| |
| b | The underlying weighted average exercise prices for Royal Dutch and Shell Transport shares under option at December 31, 2004 were€44.42 (2003:€47.64) and £4.53 (2003: £4.73) respectively. |
The following tables provide further information about the options outstanding at December 31, 2004:
| | | | | | | | | | | | | | | | | | | | | |
| | | | | | | | | | | | | | | Royal Dutch shares | |
| | | Options outstanding | | | Options exercisable | |
| | | | | | | Weighted | | | | | | | | | | | |
| | | | | | | average | | | Weighted | | | | | | | Weighted | |
| | | | | | | remaining | | | average | | | | | | | average | |
| | | Number | | | contractual life | | | exercise price | | | Number | | | exercise price | |
| Range of exercise prices | | (thousands) | | | (years) | | | ($) | | | (thousands) | | | ($) | |
| |
| $40 to $45 | | | 6,541 | | | | 8.2 | | | | 42.25 | | | | 2,027 | | | | 42.24 | |
| $45 to $50 | | | 7,096 | | | | 9.1 | | | | 48.65 | | | | 223 | | | | 45.71 | |
| $50 to $55 | | | 19,118 | | | | 7.4 | | | | 52.72 | | | | 6,241 | | | | 53.49 | |
| $55 to $60 | | | 8,354 | | | | 7.6 | | | | 56.30 | | | | 2,353 | | | | 56.21 | |
| $60 to $65 | | | 3,759 | | | | 6.2 | | | | 60.77 | | | | 3,759 | | | | 60.77 | |
| $65 to $70 | | | 773 | | | | 2.3 | | | | 66.70 | | | | 773 | | | | 66.70 | |
| $75 to $80 | | | 149 | | | | 6.8 | | | | 76.94 | | | | 149 | | | | 76.94 | |
| $80 to $85 | | | 9,503 | | | | 6.3 | | | | 82.92 | | | | 1,959 | | | | 81.34 | |
| $85 to $90 | | | 2,124 | | | | 5.4 | | | | 85.36 | | | | 2,124 | | | | 85.36 | |
| $90 to $95 | | | 79 | | | | 5.2 | | | | 94.11 | | | | 79 | | | | 94.11 | |
| $95 to $100 | | | 3,202 | | | | 6.2 | | | | 96.21 | | | | 3,202 | | | | 96.21 | |
| |
| $40 to $100 | | | 60,698 | | | | 7.3 | | | | 60.56 | | | | 22,889 | | | | 65.95 | |
| |
72 Royal Dutch/Shell Group of Companies
23 Stock-based compensation plans and Parent Companies’ shares held by Group companiescontinued
| | | | | | | | | | | | | | | | | | | | | |
| | | | | | | | | | | | | | | Shell Transport shares | |
| | | Options outstanding | | | Options exercisable | |
| | | | | | | Weighted | | | | | | | | | | | |
| | | | | | | average | | | Weighted | | | | | | | Weighted | |
| | | | | | | remaining | | | average | | | | | | | average | |
| | | Number | | | contractual life | | | exercise price | | | Number | | | exercise price | |
| Range of exercise prices | | (thousands) | | | (years) | | | ($) | | | (thousands) | | | ($) | |
| |
| $7 to $8 | | | 93,250 | | | | 7.8 | | | | 7.36 | | | | 9,847 | | | | 7.00 | |
| $8 to $9 | | | 6,937 | | | | 3.3 | | | | 8.45 | | | | 6,137 | | | | 8.47 | |
| $9 to $10 | | | 11,694 | | | | 4.4 | | | | 9.74 | | | | 11,694 | | | | 9.74 | |
| $10 to $11 | | | 51,761 | | | | 6.3 | | | | 10.29 | | | | 14,110 | | | | 10.64 | |
| $11 to $12 | | | 12,317 | | | | 6.0 | | | | 11.80 | | | | 12,317 | | | | 11.80 | |
| |
| $7 to $12 | | | 175,959 | | | | 6.8 | | | | 8.73 | | | | 54,105 | | | | 9.80 | |
| |
In the UK, The Shell Petroleum Company Limited and Shell Petroleum N.V. each operate a savings-related stock option scheme, under which options are granted over shares of Shell Transport at prices not less than the market value on a date not more than 30 days before the date of the grant of option and are normally exercisable after completion of a three-year or five-year contractual savings period. The following table shows for 2003 and 2004, in respect of these plans, the number of Shell Transport shares under option at the beginning of the year, the number of options granted, exercised and expired during the year and the number of shares under option at the end of the year:
| | | | | | | | | |
| | | | | | | thousands | |
| | | 2004 | | | 2003 | |
| |
| Under option at January 1 | | | 15,089 | | | | 18,680 | |
| Granted | | | — | | | | 4,975 | |
| Exercised | | | (1,924 | ) | | | (707 | ) |
| Expired | | | (2,634 | ) | | | (7,859 | ) |
| |
| Under option at December 31 | | | 10,531 | | | | 15,089 | |
| |
Certain Group companies have incentive compensation plans containing stock appreciation rights linked to the value of Royal Dutch shares. During 2004, 1,375,989 of these stock appreciation rights were exercised and 21,833 forfeited, leaving a balance of 7,484,779 at December 31, 2004 (2003: 8,882,601).
In 2001, the Global Employee Share Purchase Plan was implemented giving eligible employees the opportunity to buy Royal Dutch or Shell Transport shares, with 15% added after a specified holding period. At December 31, 2004, 16,024 (2003: 4,754) Royal Dutch shares and 25,881 (2003: 19,742) Shell Transport shares were held by Group companies in connection with the Global Employee Share Purchase Plan.
Effects on Group net income and Earnings per share under the fair value method
A comparison of the Group’s net income and Earnings per share for both Royal Dutch and Shell Transport as reported under the intrinsic value method and on a pro forma basis calculated as if the fair value of options and share purchase rights granted would have been considered as compensation expense is as follows:
| | | | | | | | | | | | | | | | | | | | | | | | | |
| | | 2004 | | | 2003 | | | 2002 | |
| | | As reported | | | Pro forma | | | As restated | | | Pro forma | | | As restated | | | Pro forma | |
| |
| Group net income ($ million) | | | 18,183 | | | | 17,938 | | | | 12,313 | | | | 12,036 | | | | 9,656 | | | | 9,453 | |
| Basic earnings per share attributable to Royal Dutch ($) | | | 5.39 | | | | 5.32 | | | | 3.63 | | | | 3.55 | | | | 2.82 | | | | 2.76 | |
| Diluted earnings per share attributable to Royal Dutch ($) | | | 5.39 | | | | 5.31 | | | | 3.63 | | | | 3.55 | | | | 2.81 | | | | 2.76 | |
| Basic earnings per ADR attributable to Shell Transport ($) | | | 4.60 | | | | 4.54 | | | | 3.10 | | | | 3.03 | | | | 2.41 | | | | 2.36 | |
| Diluted earnings per ADR attributable to Shell Transport ($) | | | 4.60 | | | | 4.54 | | | | 3.10 | | | | 3.03 | | | | 2.41 | | | | 2.36 | |
| |
The fair value of the Group’s 2004 option grants was estimated using a Black-Scholes option pricing model and the following assumptions for US dollar, euro and sterling denominated options respectively: risk-free interest rates of 3.5%, 3.1% and 4.9%; dividend yield of 4.1%, 4.5% and 4.0%; volatility of 28.2%, 30.3% and 31.7% and expected lives of five to seven years.
Parent Companies’ shares held by Group companies
Group companies purchase shares of the Parent Companies in the open market with the purpose of covering their future obligations arising from the stock options granted to their employees and employees of other Group companies. At December 31, 2004, 52.7 million Royal Dutch shares (2003: 41.1 million) and 183.9 million Shell Transport shares (2003: 147.9 million) were held by Group companies.
In connection with other incentive compensation plans linked to the appreciation in value of Royal Dutch and of Shell Transport shares, 9.2 million Royal Dutch shares and 0.4 million Shell Transport shares were held by Group companies at December 31, 2004 and 2003. In addition, 33,600 shares of Royal Dutch were held by Group companies at December 31, 2004 and 2003.
The carrying amount of these and all Parent Company shares held in connection with the stock-based compensation plans at December 31, 2004 was $4,187 million (2003: $3,428 million).
Notes to the US GAAP Financial Statements 73
24 Decommissioning and restoration costs
| | | | | | | | | | | | | | | | | | | | | | | | | |
| | $ million | |
| | 2004 | | 2003 | |
| | Short-term | | Long-term | | Total | | Short-term | | Long-term | | Total | |
| |
| At January 1 | | | 89 | | | | 3,955 | | | | 4,044 | | | | 71 | | | | 3,528 | | | | 3,599 | |
Cumulative effect of change in accounting policya | | | — | | | | — | | | | — | | | | 108 | | | | (102 | ) | | | 6 | |
| Liabilities incurred | | | 6 | | | | 291 | | | | 297 | | | | — | | | | 174 | | | | 174 | |
| Liabilities settled | | | (77 | ) | | | (18 | ) | | | (95 | ) | | | (106 | ) | | | (37 | ) | | | (143 | ) |
| Accretion expense | | | — | | | | 284 | | | | 284 | | | | — | | | | 49 | | | | 49 | |
| Reclassifications and other movements | | | 160 | | | | 912 | | | | 1,072 | | | | 12 | | | | 12 | | | | 24 | |
| Currency translation differences | | | 7 | | | | 285 | | | | 292 | | | | 4 | | | | 331 | | | | 335 | |
| |
| At December 31 | | | 185 | | | | 5,709 | | | | 5,894 | | | | 89 | | | | 3,955 | | | | 4,044 | |
| |
| a | US accounting standard FAS 143 (Asset Retirement Obligations) was effective from the beginning of 2003 (see Note 3). |
A review of the estimated provision for decommissioning and restoration costs was performed during 2004 based on current experience and techniques. This resulted in an increase of $1.1 billion in both the provision and corresponding tangible fixed assets, reported within other movements.
For the purposes of calculating provisions for decommissioning and restoration costs, estimated total ultimate liabilities of $9.8 billion at December 31, 2004 (2003: $7.5 billion) were used. Such estimates are subject to various regulatory and technological developments.
25 Information by geographical area and by industry segment
| | | | | | | | | | | | | | | | | | | | | | | | | |
| | | $ million | |
| | | 2004 | | | 2003 As restateda | | | 2002 As restateda | |
| | | Net | | | Fixed | | | Net | | | Fixed | | | Net | | | Fixed | |
| | | proceeds | | | assets | | | proceeds | | | assets | | | proceeds | | | assets | |
| |
| Europe | | | 94,904 | | | | 37,930 | | | | 70,375 | | | | 37,686 | | | | 62,575 | | | | 36,516 | |
| Other Eastern Hemisphere | | | 49,482 | | | | 36,977 | | | | 37,482 | | | | 33,530 | | | | 32,406 | | | | 28,492 | |
| USA | | | 102,877 | | | | 27,580 | | | | 75,109 | | | | 30,343 | | | | 54,677 | | | | 27,266 | |
| Other Western Hemisphere | | | 17,927 | | | | 13,834 | | | | 15,396 | | | | 13,038 | | | | 13,795 | | | | 11,869 | |
| |
| Total Group | | | 265,190 | | | | 116,321 | | | | 198,362 | | | | 114,597 | | | | 163,453 | | | | 104,143 | |
| |
| a | As a consequence of the separate reporting of income from discontinued operations (see Note 4), information for comparative periods has been reclassified where necessary. |
| | | | | | | | | | | | | | | | | | | | | | | | | |
| 2004 | | $ million | |
| | | Total | | | Exploration & | | | Gas & | | | Oil | | | | | | | Corporate | |
| | | Group | | | Production | | | Power | | | Products | | | Chemicals | | | and Other | |
| |
| Sales | | | | | | | | | | | | | | | | | | | | | | | | |
| Third parties | | | 265,190 | | | | 20,643 | | | | 9,604 | | | | 207,006 | | | | 26,877 | | | | 1,060 | |
| Inter-segment | | | | | | | 19,001 | | | | 1,210 | | | | 11,924 | | | | 2,620 | | | | 11 | |
| |
Net proceeds | | | | | | | 39,644 | | | | 10,814 | | | | 218,930 | | | | 29,497 | | | | 1,071 | |
| |
| Operating profit/(loss) | | | | | | | | | | | | | | | | | | | | | | | | |
| Group companies | | | 26,280 | | | | 18,386 | | | | 331 | | | | 7,152 | | | | 1,245 | | | | (834 | ) |
| Group share of associated companies | | | 5,653 | | | | 2,438 | | | | 1,384 | | | | 1,749 | | | | 94 | | | | (12 | ) |
| | | | 31,933 | | | | 20,824 | | | | 1,715 | | | | 8,901 | | | | 1,339 | | | | (846 | ) |
| Interest and other income | | | 1,705 | | | | 244 | | | | 768 | | | | 90 | | | | 1 | | | | 602 | |
| Interest expense | | | 1,214 | | | | | | | | | | | | | | | | | | | | 1,214 | |
| Currency exchange gains/(losses) | | | (39 | ) | | | (78 | ) | | | 15 | | | | (19 | ) | | | (16 | ) | | | 59 | |
| Taxation | | | 15,136 | | | | 12,033 | | | | 429 | | | | 2,691 | | | | 394 | | | | (411 | ) |
| Income applicable to minority interests | | | 626 | | | | | | | | | | | | | | | | | | | | | |
Income from continuing operations | | | 16,623 | | | | 8,957 | | | | 2,069 | | | | 6,281 | | | | 930 | | | | (988 | ) |
Income from discontinued operations, net of taxa | | | 1,560 | | | | 358 | | | | 86 | | | | 1,256 | | | | — | | | | (52 | ) |
| |
Net income | | | 18,183 | | | | 9,315 | | | | 2,155 | | | | 7,537 | | | | 930 | | | | (1,040 | ) |
| |
Total assets at December 31 | | | 192,811 | | | | 68,199 | | | | 23,214 | | | | 71,447 | | | | 18,330 | | | | 11,621 | |
Total liabilities at December 31 | | | (102,926 | ) | | | (44,602 | ) | | | (15,897 | ) | | | (44,509 | ) | | | (8,062 | ) | | | 10,144 | |
Tangible fixed assets at December 31 | | | | | | | | | | | | | | | | | | | | | | | | |
| Cost | | | 193,162 | | | | 115,404 | | | | 8,028 | | | | 53,773 | | | | 14,561 | | | | 1,396 | |
| Accumulated depreciation | | | (104,222 | ) | | | (63,411 | ) | | | (1,107 | ) | | | (30,689 | ) | | | (8,381 | ) | | | (634 | ) |
Goodwill at December 31 | | | 2,691 | | | | — | | | | 184 | | | | 2,470 | | | | 23 | | | | 14 | |
Investments in associated companies at December 31 | | | 19,743 | | | | 4,762 | | | | 4,312 | | | | 6,206 | | | | 4,139 | | | | 324 | |
Capital expenditure and new investments in associated companies | | | 13,792 | | | | 8,745 | | | | 1,633 | | | | 2,466 | | | | 705 | | | | 243 | |
Depreciation, depletion and amortisation charge from continuing operations | | | | | | | | | | | | | | | | | | | | | | | | |
| Impairment | | | 622 | | | | 7 | | | | — | | | | 580 | | | | 29 | | | | 6 | |
| Other | | | 11,530 | | | | 8,132 | | | | 262 | | | | 2,476 | | | | 515 | | | | 145 | |
| |
| a | $88 million of income applicable to minority interests is deducted in arriving at income from discontinued operations for the Group in 2004 (2003: $13 million). |
74 Royal Dutch/Shell Group of Companies
25 Information by geographical area and by industry segmentcontinued
| | | | | | | | | | | | | | | | | | | | | | | | | |
| | | | | | | | | | | | | | | | | | | | | | | $ million | |
| | | Total | | | Exploration & | | | Gas & | | | Oil | | | | | | | Corporate | |
| 2003 (as restated)a | | Group | | | Production | | | Power | | | Products | | | Chemicals | | | and Other | |
| |
| Sales | | | | | | | | | | | | | | | | | | | | | | | | |
| Third parties | | | 198,362 | | | | 12,224 | | | | 7,377 | | | | 159,075 | | | | 18,843 | | | | 843 | |
| Inter-segment | | | | | | | 20,244 | | | | 850 | | | | 3,416 | | | | 1,974 | | | | 29 | |
| |
Net proceeds | | | | | | | 32,468 | | | | 8,227 | | | | 162,491 | | | | 20,817 | | | | 872 | |
| |
| Operating profit/(loss) | | | | | | | | | | | | | | | | | | | | | | | | |
| Group companies | | | 17,877 | | | | 14,968 | | | | 510 | | | | 3,175 | | | | (112 | ) | | | (664 | ) |
| Group share of associated companies | | | 3,446 | | | | 1,857 | | | | 871 | | | | 910 | | | | (165 | ) | | | (27 | ) |
| |
| | | | 21,323 | | | | 16,825 | | | | 1,381 | | | | 4,085 | | | | (277 | ) | | | (691 | ) |
| Interest and other income | | | 1,967 | | | | 88 | | | | 1,366 | | | | (39 | ) | | | (29 | ) | | | 581 | |
| Interest expense | | | 1,324 | | | | | | | | | | | | | | | | | | | | 1,324 | |
| Currency exchange gains/(losses) | | | (231 | ) | | | (16 | ) | | | (23 | ) | | | (23 | ) | | | (14 | ) | | | (155 | ) |
| Taxation | | | 9,349 | | | | 8,307 | | | | 454 | | | | 1,202 | | | | (111 | ) | | | (503 | ) |
| Income applicable to minority interests | | | 353 | | | | | | | | | | | | | | | | | | | | | |
| |
Income from continuing operations | | | 12,033 | | | | 8,590 | | | | 2,270 | | | | 2,821 | | | | (209 | ) | | | (1,086 | ) |
Income from discontinued operations, net of taxb | | | 25 | | | | 78 | | | | 19 | | | | 39 | | | | — | | | | (98 | ) |
| Cumulative effect of change in accounting principle, net of tax | | | 255 | | | | 255 | | | | | | | | | | | | | | | | | |
| |
Net income | | | 12,313 | | | | 8,923 | | | | 2,289 | | | | 2,860 | | | | (209 | ) | | | (1,184 | ) |
| |
Total assets at December 31 | | | 169,557 | | | | 63,641 | | | | 19,212 | | | | 64,725 | | | | 15,297 | | | | 6,682 | |
Total liabilities at December 31 | | | (93,645 | ) | | | (47,866 | ) | | | (13,277 | ) | | | (42,549 | ) | | | (7,888 | ) | | | 17,935 | |
Tangible fixed assets at December 31 | | | | | | | | | | | | | | | | | | | | | | | | |
| Cost | | | 181,685 | | | | 105,540 | | | | 6,934 | | | | 53,556 | | | | 14,028 | | | | 1,627 | |
| Accumulated depreciation | | | (94,597 | ) | | | (56,265 | ) | | | (985 | ) | | | (28,784 | ) | | | (7,851 | ) | | | (712 | ) |
Goodwill at December 31 | | | 2,675 | | | | — | | | | 184 | | | | 2,455 | | | | 23 | | | | 13 | |
Investments in associated companies at December 31 | | | 19,371 | | | | 4,108 | | | | 4,924 | | | | 5,965 | | | | 4,017 | | | | 357 | |
Capital expenditure, acquisitions and new investments in associated companies | | | 13,235 | | | | 8,278 | | | | 1,511 | | | | 2,405 | | | | 599 | | | | 442 | |
Depreciation, depletion and amortisation charge from continuing operations | | | | | | | | | | | | | | | | | | | | | | | | |
| Impairment | | | 1,288 | | | | 679 | | | | — | | | | 262 | | | | 220 | | | | 127 | |
| Other | | | 10,203 | | | | 7,048 | | | | 116 | | | | 2,455 | | | | 458 | | | | 126 | |
| |
| | | | | | | | | | | | | | | | | | | | | | | | | |
| | | | | | | | | | | | | | | | | | | | | | | $ million | |
| | | Total | | | Exploration & | | | Gas & | | | Oil | | | | | | | Corporate | |
| 2002 (as restated)a | | Group | | | Production | | | Power | | | Products | | | Chemicals | | | and Other | |
| |
| Sales | | | | | | | | | | | | | | | | | | | | | | | | |
| Third parties | | | 163,453 | | | | 11,640 | | | | 4,254 | | | | 132,681 | | | | 14,125 | | | | 753 | |
| Inter-segment | | | | | | | 14,680 | | | | 620 | | | | 3,080 | | | | 1,082 | | | | 17 | |
| |
Net proceeds | | | | | | | 26,320 | | | | 4,874 | | | | 135,761 | | | �� | 15,207 | | | | 770 | |
| |
| Operating profit/(loss) | | | | | | | | | | | | | | | | | | | | | | | | |
| Group companies | | | 15,067 | | | | 11,976 | | | | 89 | | | | 3,009 | | | | 438 | | | | (445 | ) |
| Group share of associated companies | | | 2,792 | | | | 1,316 | | | | 729 | | | | 554 | | | | 213 | | | | (20 | ) |
| |
| | | | 17,859 | | | | 13,292 | | | | 818 | | | | 3,563 | | | | 651 | | | | (465 | ) |
| Interest and other income | | | 748 | | | | 98 | | | | 118 | | | | 10 | | | | 3 | | | | 519 | |
| Interest expense | | | 1,291 | | | | | | | | | | | | | | | | | | | | 1,291 | |
| Currency exchange gains/(losses) | | | (25 | ) | | | (25 | ) | | | 6 | | | | (67 | ) | | | (16 | ) | | | 77 | |
| Taxation | | | 7,647 | | | | 6,724 | | | | 195 | | | | 1,021 | | | | 73 | | | | (366 | ) |
| Income applicable to minority interests | | | 175 | | | | | | | | | | | | | | | | | | | | | |
| |
Income from continuing operations | | | 9,469 | | | | 6,641 | | | | 747 | | | | 2,485 | | | | 565 | | | | (794 | ) |
| Income from discontinued operations, net of tax | | | 187 | | | | 85 | | | | 27 | | | | 142 | | | | — | | | | (67 | ) |
| |
Net income | | | 9,656 | | | | 6,726 | | | | 774 | | | | 2,627 | | | | 565 | | | | (861 | ) |
| |
Total assets at December 31 | | | 153,131 | | | | 56,988 | | | | 16,057 | | | | 60,549 | | | | 14,172 | | | | 5,365 | |
Total liabilities at December 31c | | | (89,287 | ) | | | (45,191 | ) | | | (12,223 | ) | | | (41,826 | ) | | | (7,903 | ) | | | 17,856 | |
Tangible fixed assets at December 31 | | | | | | | | | | | | | | | | | | | | | | | | |
| Cost | | | 157,499 | | | | 93,333 | | | | 2,843 | | | | 47,689 | | | | 12,010 | | | | 1,624 | |
| Accumulated depreciation | | | (79,136 | ) | | | (47,076 | ) | | | (763 | | | | (23,926 | ) | | | (6,711 | ) | | | (660 | ) |
Goodwill at December 31 | | | 2,324 | | | | — | | | | 184 | | | | 1,989 | | | | 22 | | | | 129 | |
Investments in associated companies at December 31 | | | 17,945 | | | | 3,591 | | | | 4,679 | | | | 5,344 | | | | 4,154 | | | | 177 | |
Capital expenditure, acquisitions and new investments in associated companies | | | 23,651 | | | | 13,154 | | | | 953 | | | | 7,968 | | | | 998 | | | | 578 | |
Depreciation, depletion and amortisation charge from continuing operations | | | | | | | | | | | | | | | | | | | | | | | | |
| Impairment | | | 188 | | | | 33 | | | | 4 | | | | 102 | | | | 29 | | | | 20 | |
| Other | | | 8,340 | | | | 5,603 | | | | 112 | | | | 2,160 | | | | 372 | | | | 93 | |
| |
As a consequence of the separate reporting of income from discontinued operations (see Note 4), information for comparative periods has been reclassified where necessary.
| a | See Note 2 to the Group Financial Statements. |
| b | $88 million of income applicable to minority interests is deducted in arriving at income from discontinued operations for the Group in 2004 (2003: $13 million). |
| c | Deferred taxation as at December 31, 2002 is included on a net liability basis, rather than as separate deferred taxation assets and liabilities as in 2004 and 2003. |
Notes to the US GAAP Financial Statements 75
26 Oil and natural gas exploration and production activities
(a) Capitalised costs
The aggregate amount of tangible fixed assets of Group companies relating to oil and gas exploration and production activities and the aggregate amount of the related depreciation, depletion and amortisation at December 31 are shown in the table below:
| | | | | | | | | | | | | |
| | | $ million | |
| | | | | | | 2003 | | | 2002 | |
| | | 2004 | | | As restated | | | As restated | |
Cost | | | | | | | | | | | | |
| Proved properties | | | 104,479 | a | | | 94,069 | a | | | 83,964 | |
| Unproved properties | | | 4,281 | | | | 5,400 | | | | 4,768 | |
| Support equipment and facilities | | | 3,266 | | | | 3,128 | | | | 2,352 | |
| |
| | | | 112,026 | | | | 102,597 | | | | 91,084 | |
| |
Depreciation | | | | | | | | | | | | |
| Proved properties | | | 60,101 | a | | | 53,867 | a | | | 45,525 | |
| Unproved properties | | | 1,437 | | | | 824 | | | | 325 | |
| Support equipment and facilities | | | 1,582 | | | | 1,443 | | | | 1,224 | |
| |
| | | | 63,120 | | | | 56,134 | | | | 47,074 | |
| |
Net capitalised costs | | | 48,906 | | | | 46,463 | | | | 44,010 | |
| |
| Oil sands: net capitalised costs | | | 3,087 | | | | 2,811 | | | | 2,246 | |
| |
| a | | Includes capitalised asset retirement costs. |
The Group share of associated companies’ net capitalised costs was $3,958 million at December 31, 2004 (2003: $3,772 million; 2002: $3,173 million).
(b) Costs incurred
Costs incurred by Group companies during the year in oil and gas property acquisition, exploration and development activities, whether capitalised or charged to income currently, are shown in the table below. Development costs exclude costs of acquiring support equipment and facilities, but include depreciation thereon.
| | | | | | | | | | | | | | | | | | | | | | | | | | | | | |
| | | $ million | |
| | | Eastern Hemisphere | | | Western Hemisphere | |
| | | | | | | | | | | Asia | | | Middle East, | | | | | | | | | | |
| 2004 | | Europe | | | Africa | | | Pacific | | | Russia, CIS | a | | USA | | | Other | | | Total | |
| Acquisition of properties | | | | | | | | | | | | | | | | | | | | | | | | | | | | |
| Proved | | | — | | | | — | | | | — | | | | 192 | | | | 17 | | | | (1 | ) | | | 208 | |
| Unproved | | | (3 | ) | | | 46 | | | | (3 | ) | | | 7 | | | | 19 | | | | 44 | | | | 110 | |
| Exploration | | | 152 | | | | 196 | | | | 141 | | | | 127 | | | | 418 | | | | 214 | | | | 1,248 | |
Developmentb | | | | | | | | | | | | | | | | | | | | | | | | | | | | |
| Excluding oil sands | | | 2,404 | | | | 1,831 | | | | 363 | | | | 2,645 | | | | 867 | | | | 362 | | | | 8,472 | |
| Oil sands | | | | | | | | | | | | | | | | | | | | | | | 132 | | | | 132 | |
| |
| | | | | | | | | | | | | | | | | | | | | | | | | | | | | |
| | | $ million | |
| | | Eastern Hemisphere | | | Western Hemisphere | |
| | | | | | | | | | | Asia | | | Middle East, | | | | | | | | | | |
| 2003 | | Europe | | | Africa | | | Pacific | | | Russia, CIS | a | | USA | | | Other | | | Total | |
| Acquisition of properties | | | | | | | | | | | | | | | | | | | | | | | | | | | | |
| Proved | | | 6 | | | | 8 | | | | 177 | | | | 194 | | | | — | | | | — | | | | 385 | |
| Unproved | | | — | | | | 209 | | | | 3 | | | | 273 | | | | 17 | | | | 8 | | | | 510 | |
| Exploration | | | 187 | | | | 163 | | | | 139 | | | | 273 | | | | 342 | | | | 155 | | | | 1,259 | |
Developmentb | | | | | | | | | | | | | | | | | | | | | | | | | | | | |
| Excluding oil sands | | | 2,776 | | | | 1,660 | | | | 311 | | | | 1,251 | | | | 1,599 | | | | 588 | | | | 8,185 | |
| Oil sands | | | | | | | | | | | | | | | | | | | | | | | 88 | | | | 88 | |
| |
| | | | | | | | | | | | | | | | | | | | | | | | | | | | | |
| | | $ million | |
| | | Eastern Hemisphere | | | Western Hemisphere | |
| | | | | | | | | | | Asia | | | Middle East, | | | | | | | | | | |
| 2002 | | Europe | | | Africa | | | Pacific | | | Russia, CIS | a | | USA | | | Other | | | Total | |
| Acquisition of properties | | | | | | | | | | | | | | | | | | | | | | | | | | | | |
| Proved | | | 3,776 | | | | — | | | | — | | | | 122 | | | | 565 | | | | 801 | | | | 5,264 | |
| Unproved | | | 1,693 | | | | 53 | | | | — | | | | 3 | | | | 368 | | | | 412 | | | | 2,529 | |
| Exploration | | | 217 | | | | 279 | | | | 115 | | | | 170 | | | | 328 | | | | 182 | | | | 1,291 | |
| Development | | | | | | | | | | | | | | | | | | | | | | | | | | | | |
| Excluding oil sands | | | 1,605 | | | | 1,370 | | | | 442 | | | | 685 | | | | 1,465 | | | | 407 | | | | 5,974 | |
| Oil sands | | | | | | | | | | | | | | | | | | | | | | | 931 | | | | 931 | |
| |
| a | | These amounts do not include Sakhalin II project costs in 2004 of $869 million (2003: $384 million) reported in the Gas & Power segment. |
| |
| b | | Includes capitalised asset retirement costs. |
The Group share of associated companies’ cost incurred was $415 million in 2004 (2003: $417 million; 2002: $551 million).
76 Royal Dutch/Shell Group of Companies
26 Oil and natural gas exploration and production activities continued
(c) Earnings
Earnings of Group companies from exploration and production activities are given in the table below. For the purpose of this note, certain purchases of traded product are netted into sales.
| | | | | | | | | | | | | | | | | | | | | | | | | | | | | |
| | | $ million | |
| | | Eastern Hemisphere | | | Western Hemisphere | |
| | | | | | | | | | | Asia | | | Middle East, | | | | | | | | | | |
| 2004 | | Europe | | | Africa | | | Pacific | | | Russia, CIS | | | USA | | | Other | | | Total | |
| Sales: | | | | | | | | | | | | | | | | | | | | | | | | | | | | |
| Third parties | | | 5,856 | | | | 137 | | | | 1,045 | | | | 1,806 | | | | 2,092 | | | | 1,277 | | | | 12,213 | |
| Intra-group | | | 7,223 | | | | 5,616 | | | | 1,517 | | | | 4,616 | | | | 4,755 | | | | 1,187 | | | | 24,914 | |
| | | | | | | | | | | | | | | | | | | | | | |
| Net proceeds | | | 13,079 | | | | 5,753 | | | | 2,562 | | | | 6,422 | | | | 6,847 | | | | 2,464 | | | | 37,127 | |
Production costsa | | | 1,895 | | | | 1,548 | | | | 537 | | | | 1,687 | | | | 779 | | | | 518 | | | | 6,964 | |
| Exploration expense | | | 201 | | | | 157 | | | | 139 | | | | 101 | | | | 364 | | | | 209 | | | | 1,171 | |
| Depreciation, depletion and amortisation | | | 3,764 | | | | 700 | | | | 566 | | | | 799 | | | | 1,622 | | | | 811 | | | | 8,262 | |
| Other income/(costs) | | | (1,308 | ) | | | (353 | ) | | | 280 | | | | (517 | ) | | | (340 | ) | | | (334 | ) | | | (2,572 | ) |
| | | | | | | | | | | | | | | | | | | | | | |
| Earnings before taxation | | | 5,911 | | | | 2,995 | | | | 1,600 | | | | 3,318 | | | | 3,742 | | | | 592 | | | | 18,158 | |
| Taxation | | | 3,559 | | | | 2,448 | | | | 350 | | | | 2,795 | | | | 1,298 | | | | 186 | | | | 10,636 | |
| | | | | | | | | | | | | | | | | | | | | | |
| Earnings from continuing operations | | | 2,352 | | | | 547 | | | | 1,250 | | | | 523 | | | | 2,444 | | | | 406 | | | | 7,522 | |
| Earnings from discontinued operations, net of tax | | | — | | | | 144 | | | | 109 | | | | 105 | | | | — | | | | — | | | | 358 | |
| | | | | | | | | | | | | | | | | | | | | | |
| Earnings from operations | | | 2,352 | | | | 691 | | | | 1,359 | | | | 628 | | | | 2,444 | | | | 406 | | | | 7,880 | |
| | | | | | | | | | | | | | | | | | | | | | |
| Earnings from oil sands | | | | | | | | | | | | | | | | | | | | | | | 290 | | | | 290 | |
| |
| | | | | | | | | | | | | | | | | | | | | | | | | | | | | |
| | | $ million | |
| | | Eastern Hemisphere | | | Western Hemisphere | |
| | | | | | | | | | | Asia | | | Middle East, | | | | | | | | | | |
| 2003 (as restated)b | | Europe | | | Africa | | | Pacific | | | Russia, CIS | | | USA | | | Other | | | Total | |
| Sales: | | | | | | | | | | | | | | | | | | | | | | | | | | | | |
| Third parties | | | 5,386 | | | | 129 | | | | 808 | | | | 1,640 | | | | 1,903 | | | | 1,115 | | | | 10,981 | |
| Intra-group | | | 5,873 | | | | 3,888 | | | | 1,179 | | | | 3,713 | | | | 4,480 | | | | 713 | | | | 19,846 | |
| | | | | | | | | | | | | | | | | | | | | | |
| Net proceeds | | | 11,259 | | | | 4,017 | | | | 1,987 | | | | 5,353 | | | | 6,383 | | | | 1,828 | | | | 30,827 | |
Production costsa | | | 1,886 | | | | 1,087 | | | | 419 | | | | 1,408 | | | | 603 | | | | 366 | | | | 5,769 | |
| Exploration expense | | | 229 | | | | 235 | | | | 112 | | | | 121 | | | | 275 | | | | 144 | | | | 1,116 | |
| Depreciation, depletion and amortisation | | | 3,723 | | | | 462 | | | | 539 | | | | 585 | | | | 1,667 | | | | 681 | | | | 7,657 | |
| Other income/(costs) | | | (512 | ) | | | (187 | ) | | | 238 | | | | (443 | ) | | | 30 | | | | (240 | ) | | | (1,114 | ) |
| | | | | | | | | | | | | | | | | | | | | | |
| Earnings before taxation | | | 4,909 | | | | 2,046 | | | | 1,155 | | | | 2,796 | | | | 3,868 | | | | 397 | | | | 15,171 | |
| Taxation | | | 1,686 | | | | 1,437 | | | | 217 | | | | 2,239 | | | | 1,497 | | | | 204 | | | | 7,280 | |
| | | | | | | | | | | | | | | | | | | | | | |
| Earnings from continuing operations | | | 3,223 | | | | 609 | | | | 938 | | | | 557 | | | | 2,371 | | | | 193 | | | | 7,891 | |
| Earnings from discontinued operations, net of tax | | | — | | | | (16 | ) | | | 68 | | | | 26 | | | | — | | | | — | | | | 78 | |
| | | | | | | | | | | | | | | | | | | | | | |
| Earnings from operations | | | 3,223 | | | | 593 | | | | 1,006 | | | | 583 | | | | 2,371 | | | | 193 | | | | 7,969 | |
| | | | | | | | | | | | | | | | | | | | | | |
| Earnings from oil sands | | | | | | | | | | | | | | | | | | | | | | | (101 | ) | | | (101 | ) |
| |
| | | | | | | | | | | | | | | | | | | | | | | | | | | | | |
| | | $ million | |
| | | Eastern Hemisphere | | | Western Hemisphere | |
| | | | | | | | | | | Asia | | | Middle East, | | | | | | | | | | |
| 2002 (as restated)b | | Europe | | | Africa | | | Pacific | | | Russia, CIS | | | USA | | | Other | | | Total | |
| Sales: | | | | | | | | | | | | | | | | | | | | | | | | | | | | |
| Third parties | | | 5,472 | | | | 73 | | | | 763 | | | | 1,772 | | | | 1,997 | | | | 892 | | | | 10,969 | |
| Intra-group | | | 4,572 | | | | 2,538 | | | | 1,186 | | | | 3,087 | | | | 2,863 | | | | 433 | | | | 14,679 | |
| | | | | | | | | | | | | | | | | | | | | | |
| Net proceeds | | | 10,044 | | | | 2,611 | | | | 1,949 | | | | 4,859 | | | | 4,860 | | | | 1,325 | | | | 25,648 | |
Production costsa | | | 1,826 | | | | 754 | | | | 420 | | | | 1,275 | | | | 589 | | | | 298 | | | | 5,162 | |
| Exploration expense | | | 177 | | | | 204 | | | | 58 | | | | 81 | | | | 249 | | | | 208 | | | | 977 | |
| Depreciation, depletion and amortisation | | | 2,469 | | | | 458 | | | | 572 | | | | 777 | | | | 1,461 | | | | 265 | | | | 6,002 | |
| Other income/(costs) | | | (428 | ) | | | (97 | ) | | | 160 | | | | (654 | ) | | | (221 | ) | | | (219 | ) | | | (1,459 | ) |
| | | | | | | | | | | | | | | | | | | | | | |
| Earnings before taxation | | | 5,144 | | | | 1,098 | | | | 1,059 | | | | 2,072 | | | | 2,340 | | | | 335 | | | | 12,048 | |
| Taxation | | | 2,340 | | | | 789 | | | | 294 | | | | 1,638 | | | | 791 | | | | 93 | | | | 5,945 | |
| | | | | | | | | | | | | | | | | | | | | | |
| Earnings from continuing operations | | | 2,804 | | | | 309 | | | | 765 | | | | 434 | | | | 1,549 | | | | 242 | | | | 6,103 | |
| Earnings from discontinued operations, net of tax | | | — | | | | (15 | ) | | | 70 | | | | 30 | | | | — | | | | — | | | | 85 | |
| | | | | | | | | | | | | | | | | | | | | | |
| Earnings from operations | | | 2,804 | | | | 294 | | | | 835 | | | | 464 | | | | 1,549 | | | | 242 | | | | 6,188 | |
| | | | | | | | | | | | | | | | | | | | | | |
| Earnings from oil sands | | | | | | | | | | | | | | | | | | | | | | | (3 | ) | | | (3 | ) |
| |
| a | | Includes certain royalties paid in cash amounting to $2,019 million in 2004 (2003: $1,700 million; 2002: $1,449 million). |
| |
| b | | As a consequence of the separate reporting of income from discontinued operations (see Note 4), information for comparative periods has been reclassified where necessary. Certain other amounts have been reclassified for comparative purposes (also see Note 2). |
The Group share of associated companies’ earnings was $1,145 million in 2004 (2003: $800 million; 2002: $541 million) mainly in the USA $603 million (2003: $424 million; 2002: $330 million) and Asia Pacific $522 million (2003: $353 million; 2002: $170 million).
Notes to the US GAAP Financial Statements 77
27 Auditors’ remuneration
| | | | | | | | | | | | | |
| | | $ million | |
| | | | | | | | | | | 2002 | |
| Remuneration of KPMG and PricewaterhouseCoopers | | 2004 | | | 2003 | | | As restated | |
| Audit fees | | | 42 | | | | 32 | | | | 27 | |
Audit-related feesa | | | 13 | | | | 11 | | | | 17 | |
Tax feesb | | | 9 | | | | 7 | | | | 6 | |
| Fees for all other non-audit services | | | 6 | | | | 6 | | | | 12 | |
| | |
| a | | Fees for audit-related services such as employee benefit plan audits, due diligence assistance, assurance of non-financial data, operational audits, training services and special investigations. |
| |
| b | | Fees for tax compliance, tax advice and tax planning services. |
28 Contingencies and litigation
Contingent liabilities of Group companies arising from guarantees related to commitments of non-consolidated entities amounted to $2.9 billion at December 31, 2004 (2003: $3.4 billion). An analysis of the guarantees outstanding at December 31, 2004 is given in the following table:
| | | | | |
| | | $ billion | |
| In respect of debt | | | 1.7 | |
| In respect of customs duties | | | 0.5 | |
| Other | | | 0.7 | |
| | | | |
| | | | 2.9 | |
| |
The $1.7 billion of guarantees in respect of debt relate to project finance. Guarantees in respect of customs duties mainly relate to a cross guarantee, renewable annually, for amounts payable by industry participants in a western European country.
Shell Oil Company (including subsidiaries and affiliates, referred to collectively as SOC), along with numerous other defendants, has been sued by public and quasi-public water purveyors, as well as governmental entities, alleging responsibility for groundwater contamination caused by releases of gasoline containing oxygenate additives. Most of these suits assert various theories of liability, including product liability, and seek to recover actual damages, including clean-up costs. Some assert claims for punitive damages. As of December 31, 2004, there were approximately 66 pending suits by such plaintiffs that asserted claims against SOC and many other defendants (including major energy and refining companies). Although a majority of these cases do not specify the amount of monetary damages sought, some include specific damage claims collectively against all defendants. While the aggregate amounts claimed against all defendants for actual and punitive damages in such suits could be material to the financial statements if they were ultimately recovered against SOC alone rather than apportioned among the defendants, management of the Group considers the amounts claimed in these pleadings to be highly speculative and not an appropriate basis on which to determine a reasonable estimate of the amount of the loss that may be ultimately incurred, for the reasons described below.
The reasons for this determination can be summarised as follows:
| – | | while the majority of the cases have been consolidated for pre-trial proceedings in the U.S. District Court for the Southern District of New York, there are many cases pending in other jurisdictions throughout the USA. Most of the cases are at a preliminary stage. In many matters, little discovery has been taken and the courts have yet to rule upon motions on substantive legal issues. Consequently, management of the Group does not have sufficient information to assess the facts underlying the plaintiffs’ claims; the nature and extent of damages claimed, if any; the reasonableness of any specific claim for money damages; the allocation of potential responsibility among defendants; or the law that may be applicable. Additionally, given the pendency of cases in varying jurisdictions, there may be inconsistencies in the determinations made in these matters; |
| |
| – | | there are significant unresolved legal questions relating to claims asserted in this litigation. For example, it has not been established whether the use of oxygenates mandated by the 1990 amendments to the Clean Air Act can give rise to a products liability based claim. While some trial courts have held that it cannot, other courts have left the question open or declined to dismiss claims brought on a products liability theory. Other examples of unresolved legal questions relate to the applicability of federal pre-emption, whether a plaintiff may recover damages for alleged levels of contamination significantly below state environmental standards, and whether a plaintiff may recover for an alleged threat to groundwater before detection of contamination; |
| |
| – | | there are also significant unresolved legal questions relating to whether punitive damages are available for products liability claims or, if available, the manner in which they might be determined. For example, some courts have held that for certain types of product liability claims, punitive damages are not available. It is not known whether that rule of law would be applied in some or all of the pending oxygenate additive cases. Where specific claims for damages have been made, punitive damages represent in most cases a majority of the total amounts claimed; and |
| |
| – | | there are significant issues relating to the allocation of any liability among the defendants. Virtually all of the oxygenate additives cases involve multiple defendants including most of the major participants in the retail gasoline marketing business in the regions involved in the pending cases. The basis on which any potential liability may be apportioned among the defendants in any particular pending case cannot yet be determined. |
78 Royal Dutch/Shell Group of Companies
28 Contingencies and litigationcontinued
For these reasons, management of the Group is not currently able to estimate a range of reasonably possible losses or minimum loss for this litigation; however, management of the Group does not currently believe that the outcome of the oxygenate-related litigation pending as of December 31, 2004 will have a material impact on the Group’s financial condition, although such resolutions could have a significant effect on periodic results for the period in which they are recognised.
A $490 million judgment in favour of 466 plaintiffs in a consolidated matter that had once been nine individual cases was rendered in 2002 by a Nicaraguan court jointly against SOC and three other named defendants (not affiliated with SOC), based upon Nicaraguan Special Law 364 for claimed personal injuries resulting from alleged exposure to dibromochloropropane (DBCP) – a pesticide manufactured by SOC prior to 1978. This special law imposes strict liability (in a predetermined amount) on international manufacturers of DBCP. The statute also provides that unless a deposit (calculated as described below) of an amount denominated in Nicaraguan cordobas is made into the Nicaraguan courts, the claims would be submitted to the US courts.
In SOC’s case the deposit would have been between $19 million and $20 million (based on an exchange rate between 15 and 16 cordobas per US dollar). SOC chose not to make this deposit. The Nicaraguan courts did not, however, give effect to the provision of Special Law 364 that requires submission of the matter to the US courts. Instead, the Nicaraguan court entered judgment against SOC and the other defendants. Further, SOC was not afforded the opportunity to present any defences in the Nicaraguan court, including that it was not subject to Nicaraguan jurisdiction because it had neither shipped nor sold DBCP to parties in Nicaragua. At this time, SOC has not completed the steps necessary to perfect an appeal in Nicaragua and, as described below, the Nicaraguan claimants have sought to enforce the Nicaraguan judgment against SOC in the USA and in Venezuela. SOC does not have any assets in Nicaragua. In 2003, an attempt by the plaintiffs to enforce the Nicaraguan judgment described above in the United States against Shell Chemical Company and purported affiliates of the other named defendants was rejected by the U.S. District Court for the Central District of California, which decision is on appeal before the Ninth Circuit Court of Appeals. Enforcement of the Nicaraguan judgment was rejected because of improper service and attempted enforcement against non-existent entities or entities that were not named in the Nicaraguan judgment. Thereafter, SOC filed a declaratory judgment action seeking ultimate adjudication of the non-enforceability of this Nicaraguan judgment in the U.S. District Court for the Central District of California. This district court denied motions filed by the Nicaraguan claimants to dismiss SOC claims that Nicaragua does not have impartial tribunals, the proceedings violated due process, the relationship between SOC and Nicaragua made the exercise of personal jurisdiction unreasonable, and Special Law 364 is repugnant to U.S. public policy because it violates due process. A finding in favour of SOC on any of these grounds will result in a refusal to recognise and enforce the judgment in the United States. Several requests for Exequatur were filed in 2004 with the Tribunal Suprema de Justicia (the Venezuelan Supreme Court) to enforce Nicaraguan judgments. The petitions imply that judgments can be satisfied with assets of Shell Venezuela, S.A., which was neither a party to the Nicaraguan judgment nor a subsidiary of SOC, against whom the Exequatur was filed. The petitions are pending before the Tribunal Suprema de Justicia but have not been accepted. As of December 31, 2004, five additional Nicaraguan judgments had been entered in the collective amount of approximately $226.5 million in favour of 240 plaintiffs jointly against Shell Chemical Company and three other named defendants (not affiliated with Shell Chemical Company) under facts and circumstances almost identical to those relating to the judgment described above. Additional judgments are anticipated (including a suit seeking more than $3 billion). It is the opinion of management of the Group that the above judgments are unenforceable in a US court, as a matter of law, for the reasons set out in SOC’s declaratory judgment action described above. No financial provisions have been established for these judgments or related claims.
Since 1984, SOC has been named with others as a defendant in numerous product liability cases, including class actions, involving the failure of residential plumbing systems and municipal water distribution systems constructed with polybutylene plastic pipe. SOC fabricated the resin for this pipe while the co-defendants fabricated the raw materials for the pipe fittings. As a result of two class action settlements in 1995, SOC and the co-defendants agreed on a mechanism to fund until 2009 the settlement of most of the residential plumbing claims in the United States. Financial provisions have been taken by SOC for its settlement funding needs anticipated at this time. Additionally, claims that are not part of these class action settlements or that challenge these settlements continue to be filed primarily involving alleged problems with polybutylene pipe used in municipal water distribution systems. It is the opinion of management of the Group that exposure from this other polybutylene litigation pending as of December 31, 2004, is not material. Management of the Group cannot currently predict when or how all polybutylene matters will be finally resolved.
In connection with the recategorisation of certain hydrocarbon reserves that occurred in 2004, a number of putative shareholder class actions were filed against Royal Dutch, Shell Transport, Managing Directors of Royal Dutch during the class period, Managing Directors of Shell Transport during the class period and the external auditors for Royal Dutch, Shell Transport and the Group. These actions were consolidated in the United States District Court in New Jersey and a consolidated complaint was
Notes to the US GAAP Financial Statements 79
filed in September 2004. The parties are awaiting a decision with respect to defendants’ motions to dismiss asserting lack of jurisdiction with respect to the claims of non-United States shareholders who purchased on non-United States securities exchanges and failure to state a claim. Merits discovery has not begun. The case is at an early stage and subject to substantial uncertainties concerning the outcome of the material factual and legal issues relating to the litigation, including the pending motions to dismiss on lack of jurisdiction and failure to state a claim. In addition, potential damages, if any, in a fully litigated securities class action would depend on the losses caused by the alleged wrongful conduct that would be demonstrated by individual class members in their purchases and sales of Royal Dutch and Shell Transport shares during the relevant class period. Accordingly, based on the current status of the litigation, management of the Group is unable to estimate a range of possible losses or any minimum loss. Management of the Group will review this determination as the litigation progresses.
Also in connection with the hydrocarbon reserves recategorisation, putative shareholder class actions were filed on behalf of participants in various Shell Oil Company qualified plans alleging that Royal Dutch, Shell Transport and various current and former officers and directors breached various fiduciary duties to employee participants imposed by the Employee Retirement Income Security Act of 1974 (ERISA). These suits were consolidated in the United States District Court in New Jersey and a consolidated class action complaint was filed in July 2004. Defendants’ motions to dismiss have been fully briefed. Some document discovery has taken place. The case is at an early stage and subject to substantial uncertainties concerning the outcome of the material factual and legal issues relating to the litigation, including the pending motion to dismiss and the legal uncertainties with respect to the methodology for calculating damage, if any, should defendants become subject to an adverse judgment. The Group is in settlement discussions with counsel for plaintiffs, which it hopes will lead to a successful resolution of the case without the need for further litigation. No financial provisions have been taken with respect to the ERISA litigation.
The reserves recategorisation also led to the filing of shareholder derivative actions in June 2004. The four suits pending in New York state court, New York federal court and New Jersey federal court demand Group management and structural changes and seek unspecified damages from current and former members of the Boards of Directors of Royal Dutch and Shell Transport. The suits are in preliminary stages and no responses are yet due from defendants. Because any money “damages” in the derivative actions would be paid to Royal Dutch and Shell Transport, management of the Group does not believe that the resolution of these suits will have a material adverse effect on the Group’s financial condition or operating results.
The United States Securities and Exchange Commission (SEC) and UK Financial Services Authority (FSA) issued formal orders of private investigation in relation to the reserves recategorisation which Royal Dutch and Shell Transport resolved by reaching agreements with the SEC and the FSA. In connection with the agreement with the SEC, Royal Dutch and Shell Transport consented, without admitting or denying the SEC’s findings or conclusions, to an administrative order finding that Royal Dutch and Shell Transport violated, and requiring Royal Dutch and Shell Transport to cease and desist from future violations of, the antifraud, reporting, record-keeping and internal control provisions of the US Federal securities laws and related SEC rules, agreed to pay a $120 million civil penalty and undertook to spend an additional $5 million developing a comprehensive internal compliance programme. In connection with the agreement with the FSA, Royal Dutch and Shell Transport agreed, without admitting or denying the FSA’s findings or conclusions, to the entry of a Final Notice by the FSA finding that Royal Dutch and Shell Transport breached market abuse provisions of the UK’s Financial Services and Markets Act 2000 and the Listing Rules made under it and agreed to pay a penalty of £17 million. The penalties from the SEC and FSA and the additional amount to develop a comprehensive internal compliance programme have been paid by Group companies and fully included in the Income Statement of the Group. The United States Department of Justice has commenced a criminal investigation, and Euronext Amsterdam, the Dutch Authority Financial Markets and the California Department of Corporations are investigating the issues related to the reserves recategorisation. Management of the Group cannot currently predict the manner and timing of the resolution of these pending matters and is currently unable to estimate the range of reasonably possible losses from such matters.
Group companies are subject to a number of other loss contingencies arising out of litigation and claims brought by governmental and private parties, which are handled in the ordinary course of business.
The operations and earnings of Group companies continue, from time to time, to be affected to varying degrees by political, legislative, fiscal and regulatory developments, including those relating to the protection of the environment and indigenous people, in the countries in which they operate. The industries in which Group companies are engaged are also subject to physical risks of various types. The nature and frequency of these developments and events, not all of which are covered by insurance, as well as their effect on future operations and earnings, are unpredictable.
80 Royal Dutch/Shell Group of Companies
29 Financial instruments
Group companies, in the normal course of business, use various types of financial instruments which expose the Group to market or credit risk. Group companies have procedures and policies in place to limit the amount of credit exposure to any counterparty or market. These procedures and the broad geographical spread of Group companies’ activities limit the Group’s exposure to concentrations of credit or market risk.
Some Group companies enter into derivatives such as interest rate swaps/forward rate agreements to manage interest rate exposure. The financing of most Operating Companies is structured on a floating-rate basis and, except in special cases, further interest rate risk management is discouraged. Foreign exchange derivatives, such as forward exchange contracts and currency swaps/options, are used by some Group companies to manage foreign exchange risk. Commodity swaps, options and futures are used to manage price and timing risks mainly involving crude oil, natural gas and oil products.
The contract/notional amount, together with the estimated fair value (carrying amount) of derivatives held by Group companies at December 31 is as follows:
| | | | | | | | | | | | | | | | | |
| | | | | | | | | | | | | | | $ million | |
| | | 2004 | | | 2003 | |
| | | Contract/ | | | Estimated | | | Contract/ | | | Estimated | |
| | | notional | | | fair | | | notional | | | fair | |
| | | amount | | | value | | | amount | | | value | |
| |
| Interest rate swaps/forward rate agreements | | | 4,307 | | | | 70 | | | | 4,322 | | | | 121 | |
| Forward exchange contracts and currency swaps/options | | | 18,830 | | | | 53 | | | | 18,874 | | | | 165 | |
| Commodity swaps, options and futures | | | 101,021 | | | | 81 | | | | 65,800 | | | | 61 | |
| |
| | | | 124,158 | | | | 204 | | | | 88,996 | | | | 347 | |
| |
Additional data related to derivatives and risk disclosures, required by the United States Securities and Exchange Commission, is given in the 2004 Annual Report on Form 20-F of Royal Dutch and Shell Transport (see back cover for details of where to obtain copies of publications).
Other financial instruments in the Statement of Assets and Liabilities include fixed assets: investments — securities, trade receivables, short-term securities, cash and cash equivalents, short and long-term debt, and assets and liabilities in respect of risk management activities. The estimated fair values of these instruments approximate their carrying amounts.
Notes to the US GAAP Financial Statements 81
30 Division of Group net assets between the Parent Companies and movements therein
The division of Group net assets and movements therein, including Group net income in accordance with Note 1, is as follows:
| | | | | | | | | | | | | |
| | | | | | | | | | | $ million | |
| | | | | | | Royal | | | Shell | |
| | | | | | | Dutch | | | Transport | |
| | | Total | | | (60%) | | | (40%) | |
| | | As restated | | | As restated | | | As restated | |
| |
| At January 1, 2002 | | | 56,142 | | | | 33,685 | | | | 22,457 | |
| Movements during the year 2002: | | | | | | | | | | | | |
| Group net income | | | 9,656 | | | | 5,794 | | | | 3,862 | |
less:distributions to Parent Companies | | | (5,435 | ) | | | (3,261 | ) | | | (2,174 | ) |
| |
| Undistributed net income | | | 4,221 | | | | 2,533 | | | | 1,688 | |
| Movement in Parent Companies’ shares held by Group companies, net of dividends received | | | (844 | ) | | | (507 | ) | | | (337 | ) |
| Other comprehensive income (see Note 6) | | | 757 | | | | 455 | | | | 302 | |
| |
| At December 31, 2002 | | | 60,276 | | | | 36,166 | | | | 24,110 | |
| |
| Movements during the year 2003: | | | | | | | | | | | | |
| Group net income | | | 12,313 | | | | 7,387 | | | | 4,926 | |
less:distributions to Parent Companies | | | (5,660 | ) | | | (3,396 | ) | | | (2,264 | ) |
| |
| Undistributed net income | | | 6,653 | | | | 3,991 | | | | 2,662 | |
| Loss on sale of Parent Companies’ shares | | | (1 | ) | | | (1 | ) | | | — | |
| Movement in Parent Companies’ shares held by Group companies, net of dividends received | | | (631 | ) | | | (378 | ) | | | (253 | ) |
| Other comprehensive income (see Note 6) | | | 6,200 | | | | 3,720 | | | | 2,480 | |
| |
| At December 31, 2003 | | | 72,497 | | | | 43,498 | | | | 28,999 | |
| |
| Movements during the year 2004: | | | | | | | | | | | | |
| Group net income | | | 18,183 | | | | 10,910 | | | | 7,273 | |
less:distributions to Parent Companies | | | (7,989 | ) | | | (4,793 | ) | | | (3,196 | ) |
| |
| Undistributed net income | | | 10,194 | | | | 6,117 | | | | 4,077 | |
| Movement in Parent Companies’ shares held by Group companies, net of dividends received | | | (759 | ) | | | (455 | ) | | | (304 | ) |
| Other comprehensive income (see Note 6) | | | 2,644 | | | | 1,586 | | | | 1,058 | |
| |
At December 31, 2004 | | | 84,576 | | | | 50,746 | | | | 33,830 | |
| |
The above table is based on the Group’s US GAAP results. See Note 33 for the impact of differences between US GAAP and
Netherlands GAAP on the Group’s net income and net assets. Note 38 shows the division of Group net assets and movements therein under Netherlands GAAP.
Reconciliation of Division of Group net assets between the Parent Companies and movements therein to previously issued Financial Statements
| | | | | | | | | | | | | | | | | | | | | | | | | | | | | | | | | | | | | |
| | | | | | | | | | | | | | | | | | | | | | | | | | | | | | | | | | | $ million | |
| | | Total | | | Royal Dutch (60%) | | | Shell Transport (40%) | |
| | | As | | | Second | | | | | | | As | | | Second | | | | | | | As | | | Second | | | | |
| | | previously | | | Reserves | | | As | | | previously | | | Reserves | | | As | | | previously | | | Reserves | | | As | |
| | | restateda | | | Restatement | | | restated | | | restateda | | | Restatement | | | restated | | | restateda | | | Restatement | | | restated | |
| |
| At January 1, 2002 | | | 56,244 | | | | (102 | ) | | | 56,142 | | | | 33,746 | | | | (61 | ) | | | 33,685 | | | | 22,498 | | | | (41 | ) | | | 22,457 | |
| Movements during the year 2002: | | | | | | | | | | | | | | | | | | | | | | | | | | | | | | | | | | | | |
| Group net income | | | 9,722 | | | | (66 | ) | | | 9,656 | | | | 5,833 | | | | (39 | ) | | | 5,794 | | | | 3,889 | | | | (27 | ) | | | 3,862 | |
less: distributions to Parent Companies | | | (5,435 | ) | | | — | | | | (5,435 | ) | | | (3,261 | ) | | | — | | | | (3,261 | ) | | | (2,174 | ) | | | — | | | | (2,174 | ) |
| |
| Undistributed net income | | | 4,287 | | | | (66 | ) | | | 4,221 | | | | 2,572 | | | | (39 | ) | | | 2,533 | | | | 1,715 | | | | (27 | ) | | | 1,688 | |
| Movement in Parent Companies’ shares held by Group companies, net of dividends received | | | (844 | ) | | | — | | | | (844 | ) | | | (507 | ) | | | — | | | | (507 | ) | | | (337 | ) | | | — | | | | (337 | ) |
| Other comprehensive income (see Note 6) | | | 757 | | | | — | | | | 757 | | | | 455 | | | | — | | | | 455 | | | | 302 | | | | — | | | | 302 | |
| |
| At December 31, 2002 | | | 60,444 | | | | (168 | ) | | | 60,276 | | | | 36,266 | | | | (100 | ) | | | 36,166 | | | | 24,178 | | | | (68 | ) | | | 24,110 | |
| |
| Movements during the year 2003: | | | | | | | | | | | | | | | | | | | | | | | | | | | | | | | | | | | | |
| Group net income | | | 12,496 | | | | (183 | ) | | | 12,313 | | | | 7,498 | | | | (111 | ) | | | 7,387 | | | | 4,998 | | | | (72 | ) | | | 4,926 | |
less:distributions to Parent Companies | | | (5,660 | ) | | | — | | | | (5,660 | ) | | | (3,396 | ) | | | — | | | | (3,396 | ) | | | (2,264 | ) | | | — | | | | (2,264 | ) |
| |
| Undistributed net income | | | 6,836 | | | | (183 | ) | | | 6,653 | | | | 4,102 | | | | (111 | ) | | | 3,991 | | | | 2,734 | | | | (72 | ) | | | 2,662 | |
| Loss on sale of Parent Companies’ shares | | | (1 | ) | | | — | | | | (1 | ) | | | (1 | ) | | | — | | | | (1 | ) | | | — | | | | — | | | | -- | |
| Movement in Parent Companies’ shares held by Group companies, net of dividends received | | | (631 | ) | | | — | | | | (631 | ) | | | (378 | ) | | | — | | | | (378 | ) | | | (253 | ) | | | — | | | | (253 | ) |
| Other comprehensive income (see Note 6) | | | 6,200 | | | | — | | | | 6,200 | | | | 3,720 | | | | — | | | | 3,720 | | | | 2,480 | | | | — | | | | 2,480 | |
| |
At December 31, 2003 | | | 72,848 | | | | (351 | ) | | | 72,497 | | | | 43,709 | | | | (211 | ) | | | 43,498 | | | | 29,139 | | | | (140 | ) | | | 28,999 | |
| |
| a | | 2003 data is as originally reported. |
82 Royal Dutch/Shell Group of Companies
Report of the Independent Auditors
To Royal Dutch Petroleum Company and
The “Shell” Transport and Trading Company, p.l.c.
We have audited the Netherlands GAAP Financial Statements of the Royal Dutch/Shell Group of Companies for the year 2004, (which include the Notes on pages 52 to 81 and 83 to 91). The preparation of the Financial Statements is the responsibility of management. Our responsibility is to express an opinion on the Financial Statements based on our audit.
We conducted our audit in accordance with auditing standards generally accepted in the Netherlands. Those standards require that we plan and perform the audit to obtain reasonable assurance about whether the Financial Statements are free of material misstatement. An audit includes examining, on a test basis, evidence supporting the amounts and disclosures in the Financial Statements. An audit also includes assessing the accounting principles used and significant estimates made by management, as well as evaluating the overall presentation of the Financial Statements. We believe that our audit provides a reasonable basis for our opinion.
In our opinion, the Financial Statements give a true and fair view of the financial position of the Royal Dutch/Shell Group of Companies as of December 31, 2004 and of the result and the cash flows for the year then ended in accordance with the accounting principles generally accepted in the Netherlands.
Without qualifying our opinion we emphasise that the Royal Dutch/Shell Group of Companies has restated the comparative data for the years 2003 and 2002 as explained in Note 32 on page 87.
| | | |
KPMG Accountants N.V.
The Hague
April 27, 2005 | | PricewaterhouseCoopers LLP
London |
Netherlands GAAP Financial Statements 83
Netherlands GAAP
Financial Statements
Statement of Income
| | | | | | | | | | | | | | | | | |
| | | | | | | | | | | | | | | $ million | |
| | | | | | | | | | | 2003 | | | 2002 | |
| | | Note | | | 2004 | | | As restateda | | | As restateda | |
| |
| Sales proceeds | | | | | | | 337,522 | | | | 263,889 | | | | 218,287 | |
| Sales taxes, excise duties and similar levies | | | | | | | 72,332 | | | | 65,527 | | | | 54,834 | |
| |
Net proceeds | | | | | | | 265,190 | | | | 198,362 | | | | 163,453 | |
| Cost of sales | | | | | | | 222,334 | | | | 165,314 | | | | 135,778 | |
| |
Gross profit | | | | | | | 42,856 | | | | 33,048 | | | | 27,675 | |
| Selling and distribution expenses | | | | | | | 12,340 | | | | 11,409 | | | | 9,617 | |
| Administrative expenses | | | | | | | 2,516 | | | | 1,870 | | | | 1,587 | |
| Exploration | | | | | | | 1,823 | | | | 1,475 | | | | 1,052 | |
| Research and development | | | | | | | 553 | | | | 584 | | | | 472 | |
| |
| Operating profit of Group companies | | | | | | | 25,624 | | | | 17,710 | | | | 14,947 | |
| Share of operating profit of associated companies | | | 34 | | | | 6,050 | | | | 3,446 | | | | 2,792 | |
| |
Operating profit | | | | | | | 31,674 | | | | 21,156 | | | | 17,739 | |
| Interest and other income | | | 8 | | | | 1,705 | | | | 1,967 | | | | 748 | |
| Interest expense | | | 9 | | | | 1,214 | | | | 1,324 | | | | 1,291 | |
| Currency exchange gains/(losses) | | | | | | | (39 | ) | | | (231 | ) | | | (25 | ) |
| |
Income before taxation | | | | | | | 32,126 | | | | 21,568 | | | | 17,171 | |
| Taxation | | | 35 | | | | 15,030 | | | | 9,349 | | | | 7,647 | |
| |
| Income after taxation | | | | | | | 17,096 | | | | 12,219 | | | | 9,524 | |
| Income applicable to minority interests | | | | | | | 626 | | | | 353 | | | | 175 | |
| |
Income from continuing operations | | | | | | | 16,470 | | | | 11,866 | | | | 9,349 | |
| Income from discontinued operations, net of tax | | | 4 | | | | 1,560 | | | | 25 | | | | 187 | |
| |
Net income | | | 33 | | | | 18,030 | | | | 11,891 | | | | 9,536 | |
| |
Statement of Comprehensive Income and Parent Companies’ interest in Group net assets
| | | | | | | | | | | | | | | | | |
| | | | | | | | | | | | | | | $ million | |
| | | | | | | | | | | 2003 | | | 2002 | |
| | | Note | | | 2004 | | | As restated | | | As restated | |
| |
Net income | | | | | | | 18,030 | | | | 11,891 | | | | 9,536 | |
| Other comprehensive income, net of tax: | | | 6 | | | | | | | | | | | | | |
| currency translation differences | | | 20 | | | | 3,148 | | | | 5,102 | | | | 2,432 | |
| unrealised gains/(losses) on securities | | | | | | | (350 | ) | | | 689 | | | | 25 | |
| unrealised gains/(losses) on cash flow hedges | | | | | | | 31 | | | | 51 | | | | (225 | ) |
| minimum pension liability adjustments | | | | | | | (185 | ) | | | 358 | | | | (1,475 | ) |
| |
Comprehensive income | | | | | | | 20,674 | | | | 18,091 | | | | 10,293 | |
| Distributions to Parent Companies | | | | | | | (7,989 | ) | | | (5,660 | ) | | | (5,435 | ) |
| Increase in Parent Companies’ shares held, net of dividends received | | | 23 | | | | (759 | ) | | | (631 | ) | | | (844 | ) |
| Loss on sale of Parent Companies’ shares | | | | | | | — | | | | (1 | ) | | | — | |
| | | | | | | | | | | | | | | | | |
| Parent Companies’ interest in Group net assets: | | | | | | | | | | | | | | | | |
| At January 1 | | | | | | | 72,210 | | | | 60,156 | | | | 56,142 | |
| Cumulative effect of change in accounting policy | | | | | | | — | | | | 255 | | | | — | |
| At January 1 after cumulative effect of change | | | | | | | 72,210 | | | | 60,411 | | | | 56,142 | |
| |
Parent Companies’ interest in Group net assets at December 31 | | | 38 | | | | 84,136 | | | | 72,210 | | | | 60,156 | |
| |
| a | | See Note 2 to the Group Financial Statements. |
84 Royal Dutch/Shell Group of Companies
Statement of Assets and Liabilities
| | | | | | | | | | | | | |
| | | | | | | | | | | $ million | |
| | | | | | | | | | | Dec 31, | |
| | | | | | | Dec 31, | | | 2003 | |
| | | Note | | | 2004 | | | As restateda | |
| |
Fixed assets | | | | | | | | | | | | |
| Tangible assets | | | 36 | | | | 88,451 | | | | 87,088 | |
| Intangible assets | | | 36 | | | | 4,436 | | | | 4,448 | |
| Investments: | | | | | | | | | | | | |
| associated companies | | | 34 | | | | 20,140 | | | | 19,371 | |
| securities | | | 15 | | | | 1,627 | | | | 2,317 | |
| other | | | | | | | 1,121 | | | | 1,086 | |
| |
Total fixed assets | | | | | | | 115,775 | | | | 114,310 | |
| |
Other long-term assets | | | | | | | | | | | | |
| Prepaid pension costs | | | 21 | | | | 8,278 | | | | 6,516 | |
| Deferred taxation | | | 10 | | | | 1,995 | | | | 2,092 | |
| Other | | | 12 | | | | 4,369 | | | | 2,741 | |
| |
Total other long-term assets | | | | | | | 14,642 | | | | 11,349 | |
| |
Current assets | | | | | | | | | | | | |
| Inventories | | | 13 | | | | 15,391 | | | | 12,690 | |
| Accounts receivable | | | 14 | | | | 37,998 | | | | 28,969 | |
| Cash and cash equivalents | | | 15 | | | | 8,459 | | | | 1,952 | |
| |
Total current assets | | | | | | | 61,848 | | | | 43,611 | |
Current liabilities:amounts due within one year | | | | | | | | | | | | |
| Short-term debt | | | 16 | | | | 5,822 | | | | 11,027 | |
| Accounts payable and accrued liabilities | | | | | | | 40,207 | | | | 32,347 | |
| Taxes payable | | | 10 | | | | 9,885 | | | | 5,927 | |
| Dividends payable to Parent Companies | | | | | | | 4,750 | | | | 5,123 | |
| |
Total current liabilities | | | | | | | 60,664 | | | | 54,424 | |
| |
Net current assets/(liabilities) | | | | | | | 1,184 | | | | (10,813 | ) |
| |
Total assets less current liabilities | | | | | | | 131,601 | | | | 114,846 | |
| |
Long-term liabilities:amounts due after more than one year | | | | | | | | | | | | |
| Long-term debt | | | 37 | | | | 8,600 | | | | 9,100 | |
| Other | | | | | | | 8,065 | | | | 6,054 | |
| |
| | | | | | | | 16,665 | | | | 15,154 | |
| |
Provisions | | | | | | | | | | | | |
| Deferred taxation | | | 35 | | | | 14,738 | | | | 15,185 | |
| Pensions and similar obligations | | | 21 | | | | 5,044 | | | | 4,927 | |
| Decommissioning and restoration costs | | | 24 | | | | 5,709 | | | | 3,955 | |
| |
| | | | | | | | 25,491 | | | | 24,067 | |
| |
Group net assets before minority interests | | | | | | | 89,445 | | | | 75,625 | |
| Minority interests | | | | | | | 5,309 | | | | 3,415 | |
| |
Net assets | | | | | | | 84,136 | | | | 72,210 | |
| |
| a | | See Note 2 to the Group Financial Statements. |
Netherlands GAAP Financial Statements 85
Statement of Cash Flows
| | | | | | | | | | | | | | | | | |
| | | | | | | | | | | | | | | $ million | |
| | | Note | | | 2004 | | | 2003 | | | 2002 | |
| |
Cash flow provided by operating activities | | | | | | | 18,030 | | | | 11,891 | | | | 9,536 | |
| Net income | | | | | | | | | | | | | | | | |
| Adjustments to reconcile net income to cash flow provided by operating activities | | | | | | | | | | | | | | | | |
| Depreciation, depletion and amortisation | | | 36 | | | | 12,929 | | | | 11,878 | | | | 8,859 | |
| Profit on sale of assets | | | | | | | (3,033 | ) | | | (2,141 | ) | | | (367 | ) |
| Movements in: | | | | | | | | | | | | | | | | |
| inventories | | | | | | | (2,731 | ) | | | (236 | ) | | | (2,079 | ) |
| accounts receivable | | | | | | | (8,462 | ) | | | 1,834 | | | | (5,830 | ) |
| accounts payable and accrued liabilities | | | | | | | 7,708 | | | | (212 | ) | | | 6,989 | |
| taxes payable | | | | | | | 2,999 | | | | (218 | ) | | | (735 | ) |
| Associated companies: dividends more/(less) than net income | | | 34 | | | | (139 | ) | | | 511 | | | | 117 | |
| Deferred taxation and other provisions | | | | | | | (630 | ) | | | (366 | ) | | | 423 | |
| Long-term liabilities and other | | | | | | | (1,798 | ) | | | (1,588 | ) | | | (805 | ) |
| Income applicable to minority interests | | | | | | | 714 | | | | 366 | | | | 175 | |
| |
Cash flow provided by operating activities | | | | | | | 25,587 | | | | 21,719 | | | | 16,283 | |
| |
Cash flow used in investing activities | | | | | | | | | | | | | | | | |
| Capital expenditure (including capitalised leases) | | | 36 | | | | (12,734 | ) | | | (12,252 | ) | | | (12,102 | ) |
| Acquisitions (Enterprise Oil, Pennzoil-Quaker State and additional shares in Equilon) | | | | | | | | | | | | | | | (8,925 | ) |
| Proceeds from sale of assets | | | | | | | 5,078 | | | | 2,286 | | | | 1,099 | |
| New investments in associated companies | | | 7 | | | | (1,057 | ) | | | (983 | ) | | | (1,289 | ) |
| Disposals of investments in associated companies | | | | | | | 1,327 | | | | 708 | | | | 501 | |
| Proceeds from sale and other movements in investments | | | | | | | 1,743 | | | | 1,989 | | | | 83 | |
| |
Cash flow used in investing activities | | | | | | | (5,643 | ) | | | (8,252 | ) | | | (20,633 | ) |
| |
Cash flow used in financing activities | | | | | | | | | | | | | | | | |
| Long-term debt (including short-term part): | | | | | | | | | | | | | | | | |
| new borrowings | | | | | | | 544 | | | | 572 | | | | 5,267 | |
| repayments | | | | | | | (1,688 | ) | | | (2,740 | ) | | | (5,610 | ) |
| |
| | | | | | | | (1,144 | ) | | | (2,168 | ) | | | (343 | ) |
| Net increase/(decrease) in short-term debt | | | | | | | (3,701 | ) | | | (2,507 | ) | | | 7,058 | |
| Change in minority interests | | | | | | | 807 | | | | (1,363 | ) | | | 421 | |
| Dividends paid to: | | | | | | | | | | | | | | | | |
| Parent Companies | | | | | | | (8,490 | ) | | | (6,248 | ) | | | (6,961 | ) |
| minority interests | | | | | | | (264 | ) | | | (300 | ) | | | (228 | ) |
| |
Cash flow used in financing activities | | | | | | | (12,792 | ) | | | (12,586 | ) | | | (53 | ) |
| |
Parent Companies’ shares: net sales/(purchases) and dividends received | | | | | | | (758 | ) | | | (633 | ) | | | (864 | ) |
| Currency translation differences relating to cash and cash equivalents | | | | | | | 113 | | | | 148 | | | | 153 | |
| |
Increase/(decrease) in cash and cash equivalents | | | | | | | 6,507 | | | | 396 | | | | (5,114 | ) |
| |
| Cash and cash equivalents at January 1 | | | | | | | 1,952 | | | | 1,556 | | | | 6,670 | |
| |
| Cash and cash equivalents at December 31 | | | | | | | 8,459 | | | | 1,952 | | | | 1,556 | |
| |
86 Royal Dutch/Shell Group of Companies
Notes to the Netherlands GAAP
Financial Statements
31 Basis of Presentation of Group Financial Statements under Netherlands GAAP
These Financial Statements have been prepared in conformity with generally accepted accounting principles in the Netherlands (Netherlands GAAP). These accounting principles are consistent with the accounting principles applied in the preparation of the Group’s Financial Statements prepared in conformity with generally accepted accounting principles in the United States (US GAAP), as set out in the Group accounting policies on pages 55 to 59, except as set forth below. The Notes to the Financial Statements prepared in conformity with US GAAP appearing on pages 52 to 81 are an integral part of these Financial Statements prepared under Netherlands GAAP.
The differences between Netherlands GAAP, as applied to the preparation of these Financial Statements (and after giving effect to the restatement described in Note 32) and US GAAP, as applied to the Group’s Financial Statements prepared in conformity with US GAAP, are as follows:
| (i) | | goodwill: Under US GAAP, goodwill is not amortised but is tested for impairment annually or when certain events occur that indicate potential impairment. Under Netherlands GAAP, goodwill is amortised on a straight-line basis over its estimated useful economic life, which is assumed not to exceed 20 years unless there are grounds to rebut this assumption; |
| |
| (ii) | | recoverability of assets |
| | (a) | | impairments: Under US GAAP, only if an asset’s estimated undiscounted future cash flows are below its carrying amount is a determination required of the amount of any impairment based on discounted cash flows. There is no undiscounted test under Netherlands GAAP; |
| |
| | (b) | | reversals of impairments: Under US GAAP impairments are not reversed. Under Netherlands GAAP, a favourable change in the circumstances which resulted in an impairment would trigger the requirement for a redetermination of the amount of the impairment and any reversal is recognised in income; |
| (iii) | | asset retirement obligations: Under US GAAP, a change in accounting for asset retirement obligations in 2003, as described in Note 3, has been accounted for prospectively, with the cumulative effect of the change at the beginning of 2003 of $255 million being reflected in 2003 net income. This change in accounting was also made under Netherlands GAAP. However, the cumulative effect of the change under Netherlands GAAP has been reported as an adjustment to the opening balance of net assets and, due to the absence of comparative data, net income for prior years has not been restated. |
Reconciliations of Group net assets and net income presented in the Group Financial Statements prepared in conformity with US GAAP (on pages 49 to 81), to Group net assets and net income in these Group Financial Statements which have been prepared in conformity with Netherlands GAAP, are presented in Note 33. Additionally, the division of Group net assets and movements therein, including movements resulting from Group net income and distributions to Parent Companies, determined in conformity with Netherlands GAAP, are presented in Note 38.
Notes to the Netherlands GAAP Financial Statements 87
32 Restatement of previously issued financial statements
Errors in the depreciation, depletion and amortisation charge presented in previous Financial Statements, arising as a result of overstatement of proved reserves as corrected by the Second Reserves Restatement, have been adjusted in the Netherlands GAAP financial statements through a restatement of the comparative results for the years ended December 31, 2003 and 2002.
Quantitative information concerning the effect of these adjustments is set forth in the tables below and additional information on the Reserves Restatement is contained in Note 2 on pages 52 to 55.
Statement of Income
| | | | | | | | | | | | | | | | | | | | | | | | | | | | | | | | | | | | | | | | | |
| | | $ million | |
| | | 2003 | | | 2002 | |
| | | | | | | | | | | | | | | Reclassification | | | | | | | | | | | | | | | | | | | Reclassification | | | | |
| | | As | | | Second | | | | | | | for | | | | | | | As | | | Second | | | | | | | for | | | | |
| | | originally | | | Reserves | | | | | | | discontinued | | | As | | | previously | | | Reserves | | | | | | | discontinued | | | As | |
| | | reporteda | | | Restatement | | | As restated | | | operationsb | | | restated | | | restateda | | | Restatement | | | As restated | | | operationsb | | | restated | |
| |
| Net proceeds | | | 201,728 | | | | — | | | | 201,728 | | | | (3,366 | ) | | | 198,362 | | | | 166,601 | | | | — | | | | 166,601 | | | | (3,148 | ) | | | 163,453 | |
| Cost of sales | | | 167,667 | | | | 289 | | | | 167,956 | | | | (2,642 | ) | | | 165,314 | | | | 138,117 | | | | 118 | | | | 138,235 | | | | (2,457 | ) | | | 135,778 | |
| Exploration | | | 1,476 | | | | — | | | | 1,476 | | | | (1 | ) | | | 1,475 | | | | 1,073 | | | | — | | | | 1,073 | | | | (21 | ) | | | 1,052 | |
| Other operating expenses | | | 14,428 | | | | — | | | | 14,428 | | | | (565 | ) | | | 13,863 | | | | 12,027 | | | | — | | | | 12,027 | | | | (351 | ) | | | 11,676 | |
| Share of operating profit of associated companies | | | 3,484 | | | | (19 | ) | | | 3,465 | | | | (19 | ) | | | 3,446 | | | | 2,822 | | | | (6 | ) | | | 2,816 | | | | (24 | ) | | | 2,792 | |
| |
Operating profit | | | 21,641 | | | | (308 | ) | | | 21,333 | | | | (177 | ) | | | 21,156 | | | | 18,206 | | | | (124 | ) | | | 18,082 | | | | (343 | ) | | | 17,739 | |
| Net interest (income)/expense and currency exchange (gains)/losses | | | (370 | ) | | | — | | | | (370 | ) | | | (42 | ) | | | (412 | ) | | | 629 | | | | — | | | | 629 | | | | (61 | ) | | | 568 | |
| |
Income before taxation | | | 22,011 | | | | (308 | ) | | | 21,703 | | | | (135 | ) | | | 21,568 | | | | 17,577 | | | | (124 | ) | | | 17,453 | | | | (282 | ) | | | 17,171 | |
| Taxation | | | 9,572 | | | | (126 | ) | | | 9,446 | | | | (97 | ) | | | 9,349 | | | | 7,796 | | | | (54 | ) | | | 7,742 | | | | (95 | ) | | | 7,647 | |
| Minority interests | | | 365 | | | | 1 | | | | 366 | | | | (13 | ) | | | 353 | | | | 179 | | | | (4 | ) | | | 175 | | | | — | | | | 175 | |
| |
Income from continuing operations | | | 12,074 | | | | (183 | ) | | | 11,891 | | | | (25 | ) | | | 11,866 | | | | 9,602 | | | | (66 | ) | | | 9,536 | | | | (187 | ) | | | 9,349 | |
| Income from discontinued operations, net of tax | | | — | | | | — | | | | — | | | | 25 | | | | 25 | | | | — | | | | — | | | | — | | | | 187 | | | | 187 | |
| |
Net income | | | 12,074 | | | | (183 | ) | | | 11,891 | | | | — | | | | 11,891 | | | | 9,602 | | | | (66 | ) | | | 9,536 | | | | — | | | | 9,536 | |
| |
| a | | As reported in the 2003 Annual Report and Accounts and the 2003 Annual Report on Form 20-F, as filed with the SEC on June 30, 2004. |
| |
| b | | As a consequence of the separate reporting of income from discontinued operations (see Note 4), information for comparative periods has been reclassified where necessary. |
Statement of Assets and Liabilities
| | | | | | | | | | | | | | | | | | | | | |
| | | $ million | |
| | | December 31, 2003 | |
| | | As | | | Second | | | | | | | Reclassification | | | | |
| | | originally | | | Reserves | | | | | | | for deferred | | | As | |
| | | reporteda | | | Restatement | | | As restated | | | taxb | | | restated | |
| |
| Fixed assets | | | | | | | | | | | | | | | | | | | | |
| Tangible | | | 87,701 | | | | (613 | ) | | | 87,088 | | | | — | | | | 87,088 | |
| Intangible | | | 4,448 | | | | — | | | | 4,448 | | | | — | | | | 4,448 | |
| Investments | | | 22,787 | | | | (13 | ) | | | 22,774 | | | | — | | | | 22,774 | |
| Other long-term assets | | | 9,257 | | | | — | | | | 9,257 | | | | 2,092 | | | | 11,349 | |
| Current assets | | | 43,611 | | | | — | | | | 43,611 | | | | — | | | | 43,611 | |
| Current liabilities | | | 54,424 | | | | — | | | | 54,424 | | | | — | | | | 54,424 | |
| Long-term liabilities | | | 15,154 | | | | — | | | | 15,154 | | | | — | | | | 15,154 | |
| Provisions | | | | | | | | | | | | | | | | | | | | |
| Deferred taxation | | | 13,355 | | | | (262 | ) | | | 13,093 | | | | 2,092 | | | | 15,185 | |
| Pensions and decommissioning | | | 8,882 | | | | — | | | | 8,882 | | | | — | | | | 8,882 | |
| Minority interests | | | 3,428 | | | | (13 | ) | | | 3,415 | | | | — | | | | 3,415 | |
| |
Net assets | | | 72,561 | | | | (351 | ) | | | 72,210 | | | | — | | | | 72,210 | |
| |
| a | | As reported in the 2003 Annual Report and Accounts and the 2003 Annual Report on Form 20-F, as filed with the SEC on June 30, 2004. |
| |
| b | | Deferred tax assets and liabilities are presented at December 31, 2004 separately in the Statement of Assets and Liabilities, with reclassification of the prior year. |
Parent Companies’ interest in Group net assets
| | | | | | | | | |
| | | $ million | |
| | | 2003 | | | 2002 | |
| |
At December 31 as originally reported (2003)/previously restated (2002)a | | | 72,561 | | | | 60,324 | |
| Effect of the Second Reserves Restatement: | | | | | | | | |
| Interest at the beginning of the year | | | (168 | ) | | | (102 | )a |
| Net income for the year | | | (183 | ) | | | (66 | ) |
| |
At December 31 as restated | | | 72,210 | | | | 60,156 | |
| |
| a | | As reported in the 2003 Annual Report and Accounts and the 2003 Annual Report on Form 20-F, as filed with the SEC on June 30, 2004. |
| |
| b | | Cumulative effect as at January 1, 2002. |
Amounts relating to prior periods have been restated in the following notes where applicable.
88 Royal Dutch/Shell Group of Companies
33 Reconciliation between US GAAP and Netherlands GAAP
Please refer to the Notes to the Financial Statements prepared in accordance with US GAAP on pages 52 to 81. The following table provides a reconciliation between US GAAP and Netherlands GAAP for Group net income and net assets.
| | | | | | | | | | | | | | | | | | | | | |
| | | $ million | |
| | | Net income | | | Net assets | |
| | | | | | | | | | | | | | | | | | | Dec 31, | |
| | | | | | | 2003 | | | 2002 | | | Dec 31, | | | 2003 | |
| | | 2004 | | | As restated | | | As restated | | | 2004 | | | As restated | |
| |
| In accordance with US GAAP | | | 18,183 | | | | 12,313 | | | | 9,656 | | | | 84,576 | | | | 72,497 | |
Adjustment for Netherlands GAAP: | | | | | | | | | | | | | | | | | | | | |
| Goodwill amortisation | | | (167 | ) | | | (167 | ) | | | (120 | ) | | | (454 | ) | | | (287 | ) |
| Cumulative effect of change in accounting for asset retirement obligations | | | — | | | | (255 | ) | | | — | | | | — | | | | — | |
| Recoverability of assets: | | | | | | | | | | | | | | | | | | | | |
| Impairments | | | (455 | ) | | | — | | | | — | | | | (455 | ) | | | — | |
| Reversals of impairments | | | 469 | | | | — | | | | — | | | | 469 | | | | — | |
| |
| In accordance with Netherlands GAAP | | | 18,030 | | | | 11,891 | | | | 9,536 | | | | 84,136 | | | | 72,210 | |
| |
The above table should be used to understand the differences in the movements in the Group’s net assets found in Notes 30 and 38 as the tables are prepared based on US GAAP and Netherlands GAAP respectively.
Net income by segment in accordance with Netherlands GAAP is as follows:
| | | | | | | | | | | | | |
| | | $ million | |
| | | Net income | |
| | | | | | | 2003 | | | 2002 | |
| | | 2004 | | | As restated | | | As restated | |
| |
| Exploration & Production | | | 9,784 | | | | 8,668 | | | | 6,726 | |
| Gas & Power | | | 1,739 | | | | 2,279 | | | | 764 | |
| Oil Products | | | 7,380 | | | | 2,703 | | | | 2,517 | |
| Chemicals | | | 881 | | | | (209 | ) | | | 565 | |
| Corporate and Other | | | (1,040 | ) | | | (1,184 | ) | | | (861 | ) |
| Minority interests | | | (714 | ) | | | (366 | ) | | | (175 | ) |
| |
| | | | 18,030 | | | | 11,891 | | | | 9,536 | |
| |
Where applicable, differences between Netherlands GAAP and US GAAP affecting these Notes are disclosed below.
34 Associated companies
There is an increase in the Group share of operating profit of associated companies for 2004 and in the Group’s investment in associated companies at December 31, 2004 of $397 million, compared with Note 7 prepared under US GAAP, relating to the reversal of an impairment in the Exploration & Production segment as a result of an increase in the longer-term expectation for oil prices.
35 Taxation
There is a decrease in the taxation charge for 2004 and in the provision for deferred taxation at December 31, 2004 of $106 million, compared with Note 10 prepared under US GAAP, relating to impairments partly offset by impairment reversals.
Notes to the Netherlands GAAP Financial Statements 89
36 Tangible and intangible fixed assets
| | | | | | | | | | | | | | | | | | | | | | | | | |
| | | | | | | | | | | | | | | | | | | | | | | | $ million | |
| | | 2004 | | | 2003 | |
| | | | | | | | | | | | | | | | | | | | | | | Total | |
| | | | | | | | | | | Other | | | Total | | | Total | | | Group | |
| | | Tangible | | | Goodwill | | | intangibles | | | intangibles | | | Group | | | As restated | |
| |
Cost | | | | | | | | | | | | | | | | | | | | | | | | |
| At January 1 | | | 181,685 | | | | 4,011 | | | | 2,998 | | | | 7,009 | | | | 188,694 | | | | 167,027 | |
| Capital expenditure | | | 12,440 | | | | 3 | | | | 291 | | | | 294 | | | | 12,734 | | | | 12,252 | |
| Sales, retirements and other movements | | | (9,345 | ) | | | (44 | ) | | | 102 | | | | 58 | | | | (9,287 | ) | | | (4,840 | ) |
| Currency translation differences | | | 8,382 | | | | 62 | | | | 81 | | | | 143 | | | | 8,525 | | | | 14,255 | |
| |
| At December 31 | | | 193,162 | | | | 4,032 | | | | 3,472 | | | | 7,504 | | | | 200,666 | | | | 188,694 | |
| |
Depreciation | | | | | | | | | | | | | | | | | | | | | | | | |
| At January 1 | | | 94,597 | | | | 1,623 | | | | 938 | | | | 2,561 | | | | 97,158 | | | | 81,018 | |
| Depreciation, depletion and amortisation charge | | | 12,434 | | | | 167 | | | | 328 | | | | 495 | | | | 12,929 | | | | 11,878 | |
| Sales, retirements and other movements | | | (7,310 | ) | | | (37 | ) | | | (38 | ) | | | (75 | ) | | | (7,385 | ) | | | (3,711 | ) |
| Currency translation differences | | | 4,990 | | | | 42 | | | | 45 | | | | 87 | | | | 5,077 | | | | 7,973 | |
| |
| At December 31 | | | 104,711 | | | | 1,795 | | | | 1,273 | | | | 3,068 | | | | 107,779 | | | | 97,158 | |
| |
Net 2004 | | | 88,451 | | | | 2,237 | | | | 2,199 | | | | 4,436 | | | | 92,887 | | | | | |
| |
| Net 2003 (as restated) | | | 87,088 | | | | 2,388 | | | | 2,060 | | | | 4,448 | | | | | | | | 91,536 | |
| |
There is an increase in depreciation, depletion and amortisation for tangible fixed assets recorded in cost of sales in 2004 of $489 million, with a corresponding reduction in the net book amount at December 31, 2004, compared with Note 11 prepared under US GAAP. This relates to additional impairments mainly in Gas & Power ($625 million), as a result of economic conditions in the power generation market (where an impairment was required under Netherlands GAAP but not under US GAAP because estimated undiscounted cash flows exceeded carrying amount), partly offset by an impairment reversal in Exploration & Production of $211 million, as a result of an increase in the longer-term expectation for oil prices.
There is an increase in depreciation, depletion and amortisation for intangible fixed assets recorded in cost of sales in 2004 of $167 million (2003: $167 million), with a cumulative impact of $454 million at December 31, 2004 (2003: $287 million), compared with Note 11 prepared under US GAAP. This relates to the amortisation of goodwill under Netherlands GAAP. Goodwill arising on the acquisition of Pennzoil-Quaker State in 2002 is amortised over 40 years. Continued brand maintenance in addition to the established long-term leadership of these brands in automotive lubricants and vehicle care markets support this amortisation period.
37 Debt
There is no difference in total long-term debt compared with Note 16, prepared under US GAAP, however, certain long-term commitments are reported as capitalised leases under Netherlands GAAP rather than as amounts due to banks and other credit institutions as under US GAAP.
(a) Long-term debt
| | | | | | | | | |
| | | $ million | |
| | | 2004 | | | 2003 | |
| |
| Debentures and other loans | | | 4,204 | | | | 4,868 | |
| Amounts due to banks and other credit institutions | | | 980 | | | | 1,061 | |
| |
| | | | 5,184 | | | | 5,929 | |
| Capitalised lease obligations | | | 3,416 | | | | 3,171 | |
| |
Long-term debt | | | 8,600 | | | | 9,100 | |
addlong-term debt due within one year | | | 1,291 | | | | 1,874 | |
| |
| Long-term debt including long-term debt due within one year | | | 9,891 | | | | 10,974 | |
| |
(b) Capitalised lease obligations
The future minimum lease payments under capital leases and the present value of net minimum capital lease payments at December 31, 2004 are as follows:
| | | | | |
| | | $ million | |
| | | Capital | |
| | | leases | |
| |
| 2005 | | | 450 | |
| 2006 | | | 423 | |
| 2007 | | | 423 | |
| 2008 | | | 420 | |
| 2009 | | | 418 | |
| 2010 and after | | | 5,677 | |
| |
| Total minimum payments | | | 7,811 | |
| |
lessexecutory costs and interest | | | 4,280 | |
| |
| Present value of net minimum capital lease payments | | | 3,531 | |
| |
90 Royal Dutch/Shell Group of Companies
38 Division of Group net assets between the Parent Companies and movements therein
Arrangements between Royal Dutch and Shell Transport provide,inter alia, that notwithstanding variations in shareholdings, Royal Dutch and Shell Transport shall share in the aggregate net assets and in the aggregate dividends and interest received from Group companies in the proportion of 60:40. It is further arranged that the burden of all taxes in the nature of, or corresponding to, an income tax leviable in respect of such dividends and interest shall fall in the same proportion.
Division of Group net assets and movements therein, including Group net income
| | | | | | | | | | | | | |
| | | $ million | |
| | | | | | | Royal | | | Shell | |
| | | | | | | Dutch | | | Transport | |
| | | Total | | | (60%) | | | (40%) | |
| | | As restated | | | As restated | | | As restated | |
| |
| At January 1, 2002 | | | 56,142 | | | | 33,685 | | | | 22,457 | |
| Movements during the year 2002: | | | | | | | | | | | | |
| Group net income | | | 9,536 | | | | 5,722 | | | | 3,814 | |
less:distributions to Parent Companies | | | (5,435 | ) | | | (3,261 | ) | | | (2,174 | ) |
| |
| Undistributed net income | | | 4,101 | | | | 2,461 | | | | 1,640 | |
| Movement in Parent Companies’ shares held by Group companies, net of dividends received | | | (844 | ) | | | (507 | ) | | | (337 | ) |
| Other comprehensive income (see Note 6) | | | 757 | | | | 455 | | | | 302 | |
| |
| At December 31, 2002 | | | 60,156 | | | | 36,094 | | | | 24,062 | |
| Cumulative effect of a change in accounting policy | | | 255 | | | | 153 | | | | 102 | |
| | | | | | | | | | |
| At January 1, 2003 | | | 60,411 | | | | 36,247 | | | | 24,164 | |
| Movements during the year 2003: | | | | | | | | | | | | |
| Group net income | | | 11,891 | | | | 7,134 | | | | 4,757 | |
less:distributions to Parent Companies | | | (5,660 | ) | | | (3,396 | ) | | | (2,264 | ) |
| |
| Undistributed net income | | | 6,231 | | | | 3,738 | | | | 2,493 | |
| Loss on sale of Parent Companies’ shares | | | (1 | ) | | | (1 | ) | | | — | |
| Movement in Parent Companies’ shares held by Group companies, net of dividends received | | | (631 | ) | | | (378 | ) | | | (253 | ) |
| Other comprehensive income (see Note 6) | | | 6,200 | | | | 3,720 | | | | 2,480 | |
| |
| At December 31, 2003 | | | 72,210 | | | | 43,326 | | | | 28,884 | |
| Movements during the year 2004: | | | | | | | | | | | | |
| Group net income | | | 18,030 | | | | 10,818 | | | | 7,212 | |
less:distributions to Parent Companies | | | (7,989 | ) | | | (4,793 | ) | | | (3,196 | ) |
| |
| Undistributed net income | | | 10,041 | | | | 6,025 | | | | 4,016 | |
| Movement in Parent Companies’ shares held by Group companies, net of dividends received | | | (759 | ) | | | (455 | ) | | | (304 | ) |
| Other comprehensive income (see Note 6) | | | 2,644 | | | | 1,586 | | | | 1,058 | |
| |
At December 31, 2004 | | | 84,136 | | | | 50,482 | | | | 33,654 | |
| |
The above table is based on the Group’s Netherlands GAAP results. See Note 33 for the impact of differences between US GAAP and Netherlands GAAP on the Group’s net income and net assets. Note 30 shows the division of Group net assets and movements therein under US GAAP.
Parent Companies’ interest in Group net assets
| | | | | | | | | | | | | |
| | | $ million | |
| | | | | | | 2003 | | | 2002 | |
| | | 2004 | | | As restated | | | As restated | |
| |
| Invested by Parent Companies | | | 741 | | | | 741 | | | | 741 | |
| Retained earnings of Group companies | | | 84,660 | | | | 74,619 | | | | 68,134 | |
| Parent Companies’ shares held, net of dividends received (see Note 23) | | | (4,187 | ) | | | (3,428 | ) | | | (2,797 | ) |
| Cumulative currency translation differences | | | 4,356 | | | | 1,208 | | | | (3,894 | ) |
| Unrealised gains/(losses) on: | | | | | | | | | | | | |
| securities (see Note 15) | | | 350 | | | | 700 | | | | 11 | |
| cash flow hedges | | | (157 | ) | | | (188 | ) | | | (239 | ) |
| Minimum pension liability adjustments | | | (1,627 | ) | | | (1,442 | ) | | | (1,800 | ) |
| |
| Balance at December 31 | | | 84,136 | | | | 72,210 | | | | 60,156 | |
| |
The reduction in retained earnings of Group companies at December 31, 2004 of $440 million (2003: $287 million) compared with Note 5 prepared in accordance with US GAAP, relates to impairments, reversals of impairments and the amortisation of goodwill under Netherlands GAAP (see Note 33).
Notes to the Netherlands GAAP Financial Statements 91
Reconciliation of Division of Group net assets and movements therein, including Group net income, to previously issued Financial Statements
| | | | | | | | | | | | | | | | | | | | | | | | | | | | | | | | | | | | | |
| | | $ million | |
| | | Total | | | Royal Dutch (60%) | | | Shell Transport (40%) | |
| | | | | | | Second | | | | | | | | | | | Second | | | | | | | | | | | Second | | | | |
| | | As previously | | | Reserves | | | As | | | As previously | | | Reserves | | | As | | | As previously | | | Reserves | | | As | |
| | | restateda | | | Restatement | | | restated | | | restateda | | | Restatement | | | restated | | | restateda | | | Restatement | | | restated | |
| |
| At January 1, 2002 | | | 56,244 | | | | (102 | ) | | | 56,142 | | | | 33,746 | | | | (61 | ) | | | 33,685 | | | | 22,498 | | | | (41 | ) | | | 22,457 | |
| Movements during the year 2002: | | | | | | | | | | | | | | | | | | | | | | | | | | | | | | | | | | | | |
| Group net income | | | 9,602 | | | | (66 | ) | | | 9,536 | | | | 5,761 | | | | (39 | ) | | | 5,722 | | | | 3,841 | | | | (27 | ) | | | 3,814 | |
less:distributions to Parent Companies | | | (5,435 | ) | | | — | | | | (5,435 | ) | | | (3,261 | ) | | | — | | | | (3,261 | ) | | | (2,174 | ) | | | — | | | | (2,174 | ) |
| |
| Undistributed net income | | | 4,167 | | | | (66 | ) | | | 4,101 | | | | 2,500 | | | | (39 | ) | | | 2,461 | | | | 1,667 | | | | (27 | ) | | | 1,640 | |
| Movement in Parent Companies’ shares held by Group companies, net of dividends received | | | (844 | ) | | | — | | | | (844 | ) | | | (507 | ) | | | — | | | | (507 | ) | | | (337 | ) | | | — | | | | (337 | ) |
| Other comprehensive income (see Note 6) | | | 757 | | | | — | | | | 757 | | | | 455 | | | | — | | | | 455 | | | | 302 | | | | — | | | | 302 | |
| |
| At December 31, 2002 | | | 60,324 | | | | (168 | ) | | | 60,156 | | | | 36,194 | | | | (100 | ) | | | 36,094 | | | | 24,130 | | | | (68 | ) | | | 24,062 | |
| |
| Cumulative effect of a change in accounting policy | | | 255 | | | | — | | | | 255 | | | | 153 | | | | — | | | | 153 | | | | 102 | | | | — | | | | 102 | |
| | | | 60,579 | | | | (168 | ) | | | 60,411 | | | | 36,347 | | | | (100 | ) | | | 36,247 | | | | 24,232 | | | | (68 | ) | | | 24,164 | |
| Movements during the year 2003: | | | | | | | | | | | | | | | | | | | | | | | | | | | | | | | | | | | | |
| Group net income | | | 12,074 | | | | (183 | ) | | | 11,891 | | | | 7,244 | | | | (110 | ) | | | 7,134 | | | | 4,830 | | | | (73 | ) | | | 4,757 | |
less:distributions to Parent Companies | | | (5,660 | ) | | | — | | | | (5,660 | ) | | | (3,396 | ) | | | — | | | | (3,396 | ) | | | (2,264 | ) | | | — | | | | (2,264 | ) |
| |
| Undistributed net income | | | 6,414 | | | | (183 | ) | | | 6,231 | | | | 3,848 | | | | (110 | ) | | | 3,738 | | | | 2,566 | | | | (73 | ) | | | 2,493 | |
| Loss on sale of Parent Companies’ shares | | | (1 | ) | | | — | | | | (1 | ) | | | (1 | ) | | | — | | | | (1 | ) | | | — | | | | — | | | | — | |
| Movement in Parent Companies’ shares held by Group companies, net of dividends received | | | (631 | ) | | | — | | | | (631 | ) | | | (378 | ) | | | — | | | | (378 | ) | | | (253 | ) | | | — | | | | (253 | ) |
| Other comprehensive income (see Note 6) | | | 6,200 | | | | — | | | | 6,200 | | | | 3,721 | | | | (1 | ) | | | 3,720 | | | | 2,479 | | | | 1 | | | | 2,480 | |
| |
At December 31, 2003 | | | 72,561 | | | | (351 | ) | | | 72,210 | | | | 43,537 | | | | (211 | ) | | | 43,326 | | | | 29,024 | | | | (140 | ) | | | 28,884 | |
| |
| a | | 2003 data is as originally reported. |
92 Royal Dutch/Shell Group of Companies
Supplementary information
– Oil and Gas (unaudited)
Reserves
Net quantities (which are unaudited) of proved oil and gas reserves are shown in the tables on pages 98 through 101. Proved reserves are the estimated quantities of crude oil, natural gas and natural gas liquids which geological and engineering data demonstrate with reasonable certainty to be recoverable in future years from known reservoirs under existing economic and operating conditions, ie, prices and costs as of the date the estimate is made. Proved developed oil and gas reserves are reserves that can be expected to be recovered through existing wells with existing equipment and operating methods. The unaudited reserve volumes reported exclude volumes attributable to oil and gas discoveries which are not at present considered proved. Such volumes will be included when technical, fiscal and other conditions allow them to be economically developed and produced.
Proved reserves are shown net of any quantities of crude oil or natural gas that are expected to be taken by others as royalties in kind but do not exclude quantities related to royalties expected to be paid in cash (except in North America and in other situations in which the royalty quantities are owned by others) or those related to fixed margin contracts. Proved reserves include certain quantities of crude oil or natural gas which will be produced under arrangements which involve Group companies in upstream risks and rewards but do not transfer title of the product to those companies.
Oil and gas reserves cannot be measured exactly since estimation of reserves involves subjective judgment. These estimates remain subject to revision and are unaudited supplementary information.
Recategorisation and restatement of unaudited proved reserves volumes
First Half Review
As announced on January 9, 2004, March 18, 2004, and April 19, 2004, the Group reviewed its proved reserves inventory (with the assistance of external consultants) during the period from late 2003 to April 2004 (collectively, the First Half Review). Following the First Half Review, 4,474 million barrels of oil equivalent (boe)1previously booked at December 31, 2002 as proved reserves were recategorised as not proved. The results of the First Half Review were reflected in the restatement of proved reserves and of the standardised measure of discounted future net cash flows contained in the 2003 Annual Report and Accounts and the 2003 Annual Report on Form 20-F, as originally filed on June 30, 2004 (the First Reserves Restatement).
Second Half Review
As announced on October 28, 2004, November 26, 2004 and February 3, 2005, the Group performed additional reviews of its proved reserves inventory (with the assistance of external consultants) during the period from July 2004 to December 2004 (collectively, the Second Half Review). As a result of the Second Half Review, 1,371 million boe previously booked at December 31, 2003 as proved reserves were recategorised as not proved. These changes are reflected in the restatement of proved reserves and the standardised measure of future cash flows contained in this Report (the Second Reserves Restatement). The Second Reserves Restatement was also reflected in Amendment No. 2 to the 2003 Annual Report on Form 20-F, as filed with US Securities and Exchange Commission (SEC) on March 7, 2005. (The First Reserves Restatement and the Second Reserves Restatement are collectively referred to as the Reserves Restatements.)
The Second Half Review reflected the implementation of certain remedial actions undertaken following the First Half Review and First Reserves Restatement, and in light of the report of Davis Polk & Wardwell to the Group Audit Committee. These actions were designed to strengthen the controls relating to the reporting of proved reserves and included the following:
| – | | the Group’s reserves reporting guidelines were revised to comply with the SEC requirements and published SEC staff guidance; |
| |
| – | | the Group implemented a programme to train approximately 3,000 staff members in the revised proved reserve guidelines. This training effort was substantially completed during the fourth quarter of 2004; |
| |
| – | | beginning in July 2004, asset teams in each operating unit, using the revised guidelines and in some cases assisted by external consultants, undertook a reservoir-by-reservoir review of the Group’s proved reserve base as part of its annual reserves determination process; |
| |
| – | | teams from Group internal audit, assisted by separate external consultants, conducted on-site reviews to evaluate compliance of reported volumes with SEC requirements, as well as the functioning of the reserves control framework and governance. For 2004, this audit process covered approximately 90% of the Group’s proved reserves originally reported in the 2003 Annual Report (14,350 million boe). The findings of Group internal audit are reported directly to management and the Group Audit Committee; and |
| |
| – | | all changes to proved reserves, were agreed by the Regional Reserves Committee and the Global Reserves Committee and reviewed by the Executive Committee, the Group Audit Committee and the boards of the Parent Companies. |
See “Controls and Procedures – Remedial Actions Taken in 2004” (pages 46 and 47) for an additional discussion of the remedial actions taken following the First Half Review and in light of the report to the Group Audit Committee of Davis Polk & Wardwell.
| 1 | | The Group converts natural gas to crude oil equivalent using a factor of 5,800 standard cubic feet per barrel. |
Supplementary information – Oil and Gas (unaudited) 93
Reserves Restatements
The effects of the First Reserves Restatement were set forth in the 2003 Annual Report and Accounts and the 2003 Annual Report on Form 20-F, as filed with the SEC on June 30, 2004. The effects of the Second Reserves Restatement are set forth in the reconciliation table on page 97 and in the tables on pages 98 to 103, which reflect a restatement of the Group’s unaudited proved reserve volumes for the two years ended December 31, 2002 and December 31, 2003, as well as a restatement of the standardised measure of discounted future cash flows.
Variations from SEC Requirements
The Group determined that during the periods prior to the Reserves Restatements, its reserves bookings were not fully consistent with the definition of proved reserves as set forth in Rule 4-10 of Regulation S-X under the U.S. Securities Exchange Act of 1934 (Rule 4-10), and the interpretations of that Rule by the staff of the Division of Corporation Finance of the SEC. In particular, the Group determined that its prior guidelines contained interpretations and allowed for reserve determinations that were not consistent with Rule 4-10 and SEC staff interpretations of Rule 4-10. The principal areas of variation that are reflected in the Second Reserves Restatement are discussed on page 94.
First Reserves Restatement
Investment commitment
Volumes of hydrocarbons were booked as proved reserves with respect to certain projects for which there was found subsequently not to be a sufficient level of investment commitment to conclude that there was “reasonable certainty” of recovery of those volumes in future years under existing economic and operating conditions (as defined in SEC staff interpretations of Rule 4-10). Under prior Group guidelines, proved reserves were booked in some cases upon progress with development planning. However, this did not in all cases meet the requirement under Rule 4-10 to demonstrate specific commitment to development actions. Examples include properties in Nigeria (various fields), Norway (Ormen Lange field) and New Zealand (Pohokura field). This factor was also a consideration in Australia (Gorgon field).
Market assurance
Volumes of hydrocarbons were booked as proved reserves with respect to certain projects for which there was insufficient evidence of future market demand at the date of booking to conclude that there was “reasonable certainty” that it would be economic to recover those volumes under conditions existing at the date of booking. The primary example of this category was Australia (Gorgon field and other North West Shelf properties), but it was also a factor in determining reserves restatements for other properties that rely on the long-term extension or renewal of existing sales contracts.
Governmental or regulatory approval
Volumes of hydrocarbons were booked as proved reserves with respect to certain projects for which governmental or regulatory approvals were not sufficiently assured for there to be “reasonable certainty” of the recovery of those volumes in future years. The main examples of such properties are in Kazakhstan (Kashagan field), Ireland (Corrib field), Italy (Tempa Rossa field) and the Netherlands (Waddenzee fields).
Field performance and project delivery
Volumes of hydrocarbons were booked and maintained as proved reserves with respect to certain development projects in producing fields notwithstanding a deferment in project execution or a decline in actual production volumes and forecasts when these indications should have suggested that there was no longer “reasonable certainty” that the originally estimated volumes would be recovered in the future. These issues arose mainly in fields in the Middle East and Nigeria.
Year-end pricing
Volume entitlements under Production Sharing Contracts, and other agreements for which reserves are estimated using the “economic entitlement” method, were determined using the prices that were used internally by the Group for screening investment decisions and for business planning, rather than the year-end price as required under Rule 4-10. When applying year-end prices to such reserves estimates, the resulting reserves figure is usually inversely related to product price, such that at times of high price there will be a lower reserves entitlement than at times of low price, all other factors being equal. Several properties in the Group’s portfolio are affected in this manner.
Technical definition
Volumes of hydrocarbons were booked as proved reserves with respect to some projects prior to the development of sufficient data to meet certain technical requirements established by the SEC staff in interpreting the definition of “reasonable certainty” in Rule 4-10.
The primary examples are:
| – | | Lowest Known Hydrocarbon:In some cases, volumes occurring below the “Lowest Known Hydrocarbon” (ie, the deepest point that has been logged as hydrocarbon-bearing) had been included in proved reserves estimates. Such volumes were considered defensible prior to 2003 generally on the grounds that evidence of the location of fluid contacts was available through measurements of the pressure gradients in the reservoirs concerned. This volume was estimated to be 172 million boe at the end of 2003 and was accounted for as a revision during the year 2003. It was not reflected in the Reserves Restatements for prior years. |
| |
| – | | Proved Area – Lateral Extent:In some cases, volumes occurring in parts of the reservoir that are more than one offset development well location from existing well penetrations had been booked as proved reserves in the absence of sufficient proof of continuous and economically productive reservoir in the areas concerned. This volume was estimated to be 180 million boe at the end of 2003 and substantially all was accounted for through restatement of proved reserves for prior years. The 2003 reserves additions as announced on February 3, 2004 were also reduced by approximately 180 million boe as a result of these issues. |
94 Royal Dutch/Shell Group of Companies
Supplementary information
– Oil and Gas (unaudited)
continued
| – | | Improved Recovery – Availability of Suitable Analogues: In some cases, volumes related to the successful implementation of improved recovery processes had been booked as proved reserves in the absence of either qualifying analogues or sufficient performance proof. SEC guidance requires “reasonable certainty” that the processes would be effective in the specific reservoirs concerned. This volume was estimated to be 160 million boe at the end of 2003 and substantially all was accounted for through restatement of proved reserves for prior years. |
| |
| – | | Recovery Factor Forecasting Methodology:In some cases, volumes booked on the basis of sophisticated computer modelling were not sufficiently supported by actual reservoir performance, as seen principally in decline curve analysis, to satisfy the requirement of “reasonable certainty” in the estimation of proved reserves. This volume was estimated to be 160 million boe at the end of 2003 and substantially all was accounted for through the revisions occurring during the year 2003. |
| |
| – | | Economic Producibility:In some cases, proved reserves may have been assigned to reservoirs in the absence of information from a combination of electrical and other type logs and core analyses sufficient to indicate the reservoirs were analogous to similar reservoirs in the same field which were producing or had demonstrated the ability to produce on a formation test. However, there were no material instances of reserves being de-booked solely for this reason. |
Royalty
For the years ended 1999 to 2002, proved reserves and production had been recorded with respect to royalties paid in cash on properties in Canada. These were removed from proved reserves, resulting in a reduction in unaudited proved reserves of 103 million boe at December 31, 2003 and 89 million boe at December 31, 2002, and a reduction in production of 9 million boe for 2003 and 14 million boe for 2002.
Second Reserves Restatement
Lowest Known Hydrocarbon
In some cases, volumes occurring below the “Lowest Known Hydrocarbon” (ie, the deepest point that has been logged as hydrocarbon bearing) had been included in proved reserves estimates. Such volumes were considered defensible prior to 2003 on the grounds that evidence of the location of fluid contacts was available through measurements of the pressure gradients in the reservoirs concerned. The volume identified in the Second Half Review was estimated to be 71 million boe at the end of 2003 (5% of the Second Reserves Restatement) and was accounted for as a revision during 2003. Africa accounted for 60% of this volume followed by Asia Pacific (25%) and Europe (15%).
Proved Area – Lateral Extent
In some cases, volumes occurring in parts of the reservoir that are more than one offset development well location from existing well penetrations had been booked as proved reserves in the absence of sufficient proof of continuous and economically productive reservoir in the areas concerned. The volume identified in the Second Half Review was estimated to be 420 million boe at the end of 2003 (31% of the Second Reserves Restatement) and was accounted for through restatement of proved reserves for prior years. Africa accounted for 48% of this volume followed by Asia Pacific (32%) and Middle East (13%).
Improved Recovery – Availability of Suitable Analogues
In some cases, volumes related to the successful implementation of improved recovery processes had been booked as proved reserves in the absence of either qualifying analogues or sufficient performance proof. SEC guidance requires “reasonable certainty” that the processes will be effective in the specific reservoirs concerned. The volume identified in the Second Half Review was estimated to be 127 million boe at the end of 2003 (9% of the Second Reserves Restatement) and was accounted for through restatement of proved reserves for prior years. Western Hemisphere (excluding USA) accounted for 48% of this volume followed by Africa (42%) and Europe (10%).
Recovery Factor Forecasting Methodology
In some cases, volumes booked on the basis of sophisticated computer modelling were not sufficiently supported by actual reservoir performance, as seen principally in decline curve analysis, to satisfy the requirement of “reasonable certainty” in the estimation of proved reserves. The volume identified in the Second Half Review was estimated to be 681 million boe at the end of 2003 (50% of the Second Reserves Restatement) and was accounted for through restatement of proved reserves for prior years. Europe accounted for 45% of this volume followed by Asia Pacific (27%) and Africa (26%).
Other Reasons
In some cases, volumes were removed from proved reserves for other reasons, principally lack of investment commitment. The volume identified in the Second Half Review was approximately 73 million boe at the end of 2003 (5% of the Second Reserves Restatement).
Effect of Reserves Restatements
The tables on pages 98 to 103 show restated amounts of unaudited proved reserve volumes and a restated calculation of the standardised measure of discounted future net cash flows for 2003 and 2002 giving effect to Reserves Restatements. The allocation to particular years of quantities to be removed from the proved reserves category for some of the mature producing areas involved the use of estimates as to timing, owing to the practical difficulties in associating particular volumes with particular projects at specific times in the past. Effect was given to the Reserves Restatements through the removal of proved reserves
Supplementary information – Oil and Gas (unaudited) 95
either in the year in which those reserves were originally booked or the year during which those reserves no longer constituted proved reserves under the SEC rules, as applicable.
The tables on pages 97 to 103 present a statement of proved reserves (or standardised measure) as reported in the 2003 Annual Report and Accounts and the 2003 Annual Report on Form 20-F, as filed with the SEC on June 30, 2004 (which gave effect to the First Reserves Restatement), the effects of the Second Reserves Restatement on the opening reserves or standardised measure balances for each year concerned, the effect of the Second Reserves Restatement on movements during each year and the restated closing balance.
The effect of the Reserves Restatements on unaudited proved reserve volumes and the standardised measure for each of the years covered by this report is summarised as follows:
Year ended December 31, 2003
At December 31, 2003 (and January 1, 2004), the aggregated effect on unaudited proved reserve volumes of the Second Reserves Restatement (the First Reserves Restatement did not affect 2003) was 1,371 million boe, comprising 791 million barrels of crude oil and natural gas liquids and 3,362 thousand million standard cubic feet of gas. This amounts to 10% of the total proved reserves originally stated in the 2003 Annual Report on Form 20-F, as filed with the SEC on June 30, 2004 (14,350 million boe). Of the total proved reserves restated, 93% (1,271 million boe) was attributable to Group companies and the remainder was attributable to associated companies. 43% of the total had been in the proved developed reserves category and 57% had been categorised as proved undeveloped reserves. Africa accounted for 38% of the restatement, Europe 28%, Asia Pacific 21%, Middle East 7%, USA 1% and Other Western Hemisphere 6%. Please refer to the narrative above for explanation of the principal reasons for the Second Reserves Restatement. After giving effect to the Reserves Restatement, the proportion of total unaudited proved reserve volumes that was accounted for as proved developed reserves at that date increased from 56%, as originally stated, to 57%.
The Second Reserves Restatement gave rise to an estimated reduction of $5,672 million in the standardised measure of discounted future net cash flow for Group companies and a further $327 million for associated companies. Together, these effects equate to approximately 10% of the total standardised measure that was originally stated at that date.
The effect of the combined Reserves Restatements on the standardised measure of discounted future net cash flows on 2002 and earlier years is disproportionately low (17% in 2002) compared with the effect on proved reserves (29% in 2002) primarily due to the fact that particularly for the First Reserves Restatement many of the volumes affected are located in relatively low margin operating areas and that the majority are undeveloped (the cost of development for these reserves tends to suppress the standardised measure of these volumes, as compared to the standardised measure for volumes that have already been developed).
The effect of the Second Reserves Restatement on the standardised measure of discounted future cash flows for year-end 2003 (10%) is the same as the effect on proved reserves (10%). The volumes affected are not located primarily in low margin areas and there is a higher percentage of proved developed volumes than in the First Reserves Restatement.
Year ended December 31, 2002
At December 31, 2002 (and January 1, 2003), the aggregated effect on unaudited proved reserve volumes of the First Reserves Restatement and the Second Reserves Restatement was 5,626 million boe, comprising 3,493 million barrels of crude oil and natural gas liquids and 12,373 thousand million standard cubic feet of gas. This amounts to 29% of the total unaudited proved reserve volumes originally stated at that date (19,346 million boe). Of this total, 4,474 million boe was reflected in the First Reserves Restatement, comprising 2,795 million barrels of crude oil and natural gas liquids and 9,736 thousand million standard cubic feet of gas. The balance of 1,153 million boe is reflected herein as part of the Second Reserves Restatement. Of the total unaudited proved reserves restated as part of the Second Reserves Restatement, 92% (1,060 million boe) was attributable to Group companies and the remainder was attributable to associated companies. 42% of the total had been in the proved developed reserves category and 58% had been categorised as proved undeveloped reserves. Africa accounted for 35% of the Second Reserves Restatement, Asia Pacific 26%, Middle East 3%, Europe 21%, and Other Western Hemisphere 15%. Please refer to the narrative above for explanation of the principal reasons for the Second Reserves Restatement. After giving effect to the Second Reserves Restatement, the proportion of total unaudited proved reserve volumes that was accounted for as proved developed reserves at that date increased from 56%, as stated in the 2003 Annual Report and Accounts and 2003 Annual Report on Form 20-F, as filed with the SEC on June 30, 2004, to 57%.
The Reserves Restatements gave rise to an aggregate estimated reduction of $10,542 million in the standardised measure of discounted future net cash flow for Group companies and a further $1,470 million for associated companies. Together, these effects equate to approximately 17% of the total standardised measure that was originally stated at that date in the 2003 Annual Report and Accounts and 2003 Annual Report on Form 20-F, as filed with the SEC on June 30, 2004. The reduction of the net present value disclosed by the standardised measure includes an offset due to the correction of an error in the original statement that was discovered during compilation of the restated figures. The error related to the application of an incorrect net margin accruing to production on a fixed margin contract and resulted in an understatement of approximately 1% of the standardised measure value originally reported for the year 2002. The percentage effect is even less in 2001. Of the total reduction, $6,648 million was reflected in the First Reserves Restatement and $5,364 million is reflected herein as part of the Second Reserves Restatement.
96 Royal Dutch/Shell Group of Companies
Supplementary information
– Oil and Gas (unaudited)
continued
Years prior to 2002
In certain cases, the affected unaudited proved reserve volumes have been removed from the proved category in years prior to 2002.
Although not tabulated in detail in this report, a summary of the estimated effects on prior years is as follows:
| – | | at December 31, 2001 (and January 1, 2002), the aggregated effect on unaudited proved reserves of the Reserves Restatements was 5,324 million boe, comprising 3,205 million barrels of crude oil and natural gas liquids and 12,293 thousand million standard cubic feet of gas. This amounted to 28% of the total unaudited proved reserve volumes originally stated at that date (19,095 million boe). Of the volumes restated, 88% (4,683 million boe) were attributable to Group companies and the remainder were attributable to associated companies. 16% of the total had been in the proved developed reserves category and 84% had been categorised as proved undeveloped reserves. Africa accounted for 45% of the total restatement, Asia Pacific 33%, Middle East 11%, Europe 7% and Other Western Hemisphere 4%. Various properties in Nigeria accounted for 43% of the restated volumes at that date, Australia accounted for 19% of the total. The effect of applying year-end pricing accounted for 4% of the total; |
| – | | at December 31, 2000 (and January 1, 2001), the aggregated effect on unaudited proved reserves of the Reserves Restatements was 5,584 million boe, comprising 3,346 million barrels of crude oil and natural gas liquids and 12,979 thousand million standard cubic feet of gas. This amounted to 29% of the total unaudited proved reserves originally stated at that date (19,455 million boe). Of the total aggregated effect, 89% (4,995 million boe) was attributable to Group companies and the remainder was attributable to associated companies. 15% of the total had been in the proved developed reserves category and 85% had been categorised as proved undeveloped reserves. Africa accounted for 44% of the total restatement, Asia Pacific 31%, Middle East 14%, Europe 5% and Other Western Hemisphere 5%. Various properties in Nigeria accounted for 42% of the restated volume at that date and Australia accounted for 19%. The effect of applying year-end pricing accounted for 8% of the total; |
| – | | at December 31, 1999 (and January 1, 2000), the aggregated effect on proved reserves of the Reserves Restatements was 5,207 million boe, comprising 2,802 million barrels of crude oil and natural gas liquids and 13,947 thousand million standard cubic feet of gas. This amounted to 26% of the total proved reserves originally stated at that date (19,868 million boe). Of the total aggregated effect, 89% (4,630 million boe) was attributable to Group companies and the remainder was attributable to associated companies. 19% of the total had been in the proved developed reserves category and 81% had been categorised as proved undeveloped reserves. Africa accounted for 47% of the total restatement, Asia Pacific 32%, Middle East 11%, Europe 5% and Other Western Hemisphere 5%. Various properties in Nigeria accounted for 47% of the restated volume at that date and Australia accounted for 22%. The effect of applying year-end pricing accounted for 10% of the total; |
| – | | at December 31, 1998 (and January 1, 1999), the aggregate effect on proved reserves of the Reserves Restatements was 4,111 million boe, comprising 2,314 million barrels of crude oil and natural gas liquids and 10,423 thousand million standard cubic feet of gas. This amounted to 20% of the total proved reserves originally stated at that date (20,455 million boe). Of the total aggregate effect, 85% (3,501 million boe) was attributable to Group companies and the remainder was attributable to associated companies. 17% of the total had been in the proved developed reserves category and 83% had been categorised as proved undeveloped reserves. Africa accounted for 57% of the total restatement, Asia Pacific 39% and Europe 4%. Various properties in Nigeria and Australia together accounted for 85% of the restated volume at that date; and |
| – | | at December 31, 1997 (and January 1, 1998), the aggregate effect on proved reserves of the Reserves Restatements was 3,462 million boe, comprising 1,776 million barrels of crude oil and natural gas liquids and 9,779 thousand million standard cubic feet of gas. This amounted to 19% of the total proved reserves originally stated at that date (19,359 million boe). Of the total aggregate effect, 83% (2,883 million boe) was attributable to Group companies and the remainder was attributable to associated companies. 9% of the total had been in the proved developed reserves category and 91% had been categorised as proved undeveloped reserves. Africa accounted for 52% of the total restatement, Asia Pacific 45% and Europe 4%. Various properties in Nigeria and Australia together accounted for 85% of the restated volume at that date. |
Supplementary information – Oil and Gas (unaudited) 97
Reconciliation of previously reported Supplementary information – Oil and Gas
The following tables set forth the effect of the Second Reserves Restatement on (i) the proved developed and undeveloped crude oil and natural gas reserves of Group companies and the Group share of associated companies at December 31, 2003 and 2002 (ii) the standardised measure of discounted future net cash flows at each such date and (iii) a geographic analysis of the Second Reserves Restatement.
Reconciliation of Proved Reserve Volumes and Standardised Measure
| | | | | | | | | | | | | | | | | | | | | | | | | | | | | | | | | | | | | | | | | |
| | | | | | | | | | | | | | | million barrels | | | | | | | | | | | thousand million standard cubic feeta | | | | | | | $million | |
| | | Reserves | | | Reserves | | | | | | | | |
| | | Crude oil and natural gas liquids | | | Natural gas | | | Standardised measure | |
| | | Proved developed and | | | Proved developed | | | Proved developed and | | | Proved developed | | | of discounted future | |
| | | undeveloped reserves | | | reserves | | | undeveloped reserves | | | reserves | | | cash flows | |
| | | 2003 | | | 2002 | | | 2003 | | | 2002 | | | 2003 | | | 2002 | | | 2003 | | | 2002 | | | 2003 | | | 2002 | |
| | | | | | | | | |
| Group companies | | | | | | | | | | | | | | | | | | | | | | | | | | | | | | | | | | | | | | | | |
| | | | | | | | | | | | | | | | | | | | | | | | | | | | | | | | | | | | | | | | | |
| As originally reported (2003)/ previously restated (2002) | | | 5,723 | | | | 6,405 | | | | 3,512 | | | | 3,684 | | | | 41,601 | | | | 40,290 | | | | 20,490 | | | | 21,362 | | | | 53,844 | | | | 60,362 | |
| | | | | | | | | | | | | | | | | | | | | | | | | | | | | | | | | | | | | | | | | |
| Effect of the Second Reserves Restatement Amounts at beginning of year | | | (623 | ) | | | (507 | ) | | | (168 | ) | | | (145 | ) | | | (2,533 | ) | | | (1,529 | ) | | | (1,401 | ) | | | (1,453 | ) | | | (5,202 | ) | | | (2,504 | ) |
| Movements during the year | | | (91 | ) | | | (116 | ) | | | (75 | ) | | | (23 | ) | | | (698 | ) | | | (1,004 | ) | | | (101 | ) | | | 52 | | | | (470 | ) | | | (2,698 | ) |
| |
| Total | | | (714 | ) | | | (623 | ) | | | (243 | ) | | | (168 | ) | | | (3,231 | ) | | | (2,533 | ) | | | (1,502 | ) | | | (1,401 | ) | | | (5,672 | ) | | | (5,202 | ) |
| |
| | | | | | | | | | | | | | | | | | | | | | | | | | | | | | | | | | | | | | | | | |
| As restated at December 31 | | | 5,009 | | | | 5,782 | | | | 3,269 | | | | 3,516 | | | | 38,370 | | | | 37,757 | | | | 18,988 | | | | 19,961 | | | | 48,172 | | | | 55,160 | |
| |
| | | | | | | | | | | | | | | | | | | | | | | | | | | | | | | | | | | | | | | | | |
| Group share of associated companies | | | | | | | | | | | | | | | | | | | | | | | | | | | | | | | | | | | | | | | | |
| | | | | | | | | | | | | | | | | | | | | | | | | | | | | | | | | | | | | | | | | |
| As originally reported (2003)/ previously restated (2002) | | | 882 | | | | 933 | | | | 672 | | | | 659 | | | | 3,319 | | | | 3,412 | | | | 1,914 | | | | 1,847 | | | | 5,828 | | | | 5,762 | |
| | | | | | | | | | | | | | | | | | | | | | | | | | | | | | | | | | | | | | | | | |
| Effect of the Second Reserves Restatement Amounts at beginning of year | | | (75 | ) | | | (55 | ) | | | (72 | ) | | | (53 | ) | | | (104 | ) | | | 187 | | | | (16 | ) | | | 18 | | | | (162 | ) | | | (28 | ) |
| Movements during the year | | | (2 | ) | | | (20 | ) | | | (10 | ) | | | (19 | ) | | | (27 | ) | | | (291 | ) | | | (17 | ) | | | (34 | ) | | | (165 | ) | | | (134 | ) |
| |
| Total | | | (77 | ) | | | (75 | ) | | | (82 | ) | | | (72 | ) | | | (131 | ) | | | (104 | ) | | | (33 | ) | | | (16 | ) | | | (327 | ) | | | (162 | ) |
| |
| As restated at December 31 | | | 805 | | | | 858 | | | | 590 | | | | 587 | | | | 3,188 | | | | 3,308 | | | | 1,881 | | | | 1,831 | | | | 5,501 | | | | 5,600 | |
| |
| |
Geographical analysis of the Second Reserves Restatement |
| |
| Group companies | | | | | | | | | | | | | | | | | | | | | | | | | | | | | | | | | | | | | | | | |
| Europe | | | (168 | ) | | | (111 | ) | | | (94 | ) | | | (64 | ) | | | (1,242 | ) | | | (762 | ) | | | (873 | ) | | | (589 | ) | | | (1,499 | ) | | | (1,343 | ) |
Africab | | | (374 | ) | | | (379 | ) | | | (102 | ) | | | (64 | ) | | | (835 | ) | | | (152 | ) | | | (208 | ) | | | (446 | ) | | | (2,614 | ) | | | (2,910 | ) |
Asia Pacificc | | | (15 | ) | | | (15 | ) | | | (10 | ) | | | (5 | ) | | | (1,011 | ) | | | (1,132 | ) | | | (395 | ) | | | (370 | ) | | | (564 | ) | | | (556 | ) |
Middle East, Russia, CISd | | | (94 | ) | | | (38 | ) | | | (34 | ) | | | (33 | ) | | | (6 | ) | | | — | | | | (3 | ) | | | — | | | | (552 | ) | | | 7 | |
| USA | | | (3 | ) | | | (3 | ) | | | (2 | ) | | | (2 | ) | | | (32 | ) | | | (32 | ) | | | (4 | ) | | | (5 | ) | | | (52 | ) | | | (37 | ) |
| Other Western Hemisphere | | | (60 | ) | | | (77 | ) | | | (1 | ) | | | — | | | | (105 | ) | | | (455 | ) | | | (19 | ) | | | 9 | | | | (391 | ) | | | (363 | ) |
| |
| Total | | | (714 | ) | | | (623 | ) | | | (243 | ) | | | (168 | ) | | | (3,231 | ) | | | (2,533 | ) | | | (1,502 | ) | | | (1,401 | ) | | | (5,672 | ) | | | (5,202 | ) |
| |
| Group share of associated companies | |
| Europe | | | — | | | | — | | | | — | | | | — | | | | — | | | | — | | | | — | | | | — | | | | — | | | | — | |
Africab | | | — | | | | — | | | | — | | | | — | | | | — | | | | — | | | | — | | | | — | | | | — | | | | — | |
Asia Pacificc | | | (77 | ) | | | (75 | ) | | | (82 | ) | | | (72 | ) | | | (131 | ) | | | (104 | ) | | | (33 | ) | | | (16 | ) | | | (326 | ) | | | (162 | ) |
Middle East, Russia, CISd | | | — | | | | — | | | | — | | | | — | | | | — | | | | — | | | | — | | | | — | | | | (1 | ) | | | — | |
| USA | | | — | | | | — | | | | — | | | | — | | | | — | | | | — | | | | — | | | | — | | | | — | | | | — | |
| Other Western Hemisphere | | | — | | | | — | | | | — | | | | — | | | | — | | | | — | | | | — | | | | — | | | | — | | | | — | |
| |
| Total | | | (77 | ) | | | (75 | ) | | | (82 | ) | | | (72 | ) | | | (131 | ) | | | (104 | ) | | | (33 | ) | | | (16 | ) | | | (327 | ) | | | (162 | ) |
| |
| a | | These quantities have not been adjusted to standard heat content. |
| |
| b | | Excludes Egypt. |
| |
| c | | Excludes Sakhalin. |
| |
| d | | Middle East and former Soviet Union/Commonwealth of Independent States. Includes Caspian region, Egypt and Sakhalin. |
98 Royal Dutch/Shell Group of Companies
Crude oil and natural gas liquids
Group companies’ estimated net proved reserves of crude oil and natural gas liquids at the end of the year, their share of the net proved reserves of associated companies at the end of the year, and the changes in such reserves during the year are set out below:
Proved developed and undeveloped reservesa
| | | | | | | | | | | | | | | | | | | | | | | | | | | | | |
| | | | | | | | | | | | | | | | | | | | | | | | | | | million barrels | |
| | | 2004 | |
| | | Eastern Hemisphere | | | Western Hemisphere | | | | |
| | | | | | | | | | | Asia | | | Middle East, | | | | | | | | | | |
| | | Europe | | | Africab | | | Pacificc | | | Russia, CISd | | | USA | | | Other | | | Total | |
| | | | | |
Group companies | |
At January 1 | | | 1,199 | | | | 1,379 | | | | 303 | | | | 1,202 | | | | 547 | | | | 379 | | | | 5,009 | |
| Revisions and reclassifications | | | (27 | ) | | | (46 | ) | | | 13 | | | | 80 | | | | (2 | ) | | | (197 | ) | | | (179 | ) |
| Improved recovery | | | 6 | | | | 2 | | | | — | | | | 4 | | | | — | | | | — | | | | 12 | |
| Extensions and discoveries | | | 5 | | | | 13 | | | | 10 | | | | 68 | | | | 12 | | | | 2 | | | | 110 | |
| Purchases of minerals in place | | | — | | | | — | | | | — | | | | — | | | | — | | | | — | | | | — | |
| Sales of minerals in place | | | (2 | ) | | | (57 | ) | | | (35 | ) | | | — | | | | — | | | | — | | | | (94 | ) |
| Production | | | (212 | ) | | | (146 | ) | | | (46 | ) | | | (172 | ) | | | (99 | ) | | | (38 | ) | | | (713 | ) |
| Transfers to associated companies | | | — | | | | — | | | | — | | | | (384 | ) | | | — | | | | — | | | | (384 | ) |
| | | | | |
At December 31 | | | 969 | | | | 1,145 | | | | 245 | | | | 798 | | | | 458 | | | | 146 | | | | 3,761 | |
| | | | | |
Group share of associated companies | |
At January 1 | | | 2 | | | | — | | | | 304 | | | | 86 | | | | 413 | | | | — | | | | 805 | |
| Revisions and reclassifications | | | — | | | | — | | | | (22 | ) | | | (13 | ) | | | 18 | | | | — | | | | (17 | ) |
| Improved recovery | | | — | | | | — | | | | 38 | | | | — | | | | — | | | | — | | | | 38 | |
| Extensions and discoveries | | | — | | | | — | | | | — | | | | — | | | | — | | | | — | | | | — | |
| Purchases of minerals in place | | | — | | | | — | | | | — | | | | — | | | | — | | | | — | | | | — | |
| Sales of minerals in place | | | — | | | | — | | | | (1 | ) | | | — | | | | — | | | | — | | | | (1 | ) |
| Production | | | — | | | | — | | | | (43 | ) | | | — | | | | (39 | ) | | | — | | | | (82 | ) |
| Transfers from Group companies | | | — | | | | — | | | | — | | | | 384 | | | | — | | | | — | | | | 384 | |
| | | | | |
At December 31 | | | 2 | | | | — | | | | 276 | | | | 457 | | | | 392 | | | | — | | | | 1,127 | |
| | | | | |
Minority interests’ share of proved reserves of Group companies | |
At December 31 | | | — | | | | 23 | | | | 1 | | | | 109 | | | | — | | | | 14 | | | | 147 | |
| | | | | |
Oil sandse
| | | | | | | | | |
| | | | | | | million barrels | |
Group companies | |
At January 1 | | | 572 | | | | 572 | |
| Revisions and reclassifications | | | 72 | | | | 72 | |
| Extensions and discoveries | | | — | | | | — | |
| Production | | | (29 | ) | | | (29 | ) |
| | | | | |
At December 31 | | | 615 | | | | 615 | |
| | | | | |
Minority interests’ share of oil sands | |
At December 31 | | | 135 | | | | 135 | |
| | | | | |
Proved developed reservesa
| | | | | | | | | | | | | | | | | | | | | | | | | | | | | |
| | | | | | | | | | | | | | | | | | | | | | | | | | | million barrels | |
| | | 2004 | |
| | | Eastern Hemisphere | | | Western Hemisphere | | | | |
| | | | | | | | | | | Asia | | | Middle East, | | | | | | | | | | |
| | | Europe | | | Africab | | | Pacificc | | | Russia, CISd | | | USA | | | Other | | | Total | |
Group companies | | | | | | | | | | | | | | | | | | | | | | | | | | | | |
At January 1 | | | 962 | | | | 777 | | | | 184 | | | | 864 | | | | 291 | | | | 191 | | | | 3,269 | |
At December 31f | | | 755 | | | | 617 | | | | 134 | | | | 475 | | | | 242 | | | | 115 | | | | 2,338 | |
Group share of associated companies | | | | | | | | | | | | | | | | | | | | | | | | | | | | |
At January 1 | | | 1 | | | | — | | | | 224 | | | | 1 | | | | 364 | | | | — | | | | 590 | |
At December 31f | | | 1 | | | | — | | | | 187 | | | | 360 | | | | 349 | | | | — | | | | 897 | |
| | | | | |
| a | | A summary of changes is shown on page 97. |
| |
| b | | Excludes Egypt. |
| |
| c | | Excludes Sakhalin. |
| |
| d | | Middle East and former Soviet Union/Commonwealth of Independent States. Includes Caspian region, Egypt and Sakhalin. |
| |
| e | | Petroleum reserves from operations that do not qualify as oil and gas producing activities, such as our Athabasca Oil Sands Project, are not included in oil and gas reserves and are not considered in the standardised measure of discounted future cash flows for oil and gas reserves, which is found on pages 102 and 103. The petroleum reserves for the Athabasca Oil Sands Project are presented in this report net of royalty volumes. |
| |
| f | | After accounting for a transfer of proved developed reserves from Group to associated companies of 360 million barrels at the end of 2004. |
Supplementary information – Oil and Gas (unlimited) 99
| | | | | | | | | | | | | | | | | | | | | | | | | | | | | | | | | | | | | | | | | | | | | | | | | | | | | |
| million barrels | | | million barrels | |
| 2003 | | | 2002 | |
| As restated | | | As restated | |
| Eastern Hemisphere | | | Western Hemisphere | | | | | | | Eastern Hemisphere | | | Western Hemisphere | | | | |
| | | | | | | Asia | | | Middle East, | | | | | | | | | | | | | | | | | | | | | | | Asia | | | Middle East, | | | | | | | | | | |
| Europe | | Africab | | | Pacificc | | | Russia, CISd | | | USA | | | Other | | | Total | | | Europe | | | Africab | | | Pacificc | | | Russia, CISd | | | USA | | | Other | | | Total | |
| | | | | | | | | | | |
| 1,377 | | | 1,449 | | | | 323 | | | | 1,446 | | | | 717 | | | | 470 | | | | 5,782 | | | | 1,013 | | | | 1,308 | | | | 426 | | | | 1,677 | | | | 672 | | | | 504 | | | | 5,600 | |
| 88 | | | (102 | ) | | | 21 | | | | (204 | ) | | | (54 | ) | | | (57 | ) | | | (308 | ) | | | 99 | | | | 89 | | | | (27 | ) | | | (26 | ) | | | 77 | | | | (42 | ) | | | 170 | |
| 5 | | | (6 | ) | | | 16 | | | | 10 | | | | 8 | | | | 1 | | | | 34 | | | | 13 | | | | — | | | | 6 | | | | 47 | | | | 51 | | | | — | | | | 117 | |
| 12 | | | 171 | | | | — | | | | 128 | | | | 9 | | | | 2 | | | | 322 | | | | — | | | | 173 | | | | 6 | | | | — | | | | 33 | | | | — | | | | 212 | |
| 1 | | | — | | | | — | | | | 3 | | | | — | | | | — | | | | 4 | | | | 507 | | | | — | | | | — | | | | — | | | | 7 | | | | 41 | | | | 555 | |
| (39) | | | — | | | | — | | | | — | | | | (23 | ) | | | — | | | | (62 | ) | | | (1 | ) | | | (19 | ) | | | (19 | ) | | | (62 | ) | | | (3 | ) | | | — | | | | (104 | ) |
| (245) | | | (133 | ) | | | (57 | ) | | | (181 | ) | | | (110 | ) | | | (37 | ) | | | (763 | ) | | | (254 | ) | | | (102 | ) | | | (69 | ) | | | (190 | ) | | | (120 | ) | | | (33 | ) | | | (768 | ) |
| — | | | — | | | | — | | | | — | | | | — | | | | — | | | | — | | | | — | | | | — | | | | — | | | | — | | | | — | | | | — | | | | — | |
| | | | | | | | | | | |
| 1,199 | | | 1,379 | | | | 303 | | | | 1,202 | | | | 547 | | | | 379 | | | | 5,009 | | | | 1,377 | | | | 1,449 | | | | 323 | | | | 1,446 | | | | 717 | | | | 470 | | | | 5,782 | |
| | | | | | | | | | | |
| 2 | | | — | | | | 325 | | | | 118 | | | | 413 | | | | — | | | | 858 | | | | 1 | | | | — | | | | 307 | | | | — | | | | 356 | | | | — | | | | 664 | |
| — | | | — | | | | 1 | | | | — | | | | 41 | | | | — | | | | 42 | | | | 1 | | | | — | | | | 55 | | | | — | | | | 65 | | | | — | | | | 121 | |
| — | | | — | | | | 13 | | | | — | | | | — | | | | — | | | | 13 | | | | — | | | | — | | | | 4 | | | | — | | | | — | | | | — | | | | 4 | |
| — | | | — | | | | 11 | | | | 86 | | | | — | | | | — | | | | 97 | | | | — | | | | — | | | | 9 | | | | — | | | | 33 | | | | — | | | | 42 | |
| — | | | — | | | | — | | | | — | | | | — | | | | — | | | | — | | | | — | | | | — | | | | — | | | | 121 | | | | — | | | | — | | | | 121 | |
| — | | | — | | | | — | | | | (117 | ) | | | — | | | | — | | | | (117 | ) | | | — | | | | — | | | | — | | | | (1 | ) | | | — | | | | — | | | | (1 | ) |
| — | | | — | | | | (46 | ) | | | (1 | ) | | | (41 | ) | | | — | | | | (88 | ) | | | — | | | | — | | | | (50 | ) | | | (2 | ) | | | (41 | ) | | | — | | | | (93 | ) |
| — | | | — | | | | — | | | | — | | | | — | | | | — | | | | — | | | | — | | | | — | | | | — | | | | — | | | | — | | | | — | | | | — | |
| | | | | | | | | | | |
| 2 | | | — | | | | 304 | | | | 86 | | | | 413 | | | | — | | | | 805 | | | | 2 | | | | — | | | | 325 | | | | 118 | | | | 413 | | | | — | | | | 858 | |
| | | | | | | | | | | |
| — | | | 24 | | | | 1 | | | | 137 | | | | — | | | | 54 | | | | 216 | | | | — | | | | 23 | | | | 1 | | | | 126 | | | | — | | | | 61 | | | | 211 | |
| | | | | | | | | | | |
| | | | | | | | | | | | | | | | | | | | | | | | | | | | | | | | | | | | | | | | | | | | | | | | | | | | | |
| | | | | | | | | | | | | | | | | | | | | | | million barrels | | | | | | | | | | | | | | | | | | | | | | | | | | | million barrels | |
| | | |
| | | | | | | | | | | | | | | | | | | | 517 | | | | 517 | | | | | | | | | | | | | | | | | | | | | | | | 594 | | | | 594 | |
| | | | | | | | | | | | | | | | | | | | 10 | | | | 10 | | | | | | | | | | | | | | | | | | | | | | | | (77 | ) | | | (77 | ) |
| | | | | | | | | | | | | | | | | | | | 60 | | | | 60 | | | | | | | | | | | | | | | | | | | | | | | | — | | | | — | |
| | | | | | | | | | | | | | | | | | | | (15 | ) | | | (15 | ) | | | | | | | | | | | | | | | | | | | | | | | — | | | | — | |
| | | | | | | | | | | |
| | | | | | | | | | | | | | | | | | | | 572 | | | | 572 | | | | | | | | | | | | | | | | | | | | | | | | 517 | | | | 517 | |
| | | | | | | | | | | |
| | | | | | | | | | | | | | | | | | | | 126 | | | | 126 | | | | | | | | | | | | | | | | | | | | | | | | 115 | | | | 115 | |
| | | | | | | | | | | |
| | | | | | | | | | | | | | | | | | | | | | | | | | | | | | | | | | | | | | | | | | | | | | | | | | | | | |
| million barrels | | | million barrels | |
| 2003 | | | 2002 | |
| As restated | | | As restated | |
| Eastern Hemisphere | | | Western Hemisphere | | | | | | | Eastern Hemisphere | | | Western Hemisphere | | | | |
| | | | | | | Asia | | | Middle East, | | | | | | | | | | | | | | | | | | | | | | | Asia | | | Middle East, | | | | | | | | | | |
| Europe | | Africab | | | Pacificc | | | Russia, CISd | | | USA | | | Other | | | Total | | | Europe | | | Africab | | | Pacificc | | | Russia, CISd | | | USA | | | Other | | | Total | |
| | | | | | | | | | | |
| 1,063 | | | 674 | | | | 194 | | | | 1,023 | | | | 371 | | | | 191 | | | | 3,516 | | | | 750 | | | | 662 | | | | 245 | | | | 1,089 | | | | 429 | | | | 212 | | | | 3,387 | |
| 962 | | | 777 | | | | 184 | | | | 864 | | | | 291 | | | | 191 | | | | 3,269 | | | | 1,063 | | | | 674 | | | | 194 | | | | 1,023 | | | | 371 | | | | 191 | | | | 3,516 | |
| 1 | | | — | | | | 206 | | | | 15 | | | | 365 | | | | — | | | | 587 | | | | 1 | | | | — | | | | 208 | | | | — | | | | 330 | | | | — | | | | 539 | |
| 1 | | | — | | | | 224 | | | | 1 | | | | 364 | | | | — | | | | 590 | | | | 1 | | | | — | | | | 206 | | | | 15 | | | | 365 | | | | — | | | | 587 | |
| | | | | | | | | | | | | | | |
100 Royal Dutch/Shell Group of Companies
Natural gas
Group companies’ estimated net proved reserves of natural gas at the end of the year, their share of the net proved reserves of associated companies at the end of the year, and the changes in such reserves during the year are set out below. The volumes set out below have not been adjusted to standard heat content, which means that volumes of gas are reported on an “as-sold” basis and are treated as equivalent without regard to the quality of the gas (eg, with respect to the inert gas content thereof or the various hydrocarbon components). The price used to calculate future revenues and cash flows from proved gas reserves is that realised at year-end based on “as-sold” volumes. As such, the realised price reflects the quality of the gas, both in terms of inert components which reduce gas quality and hydrocarbon components with high molecular weights which enrich the quality of the gas.
Proved developed and undeveloped reservesa
| | | | | | | | | | | | | | | | | | | | | | | | | | | | | |
| | | thousand million standard cubic feetb | |
| | | 2004 | |
| | | Eastern Hemisphere | | | Western Hemisphere | | | | |
| | | | | | | | | | | Asia | | | Middle East, | | | | | | | | | | |
| | | Europe | | | Africac | | | Pacificd | | | Russia, CISe | | | USA | | | Other | | | Total | |
| | | | | | | | | |
Group companies | | | | | | | | | | | | | | | | | | | | | | | | | | | | |
At January 1 | | | 19,876 | | | | 2,743 | | | | 7,352 | | | | 3,628 | | | | 3,143 | | | | 1,628 | | | | 38,370 | |
| Revisions and reclassifications | | | (270 | ) | | | (74 | ) | | | 125 | | | | 138 | | | | (100 | ) | | | (45 | ) | | | (226 | ) |
| Improved recovery | | | 9 | | | | — | | | | — | | | | — | | | | — | | | | 4 | | | | 13 | |
| Extensions and discoveries | | | 217 | | | | — | | | | 171 | | | | 2,128 | | | | 257 | | | | 192 | | | | 2,965 | |
| Purchases of minerals in place | | | — | | | | — | | | | — | | | | — | | | | 9 | | | | — | | | | 9 | |
| Sales of minerals in place | | | (48 | ) | | | — | | | | (310 | ) | | | (258 | ) | | | — | | | | (37 | ) | | | (653 | ) |
| Production | | | (1,345 | ) | | | (137 | ) | | | (535 | ) | | | (253 | ) | | | (486 | ) | | | (197 | ) | | | (2,953 | ) |
| | | | | | | | | |
At December 31 | | | 18,439 | | | | 2,532 | | | | 6,803 | | | | 5,383 | | | | 2,823 | | | | 1,545 | | | | 37,525 | |
| | | | | | | | | |
Group share of associated companies | | | | | | | | | | | | | | | | | | | | | | | | | | | | |
At January 1 | | | 39 | | | | — | | | | 3,122 | | | | — | | | | 27 | | | | — | | | | 3,188 | |
| Revisions and reclassifications | | | — | | | | — | | | | 120 | | | | — | | | | (8 | ) | | | — | | | | 112 | |
| Improved recovery | | | — | | | | — | | | | 45 | | | | — | | | | — | | | | — | | | | 45 | |
| Extensions and discoveries | | | 5 | | | | — | | | | 1 | | | | — | | | | — | | | | — | | | | 6 | |
| Purchases of minerals in place | | | — | | | | — | | | | — | | | | — | | | | — | | | | — | | | | — | |
| Sales of minerals in place | | | — | | | | — | | | | (55 | ) | | | — | | | | — | | | | — | | | | (55 | ) |
| Production | | | (7 | ) | | | — | | | | (246 | ) | | | — | | | | (2 | ) | | | — | | | | (255 | ) |
| | | | | | | | | |
At December 31 | | | 37 | | | | — | | | | 2,987 | | | | — | | | | 17 | | | | — | | | | 3,041 | |
| | | | | | | | | |
Minority interests’ share of proved reserves of Group companies | | | | | | | | | | | | | | | | | | | | | | | | | | | | |
At December 31 | | | — | | | | — | | | | 56 | | | | 2,231 | | | | — | | | | 274 | | | | 2,561 | |
| | | | | | | | | |
Proved developed reservesa
| | | | | | | | | | | | | | | | | | | | | | | | | | | | | |
| | | thousand million standard cubic feetb | |
| | | 2004 | |
| | | Eastern Hemisphere | | | Western Hemisphere | | | | |
| | | | | | | | | | | Asia | | | Middle East, | | | | | | | | | | |
| | | Europe | | | Africac | | | Pacificd | | | Russia, CISe | | | USA | | | Other | | | Total | |
| | | | | | | | | |
Group companies | | | | | | | | | | | | | | | | | | | | | | | | | | | | |
At January 1 | | | 11,477 | | | | 886 | | | | 3,128 | | | | 446 | | | | 1,754 | | | | 1,297 | | | | 18,988 | |
At December 31 | | | 12,961 | | | | 919 | | | | 2,702 | | | | 166 | | | | 1,875 | | | | 1,080 | | | | 19,703 | |
Group share of associated companies | | | | | | | | | | | | | | | | | | | | | | | | | | | | |
At January 1 | | | 34 | | | | — | | | | 1,825 | | | | — | | | | 22 | | | | — | | | | 1,881 | |
At December 31 | | | 28 | | | | — | | | | 1,606 | | | | — | | | | 15 | | | | — | | | | 1,649 | |
| | | | | | | | | |
| a | | A summary of the changes is shown on page 97. |
| |
| b | | These quantities have not been adjusted to standard heat content. |
| |
| c | | Excludes Egypt. |
| |
| d | | Excludes Sakhalin. |
| |
| e | | Middle East and former Soviet Union/Commonwealth of Independent States. Includes Caspian region, Egypt and Sakhalin. |
Supplementary information – Oil and Gas (unaudited) 101
| | | | | | | | | | | | | | | | | | | | | | | | | | | | | | | | | | | | | | | | | | | | | | | | | | | | | |
| thousand million standard cubic feetb | | | thousand million standard cubic feetb | |
| 2003 | | | 2002 | |
| As restated | | | As restated | |
| Eastern Hemisphere | | | Western Hemisphere | | | | | | | Eastern Hemisphere | | | Western Hemisphere | | | | |
| | | | | | | Asia | | | Middle East, | | | | | | | | | | | | | | | | | | | | | | | Asia | | | Middle East, | | | | | | | | | | |
| Europe | | Africac | | | Pacificd | | | Russia, CISe | | | USA | | | Other | | | Total | | | Europe | | | Africac | | | Pacificd | | | Russia, CISe | | | USA | | | Other | | | Total | |
| | | | | | | | | | | | | | | |
| 21,284 | | | 1,692 | | | | 7,862 | | | | 1,118 | | | | 3,842 | | | | 1,959 | | | | 37,757 | | | | 22,022 | | | | 1,780 | | | | 9,031 | | | | 1,777 | | | | 3,663 | | | | 2,257 | | | | 40,530 | |
| (435) | | | (688 | ) | | | 8 | | | | (22 | ) | | | (70 | ) | | | (181 | ) | | | (1,388 | ) | | | (110 | ) | | | 1 | | | | (680 | ) | | | (282 | ) | | | 162 | | | | (123 | ) | | | (1,032 | ) |
| 4 | | | 506 | | | | 17 | | | | — | | | | 10 | | | | 30 | | | | 567 | | | | 6 | | | | — | | | | 150 | | | | — | | | | 20 | | | | — | | | | 176 | |
| 459 | | | 1,361 | | | | 6 | | | | 2,790 | | | | 305 | | | | 34 | | | | 4,955 | | | | 29 | | | | — | | | | 126 | | | | — | | | | 410 | | | | 9 | | | | 574 | |
| 6 | | | — | | | | — | | | | — | | | | — | | | | — | | | | 6 | | | | 673 | | | | — | | | | — | | | | — | | | | 208 | | | | 12 | | | | 893 | |
| (139) | | | — | | | | — | | | | — | | | | (389 | ) | | | (17 | ) | | | (545 | ) | | | (5 | ) | | | — | | | | (212 | ) | | | — | | | | (10 | ) | | | — | | | | (227 | ) |
| (1,303) | | | (128 | ) | | | (541 | ) | | | (258 | ) | | | (555 | ) | | | (197 | ) | | | (2,982 | ) | | | (1,331 | ) | | | (89 | ) | | | (553 | ) | | | (377 | ) | | | (611 | ) | | | (196 | ) | | | (3,157 | ) |
| | | | | | | | | | | | | | | |
| 19,876 | | | 2,743 | | | | 7,352 | | | | 3,628 | | | | 3,143 | | | | 1,628 | | | | 38,370 | | | | 21,284 | | | | 1,692 | | | | 7,862 | | | | 1,118 | | | | 3,842 | | | | 1,959 | | | | 37,757 | |
| | | | | | | | | | | | | | | |
| 44 | | | — | | | | 3,243 | | | | — | | | | 21 | | | | — | | | | 3,308 | | | | 48 | | | | — | | | | 2,943 | | | | — | | | | 15 | | | | — | | | | 3,006 | |
| — | | | — | | | | 106 | | | | — | | | | 9 | | | | — | | | | 115 | | | | 1 | | | | — | | | | 434 | | | | — | | | | 7 | | | | — | | | | 442 | |
| 1 | | | — | | | | 11 | | | | — | | | | — | | | | — | | | | 12 | | | | — | | | | — | | | | 8 | | | | — | | | | — | | | | — | | | | 8 | |
| 1 | | | — | | | | — | | | | — | | | | — | | | | — | | | | 1 | | | | 3 | | | | — | | | | 80 | | | | — | | | | 1 | | | | — | | | | 84 | |
| — | | | — | | | | — | | | | — | | | | — | | | | — | | | | — | | | | — | | | | — | | | | — | | | | — | | | | — | | | | — | | | | — | |
| — | | | — | | | | — | | | | — | | | | — | | | | — | | | | — | | | | — | | | | — | | | | — | | | | — | | | | — | | | | — | | | | — | |
| (7) | | | — | | | | (238 | ) | | | — | | | | (3 | ) | | | — | | | | (248 | ) | | | (8 | ) | | | — | | | | (222 | ) | | | — | | | | (2 | ) | | | — | | | | (232 | ) |
| 39 | | | — | | | | 3,122 | | | | — | | | | 27 | | | | — | | | | 3,188 | | | | 44 | | | | — | | | | 3,243 | | | | — | | | | 21 | | | | — | | | | 3,308 | |
| | | | | | | | | | | | | | | |
| — | | | — | | | | 63 | | | | 1,285 | | | | — | | | | 300 | | | | 1,648 | | | | — | | | | — | | | | 61 | | | | 59 | | | | — | | | | 342 | | | | 462 | |
| | | | | | | | | | | | | | | |
| | | | | | | | | | | | | | | | | | | | | | | | | | | | | | | | | | | | | | | | | | | | | | | | | | | | | |
| thousand million standard cubic feetb | | | thousand million standard cubic feetb | |
| 2003 | | | 2002 | |
| As restated | | | As restated | |
| Eastern Hemisphere | | | Western Hemisphere | | | | | | | Eastern Hemisphere | | | Western Hemisphere | | | | |
| | | | | | | Asia | | | Middle East, | | | | | | | | | | | | | | | | | | | | | | | Asia | | | Middle East, | | | | | | | | | | |
| Europe | | Africac | | | Pacificd | | | Russia, CISe | | | USA | | | Other | | | Total | | | Europe | | | Africac | | | Pacificd | | | Russia, CISe | | | USA | | | Other | | | Total | |
| | | | | | | | | | | | | | | |
| 11,472 | | | 735 | | | | 3,405 | | | | 574 | | | | 2,311 | | | | 1,464 | | | | 19,961 | | | | 11,880 | | | | 668 | | | | 3,635 | | | | 1,097 | | | | 2,363 | | | | 1,754 | | | | 21,397 | |
| 11,477 | | | 886 | | | | 3,128 | | | | 446 | | | | 1,754 | | | | 1,297 | | | | 18,988 | | | | 11,472 | | | | 735 | | | | 3,405 | | | | 574 | | | | 2,311 | | | | 1,464 | | | | 19,961 | |
| 38 | | | — | | | | 1,776 | | | | — | | | | 17 | | | | — | | | | 1,831 | | | | 41 | | | | — | | | | 1,759 | | | | — | | | | 11 | | | | — | | | | 1,811 | |
| 34 | | | — | | | | 1,825 | | | | — | | | | 22 | | | | — | | | | 1,881 | | | | 38 | | | | — | | | | 1,776 | | | | — | | | | 17 | | | | — | | | | 1,831 | |
| | | | | | | | | | | | | | | |
102 Royal Dutch/Shell Group of Companies
Standardised measure of discounted future cash flowsa
United States accounting principles require the disclosure of a standardised measure of discounted future cash flows, relating to proved oil and gas reserve quantities and based on prices and costs at the end of each year, currently enacted tax rates and a 10% annual discount factor. The information so calculated does not provide a reliable measure of future cash flows from proved reserves, nor does it permit a realistic comparison to be made of one entity with another because the assumptions used cannot reflect the varying circumstances within each entity. In addition, a substantial but unknown proportion of future real cash flows from oil and gas production activities is expected to derive from reserves which have already been discovered, but which cannot yet be regarded as proved.
| | | | | | | | | | | | | | | | | | | | | | | | | | | | | |
| | | $ million | |
| | | 2004 | |
| | | Eastern Hemisphere | | | Western Hemisphere | | | | |
| | | | | | | | | | | Asia | | | Middle East, | | | | | | | | | | |
| | | Europe | | | Africac | | | Pacificd | | | Russia, CISe | | | USA | | | Other | | | Total | |
| |
Group companies | | | | | | | | | | | | | | | | | | | | | | | | | | | | |
| Future cash inflows | | | 107,956 | | | | 47,326 | | | | 26,461 | | | | 51,565 | | | | 33,525 | | | | 12,578 | | | | 279,411 | |
| Future production costs | | | 29,641 | | | | 13,354 | | | | 4,882 | | | | 10,020 | | | | 5,354 | | | | 3,600 | | | | 66,851 | |
| Future development costs | | | 11,778 | | | | 4,928 | | | | 3,669 | | | | 10,216 | | | | 1,841 | | | | 834 | | | | 33,266 | |
| Future tax expenses | | | 34,635 | | | | 16,831 | | | | 6,147 | | | | 14,031 | | | | 9,860 | | | | 2,074 | | | | 83,578 | |
| |
| Future net cash flows | | | 31,902 | | | | 12,213 | | | | 11,763 | | | | 17,298 | | | | 16,470 | | | | 6,070 | | | | 95,716 | |
| Effect of discounting cash flows at 10% | | | 14,925 | | | | 4,037 | | | | 5,270 | | | | 11,375 | | | | 5,803 | | | | 2,007 | | | | 43,417 | |
| |
Standardised measure of discounted future net cash flows | | | 16,977 | | | | 8,176 | | | | 6,493 | | | | 5,923 | | | | 10,667 | | | | 4,063 | | | | 52,299 | |
| |
Group share of associated companies | | | | | | | | | | | | | | | | | | | | | | | | | | | 5,527 | |
| |
Minority interests | | | — | | | | 180 | | | | 36 | | | | 1,078 | | | | — | | | | 548 | | | | 1,842 | |
| |
Change in standardised measure of Group companies discounted future net cash flows relating to proved Oil and Natural Gas Reservesa,b
| | | | | | | | | | | | | |
| | | $ million | |
| | | | | | | 2003 | | | 2002 | |
| | | 2004 | | | As restated | | | As restated | |
| |
At January 1 | | | 48,172 | | | | 55,160 | | | | 37,910 | |
| Net changes in prices and production costs | | | 23,524 | | | | 12,178 | | | | 34,592 | |
| Extensions, discoveries and improved recovery | | | 6,223 | | | | 9,255 | | | | 5,177 | |
| Purchases and sales of minerals in place | | | (564 | ) | | | (2,558 | ) | | | 7,319 | |
| Revisions of previous reserve estimates | | | (385 | ) | | | (4,103 | ) | | | 375 | |
| Development cost related to future production | | | (6,829 | ) | | | (14,291 | ) | | | (6,168 | ) |
Sales and transfers of oil and natural gas, net of production costsf | | | (27,530 | ) | | | (24,892 | ) | | | (20,387 | ) |
| Development cost incurred during the year | | | 9,386 | | | | 8,205 | | | | 6,503 | |
| Accretion of discount | | | 7,947 | | | | 9,051 | | | | 6,053 | |
| Net change in income tax | | | (7,645 | ) | | | 167 | | | | (16,214 | ) |
| |
At December 31 | | | 52,299 | | | | 48,172 | | | | 55,160 | |
| |
| a | | A summary of the changes is shown on the tables on page 97. |
| |
| b | | The weighted average year-end spot oil price in 2004 was $37.61/bbl ($26.52/bbl in 2003, $24.49/bbl in 2002) and the weighted average year-end spot gas price in 2004 was $21.27/boe ($18.03/boe in 2003, $15.75/boe in 2002). |
| |
| c | | Excludes Egypt. |
| |
| d | | Excludes Sakhalin. |
| |
| e | | Middle East and former Soviet Union/Commonwealth of Independent States. Includes Caspian region, Egypt and Sakhalin. |
| |
| f | | Includes a transfer of proved developed reserves from Group to associated companies of 360 million barrels in 2004 ($260 million). |
Additional information concerning proved reserves
Proved reserves can be either developed or undeveloped. Group proved reserves at December 31, 2004 were divided into 58% developed and 42% undeveloped on a barrel of oil equivalent basis.
Proved reserves are recognised under various forms of contractual agreements. Group proved reserves volumes present in agreements such as Production Sharing Contracts or other forms of economic entitlement contracts where Group share of reserves can vary with actual year-end price are approximately 859 million barrels of crude oil and natural gas liquids and 9,720 thousand million standard cubic feet of gas.
Supplementary information – Oil and Gas (unaudited) 103
| | | | | | | | | | | | | | | | | | | | | | | | | | | | | | | | | | | | | | | | | | | | | | | | | | | | | |
| $ million | | | $ million | |
| 2003 | | | 2002 | |
| As restated | | | As restated | |
| Eastern Hemisphere | | | Western Hemisphere | | | Eastern Hemisphere | | | Western Hemisphere | | | | |
| | | | | | | Asia | | | Middle East, | | | | | | | | | | | | | | | | | | | | | | | Asia | | | Middle East, | | | | | | | | | | |
| Europe | | Africac | | | Pacificd | | | Russia, CISe | | | USA | | | Other | | | Total | | | Europe | | | Africac | | | Pacificd | | | Russia, CISe | | | USA | | | Other | | | Total | |
| | | | | | | | | | | | | | | |
| 108,836 | | | 36,965 | | | | 21,695 | | | | 42,627 | | | | 31,203 | | | | 14,710 | | | | 256,036 | | | | 98,126 | | | | 36,427 | | | | 22,243 | | | | 36,513 | | | | 32,541 | | | | 16,280 | | | | 242,130 | |
| 20,241 | | | 6,347 | | | | 4,365 | | | | 7,579 | | | | 4,949 | | | | 4,156 | | | | 47,637 | | | | 18,721 | | | | 5,034 | | | | 3,563 | | | | 5,174 | | | | 4,841 | | | | 3,673 | | | | 41,006 | |
| 6,541 | | | 4,661 | | | | 2,528 | | | | 9,679 | | | | 3,085 | | | | 1,315 | | | | 27,809 | | | | 4,783 | | | | 4,670 | | | | 2,397 | | | | 2,844 | | | | 3,201 | | | | 1,532 | | | | 19,427 | |
| 39,605 | | | 16,396 | | | | 4,076 | | | | 15,309 | | | | 8,467 | | | | 2,469 | | | | 86,322 | | | | 32,125 | | | | 18,690 | | | | 4,538 | | | | 17,443 | | | | 9,103 | | | | 3,447 | | | | 85,346 | |
| | | | | | | | | | | | | | | |
| 42,449 | | | 9,561 | | | | 10,726 | | | | 10,060 | | | | 14,702 | | | | 6,770 | | | | 94,268 | | | | 42,497 | | | | 8,033 | | | | 11,745 | | | | 11,052 | | | | 15,396 | | | | 7,628 | | | | 96,351 | |
| 21,126 | | | 4,210 | | | | 4,590 | | | | 8,491 | | | | 5,170 | | | | 2,509 | | | | 46,096 | | | | 19,511 | | | | 3,601 | | | | 5,343 | | | | 4,166 | | | | 5,427 | | | | 3,143 | | | | 41,191 | |
| | | | | | | | | | | | | | | |
| 21,323 | | | 5,351 | | | | 6,136 | | | | 1,569 | | | | 9,532 | | | | 4,261 | | | | 48,172 | | | | 22,986 | | | | 4,432 | | | | 6,402 | | | | 6,886 | | | | 9,969 | | | | 4,485 | | | | 55,160 | |
| | | | | | | | | | | | | | | |
| | | | | | | | | | | | | | | | | | | | | | | | 5,501 | | | | | | | | | | | | | | | | | | | | | | | | | | | | 5,600 | |
| | | | | | | | | | | | | | | |
| — | | | 136 | | | | 30 | | | | (1,186 | ) | | | — | | | | 547 | | | | (473 | ) | | | — | | | | 123 | | | | 22 | | | | 753 | | | | — | | | | 468 | | | | 1,366 | |
| | | | | | | | | | | | | | | |
104 Royal Dutch Petroleum Company
Report of the Supervisory Board
to the shareholders
Proposal to unify Royal Dutch and Shell Transport
As announced on October 28, 2004, the Supervisory Board and Board of Management of Royal Dutch and the Board of Directors of Shell Transport, unanimously agreed, in principle, to propose to shareholders the unification of the Royal Dutch/Shell Group of Companies under a single parent company, Royal Dutch Shell plc. The Boards believe that implementation of these proposals will strengthen the Group and deliver significant benefits through greater clarity of governance and streamlined decision making with clear lines of authority and an empowered Chief Executive. The proposals will be put forward to the shareholders at the General Meeting on June 28, 2005. Further information, including the full offer documentation, is available at www.shell.com/unification.
Members of the Supervisory Board and Managing Directors
Having reached the age limit prescribed by the Articles of Association, Henny de Ruiter retired as a member of the Supervisory Board on June 30, 2004. Mr De Ruiter was appointed to the Supervisory Board in 1994. At the General Meeting of Shareholders held on June 28, 2004, the Chairman of the Supervisory Board and the shareholders paid tribute to Mr De Ruiter for his outstanding service to the Company and the Royal Dutch/Shell Group over a 48-year period, during which he served 11 years as Managing Director of the Company and 10 years as member of the Supervisory Board.
At the same General Meeting, Christine Morin-Postel, former Chief Executive and Chairman of the Management Committee of Société Générale de Belgique as well as Executive Vice-President of Suez, was appointed to the Supervisory Board.
In addition, Maarten van den Bergh, retiring in accordance with the schedule of rotation, was re-appointed as a member of the Supervisory Board and Linda Cook was appointed as a Managing Director of the Company with effect from August 1, 2004.
Malcolm Brinded resigned as a Managing Director of the Company on March 3, 2004, and was appointed as a Managing Director of Shell Transport on the same date.
Walter van de Vijver resigned as a Managing Director of the Company on March 3, 2004.
Meetings of the Supervisory Board
During 2004, the Supervisory Board met 13 times to discuss and, where appropriate, adopt resolutions on issues relating to the Company. Most of the meetings were attended by the Board of Management. The Managing Directors did not attend when their performance, remuneration or succession were discussed. The Supervisory Board also reviewed its own performance and that of its individual members as well as its profile, composition and competence.
In addition, the members of the Supervisory Board met 17 times in the Conference with the Managing Directors of the Company and the Directors of Shell Transport. The purpose of the Conference is described on page 118. Topics of discussion at the Conference included the strategic direction of the Group’s businesses, as well as governance, business risks and internal control of Group companies.
The Dutch corporate governance code
All Supervisory Board members are independent within the meaning of the Dutch corporate governance code, except Maarten van den Bergh, who retired as a Managing Director of the Company in 2000 and also serves as a director on the Boards of the Group Holding Companies. Further information about the individual members of the Supervisory Board is provided on pages 6 and 7. Memberships of the Group Audit Committee and the Remuneration and Succession Review Committee can be found on page 119 and 122 respectively. For information in respect of the remuneration policy of the Company, reference is made to the Remuneration Report on pages 121 to 132.
Annual Accounts
We herewith submit the Annual Accounts as drawn up today by the Board of Management and approved by the Supervisory Board, which are accompanied by the other information to be attached thereto by virtue of the law and the Annual Report drawn up by the Board of Management. The Annual Accounts comprise the following documents as signed by each of the Managing Directors and the members of the Supervisory Board:
| 1 | | the Balance Sheet as at December 31, 2004;
|
| |
| 2 | | the Profit and Loss Account for the year 2004; and |
| |
| 3 | | the Notes to the Balance Sheet and the Profit and Loss Account, including the Netherlands GAAP Financial Statements of the Royal Dutch/Shell Group of Companies as presented on pages 83 to 85 and the Notes thereto as presented on pages 52 to 81 and 86 to 91 of this report. |
On the basis of these Annual Accounts we propose:
| a | | that the Balance Sheet as at December 31, 2004, the Profit and Loss Account for the year 2004 and the Notes to the Balance Sheet and the Profit and Loss Account, including the Netherlands GAAP Financial Statements of the Royal Dutch/Shell Group of Companies as presented on pages 83 to 85 and the Notes thereto as presented on pages 52 to 81 and 86 to 91 be finalised in accordance with the attached Accounts; |
| |
| b | | that it be resolved that the interim dividend of€0.75 made payable in September 2004 and the second interim dividend of€1.04 made payable in March 2005 will together constitute the total dividend for 2004 on each of the ordinary shares outstanding and that the remaining amount of undistributed profit be carried forward to reserves; |
| |
| c | | that the Managing Directors be discharged of responsibility in respect of their management for the year 2004; and |
| |
| d | | that the members of the Supervisory Board be discharged of responsibility for their supervision for the year 2004. |
| | | | | |
The Hague
April 27, 2005
The Supervisory Board | | | | /s/ Aad Jacobs
Aad Jacobs
Chairman |
Annual Report 105
Annual Report
Activities of the Company
Royal Dutch Petroleum Company (Royal Dutch) is a holding company which, in conjunction with The “Shell” Transport and Trading Company, p.l.c. (Shell Transport), a UK company, owns, directly or indirectly, investments in the numerous companies of the Royal Dutch/Shell Group. Royal Dutch has an interest of 60% in the Group and Shell Transport an interest of 40%.
The assets and income of the Company consist mainly of its interest in the net assets and its share in the net income of the Royal Dutch/ Shell Group of Companies.
Annual Accounts
Translated into euros, Royal Dutch’s share in the net income of the Royal Dutch/Shell Group of Companies for 2004 amounts to€8,712 million. The dividend distributed and yet to be distributed to Royal Dutch was€3,842 million. The share in the net income for 2003 amounted to€6,411 million (as restated).
When administrative expenses have been deducted and interest income has been added, profit after taxation for the year 2004 amounts to€8,713 million, compared with€6,418 million (as restated) for 2003.
Royal Dutch’s 60% interest in the Group net assets, expressed in dollars, has been translated into euros at the year-end rate. The amount thus obtained should be regarded as a reflection of the dollar value of Royal Dutch’s interest in the Group assets and liabilities.
Share buyback
The General Meeting of Shareholders held on June 28, 2004, adopted a proposal to reduce the Company’s issued share capital by€994,000 by cancellation of 1,775,000 ordinary shares which the Company had acquired between the General Meeting of April 23, 2003, and the General Meeting held on June 28, 2004, under the share buyback programme. This cancellation was effected on November 10, 2004.
The General Meeting of Shareholders renewed the authorisation of the Board of Management, with effect from July 1, 2004, for a period of 18 months, for the acquisition by the Company, with due observance of the statutory provisions and for its own account, of shares in its capital up to a maximum of 10% of the issued capital.
Such shares can be acquired on the stock exchange or otherwise at a price between an amount equal to the par value of the shares and an amount equal to 110% of the opening price quoted for shares of the Company at Euronext Amsterdam on the day of the acquisition or, in the absence of such a price, the last previous price quoted there.
In 2004 the Company repurchased a total of 9.1 million shares.
It will be proposed to the General Meeting of Shareholders to be held on June 28, 2005, to cancel the shares acquired by the Company in the period between the General Meetings in 2004 and 2005 and to renew the authorisation of the Board of Management for the acquisition by the Company of its own shares for a period of 18 months with effect from July 1, 2005.
Since the beginning of the programme until April 22, 2005, a total number of 74,776,352 ordinary shares were acquired by the Company, of which 62,571,352 have been cancelled.
Proxy voting
The Company continued to enable shareholders, including those participating in the Shareholders’ Communication Channel (Communicatiekanaal Aandeelhouders) or holding registered shares in the Netherlands or in the USA, to participate in the decision-making process without being present at the General Meeting, by means of a voting instruction form. This allowed the shareholders to state how they wished their votes to be cast per agenda item. In 2004, 27% of the issued capital was present or represented at the General Meeting, 89% thereof was represented in this manner.
Risk management and internal control systems
With the exception of weaknesses identified in the controls relating to reserves bookings referred to in the paragraph about risk management and internal control on page 120 of the Corporate governance section, the Board of Management considers that the internal risk management and control system, which is designed to provide reasonable but not absolute assurance of achieving business objectives, is adequate and appropriate.
Royal Dutch/Shell Group of Companies
For information on the Royal Dutch/Shell Group of Companies, reference may be made to the Message to shareholders (pages 2 and 3) and the Operational and Financial Review (pages 10 to 47), which form part of this Annual Report.
Proposal to unify Royal Dutch and Shell Transport
As announced on October 28, 2004, the Supervisory Board and Board of Management of Royal Dutch and the Board of Directors of Shell Transport, unanimously agreed, in principle, to propose to shareholders the unification of the Royal Dutch/Shell Group of Companies under a single parent company, Royal Dutch Shell plc. The proposals will be put forward to the shareholders at the General Meeting on June 28, 2005. Information about this proposal, including the full offer documentation, is available on www.shell.com/unification.
The Hague
April 27, 2005
The Board of Management
| | | | | |
/s/ Jeroen van der Veer
Jeroen van der Veer
President
| | /s/ Linda Cook
Linda Cook
Managing Director
| | /s/ Rob Routs
Rob Routs
Managing Director
|
106 Royal Dutch Petroleum Company
Annual Accounts
Profit and Loss Account
| | | | | | | | | | | | | | | | | |
| | | | | | | € million | |
| | | | | | | | | | | 2003 | | | 2002 | |
| | | Note | | | 2004 | | | As restated | | | As restated | |
| |
| Share in the net income of companies of the Royal Dutch/Shell Group from continuing operations | | | | | | | 7,958 | | | | 6,398 | | | | 5,957 | |
| Share in the net income of companies of the Royal Dutch/Shell Group from discontinued operations | | | 2 | | | | 754 | | | | 13 | | | | 119 | |
| Share in the net income of companies of the Royal Dutch/Shell Group | | | 4 | | | | 8,712 | | | | 6,411 | | | | 6,076 | |
lessAdministrative expenses | | | | | | | 8 | | | | 8 | | | | 5 | |
| |
| | | | | | | | 8,704 | | | | 6,403 | | | | 6,071 | |
| Interest income | | | | | | | 10 | | | | 18 | | | | 28 | |
| |
| Profit before taxation | | | | | | | 8,714 | | | | 6,421 | | | | 6,099 | |
lessTaxation | | | 5 | | | | 1 | | | | 3 | | | | 8 | |
| |
Profit after taxation | | | | | | | 8,713 | | | | 6,418 | | | | 6,091 | |
| |
Statement of Appropriation of Profit
| | | | | | | | | | | | | | | | | |
| | | | | | | € million | |
| | | | | | | | | | | 2003 | | | 2002 | |
| | | Note | | | 2004 | | | As restated | | | As restated | |
| |
| Profit after taxation | | | | | | | 8,713 | | | | 6,418 | | | | 6,091 | |
| Taken from/(to) Statutory investment reserve | | | 6 | | | | (4,870 | ) | | | (3,543 | ) | | | (2,759 | ) |
| Undistributed profit at beginning of year | | | | | | | 2,909 | | | | 3,650 | | | | 4,712 | |
| Final dividend distributed | | | | | | | (2,125 | ) | | | (2,084 | ) | | | (2,042 | ) |
| (Repurchase)/cancellation of share capital | | | | | | | (375 | ) | | | 9 | | | | (847 | ) |
| Unclaimed dividends forfeited | | | | | | | 1 | | | | 1 | | | | 1 | |
| |
| Available for distribution | | | | | | | 4,253 | | | | 4,451 | | | | 5,156 | |
| |
lessInterim dividenda | | | | | | | 1,562 | | | | 1,542 | | | | 1,506 | |
| |
Undistributed profit at end of yearb | | | | | | | 2,691 | | | | 2,909 | | | | 3,650 | |
| |
| a | | Including 4% cumulative preference dividend for 2004 amounting to€ 26,880 on priority shares (2003:€ 26,880; 2002:€ 26,880). |
| |
| b | | Before second interim dividend of€ 2,165 million (second interim dividend 2003:€ 2,125 million; final dividend 2002:€ 2,084 million). |
Earnings per share
| | | | | | | | | | | | | | | | | |
| | | | | | | € | |
| | | | | | | | | | | 2003 | | | 2002 | |
| | | Note | | | 2004 | | | As restated | | | As restated | |
| |
| Basic earnings per ordinary share from continuing operations | | | | | | | 3.94 | | | | 3.14 | | | | 2.90 | |
| Basic earnings per ordinary share from discontinued operations | | | | | | | 0.37 | | | | 0.01 | | | | 0.06 | |
| |
Basic earnings per ordinary share | | | 13 | | | | 4.31 | | | | 3.15 | | | | 2.96 | |
| |
| Diluted earnings per ordinary share from continuing operations | | | | | | | 3.93 | | | | 3.14 | | | | 2.90 | |
| Diluted earnings per ordinary share from discontinued operations | | | | | | | 0.37 | | | | 0.01 | | | | 0.06 | |
| |
Diluted earnings per ordinary share | | | 13 | | | | 4.30 | | | | 3.15 | | | | 2.96 | |
| |
Annual Accounts 107
Balance Sheet(before appropriation of profit)
| | | | | | | | | | | | | |
| | | | | | | € million | |
| | | | | | | | | | | Dec 31, | |
| | | | | | | Dec 31, | | | 2003 | |
| | | Note | | | 2004 | | | As restated | |
| |
Fixed assets | | | | | | | | | | | | |
| Financial fixed assets | | | | | | | | | | | | |
| Investments in companies of the Royal Dutch/Shell Group | | | 6 | | | | 37,018 | | | | 34,349 | |
| Investment in associated company | | | 7 | | | | 179 | | | | — | |
Current assets | | | | | | | | | | | | |
| Receivables | | | | | | | | | | | | |
| Dividends receivable from companies of the Royal Dutch/Shell Group | | | | | | | 2,130 | | | | 2,449 | |
| Other receivables from companies of the Royal Dutch/Shell Group | | | | | | | 44 | | | | 363 | |
| Other receivables | | | 8 | | | | 35 | | | | 36 | |
| Cash and cash equivalents | | | | | | | 252 | | | | 8 | |
| |
| | | | | | | | 2,461 | | | | 2,856 | |
| |
Current liabilities | | | | | | | | | | | | |
| Other liabilities | | | 9 | | | | 13 | | | | 10 | |
| |
Current assets less current liabilities | | | | | | | 2,448 | | | | 2,846 | |
| |
Total assets less current liabilities | | | | | | | 39,645 | | | | 37,195 | |
| |
Shareholders’ equity | | | | | | | | | | | | |
| Paid-up capital | | | 10 | | | | | | | | | |
| Ordinary shares | | | | | | | 1,165 | | | | 1,166 | |
| Priority shares | | | | | | | 1 | | | | 1 | |
| |
| | | | | | | | 1,166 | | | | 1,167 | |
| |
| Share premium reserve | | | | | | | 1 | | | | 1 | |
| Investment reserves | | | 6 | | | | | | | | | |
| Statutory | | | | | | | 25,185 | | | | 22,707 | |
| Currency translation differences | | | | | | | 1,848 | | | | 486 | |
| Other | | | | | | | 8,739 | | | | 9,910 | |
| |
| | | | | | | | 35,772 | | | | 33,103 | |
| Other statutory reserves | | | 11 | | | | 15 | | | | 15 | |
| Undistributed profit | | | | | | | 2,691 | | | | 2,909 | |
| |
| | | | | | | | 39,645 | | | | 37,195 | |
| |
Statement of Cash Flows
| | | | | | | | | | | | | |
| | | € million | |
| | | 2004 | | | 2003 | | | 2002 | |
| |
Returns on investments and servicing of finance | | | | | | | | | | | | |
| Dividends received from Group companies | | | 4,162 | | | | 3,401 | | | | 4,446 | |
| Interest received | | | 10 | | | | 18 | | | | 32 | |
| Other | | | 315 | | | | 212 | | | | (587 | ) |
| |
Net cash inflow/(outflow) from returns on investments and servicing of finance | | | 4,487 | | | | 3,631 | | | | 3,891 | |
| |
Taxation | | | | | | | | | | | | |
| Tax (paid)/recovered | | | (1 | ) | | | (4 | ) | | | (8 | ) |
Financing | | | | | | | | | | | | |
| Repurchase of share capital, including expenses | | | (376 | ) | | | — | | | | (889 | ) |
| Investment in associated company | | | (179 | ) | | | — | | | | — | |
| Dividends paid | | | (3,687 | ) | | | (3,626 | ) | | | (3,536 | ) |
| |
Increase/(decrease) in cash and cash equivalents | | | 244 | | | | 1 | | | | (542 | ) |
| |
| Cash at January 1 | | | 8 | | | | 7 | | | | 549 | |
| |
| Cash at December 31 | | | 252 | | | | 8 | | | | 7 | |
| |
108 Royal Dutch Petroleum Company
Notes to the Annual Accounts
1 The Company
Royal Dutch, one of the Parent Companies of the Royal Dutch/Shell Group of Companies (the Group), is a holding company which, in conjunction with Shell Transport, owns, directly or indirectly, investments in the numerous companies known collectively as the Royal Dutch/Shell Group of Companies.
The Netherlands GAAP Financial Statements of the Royal Dutch/Shell Group of Companies as presented on pages 83 to 85 and the Notes thereto on pages 52 to 81, 86 to 91 form part of the Notes to the Annual Accounts.
Arrangements between Royal Dutch and Shell Transport provide,inter alia, that notwithstanding variations in shareholdings, Royal Dutch and Shell Transport shall share in the aggregate net assets and in the aggregate dividends and interest received from Group companies in the proportion of 60:40, respectively. It is further arranged that the burden of all taxes in the nature of, or corresponding to, an income tax leviable in respect of such dividends and interest shall fall in the same proportion.
Unification Proposal
On October 28, 2004, the Royal Dutch and Shell Transport Boards announced that they had unanimously agreed, in principle, to propose to their shareholders a transaction (the “Transaction”) through which each Parent Company will become a subsidiary of Royal Dutch Shell plc, which will become a publicly-listed company incorporated in England and Wales and headquartered and tax resident in the Netherlands (“Royal Dutch Shell”). Reflecting the existing 60:40 ownership by Royal Dutch and Shell Transport of the Group, it is proposed that Royal Dutch shareholders will be offered 60% of the ordinary share capital in Royal Dutch Shell and Shell Transport shareholders will receive 40% of the ordinary share capital in Royal Dutch Shell. To implement the proposal, it is intended that (i) Royal Dutch Shell will make an offer to acquire all of the issued and outstanding ordinary shares of Royal Dutch in exchange for Royal Dutch Shell Class A ordinary shares or American depositary shares (“ADSs”) representing Royal Dutch Shell Class A ordinary shares and (ii) Royal Dutch Shell will become the parent company of Shell Transport pursuant to a United Kingdom reorganisational procedure referred to as a “scheme of arrangement” under section 425 of the UK Companies Act 1985, as amended. As a result of the scheme of arrangement, holders of Shell Transport Ordinary shares (and holders of Shell Transport bearer warrants) will receive Royal Dutch Shell Class B ordinary shares and holders of Shell Transport ADSs will receive ADSs representing Royal Dutch Shell Class B ordinary shares. The Class A ordinary shares and Class B ordinary shares will have identical voting rights and will vote together as a single class on all matters, including the election of directors, unless a matter affects the rights of one class as a separate class. Class A ordinary shares and Class B ordinary shares will have identical rights upon a liquidation of Royal Dutch Shell, and dividends declared on each will be equivalent in amount. However, for tax purposes, holders of Class A ordinary shares will receive Dutch source dividends, while holders of Class B ordinary shares will receive dividends that are UK source to the extent that these dividends are paid through a dividend access mechanism to be established. Implementation of the Transaction will be the subject of appropriate consultation with relevant employee representative bodies as required as well as the satisfaction of certain other conditions. It is currently expected that the Transaction will be completed in July 2005.
2 Accounting principles
The Annual Accounts of Royal Dutch include the Netherlands GAAP Financial Statements of the Royal Dutch/Shell Group of Companies. These Annual Accounts have been prepared in accordance with legal requirements and generally accepted accounting principles in the Netherlands.
The Financial Statements of Royal Dutch are reported in euros, while the Netherlands GAAP Financial Statements of the Royal Dutch/Shell Group of Companies are reported in US dollars. Notes 4, 6 and 13 to these Financial Statements contain currency translations of certain items presented in US dollars in the Netherlands GAAP Financial Statements of the Royal Dutch/Shell Group of Companies into euros.
References are made to the Netherlands GAAP Financial Statements of the Royal Dutch/Shell Group of Companies in these Notes to facilitate an understanding of the relationships between the Financial Statements of Royal Dutch and the Netherlands GAAP Financial Statements of the Royal Dutch/Shell Group of Companies, particularly as they relate to Royal Dutch’s 60% interest in net income and net assets of companies of the Royal Dutch/Shell Group of Companies.
The investments in and the share in the net income of companies of the Royal Dutch/Shell Group are accounted for by the equity method (see also Notes 4 and 6). Accounting principles used
Notes to the Annual Accounts 109
by the Group are given in Note 31 to the Netherlands GAAP Financial Statements of the Royal Dutch/Shell Group of Companies on page 86. Investments in associated companies are accounted for by the equity method.
Current assets and liabilities are stated at their nominal value. Assets and liabilities in foreign currencies are translated into euros at year-end rates of exchange, whereas results for the year are translated at average rates. For the Profit and Loss Account euros are translated from US dollars at the weighted average rate of exchange. Currency translation differences arising from translating the investments in companies of the Royal Dutch/Shell Group are taken to Investment reserves (see Note 6).
Administrative expenses, Interest income and Taxation are stated at the amounts attributable to the respective financial years.
The Group separately reports income from discontinued operations (see Notes 4 and 32 to the Financial Statements of the Royal Dutch/Shell Group of Companies). As a consequence, the Company also separately reports its share in the net income of discontinued operations of companies of the Royal Dutch/Shell Group and the basic and diluted earnings per ordinary share from discontinued operations. Amounts reported in previous years have been reclassified. Royal Dutch’s share in the net income of companies of the Royal Dutch/Shell Group from discontinued operations amounted to€13 million in 2003 (2002:€119 million). These amounts are based on Royal Dutch’s 60% share in the Net Income from discontinued operations of companies of the Royal Dutch/Shell Group of $25 million in 2003 (2002: $187 million) translated into euros at the average rate of exchange for the year of $1 =€0.90 (2002: $1 =€1.06). Under a 2002 EU Regulation, publicly-listed companies in the European Union will be required to prepare consolidated financial statements in accordance with International Financial Reporting Standards (IFRS) from 2005. The 2005 Financial Statements of the Group or, subject to completion of the Transaction described in Note 1, of its successor, will be prepared under IFRS and will include comparative data for 2004, together with reconciliations to opening balances as at January 1, 2004 and to 2004 data previously published in accordance with accounting principles generally accepted in the United States (US GAAP). With effect from January 1, 2005 Royal Dutch intends to prepare its consolidated Financial Statements under International Financial Reporting Standards.
3 Restatement of previously issued Financial Statements
First Reserves Restatement
On January 9, 2004, the Group announced the removal from proved reserves of approximately 3.9 billion barrels of oil equivalent (boe) of oil and natural gas that were originally reported as of December 31, 2002. As a result of further field level reviews concluded in April 2004 with the assistance of external petroleum consultants of over 90% of the Group’s proved reserves volumes (collectively, the First Half Review), the Group determined to increase the total volume of reserves to be removed from the proved category to 4.47 billion boe and to restate the unaudited oil and natural gas reserves disclosures contained in the supplementary information accompanying the Financial Statements (the First Reserves Restatement) to give effect to the removal of these volumes as of the earliest date on which they did not represent “proved reserves” within the applicable rules of the Securities and Exchange Commission (SEC) (which in many cases is the date on which the volumes were initially booked as proved reserves). 12% of the volumes de-booked as of December 31, 2002 as part of the First Reserves Restatement had been in the proved developed reserves category and 88% had been categorised as proved undeveloped reserves. The effects of the First Reserves Restatement were reflected in the 2003 Annual Report and Accounts and the 2003 Annual Report on Form 20-F as originally filed with the SEC on June 30, 2004.
Following the January 9, 2004 announcement of the initial reserves recategorisation, the Group Audit Committee (GAC) appointed Davis Polk & Wardwell to lead an independent review of the facts and circumstances surrounding the recategorisation, and to report its findings and any proposed remedial actions to the GAC for its consideration. Based largely on the Davis Polk & Wardwell report, the Parent Companies, Royal Dutch and Shell Transport, determined that the principal causes that permitted the initial booking and maintenance of the volumes impacted by the First Reserves Restatement as proved reserves are as follows:
| – | | the Group’s guidelines for booking proved reserves were inadequate in several respects, including (i) containing inconsistencies with the SEC’s rules and published guidance relating to proved reserves and (ii) failing to clearly and sufficiently impart these requirements and guidance to users of the guidelines. In addition, users of the guidelines in certain cases misapplied or disregarded SEC rules and published |
110 Royal Dutch Petroleum Company
3 Restatement of previously issued Financial Statementscontinued
| | | guidance and in some cases only applied changes in the guidelines prospectively rather than retrospectively. There was also insufficient knowledge and training among users of the guidelines of the SEC requirements relating to proved reserves; |
| |
| – | | executives and employees encouraged the booking of proved reserves, while discouraging the de-booking of previously booked reserves. This fostered an atmosphere that failed to emphasise the paramount importance of the compliance element of proved reserves decisions; and |
| |
| – | | there were other material weaknesses in the Group’s controls relating to the booking of proved reserves, including insufficient resources allocated to the Group Reserves Auditor and Group Reserves Co-ordinator functions, a lack of clarity in the allocation of responsibilities between the Group Reserves Auditor and the Group Reserves Co-ordinator and a lack of direct reporting responsibility of the Group Reserves Auditor to the Group internal audit function and of the business Chief Financial Officers to the Group Chief Financial Officer. |
Second Reserves Restatement
On February 3, 2005, as a result of reservoir level reviews conducted during July 2004 through December 2004 of substantially all of the Group’s proved reserves volumes reported as at December 31, 2003 (collectively, the Second Half Review), the Group announced that it would remove from proved reserves an additional 1,371 million boe of oil and natural gas that were reported as at December 31, 2003 and further restate the unaudited oil and natural gas reserves disclosures contained in the supplementary information accompanying the Financial Statements of the Group (the Second Reserves Restatement and, together with the First Reserves Restatement, the Reserves Restatements) to give effect to the removal of these volumes as of the earliest date on which they did not represent “proved reserves” within the applicable rules of the SEC (which in many cases is the date on which the volumes were initially booked as proved reserves). 43% of the volumes de-booked as of December 31, 2003 as part of the Second Reserves Restatement had been categorised as proved developed reserves and 57% had been categorised as proved undeveloped reserves. The effects of the Second Reserves Restatement are reflected in the comparative periods presented in the Financial Statements of the Group, Royal Dutch and Shell Transport. These effects were also reflected in Amendment No. 2 to the 2003 Annual Report on Form 20-F, as filed with the SEC on March 7, 2005.
Second Financial Restatement
In view of the inappropriate overstatement of unaudited proved reserves information resulting in the Second Reserves Restatement, it was determined to restate the Financial Statements of the Group and each of the Parent Companies for the year ended December 31, 2003 and prior periods (the Second Financial Restatement) to reflect the impact of the Second Reserves Restatement on those Financial Statements (as announced on February 3, 2005). This overstatement of unaudited proved reserves information had the effect of understating the depreciation, depletion and amortisation charges in the Financial Statements of the Group related to Exploration & Production in each of the years covered by the Second Financial Restatement. As capitalised costs relating to Exploration & Production were amortised across fewer proved reserves (following the Second Reserves Restatement), depreciation, depletion and amortisation associated with annual production volumes increased proportionally.
The effect on profit after taxation and the Shareholders’ equity of Royal Dutch, is as follows:
| | | | | | | | | | | | | |
| | | | | | | | | | | $ million | |
| | | Profit after taxation | | | Shareholders’ equity | |
| | | 2003 | | | 2002 | | | Dec 31, 2003 | |
| |
| As previously reported | | | 6,520 | | | | 6,108 | | | | 37,362 | |
| |
| Second Reserves Restatement | | | (100 | ) | | | (42 | ) | | | (166 | ) |
| Currency Translation effect | | | (2 | ) | | | 25 | | | | (1 | ) |
| |
As restated | | | 6,418 | | | | 6,091 | | | | 37,195 | |
| |
4 Share in the net income of companies of the Royal Dutch/Shell Group
As shown in Note 38 to the Netherlands GAAP Financial Statements of the Royal Dutch/Shell Group of Companies, net income of the Royal Dutch/Shell Group included in the Profit and Loss Account has been calculated as 60% of the net income of the Royal Dutch/Shell Group as presented in the Netherlands GAAP Financial Statements of the Royal Dutch/Shell Group on pages 83 to 85. The Royal Dutch share in the net income of the Royal Dutch/Shell Group amounts to€8,712 million, the equivalent of $10,818 million (2003:€6,411 million, the equivalent of $7,134 million as restated). Net income has been translated into euros using the weighted average rate of exchange for the year.
The dividend for 2004 distributed and yet to be distributed by Group companies to Royal Dutch amounted to€3,842 million, the equivalent of $4,793 million (2003:€2,868 million, the equivalent of $3,396 million).
5 Taxation
The effective tax rate in 2004 was 0% (2003: 0%), as against a statutory corporate income tax rate in the Netherlands of 34.5%. This difference is attributable almost entirely to the participation exemption in the Dutch Corporate Income Tax Act, which exemption applies generally to any benefits, including dividends, derived from subsidiaries that have been subject to a tax on income.
6 Investments and reserves
The 60% interest of Royal Dutch in Group net assets of€37,018 million (2003:€34,349 million) is equal to the interest attributable to Royal Dutch of $50,482 million (2003: $43,326 million) shown in Note 38 to the Netherlands GAAP Financial Statements of the Royal Dutch/Shell Group of Companies.
Notes to the Annual Accounts 111
Royal Dutch’s investments in the companies of the Royal Dutch/Shell Group are stated at an amount equal to its 60% share in Group net assets, translated into euros at the year-end rate of exchange. Movements during the year are translated at different rates of exchange. The resulting difference from movements in the US dollar/euro rate is included in currency translation differences.
The difference of€35,772 million between the cost of the investments and the amounts at which the investments are stated in the Balance Sheet has been taken to Investment reserves.
The Statutory investment reserve comprises Royal Dutch’s 60% share in the undistributed net income of Group companies which has arisen as from January 1, 1984; Royal Dutch’s share in the undistributed net income of Group companies accumulated until that date is included in Investment reserves – Other.
Royal Dutch’s 60% share in the cumulative Group currency translation differences arises as a result of translating the assets and liabilities of non-US dollar companies to US dollars at year-end rates of exchange and is shown under Investment reserves as currency translation differences. Distribution from Group companies and loss on sale of Parent Companies’ shares are translated at a rate of exchange used for distribution of dividends.
The net increase/decrease in Parent Companies’ shares held by Group companies results from sales and purchases of these shares minus dividends received on these shares, translated at the average rate of exchange for the year.
Other comprehensive income, net of tax, consists of currency translation differences, unrealised gains/losses on securities and on cash flow hedges and minimum pension liability adjustments and is translated at the year-end rate (see Note 38 to the Netherlands GAAP Financial Statements of the Royal Dutch/Shell Group of Companies on pages 90 and 91).
As the amounts dealt with under Investment reserves have been, or will be, substantially reinvested by the companies concerned, it is not meaningful to provide for taxes on possible future distributions out of earnings retained by those companies; no such provision has therefore been made.
The movements during the year in the value of the Group reporting currency (US dollar) against the Royal Dutch reporting currency (euro) lead to currency translation differences.
Movements in Investments and Investment reserves
| | | | | | | | | | | | | | | | | | | | | | | | | | | | | |
| | | | | | | | | | | | | | | € million | |
| | | $ million | | | | | | | | | | | Investment reserves | |
| | | 60% interest | | | | | | | | | | | | | | | Currency | | | | | | | |
| | | in Group | | | Exchange | | | Royal Dutch | | | | | | | translation | | | | | | | |
| | | net assetsa | | | rate (€/$) | | | investments | | | Statutory | | | differences | | | Other | | | Total | |
| |
Balance at December 31, 2002 (as restated) | | | 36,094 | | | | 0.96 | | | | 34,490 | | | | 23,052 | | | | (2,370 | ) | | | 12,562 | | | | 33,244 | |
| |
Cumulative effect of change in accounting for asset retirement obligationsb | | | 153 | | | | 0.96 | | | | 146 | | | | 146 | | | | | | | | | | | | 146 | |
| |
Balance at January 1, 2003 | | | 36,247 | | | | 0.96 | | | | 34,636 | | | | 23,198 | | | | (2,370 | ) | | | 12,562 | | | | 33,390 | |
| |
Movements during the year 2003 | | | | | | | | | | | | | | | | | | | | | | | | | | | | |
| Share in the net income of Group companies | | | 7,134 | | | | 0.90 | | | | 6,411 | | | | | | | | | | | | | | | | | |
| Distribution to Royal Dutch | | | (3,396 | ) | | | 0.84 | | | | (2,868 | ) | | | | | | | | | | | | | | | | |
| | | | | | | | | | | | | | | | | | | | | | | | | | | | | | |
| Undistributed net income of Group companies | | | 3,738 | | | | 0.95 | | | | 3,543 | | | | 3,543 | | | | | | | | | | | | 3,543 | |
| Loss on sale of Parent Companies’ shares | | | (1 | ) | | | 0.95 | | | | (1 | ) | | | (1 | ) | | | | | | | | | | | (1 | ) |
| Net (increase)/decrease in Parent Companies’ shares held by Group companies | | | (378 | ) | | | 0.89 | | | | (335 | ) | | | | | | | | | | | (335 | ) | | | (335 | ) |
| Other comprehensive income, net of tax | | | 3,720 | | | | 0.79 | | | | 2,951 | | | | 499 | | | | 2,452 | | | | | | | | 2,951 | |
| Translation effect arising from movements in US dollar/euro rate | | | | | | | | | | | (6,445 | ) | | | (4,532 | ) | | | 404 | | | | (2,317 | ) | | | (6,445 | ) |
| |
Balance at December 31, 2003 (as restated) | | | 43,326 | | | | 0.79 | | | | 34,349 | | | | 22,707 | | | | 486 | | | | 9,910 | | | | 33,103 | |
| |
Movements during the year 2004 | | | | | | | | | | | | | | | | | | | | | | | | | | | | |
| Share in the net income of Group companies | | | 10,818 | | | | 0.81 | | | | 8,712 | | | | | | | | | | | | | | | | | |
| Distribution to Royal Dutch | | | (4,793 | ) | | | 0.80 | | | | (3,842 | ) | | | | | | | | | | | | | | | | |
| | | | | | | | | | | | | | | | | | | | | | | | | | | | | | |
| Undistributed net income of Group companies | | | 6,025 | | | | 0.81 | | | | 4,870 | | | | 4,870 | | | | | | | | | | | | 4,870 | |
| Net (increase)/decrease in Parent Companies’ shares held by Group companies | | | (455 | ) | | | 0.81 | | | | (366 | ) | | | | | | | | | | | (366 | ) | | | (366 | ) |
| Other comprehensive income, net of tax | | | 1,586 | | | | 0.73 | | | | 1,163 | | | | (236 | ) | | | 1,399 | | | | | | | | 1,163 | |
| Translation effect arising from movements in US dollar/euro rate | | | | | | | | | | | (2,998 | ) | | | (2,156 | ) | | | (37 | ) | | | (805 | ) | | | (2,998 | ) |
| |
Balance at December 31, 2004 | | | 50,482 | | | | 0.73 | | | | 37,018 | | | | 25,185 | | | | 1,848 | | | | 8,739 | | | | 35,772 | |
| |
| a | | See Note 33 to the Netherlands GAAP Financial Statements of the Royal Dutch/Shell Group of Companies for the impact of the differences between US GAAP and Netherlands GAAP on Group net assets and net income. See Note 38 to the Netherlands GAAP Financial Statements of the Royal Dutch/Shell Group of Companies for the determination of Royal Dutch’s 60% interest in Group net assets and movements therein, including movements resulting from Group net income and distributions to the Parent Companies. |
| |
| b | | This relates to a change in Group accounting policies in 2003 for asset retirement obligations which is recorded as an adjustment to the opening balance of net assets in 2003. Prior periods have not been restated due to the absence of comparative data for 2002. |
112 Royal Dutch Petroleum Company
7 Investment in associated company
In October 2004, the Company, in conjunction with Shell Transport, invested in Shell RDS Holding B.V. (RDS Holding), a company incorporated in the Netherlands, in order to facilitate the proposed transaction through which each of the Company and Shell Transport will become a subsidiary of Royal Dutch Shell plc, which will become a publicly-listed company incorporated in England and Wales and headquartered and tax resident in the Netherlands. The Company and Shell Transport each own 50% of the ordinary share capital of RDS Holding. The Company has a 60% financial interest in RDS Holding, Shell Transport has a 40% financial interest in RDS Holding. RDS Holding has an interest of 100% in Royal Dutch Shell plc.
The aggregate amount of the paid up capital of RDS Holding at December 31, 2004 is€299.1 million.
8 Other receivables
| | | | | | | | | |
| | | € million | |
| | | Dec 31, | | | Dec 31, | |
| | | 2004 | | | 2003 | |
| |
| Dividend tax receivable | | | 35 | | | | 36 | |
| Other receivables | | | — | | | | — | |
| |
| | | | 35 | | | | 36 | |
| |
9 Other liabilities
| | | | | | | | | |
| | | € million | |
| | | Dec 31, | | | Dec 31, | |
| | | 2004 | | | 2003 | |
| |
| Dividends | | | 6 | | | | 8 | |
| Accounts payable | | | 6 | | | | 2 | |
| Corporation tax | | | 1 | | | | — | |
| |
| | | | 13 | | | | 10 | |
| |
10 Share capital
The authorised capital as laid down in the Articles of Association is expressed in euros and amounts to€1,792,000,000. The authorised share capital is divided into 3,198,800,000 ordinary shares with a par value of€0.56 each and 1,500 priority shares with a par value of€448 each. The movements in issued and paid-up capital during 2003 and 2004 were as follows:
Share capital
| | | | | | | | | |
| | | Number of shares | | | € | |
| |
Ordinary shares of€0.56 | | | | | | | | |
| |
| At December 31, 2002 | | | 2,099,285,000 | | | | 1,175,599,600 | |
| |
| Cancelled during 2003 | | | (15,785,000 | ) | | | (8,839,600 | ) |
| |
| At December 31, 2003 | | | 2,083,500,000 | | | | 1,166,760,000 | |
| |
| Cancelled during 2004 | | | (1,775,000 | ) | | | (994,000 | ) |
| |
At December 31, 2004 | | | 2,081,725,000 | | | | 1,165,766,000 | |
| |
| | | | | | | | | |
Priority shares of€448 | | | | | | | | |
| |
| At December 31, 2002 | | | 1,500 | | | | 672,000 | |
| |
| At December 31, 2003 | | | 1,500 | | | | 672,000 | |
| |
At December 31, 2004 | | | 1,500 | | | | 672,000 | |
| |
| | | | | | | | | |
Total ordinary and priority shares | | | | | | | | |
| |
| At December 31, 2003 | | | 2,083,501,500 | | | | 1,167,432,000 | |
| |
At December 31, 2004 | | | 2,081,726,500 | | | | 1,166,438,000 | |
| |
On June 17, 2004, the Board of Management of Royal Dutch announced that it will propose to the General Meeting of Shareholders to be held on June 28, 2005 to abolish the priority shares.
11 Other statutory reserves
The other statutory reserves resulted from the redenomination in 2002 from guilders into euros of the nominal values of the shares.
12 Royal Dutch shares held by Group companies
The movements in 2004 in Royal Dutch shares held by Group companies were as follows:
| | | | | | | | | | | | | |
| | | Number of shares | | | € million | |
| | | | | | | | | | | Royal Dutch | |
| | | | | | | | | | | 60% interest | |
| | | | | | | | | | | in the | |
| |
At December 31, 2003 | | | 50,280,082 | | | | 2,394 | | | | 1,436 | |
| Purchases | | | 12,184,414 | | | | 501 | | | | 301 | |
| Deliveries and other movements | | | 545,456 | | | | (115 | ) | | | (69 | ) |
| |
At December 31, 2004 | | | 61,919,040 | | | | 2,780 | | | | 1,668 | |
| |
These movements relate to the granting and exercise of stock options and to other incentive compensation plans as mentioned in Note 23 to the Financial Statements of the Royal Dutch/Shell Group of Companies.
13 Earnings per share
The basic earnings per share amounts shown are related to profit after taxation and after deducting the 4% cumulative preference dividend on priority shares. The calculation uses a weighted average number of shares of 2,023,212,126 (2003: 2,036,687,755; 2002: 2,057,657,737 shares). These amounts are based on outstanding shares, after deduction of shares held by Group companies in respect of stock options and other incentive compensation plans. For the purpose of the calculation, shares repurchased under the buyback programme are deemed to have been cancelled on purchase date.
The diluted earnings per share are based on the same profit figures. For this calculation the weighted number of shares is increased by 2,283,163 for 2004 (2003: 674,210; 2002: 442,580). These numbers relate to share options schemes as mentioned above.
Amounts reported in previous years have been reclassified following the separate reporting of income from discontinued operations (see Note 2). The basic earnings per ordinary share from discontinued operations of the Royal Dutch/Shell Group of Companies amounted to€0.01 for 2003 (2002:€0.06). The diluted earnings per ordinary share from discontinued operations of the Royal Dutch/Shell Group of Companies amounted to€0.01 for 2003 (2002:€0.06).
Notes to the Annual Accounts 113
Royal Dutch’s 60% interest in line items as derived from
the Group Netherlands GAAP Financial Statements
| | | | | | | | | |
| | | € million | | | $ million | |
| |
Statement of Assets and Liabilities | | | | | | | | |
2004: | | | | | | | | |
| Current assets | | | 27,212 | | | | 37,109 | |
| Non current assets | | | 57,381 | | | | 78,250 | |
| Current liabilities | | | (26,691 | ) | | | (36,398 | ) |
| Non current liabilities | | | (18,548 | ) | | | (25,294 | ) |
| Minority interests in Group companies (60% of Group amount on page 84 translated at year end rate on page 111) | | | (2,336 | ) | | | (3,185 | ) |
| | | | | | | |
| Royal Dutch share of Group net assets (see page 111 – euro & 84 – US dollar) | | | 37,018 | | | | 50,482 | |
| Other assets and liabilities of Royal Dutch | | | 2,627 | | | | | |
| | | | | | | | |
| Net assets | | | 39,645 | | | | | |
| |
| 2003 (as restated): | | | | | | | | |
| Current assets | | | 20,745 | | | | 26,167 | |
| Non current assets | | | 59,773 | | | | 75,395 | |
| Current liabilities | | | (25,888 | ) | | | (32,654 | ) |
| Non current liabilities | | | (18,657 | ) | | | (23,533 | ) |
| Minority interests in Group companies (60% of Group amount on page 84 translated at year end rate on page 111) | | | (1,624 | ) | | | (2,049 | ) |
| | | | | | | |
| Royal Dutch share of Group net assets (see page 111 – euro & 84 – US dollar) | | | 34,349 | | | | 43,326 | |
| Other assets and liabilities of Royal Dutch | | | 2,846 | | | | | |
| | | | | | | | |
| Net assets | | | 37,195 | | | | | |
| |
Statement of Income | | | | | | | | |
2004: | | | | | | | | |
| Sales proceeds (Revenue) | | | 163,104 | | | | 202,513 | |
| Operating profit | | | 15,306 | | | | 19,004 | |
| Income from continuing operations | | | 7,958 | | | | 9,882 | |
| Income from discontinued operations | | | 754 | | | | 936 | |
| Net income for the year | | | 8,712 | | | | 10,818 | |
| Distribution for the year | | | 3,842 | | | | 4,793 | |
| |
| 2003 (as restated): | | | | | | | | |
| Sales proceeds (Revenue) | | | 142,345 | | | | 158,333 | |
| Operating profit | | | 11,412 | | | | 12,694 | |
| Income from continuing operations | | | 6,398 | | | | 7,119 | |
| Income from discontinued operations | | | 13 | | | | 15 | |
| Net income for the year | | | 6,411 | | | | 7,134 | |
| Distribution for the year | | | 2,868 | | | | 3,396 | |
| |
| 2002 (as restated): | | | | | | | | |
| Sales proceeds (Revenue) | | | 138,514 | | | | 130,972 | |
| Operating profit | | | 11,256 | | | | 10,643 | |
| Income from continuing operations | | | 5,957 | | | | 5,610 | |
| Income from discontinued operations | | | 119 | | | | 112 | |
| Net income for the year | | | 6,076 | | | | 5,722 | |
| Distribution for the year | | | 3,317 | | | | 3,261 | |
| |
14 List of companies of the Royal Dutch/Shell Group
A list of companies drawn up with due observance of the provisions in Articles 379 and 414, Book 2 of the Netherlands Civil Code, has been deposited at the office of the Commercial Register in The Hague.
15 Remuneration of members of the Supervisory Board and Managing Directors
For the amounts borne in 2004 by Royal Dutch and by the Royal Dutch/Shell Group of Companies in respect of remuneration of the Managing Directors, reference is made to the relevant tables on pages 126 to 130.
Walter van de Vijver resigned as a Managing Director of Royal Dutch on March 3, 2004. The amount of remuneration he received whilst a Managing Director of the Company in 2004 is stated in the tables on pages 126 to 130. His employment terminated with effect from September 1, 2004. From March 4, 2004 to August 31, 2004 an amount of€589,939 was borne by the Royal Dutch/Shell Group of Companies in respect of the remuneration he received as an employee of the Group.
For the amounts borne in 2004 by Royal Dutch and by companies of the Royal Dutch/Shell Group in respect of remuneration of the members of the Supervisory Board, reference is made to the relevant table on page 132. This table also includes amounts borne by companies of the Royal Dutch/Shell Group in respect of remuneration for two members of the Supervisory Board who served simultaneously as Directors of these companies.
In addition to the pensions from a pension fund, ten former Managing Directors receive retirement benefits for duties performed by them simultaneously in the past as Directors of Group companies, as referred to in the previous paragraph. These retirement benefits have not been insured but provisions have been made in respect thereof in accordance with applicable accounting principles.
The breakdown of these charges per former Managing Director is as follows:
| | | | | | | | | |
| | | € | |
| | | 2004 | | | 2003 | |
| |
| Drs. M.A. van den Bergh | | | 67,071 | | | | 145,893 | |
| A.P. Bénard | | | 28,443 | | | | 42,165 | |
| Ir. J.H. Choufoer | | | 32,956 | | | | 55,381 | |
| Ir. J.M.H. van Engelshoven | | | 43,903 | | | | 80,712 | |
| R.M. Hart | | | 49,146 | | | | 80,399 | |
| Drs. C.A.J. Herkströter | | | 48,833 | | | | 101,043 | |
| Ir. H. de Ruiter | | | 63,835 | | | | 124,019 | |
| Ir. K. Swart | | | 13,741 | | | | 19,664 | |
| Ir. L.C. van Wachem | | | 61,751 | | | | 115,672 | |
| Ir. E.G.G. Werner | | | 22,545 | | | | 32,621 | |
| |
Totala | | | 432,224 | | | | 797,569 | |
| |
| a | | These amounts differ from actual relevant pensions paid. |
16 Employee numbers
Royal Dutch did not have any employees at December 31, 2004 or December 31, 2003. The Managing Directors of Royal Dutch have a contract of employment with Group companies.
114 Royal Dutch Petroleum Company
17 Contingencies and litigation
In connection with the recategorisation of certain hydrocarbon reserves that occurred in 2004, a number of putative shareholder class actions were filed against Royal Dutch, Shell Transport, Managing Directors of Royal Dutch during the class period, Managing Directors of Shell Transport during the class period and the external auditors for Royal Dutch, Shell Transport and the Group. These actions were consolidated in the United States District Court in New Jersey and a consolidated complaint was filed in September 2004. The parties are awaiting a decision with respect to defendants’ motions to dismiss asserting lack of jurisdiction with respect to the claims of non-United States shareholders who purchased on non-United States securities exchanges and failure to state a claim. Merits discovery has not begun. The case is at an early stage and subject to substantial uncertainties concerning the outcome of the material factual and legal issues relating to the litigation, including the pending motions to dismiss on lack of jurisdiction and failure to state a claim. In addition, potential damages, if any, in a fully litigated securities class action would depend on the losses caused by the alleged wrongful conduct that would be demonstrated by individual class members in their purchases and sales of Royal Dutch and Shell Transport shares during the relevant class period. Accordingly, based on the current status of the litigation, management of Royal Dutch is unable to estimate a range of possible losses or any minimum loss. Management of Royal Dutch will review this determination as the litigation progresses.
Also in connection with the hydrocarbon reserves recategorisation, putative shareholder class actions were filed on behalf of participants in various Shell Oil Company qualified plans alleging that Royal Dutch, Shell Transport and various current and former officers and directors breached various fiduciary duties to employee participants imposed by the Employee Retirement Income Security Act of 1974 (“ERISA”). These suits were consolidated in the United States District Court in New Jersey and a consolidated class action complaint was filed in July 2004. Defendants’ motions to dismiss have been fully briefed. Some document discovery has taken place. The case is at an early stage and subject to substantial uncertainties concerning the outcome of the material factual and legal issues relating to the litigation, including the pending motion to dismiss and the legal uncertainties with respect to the methodology for calculating damage, if any, should defendants become subject to an adverse judgment. The Group is in settlement discussions with counsel for plaintiffs, which it hopes will lead to a successful resolution of the case without the need for further litigation. No financial provisions have been taken with respect to the ERISA litigation.
The reserves recategorisation also led to the filing of shareholder derivative actions in June 2004. The four suits pending in New York state court, New York federal court and New Jersey federal court demand Group management and structural changes and seek unspecified damages from current and former members of the Boards of Directors of Royal Dutch and Shell Transport.
The suits are in preliminary stages and no responses are yet due from defendants. Because any money “damages” in the derivative actions would be paid to Royal Dutch and Shell Transport, management of Royal Dutch does not believe that the resolution of these suits will have a material adverse effect on Royal Dutch’s financial condition or operating results.
The United States Securities and Exchange Commission (SEC) and UK Financial Services Authority (FSA) issued formal orders of private investigation in relation to the reserves recategorisation which Royal Dutch and Shell Transport resolved by reaching agreements with the SEC and the FSA. In connection with the agreement with the SEC, Royal Dutch and Shell Transport consented, without admitting or denying the SEC’s findings or conclusions, to an administrative order finding that Royal Dutch and Shell Transport violated, and requiring Royal Dutch and Shell Transport to cease and desist from future violations of, the antifraud, reporting, recordkeeping and internal control provisions of the US Federal securities laws and related SEC rules, agreed to pay a $120 million civil penalty and undertook to spend an additional $5 million developing a comprehensive internal compliance programme. In connection with the agreement with the FSA, Royal Dutch and Shell Transport agreed, without admitting or denying the FSA’s findings or conclusions, to the entry of a Final Notice by the FSA finding that Royal Dutch and Shell Transport breached market abuse provisions of the UK’s Financial Services and Markets Act 2000 and the Listing Rules made under it and agreed to pay a penalty of £17 million. The penalties from the SEC and FSA and the additional amount to develop a comprehensive internal compliance programme have been paid by Group companies and fully included in the Income Statement of the Group. The United States Department of Justice has commenced a criminal investigation, and Euronext Amsterdam, the Dutch Authority Financial Markets and the California Department of Corporations are investigating the issues related to the reserves recategorisation. Management of Royal Dutch cannot currently predict the manner and timing of the resolution of these pending matters and is currently unable to estimate the range of reasonably possible losses from such matters.
Group companies are subject to a number of other loss contingencies arising out of litigation and claims brought by governmental and private parties, which are handled in the ordinary course of business.
The operations and earnings of Group companies continue, from time to time, to be affected to varying degrees by political, legislative, fiscal and regulatory developments, including those relating to the protection of the environment and indigenous people, in the countries in which they operate. The industries in which Group companies are engaged are also subject to physical risks of various types. The nature and frequency of these developments and events, not all of which are covered by insurance, as well as their effect on future operations and earnings, are unpredictable.
Corporate governance 115
Corporate governance
This section describes the current governance of Royal Dutch prior to the implementation of the proposal to unify Royal Dutch and Shell Transport under a new single parent company, Royal Dutch Shell plc, and prior to the proposal to amend the Articles of Association of Royal Dutch, which will be put forward to the General Meeting on June 28, 2005. Further information, including the full offer documentation, is available at www.shell.com/unification.
The Supervisory Board and Board of Management of Royal Dutch are committed to upholding the highest standards of integrity and transparency in their governance of the Company. The Company reflects much of the Dutch corporate governance code in its corporate governance. The principles and best practice provisions of the code are applied and where they are not, the current practice is described and explained. In 2004 the Company continued reviewing arrangements that require an explanation under the code, and considered and implemented further amendments. In addition to complying with the corporate governance rules of the Netherlands, the Company is also obliged to follow US securities law, rules and regulations as they apply because of the Company’s listing on the New York Stock Exchange (NYSE). The Company has taken steps to comply with the provisions of the Sarbanes-Oxley Act and the corporate governance rules of the NYSE to the extent that they are applicable to the Company as a foreign issuer.
Royal Dutch’s principal activity is the ownership of a 60% interest in the Royal Dutch/Shell Group of Companies, of which it is not a part and in whose activities it does not engage. The other 40% is owned in like manner by Shell Transport. As announced on October 28, 2004, the Supervisory Board and Board of Management of Royal Dutch and the Board of Directors of Shell Transport unanimously agreed, in principle, to propose to shareholders the unification of the Royal Dutch/Shell Group of Companies under a single parent company, Royal Dutch Shell plc. The Boards believe that implementation of these proposals will strengthen the Group and deliver significant benefits through greater clarity of governance and streamlined decision making with clear lines of authority and an empowered Chief Executive. The proposals will be put forward to the shareholders at the General Meeting on June 28, 2005. Further information, including the full offer documentation, is available at www.shell.com/unification.
The joint arrangements for supervising the governance of the operations of the Royal Dutch/Shell Group of Companies throughout the world are summarised in this section under the heading “Arrangements with Shell Transport”. The remainder of this section refers to the current governance of Royal Dutch, prior to the proposed unification of Royal Dutch and Shell Transport and prior to the proposed amendment of the Articles of Association of Royal Dutch to be considered at the General Meeting of Shareholders of June 28, 2005.
Board of Management
Royal Dutch is managed by a Board of Management, consisting of at least two Managing Directors, under the supervision of a Supervisory Board. In accordance with the Articles of Association of the Company and as permitted by Dutch legislation, Managing Directors are appointed by the General Meeting of Shareholders from the persons nominated by the meeting of holders of priority shares. One or more shareholders representing in the aggregate at least 1% of the Company’s issued capital and showing documentary evidence thereof may also draw up a nomination.
116 Royal Dutch Petroleum Company
Such a nomination shall be regarded as a nomination by the meeting of holders of priority shares provided it is submitted to the chairman of that meeting at least two weeks before the General Meeting of Shareholders at which the appointment is to be made and it is approved by the meeting of holders of priority shares. The nominations are of a binding nature. It is considered that this leads to the appointment of carefully selected and suitable nominees. For Managing Directors appointed prior to 2004, the term of appointment ends upon their retirement. As from 2004, Managing Directors are appointed or re-appointed for a period of four years, unless retiring earlier. The General Meeting of Shareholders can discharge Managing Directors at any time.
The Supervisory Board appoints one of the Managing Directors as President, who determines the division of responsibilities among the Managing Directors and has the casting vote in the event of an equality of votes at a meeting of the Board of Management. The Board of Management is responsible for achieving the Company’s objectives, its strategy and policy, its results and its financing. It is further responsible for the contents of publicly disclosed financial reports as well as for compliance with legislation and regulations. The Board of Management is accountable to the Supervisory Board and to the General Meeting of Shareholders. The Board of Management is also responsible for providing the Supervisory Board with all of the information it requires in the exercise of its duties.
The remuneration of the Managing Directors is addressed in the Remuneration Report on pages 121 to 132.
For the guidance of Managing Directors, principal executives and senior financial officers of the Royal Dutch/Shell Group, a Code of Ethics (www.shell.com/codeofethics) has been drawn up in conjunction with the Group’s Statement of General Business Principles. Under the Code of Ethics, Managing Directors should avoid any conflict of interest with the Company. Decisions to enter into transactions under which members of the Board of Management would have a conflict of interest that is of material significance to the Company and/or to the relevant Board of Management member require the approval of the Supervisory Board.
An internal global procedure for Group employees to raise, in confidence, accounting, controls and auditing concerns has been put in place. In addition to this, Royal Dutch has a global whistle-blowing procedure in place for Group employees to report any breach or suspected breach of any law, regulation or company policy or guideline, including the Group’s business principles. Breaches are reported to the President, the Chairman and/or the Chairman of the Audit Committee. Any employee reporting a breach which they reasonably believe to be true, and from which they receive no personal gain, will be given protection under this whistle-blower procedure. In accordance with the procedure, employees will not be discharged, demoted, suspended, threatened, harassed or in any manner discriminated against with respect to the reporting of such a breach. In addition to this global procedure, there are a number of national whistle-blowing procedures in operation.
The Managing Directors of Royal Dutch and the Managing Directors of Shell Transport are also members of the Presidium of the Board of Directors of Shell Petroleum N.V. and Managing Directors of The Shell Petroleum Company Limited, the Group Holding Companies. As such, they are generally known as Executive Directors.
Supervisory Board
The Supervisory Board is responsible for supervising the policies of the Board of Management and the general course of business of the Company and the Group and further advises the Board of Management. The Supervisory Board discusses strategy, business risks and the results of the Board of Management’s assessment of the risk management and internal control systems. The specific duties of the Supervisory Board are set out in the Rules of Procedure of the Supervisory Board, which were revised and published on the Shell website in 2004 (www.shell.com/investor). In performing its duties, the Supervisory Board is required to take into account the interests of all of the Company’s stakeholders.
The Supervisory Board consists of at least five members, who are appointed in the same manner as members of the Board of Management as set out in the Board of Management paragraph. The composition of the Supervisory Board is such that it is able to perform its duties properly and that its members are able to act critically and independently of one another and of the Board of Management and of any particular interests. An induction programme for newly-appointed members of the Supervisory Board, enabling them to acquire an understanding of the Company and the business of the Group, took place in 2004. Each year, one of the members of the Board retires by rotation. Pursuant to the Rules of Procedure of the Supervisory Board, the schedule of rotation is fixed in accordance with the date of appointment. As a result, members usually retire by rotation after a period of approximately four years. They are immediately eligible for re-appointment, which will, however, only take place after careful consideration and in accordance with the profile requirements. The maximum term for holding office as a Supervisory Board member is ten years. The Rules of Procedure as well as the Company’s Articles of Association provide that a member of the Supervisory Board retires after having reached the age of 70. Amendment of the Articles of Association with a view to implementing a single-tier Board of Directors and aligning them with the code regarding the term of appointment shall be proposed to the General Meeting of Shareholders 2005. Following amendment of the Articles of Association, the Rules of Procedure shall also be amended and aligned with the code.
The Rules of Procedure also provide that members of the Supervisory Board shall resign, either on their own initiative or at the request of the Supervisory Board, in the event of inadequate performance, fundamental differences of opinion, irreconcilable conflict of interest or any other compelling reason. The General Meeting of Shareholders is authorised to discharge a member from the Supervisory Board.
Corporate governance 117
The Supervisory Board reviews its own overall performance as well as that of the individual members of the Board on an annual basis. The Supervisory Board also evaluates the Board of Management and its individual members.
The Chairman of the Supervisory Board is elected by the Board from among its members. The Chairman chairs the meetings of the Supervisory Board and is responsible for ensuring that the Board functions properly in all respects. The role of the Chairman includes keeping in regular contact with the President of the Company on all matters that relate to the Supervisory Board’s responsibilities. The Chairman’s tasks include monitoring the information to be submitted for Supervisory Board Meetings by or on behalf of the Board of Management and requesting any additional information he deems appropriate. Finally, the Chairman also presides over the General Meeting of Shareholders and is responsible for ensuring orderly and efficient proceedings. The Chairman of the Supervisory Board is assisted in his role by the Company Secretary.
Members of the Supervisory Board should avoid undisclosed actual or potential conflicts of interest with the Company. A Supervisory Board member who is faced with such a conflict is obliged to disclose this immediately to the Chairman who then has to decide whether or not to disclose the conflict to the entire Supervisory Board. The Supervisory Board member concerned must abstain from any vote on items concerning such a conflict of interest.
The code of conduct for dealings in securities of Royal Dutch and Shell Transport by members of the Supervisory Board and the Board of Management, which applied in 2004, was replaced by a Code of Conduct for dealings in the Company’s shares and other securities and in order to align it with the Dutch Corporate Governance Code. The new Code of Conduct, adopted by the Supervisory Board in 2004, is published on the Company’s website (www.shell.com/investor) and is effective from January 1, 2005.
The Board aims for diversity of knowledge and experience among its members in relation to the various businesses of the Group and the international nature of the Company and the Group. In line with these goals, the Board attaches great importance to experience in the energy industry and the international environments in which Group companies operate, and values having a former Managing Director of the Company among its members. Currently one of the seven members is a former Managing Director. The Company supports the principle that the members of its Supervisory Board should aim to restrict their memberships of supervisory boards of Dutch listed companies to five. The Company expects to fully comply with the principle after July 2006. A profile of the Supervisory Board is published on the Shell website (www.shell.com/investor). There are no family relationships between members of the Board of Management and the Supervisory Board. Members of neither Board are nominated or appointed pursuant to any agreement with a third party. For more information about the members of the Supervisory Board see pages 6 and 7 or (www.shell.com/investor).
General Meetings of Shareholders
General Meetings of Shareholders of Royal Dutch are held at least once a year to discuss the reports of the Board of Management and the Supervisory Board, to finalise the Annual Accounts and to resolve on any dividend proposal and other items on the agenda, and to discuss any other items on the agenda.
General Meetings of Shareholders are called by the Board of Management or the Supervisory Board. The items to be dealt with at the meeting are determined by the Board of Management and the Supervisory Board and are specified in the agenda and explanatory notes to the agenda included in the notice of meeting. A General Meeting of Shareholders may also be held at the request of one or more shareholders who individually or jointly represent at least 10% of the Company’s issued capital, for the purpose of dealing with subjects specified by such shareholders. The Board of Management and the Supervisory Board will add items proposed by shareholders to the agenda of a General Meeting of Shareholders, provided that: (a) such a proposal is submitted by one or more shareholders who individually or jointly represent at least 1% of the Company’s issued capital or shares in the Company that represent a value of at least€50 million, and is received by the Company at least 60 days in advance of the meeting; and (b) in the opinion of the Board of Management and the Supervisory Board such a proposal concerns an item on which the General Meeting of Shareholders can legitimately decide and does not contravene serious interests of the Company or any Group company.
The resolutions of the General Meeting of Shareholders shall be passed by absolute majority of the votes cast, except in those cases where the law or the Articles of Association prescribe a larger majority. At General Meetings shareholders may cast one vote for each ordinary share held and holders of priority shares may cast 800 votes per priority share held. They may do this in person or by proxy. Shareholders participating in the Shareholders’ Communication Channel (Communicatiekanaal Aandeelhouders) or holding registered shares in the Netherlands or in the USA receive a voting instruction form by means of which they can participate in the decision-making process without being present in person at the General Meeting.
As prescribed by the Articles of Association a civil notary draws up the record of the proceedings of the General Meeting. This report is available within three months from the General Meeting of Shareholders and can be found on the Shell website (www.shell.com/investor).
Provision of information
The Group’s presentations of its quarterly and annual results and all major analyst meetings are announced in advance on the Shell website (www.shell.com/investor) and by means of press releases. They can be followed real time via webcasting or teleconference. Other meetings with analysts or investors are not normally announced in advance, nor can they be followed by webcast or any other means. Discussions in such meetings are always limited to information that is already in the public domain. This is in
118 Royal Dutch Petroleum Company
line with the requirement to ensure that all shareholders and other parties in the financial market have equal and simultaneous access to information which may influence the share price.
Priority shares
Royal Dutch has 1,500 issued priority shares. As announced on June 17, 2004, a proposal to abolish the priority shares will be put forward to the General Meeting of Shareholders 2005. It is intended that the proposal would be effected through a buyback of the priority shares at their nominal value. At present, each member of the Supervisory Board and of the Board of Management is the holder of six priority shares. The Royal Dutch Priority Shares Foundation holds the other priority shares. The Board of the Foundation consists of all members of the Supervisory Board and the Board of Management of the Company. Priority shares represent certain special rights, which include:
| – | | determining the number of Managing Directors and the number of members of the Supervisory Board; |
| |
| – | | drawing up a binding nomination consisting of at least two persons for filling vacancies on the Board of Management and the Supervisory Board; and |
| |
| – | | granting consent for amendment of the Articles of Association or for dissolution of the Company. |
The rights mentioned above are exercised by the meeting of holders of priority shares. At this meeting one vote may be cast for each priority share, but no one may cast more than six votes in all.
Anti-takeover measures
Apart from the priority shares, which can be considered an anti-takeover measure, Royal Dutch does not have any measures which exclusively or almost exclusively exist for the purpose of preventing a takeover. Furthermore, the Company does not have any measures which specifically prevent a bidder, if it has acquired 75% of the shares in the capital of the Company, appointing or dismissing members of the Board of Management and subsequently amending the Articles of Association of the Company. In the event of a hostile takeover attempt, the Board of Management and the Supervisory Board are authorised to exercise all powers attributed to them in the interest of Royal Dutch and its shareholders.
Arrangements with Shell Transport
Royal Dutch and Shell Transport are independent companies, each obliged to observe the law and corporate practices of their country of incorporation, the Netherlands and the United Kingdom respectively. Royal Dutch and Shell Transport have, over their long association, developed a number of special consultative arrangements, as set out below, to assist with the proper discharge of their responsibilities to their respective shareholders for stewardship of the Parent Companies’ interests in the Royal Dutch/Shell Group.
The Structure of the Royal Dutch/Shell Group is shown on page 115 and the current members of the Boards of the Parent Companies are shown on pages 6 and 7.
The Conference
Meetings of the Conference, comprising the members of the Supervisory Board and the Board of Management of Royal Dutch and the Directors of Shell Transport, are held regularly during the year. The Conference is currently chaired by Lord Oxburgh, Non-executive Chairman of Shell Transport. Aad Jacobs, Chairman of the Supervisory Board of Royal Dutch, is currently Vice-Chairman. The purpose of the Conference is to receive information from Executive Directors about major developments within the Royal Dutch/Shell Group of Companies and to discuss reviews and reports on the business and plans of the Group. Senior executives of Group companies also attend these meetings of the Conference to present strategic plans and proposals for major projects, giving the Conference frequent opportunities to hear from and put questions to those with first-hand experience of the business, in addition to receiving fully documented reports and proposals.
In particular, the Conference reviews and discusses:
| – | | the strategic direction of the businesses of the Royal Dutch/Shell Group of Companies; |
| |
| – | | the business plans of both the individual businesses and of the Royal Dutch/Shell Group of Companies as a whole; |
| |
| – | | major or strategic projects and significant capital items; |
| |
| – | | the quarterly and annual financial results of the Royal Dutch/Shell Group of Companies; |
| |
| – | | reports of the Group Audit Committee, Remuneration and Succession Review Committee and Social Responsibility Committee; |
| |
| – | | performance appraisals both of the individual businesses and of the Royal Dutch/Shell Group of Companies as a whole; |
| |
| – | | annual or periodic reviews of Group companies’ activities within significant countries or regions; |
| |
| – | | governance, business risks and internal control of the Royal Dutch/Shell Group of Companies; |
| |
| – | | a programme of insights and briefings on specific aspects of the Royal Dutch/Shell Group of Companies; and |
| |
| – | | any other significant or unusual items on which the Executive Directors wish to seek advice, or which members of Conference wish to raise. |
Executive Committee
The Executive Committee is a joint committee established by the Boards of the Group Holding Companies to help them operate effectively. The Executive Committee replaces the Committee of Managing Directors, which was abolished on October 28, 2004. An Executive Committee member, also known as Executive Director, is either on the Board of Management of the Company or on the Board of Shell Transport and is a member of the Boards of both Group Holding Companies. The Executive Committee advises the Group Holding Companies on investment in Shell companies and on the exercise of shareholder rights for these companies. The Executive Committee guides the Group by
Corporate governance 119
providing strategic direction, support and appraisal to Group businesses and regularly updates the Conference on strategy, organisation, plans and performance, as well as on risk management and internal control.
Joint committees
The Parent Companies have established three joint committees to assist with their respective governance responsibilities: the Group Audit Committee, the Remuneration and Succession Review Committee and the Social Responsibility Committee. All of these committees are composed of six members; three of whom are appointed by the Supervisory Board of Royal Dutch from among its members and three by the Board of Shell Transport from among its Non-executive Directors.
Group Audit Committee
In 1976 the Supervisory Board of Royal Dutch, jointly with the Board of Shell Transport, established a Group Audit Committee. Under its Terms of Reference, which were revised in February 2004, the committee acts in an advisory capacity to the Boards, providing them with quarterly and annual updates regarding its activities and related recommendations. The committee regularly considers the effectiveness of risk management processes and internal control systems within the Group and reviews the financial accounts and reports of the Royal Dutch/Shell Group of Companies. The committee also considers both internal and external audit reports (including the results of the examination of the Group Financial Statements) and assesses the performance of the internal and external audit. The committee does not supervise the application of information and communication technologies in particular. This is part of the general responsibilities of the Board of Management and Supervisory Board respectively. The committee has established an internal, global procedure for employees to raise, in confidence, accounting, controls and auditing concerns.
In February, 2004, the Group Audit Committee established two discrete sub-committees to review and report to the Boards of either Royal Dutch or Shell Transport (as appropriate) on matters that are Parent Company specific. For Royal Dutch such matters include,inter alia, the supervision of the risk management and internal control systems, the Company’s financing and its financial reporting. The sub-committee also supervises the Company’s policy on tax planning as well as compliance with the recommendations and observations of the Company’s Independent Auditors and the relations with the Company’s Independent Auditors (including their independence, remuneration and non-audit services). It determines the extent of the Independent Auditors’ involvement in the content and publication of financial reports other than the Annual Accounts, assesses the performance of the Independent Auditors, advises (together with the Board of Management) the Supervisory Board on the nomination of the Independent Auditors for appointment by the General Meeting of Shareholders and provides recommendations on their remuneration and provision of non-audit services.
Current membership of the Group Audit Committee is shown in the table below:
Appointed by the Supervisory Board of Royal Dutch
| | | | | |
| Lawrence Ricciardi | | Chairman of the committee |
| Aad Jacobs | | | | |
| Christine Morin-Postel | | | | |
Appointed by the Board of Shell Transport
| | | | | |
| Sir Peter Burt | | | | |
| Luis Giusti | | | | |
| Nina Henderson | | | | |
Lawrence Ricciardi chairs the Group Audit Committee. The membership of the Royal Dutch sub-committee comprises the Supervisory Board members appointed to the Group Audit Committee. Lawrence Ricciardi is Chairman and Aad Jacobs has been designated the sub-committee member with appropriate recent and relevant financial experience.
During 2004, there were a total of 23 meetings of the Group Audit Committee. Attendance at these meetings is shown in the table below:
Attendance
| | | | | |
| Members | Attendance |
| Lawrence Ricciardi | | | 21 | |
| Sir Peter Burt | | | 19 | |
| Luis Giusti | | | 17 | |
| Nina Henderson | | | 23 | |
| Aad Jacobs | | | 23 | |
Christine Morin-Postela | | | 3 | |
| a | | Christine Morin-Postel was appointed a member during the year and attended all meetings following her appointment. |
A copy of the new Terms of Reference of the Group Audit Committee (including the Royal Dutch sub-committee) is available from Investor Relations and can be found on the Shell website (www.shell.com/investor).
Remuneration and Succession Review Committee
In 1967, the Supervisory Board of Royal Dutch, jointly with the Board of Shell Transport, established a Remuneration Committee which later became the Remuneration and Succession Review Committee (REMCO). For detailed information on REMCO reference is made to the Remuneration Report on page 122.
Its Terms of Reference are reviewed annually and were revised in February 2004 to reflect the requirements of the Dutch corporate governance code and the UK Combined Code. A copy of the Terms of Reference of REMCO is available from Investor Relations and can be found on the Shell website (www.shell.com/investor).
120 Royal Dutch Petroleum Company
Social Responsibility Committee
In 1997 the Supervisory Board of Royal Dutch, jointly with the Board of Shell Transport, established a Social Responsibility Committee. The committee reviews the policies and conduct of the Royal Dutch/Shell Group of Companies with respect to the Group’s Statement of General Business Principles as well as the Group’s Health, Safety and Environment Commitment and Policy.
Current membership of the Social Responsibility Committee is shown in the table below:
Appointed by the Supervisory Board of Royal Dutch
| | | | | |
| Maarten van den Bergh | | | | |
| Wim Kok | | | | |
| Jonkheer Aarnout Loudon | | | | |
Appointed by the Board of Shell Transport
| | | | | |
| Dr Eileen Buttle | | Chairman of the committee |
| Teymour Alireza | | | | |
| Sir Mark Moody-Stuart | | | | |
During 2004 the committee met three times. Attendance at these meetings is shown in the table below:
Attendance
| | | | | |
| Members | Attendance | |
| Dr Eileen Buttle | | | 3 | |
| Teymour Alireza | | | 3 | |
| Maarten van den Bergh | | | 2 | |
| Wim Kok | | | 3 | |
| Jonkheer Aarnout Loudon | | | 3 | |
Sir Mark Moody-Stuarta | | | 1 | |
| a | | Sir Mark Moody-Stuart was appointed a member during the year and was unable to attend one of the two meetings held following his appointment. |
The Group’s core values of honesty, integrity and respect for people have been embodied for more than 25 years in the Group’s Statement of General Business Principles, which since 1997 have included a commitment to support fundamental human rights and to contribute to sustainable development. The principles apply to all Shell employees. The Group’s Statement of General Business Principles is publicly available on the Shell website (www.shell.com/sgbp).
The Shell Report, which reviews how Group companies are living up to the Group’s Statement of General Business Principles and contributing to sustainable development, is published annually and is available at www.shell.com/shellreport or via the contact addresses given on the back cover of this report.
Risk management and internal control systems
The approach in the Group to risk management and internal control, as set out on pages 38 and 39, involves the Board of Management in regular reviews of the risks that are significant to the fulfilment of Group objectives. Following the announcements in 2004 and 2005 of the reserves recategorisation, remedial actions, as set out on pages 46 and 47, have been taken and are being taken to address the weaknesses in the controls relating to reserves bookings as further described in that section. The Board of Management of Royal Dutch has also reviewed the effectiveness of the Company’s own system of risk management and internal control. The results of the 2004 assessment have been reviewed both with the Royal Dutch sub-committee of the Group Audit Committee and with the Supervisory Board.
Financial reporting
The Board of Management is responsible for the quality and completeness of publicly disclosed financial reports under the supervision of the Supervisory Board. Financial information from all Group businesses flows into the Group’s financial reporting system, which supplies all financial information to the Board of Management. The Group Audit Committee has a key role in respect of the preparation and publication of the Annual Report, the Annual Accounts, the announcements of quarterly and half year results as well as other financial information.
The General Meetings of Shareholders of Royal Dutch and Shell Transport each have appointed Independent Auditors. These Independent Auditors jointly audit the Financial Statements of the Group. The Independent Auditors for the Group communicate with, and attend the meetings of, the Group Audit Committee and provide a report to both Royal Dutch and Shell Transport in respect of the Financial Statements of the Group. The Independent Auditors of the Company report on their findings in relation to the audit of the Annual Accounts to the Supervisory Board and the Board of Management. The Independent Auditors of the Company will be invited to attend the General Meeting of Shareholders 2005 to answer questions about their report.
New York Stock Exchange (NYSE) rules
The NYSE corporate governance rules allow foreign private issuers to follow home country practice, except that foreign private issuers are required to have an audit committee that satisfies the requirements of Rule 10A-3 of the US Securities Exchange Act of 1934. In addition, the NYSE requires a foreign private issuer to provide certain written affirmations and notices to the NYSE and a summary of the ways in which their corporate governance practices significantly differ from those followed by domestic USA companies under NYSE listing standards. The Company provides such a summary on the Shell website (www.shell.com/investor).
Remuneration Report 121
Remuneration Report

Aarnout Loudon
Message to shareholders
In our 2003 report to you, the Remuneration and Succession Review Committee undertook to conduct a thorough review of the remuneration policies and practices for Executive Directors and to present proposals for any changes at the 2005 General Meeting of Shareholders.
In conducting this review, the committee consulted with shareholders and also took into account current market practices and governance developments. We believe the resulting proposals will serve shareholders well by linking the remuneration of Executive Directors even more closely to the performance of the Group and providing greater transparency in our reward structures.
The key recommendations are:
| – | | to discontinue stock option grants in favour of grants under the amended Long-Term Incentive Plan, originally approved by shareholders in 2003, which provides a clear focus on performance relative to the Group’s peers; and |
| |
| – | | to amend the Deferred Bonus Plan, under which Executive Directors can elect to invest a portion of their annual bonus in shares, and to introduce long-term performance conditions to the release of most of the matching shares. |
In the following pages you will find further information on our current policies, the proposed changes and the actual remuneration of Directors of the Company in 2004. I hope that on reviewing this information, you will agree that the new plan proposals put forward at the forthcoming General Meeting of Shareholders are in the best interests of the Company and its shareholders. The committee commends these proposals to you.
Aarnout Loudon
Chairman of the Remuneration
and Succession Review Committee
About this report
This report sets out the remuneration policy as it applies and will apply to the Group Chief Executive and other Executive Directors, including those who are also Managing Directors of Royal Dutch, and to the members of the Supervisory Board of Royal Dutch. The policies described are also expected to apply to Directors of Royal Dutch Shell plc if the proposed unification of the Group’s two parent companies under the single parent company, Royal Dutch Shell plc, takes place1.
This report also discloses the individual remuneration of the Managing Directors and Supervisory Board members of Royal Dutch for the year ended December 31, 2004. It has been compiled with reference to the principles and best practice provisions put forward by the Tabaksblat Committee in the Netherlands. In reflection of the joint arrangements between Royal Dutch and Shell Transport, UK corporate governance disclosure requirements have also been taken into account. This report has been approved by the Supervisory Board and its policies will be submitted for approval by shareholders at the General Meeting.
This report contains the following sections:
| – | | The Remuneration and Succession Review Committee; |
| |
| – | | Remuneration policy; |
| |
| – | | 2004 actual remuneration; and |
| |
| – | | Supervisory Board members. |
| 1 | | Further information in respect of the proposed unification transaction and Royal Dutch Shell plc is available at www.shell.com/unification. |
122 Royal Dutch Petroleum Company
The Remuneration and Succession Review Committee
The committee
The Remuneration and Succession Review Committee (REMCO) is a joint committee of the Supervisory Board of Royal Dutch and the Board of Shell Transport. REMCO has three members appointed from the Supervisory Board of Royal Dutch and three members appointed from the Board of Shell Transport. Members of the committee during 2004 are shown in the table below:
Appointed by the Supervisory Board of Royal Dutch
| | | |
| Aarnout Loudon | | Chairman of the Committee |
| Maarten van den Bergh | | Appointed to the Committee with effect from July 1, 2004 |
| Hubert Markl | | |
| Henny de Ruiter | | Retired from the Committee on June 30, 2004 |
Appointed by the Board of Shell Transport
| | | | | |
| Nina Henderson | | | | |
| Sir Peter Job | | | | |
| Lord Kerr of Kinlochard | | | | |
The Chairman of the committee is currently Aarnout Loudon. Of the current Royal Dutch members of the committee only Maarten van den Bergh is not an independent member of the Royal Dutch Supervisory Board, as he served as a Managing Director of the Group from 1992 to 2000, as President of Royal Dutch from 1998 to 2000, and he currently serves as a Managing Director of one of the Group Holding Companies. The Shell Transport members of the committee are currently all independent Non-executive Directors. Biographical details of the REMCO members are shown on page 7.
REMCO’s responsibilities
REMCO is responsible for making recommendations to the Supervisory Board of Royal Dutch and the Board of Shell Transport on the performance of Executive Directors, and on all issues related to remuneration and benefits of Executive Directors. It advises on the terms of any contract to be offered to any Executive Director, including the Group’s liabilities in relation to any provisions for the termination of such contracts. It also reviews and endorses candidates for appointments to the position of Chief Executive and Executive Director and reviews other relevant human resource matters. REMCO is also kept informed of remuneration matters concerning other senior executives of the Group, and periodically reviews these to assess alignment and consistency. In addition to fulfilling these responsibilities, REMCO also undertook a review of long-term incentive plans for Executive Directors.
As a joint committee of two independent boards, REMCO cannot formally determine the remuneration of individual Executive Directors. The committee makes recommendations to the Supervisory Board of Royal Dutch and the Board of Shell Transport. All such recommendations made in 2004 were approved by the Boards.
Following REMCO’s annual review of its Terms of Reference, a revised version, on its recommendation, was approved by the Supervisory Board of Royal Dutch and the Board of Shell Transport in February 2004. They can be found on the Shell website (www.shell.com/investor). Printed copies are available from Investor Relations (see inside back cover for contact details).
During 2004, REMCO met eight times; attendance figures for the individual committee members are shown below:
Attendance
| | | | | | | |
| Members | Attendance |
| Aarnout Loudon | | | 8 | | | Chairman of the Committee |
| Maarten van den Bergh | | | 2 | | | Appointed to the Committee with effect from July 1, 2004 |
| Nina Henderson | | | 8 | | | |
| Sir Peter Job | | | 7 | | | |
| Lord Kerr of Kinlochard | | | 7 | | | |
| Hubert Markl | | | 3 | | | |
| Henny de Ruiter | | | 5 | | | Retired from the Committee on June 30, 2004 |
Advisers to REMCO
During 2004 REMCO sought advice from John Hofmeister, Group Human Resources Director and Secretary to the committee, and from Michael Reiff, Group Head of Remuneration and Benefits. No formal internal or external adviser was appointed by REMCO. Kepler Associates and Towers Perrin provided external data that was collated by Group staff and used in the preparation of briefing papers that REMCO considered when making its decisions.
Remuneration Report 123
Remuneration policy
During 2004, the committee reviewed the remuneration policies for, and the individual remuneration of, the Executive Directors. The committee has recommended a number of changes which will be put forward for shareholder approval at the General Meeting on June 28, 2005 and adopted, if approved by both Royal Dutch and Shell Transport shareholders.
The remuneration policy and plans for the Executive Directors for the 2005 financial year and beyond are described below.
Philosophy
The remuneration policy is intended to recognise and support the Group’s:
| – | | Statement of General Business Principles, including the Group’s core values and commitment to contribute to sustainable development; |
| |
| – | | strategic direction; |
| |
| – | | need to attract and retain talented individuals; |
| |
| – | | aim to motivate and reward Executive Directors for exceptional performance that enhances the value of the Group; and |
| |
| – | | desire to align Executive Directors’ interests with those of shareholders. |
The Group’s remuneration policy is based on the following working principles:
Performance driven
The remuneration structures for Group employees are designed to reward performance that contributes to the achievement of the Group’s objectives. Consistent with this principle, more than half of an Executive Director’s target total remuneration (excluding pension) is performance-linked and weighted to the long term. This proportion is in line with market practice and the long-term nature of the Group’s business.
Competitiveness
Remuneration levels are set by reference to the practice of global groups of companies of comparable size, complexity and international scope. The Group takes a conservative approach to executive remuneration levels within the range of our industry peers, which are the major integrated oil companies.
Consistency
Group remuneration plans covering base pay, annual bonus, and long-term incentives contain similar performance measures and reward structures for Executive Directors and senior management.
Base pay
Base pay is set at a competitive level, appropriate to the scope and complexity of the roles of Chief Executive and Executive Director, and reflecting the reporting structure in the Executive Committee. Base pay levels are set by reference to market-based salary scales. Appropriate market levels are established by benchmarking against three comparator groups. The major integrated oil companies serve as the Group’s industry peers and the AEX10 and FTSE20 are used as the home markets peers. The salary scales are reviewed annually by REMCO and are adjusted in line with market practice with effect from July 1 each year.
The committee recognised the enhanced role of the Chief Executive, compared to his previous role of Chairman of the Committee of Managing Directors and it has adjusted the Chief Executive’s salary level to reflect the increased responsibilities. The current base pay levels of the Chief Executive and the Managing Directors of the Company are:
Current base pay levels
| | | | | |
| Role | € | |
| Chief Executive, Jeroen van der Veer | | | 1,500,000 | |
| Managing Director, Linda Cook | | | 810,000 | |
| Managing Director, Rob Routs | | | 900,000 | |
124 Royal Dutch Petroleum Company
Annual incentive
Executive Directors are eligible for an annual bonus, designed to reward the achievement of results that further the Group’s objectives. Similar structures and mechanisms also apply to annual bonus plans for other Group employees.
As part of the annual business planning process, challenging financial, operational and sustainable development targets are set to form a Group Scorecard. Performance during the year is then measured against this Scorecard and annual bonus awards are made on this basis. For 2005 the Group Scorecard has been simplified and the elements made more transparent as part of the Group’s efforts to set clear priorities and reduce complexity. There are four components to the new Scorecard, each with its own different weighting:
| – | | Total shareholder return (TSR) relative to our industry peers, with a 25% weighting; |
| |
| – | | Operational cash flow, with a 25% weighting; |
| |
| – | | Operational excellence in each of the businesses, with a 30% weighting; and |
| |
| – | | Sustainable development, primarily based on the number of reportable cases of work-related injuries, with a 20% weighting. |
A clear process of measuring performance against the Scorecard has been put in place with agreed definitions, calculation methodologies and controls. The Scorecard elements will also be auditable. Targets are set at stretching but realistic levels. At the end of the financial year the results are translated into an overall Group score, which can range anywhere between zero and two, the minimum and maximum, respectively. Bonus awards are based on the Group score multiplied by the target bonus level with REMCO using its judgment in making its final recommendations. The target level for Executive Directors for 2005 will be 100% of base pay, in line with competitive practices.
Long-term incentives
In 2004, REMCO reviewed the Group’s long-term incentives for Executive Directors and senior management and the outcomes of its review are described below. The committee is recommending changes which will provide greater transparency and a closer link between the remuneration of Executive Directors and senior management and the performance of the Group. Stock option grants will be discontinued in favour of conditional share awards under the Deferred Bonus Plan and the Long-Term Incentive Plan (LTIP), in both cases with vesting subject to the Group’s performance relative to its peers. Amendments to the current Deferred Bonus Plan and to the LTIP will be proposed and both plans will be put to shareholders at the 2005 General Meeting.
The proposed amendments to the Deferred Bonus Plan and the LTIP, outlined below, would not lead to an increase in the overall value of compensation for Executive Directors.
Deferred Bonus Plan
Executive Directors are eligible to participate in the Deferred Bonus Plan. Participation is currently on a voluntary basis only. The plan serves to provide Executive Directors with an investment opportunity which aligns their interests with those of shareholders during the deferral period and encourages share ownership.
Under the plan, Executive Directors can elect to invest a proportion of their annual bonus in shares. Provided that a participant remains in Group employment for three years following the deferral, or retires within the three-year period, he or she will be eligible for matching shares. The deferred bonus shares, together with shares equivalent to the value of dividends payable on the deferred bonus shares (dividend shares) and matching shares, are released three years after deferral.
REMCO has considered shareholder feedback on the current arrangements and has recommended that the proportion of annual bonus able to be deferred be increased and that performance conditions be attached to the release of matching shares.
The amended plan will allow Executive Directors to invest up to 50% of their annual bonus in shares. From 2006, 25% of their annual bonus will be deferred on a mandatory basis. A participant will receive one matching share for every four deferred bonus and dividend shares accumulated. Provided that the performance condition is met, he or she will receive up to three further performance-based matching shares.
The performance condition is the Total Shareholder Return (TSR) of the Group against the major integrated oil companies, as follows:
| – | | TSR ranked 5th or 4th: no performance-based matching shares; |
| |
| – | | TSR ranked 3rd: one performance-based matching share; |
| |
| – | | TSR ranked 2nd: two performance-based matching shares; |
| |
| – | | TSR ranked 1st: three performance-based matching shares. |
Deferrals in relation to the 2004 annual bonus have been made on these amended terms, conditional upon the approval of the Plan.
Remuneration Report 125
Long-Term Incentive Plan
Under the LTIP, performance shares are awarded conditionally once a year. If amendments to the LTIP are approved at the General Meeting of Shareholders in 2005, the plan will allow for a conditional award of shares with a face value of zero to two and a half times base pay. The performance period will be no less than three consecutive years. The receipt of shares will be conditional on the satisfaction of performance criteria over the performance period and on the participant remaining in employment (subject to certain exceptions, including retirement). The number of shares received by Executive Directors at the end of the performance period will depend on the TSR performance of the Group relative to its industry peers:
| – | | 200% of an award will be released if the Group is in first place; |
| |
| – | | 150% for second place; |
| |
| – | | 80% for third place; |
| |
| – | | awards will lapse entirely if the Group is in fourth or fifth place. |
For any award to be released to Executive Directors the committee must be assured of the underlying performance of the Group. For this, it will take into consideration the Group Scorecard results, excluding TSR, over the applicable performance period, as it provides quantifiable measures of the Group’s performance and operational excellence.
Industry peer group for base pay, annual bonus, deferred bonus, and LTIP
Major integrated oil companies
as at January 1, 2005
| | | | | |
| BP | | | | |
| ChevronTexaco | | | | |
| ExxonMobil | | | | |
| Royal Dutch/Shell Group | | | | |
| Total | | | | |
Pension policy
Retirement benefit arrangements for all staff are based on local market conditions and the overall value of the remuneration package necessary to attract and retain high-calibre individuals. They take into account factors such as costs, affordability, sustainability, sharing of investment risks, and local legislation.
For the Dutch Executive Directors1the principal source of their pensions is the Stichting Shell Pensioenfonds (SSPF). This is a defined benefit fund to which Executive Directors contribute the same percentage of relevant earnings as other employees. Contributions to the pension fund are based on the advice of actuaries. Neither the annual bonus nor the deferred bonuses are pensionable.
The latest date on which the Dutch Executive Directors may retire is on June 30, following their 60th birthday. Currently a change in retirement age is under consideration for the pension plan offered by the SSPF. A change to age 65 with effect from January 1, 2006 is proposed. Details of the proposal and its effects will be assessed further during 2005. There are provisions in the SSPF for a surviving dependant benefit of 70% of actual or prospective pension. In case of death-in-service, a lump sum of two times annual base pay is paid by the respective Group company.
For the American Executive Director2 the principal sources of pension include pension plans and savings plans. Pension plans in which she participates are the Shell Pension Plan, and the US Senior Staff Pension Plan. These are defined benefit plans which are non-contributory. Savings plans are the Shell Provident Fund for US employees, the Shell Pay Deferral Investment Fund for US employees, the Senior Executive Group Deferral Plan and the Senior Staff Savings Fund. These are defined contribution plans which are contributory on a voluntary basis. In line with standard US market practice the annual bonus is pensionable.
As there is no mandatory or normal retirement date in the USA, pensions include provisions to allow for retirement at age 60. There are also provisions for a dependant benefit of 50% of actual or prospective pension. A lump sum death-in-service payment is not offered under the plans.
Other benefits policy
Executive Directors are eligible to participate in regular employee benefit plans applying in their home countries including a company car benefit. Personal loans or guarantees are not granted to Executive Directors.
All-employee share schemes
Executive Directors are not eligible to participate in the Global Employee Share Purchase Plan.
| 1 | | Dutch Managing Directors of Royal Dutch during 2004 were Jeroen van der Veer, Rob Routs, and Walter van de Vijver. Walter van de Vijver resigned as a Managing Director of Royal Dutch on March 3, 2004 and his employment terminated with effect from September 1, 2004. |
| |
| 2 | | Linda Cook, a US citizen, was appointed as a Managing Director of Royal Dutch on August 1, 2004. |
126 Royal Dutch Petroleum Company
Contracts policy
Contracts for Executive Directors are based on country-specific labour laws and market practice. They contain similar terms and conditions as for senior employees in the country concerned. The contracts end at retirement date or by notice of either party. Notice periods are in line with those of other senior employees.
Standard Executive Directors contracts do not contain any predetermined settlements for early termination. If and when a situation arises in which a severance payment is appropriate, its terms and conditions will be recommended by REMCO and decided by the Supervisory Board taking into account applicable law and corporate governance provisions. In the case of Executive Directors appointed from outside the Group, temporary severance arrangements may be agreed to facilitate the recruitment process. The Company will bear the costs of legal proceedings against a Managing Director, except if the Managing Director concerned is ruled to be seriously at fault by a court of law.
External appointments
External appointments are considered to be valuable in terms of broadening the experience and knowledge of Executive Directors to the benefit of the Group, provided there is no conflict of interest and the commitment required is not excessive. Such appointments are subject to the explicit approval of the Supervisory Board. Monetary payments received by Executive Directors from external directorships and similar sources are required to be paid over to and retained by their employing company.
Shareholdings
Following discussions with shareholders in 2004, a new shareholding policy has been introduced. Executive Directors are expected to build up shareholdings to the value of two times their base pay over five years. Until the targets are met, they are required to retain 50% of the shares received through the vesting of future LTIP awards and vested matching shares under the Deferred Bonus Plan. Once the targets have been met, they are required to hold the shares and maintain that level until retirement. Details of Managing Directors’ shareholdings can be found under Other Information on page 134. Details of Managing Directors’ options can be found in the Stock options table on page 129.
2004 actual remuneration1
Base pay
Salary scales were not increased during 2004. With effect from March 3, 2004, Jeroen van der Veer’s base pay was increased to the base pay level of the Chairman of the Committee of Managing Directors on his appointment to this role and with effect from November 1, 2004, it was increased to reflect the increased responsibilities of Chief Executive of the Group.
Annual incentive
Executive Directors were eligible for a bonus related to the 2004 financial year. Performance during the year was measured against the 2004 Group Scorecard which contained stretching financial, operational and sustainable development targets. The financial objectives related to TSR relative to other major integrated oil companies, and to Return on Average Capital Employed (ROACE). The operational objectives related to portfolio value growth with key targets for each business. The sustainable development objectives focused on people, brand, health, safety, environment and reputation. The 2004 Scorecard weightings were 60% for financial objectives, 20% for operational objectives and 20% for sustainable development objectives. The target level of bonus for the year 2004 was 100% of base pay, in line with market practice.
The overall 2004 Group Scorecard score was 0.9 and REMCO confirmed the outcome. Having regard to the Group’s performance against all targets, REMCO recommended and it was decided that the annual bonuses payable to Executive Directors in respect of the year 2004 are 90% of base pay.
| 1 | | The information in the tables in this section has been subjected to audit by KPMG Accountants N.V., except for the Expected value columns in the Stock options table and in the Long-Term Incentive Plan table on pages 129 and 130, which are unaudited. |
Remuneration Report 127
Stock options
Stock options granted to Executive Directors in 2004 were 100% performance-linked. The financial performance criteria were TSR and ROACE, calculated as the average result of the three financial years prior to grant. TSR was measured against the other major integrated oil companies. These stock options vest three years after grant and remain exercisable for ten years after grant.
Stock options granted in March 2002 were 50% performance-linked and were due to vest in March 2005. The performance period for the options was January 1, 2002 to December 31, 2004. The Royal Dutch/Shell Group ranked fourth in TSR against the industry peer group (three-year average over the period 2002 to 2004). Taking all these factors into consideration, the committee determined that none of the performance vesting stock options should vest. Based on this determination, half of the stock options granted to Executive Directors and Senior Executives in 2002 will vest based on time, and the other half of the stock options granted in 2002 will lapse.
Long-Term Incentive Plan
REMCO recommended that Executive Directors be made a conditional award of performance shares under the LTIP with a face value of two times the individual’s base pay. The actual number of shares received will be determined in 2007 and will be based on the Group’s performance and competitive position over the period 2004 to 2006. The performance targets are linked to relative TSR over the three-year performance period. TSR is measured relative to two separate groups of comparator companies. The first comparator group consists of the AEX10 together with the FTSE20 as at January 1, 2004 (see table opposite). The second comparator group consists of the five major integrated oil companies.
Half of each conditional award will be tested against the first group and half against the second group. For the first comparator group, 100% of the shares tested against that group will be awarded for performance in the top quartile and 25% will be awarded for performance at the median. Between these two points a straight-line calculation will be used. No shares will be received for performance below the median. For the second comparator group, 100% of the shares tested against that group will be received if the Group is in first place, 75% for second place and 50% for third place. No shares will be received for fourth or fifth place.
Home markets peer group for LTIP in 2004
| | | |
| AEX10 | | FTSE20 |
| as at January 1, 2004 | as at January 1, 2004 |
| ABN AMRO | | Anglo American |
| AEGON | | AstraZeneca |
| Ahold | | Barclays |
| Fortis | | BHP Billiton |
| Heineken | | BP |
| ING Group | | British American Tobacco |
| KPN | | British Sky Broadcasting |
| Philips | | BT |
| Royal Dutch | | Diageo |
| Unilever N.V. | | GlaxoSmithKline |
| | HBOS |
| | HSBC |
| | Lloyds TSB |
| | National Grid Transco |
| | Rio Tinto |
| | Royal Bank of Scotland |
| | Shell Transport |
| | Tesco |
| | Unilever PLC |
| | Vodafone |
| a | | In the case of Royal Dutch and Shell Transport, and Unilever N.V. and Unilever PLC, the weighted average TSR of the two companies will be used. |
128 Royal Dutch Petroleum Company
Emoluments of Managing Directors of Royal Dutch in office during 2004
| | | | | | | | | | | | | | | | | | | | | |
| | | | | | | | | | | | | | | | | | | € | |
| | | | | | | | | | | Payment | | | | | | | |
| | | | | | | Annual | | | following | | | Other | | | | |
| | | Salaries | | | bonusa | | | severance | | | benefitsb | | | Total | |
| |
| Jeroen van der Veer | | | | | | | | | | | | | | | | | | | | |
2004 | | | 1,281,774 | c | | | 1,350,000 | | | | — | | | | 18,043 | | | | 2,649,817 | |
| 2003 | | | 1,120,000 | | | | 0 | | | | — | | | | 11,502 | | | | 1,131,502 | |
| 2002 | | | 1,013,729 | | | | 1,230,500 | d | | | — | | | | 4,768 | | | | 2,248,997 | |
| |
| Malcolm Brinded | | | | | | | | | | | | | | | | | | | | |
2004e | | | 148,080 | | | | 160,593 | f | | | — | | | | 6,156 | | | | 314,829 | |
| 2003 | | | 800,000 | | | | 0 | | | | — | | | | 23,707 | | | | 823,707 | |
2002e | | | 372,500 | | | | 428,375 | d | | | — | | | | 2,210 | g | | | 803,085 | |
| |
| Linda Cook | | | | | | | | | | | | | | | | | | | | |
2004h | | | 338,892 | | | | 442,000 | | | | — | | | | 189,623 | | | | 970,515 | |
| |
| Rob Routs | | | | | | | | | | | | | | | | | | | | |
2004 | | | 884,516 | | | | 810,000 | | | | — | | | | 139,850 | | | | 1,834,366 | |
2003i | | | 405,000 | | | | 0 | | | | — | | | | 55,612 | | | | 460,612 | |
| |
| Walter van de Vijver | | | | | | | | | | | | | | | | | | | | |
2004j | | | 186,774 | | | | 0 | | | | 1,900,000 | | | | 7,074 | | | | 2,093,848 | |
| 2003 | | | 842,500 | | | | 0 | | | | — | | | | 26,060 | | | | 868,560 | |
| 2002 | | | 735,095 | | | | 902,750 | | | | — | | | | 18,091 | k | | | 1,655,936 | |
| |
| a | | The annual bonus is included in the related performance year and not in the following year in which it is paid. |
| |
| b | | Includes social security premiums paid by the employer, employer’s contribution to the health insurance plan, where applicable school fees and other benefits stated at a value employed by the Fiscal Authorities in the Netherlands. |
| |
| c | | Jeroen van der Veer’s salary increase with effect from November 1, 2004 did not come into payment until 2005 and will therefore be reported in the 2005 Annual Report and Accounts. |
| |
| d | | Of which one-third was deferred under the Deferred Bonus Plan. |
| |
| e | | Malcolm Brinded was appointed as a Managing Director of Royal Dutch with effect from July 1, 2002 until March 3, 2004, therefore, where appropriate, the 2002 and 2004 emoluments are prorated. |
| |
| f | | Malcolm Brinded’s 2004 annual bonus amounted to £634,500 for the full year. His annual bonus from March 4, 2004 to December 31, 2004 has been listed in the 2004 Shell Transport Annual Report and Accounts. Sterling converted to euro at the quarterly average rate of exchange. |
| |
| g | | Exclusive of deferred payment in shares amounting to £386,000 granted in 1999. |
| |
| h | | Linda Cook was appointed as a Managing Director of Royal Dutch with effect from August 1, 2004, therefore, where appropriate, the 2004 emoluments are prorated. US dollar converted to euro at the monthly average rate of exchange. |
| |
| i | | Rob Routs was appointed as a Managing Director of Royal Dutch with effect from July 1, 2003, therefore, where appropriate, the 2003 emoluments are prorated. |
| |
| j | | Walter van de Vijver resigned as a Managing Director of Royal Dutch on March 3, 2004, therefore, where appropriate, the 2004 emoluments are prorated. |
| |
| k | | Exclusive of deferred payment in shares amounting to€688,839 granted in 1999. |
Deferred Bonus Plan
| | | | | | | | | | | | | | | | | | | | | | | | | |
| | | | | | | | | | | | | | | | | | | | | | | Total number | |
| | | | | | | | | | | | | | | | | | | Average | | | of deferred | |
| | | Number of deferred | | | | | | | Market price | | | | | | | market price of | | | bonus and | |
| | | bonus and | | | Deferred | | | of deferred | | | | | | | dividend shares | | | dividend shares | |
| | | dividend shares | | | bonus shares | | | bonus shares | | | Dividend | | | paid during | | | under award | |
| | | under award as at | | | awarded | | | at awardb | | | shares accrued | | | the yeard | | | as at December | |
| | | January 1, 2004 | | | during the yeara | | | € | | | during the yearc | | | € | | | 31, 2004 | |
| |
| Jeroen van der Veer | | | | | | | | | | | | | | | | | | | | | | | | |
| 2003 award | | | 11,695 | | | | — | | | | 36.66 | | | | 503 | | | | 41.71 | | | | 12,198 | |
| 2002 award | | | 3,710 | | | | — | | | | 60.09 | | | | 159 | | | | 41.71 | | | | 3,869 | |
| |
Awards made in 2002 and 2003 refer to the portion of the 2001 and 2002 annual bonus which was deferred in 2002 and 2003 and their related accrued dividends. In 2004 there was no opportunity for Managing Directors of Royal Dutch to defer any of their 2003 bonuses into the Deferred Bonus Plan, as no 2003 bonuses were awarded.
Due to his appointment as a Managing Director of Shell Transport in 2004 Malcolm Brinded’s Deferred Bonus Plan interests have been reported in the Shell Transport 2004 Annual Report and Accounts.
| a | | Representing the proportion of the annual bonus that has been deferred and converted into notional share entitlements (deferred bonus shares), in which there is no beneficial ownership. The value of these deferred bonus shares is also included in the annual bonus figures in the Emoluments of the Managing Directors of Royal Dutch table above. |
| |
| b | | The market price is based on the average share price over a period of five trading days prior to and including the day on which the share awards are made. |
| |
| c | | Representing dividends paid during the year on the number of shares equal to the deferred bonus shares awarded. |
| |
| d | | The market price shown is the average at the date of the 2003 second interim and 2004 interim annual dividends paid during the year:€41.08 and€42.34, respectively. |
Remuneration Report 129
Stock Options
Royal Dutch
| | | | | | | | | | | | | | | | | | | | | | | | | | | | | | | | | | | | | | | | | |
| | | Number of options | | | | | | | | | | | | | | | Expected | | | | | | | |
| | | | | | | | | | | Exercised | | | | | | | | | | | | | | | | | | | value of | | | Realisable | | | Realised | |
| | | | | | | | | | | (cancelled/ | | | | | | | | | | | | | | | | | | | the 2004 | | | gains as at | | | gains on | |
| | | | | | | Granted | | | lapsed) | | | | | | | Exercise | | | | | | | | | | | stock options | | | Dec 31, | | | stock options | |
| | | At Jan 1, | | | during | | | during | | | At Dec 31, | | | pricea | | | Exercisable | | | Expiry | | | grantb | | | 2004c | | | exercised | |
| | | 2004 | | | the year | | | the year | | | 2004 | | | € | | | from date | | | date | | | € | | | € | | | € | |
| |
| Jeroen van der Veer | | | 40,850 | | | | — | | | | — | | | | 40,850 | | | | 41.16 | | | | 22.12.01 | | | | 21.12.08 | | | | — | | | | 48,612 | | | | — | |
| | | | 33,750 | | | | — | | | | — | | | | 33,750 | | | | 59.54 | | | | 23.03.03 | | | | 22.03.10 | | | | — | | | | 0 | | | | — | |
| | | | 80,000 | | | | — | | | | (40,000 | ) | | | 40,000 | | | | 62.60 | | | | 26.03.04 | | | | 25.03.11 | | | | — | | | | 0 | | | | — | |
| | | | 105,000 | | | | — | | | | — | | | | 105,000 | | | | 62.10 | | | | 21.03.05 | | | | 20.03.12 | | | | — | | | | — | | | | — | |
| | | | 150,000 | | | | — | | | | — | | | | 150,000 | | | | 36.81 | | | | 19.03.06 | | | | 18.03.13 | | | | — | | | | — | | | | — | |
| | | | — | | | | 150,000 | | | | — | | | | 150,000 | | | | 41.29 | | | | 07.05.07 | | | | 06.05.14 | | | | 1,362,570 | | | | — | | | | — | |
| |
| Linda Cook | | | — | | | | 106,300 | d | | | — | | | | 106,300 | | | | 42.67 | | | | 05.11.07 | | | | 04.11.14 | | | | 997,881 | | | | — | | | | — | |
| |
| Rob Routs | | | 20,000 | | | | — | | | | — | | | | 20,000 | | | | 41.16 | | | | 22.12.01 | | | | 21.12.08 | | | | — | | | | 23,800 | | | | — | |
| | | | 18,000 | | | | — | | | | — | | | | 18,000 | | | | 59.54 | | | | 23.03.03 | | | | 22.03.10 | | | | — | | | | 0 | | | | — | |
| | | | 50,000 | | | | — | | | | — | | | | 50,000 | | | | 62.10 | | | | 21.03.05 | | | | 20.03.12 | | | | — | | | | — | | | | — | |
| | | | 49,400 | | | | — | | | | — | | | | 49,400 | | | | 36.81 | | | | 19.03.06 | | | | 18.03.13 | | | | — | | | | — | | | | — | |
| | | | 50,066 | | | | — | | | | — | | | | 50,066 | | | | 40.95 | | | | 19.08.06 | | | | 18.08.13 | | | | — | | | | — | | | | — | |
| | | | — | | | | 115,000 | | | | — | | | | 115,000 | | | | 41.29 | | | | 07.05.07 | | | | 06.05.14 | | | | 1,044,637 | | | | — | | | | — | |
| |
Walter van de Vijvere | | | 10,000 | | | | — | | | | — | | | | 10,000 | | | | 48.92 | | | | 11.12.00 | | | | 10.12.07 | | | | — | | | | 0 | | | | — | |
| | | | 20,000 | | | | — | | | | — | | | | 20,000 | | | | 41.16 | | | | 22.12.01 | | | | 21.12.08 | | | | — | | | | 23,800 | | | | — | |
| | | | 24,000 | | | | — | | | | — | | | | 24,000 | | | | 59.54 | | | | 23.03.03 | | | | 31.08.09 | | | | — | | | | 0 | | | | — | |
| | | | 7,500 | | | | — | | | | — | | | | 7,500 | | | | 68.73 | | | | 23.08.03 | | | | 31.08.09 | | | | — | | | | 0 | | | | — | |
| | | | 40,000 | | | | — | | | | (20,000 | ) | | | 20,000 | | | | 62.60 | | | | 26.03.04 | | | | 31.08.09 | | | | — | | | | 0 | | | | — | |
| | | | 75,000 | | | | — | | | | — | | | | 75,000 | | | | 62.10 | | | | 21.03.05 | | | | 31.08.09 | | | | — | | | | — | | | | — | |
| | | | 115,000 | | | | — | | | | — | | | | 115,000 | | | | 36.81 | | | | 19.03.06 | | | | 31.08.09 | | | | — | | | | — | | | | — | |
| |
Maarten van den Berghf | | | 37,950 | | | | — | | | | — | | | | 37,950 | | | | 41.16 | | | | 22.12.01 | | | | 29.06.05 | | | | — | | | | 45,161 | | | | — | |
| |
Royal Dutchg | | | | | | | | | | | | | | | | | | | $ | | | | | | | | | | | | | | | | € | | | | | |
| |
Linda Cookh | | | 13,087 | i | | | — | | | | — | | | | 13,087 | | | | 54.31 | | | | 05.03.99 | | | | 05.03.08 | | | | — | | | | 29,462 | j | | | — | |
| | | | 23,000 | i | | | — | | | | — | | | | 23,000 | | | | 43.50 | | | | 04.03.00 | | | | 04.03.09 | | | | — | | | | 234,099 | j | | | — | |
| | | | 45,000 | | | | — | | | | — | | | | 45,000 | | | | 52.08 | | | | 01.03.01 | | | | 01.03.10 | | | | — | | | | 174,892 | j | | | — | |
| | | | 2,175 | | | | — | | | | — | | | | 2,175 | | | | 56.33 | | | | 21.04.01 | | | | 21.04.10 | | | | — | | | | 1,675 | j | | | — | |
| | | | 70,000 | | | | — | | | | (26,250 | ) | | | 43,750 | | | | 60.75 | | | | 08.03.02 | | | | 07.03.11 | | | | — | | | | 0 | | | | — | |
| | | | 70,000 | | | | — | | | | — | | | | 70,000 | | | | 54.35 | | | | 21.03.03 | | | | 20.03.12 | | | | — | | | | 155,533 | j | | | — | |
| | | | 70,500 | | | | — | | | | — | | | | 70,500 | | | | 40.64 | | | | 19.03.04 | | | | 18.03.13 | | | | — | | | | 865,419 | j | | | — | |
| |
Shell Canada Limited | | | | | | | | | | | | | | | | | | CAD | | | | | | | | | | | | | | | | | | | | € | |
| |
Linda Cookd | | | 120,000 | | | | — | | | | (120,000 | ) | | | 0 | | | | 62.55 | | | | 28.01.04 | | | | 26.07.04 | | | | — | | | | — | | | | 23,710 | k |
| |
Rob Routsl | | | 7,500 | | | | — | | | | 7,500 | | | | 0 | | | | 17.83 | | | | 29.01.97 | | | | 28.01.07 | | | | — | | | | — | | | | 230,659 | m |
| | | | 24,000 | | | | — | | | | 24,000 | | | | 0 | | | | 23.50 | | | | 27.01.98 | | | | 26.01.08 | | | | — | | | | — | | | | 646,619 | n |
| |
Due to his appointment as a Managing Director of Shell Transport in 2004, Malcolm Brinded’s stock options interests have been reported in the Shell Transport 2004 Annual Report and Accounts.
| a | | The exercise price is the average of the opening and closing share prices over a period of five trading days prior to and including the day on which the options are granted (no discount). |
| |
| b | | The expected values of the 2004 stock options grants have been calculated on the basis of the Black-Scholes model valuations provided by Towers Perrin and Kepler Associates. The values are unaudited. The expected value is equal to 22% of the face value of the grant. |
| |
| c | | Represents the value of unexercised stock options at the end of the financial year, which is calculated by taking the difference between the exercise price of the option and the fair market value of Royal Dutch shares at December 31, 2004, and multiplied by the number of shares under option at December 31, 2004. The actual gain, if any, a Managing Director will realise, will depend on the market price of the Royal Dutch shares at the time of exercise. |
| |
| d | | As CEO of Shell Canada Limited (SCL) Linda Cook was awarded 120,000 options in January 2004. Half of these options were subject to performance conditions. Upon her appointment as a Managing Director of Royal Dutch, Linda Cook was prohibited from exercising any SCL options. All the SCL options were therefore cancelled on July 26, 2004. Linda Cook was paid a cash equivalent to the paper value of 10,000 of the non-performance related shares, on the basis that Linda Cook had qualified for one-sixth of these options on a time prorated basis. She also received a replacement grant of 106,300 options over Royal Dutch shares in respect of the potential value of the options cancelled, in relation to both the remaining performance related shares and the non-performance related shares, offset by the cash payment to her. |
| |
| e | | Upon Walter van de Vijver’s termination of employment on September 1, 2004, the exercise terms of his remaining stock options have been shortened so that they expire five years after the termination of his employment, on August 31, 2009, or earlier if their original expiry date is prior to August 31, 2009. Walter van de Vijver did not receive any stock option grants in 2004. |
| |
| f | | Maarten van den Bergh holds share options relating to his former service with the Group. |
| |
| g | | Options over Royal Dutch New York shares. |
| |
| h | | During her employment with the Group and prior to her appointment as Chief Executive Officer of Shell Canada Limited, Linda Cook was awarded US-dollar based options and Stock Appreciation Rights, as well as 14,000 conditional Royal Dutch ordinary shares on October 1, 2002; the latter will be released on October 1, 2005. |
| |
| i | | Stock Appreciation Rights with an entitlement to receive any gain upon exercise in either cash or shares. |
| |
| j | | US dollar converted to euro at the year-end rate of exchange. |
| |
| k | | The exercise price was CAD 66.36. Canadian dollar converted to euro at the mean rate of exchange on the day of exercise. |
| |
| l | | Rob Routs’ Shell Canada Limited stock options were awarded to him in 1997 and 1998, when he was a Shell Canada executive. |
| |
| m | | The price at which the options were exercised was CAD 66.65. Canadian dollar converted to euro at the mean rate of exchange on the day of exercise. |
| |
| n | | The price at which the options were exercised was CAD 66.27. Canadian dollar converted to euro at the mean rate of exchange on the day of exercise. |
130 Royal Dutch Petroleum Company
Long-Term Incentive Plan (LTIP)
| | | | | | | | | | | | | | | | | | | | | | | | | | | | | | | | | | | | | |
| | | | | | | Performance | | | | | | | | | | | | | | | | | | | | | | | Expected value | | | Theoretical | |
| | | | | | | shares | | | | | | | | | | | Market price at | | | | | | | | | | | of the 2004 | | | gains as | |
| | | | | | | conditionally | | | Released | | | | | | | date of | | | Start of | | | End of | | | performance | | | at Dec 31, | |
| | | At Jan 1, | | | awarded during | | | (cancelled/lapsed) | | | At Dec 31, | | | awarda | | | performance | | | performance | | | shares awardb | | | 2004c | |
| | | 2004 | | | the year | | | during the year | | | 2004 | | | € | | | period | | | period | | | € | | | € | |
| |
| Jeroen van der Veer | | | | | | | | | | | | | | | | | | | | | | | | | | | | | | | | | | | | |
| 2004 | | | — | | | | 63,211 | | | | — | | | | 63,211 | | | | 41.29 | | | | 01.01.04 | | | | 31.12.06 | | | | 1,122,292 | | | | — | |
| 2003 | | | 57,142 | | | | — | | | | — | | | | 57,142 | | | | 40.95 | | | | 01.01.03 | | | | 31.12.05 | | | | — | | | | 0 | |
| |
| Rob Routs | | | | | | | | | | | | | | | | | | | | | | | | | | | | | | | | | | | | |
| 2004 | | | — | | | | 43,594 | | | | — | | | | 43,594 | | | | 41.29 | | | | 01.01.04 | | | | 31.12.06 | | | | 773,998 | | | | — | |
| 2003 | | | 39,560 | | | | — | | | | — | | | | 39,560 | | | | 40.95 | | | | 01.01.03 | | | | 31.12.05 | | | | — | | | | 0 | |
| |
Walter van de Vijverd | | | | | | | | | | | | | | | | | | | | | | | | | | | | | | | | | | | | |
| 2003 | | | 43,956 | | | | — | | | | (43,956 | ) | | | — | | | | 40.95 | | | | 01.01.03 | | | | 31.12.05 | | | | — | | | | — | |
| |
Due to his appointment as a Managing Director of Shell Transport in 2004, Malcolm Brinded’s LTIP interests have been reported in the Shell Transport 2004 Annual Report and Accounts.
| a | | The market price is based on the average of the opening and closing share prices over a period of five trading days prior to and including the day on which the number of shares are determined in accordance with the Plan rules. |
| |
| b | | The expected values of the conditional performance shares awards have been calculated on the basis of a standard valuation approach provided by Towers Perrin and Kepler Associates. The values are unaudited. The expected value based on this approach is equal to 43% of the face value of the award. |
| |
| c | | Represents the value of the conditional performance shares under the LTIP at the end of the financial year, which is calculated by multiplying the fair market value of Royal Dutch shares, at December 31, 2004, by the number of shares under the LTIP that would vest based on the achievement of performance conditions up to December 31, 2004. |
| |
| d | | Walter van de Vijver resigned as a Managing Director of Royal Dutch on March 3, 2004 and his employment contract terminated on September 1, 2004. None of the conditional award of Royal Dutch shares made to him in August 2003 under the Long-Term Incentive Plan vested. He did not receive any further Long-Term Incentive Plan awards in 2004. |
Pensions
| | | | | | | | | | | | | | | | | | | | | | | | | |
| | | | | | | | | | | Increase | | | Accumulated | | | Pension | | | Pension | |
| | | | | | | Years of | | | in accrued | | | annual | | | premium 2004 | | | premium 2003 | |
| | | | | | | Group | | | pension | | | pension as at | | | paid by | | | paid by | |
| | | Age as at | | | service as at | | | during 2004 | | | Dec 31, 2004 | | | employer | | | employer | |
| | | Dec 31, 2004 | | | Dec 31, 2004 | | | € thousand | | | € thousand | | | € thousand | | | € thousand | |
| |
Jeroen van der Veera | | | 57 | | | | 33 | | | | 102 | | | | 777 | | | | 256 | | | | 171 | |
| |
Malcolm Brindedb | | | 51 | | | | 30 | | | | — | | | | — | | | | 46 | c | | | 622 | d |
| |
Linda Cooke | | | 46 | | | | 24 | | | | 21 | f | | | 324 | g | | | 8 | h | | | — | |
| |
| Rob Routs | | | 58 | | | | 26 | | | | 54 | | | | 506 | | | | 177 | | | | 81 | i |
| |
| Walter van de Vijver | | | 49 | | | | 25 | j | | | 10 | | | | 385 | | | | 120 | k | | | 129 | |
| |
| a | | Jeroen van der Veer’s salary increase with effect from November 1, 2004 did not come into payment until 2005. The pension figures in the 2005 Annual Report and Accounts will reflect this increase. |
| |
| b | | Malcolm Brinded resigned as a Managing Director of Royal Dutch on March 3, 2004 and was appointed Managing Director of Shell Transport on the same date. Therefore his pension figures for the full year 2004 have been disclosed in the Shell Transport Annual Report and Accounts 2004. |
| |
| c | | Represents pension premium paid by the employer up to March 3, 2004. Sterling converted to euro at the quarterly average rate of exchange. |
| |
| d | | As a result of the 2002 valuation of the SOCPF fund, the Actuary requested that an additional one-time company contribution to the fund be paid. The amount stated comprises the basic pension increase and a prorated amount relating to this additional employer contribution. Sterling converted to euro at the average quarterly rate of exchange. |
| |
| e | | Linda Cook was appointed a Managing Director of Royal Dutch with effect from August 1, 2004, therefore, where appropriate, the 2004 pension figures are with effect from this date. |
| |
| f | | Includes an accrued pension increase and a movement in the exchange rate between the US dollar and euro over the period disclosed; US dollar converted to euro at the quarterly average rate of exchange. |
| |
| g | | US dollar converted to euro at the year-end rate of exchange. |
| |
| h | | US dollar converted to euro at the quarterly average rate of exchange. In addition, the Company contributed€42,650 based on the quarterly average exchange rate to the Shell Provident Fund for US employees and the Senior Executive Group Deferral Plan, both of which are defined contribution plans. |
| |
| i | | The 2003 pension premium paid by the employer is reflective of Rob Routs’ appointment as a Managing Director of Royal Dutch with effect from July 1, 2003. |
| |
| j | | As at August 31, 2004. |
| |
| k | | The 2004 pension premium paid by the employer is reflective of Walter van de Vijver’s termination of employment on September 1, 2004. |
Remuneration Report 131
Pensions
For employees in the Netherlands, their 2004 contribution to the pension plan offered by the Stichting Shell Pensioenfonds was 8% of the amount of pensionable salary above the premium threshold. The company contribution rate was 20% during 2004.
Company contributions were not required for the US Senior Staff Pension Plan during 2004. The employing company’s contribution rate for the Shell Pension Plan was 5.1% in 2004. Executive Directors are not required to contribute to these plans.
Managing Directors’ contracts of service
Managing Directors of Royal Dutch do not have a contract of service with Royal Dutch. Jeroen van der Veer and Rob Routs have employment contracts with one of the Group Holding Companies that provide entitlement to the statutory notice period applicable to the employees in the Netherlands, being one month for an employee and, depending on the duration of employment, a maximum of four months for the employer. Such contracts expire on the expected date of retirement which is June 30 following their 60th birthday. Walter van de Vijver was employed with one of the Group Holding Companies on similar terms and conditions. Linda Cook’s employment contract is with Shell Expatriate Employment US Inc. on an ‘‘at-will’’ basis.
There are no predetermined termination compensation arrangements in place for Managing Directors of Royal Dutch.
Walter van de Vijver resigned as Managing Director of the Company on March 3, 2004. His employment terminated with effect from September 1, 2004. Under the terms of the agreement addressing termination of his employment contract, Walter van de Vijver will be eligible to receive a total amount of up to€3.8 million. This amount was determined by reference to the so called ‘‘Kantonrechtersformule’’, the formula used by the courts in the Netherlands to determine compensation upon termination of employment contracts, taking into account, amongst other things, his 25 years of service with the Group. Under the agreement, an amount of€1.9 million was paid out following termination of his employment contract. Another€1.9 million is held in escrow and is subject to continuing co-operation with and review by relevant authorities, amongst other conditions. Walter van de Vijver did not receive a performance-related annual bonus or stock options or any awards under the LTIP in respect of 2004. The exercise terms of his stock options have been shortened to expire five years after the termination of his employment, on August 31, 2009, or earlier if the original expiry date is prior to August 31, 2009. The schedule for his stock options is disclosed in the Stock Options table on page 129. None of the conditional award of 43,956 Royal Dutch shares made to Walter van de Vijver in August 2003 under the Long-Term Incentive Plan vested on September 1, 2004. From June 30, 2015, Walter van de Vijver has the legal right to a deferred pension of€385,388 per annum under the Stichting Shell Pensioenfonds pension scheme to which he has contributed over the past 25 years. Under pre-existing provisions, Mr Van de Vijver is also entitled to the reimbursement of litigation costs under certain circumstances.
132Royal Dutch Petroleum Company
Supervisory Board members
Policy
The remuneration of the members of the Supervisory Board is, in accordance with the Articles of Association, the responsibility of the General Meeting and is determined within the limits set by shareholders. The Articles of Association provide for an amount to be fixed by the General Meeting that shall serve as the basis for the remuneration of members of the Supervisory Board. At the General Meeting held on May 16, 2002, that amount was set at€75,000 multiplied by the number of members of the Supervisory Board holding office during any year or proportionately during part of a year. This amount constitutes the maximum aggregate remuneration in respect of any year for all members of the Supervisory Board. Out of these funds, the Supervisory Board fixes the amount of the remuneration for each of its members, taking into account any special duties performed by a member. Within the limits set by shareholders, the level of remuneration is reviewed from time to time by the Supervisory Board to ensure it is in line with Supervisory Board members’ fee levels of other major listed companies, and adjustments are made when appropriate. Personal loans or guarantees are not granted to members of the Supervisory Board. The Company will bear the costs resulting from legal proceedings against a member of the Supervisory Board, except if the member concerned is ruled to be seriously at fault by a court of law.
Fees
At its last review in December 2002, the Supervisory Board resolved to increase the Supervisory Board fees to€55,000 per annum and the additional fee for the Chairman to€15,000 per annum, with effect from January 1, 2003. Also an additional fee amounting to€2,375 per meeting, will be payable to Supervisory Board members required to make intercontinental trips to attend Supervisory Board meetings. Fees for each membership of the committees of the Supervisory Board remained at€7,000.
There are no proposals to increase Royal Dutch Supervisory Board members’ fees in 2005. A proposal to abandon the payment of fees to Directors of the Holding Companies and to reduce the fees to Supervisory Board Members of Royal Dutch, following approval of the unification proposal by the General Meeting of Shareholders, is under consideration.
Emoluments of the Supervisory Board
| | | | | | | | | | | | | |
| | | | | | | | | | | € | |
| | | 2004 | | | 2003 | | | 2002 | |
| |
Aad Jacobs | | | | | | | | | | | | |
| Chairman’s fee | | | 15,000 | | | | 15,000 | | | | 5,750 | |
| Supervisory Board fees | | | 55,000 | | | | 55,000 | | | | 46,000 | |
| Committee fees | | | 7,000 | | | | 7,000 | | | | 7,000 | |
| |
| | | | 77,000 | | | | 77,000 | | | | 58,750 | |
| |
Maarten van den Bergh | | | | | | | | | | | | |
| Supervisory Board fees | | | 55,000 | | | | 55,000 | | | | 46,000 | |
| Committee fees | | | 10,500 | | | | 7,000 | | | | 7,000 | |
Holding Company feesa | | | 27,968 | | | | 27,711 | | | | 29,021 | |
| |
| | | | 93,468 | | | | 89,711 | | | | 82,021 | |
| |
Wim Kok | | | | | | | | | | | | |
| Supervisory Board fees | | | 55,000 | | | | 27,500 | | | | — | |
| Committee fees | | | 7,000 | | | | 3,500 | | | | — | |
| |
| | | | 62,000 | | | | 31,000 | | | | — | |
| |
Aarnout Loudon | | | | | | | | | | | | |
| Supervisory Board fees | | | 55,000 | | | | 55,000 | | | | 46,000 | |
| Committee fees | | | 14,000 | | | | 14,000 | | | | 14,000 | |
| |
| | | | 69,000 | | | | 69,000 | | | | 60,000 | |
| |
Hubert Markl | | | | | | | | | | | | |
| Supervisory Board fees | | | 55,000 | | | | 55,000 | | | | 23,000 | |
| Committee fees | | | 7,546 | | | | — | | | | — | |
| |
| | | | 62,546 | | | | 55,000 | | | | 23,000 | |
| |
Christine Morin-Postelb | | | | | | | | | | | | |
| Supervisory Board fees | | | 27,500 | | | | — | | | | — | |
| Committee fees | | | 3,500 | | | | — | | | | — | |
| |
| | | | 31,000 | | | | — | | | | — | |
| |
Lawrence Ricciardi | | | | | | | | | | | | |
| Supervisory Board fees | | | 55,000 | | | | 55,000 | | | | 46,000 | |
| Committee fees | | | 7,000 | | | | 3,500 | | | | — | |
| Intercontinental travel fees | | | 28,500 | | | | 21,375 | | | | — | |
| |
| | | | 90,500 | | | | 79,875 | | | | 46,000 | |
| |
Henny de Ruiterc | | | | | | | | | | | | |
| Supervisory Board fees | | | 27,500 | | | | 55,000 | | | | 46,000 | |
| Committee fees | | | 7,000 | | | | 14,000 | | | | 10,500 | |
Holding Company feesa | | | 13,984 | | | | 27,711 | | | | 29,021 | |
| |
| | | | 48,484 | | | | 96,711 | | | | 85,521 | |
| |
The information in this table is subject to audit.
| a | | Maarten van den Bergh and Henny de Ruiter received fees from the Group Holding Companies in respect of duties performed by them as Directors of these companies. |
| |
| b | | Appointed as from July 1, 2004. |
| |
| c | | Retired on June 30, 2004. |
Group share plans133
Group share plans
Set out below is a summary of the principal employee share schemes operated by Group companies.1The shares subject to the plans are existing issued shares of Royal Dutch or Shell Transport. Shares to be delivered by a Group company under these plans are generally bought in the market at the time the commitment is made.
Long-Term Incentive Plan (LTIP)
Amendments to the current Long-Term Incentive Plan (LTIP) will be proposed to shareholders at the 2005 General Meeting. Details of the amended plan can be found on page 125.
Restricted Share Plan
This plan will be put to shareholders for approval at the 2005 General Meeting. Grants are made under this plan on a highly selective basis for recruitment and retention of senior staff. Shares are granted subject to a three-year restriction period. The shares, together with additional shares equivalent to the value of the dividends payable over the restriction period, are released to the individual at the end of the three-year period. Executive Directors are not eligible to participate in the Restricted Share Plan.
Stock Option Plans
As part of REMCO’s review of long-term incentives, it has recommended that no further grants be made under these plans. Eligible employees were granted stock options over shares of Royal Dutch or Shell Transport under these plans. The price at which the shares could be bought (the exercise price) was not less than the fair market value of the shares at the date the stock options were granted. This was calculated as the average of the stock exchange opening and closing prices over the five business days ending on the date of grant, except for the US plans where the grant price was the New York Stock Exchange closing price on the date of grant.
Options under the Stock Option Plans are exercisable three years from grant except for those granted under the US plans which vest one-third per year for three years. Stock options lapse ten years after grant; however, leaving Group employment may cause options to lapse earlier.
For the Executive Directors and the most senior executives, 100% of options granted under the Stock Option Plans in 2003 and 2004 are subject to performance conditions.
Global Employee Share Purchase Plan
This plan enables employees to make contributions, which are applied quarterly to purchase Royal Dutch or Shell Transport shares at current market value. If the acquired shares are retained in the plan until the end of the twelve-month cycle the employee receives an additional 15% share allocation. In the USA a variant of this plan is operated where contributions are applied to buy Royal Dutch shares at the end of the twelve-month cycle. The purchase price is the lower of the market price on the first or last trading day of the cycle reduced by 15%. Executive Directors are not eligible to participate in the Global Employee Share Purchase Plan.
UK Sharesave Scheme
Employees of participating companies in the UK may participate in the UK Sharesave Scheme. Share options are granted over shares of Shell Transport at a price set at the date specified in the invitation. Options are granted on a date not more than 30 days after the option price is determined and are normally exercisable after a three-year or five-year contractual savings period.
Shell All-employee Share Ownership Plan
Employees of participating companies in the UK may also participate in the Shell All-employee Share Ownership Plan, which is designed to encourage employee participation in their company. Employees invest amounts up to 10% of gross annual salary with a maximum of £1,500 in any fiscal year in Shell Transport shares at the current market value using funds deducted from their monthly salary. The contributions are not liable to income tax, however, to maintain the tax benefit, the shares must be held in the plan for a defined period (normally five years).
| 1 | | Details of the number of shares held by Group companies in connection with the above plans are shown in Note 23 to the Group Financial Statements on pages 71 and 72. |
134Royal Dutch Petroleum Company
Other information
1 Summary of the arrangement in the Articles of Association regarding the appropriation of the profit
After the amounts to be appropriated to reserves have been fixed by the Board of Management with the approval of the Supervisory Board, an amount of€17.92 is distributed on each priority share out of the profit available for distribution. The balance of profit available for distribution then remaining is distributed to the holders of ordinary shares, unless the General Meeting of Shareholders resolves that the whole or part of such profit be carried forward to the following year. Shares acquired and held by the Company in its own capital are not included in the profit distribution calculation and no distributions are made thereon.
2 Proposal for appropriation of the profit available for distribution
The proposal for appropriation of the profit available for distribution is stated in the Report of the Supervisory Board on page 104 and is disclosed in the Statement of Appropriation of Profit on page 106.
3 Special rights in the Articles of Association regarding control in the Company
Pursuant to the Articles of Association, the meeting of holders of priority shares determines the number of Managing Directors and members of the Supervisory Board and, when the case arises, that meeting decides whether or not to fill a vacancy on the Board of Management or the Supervisory Board. The meeting of holders of priority shares is furthermore entitled to make a binding nomination, containing the names of at least two persons, for each appointment of a Managing Director or a member of the Supervisory Board. The prior consent of the meeting of holders of priority shares is required for the passing of a resolution to amend the Articles of Association or to dissolve the Company. A resolution to amend the Articles of Association may also be passed subject to the subsequent approval of that meeting. Each of the members of the Supervisory Board and the Managing Directors is the holder of six priority shares. The other 1,440 priority shares are held by the Royal Dutch Priority Shares Foundation. The Board of the Foundation consists of all the members of the Supervisory Board and the Managing Directors of the Company.
As announced on June 17, 2004, a proposal to abolish the priority shares will be put forward to the General Meeting on June 28, 2005. It is intended that this would be effected through a buyback of the priority shares at their nominal value.
4 Share buyback
In the period between the General Meeting held on June 28, 2004 and April 22, 2005 the Company acquired 12,205,000 shares under the share buyback programme.
5 Supervisory Board members’ and Managing Directors’ share interests in the Companya
| | | | | | | | | |
| | | Number of ordinary shares | |
| | | Dec 31, 2004 | | | Dec 31, 2003 | |
| |
Supervisory Board | | | | | | | | |
| Aad Jacobs | | | 0 | | | | 0 | |
| Maarten van den Bergh | | | 4,000 | | | | 4,000 | |
| Wim Kok | | | 0 | | | | 0 | |
| Aarnout Loudon | | | 75,000 | | | | 75,000 | |
| Hubert Markl | | | 0 | | | | 0 | |
| Christine Morin-Postel | | | 0 | | | | — | |
| Lawrence Ricciardi | | | 10,000 | | | | 10,000 | |
| |
Managing Directors | | | | | | | | |
| Jeroen van der Veer | | | 10,512 | | | | 10,512 | |
| Linda Cook | | | 217 | | | | — | |
| Rob Routs | | | 0 | | | | 0 | |
| |
| a | | Excluding priority shares and shares under the Deferred Bonus Plan (see page 128) which will be released in principle three years after deferral. |
Report of the Independent Auditors135
Report of the Independent Auditors
Introduction
We have audited the Annual Accounts for the year 2004 of Royal Dutch Petroleum Company appearing on pages 106 to 114. These Accounts are the responsibility of the Company’s management. Our responsibility is to express an opinion on these Accounts based on our audit.
Scope
We conducted our audit in accordance with generally accepted auditing standards in the Netherlands. Those standards require that we plan and perform the audit to obtain reasonable assurance about whether the annual accounts are free of material misstatement. An audit includes examining, on a test basis, evidence supporting the amounts and disclosures in the annual accounts. An audit also includes assessing the accounting principles used and significant estimates made by management, as well as evaluating the overall presentation of the annual accounts. We believe that our audit provides a reasonable basis for our opinion.
Opinion
In our opinion, these Accounts – of which the Netherlands GAAP Financial Statements of the Royal Dutch/Shell Group of Companies as presented on pages 83 to 85 and the Notes thereto on pages 52 to 81 and 86 to 91 form part – give a true and fair view of the financial position of the Company at December 31, 2004, and of the results and the cash flows for the year then ended in accordance with accounting principles generally accepted in the Netherlands and comply with the financial reporting requirements included in Part 9, Book 2 of the Netherlands Civil Code.
Emphasis of Matter
Without qualifying our opinion, we emphasise that the Company has restated the comparative data for the years 2003 and 2002 as explained in Note 3 on pages 109 and 110.
KPMG Accountants N.V.
The Hague
April 27, 2005
136Royal Dutch Petroleum Company
Shareholder information
Ownership of ordinary shares
At April 22, 2005 the only interest known to the Company in 5% or more of the Company’s issued ordinary share capital was The Capital Group International Inc. which held 115,437,760 shares (5.5%) at December 31, 2004, as indicated in its Schedule 13G filed with the SEC, dated February 14, 2005.
Number of shares
The number of outstanding ordinary shares with a par value of€0.56 at the end of 2004 was 2,081,725,000.
Share prices
Euronext Amsterdam
| | | | | | | | | | | | | | | | | | | | | |
| | | | | | | | | | | | | | | | | | | € | |
| | | 2004 | | | 2003 | | | 2002 | | | 2001 | | | 2000 | |
| |
| Highest | | | 44.03 | | | | 44.58 | | | | 63.20 | | | | 73.48 | | | | 75.90 | |
| Lowest | | | 36.59 | | | | 33.35 | | | | 39.21 | | | | 43.72 | | | | 51.51 | |
| Year-end | | | 42.35 | | | | 41.80 | | | | 41.95 | | | | 56.90 | | | | 65.26 | |
| |
New York Stock Exchange
| | | | | | | | | | | | | | | | | | | | | |
| | | | | | | | | | | | | | | | | | | $ | |
| | | 2004 | | | 2003 | | | 2002 | | | 2001 | | | 2000 | |
| |
| Highest | | | 57.79 | | | | 52.70 | | | | 57.30 | | | | 64.15 | | | | 65.69 | |
| Lowest | | | 45.79 | | | | 36.69 | | | | 38.60 | | | | 39.75 | | | | 50.44 | |
| Year-end | | | 57.38 | | | | 52.39 | | | | 44.02 | | | | 49.02 | | | | 60.56 | |
| |
Information prior to 2004 has been restated for comparative purposes (see Note 3 to the Annual Accounts on pages 109 and 110).
Key figures per ordinary share
| | | | | | | | | | | | | |
| | | | | | | | | | | € | |
| | | 2004 | | | 2003 | | | 2002 | |
| |
Dividends | | | | | | | | | | | | |
| Interim | | | 0.75 | | | | 0.74 | | | | 0.72 | |
| Final | | | 1.04 | a | | | 1.02 | a | | | 1.00 | |
| |
Total dividend | | | 1.79 | | | | 1.76 | | | | 1.72 | |
| |
Net incomeb | | | 4.31 | | | | 3.15 | | | | 2.79 | |
| |
Net assetsc | | | 19.63 | | | | 18.29 | | | | 18.49 | |
| |
Key figures per ordinary share
| | | | | | | | | | | | | |
| | | | | | | | | | | $ | |
| | | 2004 | | | 2003 | | | 2002 | |
| |
Dividends | | | | | | | | | | | | |
| Interim | | | 0.90 | | | | 0.85 | | | | 0.70 | |
| Final | | | 1.33 | a | | | 1.21 | a | | | 1.10 | |
| |
Total dividend | | | 2.23 | | | | 2.06 | | | | 1.80 | |
| |
Net incomeb | | | 5.35 | | | | 3.51 | | | | 2.79 | |
| |
Net assetsc | | | 26.77 | | | | 23.07 | | | | 19.35 | |
| |
| a | | Second interim dividend. |
| |
| b | | Basic earnings per share based on Netherlands GAAP. |
| |
| c | | Based on Netherlands GAAP and on ordinary shares in issue at December 31, after deduction of shares held by Group Companies in respect of stock options and other incentive compensation plans. For this purpose shares repurchased under the buyback programme are deemed to have been cancelled on purchase date. |
| a | | Annualised total shareholder return is calculated as the annualised total of stock appreciation and yield from reinvested dividends before taxes. The figures above are based on quarterly reinvestment of gross dividends expressed in dollars. Data for ChevronTexaco, ExxonMobil and Total before the effective date of their respective mergers were replaced by data from the acquiring entities. |
Shareholder information
Financial calendar
| | | |
| Financial year ends | | December 31, 2004 |
| | | |
Announcements | | |
| Full-year results for 2004 | | February 3, 2005 |
| First quarter results for 2005 | | April 28, 2005 |
| Second quarter results for 2005 | | July 28, 2005* |
| Third quarter results for 2005 | | October 27, 2005* |
| | | |
Dividends – Hague Register and Bearer shares | | |
| 2004 Second interim | | |
| |
| Announced | | February 3, 2005 |
| Record date | | February 3, 2005 |
| Ex-dividend date | | February 4, 2005 |
| Payment date | | March 15, 2005 |
| | | |
| 2005 First interim | | |
| |
| Announced | | April 28, 2005 |
| Record date | | April 28, 2005 |
| Ex-dividend date | | April 29, 2005 |
| Payment date | | June 15, 2005 |
| | | |
Dividends – New York Register | | |
| 2004 Second interim | | |
| |
| Announced | | February 3, 2005 |
| Ex-dividend date | | February 4, 2005 |
| Record date | | February 8, 2005 |
| Payment date | | March 15, 2005 |
| | | |
| 2005 First interim | | |
| |
| Announced | | April 28, 2005 |
| Ex-dividend date | | April 29, 2005 |
| Record date | | May 3, 2005 |
| Payment date | | June 15, 2005 |
General Meeting of Shareholders | | June 28, 2005 |
| |
| * | | The dates shown are provisional and subject to final confirmation. |
Contact addresses
Investor Relations
Enquiries from shareholders may be addressed to:
The Hague
Shell International B.V.
Group Investor Relations
PO Box 162
2501 AN The Hague
The Netherlands
Tel: +31 (0)70 377 4540
Fax: +31 (0)70 377 3115
e-mail: ir-hague@shell.com
London
Shell International Limited
Group Investor Relations
Shell Centre
London SE1 7NA
United Kingdom
Tel: +44 (0)20 7934 3856
Fax: +44 (0)20 7934 3702
e-mail: ir-london@shell.com
New York
Shell Oil Company
1270 Avenue of the Americas
Suite 2320
New York, NY 10020
USA
Tel: +1 212 218 3113
Fax: +1 212 218 3114
e-mail: ir-newyork@shell.com
For access to investor relations information, visit the website at
www.shell.com/investor
See addresses on the back cover for requests for publications, including copies of the original Dutch Annual Report.
Hague Register
Royal Dutch shareholders listed in the Hague Register who have enquiries about share ownership, changes of address or payment of dividends may contact:
N.V. Algemeen Nederlands
Trustkantoor ANT
PO Box 11063
1001 GB Amsterdam
The Netherlands
Tel: +31 (0)20 522 2510
Fax: +31 (0)20 522 2500
e-mail: registers@ant-trust.nl
New York Register
Royal Dutch shareholders listed in the New York Register who have enquiries about share ownership, changes of address or payment of dividends may contact:
Stock Transfer and Paying Agent
JPMorgan Service Center
PO Box 43013
Providence, RI 02940-3013
USA
Tel: 800 556 8639 (USA only)
+1 781 575 4328
(international)
Fax: +1 781 575 4082
Website:www.adr.com/shareholders
Royal Dutch Petroleum Company
N.V. Koninklijke Nederlandsche
Petroleum Maatschappij
Founded on June 16, 1890
Carel van Bylandtlaan 30
2596 HR The Hague
The Netherlands
Tel: +31 (0)70 377 9111
Designed and produced by Corporate Edge using Ringmaster®. Cover photography by Peter Dazeley. Printed by Butler and Tanner who are accredited with the ISO 14001 Environmental Management System.
The paper for this report contains 75% de-inked post-consumer waste. The remaining 25% is from elemental chlorine-free pulp sourced from sustainably managed forests. The manufacturers of the paper are accredited with the ISO 9002 Quality Assurance and ISO 14001 Environmental Management Systems.
Ringmaster® is the registered trademark of Automatrix plc.

Annual Report and Accounts 2004
The Annual Reports and Accounts of Royal Dutch Petroleum Company and The “Shell” Transport and Trading Company, p.l.c.
Available atwww.shell.com/annualreport

Summary Annual Report and Accounts 2004
Summary versions of the Annual Reports and Accounts of Royal Dutch Petroleum Company and The “Shell” Transport and Trading Company, p.l.c.
Available atwww.shell.com/annualreport
The Shell Report 2004
Meeting the energy challenge – our progress in contributing to sustainable development. Available atwww.shell.com/shellreport

Financial and Operational Information 2000–2004
Five years’ financial and operational information about the Group, including maps of exploration and production activities.
Available atwww.shell.com/faoi
Statement of General Business Principles
Fundamental principles that govern how each Shell company conducts its affairs. Available atwww.shell.com/sgbp
Tell Shell
Tell us what you think about Shell, our performance, our reports or the issues we face. Join the global debate – we value your views.
Visitwww.shell.com/tellshell or e-mail us at tellshell@shell.com
Contact any of the addresses below for copies of publications:
Shell International B.V.
FSK Division, PO Box 162
2501 AN The Hague
The Netherlands
Tel: +31 (0)70 377 4540
Fax: +31 (0)70 377 3115
Shell International Limited
PXXC (Publications)
Shell Centre, London, SE1 7NA
United Kingdom
Tel: +44 (0)20 7934 5293
Fax: +44 (0)20 7934 5555
Shell Oil Company
1270 Avenue of the Americas
Suite 2320, New York
NY 10020, USA
Tel: +1 212 218 3113
Fax: +1 212 218 3114
More information about the Royal Dutch/Shell Group is available atwww.shell.com