Exhibit 99.4

Summary Annual Report and Accounts 2004
Royal Dutch Petroleum Company
N.V. Koninklijke Nederlandsche Petroleum Maatschappij

About this report
Welcome to the Summary Annual Report and Accounts 2004 for Royal Dutch Petroleum Company. In this report you will find information relating to the Royal Dutch/Shell Group of Companies on pages 6 to 28, including a review of the 2004 operational and financial performance of the businesses. On pages 1 to 5 and 29 to 36, you will find information about Royal Dutch Petroleum Company, one of the Parent Companies of the Royal Dutch/Shell Group.
Shell’s operations
The Royal Dutch/Shell Group of Companies consists of the upstream businesses of Exploration & Production and Gas & Power and the downstream businesses of Oil Products and Chemicals. We also have interests in other industry segments such as Renewables and Hydrogen. For more information on Shell’s operations, see pages 8 and 9 of this report.
1 
What’s in this report
| | | | | |
| Royal Dutch Petroleum Company |
| 2 | | Message to shareholders |
| 4 | | Financial highlights |
| 5 | | Unification of Royal Dutch and Shell Transport |
| | | | | |
| Royal Dutch/Shell Group |
| 6 | | The Boards of the Parent Companies |
| 8 | | What we do |
| 9 | | Where we are |
| 10 | | Summary Operational and Financial Review |
| 10 | | Strategy |
| 12 | | Summary of Group results |
| 14 | | Upstream: Exploration & Production |
| 16 | | Upstream: Gas & Power |
| 18 | | Downstream: Oil Products |
| 20 | | Downstream: Chemicals |
| 21 | | Other industry segments and Corporate |
| 22 | | Report of the Independent Auditors |
| 22 | | Summary Group Financial Statements |
| 27 | | Supplementary information |
| | | | | |
| Royal Dutch Petroleum Company |
| 29 | | Summary Report of the Supervisory Board and the Board of Management |
| 31 | | Summary Remuneration Report |
| 33 | | Summary Annual Accounts |
| 34 | | Notes to the Summary Annual Accounts |
| 35 | | Report of the Independent Auditors |
| 36 | | Shareholder information |
Report structure
Royal Dutch Petroleum Company owns 60% of the Royal Dutch/Shell Group. Throughout this report, page markers are used to identify sections that relate to these entities:
 Royal Dutch/Shell Group
 Royal Dutch Petroleum Company
This Summary Report is an abridged version of the Annual Report and Accounts 2004 of Royal Dutch Petroleum Company. For further information consult the full Annual Report and Accounts 2004 (www.shell.com/annual report). To obtain a free copy please see the back cover for contact addresses.
The companies in which Royal Dutch Petroleum Company and The “Shell” Transport and Trading Company, p.l.c. directly or indirectly own investments are separate and distinct entities. But in this report the collective expressions “Shell”, “Group” and “Royal Dutch/Shell Group of Companies” are sometimes used for convenience in contexts where reference is made to the companies of the Royal Dutch/Shell Group in general. Likewise the words “we”, “us” and “our” are used in some places to refer to companies of the Royal Dutch/Shell Group in general, and in others to those who work in those companies. Those expressions are also used where no useful purpose is served by identifying a particular company or companies.
The shell pictured on the cover of this report isMitra mitrafrom the Indo-Pacific region and the Galapagos Islands.
 2 Royal Dutch Petroleum Company
Message to shareholders

Aad Jacobs
Message from the Chairman
2004 was one of the most challenging years in the Group’s history. However, it was also a year when we took important steps to deal with the difficulties we faced and to strengthen the foundations of the Royal Dutch/Shell Group for the future. At the same time, we maintained our focus on the fundamentals of our business: in 2004 we had record income and good performance across all of our businesses.
Addressing the issues arising from the recategorisation of the Group’s proved hydrocarbon reserves was a key priority. We made major improvements to the way we record, review and audit our reserves. I believe we now have a thorough and rigorous system in place that meets the relevant regulatory and legal requirements and that we can now begin to put these issues behind us. We have also refocused our upstream strategy, increasing capital investment to replenish our resource base.
We undertook a far reaching review of the structure and governance of the Group which has resulted in the proposals for unification that are being put to shareholders at meetings on June 28, 2005. This is a historic step that your Board believes offers the opportunity to bring greater clarity, simplicity and accountability to the governance and management of your company.
I am confident that the steps we are now taking will enable us to take full advantage of the outstanding skills of our people and the value of our assets to seize the exciting opportunities ahead.
/s/ Aad Jacobs
Aad Jacobs
Chairman of Royal Dutch
April 27, 2005

Jeroen van der Veer
Message from the Group Chief Executive
The past year has been one of real contrasts. We faced very difficult issues arising from the recategorisation of our proved reserves but also delivered record earnings in line with our business strategy. At the same time, we made sweeping proposals to clarify and simplify the Group’s structure and to strengthen our business for the future.
Our performance in 2004 reflected the progress we made in delivering our strategy of more upstream and profitable downstream. We reported record net income of $18.2 billion, a 48% increase on 2003 and generated more than $33 billion in cash. This strong performance and cash generation is enabling us to pay more than $10 billion in dividends in 2005 and to relaunch our share buyback programme, while investing some $15 billion to build for the future.
Results in the Downstream and Gas & Power in 2004 were particularly strong. Higher prices and higher margins, as well as improved operational performance, meant that earnings in the Oil Products business more than doubled. In Gas & Power, we continued to build on our industry leading position in liquefied natural gas (LNG), with 9% volume growth and new projects added to our portfolio.
In Oil Products, the premium fuels programme continued to be popular with customers, not least in the USA where we launched Shell V-Power which quickly became the best selling premium gasoline. We took a number of important steps during the year to build our presence in the key growth markets including an agreement with Sinopec to develop 500 retail stations in China.
Message to shareholders 3
Financial highlights
Total Dividenda
per ordinary share
€1.79
Earnings
net income
$18,183 millionb
| a | | A second interim dividend of €1.04 was made payable to shareholders in March 2005. |
| |
| b | | Based on accounting principles generally accepted in the US. |
We continued to make good progress in reshaping the portfolio through divestments of under-performing assets.
It was encouraging that, after several difficult years, the Chemicals business showed significant success with a profit of $930 million. The main opportunities for growth in Chemicals are in Asia Pacific and we made good progress on the construction of the Nanhai plant, which is on time and on budget. The plant is scheduled to be commissioned at the end of 2005 and will serve China’s growing domestic petrochemical market.
In Exploration & Production, earnings were strong and production, considering divestments, was broadly the same as in 2003. A number of new fields started production including Jintan in Malaysia, the Goldeneye field in the North Sea and Holstein in the Gulf of Mexico. Production from the West Salym field in Siberia also began, a year earlier than planned. We continued to invest in developments that will deliver long-term value and final investment decisions were taken on the Kashagan project in Kazakhstan and the Pohokura gas development in New Zealand. We made significant additions to our overall acreage positions and participated in 31 successful exploration wells.
We completed the review of our proved reserves and I am confident that we now have the people, processes and systems in place to ensure that our reserves are recorded in a rigorous and accurate way. In the next five years we will unlock 13 billion barrels of oil equivalent in new resources through the development of identified projects in our portfolio. We also decided to increase our spend for exploration for oil and gas.
Gas & Power had another successful year with a 9% increase in LNG volumes, further reinforcing our leading position in this growing market. We made significant progress in selling LNG from the Sakhalin II facility which will start production in 2007. The majority of the plant’s LNG has now been sold to customers in Japan, Korea, and in a highly significant deal, to North America. This will be the first time that Russian gas has been sold in the North American market.
We continued to invest for the future with the final investment decision being made for a sixth train of the LNG plant in Nigeria and the agreement to build a LNG plant in Qatar. Acknowledging that a key part of the growth in global energy demand will be met by natural gas, our strategy will continue to build on our leading positions in the LNG and gas to liquids markets.
In line with our business strategy we plan to increase total investment in the upstream to some $12 billion a year. This will ensure we are positioned to seize the opportunities in a growing energy market where oil and gas prices are likely to remain relatively high.
We also made progress in embedding a culture change throughout the Group. The Executive Committee has taken the lead in rolling out “Enterprise First” based on three principles: leadership, accountability and teamwork, starting with the senior management, and through them, across the Group. The adoption of these behaviours will be critical to our future success.
I was very honoured to be appointed the Group’s first Chief Executive in October 2004. I believe that our results demonstrate that Shell retains the fundamental strengths on which to build for the future. Our employees are one of those core strengths and I would like to thank them for their hard work and dedication, especially because 2004 was a difficult year for all employees.
While I know that there will be many challenges ahead, I am fully committed to driving the actions that will transform our business, meet your expectations and help us move ahead of the competition.
/s/ Jeroen van der Veer
Jeroen van der Veer
President of Royal Dutch
and Group Chief Executive
April 27, 2005
4 Royal Dutch Petroleum Company
Financial highlights
Group financial highlights:
Royal Dutch/Shell Group of Companies (US GAAP)
Information prior to 2004 for the Group has been restated where applicable to take account of the restatements as described in Note 2 to the Summary Financial Statements of the Royal Dutch/ Shell Group of Companies (see pages 23 and 24).
Parent Company financial highlights:
Royal Dutch Petroleum Company (Netherlands GAAP)
Information prior to 2004 has been restated for comparative purposes.
| a | | Basic earnings per share. |
| |
| b | | Includes interim dividend at €0.75 ($0.90) made payable in September 2004 and a second interim dividend at €1.04 ($1.33) made payable in March 2005. This together will constitute the total dividend for 2004, subject to finalisation by the General Meeting of Shareholders to be held on June 28, 2005. |
| |
Throughout this report, a billion = 1,000 million.
GAAP = generally accepted accounting principles. |
Unification of Royal Dutch and Shell Transport 5
Unification of Royal Dutch and Shell Transport
“Your Boards believe that these proposals are in the best interests of shareholders and the Directors unanimously recommend that Royal Dutch shareholders vote in favour of the resolutions to be proposed at the meeting on June 28, 2005 and accept the Royal Dutch offer.”
Aad Jacobs
Chairman of Royal Dutch
A review of the structure and governance of the Shell Group was carried out during 2004 by a steering group drawn from the Boards of the Group’s two parent companies, Royal Dutch Petroleum Company (Royal Dutch) and The “Shell” Transport and Trading Company, p.l.c. (Shell Transport). Chaired by Lord Kerr, its remit was to consider how best to simplify the structures of the companies, the Boards and management of the Group; how to improve the decision making processes and the personal accountability of management; and how to enhance leadership of the Group. The steering group heard the views of a large number of institutional shareholders and shareholder groups and considered a wide range of solutions, in the end opting for the simplest, cleanest and clearest. The steering group’s final recommendations received the unanimous support of the Boards and were announced on October 28, 2004.
The Boards’ proposal to shareholders is for the unification of the two existing parent companies, Royal Dutch and Shell Transport, under a single new parent company, Royal Dutch Shell plc.
Royal Dutch Shell is incorporated in England and Wales and has a single corporate headquarters and its tax domicile in the Netherlands. Royal Dutch Shell will have a single tier 15-person board with a majority of independent non-executive directors, headed by a non-executive chairman. A single Chief Executive leads the Executive Committee, whose members report to him.
The Boards believe that this proposal will strengthen the Group in a number of ways. It will provide a clearer and simpler structure with a single smaller board and a simplified senior management structure. The lines of accountability will be clearer with the Executive Committee reporting to the Chief Executive, who in turn will report to the unified single board and non-executive chairman, who are accountable to shareholders. Efficiencies will be achieved by reducing duplication and centralising functions in one headquarters in The Hague.
The Executive Committee has already been established and Jeroen van der Veer has been appointed as the Group’s first Chief Executive. He has full executive authority and a remit to drive the implementation of strategy, operational delivery and cultural change.
Royal Dutch is seeking shareholder approval of the proposed unification. The implementation agreement, which outlines how the proposals would be implemented, will be put to shareholders for approval at the General Meeting on June 28, 2005. Holders of Royal Dutch shares will be invited to tender their shares in exchange for shares of Royal Dutch Shell plc. More information on the proposals is available on www.shell.com/unification.
If the proposals are approved by shareholders of both Royal Dutch and Shell Transport, the conditions of the Royal Dutch offer are satisfied or, to the extent permitted, waived and the Shell Transport scheme of arrangement is approved by the High Court, implementation of the new structure is expected to take place in July 2005 (subject to the satisfaction or waiver of all other conditions).
 6 Royal Dutch/Shell Group of Companies
The Boards of the Parent Companies
As at April 2005
| | | |
| | Royal Dutch Supervisory Board
Aad Jacobs
Chairman
Maarten van den Bergh
Wim Kok
Jonkheer Aarnout Loudon
Professor Hubert Markl
Christine Morin-Postel
Lawrence Ricciardi
Royal Dutch Board of Management
Jeroen van der Veer
President of Royal Dutch and
Group Chief Executive
Linda Cook
Rob Routs
Shell Transport Non-executive Directors
Lord Oxburgh
Chairman
Teymour Alireza
Sir Peter Burt
Dr Eileen Buttle
Luis Giusti
Nina Henderson
Sir Peter Job
Lord Kerr of Kinlochard
Sir Mark Moody-Stuart
Shell Transport Managing Directors
Malcolm Brinded
Peter Voser
Company Secretary, Royal Dutch
Michiel Brandjes
Joined the Group in 1980 as a Legal Adviser. General Attorney of the Company since May 2003. Appointed Company Secretary of Royal Dutch in February 2004.
Company Secretary, Shell Transport
Jyoti Munsiff
Joined the Group in 1969 as a Legal Adviser. Appointed Company Secretary of Shell Transport in 1993.
Key to Committee membership
n Group Audit Committee
+ Remuneration and Succession Review Committee
# Social Responsibility Committee
ø Shell Transport Nomination Committee
The Boards of the Parent Companies are denoted as follows:
 Royal Dutch Royal Dutch
 Shell Transport Shell Transport |
The Boards of the Parent Companies 7
The members of the Supervisory Board and the Board of Management of Royal Dutch Petroleum Company and the Directors and Managing Directors of The “Shell” Transport and Trading Company, p.l.c. meet regularly during the year to discuss reviews and reports on the business and plans of the Royal Dutch/Shell Group.
 Aad Jacobsn
Chairman of the Supervisory Board of Royal Dutch
Born May 28, 1936. A Dutch national, appointed a member of the Supervisory Board in 1998 and Chairman in 2002. Due to retire in 2006. Previously Chairman of the Board of Management of ING Group. Chairman of the Supervisory Boards of Joh. Enschedé, Imtech and VNU; Vice-Chairman of the Supervisory Boards of Buhrmann and IHC Caland and a member of the Supervisory Board of ING Group.
 Lord Oxburgh KBE FRSø
Non-executive Chairman of Shell Transport
Born November 2, 1934. A British national, appointed a Director in 1996 and Non-executive Chairman in March 2004. Pursuant to the Articles of Association, he will retire in 2005 by virtue of age (70 years) and will stand for re-election at the 2005 AGM. Held a number of scientific and university appointments including Chief Scientific Advisor, Ministry of Defence and Rector, Imperial College of Science, Technology and Medicine.
 Jeroen van der Veer
President of Royal Dutch and Group Chief Executive
Born October 27, 1947. A Dutch national, appointed President of Royal Dutch in 2000, having been a Managing Director of Royal Dutch since 1997. Appointed Group Chief Executive in October 2004. Joined the Group in 1971 in refinery process design and held a number of senior management positions around the world. Also a member of the Supervisory Board of De Nederlandsche Bank (until September 2004) and a Non-executive Director of Unilever.
 Teymour Alireza#
Non-executive Director of Shell Transport
Born September 7, 1939. A Saudi Arabian national, appointed a Director in 1997. Latest date for retirement by rotation 2005. President and Deputy Chairman of The Alireza Group. Also Chairman of the National Pipe Company Ltd, Saudi Arabia and a Director of Arabian Gulf Investments (Far East) Ltd and of Riyad Bank Saudi Arabia. Member of the International Board of Trustees of the World Wide Fund for Nature.
 Maarten van den Bergh +#
Member of the Supervisory Board of Royal Dutch
Born April 19, 1942. A Dutch national, appointed a member of the Supervisory Board in 2000 and 2004. Due to retire in 2008. Managing Director of Royal Dutch from 1992 to 2000 and President from 1998 to 2000. Chairman of the Board of Directors of Lloyds TSB and a member of the Boards of Directors of BT and British Airways.
 Malcolm Brinded CBE FREng
Managing Director of Shell Transport and Executive Director
Born March 18, 1953. A British national, was appointed a Director and Managing Director of Shell Transport in March 2004. Latest date for retirement by rotation 2007. Previously a Managing Director of Royal Dutch since 2002. Joined the Group in 1974 and has held various positions around the world. Country Chair for Shell in the UK from 1999 to 2002 and Director of Planning, Environment and External Affairs at Shell International Ltd from 2001 to 2002.
 Sir Peter Burt FRSEn ø
Non-executive Director of Shell Transport
Born March 6, 1944. A British national, appointed a Director in 2002. Latest date for retirement by rotation 2006. Joined the Bank of Scotland in 1975 and rose to become Chief General Manager. Appointed Group Chief Executive and in 2001 became Executive Deputy Chairman of HBOS plc and Governor of the Bank of Scotland, retired in 2003. Chairman of Gleacher Shacklock Limited and a director of a number of charitable organisations. In February 2004 he was appointed Non-executive Chairman of ITV plc.
 Dr Eileen Buttle CBE#
Non-executive Director of Shell Transport
Born October 19, 1937. A British national, appointed a Director in 1998 following retirement from a career of public scientific appointments. Latest date for retirement by rotation 2007. Member of a number of UK Government and European Union advisory committees on environmental aspects of UK and European research and of Boards of Trustees of environmental non-governmental organisations.
 Linda Cook
Managing Director of Royal Dutch and Executive Director
Born June 4, 1958. A US national, appointed a Managing Director of Royal Dutch in August 2004. President and Chief Executive Officer and a member of the Board of Directors of Shell Canada Ltd from August 2003 to July 2004. Joined Shell Oil Company in Houston in 1980, and worked for Shell Oil Company in Houston and California in a variety of technical and managerial positions. Member of the Society of Petroleum Engineers and member of the Board of Directors of The Boeing Company.
 Luis Giustin
Non-executive Director of Shell Transport
Born November 27, 1944. A Venezuelan national, appointed a Director in 2000. Latest date for retirement by rotation 2007. Chairman and Chief Executive Officer of Petróleos de Venezuela, SA (PDVSA) from 1994 to 1999. Before joining PDVSA in 1976, worked for the Venezuelan Shell oil company. Member of the Board of Governors of the Centre for Global Energy Studies in London. Senior Advisor at the Center for Strategic and International Studies in Washington DC.
 Mary R. (Nina) Hendersonn +
Non-executive Director of Shell Transport
Born July 6, 1950. A US national, appointed a Director in 2001. Latest date for retirement by rotation 2007. Previously President of a major division and Corporate Vice-President of Bestfoods, a major US foods company, responsible for worldwide core business development. Non-executive Director of Pactiv Corporation, AXA Financial Inc., Del Monte Foods Company and Visiting Nurse Service of New York.
 Sir Peter Job KBE +ø
Non-executive Director of Shell Transport
Born July 13, 1941. A British national, appointed a Director in 2001. Latest date for retirement by rotation 2005. Previously Chief Executive of Reuters plc. Non-executive Director of Schroders plc, TIBCO Software Inc., Instinet Group Inc., and a member of the Supervisory Board of Deutsche Bank AG.
 Lord Kerr of Kinlochard GCMG +ø
Non-executive Director of Shell Transport
Born February 22, 1942. A British national, appointed a Director in 2002. Latest date for retirement by rotation 2006. A member of the UK Diplomatic Service from 1966 to 2002 (and its Head from 1997 to 2002), he was successively UK Permanent Representative to the EU, British Ambassador to the USA, Foreign Office Permanent Under Secretary of State and Secretary-General of the European Convention. Non-executive Director of Rio Tinto, Scottish American Investment Trust plc and Chairman of Court/Council of Imperial College. Trustee of the National Gallery and of the Rhodes Trust.
 Wim Kok#
Member of the Supervisory Board of Royal Dutch
Born September 29, 1938. A Dutch national, appointed a member of the Supervisory Board with effect from 2003. Due to retire by rotation in 2007. Chaired the Confederation of Dutch trade unions (FNV) before becoming a member of the Lower House of Parliament and parliamentary leader of the Partij van de Arbeid (Labour Party). Appointed Minister of Finance in 1989 and Prime Minister in 1994, serving for two periods of government up to July 2002. Member of the Supervisory Boards of ING Group, KLM and TPG.
 Jonkheer Aarnout Loudon +#
Member of the Supervisory Board of Royal Dutch
Born December 10, 1936. A Dutch national, appointed a member of the Supervisory Board in 1997. Due to retire in 2007. Member of the Board of Management of Akzo from 1977 to 1994 (Akzo Nobel as from 1994) and its Chairman from 1982 to 1994. Chairman of the Supervisory Boards of ABN AMRO Bank and Akzo Nobel and a member of the International Advisory Board of Allianz.
 Professor Hubert Markl +
Member of the Supervisory Board of Royal Dutch
Born August 17, 1938. A German national, appointed a member of the Supervisory Board in 2002. Due to retire by rotation in 2006. President of the Max-Planck-Gesellschaft from 1996 to 2002. Professor of Biology at the University of Constance from 1974 to 2003. Member of the Supervisory Boards of Aventis, BMW, and Münchener Rückversicherungs-Gesellschaft.
 Sir Mark Moody-Stuart KCMG#
Non-executive Director of Shell Transport
Born September 15, 1940. A British national, appointed a Non-executive Director in 2001. Latest date for retirement by rotation 2005. Appointed a Managing Director in 1991 and Chairman of Shell Transport from 1997 to 2001. Chairman of Anglo American plc and a Director of HSBC Holdings plc and Accenture. Member of the UN Secretary General’s Advisory Council for the Global Compact from 2001 to 2004.
 Christine Morin-Posteln
Member of the Supervisory Board of Royal Dutch
Born October 6, 1946. A French national, appointed a member of the Supervisory Board in July, 2004. Due to retire by rotation in 2008. Formerly Chief Executive of Société Générale de Belgique and Executive Vice-President and member of the Executive Committee of Suez. Member of the Board of Alcan Inc., 3i Group plc and Pilkington plc.
 Lawrence Ricciardin
Member of the Supervisory Board of Royal Dutch
Born August 14, 1940. A US national, appointed a member of the Supervisory Board in 2001. Due to retire by rotation in 2005. Previously President of RJR Nabisco, Inc. and subsequently Senior Vice-President and General Counsel of IBM. Senior Advisor to the law firm Jones Day and to Lazard Frères & Co. Member of the Board of Directors of The Reader’s Digest Association, Inc.
 Rob Routs
Managing Director of Royal Dutch and Executive Director
Born September 10, 1946. A Dutch national, appointed a Managing Director of Royal Dutch with effect from 2003. Joined the Group in 1971. Held various positions in the Netherlands, Canada and the USA. Previously President and Chief Executive Officer of Shell Oil Products USA and President of Shell Oil Company and Country Chair for Shell in the USA.
 Peter Voser
Managing Director of Shell Transport and Chief Financial Officer
Born August 29, 1958. A Swiss national, appointed a Managing Director of Shell Transport and Chief Financial Officer (CFO) in October 2004. Latest date for retirement by rotation 2008. In 2002, joined the Asea Brown Boveri (ABB) Group of Companies, based in Switzerland as CFO and Member of the Group Executive Committee. Also responsible for ABB’s Group IT and the Oil, Gas and Petrochemicals business. Originally joined the Royal Dutch/Shell Group in 1982 where he held a variety of finance and business roles in Switzerland, UK, Argentina and Chile, including CFO of Oil Products. Member of the Board of Directors of UBS AG.
8 Royal Dutch/Shell Group of Companies
What we do
Though we are probably best known to the public for our service stations and for finding and producing oil and natural gas, our activities result in many other products that play a role in people’s everyday lives.
Upstream
Shell’s upstream businesses explore for and extract oil and natural gas, and build and operate the infrastructure necessary to deliver these hydrocarbons to market. Activities also include marketing and trading of natural gas and electricity, as well as converting natural gas to liquids to provide cleaner fuels.
| | | | | |
Exploration & Production | | | | |
| Employees (thousand) | | | 17 | |
| Capital investment ($ million) | | | 9,868 | |
| |
| | | | | |
Gas & Power | | | | |
| Employees (thousand) | | | 2 | |
| Capital investment ($ million) | | | 1,633 | |
| |
Downstream
Shell’s downstream businesses engage in refining crude oil into a range of products including fuels, lubricants and petrochemicals. The Group operates the largest single brand retail network, with over 46,000 service stations.
| | | | | |
Oil Products | | | | |
| Employees (thousand) | | | 76 | |
| Capital investment ($ million) | | | 2,466 | |
| |
| | | | | |
Chemicals | | | | |
| Employees (thousand) | | | 8 | |
| Capital investment ($ million) | | | 705 | |
| |
Everyday products
Shell’s products play a part in people’s everyday lives:
| – | | fuels and lubricants used in cars, trucks, buses and planes; |
| |
| – | | natural gas, wind power and solar panels used to generate electricity for industrial and domestic use; and |
| |
| – | | base chemicals and intermediates used to manufacture household products, from detergents to CDs to toys. |
Renewables and Hydrogen
The activities covered in Shell’s new energy portfolio aim to build a commercially viable business based on hydrogen and renewable sources. Part of this portfolio includes producing wind and solar energy used to generate electricity and finding solutions to develop hydrogen as a cleaner and more efficient fuel.
| | | | | |
| Corporate and Other | | | | |
| Employees (thousand) | | | 9 | |
| Capital investment ($ million) | | | 243 | |


Find out more
www.shell.com/aboutshell
Where we are 9
Where we are
Shell is a global group of energy and petrochemical companies, operating in more than 140 countries and territories and employing more than 112,000 people.
10 Royal Dutch/Shell Group of Companies
Summary Operational and Financial Review
The Royal Dutch/Shell Group of Companies consists of the upstream businesses of Exploration & Production and Gas & Power and the downstream businesses of Oil Products and Chemicals. We also have interests in other industry segments such as Renewables and Hydrogen.
Upstream and Downstream
An energy company’s upstream activities consist of the exploration, production and transportation of oil and natural gas. Its downstream activities consist of the refining, processing, distribution and marketing of that oil and gas.
Strategy
Over time, and across the commodity price cycle, the Group has achieved higher earnings, cash flow and returns on investment in the Exploration & Production business compared with the other businesses, and sees significant growth potential in demand for natural gas. The downstream businesses continue to offer attractive returns and growth potential in certain business lines and geographies, and provide useful balance in the portfolio to reduce exposure to commodity price movements. The Group’s core competencies include the application of technology, financial and project management skills to large oil and gas projects; the ability to develop and manage a diverse and international business portfolio; and the development of customer-focused businesses built around the strength of the Shell brand.
Our strategy is clear: more upstream, profitable downstream. We intend to focus on areas with high growth potential and where we can capture value from a higher oil and gas price environment. The strategy will be achieved through the following actions:
Reshaping our portfolio
We are strengthening our portfolio through an active programme of divestments and selective focused acquisitions. We have increased our capital expenditure to about $15 billion per year for the medium term, and in the period from 2004 to 2006 will be selling non-strategic or under-performing assets with proceeds targeted at $12 to $15 billion. Most of the increased capital expenditure will be in the upstream, where we expect higher returns. We are growing our upstream business in areas of resource opportunity such as Russia, the Middle East and West Africa, and our downstream business in markets such as Asia Pacific where we see significant potential for growth. We also intend to generate new income streams from
Regaining upstream strength:
Finding new resources
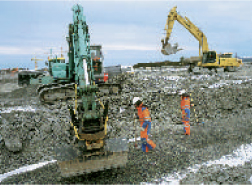
Construction work for the Ormen Lange field, Norway
Ormen Lange is Europe’s second largest offshore gas field. It is situated in an area where climatic and oceanographic conditions make it one of the most challenging developments in the world.
One of our key challenges is to improve our reserves replacement ratio and build our oil and gas resources for the future. Over the next five years, we will be investing $10 billion a year to provide the infrastructure and facilities to unlock 13 billion barrels of new resources.
This activity will include investment to sustain production from our existing positions in Europe, the Americas, Brunei, Malaysia, Oman and onshore Nigeria. We are also making significant investments in new positions such as offshore Nigeria and Kashagan in Kazakhstan. We will develop our strength further in integrated gas developments in LNG, GTL and in pipeline gas from developments such as Ormen Lange. Finally, we will increase our focus on new unconventional developments such as oil sands.
Total exploration and appraisal expenditure will rise to $1.5 billion a year, most of which will be spent on acquiring new acreage and drilling new prospects, with a focus on larger exploration opportunities in fewer countries. In 2004 we have made discoveries in 14 countries and have made positive appraisals of finds in the Gulf of Mexico, Kazakhstan and Malaysia. Over recent years we have increased the drilling of exploration prospects where we expect to find more than 100 million barrels. We drilled 12 of these prospects in 2003 and 15 in 2004 and we expect to drill 15 to 20 of these each year.
Find out more
www.shell.com/ep
Summary Operational and Financial Review 11
technologies such as oil sands production and gas to liquids conversion; by providing oil and gas processing services; and from energy sources such as wind, hydrogen and solar power.
Raising our operational performance
Our strategy is underpinned by a focus on achieving the highest standards of performance and operational excellence across all of our business activities. A measure of operational performance for each business has been built into employee compensation systems, encouraging everyone in the organisation to make this a priority. Project delivery and execution has also become increasingly important as we take on larger and more complex projects. We are channelling more resources into this area and providing additional staff training. To deliver our strategy we must complete projects on time, on specification and on budget. Operational performance also means delivering competitive returns and strong cash generation.
Creating the culture and organisation to deliver
Through simplifying our structure and standardising processes across businesses and around the world, we are creating a more dynamic, responsive organisation. The three principles of leadership, accountability and teamwork form the basis of a culture change that is being embedded throughout the Group by the Executive Committee and other senior leaders. The appointment of a single Group Chief Executive to lead this process is proving to be an enabler for driving these changes.
“Improved performance will underpin all of our activities with the goal of achieving top quartile performance in all our businesses.”
Jeroen van der Veer
Group Chief Executive
More profitable downstream:
Securing the benefits of integration
A joint oil and chemicals site, Deer Park, Texas, USA
Having a facility that is fully integrated from raw materials to end products at one site means we can operate at lower cost to produce chemicals such as phenol, used to manufacture everyday goods like compact discs, computers and car headlights.
Shell’s downstream business refines some 4.4 million barrels a day of crude oil, produces some 20 million tonnes per year of chemical products and sells 145 billion litres of fuel a year at our 46,000 service stations.
This business operates in an increasingly competitive and challenging environment where our customers are becoming more discerning and where the pressures on costs are growing. If we are to meet our strategic objective of more profitable downstream we need to ensure that we manage those activities in a way that meets those challenges. That is why we have established a new global downstream organisation that integrates some activities of our Chemicals and Oil Products businesses.
There are obvious immediate practical benefits to this approach where refineries and petrochemicals plants are on the same sites and can share services. The new structure is also making it easier to adopt best practice quickly across all our operations wherever they are in the world. This helps to improve reliability and operational performance at our manufacturing sites. Equally, by standardising and simplifying business processes we can provide a more responsive and effective service to our customers.
We believe that the new downstream global strategy will reduce costs, improve the service we provide to our customers and help us to retain our position as a market leader in the downstream sector.
Find out more
www.shelldeerpark.com
12 Royal Dutch/Shell Group of Companies
Summary of Group results
2004 was a year of extremes, with the reserves recategorisation on one hand, and record net income and cash generation on the other.
“These strong results were, of course, largely the result of high oil and natural gas prices, but they also reflect our financial and operational strengths and the way we are improving our operational performance.”
Jeroen van der Veer
Group Chief Executive
| | | | | | | | | | | | | |
| | | | | | | | | | | $ million | |
| | | | | | | 2003 | | | 2002 | |
| Earnings | | 2004 | | | As restated | a | | As restated | a |
| |
| Income from continuing operations | | | 16,623 | | | | 12,033 | | | | 9,469 | |
| Income from discontinued operations | | | 1,560 | | | | 25 | | | | 187 | |
| Cumulative effect of a change in accounting principle | | | — | | | | 255 | | | | — | |
| |
Net income | | | 18,183 | | | | 12,313 | | | | 9,656 | |
| |
Change from previous year | | | +48 | % | | | +28 | % | | | -6 | % |
| |
a See Note 2 to the Summary Group Financial Statements.
The Group’s net income in 2004 was $18.2 billion, an increase of 48% from 2003. These earnings reflect higher realised oil and gas prices in Exploration & Production and higher LNG volumes and prices in Gas & Power, as well as increases in refining margins and trading profits in Oil Products and higher volumes and margins in Chemicals.
Exploration & Production earnings were $9,315 million, 4% higher than in 2003. Production in 2004 was broadly unchanged compared to 2003, excluding the impact of divestments, price effects and hurricanes in the Gulf of Mexico. The decline in production in mature areas was largely offset by the start of production in new fields.
Hydrocarbon prices were higher in 2004 than in 2003 with Brent crude prices averaging $38.30 a barrel compared with $28.85 in 2003 and West Texas Intermediate prices averaging $41.50 a barrel in 2004 compared with $31.05 in 2003. Prices reflected the effect of strong US and Chinese demand, geopolitical uncertainty in a number of producer countries, disruptions to production as a result of the hurricanes in the Gulf of Mexico, and lower OPEC spare production capacity. The benefits of higher oil and gas prices were offset by lower hydrocarbon production, higher costs and depreciation, and an increase in the overall effective tax rate.
Earnings in Gas & Power were $2,155 million, 6% lower than in 2003. Earnings in 2003 included gains of $1,120 million mainly related to divestments (Ruhrgas), divestment gains in 2004 were $772 million. Earnings in 2004 reflected a 9% increase in LNG volumes and an 8% increase in LNG prices.
Oil Products earnings increased by 164% compared with 2003, to $7,537 million, benefiting significantly from higher refining margins and increased trading earnings. These results included divestment gains of $1,038 million and net charges of $403 million.
Earnings in Chemicals were $930 million, after a $565 million write-down in the carrying amount of Basell. This impairment followed the announcement in 2004 of a review of strategic alternatives regarding this joint venture. In 2003, a loss of $209 million for Chemicals included $478 million in asset restructuring and impairment charges. The improvement in earnings from 2003 was due to volume growth and higher margins.
The results discussed above include income from discontinued operations of $1,560 million in 2004, including gains on the disposal of such operations.
Capital investment1in 2004 was $14.9 billion compared with $14.3 billion in 2003. Gross proceeds from divestments were $7.6 billion and cash flow from operating activities was $25.6 billion, an increase of 18% from 2003. At the end of 2004 the total debt ratio2was
| 1 | | Capital investment is capital expenditure, exploration expense and investments in associated companies. |
| |
| 2 | | The total debt ratio is defined as short-term plus long-term debt as a percentage of capital employed. Capital employed is Group net assets before deduction of minority interests, plus short-term and long-term debt. |
Summary Operational and Financial Review 13
13.8% compared with 21.0% in 2003. Cash and cash equivalents were $8.5 billion compared with $2.0 billion in 2003.
It is expected that at least $10 billion, subject to exchange rates, will be returned to shareholders in dividends in 2005. The share buyback programme was relaunched on February 3, 2005.
All Group financial information contained in this section is presented in accordance with accounting principles generally accepted in the United States.
Reserves
On January 9, 2004, the Group announced the removal of approximately 3.9 billion barrels of oil equivalent (boe) originally reported as proved reserves at December 31, 2002. As a result of further field level reviews concluded in April 2004, the Group determined to restate both the Financial Statements (the First Financial Restatement) and the unaudited disclosures contained in the supplementary information accompanying the Financial Statements (the First Reserves Restatement) to reflect the removal of 4.47 billion boe originally reported as proved reserves as at December 31, 2002.
On February 3, 2005 as a result of reservoir level reviews conducted from July to December 2004 of substantially all of the Group’s proved reserves volumes, the Group announced the removal of approximately 1.37 billion boe of oil and natural gas that were originally reported as proved reserves as at December 31, 2003. The Group has restated the unaudited oil and natural gas reserves disclosures contained in the supplementary information accompanying the Group Financial Statements (the Second Reserves Restatement) to remove these volumes at the earliest date on which they did not represent “proved reserves” within the applicable rules of the United States Securities and Exchange Commission, which in many cases is the date on which the volumes were initially booked as reserves. Approximately 57% of the de-booked volumes were previously booked as proved undeveloped reserves and 43% of the de-booked volumes were previously booked as proved developed reserves.
In view of the inappropriate overstatement of unaudited proved reserves information, it was decided to restate the Financial Statements of the Group, and each of the Parent Companies for the year ended December 2003 and prior periods (the Second Financial Restatement) to reflect the impact of the Second Reserves Restatement on those Financial Statements.
For further information on the Reserves Restatements and Financial Restatements see Note 2 to the Summary Group Financial Statements.
14 Royal Dutch/Shell Group of Companies
Upstream: Exploration & Production
Performance for the year was strong in terms of cash generation and the progress made on new business milestones. However, the SEC proved reserves reduction and the low 2004 reserves replacement ratio were clearly disappointing.
Our Exploration & Production business searches for and recovers oil and natural gas around the world and is active in more than 36 countries. The majority of these activities are carried out in ventures with external partners.
“The E&P business retains a sound foundation of assets, positions and people. We have some way to go, but we will regain our competitive strength.”
Malcolm Brinded
Executive Director,
Exploration & Production

Malcolm Brinded
Executive Director, Exploration & Production
Earnings
| | | | | | | | | | | | | |
| | | | | | | | | | | $ million | |
| | | | | | | 2003 | | | 2002 | |
| | | 2004 | | | As restateda | | | As restateda | |
| |
Segment earnings | | | 9,315 | | | | 8,923 | | | | 6,726 | |
| |
Change from previous year | | | +4 | % | | | +33 | % | | | -15 | % |
| |
| a | | See Note 2 to the Summary Group Financial Statements. |
Exploration & Production earnings in 2004 were $9,315 million, 4% higher than in 2003 reflecting higher oil and natural gas prices. Total underlying hydrocarbon production (including oil sands) was 3% lower than in 2003 at 3,772 thousand barrels of oil equivalent (boe) per day and total capital investment was $8.8 billion (excluding the contribution of our minority partners in Sakhalin).
Various new fields started production during the year, including Jintan and Serai in Sarawak, Malaysia and Goldeneye in the Moray Firth in the UK. Production began at the Holstein, Llano and Glider fields in the Gulf of Mexico, and in the North Sea at the Scoter and Howe fields. Oil production from the West Salym in Russia started, a year earlier than planned.
A number of fields increased production significantly over the year. These included the Bijupirá-Salema field in Brazil, the Na Kika and Habanero fields in the USA, the EA
| 1 | | Natural gas has been converted to crude oil equivalent using a factor of 5,800 standard cubic feet per barrel. |
Building a long history:
A new discovery in Brunei

Sally Kapal, a production operator on Ampa 6.
Ampa 6 is one of Shell’s offshore production platforms in Brunei. Over 80% of the employees of Brunei Shell are Bruneian.
In 2004 Shell celebrated 75 years of production in Brunei. In a joint venture with the Brunei government, we operate 15 oil and natural gas fields, which makes Brunei the Group’s largest source of oil in the Asia Pacific region.
The mature fields in Brunei have been complemented by a potentially significant new discovery in what is known as the Seria North flank. The Seria field was first discovered in 1929 in a coastal area onshore and has been a significant producer of oil and natural gas for many years. The latest find is in an area three kilometres offshore that had not previously been drilled and, while more appraisal work needs to be done, current indications suggest that there could be up to 100 million barrels of oil in the whole of the Seria North flank.
The exploration of the area is making use of the most advanced technology including the use of what is known as a fish hook well. This type of well follows a U shape and means that the Seria North flank can be developed from a drilling rig onshore. This use of existing infrastructure and facilities is a very efficient way of extending and developing the life of the field.
Find out more
www.shell.com/ep
Summary Operational and Financial Review 15
field in Nigeria and the Athabasca Oil Sands Project in Canada. These increases, along with production from new fields, added 221,000 boe per day of production.
During the year, final investment decision was taken on the Kashagan project in Kazakhstan which is expected to start production in 2008. The development of the Pohokura natural gas field in New Zealand was agreed and planning permission was granted for the terminal that will receive natural gas from the offshore Corrib development in Ireland. In Oman agreements were signed with the government to extend the terms of Petroleum Development Oman’s (PDO) concession until 2044 and a Heads of Agreement was signed with the Libyan National Oil Company to establish a long-term strategic partnership. Plans were also announced to increase production at the Athabasca Oil Sands Project and important progress was made on the construction work for the Sakhalin project.
We participated in 31 successful exploration wells and made discoveries in 11 countries. These discoveries will now be appraised in order to establish the extent of the reserves they contain.
Reserves
Further reductions were made to the proved reserves (see page 13 for further details). At the end of the year the Group’s total proved reserves were 10,231 million boe, 12% lower than the previous year. At December 31, 2004 the Group share of associated companies’ total proved reserves were 1,652 million boe, 22% higher than the previous year. Exploration and appraisal activity has been refocused and investment increased in order to improve reserve replacement in the future.
Unlocking new resources in Russia:
Salym starts production
Construction of essential field infrastructure facilities, Salym, Russia
The Salym project is an important step forward in the development of Shell’s presence in Russia, a country of high strategic importance for the Group.
The Salym project in western Siberia is a $1 billion joint venture between Shell and the Russian oil company, OAO NK Evikohn and is Shell’s second largest investment in Russia (after Sakhalin). The rapid pace of the development of these complex fields shows the value that can be gained from combining Shell’s international experience with the long established expertise of the Siberian oil industry.
The Salym group of fields is estimated to have more than 800 million barrels of producible oil and natural gas resources and to have a life of over 30 years. They cover three areas, Upper Salym, West Salym and Vadelyp. Production started from the Upper Salym field in 2003, from West Salym, the biggest field, at the end of 2004, and will be followed by Vadelyp in 2006. The development will have 213 production wells across the three fields, from which production is expected to reach 120,000 barrels of oil a day and 20 million cubic feet of natural gas. All this work is being carried out to high environmental standards and in a way that seeks to make a positive contribution to the local community.
Exploration is continuing in the area and a new prospect has been found in the Upper Salym field. While testing is continuing to establish the extent and nature of this discovery, it is an encouraging find. This underlines that the area has major potential for further development and reinforces Shell’s role in the massive and still growing Russian upstream industry.
Find out more
www.shell.com/ep
16 Royal Dutch/Shell Group of Companies
Upstream: Gas & Power
The drivers behind the strong performance for 2004 are LNG volume growth, record realised prices and higher dividends from joint ventures.
Our Gas & Power business liquefies and transports natural gas, and develops natural gas markets and infrastructure including gas-fired power plants. It also markets and trades natural gas and electricity and converts natural gas to liquids to provide clean fuels. The majority of activities, in particular liquefied natural gas (LNG), are carried out by associated companies.
“My personal top three priorities for 2005 are improvement in safety performance, operational excellence and accessing material new natural gas positions for the Group.”
Linda Cook
Executive Director, Gas & Power

Linda Cook
Executive Director, Gas & Power
Earnings
| | | | | | | | | | | | | |
| | | | | | | | | | | $ million | |
| | | | | | | 2003 As | | | 2002 As | |
| | | 2004 | | | reclassifieda | | | reclassifieda | |
| |
Segment earnings | | | 2,155 | | | | 2,289 | | | | 774 | |
| |
Change from previous year | | | -6 | % | | | +196 | % | | | -37 | % |
| |
| a | | See Note 2 to the Summary Group Financial Statements. |
Gas & Power earnings in 2004 were $2,155 million, down slightly from record earnings of $2,289 million in 2003. Earnings in 2003 included gains of $1,120 million mainly related to divestments (Ruhrgas), whereas divestment gains in 2004 were $772 million. Excluding these gains, earnings in 2004 were up 18% on 2003.
Capital investment in 2004 was $1,633 million, up 8% from $1,511 million in 2003.
Total LNG sales increased to a record 10.15 million tonnes reflecting the impact of the start of production from the fourth train in the North West Shelf Venture in Australia, increased production from the Malaysia Tiga project and the effect of a full year’s production from the third train of Nigeria LNG.
Two new long-term contracts were signed for the Australian North West Shelf Venture to supply LNG to Japan and an agreement was also reached to supply 3.5 million tonnes per annum (mtpa) for 25 years to China’s first LNG terminal in Guangdong. The Malaysia Tiga LNG project signed an agreement to
Developing a global LNG business:
New projects in North America

Mateo Lopez, Managing Director, Altamira LNG Import Terminal
The construction at Altamira, on the east coast of Mexico, is only a part of Shell’s broader strategy to establish a network of LNG terminals in North America.
Global demand for liquefied natural gas (LNG) is expected to double during this decade. The increases will be seen in all major markets but the fastest growth will be in North America where Shell has several import projects at different stages of development that will build on our leading role in the global LNG business.
Shell is already supplying LNG to the US market through an existing regasification terminal at Cove Point in Maryland and supplies to Elba Island in Georgia are set to begin in 2006. We have proposals for new terminals at Gulf Landing in the Gulf of Mexico and for the Broadwater project in Long Island Sound.
In Mexico we are involved in two new LNG import terminals with the first at Altamira on the east coast. This will initially receive much of its natural gas from Shell’s LNG plant in Nigeria to supply the growing Mexican market and is expected to start operations towards the end of 2006. The second terminal, at Baja California on Mexico’s west coast, will be supplied through a historic development with LNG from the Sakhalin project in Russia. While Russia has been supplying natural gas to Europe for more than 30 years this is the first time that Russian natural gas has been sold into the North American market. The agreement will see 37 million tonnes of LNG being supplied from Sakhalin to Baja over a 20-year period. Longer-term supplies to Baja are also expected from Shell’s other LNG projects in Asia Pacific.
Find out more
www.shell.com/lng
Summary Operational and Financial Review 17
supply 2.8mtpa to Kogas in Korea (2005-2008). Sakhalin Energy finalised a number of agreements to supply LNG from the Sakhalin II project. A total of 5mtpa has now been sold under long-term contracts from this project, including a historic agreement to supply Russian natural gas to the North American market through the Baja California receiving terminal in Mexico.
There were a number of other significant developments in the North American market including the Group’s agreement to acquire 50% of the capacity of the new regasification terminal in Baja California, Mexico. Progress was also made in the joint venture that is building a 3.3mtpa LNG import terminal on Mexico’s east coast at Altamira. Another Shell joint venture announced plans to develop a 7.5mtpa offshore LNG import terminal in Long Island Sound in the USA and permits for the Gulf Landing offshore import terminal in the Gulf of Mexico were received in early 2005.
In other key developments the decision was made to proceed with Nigeria LNG train 6 which is expected to start production in 2007. Shell acquired an 11% indirect interest in the Qalhat LNG project in Oman which has a total capacity of 3.3mtpa. An integrated development and production sharing agreement was signed between Shell and Qatar Petroleum to develop the Pearl Gas to Liquids (GTL) plant at Ras Laffan. When fully operational the plant will have the capacity to produce 140,000 barrels per day of GTL products.
In April 2005, Shell and Bechtel Enterprises Energy B.V. signed an agreement to sell InterGen N.V. (Group interest 68%) including 10 of its power plants for $1.75 billion. Excluded from the sale are InterGen’s assets in the United States, Colombia, and Turkey, which will be reorganised prior to financial closing and retained by Shell and Bechtel pending further review. The transaction is expected to close mid-2005 and is subject to certain conditions and regulatory approvals.
Supporting sustainable transport:
GTL comes to China

Shanghai, China
A cleaner alternative, GTL Fuels are being
tested in large cities such as Shanghai.
The world’s largest cities face real challenges in improving local air quality. Shell’s Gas to Liquids (GTL) Fuel could play an important part in meeting that challenge. GTL is a liquid fuel produced from natural gas that can be used in vehicles with conventional diesel engines. GTL offers a practical and cost-effective way of reducing vehicle emissions.
Trials in cities around the world, using fuel produced at our plant in Bintulu, Malaysia, have already shown the benefits GTL Fuel can bring in reducing emissions. In addition, Shell is working with a number of vehicle manufacturers to develop advanced engines to improve both performance and reduce polluting emissions further.
Trials with GTL Fuel in 2004 included London buses, cars in Shanghai at the Michelin Bibendum Challenge, and trucks in California. At the Michelin Bibendum Challenge, the world’s premier clean vehicle event held in Shanghai in 2004, GTL Fuel was used in the latest Audi diesel cars. The international event includes a rally, exhibition and technical competition designed to test a range of new engine technologies and fuels. Emissions tests demonstrated that GTL Fuel reduced emissions of particulates, nitrogen oxide, carbon monoxide and hydrocarbons significantly below standard European diesel and resulted in Audi winning their class in the competition.
GTL Fuel blends are already on sale in a number of countries and, when the planned Pearl GTL project in Qatar starts production late in this decade, will be available on a larger scale across the world.
Find out more
www.shell.com/gtl
18 Royal Dutch/Shell Group of Companies
Downstream: Oil Products
Underlying the 2004 results was improved asset utilisation which enabled the business to capture more benefits of high margins.
Our Oil Products business markets fuels and lubricants for domestic and industrial use and for the range of transport modes from road to shipping and aviation. It also refines, supplies, trades and ships crude oil and petroleum products.
“Our priorities for 2005 include strengthening our position for the long term in those markets that offer good profitability and potential for growth, and developing distinctive customer value propositions. The new global organisation is an important enabler in these activities.”
Rob Routs
Executive Director,
Oil Products and Chemicals

Rob Routs
Executive Director, Oil Products and Chemicals
Earnings
| | | | | | | | | | | | | |
| | | | | | | | | | | $ million | |
| | | | | | | 2003 As | | | 2002 As | |
| | | 2004 | | | reclassifieda | | | reclassifieda | |
| |
Segment earnings | | | 7,537 | | | | 2,860 | | | | 2,627 | |
| |
Change from previous year | | | +164% | | | | +9% | | | | -33% | |
| |
| a | | See Note 2 to the Summary Group Financial Statements. |
Total full year segment earnings in Oil Products were $7,537 million, an increase of 164% over 2003, reflecting higher refining margins and increased trading earnings.
Capital investment in 2004 was $2.5 billion compared with $2.4 billion in 2003. The main areas of investment were in refinery maintenance and in maintaining and upgrading retail networks.
The rebranding of the retail network in the USA and Europe continued. In the USA, more than 12,000 sites have either been rebranded from Texaco to Shell or upgraded to the new Shell image and style. Shell is now the leading brand of gasoline in the USA, having a greater market share and higher volume of sales than any other brand. Work continued to extend our presence in the premium fuels market including the launch of V-Power in the USA and of a V-Power diesel blend, with a Gas to Liquids component, in Germany and the Netherlands.
Looking to growth markets:
New developments in Asia

Shell Service Station, Subang Jaya, Malaysia
Increasing our presence in the Asian market is key to the success of the downstream strategy.
In the highly competitive oil products market it is especially important that we increase our presence in selected markets which are seeing growth in demand and reduce our assets in markets where returns are less attractive.
As a result, we are expanding our presence in Asian markets which look set to see significant economic growth in the years ahead. This will build on the success we have already had in establishing new positions in this region. These include the agreement we have signed with Sinopec to provide 500 retail stations in Jiangsu province which will give us a presence in China’s rapidly growing transport fuels sector. Other investments are developing new downstream activity elsewhere in the region. We have gained the first foreign retail marketing licence in India and the first retail service station opened in Bangalore in late 2004. In Indonesia, another market with enormous potential, we have been awarded a licence to develop a fuels marketing and retailing business.
At the same time we have sold assets in Spain, Portugal and South America where analysis of the particular markets showed that returns were less attractive and the potential for growth was limited.
Find out more
www.shell.com/china-en
Summary Operational and Financial Review 19
In line with our strategy of reshaping our portfolio and focusing our activity in selected markets, a number of divestments were made including assets in Portugal and Spain and a portion of the Group’s ownership of Showa Shell in Japan which was sold to Saudi Aramco. The sale of the Group’s interest in the Rayong refinery in Thailand was completed. The Delaware City refinery and the Great Plains and Midwest product pipelines in the USA were sold. We also announced that we were considering options for the LPG business including the possibility of a sale.
At the beginning of 2005 a single downstream organisation was established that integrated some activities of the Oil Products and Chemicals businesses. This will help us optimise the way we work at shared refining and chemicals facilities, standardise our processes and improve services to customers.
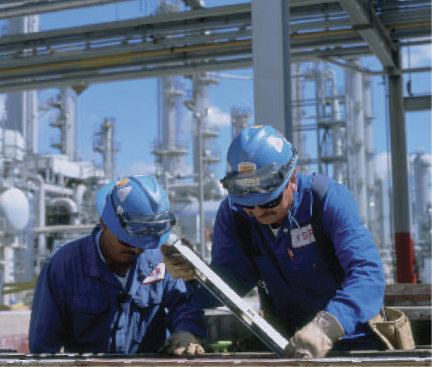
Achieving operational excellence:
Effective refinery maintenance
Joanne Mase, apprentice process operator, Stanlow Refinery, UK
Stanlow employs some 800 people, processes 12 million tonnes of crude a year, and manufactures a range of oil products including about one-sixth of Britain’s petrol.
Improving performance at refineries and chemicals plants is key to our success, especially in a high oil price environment. This means both reducing the unplanned interruptions to operations and ensuring that planned maintenance is carried out on schedule.
One initiative called Global Asset Management Excellence (GAME) is helping to tackle these issues by focusing on improving the reliability of equipment by standardising processes with a focus on reducing costly equipment failures. That means that by 2008, when the programme is in place across the world, the processes used in a refinery in Europe will be the same as those in the USA. This standardisation and reduction in variability will help us to address problems more quickly and to manage operations more efficiently.
This is one element in a range of work that is being undertaken to bring all our refineries up to the highest standards of operational performance. The benefits of this approach have already been seen at the Stanlow refinery in northwest England. Every three years a major project, known as a turnaround, takes place to inspect, maintain and upgrade the equipment at the refinery. The most recent turnaround took place in early 2004 and was a huge undertaking, costing £18 million and involving 1,500 contractors. The project was extremely successful, meeting its environmental, safety and quality targets, and completing operations in a record time, allowing the plant to restart production on schedule.
Find out more
www.shell.com/stanlow
20 Royal Dutch/Shell Group of Companies
Downstream: Chemicals
The 2004 results were a great achievement for Chemicals. Highlights included improved operating rates, strong cash generation and strengthening the portfolio with new investments.
Our Chemicals business produces and sells petrochemicals to industrial customers globally. Chemicals’ products are widely used in plastics, coatings and detergents, which in turn are used in products such as fibres and textiles, thermal and electrical insulation, medical equipment and sterile supplies, computers, lighter and more efficient vehicles, paints and biodegradable detergents.
| | | | | | | | | | | | | |
| | | | | | | | | | | $ million | |
| Earnings | | 2004 | | | 2003 | | | 2002 | |
| |
Segment earnings | | | 930 | | | | (209 | ) | | | 565 | |
| |
Segment earnings in 2004 showed a profit of $930 million. This compares with a loss of $209 million in 2003 and reflects higher demand and higher margins in all the key markets.
Capital investment was $705 million in 2004 compared with $599 million in 2003.
Work continued on the construction of the Nanhai petrochemicals plant in southern China. PTT PolyCanada began production of Corterra, a product used in the manufacture of textiles and carpets. The production of butadiene, used in the manufacture of rubber and plastics products, started at the Sabina Petrochemicals plant in the USA and the ethylene cracker at Deer Park in Texas was expanded. In the Netherlands, a new ethylene oxide reactor began operations and the ethylene glycol plant was expanded. We also announced the next phase in the development of our chemicals facilities in Singapore and a review of the Basell polyolefins joint venture.
Meeting the growing demand in China:
Nanhai nears completion

Dramatic growth in use of consumer products
Increasing disposable incomes mean that the Chinese are buying more consumer products such as mobile phones, computers and televisions.
China is one of the fastest growing economies in the world, with most forecasters predicting growth in GDP in excess of 8% for the next few years. With a population of 1.3 billion, that growth in prosperity is opening up a huge new market for a whole range of consumer products.
This includes products made by the petrochemicals industry which range from plastics to paints and from carpets to cars. At the moment much of China’s demand for petrochemicals is met from imports. From 2006, the Nanhai complex at Daya Bay, Guangdong province, in which Shell has a 50% share, will have the capacity to produce 2.3 million tonnes of chemicals a year to supply that domestic market.
China currently uses about 1kg per head of plastics products a year compared to 40kg in Western Europe. The location of the Nanhai complex in Guangdong, the province where economic growth and petrochemical demand are predicted to grow most rapidly, means it is ideally placed to supply customers in South China.
The plant will have the capacity to produce a range of different chemicals, including 800,000 tonnes a year of ethylene which is used to make a wide range of derivatives products, for which demand in China is forecast to more than double by 2010. The complex will also produce styrene, which is used in the production of materials such as polystyrene; propylene oxide that is used in foam and adhesives; mono-ethylene glycol that is used in the textile industry; and polyethylene and polypropylene that can be used in a range of plastics, film and packaging applications.
Find out more
www.shell.com/chemicals
Summary Operational and Financial Review 21
Other industry segments and Corporate
Other industry segments include Renewables and Hydrogen. Renewables works to develop businesses based on renewable sources of energy, including wind and solar power. Hydrogen works to develop business opportunities in hydrogen and fuel cell technology.
Segment earnings
| | | | | | | | | | | | | |
| | | | | | | | | | | $ million | |
| | | | | | | 2003 | | | 2002 | |
| | | 2004 | | | As reclassifieda | | | As reclassifieda | |
| |
Other industry segments | | | (141 | ) | | | (267 | ) | | | (110 | ) |
| |
Corporate | | | (899 | ) | | | (917 | ) | | | (751 | ) |
| |
| a | | See Note 2 to the Summary Group Financial Statements. |
Other industry segments is made up of the Group’s Renewables, Hydrogen and Consumer businesses. The combined earnings of these activities showed a loss of $141 million compared with a loss of $267 million in 2003.
In Renewables, sales of solar products increased by 50%, driven by strong demand in the German market. A number of technological developments were made to improve the efficiency of solar panels including the launch of a new range of solar products called Shell PowerMax. In the Wind business, the wind parks in Colorado Green and Brazos in the USA started full production and a number of other wind assets were sold as had previously been planned. Shell Hydrogen continued to develop partnership projects to demonstrate the viability of hydrogen as a transport fuel. These included the opening of the first integrated hydrogen station in Washington, DC.
Shell Consumer was integrated into the Oil Products business during the course of the year.
Corporate is a non-operating segment consisting primarily of interest expense on Group debt and certain non-allocated costs of the Group. Corporate net costs were $899 million compared with $917 million in 2003.
Developing an infrastructure for hydrogen:
Hydrogen station opens in Washington, DC

Hydrogen fuel cell car in Washington, DC
Fuel cell technology uses oxygen and hydrogen to produce energy offering a cleaner alternative to conventional fuels.
Hydrogen fuel cell vehicles can be found on the road in a number of cities around the world as part of partnership projects supported by Shell Hydrogen.
These include a project in Washington, DC where Shell Hydrogen and General Motors are running a trial of six fuel cell vehicles to demonstrate how hydrogen cars operate in everyday road conditions. These vehicles fill up alongside conventional cars at a service station in the city. This is the world’s first integrated station and by placing the hydrogen dispenser within a conventional fuel station, the project highlights the progress that has been made in providing a fuelling infrastructure for hydrogen vehicles.
By bringing together energy companies, governments and car manufacturers in these kinds of projects Shell Hydrogen believes we can help to accelerate the development of hydrogen as a commercially viable transport fuel. That work is now being extended in what is known as a ‘lighthouse project’ in New York that will develop a network of hydrogen fuelling stations to supply a fleet of hydrogen fuel cell cars.
Find out more
www.shell.com/hydrogen
22 Royal Dutch/Shell Group of Companies
Report of the Independent Auditors
To Royal Dutch Petroleum Company and
The “Shell” Transport and Trading Company, p.l.c.
We have reviewed the Summary Financial Statements, set out on pages 22 to 24 prepared under generally accepted accounting principles in the United States (US GAAP) and on pages 25 and 26 prepared under generally accepted accounting principles in the Netherlands (Netherlands GAAP), which have been derived from the full 2004 Financial Statements of the Royal Dutch/Shell Group of Companies. The preparation of Summary Financial Statements is the responsibility of management.
Based on our review, we confirm that the Summary Financial Statements are consistent in all material respects with the full 2004 Financial Statements of the Royal Dutch/Shell Group of Companies which we have audited in accordance with generally accepted auditing standards in the United States and the Netherlands respectively, and on which we have issued an unqualified opinion dated April 27, 2005. For a better understanding of the Group’s financial performance and position and the scope of the audit performed, the Summary Financial Statements should be read in conjunction with the full Annual Report and Accounts and our reports thereon.
As disclosed in Note 1: the Group adopted the provisions of Statement of Financial Accounting Standards No. 143 ‘Accounting for Asset Retirement Obligations’ as of January 1, 2003 in its Financial Statements prepared under US GAAP and adopted the provisions of Financial Accounting Standards Board Interpretation No. 46 ‘Consolidation of Variable Interest Entities — an interpretation of ARB 51’ as of September 30, 2003 in its Financial Statements prepared under US GAAP.
As discussed in Note 2 “Restatement of previously issued Financial Statements”, the Group has restated its Financial Statements prepared under US GAAP for the two years ended December 31, 2003 to correct for the financial impact of the reserves restatement announced on February 3, 2005.
Without qualifying our opinion, we emphasise that the Group has restated the comparative data for the years 2003 and 2002 under Netherlands GAAP as explained in Note 3.
| | | |
KPMG Accountants N.V.
The Hague
April 27, 2005 | | PricewaterhouseCoopers LLP
London |
Summary Group Financial Statements
These Summary Financial Statements are an abridged version of the Financial Statements of the Royal Dutch/Shell Group of Companies. They do not contain sufficient information to allow a thorough understanding of the Financial Statements and the state of affairs of the Royal Dutch/Shell Group of Companies. For further information consult the full Annual Report and Accounts (available at www.shell.com/annualreport or see the back cover for contact addresses to request a free copy).
Summarised Statement of Income
| | | | | | | | | | | | | |
| | | | | | | | | | | $ million | |
| | | | | | | 2003 | | | 2002 | |
| | | 2004 | | | As restateda | | | As restateda | |
| |
| Sales proceeds | | | 337,522 | | | | 263,889 | | | | 218,287 | |
| Sales taxes, excise duties and similar levies | | | 72,332 | | | | 65,527 | | | | 54,834 | |
| |
Net proceeds | | | 265,190 | | | | 198,362 | | | | 163,453 | |
| Cost of sales | | | 221,678 | | | | 165,147 | | | | 135,658 | |
| |
Gross profit | | | 43,512 | | | | 33,215 | | | | 27,795 | |
| Selling and distribution expenses | | | 12,340 | | | | 11,409 | | | | 9,617 | |
| Administrative expenses | | | 2,516 | | | | 1,870 | | | | 1,587 | |
| Exploration | | | 1,823 | | | | 1,475 | | | | 1,052 | |
| Research and development | | | 553 | | | | 584 | | | | 472 | |
| |
| Operating profit of Group companies | | | 26,280 | | | | 17,877 | | | | 15,067 | |
| Share of operating profit of associated companies | | | 5,653 | | | | 3,446 | | | | 2,792 | |
| |
Operating profit | | | 31,933 | | | | 21,323 | | | | 17,859 | |
| Interest and other income | | | 1,705 | | | | 1,967 | | | | 748 | |
| Interest expense | | | 1,214 | | | | 1,324 | | | | 1,291 | |
| Currency exchange gains/(losses) | | | (39 | ) | | | (231 | ) | | | (25 | ) |
| |
Income before taxation | | | 32,385 | | | | 21,735 | | | | 17,291 | |
| Taxation | | | 15,136 | | | | 9,349 | | | | 7,647 | |
| |
| Income after taxation | | | 17,249 | | | | 12,386 | | | | 9,644 | |
| Income applicable to minority interests | | | 626 | | | | 353 | | | | 175 | |
| |
Income from continuing operations | | | 16,623 | | | | 12,033 | | | | 9,469 | |
| Income from discontinued operations, net of tax | | | 1,560 | | | | 25 | | | | 187 | |
| Cumulative effect of a change in accounting principle, net of tax | | | — | | | | 255 | | | | — | |
| |
Net income | | | 18,183 | | | | 12,313 | | | | 9,656 | |
| |
Summary Financial Statements 23
Summarised Statement of Assets and Liabilities
| | | | | | | | | |
| | | | | | | $ million | |
| | | | | | | Dec 31, | |
| | | Dec 31, | | | 2003 | |
| | | 2004 | | | As restateda | |
| |
Fixed assets | | | 116,321 | | | | 114,597 | |
| Other long-term assets | | | 14,642 | | | | 11,349 | |
Current assets | | | | | | | | |
| Inventories | | | 15,391 | | | | 12,690 | |
| Accounts receivable | | | 37,998 | | | | 28,969 | |
| Cash and cash equivalents | | | 8,459 | | | | 1,952 | |
| |
Total current assets | | | 61,848 | | | | 43,611 | |
| |
Current liabilities:amounts due within one year | | | | | | | | |
| Short-term debt | | | 5,822 | | | | 11,027 | |
| Accounts payable and accrued liabilities | | | 40,207 | | | | 32,347 | |
| Taxes payable | | | 9,885 | | | | 5,927 | |
| Dividends payable to Parent Companies | | | 4,750 | | | | 5,123 | |
| |
Total current liabilities | | | 60,664 | | | | 54,424 | |
| |
| Long-term liabilities (including long-term debt) | | | 16,665 | | | | 15,154 | |
| Provisions | | | 25,597 | | | | 24,067 | |
| Minority interests | | | 5,309 | | | | 3,415 | |
| |
Net assets | | | 84,576 | | | | 72,497 | |
| |
Summarised Statement of Cash Flows
| | | | | | | | | | | | | |
| | | | | | | | | | $ million | |
| | | | | | | 2003 | | | 2002 | |
| | | 2004 | | | As restated | | | As restated | |
| |
Cash flow provided by operating activities | | | | | | | | | | | | |
| Net income | | | 18,183 | | | | 12,313 | | | | 9,656 | |
| Depreciation, depletion and amortisation | | | 12,273 | | | | 11,711 | | | | 8,739 | |
| Profit on sale of assets | | | (3,033 | ) | | | (2,141 | ) | | | (367 | ) |
| Decrease/(increase) in net working capital | | | (486 | ) | | | 1,168 | | | | (1,655 | ) |
| Other | | | (1,350 | ) | | | (1,332 | ) | | | (90 | ) |
| |
| | | | 25,587 | | | | 21,719 | | | | 16,283 | |
| |
Cash flow used in investing activities | | | | | | | | | | | | |
| Capital expenditure, including acquisitions | | | (12,734 | ) | | | (12,252 | ) | | | (21,027 | ) |
| Proceeds from sale of assets | | | 5,078 | | | | 2,286 | | | | 1,099 | |
| Other | | | 2,013 | | | | 1,714 | | | | (705 | ) |
| |
| | | | (5,643 | ) | | | (8,252 | ) | | | (20,633 | ) |
| |
Cash flow used in financing activities | | | | | | | | | | | | |
| Net increase/(decrease) in long-term debt | | | (1,144 | ) | | | (2,168 | ) | | | (343 | ) |
| Net increase/(decrease) in short-term debt | | | (3,701 | ) | | | (2,507 | ) | | | 7,058 | |
| Change in minority interests | | | 807 | | | | (1,363 | ) | | | 421 | |
| Dividends paid to: | | | | | | | | | | | | |
| Parent Companies | | | (8,490 | ) | | | (6,248 | ) | | | (6,961 | ) |
| minority interests | | | (264 | ) | | | (300 | ) | | | (228 | ) |
| |
| | | | (12,792 | ) | | | (12,586 | ) | | | (53 | ) |
| |
Parent Companies’ shares: | | | | | | | | | | | | |
| net sales/(purchases) and dividends received | | | (758 | ) | | | (633 | ) | | | (864 | ) |
| Currency translation differences relating to cash and cash equivalents | | | 113 | | | | 148 | | | | 153 | |
| |
Increase/(decrease) in cash and cash equivalents | | | 6,507 | | | | 396 | | | | (5,114 | ) |
| |
| Cash and cash equivalents at January 1 | | | 1,952 | | | | 1,556 | | | | 6,670 | |
| |
| Cash and cash equivalents at December 31 | | | 8,459 | | | | 1,952 | | | | 1,556 | |
| |
1 Nature of the Summary Financial Statements and changes in accounting policy
The Summary Financial Statements have been derived from the Financial Statements of the Royal Dutch/Shell Group of Companies. Those Financial Statements have been prepared under the historical cost convention and in accordance with generally accepted accounting principles in the United States.
The Financial Statements reflect an aggregation in US dollars of the accounts of companies in which Royal Dutch and Shell Transport together, either directly or indirectly, have control either through a majority of the voting rights or the right to exercise a controlling influence. Investments in companies over which Group companies have significant influence, but not control, are classified as associated companies and are accounted for on an equity basis. Certain joint ventures are taken up in the Financial Statements in proportion to the relevant Group interest.
Assets and liabilities of non-dollar Group companies are translated to dollars at year-end rates of exchange, whilst their statements of income and cash flows are translated at quarterly average rates. Translation differences arising on aggregation are taken directly to a currency translation differences account, which forms part of Parent Companies’ interest in Group net assets.
In 2003 the Group adopted US accounting standard FAS 143 relating to asset retirement obligations. The effect upon implementation was recorded as a cumulative effect adjustment in the income statement under US GAAP, and as an adjustment to opening net assets under Netherlands GAAP. US pronouncement FIN 46 was implemented on September 30, 2003, resulting in the consolidation of certain Variable Interest Entities under US GAAP.
2 Restatement of previously issued Financial Statements
First Reserves Restatement
The 2003 Group Financial Statements reflected the impact of removing 4.47 billion barrels of oil equivalent (boe) from the proved category per December 31, 2002, the restatement of the unaudited oil and gas reserves disclosures contained in the supplementary information accompanying the Financial Statements, and to show the resulting effect in depreciation, depletion and amortisation charges related to Exploration & Production.
Second Reserves Restatement
The completion of the Group’s reserves review was announced on February 3, 2005 and resulted in an additional 1.37 billion boe of oil and natural gas being removed from the proved category per December 31, 2003.
Second Financial Restatement
The additional effect of understating the depreciation, depletion and amortisation charges related to Exploration & Production resulted in a reduction in net income for 2003 of $183 million (2002: $66 million).
Discontinued operations
The activities of certain Group companies were disposed of during 2004 or remain as held for sale at December 31, 2004. Activities reported as discontinued operations in the Summarised Statement
24 Royal Dutch/Shell Group of Companies
2 Restatement of previously issued Financial Statementscontinued
of income comprise certain operations in Exploration & Production, Gas & Power, and Oil Products and reflect the Group’s continued strategy of greater focus on core assets. All of these were disposed of in 2004 except some operations with a carrying amount as at December 31, 2004 of $0.3 billion, which are expected to be sold in 2005. Net proceeds of discontinued operations in 2004 (up to date of disposal where applicable) were $3.5 billion (2003: $3.4 billion; 2002: $3.1 billion).
Statement of Income
| | | | | | | | | | | | | | | | | |
| | | | | | | | | | | | | | | $ million | |
| 2003 | |
| | | | | | | | | | | Reclassification | | | | |
| | | As | | | Second | | | for | | | | |
| | | originally | | | Reserves | | | discontinued | | | As | |
| | | reporteda | | | Restatement | | | operationsb | | | restated | |
| |
| Net proceeds | | | 201,728 | | | | — | | | | (3,366 | ) | | | 198,362 | |
| Cost of sales | | | 167,500 | | | | 289 | | | | (2,642 | ) | | | 165,147 | |
| Exploration | | | 1,476 | | | | — | | | | (1 | ) | | | 1,475 | |
| Other operating expenses | | | 14,428 | | | | — | | | | (565 | ) | | | 13,863 | |
| Share of operating profit of associated companies | | | 3,484 | | | | (19 | ) | | | (19 | ) | | | 3,446 | |
| |
Operating profit | | | 21,808 | | | | (308 | ) | | | (177 | ) | | | 21,323 | |
| Net interest (income)/expense and currency exchange (gains)/losses | | | (370 | ) | | | — | | | | (42 | ) | | | (412 | ) |
| |
Income before taxation | | | 22,178 | | | | (308 | ) | | | (135 | ) | | | 21,735 | |
| Taxation | | | 9,572 | | | | (126 | ) | | | (97 | ) | | | 9,349 | |
| Minority interests | | | 365 | | | | 1 | | | | (13 | ) | | | 353 | |
| |
Income from continuing operations | | | 12,241 | | | | (183 | ) | | | (25 | ) | | | 12,033 | |
| Income from discontinued operations, net of tax | | | — | | | | — | | | | 25 | | | | 25 | |
| Cumulative effect of a change in accounting principle, net of tax | | | 255 | | | | — | | | | — | | | | 255 | |
| |
Net income | | | 12,496 | | | | (183 | ) | | | — | | | | 12,313 | |
| |
| | | | | | | | | | | | | | | | | |
| | | | | | | | | | | | | | | $ million | |
| 2002 | |
| | | | | | | | | | | Reclassification | | | | |
| | | As | | | Second | | | for | | | | |
| | | previously | | | Reserves | | | discontinued | | | As | |
| | | restateda | | | Restatement | | | operationsb | | | restated | |
| |
| Net proceeds | | | 166,601 | | | | — | | | | (3,148 | ) | | | 163,453 | |
| Cost of sales | | | 137,997 | | | | 118 | | | | (2,457 | ) | | | 135,658 | |
| Exploration | | | 1,073 | | | | — | | | | (21 | ) | | | 1,052 | |
| Other operating expenses | | | 12,027 | | | | — | | | | (351 | ) | | | 11,676 | |
| Share of operating profit of associated companies | | | 2,822 | | | | (6 | ) | | | (24 | ) | | | 2,792 | |
| |
Operating profit | | | 18,326 | | | | (124 | ) | | | (343 | ) | | | 17,859 | |
| Net interest (income)/expense and currency exchange (gains)/losses | | | 629 | | | | — | | | | (61 | ) | | | 568 | |
| |
Income before taxation | | | 17,697 | | | | (124 | ) | | | (282 | ) | | | 17,291 | |
| Taxation | | | 7,796 | | | | (54 | ) | | | (95 | ) | | | 7,647 | |
| Minority interests | | | 179 | | | | (4 | ) | | | — | | | | 175 | |
| |
Income from continuing operations | | | 9,722 | | | | (66 | ) | | | (187 | ) | | | 9,469 | |
| Income from discontinued operations, net of tax | | | — | | | | — | | | | 187 | | | | 187 | |
| Cumulative effect of a change in accounting principle, net of tax | | | — | | | | — | | | | — | | | | — | |
| |
Net income | | | 9,722 | | | | (66 | ) | | | — | | | | 9,656 | |
| |
| a | | As reported in the 2003 Annual Report and Accounts and the 2003 Annual Report on Form 20-F, as filed with the SEC on June 30, 2004. |
| |
| b | | As a consequence of the separate reporting of income from discontinued operations, information for comparative periods has been reclassified where necessary. |
Statement of Assets and Liabilities
| | | | | | | | | | | | | | | | | |
| $ million | |
| December 31, 2003 | |
| | | | | | | | | | | Reclassification | | | | |
| | | As | | | Second | | | for | | | | |
| | | originally | | | Reserves | | | deferred | | | As | |
| | | reporteda | | | Restatement | | | taxb | | | restated | |
| |
| Fixed assets | | | | | | | | | | | | | | | | |
| Tangible | | | 87,701 | | | | (613 | ) | | | — | | | | 87,088 | |
| Intangible | | | 4,735 | | | | — | | | | — | | | | 4,735 | |
| Investments | | | 22,787 | | | | (13 | ) | | | — | | | | 22,774 | |
| Other long-term assets | | | 9,257 | | | | — | | | | 2,092 | | | | 11,349 | |
| Current assets | | | 43,611 | | | | — | | | | — | | | | 43,611 | |
| Current liabilities | | | 54,424 | | | | — | | | | — | | | | 54,424 | |
| Long-term liabilities | | | 15,154 | | | | — | | | | — | | | | 15,154 | |
| Provisions | | | | | | | | | | | | | | | | |
| Deferred taxation | | | 13,355 | | | | (262 | ) | | | 2,092 | | | | 15,185 | |
| Pensions and decommissioning | | | 8,882 | | | | — | | | | — | | | | 8,882 | |
| Minority interests | | | 3,428 | | | | (13 | ) | | | — | | | | 3,415 | |
| |
Net assets | | | 72,848 | | | | (351 | ) | | | — | | | | 72,497 | |
| |
| a | | As reported in the 2003 Annual Report and Accounts and the 2003 Annual Report on Form 20-F, as filed with the SEC on June 30, 2004. |
| |
| b | | Deferred tax assets and liabilities are presented at December 31, 2004 separately in the Statement of Assets and Liabilities, with reclassification of the prior year. |
Parent Companies’ interest in Group net assets
| | | | | | | | | |
| | | | | | | $ million | |
| | | 2003 | | | 2002 | |
| |
At December 31 as originally reported (2003)/previously restated (2002)a | | | 72,848 | | | | 60,444 | |
| Effect of the Second Reserves Restatement: | | | | | | | | |
| Interest at the beginning of the year | | | (168 | ) | | | (102 | )b |
| Net income for the year | | | (183 | ) | | | (66 | ) |
| |
At December 31 as restated | | | 72,497 | | | | 60,276 | |
| |
| a | | As reported in the 2003 Annual Report and Accounts and the 2003 Annual Report on Form 20-F, as filed with the SEC on June 30, 2004. |
| |
| b | | Cumulative effect as at January 1, 2002. |
Earnings by industry segment
| | | | | | | | | | | | | |
| $ million | |
| | | | | | | 2003 | | | 2002 | |
| | | 2004 | | | As restated | | | As restated | |
| |
| Exploration & Production | | | 9,315 | | | | 8,923 | | | | 6,726 | |
| Gas & Power | | | 2,155 | | | | 2,289 | | | | 774 | |
| Oil Products | | | 7,537 | | | | 2,860 | | | | 2,627 | |
| Chemicals | | | 930 | | | | (209 | ) | | | 565 | |
| Corporate and Other | | | (1,040 | ) | | | (1,184 | ) | | | (861 | ) |
| Minority interests | | | (714 | ) | | | (366 | ) | | | (175 | ) |
| |
Net income | | | 18,183 | | | | 12,313 | | | | 9,656 | |
| |
Netherlands GAAP Summary Financial Statements 25
Netherlands GAAP
Summary Financial Statements
| | | | | | | | | | | | | |
| | | $ million | |
| | | | | | | 2003 | | | 2002 | |
| Summarised Statement of Income | | 2004 | | | As restateda | | | As restateda | |
| |
| Sales proceeds | | | 337,522 | | | | 263,889 | | | | 218,287 | |
| Sales taxes, excise duties and similar levies | | | 72,332 | | | | 65,527 | | | | 54,834 | |
| |
Net proceeds | | | 265,190 | | | | 198,362 | | | | 163,453 | |
| Cost of sales | | | 222,334 | | | | 165,314 | | | | 135,778 | |
| |
Gross profit | | | 42,856 | | | | 33,048 | | | | 27,675 | |
| Selling and distribution expenses | | | 12,340 | | | | 11,409 | | | | 9,617 | |
| Administrative expenses | | | 2,516 | | | | 1,870 | | | | 1,587 | |
| Exploration | | | 1,823 | | | | 1,475 | | | | 1,052 | |
| Research and development | | | 553 | | | | 584 | | | | 472 | |
| |
| Operating profit of Group companies | | | 25,624 | | | | 17,710 | | | | 14,947 | |
| Share of operating profit of associated companies | | | 6,050 | | | | 3,446 | | | | 2,792 | |
| |
Operating profit | | | 31,674 | | | | 21,156 | | | | 17,739 | |
| Interest and other income | | | 1,705 | | | | 1,967 | | | | 748 | |
| Interest expense | | | 1,214 | | | | 1,324 | | | | 1,291 | |
| Currency exchange gains/(losses) | | | (39 | ) | | | (231 | ) | | | (25 | ) |
| |
Income before taxation | | | 32,126 | | | | 21,568 | | | | 17,171 | |
| Taxation | | | 15,030 | | | | 9,349 | | | | 7,647 | |
| |
| Income after taxation | | | 17,096 | | | | 12,219 | | | | 9,524 | |
| Income applicable to minority interests | | | 626 | | | | 353 | | | | 175 | |
| |
Income from continuing operations | | | 16,470 | | | | 11,866 | | | | 9,349 | |
| Income from discontinuing operations, net of tax | | | 1,560 | | | | 25 | | | | 187 | |
| |
Net income | | | 18,030 | | | | 11,891 | | | | 9,536 | |
| |
| | | | | | | | | |
| $ million | |
| | | | | | | Dec 31, | |
| | | Dec 31, | | | 2003 | |
| Summarised Statement of Assets and Liabilities | | 2004 | | | As restateda | |
| |
Fixed assets | | | 115,775 | | | | 114,310 | |
| Other long-term assets | | | 14,642 | | | | 11,349 | |
Current assets | | | | | | | | |
| Inventories | | | 15,391 | | | | 12,690 | |
| Accounts receivable | | | 37,998 | | | | 28,969 | |
| Cash and cash equivalents | | | 8,459 | | | | 1,952 | |
| |
Total current assets | | | 61,848 | | | | 43,611 | |
| |
Current liabilities:amounts due within one year | | | | | | | | |
| Short-term debt | | | 5,822 | | | | 11,027 | |
| Accounts payable and accrued liabilities | | | 40,207 | | | | 32,347 | |
| Taxes payable | | | 9,885 | | | | 5,927 | |
| Dividends payable to Parent Companies | | | 4,750 | | | | 5,123 | |
| |
Total current liabilities | | | 60,664 | | | | 54,424 | |
| |
| Long-term liabilities (including long-term debt) | | | 16,665 | | | | 15,154 | |
| Provisions | | | 25,491 | | | | 24,067 | |
| Minority interests | | | 5,309 | | | | 3,415 | |
| |
Net assets | | | 84,136 | | | | 72,210 | |
| |
3 Restatement of previously issued financial statements
Errors in the depreciation, depletion and amortisation charge presented in previous Financial Statements, arising as a result of overstatement of proved reserves as corrected by the Second Reserves Restatement, have been adjusted in the Netherlands GAAP financial statements through a restatement of the comparative results for the years ended December 31, 2003 and 2002.
Quantitative information concerning the effect of these adjustments is set forth in the tables below and additional information on the Reserves Restatement is contained in Note 2.
Statement of Income
| | | | | | | | | | | | | | | | | |
| $ million | |
| 2003 | |
| | | | | | | | | | | Reclassification | | | | |
| | | As | | | Second | | | for | | | | |
| | | originally | | | Reserves | | | discontinued | | | As | |
| | | reporteda | | | Restatement | | | operationsb | | | restated | |
| |
| Net proceeds | | | 201,728 | | | | — | | | | (3,366 | ) | | | 198,362 | |
| Cost of sales | | | 167,667 | | | | 289 | | | | (2,642 | ) | | | 165,314 | |
| Exploration | | | 1,476 | | | | — | | | | (1 | ) | | | 1,475 | |
| Other operating expenses | | | 14,428 | | | | — | | | | (565 | ) | | | 13,863 | |
| Share of operating profit of associated companies | | | 3,484 | | | | (19 | ) | | | (19 | ) | | | 3,446 | |
| |
Operating profit | | | 21,641 | | | | (308 | ) | | | (177 | ) | | | 21,156 | |
| Net interest (income)/expense and currency exchange (gains) and losses | | | (370 | ) | | | — | | | | (42 | ) | | | (412 | ) |
| |
Income before taxation | | | 22,011 | | | | (308 | ) | | | (135 | ) | | | 21,568 | |
| Taxation | | | 9,572 | | | | (126 | ) | | | (97 | ) | | | 9,349 | |
| Minority interests | | | 365 | | | | 1 | | | | (13 | ) | | | 353 | |
| |
Income from continuing operations | | | 12,074 | | | | (183 | ) | | | (25 | ) | | | 11,866 | |
| Income from discontinued operations, net of tax | | | — | | | | — | | | | 25 | | | | 25 | |
| |
Net income | | | 12,074 | | | | (183 | ) | | | — | | | | 11,891 | |
| |
| a | | As reported in the 2003 Annual Report and Accounts and the 2003 Annual Report on Form 20-F, as filed with the SEC on June 30, 2004. |
| |
| b | | As a consequence of the separate reporting of income from discontinued operations, information for comparative periods has been reclassified where necessary. |
26 Royal Dutch/Shell Group of Companies
3 Restatement of previously issued financial statementscontinued
| | | | | | | | | | | | | | | | | |
| $ million | |
| 2002 | |
| | | | | | | | | | | Reclassification | | | | |
| | | As | | | Second | | | for | | | | |
| | | previously | | | Reserves | | | discontinued | | | As | |
| | | restateda | | | Restatement | | | operationsb | | | restated | |
| |
| Net proceeds | | | 166,601 | | | | — | | | | (3,148 | ) | | | 163,453 | |
| Cost of sales | | | 138,117 | | | | 118 | | | | (2,457 | ) | | | 135,778 | |
| Exploration | | | 1,073 | | | | — | | | | (21 | ) | | | 1,052 | |
| Other operating expenses | | | 12,027 | | | | — | | | | (351 | ) | | | 11,676 | |
| Share of operating profit of associated companies | | | 2,822 | | | | (6 | ) | | | (24 | ) | | | 2,792 | |
| |
Operating profit | | | 18,206 | | | | (124 | ) | | | (343 | ) | | | 17,739 | |
| Net interest (income)/expense and currency exchange (gains) and losses | | | 629 | | | | — | | | | (61 | ) | | | 568 | |
| |
Income before taxation | | | 17,577 | | | | (124 | ) | | | (282 | ) | | | 17,171 | |
| Taxation | | | 7,796 | | | | (54 | ) | | | (95 | ) | | | 7,647 | |
| Minority interests | | | 179 | | | | (4 | ) | | | — | | | | 175 | |
| |
Income from continuing operations | | | 9,602 | | | | (66 | ) | | | (187 | ) | | | 9,349 | |
| Income from discontinued operations, net of tax | | | — | | | | — | | | | 187 | | | | 187 | |
| |
Net income | | | 9,602 | | | | (66 | ) | | | — | | | | 9,536 | |
| |
| a | | As reported in the 2003 Annual Report and Accounts and the 2003 Annual Report on Form 20-F, as filed with the SEC on June 30, 2004. |
| |
| b | | As a consequence of the separate reporting of income from discontinued operations, information for comparative periods has been reclassified where necessary. |
Statement of Assets and Liabilities
| | | | | | | | | | | | | | | | | |
| $ million | |
| December 31, 2003 | |
| | | | | | | | | | | Reclassification | | | | |
| | | As | | | Second | | | for | | | | |
| | | originally | | | Reserves | | | deferred | | | As | |
| | | reporteda | | | Restatement | | | taxb | | | restated | |
| |
| Fixed assets | | | | | | | | | | | | | | | | |
| Tangible | | | 87,701 | | | | (613 | ) | | | — | | | | 87,088 | |
| Intangible | | | 4,448 | | | | — | | | | — | | | | 4,448 | |
| Investments | | | 22,787 | | | | (13 | ) | | | — | | | | 22,774 | |
| Other long-term assets | | | 9,257 | | | | — | | | | 2,092 | | | | 11,349 | |
| Current assets | | | 43,611 | | | | — | | | | — | | | | 43,611 | |
| Current liabilities | | | 54,424 | | | | — | | | | — | | | | 54,424 | |
| Long-term liabilities | | | 15,154 | | | | — | | | | — | | | | 15,154 | |
| Provisions | | | | | | | | | | | | | | | | |
| Deferred taxation | | | 13,355 | | | | (262 | ) | | | 2,092 | | | | 15,185 | |
| Pensions and decommissioning | | | 8,882 | | | | — | | | | — | | | | 8,882 | |
| Minority interests | | | 3,428 | | | | (13 | ) | | | — | | | | 3,415 | |
| |
Net assets | | | 72,561 | | | | (351 | ) | | | — | | | | 72,210 | |
| |
| a | | As reported in the 2003 Annual Report and Accounts and the 2003 Annual Report on Form 20-F, as filed with the SEC on June 30, 2004. |
| |
| b | | Deferred tax assets and liabilities are presented at December 31, 2004 separately in the Statement of Assets and Liabilities, with reclassification of the prior year. |
Parent Companies’ interest in Group net assets
| | | | | | | | | |
| | | | | | | $ million | |
| | | 2003 | | | 2002 | |
| |
At December 31 as originally reported (2003)/previously restated (2002)a | | | 72,561 | | | | 60,324 | |
| Effect of the Second Reserves Restatement: | | | | | | | | |
| Interest at the beginning of the year | | | (168 | ) | | | (102 | )b |
| Net income for the year | | | (183 | ) | | | (66 | ) |
| |
At December 31 as restated | | | 72,210 | | | | 60,156 | |
| |
| a | | As reported in the 2003 Annual Report and Accounts and the 2003 Annual Report on Form 20-F, as filed with the SEC on June 30, 2004. |
| |
| b | | Cumulative effect as at January 1, 2002. |
4 Reconciliation between US GAAP and Netherlands GAAP
Differences in the accounting policies applied under Netherlands GAAP from those under US GAAP relate to treatment of goodwill; recoverability of assets, long-term commitments; and asset retirement obligations.
The following tables provide a reconciliation between US GAAP and Netherlands GAAP for Group net income and net assets:
Group net income
| | | | | | | | | | | | | |
| | | | | | | | | | | $ million | |
| | | | | | | 2003 | | | 2002 | |
| | | 2004 | | | As restated | | | As restated | |
| |
| In accordance with US GAAP | | | 18,183 | | | | 12,313 | | | | 9,656 | |
Adjustment for Netherlands GAAP: | | | | | | | | | | | | |
| Goodwill amortisation | | | (167 | ) | | | (167 | ) | | | (120 | ) |
| Cumulative effect of change in accounting for asset retirement obligations | | | — | | | | (255 | ) | | | — | |
| Recoverability of assets: | | | | | | | | | | | | |
| Impairments | | | (455 | ) | | | — | | | | — | |
| Reversals of impairments | | | 469 | | | | — | | | | — | |
| |
| In accordance with Netherlands GAAP | | | 18,030 | | | | 11,891 | | | | 9,536 | |
| |
| Royal Dutch (60%) | | | 10,818 | | | | 7,134 | | | | 5,722 | |
| Shell Transport (40%) | | | 7,212 | | | | 4,757 | | | | 3,814 | |
| |
Group net assets
| | | | | | | | | |
| | | | | | | $ million | |
| | | | | | | Dec 31, | |
| | | Dec 31, | | | 2003 | |
| | | 2004 | | | As restated | |
| |
| In accordance with US GAAP | | | 84,576 | | | | 72,497 | |
Adjustment for Netherlands GAAP: | | | | | | | | |
| Goodwill amortisation | | | (454 | ) | | | (287 | ) |
| Recoverability of assets: | | | | | | | | |
| Impairments | | | (455 | ) | | | — | |
| Reversals of impairments | | | 469 | | | | — | |
| |
| In accordance with Netherlands GAAP | | | 84,136 | | | | 72,210 | |
| |
| Royal Dutch (60%) | | | 50,482 | | | | 43,326 | |
| Shell Transport (40%) | | | 33,654 | | | | 28,884 | |
| |
Supplementary information 27
Supplementary information
| | | | | | | | | | | | | |
| | | | | | | | | | | $ million | |
| Capital investment | | 2004 | | | 2003 | | | 2002 | |
| |
Capital expenditure | | | | | | | | | | | | |
| Exploration & Production | | | 8,387 | | | | 8,129 | | | | 13,064 | |
| Gas & Power | | | 1,357 | | | | 1,021 | | | | 471 | |
| Oil Products | | | 2,404 | | | | 2,367 | | | | 7,653 | |
| Chemicals | | | 366 | | | | 470 | | | | 680 | |
| Corporate and Other | | | 220 | | | | 265 | | | | 494 | |
| |
| | | | 12,734 | | | | 12,252 | | | | 22,362 | |
Exploration expense | | | 1,123 | | | | 1,059 | | | | 997 | |
New equity investments in associated companies | | | 681 | | | | 758 | | | | 684 | |
New loans to associated companies | | | 377 | | | | 225 | | | | 605 | |
Other investments | | | — | | | | — | | | | — | |
| |
| | | | 14,915 | | | | 14,294 | | | | 24,648 | |
| |
First Reserves Restatement
On January 9, 2004, the Group announced the removal from proved reserves of approximately 3.9 billion barrels of oil equivalent (boe) of oil and natural gas that were originally reported as of December 31, 2002. As a result of further field level reviews concluded in April 2004 with the assistance of external petroleum consultants of over 90% of the Group’s proved reserves volumes (collectively, the First Half Review), the Group determined to increase the total volume of reserves to be removed from the proved category to 4.47 billion boe and to restate the unaudited oil and natural gas reserves disclosures contained in the supplementary information accompanying the Financial Statements (the First Reserves Restatement) to give effect to the removal of these volumes as of the earliest date on which they did not represent “proved reserves” within the applicable rules of the Securities and Exchange Commission (SEC) (which in many cases is the date on which the volumes were initially booked as proved reserves). 12% of the volumes de-booked as of December 31, 2002 as part of the First Reserves Restatement had been in the proved developed reserves category and 88% had been categorised as proved undeveloped reserves. The effects of First Reserves Restatement were reflected in the 2003 Annual Report and Accounts and the 2003 Annual Report on Form 20-F as originally filed with the SEC on June 30, 2004.
Following the January 9, 2004 announcement of the initial reserves recategorisation, the Group Audit Committee (GAC) appointed Davis Polk & Wardwell to lead an independent review of the facts and circumstances surrounding the recategorisation, and to report its findings and any proposed remedial actions to the GAC for its consideration.
Second Reserves Restatement
On February 3, 2005, as a result of reservoir level reviews conducted during July 2004 through December 2004 of substantially all of the Group’s proved reserves volumes reported as at December 31, 2003 (collectively, the Second Half Review), the Group announced that it would remove from proved reserves an additional 1,371 million boe of oil and natural gas that were reported as at December 31, 2003 and further restate the unaudited oil and natural gas reserves disclosures contained in the supplementary information accompanying the Financial Statements (the Second Reserves Restatement and, together with the First Reserves Restatement, the Reserves Restatements) to give effect to the removal of these volumes as of the earliest date on which they did not represent “proved reserves” within the applicable rules of the SEC (which in many cases is the date on which the volumes were initially booked as proved reserves). 43% of the volumes de-booked as of December 31, 2003 as part of the Second Reserves Restatement had been categorised as proved developed reserves and 57% had been categorised as proved undeveloped reserves. The effects of the Second Reserves Restatement are reflected in the comparative periods presented in these Financial Statements. These effects were also reflected in Amendment No. 2 to the 2003 Annual Report on Form 20-F, as filed with the SEC on March 7, 2005.
The Annual Reports on Form 20-F are available on the Shell website (www.shell.com/annualreport).
28 Royal Dutch/Shell Group of Companies
Oil and Natural gas reserves
Estimated net proved developed and undeveloped oil and natural gas reserves, including the Group share of associated companies, are set out below.
| | | | | | | | | | | | | | | | | | | | | |
| | | | | | | | | | | | | | | | | | | million barrels | |
| | | 2004 | | | 2003 | | | 2002 | |
| | | | | | | As | | | | | | | As | | | | |
| | | | | | | originally | | | As | | | previously | | | As | |
| Crude oil and natural gas liquids | | | | | | reported | | | restated | | | restated | | | restated | |
| |
| Group Companies | | | | | | | | | | | | | | | | | | | | |
| Europe | | | 969 | | | | 1,367 | | | | 1,199 | | | | 1,488 | | | | 1,377 | |
| Other Eastern Hemisphere | | | 2,188 | | | | 3,367 | | | | 2,884 | | | | 3,650 | | | | 3,218 | |
| USA | | | 458 | | | | 550 | | | | 547 | | | | 720 | | | | 717 | |
| Other Western Hemisphere | | | 146 | | | | 439 | | | | 379 | | | | 547 | | | | 470 | |
| Group share of associated companies | | | 1,127 | | | | 882 | | | | 805 | | | | 933 | | | | 858 | |
| |
| Total at December 31 | | | 4,888 | | | | 6,605 | | | | 5,814 | | | | 7,338 | | | | 6,640 | |
| |
| | | | | | | | | | | | | | | | | | | | | |
| | | | | | | thousand million standard cubic feeta | |
| | | 2004 | | | 2003 | | | 2002 | |
| | | | | | | As | | | | | | | As | | | | |
| | | | | | | originally | | | As | | | previously | | | As | |
| Natural gas | | | | | | reported | | | restated | | | restated | | | restated | |
| |
| Group Companies | | | | | | | | | | | | | | | | | | | | |
| Europe | | | 18,439 | | | | 21,118 | | | | 19,876 | | | | 22,046 | | | | 21,284 | |
| Other Eastern Hemisphere | | | 14,718 | | | | 15,575 | | | | 13,723 | | | | 11,956 | | | | 10,672 | |
| USA | | | 2,823 | | | | 3,175 | | | | 3,143 | | | | 3,874 | | | | 3,842 | |
| Other Western Hemisphere | | | 1,545 | | | | 1,733 | | | | 1,628 | | | | 2,414 | | | | 1,959 | |
| Group share of associated companies | | | 3,041 | | | | 3,319 | | | | 3,188 | | | | 3,412 | | | | 3,308 | |
| |
| Total at December 31 | | | 40,566 | | | | 44,920 | | | | 41,558 | | | | 43,702 | | | | 41,065 | |
| |
| a | | These quantities have not been adjusted to standard heat content. |
Operational data
| | | | | | | | | | | | | |
| | | thousand barrels daily | |
| Crude oil and natural gas liquids production | | | | | | 2003 | | | 2002 | |
| (including Group share of associated companies, excluding oil sands) | | 2004 | | | As restated | | | As restated | |
| |
| Europe | | | 580 | | | | 671 | | | | 696 | |
| Other Eastern Hemisphere | | | 1,113 | | | | 1,147 | | | | 1,130 | |
| USA | | | 375 | | | | 414 | | | | 442 | |
| Other Western Hemisphere | | | 105 | | | | 101 | | | | 91 | |
| |
| | | | 2,173 | | | | 2,333 | | | | 2,359 | |
| |
| | | | | | | | | | | | | |
| | | | | | | million standard cubic feet daily | |
| Natural gas production available for sale | | | | | | 2003 | | | 2002 | |
| (including Group share of associated companies) | | 2004 | | | As restated | | | As restated | |
| |
| Europe | | | 3,739 | | | | 3,587 | | | | 3,667 | |
| Other Eastern Hemisphere | | | 3,198 | | | | 3,195 | | | | 3,403 | |
| USA | | | 1,332 | | | | 1,527 | | | | 1,679 | |
| Other Western Hemisphere | | | 539 | | | | 540 | | | | 537 | |
| |
| | | | 8,808 | | | | 8,849 | | | | 9,286 | |
| |
| | | | | | | | | | | | | |
| | | million tonnes | |
| Liquefied natural gas (LNG) | | 2004 | | | 2003 | | | 2002 | |
| |
| Global equity LNG sales volume | | | 10.2 | | | | 9.3 | | | | 9.1 | |
| |
| | | | | | | | | | | | | |
| | | thousand barrels daily | |
| Refinery processing intake | | 2004 | | | 2003 | | | 2002 | |
| |
| Europe | | | 1,770 | | | | 1,776 | | | | 1,761 | |
| Other Eastern Hemisphere | | | 962 | | | | 956 | | | | 941 | |
| USA | | | 1,055 | | | | 1,079 | | | | 1,064 | |
| Other Western Hemisphere | | | 375 | | | | 356 | | | | 318 | |
| |
| | | | 4,162 | | | | 4,167 | | | | 4,084 | |
| |
| | | | | | | | | | | | | |
| | | thousand barrels daily | |
| Oil sales | | 2004 | | | 2003 | | | 2002 | |
| |
| Gasolines | | | 2,760 | | | | 2,763 | | | | 2,786 | |
| Kerosines | | | 833 | | | | 798 | | | | 782 | |
| Gas/diesel oils | | | 2,398 | | | | 2,311 | | | | 2,295 | |
| Fuel oil | | | 849 | | | | 820 | | | | 758 | |
| Other products | | | 760 | | | | 753 | | | | 778 | |
| |
| Total oil products | | | 7,600 | | | | 7,445 | | | | 7,399 | |
| Crude oil | | | 5,160 | | | | 4,769 | | | | 5,025 | |
| |
| | | | 12,760 | | | | 12,214 | | | | 12,424 | |
| |
| | | | | | | | | | | | | |
| | | $ million | |
| Chemicals sales: net proceeds | | 2004 | | | 2003 | | | 2002 | |
| |
| Europe | | | 7,873 | | | | 5,617 | | | | 3,994 | |
| Other Eastern Hemisphere | | | 4,530 | | | | 3,092 | | | | 2,324 | |
| USA | | | 6,159 | | | | 4,369 | | | | 3,548 | |
| Other Western Hemisphere | | | 616 | | | | 486 | | | | 379 | |
| |
| Total chemical products net proceeds | | | 19,178 | | | | 13,564 | | | | 10,245 | |
| |
| Non-chemical products | | | 2,311 | | | | 1,622 | | | | 1,245 | |
| |
| | | | 21,489 | | | | 15,186 | | | | 11,490 | |
| |
Summary Report of the Supervisory Board and the Board of Management29
Summary Report of the Supervisory Board and the Board of Management
Activities of the Company
Royal Dutch Petroleum Company (Royal Dutch) is a holding company which, in conjunction with The “Shell” Transport and Trading Company, p.l.c. (Shell Transport), a UK company, owns, directly or indirectly, investments in the numerous companies of the Royal Dutch/Shell Group. Royal Dutch has an interest of 60% in the Group and Shell Transport an interest of 40%.
The assets and income of Royal Dutch consist mainly of its interest in the net assets and its share in the net income of the Royal Dutch/Shell Group of Companies. For the reporting with regard to the Group, reference may be made to the Message to shareholders (pages 2 and 3) and the Summary Operational and Financial Review (pages 10 to 21).
The Supervisory Board and the Board of Management
Royal Dutch is managed by a Board of Management, consisting of at least two Managing Directors. The Supervisory Board is responsible for supervising the policies of the Board of Management and the general course of business of the Company and the Group and further advises the Board of Management.
During the year under review, the Supervisory Board met 13 times to discuss issues relating to the Company. In addition, the members of the Supervisory Board met 17 times in the Conference with the Managing Directors of the Company and the Directors of Shell Transport. The purpose of the Conference is to receive information from the Executive Directors and other senior executives about major developments within the Royal Dutch/Shell Group of Companies and to exchange views on such matters. Topics of discussion at the Conference included,inter alia, the strategic direction of the businesses of Group companies, as well as governance, business risks and internal control of Group companies.
The Supervisory Board of Royal Dutch and the Board of Directors of Shell Transport are assisted in their governance by three joint committees, to which each of them has appointed three members from amongst its midst. These are the Group Audit Committee, the Remuneration and Succession Review Committee and the Social Responsibility Committee.
For a full report of the Company’s corporate governance, reference is made to pages 115 to 120 of the full Annual Report and Accounts.
Share buyback
The General Meeting of Shareholders of 2004 adopted a proposal to reduce the Company’s issued share capital by€994,000, by cancellation of 1,775,000 ordinary shares which the Company had acquired under the share buyback programme between the General Meetings held in 2003 and 2004. This cancellation effectively took place on November 10, 2004. The General Meeting of Shareholders further renewed the authorisation of the Board of Management for the acquisition by the Company of shares in its capital up to a maximum of 10% of the issued capital.
Since the beginning of the programme until April 22, 2005, a total number of 74,776,352 ordinary shares were acquired by the Company, of which so far 62,571,352 shares have been cancelled.
Annual Accounts
Translated into euros, Royal Dutch’s share in the net income of the Royal Dutch/Shell Group of Companies for 2004 amounts to€8,712 million (2003:€6,411 million as restated). The dividend distributed and yet to be distributed to Royal Dutch for 2004 was€3,842 million. When administrative expenses have been deducted and interest income has been added, profit after taxation for the year 2004 amounts to€8,713 million (2003:€6,418 million as restated).
Royal Dutch’s 60% interest in the Group net assets, expressed in dollars, has been translated into euros at the year-end rate. The amount thus obtained should be regarded as a reflection of the dollar value of Royal Dutch’s interest in the Group assets and liabilities.
The full Annual Accounts, as drawn up by the Board of Management and approved by the Supervisory Board, will be submitted to the General Meeting of Shareholders to be held on June 28, 2005 together with the proposal of the Supervisory Board that these Annual Accounts be finalised by the General Meeting and it be resolved that the interim dividend of€0.75 made payable in September 2004 and the second interim dividend of€1.04 made payable in March 2005 will together constitute the total dividend for 2004 on each of the ordinary shares outstanding and that the remaining amount of undistributed profit be carried forward to reserves. The Supervisory Board will further propose to the General Meeting that the Managing Directors be discharged of responsibility in respect of their management and the members of the Supervisory Board for their supervision for the year 2004.
30Royal Dutch Petroleum Company
Report of the Independent Auditors
The Report of the Independent Auditors on the Summary Annual Accounts contained in this Report is set out on page 35. The Report of the Independent Auditors on the full Annual Accounts of the Company for the year 2004 was unqualified.
Proposal to unify Royal Dutch and Shell Transport
As announced on October 28, 2004, the Supervisory Board and Board of Management of Royal Dutch and the Board of Directors of Shell Transport, unanimously agreed, in principle, to propose to shareholders the unification of the Royal Dutch/Shell Group of Companies under a single parent company, Royal Dutch Shell plc. The Boards believe that implementation of these proposals will strengthen the Group and deliver significant benefits through greater clarity of governance and streamlined decision-making with clear lines of authority and an empowered Chief Executive. The proposals will be put forward to the shareholders at the General Meeting on June 28, 2005. Further information, including the full offer documentation, is available on the Shell website (www.shell.com/unification).
New York Stock Exchange (NYSE) rules
The NYSE corporate governance rules allow foreign private issuers to follow home country practice, except that foreign private issuers are required to have an audit committee that satisfies the requirements of Rule 10A-3 of the US Securities Exchange Act of 1934. In addition, the NYSE requires a foreign private issuer to provide certain written affirmations and notices to the NYSE and a summary of the ways in which their corporate governance practices significantly differ from those followed by domestic USA companies under NYSE listing standards. The Company provides such a summary on the Shell website (www.shell.com/investor).
The Hague
April 27, 2005
Summary Remuneration Report31
Summary
Remuneration Report
This is a summary of the full Remuneration Report which can be found in the Annual Report and Accounts 2004 and on the Shell website (www.shell.com/annualreport).
Remuneration policy
The Group’s remuneration policy is intended to recognise and support the Group’s Statement of General Business Principles and strategic direction; as well as the need to attract and retain talented individuals and to motivate and reward Executive Directors for exceptional performance; and to align Executive Directors’ interests with those of shareholders.
More than half of an Executive Director’s target total remuneration is performance-linked and targeted to the long term. To ensure competitiveness, remuneration levels are set by reference to the practice of similar global companies. Performance mechanisms and reward structures are applied consistently to Executive Directors and senior managers.
Base pay
Base pay is set at a competitive level, appropriate to the scope and complexity of the roles of Chief Executive and Executive Director, and levels are benchmarked against relevant comparator groups.
Annual incentive
Executive Directors are eligible for an annual bonus. Performance during the year is measured against the Group Scorecard and annual bonus awards are made on this basis. There are four components to the 2005 Scorecard: total shareholder return, operational cash flow, operational excellence in each of the businesses and sustainable development. The target level for bonus payments for Executive Directors in 2005 will be 100% of base pay.
Long-term incentives
In 2004, the Remuneration and Succession Review Committee (REMCO) reviewed the Group’s long-term incentives for Executive Directors and senior management and the proposals for change are being presented to shareholders for approval at the 2005 General Meeting.
The key recommendations are: to discontinue stock option grants in favour of grants under the amended Long-Term Incentive Plan (LTIP); and to amend the Deferred Bonus Plan to introduce long-term performance conditions to the release of most of the matching shares. These amendments would not lead to an increase in the overall value of compensation for Executive Directors.
Pension policy
Retirement benefit arrangements for all staff are based on local market conditions and the overall value of the remuneration package necessary to attract and retain high-calibre individuals. The latest date on which Executive Directors may retire is June 30, following their 60th birthday. A change in retirement age to 65 from 2006 is being proposed.
Contracts policy
Contracts for Executive Directors are based on country-specific labour laws and market practice. They contain similar terms and conditions as for senior employees in the country concerned. Standard Executive Directors’ contracts do not contain any predetermined settlements for early termination.
Shareholdings
Following discussions with shareholders in 2004, a new shareholding policy has been introduced. Executive Directors are expected to build up shareholdings to the value of twice their base pay over five years. Until this target is met, they are required to retain 50% of the shares received through the vesting of future LTIP awards and vested matching shares under the Deferred Bonus Plan and maintain that level until retirement.
Actual remuneration in 2004
Base pay
Salary scales were not increased during 2004. Jeroen van der Veer’s base pay was increased from March 3, 2004 to reflect his appointment to the role of Chairman of the Committee of Managing Directors. It was increased on November 1, 2004 to reflect the increased responsibilities of Chief Executive of the Group.
Annual incentive
Executive Directors were eligible for a bonus related to the 2004 financial year reflecting performance against the Group Scorecard. Having regard to the Group’s performance against all targets, REMCO recommended and it was decided that the annual bonuses payable to Executive Directors in respect of the year 2004 are 90% of base pay.
Stock options
Stock options granted to Executive Directors in 2004 were 100% performance-linked. Stock options granted in March 2002 were 50% performance-linked and were due to vest in March 2005. Taking into account the financial performance conditions over those three years, the committee decided that none of the 2002 performance vesting stock options should vest.
Long-Term Incentive Plan
REMCO recommended that Executive Directors be made a conditional award of performance shares under the LTIP with a face value of twice the individual’s base pay. The actual number of shares received will be determined in 2007.
Pensions
For employees in the Netherlands their 2004 contributions to the plan offered by the Stichting Shell Pensionfonds was 8% of the amount of pensionable salary above the premium threshold. The company contribution rate was 20% during 2004. Company contributions were not required for the US Senior Staff Pension plan during 2004. The employing company’s contribution rate for the Shell Pension Plan was 5.1% in 2004. Executive Directors are not required to contribute to these plans.
Contracts
Jeroen van der Veer and Rob Routs have employment contracts with one of the Group Holding Companies that provide entitlement to the statutory notice period of one month for an employee and,
32Royal Dutch Petroleum Company
depending on the duration of the employment, a maximum of four months for the employer. Their contracts expire on the expected date of retirement or by notice by either party. Walter van de Vijver was employed by one of the Group Holding Companies on similar terms and conditions. Linda Cook’s contract is with Shell Expatriate Employment US Inc. on an “at-will” basis.
Walter van de Vijver resigned as a Managing Director of the Company on March 3, 2004. His employment terminated with effect from September 1, 2004. Under the terms of the agreement addressing termination of his employment contract he will be eligible to receive a total of€3.8 million.
Supervisory Board Members
Under the Articles of Association the remuneration of the members of the Supervisory Board is the responsibility of the General Meeting and is determined within the limits set by shareholders. Supervisory Board members receive fees of€55,000 per annum and the Chairman’s fee is an additional€15,000 per annum. Fees for each membership of the committees of the Supervisory Board are€7,000.
Emoluments of Managing Directors of Royal Dutch in office during 2004
| | | | | | | | | | | | | | | | | | | | | |
| | | | | | | | | | | | | | | | | | | € | |
| | | | | | | Annual | | | Payment following | | | Other | | | | |
| | | Salaries | | | bonusa | | | severance | | | benefitsb | | | Total | |
| |
| Jeroen van der Veer | | | | | | | | | | | | | | | | | | | | |
2004 | | | 1,281,774 | c | | | 1,350,000 | | | | — | | | | 18,043 | | | | 2,649,817 | |
| 2003 | | | 1,120,000 | | | | 0 | | | | — | | | | 11,502 | | | | 1,131,502 | |
| 2002 | | | 1,013,729 | | | | 1,230,500 | d | | | — | | | | 4,768 | | | | 2,248,997 | |
| |
| Malcolm Brinded | | | | | | | | | | | | | | | | | | | | |
2004e | | | 148,080 | | | | 160,593 | f | | | — | | | | 6,156 | | | | 314,829 | |
| 2003 | | | 800,000 | | | | 0 | | | | — | | | | 23,707 | | | | 823,707 | |
2002e | | | 372,500 | | | | 428,375 | d | | | — | | | | 2,210 | g | | | 803,085 | |
| |
| Linda Cook | | | | | | | | | | | | | | | | | | | | |
2004h | | | 338,892 | | | | 442,000 | | | | — | | | | 189,623 | | | | 970,515 | |
| |
| Rob Routs | | | | | | | | | | | | | | | | | | | | |
2004 | | | 884,516 | | | | 810,000 | | | | — | | | | 139,850 | | | | 1,834,366 | |
2003i | | | 405,000 | | | | 0 | | | | — | | | | 55,612 | | | | 460,612 | |
| |
| Walter van de Vijver | | | | | | | | | | | | | | | | | | | | |
2004j | | | 186,774 | | | | 0 | | | | 1,900,000 | | | | 7,074 | | | | 2,093,848 | |
| 2003 | | | 842,500 | | | | 0 | | | | — | | | | 26,060 | | | | 868,560 | |
| 2002 | | | 735,095 | | | | 902,750 | | | | — | | | | 18,091 | k | | | 1,655,936 | |
| |
| a | | The annual bonus is included in the related performance year and not in the following year in which it is paid. |
| |
| b | | Includes social security premiums paid by the employer, employer’s contribution to the health insurance plan, where applicable school fees and other benefits stated at a value employed by the Fiscal Authorities in the Netherlands. |
| |
| c | | Jeroen van der Veer’s salary increase with effect from November 1, 2004 did not come into payment until 2005 and will therefore be reported in the 2005 Annual Report and Accounts. |
| |
| d | | Of which one-third was deferred under the Deferred Bonus Plan. |
| |
| e | | Malcolm Brinded was appointed as a Managing Director of Royal Dutch with effect from July 1, 2002 until March 3, 2004, therefore, where appropriate, the 2002 and 2004 emoluments are prorated. |
| |
| f | | Malcolm Brinded’s 2004 annual bonus amounted to £634,500 for the full year. His annual bonus from March 4, 2004 to December 31, 2004 has been listed in the 2004 Shell Transport Annual Reports and Accounts. Sterling converted to euro at the quarterly average rate of exchange. |
| |
| g | | Exclusive of deferred payment in shares amounting to £386,000 granted in 1999. |
| |
| h | | Linda Cook was appointed as a Managing Director of Royal Dutch with effect from August 1, 2004, therefore, where appropriate, the 2004 emoluments are prorated. US dollar converted to euro at the monthly average rate of exchange. |
| |
| i | | Rob Routs was appointed as a Managing Director of Royal Dutch with effect from July 1, 2003, therefore, where appropriate, the 2003 emoluments are prorated. |
| |
| j | | Walter van de Vijver resigned as a Managing Director of Royal Dutch on March 3, 2004, therefore, where appropriate, the 2004 emoluments are prorated. |
| |
| k | | Exclusive of deferred payment in shares amounting to€688,839 granted in 1999. |
Emoluments of the Members of the Supervisory Board
| | | | | | | | | | | | | |
| | | | | | | | | | | € | |
| | | 2004 | | | 2003 | | | 2002 | |
| |
| Aad Jacobs | | | 77,000 | | | | 77,000 | | | | 58,750 | |
Maarten van den Bergha | | | 93,468 | | | | 89,711 | | | | 82,021 | |
| Wim Kok | | | 62,000 | | | | 31,000 | | | | — | |
| Aarnout Loudon | | | 69,000 | | | | 69,000 | | | | 60,000 | |
| Hubert Markl | | | 62,546 | | | | 55,000 | | | | 23,000 | |
Christine Morin-Postelb | | | 31,000 | | | | — | | | | — | |
| Lawrence Ricciardi | | | 90,500 | | | | 79,875 | | | | 46,000 | |
Henny de Ruitera,c | | | 48,484 | | | | 96,711 | | | | 85,521 | |
| |
| a | | Maarten van den Bergh and Henny de Ruiter received fees from the Group Holding Companies in respect of duties performed by them as Directors of these Companies. |
| |
| b | | Appointed as from July 1, 2004. |
| |
| c | | Retired on June 30, 2004. |
Share interests and stock options in the Company of members of the Supervisory Board and Managing Directors as at December 31, 2004:
| | | | | | | | | |
| | | Stock options | | | Ordinary shares | |
| |
Supervisory Board | | | | | | | | |
| Aad Jacobs | | | 0 | | | | 0 | |
Maarten van den Bergha | | | 37,950 | | | | 4,000 | |
| Wim Kok | | | 0 | | | | 0 | |
| Aarnout Loudon | | | 0 | | | | 75,000 | |
| Hubert Markl | | | 0 | | | | 0 | |
| Christine Morin-Postel | | | 0 | | | | 0 | |
| Lawrence Ricciardi | | | 0 | | | | 10,000 | |
| |
Managing Directors | | | | | | | | |
| Jeroen van der Veer | | | 519,600 | | | | 10,512 | |
Linda Cookb | | | 337,725 | | | | 217 | |
| Rob Routs | | | 302,466 | | | | 0 | |
| |
Excluding priority shares and shares under the Deferred Bonus Plan, which will be released in principle three years after deferral.
| a | | No options are granted to members of Supervisory Board, but options may be outstanding to members who have formerly been a Managing Director. |
| |
| b | | Excludes 36,087 Stock Appreciation Rights. |
Summary Annual Accounts33
Summary Annual Accounts
Profit and Loss Account
| | | | | | | | | | | | | |
| | | | | | | | | | | € million | |
| | | | | | | 2003 | | | 2002 | |
| | | 2004 | | | As restated | | | As restated | |
| |
| Share in the net income of companies of the Royal Dutch/Shell Group from continuing operations | | | 7,958 | | | | 6,398 | | | | 5,957 | |
| Share in the net income of companies of the Royal Dutch/Shell Group from discontinued operations | | | 754 | | | | 13 | | | | 119 | |
| |
| Share in the net income of companies of the Royal Dutch/Shell Group | | | 8,712 | | | | 6,411 | | | | 6,076 | |
lessAdministrative expenses | | | 8 | | | | 8 | | | | 5 | |
| |
| | | | 8,704 | | | | 6,403 | | | | 6,071 | |
| Interest income | | | 10 | | | | 18 | | | | 28 | |
| |
| Profit before taxation | | | 8,714 | | | | 6,421 | | | | 6,099 | |
lessTaxation | | | 1 | | | | 3 | | | | 8 | |
| |
Profit after taxation | | | 8,713 | | | | 6,418 | | | | 6,091 | |
| |
Statement of Appropriation of Profit
| | | | | | | | | | | | | |
| | | | | | | | | | | € million | |
| | | | | | | 2003 | | | 2002 | |
| | | 2004 | | | As restated | | | As restated | |
| |
| Profit after taxation | | | 8,713 | | | | 6,418 | | | | 6,091 | |
| Taken from/(to) Statutory investment reserve | | | (4,870 | ) | | | (3,543 | ) | | | (2,759 | ) |
| Undistributed profit at beginning of year | | | 2,909 | | | | 3,650 | | | | 4,712 | |
| Final dividend distributed | | | (2,125 | ) | | | (2,084 | ) | | | (2,042 | ) |
| (Repurchase)/cancellation of share capital | | | (375 | ) | | | 9 | | | | (847 | ) |
| Unclaimed dividends forfeited | | | 1 | | | | 1 | | | | 1 | |
| |
| Available for distribution | | | 4,253 | | | | 4,451 | | | | 5,156 | |
| |
lessInterim dividenda | | | 1,562 | | | | 1,542 | | | | 1,506 | |
| |
Undistributed profit at end of yearb | | | 2,691 | | | | 2,909 | | | | 3,650 | |
| |
| a | | Including 4% cumulative preference dividend for 2004 amounting to€26,880 on priority shares (2003:€26,880; 2002:€26,880). |
| |
| b | | Before second interim dividend of€2,165 million (second interim dividend 2003:€2,125 million; final dividend 2002:€2,084 million). |
Earnings per share
| | | | | | | | | | | | | | | | | |
| | | | | | | | | | | | | | | € | |
| | | | | | | | | | | 2003 | | | 2002 | |
| | | Note | | | 2004 | | | As restated | | | As restated | |
| |
| Basic earnings per ordinary share from continuing operations | | | | | | | 3.94 | | | | 3.14 | | | | 2.90 | |
| Basic earnings per ordinary share from discontinued operations | | | | | | | 0.37 | | | | 0.01 | | | | 0.06 | |
| |
Basic earnings per ordinary share | | | 6 | | | | 4.31 | | | | 3.15 | | | | 2.96 | |
| |
| Diluted earnings per ordinary share from continuing operations | | | | | | | 3.93 | | | | 3.14 | | | | 2.90 | |
| Diluted earnings per ordinary share from discontinued operations | | | | | | | 0.37 | | | | 0.01 | | | | 0.06 | |
| |
Diluted earnings per ordinary share | | | 6 | | | | 4.30 | | | | 3.15 | | | | 2.96 | |
| |
Balance Sheet(before appropriation of profit)
| | | | | | | | | | | | | |
| | | | | | | | | | | € million | |
| | | | | | | | | | | Dec 31, | |
| | | | | | | Dec 31, | | | 2003 | |
| | | Note | | | 2004 | | | As restated | |
| |
Fixed assets | | | | | | | | | | | | |
| Financial fixed assets | | | | | | | | | | | | |
| Investments in companies of the Royal Dutch/Shell Group | | | | | | | 37,018 | | | | 34,349 | |
| Investment in associated company | | | | | | | 179 | | | | — | |
Current assets | | | | | | | | | | | | |
| Receivables | | | | | | | | | | | | |
| Dividends receivable from companies of the Royal Dutch/Shell Group | | | | | | | 2,130 | | | | 2,449 | |
| Other receivables from companies of the Royal Dutch/Shell Group | | | | | | | 44 | | | | 363 | |
| Other receivables | | | | | | | 35 | | | | 36 | |
| Cash and cash equivalents | | | | | | | 252 | | | | 8 | |
| |
| | | | | | | | 2,461 | | | | 2,856 | |
| |
Current liabilities | | | | | | | | | | | | |
| Other liabilities | | | | | | | 13 | | | | 10 | |
| |
Current assets less current liabilities | | | | | | | 2,448 | | | | 2,846 | |
| |
Total assets less current liabilities | | | | | | | 39,645 | | | | 37,195 | |
| |
Shareholders’ equity | | | | | | | | | | | | |
| Paid-up capital | | | 5 | | | | | | | | | |
| Ordinary shares | | | | | | | 1,165 | | | | 1,166 | |
| Priority shares | | | | | | | 1 | | | | 1 | |
| |
| | | | | | | | 1,166 | | | | 1,167 | |
| |
| Share premium reserve | | | | | | | 1 | | | | 1 | |
| Investment reserves | | | | | | | | | | | | |
| Statutory | | | | | | | 25,185 | | | | 22,707 | |
| Currency translation differences | | | | | | | 1,848 | | | | 486 | |
| Other | | | | | | | 8,739 | | | | 9,910 | |
| |
| | | | | | | | 35,772 | | | | 33,103 | |
| |
| Other statutory reserves | | | | | | | 15 | | | | 15 | |
| Undistributed profit | | | | | | | 2,691 | | | | 2,909 | |
| |
| | | | | | | | 39,645 | | | | 37,195 | |
| |
Statement of Cash Flows
| | | | | | | | | | | | | |
| | | | | | | | | | | € million | |
| | | 2004 | | | 2003 | | | 2002 | |
| |
Returns on investments and servicing of finance | | | | | | | | | | | | |
| Dividends received from Group companies | | | 4,162 | | | | 3,401 | | | | 4,446 | |
| Interest received | | | 10 | | | | 18 | | | | 32 | |
| Other | | | 315 | | | | 212 | | | | (587 | ) |
| |
Net cash inflow/(outflow) from returns on investments and servicing of finance | | | 4,487 | | | | 3,631 | | | | 3,891 | |
| |
Taxation | | | | | | | | | | | | |
| Tax (paid)/recovered | | | (1 | ) | | | (4 | ) | | | (8 | ) |
Financing | | | | | | | | | | | | |
| Repurchase of share capital, including expenses | | | (376 | ) | | | — | | | | (889 | ) |
| Investment in associated company | | | (179 | ) | | | — | | | | — | |
| Dividends paid | | | (3,687 | ) | | | (3,626 | ) | | | (3,536 | ) |
| |
Increase/(decrease) in cash and cash equivalents | | | 244 | | | | 1 | | | | (542 | ) |
| |
| Cash at January 1 | | | 8 | | | | 7 | | | | 549 | |
| |
| Cash at December 31 | | | 252 | | | | 8 | | | | 7 | |
| |
34Royal Dutch Petroleum Company
Notes to the Summary Annual Accounts
1 The Company
Royal Dutch, one of the Parent Companies of the Royal Dutch/Shell Group, is a holding company which, in conjunction with Shell Transport, owns, directly or indirectly, investments in the numerous companies known collectively as the Royal Dutch/Shell Group of Companies.
Arrangements between Royal Dutch and Shell Transport provide,inter alia, that notwithstanding variations in shareholdings, Royal Dutch and Shell Transport shall share in the aggregate net assets and in the aggregate dividends and interest received from Group companies in the proportion of 60:40, respectively. It is further arranged that the burden of all taxes in the nature of, or corresponding to, an income tax leviable in respect of such dividends and interest shall fall in the same proportion.
2 Summary Annual Accounts
These Summary Annual Accounts are an abridged version of the full Annual Accounts, which have been prepared in accordance with legal requirements and generally accepted accounting principles in the Netherlands, and which are published in the full Annual Report and Accounts 2004 of Royal Dutch Petroleum Company. For a better understanding of the Company’s financial performance and position, and the effects of the Reserves Restatement as set out in Note 3, the reader should consult the full Annual Accounts.
3 Restatement of previously issued Financial Statements
Reserves related adjustments
The Group 2003 Financial Statements reflected the impact of removing 4.47 billion barrels of oil equivalent (boe) from the proved category per December 31, 2002, the restatement of the unaudited oil and gas reserves disclosures contained in the supplementary information accompanying the Financial Statements, and to show the resulting effect in depreciation, depletion and amortisation charges related to Exploration & Production. The completion of the Group’s reserves review was announced on February 3, 2005 and resulted in an additional 1.37 billion boe of oil and natural gas being removed from the proved category per December 31, 2003. The additional effect of understating the depreciation, depletion and amortisation charges related to Exploration & Production resulted in a reduction in the Group’s net income for 2003 of $183 million (2002: $66 million).
The effect on profit after taxation and the Shareholders’ equity of Royal Dutch, is as follows:
| | | | | | | | | | | | | |
| | | | | | | | | | | $ million | |
| | | Profit after taxation | | | Shareholders’ equity | |
| | | 2003 | | | 2002 | | | Dec 31, 2003 | |
| |
| As previously reported | | | 6,520 | | | | 6,108 | | | | 37,362 | |
| |
| Second Reserves Restatement | | | (100 | ) | | | (42 | ) | | | (166 | ) |
| Currency translation effect | | | (2 | ) | | | 25 | | | | (1 | ) |
| |
As restated | | | 6,418 | | | | 6,091 | | | | 37,195 | |
| |
4 Share in the net income of companies of the Royal Dutch/Shell Group
Net income of the Royal Dutch/Shell Group included in the Profit and Loss Account has been calculated as 60% of the net income of the Royal Dutch/Shell Group as presented in the Netherlands GAAP Financial Statements of the Royal Dutch/Shell Group. The Royal Dutch share in the net income of the Royal Dutch/Shell Group amounts to€8,712 million, the equivalent of $10,818 million (2003:€6,411 million, the equivalent of $7,134 million as restated). Net income has been translated into euros using the weighted average rate of exchange for the year.
The dividend for 2004 distributed and yet to be distributed by Group companies to Royal Dutch amounted to€3,842 million, the equivalent of $4,793 million (2003:€2,868 million, the equivalent of $3,396 million).
5 Share capital
The authorised capital as laid down in the Articles of Association is expressed in euros and amounts to€1,792,000,000. The authorised share capital is divided into 3,198,800,000 ordinary shares with a par value of€0.56 each and 1,500 priority shares with a par value of€448 each. The movements in issued and paid-up capital during 2003 and 2004 were as follows:
Share capital
| | | | | | | | | |
| | | Number of shares | | | € | |
| |
Ordinary shares of€0.56 | | | | | | | | |
| |
| At December 31, 2002 | | | 2,099,285,000 | | | | 1,175,599,600 | |
| |
| Cancelled during 2003 | | | (15,785,000 | ) | | | (8,839,600 | ) |
| |
| At December 31, 2003 | | | 2,083,500,000 | | | | 1,166,760,000 | |
| |
| Cancelled during 2004 | | | (1,775,000 | ) | | | (994,000 | ) |
| |
At December 31, 2004 | | | 2,081,725,000 | | | | 1,165,766,000 | |
| |
Priority shares of€448 | | | | | | | | |
| |
| At December 31, 2002 | | | 1,500 | | | | 672,000 | |
| |
| At December 31, 2003 | | | 1,500 | | | | 672,000 | |
| |
At December 31, 2004 | | | 1,500 | | | | 672,000 | |
| |
Total ordinary and priority shares | | | | | | | | |
| |
| At December 31, 2003 | | | 2,083,501,500 | | | | 1,167,432,000 | |
| |
At December 31, 2004 | | | 2,081,726,500 | | | | 1,166,438,000 | |
| |
Report of the Independent Auditors35
On June 17, 2004, the Board of Management of Royal Dutch announced that it will propose to the General Meeting of Shareholders on June 28, 2005, to abolish the priority shares.
6 Earnings per share
The basic earnings per share amounts shown are related to profit after taxation and after deducting the 4% cumulative preference dividend on priority shares. The calculation uses a weighted average number of shares of 2,023,212,126 (2003: 2,036,687,755 shares; 2002: 2,057,657,737 shares). These numbers are based on outstanding shares, after deduction of shares held by Group companies in respect of stock options and other incentive compensation plans. For the purpose of the calculation, shares repurchased under the buyback programme are deemed to have been cancelled on purchase date.
The diluted earnings per share are based on the same profit figures For this calculation the weighted number of shares is increased by 2,283,163 for 2004 (2003: 674,210; 2002: 442,580). These numbers relate to share options schemes as mentioned above.
Amounts reported in previous years have been reclassified following the separate reporting of income from discontinued operations. The basic earnings per ordinary share from discontinued operations of the Royal Dutch/Shell Group of Companies amounted to€0.01 for 2003 (2002:€0.06). The diluted earnings per ordinary share from discontinued operations of the Royal Dutch/Shell Group of Companies amounted to€0.01 for 2003 (2002:€0.06).
Report of the Independent Auditors
We have audited the Summary Annual Accounts set out on pages 33 to 35, which have been derived from the full Annual Accounts of Royal Dutch Petroleum Company for the year 2004. The preparation of the Summary Annual Accounts is the responsibility of the Company’s management.
We conducted our audit in accordance with generally accepted auditing standards in the Netherlands.
Based on our audit, we confirm that the Summary Annual Accounts are consistent in all material respects with the full Annual Accounts of Royal Dutch Petroleum Company for the year ended December 31, 2004, on which we have issued an unqualified opinion dated April 27, 2005. For a better understanding of the Company’s financial performance and position and the scope of the audit performed, the Summary Annual Accounts should be read in conjunction with the full Annual Accounts and our audit report thereon.
KPMG Accountants N.V.
The Hague
April 27, 2005
36Royal Dutch Petroleum Company
Shareholder information
Ownership of ordinary shares
At April 22, 2005 the only interest known to the Company in 5% or more of the Company’s issued ordinary share capital was The Capital Group International Inc. which held 115,437,760 shares (5.5%) at December 31, 2004, as indicated in its Schedule 13G filed with the SEC, dated February 14, 2005.
Number of shares
The number of outstanding ordinary shares with a par value of€0.56 at the end of 2004 was 2,081,725,000.
Share prices
Euronext Amsterdam
| | | | | | | | | | | | | | | | | | | | | |
| | | | | | | | | | | | | | | | | | | € | |
| | | 2004 | | | 2003 | | | 2002 | | | 2001 | | | 2000 | |
| |
| Highest | | | 44.03 | | | | 44.58 | | | | 63.20 | | | | 73.48 | | | | 75.90 | |
| Lowest | | | 36.59 | | | | 33.35 | | | | 39.21 | | | | 43.72 | | | | 51.51 | |
| Year-end | | | 42.35 | | | | 41.80 | | | | 41.95 | | | | 56.90 | | | | 65.26 | |
| |
New York Stock Exchange
| | | | | | | | | | | | | | | | | | | | | |
| | | | | | | | | | | | | | | | | | | $ | |
| | | 2004 | | | 2003 | | | 2002 | | | 2001 | | | 2000 | |
| |
| Highest | | | 57.79 | | | | 52.70 | | | | 57.30 | | | | 64.15 | | | | 65.69 | |
| Lowest | | | 45.79 | | | | 36.69 | | | | 38.60 | | | | 39.75 | | | | 50.44 | |
| Year-end | | | 57.38 | | | | 52.39 | | | | 44.02 | | | | 49.02 | | | | 60.56 | |
| |
Information prior to 2004 has been restated for comparative purposes (see Note 3 to the Summary Annual Accounts on page 34).
| | | | | | | | | | | |
| Key figures per ordinary share |
| | | | | | | | | | | | | |
| | | | | | | | | | | € | |
| | | 2004 | | | 2003 | | | 2002 | |
| |
Dividends | | | | | | | | | | | | |
| Interim | | | 0.75 | | | | 0.74 | | | | 0.72 | |
| Final | | | 1.04 | a | | | 1.02 | a | | | 1.00 | |
| |
Total dividend | | | 1.79 | | | | 1.76 | | | | 1.72 | |
| |
Net incomeb | | | 4.31 | | | | 3.15 | | | | 2.79 | |
| |
Net assetsc | | | 19.63 | | | | 18.29 | | | | 18.49 | |
| |
Key figures per ordinary share
| | | | | | | | | | | | | |
| | | | | | | | | | | $ | |
| | | 2004 | | | 2003 | | | 2002 | |
| |
Dividends | | | | | | | | | | | | |
| Interim | | | 0.90 | | | | 0.85 | | | | 0.70 | |
| Final | | | 1.33 | a | | | 1.21 | a | | | 1.10 | |
| |
Total dividend | | | 2.23 | | | | 2.06 | | | | 1.80 | |
| |
Net incomeb | | | 5.35 | | | | 3.51 | | | | 2.79 | |
| |
Net assetsc | | | 26.77 | | | | 23.07 | | | | 19.35 | |
| |
| a | | Second interim dividend. |
| |
| b | | Basic earnings per share based on Netherlands GAAP. |
| |
| c | | Based on Netherlands GAAP and on ordinary shares in issue at December 31, after deduction of shares held by Group Companies in respect of stock options and other incentive compensation plans. For this purpose shares repurchased under the buyback programme are deemed to have been cancelled on purchase date. |
| a | | Annualised total shareholder return is calculated as the annualised total of stock appreciation and yield from reinvested dividends before taxes. The figures above are based on quarterly reinvestment of gross dividends expressed in dollars. Data for ChevronTexaco, ExxonMobil and Total before the effective date of their respective mergers were replaced by data from the acquiring entities. |
| |
| | | Source: Bloomberg. |
Shareholder information
Financial calendar
| | | | | |
| |
| Financial year ends | | December 31, 2004 |
| | | | | |
Announcements | | | | |
| Full-year results for 2004 | | February 3, 2005 |
| First quarter results for 2005 | | April 28, 2005 |
| Second quarter results for 2005 | | July 28, 2005* |
| Third quarter results for 2005 | | October 27, 2005* |
| | | | | |
Dividends – Hague Register and Bearer shares | | | | |
| 2004 Second interim | | | | |
| |
| Announced | | February 3, 2005 |
| Record date | | February 3, 2005 |
| Ex-dividend date | | February 4, 2005 |
| Payment date | | March 15, 2005 |
| | | | | |
| 2005 First interim | | | | |
| |
| Announced | | April 28, 2005 |
| Record date | | April 28, 2005 |
| Ex-dividend date | | April 29, 2005 |
| Payment date | | June 15, 2005 |
| | | | | |
Dividends – New York Register | | | | |
| 2004 Second interim | | | | |
| |
| Announced | | February 3, 2005 |
| Ex-dividend date | | February 4, 2005 |
| Record date | | February 8, 2005 |
| Payment date | | March 15, 2005 |
| | | | | |
| 2005 First interim | | | | |
| |
| Announced | | April 28, 2005 |
| Ex-dividend date | | April 29, 2005 |
| Record date | | May 3, 2005 |
| Payment date | | June 15, 2005 |
General Meeting of Shareholders | | June 28, 2005 |
| |
| * | | The dates shown are provisional and subject to final confirmation. |
Contact addresses
| | | |
Investor Relations
Enquiries from shareholders may be
addressed to:
The Hague
Shell International B.V.
Group Investor Relations
PO Box 162
2501 AN The Hague
The Netherlands
Tel: +31 (0)70 377 4540
Fax: +31 (0)70 377 3115
e-mail: ir-hague@shell.com
London
Shell International Limited
Group Investor Relations
Shell Centre
London SE1 7NA
United Kingdom
Tel: +44 (0)20 7934 3856
Fax: +44 (0)20 7934 3702
e-mail: ir-london@shell.com
New York
Shell Oil Company
1270 Avenue of the Americas
Suite 2320
New York, NY 10020
USA
Tel: +1 212 218 3113
Fax: +1 212 218 3114
e-mail: ir-newyork@shell.com
For access to investor relations
information, visit the website at
www.shell.com/investor
See addresses on the back cover
for requests for publications,
including copies of the original
Dutch Annual Report. | | Hague Register
Royal Dutch shareholders listed in the
Hague Register who have enquiries
about share ownership, changes of
address or payment of dividends
may contact:
N.V. Algemeen Nederlands
Trustkantoor ANT
PO Box 11063
1001 GB Amsterdam
The Netherlands
Tel: + 31 (0)20 522 2510
Fax: + 31 (0)20 522 2500
e-mail: registers@ant-trust.nl
New York Register
Royal Dutch shareholders listed in
the New York Register who have
enquiries about share ownership,
changes of address or payment of
dividends may contact:
Stock Transfer and Paying Agent
JPMorgan Service Center
PO Box 43013
Providence, RI 02940-3013
USA
Tel: 800 556 8639 (USA only)
+ 1 781 575 4328
(international)
Fax: + 1 781 575 4082
Website:
www.adr.com/shareholders |
Royal Dutch Petroleum Company
N.V. Koninklijke Nederlandsche
Petroleum Maatschappij
Founded on June 16, 1890
Carel van Bylandtlaan 30
2596 HR The Hague
The Netherlands
Tel: +31 (0)70 377 9111
Designed and produced by Corporate Edge using Ringmaster®. Cover photography by Peter Dazeley. Printed by Butler and Tanner who are accredited with the ISO 14001 Environmental Management System.
The paper for this report contains 75% de-inked post-consumer waste. The remaining 25% is from elemental chlorine-free pulp sourced from sustainably managed forests. The manufacturers of the paper are accredited with the ISO 9002 Quality Assurance and ISO 14001 Environmental Management Systems.
Ringmaster® is the registered trademark of Automatrix plc.

Annual Report and Accounts 2004
The Annual Reports and Accounts of Royal Dutch Petroleum Company and The “Shell” Transport and Trading Company, p.l.c.
Available at www.shell.com/annualreport
The Shell Report 2004
Meeting the energy challenge – our progress in contributing to sustainable development.
Available at www.shell.com/shellreport
Summary Annual Report and Accounts 2004
Summary versions of the Annual Reports and Accounts of Royal Dutch Petroleum Company and The “Shell” Transport and Trading Company, p.l.c.
Available at www.shell.com/annualreport
Financial and Operational Information 2000–2004
Five years’ financial and operational information about the Group, including maps of exploration and production activities.
Available at www.shell.com/faoi
Statement of General Business Principles
Fundamental principles that govern how each Shell company conducts its affairs.
Available at www.shell.com/sgbp
Tell Shell
Tell us what you think about Shell, our performance, our reports or the issues we face. Join the global debate – we value your views.
Visit www.shell.com/tellshell or e-mail us at tellshell@shell.com
Contact any of the addresses below for copies of publications:
Shell International B.V.
FSK Division, PO Box 162
2501 AN The Hague
The Netherlands
Tel: +31 (0)70 377 4540
Fax: +31 (0)70 377 3115
Shell International Limited
PXXC (Publications)
Shell Centre, London, SE1 7NA
United Kingdom
Tel: +44 (0)20 7934 5293
Fax: +44 (0)20 7934 5555
Shell Oil Company
1270 Avenue of the Americas
Suite 2320, New York
NY 10020, USA
Tel: +1 212 218 3113
Fax: +1 212 218 3114
More information about the Royal Dutch/Shell Group is available at www.shell.com