UNITED STATES
SECURITIES AND EXCHANGE COMMISSION
WASHINGTON, D. C. 20549
FORM N-CSRS
Investment Company Act file number 811-5896
DWS Target Fund
(Exact Name of Registrant as Specified in Charter)
222 South Riverside Plaza
Chicago, IL 60606
(Address of principal executive offices) (Zip code)
Registrant’s Telephone Number, including Area Code: (212) 454-7190
Paul Schubert
345 Park Avenue
New York, NY 10154
(Name and Address of Agent for Service)
Date of fiscal year end: | 07/31 |
Date of reporting period: | 1/31/07 |
ITEM 1. REPORT TO STOCKHOLDERS
JANUARY 31, 2007
Semiannual Report
to Shareholders
DWS Target 2010 Fund
Contents
This report must be preceded by a prospectus. The prospectus contains the fund's objectives, risks, charges and expenses, and other important information about the fund.
Investments in mutual funds involve risk. Some funds have more risk than others. Because the fund provides investment protection only on the maturity date to investors who reinvest all dividends and do not redeem their shares before the maturity date, the principal value of the fund is subject to market fluctuation prior to and after the maturity date. This fund is subject to stock market risk, meaning stocks in the fund may decline in value for extended periods of time due to the activities and financial prospects of individual companies, or due to general market and economic conditions. Additionally, the fund invests in individual bonds whose yields and market values fluctuate so that your investment may be worth more or less than its original cost. Bond investments are subject to interest-rate risk such that when interest rates rise, the prices of the bonds, and thus the value of the fund, can decline and the investor can lose principal value. Please read this fund's prospectus for specific details regarding its investments and risk profile. This fund is closed to new investors. Please refer to the fund's prospectus for more details.
DWS Scudder is part of Deutsche Asset Management, which is the marketing name in the US for the asset management activities of Deutsche Bank AG, Deutsche Bank Trust Company Americas, Deutsche Investment Management Americas Inc. and DWS Trust Company.
NOT FDIC/NCUA INSURED NO BANK GUARANTEE MAY LOSE VALUE NOT A DEPOSIT NOT INSURED BY ANY FEDERAL GOVERNMENT AGENCY
Performance Summary January 31, 2007
All performance shown is historical, assumes reinvestment of all dividend and capital gain distributions, and does not guarantee future results. Investment return and principal value fluctuate with changing market conditions so that, when redeemed, shares may be worth more or less than their original cost. Current performance may be lower or higher than the performance quoted. Please visit www.dws-scudder.com for the Fund's most recent month-end performance.
The maximum sales charge for the Fund is 5.0%. Unadjusted returns do not reflect sales charges and would have been lower if they had.
Returns and rankings during all periods shown reflect a fee waiver and/or expense reimbursement. Without this waiver/reimbursement, returns and rankings would have been lower.
Performance figures do not reflect the deduction of taxes that a shareholder would pay on fund distributions or the redemption of fund shares.
Average Annual Total Returns (Unadjusted for Sales Charge) as of 1/31/07 |
| 6-Month* | 1-Year | 3-Year | 5-Year | 10-Year |
DWS Target 2010 Fund | 4.97% | 4.39% | 3.35% | 4.74% | 6.71% |
S&P 500® Index+
| 13.75% | 14.51% | 10.32% | 6.82% | 7.93% |
Lehman Brothers US Government Bond Index++
| 3.05% | 3.53% | 2.88% | 4.48% | 5.99% |
Sources: Lipper Inc. and Deutsche Investment Management Americas Inc.
* Total returns shown for periods less than one year are not annualized.Net Asset Value and Distribution Information |
Net Asset Value: 1/31/07
| $ 8.73 |
7/31/06
| $ 9.05 |
Distribution Information: Six Months as of 1/31/07:
Income Dividends | $ 0.22 |
Capital Gain Distributions | $ 0.55 |
Lipper Rankings — Mixed-Asset Target 2010 Funds Category as of 1/31/07 |
Period | Rank | | Number of Funds Tracked | Percentile Ranking (%) |
1-Year
| 97 | of | 97 | 99 |
3-Year
| 40 | of | 40 | 98 |
5-Year
| 11 | of | 15 | 69 |
10-Year
| 3 | of | 5 | 50 |
Source: Lipper Inc. Rankings are historical and do not guarantee future results. Rankings are based on total returns unadjusted for sales charges with distributions reinvested. If sales charges had been included, rankings might have been less favorable.
Growth of an Assumed $10,000 Investment (Adjusted for Maximum Sales Charge) |
[] DWS Target 2010 Fund [] S&P 500 Index+ [] Lehman Brothers US Government Bond Index++ |
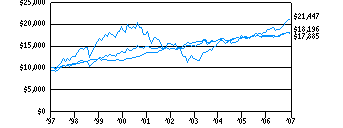 |
Yearly periods ended January 31 |
The Fund's growth of an assumed $10,000 investment is adjusted for the maximum sales charge of 5.0%. This results in a net initial investment of $9,500.
Comparative Results (Adjusted for Maximum Sales Charge) as of 1/31/07 |
| 1-Year | 3-Year | 5-Year | 10-Year |
DWS Target 2010 Fund | Growth of $10,000
| $9,917 | $10,488 | $11,973 | $18,196 |
Average annual total return
| -.83% | 1.60% | 3.67% | 6.17% |
S&P 500 Index+
| Growth of $10,000
| $11,451 | $13,427 | $13,910 | $21,447 |
Average annual total return
| 14.51% | 10.32% | 6.82% | 7.93% |
Lehman Brothers US Government Bond Index++
| Growth of $10,000
| $10,353 | $10,888 | $12,447 | $17,885 |
Average annual total return
| 3.53% | 2.88% | 4.48% | 5.99% |
The growth of $10,000 is cumulative.
+ The Standard & Poor's 500 (S&P 500) Index is an unmanaged, capitalization-weighted index of 500 stocks. The index is designed to measure performance of the broad domestic economy through changes in the aggregate market value of 500 stocks representing all major industries.++ The Lehman Brothers US Government Bond Index is an unmanaged, market-value-weighted index of US Treasury and government agency, securities (other than mortgage securities) with maturities of one year or more.Index returns assume reinvestment of dividends and, unlike Fund returns, do not reflect any fees or expenses. It is not possible to invest directly into an index.Information About Your Fund's Expenses
As an investor of the Fund, you incur two types of costs: ongoing expenses and transaction costs. Ongoing expenses include management fees, distribution and service (12b-1) fees and other Fund expenses. Examples of transaction costs include sales charges (loads) and account maintenance fees, which are not shown in this section. The following tables are intended to help you understand your ongoing expenses (in dollars) of investing in the Fund and to help you compare these expenses with the ongoing expenses of investing in other mutual funds. In the most recent six-month period, the Fund limited these expenses; had it not done so, expenses would have been higher. The example in the table is based on an investment of $1,000 invested at the beginning of the six-month period and held for the entire period (August 1, 2006 to January 31, 2007).
The tables illustrate your Fund's expenses in two ways:
Actual Fund Return. This helps you estimate the actual dollar amount of ongoing expenses (but not transaction costs) paid on a $1,000 investment in the Fund using the Fund's actual return during the period. To estimate the expenses you paid over the period, simply divide your account value by $1,000 (for example, an $8,600 account value divided by $1,000 = 8.6), then multiply the result by the number in the "Expenses Paid per $1,000" line under the share class you hold.
Hypothetical 5% Fund Return. This helps you to compare your Fund's ongoing expenses (but not transaction costs) with those of other mutual funds using the Fund's actual expense ratio and a hypothetical rate of return of 5% per year before expenses. Examples using a 5% hypothetical fund return may be found in the shareholder reports of other mutual funds. The hypothetical account values and expenses may not be used to estimate the actual ending account balance or expenses you paid for the period.
Please note that the expenses shown in these tables are meant to highlight your ongoing expenses only and do not reflect any transaction costs. The "Expenses Paid per $1,000" line of the tables is useful in comparing ongoing expenses only and will not help you determine the relative total expense of owning different funds. If these transaction costs had been included, your costs would have been higher.
Expenses and Value of a $1,000 Investment for the six months ended January 31, 2007 |
Actual Fund Return | |
Beginning Account Value 8/1/06
| $ 1,000.00 |
Ending Account Value 1/31/07
| $ 1,049.70 |
Expenses Paid per $1,000*
| $ 5.84 |
Hypothetical 5% Fund Return | |
Beginning Account Value 8/1/06
| $ 1,000.00 |
Ending Account Value 1/31/07
| $ 1,019.51 |
Expenses Paid per $1,000*
| $ 5.75 |
* Expenses are equal to the Fund's annualized expense ratio, multiplied by the average account value over the period, multiplied by the number of days in the most recent six-month period, then divided by 365.Annualized Expense Ratio | |
DWS Target 2010 Fund
| 1.13% |
For more information, please refer to the Fund's prospectus.
Portfolio Management Review
In the following interview, the portfolio managers discuss the market environment, fund performance and the strategy in managing DWS Target 2010 Fund during the semiannual period ended January 31, 2007.
Q: How did the US bond market perform during the semiannual period?
A: The domestic bond market delivered a positive total return for the period, but with a high level of volatility. The reason for this volatility can be traced back to the statement accompanying the Federal Open Market Committee (FOMC) meeting on June 29, 2006. In this release, the FOMC changed its language to suggest that further rate hikes were no longer a given and that future decisions would in fact be dependent on incoming data. The bond market reacted by treating every major economic data release as though it would be the deciding factor in the FOMC's next decision.
With this as the backdrop, there was a decent amount of price volatility leading up to and away from each major number (particularly employment, housing and inflation data). Still, the net effect was continued outperformance by longer-term bonds relative to their shorter-term counterparts. While two-year US Treasury yields dropped slightly from 4.95% to 4.92% (reflecting rising prices), five-year yields fell from 4.90% to 4.80% and 10-year yields fell even more, from 4.98% to 4.81%.
However, these net results do not provide a full picture of the bond market's performance during this time. US Treasury yields declined throughout the majority of the period before touching a low in December, with yields falling to 4.51%, 4.38% and 4.42% for the two-, five- and 10-year issues, respectively. Until this point, the bond market had been convinced that US Federal Reserve Board (the Fed) Chairman Benjamin Bernanke was engineering a "soft landing," i.e., keeping inflation in check without strongly curbing growth. Beginning in December, however, a string of economic numbers indicated that the economy was in fact stronger than market participants had thought. In addition, the Fed again emphasized its focus on controlling inflation. As a result, expectations diminished that the Fed would enact atr rate cut in the first half of the year, and US Treasury yields rose in response. Still, yields closed the period lower than where they stood at the end of July, reflecting rising prices.
Q: What events drove performance in the stock market?
A: The US stock market delivered a strong performance during the past six months. At the very beginning of the period — in early July — stock prices were under pressure from a variety of sources, including violence in the Middle East, high oil prices and concerns that rising inflation pressures would force the Fed to continue raising interest rates. These fears began to subside by mid-July as overseas tensions calmed, the price of oil fell sharply and investors began to factor in the possibility of a "Goldilocks" economy (i.e., not too hot and not too cold).
The result was an impressive rally for the stock market that began in the second half of July and continued with virtually no interruption through the end of the period, reflecting investors' steadily growing appetite for risk.
Q: How did the fund perform in this environment?
A: DWS Target 2010 Fund produced a total return of 4.97% during the six months ended January 31, 2007. The fund, which invests in both stocks and bonds, held weightings of 27% and 73%, respectively, in the two asset classes as of January 31, 2007. The fund's stock benchmark is the Standard & Poor's 500® (S&P 500) Index, which posted a total return of 13.75% during the semiannual period.1 The fund's bond benchmark is the Lehman Brothers US Government Bond Index, which returned 3.05% for the same period.2
1 The Standard & Poor's 500 (S&P 500) Index is an unmanaged, capitalization-weighted index of 500 stocks. The index is designed to measure performance of the broad domestic economy through changes in the aggregate market valued of 500 stocks representing all major indices.Index returns reflect the reinvestment of dividends and, unlike fund returns, do not reflect fees or expenses. It is not possible to invest directly in an index.2 The Lehman Brothers US Government Bond Index is an unmanaged, market-value weighted index of US Treasury and government agency securities (other than mortgage securities) with maturities of one year or more.Index returns reflect the reinvestment of dividends and, unlike fund returns, do not reflect fees or expenses. It is not possible to invest directly in an index.Returns are unadjusted for sales charges. If sales charges had been included, returns would have been lower. Past performance is no guarantee of future results. Please see pages 4 through 5 for more complete performance information.
Q: What factors helped and hurt the performance of the equity portion of the portfolio?
A: The current team assumed the fund's management duties on January 22, 2007 — close to the end of the reporting period. With the switch in management came a change in strategy and a realignment of the fund's portfolio. Prior to this change, the fund delivered its best performance within the financial sector. Here, the two top performers were Merrill Lynch & Co., Inc. and Bank of New York Co.* Also making a notable contribution to performance were the fund's stock picks in the industrials sector, where PACCAR Inc. and Honeywell International Inc. were the leading contributors. The third-best sector was technology, where Cisco Systems Inc. turned in a good performance.
In terms of detractors, stock selection was least effective in the energy sector, where holdings in Occidental Petroleum Corp.* and Valero Energy Corp.* were hardest hit by the decline in oil prices. Also detracting were the fund's holdings in the utilities sector, where TXU Corp.* made the largest negative contribution to returns. Note that all contributors and detractors mentioned here were investments made by the previous management team.
* These securities were no longer held as of January 31, 2007.Q: How will you manage the fund's equity portfolio going forward?
A: We employ a quantitative strategy that is based on the philosophy that an objective, systematic and disciplined investment process can consistently add value in terms of stock selection. We believe that all stocks have an intrinsic value, but that their market prices will deviate from this level over time. The best way to identify this intrinsic value, in our view, is through a strict quantitative peer group comparison that takes into account both value and growth characteristics. We also believe that the consistency of the portfolio's risk-adjusted performance can be improved through diversification and rigorous portfolio construction, i.e., taking smaller positions in more companies and minimizing the exposure to style and capitalization. In this way, we seek to minimize subjective judgment by utilizing comprehensive data analysis to support our investment decisions.
Put simply, our goal is to construct an equity portfolio with risk characteristics that are similar to that of the benchmark, but with a higher consistency of outperformance than traditionally managed funds. We put this approach to work upon taking over management of the fund on January 22, and we believe that our disciplined process has potential in terms of the fund's long-term performance.
Q: How did the fund's investments in fixed income securities affect performance?
A: The fixed income portion of the portfolio is invested entirely in US Treasury STRIPS, which are securities representing the principal payment of a US Treasury security that has been "stripped" of its semiannual income component.3 In other words, the final payment of the bond — the return of principal — is the only payment investors receive. Such securities initially sell at a discount to their final value, and their prices gradually rise until they become fully valued at par ($1,000 per bond) on their maturity date. Because STRIPS are more responsive to interest rate changes than coupon-bearing bonds of similar maturity, they tend to be more sensitive to overall market volatility. This is particularly true for longer-maturity STRIPS. As the maturity dates for these STRIPS approach, the dominant contribution to price performance is the gradual appreciation to par value.
3 STRIPS is an acronym for Separate Trading of Registered Interest and Principal of Securities.The price performance of DWS Target 2010 Fund's STRIP position was characterized by a steady accretion of the value towards par. Volatility was relatively limited due to the security's close maturity and corresponding lower sensitivity to interest rate fluctuations. Still, given the positive environment for the bond market as a whole during the past six months, this portion of the fund's portfolio contributed nicely to returns.
The views expressed in this report reflect those of the portfolio managers only through the end of the period of the report as stated on the cover. The management team's views are subject to change at any time based on market and other conditions and should not be construed as a recommendation. Past performance is no guarantee of future results.
Portfolio Summary
Asset Allocation (Excludes Securities Lending Collateral) | 1/31/07 | 7/31/06 |
| | |
US Treasury Obligations | 73% | 74% |
Common Stocks | 27% | 24% |
Exchange Traded Funds | — | 1% |
Cash Equivalents | — | 1% |
| 100% | 100% |
Sector Diversification (As a % of Common Stocks) | 1/31/07 | 7/31/06 |
| | |
Financials | 20% | 23% |
Information Technology | 15% | 14% |
Consumer Discretionary | 14% | 8% |
Health Care | 14% | 13% |
Industrials | 12% | 11% |
Energy | 11% | 10% |
Consumer Staples | 7% | 10% |
Utilities | 3% | 4% |
Telecommunication Services | 2% | 4% |
Materials | 2% | 3% |
| 100% | 100% |
Asset allocation and sector diversification are subject to change.
Ten Largest Equity Holdings at January 31, 2007 (6.3% of Net Assets) |
1. Bank of America Corp.
Provider of commercial banking services
| 0.8% |
2. Microsoft Corp.
Developer of computer software
| 0.8% |
3. Johnson & Johnson
Provider of health care products
| 0.8% |
4. JPMorgan Chase & Co.
Provider of global financial services
| 0.7% |
5. Wells Fargo & Co.
Provider of various financial services
| 0.6% |
6. Cisco Systems, Inc.
Developer of computer network products
| 0.6% |
7. PepsiCo, Inc.
Provider of soft drinks, snack foods and food services
| 0.5% |
8. Morgan Stanley
Provider of investment banking and brokerage services
| 0.5% |
9. ExxonMobil Corp.
Explorer and producer of oil and gas
| 0.5% |
10. Abbott Laboratories
Developer of health care products
| 0.5% |
Portfolio holdings are subject to change.
For more complete details about the Fund's investment portfolio, see page 15. A quarterly Fact Sheet is available upon request. Information concerning portfolio holdings of the Fund as of month end will be posted to www.dws-scudder.com on or after the last day of the following month. In addition, the Fund's top ten holdings and other information about the Fund is posted on www.dws-scudder.com as of the calendar quarter-end on or after the 15th day following quarter-end. Please see the Account Management Resources section for contact information.
Following the Fund's fiscal first and third quarter-end, a complete portfolio holdings listing is filed with the SEC on Form N-Q. This form will be available on the SEC's Web site at www.sec.gov, and it also may be reviewed and copied at the SEC's Public Reference Room in Washington, D.C. Information on the operation of the SEC's Public Reference Room may be obtained by calling (800) SEC-0330.
Investment Portfolio as of January 31, 2007 (Unaudited)
|
Shares
| Value ($) |
| |
Common Stocks 26.9% |
Consumer Discretionary 3.8% |
Hotels Restaurants & Leisure 0.6% |
Brinker International, Inc. | 600 | 18,930 |
International Game Technology | 900 | 39,114 |
McDonald's Corp. | 5,030 | 223,080 |
| 281,124 |
Household Durables 0.1% |
Newell Rubbermaid, Inc. | 1,800 | 53,172 |
Internet & Catalog Retail 0.3% |
Coldwater Creek, Inc.* | 4,600 | 85,790 |
Nutri/System, Inc.* | 1,100 | 48,455 |
| 134,245 |
Leisure Equipment & Products 0.1% |
Pool Corp. | 1,300 | 47,580 |
Media 1.3% |
Comcast Corp. "A"* | 1,320 | 58,502 |
McGraw-Hill Companies, Inc. | 3,210 | 215,327 |
Omnicom Group, Inc. | 1,010 | 106,252 |
Walt Disney Co. | 6,780 | 238,453 |
| 618,534 |
Multiline Retail 0.3% |
Dollar Tree Stores, Inc.* | 1,800 | 56,628 |
Family Dollar Stores, Inc. | 2,900 | 93,960 |
| 150,588 |
Specialty Retail 0.8% |
Dick's Sporting Goods, Inc.* | 2,300 | 118,427 |
Office Depot, Inc.* | 3,400 | 127,126 |
Ross Stores, Inc. | 1,100 | 35,629 |
The Sherwin-Williams Co. | 1,200 | 82,920 |
| 364,102 |
Textiles, Apparel & Luxury Goods 0.3% |
Coach, Inc.* | 3,110 | 142,625 |
Consumer Staples 1.9% |
Beverages 0.5% |
PepsiCo, Inc. | 4,000 | 260,960 |
Food & Staples Retailing 0.0% |
Safeway, Inc. | 400 | 14,412 |
Food Products 0.4% |
ConAgra Foods, Inc. | 7,700 | 197,967 |
Household Products 0.5% |
Colgate-Palmolive Co. | 2,900 | 198,070 |
Kimberly-Clark Corp. | 300 | 20,820 |
| 218,890 |
Tobacco 0.5% |
Altria Group, Inc. | 1,040 | 90,886 |
Reynolds American, Inc. | 500 | 32,250 |
UST, Inc. | 1,700 | 97,648 |
| 220,784 |
Energy 2.8% |
Energy Equipment & Services 1.1% |
ENSCO International, Inc. | 2,200 | 111,914 |
Superior Energy Services, Inc.* | 3,500 | 106,120 |
Tidewater, Inc. | 2,400 | 123,768 |
Todco* | 2,700 | 93,501 |
Unit Corp.* | 1,800 | 87,264 |
| 522,567 |
Oil, Gas & Consumable Fuels 1.7% |
Devon Energy Corp. | 2,200 | 154,198 |
ExxonMobil Corp. | 3,366 | 249,421 |
Forest Oil Corp.* | 1,300 | 41,496 |
Newfield Exploration Co.* | 2,800 | 119,868 |
Plains Exploration & Production Co.* | 2,400 | 115,776 |
Sunoco, Inc. | 1,300 | 82,069 |
XTO Energy, Inc. | 1,100 | 55,517 |
| 818,345 |
Financials 5.4% |
Capital Markets 1.4% |
Merrill Lynch & Co., Inc. | 2,090 | 195,540 |
Morgan Stanley | 3,020 | 250,026 |
The Goldman Sachs Group, Inc. | 1,070 | 227,011 |
| 672,577 |
Commercial Banks 0.7% |
US Bancorp | 1,600 | 56,960 |
Wells Fargo & Co. | 8,240 | 295,981 |
| 352,941 |
Diversified Financial Services 1.7% |
Bank of America Corp. | 7,710 | 405,392 |
Citigroup, Inc. | 900 | 49,617 |
JPMorgan Chase & Co. | 6,100 | 310,673 |
Moody's Corp. | 450 | 32,202 |
| 797,884 |
Insurance 0.9% |
Allstate Corp. | 600 | 36,096 |
Assurant, Inc. | 200 | 11,116 |
CNA Financial Corp.* | 500 | 20,325 |
Genworth Financial, Inc. "A" | 1,300 | 45,370 |
HCC Insurance Holdings, Inc. | 200 | 6,246 |
Loews Corp. | 1,250 | 54,325 |
MetLife, Inc. | 2,180 | 135,422 |
Nationwide Financial Services, Inc. "A" | 100 | 5,465 |
Old Republic International Corp. | 1,800 | 40,140 |
Philadelphia Consolidated Holding Corp.* | 1,000 | 45,060 |
St. Paul Travelers Companies, Inc. | 500 | 25,425 |
| 424,990 |
Real Estate Investment Trusts 0.6% |
AMB Property Corp. (REIT) | 200 | 12,170 |
Archstone-Smith Trust (REIT) | 600 | 37,926 |
AvalonBay Communities, Inc. (REIT) | 200 | 29,672 |
Developers Diversified Realty Corp. (REIT) | 400 | 26,848 |
Hospitality Properties Trust (REIT) | 300 | 14,640 |
Public Storage, Inc. (REIT) | 300 | 32,628 |
Rayonier, Inc. (REIT) | 100 | 4,320 |
Simon Property Group, Inc. (REIT) | 400 | 45,756 |
The Macerich Co. (REIT) | 300 | 28,659 |
Thornburg Mortgage, Inc. (REIT) | 300 | 8,070 |
United Dominion Realty Trust, Inc. (REIT) | 100 | 3,279 |
Vornado Realty Trust (REIT) | 300 | 36,705 |
| 280,673 |
Thrifts & Mortgage Finance 0.1% |
Fannie Mae | 900 | 50,877 |
Health Care 3.7% |
Biotechnology 0.3% |
Amgen, Inc.* | 2,060 | 144,962 |
Health Care Equipment & Supplies 0.8% |
Baxter International, Inc. | 4,010 | 199,137 |
Becton, Dickinson & Co. | 500 | 38,470 |
C.R. Bard, Inc. | 1,240 | 102,325 |
Dade Behring Holdings, Inc. | 700 | 29,456 |
| 369,388 |
Health Care Providers & Services 0.5% |
Humana, Inc.* | 1,400 | 77,700 |
Laboratory Corp. of America Holdings* | 900 | 66,096 |
McKesson Corp. | 1,980 | 110,385 |
| 254,181 |
Life Sciences Tools & Services 0.4% |
Covance, Inc.* | 300 | 18,495 |
Thermo Fisher Scientific, Inc.* | 3,660 | 175,131 |
| 193,626 |
Pharmaceuticals 1.7% |
Abbott Laboratories | 4,500 | 238,500 |
Johnson & Johnson | 5,444 | 363,659 |
Schering-Plough Corp. | 7,300 | 182,500 |
| 784,659 |
Industrials 3.2% |
Aerospace & Defense 0.9% |
Boeing Co. | 2,600 | 232,856 |
Honeywell International, Inc. | 1,000 | 45,690 |
Lockheed Martin Corp. | 800 | 77,752 |
Rockwell Collins, Inc. | 1,400 | 95,494 |
| 451,792 |
Airlines 0.3% |
AMR Corp.* | 1,800 | 66,690 |
Continental Airlines, Inc. "B"* | 1,900 | 78,831 |
| 145,521 |
Commercial Services & Supplies 0.3% |
Allied Waste Industries, Inc.* | 3,300 | 42,207 |
Avery Dennison Corp. | 700 | 47,852 |
R.R. Donnelley & Sons Co. | 400 | 14,840 |
Waste Management, Inc. | 1,000 | 37,980 |
| 142,879 |
Electrical Equipment 0.5% |
Emerson Electric Co. | 4,890 | 219,903 |
Industrial Conglomerates 0.3% |
General Electric Co. | 3,980 | 143,479 |
Machinery 0.7% |
Cummins, Inc. | 1,100 | 148,016 |
Eaton Corp. | 300 | 23,505 |
PACCAR, Inc. | 2,415 | 161,491 |
| 333,012 |
Road & Rail 0.2% |
Laidlaw International, Inc. | 800 | 23,768 |
Ryder System, Inc. | 1,400 | 76,356 |
| 100,124 |
Information Technology 4.0% |
Communications Equipment 0.6% |
Cisco Systems, Inc.* | 10,240 | 272,281 |
Computers & Peripherals 0.7% |
Hewlett-Packard Co. | 5,390 | 233,279 |
Network Appliance, Inc.* | 1,390 | 52,264 |
Western Digital Corp.* | 3,100 | 60,760 |
| 346,303 |
Electronic Equipment & Instruments 0.1% |
Tech Data Corp.* | 700 | 25,998 |
Internet Software & Services 0.3% |
eBay, Inc.* | 700 | 22,673 |
Google, Inc. "A"* | 220 | 110,286 |
| 132,959 |
IT Services 0.2% |
Acxiom Corp. | 1,900 | 43,130 |
Automatic Data Processing, Inc. | 1,580 | 75,398 |
CheckFree Corp.* | 200 | 8,286 |
| 126,814 |
Semiconductors & Semiconductor Equipment 1.0% |
Advanced Micro Devices, Inc.* | 5,500 | 85,525 |
Applied Materials, Inc. | 3,390 | 60,105 |
Atmel Corp.* | 13,800 | 82,524 |
MEMC Electronic Materials, Inc.* | 2,000 | 104,800 |
National Semiconductor Corp. | 1,600 | 37,008 |
Novellus Systems, Inc.* | 3,700 | 114,071 |
| 484,033 |
Software 1.1% |
Autodesk, Inc.* | 1,370 | 59,896 |
Cadence Design Systems, Inc.* | 2,300 | 43,470 |
Microsoft Corp. | 13,010 | 401,489 |
Symantec Corp.* | 2,200 | 38,962 |
| 543,817 |
Materials 0.6% |
Chemicals 0.4% |
Huntsman Corp.* | 1,200 | 25,092 |
Monsanto Co. | 2,570 | 141,581 |
| 166,673 |
Containers & Packaging 0.0% |
Sonoco Products Co. | 300 | 11,550 |
Metals & Mining 0.2% |
Southern Copper Corp. | 1,600 | 100,000 |
Paper & Forest Products 0.0% |
International Paper Co. | 500 | 16,850 |
Telecommunication Services 0.6% |
Diversified Telecommunication Services 0.6% |
AT&T, Inc. | 1,250 | 47,037 |
Verizon Communications, Inc. | 6,100 | 234,972 |
| 282,009 |
Wireless Telecommunication Services 0.0% |
Telephone & Data Systems, Inc. | 100 | 5,595 |
United States Cellular Corp.* | 200 | 14,420 |
| 20,015 |
Utilities 0.9% |
Electric Utilities |
Duke Energy Corp. | 11,200 | 220,528 |
Entergy Corp. | 1,080 | 100,278 |
Exelon Corp. | 1,610 | 96,584 |
Great Plains Energy, Inc. | 100 | 3,134 |
| 420,524 |
Total Common Stocks (Cost $11,552,452) | 12,859,189 |
| Principal Amount ($) | Value ($) |
| |
US Treasury Obligations 73.0% |
US Treasury STRIPS, 4.782%**, 11/15/2010 (a) (Cost $32,962,579) | 41,730,000 | 34,891,454 |
|
Shares
| Value ($) |
| |
Securities Lending Collateral 0.4% |
Daily Assets Fund Institutional, 5.34% (b) (c) (Cost $203,788) | 203,788 | 203,788 |
|
Cash Equivalents 0.2% |
Cash Management QP Trust, 5.31% (d) (Cost $87,008) | 87,008 | 87,008 |
| % of Net Assets | Value ($) |
| |
Total Investment Portfolio (Cost $44,805,827)+ | 100.5 | 48,041,439 |
Other Assets and Liabilities, Net | (0.5) | (262,741) |
Net Assets | 100.0 | 47,778,698 |
* Non-income producing security.** Bond equivalent yield to maturity; not a coupon rate.+ The cost for federal income tax purposes was $44,831,568. At January 31, 2007, net unrealized appreciation for all securities based on tax cost was $3,209,871. This consisted of aggregate gross unrealized appreciation for all securities in which there was an excess of value over tax cost of $3,274,467 and aggregate gross unrealized depreciation for all securities in which there was an excess of tax cost over value of $64,596.(a) All or a portion of these securities were on loan (see Notes to Financial Statements). The value of all securities loaned at January 31, 2007 amounted to $199,360 which is 0.4% of net assets.(b) Daily Assets Fund Institutional, an affiliated fund, is managed by Deutsche Investment Management Americas Inc. The rate shown is the annualized seven-day yield at period end.(c) Represents collateral held in connection with securities lending.(d) Cash Management QP Trust, an affiliated fund, is managed by Deutsche Investment Management Americas Inc. The rate shown is the annualized seven-day yield at period end.REIT: Real Estate Investment Trust
STRIPS: Separate Trading of Registered Interest and Principal Securities
The accompanying notes are an integral part of the financial statements.
Financial Statements
Statement of Assets and Liabilities as of January 31, 2007 (Unaudited) |
Assets |
Investments:
Investments in securities, at value (cost $44,515,031) — including $199,360 of securities loaned | $ 47,750,643 |
Investment in Daily Assets Fund Institutional (cost $203,788)* | 203,788 |
Investment in Cash Management QP Trust (cost $87,008) | 87,008 |
Total investments in securities, at value (cost $44,805,827)
| 48,041,439 |
Cash
| 1,105 |
Foreign currency, at value (cost $435)
| 435 |
Receivable for investment sold
| 9,341 |
Dividends receivable
| 13,642 |
Interest receivable
| 387 |
Other assets
| 10,545 |
Total assets
| 48,076,894 |
Liabilities |
Payable for Fund shares redeemed
| 10,870 |
Payable upon return of securities loaned
| 203,788 |
Accrued management fee
| 21,105 |
Other accrued expenses and payables
| 62,433 |
Total liabilities
| 298,196 |
Net assets, at value | $ 47,778,698 |
Net Assets |
Net assets consist of:
Undistributed net investment income
| 928,988 |
Net unrealized appreciation (depreciation) on investments
| 3,235,612 |
Accumulated net realized gain (loss)
| 302,028 |
Paid-in capital
| 43,312,070 |
Net assets, at value | $ 47,778,698 |
Net Asset Value |
Net Asset Value and redemption price per share ($47,778,698 ÷ 5,470,533 outstanding shares of beneficial interest, $.01 par value, unlimited number of shares authorized)
| $ 8.73 |
* Represents collateral on securities loaned.The accompanying notes are an integral part of the financial statements.
Statement of Operations for the six months ended January 31, 2007 (Unaudited) |
Investment Income |
Income:
Dividends (net of foreign taxes withheld of $1,135)
| $ 116,440 |
Interest
| 1,064,890 |
Interest — Cash Management QP Trust
| 1,902 |
Securities lending income, including income from Daily Assets Fund Institutional, net of borrower rebates
| 4,863 |
Other income*
| 23,587 |
Total Income
| 1,211,682 |
Expenses:
Management fee
| 124,034 |
Services to shareholders
| 39,550 |
Custodian fees
| 6,114 |
Distribution service fees
| 61,733 |
Auditing
| 18,807 |
Legal
| 4,486 |
Trustees' fees and expenses
| 5,843 |
Reports to shareholders
| 8,726 |
Registration fees
| 9,516 |
Other
| 3,344 |
Total expenses before expense reductions
| 282,153 |
Expense reductions
| (1,470) |
Total expenses after expense reductions
| 280,683 |
Net investment income (loss) | 930,999 |
Realized and Unrealized Gain (Loss) on Investment Transactions |
Net realized gain (loss) from:
Investments
| 1,667,657 |
Written options
| 529 |
| 1,668,186 |
Net unrealized appreciation (depreciation) during the period on investments
| (189,213) |
Net gain (loss) on investment transactions | 1,478,973 |
Net increase (decrease) in net assets resulting from operations | $ 2,409,972 |
* Represents non-recurring income from the Advisor recorded as a result of an administrative proceeding regarding disclosure of brokerage allocation practices in connection with sales of DWS Scudder Funds (see Note F).The accompanying notes are an integral part of the financial statements.
Statement of Changes in Net Assets |
Increase (Decrease) in Net Assets | Six Months Ended January 31, 2007 (Unaudited) | Year Ended July 31, 2006 |
Operations:
Net investment income (loss)
| $ 930,999 | $ 1,970,960 |
Net realized gain (loss) on investment transactions
| 1,668,186 | 1,929,492 |
Net unrealized appreciation (depreciation) during the period on investment transactions
| (189,213) | (3,747,841) |
Net increase (decrease) in net assets resulting from operations
| 2,409,972 | 152,611 |
Distributions to shareholders from:
Net investment income
| (1,139,335) | (2,956,517) |
Net realized gains
| (2,838,779) | (1,240,630) |
Fund share transactions:
Reinvestment of distributions
| 3,767,279 | 4,066,275 |
Cost of shares redeemed
| (4,224,482) | (9,170,971) |
Net increase (decrease) in net assets from Fund share transactions
| (457,203) | (5,104,696) |
Increase (decrease) in net assets | (2,025,345) | (9,149,232) |
Net assets at beginning of period
| 49,804,043 | 58,953,275 |
Net assets at end of period (including undistributed net investment income of $928,988 and $1,137,324, respectively)
| $ 47,778,698 | $ 49,804,043 |
Other Information |
Shares outstanding at beginning of period
| 5,501,703 | 6,047,402 |
Shares issued to shareholders in reinvestment of distributions
| 431,533 | 446,352 |
Shares redeemed
| (462,703) | (992,051) |
Net increase (decrease) in Fund shares
| (31,170) | (545,699) |
Shares outstanding at end of period
| 5,470,533 | 5,501,703 |
The accompanying notes are an integral part of the financial statements.
Financial Highlights
Years Ended July 31, | 2007a | 2006 | 2005 | 2004 | 2003 | 2002 |
Selected Per Share Data |
Net asset value, beginning of period | $ 9.05 | $ 9.75 | $ 9.52 | $ 9.35 | $ 9.10 | $ 9.49 |
Income (loss) from investment operations: Net investment income (loss)b | .18e | .34 | .35 | .32 | .32 | .31 |
Net realized and unrealized gain (loss) on investment transactions | .27 | (.31) | .23 | .18 | .26 | (.37) |
Total from investment operations | .45 | .03 | .58 | .50 | .58 | (.06) |
Less distributions from: Net investment income | (.22) | (.51) | (.35) | (.33) | (.33) | (.20) |
Net realized gain on investment transactions | (.55) | (.22) | — | — | — | (.13) |
Total distributions | (.77) | (.73) | (.35) | (.33) | (.33) | (.33) |
Net asset value, end of period | $ 8.73 | $ 9.05 | $ 9.75 | $ 9.52 | $ 9.35 | $ 9.10 |
Total Return (%)c
| 4.97d,e** | .23d | 6.14 | 5.39 | 6.49 | (.53) |
Ratios to Average Net Assets and Supplemental Data |
Net assets, end of period ($ millions)
| 48 | 50 | 59 | 63 | 67 | 69 |
Ratio of expenses before expense reductions (%)
| 1.14* | 1.12 | 1.03 | 1.03 | .96 | .96 |
Ratio of expenses after expense reductions (%)
| 1.13* | 1.11 | 1.03 | 1.03 | .96 | .96 |
Ratio of net investment income (loss) (%)
| 3.71e* | 3.61 | 3.58 | 3.35 | 3.38 | 3.39 |
Portfolio turnover rate (%)
| 27** | 27 | 22 | 7 | 9 | 33 |
a For the six months ended January 31, 2007 (Unaudited).
b Based on average shares outstanding during the period.
c Total return does not reflect the effect of any sales charge.
d Total return would have been lower had certain expenses not been reduced.
e Includes non-recurring income from the Advisor recorded as a result of an administrative proceeding regarding disclosure of brokerage allocation practices in connection with sales of DWS Scudder Funds (see Note F). The non-recurring income resulted in an increase in net investment income of 0.004 per share and an increase in the ratio of net investment income of 0.05%. Excluding this non-recurring income, total return would have been 0.05% lower.
* Annualized
** Not annualized
|
Notes to Financial Statements (Unaudited)
A. Significant Accounting Policies
DWS Target 2010 Fund (the "Fund") is a diversified series of DWS Target Fund (the "Trust"), which is registered under the Investment Company Act of 1940, as amended (the "1940 Act"), as an open-end investment company organized as a Massachusetts business trust. The objective of the Fund is to provide a guaranteed return of investment on the Maturity Date (November 15, 2010) to investors who reinvest all dividends and hold their shares to the Maturity Date, and to provide long-term growth of capital.
The assurance that investors who reinvest all dividends and hold their shares until the Maturity Date will receive at least their original investment on the Maturity Date is provided by the principal amount of the zero coupon US Treasury obligations in the Fund's portfolio. This assurance is further backed by an agreement entered into by Deutsche Investment Management Americas Inc. ("DIMA" or the "Advisor"), an indirect, wholly owned subsidiary of Deutsche Bank AG, the Fund's investment manager. Fund shares were sold during limited offering periods, and are redeemable on a continuous basis. The Fund's returns will fluctuate and there is no assurance that the Fund will achieve its objective of long-term capital growth.
The Fund's financial statements are prepared in accordance with accounting principles generally accepted in the United States of America which require the use of management estimates. Actual results could differ from those estimates. The policies described below are followed consistently by the Fund in the preparation of its financial statements.
Security Valuation. Investments are stated at value determined as of the close of regular trading on the New York Stock Exchange on each day the exchange is open for trading. Equity securities are valued at the most recent sale price or official closing price reported on the exchange (US or foreign) or over-the-counter market on which the security is traded most extensively. Securities for which no sales are reported are valued at the calculated mean between the most recent bid and asked quotations on the relevant market or, if a mean cannot be determined, at the most recent bid quotation.
Debt securities are valued by independent pricing services approved by the Trustees of the Fund. If the pricing services are unable to provide valuations, the securities are valued at the most recent bid quotation or evaluated price, as applicable, obtained from a broker-dealer. Such services may use various pricing techniques which take into account appropriate factors such as yield, quality, coupon rate, maturity, type of issue, trading characteristics and other data, as well as broker quotes.
Money market instruments purchased with an original or remaining maturity of sixty days or less, maturing at par, are valued at amortized cost. Investments in open-end investments companies and Cash Management QP Trust are valued at their net asset value each business day.
Securities and other assets for which market quotations are not readily available or for which the above valuation procedures are deemed not to reflect fair value are valued in a manner that is intended to reflect their fair value as determined in accordance with procedures approved by the Trustees.
In September 2006, the Financial Accounting Standards Board ("FASB") released Statement of Financial Accounting Standards No. 157, "Fair Value Measurements" ("FAS 157"). FAS 157 defines fair value, establishes a framework for measuring fair value and expands disclosures about fair value measurements. FAS 157 is effective for fiscal years beginning after November 15, 2007. As of January 31, 2007, management does not believe the adoption of FAS 157 will impact the amounts reported in the financial statements, however, additional disclosures will be required about the inputs used to develop the measurements of fair value and the effect of certain of the measurements reported in the statement of operations for a fiscal period.
Securities Lending. The Fund may lend securities to financial institutions. The Fund retains beneficial ownership of the securities it has loaned and continues to receive interest and dividends paid by the issuer of securities and to participate in any changes in their market value. The Fund requires the borrowers of the securities to maintain collateral with the Fund consisting of liquid, unencumbered assets having a value at least equal to the value of the securities loaned. The Fund may invest the cash collateral into a joint trading account in an affiliated money market fund pursuant to Exemptive Orders issued by the SEC. The Fund receives compensation for lending its securities either in the form of fees or by earning interest on invested cash collateral net of borrower rebates and fees paid to the lending agent. Either the Fund or the borrower may terminate the loan. The Fund is subject to all investment risks associated with the value of any cash collateral received, including, but not limited to, interest rate, credit and liquidity risk associated with such investments.
Options. An option contract is a contract in which the writer of the option grants the buyer of the option the right to purchase from (call option), or sell to (put option), the writer a designated instrument at a specified price within a specified period of time. Certain options, including options on indices, will require cash settlement by the Fund if the option is exercised. The Fund may enter into option contracts in order to hedge against potential adverse price movements in the value of portfolio assets; as a temporary substitute for selling selected investments; to lock in the purchase price of a security or currency which it expects to purchase in the near future; as a temporary substitute for purchasing selected investments; and to enhance potential gain.
The liability representing the Fund's obligation under an exchange traded written option or investment in a purchased option is valued at the last sale price or, in the absence of a sale, the mean between the closing bid and asked prices or at the most recent asked price (bid for purchased options) if no bid and asked price are available. Over-the-counter written or purchased options are valued using dealer supplied quotations. Gain or loss is recognized when the option contract expires or is closed.
If the Fund writes a covered call option, the Fund foregoes, in exchange for the premium, the opportunity to profit during the option period from an increase in the value of the underlying security above the exercise price. If the Fund writes a put option it accepts the risk of a decline in the value of the underlying security below the exercise price. Over-the-counter options have the risk of the potential inability of counterparties to meet the terms of their contracts. The Fund's maximum exposure to purchased options is limited to the premium initially paid. In addition, certain risks may arise upon entering into option contracts including the risk that an illiquid secondary market will limit the Fund's ability to close out an option contract prior to the expiration date and that a change in the value of the option contract may not correlate exactly with changes in the value of the securities or currencies hedged.
Federal Income Taxes. The Fund's policy is to comply with the requirements of the Internal Revenue Code, as amended, which are applicable to regulated investment companies, and to distribute all of its taxable income to its shareholders. Accordingly, the Fund paid no federal income taxes and no federal income tax provision was required.
In July 2006, FASB issued Interpretation No. 48 ("FIN 48"), "Accounting for Uncertainty in Income Taxes — an interpretation of FASB Statement No. 109" (the "Interpretation"). The Interpretation establishes for the Fund a minimum threshold for financial statement recognition of the benefit of positions taken in filing tax returns (including whether the Fund is taxable in certain jurisdictions), and requires certain expanded tax disclosures. The Interpretation is effective for fiscal years beginning after December 15, 2006. On December 22, 2006, the SEC indicated that they would not object if a Fund implements FIN 48 in the first required financial statement reporting period for its fiscal year beginning after December 15, 2006. Management has begun to evaluate the application of the Interpretation to the Fund and is not in a position at this time to estimate the significance of its impact, if any, on the Fund's financial statements.
Distribution of Income and Gains. Net investment income of the Fund, if any, is declared and distributed to shareholders annually. Net realized gains from investment transactions, in excess of available capital loss carryforwards, would be taxable to the Fund if not distributed, and, therefore, will be distributed to shareholders at least annually.
The timing and characterization of certain income and capital gains distributions are determined annually in accordance with federal tax regulations which may differ from accounting principles generally accepted in the United States of America. These differences primarily relate to certain securities sold at a loss. As a result, net investment income (loss) and net realized gain (loss) on investment transactions for a reporting period may differ significantly from distributions during such period. Accordingly, the Fund may periodically make reclassifications among certain of its capital accounts without impacting the net asset value of the Fund.
The tax character of current year distributions will be determined at the end of the current fiscal year.
Expenses. Expenses of the Trust arising in connection with a specific fund are allocated to that fund. Other Trust expenses which cannot be directly attributed to a fund are apportioned among the funds in the Trust.
Contingencies. In the normal course of business, the Fund may enter into contracts with service providers that contain general indemnification clauses. The Fund's maximum exposure under these arrangements is unknown as this would involve future claims that may be made against the Fund that have not yet been made. However, based on experience, the Fund expects the risk of loss to be remote.
Other. Investment transactions are accounted for on a trade date plus one basis for daily net asset value calculations. However, for financial reporting purposes, investment transactions are reported on trade date. Interest income is recorded on the accrual basis. Dividend income is recorded on the ex-dividend date net of foreign withholding taxes. Realized gains and losses from investment transactions are recorded on an identified cost basis. All premiums and discounts are amortized/accreted for both tax and financial reporting purposes.
B. Purchases and Sales of Securities
During the six months ended January 31, 2007, purchases and sales of investment securities (excluding short-term investments and US Treasury obligations) aggregated $13,154,602 and $14,538,816, respectively. Purchases and sales of US Treasury obligations aggregated $42,089 and $3,253,503, respectively.
For the six months ended January 31, 2007, transactions for written options on securities were as follows:
| Number of Contracts | Premium |
Outstanding, beginning of period
| — | $ — |
Options written
| 59 | 3,396 |
Options exercised
| (44) | (2,711) |
Options closed
| (15) | (685) |
Outstanding, end of period | — | $ — |
C. Related Parties
Management Agreement. Under the Management Agreement, the Advisor directs the investments of the Fund in accordance with its investment objectives, policies and restrictions. The Advisor determines the securities, instruments and other contracts relating to investments to be purchased, sold or entered into by the Fund. In addition to portfolio management services, the Advisor provides certain administrative services in accordance with the Management Agreement. The management fee payable under the Management Agreement is equal to an annual rate of 0.50% of average daily net assets, computed and accrued daily and payable monthly.
Service Provider Fees. DWS Scudder Investments Service Company ("DWS-SISC"), an affiliate of the Advisor, is the Fund's transfer agent, dividend-paying agent and shareholder service agent. Pursuant to a sub-transfer agency agreement between DWS-SISC and DST Systems, Inc. ("DST"), DWS-SISC has delegated certain transfer agent and dividend paying agent functions to DST. DWS-SISC compensates DST out of the shareholder servicing fee it receives from the Fund. For the six months ended January 31, 2007, the amount charged to the Fund by DWS-SISC aggregated $27,817, of which $10,256 is unpaid.
Distribution Service Agreement. Under the Distribution Service Agreement, in accordance with Rule 12b-1 under the 1940 Act, DWS Scudder Distributors, Inc. ("DWS-SDI"), an affiliate of the Advisor, provides information and administrative services for a fee ("Service Fee") to shareholders at an annual rate of up to 0.25% of average daily net assets. DWS-SDI in turn has various agreements with financial services firms that provide these services and pays these fees based upon the assets of shareholder accounts the firms service. For the six months ended January 31, 2007 the Service Fee was $61,733, of which $11,581 is unpaid. Accordingly, for the six months ended January 31, 2007, the Service Fee was equivalent to an annualized effective rate of 0.25% of the Fund's average daily net assets.
Typesetting and Filing Service Fees. Under an agreement with DIMA, DIMA is compensated for providing typesetting and regulatory filing services to the Fund. For the six months ended January 31, 2007, the amount charged to the Fund by DIMA included in the Statement of Operations under "reports to shareholders" aggregated $5,640, all of which is unpaid.
Trustees' Fees and Expenses. The Fund paid each Trustee not affiliated with the Advisor retainer fees plus specific amounts for various committee services and for the Board Chairperson.
Cash Management QP Trust. Pursuant to an Exemptive Order issued by the SEC, the Fund may invest in the Cash Management QP Trust (the "QP Trust") and other affiliated funds managed by the Advisor. The QP Trust seeks to provide as high a level of current income as is consistent with the preservation of capital and the maintenance of liquidity. The QP Trust does not pay the Advisor a management fee for the affiliated funds' investments in the QP Trust.
D. Fee Reductions
For the six months ended January 31, 2007, the Advisor agreed to reimburse the Fund $368, which represents a portion of the fee savings expected to be realized by the Advisor related to the outsourcing by the Advisor of certain administrative services to an unaffiliated service provider.
In addition, the Fund has entered into an arrangement with its custodian and transfer agent whereby credits realized as a result of uninvested cash balances are used to reduce a portion of the Fund's custodian expenses. During the six months ended January 31, 2007, the Fund's custodian fees were reduced by $51 and $1,051, respectively, for custody and transfer agent credits earned.
E. Line of Credit
The Fund and several other affiliated funds (the "Participants") share in a $750 million revolving credit facility administered by JPMorgan Chase Bank N.A. for temporary or emergency purposes, including the meeting of redemption requests that otherwise might require the untimely disposition of securities. The Participants are charged an annual commitment fee which is allocated, based upon net assets, among each of the Participants. Interest is calculated at the Federal Funds Rate plus 0.5 percent. The Fund may borrow up to a maximum of 33 percent of its net assets under the agreement.
F. Regulatory Matters and Litigation
Regulatory Settlements. On December 21, 2006, Deutsche Asset Management ("DeAM") settled proceedings with the Securities and Exchange Commission ("SEC") and the New York Attorney General on behalf of Deutsche Asset Management, Inc. ("DAMI") and Deutsche Investment Management Americas Inc. ("DIMA"), the investment advisors to many of the DWS Scudder funds, regarding allegations of improper trading of fund shares at DeAM and at the legacy Scudder and Kemper organizations prior to their acquisition by DeAM in April 2002. These regulators alleged that although the prospectuses for certain funds in the regulators' view indicated that the funds did not permit market timing, DAMI and DIMA breached their fiduciary duty to those funds in that their efforts to limit trading activity in the funds were not effective at certain times. The regulators also alleged that DAMI and DIMA breached their fiduciary duty to certain funds by entering into certain market timing arrangements with investors. These trading arrangements originated in businesses that existed prior to the currently constituted DeAM organization, which came together as a result of various mergers of the legacy Scudder, Kemper and Deutsche fund groups, and all of the arrangements were terminated prior to the start of the regulatory investigations that began in the summer of 2003. No current DeAM employee approved these trading arrangements. Under the terms of the settlements, DAMI and DIMA neither admitted nor denied any wrongdoing.
The terms of the SEC settlement, which identified improper trading in the legacy Deutsche and Kemper mutual funds only, provide for payment of disgorgement in the amount of $17.2 million. The terms of the settlement with the New York Attorney General provide for payment of disgorgement in the amount of $102.3 million, which is inclusive of the amount payable under the SEC settlement, plus a civil penalty in the amount of $20 million. The total amount payable by DeAM, approximately $122.3 million, would be distributed in accordance with a distribution plan to be developed by a distribution consultant. The funds' investment advisors do not believe these amounts will have a material adverse financial impact on them or materially affect their ability to perform under their investment management agreements with the DWS funds. The above-described amounts are not material to Deutsche Bank, and have already been reserved.
Among the terms of the settled orders, DeAM is subject to certain undertakings regarding the conduct of its business in the future, including: formation of a Code of Ethics Oversight Committee to oversee all matters relating to issues arising under the advisors' Code of Ethics; establishment of an Internal Compliance Controls Committee having overall compliance oversight responsibility of the advisors; engagement of an Independent Compliance Consultant to conduct a comprehensive review of the advisors' supervisory compliance and other policies and procedures designed to prevent and detect breaches of fiduciary duty, breaches of the Code of Ethics and federal securities law violations by the advisors and their employees; and commencing in 2008, the advisors shall undergo a compliance review by an independent third party.
In addition, DeAM is subject to certain further undertakings relating to the governance of the mutual funds, including that: at least 75% of the members of the Boards of Trustees/Directors overseeing the DWS Funds continue to be independent of DeAM; the Chairmen of the DWS Funds' Boards of Trustees/Directors continue to be independent of DeAM; DeAM maintain existing management fee reductions for certain funds for a period of five years and not increase management fees for certain funds during this period; the funds retain a senior officer (or independent consultants) responsible for assisting in the review of fee arrangements and monitoring compliance by the funds and the investment advisors with securities laws, fiduciary duties, codes of ethics and other compliance policies, the expense of which shall be borne by DeAM; and periodic account statements, fund prospectuses and the mutual funds' web site contain additional disclosure and/or tools that assist investors in understanding the fees and costs associated with an investment in the funds and the impact of fees and expenses on fund returns.
DeAM has also settled proceedings with the Illinois Secretary of State regarding market timing matters. The terms of the Illinois settlement provide for investor education contributions totaling approximately $4 million and a payment in the amount of $2 million to the Securities Audit and Enforcement Fund.
On September 28, 2006, the SEC and the National Association of Securities Dealers ("NASD") announced final agreements in which Deutsche Investment Management Americas Inc. ("DIMA"), Deutsche Asset Management, Inc. ("DAMI") and Scudder Distributors, Inc. ("SDI") (now known as DWS Scudder Distributors, Inc.) settled administrative proceedings regarding disclosure of brokerage allocation practices in connection with sales of the Scudder Funds' (now known as the DWS Scudder Funds) shares during 2001-2003. The agreements with the SEC and NASD are reflected in orders which state, among other things, that DIMA and DAMI failed to disclose potential conflicts of interest to the fund Boards and to shareholders relating to SDI's use of certain funds' brokerage commissions to reduce revenue sharing costs to broker-dealer firms with whom it had arrangements to market and distribute Scudder Fund shares. These directed brokerage practices were discontinued in October 2003.
Under the terms of the settlements, in which DIMA, DAMI and SDI neither admitted nor denied any of the regulators' findings, DIMA, DAMI and SDI agreed to pay disgorgement, prejudgment interest and civil penalties in the total amount of $19.3 million. The portion of the settlements distributed to the funds was approximately $17.8 million and was paid to the funds as prescribed by the settlement orders based upon the amount of brokerage commissions from each fund used to satisfy revenue sharing agreements with broker-dealers who sold fund shares. Accordingly, in September 2006, the Fund received $23,587 from the Advisor for its settlement portion, which is equivalent to $0.004 per share.
As part of the settlements, DIMA, DAMI and SDI also agreed to implement certain measures and undertakings relating to revenue sharing payments including making additional disclosures in the fund Prospectuses or Statements of Additional Information, adopting or modifying relevant policies and procedures and providing regular reporting to the fund Boards.
Private Litigation Matters. The matters alleged in the regulatory settlements described above also serve as the general basis of a number of private class action lawsuits involving the DWS funds. These lawsuits name as defendants various persons, including certain DWS funds, the funds' investment advisors and their affiliates, and certain individuals, including in some cases fund Trustees/Directors, officers, and other parties. Each DWS fund's investment advisor has agreed to indemnify the applicable DWS funds in connection with these lawsuits, or other lawsuits or regulatory actions that may be filed making similar allegations.
Based on currently available information, the funds' investment advisors believe the likelihood that the pending lawsuits will have a material adverse financial impact on a DWS fund is remote and such actions are not likely to materially affect their ability to perform under their investment management agreements with the DWS funds.
Investment Management Agreement Approval
The Board of Trustees, including the Independent Trustees, approved the renewal of your Fund's investment management agreement (the "Agreement") with Deutsche Investment Management Americas Inc. ("DIMA" or the "Advisor") in September 2006. As part of its review process, the Board requested and evaluated all information it deemed reasonably necessary to evaluate the Agreement. Over the course of several months, the Contract Review Committee, in coordination with the Equity Oversight Committee and the Operations Committee of the Board, reviewed comprehensive materials received from the Advisor, independent third parties and independent counsel. These materials included an analysis of the Fund's performance, fees and expenses, and profitability compiled by an independent fee consultant. The Board also received extensive information throughout the year regarding performance and operating results of the Fund. Based on their evaluation of the information provided, the Committees presented their findings and recommendations to the Independent Trustees as a group. The Independent Trustees then reviewed the Committees' findings and recommendations and presented their recommendations to the full Board. Throughout their consideration of the Agreement, the Independent Trustees were advised by their independent legal counsel and by an independent fee consultant.
In connection with the contract review process, the various Committees and the Board considered the factors discussed below, among others. The Board also considered that the Advisor and its predecessors have managed the Fund since its inception, and the Board believes that a long-term relationship with a capable, conscientious advisor is in the best interests of the Fund. The Board considered, generally, that shareholders invested in the Fund, or approved the investment management agreement for the Fund, knowing that the Advisor managed the Fund and knowing the investment management fee schedule. In connection with recent and ongoing efforts by Deutsche Bank to restructure its US mutual fund business, which resulted in turnover of senior management and other personnel of the Advisor, the Board considered Deutsche Bank's commitment that it will devote to the Advisor and its affiliates all attention and resources that are necessary to provide the Fund with top-quality investment management and shareholder, administrative and product distribution services.
Nature, Quality and Extent of Services. The Board considered the nature, extent and quality of services provided under the Agreement, including portfolio management services and administrative services. The Board considered the experience and skills of senior management and investment personnel, the resources made available to such personnel, the ability of the Advisor to attract and retain high-quality personnel, the impact of recent changes in investment personnel, and the organizational depth and stability of the Advisor. The Board reviewed the Fund's performance over short-term and long-term periods, and compared those returns to various agreed-upon performance measures, including market indices and a peer universe compiled by Lipper Inc. ("Lipper"). The Board considered whether investment results were consistent with the Fund's investment objectives and policies. The Board also noted that it has put a process into place of identifying "Focus Funds" (e.g., funds performing poorly relative to their peer group), and receives more frequent reporting and information from the Advisor regarding such funds, along with the Advisor's remedial plans to address underperformance. The Board believes this process is an effective manner of addressing poorly performing funds at this time.
On the basis of this evaluation and the ongoing review of investment results by the Equity Oversight Committee, the Board concluded that the nature, quality and extent of services provided by the Advisor historically have been and continue to be satisfactory, and that the Fund's performance over time was satisfactory.
Fees and Expenses. The Board considered the Fund's management fee rate, operating expenses and total expense ratio, and compared management fees to a peer group and total expenses to a broader peer universe based on information and data supplied by Lipper. The information provided to the Board showed that the Fund's management fee rate was at the 1st percentile of the peer group, and that the total expense ratio (excluding any 12b-1 plans) was at the 1st percentile of the peer universe. The Board also considered the Fund's management fee rate as compared to fees charged by the Advisor and certain of its affiliates for comparable mutual funds.
On the basis of the information provided, the Board concluded that management fees were reasonable and appropriate in light of the nature, quality and extent of services provided by the Advisor.
Profitability. The Board reviewed detailed information regarding revenues received by the Advisor under the Agreement. The Board considered the estimated costs and pre-tax profits realized by the Advisor from advising the DWS Funds, as well as estimates of the pre-tax profits attributable to managing the Fund in particular. The Board also received information regarding the estimated enterprise-wide profitability of the DWS Scudder organization with respect to all fund services in totality and by fund. The Board reviewed DIMA's methodology in allocating its costs to the management of the Fund. Although the Board noted the inherently subjective nature of any allocation methodology, the Board received an attestation report from an accounting firm affirming that the allocation methods were consistently applied and were based upon practices commonly used in the investment management industry. The Board noted that, based on the information provided, the Advisor operated the Fund at a loss.
Economies of Scale. The Board considered whether there are economies of scale with respect to the management of the Fund and whether the Fund benefits from any economies of scale. The Board considered whether the management fee rate under the Agreement is reasonable in relation to the asset size of the Fund. The Board concluded that the management fee rate reflects an appropriate level of sharing of any economies of scale.
Other Benefits to DIMA and Its Affiliates. The Board also considered the character and amount of other incidental benefits received by DIMA and its affiliates, including any fees received by the Advisor for administrative services provided to the Fund and any fees received by an affiliate of the Advisor for distribution services. The Board also considered benefits to DIMA related to brokerage and soft-dollar allocations, which pertain primarily to funds investing in equity securities. The Board considered that the Advisor has recently proposed and the Board is evaluating a change in the Advisor's policies to permit the allocation of brokerage to acquire research services from third-party service providers. The Advisor had voluntarily discontinued this practice in 2004. The Board concluded that management fees were reasonable in light of these fallout benefits.
Regulatory Matters. The Board also considered information regarding pending regulatory actions against the Advisor and its affiliates related to allegations of market timing, revenue sharing, directed brokerage and other matters. The Board considered that the Advisor informed the Board that it expects to pay approximately $134 million in connection with final settlement agreements with various federal and state regulators regarding allegations of market timing in the DWS Funds. The Board also considered that the Advisor agreed to pay approximately $19 million in connection with a final settlement agreement with the Securities and Exchange Commission regarding allegations of directed brokerage. The Board considered the Advisor's representation that such regulatory actions will not materially impact its ability to perform under the Agreement or materially impact the Fund and that no current DeAM employee approved the trading arrangements. The Board also noted the private lawsuits brought against the DWS Funds in connection with the above allegations and considered the Advisor's commitment to indemnify the DWS Funds against any liability arising from these lawsuits.
Based on all of the information considered and the conclusions reached, the Board (including a majority of the Independent Trustees) determined that the terms of the Agreement continue to be fair and reasonable and that the continuation of the Agreement is in the best interests of the Fund. No single factor was determinative in the Board's analysis.
Account Management Resources
|
Automated Information Lines | (800) 621-1048 Personalized account information, information on other DWS funds and services via touchtone telephone, and the ability to exchange or redeem shares.
|
Web Site | www.dws-scudder.com View your account transactions and balances, trade shares, monitor your asset allocation, and change your address, 24 hours a day.
Obtain prospectuses and applications, blank forms, interactive worksheets, news about DWS funds, subscription to fund updates by e-mail, retirement planning information, and more.
|
For More Information | (800) 621-1048 To speak with a DWS Scudder service representative.
|
Written Correspondence | DWS Scudder PO Box 219151
Kansas City, MO 64121-9151
|
Proxy Voting | A description of the fund's policies and procedures for voting proxies for portfolio securities and information about how the fund voted proxies related to its portfolio securities during the 12-month period ended June 30 is available on our Web site — www.dws-scudder.com (click on "proxy voting"at the bottom of the page) — or on the SEC's Web site — www.sec.gov. To obtain a written copy of the fund's policies and procedures without charge, upon request, call us toll free at (800) 621-1048.
|
Principal Underwriter | If you have questions, comments or complaints, contact:
DWS Scudder Distributors, Inc. 222 South Riverside Plaza
Chicago, IL 60606-5808
(800) 621-1148
|
Nasdaq Symbol | KRFAX
|
CUSIP Number | 23337N 303
|
Fund Number | 50
|
Privacy Statement
This privacy statement is issued by DWS Scudder Distributors, Inc., Deutsche Investment Management Americas Inc., Investment Company Capital Corporation, DeAM Investor Services, Inc., DWS Trust Company and the DWS Funds.
We never sell customer lists or individual client information. We consider privacy fundamental to our client relationships and adhere to the policies and practices described below to protect current and former clients' information. Internal policies are in place to protect confidentiality, while allowing client needs to be served. Only individuals who need to do so in carrying out their job responsibilities may access client information. We maintain physical, electronic and procedural safeguards that comply with federal and state standards to protect confidentiality. These safeguards extend to all forms of interaction with us, including the Internet.
In the normal course of business, clients give us nonpublic personal information on applications and other forms, on our websites, and through transactions with us or our affiliates. Examples of the nonpublic personal information collected are name, address, Social Security number and transaction and balance information. To be able to serve our clients, certain of this client information is shared with affiliated and nonaffiliated third party service providers such as transfer agents, custodians, and broker-dealers to assist us in processing transactions and servicing your account with us. In addition, we may disclose all of the information we collect to companies that perform marketing services on our behalf or to other financial institutions with which we have joint marketing agreements. The organizations described above that receive client information may only use it for the purpose designated by the DWS Scudder Companies listed above.
We may also disclose nonpublic personal information about you to other parties as required or permitted by law. For example, we are required or we may provide information to government entities or regulatory bodies in response to requests for information or subpoenas, to private litigants in certain circumstances, to law enforcement authorities, or any time we believe it necessary to protect the firm.
Questions on this policy may be sent to:
DWS Scudder
Attention: Correspondence — Chicago
P.O. Box 219415
Kansas City, MO 64121-9415
September 2006
Notes
Notes
Notes
Notes

ITEM 2. | CODE OF ETHICS |
| |
| Not applicable. |
| |
ITEM 3. | AUDIT COMMITTEE FINANCIAL EXPERT |
| |
| Not applicable. |
| |
ITEM 4. | PRINCIPAL ACCOUNTANT FEES AND SERVICES |
| |
| Not applicable. |
ITEM 5. | AUDIT COMMITTEE OF LISTED REGISTRANTS |
| |
| Not Applicable |
| |
ITEM 6. | SCHEDULE OF INVESTMENTS |
| |
| Not Applicable |
| |
ITEM 7. | DISCLOSURE OF PROXY VOTING POLICIES AND PROCEDURES FOR CLOSED-END MANAGEMENT INVESTMENT COMPANIES |
| |
| Not applicable. |
| |
ITEM 8. | PORTFOLIO MANAGERS OF CLOSED-END MANAGEMENT INVESTMENT COMPANIES |
| |
| Not applicable. |
ITEM 9. | PURCHASES OF EQUITY SECURITIES BY CLOSED-END MANAGEMENT INVESTMENT COMPANY AND AFFILIATED PURCHASERS |
| |
| Not Applicable. |
ITEM 10. | SUBMISSION OF MATTERS TO A VOTE OF SECURITY HOLDERS |
| |
| The primary function of the Nominating and Governance Committee is to identify and recommend individuals for membership on the Board and oversee the administration of the Board Governance Procedures and Guidelines. Shareholders may recommend candidates for Board positions by forwarding their correspondence by U.S. mail or courier service to the Fund's Secretary for the attention of the Chairman of the Nominating and Governance Committee, Two International Place, Boston, MA 02110. Suggestions for candidates must include a resume of the candidate. |
| |
ITEM 11. | CONTROLS AND PROCEDURES |
| |
| (a) The Chief Executive and Financial Officers concluded that the Registrant's Disclosure Controls and Procedures are effective based on the evaluation of the Disclosure Controls and Procedures as of a date within 90 days of the filing date of this report. |
| |
| (b) There have been no changes in the registrant's internal control over financial reporting that occurred during the registrant's last half-year (the registrant's second fiscal half-year in the case of the annual report) that has materially affected, or is reasonably likely to materially affect, the registrant's internal controls over financial reporting. |
| |
ITEM 12. | EXHIBITS |
| |
| (a)(1) Certification pursuant to Rule 30a-2(a) under the Investment Company Act of 1940 (17 CFR 270.30a-2(a)) is filed and attached hereto as Exhibit 99.CERT. |
| |
| (b) Certification pursuant to Rule 30a-2(b) under the Investment Company Act of 1940 (17 CFR 270.30a-2(b)) is furnished and attached hereto as Exhibit 99.906CERT. |
Form N-CSRS Item F
SIGNATURES
Pursuant to the requirements of the Securities Exchange Act of 1934 and the Investment Company Act of 1940, the registrant has duly caused this report to be signed on its behalf by the undersigned, thereunto duly authorized.
Registrant: | DWS Target 2010 Fund, a series of DWS Target Fund |
President
Pursuant to the requirements of the Securities Exchange Act of 1934 and the Investment Company Act of 1940, this report has been signed below by the following persons on behalf of the registrant and in the capacities and on the dates indicated.
Registrant: | DWS Target 2010 Fund, a series of DWS Target Fund |
President
Chief Financial Officer and Treasurer
