UNITED STATES
SECURITIES AND EXCHANGE COMMISSION
Washington, D.C. 20549
FORM N-CSR
CERTIFIED SHAREHOLDER REPORT OF REGISTERED
MANAGEMENT INVESTMENT COMPANIES
Investment Company Act File Number: 811-05876
LORD ABBETT SERIES FUND, INC.
(Exact name of Registrant as specified in charter)
90 Hudson Street, Jersey City, New Jersey 07302-3973
(Address of principal executive offices) (Zip code)
Lawrence B. Stoller, Esq.
Vice President, Secretary, and Chief Legal Officer
90 Hudson Street, Jersey City, New Jersey 07302-3973
(Name and address of agent for service)
Registrant’s telephone number, including area code: (888) 522-2388
Date of fiscal year end: 12/31
Date of reporting period: 12/31/2022
| Item 1: | Report(s) to Shareholders. |

LORD ABBETT
ANNUAL REPORT
Lord Abbett
Series Fund—Bond Debenture Portfolio
For the fiscal year ended December 31, 2022
Table of Contents
Lord Abbett Series Fund — Bond Debenture Portfolio
Annual Report
For the fiscal year ended December 31, 2022
 From left to right: James L.L. Tullis, Independent Chair of the Lord Abbett Funds and Douglas B. Sieg, Director, President, and Chief Executive Officer of the Lord Abbett Funds. | | Dear Shareholders: We are pleased to provide you with this overview of the performance of Lord Abbett Series Fund – Bond Debenture Portfolio for the fiscal year ended December 31, 2022. On this page and the following pages, we discuss the major factors that influenced fiscal year performance. For detailed and timely information about the Fund, please visit our website at www.lordabbett.com, where you can also access the quarterly commentaries that provide updates on the Fund’s performance and other portfolio related updates. Thank you for investing in Lord Abbett mutual funds. We value the trust that you place in us and look forward to serving your investment needs in the years to come. Best regards, 
Douglas B. Sieg Director, President and Chief Executive Officer |
For the fiscal year ended December 31, 2022, the Fund returned -12.80%, reflecting performance at the net asset value (NAV) of Class VC shares with all distributions reinvested, compared to its benchmark, the Bloomberg U.S. Aggregate Bond Index,1 which returned -13.01% over the same period.
The twelve-month period ending December 31, 2022 introduced meaningful headwinds for U.S. markets that led to selloffs in virtually all asset classes. The major risks over the period were inflationary pressures, which reached multi-decade highs, and the most rapid pace of interest rate hikes implemented in history by the U.S. Federal Reserve (Fed). Rates spiked across
the U.S. yield curve as a result, with U.S. Treasury yields at almost all maturities reaching their highest levels in years. Other notable challenges for markets included supply chain dislocations and labor shortages influenced in part by the Omicron variant of COVID-19, as well as escalating geopolitical tensions headlined by Russia’s invasion of Ukraine.
The surge in interest rates over the year caused softness in both major fixed income and equity indices. Equities fared the worst amid the sell-off, with the S&P 500 Index2 returning -18.11% over the period and experiencing its worst year since the Global Financial Crisis (GFC) of 2008. The tech-heavy NASDAQ3 also logged its worst year since
1
2008, declining -32.54% over the period as growth-related stocks in semiconductor and software sectors suffered in the face of inflationary pressures. Within fixed income, higher rates caused underperformance in longer duration bonds. These included U.S. Treasuries4 and investment grade bonds5 which returned -12.46% and -15.76% over the period, respectively. However, high yield bond6 and leveraged loan7 indexes outperformed the investment grade index for the period because of their lower duration profiles. Notably, high yield bonds and leveraged loans returned -11.21% and -1.06%, respectively, outperforming higher quality bonds despite recessionary fears in the U.S. economy contributing to wider spreads. Leveraged loans in particular were able to significantly outperform relative to other assets given their insulation from interest rate volatility due to their floating-rate coupons.
Inflationary concerns began to take focus towards the end of 2021 before becoming a dominant storyline in 2022. Headline consumer price index (CPI) readings had hovered a little above 5% year-over-year for most of 2021, which led investors to question whether this period of rising prices would be more persistent than originally thought. This debate intensified in the beginning of the year as inflation readings continued as climb throughout the first half of 2022, with CPI peaking at 9.1% year-over-year in June. The surge in prices was due primarily to an imbalance between supply and demand dynamics across multiple industries, including energy, food, and used cars.
Inflationary pressures throughout the period were most evident in energy costs, which rose more than 30% year-over-year
by the end of June. The energy sector, which had been subject to rising consumer demand as global economies reopened from lockdowns induced by COVID-19, faced added friction with Russia’s invasion of Ukraine as Russia had been a large exporter of oil and certain minerals. Various sanctions were instilled on Russia from Western nations in response to their aggression towards Ukraine, which contributed to surging prices. Crude oil specifically reached over $100 per barrel, the highest value since 2014.
The Fed pivoted towards a much more hawkish stance on monetary policy during the period given the surge in inflation. After remaining mostly consistent in its messaging around expectations that price pressures would be transitory, elevated and more persistent inflation pressures caused the Fed to move the target federal funds rate into more restrictive territory. This resulted in a 25-basis point (bps) hike in the federal funds rate at the March Federal Open Market Committee (FOMC) meeting, the first hike in more than three years. Six additional rate hikes followed in the succeeding months, one of 50 bps, and four consecutive hikes of 75 bps and an additional one of 50 bps as inflation prints continued to come mostly in hotter than expected, resulting in a federal funds rate at a range of 4.25%-4.50% by the end of 2022. Bond yields shot up amid this aggressive policy, leading to a bearish curve flattening and ultimately periods of significant yield curve inversion, with the spread between the 2-year and 10-year Treasury yields hitting its most negative level in more than 40 years.
Key macroeconomic indicators trended lower throughout the period. Most notably, the U.S. reported real GDP decline of -1.6%
2
in the first quarter of 2022 and -0.9% in the second quarter before returning to growth in the third quarter. Worries of an impending recession resulted in consumer sentiment dropping to levels worse than during the height of the COVID-19 pandemic and the GFC of 2008, according to the U.S. Consumer Confidence Index.
Despite rising recessionary signs, select bright spots in the U.S. economy supported the idea that a potential recession would be shallow. One of the most positive developments seemed to be the traction behind the peak inflation narrative, which gained momentum in the fourth quarter from lower-than-expected CPI prints in both October and November. In addition, energy prices retracted from their multi-year highs, rent prices began to stabilize, and wage growth showed signs of softening. Job growth also remained strong in the period, and the U.S. national unemployment rate continued to hover around pre-COVID lows. Companies also cited relatively stable demand in both second and third quarter earnings seasons as consumers remained resilient despite higher prices. Separately, labor shortages eased, and supply chain frictions moderated, providing added benefits for companies managing generally higher input costs.
The Fund takes a flexible, multi-sector approach, which emphasizes credit sensitive sectors of the market, compared to its benchmark, which is largely comprised of U.S. Treasuries and government-related securities. Notably, the Fund’s allocation to lower rated, but shorter duration securities ultimately contributed to relative performance as government securities, which have lower
carry and longer duration profiles, underperformed. The Fund’s sub-investment grade allocation was primarily comprised of U.S. high yield corporate bonds, which outperformed the index. Many of these investments were within the Energy and Basic Industry sectors, which were broadly supported by a positive relationship to resilient commodity prices, leading to better returns relative to other sectors such as Media and Telecommunications. The Fund also had a modest allocation to bank loans that provided a boost to relative performance. Specifically, loans were one of the strongest performing asset classes for the period, as loan returns were more insulated from interest rate volatility given their floating rate nature. Separately, strong security selection within structured products, including collateralized loan obligations (CLOs) and commercial mortgage-backed securities (CMBS) was a positive contributor to relative performance. In addition to being higher rated investments with more muted spread widening, many of these securities are also floating rate instruments and exhibited similar protection against rising interest rates as bank loans throughout the year.
Several allocations detracted from relative performance over the period, one of which was U.S. equities. Stocks came under pressure throughout the year, underperforming bonds amid rising interest rates and heightened inflationary pressures. Strikingly, this was the worst performance for U.S. equity markets since the Global Financial Crisis of 2008. The Fund’s equity exposure was significantly lowered over the period in consideration of these headwinds and finished the year
3
close to historic lows of the Fund’s allocation. The Fund’s relative performance was also affected by modest exposure to Emerging Market (EM) bonds. EM bonds underperformed U.S. high yield bonds due to a combination of factors, including sensitivity to interest rate hikes from global central banks, as well as an appreciating
U.S. dollar that can pressure EM issuers with dollar-denominated liabilities.
The Fund’s portfolio is actively managed and, therefore, its holdings and the weightings of a particular issuer or particular sector as a percentage of portfolio assets are subject to change. Sectors may include many industries.
1 The Bloomberg U.S. Aggregate Bond Index is an index of U.S dollar-denominated, investment-grade U.S. government and corporate securities, and mortgage pass-through securities, and asset-backed securities.
2 The S&P 500® Index is widely regarded as the standard for measuring large cap U.S. stock market performance and includes a representative sample of leading companies in leading industries.
3 The Nasdaq Composite Index is the market capitalization-weighted index of over 2,500 common equities listed on the Nasdaq stock exchange.
4 As represented by the U.S. Treasury component of the Bloomberg U.S. Government Index as of 12/31/2022.
5 As represented by the Bloomberg US Corp Investment Grade Index as of 12/31/2022.
6 As represented by the ICE BofA U.S. High Yield Constrained Index as of 12/31/2022.
7 As represented by the Credit Suisse Leveraged Loan Index as of 12/31/2022.
Unless otherwise specified, indexes reflect total return, with all dividends reinvested. Indexes are unmanaged, do not reflect the deduction of fees or expenses, and are not available for direct investment.
Important Performance and Other Information
Performance data quoted in the following pages reflect past performance and are no guarantee of future results. Current performance may be higher or lower than the performance quoted. The investment return and principal value of an investment in the Fund will fluctuate so that shares, on any given day or when redeemed, may
be worth more or less than their original cost. You can obtain performance data current to the most recent month end by calling Lord Abbett at 888-522-2388 or referring to www.lordabbett.com.
During certain periods shown, expense waivers and reimbursements were in place. Without such expense waivers and reimbursements, the Fund’s returns would have been lower.
The annual commentary above discusses the views of the Fund’s management and various portfolio holdings of the Fund as of December 31, 2022. These views and portfolio holdings may have changed after this date. Information provided in the commentary is not a recommendation to buy or sell securities. Because the Fund’s portfolio is actively managed and may change significantly, the Fund may no longer own the securities described above or may have otherwise changed its position in the securities. For more recent information about the Fund’s portfolio holdings, please visit www.lordabbett.com.
A Note about Risk: See Notes to Financial Statements for a discussion of investment risks. For a more detailed discussion of the risks associated with the Fund, please see the Fund’s prospectus.
Mutual funds are not insured by the FDIC, are not deposits or other obligations of, or guaranteed by, banks, and are subject to investment risks including possible loss of principal amount invested.
The Fund serves as an underlying investment vehicle for variable annuity contracts and variable life insurance policies.
4
Investment Comparison
Below is a comparison of a $10,000 investment in Class VC shares with the same investment in the Bloomberg U.S. Aggregate Bond Index and the ICE BofA U.S. High Yield Constrained Index, assuming reinvestment of all dividends and distributions. The Fund’s shares are sold only to insurance company separate accounts that fund certain variable annuity and variable life contracts. This line graph comparison does not reflect the sales charges or other expenses of these contracts. If those sales charges and expenses were reflected, returns would be lower. The graph and performance table below do not reflect the deduction of taxes that a shareholder would pay on Fund distributions or the redemption of Fund shares. During certain periods, expenses of the Fund have been waived or reimbursed by Lord Abbett; without such waiver or reimbursement of expenses, the Fund’s returns would have been lower. Past performance is no guarantee of future results.
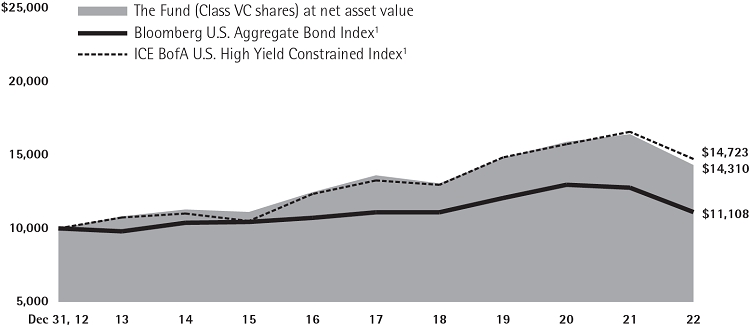
Average Annual Total Returns for the
Periods Ended December 31, 2022
| | | 1 Year | | 5 Years | | 10 Years | |
| Class VC | | | –12.80% | | | 1.01% | | | 3.65% | |
1 Performance for each unmanaged index does not reflect any fees or expenses. The performance of each index is not necessarily representative of the Fund’s performance.
5
Expense Example
As a shareholder of the Fund, you incur ongoing costs, including management fees; expenses related to the Fund’s services arrangements with certain insurance companies; and other Fund expenses. This Example is intended to help you understand your ongoing costs (in dollars) of investing in the Fund and to compare these costs with the ongoing costs of investing in other mutual funds.
The Example is based on an investment of $1,000 invested at the beginning of the period and held for the entire period (July 1, 2022 through December 31, 2022).
The Example reflects only expenses that are deducted from the assets of the Fund. Fees and expenses, including sales charges applicable to the various insurance products that invest in the Fund, are not reflected in this Example. If such fees and expenses were reflected in the Example, the total expenses shown would be higher. Fees and expenses regarding such variable insurance products are separately described in the prospectus related to those products.
Actual Expenses
The first line of the table on the following page provides information about actual account values and actual expenses. You may use the information in this line, together with the amount you invested, to estimate the expenses that you paid over the period. Simply divide your account value by $1,000 (for example, an $8,600 account value divided by $1,000 = 8.6), then multiply the result by the number in the first line under the heading titled “Expenses Paid During Period 7/1/22 – 12/31/22” to estimate the expenses you paid on your account during this period.
Hypothetical Example for Comparison Purposes
The second line of the table on the following page provides information about hypothetical account values and hypothetical expenses based on the Fund’s actual expense ratio and an assumed rate of return of 5% per year before expenses, which is not the Fund’s actual return. The hypothetical account values and expenses may not be used to estimate the actual ending account balance or expenses you paid for the period. You may use this information to compare the ongoing costs of investing in the Fund and other funds. To do so, compare this 5% hypothetical example with the 5% hypothetical examples that appear in the shareholder reports of the other funds.
6
Please note that the expenses shown in the table are meant to highlight your ongoing costs only and do not reflect any transactional costs, such as sales charges. Therefore, the second line of the table is useful in comparing ongoing costs only, and will not help you determine the relative total costs of owning different funds. In addition, if these transactional costs were included, your costs would have been higher.
| | | Beginning
Account
Value | | Ending
Account
Value | | Expenses
Paid During
Period† | |
| | | 7/1/22 | | 12/31/22 | | 7/1/22 -
12/31/22 | |
| Class VC | | | | | | | |
| Actual | | $1,000.00 | | $1,007.10 | | $4.50 | |
| Hypothetical (5% Return Before Expenses) | | $1,000.00 | | $1,020.72 | | $4.53 | |
| | |
| † | Net expenses are equal to the Fund’s annualized expense ratio of 0.89%, multiplied by the average account value over the period, multiplied by 184/365 (to reflect one-half year period). |
Portfolio Holdings Presented by Sector
December 31, 2022
| Sector* | %** |
| Asset Backed Securities | 5.28 | % |
| Basic Materials | 4.20 | % |
| Communications | 7.13 | % |
| Consumer, Cyclical | 10.10 | % |
| Consumer, Non-cyclical | 12.25 | % |
| Energy | 16.32 | % |
| Financials | 8.99 | % |
| Foreign Government | 2.71 | % |
| Industrial | 5.05 | % |
| Mortgage-Backed Securities | 3.63 | % |
| Municipal | 2.62 | % |
| Technology | 4.32 | % |
| U.S. Government | 8.24 | % |
| Utilities | 6.31 | % |
| Time Deposits(a) | 0.01 | % |
| Money Market Funds(a) | 0.09 | % |
| Repurchase Agreements | 2.75 | % |
| Total | 100.00 | % |
| | | |
| * | | A sector may comprise several industries. |
| ** | | Represents percent of total investments, which excludes derivatives. |
| (a) | | Securities were purchased with the cash collateral from loaned securities. |
7
Schedule of Investments
December 31, 2022
| Investments | | Interest
Rate | | Maturity
Date | | Principal
Amount | | | Fair
Value | |
| LONG-TERM INVESTMENTS 100.79% | | | | | | | | | | | | |
| | | | | | | | | | | | | |
| ASSET-BACKED SECURITIES 5.47% | | | | | | | | | | | | |
| | | | | | | | | | | | | |
| Automobiles 0.95% | | | | | | | | | | | | |
| Carvana Auto Receivables Trust NP1 2020-N1A E† | | 5.20% | | 7/15/2027 | | $ | 1,250,000 | | | $ | 1,152,529 | |
| Drive Auto Receivables Trust 2021-3 A3 | | 0.79% | | 10/15/2025 | | | 1,410,350 | | | | 1,400,482 | |
| Mercedes-Benz Auto Receivables Trust 2022-1 A3 | | 5.21% | | 8/16/2027 | | | 3,815,000 | | | | 3,850,608 | |
| Santander Drive Auto Receivables Trust 2022-3 B | | 4.13% | | 8/16/2027 | | | 1,120,000 | | | | 1,093,414 | |
| Westlake Automobile Receivables Trust 2021-1A F† | | 3.91% | | 9/15/2027 | | | 3,118,000 | | | | 2,823,096 | |
| Total | | | | | | | | | | | 10,320,129 | |
| | | | | | | | | | | | | |
| Credit Card 0.97% | | | | | | | | | | | | |
| American Express Credit Account Master Trust 2021-1 A | | 0.90% | | 11/15/2026 | | | 3,677,000 | | | | 3,414,045 | |
| American Express Credit Account Master Trust 2022-2 A | | 3.39% | | 5/15/2027 | | | 1,604,000 | | | | 1,558,152 | |
| American Express Credit Account Master Trust 2022-3 A | | 3.75% | | 8/15/2027 | | | 1,207,000 | | | | 1,180,907 | |
| Capital One Multi-Asset Execution Trust 2022-A2 A | | 3.49% | | 5/15/2027 | | | 865,000 | | | | 841,833 | |
| Genesis Sales Finance Master Trust 2021-AA A† | | 1.20% | | 12/21/2026 | | | 1,298,000 | | | | 1,216,239 | |
| Perimeter Master Note Business Trust 2019-2A A† | | 4.23% | | 5/15/2024 | | | 2,330,255 | | | | 2,306,118 | |
| Total | | | | | | | | | | | 10,517,294 | |
| | | | | | | | | | | | | |
| Other 3.55% | | | | | | | | | | | | |
| AMMC CLO Ltd. 2021-24A C† | | 6.443%
(3 Mo. LIBOR + 2.20% | )# | 1/20/2035 | | | 820,000 | | | | 768,799 | |
| Arbor Realty Commercial Real Estate Notes Ltd. 2022-FL2 A† | | 6.186%
(1 Mo. Term SOFR + 1.85% | )# | 5/15/2037 | | | 1,410,000 | | | | 1,375,483 | |
| Avant Loans Funding Trust 2021-REV1 A† | | 1.21% | | 7/15/2030 | | | 1,367,000 | | | | 1,302,621 | |
| Ballyrock CLO Ltd. 2019-1A A1R† | | 5.109%
(3 Mo. LIBOR + 1.03% | )# | 7/15/2032 | | | 450,000 | | | | 440,769 | |
| Benefit Street Partners CLO XIX Ltd. 2019-19A B† | | 6.079%
(3 Mo. LIBOR + 2.00% | )# | 1/15/2033 | | | 578,133 | | | | 561,808 | |
| Dryden Senior Loan Fund 2022-113A A1† | | 6.518%
(3 Mo. Term SOFR + 2.00% | )# | 10/20/2035 | | | 1,200,000 | | | | 1,198,283 | |
| Elmwood CLO Ltd. 2022-8A A1† | | 6.816% | | 11/20/2035 | | | 2,000,000 | | | | 1,994,968 | |
| Flatiron CLO 18 Ltd. 2018-1A A† | | 5.075%
(3 Mo. Term SOFR + 2.00% | )# | 4/17/2031 | | | 2,500,000 | | | | 2,465,985 | |
| Greywolf CLO III Ltd. 2020-3RA A1R† | | 5.588%
(3 Mo. Term SOFR + 1.55% | )# | 4/15/2033 | | | 1,398,603 | | | | 1,378,688 | |
| 8 | See Notes to Financial Statements. |
Schedule of Investments (continued)
December 31, 2022
| Investments | | Interest
Rate | | Maturity
Date | | Principal
Amount | | | Fair
Value | |
| Other (continued) | | | | | | | | | | | | |
| Halcyon Loan Advisors Funding Ltd. 2015-2A CR† | | 6.508%
(3 Mo. LIBOR + 2.15% | )# | 7/25/2027 | | $ | 465,000 | | | $ | 459,076 | |
| Halcyon Loan Advisors Funding Ltd. 2017-2A A2† | | 5.779%
(3 Mo. LIBOR + 1.70% | )# | 1/17/2030 | | | 679,855 | | | | 666,603 | |
| Hardee’s Funding LLC 2018-1A A2II† | | 4.959% | | 6/20/2048 | | | 567,998 | | | | 535,312 | |
| Madison Park Funding XIII Ltd. 2014-13A AR2† | | 5.177%
(3 Mo. LIBOR + .95% | )# | 4/19/2030 | | | 773,869 | | | | 765,769 | |
| Marble Point CLO XVII Ltd. 2020-1A A† | | 5.543%
(3 Mo. LIBOR + 1.30% | )# | 4/20/2033 | | | 2,050,466 | | | | 2,014,583 | |
| Marble Point CLO XVII Ltd. 2020-1A B† | | 6.013%
(3 Mo. LIBOR + 1.77% | )# | 4/20/2033 | | | 651,646 | | | | 625,438 | |
| MF1 LLC 2022-FL9 A† | | 6.471%
(1 Mo. Term SOFR + 2.15% | )# | 6/19/2037 | | | 2,620,000 | | | | 2,597,487 | |
| Neuberger Berman Loan Advisers CLO Ltd. 2020-37A AR† | | 5.213%
(3 Mo. LIBOR + .97% | )# | 7/20/2031 | | | 670,000 | | | | 656,666 | |
| Oaktree CLO Ltd. 2019-4 BR† | | 5.943%
(3 Mo. LIBOR + 1.70% | )# | 10/20/2032 | | | 1,460,000 | | | | 1,404,798 | |
| OCP CLO Ltd. 2016-12A AR2† | | 5.199%
(3 Mo. Term SOFR + 1.27% | )# | 4/18/2033 | | | 2,400,000 | | | | 2,330,090 | |
| OCP CLO Ltd. 2021-21A C† | | 6.143%
(3 Mo. LIBOR + 1.90% | )# | 7/20/2034 | | | 620,000 | | | | 568,507 | |
| OCP CLO Ltd. 2021-22A B1† | | 5.943%
(3 Mo. LIBOR + 1.70% | )# | 12/2/2034 | | | 1,860,000 | | | | 1,782,470 | |
| OneMain Financial Issuance Trust 2020-2A A† | | 1.75% | | 9/14/2035 | | | 1,300,000 | | | | 1,137,659 | |
| Palmer Square CLO Ltd. 2022-5A A† | | 5.658%
(3 Mo. Term SOFR + 2.00% | )# | 10/20/2035 | | | 1,414,000 | | | | 1,414,595 | |
| PFS Financing Corp. 2022-C A† | | 3.89% | | 5/15/2027 | | | 3,432,000 | | | | 3,289,230 | |
| Rad CLO Ltd. 2020-7A A1† | | 5.279%
(3 Mo. LIBOR + 1.20% | )# | 4/17/2033 | | | 316,336 | | | | 310,116 | |
| Regata XII Funding Ltd. 2019-1A CR† | | 6.079%
(3 Mo. LIBOR + 2.00% | )# | 10/15/2032 | | | 560,000 | | | | 525,402 | |
| Regatta XVIII Funding Ltd. 2021-1A B† | | 5.529%
(3 Mo. LIBOR + 1.45% | )# | 1/15/2034 | | | 1,060,000 | | | | 1,007,972 | |
| SEB Funding LLC 2021-1A A2† | | 4.969% | | 1/30/2052 | | | 1,858,343 | | | | 1,578,198 | |
| Signal Peak CLO Ltd. 2021-10A B† | | 6.075%
(3 Mo. LIBOR + 1.75% | )# | 1/24/2035 | | | 1,180,000 | | | | 1,117,910 | |
| Sunrun Demeter Issuer 2021-2A A† | | 2.27% | | 1/30/2057 | | | 1,377,758 | | | | 1,078,085 | |
| Voya CLO Ltd. 2022-3A A1† | | 6.012%
(3 Mo. Term SOFR + 2.00% | )# | 10/20/2034 | | | 1,150,000 | | | | 1,145,885 | |
| Total | | | | | | | | | | | 38,499,255 | |
| Total Asset-Backed Securities (cost $61,306,412) | | | | | | | | | 59,336,678 | |
| | See Notes to Financial Statements. | 9 |
Schedule of Investments (continued)
December 31, 2022
| Investments | | Shares | | | Fair
Value | |
| COMMON STOCKS 5.39% | | | | | | |
| | | | | | | | | |
| Aerospace & Defense 0.15% | | | | | | | | |
| Huntington Ingalls Industries, Inc. | | | 6,922 | | | $ | 1,596,767 | |
| | | | | | | | | |
| Auto Components 0.10% | | | | | | | | |
| Chassix Holdings, Inc. | | | 59,475 | | | | 1,040,812 | |
| | | | | | | | | |
| Automobiles 0.11% | | | | | | | | |
| Tesla, Inc.* | | | 9,788 | | | | 1,205,686 | |
| | | | | | | | | |
| Beverages 0.21% | | | | | | | | |
| Brown-Forman Corp. Class B | | | 17,038 | | | | 1,119,056 | |
| Treasury Wine Estates Ltd. (Australia)(a) | | | 125,760 | | | | 1,161,823 | |
| Total | | | | | | | 2,280,879 | |
| | | | | | | | | |
| Biotechnology 0.40% | | | | | | | | |
| Alnylam Pharmaceuticals, Inc.* | | | 9,198 | | | | 2,185,905 | |
| Amgen, Inc. | | | 4,145 | | | | 1,088,643 | |
| Genmab A/S ADR* | | | 26,212 | | | | 1,110,864 | |
| Total | | | | | | | 4,385,412 | |
| | | | | | | | | |
| Capital Markets 0.10% | | | | | | | | |
| MarketAxess Holdings, Inc. | | | 3,946 | | | | 1,100,500 | |
| | | | | | | | | |
| Commercial Services & Supplies 0.10% | | | | | | | | |
| Tetra Tech, Inc. | | | 7,300 | | | | 1,059,887 | |
| | | | | | | | | |
| Electric: Utilities 0.11% | | | | | | | | |
| PG&E Corp.* | | | 71,127 | | | | 1,156,525 | |
| | | | | | | | | |
| Electric-Generation 0.00% | | | | | | | | |
| Frontera Generation Holdings LLC | | | 9,472 | | | | 142 | |
| | | | | | | | | |
| Entertainment 0.27% | | | | | | | | |
| Bilibili, Inc. ADR*(b) | | | 71,653 | | | | 1,697,459 | |
| Genting Singapore Ltd. (Singapore)(a) | | | 1,750,862 | | | | 1,249,516 | |
| Total | | | | | | | 2,946,975 | |
| | | | | | | | | |
| Food Products 0.51% | | | | | | | | |
| Archer-Daniels-Midland Co. | | | 13,260 | | | | 1,231,191 | |
| Campbell Soup Co. | | | 19,415 | | | | 1,101,801 | |
| General Mills, Inc. | | | 19,063 | | | | 1,598,433 | |
| Hershey Co. (The) | | | 7,007 | | | | 1,622,611 | |
| Total | | | | | | | 5,554,036 | |
| 10 | See Notes to Financial Statements. |
Schedule of Investments (continued)
December 31, 2022
| Investments | | Shares | | | Fair
Value | |
| Health Care Providers & Services 0.10% | | | | | | | | |
| Medpace Holdings, Inc.* | | | 5,298 | | | $ | 1,125,348 | |
| | | | | | | | | |
| Hotels, Restaurants & Leisure 0.32% | | | | | | | | |
| McDonald’s Corp. | | | 4,111 | | | | 1,083,372 | |
| Starbucks Corp. | | | 11,431 | | | | 1,133,955 | |
| Wynn Resorts Ltd.* | | | 14,621 | | | | 1,205,794 | |
| Total | | | | | | | 3,423,121 | |
| | | | | | | | | |
| Household Durables 0.12% | | | | | | | | |
| DR Horton, Inc. | | | 14,614 | | | | 1,302,692 | |
| | | | | | | | | |
| Insurance 0.42% | | | | | | | | |
| Kinsale Capital Group, Inc. | | | 4,172 | | | | 1,091,062 | |
| Markel Corp.* | | | 868 | | | | 1,143,581 | |
| Progressive Corp. (The) | | | 8,736 | | | | 1,133,147 | |
| W R Berkley Corp. | | | 15,527 | | | | 1,126,794 | |
| Total | | | | | | | 4,494,584 | |
| | | | | | | | | |
| Interactive Media & Services 0.12% | | | | | | | | |
| Pinterest, Inc. Class A* | | | 53,968 | | | | 1,310,343 | |
| | | | | | | | | |
| Internet & Catalog Retail 0.20% | | | | | | | | |
| Alibaba Group Holding Ltd. ADR* | | | 24,880 | | | | 2,191,679 | |
| | | | | | | | | |
| Machinery 0.11% | | | | | | | | |
| Deere & Co. | | | 2,745 | | | | 1,176,946 | |
| | | | | | | | | |
| Metals & Mining 0.44% | | | | | | | | |
| Freeport-McMoRan, Inc. | | | 28,383 | | | | 1,078,554 | |
| Newmont Corp. | | | 45,612 | | | | 2,152,887 | |
| Nucor Corp. | | | 12,030 | | | | 1,585,674 | |
| Total | | | | | | | 4,817,115 | |
| | | | | | | | | |
| Miscellaneous Financials 0.05% | | | | | | | | |
| UTEX Industries, Inc. | | | 8,205 | | | | 551,786 | |
| | | | | | | | | |
| Personal Products 0.21% | | | | | | | | |
| Gibson Brands Private Equity | | | 9,449 | | | | 1,110,258 | |
| Kose Corp. (Japan)(a) | | | 10,464 | | | | 1,136,947 | |
| Total | | | | | | | 2,247,205 | |
| | See Notes to Financial Statements. | 11 |
Schedule of Investments (continued)
December 31, 2022
| Investments | | | | | | Shares | | | Fair
Value | |
| Pharmaceuticals 0.52% | | | | | | | | | | | | |
| Cardinal Health, Inc. | | | | | | | 19,730 | | | $ | 1,516,645 | |
| Cigna Corp. | | | | | | | 3,401 | | | | 1,126,887 | |
| Daiichi Sankyo Co. Ltd. (Japan)(a) | | | | | | | 56,895 | | | | 1,831,262 | |
| Madrigal Pharmaceuticals, Inc.* | | | | | | | 3,956 | | | | 1,148,229 | |
| Total | | | | | | | | | | | 5,623,023 | |
| | | | | | | | | | | | | |
| Professional Services 0.09% | | | | | | | | | | | | |
| Booz Allen Hamilton Holding Corp. | | | | | | | 9,703 | | | | 1,014,158 | |
| | | | | | | | | | | | | |
| Specialty Retail 0.25% | | | | | | | | | | | | |
| Claires Holdings LLC | | | | | | | 1,067 | | | | 426,891 | (c) |
| Five Below, Inc.* | | | | | | | 7,024 | | | | 1,242,335 | |
| Genuine Parts Co. | | | | | | | 6,089 | | | | 1,056,502 | |
| Total | | | | | | | | | | | 2,725,728 | |
| | | | | | | | | | | | | |
| Textiles, Apparel & Luxury Goods 0.27% | | | | | | | | | | | | |
| Cie Financiere Richemont SA Class A (Switzerland)(a) | | | | | | | 13,344 | | | | 1,730,182 | |
| Hermes International (France)(a) | | | | | | | 755 | | | | 1,168,628 | |
| Total | | | | | | | | | | | 2,898,810 | |
| | | | | | | | | | | | | |
| Transportation Infrastructure 0.11% | | | | | | | | | | | | |
| ACBL Holdings Corp. | | | | | | | 3,684 | | | | 145,518 | |
| Canadian Pacific Railway Ltd. (Canada)(a) | | | | | | | 14,461 | | | | 1,078,646 | |
| Total | | | | | | | | | | | 1,224,164 | |
| Total Common Stocks (cost $58,249,646) | | | | | | | | | | | 58,454,323 | |
| | | | | | | | | | | | | |
| | | Interest
Rate | | Maturity
Date | | | Principal
Amount | | | | | |
| CORPORATE BONDS 70.96% | | | | | | | | | | | | |
| | | | | | | | | | | | | |
| Aerospace/Defense 1.11% | | | | | | | | | | | | |
| Bombardier, Inc. (Canada)†(a) | | 6.00% | | 2/15/2028 | | $ | 1,052,000 | | | | 974,089 | |
| Bombardier, Inc. (Canada)†(a) | | 7.125% | | 6/15/2026 | | | 1,828,000 | | | | 1,776,879 | |
| Lockheed Martin Corp. | | 5.10% | | 11/15/2027 | | | 1,155,000 | | | | 1,182,532 | |
| Raytheon Technologies Corp. | | 4.125% | | 11/16/2028 | | | 1,625,000 | | | | 1,558,634 | |
| TransDigm, Inc. | | 4.625% | | 1/15/2029 | | | 2,531,000 | | | | 2,229,874 | |
| TransDigm, Inc. | | 5.50% | | 11/15/2027 | | | 4,532,000 | | | | 4,264,974 | |
| Total | | | | | | | | | | | 11,986,982 | |
| 12 | See Notes to Financial Statements. |
Schedule of Investments (continued)
December 31, 2022
| Investments | | Interest
Rate | | Maturity
Date | | Principal
Amount | | | Fair
Value | |
| Agriculture 0.96% | | | | | | | | | | | | |
| BAT Capital Corp. | | 7.75% | | 10/19/2032 | | $ | 1,051,000 | | | $ | 1,133,643 | |
| Cargill, Inc.† | | 4.875% | | 10/10/2025 | | | 1,378,000 | | | | 1,373,945 | |
| Darling Ingredients, Inc.† | | 6.00% | | 6/15/2030 | | | 1,091,000 | | | | 1,067,925 | |
| Imperial Brands Finance plc (United Kingdom)†(a) | | 6.125% | | 7/27/2027 | | | 1,436,000 | | | | 1,431,402 | |
| JT International Financial Services BV (Netherlands)†(a) | | 6.875% | | 10/24/2032 | | | 1,573,000 | | | | 1,673,197 | |
| Viterra Finance BV (Netherlands)†(a) | | 2.00% | | 4/21/2026 | | | 1,707,000 | | | | 1,482,224 | |
| Viterra Finance BV (Netherlands)†(a) | | 3.20% | | 4/21/2031 | | | 1,518,000 | | | | 1,150,268 | |
| Viterra Finance BV (Netherlands)†(a) | | 5.25% | | 4/21/2032 | | | 1,306,000 | | | | 1,150,686 | |
| Total | | | | | | | | | | | 10,463,290 | |
| | | | | | | | | | | | | |
| Airlines 1.94% | | | | | | | | | | | | |
| Air Canada (Canada)†(a) | | 3.875% | | 8/15/2026 | | | 1,815,000 | | | | 1,610,690 | |
| Alaska Airlines 2020-1 Class A Pass Through Trust† | | 4.80% | | 2/15/2029 | | | 1,676,328 | | | | 1,598,461 | |
| American Airlines, Inc./AAdvantage Loyalty IP Ltd.† | | 5.75% | | 4/20/2029 | | | 4,588,000 | | | | 4,201,511 | |
| Azul Investments LLP† | | 5.875% | | 10/26/2024 | | | 2,396,000 | | | | 1,931,568 | |
| British Airways Pass Through Trust 2019-1A (United Kingdom)†(a) | | 3.30% | | 6/15/2034 | | | 685,744 | | | | 583,624 | |
| British Airways Pass-Through Trust A (United Kingdom)†(a) | | 4.25% | | 5/15/2034 | | | 499,060 | | | | 447,840 | |
| Delta Air Lines, Inc.† | | 7.00% | | 5/1/2025 | | | 2,203,000 | | | | 2,253,335 | |
| Delta Air Lines, Inc./SkyMiles IP Ltd.† | | 4.75% | | 10/20/2028 | | | 1,723,000 | | | | 1,622,221 | |
| Hawaiian Brand Intellectual Property Ltd./HawaiianMiles Loyalty Ltd.† | | 5.75% | | 1/20/2026 | | | 1,695,347 | | | | 1,537,510 | |
| JetBlue 2019-1 Class A Pass Through Trust | | 2.95% | | 11/15/2029 | | | 876,269 | | | | 729,364 | |
| Mileage Plus Holdings LLC/Mileage Plus Intellectual Property Assets Ltd.† | | 6.50% | | 6/20/2027 | | | 1,350,000 | | | | 1,345,143 | |
| United Airlines 2020-1 Class A Pass Through Trust | | 5.875% | | 4/15/2029 | | | 2,194,104 | | | | 2,166,303 | |
| United Airlines, Inc.† | | 4.625% | | 4/15/2029 | | | 1,197,000 | | | | 1,044,324 | |
| Total | | | | | | | | | | | 21,071,894 | |
| | | | | | | | | | | | | |
| Apparel 0.14% | | | | | | | | | | | | |
| Levi Strauss & Co.† | | 3.50% | | 3/1/2031 | | | 1,907,000 | | | | 1,516,046 | |
| | | | | | | | | | | | | |
| Auto Manufacturers 1.20% | | | | | | | | | | | | |
| Allison Transmission, Inc.† | | 3.75% | | 1/30/2031 | | | 1,355,000 | | | | 1,116,181 | |
| BMW US Capital LLC† | | 4.15% | | 4/9/2030 | | | 1,500,000 | | | | 1,427,693 | |
| Ford Motor Co. | | 3.25% | | 2/12/2032 | | | 5,013,000 | | | | 3,768,381 | |
| Ford Motor Co. | | 6.10% | | 8/19/2032 | | | 2,144,000 | | | | 1,983,806 | |
| Ford Motor Credit Co. LLC | | 2.90% | | 2/10/2029 | | | 1,452,000 | | | | 1,161,651 | |
| Ford Motor Credit Co. LLC | | 4.00% | | 11/13/2030 | | | 2,916,000 | | | | 2,399,299 | |
| Ford Motor Credit Co. LLC | | 7.35% | | 11/4/2027 | | | 1,096,000 | | | | 1,125,811 | |
| Total | | | | | | | | | | | 12,982,822 | |
| | See Notes to Financial Statements. | 13 |
Schedule of Investments (continued)
December 31, 2022
| Investments | | Interest
Rate | | Maturity
Date | | Principal
Amount | | | Fair
Value | |
| Banks 3.43% | | | | | | | | | | | | |
| ABN AMRO Bank NV (Netherlands)†(a) | | 3.324%
(5 Yr. Treasury CMT + 1.90% | )# | 3/13/2037 | | $ | 1,200,000 | | | $ | 870,229 | |
| Alfa Bank AO Via Alfa Bond Issuance PLC (Ireland)(a) | | 5.50%
(5 Yr. Treasury CMT + 4.55% | ) | 10/26/2031 | | | 2,645,000 | | | | – | (d)(e) |
| Australia & New Zealand Banking Group Ltd. (Australia)†(a) | | 6.742% | | 12/8/2032 | | | 2,525,000 | | | | 2,557,871 | |
| Bank of America Corp. | | 3.384%
(SOFR + 1.33% | )# | 4/2/2026 | | | 2,839,000 | | | | 2,713,757 | |
| Bank of Ireland Group plc (Ireland)†(a) | | 2.029%
(1 Yr. Treasury CMT + 1.10% | )# | 9/30/2027 | | | 1,201,000 | | | | 1,015,645 | |
| Bank of Ireland Group PLC (Ireland)†(a) | | 6.253%
(1 Yr. Treasury CMT + 2.65% | )# | 9/16/2026 | | | 1,666,000 | | | | 1,653,769 | |
| Bank OZK | | 2.75%
(3 Mo. Term SOFR + 2.09% | )# | 10/1/2031 | | | 2,069,000 | | | | 1,767,211 | |
| BankUnited, Inc. | | 4.875% | | 11/17/2025 | | | 1,178,000 | | | | 1,160,928 | |
| Danske Bank A/S (Denmark)†(a) | | 4.298%
(1 Yr. Treasury CMT + 1.75% | )# | 4/1/2028 | | | 584,000 | | | | 537,851 | |
| First-Citizens Bank & Trust Co. | | 6.125% | | 3/9/2028 | | | 2,793,000 | | | | 2,844,353 | |
| Home BancShares, Inc. | | 3.125%
(3 Mo. Term SOFR + 1.82% | )# | 1/30/2032 | | | 1,058,000 | | | | 889,391 | |
| HSBC Holdings plc (United Kingdom)(a) | | 2.999%
(SOFR + 1.43% | )# | 3/10/2026 | | | 5,768,000 | | | | 5,425,882 | |
| JPMorgan Chase & Co. | | 3.54%
(3 Mo. LIBOR + 1.38% | )# | 5/1/2028 | | | 4,306,000 | | | | 3,968,947 | |
| Morgan Stanley | | 4.679%
(SOFR + 1.65% | )# | 7/17/2026 | | | 1,379,000 | | | | 1,356,693 | |
| NatWest Group PLC (United Kingdom)(a) | | 7.472%
(5 Yr. Treasury CMT + 2.85% | )# | 11/10/2026 | | | 1,602,000 | | | | 1,668,818 | |
| Oesterreichische Kontrollbank AG (Austria)(a) | | 4.625% | | 11/3/2025 | | | 1,851,000 | | | | 1,861,242 | |
| Standard Chartered PLC (United Kingdom)†(a) | | 7.767%
(5 Yr. Treasury CMT + 3.45% | )# | 11/16/2028 | | | 1,621,000 | | | | 1,720,193 | |
| SVB Financial Group | | 4.25%
(5 Yr. Treasury CMT + 3.07% | )# | 11/15/2026 | | | 1,115,000 | | | | 733,585 | |
| United Overseas Bank Ltd. (Singapore)†(a) | | 2.00%
(5 Yr. Treasury CMT + 1.23% | )# | 10/14/2031 | | | 1,420,000 | | | | 1,241,121 | |
| US Bancorp | | 3.00% | | 7/30/2029 | | | 1,090,000 | | | | 959,321 | |
| Webster Financial Corp. | | 4.10% | | 3/25/2029 | | | 1,622,000 | | | | 1,474,320 | |
| Western Alliance Bancorp | | 3.00%
(3 Mo. Term SOFR + 2.25% | )# | 6/15/2031 | | | 893,000 | | | | 754,669 | |
| Total | | | | | | | | | | | 37,175,796 | |
| 14 | See Notes to Financial Statements. |
Schedule of Investments (continued)
December 31, 2022
| Investments | | Interest
Rate | | Maturity
Date | | Principal
Amount | | | Fair
Value | |
| Beverages 0.83% | | | | | | | | | | | | |
| Bacardi Ltd.† | | 2.75% | | 7/15/2026 | | $ | 1,749,000 | | | $ | 1,582,734 | |
| Bacardi Ltd.† | | 4.70% | | 5/15/2028 | | | 1,500,000 | | | | 1,434,920 | |
| Becle SAB de CV (Mexico)†(a) | | 2.50% | | 10/14/2031 | | | 1,270,000 | | | | 988,625 | |
| Brown-Forman Corp. | | 4.50% | | 7/15/2045 | | | 1,192,000 | | | | 1,095,642 | |
| Central American Bottling Corp./CBC Bottling Holdco SL/Beliv Holdco SL (Guatemala)†(a) | | 5.25% | | 4/27/2029 | | | 1,196,000 | | | | 1,117,345 | |
| PepsiCo, Inc. | | 3.00% | | 10/15/2027 | | | 1,839,000 | | | | 1,727,685 | |
| PepsiCo, Inc. | | 4.20% | | 7/18/2052 | | | 1,116,000 | | | | 1,022,884 | |
| Total | | | | | | | | | | | 8,969,835 | |
| | | | | | | | | | | | | |
| Biotechnology 0.44% | | | | | | | | | | | | |
| Amgen, Inc. | | 4.20% | | 2/22/2052 | | | 2,655,000 | | | | 2,118,741 | |
| Regeneron Pharmaceuticals, Inc. | | 2.80% | | 9/15/2050 | | | 4,216,000 | | | | 2,632,816 | |
| Total | | | | | | | | | | | 4,751,557 | |
| | | | | | | | | | | | | |
| Building Materials 0.32% | | | | | | | | | | | | |
| Builders FirstSource, Inc.† | | 4.25% | | 2/1/2032 | | | 1,153,000 | | | | 936,793 | |
| Lennox International, Inc. | | 1.70% | | 8/1/2027 | | | 885,000 | | | | 760,121 | |
| Smyrna Ready Mix Concrete LLC† | | 6.00% | | 11/1/2028 | | | 889,000 | | | | 797,246 | |
| Vulcan Materials Co. | | 4.50% | | 6/15/2047 | | | 1,186,000 | | | | 990,792 | |
| Total | | | | | | | | | | | 3,484,952 | |
| | | | | | | | | | | | | |
| Chemicals 1.98% | | | | | | | | | | | | |
| Albemarle Corp. | | 4.65% | | 6/1/2027 | | | 1,332,000 | | | | 1,301,066 | |
| Ashland LLC† | | 3.375% | | 9/1/2031 | | | 1,306,000 | | | | 1,045,545 | |
| Cabot Corp. | | 5.00% | | 6/30/2032 | | | 1,342,000 | | | | 1,244,751 | |
| Celanese US Holdings LLC | | 6.165% | | 7/15/2027 | | | 3,391,000 | | | | 3,350,073 | |
| CF Industries, Inc.† | | 4.50% | | 12/1/2026 | | | 1,047,000 | | | | 1,014,898 | |
| FMC Corp. | | 3.45% | | 10/1/2029 | | | 893,000 | | | | 789,147 | |
| Ingevity Corp.† | | 3.875% | | 11/1/2028 | | | 1,275,000 | | | | 1,098,591 | |
| NOVA Chemicals Corp. (Canada)†(a) | | 4.25% | | 5/15/2029 | | | 1,305,000 | | | | 1,068,756 | |
| OCP SA (Morocco)†(a) | | 3.75% | | 6/23/2031 | | | 2,847,000 | | | | 2,394,925 | |
| Olin Corp. | | 5.00% | | 2/1/2030 | | | 1,347,000 | | | | 1,231,528 | |
| Olin Corp. | | 5.125% | | 9/15/2027 | | | 1,304,000 | | | | 1,234,523 | |
| SCIH Salt Holdings, Inc.† | | 4.875% | | 5/1/2028 | | | 2,328,000 | | | | 2,001,951 | |
| SCIH Salt Holdings, Inc.† | | 6.625% | | 5/1/2029 | | | 1,462,000 | | | | 1,179,512 | |
| SK Invictus Intermediate II Sarl (Luxembourg)†(a) | | 5.00% | | 10/30/2029 | | | 1,402,000 | | | | 1,151,463 | |
| Sociedad Quimica y Minera de Chile SA (Chile)†(a) | | 3.50% | | 9/10/2051 | | | 1,789,000 | | | | 1,319,177 | |
| Total | | | | | | | | | | | 21,425,906 | |
| | See Notes to Financial Statements. | 15 |
Schedule of Investments (continued)
December 31, 2022
| Investments | | Interest
Rate | | Maturity
Date | | Principal
Amount | | | Fair
Value | |
| Coal 0.34% | | | | | | | | | | | | |
| SunCoke Energy, Inc.† | | 4.875% | | 6/30/2029 | | $ | 1,212,000 | | | $ | 1,041,941 | |
| Warrior Met Coal, Inc.† | | 7.875% | | 12/1/2028 | | | 2,683,000 | | | | 2,648,370 | |
| Total | | | | | | | | | | | 3,690,311 | |
| | | | | | | | | | | | | |
| Commercial Services 1.25% | | | | | | | | | | | | |
| Adani Ports & Special Economic Zone Ltd. (India)†(a) | | 3.828% | | 2/2/2032 | | | 1,007,000 | | | | 762,731 | |
| Adani Ports & Special Economic Zone Ltd. (India)†(a) | | 4.375% | | 7/3/2029 | | | 2,280,000 | | | | 1,917,710 | |
| AMN Healthcare, Inc.† | | 4.625% | | 10/1/2027 | | | 882,000 | | | | 814,783 | |
| Ashtead Capital, Inc.† | | 5.50% | | 8/11/2032 | | | 1,155,000 | | | | 1,108,101 | |
| Block, Inc. | | 3.50% | | 6/1/2031 | | | 1,196,000 | | | | 955,843 | |
| Cleveland Clinic Foundation (The) | | 4.858% | | 1/1/2114 | | | 700,000 | | | | 599,221 | |
| Georgetown University (The) | | 2.943% | | 4/1/2050 | | | 1,246,000 | | | | 792,984 | |
| Global Payments, Inc. | | 2.90% | | 5/15/2030 | | | 1,538,000 | | | | 1,263,561 | |
| Hertz Corp. (The)† | | 5.50% | | 10/15/2024 | | | 987,000 | | | | 37,012 | |
| Hertz Corp. (The)† | | 6.00% | | 1/15/2028 | | | 1,887,000 | | | | 169,830 | |
| ITR Concession Co. LLC† | | 5.183% | | 7/15/2035 | | | 785,000 | | | | 733,485 | |
| Johns Hopkins University | | 2.813% | | 1/1/2060 | | | 692,000 | | | | 435,437 | |
| Metropolitan Museum of Art (The) | | 3.40% | | 7/1/2045 | | | 1,975,000 | | | | 1,557,504 | |
| Movida Europe SA (Luxembourg)†(a) | | 5.25% | | 2/8/2031 | | | 1,088,000 | | | | 817,190 | |
| United Rentals North America, Inc. | | 4.875% | | 1/15/2028 | | | 789,000 | | | | 749,436 | |
| University of Miami | | 4.063% | | 4/1/2052 | | | 992,000 | | | | 813,538 | |
| Total | | | | | | | | | | | 13,528,366 | |
| | | | | | | | | | | | | |
| Computers 1.24% | | | | | | | | | | | | |
| Apple, Inc. | | 2.90% | | 9/12/2027 | | | 1,600,000 | | | | 1,494,101 | |
| Apple, Inc. | | 3.20% | | 5/11/2027 | | | 3,601,000 | | | | 3,418,511 | |
| Booz Allen Hamilton, Inc.† | | 3.875% | | 9/1/2028 | | | 976,000 | | | | 866,427 | |
| Booz Allen Hamilton, Inc.† | | 4.00% | | 7/1/2029 | | | 827,000 | | | | 729,074 | |
| Condor Merger Sub, Inc.† | | 7.375% | | 2/15/2030 | | | 291,000 | | | | 234,492 | |
| Crowdstrike Holdings, Inc. | | 3.00% | | 2/15/2029 | | | 6,407,000 | | | | 5,414,171 | |
| Teledyne FLIR LLC | | 2.50% | | 8/1/2030 | | | 1,603,000 | | | | 1,297,414 | |
| Total | | | | | | | | | | | 13,454,190 | |
| | | | | | | | | | | | | |
| Cosmetics/Personal Care 0.19% | | | | | | | | | | | | |
| GSK Consumer Healthcare Capital U.S. LLC | | 3.625% | | 3/24/2032 | | | 2,389,000 | | | | 2,103,929 | |
| | | | | | | | | | | | | |
| Distribution/Wholesale 0.30% | | | | | | | | | | | | |
| Ferguson Finance plc (United Kingdom)†(a) | | 3.25% | | 6/2/2030 | | | 2,229,000 | | | | 1,895,300 | |
| H&E Equipment Services, Inc.† | | 3.875% | | 12/15/2028 | | | 1,563,000 | | | | 1,334,091 | |
| Total | | | | | | | | | | | 3,229,391 | |
| 16 | See Notes to Financial Statements. |
Schedule of Investments (continued)
December 31, 2022
| Investments | | Interest
Rate | | Maturity
Date | | Principal
Amount | | | Fair
Value | |
| Diversified Financial Services 1.55% | | | | | | | | | | | | |
| AG Issuer LLC† | | 6.25% | | 3/1/2028 | | $ | 1,220,000 | | | $ | 1,123,053 | |
| Blackstone Holdings Finance Co. LLC† | | 2.00% | | 1/30/2032 | | | 1,609,000 | | | | 1,185,926 | |
| CDP Financial, Inc. (Canada)(a) | | 1.00% | | 5/26/2026 | | | 4,582,000 | | | | 4,078,641 | |
| CPPIB Capital, Inc. (Canada)†(a) | | 4.125% | | 10/21/2024 | | | 1,699,000 | | | | 1,679,552 | |
| CPPIB Capital, Inc. (Canada)†(a) | | 4.818%
(SOFR Index + 1.25% | )# | 4/4/2025 | | | 4,056,000 | | | | 4,131,651 | |
| Intercontinental Exchange, Inc. | | 4.00% | | 9/15/2027 | | | 1,839,000 | | | | 1,778,579 | |
| Jane Street Group/JSG Finance, Inc.† | | 4.50% | | 11/15/2029 | | | 896,000 | | | | 771,855 | |
| Neuberger Berman Group LLC/Neuberger Berman Finance Corp.† | | 4.875% | | 4/15/2045 | | | 1,377,000 | | | | 1,117,370 | |
| USAA Capital Corp.† | | 2.125% | | 5/1/2030 | | | 1,129,000 | | | | 927,928 | |
| Total | | | | | | | | | | | 16,794,555 | |
| | | | | | | | | | | | | |
| Electric 5.75% | | | | | | | | | | | | |
| AES Corp. (The) | | 2.45% | | 1/15/2031 | | | 2,495,000 | | | | 1,990,664 | |
| Atlantic City Electric Co. | | 4.00% | | 10/15/2028 | | | 1,149,000 | | | | 1,096,154 | |
| Ausgrid Finance Pty Ltd. (Australia)†(a) | | 4.35% | | 8/1/2028 | | | 1,217,000 | | | | 1,130,632 | |
| Black Hills Corp. | | 4.35% | | 5/1/2033 | | | 1,166,000 | | | | 1,029,374 | |
| Calpine Corp.† | | 3.75% | | 3/1/2031 | | | 1,352,000 | | | | 1,090,328 | |
| Calpine Corp.† | | 4.50% | | 2/15/2028 | | | 1,198,000 | | | | 1,071,231 | |
| Calpine Corp.† | | 4.625% | | 2/1/2029 | | | 3,814,000 | | | | 3,278,739 | |
| Calpine Corp.† | | 5.00% | | 2/1/2031 | | | 2,841,000 | | | | 2,387,886 | |
| Calpine Corp.† | | 5.125% | | 3/15/2028 | | | 1,328,000 | | | | 1,187,667 | |
| Clearway Energy Operating LLC† | | 4.75% | | 3/15/2028 | | | 1,731,000 | | | | 1,600,302 | |
| Cleveland Electric Illuminating Co.† | | 3.50% | | 4/1/2028 | | | 1,118,000 | | | | 1,020,689 | |
| Constellation Energy Generation LLC | | 5.60% | | 6/15/2042 | | | 1,171,000 | | | | 1,133,760 | |
| Constellation Energy Generation LLC | | 6.25% | | 10/1/2039 | | | 2,067,000 | | | | 2,117,503 | |
| Duke Energy Corp. | | 4.30% | | 3/15/2028 | | | 1,839,000 | | | | 1,772,921 | |
| EDP Finance BV (Netherlands)† | | 6.30% | | 10/11/2027 | | | 2,264,000 | | | | 2,332,677 | |
| El Paso Electric Co. | | 5.00% | | 12/1/2044 | | | 1,203,000 | | | | 1,057,697 | |
| Electricite de France SA (France)†(a) | | 3.625% | | 10/13/2025 | | | 1,000,000 | | | | 964,914 | |
| Electricite de France SA (France)†(a) | | 4.50% | | 9/21/2028 | | | 1,250,000 | | | | 1,185,597 | |
| Empresa de Transmision Electrica SA (Panama)†(a) | | 5.125% | | 5/2/2049 | | | 1,205,000 | | | | 977,333 | |
| Enel Finance International NV (Netherlands)†(a) | | 3.50% | | 4/6/2028 | | | 1,329,000 | | | | 1,165,030 | |
| Entergy Arkansas LLC | | 4.95% | | 12/15/2044 | | | 1,109,000 | | | | 967,977 | |
| FirstEnergy Corp. | | 4.40% | | 7/15/2027 | | | 2,518,000 | | | | 2,347,905 | |
| FirstEnergy Corp. | | 5.35% | | 7/15/2047 | | | 1,420,000 | | | | 1,270,280 | |
| FirstEnergy Transmission LLC† | | 2.866% | | 9/15/2028 | | | 1,356,000 | | | | 1,185,696 | |
| FirstEnergy Transmission LLC† | | 4.55% | | 4/1/2049 | | | 1,271,000 | | | | 1,034,428 | |
| | See Notes to Financial Statements. | 17 |
Schedule of Investments (continued)
December 31, 2022
| Investments | | Interest
Rate | | Maturity
Date | | Principal
Amount | | | Fair
Value | |
| Electric (continued) | | | | | | | | | | | | |
| Indianapolis Power & Light Co.† | | 4.05% | | 5/1/2046 | | $ | 1,608,000 | | | $ | 1,298,396 | |
| Indianapolis Power & Light Co.† | | 5.65% | | 12/1/2032 | | | 969,000 | | | | 996,886 | |
| ITC Holdings Corp.† | | 4.95% | | 9/22/2027 | | | 1,129,000 | | | | 1,115,324 | |
| Louisville Gas & Electric Co. | | 4.375% | | 10/1/2045 | | | 1,017,000 | | | | 845,607 | |
| Minejesa Capital BV (Netherlands)†(a) | | 4.625% | | 8/10/2030 | | | 1,354,000 | | | | 1,191,791 | |
| Monongahela Power Co.† | | 3.55% | | 5/15/2027 | | | 1,188,000 | | | | 1,118,408 | |
| NextEra Energy Operating Partners LP† | | 3.875% | | 10/15/2026 | | | 2,267,000 | | | | 2,078,827 | |
| NextEra Energy Operating Partners LP† | | 4.50% | | 9/15/2027 | | | 1,774,000 | | | | 1,630,284 | |
| NRG Energy, Inc.† | | 3.875% | | 2/15/2032 | | | 2,781,000 | | | | 2,094,023 | |
| NSG Holdings LLC/NSG Holdings, Inc.† | | 7.75% | | 12/15/2025 | | | 496,892 | | | | 483,500 | |
| Ohio Edison Co.† | | 5.50% | | 1/15/2033 | | | 909,000 | | | | 903,572 | |
| Pacific Gas and Electric Co. | | 3.50% | | 8/1/2050 | | | 1,806,000 | | | | 1,128,593 | |
| Pacific Gas and Electric Co. | | 4.95% | | 7/1/2050 | | | 1,580,000 | | | | 1,231,023 | |
| Pattern Energy Operations LP/Pattern Energy Operations, Inc.† | | 4.50% | | 8/15/2028 | | | 1,173,000 | | | | 1,053,828 | |
| PG&E Corp. | | 5.00% | | 7/1/2028 | | | 1,547,000 | | | | 1,414,681 | |
| Puget Energy, Inc. | | 4.10% | | 6/15/2030 | | | 1,000,000 | | | | 895,291 | |
| Union Electric Co. | | 2.625% | | 3/15/2051 | | | 1,655,000 | | | | 1,050,334 | |
| Vistra Operations Co. LLC† | | 4.375% | | 5/1/2029 | | | 2,555,000 | | | | 2,206,580 | |
| Vistra Operations Co. LLC† | | 5.125% | | 5/13/2025 | | | 2,220,000 | | | | 2,174,901 | |
| Wisconsin Electric Power Co. | | 4.75% | | 9/30/2032 | | | 1,103,000 | | | | 1,084,241 | |
| Total | | | | | | | | | | | 62,393,474 | |
| | | | | | | | | | | | | |
| Electronics 0.34% | | | | | | | | | | | | |
| Amphenol Corp. | | 2.80% | | 2/15/2030 | | | 1,875,000 | | | | 1,604,629 | |
| Honeywell International, Inc.(f) | | 4.125% | | 11/2/2034 | | EUR | 1,284,000 | | | | 1,361,771 | |
| Imola Merger Corp.† | | 4.75% | | 5/15/2029 | | $ | 886,000 | | | | 770,491 | |
| Total | | | | | | | | | | | 3,736,891 | |
| | | | | | | | | | | | | |
| Energy-Alternate Sources 0.56% | | | | | | | | | | | | |
| Sweihan PV Power Co. PJSC (United Arab Emirates)†(a) | | 3.625% | | 1/31/2049 | | | 1,668,593 | | | | 1,345,486 | |
| TerraForm Power Operating LLC† | | 4.75% | | 1/15/2030 | | | 1,484,000 | | | | 1,293,712 | |
| TerraForm Power Operating LLC† | | 5.00% | | 1/31/2028 | | | 1,000,000 | | | | 901,710 | |
| Topaz Solar Farms LLC† | | 5.75% | | 9/30/2039 | | | 2,634,410 | | | | 2,504,112 | |
| Total | | | | | | | | | | | 6,045,020 | |
| | | | | | | | | | | | | |
| Engineering & Construction 0.42% | | | | | | | | | | | | |
| Aeropuerto Internacional de Tocumen SA (Panama)†(a) | | 5.125% | | 8/11/2061 | | | 2,907,000 | | | | 2,389,138 | |
| Fluor Corp. | | 4.25% | | 9/15/2028 | | | 2,391,000 | | | | 2,156,139 | |
| Total | | | | | | | | | | | 4,545,277 | |
| 18 | See Notes to Financial Statements. |
Schedule of Investments (continued)
December 31, 2022
| | | Interest | | Maturity | | Principal | | | Fair | |
| Investments | | Rate | | Date | | Amount | | | Value | |
| Entertainment 1.67% | | | | | | | | | | | | |
| Churchill Downs, Inc.† | | 4.75% | | 1/15/2028 | | $ | 1,787,000 | | | $ | 1,601,902 | |
| Churchill Downs, Inc.† | | 5.50% | | 4/1/2027 | | | 2,671,000 | | | | 2,535,060 | |
| Live Nation Entertainment, Inc.† | | 3.75% | | 1/15/2028 | | | 2,128,000 | | | | 1,818,541 | |
| Merlin Entertainments Ltd. (United Kingdom)†(a) | | 5.75% | | 6/15/2026 | | | 1,360,000 | | | | 1,275,432 | |
| Midwest Gaming Borrower LLC/Midwest Gaming Finance Corp† | | 4.875% | | 5/1/2029 | | | 1,984,000 | | | | 1,690,694 | |
| Mohegan Gaming & Entertainment† | | 8.00% | | 2/1/2026 | | | 2,032,000 | | | | 1,904,024 | |
| Resorts World Las Vegas LLC/RWLV Capital, Inc.† | | 4.625% | | 4/16/2029 | | | 2,000,000 | | | | 1,421,463 | |
| SeaWorld Parks & Entertainment, Inc.† | | 5.25% | | 8/15/2029 | | | 1,820,000 | | | | 1,587,038 | |
| Warnermedia Holdings, Inc.† | | 5.141% | | 3/15/2052 | | | 1,970,000 | | | | 1,439,730 | |
| WMG Acquisition Corp.† | | 3.00% | | 2/15/2031 | | | 1,417,000 | | | | 1,134,585 | |
| WMG Acquisition Corp.† | | 3.75% | | 12/1/2029 | | | 1,919,000 | | | | 1,652,835 | |
| Total | | | | | | | | | | | 18,061,304 | |
| | | | | | | | | | | | | |
| Environmental Control 0.32% | | | | | | | | | | | | |
| Madison IAQ LLC† | | 4.125% | | 6/30/2028 | | | 1,677,000 | | | | 1,404,487 | |
| Madison IAQ LLC† | | 5.875% | | 6/30/2029 | | | 1,372,000 | | | | 942,947 | |
| Republic Services, Inc. | | 2.375% | | 3/15/2033 | | | 1,433,000 | | | | 1,146,999 | |
| Total | | | | | | | | | | | 3,494,433 | |
| | | | | | | | | | | | | |
| Food 1.59% | | | | | | | | | | | | |
| Bellis Acquisition Co. PLC(f) | | 3.25% | | 2/16/2026 | | GBP | 1,350,000 | | | | 1,334,023 | |
| Campbell Soup Co. | | 2.375% | | 4/24/2030 | | $ | 952,000 | | | | 794,385 | |
| Hershey Co. (The) | | 2.65% | | 6/1/2050 | | | 1,008,000 | | | | 659,389 | |
| Kraft Heinz Foods Co. | | 4.375% | | 6/1/2046 | | | 4,002,000 | | | | 3,270,399 | |
| Kraft Heinz Foods Co. | | 4.875% | | 10/1/2049 | | | 3,623,000 | | | | 3,163,313 | |
| Lamb Weston Holdings, Inc.† | | 4.125% | | 1/31/2030 | | | 1,243,000 | | | | 1,099,496 | |
| McCormick & Co., Inc. | | 2.50% | | 4/15/2030 | | | 2,046,000 | | | | 1,710,943 | |
| Post Holdings, Inc.† | | 4.50% | | 9/15/2031 | | | 1,666,000 | | | | 1,403,614 | |
| Post Holdings, Inc.† | | 4.625% | | 4/15/2030 | | | 2,303,000 | | | | 1,991,692 | |
| Smithfield Foods, Inc.† | | 5.20% | | 4/1/2029 | | | 2,021,000 | | | | 1,850,464 | |
| Total | | | | | | | | | | | 17,277,718 | |
| | | | | | | | | | | | | |
| Gas 0.22% | | | | | | | | | | | | |
| Brooklyn Union Gas Co. (The)† | | 3.407% | | 3/10/2026 | | | 1,368,000 | | | | 1,283,861 | |
| Southwest Gas Corp. | | 4.05% | | 3/15/2032 | | | 1,247,000 | | | | 1,098,356 | |
| Total | | | | | | | | | | | 2,382,217 | |
| | | | | | | | | | | | | |
| Health Care-Products 0.60% | | | | | | | | | | | | |
| Alcon Finance Corp.† | | 2.60% | | 5/27/2030 | | | 1,552,000 | | | | 1,322,030 | |
| Boston Scientific Corp. | | 6.75% | | 11/15/2035 | | | 1,597,000 | | | | 1,759,471 | |
| | | |
| | See Notes to Financial Statements. | 19 |
Schedule of Investments (continued)
December 31, 2022
| | | Interest | | Maturity | | Principal | | | Fair | |
| Investments | | Rate | | Date | | Amount | | | Value | |
| Health Care-Products (continued) | | | | | | | | | | | | |
| Edwards Lifesciences Corp. | | 4.30% | | 6/15/2028 | | $ | 1,411,000 | | | $ | 1,351,614 | |
| GE HealthCare Technologies, Inc.† | | 6.377% | | 11/22/2052 | | | 687,000 | | | | 733,848 | |
| Medline Borrower LP† | | 3.875% | | 4/1/2029 | | | 1,682,000 | | | | 1,358,627 | |
| Total | | | | | | | | | | | 6,525,590 | |
| | | | | | | | | | | | | |
| Health Care-Services 3.56% | | | | | | | | | | | | |
| Catalent Pharma Solutions, Inc.† | | 3.125% | | 2/15/2029 | | | 1,365,000 | | | | 1,088,588 | |
| Centene Corp. | | 2.50% | | 3/1/2031 | | | 1,513,000 | | | | 1,186,794 | |
| Centene Corp. | | 3.00% | | 10/15/2030 | | | 1,327,000 | | | | 1,090,800 | |
| Centene Corp. | | 3.375% | | 2/15/2030 | | | 3,631,000 | | | | 3,077,726 | |
| Centene Corp. | | 4.625% | | 12/15/2029 | | | 1,807,000 | | | | 1,655,376 | |
| Charles River Laboratories International, Inc.† | | 3.75% | | 3/15/2029 | | | 1,304,000 | | | | 1,155,142 | |
| Elevance Health, Inc. | | 2.25% | | 5/15/2030 | | | 1,299,000 | | | | 1,077,553 | |
| Hadrian Merger Sub, Inc.† | | 8.50% | | 5/1/2026 | | | 1,187,000 | | | | 1,050,738 | |
| HCA, Inc. | | 3.50% | | 9/1/2030 | | | 2,358,000 | | | | 2,039,259 | |
| HCA, Inc. | | 7.69% | | 6/15/2025 | | | 640,000 | | | | 671,453 | |
| Kaiser Foundation Hospitals | | 4.15% | | 5/1/2047 | | | 873,000 | | | | 744,064 | |
| Memorial Sloan-Kettering Cancer Center | | 4.20% | | 7/1/2055 | | | 1,478,000 | | | | 1,214,782 | |
| ModivCare Escrow Issuer, Inc.† | | 5.00% | | 10/1/2029 | | | 1,864,000 | | | | 1,574,335 | |
| Molina Healthcare, Inc.† | | 3.875% | | 11/15/2030 | | | 1,553,000 | | | | 1,318,380 | |
| Molina Healthcare, Inc.† | | 3.875% | | 5/15/2032 | | | 2,065,000 | | | | 1,717,841 | |
| Montefiore Obligated Group | | 5.246% | | 11/1/2048 | | | 1,553,000 | | | | 1,167,051 | |
| Mount Sinai Hospitals Group, Inc. | | 3.737% | | 7/1/2049 | | | 1,566,000 | | | | 1,162,307 | |
| New York & Presbyterian Hospital (The) | | 4.063% | | 8/1/2056 | | | 1,020,000 | | | | 808,274 | |
| NYU Langone Hospitals | | 4.368% | | 7/1/2047 | | | 1,191,000 | | | | 994,608 | |
| Providence St. Joseph Health Obligated Group | | 2.532% | | 10/1/2029 | | | 1,160,000 | | | | 984,111 | |
| Rede D’or Finance Sarl (Luxembourg)†(a) | | 4.95% | | 1/17/2028 | | | 912,000 | | | | 843,801 | |
| Roche Holdings, Inc.† | | 2.314% | | 3/10/2027 | | | 1,268,000 | | | | 1,157,020 | |
| Seattle Children’s Hospital | | 2.719% | | 10/1/2050 | | | 1,672,000 | | | | 1,060,881 | |
| Tenet Healthcare Corp.† | | 4.375% | | 1/15/2030 | | | 1,319,000 | | | | 1,143,995 | |
| Tenet Healthcare Corp.† | | 4.875% | | 1/1/2026 | | | 1,154,000 | | | | 1,093,614 | |
| Tenet Healthcare Corp.† | | 6.125% | | 10/1/2028 | | | 2,221,000 | | | | 1,993,192 | |
| Tenet Healthcare Corp.† | | 6.125% | | 6/15/2030 | | | 1,770,000 | | | | 1,689,562 | |
| UnitedHealth Group, Inc. | | 2.95% | | 10/15/2027 | | | 686,000 | | | | 636,238 | |
| UnitedHealth Group, Inc. | | 4.20% | | 5/15/2032 | | | 1,630,000 | | | | 1,552,224 | |
| UnitedHealth Group, Inc. | | 5.875% | | 2/15/2053 | | | 1,542,000 | | | | 1,675,140 | |
| Total | | | | | | | | | | | 38,624,849 | |
| | | |
| 20 | See Notes to Financial Statements. | |
Schedule of Investments (continued)
December 31, 2022
| | | Interest | | Maturity | | Principal | | | Fair | |
| Investments | | Rate | | Date | | Amount | | | Value | |
| Home Builders 0.29% | | | | | | | | | | | | |
| NVR, Inc. | | 3.00% | | 5/15/2030 | | $ | 1,297,000 | | | $ | 1,091,736 | |
| PulteGroup, Inc. | | 6.375% | | 5/15/2033 | | | 1,215,000 | | | | 1,215,830 | |
| Toll Brothers Finance Corp. | | 4.35% | | 2/15/2028 | | | 874,000 | | | | 795,589 | |
| Total | | | | | | | | | | | 3,103,155 | |
| | | | | | | | | | | | | |
| Home Furnishings 0.07% | | | | | | | | | | | | |
| Leggett & Platt, Inc. | | 4.40% | | 3/15/2029 | | | 828,000 | | | | 778,946 | |
| | | | | | | | | | | | | |
| Household Products/Wares 0.11% | | | | | | | | | | | | |
| SC Johnson & Son, Inc.† | | 4.75% | | 10/15/2046 | | | 1,300,000 | | | | 1,156,931 | |
| | | | | | | | | | | | | |
| Insurance 1.64% | | | | | | | | | | | | |
| AIA Group Ltd. (Hong Kong)†(a) | | 3.20% | | 9/16/2040 | | | 1,940,000 | | | | 1,388,091 | |
| AIA Group Ltd. (Hong Kong)†(a) | | 3.375% | | 4/7/2030 | | | 1,304,000 | | | | 1,148,742 | |
| Arch Capital Finance LLC | | 4.011% | | 12/15/2026 | | | 1,183,000 | | | | 1,129,780 | |
| Assurant, Inc. | | 2.65% | | 1/15/2032 | | | 1,306,000 | | | | 969,017 | |
| Assurant, Inc. | | 3.70% | | 2/22/2030 | | | 1,191,000 | | | | 1,011,227 | |
| AXIS Specialty Finance plc (United Kingdom)(a) | | 5.15% | | 4/1/2045 | | | 1,595,000 | | | | 1,367,964 | |
| Brown & Brown, Inc. | | 2.375% | | 3/15/2031 | | | 2,120,000 | | | | 1,617,789 | |
| Fidelity National Financial, Inc. | | 4.50% | | 8/15/2028 | | | 869,000 | | | | 825,850 | |
| Global Atlantic Fin Co.† | | 4.70%
(5 Yr. Treasury CMT + 3.80% | )# | 10/15/2051 | | | 1,000,000 | | | | 763,283 | |
| Northwestern Mutual Life Insurance Co. (The)† | | 3.85% | | 9/30/2047 | | | 1,456,000 | | | | 1,117,599 | |
| PartnerRe Finance B LLC | | 3.70% | | 7/2/2029 | | | 1,806,000 | | | | 1,633,117 | |
| Selective Insurance Group, Inc. | | 5.375% | | 3/1/2049 | | | 1,169,000 | | | | 1,006,878 | |
| Teachers Insurance & Annuity Association of America† | | 4.27% | | 5/15/2047 | | | 889,000 | | | | 731,155 | |
| Teachers Insurance & Annuity Association of America† | | 4.90% | | 9/15/2044 | | | 1,506,000 | | | | 1,384,130 | |
| Transatlantic Holdings, Inc. | | 8.00% | | 11/30/2039 | | | 934,000 | | | | 1,163,311 | |
| W R Berkley Corp. | | 3.15% | | 9/30/2061 | | | 900,000 | | | | 551,802 | |
| Total | | | | | | | | | | | 17,809,735 | |
| | | | | | | | | | | | | |
| Internet 2.34% | | | | | | | | | | | | |
| Alibaba Group Holding Ltd. (China)(a) | | 2.125% | | 2/9/2031 | | | 3,468,000 | | | | 2,769,446 | |
| Amazon.com, Inc. | | 3.15% | | 8/22/2027 | | | 7,000,000 | | | | 6,589,343 | |
| Gen Digital, Inc.† | | 6.75% | | 9/30/2027 | | | 1,126,000 | | | | 1,104,944 | |
| Go Daddy Operating Co. LLC/GD Finance Co., Inc.† | | 5.25% | | 12/1/2027 | | | 1,235,000 | | | | 1,171,002 | |
| Meta Platforms, Inc. | | 4.45% | | 8/15/2052 | | | 2,247,000 | | | | 1,797,245 | |
| Netflix, Inc.(f) | | 3.625% | | 5/15/2027 | | EUR | 2,500,000 | | | | 2,581,116 | |
| Netflix, Inc. | | 4.875% | | 4/15/2028 | | $ | 3,733,000 | | | | 3,612,933 | |
| | | |
| | See Notes to Financial Statements. | 21 |
Schedule of Investments (continued)
December 31, 2022
| | | Interest | | Maturity | | Principal | | | Fair | |
| Investments | | Rate | | Date | | Amount | | | Value | |
| Internet (continued) | | | | | | | | | | | | |
| Tencent Holdings Ltd. (China)†(a) | | 3.595% | | 1/19/2028 | | $ | 3,150,000 | | | $ | 2,892,546 | |
| Tencent Holdings Ltd. (China)†(a) | | 3.925% | | 1/19/2038 | | | 2,149,000 | | | | 1,716,143 | |
| VeriSign, Inc. | | 2.70% | | 6/15/2031 | | | 1,384,000 | | | | 1,130,618 | |
| Total | | | | | | | | | | | 25,365,336 | |
| | | | | | | | | | | | | |
| Investment Companies 0.08% | | | | | | | | | | | | |
| Temasek Financial I Ltd. (Singapore)†(a) | | 2.50% | | 10/6/2070 | | | 1,480,000 | | | | 869,689 | |
| | | | | | | | | | | | | |
| Iron-Steel 0.58% | | | | | | | | | | | | |
| ArcelorMittal SA (Luxembourg)(a) | | 6.55% | | 11/29/2027 | | | 1,141,000 | | | | 1,148,325 | |
| Baffinland Iron Mines Corp./Baffinland Iron Mines LP (Canada)†(a) | | 8.75% | | 7/15/2026 | | | 661,000 | | | | 627,778 | |
| Mineral Resources Ltd. (Australia)†(a) | | 8.50% | | 5/1/2030 | | | 1,798,000 | | | | 1,824,961 | |
| Steel Dynamics, Inc. | | 3.45% | | 4/15/2030 | | | 486,000 | | | | 428,449 | |
| United States Steel Corp. | | 6.875% | | 3/1/2029 | | | 1,102,000 | | | | 1,071,140 | |
| Vale Overseas Ltd. (Brazil)(a) | | 3.75% | | 7/8/2030 | | | 1,309,000 | | | | 1,148,237 | |
| Total | | | | | | | | | | | 6,248,890 | |
| | | | | | | | | | | | | |
| Leisure Time 0.19% | | | | | | | | | | | | |
| Life Time, Inc.† | | 5.75% | | 1/15/2026 | | | 895,000 | | | | 833,916 | |
| NCL Corp. Ltd.† | | 5.875% | | 2/15/2027 | | | 1,378,000 | | | | 1,195,353 | |
| Total | | | | | | | | | | | 2,029,269 | |
| | | | | | | | | | | | | |
| Lodging 1.74% | | | | | | | | | | | | |
| Boyd Gaming Corp. | | 4.75% | | 12/1/2027 | | | 1,201,000 | | | | 1,120,341 | |
| Genting New York LLC/GENNY Capital, Inc.† | | 3.30% | | 2/15/2026 | | | 1,306,000 | | | | 1,142,648 | |
| Hilton Domestic Operating Co., Inc.† | | 3.75% | | 5/1/2029 | | | 1,268,000 | | | | 1,098,519 | |
| Hilton Domestic Operating Co., Inc. | | 4.875% | | 1/15/2030 | | | 3,480,000 | | | | 3,159,457 | |
| Las Vegas Sands Corp. | | 3.50% | | 8/18/2026 | | | 1,835,000 | | | | 1,658,930 | |
| Marriott International, Inc. | | 3.50% | | 10/15/2032 | | | 1,250,000 | | | | 1,043,297 | |
| Sands China Ltd. (Macau)(a) | | 3.35% | | 3/8/2029 | | | 1,638,000 | | | | 1,340,395 | |
| Sands China Ltd. (Macau)(a) | | 4.875% | | 6/18/2030 | | | 1,640,000 | | | | 1,443,430 | |
| Sands China Ltd. (Macau)(a) | | 5.90% | | 8/8/2028 | | | 1,442,000 | | | | 1,352,110 | |
| Travel + Leisure Co. | | 6.00% | | 4/1/2027 | | | 1,439,000 | | | | 1,368,216 | |
| Wynn Las Vegas LLC/Wynn Las Vegas Capital Corp.† | | 5.25% | | 5/15/2027 | | | 2,424,000 | | | | 2,191,419 | |
| Wynn Las Vegas LLC/Wynn Las Vegas Capital Corp.† | | 5.50% | | 3/1/2025 | | | 2,000,000 | | | | 1,902,812 | |
| Total | | | | | | | | | | | 18,821,574 | |
| | | |
| 22 | See Notes to Financial Statements. | |
Schedule of Investments (continued)
December 31, 2022
| | | Interest | | Maturity | | Principal | | | Fair | |
| Investments | | Rate | | Date | | Amount | | | Value | |
| Machinery-Diversified 0.28% | | | | | | | | | | | | |
| nVent Finance Sarl (Luxembourg)(a) | | 2.75% | | 11/15/2031 | | $ | 783,000 | | | $ | 604,421 | |
| TK Elevator US Newco, Inc.† | | 5.25% | | 7/15/2027 | | | 1,240,000 | | | | 1,103,104 | |
| Westinghouse Air Brake Technologies Corp. | | 3.45% | | 11/15/2026 | | | 1,421,000 | | | | 1,321,946 | |
| Total | | | | | | | | | | | 3,029,471 | |
| | | | | | | | | | | | | |
| Media 2.00% | | | | | | | | | | | | |
| Cable One, Inc.† | | 4.00% | | 11/15/2030 | | | 2,012,000 | | | | 1,581,313 | |
| CCO Holdings LLC/CCO Holdings Capital Corp.† | | 5.00% | | 2/1/2028 | | | 1,746,000 | | | | 1,589,200 | |
| CCO Holdings LLC/CCO Holdings Capital Corp.† | | 5.375% | | 6/1/2029 | | | 1,881,000 | | | | 1,705,173 | |
| CCO Holdings LLC/CCO Holdings Capital Corp.† | | 6.375% | | 9/1/2029 | | | 1,484,000 | | | | 1,397,431 | |
| CSC Holdings LLC† | | 4.125% | | 12/1/2030 | | | 2,713,000 | | | | 1,920,899 | |
| DISH Network Corp.† | | 11.75% | | 11/15/2027 | | | 2,371,000 | | | | 2,444,857 | |
| FactSet Research Systems, Inc. | | 3.45% | | 3/1/2032 | | | 1,962,000 | | | | 1,650,161 | |
| LCPR Senior Secured Financing DAC (Ireland)†(a) | | 6.75% | | 10/15/2027 | | | 708,000 | | | | 663,623 | |
| News Corp.† | | 3.875% | | 5/15/2029 | | | 1,559,000 | | | | 1,354,514 | |
| Nexstar Media, Inc.† | | 4.75% | | 11/1/2028 | | | 1,280,000 | | | | 1,109,133 | |
| Univision Communications, Inc.† | | 4.50% | | 5/1/2029 | | | 2,508,000 | | | | 2,102,043 | |
| UPC Broadband Finco BV (Netherlands)†(a) | | 4.875% | | 7/15/2031 | | | 2,867,000 | | | | 2,390,533 | |
| VZ Secured Financing BV (Netherlands)†(a) | | 5.00% | | 1/15/2032 | | | 2,228,000 | | | | 1,814,553 | |
| Total | | | | | | | | | | | 21,723,433 | |
| | | | | | | | | | | | | |
| Metal Fabricate-Hardware 0.22% | | | | | | | | | | | | |
| Roller Bearing Co. of America, Inc.† | | 4.375% | | 10/15/2029 | | | 2,799,000 | | | | 2,423,794 | |
| | | | | | | | | | | | | |
| Mining 1.36% | | | | | | | | | | | | |
| Anglo American Capital plc (United Kingdom)†(a) | | 5.625% | | 4/1/2030 | | | 1,100,000 | | | | 1,094,693 | |
| FMG Resources August 2006 Pty Ltd. (Australia)†(a) | | 4.375% | | 4/1/2031 | | | 4,005,000 | | | | 3,338,602 | |
| FMG Resources August Pty. Ltd. (Australia)†(a) | | 6.125% | | 4/15/2032 | | | 1,346,000 | | | | 1,257,225 | |
| Fresnillo PLC (Mexico)(a) | | 4.25% | | 10/2/2050 | | | 274,000 | | | | 216,198 | |
| Glencore Funding LLC† | | 2.50% | | 9/1/2030 | | | 2,300,000 | | | | 1,872,150 | |
| Hecla Mining Co. | | 7.25% | | 2/15/2028 | | | 1,194,000 | | | | 1,177,500 | |
| Kaiser Aluminum Corp.† | | 4.50% | | 6/1/2031 | | | 1,528,000 | | | | 1,230,116 | |
| Mirabela Nickel Ltd. | | 1.00% | | 9/10/2044 | | | 15,172 | | | | 1 | (d) |
| Newmont Corp. | | 2.25% | | 10/1/2030 | | | 1,318,000 | | | | 1,062,376 | |
| Novelis Corp.† | | 4.75% | | 1/30/2030 | | | 2,071,000 | | | | 1,840,746 | |
| Teck Resources Ltd. (Canada)(a) | | 3.90% | | 7/15/2030 | | | 1,913,000 | | | | 1,715,309 | |
| Total | | | | | | | | | | | 14,804,916 | |
| | | |
| | See Notes to Financial Statements. | 23 |
Schedule of Investments (continued)
December 31, 2022
| | | Interest | | Maturity | | Principal | | | Fair | |
| Investments | | Rate | | Date | | Amount | | | Value | |
| Miscellaneous Manufacturing 0.21% | | | | | | | | | | | | |
| Eaton Corp. | | 4.15% | | 3/15/2033 | | $ | 1,342,000 | | | $ | 1,251,792 | |
| Hillenbrand, Inc. | | 3.75% | | 3/1/2031 | | | 1,275,000 | | | | 1,047,158 | |
| Total | | | | | | | | | | | 2,298,950 | |
| | | | | | | | | | | | | |
| Multi-National 0.35% | | | | | | | | | | | | |
| Asian Development Bank (Philippines)(a) | | 4.597%
(SOFR Index + 1.00% | )# | 4/6/2027 | | | 3,683,000 | | | | 3,765,033 | |
| | | | | | | | | | | | | |
| Office/Business Equipment 0.10% | | | | | | | | | | | | |
| CDW LLC/CDW Finance Corp. | | 3.569% | | 12/1/2031 | | | 1,287,000 | | | | 1,062,948 | |
| | | | | | | | | | | | | |
| Oil & Gas 12.10% | | | | | | | | | | | | |
| Antero Resources Corp.† | | 5.375% | | 3/1/2030 | | | 4,893,000 | | | | 4,542,955 | |
| Apache Corp. | | 4.25% | | 1/15/2030 | | | 2,793,000 | | | | 2,476,502 | |
| Apache Corp. | | 4.75% | | 4/15/2043 | | | 1,641,000 | | | | 1,241,047 | |
| Apache Corp. | | 5.10% | | 9/1/2040 | | | 3,580,000 | | | | 2,974,864 | |
| California Resources Corp.† | | 7.125% | | 2/1/2026 | | | 2,160,000 | | | | 2,078,395 | |
| Callon Petroleum Co. | | 6.375% | | 7/1/2026 | | | 2,011,000 | | | | 1,877,521 | |
| Callon Petroleum Co.† | | 8.00% | | 8/1/2028 | | | 1,951,000 | | | | 1,862,383 | |
| Cenovus Energy, Inc. (Canada)(a) | | 2.65% | | 1/15/2032 | | | 1,364,000 | | | | 1,092,576 | |
| Cenovus Energy, Inc. (Canada)(a) | | 3.75% | | 2/15/2052 | | | 2,668,000 | | | | 1,885,429 | |
| Cenovus Energy, Inc. (Canada)(a) | | 5.40% | | 6/15/2047 | | | 3,846,000 | | | | 3,458,504 | |
| Chesapeake Energy Corp.† | | 6.75% | | 4/15/2029 | | | 2,643,000 | | | | 2,576,793 | |
| CITGO Petroleum Corp.† | | 7.00% | | 6/15/2025 | | | 1,160,000 | | | | 1,134,109 | |
| CNX Resources Corp.† | | 7.25% | | 3/14/2027 | | | 1,068,000 | | | | 1,061,827 | |
| Comstock Resources, Inc.† | | 5.875% | | 1/15/2030 | | | 1,615,000 | | | | 1,390,515 | |
| Comstock Resources, Inc.† | | 6.75% | | 3/1/2029 | | | 1,713,000 | | | | 1,549,083 | |
| Continental Resources, Inc. | | 4.375% | | 1/15/2028 | | | 4,075,000 | | | | 3,740,402 | |
| Continental Resources, Inc.† | | 5.75% | | 1/15/2031 | | | 1,644,000 | | | | 1,533,565 | |
| Crescent Energy Finance LLC† | | 7.25% | | 5/1/2026 | | | 1,716,000 | | | | 1,619,243 | |
| CrownRock LP/CrownRock Finance, Inc.† | | 5.00% | | 5/1/2029 | | | 1,840,000 | | | | 1,663,076 | |
| Diamondback Energy, Inc. | | 3.50% | | 12/1/2029 | | | 2,292,000 | | | | 2,015,840 | |
| Diamondback Energy, Inc. | | 4.25% | | 3/15/2052 | | | 2,616,000 | | | | 1,925,627 | |
| Diamondback Energy, Inc. | | 4.40% | | 3/24/2051 | | | 2,777,000 | | | | 2,128,083 | |
| Encino Acquisition Partners Holdings LLC† | | 8.50% | | 5/1/2028 | | | 1,734,000 | | | | 1,587,104 | |
| Endeavor Energy Resources LP/EER Finance, Inc.† | | 5.75% | | 1/30/2028 | | | 2,818,000 | | | | 2,702,885 | |
| Exxon Mobil Corp. | | 3.043% | | 3/1/2026 | | | 823,000 | | | | 785,920 | |
| Geopark Ltd. (Colombia)†(a) | | 5.50% | | 1/17/2027 | | | 418,000 | | | | 360,034 | |
| Helmerich & Payne, Inc. | | 2.90% | | 9/29/2031 | | | 2,358,000 | | | | 1,919,779 | |
| Hess Corp. | | 5.60% | | 2/15/2041 | | | 1,617,000 | | | | 1,535,587 | |
| | | |
| 24 | See Notes to Financial Statements. | |
Schedule of Investments (continued)
December 31, 2022
| | | Interest | | Maturity | | Principal | | | Fair | |
| Investments | | Rate | | Date | | Amount | | | Value | |
| Oil & Gas (continued) | | | | | | | | | | | | |
| Hess Corp. | | 5.80% | | 4/1/2047 | | $ | 693,000 | | | $ | 665,092 | |
| Kosmos Energy Ltd.† | | 7.125% | | 4/4/2026 | | | 467,000 | | | | 398,855 | |
| Kosmos Energy Ltd.† | | 7.75% | | 5/1/2027 | | | 2,079,000 | | | | 1,738,762 | |
| Laredo Petroleum, Inc.† | | 7.75% | | 7/31/2029 | | | 2,617,000 | | | | 2,358,922 | |
| Laredo Petroleum, Inc. | | 10.125% | | 1/15/2028 | | | 3,500,000 | | | | 3,418,570 | |
| Matador Resources Co. | | 5.875% | | 9/15/2026 | | | 1,088,000 | | | | 1,047,656 | |
| MC Brazil Downstream Trading Sarl (Luxembourg)†(a) | | 7.25% | | 6/30/2031 | | | 1,536,000 | | | | 1,269,593 | |
| MEG Energy Corp. (Canada)†(a) | | 5.875% | | 2/1/2029 | | | 2,312,000 | | | | 2,183,222 | |
| MEG Energy Corp. (Canada)†(a) | | 7.125% | | 2/1/2027 | | | 2,420,000 | | | | 2,471,732 | |
| Murphy Oil Corp. | | 5.875% | | 12/1/2027 | | | 2,000,000 | | | | 1,928,020 | |
| Murphy Oil Corp. | | 6.375% | | 7/15/2028 | | | 1,241,000 | | | | 1,196,299 | |
| Nabors Industries, Inc.† | | 7.375% | | 5/15/2027 | | | 1,083,000 | | | | 1,050,347 | |
| Occidental Petroleum Corp. | | 6.125% | | 1/1/2031 | | | 3,933,000 | | | | 3,976,714 | |
| Occidental Petroleum Corp. | | 6.625% | | 9/1/2030 | | | 837,000 | | | | 866,826 | |
| Occidental Petroleum Corp. | | 7.50% | | 5/1/2031 | | | 1,013,000 | | | | 1,084,062 | |
| OQ SAOC (Oman)†(a) | | 5.125% | | 5/6/2028 | | | 1,782,000 | | | | 1,694,128 | |
| Ovintiv, Inc. | | 6.50% | | 2/1/2038 | | | 1,948,000 | | | | 1,937,638 | |
| Patterson-UTI Energy, Inc. | | 3.95% | | 2/1/2028 | | | 1,394,000 | | | | 1,230,723 | |
| Patterson-UTI Energy, Inc. | | 5.15% | | 11/15/2029 | | | 1,562,000 | | | | 1,403,253 | |
| PDC Energy, Inc. | | 5.75% | | 5/15/2026 | | | 2,868,000 | | | | 2,742,382 | |
| Permian Resources Operating LLC† | | 5.375% | | 1/15/2026 | | | 1,659,000 | | | | 1,512,783 | |
| Permian Resources Operating LLC† | | 6.875% | | 4/1/2027 | | | 3,588,000 | | | | 3,390,294 | |
| Pioneer Natural Resources Co. | | 2.15% | | 1/15/2031 | | | 1,344,000 | | | | 1,065,467 | |
| Precision Drilling Corp. (Canada)†(a) | | 6.875% | | 1/15/2029 | | | 1,295,000 | | | | 1,207,337 | |
| QatarEnergy Trading LLC (Qatar)†(a) | | 3.30% | | 7/12/2051 | | | 5,399,000 | | | | 3,999,579 | |
| Range Resources Corp.† | | 4.75% | | 2/15/2030 | | | 2,643,000 | | | | 2,332,586 | |
| Range Resources Corp. | | 8.25% | | 1/15/2029 | | | 2,791,000 | | | | 2,879,726 | |
| Rockcliff Energy II LLC† | | 5.50% | | 10/15/2029 | | | 1,194,000 | | | | 1,093,973 | |
| Saudi Arabian Oil Co. (Saudi Arabia)(a) | | 2.875% | | 4/16/2024 | | | 1,600,000 | | | | 1,553,021 | |
| Saudi Arabian Oil Co. (Saudi Arabia)†(a) | | 4.375% | | 4/16/2049 | | | 2,895,000 | | | | 2,499,844 | |
| Shell International Finance BV (Netherlands)(a) | | 2.875% | | 5/10/2026 | | | 914,000 | | | | 861,843 | |
| Shell International Finance BV (Netherlands)(a) | | 6.375% | | 12/15/2038 | | | 1,473,000 | | | | 1,626,460 | |
| SM Energy Co. | | 6.625% | | 1/15/2027 | | | 4,388,000 | | | | 4,233,542 | |
| SM Energy Co. | | 6.75% | | 9/15/2026 | | | 1,112,000 | | | | 1,081,337 | |
| Southwestern Energy Co. | | 4.75% | | 2/1/2032 | | | 1,212,000 | | | | 1,038,096 | |
| Southwestern Energy Co. | | 5.375% | | 2/1/2029 | | | 2,333,000 | | | | 2,166,202 | |
| Southwestern Energy Co. | | 5.375% | | 3/15/2030 | | | 3,246,000 | | | | 2,966,662 | |
| | | |
| | See Notes to Financial Statements. | 25 |
Schedule of Investments (continued)
December 31, 2022
| | | Interest | | Maturity | | Principal | | | Fair | |
| Investments | | Rate | | Date | | Amount | | | Value | |
| Oil & Gas (continued) | | | | | | | | | | | | |
| Southwestern Energy Co. | | 8.375% | | 9/15/2028 | | $ | 1,608,000 | | | $ | 1,660,591 | |
| Suncor Energy, Inc. (Canada)(a) | | 4.00% | | 11/15/2047 | | | 2,713,000 | | | | 2,068,914 | |
| Texaco Capital, Inc. | | 8.625% | | 11/15/2031 | | | 722,000 | | | | 878,329 | |
| Viper Energy Partners LP† | | 5.375% | | 11/1/2027 | | | 1,751,000 | | | | 1,665,604 | |
| Total | | | | | | | | | | | 131,164,634 | |
| | | | | | | | | | | | | |
| Oil & Gas Services 0.54% | | | | | | | | | | | | |
| Oceaneering International, Inc. | | 4.65% | | 11/15/2024 | | | 1,301,000 | | | | 1,244,522 | |
| Oceaneering International, Inc. | | 6.00% | | 2/1/2028 | | | 1,464,000 | | | | 1,350,713 | |
| USA Compression Partners LP/USA Compression Finance Corp. | | 6.875% | | 9/1/2027 | | | 1,271,000 | | | | 1,190,425 | |
| Weatherford International Ltd.† | | 8.625% | | 4/30/2030 | | | 2,101,000 | | | | 2,021,358 | |
| Total | | | | | | | | | | | 5,807,018 | |
| | | | | | | | | | | | | |
| Packaging & Containers 0.49% | | | | | | | | | | | | |
| Ball Corp. | | 2.875% | | 8/15/2030 | | | 2,897,000 | | | | 2,318,194 | |
| Ball Corp. | | 6.875% | | 3/15/2028 | | | 1,541,000 | | | | 1,584,872 | |
| Crown Cork & Seal Co., Inc. | | 7.375% | | 12/15/2026 | | | 363,000 | | | | 374,337 | |
| Sealed Air Corp.† | | 6.875% | | 7/15/2033 | | | 1,060,000 | | | | 1,052,307 | |
| Total | | | | | | | | | | | 5,329,710 | |
| | | | | | | | | | | | | |
| Pharmaceuticals 0.98% | | | | | | | | | | | | |
| AbbVie, Inc. | | 3.20% | | 11/21/2029 | | | 1,000,000 | | | | 903,751 | |
| AbbVie, Inc. | | 4.25% | | 11/21/2049 | | | 1,409,000 | | | | 1,176,551 | |
| BellRing Brands, Inc.† | | 7.00% | | 3/15/2030 | | | 874,000 | | | | 842,121 | |
| CVS Health Corp. | | 3.625% | | 4/1/2027 | | | 1,549,000 | | | | 1,472,298 | |
| Hess Midstream Operations LP† | | 5.125% | | 6/15/2028 | | | 918,000 | | | | 850,496 | |
| Organon & Co./Organon Foreign Debt Co-Issuer BV† | | 4.125% | | 4/30/2028 | | | 1,285,000 | | | | 1,139,988 | |
| Owens & Minor, Inc.† | | 4.50% | | 3/31/2029 | | | 1,344,000 | | | | 1,073,319 | |
| Pfizer, Inc. | | 2.625% | | 4/1/2030 | | | 1,246,000 | | | | 1,097,463 | |
| Teva Pharmaceutical Finance Netherlands III BV (Netherlands)(a) | | 5.125% | | 5/9/2029 | | | 1,065,000 | | | | 949,817 | |
| Zoetis, Inc. | | 2.00% | | 5/15/2030 | | | 1,387,000 | | | | 1,128,727 | |
| Total | | | | | | | | | | | 10,634,531 | |
| | | | | | | | | | | | | |
| Pipelines 3.02% | | | | | | | | | | | | |
| Abu Dhabi Crude Oil Pipeline LLC (United Arab Emirates)†(a) | | 4.60% | | 11/2/2047 | | | 1,779,000 | | | | 1,641,483 | |
| AI Candelaria Spain SA (Spain)†(a) | | 5.75% | | 6/15/2033 | | | 1,646,000 | | | | 1,254,384 | |
| AI Candelaria Spain SA (Spain)†(a) | | 7.50% | | 12/15/2028 | | | 1,224,171 | | | | 1,161,487 | |
| | | |
| 26 | See Notes to Financial Statements. | |
Schedule of Investments (continued)
December 31, 2022
| | | Interest | | Maturity | | Principal | | | Fair | |
| Investments | | Rate | | Date | | Amount | | | Value | |
| Pipelines (continued) | | | | | | | | | | | | |
| Buckeye Partners LP | | 6.375%
(3 Mo. LIBOR + 4.02% | )# | 1/22/2078 | | $ | 1,532,000 | | | $ | 1,306,093 | |
| Cheniere Energy Partners LP | | 3.25% | | 1/31/2032 | | | 2,096,000 | | | | 1,668,535 | |
| Colonial Enterprises, Inc.† | | 3.25% | | 5/15/2030 | | | 1,241,000 | | | | 1,077,305 | |
| CQP Holdco LP/BIP-V Chinook Holdco LLC† | | 5.50% | | 6/15/2031 | | | 3,394,000 | | | | 2,971,040 | |
| DT Midstream, Inc.† | | 4.30% | | 4/15/2032 | | | 1,293,000 | | | | 1,137,885 | |
| Galaxy Pipeline Assets Bidco Ltd. (United Arab Emirates)†(a) | | 3.25% | | 9/30/2040 | | | 3,001,000 | | | | 2,333,590 | |
| Magellan Midstream Partners LP | | 3.95% | | 3/1/2050 | | | 2,259,000 | | | | 1,663,225 | |
| NGPL PipeCo LLC† | | 3.25% | | 7/15/2031 | | | 1,530,000 | | | | 1,248,512 | |
| NGPL PipeCo LLC† | | 4.875% | | 8/15/2027 | | | 852,000 | | | | 810,643 | |
| Northern Natural Gas Co.† | | 4.30% | | 1/15/2049 | | | 811,000 | | | | 648,746 | |
| Oleoducto Central SA (Colombia)(a) | | 4.00% | | 7/14/2027 | | | 856,000 | | | | 756,094 | |
| ONEOK, Inc. | | 4.45% | | 9/1/2049 | | | 1,288,000 | | | | 962,549 | |
| Sabal Trail Transmission LLC† | | 4.246% | | 5/1/2028 | | | 1,125,000 | | | | 1,044,613 | |
| Sabine Pass Liquefaction LLC | | 4.50% | | 5/15/2030 | | | 3,627,000 | | | | 3,370,540 | |
| Venture Global Calcasieu Pass LLC† | | 3.875% | | 8/15/2029 | | | 1,321,000 | | | | 1,158,193 | |
| Venture Global Calcasieu Pass LLC† | | 4.125% | | 8/15/2031 | | | 1,293,000 | | | | 1,103,899 | |
| Western Midstream Operating LP | | 4.30% | | 2/1/2030 | | | 3,702,000 | | | | 3,239,898 | |
| Williams Cos., Inc. (The) | | 4.65% | | 8/15/2032 | | | 2,381,000 | | | | 2,223,504 | |
| Total | | | | | | | | | | | 32,782,218 | |
| | | | | | | | | | | | | |
| Real Estate 0.14% | | | | | | | | | | | | |
| Hunt Cos., Inc.† | | 5.25% | | 4/15/2029 | | | 1,866,000 | | | | 1,570,822 | |
| | | | | | | | | | | | | |
| REITS 1.75% | | | | | | | | | | | | |
| Crown Castle, Inc. | | 2.50% | | 7/15/2031 | | | 3,750,000 | | | | 3,031,341 | |
| GLP Capital LP / GLP Financing II, Inc. | | 4.00% | | 1/15/2030 | | | 1,272,000 | | | | 1,116,293 | |
| GLP Capital LP/GLP Financing II, Inc. | | 4.00% | | 1/15/2031 | | | 1,278,000 | | | | 1,098,537 | |
| GLP Capital LP/GLP Financing II, Inc. | | 5.75% | | 6/1/2028 | | | 1,000,000 | | | | 985,000 | |
| Goodman U.S. Finance Five LLC† | | 4.625% | | 5/4/2032 | | | 1,095,000 | | | | 1,001,362 | |
| Goodman US Finance Four LLC† | | 4.50% | | 10/15/2037 | | | 1,079,000 | | | | 907,638 | |
| Prologis LP | | 4.375% | | 2/1/2029 | | | 1,106,000 | | | | 1,057,195 | |
| Rayonier LP | | 2.75% | | 5/17/2031 | | | 2,532,000 | | | | 2,040,245 | |
| SBA Communications Corp. | | 3.875% | | 2/15/2027 | | | 4,137,000 | | | | 3,744,868 | |
| VICI Properties LP/VICI Note Co., Inc.† | | 4.625% | | 6/15/2025 | | | 1,328,000 | | | | 1,274,946 | |
| VICI Properties LP/VICI Note Co., Inc.† | | 4.625% | | 12/1/2029 | | | 2,948,000 | | | | 2,687,633 | |
| Total | | | | | | | | | | | 18,945,058 | |
| | | |
| | See Notes to Financial Statements. | 27 |
Schedule of Investments (continued)
December 31, 2022
| | | Interest | | Maturity | | Principal | | | Fair | |
| Investments | | Rate | | Date | | Amount | | | Value | |
| Retail 1.52% | | | | | | | | | | | | |
| Bath & Body Works, Inc. | | 5.25% | | 2/1/2028 | | $ | 830,000 | | | $ | 772,091 | |
| Costco Wholesale Corp. | | 1.75% | | 4/20/2032 | | | 1,511,000 | | | | 1,198,704 | |
| Dollar Tree, Inc. | | 3.375% | | 12/1/2051 | | | 3,366,000 | | | | 2,274,603 | |
| Gap, Inc. (The)† | | 3.875% | | 10/1/2031 | | | 1,579,000 | | | | 1,103,855 | |
| Genuine Parts Co. | | 2.75% | | 2/1/2032 | | | 1,448,000 | | | | 1,165,965 | |
| Murphy Oil USA, Inc.† | | 3.75% | | 2/15/2031 | | | 1,934,000 | | | | 1,595,201 | |
| Murphy Oil USA, Inc. | | 4.75% | | 9/15/2029 | | | 1,500,000 | | | | 1,375,208 | |
| PetSmart, Inc./PetSmart Finance Corp.† | | 4.75% | | 2/15/2028 | | | 985,000 | | | | 893,604 | |
| SRS Distribution, Inc.† | | 4.625% | | 7/1/2028 | | | 1,478,000 | | | | 1,312,080 | |
| Stonegate Pub Co. Financing 2019 plc(f) | | 8.00% | | 7/13/2025 | | GBP | 1,006,000 | | | | 1,088,806 | |
| Stonegate Pub Co. Financing 2019 plc(f) | | 8.25% | | 7/31/2025 | | GBP | 1,860,000 | | | | 2,041,715 | |
| Tiffany & Co. | | 4.90% | | 10/1/2044 | | $ | 1,816,000 | | | | 1,610,753 | |
| Total | | | | | | | | | | | 16,432,585 | |
| | | | | | | | | | | | | |
| Savings & Loans 0.00% | | | | | | | | | | | | |
| Washington Mutual Bank(g) | | 6.875% | | 6/15/2011 | | | 1,250,000 | | | | 125 | (d) |
| | | | | | | | | | | | | |
| Semiconductors 1.01% | | | | | | | | | | | | |
| Entegris Escrow Corp.† | | 4.75% | | 4/15/2029 | | | 1,215,000 | | | | 1,110,452 | |
| KLA Corp. | | 4.10% | | 3/15/2029 | | | 1,114,000 | | | | 1,077,265 | |
| KLA Corp. | | 4.65% | | 7/15/2032 | | | 1,696,000 | | | | 1,666,513 | |
| Lam Research Corp. | | 4.875% | | 3/15/2049 | | | 808,000 | | | | 769,577 | |
| ON Semiconductor Corp.† | | 3.875% | | 9/1/2028 | | | 3,036,000 | | | | 2,654,044 | |
| TSMC Arizona Corp. | | 3.25% | | 10/25/2051 | | | 5,159,000 | | | | 3,731,979 | |
| Total | | | | | | | | | | | 11,009,830 | |
| | | | | | | | | | | | | |
| Shipbuilding 0.19% | | | | | | | | | | | | |
| Huntington Ingalls Industries, Inc. | | 4.20% | | 5/1/2030 | | | 2,251,000 | | | | 2,048,321 | |
| | | | | | | | | | | | | |
| Software 1.87% | | | | | | | | | | | | |
| Autodesk, Inc. | | 3.50% | | 6/15/2027 | | | 1,446,000 | | | | 1,356,953 | |
| Electronic Arts, Inc. | | 2.95% | | 2/15/2051 | | | 1,588,000 | | | | 1,031,607 | |
| Intuit, Inc. | | 1.65% | | 7/15/2030 | | | 2,012,000 | | | | 1,618,861 | |
| Microsoft Corp. | | 3.30% | | 2/6/2027 | | | 968,000 | | | | 934,319 | |
| MSCI, Inc.† | | 3.25% | | 8/15/2033 | | | 1,483,000 | | | | 1,147,402 | |
| MSCI, Inc.† | | 3.875% | | 2/15/2031 | | | 3,447,000 | | | | 2,872,040 | |
| MSCI, Inc.† | | 4.00% | | 11/15/2029 | | | 2,299,000 | | | | 2,006,590 | |
| Oracle Corp. | | 3.60% | | 4/1/2050 | | | 692,000 | | | | 468,795 | |
| Oracle Corp. | | 4.50% | | 7/8/2044 | | | 1,280,000 | | | | 1,035,377 | |
| PTC, Inc.† | | 4.00% | | 2/15/2028 | | | 1,211,000 | | | | 1,092,023 | |
| ROBLOX Corp.† | | 3.875% | | 5/1/2030 | | | 2,680,000 | | | | 2,115,860 | |
| Roper Technologies, Inc. | | 1.75% | | 2/15/2031 | | | 1,352,000 | | | | 1,044,727 | |
| | | |
| 28 | See Notes to Financial Statements. | |
Schedule of Investments (continued)
December 31, 2022
| | | Interest | | Maturity | | Principal | | | Fair | |
| Investments | | Rate | | Date | | Amount | | | Value | |
| Software (continued) | | | | | | | | | | | | |
| ServiceNow, Inc. | | 1.40% | | 9/1/2030 | | $ | 2,297,000 | | | $ | 1,762,416 | |
| Workday, Inc. | | 3.80% | | 4/1/2032 | | | 1,975,000 | | | | 1,748,926 | |
| Total | | | | | | | | | | | 20,235,896 | |
| | | | | | | | | | | | | |
| Sovereign 0.27% | | | | | | | | | | | | |
| Export Finance & Insurance Corp. (Australia)†(a) | | 4.625% | | 10/26/2027 | | | 2,859,000 | | | | 2,891,109 | |
| | | | | | | | | | | | | |
| Telecommunications 2.73% | | | | | | | | | | | | |
| Altice France SA (France)†(a) | | 5.125% | | 7/15/2029 | | | 1,458,000 | | | | 1,095,728 | |
| Altice France SA (France)†(a) | | 5.50% | | 10/15/2029 | | | 1,383,000 | | | | 1,057,048 | |
| Connect Finco SARL/Connect US Finco LLC (Luxembourg)†(a) | | 6.75% | | 10/1/2026 | | | 1,264,000 | | | | 1,174,028 | |
| Frontier Communications Holdings LLC† | | 5.875% | | 10/15/2027 | | | 1,730,000 | | | | 1,610,232 | |
| Hughes Satellite Systems Corp. | | 5.25% | | 8/1/2026 | | | 1,111,000 | | | | 1,067,582 | |
| NTT Finance Corp. (Japan)†(a) | | 4.372% | | 7/27/2027 | | | 1,148,000 | | | | 1,123,183 | |
| Sprint Capital Corp. | | 6.875% | | 11/15/2028 | | | 5,646,000 | | | | 5,872,941 | |
| T-Mobile USA, Inc. | | 3.375% | | 4/15/2029 | | | 5,643,000 | | | | 4,981,045 | |
| T-Mobile USA, Inc. | | 3.875% | | 4/15/2030 | | | 1,099,000 | | | | 998,068 | �� |
| T-Mobile USA, Inc. | | 4.50% | | 4/15/2050 | | | 1,311,000 | | | | 1,084,310 | |
| Verizon Communications, Inc. | | 4.016% | | 12/3/2029 | | | 2,942,000 | | | | 2,754,780 | |
| Vmed O2 UK Financing I plc (United Kingdom)†(a) | | 4.25% | | 1/31/2031 | | | 4,435,000 | | | | 3,600,200 | |
| Vmed O2 UK Financing I plc (United Kingdom)†(a) | | 4.75% | | 7/15/2031 | | | 2,413,000 | | | | 1,964,918 | |
| Xiaomi Best Time International Ltd. (Hong Kong)†(a) | | 4.10% | | 7/14/2051 | | | 2,066,000 | | | | 1,201,785 | |
| Total | | | | | | | | | | | 29,585,848 | |
| | | | | | | | | | | | | |
| Transportation 0.54% | | | | | | | | | | | | |
| Autoridad del Canal de Panama (Panama)†(a) | | 4.95% | | 7/29/2035 | | | 1,000,000 | | | | 946,130 | |
| Central Japan Railway Co. (Japan)(a) | | 2.20% | | 10/2/2024 | | | 1,137,000 | | | | 1,079,515 | |
| Central Japan Railway Co. (Japan)†(a) | | 4.25% | | 11/24/2045 | | | 1,524,000 | | | | 1,301,688 | |
| FedEx Corp. 2020-1 Class AA Pass Through Trust | | 1.875% | | 8/20/2035 | | | 1,264,566 | | | | 1,040,109 | |
| Union Pacific Corp. | | 3.00% | | 4/15/2027 | | | 1,602,000 | | | | 1,493,890 | |
| Total | | | | | | | | | | | 5,861,332 | |
| Total Corporate Bonds (cost $847,987,527) | | | | | | | | | | | 769,307,702 | |
| | | | | | | | | | | | | |
| FLOATING RATE LOANS(h) 1.36% | | | | | | | | | | | | |
| | | | | | | | | | | | | |
| Aerospace/Defense 0.16% | | | | | | | | | | | | |
| Alloy Finco Limited 2020 USD Term Loan B2 (Jersey)(a) | | 10.915%
(3 Mo. LIBOR + 6.50% | ) | 3/6/2024 | | | 656,228 | | | | 607,424 | |
| Alloy Finco Limited USD Holdco PIK Term Loan PIK 13.50% (Jersey)(a) | | 0.50% | | 3/6/2025 | | | 1,301,640 | | | | 1,132,427 | |
| Total | | | | | | | | | | | 1,739,851 | |
| | | |
| | See Notes to Financial Statements. | 29 |
Schedule of Investments (continued)
December 31, 2022
| | | Interest | | Maturity | | Principal | | | Fair | |
| Investments | | Rate | | Date | | Amount | | | Value | |
| Beverages 0.10% | | | | | | | | | | | | |
| Sunshine Investments B.V. 2022 USD Term Loan (Netherlands)(a) | 8.515%
(3 Mo. Term SOFR + 4.25% | ) | 7/12/2029 | | $ | 1,092,307 | | | $ | 1,059,538 | |
| | | | | | | | | | | | | |
| Diversified Capital Goods 0.11% | | | | | | | | | | | | |
| CeramTec AcquiCo GmbH 2022 EUR Term Loan B(f) | | 5.704%
(3 Mo. EURIBOR + 3.75% | ) | 3/16/2029 | | EUR | 1,162,111 | | | | 1,176,147 | |
| | | | | | | | | | | | | |
| Electric: Generation 0.29% | | | | | | | | | | | | |
| Astoria Energy LLC 2020 Term Loan B | | 7.89%
(1 Mo. LIBOR + 3.50% | ) | 12/10/2027 | | $ | 1,802,543 | | | | 1,783,013 | |
| EFS Cogen Holdings I LLC 2020 Term Loan B | | 8.23% - 8.24%
(3 Mo. LIBOR + 3.50% | ) | 10/1/2027 | | | 1,226,406 | | | | 1,182,384 | |
| Frontera Generation Holdings LLC 2021 2nd Lien Term Loan | | 6.23%
(3 Mo. LIBOR + 1.50% | ) | 7/28/2028 | | | 129,040 | | | | 32,260 | |
| Frontera Generation Holdings LLC 2021 Term Loan | | 17.73%
(3 Mo. LIBOR + 13.00% | ) | 7/28/2026 | | | 133,293 | | | | 133,293 | |
| Total | | | | | | | | | | | 3,130,950 | |
| | | | | | | | | | | | | |
| Electric: Integrated 0.17% | | | | | | | | | | | | |
| Generation Bridge Acquisition, LLC Term Loan B | | 9.73%
(3 Mo. LIBOR + 5.00% | ) | 12/1/2028 | | | 667,148 | | | | 662,978 | |
| Generation Bridge Acquisition, LLC Term Loan C | | 9.73%
(3 Mo. LIBOR + 5.00% | ) | 12/1/2028 | | | 14,476 | | | | 14,385 | |
| Helix Gen Funding, LLC Term Loan B | | 8.134%
(1 Mo. LIBOR + 3.75% | ) | 6/3/2024 | | | 1,223,786 | | | | 1,208,397 | |
| Total | | | | | | | | | | | 1,885,760 | |
| | | | | | | | | | | | | |
| Gas Distribution 0.16% | | | | | | | | | | | | |
| Freeport LNG Investments, LLLP Term Loan B | | 7.743%
(3 Mo. LIBOR + 3.50% | ) | 12/21/2028 | | | 1,794,874 | | | | 1,710,865 | |
| | | | | | | | | | | | | |
| Health Facilities 0.12% | | | | | | | | | | | | |
| Electron BidCo Inc. 2021 Term Loan | | 7.384%
(1 Mo. LIBOR + 3.00% | ) | 11/1/2028 | | | 1,314,966 | | | | 1,282,256 | |
| | | | | | | | | | | | | |
| Manufacturing 0.09% | | | | | | | | | | | | |
| Tank Holding Corp. 2022 Term Loan | | 12.25%
(1 Mo. Term SOFR + 5.75% | ) | 3/31/2028 | | | 1,045,447 | | | | 993,174 | |
| | | |
| 30 | See Notes to Financial Statements. | |
Schedule of Investments (continued)
December 31, 2022
| | | Interest | | Maturity | | Principal | | | Fair | |
| Investments | | Rate | | Date | | Amount | | | Value | |
| Personal & Household Products 0.00% | | | | | | | | | | | | |
| FGI Operating Company, LLC Exit Term Loan | | 14.73%
(3 Mo. LIBOR + 10.00% | ) | 5/16/2023 | | $ | 80,004 | | | $ | 10,041 | (i) |
| Revlon Consumer Products Corporation 2020 Additional Term Loan B2 | | 8.144%
(3 Mo. LIBOR + 3.50% | ) | 6/30/2025 | | | 16 | | | | 8 | |
| Total | | | | | | | | | | | 10,049 | |
| | | | | | | | | | | | | |
| Software/Services 0.10% | | | | | | | | | | | | |
| Peraton Corp. Term Loan B | | 8.134%
(1 Mo. LIBOR + 3.75% | ) | 2/1/2028 | | | 1,150,518 | | | | 1,125,592 | |
| | | | | | | | | | | | | |
| Theaters & Entertainment 0.06% | | | | | | | | | | | | |
| Vue International Bidco p.l.c. 2019 EUR Term Loan B(f) | | – | (j) | 7/3/2026 | | EUR | 857,905 | | | | 525,752 | |
| Vue International Bidco p.l.c. 2022 EUR Term Loan(f) | | 9.766%
(3 Mo. EURIBOR + 8.00% | ) | 6/30/2027 | | EUR | 113,307 | | | | 110,980 | |
| Total | | | | | | | | | | | 636,732 | |
| Total Floating Rate Loans (cost $15,582,521) | | | | | | | | | | | 14,750,914 | |
| | | | | | | | | | | | | |
| FOREIGN GOVERNMENT OBLIGATIONS 2.47% | | | | | | | | | | | | |
| | | | | | | | | | | | | |
| Bermuda 0.20% | | | | | | | | | | | | |
| Bermuda Government International Bond† | | 2.375% | | 8/20/2030 | | $ | 1,296,000 | | | | 1,099,704 | |
| Bermuda Government International Bond† | | 3.375% | | 8/20/2050 | | | 1,444,000 | | | | 1,028,648 | |
| Total | | | | | | | | | | | 2,128,352 | |
| | | | | | | | | | | | | |
| Canada 0.26% | | | | | | | | | | | | |
| Ontario Teachers’ Finance Trust(a) | | 0.875% | | 9/21/2026 | | | 1,345,000 | | | | 1,172,239 | |
| Province of Ontario Canada(f) | | 1.55% | | 11/1/2029 | | CAD | 2,519,000 | | | | 1,598,021 | |
| Total | | | | | | | | | | | 2,770,260 | |
| | | | | | | | | | | | | |
| Costa Rica 0.27% | | | | | | | | | | | | |
| Costa Rica Government International Bond†(a) | | 7.158% | | 3/12/2045 | | $ | 3,096,000 | | | | 2,972,074 | |
| | | | | | | | | | | | | |
| Dominican Republic 0.42% | | | | | | | | | | | | |
| Dominican Republic International Bond†(a) | | 6.00% | | 2/22/2033 | | | 5,070,000 | | | | 4,592,416 | |
| | | | | | | | | | | | | |
| Ecuador 0.12% | | | | | | | | | | | | |
| Ecuador Government International Bond†(a) | | 5.50% | | 7/31/2030 | | | 1,917,480 | | | | 1,241,700 | |
| | | |
| | See Notes to Financial Statements. | 31 |
Schedule of Investments (continued)
December 31, 2022
| Investments | | Interest
Rate | | Maturity
Date | | Principal
Amount | | | Fair
Value | |
| Japan 0.39% | | | | | | | | | | | | |
| Japan Bank for International Cooperation(a) | | 3.875% | | 9/16/2025 | | $ | 4,352,000 | | | $ | 4,258,633 | |
| | | | | | | | | | | | | |
| Peru 0.15% | | | | | | | | | | | | |
| Republic of Peru(a) | | 2.78% | | 12/1/2060 | | | 2,761,000 | | | | 1,619,640 | |
| | | | | | | | | | | | | |
| South Africa 0.26% | | | | | | | | | | | | |
| Republic of South Africa(a) | | 4.30% | | 10/12/2028 | | | 3,130,000 | | | | 2,801,350 | |
| | | | | | | | | | | | | |
| Sri Lanka 0.07% | | | | | | | | | | | | |
| Sri Lanka Government International Bond†(a)(g) | | 5.875% | | 7/25/2022 | | | 2,340,000 | | | | 772,522 | |
| | | | | | | | | | | | | |
| Turkey 0.33% | | | | | | | | | | | | |
| Turkey Government International Bond(a) | | 5.125% | | 2/17/2028 | | | 4,124,000 | | | | 3,583,673 | |
| Total Foreign Government Obligations (cost $29,139,610) | | | | | | | | | | | 26,740,620 | |
| | | | | | | | | | | | | |
| GOVERNMENT SPONSORED ENTERPRISES PASS-THROUGHS 8.17% | | | | | | | |
| Fannie Mae or Freddie Mac(k) | | 2.00% | | TBA | | | 4,580,000 | | | | 3,731,731 | |
| Fannie Mae or Freddie Mac(k) | | 3.50% | | TBA | | | 809,000 | | | | 735,070 | |
| Fannie Mae or Freddie Mac(k) | | 4.00% | | TBA | | | 2,908,000 | | | | 2,728,305 | |
| Fannie Mae or Freddie Mac(k) | | 4.50% | | TBA | | | 3,697,000 | | | | 3,558,617 | |
| Fannie Mae or Freddie Mac(k) | | 5.00% | | TBA | | | 2,179,000 | | | | 2,189,210 | |
| Fannie Mae or Freddie Mac(k) | | 5.50% | | TBA | | | 3,548,000 | | | | 3,556,788 | |
| Fannie Mae or Freddie Mac(k) | | 6.00% | | TBA | | | 3,220,000 | | | | 3,267,420 | |
| Fannie Mae or Freddie Mac(k) | | 6.50% | | TBA | | | 4,383,000 | | | | 4,487,188 | |
| Fannie Mae Pool | | 2.00% | | 6/1/2051 | | | 1,890,784 | | | | 1,545,126 | |
| Fannie Mae Pool | | 2.50% | | 6/1/2051 -
12/1/2051 | | | 9,156,859 | | | | 7,864,765 | |
| Fannie Mae Pool | | 3.00% | | 1/1/2051 | | | 628,289 | | | | 562,765 | |
| Fannie Mae Pool | | 3.50% | | 9/1/2051 -
4/1/2052 | | | 2,710,434 | | | | 2,498,050 | |
| Fannie Mae Pool | | 4.00% | | 5/1/2052 | | | 4,448,375 | | | | 4,237,139 | |
| Fannie Mae Pool | | 5.00% | | 7/1/2052 | | | 3,197,791 | | | | 3,210,223 | |
| Federal Home Loan Mortgage Corp. | | 2.00% | | 10/1/2051 | | | 1,496,338 | | | | 1,221,390 | |
| Federal Home Loan Mortgage Corp. | | 2.50% | | 7/1/2051 | | | 494,392 | | | | 423,144 | |
| Federal Home Loan Mortgage Corp. | | 3.50% | | 8/1/2045 | | | 2,024,539 | | | | 1,887,742 | |
| Federal Home Loan Mortgage Corp. | | 5.00% | | 7/1/2052 | | | 2,338,592 | | | | 2,342,903 | |
| Ginnie Mae(k) | | 3.00% | | TBA | | | 7,324,000 | | | | 6,527,988 | |
| Ginnie Mae(k) | | 3.50% | | TBA | | | 3,025,000 | | | | 2,779,757 | |
| Ginnie Mae(k) | | 4.00% | | TBA | | | 5,624,000 | | | | 5,322,609 | |
| Ginnie Mae(k) | | 4.50% | | TBA | | | 7,701,000 | | | | 7,473,331 | |
| 32 | See Notes to Financial Statements. |
Schedule of Investments (continued)
December 31, 2022
| Investments | | Interest
Rate | | Maturity
Date | | Principal
Amount | | | Fair
Value | |
| GOVERNMENT SPONSORED ENTERPRISES PASS-THROUGHS (continued) | | | | | | | | |
| Ginnie Mae(k) | | 5.00% | | TBA | | $ | 3,964,000 | | | $ | 3,928,012 | |
| Ginnie Mae(k) | | 5.50% | | TBA | | | 3,528,000 | | | | 3,546,251 | |
| Ginnie Mae(k) | | 6.00% | | TBA | | | 8,811,000 | | | | 8,935,853 | |
| Total Government Sponsored Enterprises Pass-Throughs (cost $89,994,252) | | | | | | | | 88,561,377 | |
| | | | | | | | | | | | | |
| MUNICIPAL BONDS 2.71% | | | | | | | | | | | | |
| | | | | | | | | | | | | |
| Education 0.46% | | | | | | | | | | | | |
| California State University CA | | 3.899% | | 11/1/2047 | | | 1,975,000 | | | | 1,680,593 | |
| Ohio University OH | | 5.59% | | 12/1/2114 | | | 1,000,000 | | | | 896,251 | |
| Permanent University Fund - Texas A&M University System TX | | 3.66% | | 7/1/2047 | | | 1,070,000 | | | | 879,923 | |
| Regents of the University of California Medical Center Pooled Revenue CA | | 4.132% | | 5/15/2032 | | | 880,000 | | | | 821,023 | |
| Regents of the University of California Medical Center Pooled Revenue CA | | 6.548% | | 5/15/2048 | | | 600,000 | | | | 683,572 | |
| Total | | | | | | | | | | | 4,961,362 | |
| | | | | | | | | | | | | |
| General Obligation 0.23% | | | | | | | | | | | | |
| Commonwealth of Pennsylvania PA GO | | 5.45% | | 2/15/2030 | | | 836,000 | | | | 854,634 | |
| District of Columbia DC | | 5.591% | | 12/1/2034 | | | 795,000 | | | | 826,955 | |
| University of North Carolina at Chapel Hill NC | | 3.847% | | 12/1/2034 | | | 855,000 | | | | 765,102 | |
| Total | | | | | | | | | | | 2,446,691 | |
| | | | | | | | | | | | | |
| Government 0.80% | | | | | | | | | | | | |
| Foothill-Eastern Transportation Corridor Agency CA | | 4.094% | | 1/15/2049 | | | 1,292,000 | | | | 979,732 | |
| Louisiana Local Government Environmental Facilities & Community Development Authority LA | | 3.615% | | 2/1/2029 | | | 1,334,000 | | | | 1,293,626 | |
| Louisiana Local Government Environmental Facilities & Community Development Authority LA | | 4.145% | | 2/1/2033 | | | 2,002,000 | | | | 1,898,107 | |
| New Jersey Transportation Trust Fund Authority NJ | | 4.131% | | 6/15/2042 | | | 1,075,000 | | | | 866,534 | |
| Regents of the University of California Medical Center Pooled Revenue CA | | 3.006% | | 5/15/2050 | | | 1,185,000 | | | | 785,095 | |
| State of Illinois IL GO | | 5.10% | | 6/1/2033 | | | 3,010,000 | | | | 2,892,044 | |
| Total | | | | | | | | | | | 8,715,138 | |
| | | | | | | | | | | | | |
| Lease Obligation 0.06% | | | | | | | | | | | | |
| State of Wisconsin WI | | 3.294% | | 5/1/2037 | | | 790,000 | | | | 639,263 | |
| | See Notes to Financial Statements. | 33 |
Schedule of Investments (continued)
December 31, 2022
| Investments | | Interest
Rate | | Maturity
Date | | Principal
Amount | | | Fair
Value | |
| Miscellaneous 0.23% | | | | | | | | | | | | |
| Dallas Convention Center Hotel Development Corp. TX | | 7.088% | | 1/1/2042 | | $ | 1,210,000 | | | $ | 1,319,735 | |
| New York City Industrial Development Agency NY† | | 11.00% | | 3/1/2029 | | | 1,040,000 | | | | 1,215,253 | |
| Total | | | | | | | | | | | 2,534,988 | |
| | | | | | | | | | | | | |
| Revenue - Utilities - Other 0.10% | | | | | | | | | | | | |
| City of San Antonio Electric & Gas Systems Revenue TX | | 5.718% | | 2/1/2041 | | | 980,000 | | | | 1,036,281 | |
| | | | | | | | | | | | | |
| Tax Revenue 0.38% | | | | | | | | | | | | |
| County of Miami-Dade FL | | 2.786% | | 10/1/2037 | | | 660,000 | | | | 474,118 | |
| Dallas Area Rapid Transit TX | | 2.613% | | 12/1/2048 | | | 1,090,000 | | | | 719,747 | |
| Massachusetts School Building Authority MA | | 5.715% | | 8/15/2039 | | | 1,220,000 | | | | 1,251,937 | |
| Memphis-Shelby County Industrial Development Board TN Tax Allocation(g) | | 7.00% | | 7/1/2045 | | | 1,415,000 | | | | 916,085 | (c) |
| New York State Dormitory Authority NY | | 3.19% | | 2/15/2043 | | | 310,000 | | | | 228,871 | |
| Regional Transportation District Sales Tax Revenue CO | | 2.387% | | 11/1/2037 | | | 830,000 | | | | 585,591 | |
| Total | | | | | | | | | | | 4,176,349 | |
| | | | | | | | | | | | | |
| Taxable Revenue - Water & Sewer 0.04% | | | | | | | | | | | | |
| City & County Honolulu Wastewater System Revenue HI | | 1.623% | | 7/1/2031 | | | 390,000 | | | | 299,525 | |
| City & County Honolulu Wastewater System Revenue HI | | 2.574% | | 7/1/2041 | | | 260,000 | | | | 179,190 | |
| Total | | | | | | | | | | | 478,715 | |
| | | | | | | | | | | | | |
| Transportation 0.41% | | | | | | | | | | | | |
| Chicago Transit Authority Sales Tax Receipts Fund IL | | 6.20% | | 12/1/2040 | | | 1,030,000 | | | | 1,109,929 | |
| County of Miami-Dade Aviation Revenue FL | | 4.28% | | 10/1/2041 | | | 950,000 | | | | 840,849 | |
| Metropolitan Transportation Authority NY | | 5.175% | | 11/15/2049 | | | 1,000,000 | | | | 866,441 | |
| Metropolitan Transportation Authority NY | | 6.668% | | 11/15/2039 | | | 525,000 | | | | 543,750 | |
| Port of Seattle WA | | 3.571% | | 5/1/2032 | | | 130,000 | | | | 114,945 | |
| Port of Seattle WA | | 3.755% | | 5/1/2036 | | | 1,105,000 | | | | 951,495 | |
| Total | | | | | | | | | | | 4,427,409 | |
| Total Municipal Bonds (cost $35,281,559) | | | | | | | | | | | 29,416,196 | |
| | | | | | | | | | | | | |
| NON-AGENCY COMMERCIAL MORTGAGE-BACKED SECURITIES 4.15% | | | | | | | | | |
| BBCMS Mortgage Trust 2019-BWAY A† | | 5.274%
(1 Mo. LIBOR + .96% | )# | 11/15/2034 | | | 1,750,000 | | | | 1,624,495 | |
| Benchmark Mortgage Trust 2019-B12 WMA† | | 4.246% | #(l) | 8/15/2052 | | | 2,892,000 | | | | 2,495,244 | (c) |
| BHMS 2018-ATLS A† | | 5.568%
(1 Mo. LIBOR + 1.25% | )# | 7/15/2035 | | | 2,120,000 | | | | 2,038,964 | |
| 34 | See Notes to Financial Statements. |
Schedule of Investments (continued)
December 31, 2022
| Investments | | Interest
Rate | | Maturity
Date | | Principal Amount | | | Fair
Value | |
| NON-AGENCY COMMERCIAL MORTGAGE-BACKED SECURITIES (continued) | | | | | | | | | |
| BX 2021-MFM1 B† | | 5.268%
(1 Mo. LIBOR + .95% | )# | 1/15/2034 | | $ | 400,000 | | | $ | 383,579 | |
| BX 2021-MFM1 C† | | 5.518%
(1 Mo. LIBOR + 1.20% | )# | 1/15/2034 | | | 250,000 | | | | 238,699 | |
| BX Commercial Mortgage Trust 2020-VIV4 A† | | 2.843% | | 3/9/2044 | | | 829,000 | | | | 672,391 | |
| BX Commercial Mortgage Trust 2021-VOLT A† | | 5.018%
(1 Mo. LIBOR + .70% | )# | 9/15/2036 | | | 2,630,000 | | | | 2,537,194 | |
| BX Trust 2022-PSB A† | 6.787%
(1 Mo. Term SOFR + 2.45% | )# | 8/15/2039 | | | 603,023 | | | | 602,591 | |
| CF Trust 2019-BOSS A1† | | 4.75%
(1 Mo. LIBOR + 3.25% | )# | 12/15/2024 | | | 1,340,000 | | | | 1,236,095 | |
| Citigroup Commercial Mortgage Trust 2016-GC36 C | | 4.747% | #(l) | 2/10/2049 | | | 480,000 | | | | 390,993 | |
| COMM Mortgage Trust 2014-UBS5 AM | | 4.193% | #(l) | 9/10/2047 | | | 1,161,000 | | | | 1,110,811 | |
| Connecticut Avenue Securities Trust 2022-R01 1B2† | | 9.928%
(1 Mo. SOFR + 6.00% | )# | 12/25/2041 | | | 1,600,000 | | | | 1,395,497 | |
| Connecticut Avenue Securities Trust 2022-R02 2M1† | | 5.128%
(1 Mo. SOFR + 1.20% | )# | 1/25/2042 | | | 980,989 | | | | 959,896 | |
| CSMC 2021-BPNY A† | | 8.032%
(1 Mo. LIBOR + 3.71% | )# | 8/15/2023 | | | 2,420,000 | | | | 2,376,266 | |
| CSMC 2021-BRIT A† | 7.91%
(1 Mo. Term SOFR + 3.57% | )# | 5/15/2023 | | | 4,500,000 | | | | 4,211,203 | |
| DCP Rights LLC A | | 6.786% | | 1/15/2024 | | | 3,850,000 | | | | 3,857,297 | |
| Freddie Mac Stacr Remic Trust 2020-DNA1 B1† | | 6.689%
(1 Mo. LIBOR + 2.30% | )# | 1/25/2050 | | | 546,756 | | | | 516,587 | |
| Freddie Mac STACR Remic Trust 2020-DNA2 B1† | | 6.889%
(1 Mo. LIBOR + 2.50% | )# | 2/25/2050 | | | 692,000 | | | | 647,912 | |
| Freddie Mac STACR REMIC Trust 2021-HQA3 M1† | | 4.778%
(1 Mo. SOFR + 0.85% | )# | 9/25/2041 | | | 739,407 | | | | 706,560 | |
| Freddie Mac STACR REMIC Trust 2022-HQA3 M1A† | | 6.228%
(1 Mo. SOFR + 2.30% | )# | 8/25/2042 | | | 430,846 | | | | 430,628 | |
| Freddie Mac STACR REMIC Trust 2022-HQA3 M1B† | | 7.478%
(1 Mo. SOFR + 3.55% | )# | 8/25/2042 | | | 1,350,000 | | | | 1,340,841 | |
| Freddie Mac STACR Trust 2019-DNA3 B1† | | 7.639%
(1 Mo. LIBOR + 3.25% | )# | 7/25/2049 | | | 500,000 | | | | 500,750 | |
| | See Notes to Financial Statements. | 35 |
Schedule of Investments (continued)
December 31, 2022
| Investments | | Interest
Rate | | Maturity Date | | Principal Amount | | | Fair
Value | |
| NON-AGENCY COMMERCIAL MORTGAGE-BACKED SECURITIES (continued) | | | | | | | | |
| GS Mortgage Securities Corp Trust 2022-ECI B† | 7.28%
(1 Mo. Term SOFR + 2.94% | )# | 8/15/2039 | | $ | 1,180,000 | | | $ | 1,166,160 | |
| GS Mortgage Securities Corp. II 2021-ARDN C† | | 6.368%
(1 Mo. LIBOR + 2.05% | )# | 11/15/2036 | | | 770,000 | | | | 728,761 | |
| GS Mortgage Securities Corp. II 2021-ARDN D† | | 7.068%
(1 Mo. LIBOR + 2.75% | )# | 11/15/2036 | | | 1,340,000 | | | | 1,264,911 | |
| GS Mortgage Securities Corp. Trust 2021-RENT E† | | 7.104%
(1 Mo. LIBOR + 2.75% | )# | 11/21/2035 | | | 643,334 | | | | 588,071 | |
| GS Mortgage Securities Corp. Trust 2021-RENT F† | | 8.004%
(1 Mo. LIBOR + 3.65% | )# | 11/21/2035 | | | 494,873 | | | | 450,159 | |
| GS Mortgage Securities Corp. Trust 2021-RENT G† | | 10.054%
(1 Mo. LIBOR + 5.70% | )# | 11/21/2035 | | | 98,975 | | | | 89,150 | |
| GS Mortgage Securities Corp. Trust 2021-RSMZ MZ† | | 13.818%
(1 Mo. LIBOR + 9.50% | )# | 6/15/2026 | | | 4,000,000 | | | | 3,836,418 | |
| Hilton Orlando Trust 2018-ORL A† | | 5.338%
(1 Mo. LIBOR + .92% | )# | 12/15/2034 | | | 557,000 | | | | 543,908 | |
| HPLY Trust 2019-HIT A† | | 5.318%
(1 Mo. LIBOR + 1.00% | )# | 11/15/2036 | | | 981,605 | | | | 957,895 | |
| J.P. Morgan Chase Commercial Mortgage Securities Trust 2022-NLP B† | 5.442%
(1 Mo. Term SOFR + 1.11% | )# | 4/15/2037 | | | 1,791,660 | | | | 1,635,443 | |
| JPMorgan Chase Commercial Mortgage Securities Trust 2021-BOLT D† | | 11.018%
(1 Mo. LIBOR + 6.70% | )# | 8/15/2033 | | | 2,110,000 | | | | 2,045,207 | |
| Life Mortgage Trust 2022-BMR2 A1† | 5.631%
(1 Mo. Term SOFR + 1.30% | )# | 5/15/2039 | | | 1,400,000 | | | | 1,367,455 | |
| Total Non-Agency Commercial Mortgage-Backed Securities (cost $47,280,572) | | | | | | | 44,948,031 | |
| | | | | | | | | | | | | |
| | | | | | | | | | | | | |
| | | Dividend
Rate | | | | | Shares | | | | | |
| | | | | | | | | | | | | |
| PREFERRED STOCKS 0.11% | | | | | | | | | | | | |
| | | | | | | | | | | | | |
| Transportation Infrastructure | | | | | | | | | | | | |
| ACBL Holdings Corp. | | Zero Coupon | | | | | 12,368 | | | | 318,476 | |
| ACBL Holdings Corp. | | Zero Coupon | | | | | 16,904 | | | | 853,652 | |
| Total Preferred Stocks (cost $731,800) | | | | | | | | | | | 1,172,128 | |
| | | | | | | | | | | | | |
| 36 | See Notes to Financial Statements. |
Schedule of Investments (continued)
December 31, 2022
| Investments | | Exercise
Price | | Expiration
Date | | Shares | | | Fair
Value | |
| RIGHTS 0.00% | | | | | | | | | | | | |
| Cosmetics/Personal Care Revlon, Inc.* | | Zero Coupon | | 9/7/2023 | | | 148,512 | | | $ | 43,068 | (d) |
| Total Rights (cost $48,886) | | | | | | | | | | | 43,068 | |
| Total Long-Term Investments (cost $1,185,602,785) | | | | | | | | | | 1,092,731,037 | |
| | | | | | | | | | | | | |
| | | | | | | | | | | | | |
| | | | | | | | Principal
Amount | | | | | |
| SHORT-TERM INVESTMENTS 2.96% | | | | | | | | | | | | |
| | | | | | | | | | | | | |
| Repurchase Agreements 2.85% | | | | | | | | | | | | |
Repurchase Agreement dated 12/30/2022, 2.050% due 1/3/2023 with Fixed Income Clearing Corp. collateralized by $6,050,300 of U.S. Treasury Note at 4.275% due 4/30/2024; value: $6,079,680; proceeds: $5,961,773
(cost $5,960,416) | | | | | | $ | 5,960,416 | | | | 5,960,416 | |
Repurchase Agreement dated 12/30/2022, 4.300% due 1/3/2023 with TD Securities USA LLC collateralized by $9,124,000 of U.S. Treasury Note at 2.500% due 1/31/2025; value: $8,873,214; proceeds: $8,703,386
(cost $8,699,229) | | | | | | | 8,699,229 | | | | 8,699,229 | |
Repurchase Agreement dated 12/30/2022, 4.250% due 1/3/2023 with Barclays Bank plc collateralized by $16,320,000 of U.S. Treasury Bond at 4.000% due 11/15/2052; value: $16,625,592; proceeds: $16,307,297
(cost $16,299,600) | | | | | | | 16,299,600 | | | | 16,299,600 | |
| Total | | | | | | | | | | | 30,959,245 | |
| | | | | | | | | | | | | |
| | | | | | | | Shares | | | | | |
| | | | | | | | | | | | | |
| Money Market Funds 0.10% | | | | | | | | | | | | |
Fidelity Government Portfolio(m)
(cost $1,055,498) | | | | | | | 1,055,498 | | | | 1,055,498 | |
| | | | | | | | | | | | | |
| Time Deposits 0.01% | | | | | | | | | | | | |
CitiBank N.A.(m)
(cost $117,278) | | | | | | | 117,278 | | | | 117,278 | |
| Total Short-Term Investments (cost $32,132,021) | | | | | | | | | | | 32,132,021 | |
| | | | | | | | | | | | | |
| Total Investments in Securities 103.75% (cost $1,217,734,806) | | | | | | | | | | | 1,124,863,058 | |
| Other Assets and Liabilities – Net(n) (3.75)% | | | | | | | | | | | (40,692,816 | ) |
| Net Assets 100.00% | | | | | | | | | | $ | 1,084,170,242 | |
| | | | | | | | | | | | | |
| | See Notes to Financial Statements. | 37 |
Schedule of Investments (continued)
December 31, 2022
| CAD | | Canadian Dollar. EUR Euro. |
| GBP | | British Pound. |
| ADR | | American Depositary Receipt. |
| CMT | | Constant Maturity Rate. |
| EURIBOR | | Euro Interbank Offered Rate. |
| LIBOR | | London Interbank Offered Rate. |
| PIK | | Payment-in-kind. |
| REITS | | Real Estate Investment Trusts. |
| SOFR | | Secured Overnight Financing Rate. |
| † | | Security was purchased pursuant to Rule 144A under the Securities Act of 1933 and, unless registered under such Act or exempted from registration, may only be resold to qualified institutional buyers. At December 31, 2022, the total value of Rule 144A securities was $468,952,835, which represents 43.25% of net assets. |
| # | | Variable rate security. The interest rate represents the rate in effect at December 31, 2022. |
| * | | Non-income producing security. |
| (a) | | Foreign security traded in U.S. dollars. |
| (b) | | All or a portion of this security is temporarily on loan to unaffiliated broker/dealers. |
| (c) | | Level 3 Investment as described in Note 2(r) in the Notes to Financials. Security valued utilizing third party pricing information without adjustment. Such valuations are based on unobservable inputs. A significant change in third party information could result in a significantly lower or higher value of such Level 3 investments. |
| (d) | | Level 3 Investment as described in Note 2(r) in the Notes to Financials. Security fair valued by the Pricing Committee. |
| (e) | | Amount is less than $1. |
| (f) | | Investment in non-U.S. dollar denominated securities. |
| (g) | | Defaulted (non-income producing security). |
| (h) | | Floating Rate Loans in which the Fund invests generally pay interest at rates which are periodically re-determined at a margin above the London Interbank Offered Rate (“LIBOR”) or the prime rate offered by major U.S. banks. The rate(s) shown is the rate(s) in effect at December 31, 2022. |
| (i) | | Level 3 Investment as described in 2(r) in the Notes to Financials. Floating Rate Loan fair valued by the Pricing Committee. Accounting principles generally accepted in the United States of America do not require the Fund to create quantitative unobservable inputs that were not developed by the Fund. Therefore the Fund does not have access to unobservable inputs and can not disclose such inputs in the valuation. |
| (j) | | Interest Rate to be determined. |
| (k) | | To-be-announced (“TBA”). Security purchased on a forward commitment basis with an approximate principal and maturity date. Actual principal and maturity will be determined upon settlement when the specific mortgage pools are assigned. |
| (l) | | Interest rate is based on the weighted average interest rates of the underlying mortgages within the mortgage pool. |
| (m) | | Security was purchased with the cash collateral from loaned securities. |
| (n) | | Other Assets and Liabilities – Net include net unrealized appreciation/depreciation on forward foreign currency exchange contracts, futures contracts and swaps as follows: |
Centrally Cleared Credit Default Swaps on Indexes - Sell Protection at December 31, 2022(1):
Referenced
Indexes | | Central
Clearing
Party | | Fund
Receives
(Quarterly) | | Termination
Date | | Notional
Amount | | | Payments
Upfront(2) | | Value | | Unrealized
Appreciation(3) | |
| Markit CDX.EM.38(4)(5) | | Bank of America | | 1.000% | | 12/20/2027 | | $ | 11,603,000 | | | $ | (728,379 | ) | | $ | (678,237 | ) | | $ | 50,142 | |
| (1) | | If the Fund is a seller of protection and a credit event occurs, as defined under the terms of that particular swap agreement, the Fund will either (i) pay to the buyer of protection an amount equal to the notional amount of the swap and take delivery of the referenced obligation or underlying securities comprising the referenced index or (ii) pay a net settlement amount in the form of cash or securities equal to the notional amount of the swap less the recovery value of the referenced obligation or underlying securities. |
| (2) | | Upfront payments paid (received) by Central Clearing Party are presented net of amortization. |
| (3) | | Total unrealized appreciation on Credit Default Swaps on Indexes amounted to $50,142. Total unrealized depreciation on Credit Default Swaps on Indexes amounted to $0. |
| 38 | See Notes to Financial Statements. |
Schedule of Investments (continued)
December 31, 2022
| | (4) | Central Clearinghouse: Intercontinental Exchange (ICE). |
| | (5) | The Referenced Index is for the Centrally Cleared Credit Default Swaps on Indexes, which is comprised of a basket of emerging markets securities. |
Centrally Cleared Consumer Price Index (“CPI”) Swaps at December 31, 2022:
Swap
Counterparty | | Payments to be
Made By
The Fund at
Termination Date | | Payments to be
Received By
The Fund at
Termination Date | | Termination
Date | Notional
Amount | | Value/Unrealized
Appreciation | |
| Bank of America | | 2.544% | | CPI Urban Consumer NSA | | 3/2/2052 | | $ | 2,807,089 | | | $ | 33,944 | |
| Bank of America | | 2.544% | | CPI Urban Consumer NSA | | 3/2/2052 | | | 1,392,911 | | | | 10,227 | (1) |
| Total Unrealized Appreciation on Centrally Cleared CPI Swaps | | | | | | | | $ | 44,171 | |
| | | | | | | | | | | |
Swap
Counterparty | | Payments to be
Made By
The Fund at
Termination Date | | Payments to be
Received By
The Fund at
Termination Date | | Termination
Date | Notional
Amount | | Value/Unrealized
Depreciation | |
| Bank of America | | 2.748% | | CPI Urban Consumer NSA | | 4/20/2052 | | $ | 6,000,000 | | | $ | (282,107 | ) |
| Bank of America | | 2.665% | | CPI Urban Consumer NSA | | 5/12/2052 | | | 4,373,000 | | | | (129,142 | ) |
| Total Unrealized Depreciation on Centrally Cleared CPI Swaps | | | | | | | | $ | (411,249 | ) |
| (1) | | Upfront payments paid (received) by Central Clearing Party are presented net of amortization. Includes upfront payment of $6,616. |
Credit Default Swaps on Issuers - Buy Protection at December 31, 2022(1):
Referenced
Issuers | | Swap
Counterparty | | Fund
Pays
(Quarterly) | | Termination
Date | | Notional
Amount | | Payments
Upfront(2) | | Unrealized
Appreciation/
(Depreciation)(3) | | Credit
Default Swap
Agreements
Receivable at
Fair Value(4) | |
| Credit Suisse Group AG(5) | | BNP Paribas S.A. | | 1.000% | | 12/20/2027 | | EUR 2,392,903 | | $ | 127,201 | | | $ | 166,764 | | | $ | 293,965 | |
| Credit Suisse Group AG(5) | | BNP Paribas S.A. | | 1.000% | | 12/20/2027 | | 957,161 | | | 52,479 | | | | 65,107 | | | | 117,586 | |
| Credit Suisse Group AG(5) | | J.P. Morgan | | 1.000% | | 12/20/2027 | | 717,871 | | | 47,326 | | | | 40,863 | | | | 88,189 | |
| | | | | | | | | | | $ | 227,006 | | | $ | 272,734 | | | $ | 499,740 | |
| | See Notes to Financial Statements. | 39 |
Schedule of Investments (continued)
December 31, 2022
Credit Default Swaps on Indexes - Sell Protection at December 31, 2022(1):
Referenced
Indexes* | | Swap
Counterparty | | Fund
Receives
(Quarterly) | | Termination
Date | | Notional
Amount | | Payments
Upfront(2) | | Unrealized
Appreciation/
(Depreciation)(3) | | Credit
Default Swap
Agreements
Payable at
Fair Value(4) | |
| Markit CMBX.NA.AA.7 | | Citibank | | 1.500% | | 1/17/2047 | | $ | 500,000 | | | $ | (5,832 | ) | | $ | (10,464 | ) | | $ | (16,296 | ) |
| Markit CMBX.NA.AA.8 | | Citibank | | 1.500% | | 10/17/2057 | | | 1,000,000 | | | | 4,869 | | | | (10,596 | ) | | | (5,727 | ) |
| | | | | | | | | | | | | $ | (963 | ) | | $ | (21,060 | ) | | $ | (22,023 | ) |
| | * | | The Referenced Index is for the Credit Default Swaps on Indexes, which is comprised of a basket of commercial mortgage-backed securities. |
| | (1) | | If the Fund is a buyer of protection and a credit event occurs, as defined under the terms of that particular swap agreement, the Fund will either (i) receive from the seller of protection an amount equal to the notional amount of the swap and make delivery of the referenced obligation or underlying securities comprising the referenced index or (ii) receive net settlement amount in the form of cash or securities equal to the notional amount of the swap less the recovery value of the referenced obligation or underlying securities. If the Fund is a seller of protection and a credit event occurs, as defined under the terms of that particular swap agreement, the Fund will either (i) pay to the buyer of protection an amount equal to the notional amount of the swap and take delivery of the referenced obligation or underlying securities comprising the referenced index or (ii) pay a net settlement amount in the form of cash or securities equal to the notional amount of the swap less the recovery value of the referenced obligation or underlying securities. |
| | (2) | | Upfront payments paid (received) are presented net of amortization. |
| | (3) | | Total unrealized appreciation on Credit Default Swaps in Indexes/Issuers amounted to $272,734. Total unrealized depreciation on Credit Default Swaps on Indexes/Issuers amounted to $21,060. |
| | (4) | | Includes upfront payments paid (received). |
| | (5) | | Moody’s Credit Rating: Ba2. |
| | |
| 40 | See Notes to Financial Statements. |
Schedule of Investments (continued)
December 31, 2022
Forward Foreign Currency Exchange Contracts at December 31, 2022:
Forward
Foreign
Currency
Exchange
Contracts | | Transaction
Type | | Counterparty | | Expiration
Date | | Foreign
Currency | | U.S. $
Cost on
Origination
Date | | | U.S. $
Current
Value | | Unrealized
Appreciation | |
| Euro | | Buy | | Morgan Stanley | | 3/13/2023 | | 620,000 | | $ | 662,140 | | | $ | 666,765 | | | $ | 4,625 | |
| Japanese yen | | Buy | | Morgan Stanley | | 2/14/2023 | | 20,000,000 | | | 152,221 | | | | 153,200 | | | | 979 | |
| British pound | | Sell | | Toronto Dominion Bank | | 3/8/2023 | | 3,811,000 | | | 4,636,653 | | | | 4,614,532 | | | | 22,121 | |
| Swiss franc | | Sell | | Morgan Stanley | | 1/23/2023 | | 267,000 | | | 290,002 | | | $ | 289,345 | | | | 657 | |
| Total Unrealized Appreciation on Forward Foreign Currency Exchange Contracts | | | | | | | | $ | 28,382 | |
| | | | | | | | | | | | | | | | | |
Forward
Foreign
Currency
Exchange
Contracts | | Transaction
Type | | Counterparty | | Expiration
Date | | Foreign
Currency | | U.S. $
Cost on
Origination
Date | | | U.S. $
Current
Value | | Unrealized
Depreciation | |
| Canadian dollar | | Buy | | Bank of America | | 1/20/2023 | | 751,000 | | $ | 563,979 | | | $ | 554,698 | | | $ | (9,281 | ) |
| Canadian dollar | | Buy | | Toronto Dominion Bank | | 1/20/2023 | | 568,000 | | | 424,343 | | | | 419,532 | | | | (4,811 | ) |
| Australian dollar | | Sell | | Morgan Stanley | | 2/27/2023 | | 1,662,000 | | | 1,107,894 | | | | 1,134,015 | | | | (26,121 | ) |
| Canadian dollar | | Sell | | Toronto Dominion Bank | | 1/20/2023 | | 3,758,000 | | | 2,730,629 | | | | 2,775,708 | | | | (45,079 | ) |
| Euro | | Sell | | State Street Bank and Trust | | 3/13/2023 | | 7,680,000 | | | 8,159,278 | | | | 8,259,284 | | | | (100,006 | ) |
| Japanese yen | | Sell | | Toronto Dominion Bank | | 2/14/2023 | | 418,000,000 | | | 3,011,838 | | | | 3,201,873 | | | | (190,035 | ) |
| Singapore dollar | | Sell | | State Street Bank and Trust | | 2/22/2023 | | 794,000 | | | 578,345 | | | | 593,267 | | | | (14,922 | ) |
| Singapore dollar | | Sell | | State Street Bank and Trust | | 2/22/2023 | | 470,000 | | | 340,437 | | | | 351,178 | | | | (10,741 | ) |
| Singapore dollar | | Sell | | State Street Bank and Trust | | 2/22/2023 | | 257,000 | | | 186,605 | | | | 192,027 | | | | (5,422 | ) |
| Swiss franc | | Sell | | J.P. Morgan | | 1/23/2023 | | 1,356,000 | | | 1,465,869 | | | | 1,469,483 | | | | (3,614 | ) |
| Total Unrealized Depreciation on Forward Foreign Currency Exchange Contracts | | | | $ | (410,032 | ) |
Futures Contracts at December 31, 2022:
| Type | | Expiration | | Contracts | | Position | | Notional
Amount | | Notional
Value | | Unrealized
Appreciation | |
| U.S. 5-Year Treasury Note | | March 2023 | | 385 | | Short | | $ (41,842,624 | ) | $ (41,552,930 | ) | | $ | 289,694 | |
| U.S. Ultra Treasury Bond | | March 2023 | | 355 | | Short | | (48,338,064 | ) | (47,680,937 | ) | | | 657,127 | |
| U.S. Long Bond | | March 2023 | | 722 | | Short | | (91,482,663 | ) | (90,498,188 | ) | | | 984,475 | |
| U.S. 2-Year Treasury Notes | | March 2023 | | 585 | | Long | | 119,829,697 | | 119,970,704 | | | | 141,007 | |
| Total Unrealized Appreciation on Futures Contracts | | | | | | $ | 2,072,303 | |
| | See Notes to Financial Statements. | 41 |
Schedule of Investments (continued)
December 31, 2022
| Type | | Expiration | | Contracts | | Position | | Notional Amount | | Notional
Value | | Unrealized
Depreciation | |
| U.S. 10-Year Ultra Treasury Note | | March 2023 | | 222 | | Long | | $27,051,720 | | $26,258,438 | | | $ | (793,282 | ) |
| U.S. 10-Year Treasury Notes | | March 2023 | | 140 | | Long | | 16,054,482 | | 15,721,562 | | | | (332,920 | ) |
| Total Unrealized Depreciation on Futures Contracts | | | | | | $ | (1,126,202 | ) |
The following is a summary of the inputs used as of December 31, 2022 in valuing the Fund’s investments carried at fair value(1):
| Investment Type(2) | | Level 1 | | | Level 2 | | | Level 3 | | | Total | |
| Long-Term Investments | | | | | | | | | | | | | | | | |
| Asset-Backed Securities | | $ | – | | | $ | 59,336,678 | | | $ | – | | | $ | 59,336,678 | |
| Common Stocks | | | | | | | | | | | | | | | | |
| Auto Components | | | – | | | | 1,040,812 | | | | – | | | | 1,040,812 | |
| Beverages | | | 1,119,056 | | | | 1,161,823 | | | | – | | | | 2,280,879 | |
| Electric-Generation | | | – | | | | 142 | | | | – | | | | 142 | |
| Entertainment | | | 1,697,459 | | | | 1,249,516 | | | | – | | | | 2,946,975 | |
| Miscellaneous Financials | | | – | | | | 551,786 | | | | – | | | | 551,786 | |
| Personal Products | | | – | | | | 2,247,205 | | | | – | | | | 2,247,205 | |
| Pharmaceuticals | | | 3,791,761 | | | | 1,831,262 | | | | – | | | | 5,623,023 | |
| Specialty Retail | | | 2,298,837 | | | | – | | | | 426,891 | | | | 2,725,728 | |
| Textiles, Apparel & Luxury Goods | | | – | | | | 2,898,810 | | | | – | | | | 2,898,810 | |
| Transportation Infrastructure | | | 1,078,646 | | | | 145,518 | | | | – | | | | 1,224,164 | |
| Remaining Industries | | | 36,914,799 | | | | – | | | | – | | | | 36,914,799 | |
| Corporate Bonds | | | | | | | | | | | | | | | | |
| Mining | | | – | | | | 14,804,915 | | | | 1 | | | | 14,804,916 | |
| Savings & Loans | | | – | | | | – | | | | 125 | | | | 125 | |
| Remaining Industries | | | – | | | | 754,502,661 | | | | – | | | | 754,502,661 | |
| Floating Rate Loans | | | | | | | | | | | | | | | | |
| Personal & Household Products | | | – | | | | 8 | | | | 10,041 | | | | 10,049 | |
| Remaining Industries | | | – | | | | 14,740,865 | | | | – | | | | 14,740,865 | |
| Foreign Government Obligations | | | – | | | | 26,740,620 | | | | – | | | | 26,740,620 | |
| Government Sponsored Enterprises | | | | | | | | | | | | | | | | |
| Pass-Throughs | | | – | | | | 88,561,377 | | | | – | | | | 88,561,377 | |
| Municipal Bonds | | | | | | | | | | | | | | | | |
| Tax Revenue | | | – | | | | 3,260,264 | | | | 916,085 | | | | 4,176,349 | |
| Remaining Industries | | | – | | | | 25,239,847 | | | | – | | | | 25,239,847 | |
| Non-Agency Commercial | | | | | | | | | | | | | | | | |
| Mortgage-Backed Securities | | | – | | | | 42,452,787 | | | | 2,495,244 | | | | 44,948,031 | |
| Preferred Stocks | | | – | | | | 1,172,128 | | | | – | | | | 1,172,128 | |
| Rights | | | – | | | | – | | | | 43,068 | | | | 43,068 | |
| Short-Term Investments | | | | | | | | | | | | | | | | |
| Repurchase Agreements | | | – | | | | 30,959,245 | | | | – | | | | 30,959,245 | |
| Money Market Funds | | | 1,055,498 | | | | – | | | | – | | | | 1,055,498 | |
| Time Deposits | | | – | | | | 117,278 | | | | – | | | | 117,278 | |
| Total | | $ | 47,956,056 | | | $ | 1,073,015,547 | | | $ | 3,891,455 | | | $ | 1,124,863,058 | |
| 42 | See Notes to Financial Statements. |
Schedule of Investments (concluded)
December 31, 2022
| Investment Type(2) | | Level 1 | | | Level 2 | | | Level 3 | | | Total | |
| Other Financial Instruments | | | | | | | | | | | | | | | | |
| Centrally Cleared Credit Default Swap Contracts | | | | | | | | | | | | | | | | |
| Assets | | $ | – | | | $ | – | | | $ | – | | | $ | – | |
| Liabilities | | | – | | | | (678,237 | ) | | | – | | | | (678,237 | ) |
| Centrally Cleared CPI Swap Contracts | | | | | | | | | | | | | | | | |
| Assets | | | – | | | | 44,171 | | | | – | | | | 44,171 | |
| Liabilities | | | – | | | | (411,249 | ) | | | – | | | | (411,249 | ) |
| Credit Default Swap Contracts | | | | | | | | | | | | | | | | |
| Assets | | | – | | | | 499,740 | | | | – | | | | 499,740 | |
| Liabilities | | | – | | | | (22,023 | ) | | | – | | | | (22,023 | ) |
| Forward Foreign Currency Exchange Contracts | | | | | | | | | | | | | | | | |
| Assets | | | – | | | | 28,382 | | | | – | | | | 28,382 | |
| Liabilities | | | – | | | | (410,032 | ) | | | – | | | | (410,032 | ) |
| Futures Contracts | | | | | | | | | | | | | | | | |
| Assets | | | 2,072,303 | | | | – | | | | – | | | | 2,072,303 | |
| Liabilities | | | (1,126,202 | ) | | | – | | | | – | | | | (1,126,202 | ) |
| Total | | $ | 946,101 | | | $ | (949,248 | ) | | $ | – | | | $ | 3,147 | |
| (1) | | Refer to Note 2(r) for a description of fair value measurements and the three-tier hierarchy of inputs. |
| (2) | | See Schedule of Investments for fair values in each industry and identification of foreign issuers and/or geography. The table above is presented by Investment Type. Industries are presented within an Investment Type should such Investment Type include securities classified as two or more levels within the three-tier fair value hierarchy. When applicable, each Level 3 security is identified on the Schedule of Investments along with the valuation technique utilized. |
A reconciliation of Level 3 investments is presented when the Fund has a material amount of Level 3 investments at the beginning or end of the year in relation to the Fund’s net assets. Management has determined not to provide a reconciliation as the balance of Level 3 investments was not considered to be material to the Fund’s net assets at the beginning or end of the year.
| | See Notes to Financial Statements. | 43 |
Statement of Assets and Liabilities
December 31, 2022
| ASSETS: | | | | |
| Investments in securities, at fair value including $1,111,322 of securities loaned (cost $1,217,734,806) | | $ | 1,124,863,058 | |
| Cash | | | 56,106 | |
| Cash at brokers | | | 360,000 | |
| Deposits with brokers for futures collateral | | | 5,350,153 | |
| Deposits with brokers for forwards and swaps collateral | | | 3,491,212 | |
| Receivables: | | | | |
| Investment securities sold | | | 79,820,381 | |
| Interest and dividends | | | 13,348,443 | |
| Capital shares sold | | | 593,681 | |
| Variation margin for futures contracts | | | 231,005 | |
| Variation margin for centrally cleared swap agreements | | | 8,958 | |
| Securities lending income receivable | | | 69 | |
| Unrealized appreciation on forward foreign currency exchange contracts | | | 28,382 | |
| Credit default swap agreements receivable, at fair value (including upfront payments of $227,006) | | | 499,740 | |
| Prepaid expenses and other assets | | | 26,013 | |
| Total assets | | | 1,228,677,201 | |
| LIABILITIES: | | | | |
| Payables: | | | | |
| Investment securities purchased | | | 139,318,408 | |
| To brokers for swap collateral | | | 360,000 | |
| Transfer agent fees | | | 1,783,531 | |
| Payable for collateral due to broker for securities lending | | | 1,172,776 | |
| Capital shares reacquired | | | 582,167 | |
| Management fee | | | 439,243 | |
| Directors’ fees | | | 155,290 | |
| Fund administration | | | 37,156 | |
| Credit default swap agreements payable, at fair value (including upfront payments of $963) | | | 22,023 | |
| Unrealized depreciation on forward foreign currency exchange contracts | | | 410,032 | |
| Foreign currency overdraft (cost $41,786) | | | 29,945 | |
| Accrued expenses and other liabilities | | | 196,388 | |
| Total liabilities | | | 144,506,959 | |
| NET ASSETS | | $ | 1,084,170,242 | |
| COMPOSITION OF NET ASSETS: | | | | |
| Paid-in capital | | $ | 1,261,854,690 | |
| Total distributable earnings (loss) | | | (177,684,448 | ) |
| Net Assets | | $ | 1,084,170,242 | |
| Outstanding shares (200 million shares of common stock authorized, $.001 par value) | | | 106,287,236 | |
| Net asset value, offering and redemption price per share (Net assets divided by outstanding shares) | | | $10.20 | |
| 44 | See Notes to Financial Statements. |
Statement of Operations
For the Year Ended December 31, 2022
| Investment income: | | | | |
| Dividends (net of foreign withholding taxes of $13,360) | | $ | 899,596 | |
| Securities lending net income | | | 3,514 | |
| Interest and other | | | 56,520,717 | |
| Interest earned from Interfund Lending (See Note 11) | | | 144 | |
| Total investment income | | | 57,423,971 | |
| Expenses: | | | | |
| Management fee | | | 5,517,071 | |
| Non 12b-1 service fees | | | 2,925,183 | |
| Shareholder servicing | | | 1,243,212 | |
| Fund administration | | | 468,184 | |
| Custody | | | 67,133 | |
| Professional | | | 64,632 | |
| Reports to shareholders | | | 61,983 | |
| Directors’ fees | | | 21,223 | |
| Other | | | 96,706 | |
| Gross expenses | | | 10,465,327 | |
| Expense reductions (See Note 9) | | | (14,614 | ) |
| Fees waived and expenses reimbursed (See Note 3) | | | (67,133 | ) |
| Net expenses | | | 10,383,580 | |
| Net investment income | | | 47,040,391 | |
| Net realized and unrealized gain (loss): | | | | |
| Net realized gain (loss) on investments | | | (109,213,804 | ) |
| Net realized gain (loss) on futures contracts | | | 28,206,355 | |
| Net realized gain (loss) on forward foreign currency exchange contracts | | | 1,619,886 | |
| Net realized gain (loss) on swap contracts | | | (867,271 | ) |
| Net realized gain (loss) on foreign currency related transactions | | | 18,729 | |
| Net change in unrealized appreciation/depreciation on investments | | | (136,667,212 | ) |
| Net change in unrealized appreciation/depreciation on futures contracts | | | 1,602,523 | |
| Net change in unrealized appreciation/depreciation on forward foreign currency exchange contracts | | | (261,467 | ) |
| Net change in unrealized appreciation/depreciation on swap contracts | | | (199,714 | ) |
| Net change in unrealized appreciation/depreciation on translation of assets and liabilities denominated in foreign currencies | | | (48,541 | ) |
| Net change in unrealized appreciation/depreciation on unfunded commitments | | | 783 | |
| Net realized and unrealized gain (loss) | | | (215,809,733 | ) |
| Net Decrease in Net Assets Resulting From Operations | | $ | (168,769,342 | ) |
| | See Notes to Financial Statements. | 45 |
Statements of Changes in Net Assets
| INCREASE (DECREASE) IN NET ASSETS | | For the Year Ended
December 31, 2022 | | | For the Year Ended
December 31, 2021 | |
| Operations: | | | | | | | | | | |
| Net investment income | | | $ | 47,040,391 | | | | $ | 39,376,068 | |
| Net realized gain (loss) on investments, futures contracts, forward foreign currency exchange contracts, swaps and foreign currency related transactions | | | | (80,236,105 | ) | | | | 61,885,755 | |
| Net change in unrealized appreciation/depreciation on investments, futures contracts, forward foreign currency exchange contracts, swaps, unfunded commitments and translation of assets and liabilities denominated in foreign currencies | | | | (135,573,628 | ) | | | | (61,849,142 | ) |
| Net increase (decrease) in net assets resulting from operations | | | | (168,769,342 | ) | | | | 39,412,681 | |
| Distributions to shareholders: | | | | (53,863,559 | ) | | | | (61,516,780 | ) |
| Capital share transactions (See Note 15): | | | | | | | | | | |
| Net proceeds from sales of shares | | | | 75,105,510 | | | | | 200,310,546 | |
| Reinvestment of distributions | | | | 53,863,559 | | | | | 61,516,780 | |
| Cost of shares reacquired | | | | (153,085,834 | ) | | | | (85,061,912 | ) |
| Net increase (decrease) in net assets resulting from capital share transactions | | | | (24,116,765 | ) | | | | 176,765,414 | |
| Net increase (decrease) in net assets | | | | (246,749,666 | ) | | | | 154,661,315 | |
| NET ASSETS: | | | | | | | | | | |
| Beginning of year | | | $ | 1,330,919,908 | | | | $ | 1,176,258,593 | |
| End of year | | | $ | 1,084,170,242 | | | | $ | 1,330,919,908 | |
| 46 | See Notes to Financial Statements. |
This page is intentionally left blank.
47
Financial Highlights
| | | | | | Per Share Operating Performance: |
| | | | | | Investment Operations: | | Distributions to
shareholders from: |
| | | | | | | | | | | | | | | | | | | | | | |
| | | | | | | | | | | | | | | | | | | | | | |
| | | | | | | | | | | | | | | | | | | | | | |
| | | Net asset
value,
beginning
of period | | Net
invest-
ment
income(a) | | Net
realized
and
unrealized
gain (loss) | | Total
from
invest-
ment
operations | | Net
invest-
ment
income | | Net
realized
gain | | Total
distributions |
| 12/31/2022 | | | $12.29 | | | | $0.45 | | | | $(2.01 | ) | | | $(1.56 | ) | | | $(0.50 | ) | | | $(0.03 | ) | | | $(0.53 | ) |
| 12/31/2021 | | | 12.48 | | | | 0.40 | | | | 0.01 | | | | 0.41 | | | | (0.39 | ) | | | (0.21 | ) | | | (0.60 | ) |
| 12/31/2020 | | | 12.08 | | | | 0.44 | | | | 0.43 | | | | 0.87 | | | | (0.47 | ) | | | – | | | | (0.47 | ) |
| 12/31/2019 | | | 11.08 | | | | 0.46 | | | | 1.02 | | | | 1.48 | | | | (0.48 | ) | | | – | | | | (0.48 | ) |
| 12/31/2018 | | | 12.38 | | | | 0.49 | | | | (0.99 | ) | | | (0.50 | ) | | | (0.53 | ) | | | (0.27 | ) | | | (0.80 | ) |
| (a) | Calculated using average shares outstanding during the period. |
| (b) | Total return does not consider the effects of sales charges or other expenses imposed by an insurance company and assumes the reinvestment of all distributions. |
| 48 | See Notes to Financial Statements. |
| | | | | Ratios to Average Net Assets: | | Supplemental Data: |
| | | | | | | | | | | | | |
| | | | | | | | | | | | | |
Net
asset
value,
end of
period | | Total
return(b)
(%) | | Total
expenses
after
waivers
and/or
reimburse-
ments
(%) | | Total
expenses
(%) | | Net
investment
income
(%) | | Net
assets,
end of
period
(000) | | Portfolio
turnover
rate
(%) |
| $ | 10.20 | | | | (12.80 | ) | | | 0.89 | | | | 0.89 | | | | 4.02 | | | $ | 1,084,170 | | | | 182 | |
| | 12.29 | | | | 3.28 | | | | 0.89 | | | | 0.89 | | | | 3.11 | | | | 1,330,920 | | | | 96 | |
| | 12.48 | | | | 7.30 | | | | 0.91 | | | | 0.91 | | | | 3.65 | | | | 1,176,259 | | | | 96 | |
| | 12.08 | | | | 13.35 | | | | 0.92 | | | | 0.92 | | | | 3.84 | | | | 1,187,443 | | | | 232 | |
| | 11.08 | | | | (4.02 | ) | | | 0.92 | | | | 0.93 | | | | 4.04 | | | | 1,077,305 | | | | 153 | |
| | See Notes to Financial Statements. | 49 |
Notes to Financial Statements
Lord Abbett Series Fund, Inc. (the “Company”) is registered under the Investment Company Act of 1940, as amended (the “Act”), as a diversified, open-end management investment company and was incorporated under Maryland law in 1989. The Company consists of nine separate portfolios as of December 31, 2022. This report covers Bond-Debenture Portfolio (the “Fund”).
The Fund’s investment objective is to seek high current income and the opportunity for capital appreciation to produce a high total return. The Fund has Variable Contract class shares (“Class VC Shares”), which are currently issued and redeemed only in connection with investments in, and payments under, variable annuity contracts and variable life insurance policies issued by life insurance and insurance-related companies.
The preparation of the financial statements in conformity with accounting principles generally accepted in the United States of America (“U.S. GAAP”) requires management to make certain estimates and assumptions that affect the reported amounts of assets and liabilities and disclosure of contingent assets and liabilities at the date of the financial statements and the reported amounts of increases and decreases in net assets from operations during the reporting period. Actual results could differ from those estimates. The Fund is considered an investment company under U.S. GAAP and follows the accounting and reporting guidance applicable to investment companies.
| 2. | SIGNIFICANT ACCOUNTING POLICIES |
| (a) | Investment Valuation–Under procedures approved by the Fund’s Board of Directors (the “Board”), the Board has designated the determination of fair value of the Fund’s portfolio investments to Lord, Abbett & Co. LLC (“Lord Abbett”), as its valuation designee. Accordingly, Lord Abbett is responsible for, among other things, assessing and managing valuation risks, establishing, applying and testing fair value methodologies, and evaluating pricing services. Lord Abbett has formed a Pricing Committee that performs these responsibilities on behalf of Lord Abbett, administers the pricing and valuation of portfolio investments and ensures that prices utilized reasonably reflect fair value. Among other things, these procedures allow Lord Abbett, subject to Board oversight, to utilize independent pricing services, quotations from securities and financial instrument dealers and other market sources to determine fair value. |
| | |
| | Securities actively traded on any recognized U.S. or non-U.S. exchange or on The NASDAQ Stock Market LLC are valued at the last sale price or official closing price on the exchange or system on which they are principally traded. Events occurring after the close of trading on non-U.S. exchanges may result in adjustments to the valuation of foreign securities to reflect their fair value as of the close of regular trading on the New York Stock Exchange. When valuing foreign equity securities that meet certain criteria, the Board has approved the use of an independent fair valuation service that values such securities to reflect market trading that occurs after the close of the applicable foreign markets of comparable securities or other instruments that correlate to the fair-valued securities. Unlisted equity securities are valued at the last quoted sale price or, if no sale price is available, at the mean between the most recently quoted bid and ask prices. Exchange traded options and futures contracts are valued at the last quoted sale price in the market where they are principally traded. If no sale has occurred, the mean between the most recently quoted bid and ask prices is used. Fixed income securities are valued based on evaluated prices supplied by independent pricing services, which reflect broker/dealer supplied valuations and the independent pricing services’ own electronic data processing techniques. Floating rate loans are valued at the average of bid and |
50
Notes to Financial Statements (continued)
| | ask quotations obtained from dealers in loans on the basis of prices supplied by independent pricing services. Forward foreign currency exchange contracts are valued using daily forward exchange rates. Swaps are valued daily using independent pricing services or quotations from broker/dealers to the extent available. |
| | |
| | Securities for which prices are not readily available are valued at fair value as determined by the Pricing Committee. The Pricing Committee considers a number of factors, including observable and unobservable inputs, when arriving at fair value. The Pricing Committee may use related or comparable assets or liabilities, recent transactions, market multiples, book values, and other relevant information to determine the fair value of portfolio investments. The Board or a designated committee thereof periodically reviews reports that may include fair value determinations made by the Pricing Committee, related market activity, inputs and assumptions, and retrospective comparison of prices of subsequent purchases and sales transactions to fair value determinations made by the Pricing Committee. |
| | |
| | Investments in open-end money market mutual funds are valued at their NAV as of the close of each business day. Short-term securities with 60 days or less remaining to maturity are valued using the amortized cost method, which approximates fair value. |
| | |
| (b) | Security Transactions–Security transactions are recorded as of the date that the securities are purchased or sold (trade date). Realized gains and losses on sales of portfolio securities are calculated using the identified- cost method. |
| | |
| (c) | Investment Income–Dividend income is recorded on the ex-dividend date. Interest income is recorded on the accrual basis as earned. Discounts are accreted and premiums are amortized using the effective interest method and are included in Interest and other, if applicable, on the Statement of Operations. Withholding taxes on foreign dividends have been provided for in accordance with the applicable country’s tax rules and rates. |
| | |
| (d) | Income Taxes–It is the policy of the Fund to meet the requirements of Subchapter M of the Internal Revenue Code applicable to regulated investment companies and to distribute substantially all taxable income and capital gains to its shareholders. Therefore, no income tax provision is required. |
| | |
| | The Fund files U.S. federal and various state and local tax returns. No income tax returns are currently under examination. The statute of limitations on the Fund’s filed U.S. federal tax returns remains open for the fiscal years ended December 31, 2019 through December 31, 2022. The statutes of limitations on the Fund’s state and local tax returns may remain open for an additional year depending upon the jurisdiction. |
| | |
| (e) | Expenses–Expenses incurred by the Company that do not specifically relate to an individual fund are generally allocated to the funds within the Company on a pro rata basis by relative net assets. |
| | |
| (f) | Foreign Transactions–The books and records of the Fund are maintained in U.S. dollars and transactions denominated in foreign currencies are recorded in the Fund’s records at the rate prevailing when earned or recorded. Asset and liability accounts that are denominated in foreign currencies are adjusted daily to reflect current exchange rates and any unrealized gain (loss), if applicable, is included in Net change in unrealized appreciation/depreciation on translation of assets and liabilities denominated in foreign currencies on the Fund’s Statement of Operations. The resultant exchange gains and losses upon settlement of such transactions, if applicable, are included in Net realized gain (loss) on foreign currency related transactions |
51
Notes to Financial Statements (continued)
| | on the Fund’s Statement of Operations. The Fund does not isolate that portion of the results of operations arising as a result of changes in the foreign exchange rates from the changes in market prices of the securities. |
| | |
| | The Fund uses foreign currency exchange contracts to facilitate transactions in foreign-denominated securities. Losses from these transactions may arise from changes in the value of the foreign currency or if the counterparties do not perform under the contracts’ terms. |
| | |
| (g) | Forward Foreign Currency Exchange Contracts–The Fund may enter into forward foreign currency exchange contracts in order to reduce exposure to changes in foreign currency exchange rates on foreign portfolio holdings, or gain or reduce exposure to foreign currency solely for investment purposes. A forward foreign currency exchange contract is a commitment to purchase or sell a foreign currency at a future date at a negotiated rate. The contracts are valued daily at forward exchange rates and any unrealized gain (loss), if applicable, is included in Net change in unrealized appreciation/depreciation on forward foreign currency exchange contracts in the Fund’s Statement of Operations. The gain (loss) arising from the difference between the U.S. dollar cost of the original contract and the value of the forward foreign currency in U.S. dollars upon closing of such contracts is included, if applicable, in Net realized gain (loss) on forward foreign currency exchange contracts in the Fund’s Statement of Operations. |
| | |
| (h) | Futures Contracts–The Fund may purchase and sell futures contracts to enhance returns, to attempt to economically hedge some of its investment risk, or as a substitute position in lieu of holding the underlying asset on which the instrument is based. At the time of entering into a futures transaction, an investor is required to deposit and maintain a specified amount of cash or eligible securities called “initial margin.” Subsequent payments made or received by the Fund called “variation margin” are made on a daily basis as the market price of the futures contract fluctuates. The Fund will record an unrealized gain (loss) based on the amount of variation margin. When a contract is closed, a realized gain (loss) is recorded equal to the difference between the opening and closing value of the contract. |
| | |
| (i) | Inflation-Linked Derivatives–The Fund may invest in inflation-linked derivatives, such as Consumer Price Index Swap Agreements (“CPI swaps”). A CPI swap is a contract in which one party agrees to pay a fixed rate in exchange for a variable rate, which is the rate of change in the CPI during the life of the contract. Payments are based on a notional amount of principal. The Fund will normally enter into CPI swap contracts on a zero coupon basis, meaning that the floating rate will be based on the cumulative CPI during the life of the contract, and the fixed rate will compound until the swap’s maturity date, at which point the payments are netted. The swaps are valued daily and any unrealized gain (loss) is included in the Net change in unrealized appreciation/depreciation on swap contracts in the Fund’s Statement of Operations. A liquidation payment received or made at the termination or maturity of the swap is recorded in realized gain (loss) and is included in Net realized gain (loss) on swap contracts in the Fund’s Statement of Operations. Daily changes in valuation of centrally cleared CPI swaps, if any, are recorded as a receivable or payable for the change in value as appropriate (“variation margin”) on the Statement of Assets and Liabilities. For the centrally cleared CPI swaps, there was minimal counterparty risk to the Fund, since such CPI swaps entered into were traded through a central clearinghouse, which guarantees against default. |
| | |
| (j) | Credit Default Swaps–The Fund may enter into credit default swap contracts in order to hedge credit risk or for speculation purposes. As a seller of a credit default swap contract |
52
Notes to Financial Statements (continued)
| | (“seller of protection”), the Fund is required to pay the notional amount or other agreed-upon value of a referenced debt obligation to the counterparty in the event of a default by or other credit event involving the referenced issuer, obligation or index. In return, the Fund receives from the counterparty a periodic stream of payments over the term of the contract. |
| | |
| | As a purchaser of a credit default swap contract (“buyer of protection”), the Fund would receive the notional amount or other agreed upon value of a referenced debt obligation from the counterparty in the event of default by or other credit event involving the referenced issuer, obligation or index. In return, the Fund makes periodic payments to the counterparty over the term of the contracts, provided no event of default has occurred. |
| | |
| | These credit default swaps may have as a reference obligation corporate or sovereign issuers or credit indexes. These credit indexes are comprised of a basket of securities representing a particular sector of the market. |
| | |
| | Credit default swaps are fair valued based upon quotations from counterparties, brokers or market-makers and the change in value, if any, is recorded as unrealized appreciation or depreciation. For a credit default swap sold by the Fund, payment of the agreed-upon amount made by the Fund in the event of default of the referenced debt obligation is recorded as the cost of the referenced debt obligation purchased/received. For a credit default swap purchased by the Fund, the agreed-upon amount received by the Fund in the event of default of the referenced debt obligation is recorded as proceeds from sale/delivery of the referenced debt obligation and the resulting gain or loss realized on the referenced debt obligation is recorded as such by the Fund. |
| | |
| | Any upfront payments made or received upon entering a credit default swap contract would be amortized or accreted over the life of the swap and recorded as realized gains or losses. Collateral, in the form of cash or securities, may be required to be held in segregated accounts with the custodian bank or broker in accordance with the swap agreement. The value and credit rating of each credit default swap where the Fund is the seller of protection, are both measures of the current payment/performance risk of the swap. As the value of the swap changes as a positive or negative percentage of the total notional amount, the payment/performance risk may decrease or increase, respectively. The maximum potential amount of future payments (undiscounted) that the Fund as a seller of protection could be required to make under a credit default swap agreement would be an amount equal to the notional amount of the agreement. These potential amounts would be partially offset by any recovery values of the respective referenced obligations, upfront payments received upon entering into the agreement, or net amounts received from the settlement of buy protection credit default swap agreements entered into by the Fund for the same referenced entity or entities. |
| | |
| | Entering into credit default swaps involves credit and market risk. Such risks involve the possibility that there will be no liquid market for these agreements, that the counterparty to the agreements may default on its obligation to perform or disagree as to the meaning of the contractual terms in the agreements, and that there may be unfavorable changes in interest rates, and that Lord Abbett does not correctly predict the creditworthiness of the issuers of the reference obligation on which the credit default swap is based. For the centrally cleared credit default swaps, there was minimal counterparty risk to the Fund, since such credit default swaps entered into were traded through a central clearinghouse, which guarantees against default. |
| | |
| (k) | Total Return Swaps–The Fund may enter into total return swap agreements to obtain exposure to a security or market without owning such security or investing directly in that |
53
Notes to Financial Statements (continued)
| | market. The Fund may agree to make payments that are the equivalent of interest in exchange for the right to receive payments equivalent to any appreciation in the value of an underlying security, index or other asset, as well as receive payments equivalent to any distributions made on that asset, over the term of the swap. If the value of the asset underlying a total return swap declines over the term of the swap, the Fund also may be required to pay an amount equal to that decline in value to its counterparty. |
| | |
| (l) | Repurchase Agreements–The Fund may enter into repurchase agreements with respect to securities. A repurchase agreement is a transaction in which a fund acquires a security and simultaneously commits to resell that security to the seller (a bank or securities dealer) at an agreed-upon price on an agreed-upon date. The Fund requires at all times that the repurchase agreement be collateralized by cash, or by securities of the U.S. Government, its agencies, its instrumentalities, or U.S. Government sponsored enterprises having a value equal to, or in excess of, the value of the repurchase agreement (including accrued interest). If the seller of the agreement defaults on its obligation to repurchase the underlying securities at a time when the fair value of these securities has declined, the Fund may incur a loss upon disposition of the securities. |
| | |
| (m) | When-Issued, Forward Transactions or To-Be-Announced (“TBA”) Transactions–The Fund may purchase portfolio securities on a when-issued or forward basis. When-issued, forward transactions or TBA transactions involve a commitment by the Fund to purchase securities, with payment and delivery (“settlement”) to take place in the future, in order to secure what is considered to be an advantageous price or yield at the time of entering into the transaction. During the period between purchase and settlement, the fair value of the securities will fluctuate and assets consisting of cash and/or marketable securities (normally short-term U.S. Government or U.S. Government sponsored enterprise securities) marked to market daily in an amount sufficient to make payment at settlement will be segregated at the Fund’s custodian in order to pay for the commitment. At the time the Fund makes the commitment to purchase a security on a when-issued basis, it will record the transaction and reflect the liability for the purchase and fair value of the security in determining its NAV. The Fund, generally, has the ability to close out a purchase obligation on or before the settlement date rather than take delivery of the security. Under no circumstances will settlement for such securities take place more than 120 days after the purchase date. |
| | |
| (n) | TBA Sale Commitments–The Fund may enter into TBA sale commitments to hedge its positions or to sell mortgage-backed securities it owns under delayed delivery arrangements. Proceeds of TBA sale commitments are not received until the contractual settlement date. During the time a TBA sale commitment is outstanding, equivalent deliverable securities, or an offsetting TBA purchase commitment deliverable on or before the sale commitment date, are held as “cover” for the transaction. Unsettled TBA sale commitments are valued at the current market value of the underlying securities, according to the procedures described under “Investment Valuation” above. The contract is adjusted to market value daily and the change in market value is recorded by the Fund as unrealized appreciation (depreciation). If the TBA sale (purchase) commitment is closed through the acquisition of an offsetting purchase (sale) commitment, the Fund realizes a gain or loss from the sale of the securities based upon the unit price established at the date the commitment was entered into. |
| | |
| (o) | Mortgage Dollar Rolls–The Fund may enter into mortgage dollar rolls in which a Fund sells mortgage-backed securities for delivery in the current month and simultaneously contracts |
54
Notes to Financial Statements (continued)
| | with the same counterparty to repurchase similar (same type, coupon and maturity) but not identical securities on a specified future date. During the roll period, the Fund loses the right to receive principal (including prepayments of principal) and interest paid on the securities sold. |
| | |
| (p) | Reverse Repurchase Agreements–The Fund may enter into reverse repurchase agreements. In a reverse repurchase agreement, a fund sells a security to a securities dealer or bank for cash and also agrees to repurchase the same security later at a set price. Reverse repurchase agreements expose the Fund to credit risk (that is, the risk that the counterparty will fail to resell the security to the Fund). Engaging in reverse repurchase agreements also may involve the use of leverage, in that the Fund may reinvest the cash it receives in additional securities. Reverse repurchase agreements involve the risk that the market value of the securities to be repurchased by the Fund may decline below the repurchase price. |
| | |
| | For the fiscal year ended December 31, 2022, the Fund did not have reverse repurchase agreements. |
| | |
| (q) | Floating Rate Loans–The Fund may invest in floating rate loans, which usually take the form of loan participations and assignments. Loan participations and assignments are agreements to make money available to U.S. or foreign corporations, partnerships or other business entities (the “Borrower”) in a specified amount, at a specified rate and within a specified time. A loan is typically originated, negotiated and structured by a U.S. or foreign bank, insurance company or other financial institution (the “Agent”) for a group of loan investors (“Loan Investors”). The Agent typically administers and enforces the loan on behalf of the other Loan Investors in the syndicate and may hold any collateral on behalf of the Loan Investors. Such loan participations and assignments are typically senior, secured and collateralized in nature. The Fund records an investment when the Borrower withdraws money and records interest as earned. These loans pay interest at rates which are periodically reset by reference to a base lending rate plus a spread. These base lending rates are generally the prime rate offered by a designated U.S. bank or London InterBank Offered Rate (“LIBOR”). |
| | |
| | The loans in which the Fund invests may be subject to some restrictions on resale. For example, the Fund may be contractually obligated to receive approval from the Agent and/or Borrower prior to the sale of these investments. The Fund generally has no right to enforce compliance with the terms of the loan agreement with the Borrower. As a result, the Fund assumes the credit risk of the Borrower, the selling participant and any other persons interpositioned between the Fund and the Borrower (“Intermediate Participants”). In the event that the Borrower, selling participant or Intermediate Participants become insolvent or enter into bankruptcy, the Fund may incur certain costs and delays in realizing payment or may suffer a loss of principal and/or interest. |
| | |
| | Unfunded commitments represent the remaining obligation of the Fund to the Borrower. At any point in time, up to the maturity date of the issue, the Borrower may demand the unfunded portion. Until demanded by the Borrower, unfunded commitments are not recognized as an asset on the Statement of Assets and Liabilities. Unrealized appreciation/depreciation on unfunded commitments, if any, on the Statement of Assets and Liabilities represents mark to market of the unfunded portion of the Fund’s floating rate notes. |
| | |
| | As of December 31, 2022, the Fund did not have unfunded loan commitments. |
| | |
| (r) | Fair Value Measurements–Fair value is defined as the price that the Fund would receive upon selling an investment or transferring a liability in an orderly transaction to an independent |
55
Notes to Financial Statements (continued)
| | buyer in the principal or most advantageous market of the investment. A three-tier hierarchy is used to maximize the use of observable market data and minimize the use of unobservable inputs and to establish classification of fair value measurements for disclosure purposes. Inputs refer broadly to the assumptions that market participants would use in pricing the asset or liability, including assumptions about risk - for example, the risk inherent in a particular valuation technique used to measure fair value (such as a pricing model) and/or the risk inherent in the inputs to the valuation technique. Inputs may be observable or unobservable. Observable inputs reflect the assumptions market participants would use in pricing the asset or liability. Observable inputs are based on market data obtained from sources independent of the reporting entity. Unobservable inputs reflect the reporting entity’s own assumptions about the assumptions market participants would use in pricing the asset or liability. Unobservable inputs are based on the best information available in the circumstances. The three-tier hierarchy classification is determined based on the lowest level of inputs that is significant to the fair value measurement, and is summarized in the three broad Levels listed below: |
| | |
| | • | Level 1 – | unadjusted quoted prices in active markets for identical investments; |
| | | | |
| | • | Level 2 – | other significant observable inputs (including quoted prices for similar investments, interest rates, prepayment speeds, credit risk, etc.); and |
| | | | |
| | • | Level 3 – | significant unobservable inputs (including the Fund’s own assumptions in determining the fair value of investments). |
| | |
| | A summary of inputs used in valuing the Fund’s investments and other financial instruments as of December 31, 2022 and, if applicable, Level 3 rollforwards for the fiscal year then ended is included in the Fund’s Schedule of Investments. |
| | |
| | Changes in valuation techniques may result in transfers into or out of an assigned level within the three-tier hierarchy. The inputs or methodology used for valuing securities are not necessarily an indication of the risk associated with investing in those securities. |
| | |
| 3. | MANAGEMENT FEE AND OTHER TRANSACTIONS WITH AFFILIATES |
Management Fee
The Company has a management agreement with Lord Abbett, pursuant to which Lord Abbett provides the Fund with investment management services and executive and other personnel, provides office space and pays for ordinary and necessary office and clerical expenses relating to research and statistical work and supervision of the Fund’s investment portfolio. The management fee is accrued daily and payable monthly.
The management fee is based on the Fund’s average daily net assets at the following annual rate:
| First $500 million | .50% |
| Next $9.5 billion | .45% |
| Over $10 billion | .40% |
For the fiscal year ended December 31, 2022, the effective management fee was at an annualized rate of .47% of the Fund’s average daily net assets.
In addition, Lord Abbett provides certain administrative services to the Fund pursuant to an Administrative Services Agreement in return for a fee at an annual rate of .04% of the Fund’s average daily net assets. The fund administration fee is accrued daily and payable monthly. Lord Abbett voluntarily waived $67,133 of fund administration fees during the fiscal year ended December 31, 2022.
The Company, on behalf of the Fund, has entered into services arrangements with certain insurance companies. Under these arrangements, certain insurance companies will be
56
Notes to Financial Statements (continued)
compensated up to .25% of the average daily net asset value (“NAV”) of the Fund’s Class VC Shares held in the insurance company’s separate account to service and maintain the Variable Contract owners’ accounts. This amount is included in Non 12b-1 service fees on the Statement of Operations. The Fund may also compensate certain insurance companies, third-party administrators and other entities for providing recordkeeping, sub-transfer agency and other administrative services to the Fund. This amount is included in Shareholder servicing on the Statement of Operations.
One Director and certain of the Company’s officers have an interest in Lord Abbett.
| 4. | DISTRIBUTIONS AND CAPITAL LOSS CARRYFORWARDS |
Dividends from net investment income, if any, are declared and paid at least semi-annually. Taxable net realized gains from investment transactions, reduced by allowable capital loss carryforwards, if any, are declared and distributed to shareholders at least annually. The capital loss carryforward amount, if any, is available to offset future net capital gains. Dividends and distributions to shareholders are recorded on the ex-dividend date. The amounts of dividends and distributions from net investment income and net realized capital gains are determined in accordance with federal income tax regulations, which may differ from U.S. GAAP. These book/tax differences are either considered temporary or permanent in nature. To the extent these differences are permanent in nature, such amounts are reclassified within the components of net assets based on their federal tax basis treatment; temporary differences do not require reclassification. Dividends and distributions that exceed earnings and profits for tax purposes are reported as a tax return of capital.
The tax character of distributions paid during the fiscal years ended December 31, 2022 and December 31, 2021 was as follows:
| | | Year Ended
12/31/2022 | | | Year Ended
12/31/2021 | |
| Distributions paid from: | | | | | | | | |
| Ordinary income | | $ | 53,863,559 | | | $ | 61,516,780 | |
| Total distributions paid | | $ | 53,863,559 | | | $ | 61,516,780 | |
As of December 31, 2022, the components of accumulated gains (losses) on a tax-basis were as follows:
| Capital loss carryforwards* | | $ | (79,928,632 | ) |
| Temporary differences | | | (468,287 | ) |
| Unrealized gains (losses) – net | | | (97,287,529 | ) |
| Total accumulated gains (losses) – net | | $ | (177,684,448 | ) |
| * | The capital losses will carry forward indefinitely. |
At the Fund’s election, certain losses incurred within the taxable year (Qualified Late- Year Losses) are deemed to arise on the first business day of the Fund’s next taxable year. The Fund incurred and will elect to defer late-year ordinary losses of $283,927 during fiscal 2022.
As of December 31, 2022, the aggregate unrealized security gains (losses) on investments and other financial instruments based on cost for U.S. federal income tax purposes were as follows:
| Tax cost | | $ | 1,222,599,922 | |
| Gross unrealized gain | | | 9,384,259 | |
| Gross unrealized loss | | | (106,621,934 | ) |
| Net unrealized security gain (loss) | | $ | (97,237,675 | ) |
57
Notes to Financial Statements (continued)
The difference between book- basis and tax- basis unrealized gains (losses) is attributable to the tax treatment of certain securities, other financial instruments, premium amortization and wash sales.
Permanent items identified during the fiscal year ended December 31, 2022 have been reclassified among the components of net assets based on their tax basis treatment as follows:
Total Distributable
Earnings (Loss) | Paid-in capital | |
| $748,229 | $(748,229 | ) |
The permanent differences are primarily attributable to the tax treatment of certain distributions.
| 5. | PORTFOLIO SECURITIES TRANSACTIONS |
Purchases and sales of investment securities (excluding short-term investments) for the fiscal year ended December 31, 2022 were as follows:
U.S.
Government
Purchases | * | Non-U.S.
Government
Purchases | U.S.
Government
Sales | * | Non-U.S.
Government
Sales |
| $997,441,621 | | $1,179,221,654 | $888,698,648 | | $1,262,651,875 |
| * | Includes U.S. Government sponsored enterprises securities. |
The Fund is permitted to purchase and sell securities (“cross-trade”) from and to other Lord Abbett funds or client accounts pursuant to procedures approved by the Board in compliance with Rule 17a-7 under the Act (the “Rule”). Each cross-trade is executed at a fair market price in compliance with provisions of the Rule. For the fiscal year ended December 31, 2022, the Fund engaged in cross-trade purchases of $1,972,015 and sales of $5,930,193 which resulted in a net realized gain (loss) of $11,397.
| 6. | DISCLOSURES ABOUT DERIVATIVE INSTRUMENTS AND HEDGING ACTIVITIES |
The Fund entered into forward foreign currency exchange contracts for the for the fiscal year ended December 31, 2022 (as described in Note 2(g)). A forward foreign currency exchange contract reduces the Fund’s exposure to changes in the value of the currency it will deliver (or settle in cash) and increases its exposure to changes in the value of the currency it will receive (or settle in cash) for the duration of the contract. The Fund’s use of forward foreign currency exchange contracts involves the risk that Lord Abbett will not accurately predict currency movements, and the Fund’s returns could be reduced as a result. Forward foreign currency exchange contracts are subject to the risk that those currencies will decline in value relative to the U.S. dollar, or, in the case of hedged positions, that the U.S. dollar will decline relative to the currency being hedged. Currency rates in foreign countries may fluctuate significantly over short periods of time. The Fund’s risk of loss from counterparty credit risk is the unrealized appreciation on forward foreign currency exchange contracts and deposits with brokers as collateral.
The Fund entered into U.S. Treasury futures contracts for the for the fiscal year ended December 31, 2022 (as described in Note 2(h)) to economically hedge against changes in interest rates. The Fund bears the risk of interest rates moving unexpectedly, in which case the Fund may not achieve the anticipated benefits of the futures contracts and realize a loss. There is minimal counterparty credit risk to the Fund since futures are exchange traded and the exchange’s clearinghouse, as counterparty to all exchange traded futures, guarantees futures against default.
The Fund entered into CPI swaps for the fiscal year ended December 31, 2022 (as described in Note 2(i)) to speculate the rate of inflation in the U.S. economy. The Fund’s use of CPI swaps involves
58
Notes to Financial Statements (continued)
the risk that Lord Abbett will not accurately predict expectations of inflation or interest rates, and the Fund’s returns could be reduced as a result. The Fund’s risk of loss from counterparty credit risk is the unrealized appreciation on CPI swaps. For the centrally cleared CPI swaps, there is minimal counterparty credit risk to the Fund since these CPI swaps are traded through a central clearinghouse. As a counterparty to all centrally cleared CPI swaps, the clearinghouse guarantees CPI swaps against default.
The Fund entered into credit default swaps for the fiscal year ended December 31, 2022 (as described in Note 2(j)) for investment purposes, to economically hedge credit risk or for speculative purposes. Credit default swaps involve the exchange of a fixed rate premium for protection against the loss in value of an underlying security within the index in the event of a defined credit event, such as payment default or bankruptcy. Under a credit default swap one party acts as a guarantor by receiving the fixed periodic payment in exchange for the commitment to purchase the underlying security at par if the defined credit event occurs. Upon the occurrence of a defined credit event, the difference between the value of the reference obligation and the swap’s notional amount is recorded as realized gain or loss on swap transactions in the Statement of Operations. The Fund’s maximum risk of loss from counterparty risk, either as the protection seller or as the protection buyer, is the fair value of the contract. For the centrally cleared credit default swaps, there is minimal counterparty credit risk to the Fund since these credit default swaps are traded through a central clearinghouse. As a counterparty to all centrally cleared credit default swaps, the clearinghouse guarantees credit default swaps against default.
The Fund entered into total return swaps on indexes for the fiscal year ended December 31, 2022 (as described in Note 2(k)) to hedge credit risk. The Fund may enter into total return swap agreements to obtain exposure to a security or market without owning such security or investing directly in that market. The Fund may agree to make payments that are the equivalent of interest in exchange for the right to receive payments equivalent to any appreciation in the value of an underlying security, index or other asset, as well as receive payments equivalent to any distributions made on that asset, over the term of the swap. If the value of the asset underlying a total return swap declines over the term of the swap, the Fund also may be required to pay an amount equal to that decline in value to its counterparty.
As of December 31, 2022, the Fund had the following derivatives at fair value, grouped into appropriate risk categories that illustrate the Fund’s use of derivative instruments:
| Asset Derivatives | | Interest
Rate
Contracts | | | Foreign
Currency
Contracts | | | Credit
Contracts | | | Inflation
Linked
Contracts | |
| Centrally Cleared CPI Swap Contracts(1) | | | – | | | | – | | | | – | | | $ | 44,171 | |
| Credit Default Swap Contracts(2) | | | – | | | | – | | | $ | 499,740 | | | | – | |
| Forward Foreign Currency Exchange Contracts(3) | | | – | | | $ | 28,382 | | | | – | | | | – | |
| Futures Contracts(4) | | $ | 2,072,303 | | | | – | | | | – | | | | – | |
| Liability Derivatives | | | | | | | | | | | | | | | | |
| Centrally Cleared CPI Swap Contracts(1) | | | – | | | | – | | | | – | | | $ | 411,249 | |
| Centrally Cleared Credit Default Swap Contracts(1) | | | – | | | | – | | | $ | 678,237 | | | | – | |
| Credit Default Swap Contracts(2) | | | – | | | | – | | | $ | 22,023 | | | | – | |
| Forward Foreign Currency Exchange Contracts(5) | | | – | | | $ | 410,032 | | | | – | | | | – | |
| Futures Contracts(4) | | $ | 1,126,202 | | | | – | | | | – | | | | – | |
| (1) | Statement of Assets and Liabilities location: Includes cumulative unrealized appreciation/depreciation of centrally cleared swap contracts as reported in the Schedule of Investments. Only current day’s variation margin is reported within the Statement of Assets and Liabilities. |
59
Notes to Financial Statements (continued)
| (2) | Statement of Assets and Liabilities location: Credit default swap agreements payable (receivable), at fair value. |
| (3) | Statement of Assets and Liabilities location: Unrealized appreciation on forward foreign currency exchange contracts. |
| (4) | Statement of Assets and Liabilities location: Includes cumulative unrealized appreciation/depreciation of futures contracts as reported in the Schedule of Investments. Only current day’s variation margin is reported within the Statement of Assets and Liabilities. |
| (5) | Statement of Assets and Liabilities location: Unrealized depreciation on forward foreign currency exchange contracts. |
Transactions in derivative instruments for the fiscal year ended December 31, 2022, were as follows:
| | | Equity
Contracts | | | Inflation
Linked/
Interest
Rate
Contracts | | | Foreign
Currency
Contracts | | | Credit
Contracts | |
| Net Realized Gain (Loss) | | | | | | | | | | | | | | | | |
| CPI/Interest Rate Swap Contracts(1) | | | – | | | $ | 2,026,284 | | | | – | | | | – | |
| Credit Default Swap Contracts(1) | | | – | | | | – | | | | – | | | $ | (2,768,378 | ) |
| Forward Foreign Currency Exchange Contracts(2) | | | – | | | | – | | | $ | 1,619,886 | | | | – | |
| Futures Contracts(3) | | | – | | | $ | 28,206,355 | | | | – | | | | – | |
| Total Return Swap Contracts(1) | | $ | (125,177 | ) | | | – | | | | – | | | | – | |
| Net Change in Unrealized Appreciation/Depreciation | | | | | | | | | | | | | | | | |
| CPI/Interest Rate Swap Contracts(4) | | | – | | | $ | (367,078 | ) | | | – | | | | – | |
| Credit Default Swap Contracts(4) | | | – | | | | – | | | | – | | | $ | 167,364 | |
| Forward Foreign Currency Exchange Contracts(5) | | | – | | | | – | | | $ | (261,467 | ) | | | – | |
| Futures Contracts(6) | | | – | | | $ | 1,602,523 | | | | – | | | | – | |
| Average Number of Contracts/Notional Amounts* | | | | | | | | | | | | | | | | |
| CPI/Interest Rate Swap Contracts(7) | | | – | | | $ | 38,504,470 | | | | – | | | | – | |
| Credit Default Swap Contracts(7) | | | – | | | | – | | | | – | | | $ | 40,093,783 | |
| Forward Foreign Currency Exchange Contracts(7) | | | – | | | | – | | | $ | 26,395,586 | | | | – | |
| Futures Contracts(8) | | | – | | | | 4,217 | | | | – | | | | – | |
| Total Return Swap Contracts(7) | | $ | 1,623,751 | | | | – | | | | – | | | | – | |
| * | Calculated based on the number of contracts or notional amounts for the year ended December 31, 2022. |
| (1) | Statement of Operations location: Net realized gain (loss) on swap contracts. |
| (2) | Statement of Operation location: Net realized gain (loss) on forward foreign currency exchange contracts. |
| (3) | Statement of Operation location: Net realized gain (loss) on futures contracts. |
| (4) | Statement of Operation location: Net change in unrealized appreciation/depreciation on swap contracts. |
| (5) | Statement of Operation location: Net change in unrealized appreciation/depreciation on forward foreign currency exchange contracts. |
| (6) | Statement of Operations location: Net change in unrealized appreciation/depreciation on futures contracts. |
| (7) | Amount represents notional amounts in U.S. dollars. |
| (8) | Amount represents number of contracts. |
| 7. | DISCLOSURES ABOUT OFFSETTING ASSETS AND LIABILITIES |
The Financial Accounting Standards Board requires disclosures intended to help better assess the effect or potential effect of offsetting arrangements on a fund’s financial position. The following tables illustrate gross and net information about recognized assets and liabilities eligible for offset in the Statement of Assets and Liabilities; and disclose such amounts subject to an enforceable master netting agreement or similar agreement, by the counterparty. A master netting agreement is an agreement between a fund and a counterparty which provides for the net settlement of amounts owed under all contracts traded under that agreement, as well as cash collateral, through a single payment by one party to the other in the event of default on or termination of any one contract. The
60
Notes to Financial Statements (continued)
Fund’s accounting policy with respect to balance sheet offsetting is that, absent an event of default by the counterparty or a termination of the agreement, the master netting agreement does not result in an offset of reported amounts of financial assets and liabilities in the Statement of Assets and Liabilities across transactions between the Fund and the applicable counterparty:
| Description | | Gross Amounts of
Recognized Assets | | | Gross Amounts
Offset in the
Statement of Assets
and Liabilities | | | Net Amounts of
Assets Presented
in the Statement of
Assets and Liabilities | |
| Credit Default Swap Contracts | | $ | 499,740 | | | $ | – | | | $ | 499,740 | |
| Forward Foreign Currency Exchange Contracts | | | 28,382 | | | | – | | | | 28,382 | |
| Repurchase Agreements | | | 30,959,245 | | | | – | | | | 30,959,245 | |
| Total | | $ | 31,487,367 | | | $ | – | | | $ | 31,487,367 | |
| | | Net Amount
of Assets
Presented in | | | Amounts Not Offset in the
Statement of Assets and Liabilities | | | | |
| Counterparty | | the Statement
of Assets
and Liabilities | | | Financial
Instruments | | | Cash
Collateral
Received(a) | | | Securities
Collateral
Received(a) | | | Net
Amount(b) | |
| BNP Paribas S.A. | | $ | 411,551 | | | $ | – | | | $ | (300,000 | ) | | $ | – | | | $ | 111,551 | |
| J.P. Morgan | | | 88,189 | | | | (3,614 | ) | | | – | | | | – | | | | 84,575 | |
| Morgan Stanley | | | 6,261 | | | | (6,261 | ) | | | – | | | | – | | | | – | |
| Toronto Dominion Bank | | | 22,121 | | | | (22,121 | ) | | | – | | | | – | | | | – | |
| Fixed Income Clearing Corp. | | | 5,960,416 | | | | – | | | | – | | | | (5,960,416 | ) | | | – | |
| TD Securities USA LLC | | | 8,699,229 | | | | – | | | | – | | | | (8,699,229 | ) | | | – | |
| Barclays Bank plc | | | 16,299,600 | | | | – | | | | – | | | | (16,299,600 | ) | | | – | |
| Total | | $ | 31,487,367 | | | $ | (31,996 | ) | | $ | (300,000 | ) | | $ | (30,959,245 | ) | | $ | 196,126 | |
| Description | | Gross Amounts of
Recognized Liabilities | | | Gross Amounts
Offset in the
Statement of Assets
and Liabilities | | | Net Amounts of
Liabilities Presented
in the Statement of
Assets and Liabilities | |
| Credit Default Swap Contracts | | $ | 22,023 | | | $ | – | | | $ | 22,023 | |
| Forward Foreign Currency Exchange Contracts | | | 410,032 | | | | – | | | | 410,032 | |
| Total | | $ | 432,055 | | | $ | – | | | $ | 432,055 | |
| | | Net Amounts
of Liabilities
Presented in | | | Amounts Not Offset in the
Statement of Assets and Liabilities | | | | |
| Counterparty | | the Statement
of Assets and
Liabilities | | | Financial
Instruments | | | Cash
Collateral
Pledged(a) | | | Securities
Collateral
Pledged(a) | | | Net
Amount(c) | |
| Bank of America | | $ | 9,281 | | | $ | – | | | $ | – | | | $ | – | | | $ | 9,281 | |
| Citibank | | | 22,023 | | | | – | | | | – | | | | – | | | | 22,023 | |
| J.P. Morgan | | | 3,614 | | | | (3,614 | ) | | | – | | | | – | | | | – | |
| Morgan Stanley | | | 26,121 | | | | (6,261 | ) | | | – | | | | – | | | | 19,860 | |
| State Street Bank and Trust | | | 131,091 | | | | – | | | | (10,000 | ) | | | – | | | | 121,091 | |
| Toronto Dominion Bank | | | 239,925 | | | | (22,121 | ) | | | (217,804 | ) | | | – | | | | – | |
| Total | | $ | 432,055 | | | $ | (31,996 | ) | | $ | (227,804 | ) | | $ | – | | | $ | 172,255 | |
| (a) | Collateral disclosed is limited to an amount not to exceed 100% of the net amount of assets (liabilities) presented in the Statement of Assets and Liabilities, for each respective counterparty. |
61
Notes to Financial Statements (continued)
| (b) | Net amount represents the amount owed to the Fund by the counterparty as of December 31, 2022. |
| (c) | Net amount represents the amount owed by the Fund to the counterparty as of December 31, 2022. |
| 8. | DIRECTORS’ REMUNERATION |
The Company’s officers and one Director, who are associated with Lord Abbett, do not receive any compensation from the Company for serving in such capacities. Independent Directors’ fees are allocated among all Lord Abbett-sponsored funds based on the net assets of each fund. There is an equity-based plan available to all Independent Directors under which Independent Directors may elect to defer receipt of a portion of Directors’ fees. The deferred amounts are treated as though equivalent dollar amounts had been invested in the Fund. Such amounts and earnings accrued thereon are included in Directors’ fees on the Statement of Operations and in Directors’ fees payable on the Statement of Assets and Liabilities and are not deductible for U.S. federal income tax purposes until such amounts are paid.
The Company has entered into an arrangement with its transfer agent and custodian, whereby credits realized as a result of uninvested cash balances are used to reduce a portion of the Fund’s expenses.
For the period ended August 3, 2022, the Fund and certain other funds managed by Lord Abbett (collectively, the “Participating Funds”) entered into a syndicated line of credit facility with various lenders for $1.275 billion (the “Syndicated Facility”) whereas State Street Bank and Trust Company (“SSB”) participated as a lender and as agent for the lenders. The Participating Funds were subject to graduated borrowing limits of one-third of fund net assets (if fund net assets are less than $750 million), $250 million, $300 million, $700 million, or $1 billion, based on past borrowings and likelihood of future borrowings, among other factors.
Effective August 4, 2022, the Participating Funds entered into a Syndicated Facility with various lenders for $1.625 billion whereas SSB participates as a lender and as agent for the lenders. The Participating Funds were subject to graduated borrowing limits of one-third of fund net assets (if fund net assets are less than $750 million), $250 million, $300 million, $700 million, or $1 billion, based on past borrowings and likelihood of future borrowings, among other factors.
For the period ended August 3, 2022, the Participating Funds were party to an additional line of credit facility with SSB for $330 million (the “Bilateral Facility”), $250 million committed and $80 million uncommitted. Under the Bilateral Facility, the Participating Funds are subject to graduated borrowing limits of one-third of fund net assets (if net assets are less than $750 million), $250 million, $300 million, or $330 million, based on past borrowings and likelihood of future borrowings, among other factors.
Effective August 4, 2022, the Participating Funds are party to an additional uncommitted line of credit facility with SSB for $330 million. Under the Bilateral Facility, the Participating Funds are subject to borrowing limits of one-third of fund net assets (if net assets are less than $750 million), or $250 million based on past borrowings and likelihood of future borrowings, among other factors.
The Syndicated Facility and the Bilateral Facility are to be used for temporary or emergency purposes as additional sources of liquidity to satisfy redemptions.
62
Notes to Financial Statements (continued)
For the year ended December 31, 2022, the Fund did not utilize the Syndicated Facility or Bilateral Facility.
| 11. | INTERFUND LENDING PROGRAM |
Pursuant to an exemptive order issued by the U.S. Securities and Exchange Commission (“SEC exemptive order”) certain registered open-end management investment companies managed by Lord Abbett, including the Fund, participate in a joint lending and borrowing program (the “Interfund Lending Program”). The SEC exemptive order allows the funds that participate in the Interfund Lending Program to borrow money from and lend money to each other for temporary or emergency purposes subject to the limitations and conditions.
For the fiscal year ended December 31, 2022 the Fund participated as a lender in the Interfund Lending Program. For the period in which the loan was outstanding, the average amount loaned, interest rate and interest income were as follows:
Average
Amount Loaned | Average
Interest Rate | Interest
Income* |
| $5,432,101 | 0.97% | $144 |
| * | Statement of Operations location: Interest earned from Interfund Lending. |
| 12. | CUSTODIAN AND ACCOUNTING AGENT |
SSB is the Company’s custodian and accounting agent. SSB performs custodial, accounting and recordkeeping functions relating to portfolio transactions and calculating the Fund’s NAV.
| 13. | SECURITIES LENDING AGREEMENT |
The Fund has established a securities lending agreement with Citibank, N.A. for the lending of securities to qualified brokers in exchange for securities or cash collateral equal to at least the market value of securities loaned, plus interest, if applicable. Cash collateral is invested in an approved money market fund. In accordance with the Fund’s securities lending agreement, the market value of securities on loan is determined each day at the close of business and any additional collateral required to cover the value of securities on loan is delivered to the Fund on the next business day. As with other extensions of credit, the Fund may experience a delay in the recovery of its securities or incur a loss should the borrower of the securities breach its agreement with the Fund or the borrower becomes insolvent at a time when the collateral is insufficient to cover the cost of repurchasing securities on loan. Any income earned from securities lending is included in Securities lending net income on the Fund’s Statement of Operations.
The initial collateral received by the Fund is required to have a value equal to at least 100% of the market value of the securities loaned. The collateral must be marked-to-market daily to cover increases in the market value of the securities loaned (or potentially a decline in the value of the collateral). In general, the risk of borrower default will be borne by Citibank, N.A.; the Fund will bear the risk of loss with respect to the investment of the cash collateral. The advantage of such loans is that the Fund continues to receive income on loaned securities while receiving a portion of any securities lending fees and earning returns on the cash amounts which may be reinvested for the purchase of investments in securities.
63
Notes to Financial Statements (continued)
As of December 31, 2022, the market value of securities loaned and collateral received for the Fund were as follows:
Market Value
of Securities
Loaned | Collateral
Received(1) |
| $1,111,322 | $1,172,776 |
| (1) | Statement of Assets and Liabilities location: Payable for collateral due to broker for securities lending. |
The Fund is subject to the general risks and considerations associated with investing in debt securities and to the changing prospects of individual companies and/or sectors in which the Fund invests. The value of an investment will change as interest rates fluctuate and in response to market movements. When interest rates rise, the prices of debt securities are likely to decline; when rates fall, such prices tend to rise. Longer-term debt securities are usually more sensitive to interest rate changes. There is also the risk that an issuer of a debt security will fail to make timely payments of principal or interest to the Fund, a risk that is greater with high-yield securities (sometimes called “lower-rated bonds” or “junk bonds”) in which the Fund may substantially invest. Some issuers, particularly of high-yield securities, may default as to principal and/or interest payments after the Fund purchases its securities. A default, or concerns in the market about an increase in risk of default, may result in losses to the Fund. High-yield securities are subject to greater price fluctuations, as well as additional risks. The market for below investment grade securities may be less liquid, which may make such securities more difficult to sell at an acceptable price, especially during periods of financial distress, increased market volatility, or significant market decline.
Certain instruments in which the Fund may invest may rely in some fashion upon LIBOR. On March 5, 2021 the United Kingdom Financial Conduct Authority (FCA) and LIBOR’s administrator, ICE Benchmark Administration (IBA), announced that most LIBOR settings will no longer be published after the end of 2021 and a majority of U.S. dollar LIBOR setting will no longer be published after June 30, 2023. Abandonment of or modification to LIBOR could have adverse impacts on newly issued financial instruments and existing financial instruments which reference LIBOR and lead to significant short-term and long-term uncertainty and market instability.
The Fund is subject to the risk of investing in securities issued or guaranteed by the U.S. Government or its agencies and instrumentalities (such as the Government National Mortgage Association (“Ginnie Mae”), the Federal National Mortgage Association (“Fannie Mae”), or the Federal Home Loan Mortgage Corporation (“Freddie Mac”)). Unlike Ginnie Mae securities, securities issued or guaranteed by U.S. Government-related organizations such as Fannie Mae and Freddie Mac are not backed by the full faith and credit of the U.S. Government and no assurance can be given that the U.S. Government would provide financial support to its agencies and instrumentalities if not required to do so by law. Consequently, the Fund may be required to look principally to the agency issuing or guaranteeing the obligation.
The asset backed securities and mortgage-related securities in which the Fund may invest may be particularly sensitive to changes in prevailing interest rates and economic conditions, including delinquencies and/or defaults. These changes can affect the value, income and/or liquidity of such positions. When interest rates are declining, the value of these securities with prepayment features may not increase as much as other fixed income securities. Early principal repayment may deprive the
64
Notes to Financial Statements (continued)
Fund of income payments above current market rates. Alternatively, rising interest rates may cause prepayments to occur at a slower-than-expected rate, extending the duration of a security and typically reducing its value. The payment rate will thus affect the price and volatility of a mortgage-related security. In addition, the Fund may invest in non-agency asset backed and mortgage-related securities, which are issued by private institutions, not by government sponsored enterprises.
The Fund may invest up to 20% of its net assets in equity securities, the value of which fluctuates in response to movements in the equity securities market in general, changing prospects of individual companies in which the Fund invests, or an individual company’s financial condition.
The Fund may invest in convertible securities, which have both equity and fixed income risk characteristics, including market, credit, liquidity, and interest rate risks. Generally, convertible securities offer lower interest or dividend yields than non-convertible securities of similar quality, and less potential for gains or capital appreciation in a rising equity securities market than equity securities. They tend to be more volatile than other fixed income securities, and the market for convertible securities may be less liquid than the markets for stocks or bonds. A significant portion of convertible securities have below investment grade credit ratings and are subject to increased credit and liquidity risks.
Due to the Fund’s investment exposure to foreign companies and American Depositary Receipts, the Fund may experience increased market, industry and sector, liquidity, currency, political, information and other risks. The securities of foreign companies also may be subject to inadequate exchange control regulations, the imposition of economic sanctions or other government restrictions, higher transaction and other costs, and delays in settlement to the extent they are traded on non-U.S. exchanges or markets.
The Fund is subject to the risks associated with derivatives, which may be different from and greater than the risks associated with directly investing in securities. Derivatives may be subject to risks such as liquidity risk, leveraging risk, interest rate risk, market risk, and credit risk. Illiquid securities may lower the Fund’s returns since the Fund may be unable to sell these securities at their desired time or price. Derivatives also may involve the risk of mispricing or improper valuation and the risk that changes in the value of the derivative may not correlate perfectly with the value of the underlying asset, rate or index. Whether the Fund’s use of derivatives is successful will depend on, among other things, the Fund’s ability to correctly forecast market movements and other factors. If the Fund incorrectly forecasts these and other factors, the Fund’s performance could suffer. The Fund’s use of derivatives could result in a loss exceeding the amount of the Fund’s investment in these instruments.
The Fund may invest up to 15% of its net assets in floating rate or adjustable rate senior loans, including bridge loans, novations, assignments, and participations, which are subject to increased credit and liquidity risks. Senior loans are business loans made to borrowers that may be U.S. or foreign corporations, partnerships or other business entities. The senior loans in which the Fund invests may consist primarily of senior loans that are rated below investment grade or, if unrated, deemed by Lord Abbett to be equivalent to below investment grade securities. Below investment grade senior loans, as in the case of high-yield debt securities, or junk bonds, are usually more credit sensitive than interest rate sensitive, although the value of these instruments may be impacted by broader interest rate swings in the overall fixed income market. Below investment grade senior loans may be affected by interest rate swings in the overall fixed income market. In addition, senior loans may be subject to structural subordination.
65
Notes to Financial Statements (concluded)
Geopolitical and other events (e.g., wars, terrorism, natural disasters, epidemics or pandemics, such as the COVID-19 outbreak which began in late 2019) may disrupt securities markets and adversely affect global economies and markets, thereby decreasing the value of the Fund’s investments. Market disruptions can also prevent the Fund from implementing its investment strategies and achieving its investment objective.
The transmission of COVID-19 and efforts to contain its spread have resulted in, among other things, border closings and other significant travel restrictions and disruptions, significant disruptions to business operations, supply chains and customer activity, lower consumer demand for goods and services, event cancellations and restrictions, service cancellations, reductions and other changes, significant challenges in healthcare service preparation and delivery, and prolonged quarantines, as well as general concern and uncertainty. The impact of the COVID-19 outbreak has, and could again, negatively affect the global economy, the economies of individual countries, and the financial performance of individual issuers, sectors, industries, asset classes, and markets in significant and unforeseen ways.
The COVID-19 pandemic and its effects may last for an extended period of time. Although the long-term economic fallout of COVID-19 is difficult to predict, it has contributed to, and is likely to continue to contribute to, market volatility, inflation, and systemic economic weakness. The foregoing could disrupt the operations of the Fund and its service providers, adversely affect the value and liquidity of the Fund’s investments, and negatively impact the Fund’s performance and your investment in the Fund.
These factors, and others, can affect the Fund’s performance.
| 15. | SUMMARY OF CAPITAL TRANSACTIONS |
Transactions in shares of capital stock were as follows:
| | | Year Ended
December 31, 2022 | | | Year Ended
December 31, 2021 | |
| Shares sold | | | 6,729,269 | | | | 15,670,960 | |
| Reinvestment of distributions | | | 5,219,695 | | | | 5,017,682 | |
| Shares reacquired | | | (13,912,794 | ) | | | (6,664,914 | ) |
| Increase (decrease) | | | (1,963,830 | ) | | | 14,023,728 | |
66
Report of Independent Registered Public Accounting Firm
To the shareholders and the Board of Directors of Lord Abbett Series Fund, Inc.
Opinion on the Financial Statements and Financial Highlights
We have audited the accompanying statement of assets and liabilities, including the schedule of investments, of Bond-Debenture Portfolio, one of the funds constituting Lord Abbett Series Fund, Inc. (the “Fund”), as of December 31, 2022, the related statement of operations for the year then ended, the statements of changes in net assets for each of the two years in the period then ended, the financial highlights for each of the five years in the period then ended, and the related notes. In our opinion, the financial statements and financial highlights present fairly, in all material respects, the financial position of Bond-Debenture Portfolio of the Fund as of December 31, 2022, and the results of its operations for the year then ended, the changes in its net assets for each of the two years in the period then ended, and the financial highlights for each of the five years in the period then ended in conformity with accounting principles generally accepted in the United States of America.
Basis for Opinion
These financial statements and financial highlights are the responsibility of the Fund’s management. Our responsibility is to express an opinion on the Fund’s financial statements and financial highlights based on our audits. We are a public accounting firm registered with the Public Company Accounting Oversight Board (United States) (PCAOB) and are required to be independent with respect to the Fund in accordance with the U.S. federal securities laws and the applicable rules and regulations of the Securities and Exchange Commission and the PCAOB.
We conducted our audits in accordance with the standards of the PCAOB. Those standards require that we plan and perform the audit to obtain reasonable assurance about whether the financial statements and financial highlights are free of material misstatement, whether due to error or fraud. The Fund is not required to have, nor were we engaged to perform, an audit of its internal control over financial reporting. As part of our audits we are required to obtain an understanding of internal control over financial reporting but not for the purpose of expressing an opinion on the effectiveness of the Fund’s internal control over financial reporting. Accordingly, we express no such opinion.
Our audits included performing procedures to assess the risks of material misstatement of the financial statements and financial highlights, whether due to error or fraud, and performing procedures that respond to those risks. Such procedures included examining, on a test basis, evidence regarding the amounts and disclosures in the financial statements and financial highlights. Our audits also included evaluating the accounting principles used and significant estimates made by management, as well as evaluating the overall presentation of the financial statements and financial highlights. Our procedures included confirmation of securities owned as of December 31, 2022, by correspondence with the custodian, brokers and selling or agent banks; when replies were not received from brokers and selling or agent banks, we performed other auditing procedures. We believe that our audits provide a reasonable basis for our opinion.
DELOITTE & TOUCHE LLP
New York, New York
February 14, 2023
We have served as the auditor of one or more Lord Abbett Family of Funds’ investment companies since 1932.
67
Basic Information About Management
The Board is responsible for the management of the business and affairs of the Fund in accordance with the laws of the state of organization. The Board elects officers who are responsible for the day-to-day operations of the Fund and who execute policies authorized by the Board. The Board also approves an investment adviser to the Fund and continues to monitor the cost and quality of the services the investment adviser provides, and annually considers whether to renew the contract with the investment adviser. Generally, each Board member holds office until his/her successor is elected and qualified or until his/her earlier resignation or removal, as provided in the Fund’s organizational documents.
Lord, Abbett & Co. LLC (“Lord Abbett”), a Delaware limited liability company, is the Fund’s investment adviser. Designated Lord Abbett personnel are responsible for the day-to-day management of the Fund.
Independent Board Members
The following Independent Board Members also are board members of each of the 15 investment companies in the Lord Abbett Family of Funds, which consist of 63 investment portfolios.
Name, Address and
Year of Birth | | Current Position and
Length of Service
with the Fund | | Principal Occupation and Other Directorships
During the Past Five Years |
Evelyn E. Guernsey
Lord, Abbett & Co. LLC
c/o Legal Dept.
90 Hudson Street
Jersey City, NJ 07302
(1955) | | Board member since 2011;
Vice Chair since 2023 | | Principal Occupation: None. Other Directorships: None. |
| | | | | |
Julie A. Hill
Lord, Abbett & Co. LLC
c/o Legal Dept.
90 Hudson Street
Jersey City, NJ 07302
(1946) | | Board member since 2004 | | Principal Occupation: Owner and CEO of The Hill Company, a business consulting firm (since 1998). Other Directorships: Previously served as director of Anthem, Inc., a health benefits company (1994–2021). |
| | | | | |
Kathleen M. Lutito
Lord, Abbett & Co. LLC
c/o Legal Dept.
90 Hudson Street
Jersey City, NJ 07302
(1963) | | Board member since 2017 | | Principal Occupation: President and Chief Investment Officer of CenturyLink Investment Management Company (since 2006). Other Directorships: None. |
| | | | | |
James M. McTaggart
Lord, Abbett & Co. LLC
c/o Legal Dept.
90 Hudson Street
Jersey City, NJ 07302
(1947) | | Board member since 2012 | | Principal Occupation: Owner of McTaggart LLC (since 2011). Other Directorships: None. |
| | | | | |
Charles O. Prince
Lord, Abbett & Co. LLC
c/o Legal Dept.
90 Hudson Street
Jersey City, NJ 07302
(1950) | | Board member since 2019 | | Principal Occupation: None. Formerly Chair and Chief Executive Officer, Citigroup, Inc. (Retired 2007). Other Directorships: Previously served as director of Johnson & Johnson (2005–2022). Previously served as director of Xerox Corporation (2007–2018). |
68
Basic Information About Management (continued)
Name, Address and
Year of Birth | | Current Position and
Length of Service
with the Fund | | Principal Occupation and Other Directorships
During the Past Five Years |
Karla M. Rabusch
Lord, Abbett & Co. LLC
c/o Legal Dept.
90 Hudson Street
Jersey City, NJ 07302
(1959) | | Board member since 2017 | | Principal Occupation: President and Director of Wells Fargo Funds Management, LLC (2003–2017); President of Wells Fargo Funds (2003–2016). Other Directorships: None. |
| | | | | |
Lorin Patrick Taylor Radtke
Lord, Abbett & Co. LLC
c/o Legal Dept.
90 Hudson Street
Jersey City, NJ 07302
(1968) | | Board member since 2021 | | Principal Occupation: Partner and Co-Founder of M Seven 8 Partners LLC, a venture capital firm (since 2016). Formerly Partner, Goldman Sachs (1992–2016). Other Directorships: Currently serves as director of Assured Guaranty (2021–Present), Virtual Combine (2018–Present), and Mariposa Family Learning Center (2021–Present). Previously served as director of SummerMoon Coffee (2022). |
| | | | | |
Leah Song Richardson
Lord, Abbett & Co. LLC
c/o Legal Dept.
90 Hudson Street
Jersey City, NJ 07302
(1966) | | Board member since 2021 | | Principal Occupation: President of Colorado College (since 2021) and was formerly Dean at University of California, Irvine – School of Law (2017–2021) and formerly Professor of Law at University of California, Irvine (2014–2017). Other Directorships: None. |
| | | | | |
Mark A. Schmid
Lord, Abbett & Co. LLC
c/o Legal Dept.
90 Hudson Street
Jersey City, NJ 07302
(1959) | | Board member since 2016 | | Principal Occupation: Vice President and Chief Investment Officer of the University of Chicago (2009–2021). Other Directorships: None. |
| | | | | |
James L.L. Tullis
Lord, Abbett & Co. LLC
c/o Legal Dept.
90 Hudson Street
Jersey City, NJ 07302
(1947) | | Board member since 2006; Chair since 2017 | | Principal Occupation: Chair of Tullis Health Investors – FL LLC (since 2018); CEO of Tullis-Dickerson and Co. Inc., a venture capital management firm (1990–2016). Other Directorships: Currently serves as Chair of Crane Co. (since 2020, director since 1998), Director of Alphatec Spine (since 2018), and Director of Exagen Inc. (since 2019). Previously served as director of electroCore, Inc. (2018–2020). |
Interested Board Members
Mr. Sieg is affiliated with Lord Abbett and is an “interested person” of the Fund as defined in the Act. Mr. Sieg is a board member of each of the 15 investment companies in the Lord Abbett Family of Funds, which consist of 63 investment portfolios. Mr. Sieg is an officer of the Lord Abbett Family of Funds.
69
Basic Information About Management (continued)
Name, Address and
Year of Birth | | Current Position and
Length of Service
with the Fund | | Principal Occupation and Other Directorships
During the Past Five Years |
Douglas B. Sieg
Lord, Abbett & Co. LLC
90 Hudson Street
Jersey City, NJ 07302
(1969) | | Board member since 2016 | | Principal Occupation: Managing Partner of Lord Abbett (since 2018) and was formerly Head of Client Services, joined Lord Abbett in 1994. Other Directorships: None. |
Officers
None of the officers listed below have received compensation from the Fund. All of the officers of the Fund also may be officers of the other Lord Abbett Funds and maintain offices at 90 Hudson Street, Jersey City, NJ 07302. Unless otherwise indicated, the position(s) and title(s) listed under the “Principal Occupation During the Past Five Years” column indicate each officer’s position(s) and title(s) with Lord Abbett. Each officer serves for an indefinite term (i.e., until his or her death, resignation, retirement, or removal).
Name and
Year of Birth | | Current Position
with the Fund | | Length of Service
of Current
Position | | Principal Occupation
During the Past Five Years |
Douglas B. Sieg
(1969) | | President and Chief Executive Officer | | Elected as President and Chief Executive Officer in 2018 | | Managing Partner of Lord Abbett (since 2018) and was formerly Head of Client Services, joined Lord Abbett in 1994. |
| | | | | | | |
Jackson C. Chan
(1964) | | AML Compliance Officer | | Elected in 2018 | | Deputy Chief Compliance Officer and Director of Regulatory Affairs, joined Lord Abbett in 2014. |
| | | | | | | |
Michael J. Hebert
(1976) | | Chief Financial Officer and Treasurer | | Elected as Chief Financial Officer and Treasurer in 2021 | | Head of Global Fund Finance, joined Lord Abbett in 2021 and was formerly Vice President at Eaton Vance Management (EVM) (2014–2021) and Calvert Research & Management (CRM) (2016–2021), and Assistant Treasurer of registered investment companies managed, advised or administered by EVM and CRM during such years. |
| | | | | | | |
Jennifer C. Karam
(1970) | | Vice President and Assistant Secretary | | Elected in 2022 | | Partner and Senior Deputy General Counsel, joined Lord Abbett in 2012. |
| | | | | | | |
Joseph M. McGill
(1962) | | Chief Compliance Officer | | Elected in 2014 | | Partner and Chief Compliance Officer, joined Lord Abbett in 2014. |
70
Basic Information About Management (concluded)
Name and
Year of Birth | | Current Position
with the Fund | | Length of Service
of Current
Position | | Principal Occupation
During the Past Five Years |
Parker J. Milender
(1989) | | Vice President and Assistant Secretary | | Elected in 2023 | | Counsel, joined Lord Abbett in 2021 and was formerly an Associate at Milbank LLP (2017–2021). |
| | | | | | | |
Lawrence B. Stoller
(1963) | | Vice President, Secretary and Chief Legal Officer | | Elected as Vice President and Secretary in 2007 and Chief Legal Officer in 2019 | | Partner and General Counsel, joined Lord Abbett in 2007. |
| | | | | | | |
Matthew A. Press
(1987) | | Vice President and Assistant Secretary | | Elected in 2023 | | Counsel, joined Lord Abbett in 2022 and was formerly an Associate at Clifford Chance US LLP (2014–2022). |
| | | | | | | |
Victoria Zozulya
(1983) | | Vice President and Assistant Secretary | | Elected in 2022 | | Counsel, joined Lord Abbett in 2022 and was formerly Senior Director and Counsel at Equitable (2018–2022) and Assistant General Counsel at Neuberger Berman (2014–2018). |
| | | | | | | |
Nicholas D. Emguschowa
(1986) | | Data Protection Officer | | Elected in 2022 | | Assistant General Counsel, joined Lord Abbett in 2018 and was formerly Associate at Shearman & Sterling (2014–2018). |
Please call 888-522-2388 for a copy of the statement of additional information, which contains further information about the Fund’s Board members. It is available free upon request.
71
Householding
The Company has adopted a policy that allows it to send only one copy of the Fund’s prospectus, proxy material, annual report and semiannual report (or related notice of internet availability of annual report and semiannual report) to certain shareholders residing at the same “household.” This reduces Fund expenses, which benefits you and other shareholders. If you need additional copies or do not want your mailings to be “householded,” please call Lord Abbett at 888-522-2388 or send a written request with your name, the name of your fund or funds and your account number or numbers to Lord Abbett Family of Funds, P.O. Box 219336, Kansas City, MO 64121.
Proxy Voting Policies, Procedures and Records
A description of the policies and procedures that Lord Abbett uses to vote proxies related to the Fund’s portfolio securities, and information on how Lord Abbett voted the Fund’s proxies during the 12-month period ended June 30 are available without charge, upon request, (i) by calling 888-522-2388; (ii) on Lord Abbett’s website at www.lordabbett.com; and (iii) on the Securities and Exchange Commission’s (“SEC”) website at www.sec.gov.
Shareholder Reports and Quarterly Portfolio Disclosure
The Fund is required to file its complete schedule of portfolio holdings with the SEC for its first and third fiscal quarters as an attachment to Form N-PORT. Copies of the filings are available without charge, upon request on the SEC’s website at www.sec.gov and may be available by calling Lord Abbett at 888-522-2388.
Tax Information (unaudited) Of the distributions paid to the shareholders during the fiscal year ended December 31, 2022, $3,176,295 represent short-term capital gains. |
72


This report, when not used for the general information of shareholders of the Fund, is to be distributed only if preceded or accompanied by a current fund prospectus. Lord Abbett mutual fund shares are distributed by
LORD ABBETT DISTRIBUTOR LLC. | | Lord Abbett Series Fund, Inc. Bond-Debenture Portfolio | | LASFBD-2
(02/23) |

LORD ABBETT
ANNUAL REPORT
Lord Abbett
Series Fund—Dividend Growth Portfolio
For the fiscal year ended December 31, 2022
Table of Contents
Lord Abbett Series Fund — Dividend Growth Portfolio
Annual Report
For the fiscal year ended December 31, 2022
 From left to right: James L.L. Tullis, Independent Chair of the Lord Abbett Funds and Douglas B. Sieg, Director, President and Chief Executive Officer of the Lord Abbett Funds. | | Dear Shareholders: We are pleased to provide you with this overview of the performance of Lord Abbett Series Fund – Dividend Growth Portfolio for the fiscal year ended December 31, 2022. On this page and the following pages, we discuss the major factors that influenced fiscal year performance. For detailed and timely information about the Fund, please visit our website at www.lordabbett.com, where you can also access the quarterly commentaries that provide updates on the Fund’s performance and other portfolio related updates. Thank you for investing in Lord Abbett mutual funds. We value the trust that you place in us and look forward to serving your investment needs in the years to come. Best regards,  Douglas B. Sieg Director, President and Chief Executive Officer |
For the fiscal year ended December 31, 2022, the Fund returned –13.55%, reflecting performance at the net asset value (“NAV”) of Class VC shares with all distributions reinvested, compared to its benchmark, the S&P 500® Index*, which returned –18.11% over the same period.
U.S. markets faced many challenges throughout the twelve-month period ending December 31, 2022, including the spread of the Omicron variant of COVID-19, supply chain dislocations, labor shortages, inflationary pressures, tighter fiscal and monetary policy, and Russia’s invasion of Ukraine. The Dow Jones Industrial
Average and S&P 500® Index fell -6.86% and –18.11%, respectively, while the tech-heavy Nasdaq Composite suffered even greater losses, falling –32.54%. Value stocks1 significantly outperformed growth stocks2 (–7.98% vs –28.97%), while large cap stocks3 slightly edged out small cap stocks4 (–19.13% vs –20.44%).
To begin the twelve-month period, U.S. markets grappled with COVID-19 cases hitting the highest levels of the pandemic, rising above 580,000 new cases in the last week of December 2021, more than doubling the previous record high. The spike in cases occurred shortly after the
1
World Health Organization designated the newly discovered Omicron variant as a “variant of concern”, leading to one of the largest selloffs of U.S. risk assets since the start of the pandemic, amid fears that the world would succumb to a new wave of infections. However, negative sentiment quickly reversed as cases proved to be generally less severe than prior strains. Market sentiment also increased after the Center for Disease Control shortened its suggested isolation policy for those infected from 10 days to five.
Inflationary concerns began to take focus towards the end of 2021 and became a dominant story throughout the period. Headline consumer price index (CPI) readings had hovered a little above 5% year-over-year for most of 2021, which led investors to question whether this period of rising prices would be more persistent than originally thought. This debate was intensified by the December 2021 headline CPI rising 7.0% year-over-year, the fastest pace since 1982. The sharp increase in prices was generally due to supply and demand imbalances across multiple industries, led initially by energy, food, and used cars. Inflation readings continued to climb throughout the first half of 2022, peaking at 9.1% year-over-year in June. Increases in energy costs were even more profound, rising by more than 30% year-over-year by the end of June. The energy sector, which had been subject to rising consumer demand as global economies reopened from lockdowns induced by COVID-19, faced added friction with
Russia’s invasion of Ukraine since Russia has been a large exporter of oil and certain minerals. Various sanctions imposed on Russia from Western nations led to a surge in commodity prices, with crude oil reaching over $100 per barrel for the first time since 2014.
The surge in prices forced the U.S. Federal Reserve (Fed) into a more aggressive approach to combating inflation. After remaining mostly consistent in its messaging that price pressures would likely be transitory, elevated and more persistent inflation pressures caused the Fed to move the target federal funds rate into more restrictive territory. This resulted in a 25 basis point (bps) hike in the federal funds rate at the March Federal Open Market Committee (FOMC) meeting, the first hike in more than three years. Six additional rate hikes of 50 bps, 75 bps, 75 bps, 75 bps, 75 bps, and 50 bps, respectively, followed in the succeeding months as inflation prints continued to come in hotter than expected, resulting in a federal funds rate of 4.5% by the end of the period, the highest level in 15 years. While the shift down in the pace of rate hikes supported the narrative that the Fed may begin to cut rates by the end of 2023, the Fed’s updated Summary of Economic Projections showed a more hawkish outlook, raising the outlook for the fed funds rate through 2025 from September’s forecasts – including a median forecast of 5.1% for 2023, 4.1% in 2024, and 3.1% in 2025. Fed Chair Powell also struck a hawkish tone in the press conference following the December FOMC
2
meeting, sticking to the higher-for-longer messaging. Bond yields shot up over the period in response to this aggressive policy, leading to a bearish curve flattening and ultimately a yield curve inversion, as shorter-term yields moved higher than longer-term yields.
Separately, global markets faced increased geopolitical tensions due to Russia’s invasion of Ukraine on February 23rd. Tensions remained elevated for the remainder of the twelve-month period, as Russia continued to weaponize energy flows, annexed four Ukrainian regions, and ratcheted up its nuclear warnings. In addition, the rhetoric between the U.S. and China over Taiwan further heated up after U.S. House of Representatives Speaker Nancy Pelosi visited Taiwan in August.
Key macroeconomic indicators mostly trended lower throughout the period, with the U.S. reporting negative gross domestic product of –1.6% in the first quarter of 2022 and –0.6% in the second quarter before growing 3.2% in the third quarter. Worries among investors that a recession was pending continued to grow, leading to a decline in the consumer confidence index to lower levels than during the height of the COVID-19 pandemic and the global financial crisis of 2008.
Despite rising recessionary signs, select bright spots in the U.S. economy supported the idea that a potential recession would be shallow. For example, one positive development was the peak inflation narrative, which included a 99-day stretch of declines in U.S. gasoline prices and
November CPI coming in better than expected on both the headline and core numbers. In addition, apartment rents fell for the first time in nearly two years in July, and lumber prices declined by more than 70% from their March peak late in the third quarter, falling back to pre-COVID levels. The third quarter of the 2022 earnings season also generated a lot of “better-than-feared” takeaways, including a common theme of relatively stable demand and pricing power protecting margins. While third quarter earnings were slightly below expectations, comments from management generally provided evidence of healthy consumer spending. Capital return and capital expenditures were also mentioned as relative bright spots as companies flagged easing labor shortages and supply chain constraints. The U.S. labor market also remained strong over the period, with the national unemployment rate at 3.5% as of the end of December.
In terms of the Fund’s key performance drivers, over the twelve-month period ending December 31, 2022, security selection within the Industrials sector contributed to the Fund’s relative performance. Within the Industrials sector, Northrop Grumman Corp., a defense contractor, contributed most to relative performance. The ongoing tensions between Russia and Ukraine built up momentum in the defense sector and Northrop Grumman’s largest customer is the U.S. government. We expect Northrop Grumman to be one of the fastest growing
3
U.S. defense contractors based on its large and ramping growth platforms that serve critical U.S. needs including Ground Based Strategic Deterrent (GBSD) and satellites. The Fund’s position in AbbVie, Inc., a research-based biopharmaceutical company, also contributed to relative performance. Shares rallied in the first half of the year, up almost 50% at the peak in early April. The stock price move was further supported by the company’s strong fourth quarter earnings and fiscal year guidance, which came in above expectations. The Fund’s position in McDonald’s Corporation, a multinational fast-food chain, also contributed to relative performance. Shares rallied after the company reported strong third quarter earnings that demonstrated broad-based business momentum as global comparable sales increased nearly 10%. The company also increased the third quarter’s dividend by more than 10%.
Conversely, one of the largest detractors from relative performance during the twelve-month period ending December 31, 2022, was NVIDIA Corp., an American multinational technology company. The company’s gaming segment was adversely impacted by material economic slowdowns in China and Europe, which led to a selloff in shares of NVIDIA. Chinese government restrictions were introduced in September, which limited the company’s ability to sell certain products into China and in turn compounded the magnitude of the sell off.
Within the Health Care sector, the Fund’s allocation to West Pharmaceutical, which manufactures and markets pharmaceuticals, biologics, vaccines and consumer healthcare products, was one of the largest detractors from relative performance. The company reported first quarter earnings that were modestly ahead of expectations, coupled with an earnings guidance increase. Despite the better-than-expected quarter, shares sold off as the company continued to face foreign exchange rate headwinds as the U.S. dollar strengthened and investors worried that a faster-than-expected fall-off in COVID-19 related order flow would result in underutilization of new capacity. The Fund’s position in Estée Lauder Companies, Inc., which engages in the manufacturing of skin care, makeup, fragrance, and hair care products, detracted from relative performance. Shares sold off following Russia’s invasion of Ukraine. After suspending The Estée Lauder Companies’ business investments and initiatives in Russia, the company also decided to suspend all commercial activity in Russia, including closing every store it owns and operates, as well as its brand sites and shipments to any of its retailers in Russia.
The Fund’s portfolio is actively managed and, therefore, its holdings and the weightings of a particular issuer or particular sector as a percentage of portfolio assets are subject to change. Sectors may include many industries.
4
* The S&P 500® Index is widely regarded as the standard for measuring large cap U.S. stock market performance and includes a representative sample of leading companies in leading industries.
1 As represented by the Russell 3000® Value Index as of 12/31/2022.
2 As represented by the Russell 3000® Growth Index as of 12/31/2022.
3 As represented by the Russell 1000® Index as of 12/31/2022.
4 As represented by the Russell 2000® Index as of 12/31/2022.
Unless otherwise specified, indexes reflect total return, with all dividends reinvested. Indexes are unmanaged, do not reflect the deduction of fees or expenses, and are not available for direct investment.
Important Performance and Other Information
Performance data quoted in the following pages reflect past performance and are no guarantee of future results. Current performance may be higher or lower than the performance quoted. The investment return and principal value of an investment in the Fund will fluctuate so that shares, on any given day or when redeemed, may be worth more or less than their original cost. You can obtain performance data current to the most recent month end by calling Lord Abbett at 888-522-2388 or referring to www.lordabbett.com.
During certain periods shown, expense waivers and reimbursements were in place. Without such expense waivers and reimbursements, the Fund’s returns would have been lower.
The annual commentary above discusses the views of the Fund’s management and various portfolio holdings of the Fund as of December 31, 2022. These views and portfolio holdings may have changed after this date. Information provided in the commentary is not a recommendation to buy or sell securities. Because the Fund’s portfolio is actively managed and may change significantly, the Fund may no longer own the securities described above or may have otherwise changed its position in the securities. For more recent information about the Fund’s portfolio holdings, please visit www.lordabbett.com.
A Note about Risk: See Notes to Financial Statements for a discussion of investment risks. For a more detailed discussion of the risks associated with the Fund, please see the Fund’s prospectus.
Mutual funds are not insured by the FDIC, are not deposits or other obligations of, or guaranteed by, banks, and are subject to investment risks including possible loss of principal amount invested.
The Fund serves as an underlying investment vehicle for variable annuity contracts and variable life insurance policies.
5
Investment Comparison
Below is a comparison of a $10,000 investment in Class VC shares with the same investment in the S&P 500® Index, assuming reinvestment of all dividends and distributions. The Fund’s shares are sold only to insurance company separate accounts that fund certain variable annuity and variable life contracts. The line graph comparison does not reflect the sales charges or other expenses of these contracts. If those sales charges and expenses were reflected, returns would be lower. The graph and performance table below do not reflect the deduction of taxes that a shareholder would pay on Fund distributions or the redemption of Fund shares. During certain periods, expenses of the Fund have been waived or reimbursed by Lord Abbett; without such waiver or reimbursement of expenses, the Fund’s returns would have been lower. Past performance is no guarantee of future results.

Average Annual Total Returns for the
Periods Ended December 31, 2022 |
| | | 1 Year | | 5 Years | | 10 Years | |
| Class VC | | -13.55% | | 8.60% | | 11.21% | |
| 1 | Performance for the unmanaged index does not reflect any fees or expenses. The performance of the index is not necessarily representative of the Fund’s performance. |
6
Expense Example
As a shareholder of the Fund, you incur ongoing costs, including management fees; expenses related to the Fund’s services arrangements with certain insurance companies; and other Fund expenses. This Example is intended to help you understand your ongoing costs (in dollars) of investing in the Fund and to compare these costs with the ongoing costs of investing in other mutual funds.
The Example is based on an investment of $1,000 invested at the beginning of the period and held for the entire period (July 1, 2022 through December 31, 2022).
The Example reflects only expenses that are deducted from the assets of the Fund. Fees and expenses, including sales charges applicable to the various insurance products that invest in the Fund, are not reflected in this Example. If such fees and expenses were reflected in the Example, the total expenses shown would be higher. Fees and expenses regarding such variable insurance products are separately described in the prospectus related to those products.
Actual Expenses
The first line of the table on the following page provides information about actual account values and actual expenses. You may use the information in this line, together with the amount you invested, to estimate the expenses that you paid over the period. Simply divide your account value by $1,000 (for example, an $8,600 account value divided by $1,000 = 8.6), then multiply the result by the number in the first line under the heading titled “Expenses Paid During Period 7/1/22 – 12/31/22” to estimate the expenses you paid on your account during this period.
Hypothetical Example for Comparison Purposes
The second line of the table on the following page provides information about hypothetical account values and hypothetical expenses based on the Fund’s actual expense ratio and an assumed rate of return of 5% per year before expenses, which is not the Fund’s actual return. The hypothetical account values and expenses may not be used to estimate the actual ending account balance or expenses you paid for the period. You may use this information to compare the ongoing costs of investing in the Fund and other funds. To do so, compare this 5% hypothetical example with the 5% hypothetical examples that appear in the shareholder reports of the other funds.
7
Please note that the expenses shown in the table are meant to highlight your ongoing costs only and do not reflect any transactional costs, such as sales charges (loads). Therefore, the second line of the table is useful in comparing ongoing costs only, and will not help you determine the relative total costs of owning different funds. In addition, if these transactional costs were included, your costs would have been higher.
| | | Beginning
Account
Value | | Ending
Account
Value | | Expenses
Paid During
Period† | |
| | | 7/1/22 | | 12/31/22 | | 7/1/22 -
12/31/22 | |
| Class VC | | | | | | | | | |
| Actual | | $ | 1,000.00 | | | $ | 1,058.20 | | | $ | 5.14 | |
| Hypothetical (5% Return Before Expenses) | | $ | 1,000.00 | | | $ | 1,020.21 | | | $ | 5.04 | |
| † | Net expenses are equal to the Fund’s annualized expense ratio of 0.99%, multiplied by the average account value over the period, multiplied by 184/365 (to reflect one-half year period). |
Portfolio Holdings Presented by Sector
December 31, 2022
| Sector* | %** | |
| Consumer Discretionary | 9.91 | % |
| Consumer Staples | 6.21 | % |
| Energy | 5.35 | % |
| Financials | 16.27 | % |
| Health Care | 14.95 | % |
| Industrials | 11.55 | % |
| Information Technology | 23.03 | % |
| Materials | 6.28 | % |
| Real Estate | 2.51 | % |
| Utilities | 3.59 | % |
| Repurchase Agreements | 0.35 | % |
| Total | 100.00 | % |
| * | | A sector may comprise several industries. |
| ** | | Represents percent of total investments, which excludes derivatives. |
8
Schedule of Investments
December 31, 2022
| Investments | | Shares | | | Fair
Value | |
| LONG-TERM INVESTMENTS 99.61% | | | | | |
| | | | | | | | | |
| COMMON STOCKS 99.61% | | | | | |
| | | | | | | | | |
| Aerospace & Defense 4.52% | | | | | |
| Northrop Grumman Corp. | | | 5,900 | | | $ | 3,219,099 | |
| Raytheon Technologies Corp. | | | 39,816 | | | | 4,018,231 | |
| Total | | | | | | | 7,237,330 | |
| | | | | | | | | |
| Banks 3.02% | | | | | | | | |
| Bank of America Corp. | | | 145,741 | | | | 4,826,942 | |
| | | | | | | | | |
| Beverages 2.60% | | | | | | | | |
| Coca-Cola Co. (The) | | | 65,468 | | | | 4,164,420 | |
| | | | | | | | | |
| Biotechnology 2.54% | | | | | | | | |
| AbbVie, Inc. | | | 25,199 | | | | 4,072,410 | |
| | | | | | | | | |
| Capital Markets 7.39% | | | | | | | | |
| Ameriprise Financial, Inc. | | | 13,300 | | | | 4,141,221 | |
| Morgan Stanley | | | 53,000 | | | | 4,506,060 | |
| S&P Global, Inc. | | | 9,500 | | | | 3,181,930 | |
| Total | | | | | | | 11,829,211 | |
| | | | | | | | | |
| Chemicals 2.18% | | | | | |
| Air Products & Chemicals, Inc. | | | 11,300 | | | | 3,483,338 | |
| | | | | | | | | |
| Construction Materials 2.00% | | | | | |
| Vulcan Materials Co. | | | 18,252 | | | | 3,196,108 | |
| | | | | | | | | |
| Containers & Packaging 1.20% | | | | | |
| Avery Dennison Corp. | | | 10,575 | | | | 1,914,075 | |
| | | | | | | | | |
| Electric: Utilities 3.16% | | | | | | | | |
| NextEra Energy, Inc. | | | 60,430 | | | | 5,051,948 | |
| | | | | | | | | |
| Equity Real Estate Investment Trusts 2.51% | | | | | |
| American Tower Corp. | | | 14,600 | | | | 3,093,156 | |
| Prologis, Inc. | | | 8,193 | | | | 923,597 | |
| Total | | | | | | | 4,016,753 | |
| | | | | | | | | |
| Food & Staples Retailing 3.04% | | | | | |
| Costco Wholesale Corp. | | | 3,320 | | | | 1,515,580 | |
| Walmart, Inc. | | | 23,580 | | | | 3,343,408 | |
| Total | | | | | | | 4,858,988 | |
| Investments | | Shares | | | Fair
Value | |
| Health Care Equipment & Supplies 1.90% | | | | | |
| Abbott Laboratories | | | 27,700 | | | $ | 3,041,183 | |
| | | | | | | | | |
| Health Care Providers & Services 4.70% | | | | | |
| Humana, Inc. | | | 3,490 | | | | 1,787,543 | |
| UnitedHealth Group, Inc. | | | 10,800 | | | | 5,725,944 | |
| Total | | | | | | | 7,513,487 | |
| | | | | | | | | |
| Hotels, Restaurants & Leisure 3.27% | | | | | |
| Churchill Downs, Inc. | | | 6,107 | | | | 1,291,203 | |
| McDonald’s Corp. | | | 7,674 | | | | 2,022,329 | |
| Starbucks Corp. | | | 19,345 | | | | 1,919,024 | |
| Total | | | | | | | 5,232,556 | |
| | | | | | | | | |
| Industrial Conglomerates 2.33% | | | | | |
| Honeywell International, Inc. | | | 17,400 | | | | 3,728,820 | |
| | | | | | | | | |
| Information Technology Services 5.72% | | | | | |
| Accenture plc Class A (Ireland)(a) | | | 6,400 | | | | 1,707,776 | |
| Jack Henry & Associates, Inc. | | | 11,800 | | | | 2,071,608 | |
| Mastercard, Inc. Class A | | | 15,430 | | | | 5,365,474 | |
| Total | | | | | | | 9,144,858 | |
| | | | | | | | | |
| Insurance 5.85% | | | | | |
| Allstate Corp. (The) | | | 23,589 | | | | 3,198,668 | |
| American Financial Group, Inc./OH | | | 6,200 | | | | 851,136 | |
| Arthur J Gallagher & Co. | | | 10,873 | | | | 2,049,995 | |
| Chubb Ltd. (Switzerland)(a) | | | 7,900 | | | | 1,742,740 | |
| RenaissanceRe Holdings Ltd. | | | 8,237 | | | | 1,517,503 | |
| Total | | | | | | | 9,360,042 | |
| | | | | | | | | |
| Life Sciences Tools & Services 2.70% | | | | | |
| Danaher Corp. | | | 11,400 | | | | 3,025,788 | |
| West Pharmaceutical Services, Inc. | | | 5,500 | | | | 1,294,425 | |
| Total | | | | | | | 4,320,213 | |
| | | | | | | | | |
| Machinery 2.15% | | | | | | | | |
| Parker-Hannifin Corp. | | | 11,798 | | | | 3,433,218 | |
| | | | | | | | | |
| Metals & Mining 0.91% | | | | | | | | |
| Reliance Steel & Aluminum Co. | | | 7,200 | | | | 1,457,568 | |
| | See Notes to Financial Statements. | 9 |
Schedule of Investments (continued)
December 31, 2022
| Investments | | Shares | | | Fair
Value | |
| Multi-Utilities 0.43% | | | | | |
| CMS Energy Corp. | | | 10,800 | | | $ | 683,964 | |
| | | | | | | | | |
| Oil, Gas & Consumable Fuels 5.34% | | | | | |
| Exxon Mobil Corp. | | | 57,693 | | | | 6,363,538 | |
| Marathon Petroleum Corp. | | | 18,800 | | | | 2,188,132 | |
| Total | | | | | | | 8,551,670 | |
| | | | | | | | | |
| Personal Products 0.57% | | | | | |
| Estee Lauder Cos., Inc. (The) Class A | | | 3,681 | | | | 913,293 | |
| | | | | | | | | |
| Pharmaceuticals 3.10% | | | | | |
| Eli Lilly & Co. | | | 9,094 | | | | 3,326,949 | |
| Zoetis, Inc. | | | 11,200 | | | | 1,641,360 | |
| Total | | | | | | | 4,968,309 | |
| | | | | | | | | |
| Professional Services 0.84% | | | | | |
| Booz Allen Hamilton Holding Corp. | | | 12,820 | | | | 1,339,947 | |
| | | | | | | | | |
| Road & Rail 1.71% | | | | | | | | |
| Union Pacific Corp. | | | 13,200 | | | | 2,733,324 | |
| | | | | | | | | |
| Semiconductors & Semiconductor Equipment 4.85% | | | | | |
| Analog Devices, Inc. | | | 15,400 | | | | 2,526,062 | |
| KLA Corp. | | | 4,600 | | | | 1,734,338 | |
| NVIDIA Corp. | | | 6,900 | | | | 1,008,366 | |
| Texas Instruments, Inc. | | | 15,100 | | | | 2,494,822 | |
| Total | | | | | | | 7,763,588 | |
| | | | | | | | | |
| Software 9.71% | | | | | | | | |
| Intuit, Inc. | | | 5,000 | | | | 1,946,100 | |
| Microsoft Corp. | | | 44,300 | | | | 10,624,026 | |
| Roper Technologies, Inc. | | | 6,858 | | | | 2,963,273 | |
| Total | | | | | | | 15,533,399 | |
| | | | | | | | | |
| Specialty Retail 5.56% | | | | | | | | |
| Home Depot, Inc. (The) | | | 8,400 | | | | 2,653,224 | |
| Lowe’s Cos., Inc. | | | 16,825 | | | | 3,352,213 | |
| TJX Cos., Inc. (The) | | | 36,300 | | | | 2,889,480 | |
| Total | | | | | | | 8,894,917 | |
| Investments | | Shares | | | Fair
Value | |
| Technology Hardware, Storage & Peripherals 2.74% | | | | | |
| Apple, Inc. | | | 33,741 | | | $ | 4,383,968 | |
| | | | | | | | | |
| Textiles, Apparel & Luxury Goods 1.07% | | | | | |
| NIKE, Inc. Class B | | | 14,700 | | | | 1,720,047 | |
Total Common Stocks
(cost $147,801,257) | | | | | | | 159,369,894 | |
| | | | | | | | | |
| | | Principal
Amount | | | | | |
| SHORT-TERM INVESTMENTS 0.35% | | | | | |
| | | | | | | | | |
| Repurchase Agreements 0.35% | | | | | |
Repurchase Agreement dated 12/30/2022, 2.05% due 1/3/2023 with Fixed Income Clearing Corp. collateralized by $569,400 of U.S. Treasury Note at 4.275% due 4/30/2024; value: $572,165; proceeds: $560,983
(cost $560,855) | | $ | 560,855 | | | | 560,855 | |
Total Investments in Securities 99.96%
(cost $148,362,112) | | | | | | | 159,930,749 | |
| Other Assets and Liabilities – Net(b) 0.04% | | | | | | | 57,424 | |
| Net Assets 100.00% | | | | | | $ | 159,988,173 | |
| (a) | | Foreign security traded in U.S. dollars. |
| (b) | | Other Assets and Liabilities include net unrealized appreciation/depreciation on futures contracts as follows: |
| 10 | See Notes to Financial Statements. | |
Schedule of Investments (concluded)
December 31, 2022
Futures Contracts at December 31, 2022:
| Type | | Expiration | | | Contracts | | | Position | | | Notional
Amount | | | Notional
Value | | | Unrealized
Depreciation | |
| E-Mini S&P 500 Index | | | March 2023 | | | | 4 | | | | Long | | | $ | 793,805 | | | $ | 772,200 | | | | $(21,605 | ) |
The following is a summary of the inputs used as of December 31, 2022 in valuing the Fund’s investments carried at fair value(1):
| Investment Type(2) | | Level 1 | | | Level 2 | | | Level 3 | | | Total | |
| Long-Term Investments | | | | | | | | | | | | | | | | |
| Common Stocks | | $ | 159,369,894 | | | $ | – | | | $ | – | | | $ | 159,369,894 | |
| Short-Term Investments | | | | | | | | | | | | | | | | |
| Repurchase Agreements | | | – | | | | 560,855 | | | | – | | | | 560,855 | |
| Total | | $ | 159,369,894 | | | $ | 560,855 | | | $ | – | | | $ | 159,930,749 | |
| | | | | | | | | | | | | | | | | |
| Other Financial Instruments | | | | | | | | | | | | | | | | |
| Futures Contracts | | | | | | | | | | | | | | | | |
| Assets | | $ | – | | | $ | – | | | $ | – | | | $ | – | |
| Liabilities | | | (21,605 | ) | | | – | | | | – | | | | (21,605 | ) |
| Total | | $ | (21,605 | ) | | $ | – | | | $ | – | | | $ | (21,605 | ) |
| (1) | Refer to Note 2(i) for a description of fair value measurements and the three-tier hierarchy of inputs. |
| (2) | See Schedule of Investments for fair values in each industry and identification of foreign issuers and/or geography. When applicable, each Level 3 security is identified on the Schedule of Investments along with the valuation technique utilized. |
A reconciliation of Level 3 investments is presented when the Fund has a material amount of Level 3 investments at the beginning or end of the year in relation to the Fund’s net assets.
| | See Notes to Financial Statements. | 11 |
Statement of Assets and Liabilities
December 31, 2022
| ASSETS: | | | |
| Investments in securities, at fair value (cost $148,362,112) | | $ | 159,930,749 | |
| Deposits with brokers for futures collateral | | | 42,400 | |
| Receivables: | | | | |
| Investment securities sold | | | 1,000,384 | |
| Interest and dividends | | | 127,676 | |
| Variation margin for futures contracts | | | 48,152 | |
| Capital shares sold | | | 5,185 | |
| From advisor (See Note 3) | | | 831 | |
| Prepaid expenses | | | 379 | |
| Total assets | | | 161,155,756 | |
| LIABILITIES: | | | | |
| Payables: | | | | |
| Capital shares reacquired | | | 612,633 | |
| Transfer agent fees | | | 340,253 | |
| Management fee | | | 75,200 | |
| To bank | | | 50,250 | |
| Directors’ fees | | | 23,751 | |
| Fund administration | | | 5,469 | |
| Accrued expenses | | | 60,027 | |
| Total liabilities | | | 1,167,583 | |
| NET ASSETS | | $ | 159,988,173 | |
| COMPOSITION OF NET ASSETS: | | | | |
| Paid-in capital | | $ | 147,701,786 | |
| Total distributable earnings (loss) | | | 12,286,387 | |
| Net Assets | | $ | 159,988,173 | |
| Outstanding shares (50 million shares of common stock authorized, $.001 par value) | | | 10,768,445 | |
Net asset value, offering and redemption price per share
(Net assets divided by outstanding shares) | | | $14.86 | |
| 12 | See Notes to Financial Statements. | |
Statement of Operations
For the Year Ended December 31, 2022
| Investment income: | | | |
| Dividends (net of foreign withholding taxes of $5,193) | | $ | 3,087,823 | |
| Interest and other | | | 18,661 | |
| Total investment income | | | 3,106,484 | |
| Expenses: | | | | |
| Management fee | | | 925,301 | |
| Non 12b-1 service fees | | | 420,394 | |
| Shareholder servicing | | | 178,691 | |
| Fund administration | | | 67,295 | |
| Professional | | | 50,487 | |
| Reports to shareholders | | | 16,140 | |
| Directors’ fees | | | 3,044 | |
| Custody | | | 2,968 | |
| Other | | | 27,801 | |
| Gross expenses | | | 1,692,121 | |
| Expense reductions (See Note 9) | | | (2,082 | ) |
| Fees waived and expenses reimbursed (See Note 3) | | | (24,496 | ) |
| Net expenses | | | 1,665,543 | |
| Net investment income | | | 1,440,941 | |
| Net realized and unrealized gain (loss): | | | | |
| Net realized gain (loss) on investments | | | 21,290,614 | |
| Net realized gain (loss) on futures contracts | | | (171,361 | ) |
| Net realized gain (loss) on foreign currency related transactions | | | 1,582 | |
| Net change in unrealized appreciation/depreciation on investments | | | (52,577,563 | ) |
| Net change in unrealized appreciation/depreciation on futures contracts | | | (66,366 | ) |
| Net change in unrealized appreciation/depreciation on translation of assets and liabilities denominated in foreign currencies | | | 247 | |
| Net realized and unrealized gain (loss) | | | (31,522,847 | ) |
| Net Decrease in Net Assets Resulting From Operations | | $ | (30,081,906 | ) |
| | See Notes to Financial Statements. | 13 |
Statements of Changes in Net Assets
| INCREASE (DECREASE) IN NET ASSETS | | For the Year Ended
December 31, 2022 | | | For the Year Ended
December 31, 2021 | |
| Operations: | | | | | | | | |
| Net investment income | | $ | 1,440,941 | | | $ | 1,499,931 | |
| Net realized gain (loss) on investments, futures contracts and foreign currency related transactions | | | 21,120,835 | | | | 22,091,725 | |
| Net change in unrealized appreciation/depreciation on investments, futures contracts and translation of assets and liabilities denominated in foreign currencies | | | (52,643,682 | ) | | | 22,376,094 | |
| Net increase (decrease) in net assets resulting from operations | | | (30,081,906 | ) | | | 45,967,750 | |
| Distributions to shareholders: | | | (25,267,673 | ) | | | (21,741,336 | ) |
| Capital share transactions (See Note 15): | | | | | | | | |
| Net proceeds from sales of shares | | | 31,822,978 | | | | 10,494,440 | |
| Reinvestment of distributions | | | 25,267,673 | | | | 21,741,336 | |
| Cost of shares reacquired | | | (61,903,160 | ) | | | (25,109,418 | ) |
| Net increase (decrease) in net assets resulting from capital share transactions | | | (4,812,509 | ) | | | 7,126,358 | |
| Net increase (decrease) in net assets | | | (60,162,088 | ) | | | 31,352,772 | |
| NET ASSETS: | | | | | | | | |
| Beginning of year | | $ | 220,150,261 | | | $ | 188,797,489 | |
| End of year | | $ | 159,988,173 | | | $ | 220,150,261 | |
| 14 | See Notes to Financial Statements. | |
This page is intentionally left blank.
15
Financial Highlights
| | | | | | Per Share Operating Performance: |
| | | | | | Investment Operations: | | Distributions to
shareholders from: |
| | | | | | | | |
| | | Net asset
value,
beginning
of period | | Net
invest-
ment
income(a) | | Net
realized
and
unrealized
gain (loss) | | Total
from
invest-
ment
opera-
tions | | Net
investment
income | Net
realized
gain | | Total
distri-
butions |
| 12/31/2022 | | $ | 20.27 | | | $ | 0.15 | | | $ | (2.91 | ) | | $ | (2.76 | ) | | $ | (0.15 | ) | | $ | (2.50 | ) | | $ | (2.65 | ) |
| 12/31/2021 | | | 17.93 | | | | 0.15 | | | | 4.38 | | | | 4.53 | | | | (0.15 | ) | | | (2.04 | ) | | | (2.19 | ) |
| 12/31/2020 | | | 15.96 | | | | 0.16 | | | | 2.28 | | | | 2.44 | | | | (0.16 | ) | | | (0.31 | ) | | | (0.47 | ) |
| 12/31/2019 | | | 13.48 | | | | 0.24 | | | | 3.31 | | | | 3.55 | | | | (0.25 | ) | | | (0.82 | ) | | | (1.07 | ) |
| 12/31/2018 | | | 16.02 | | | | 0.27 | | | | (1.03 | ) | | | (0.76 | ) | | | (0.30 | ) | | | (1.48 | ) | | | (1.78 | ) |
| (a) | Calculated using average shares outstanding during the period. |
| (b) | Total return does not consider the effects of sales loads and assumes the reinvestment of all distributions. |
| 16 | See Notes to Financial Statements. | |
| | | | | | | Ratios to Average Net Assets: | | Supplemental Data: |
| | | | | | | | | |
| | | | | | | | | |
Net
asset
value,
end of
period | | Total
return(b)
(%) | | Total
expenses
after
waivers
and/or reim-
bursements
(%) | | Total
expenses
(%) | | Net
investment
income
(%) | | Net
assets,
end of
period
(000) | | Portfolio
turnover
rate
(%) |
| $ | 14.86 | | | | (13.55 | ) | | | 0.99 | | | | 1.01 | | | | 0.86 | | | $ | 159,988 | | | | 56 | |
| | 20.27 | | | | 25.62 | | | | 0.99 | | | | 1.01 | | | | 0.75 | | | | 220,150 | | | | 44 | |
| | 17.93 | | | | 15.42 | | | | 0.99 | | | | 1.02 | | | | 1.01 | | | | 188,797 | | | | 64 | |
| | 15.96 | | | | 26.45 | | | | 0.96 | | | | 1.10 | | | | 1.58 | | | | 182,728 | | | | 61 | |
| | 13.48 | | | | (4.67 | ) | | | 0.88 | | | | 1.22 | | | | 1.68 | | | | 140,639 | | | | 58 | |
| | See Notes to Financial Statements. | 17 |
Notes to Financial Statements
Lord Abbett Series Fund, Inc. (the “Company”) is registered under the Investment Company Act of 1940, as amended (the “Act”), as a diversified, open-end management investment company and was incorporated under Maryland law in 1989. The Company consists of nine separate portfolios as of December 31, 2022. This report covers Dividend Growth Portfolio (the “Fund”).
The Fund’s investment objective is to seek current income and capital appreciation. The Fund has Variable Contract class shares (“Class VC Shares”), which are currently issued and redeemed only in connection with investments in, and payments under, variable annuity contracts and variable life insurance policies issued by life insurance and insurance-related companies.
The preparation of the financial statements in conformity with accounting principles generally accepted in the United States of America (“U.S. GAAP”) requires management to make certain estimates and assumptions that affect the reported amounts of assets and liabilities and disclosure of contingent assets and liabilities at the date of the financial statements and the reported amounts of increases and decreases in net assets from operations during the reporting period. Actual results could differ from those estimates. The Fund is considered an investment company under U.S. GAAP and follows the accounting and reporting guidance applicable to investment companies.
| 2. | SIGNIFICANT ACCOUNTING POLICIES |
| (a) | Investment Valuation–Under procedures approved by the Fund’s Board of Directors (the “Board”), the Board has designated the determination of fair value of the Fund’s portfolio investments to Lord, Abbett & Co. LLC (“Lord Abbett”), as its valuation designee. Accordingly, Lord Abbett is responsible for, among other things, assessing and managing valuation risks, establishing, applying and testing fair value methodologies, and evaluating pricing services. Lord Abbett has formed a Pricing Committee that performs these responsibilities on behalf of Lord Abbett, administers the pricing and valuation of portfolio investments and ensures that prices utilized reasonably reflect fair value. Among other things, these procedures allow Lord Abbett, subject to Board oversight, to utilize independent pricing services, quotations from securities and financial instrument dealers and other market sources to determine fair value. Securities actively traded on any recognized U.S. or non-U.S. exchange or on The NASDAQ Stock Market LLC are valued at the last sale price or official closing price on the exchange or system on which they are principally traded. Events occurring after the close of trading on non-U.S. exchanges may result in adjustments to the valuation of foreign securities to reflect their fair value as of the close of regular trading on the New York Stock Exchange. When valuing foreign equity securities that meet certain criteria, the Board has approved the use of an independent fair valuation service that values such securities to reflect market trading that occurs after the close of the applicable foreign markets of comparable securities or other instruments that correlate to the fair-valued securities. Unlisted equity securities are valued at the last quoted sale price or, if no sale price is available, at the mean between the most recently quoted bid and ask prices. Exchange traded options and futures contracts are valued at the last quoted sale price in the market where they are principally traded. If no sale has occurred, the mean between the most recently quoted bid and ask prices is used. |
18
Notes to Financial Statements (continued)
| | Securities for which prices are not readily available are valued at fair value as determined by the Pricing Committee. The Pricing Committee considers a number of factors, including observable and unobservable inputs, when arriving at fair value. The Pricing Committee may use related or comparable assets or liabilities, recent transactions, market multiples, book values, and other relevant information to determine the fair value of portfolio investments. The Board or a designated committee thereof periodically reviews reports that may include fair value determinations made by the Pricing Committee, related market activity, inputs and assumptions, and retrospective comparison of prices of subsequent purchases and sales transactions to fair value determinations made by the Pricing Committee. Short-term securities with 60 days or less remaining to maturity are valued using the amortized cost method, which approximates fair value. |
| (b) | Security Transactions–Security transactions are recorded as of the date that the securities are purchased or sold (trade date). Realized gains and losses on sales of portfolio securities are calculated using the identified-cost method. |
| | |
| (c) | Investment Income–Dividend income is recorded on the ex-dividend date. Interest income is recorded on the accrual basis as earned. Discounts are accreted and premiums are amortized using the effective interest method and are included in Interest and other, if applicable, on the Statement of Operations. Withholding taxes on foreign dividends have been provided for in accordance with the applicable country’s tax rules and rates. |
| | |
| (d) | Income Taxes–It is the policy of the Fund to meet the requirements of Subchapter M of the Internal Revenue Code applicable to regulated investment companies and to distribute substantially all taxable income and capital gains to its shareholders. Therefore, no income tax provision is required. The Fund files U.S. federal and various state and local tax returns. No income tax returns are currently under examination. The statute of limitations on the Fund’s filed U.S. federal tax returns remains open for the fiscal years ended December 31, 2019 through December 31, 2022. The statutes of limitations on the Fund’s state and local tax returns may remain open for an additional year depending upon the jurisdiction. |
| | |
| (e) | Expenses–Expenses incurred by the Company that do not specifically relate to an individual fund are generally allocated to the funds within the Company on a pro rata basis by relative net assets. |
| | |
| (f) | Foreign Transactions–The books and records of the Fund are maintained in U.S. dollars and transactions denominated in foreign currencies are recorded in the Fund’s records at the rate prevailing when earned or recorded. Asset and liability accounts that are denominated in foreign currencies are adjusted daily to reflect current exchange rates and any unrealized gain (loss), if applicable, is included in Net change in unrealized appreciation/depreciation on translation of assets and liabilities denominated in foreign currencies on the Fund’s Statement of Operations. The resultant exchange gains and losses upon settlement of such transactions, if applicable, are included in Net realized gain (loss) on foreign currency related transactions on the Fund’s Statement of Operations. The Fund does not isolate that portion of the results of operations arising as a result of changes in the foreign exchange rates from the changes in market prices of the securities. |
19
Notes to Financial Statements (continued)
| The Fund uses foreign currency exchange contracts to facilitate transactions in foreign-denominated securities. Losses from these transactions may arise from changes in the value of the foreign currency or if the counterparties do not perform under the contracts’ terms. |
| (g) | Futures Contracts–The Fund may purchase and sell futures contracts to enhance returns, to attempt to economically hedge some of its investment risk, or as a substitute position in lieu of holding the underlying asset on which the instrument is based. At the time of entering into a futures transaction, an investor is required to deposit and maintain a specified amount of cash or eligible securities called “initial margin.” Subsequent payments made or received by the Fund called “variation margin” are made on a daily basis as the market price of the futures contract fluctuates. The Fund will record an unrealized gain (loss) based on the amount of variation margin. When a contract is closed, a realized gain (loss) is recorded equal to the difference between the opening and closing value of the contract. |
| | |
| (h) | Repurchase Agreements–The Fund may enter into repurchase agreements with respect to securities. A repurchase agreement is a transaction in which a fund acquires a security and simultaneously commits to resell that security to the seller (a bank or securities dealer) at an agreed-upon price on an agreed-upon date. The Fund requires at all times that the repurchase agreement be collateralized by cash, or by securities of the U.S. Government, its agencies, its instrumentalities, or U.S. Government sponsored enterprises having a value equal to, or in excess of, the value of the repurchase agreement (including accrued interest). If the seller of the agreement defaults on its obligation to repurchase the underlying securities at a time when the fair value of these securities has declined, the Fund may incur a loss upon disposition of the securities. |
| | |
| (i) | Fair Value Measurements–Fair value is defined as the price that the Fund would receive upon selling an investment or transferring a liability in an orderly transaction to an independent buyer in the principal or most advantageous market of the investment. A three-tier hierarchy is used to maximize the use of observable market data and minimize the use of unobservable inputs and to establish classification of fair value measurements for disclosure purposes. Inputs refer broadly to the assumptions that market participants would use in pricing the asset or liability, including assumptions about risk – for example, the risk inherent in a particular valuation technique used to measure fair value (such as a pricing model) and/or the risk inherent in the inputs to the valuation technique. Inputs may be observable or unobservable. Observable inputs reflect the assumptions market participants would use in pricing the asset or liability. Observable inputs are based on market data obtained from sources independent of the reporting entity. Unobservable inputs reflect the reporting entity’s own assumptions about the assumptions market participants would use in pricing the asset or liability. Unobservable inputs are based on the best information available in the circumstances. The three-tier hierarchy classification is determined based on the lowest level of inputs that is significant to the fair value measurement, and is summarized in the three broad Levels listed below: |
| | • | Level 1 – | unadjusted quoted prices in active markets for identical investments; |
| | | | |
| | • | Level 2 – | other significant observable inputs (including quoted prices for similar investments, interest rates, prepayment speeds, credit risk, etc.); and |
| | | | |
| | • | Level 3 – | significant unobservable inputs (including the Fund’s own assumptions in determining the fair value of investments). |
20
Notes to Financial Statements (continued)
| A summary of inputs used in valuing the Fund’s investments and other financial instruments as of December 31, 2022 and, if applicable, Level 3 rollforwards for the fiscal year then ended is included in the Fund’s Schedule of Investments. Changes in valuation techniques may result in transfers into or out of an assigned level within the three-tier hierarchy. The inputs or methodology used for valuing securities are not necessarily an indication of the risk associated with investing in those securities. |
| 3. | MANAGEMENT FEE AND OTHER TRANSACTIONS WITH AFFILIATES |
Management Fee
The Company has a management agreement with Lord Abbett, pursuant to which Lord Abbett provides the Fund with investment management services and executive and other personnel, provides office space and pays for ordinary and necessary office and clerical expenses relating to research and statistical work and supervision of the Fund’s investment portfolio. The management fee is accrued daily and payable monthly.
The management fee is based on the Fund’s average daily net assets at the following annual rate:
| First $2 billion | .55% |
| Over $2 billion | .49% |
For the fiscal year ended December 31, 2022, the effective management fee, net of any applicable waivers, was at an annualized rate of .54% of the Fund’s average daily net assets.
In addition, Lord Abbett provides certain administrative services to the Fund pursuant to an Administrative Services Agreement in return for a fee at an annual rate of .04% of the Fund’s average daily net assets. The fund administration fee is accrued daily and payable monthly. Lord Abbett voluntarily waived $2,968 of fund administration fees during the fiscal year ended December 31, 2022.
For the fiscal year ended December 31, 2022 and continuing through April 30, 2023, Lord Abbett has contractually agreed to waive its fees and reimburse expenses to the extent necessary to limit total net annual operating expenses to an annual rate of 0.99%. This agreement may be terminated only upon the approval of the Board.
The Company, on behalf of the Fund, has entered into services arrangements with certain insurance companies. Under these arrangements, certain insurance companies will be compensated up to .25% of the average daily net asset value (“NAV”) of the Fund’s Class VC Shares held in the insurance company’s separate account to service and maintain the Variable Contract owners’ accounts. This amount is included in non 12b-1 service fees on the Statement of Operations. The Fund may also compensate certain insurance companies, third-party administrators and other entities for providing recordkeeping, sub-transfer agency and other administrative services to the Fund. This amount is included in Shareholder servicing on the Statement of Operations.
One Director and certain of the Company’s officers have an interest in Lord Abbett.
| 4. | DISTRIBUTIONS AND CAPITAL LOSS CARRYFORWARDS |
Dividends from net investment income, if any, are declared and paid at least semi-annually. Taxable net realized gains from investment transactions, reduced by allowable capital loss carryforwards, if any, are declared and distributed to shareholders at least annually. The capital loss carryforward amount, if any, is available to offset future net capital gains. Dividends and distributions to
21
Notes to Financial Statements (continued)
shareholders are recorded on the ex-dividend date. The amounts of dividends and distributions from net investment income and net realized capital gains are determined in accordance with federal income tax regulations, which may differ from U.S. GAAP. These book/tax differences are either considered temporary or permanent in nature. To the extent these differences are permanent in nature, such amounts are reclassified within the components of net assets based on their federal tax basis treatment; temporary differences do not require reclassification. Dividends and distributions that exceed earnings and profits for tax purposes are reported as a tax return of capital.
The tax character of distributions paid during the fiscal years ended December 31, 2022 and December 31, 2021 was as follows:
| | | Year Ended
12/31/2022 | | | Year Ended
12/31/2021 | |
| Distributions paid from: | | | | | | | | |
| Ordinary income | | $ | 1,757,825 | | | $ | 2,828,756 | |
| Net long-term capital gains | | | 23,509,848 | | | | 18,912,580 | |
| Total distributions paid | | $ | 25,267,673 | | | $ | 21,741,336 | |
As of December 31, 2022, the components of accumulated gains (losses) on a tax-basis were as follows:
| Undistributed ordinary income – net | | $ | 111,020 | |
| Undistributed long-term capital gains | | | 1,330,203 | |
| Total undistributed earnings | | | 1,441,223 | |
| Temporary differences | | | (23,751 | ) |
| Unrealized gains (losses) – net | | | 10,868,915 | |
| Total accumulated gains (losses) – net | | $ | 12,286,387 | |
As of December 31, 2022, the aggregate unrealized security gains and losses on investments and other financial instruments based on cost for U.S. federal income tax purposes were as follows:
| Tax cost | | $ | 149,040,476 | |
| Gross unrealized gain | | | 17,532,563 | |
| Gross unrealized loss | | | (6,663,895 | ) |
| Net unrealized security gain/(loss) | | $ | 10,868,668 | |
The difference between book-basis and tax-basis unrealized gains (losses) is attributable to the tax treatment of other financial instruments and wash sales.
| 5. | PORTFOLIO SECURITIES TRANSACTIONS |
Purchases and sales of investment securities (excluding short-term investments) for the fiscal year ended December 31, 2022 were as follows:
| Purchases | Sales |
| $94,897,217 | $121,998,346 |
There were no purchases or sales of U.S. Government securities for the fiscal year ended December 31, 2022.
The Fund is permitted to purchase and sell securities (“cross-trade”) from and to other Lord Abbett funds or client accounts pursuant to procedures approved by the Board in compliance with Rule 17a-7 under the Act (the “Rule”). Each cross-trade is executed at a fair market price in compliance with provisions of the Rule. For the fiscal year ended December 31, 2022, the Fund engaged in cross-trade purchases of $406,266.
22
Notes to Financial Statements (continued)
| 6. | DISCLOSURES ABOUT DERIVATIVE INSTRUMENTS AND HEDGING ACTIVITIES |
Dividend Growth Portfolio entered into E-Mini S&P 500 Index futures contracts for the fiscal year ended December 31, 2022 (as described in Note 2(g)) to manage cash. The Fund bears the risk that the underlying index will move unexpectedly, in which case the Fund may realize a loss. There is minimal counterparty credit risk to the Fund since futures are exchange traded and the exchange’s clearinghouse, as counterparty to all exchange traded futures, guarantees futures against default.
As of December 31, 2022, the Fund had futures contracts with unrealized depreciation of $21,605, which is included in the Schedule of Investments. Only current day’s variation margin is reported within the Fund’s Statement of Assets and Liabilities. Amounts of $(171,361) and $(66,366) are included in the Statement of Operations related to futures contracts under the captions Net realized gain (loss) on futures contracts and Net change in unrealized appreciation/depreciation on futures contracts, respectively. The average number of futures contracts throughout the year was 5.
| 7. | DISCLOSURES ABOUT OFFSETTING ASSETS AND LIABILITIES |
The Financial Accounting Standards Board requires disclosures intended to help better assess the effect or potential effect of offsetting arrangements on a fund’s financial position. The following tables illustrate gross and net information about recognized assets and liabilities eligible for offset in the Statement of Assets and Liabilities; and disclose such amounts subject to an enforceable master netting agreement or similar agreement, by the counterparty. A master netting agreement is an agreement between a fund and a counterparty which provides for the net settlement of amounts owed under all contracts traded under that agreement, as well as cash collateral, through a single payment by one party to the other in the event of default on or termination of any one contract. The Fund’s accounting policy with respect to balance sheet offsetting is that, absent an event of default by the counterparty or a termination of the agreement, the master netting agreement does not result in an offset of reported amounts of financial assets and liabilities in the Statement of Assets and Liabilities across transactions between the Fund and the applicable counterparty:
| Description | | Gross Amounts of
Recognized Assets | | Gross Amounts
Offset in the
Statement of Assets
and Liabilities | | | Net Amounts of
Assets Presented
in the Statement of
Assets and Liabilities |
| Repurchase Agreements | | $560,855 | | $ | – | | | $560,855 |
| Total | | $560,855 | | $ | – | | | $560,855 |
| | | Net Amount
of Assets
Presented in | | | Amounts Not Offset in the
Statement of Assets and Liabilities | |
Counterparty | | the Statement
of Assets and
Liabilities | | | Financial
Instruments | | | Cash
Collateral
Received(a | ) | | Securities
Collateral
Received(a | ) | | Net
Amount(b | ) |
| Fixed Income Clearing Corp. | | $ | 560,855 | | | $ | – | | | $ | – | | | $ | (560,855 | ) | | $ | – | |
| Total | | $ | 560,855 | | | $ | – | | | $ | – | | | $ | (560,855 | ) | | $ | – | |
| (a) | Collateral disclosed is limited to an amount not to exceed 100% of the net amount of assets (liabilities) presented in the Statement of Assets and Liabilities, for each respective counterparty. |
| (b) | Net amount represents the amount owed to the Fund by the counterparty as of December 31, 2022. |
23
Notes to Financial Statements (continued)
| 8. | DIRECTORS’ REMUNERATION |
The Company’s officers and one Director, who are associated with Lord Abbett, do not receive any compensation from the Company for serving in such capacities. Independent Directors’ fees are allocated among all Lord Abbett-sponsored funds based on the net assets of each fund. There is an equity-based plan available to all Independent Directors under which Independent Directors may elect to defer receipt of a portion of Directors’ fees. The deferred amounts are treated as though equivalent dollar amounts had been invested in the Fund. Such amounts and earnings accrued thereon are included in Directors’ fees on the Statement of Operations and in Directors’ fees payable on the Statement of Assets and Liabilities and are not deductible for U.S. federal income tax purposes until such amounts are paid.
The Company has entered into an arrangement with its transfer agent and custodian, whereby credits realized as a result of uninvested cash balances are used to reduce a portion of the Fund’s expenses.
For the period ended August 3, 2022, the Fund and certain other funds managed by Lord Abbett (collectively, the “Participating Funds”) entered into a syndicated line of credit facility with various lenders for $1.275 billion (the “Syndicated Facility”) whereas State Street Bank and Trust Company (“SSB”) participated as a lender and as agent for the lenders. The Participating Funds were subject to graduated borrowing limits of one-third of fund net assets (if fund net assets are less than $750 million), $250 million, $300 million, $700 million, or $1 billion, based on past borrowings and likelihood of future borrowings, among other factors.
Effective August 4, 2022, the Participating Funds entered into a Syndicated Facility with various lenders for $1.625 billion whereas SSB participates as a lender and as agent for the lenders. The Participating Funds were subject to graduated borrowing limits of one-third of fund net assets (if fund net assets are less than $750 million), $250 million, $300 million, $700 million, or $1 billion, based on past borrowings and likelihood of future borrowings, among other factors.
For the period ended August 3, 2022, the Participating Funds were party to an additional line of credit facility with SSB for $330 million (the “Bilateral Facility”), $250 million committed and $80 million uncommitted. Under the Bilateral Facility, the Participating Funds are subject to graduated borrowing limits of one-third of fund net assets (if net assets are less than $750 million), $250 million, $300 million, or $330 million, based on past borrowings and likelihood of future borrowings, among other factors.
Effective August 4, 2022, the Participating Funds are party to an additional uncommitted line of credit facility with SSB for $330 million. Under the Bilateral Facility, the Participating Funds are subject to borrowing limits of one-third of fund net assets (if net assets are less than $750 million), or $250 million based on past borrowings and likelihood of future borrowings, among other factors.
The Syndicated Facility and the Bilateral Facility are to be used for temporary or emergency purposes as additional sources of liquidity to satisfy redemptions.
For the year ended December 31, 2022, the Fund did not utilize the Syndicated Facility or Bilateral Facility.
24
Notes to Financial Statements (continued)
| 11. | INTERFUND LENDING PROGRAM |
Pursuant to an exemptive order issued by the U.S. Securities and Exchange Commission (“SEC exemptive order”) certain registered open-end management investment companies managed by Lord Abbett, including the Fund, participate in a joint lending and borrowing program (the “Interfund Lending Program”). The SEC exemptive order allows the funds that participate in the Interfund Lending Program to borrow money from and lend money to each other for temporary or emergency purposes subject to the limitations and conditions.
For the fiscal year ended December 31, 2022, the Fund did not participate as a borrower or lender in the Interfund Lending Program.
| 12. | CUSTODIAN AND ACCOUNTING AGENT |
SSB is the Company’s custodian and accounting agent. SSB performs custodial, accounting and recordkeeping functions relating to portfolio transactions and calculating the Fund’s NAV.
| 13. | SECURITIES LENDING AGREEMENT |
The Fund has established a securities lending agreement with Citibank, N.A. for the lending of securities to qualified brokers in exchange for securities or cash collateral equal to at least the market value of securities loaned, plus interest, if applicable. Cash collateral is invested in an approved money market fund. In accordance with the Fund’s securities lending agreement, the market value of securities on loan is determined each day at the close of business and any additional collateral required to cover the value of securities on loan is delivered to the Fund on the next business day. As with other extensions of credit, the Fund may experience a delay in the recovery of its securities or incur a loss should the borrower of the securities breach its agreement with the Fund or the borrower becomes insolvent at a time when the collateral is insufficient to cover the cost of repurchasing securities on loan. Any income earned from securities lending is included in Securities lending net income on the Fund’s Statement of Operations.
The initial collateral received by the Fund is required to have a value equal to at least 100% of the market value of the securities loaned. The collateral must be marked-to-market daily to cover increases in the market value of the securities loaned (or potentially a decline in the value of the collateral). In general, the risk of borrower default will be borne by Citibank, N.A.; the Fund will bear the risk of loss with respect to the investment of the cash collateral. The advantage of such loans is that the Fund continues to receive income on loaned securities while receiving a portion of any securities lending fees and earning returns on the cash amounts which may be reinvested for the purchase of investments in securities.
As of December 31, 2022, the Fund did not loan any securities.
The Fund is subject to the general risks and considerations associated with equity investing. The Fund invests primarily in equity securities of large and mid-sized company stocks that have a history of growing their dividends, but there is no guarantee that a company will pay a dividend. At times, the performance of dividend paying companies may lag the performance of other companies or the broader market as a whole. The value of the Fund’s investments in equity securities will fluctuate in response to general economic conditions and to the changes in the prospects of particular companies and/or sectors in the economy. If the Fund’s fundamental research and quantitative analysis fail to produce the intended result, the Fund may suffer losses or underperform its benchmark or other funds with the same investment objective or similar strategies, even in a favorable market.
25
Notes to Financial Statements (concluded)
Large and mid-sized company stocks each may perform differently than the market as a whole and other types of stocks. This is because different types of stocks tend to shift in and out of favor over time depending on market and economic conditions. Mid-sized company stocks may be less able to weather economic shifts or other adverse developments than those of larger, more established companies. Although investing in mid-sized companies offers the potential for above average returns, these companies may not succeed and the value of their stock could decline significantly. Mid-sized companies also may fall out of favor relative to larger companies in certain market cycles, causing the Fund to incur losses or under perform.
The Fund’s exposure to foreign companies and markets presents increased market, industry and sector, liquidity, currency, political and other risks. The securities of foreign companies also may be subject to inadequate exchange control regulations, the imposition of economic sanctions or other government restrictions, higher transaction and other costs, and delays in settlement to the extent they are traded on non-U.S. exchanges or markets.
Geopolitical and other events (e.g., wars, terrorism, natural disasters, epidemics or pandemics, such as the COVID-19 outbreak which began in late 2019) may disrupt securities markets and adversely affect global economies and markets, thereby decreasing the value of the Fund’s investments. Market disruptions can also prevent the Fund from implementing its investment strategies and achieving its investment objective.
The transmission of COVID-19 and efforts to contain its spread have resulted in, among other things, border closings and other significant travel restrictions and disruptions, significant disruptions to business operations, supply chains and customer activity, lower consumer demand for goods and services, event cancellations and restrictions, service cancellations, reductions and other changes, significant challenges in healthcare service preparation and delivery, and prolonged quarantines, as well as general concern and uncertainty. The impact of the COVID-19 outbreak has, and could again, negatively affect the global economy, the economies of individual countries, and the financial performance of individual issuers, sectors, industries, asset classes, and markets in significant and unforeseen ways.
The COVID-19 pandemic and its effects may last for an extended period of time. Although the long-term economic fallout of COVID-19 is difficult to predict, it has contributed to, and is likely to continue to contribute to, market volatility, inflation and systemic economic weakness. The foregoing could disrupt the operations of the Fund and its service providers, adversely affect the value and liquidity of the Fund’s investments, and negatively impact the Fund’s performance and your investment in the Fund.
These factors, and others, can affect the Fund’s performance.
| 15. | SUMMARY OF CAPITAL TRANSACTIONS |
Transactions in shares of capital stock were as follows:
| | | Year Ended
December 31, 2022 | | | Year Ended
December 31, 2021 | |
| Shares sold | | | 1,754,530 | | | | 520,633 | |
| Reinvestment of distributions | | | 1,670,242 | | | | 1,090,634 | |
| Shares reacquired | | | (3,515,388 | ) | | | (1,282,013 | ) |
| Increase (decrease) | | | (90,616 | ) | | | 329,254 | |
26
Report of Independent Registered Public Accounting Firm
To the shareholders and the Board of Directors of Lord Abbett Series Fund, Inc.
Opinion on the Financial Statements and Financial Highlights
We have audited the accompanying statement of assets and liabilities, including the schedule of investments, of Dividend Growth Portfolio, one of the funds constituting Lord Abbett Series Fund, Inc. (the “Fund”), as of December 31, 2022, the related statement of operations for the year then ended, the statements of changes in net assets for each of the two years in the period then ended, the financial highlights for each of the five years in the period then ended, and the related notes. In our opinion, the financial statements and financial highlights present fairly, in all material respects, the financial position of Dividend Growth Portfolio of the Fund as of December 31, 2022, and the results of its operations for the year then ended, the changes in its net assets for each of the two years in the period then ended, and the financial highlights for each of the five years in the period then ended in conformity with accounting principles generally accepted in the United States of America.
Basis for Opinion
These financial statements and financial highlights are the responsibility of the Fund’s management. Our responsibility is to express an opinion on the Fund’s financial statements and financial highlights based on our audits. We are a public accounting firm registered with the Public Company Accounting Oversight Board (United States) (PCAOB) and are required to be independent with respect to the Fund in accordance with the U.S. federal securities laws and the applicable rules and regulations of the Securities and Exchange Commission and the PCAOB.
We conducted our audits in accordance with the standards of the PCAOB. Those standards require that we plan and perform the audit to obtain reasonable assurance about whether the financial statements and financial highlights are free of material misstatement, whether due to error or fraud. The Fund is not required to have, nor were we engaged to perform, an audit of its internal control over financial reporting. As part of our audits we are required to obtain an understanding of internal control over financial reporting but not for the purpose of expressing an opinion on the effectiveness of the Fund’s internal control over financial reporting. Accordingly, we express no such opinion.
Our audits included performing procedures to assess the risks of material misstatement of the financial statements and financial highlights, whether due to error or fraud, and performing procedures that respond to those risks. Such procedures included examining, on a test basis, evidence regarding the amounts and disclosures in the financial statements and financial highlights. Our audits also included evaluating the accounting principles used and significant estimates made by management, as well as evaluating the overall presentation of the financial statements and financial highlights. Our procedures included confirmation of securities owned as of December 31, 2022, by correspondence with the custodian and brokers; when replies were not received from brokers, we performed other auditing procedures. We believe that our audits provide a reasonable basis for our opinion.
DELOITTE & TOUCHE LLP
New York, New York
February 14, 2023
We have served as the auditor of one or more Lord Abbett Family of Funds’ investment companies since 1932.
27
Basic Information About Management
The Board is responsible for the management of the business and affairs of the Fund in accordance with the laws of the state of organization. The Board elects officers who are responsible for the day-to-day operations of the Fund and who execute policies authorized by the Board. The Board also approves an investment adviser to the Fund and continues to monitor the cost and quality of the services the investment adviser provides, and annually considers whether to renew the contract with the investment adviser. Generally, each Board member holds office until his/her successor is elected and qualified or until his/her earlier resignation or removal, as provided in the Fund’s organizational documents.
Lord, Abbett & Co. LLC (“Lord Abbett”), a Delaware limited liability company, is the Fund’s investment adviser. Designated Lord Abbett personnel are responsible for the day-to-day management of the Fund.
Independent Board Members
The following Independent Board Members also are board members of each of the 15 investment companies in the Lord Abbett Family of Funds, which consist of 63 investment portfolios.
Name, Address and
Year of Birth | | Current Position and
Length of Service
with the Fund | | Principal Occupation and Other Directorships
During the Past Five Years |
Evelyn E. Guernsey
Lord, Abbett & Co. LLC
c/o Legal Dept.
90 Hudson Street
Jersey City, NJ 07302
(1955) | | Board member since 2011;
Vice Chair since 2023 | | Principal Occupation: None. Other Directorships: None. |
Julie A. Hill
Lord, Abbett & Co. LLC
c/o Legal Dept.
90 Hudson Street
Jersey City, NJ 07302
(1946) | | Board member since 2004 | | Principal Occupation: Owner and CEO of The Hill Company, a business consulting firm (since 1998). Other Directorships: Previously served as director of Anthem, Inc., a health benefits company (1994–2021). |
Kathleen M. Lutito
Lord, Abbett & Co. LLC
c/o Legal Dept.
90 Hudson Street
Jersey City, NJ 07302
(1963) | | Board member since 2017 | | Principal Occupation: President and Chief Investment Officer of CenturyLink Investment Management Company (since 2006). Other Directorships: None. |
James M. McTaggart
Lord, Abbett & Co. LLC
c/o Legal Dept.
90 Hudson Street
Jersey City, NJ 07302
(1947) | | Board member since 2012 | | Principal Occupation: Owner of McTaggart LLC (since 2011). Other Directorships: None. |
Charles O. Prince
Lord, Abbett & Co. LLC
c/o Legal Dept.
90 Hudson Street
Jersey City, NJ 07302
(1950) | | Board member since 2019 | | Principal Occupation: None. Formerly Chair and Chief Executive Officer, Citigroup, Inc. (Retired 2007). Other Directorships: Previously served as director of Johnson & Johnson (2005–2022). Previously served as director of Xerox Corporation (2007–2018). |
28
Basic Information About Management (continued)
Name, Address and
Year of Birth | | Current Position and
Length of Service
with the Fund | | Principal Occupation and Other Directorships
During the Past Five Years |
Karla M. Rabusch
Lord, Abbett & Co. LLC
c/o Legal Dept.
90 Hudson Street
Jersey City, NJ 07302
(1959) | | Board member since 2017 | | Principal Occupation: President and Director of Wells Fargo Funds Management, LLC (2003–2017); President of Wells Fargo Funds (2003–2016). Other Directorships: None. |
Lorin Patrick Taylor Radtke
Lord, Abbett & Co. LLC
c/o Legal Dept.
90 Hudson Street
Jersey City, NJ 07302
(1968) | | Board member since 2021 | | Principal Occupation: Partner and Co-Founder of M Seven 8 Partners LLC, a venture capital firm (since 2016). Formerly Partner, Goldman Sachs (1992–2016). Other Directorships: Currently serves as director of Assured Guaranty (2021–Present), Virtual Combine (2018–Present), and Mariposa Family Learning Center (2021–Present). Previously served as director of SummerMoon Coffee (2022). |
Leah Song Richardson
Lord, Abbett & Co. LLC
c/o Legal Dept.
90 Hudson Street
Jersey City, NJ 07302
(1966) | | Board member since 2021 | | Principal Occupation: President of Colorado College (since 2021) and was formerly Dean at University of California, Irvine–School of Law (2017–2021) and formerly Professor of Law at University of California, Irvine (2014–2017). Other Directorships: None. |
Mark A. Schmid
Lord, Abbett & Co. LLC
c/o Legal Dept.
90 Hudson Street
Jersey City, NJ 07302
(1959) | | Board member since 2016 | | Principal Occupation: Vice President and Chief Investment Officer of the University of Chicago (2009–2021).
Other Directorships: None.
|
James L.L. Tullis
Lord, Abbett & Co. LLC
c/o Legal Dept.
90 Hudson Street
Jersey City, NJ 07302
(1947) | | Board member since 2006;
Chair since 2017 | | Principal Occupation: Chair of Tullis Health Investors – FL LLC (since 2018); CEO of Tullis-Dickerson and Co. Inc., a venture capital management firm (1990–2016). Other Directorships: Currently serves as Chair of Crane Co. (since 2020, director since 1998), Director of Alphatec Spine (since 2018), and Director of Exagen Inc. (since 2019). Previously served as director of electroCore, Inc. (2018–2020). |
Interested Board Members
Mr. Sieg is affiliated with Lord Abbett and is an “interested person” of the Fund as defined in the Act. Mr. Sieg is a board member of each of the 15 investment companies in the Lord Abbett Family of Funds, which consist of 63 investment portfolios. Mr. Sieg is an officer of the Lord Abbett Family of Funds.
29
Basic Information About Management (continued)
Name, Address and
Year of Birth | | Current Position and
Length of Service
with the Fund | | Principal Occupation and Other Directorships
During the Past Five Years |
Douglas B. Sieg
Lord, Abbett & Co. LLC
90 Hudson Street
Jersey City, NJ 07302
(1969) | | Board member since 2016 | | Principal Occupation: Managing Partner of Lord Abbett (since 2018) and was formerly Head of Client Services, joined Lord Abbett in 1994. Other Directorships: None. |
Officers
None of the officers listed below have received compensation from the Fund. All of the officers of the Fund also may be officers of the other Lord Abbett Funds and maintain offices at 90 Hudson Street, Jersey City, NJ 07302. Unless otherwise indicated, the position(s) and title(s) listed under the “Principal Occupation During the Past Five Years” column indicate each officer’s position(s) and title(s) with Lord Abbett. Each officer serves for an indefinite term (i.e., until his or her death, resignation, retirement, or removal).
Name and
Year of Birth | | Current Position
with the Fund | | Length of Service
of Current
Position | | Principal Occupation
During the Past Five Years |
Douglas B. Sieg
(1969) | | President and Chief
Executive Officer | | Elected as President and Chief Executive Officer in 2018 | | Managing Partner of Lord Abbett (since 2018) and was formerly Head of Client Services, joined Lord Abbett in 1994. |
Jackson C. Chan
(1964) | | AML Compliance Officer | | Elected in 2018 | | Deputy Chief Compliance Officer and Director of Regulatory Affairs, joined Lord Abbett in 2014. |
Michael J. Hebert
(1976) | | Chief Financial Officer
and Treasurer | | Elected as Chief Financial Officer and Treasurer in 2021 | | Head of Global Fund Finance, joined Lord Abbett in 2021 and was formerly Vice President at Eaton Vance Management (EVM) (2014-2021) and Calvert Research & Management (CRM) (2016-2021), and Assistant Treasurer of registered investment companies managed, advised or administered by EVM and CRM during such years. |
Jennifer C. Karam
(1970) | | Vice President and
Assistant Secretary | | Elected in 2022 | | Partner and Senior Deputy General Counsel, joined Lord Abbett in 2012. |
Joseph M. McGill
(1962) | | Chief Compliance Officer | | Elected in 2014 | | Partner and Chief Compliance Officer, joined Lord Abbett in 2014. |
Parker J. Milender
(1989) | | Vice President and
Assistant Secretary | | Elected in 2023 | | Counsel, joined Lord Abbett in 2021 and was formerly an Associate at Milbank LLP (2017-2021). |
30
Basic Information About Management (concluded)
Name and
Year of Birth | | Current Position
with the Fund | | Length of Service
of Current
Position | | Principal Occupation
During the Past Five Years |
Matthew A. Press
(1987) | | Vice President and
Assistant Secretary | | Elected in 2023 | | Counsel, joined Lord Abbett in 2022 and was formerly an Associate at Clifford Chance US LLP (2014-2022). |
Lawrence B. Stoller
(1963) | | Vice President, Secretary
and Chief Legal Officer | | Elected as Vice President and Secretary in 2007 and Chief Legal Officer in 2019 | | Partner and General Counsel, joined Lord Abbett in 2007. |
Victoria Zozulya
(1983) | | Vice President and
Assistant Secretary | | Elected in 2022 | | Counsel, joined Lord Abbett in 2022 and was formerly Senior Director and Counsel at Equitable (2018-2022) and Assistant General Counsel at Neuberger Berman (2014-2018). |
Nicholas D. Emguschowa
(1986) | | Data Protection Officer | | Elected in 2022 | | Assistant General Counsel, joined Lord Abbett in 2018 and was formerly Associate at Shearman & Sterling (2014-2018). |
Please call 888-522-2388 for a copy of the statement of additional information, which contains further information about the Fund’s Board members. It is available free upon request.
31
Householding
The Company has adopted a policy that allows it to send only one copy of the Fund’s prospectus, proxy material, annual report and semiannual report (or related notice of internet availability of annual report and semiannual report) to certain shareholders residing at the same “household.” This reduces Fund expenses, which benefits you and other shareholders. If you need additional copies or do not want your mailings to be “householded,” please call Lord Abbett at 888-522-2388 or send a written request with your name, the name of your fund or funds and your account number or numbers to Lord Abbett Family of Funds, P.O. Box 219336, Kansas City, MO 64121.
Proxy Voting Policies, Procedures and Records
A description of the policies and procedures that Lord Abbett uses to vote proxies related to the Fund’s portfolio securities, and information on how Lord Abbett voted the Fund’s proxies during the 12-month period ended June 30 are available without charge, upon request, (i) by calling 888-522-2388; (ii) on Lord Abbett’s website at www.lordabbett.com; and (iii) on the Securities and Exchange Commission’s (“SEC”) website at www.sec.gov.
Shareholder Reports and Quarterly Portfolio Disclosure
The Fund is required to file its complete schedule of portfolio holdings with the SEC for its first and third fiscal quarters as an attachment to Form N-PORT. Copies of the filings are available without charge, upon request on the SEC’s website at www.sec.gov and may be available by calling Lord Abbett at 888-522-2388.
Tax Information (unaudited) For corporate shareholders, 100% of the Fund’s ordinary income distributions qualified for the dividends received deduction. Additionally, of the distributions paid to the shareholders during the fiscal year ended December 31, 2022, $316,536 and $23,509,848, respectively, represent short-term capital gains and long-term capital gains. |
32


This report, when not used for the general information of shareholders of the Fund, is to be distributed only if preceded or accompanied by a current fund prospectus. | | | |
| | | | |
Lord Abbett mutual fund shares are distributed by
LORD ABBETT DISTRIBUTOR LLC. | | Lord Abbett Series Fund, Inc. Dividend Growth Portfolio | SFCS-PORT-2
(02/23) |

LORD ABBETT
ANNUAL REPORT
Lord Abbett
Series Fund—Developing Growth Portfolio
For the fiscal year ended December 31, 2022
Table of Contents
Lord Abbett Series Fund — Developing Growth Portfolio
Annual Report
For the fiscal year ended December 31, 2022
 From left to right: James L.L. Tullis, Independent Chair of the Lord Abbett Funds and Douglas B. Sieg, Director, President and Chief Executive Officer of the Lord Abbett Funds. | | Dear Shareholders: We are pleased to provide you with this overview of the performance of Lord Abbett Series Fund – Developing Growth Portfolio for the fiscal year ended December 31, 2022. On this page and the following pages, we discuss the major factors that influenced fiscal year performance. For detailed and more information about the Fund, please visit our website at www.lordabbett.com, where you can also access the quarterly commentaries that provide updates on the Fund’s performance and other portfolio related updates. Thank you for investing in Lord Abbett mutual funds. We value the trust that you place in us and look forward to serving your investment needs in the years to come. Best regards, 
Douglas B. Sieg Director, President and Chief Executive Officer |
For the fiscal year ended December 31, 2022, the Fund returned -35.98%, reflecting performance at the net asset value (“NAV”) of Class VC shares with all distributions reinvested, compared to its benchmark, the Russell 2000® Growth Index1, which returned -26.36% over the same period.
U.S. markets faced many challenges throughout the twelve-month period ending December 31, 2022, including the spread of the Omicron variant of COVID-19, supply chain dislocations, labor shortages, inflationary pressures, tighter
fiscal and monetary policy, and Russia’s invasion of Ukraine. The Dow Jones Industrial Average and S&P 500® Index fell -6.86% and -18.11%, respectively, while the tech-heavy Nasdaq Composite suffered even greater losses, falling -32.54%. Value stocks2 significantly outperformed growth stocks3 (-7.98% vs -28.97%), while large cap stocks4 slightly edged out small cap stocks5 (-19.13% vs -20.44%).
To begin the twelve-month period, U.S. markets grappled with COVID-19 cases hitting the highest levels of the pandemic, rising above 580,000 new cases in the last
1
week of December 2021, more than doubling the previous record high. The spike in cases occurred shortly after the World Health Organization designated the newly discovered Omicron variant as a “variant of concern”, leading to one of the largest selloffs of U.S. risk assets since the start of the pandemic, amid fears that the world would succumb to a new wave of infections. However, negative sentiment quickly reversed as cases proved to be generally less severe than prior strains. Market sentiment also increased after the Center for Disease Control shortened its suggested isolation policy for those infected from 10 days to five.
Inflationary concerns began to take focus towards the end of 2021 and became a dominant story throughout the period. Headline consumer price index (CPI) readings had hovered a little above 5% year-over-year for most of 2021, which led investors to question whether this period of rising prices would be more persistent than originally thought. This debate was intensified by the December 2021 headline CPI rising 7.0% year-over-year, the fastest pace since 1982. The sharp increase in prices was generally due to supply and demand imbalances across multiple industries, led initially by energy, food, and used cars. Inflation readings continued to climb throughout the first half of 2022, peaking at 9.1% year-over-year in June. Increases in energy costs were even more profound, rising by more than 30% year-over-year by the end of June. The energy
sector, which had been subject to rising consumer demand as global economies reopened from lockdowns induced by COVID-19, faced added friction with Russia’s invasion of Ukraine since Russia has been a large exporter of oil and certain minerals. Various sanctions imposed on Russia from Western nations led to a surge in commodity prices, with crude oil reaching over $100 per barrel for the first time since 2014.
The surge in prices forced the U.S. Federal Reserve (Fed) into a more aggressive approach to combating inflation. After remaining mostly consistent in its messaging that price pressures would likely be transitory, elevated and more persistent inflation pressures caused the Fed to move the target federal funds rate into more restrictive territory. This resulted in a 25 basis point (bps) hike in the federal funds rate at the March Federal Open Market Committee (FOMC) meeting, the first hike in more than three years. Six additional rate hikes of 50 bps, 75 bps, 75 bps, 75 bps, 75 bps, and 50 bps, respectively, followed in the succeeding months as inflation prints continued to come in hotter than expected, resulting in a federal funds rate of 4.5% by the end of the period, the highest level in 15 years. While the shift down in the pace of rate hikes supported the narrative that the Fed may begin to cut rates by the end of 2023, the Fed’s updated Summary of Economic Projections showed a more hawkish outlook, raising the
2
outlook for the fed funds rate through 2025 from September’s forecasts – including a median forecast of 5.1% for 2023, 4.1% in 2024, and 3.1% in 2025. Fed Chair Powell also struck a hawkish tone in the press conference following the December FOMC meeting, sticking to the higher-for-longer messaging. Bond yields shot up over the period in response to this aggressive policy, leading to a bearish curve flattening and ultimately a yield curve inversion, as shorter-term yields moved higher than longer-term yields.
Separately, global markets faced increased geopolitical tensions due to Russia’s invasion of Ukraine on February 23rd. Tensions remained elevated for the remainder of the twelve-month period, as Russia continued to weaponize energy flows, annexed four Ukrainian regions, and ratcheted up its nuclear warnings. In addition, the rhetoric between the U.S. and China over Taiwan further heated up after U.S. House of Representatives Speaker Nancy Pelosi visited Taiwan in August.
Key macroeconomic indicators mostly trended lower throughout the period, with the U.S. reporting negative gross domestic product of -1.6% in the first quarter of 2022 and -0.6% in the second quarter before growing 3.2% in the third quarter. Worries among investors that a recession was pending continued to grow, leading to a decline in the consumer confidence index to lower levels than during the height of the COVID-19 pandemic and the global financial crisis of 2008.
Despite rising recessionary signs, select bright spots in the U.S. economy supported the idea that a potential recession would be shallow. For example, one positive development was the peak inflation narrative, which included a 99-day stretch of declines in U.S. gasoline prices and November CPI coming in better than expected on both the headline and core numbers. In addition, apartment rents fell for the first time in nearly two years in July, and lumber prices declined by more than 70% from their March peak late in the third quarter, falling back to pre-COVID levels. The third quarter of the 2022 earnings season also generated a lot of “better-than-feared” takeaways, including a common theme of relatively stable demand and pricing power protecting margins. While third quarter earnings were slightly below expectations, comments from management generally provided evidence of healthy consumer spending. Capital return and capital expenditures were also mentioned as relative bright spots as companies flagged easing labor shortages and supply chain constraints. The U.S. labor market also remained strong over the period, with the national unemployment rate at 3.5% as of the end of December.
In terms of Fund performance, security selection within the information technology sector was a primary detractor from relative performance over the one-year period. Specifically, within the semiconductor and semi equipment industry, the Fund’s
3
position in SiTime Corporation, a precision timing company, was the largest individual detractor from relative performance. Shares of the stock fell after management issued second half expectations that disappointed investors, which was a result of weakening demand for both new and legacy products.
The Fund’s position in Ambarella, Inc., a semiconductor company that develops video compression, image processing, and computer vision solutions, was also a primary detractor from relative performance over the period. Despite unveiling a new artificial intelligence-powered image processor in early January, shares fell throughout the first quarter of 2022 amid general market weakness following the Fed’s hawkish pivot. The company also reported disappointing earnings results as it was unable to completely offset supply constrained shortages in their less valuable commercial security vision businesses.
Conversely, security selection within the health care sector contributed to relative performance over the period. The Fund’s position in Shockwave Medical, Inc., a medical device company that focuses on developing and commercializing products intended to transform the way calcified cardiovascular disease is treated, contributed the most to relative performance. Shares of the stock rallied throughout the third
quarter of 2022 after the company reported strong earnings results and raised guidance despite macro headwinds that have largely plagued other companies within the sector – namely labor and supply shortages.
The Fund’s position in Inspire Medical Systems, Inc., a developer of minimally invasive solutions for patients with obstructive sleep apnea, was also a notable contributor to relative performance over the one-year period. Shares of the stock rallied in the fourth quarter of 2022 in response to the company reporting quarterly earnings results that beat expectations and raising forward guidance. Management also announced a new partnership that is expected to expand access to their offerings to thousands of federal medical facilities by providing the Inspire therapy system to Federal Healthcare Systems. With this partnership, the Inspire therapy system is expected to be listed on major government contract vehicles, making it easier for government customers to order the technology for patients.
The Fund’s portfolio is actively managed and, therefore, its holdings and the weightings of a particular issuer or particular sector as a percentage of portfolio assets are subject to change. Sectors may include many industries.
4
1 The Russell 2000® Growth Index measures the performance of those Russell 2000® companies with higher price-to-book ratios and higher forecasted growth values.
2 As represented by the Russell 3000® Value Index as of 12/31/2022.
3 As represented by the Russell 3000® Growth Index as of 12/31/2022.
4 As represented by the Russell 1000® Index as of 12/31/2022.
5 As represented by the Russell 2000® Index as of 12/31/2022.
Unless otherwise specified, indexes reflect total return, with all dividends reinvested. Indexes are unmanaged, do not reflect the deduction of fees or expenses, and are not available for direct investment.
Important Performance and Other Information
Performance data quoted in the following pages reflect past performance and are no guarantee of future results. Current performance may be higher or lower than the performance quoted. The investment return and principal value of an investment in the Fund will fluctuate so that shares, on any given day or when redeemed, may be worth more or less than their original cost. You can obtain performance data current to the most recent month end by calling Lord Abbett at 888-522-2388 or referring to www.lordabbett.com.
During certain periods shown, expense waivers and reimbursements were in place. Without such expense waivers and reimbursements, the Fund’s returns would have been lower.
The annual commentary above discusses the views of the Fund’s management and various portfolio holdings of the Fund as of December 31, 2022. These views and portfolio holdings may have changed after this date. Information provided in the commentary is not a recommendation to buy or sell securities. Because the Fund’s portfolio is actively managed and may change significantly, the Fund may no longer own the securities described above or may have otherwise changed its position in the securities. For more recent information about the Fund’s portfolio holdings, please visit www.lordabbett.com.
A Note about Risk: See Notes to Financial Statements for a discussion of investment risks. For a more detailed discussion of the risks associated with the Fund, please see the Fund’s prospectus.
Mutual funds are not insured by the FDIC, are not deposits or other obligations of, or guaranteed by, banks, and are subject to investment risks including possible loss of principal amount invested.
The Fund serves as an underlying investment vehicle for variable annuity contracts and variable life insurance policies.
5
Investment Comparison
Below is a comparison of a $10,000 investment in Class VC shares with the same investment in the Russell 2000® Growth Index, assuming reinvestment of all dividends and distributions. The Fund’s shares are sold only to insurance company separate accounts that fund certain variable annuity and variable life contracts. The line graph comparison does not reflect the sales charges or other expenses of these contracts. If those sales charges and expenses were reflected, returns would be lower. The graph and performance table below do not reflect the deduction of taxes that a shareholder would pay on Fund distributions or the redemption of Fund shares. During the period, expenses of the Fund have been waived or reimbursed by Lord Abbett; without such waiver or reimbursement of expenses, the Fund’s returns would have been lower. Past performance is no guarantee of future results.
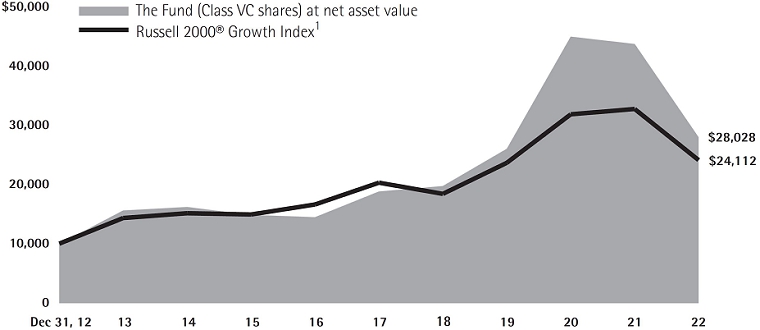
Average Annual Total Returns for the
Periods Ended December 31, 2022 |
| | | 1 Year | | 5 Years | | 10 Years | |
| Class VC | | -35.98% | | 8.23% | | 10.86% | |
| 1 | Performance for the unmanaged index does not reflect any fees or expenses. The performance of the index is not necessarily representative of the Fund’s performance. Performance for the index began on May 1, 2010. |
6
Expense Example
As a shareholder of the Fund, you incur ongoing costs, including management fees; expenses related to the Fund’s services arrangements with certain insurance companies; and other Fund expenses. This Example is intended to help you understand your ongoing costs (in dollars) of investing in the Fund and to compare these costs with the ongoing costs of investing in other mutual funds.
The Example is based on an investment of $1,000 invested at the beginning of the period and held for the entire period (July 1, 2022 through December 31, 2022).
The Example reflects only expenses that are deducted from the assets of the Fund. Fees and expenses, including sales charges applicable to the various insurance products that invest in the Fund, are not reflected in this Example. If such fees and expenses were reflected in the Example, the total expenses shown would be higher. Fees and expenses regarding such variable insurance products are separately described in the prospectus related to those products.
Actual Expenses
The first line of the table on the following page provides information about actual account values and actual expenses. You may use the information in this line, together with the amount you invested, to estimate the expenses that you paid over the period. Simply divide your account value by $1,000 (for example, an $8,600 account value divided by $1,000 = 8.6), then multiply the result by the number in the first line under the heading titled “Expenses Paid During Period 7/1/22 – 12/31/22” to estimate the expenses you paid on your account during this period.
Hypothetical Example for Comparison Purposes
The second line of the table on the following page provides information about hypothetical account values and hypothetical expenses based on the Fund’s actual expense ratio and an assumed rate of return of 5% per year before expenses, which is not the Fund’s actual return. The hypothetical account values and expenses may not be used to estimate the actual ending account balance or expenses you paid for the period. You may use this information to compare the ongoing costs of investing in the Fund and other funds. To do so, compare this 5% hypothetical example with the 5% hypothetical examples that appear in the shareholder reports of the other funds.
7
Please note that the expenses shown in the table are meant to highlight your ongoing costs only and do not reflect any transactional costs, such as sales charges (loads). Therefore, the second line of the table is useful in comparing ongoing costs only, and will not help you determine the relative total costs of owning different funds. In addition, if these transactional costs were included, your costs would have been higher.
| | | Beginning
Account
Value | | Ending
Account
Value | | Expenses
Paid During
Period† | |
| | | 7/1/22 | | 12/31/22 | | 7/1/22 -
12/31/22 | |
| Class VC | | | | | | | | | | | | |
| Actual | | $ | 1,000.00 | | | $ | 1,003.20 | | | $ | 5.25 | |
| Hypothetical (5% Return Before Expenses) | | $ | 1,000.00 | | | $ | 1,019.96 | | | $ | 5.30 | |
| † | Net expenses are equal to the Fund’s annualized expense ratio of 1.04%, multiplied by the average account value over the period, multiplied by 184/365 (to reflect one-half year period). |
Portfolio Holdings Presented by Sector
December 31, 2022
| Sector* | %** |
| Communication Services | 1.94 | % |
| Consumer Discretionary | 12.30 | % |
| Consumer Staples | 2.15 | % |
| Energy | 3.21 | % |
| Financials | 1.36 | % |
| Health Care | 29.44 | % |
| Industrials | 18.65 | % |
| Information Technology | 25.18 | % |
| Materials | 2.79 | % |
| Repurchase Agreements | 2.07 | % |
| Money Market Funds(a) | 0.82 | % |
| Time Deposits(a) | 0.09 | % |
| Total | 100.00 | % |
| * | | A sector may comprise several industries. |
| ** | | Represents percent of total investments, which excludes derivatives. |
| (a) | | Securities were purchased with the cash collateral from loaned securities. |
8
Schedule of Investments
December 31, 2022
| Investments | | Shares | | | Fair
Value | |
| LONG-TERM INVESTMENTS 97.58% | | |
| | | | | | | | | |
| COMMON STOCKS 97.58% | | | | | | | | |
| | | | | | | | | |
| Aerospace & Defense 3.77% | |
| AeroVironment, Inc.* | | | 8,817 | | | $ | 755,264 | |
| Axon Enterprise, Inc.* | | | 7,043 | | | | 1,168,645 | |
| Parsons Corp.* | | | 14,630 | | | | 676,638 | |
| Total | | | | | | | 2,600,547 | |
| | | | | | | | | |
| Auto Components 0.81% | | | | | | | | |
| Fox Factory Holding Corp.* | | | 6,087 | | | | 555,317 | |
| | | | | | | | | |
| Banks 0.74% | | | | | | | | |
| Glacier Bancorp, Inc. | | | 10,297 | | | | 508,878 | |
| | | | | | | | | |
| Beverages 1.15% | | | | | | | | |
| Celsius Holdings, Inc.* | | | 7,596 | | | | 790,288 | |
| | | | | | | | | |
| Biotechnology 13.88% | | | | | | | | |
| Apellis Pharmaceuticals, Inc.* | | | 25,508 | | | | 1,319,019 | |
| Cerevel Therapeutics Holdings, Inc.* | | | 24,300 | | | | 766,422 | |
| Cytokinetics, Inc.* | | | 29,451 | | | | 1,349,445 | |
| Karuna Therapeutics, Inc.* | | | 5,129 | | | | 1,007,848 | |
| Krystal Biotech, Inc.* | | | 20,369 | | | | 1,613,632 | |
| Legend Biotech Corp. ADR* | | | 8,616 | | | | 430,111 | |
| Natera, Inc.* | | | 12,912 | | | | 518,675 | |
| Sarepta Therapeutics, Inc.* | | | 8,841 | | | | 1,145,617 | |
| Xenon Pharmaceuticals, Inc. (Canada)*(a) | | | 35,706 | | | | 1,407,887 | |
| Total | | | | | | | 9,558,656 | |
| | | | | | | | | |
| Building Products 0.71% | | | | | | | | |
| Summit Materials, Inc.* | | | 17,267 | | | | 490,210 | |
| | | | | | | | | |
| Capital Markets 0.63% | | | | | | | | |
| Piper Sandler Cos. | | | 3,352 | | | | 436,397 | |
| | | | | | | | | |
| Chemicals 2.09% | | | | | | | | |
| Balchem Corp. | | | 7,156 | | | | 873,819 | |
| Cabot Corp. | | | 8,495 | | | | 567,806 | |
| Total | | | | | | | 1,441,625 | |
| Investments | | Shares | | | Fair
Value | |
| Commercial Services & Supplies 3.25% | | | | |
| Clean Harbors, Inc.* | | | 10,335 | | | $ | 1,179,430 | |
| Tetra Tech, Inc. | | | 7,285 | | | | 1,057,709 | |
| Total | | | | | | | 2,237,139 | |
| | | | | | | | | |
| Communications Equipment 2.92% | | | | | | | | |
| Calix, Inc.* | | | 29,414 | | | | 2,012,800 | |
| | | | | | | | | |
| Construction & Engineering 4.99% | | | | | | | | |
| Ameresco, Inc. Class A* | | | 14,451 | | | | 825,730 | |
| Comfort Systems USA, Inc. | | | 10,788 | | | | 1,241,483 | |
| MasTec, Inc.* | | | 3,818 | | | | 325,790 | |
| Valmont Industries, Inc. | | | 3,161 | | | | 1,045,248 | |
| Total | | | | | | | 3,438,251 | |
| | | | | | | | | |
| Diversified Consumer Services 1.19% | | | | |
| PowerSchool Holdings, Inc. Class A* | | | 35,571 | | | | 820,979 | |
| | | | | | | | | |
| Electrical Equipment 0.76% | | | | | | | | |
| Shoals Technologies Group, Inc. Class A* | | | 21,271 | | | | 524,756 | |
| | | | | | | | | |
| Energy Equipment & Services 1.88% | | | | |
| Cactus, Inc. Class A | | | 4,352 | | | | 218,731 | |
| ChampionX Corp. | | | 12,221 | | | | 354,287 | |
| TechnipFMC PLC (United Kingdom)*(a) | | | 59,314 | | | | 723,038 | |
| Total | | | | | | | 1,296,056 | |
| | | | | | | | | |
| Entertainment 1.17% | | | | | | | | |
| World Wrestling Entertainment, Inc. Class A | | | 11,783 | | | | 807,371 | |
| | | | | | | | | |
| Food & Staples Retailing 0.45% | | | | | | | | |
| BJ’s Wholesale Club Holdings, Inc.* | | | 4,663 | | | | 308,504 | |
| | | | | | | | | |
| Health Care Equipment & Supplies 9.75% | | | | |
| Axonics, Inc.* | | | 17,457 | | | | 1,091,586 | |
| Glaukos Corp.* | | | 20,423 | | | | 892,077 | |
| Inari Medical, Inc.* | | | 12,729 | | | | 809,055 | |
| iRhythm Technologies, Inc.* | | | 2,853 | | | | 267,240 | |
| Lantheus Holdings, Inc.* | | | 6,294 | | | | 320,742 | |
| | See Notes to Financial Statements. | 9 |
Schedule of Investments (continued)
December 31, 2022
| Investments | | Shares | | | Fair
Value | |
| Health Care Equipment & Supplies (continued) |
| Pacific Biosciences of California, Inc.* | | | 63,627 | | | $ | 520,469 | |
| Shockwave Medical, Inc.* | | | 4,801 | | | | 987,134 | |
| Silk Road Medical, Inc.* | | | 12,188 | | | | 644,136 | |
| TransMedics Group, Inc.* | | | 19,211 | | | | 1,185,703 | |
| Total | | | | | | | 6,718,142 | |
| | | | | | | | | |
| Health Care Technology 2.06% | | | | | | | | |
| Inspire Medical Systems, Inc.* | | | 5,644 | | | | 1,421,611 | |
| | | | | | | | | |
| Hotels, Restaurants & Leisure 4.35% | | | | | | |
| Planet Fitness, Inc. Class A* | | | 18,220 | | | | 1,435,736 | |
| Texas Roadhouse, Inc. | | | 7,224 | | | | 657,023 | |
| Wingstop, Inc. | | | 6,579 | | | | 905,402 | |
| Total | | | | | | | 2,998,161 | |
| | | | | | | | | |
| Information Technology Services 3.22% | | | | |
| Endava plc ADR* | | | 8,875 | | | | 678,937 | |
| Flywire Corp.* | | | 33,856 | | | | 828,456 | |
| Globant SA (Uruguay)*(a) | | | 2,000 | | | | 336,320 | |
| Shift4 Payments, Inc. Class A* | | | 6,705 | | | | 375,011 | |
| Total | | | | | | | 2,218,724 | |
| | | | | | | | | |
| Internet & Direct Marketing Retail 0.68% | | | | |
| Fiverr International Ltd. (Israel)*(a) | | | 16,086 | | | | 468,746 | |
| | | | | | | | | |
| Leisure Products 0.49% | | | | | | | | |
| Topgolf Callaway Brands Corp.* | | | 16,995 | | | | 335,651 | |
| | | | | | | | | |
| Life Sciences Tools & Services 0.07% | | | | | | |
| Olink Holding AB ADR*(b) | | | 1,761 | | | | 44,694 | |
| | | | | | | | | |
| Machinery 3.22% | | | | | | | | |
| Driven Brands Holdings, Inc.* | | | 12,574 | | | | 343,396 | |
| Evoqua Water Technologies Corp.* | | | 22,126 | | | | 876,190 | |
| RBC Bearings, Inc.* | | | 4,778 | | | | 1,000,274 | |
| Total | | | | | | | 2,219,860 | |
| Investments | | Shares | | | Fair
Value | |
| Oil, Gas & Consumable Fuels 1.34% | | | | | | | | |
| Matador Resources Co. | | | 6,804 | | | $ | 389,461 | |
| Talos Energy, Inc.* | | | 28,384 | | | | 535,890 | |
| Total | | | | | | | 925,351 | |
| | | | | | | | | |
| Personal Products 0.57% | | | | | | | | |
| Inter Parfums, Inc. | | | 4,080 | | | | 393,802 | |
| | | | | | | | | |
| Pharmaceuticals 3.85% | | | | | | | | |
| Intra-Cellular Therapies, Inc.* | | | 13,427 | | | | 710,557 | |
| Madrigal Pharmaceuticals, Inc.* | | | 1,707 | | | | 495,457 | |
| Prometheus Biosciences, Inc.* | | | 5,197 | | | | 571,670 | |
| Ventyx Biosciences, Inc.* | | | 26,738 | | | | 876,739 | |
| Total | | | | | | | 2,654,423 | |
| | | | | | | | | |
| Road & Rail 0.57% | | | | | | | | |
| Saia, Inc.* | | | 1,864 | | | | 390,844 | |
| | | | | | | | | |
| Semiconductors & Semiconductor Equipment 7.83% | |
| Array Technologies, Inc.* | | | 38,286 | | | | 740,068 | |
| CEVA, Inc.* | | | 6,141 | | | | 157,087 | |
| Diodes, Inc.* | | | 12,897 | | | | 981,978 | |
| Impinj, Inc.* | | | 9,494 | | | | 1,036,555 | |
| indie Semiconductor, Inc. Class A*(b) | | | 88,198 | | | | 514,194 | |
| Lattice Semiconductor Corp.* | | | 13,175 | | | | 854,794 | |
| Rambus, Inc.* | | | 30,986 | | | | 1,109,918 | |
| Total | | | | | | | 5,394,594 | |
| | | | | | | | | |
| Software 11.78% | | | | | | | | |
| Agilysys, Inc.* | | | 6,468 | | | | 511,878 | |
| AvidXchange Holdings, Inc.* | | | 78,109 | | | | 776,404 | |
| Clear Secure, Inc. Class A | | | 50,031 | | | | 1,372,350 | |
| Confluent, Inc. Class A* | | | 22,263 | | | | 495,129 | |
| CyberArk Software Ltd. (Israel)*(a) | | | 5,402 | | | | 700,369 | |
| DoubleVerify Holdings, Inc.* | | | 28,245 | | | | 620,260 | |
| Gitlab, Inc. Class A* | | | 7,129 | | | | 323,942 | |
| Global-e Online Ltd. (Israel)*(a) | | | 17,865 | | | | 368,734 | |
| HashiCorp, Inc. Class A* | | | 12,536 | | | | 342,734 | |
| 10 | See Notes to Financial Statements. |
Schedule of Investments (continued)
December 31, 2022
| Investments | | Shares | | | Fair
Value | |
| Software (continued) | | | | | | | | |
| Jamf Holding Corp.* | | | 8,467 | | | $ | 180,347 | |
| JFrog Ltd. (Israel)*(a) | | | 19,391 | | | | 413,610 | |
| Qualtrics International, Inc. Class A* | | | 14,670 | | | | 152,275 | |
| Remitly Global, Inc.* | | | 66,294 | | | | 759,066 | |
| Sprout Social, Inc. Class A* | | | 12,868 | | | | 726,527 | |
| Tenable Holdings, Inc.* | | | 9,673 | | | | 369,025 | |
| Total | | | | | | | 8,112,650 | |
| | | | | | | | | |
| Specialty Retail 1.24% | | | | | | | | |
| Dick’s Sporting Goods, Inc. | | | 4,704 | | | | 565,844 | |
| Warby Parker, Inc. Class A*(b) | | | 21,476 | | | | 289,711 | |
| Total | | | | | | | 855,555 | |
| | | | | | | | | |
| Textiles, Apparel & Luxury Goods 4.27% | | | | |
| Crocs, Inc.* | | | 16,864 | | | | 1,828,563 | |
| Deckers Outdoor Corp.* | | | 2,785 | | | | 1,111,661 | |
| Total | | | | | | | 2,940,224 | |
| | | | | | | | | |
| Trading Companies & Distributors 1.12% | | |
| Applied Industrial Technologies, Inc. | | | 6,094 | | | | 768,027 | |
| | | | | | | | | |
| Wireless Telecommunication Services 0.78% | | | | |
| Gogo, Inc.* | | | 36,245 | | | | 534,976 | |
Total Common Stocks
(cost $66,365,953) | | | | | | | 67,223,809 | |
| | | | | | | | | |
| | | | Principal
Amount | | | | | |
| | | | | | | | | |
| SHORT-TERM INVESTMENTS 3.00% | | | | |
| | | | | | | | | |
| Repurchase Agreements 2.08% | | | | | |
Repurchase Agreement dated 12/30/2022, 2.05% due 1/3/2023 with Fixed Income Clearing Corp. collateralized by $1,455,500 of Federal Home Loan Bank at 4.875% due 9/13/2024; value: $1,470,724; proceeds: $1,437,441
(cost $1,437,113) | | $ | 1,437,113 | | | | 1,437,113 | |
| Investments | | Shares | | | Fair
Value | |
| Money Market Funds 0.83% | | | | | | | | |
Fidelity Government Portfolio(c)
(cost $569,534) | | | 569,534 | | | $ | 569,534 | |
| | | | | | | | | |
| Time Deposits 0.09% | | | | | | | | |
CitiBank N.A.(c)
(cost $63,282) | | | 63,282 | | | | 63,282 | |
Total Short-Term Investments
(cost $2,069,929) | | | | | | | 2,069,929 | |
Total Investments in Securities 100.58%
(cost $68,435,882) | | | | | | | 69,293,738 | |
| Other Assets and Liabilities – Net (0.58)% | | | | | | | (401,698 | ) |
| Net Assets 100.00% | | | | | | $ | 68,892,040 | |
| ADR | | American Depositary Receipt. |
| * | | Non-income producing security. |
| (a) | | Foreign security traded in U.S. dollars. |
| (b) | | All or a portion of this security is temporarily on loan to unaffiliated broker/dealers. |
| (c) | | Security was purchased with the cash collateral from loaned securities. |
| | See Notes to Financial Statements. | 11 |
Schedule of Investments (concluded)
December 31, 2022
The following is a summary of the inputs used as of December 31, 2022 in valuing the Fund’s investments carried at fair value(1):
| Investment Type(2) | | Level 1 | | | Level 2 | | | Level 3 | | | Total | |
| Long-Term Investments | | | | | | | | | | | | | | | | | | |
| Common Stocks | | $ | 67,223,809 | | | | $ | – | | | | $ | – | | | $ | 67,223,809 | |
| Short-Term Investments | | | | | | | | | | | | | | | | | | |
| Repurchase Agreements | | | – | | | | | 1,437,113 | | | | | – | | | | 1,437,113 | |
| Money Market Funds | | | 569,534 | | | | | – | | | | | – | | | | 569,534 | |
| Time Deposits | | | – | | | | | 63,282 | | | | | – | | | | 63,282 | |
| Total | | $ | 67,793,343 | | | | $ | 1,500,395 | | | | $ | – | | | $ | 69,293,738 | |
| (1) | | Refer to Note 2(h) for a description of fair value measurements and the three-tier hierarchy of inputs. |
| (2) | | See Schedule of Investments for fair values in each industry and identification of foreign issuers and/or geography. When applicable, each Level 3 security is identified on the Schedule of Investments along with the valuation technique utilized. |
A reconciliation of Level 3 investments is presented when the Fund has a material amount of Level 3 investments at the beginning or end of the year in relation to the Fund’s net assets.
| 12 | See Notes to Financial Statements. |
Statement of Assets and Liabilities
December 31, 2022
| ASSETS: | | | |
| Investments in securities, at fair value including $610,481 of securities loaned (cost $68,435,882) | | $ | 69,293,738 | |
| Cash | | | 72 | |
| Receivables: | | | | |
| Capital shares sold | | | 280,868 | |
| Investment securities sold | | | 150,165 | |
| From advisor (See Note 3) | | | 15,532 | |
| Interest and dividends | | | 8,025 | |
| Securities lending income receivable | | | 481 | |
| Prepaid expenses | | | 8,009 | |
| Total assets | | | 69,756,890 | |
| LIABILITIES: | | | | |
| Payables: | | | | |
| Payable for collateral due to broker for securities lending | | | 632,816 | |
| Transfer agent fees | | | 99,397 | |
| Management fee | | | 45,358 | |
| Capital shares reacquired | | | 13,408 | |
| Directors’ fees | | | 8,345 | |
| Fund administration | | | 2,419 | |
| Accrued expenses | | | 63,107 | |
| Total liabilities | | | 864,850 | |
| NET ASSETS | | $ | 68,892,040 | |
| COMPOSITION OF NET ASSETS: | | | | |
| Paid-in capital | | $ | 95,038,761 | |
| Total distributable earnings (loss) | | | (26,146,721 | ) |
| Net Assets | | $ | 68,892,040 | |
| Outstanding shares (50 million shares of common stock authorized, $.001 par value) | | | 3,110,043 | |
| Net asset value, offering and redemption price per share (Net assets divided by outstanding shares) | | | $22.15 | |
| | See Notes to Financial Statements. | 13 |
Statement of Operations
For the Year Ended December 31, 2022
| Investment income: | | | |
| Dividends (net of foreign withholding taxes of $826) | | $ | 223,716 | |
| Securities lending net income | | | 12,397 | |
| Interest and other | | | 11,053 | |
| Total investment income | | | 247,166 | |
| Expenses: | | | | |
| Management fee | | | 613,113 | |
| Non 12b-1 service fees | | | 204,111 | |
| Shareholder servicing | | | 87,684 | |
| Professional | | | 42,935 | |
| Custody | | | 35,220 | |
| Fund administration | | | 32,759 | |
| Reports to shareholders | | | 23,959 | |
| Directors’ fees | | | 1,574 | |
| Other | | | 19,505 | |
| Gross expenses | | | 1,060,860 | |
| Expense reductions (See Note 8) | | | (1,001 | ) |
| Fees waived and expenses reimbursed (See Note 3) | | | (208,131 | ) |
| Net expenses | | | 851,728 | |
| Net investment loss | | | (604,562 | ) |
| Net realized and unrealized gain (loss): | | | | |
| Net realized gain (loss) on investments | | | (23,300,960 | ) |
| Net change in unrealized appreciation/depreciation on investments | | | (17,820,646 | ) |
| Net realized and unrealized gain (loss) | | | (41,121,606 | ) |
| Net Decrease in Net Assets Resulting From Operations | | $ | (41,726,168 | ) |
| 14 | See Notes to Financial Statements. |
Statements of Changes in Net Assets
| INCREASE (DECREASE) IN NET ASSETS | | For the Year Ended
December 31, 2022 | | | For the Year Ended
December 31, 2021 | |
| Operations: | | | | | | | | | | |
| Net investment loss | | | $ | (604,562 | ) | | | $ | (1,187,918 | ) |
| Net realized gain (loss) on investments | | | | (23,300,960 | ) | | | | 23,624,611 | |
| Net change in unrealized appreciation/depreciation on investments | | | | (17,820,646 | ) | | | | (27,374,033 | ) |
| Net decrease in net assets resulting from operations | | | | (41,726,168 | ) | | | | (4,937,340 | ) |
| Distributions to shareholders: | | | | – | | | | | (29,485,936 | ) |
| Capital share transactions (See Note 14): | | | | | | | | | | |
| Net proceeds from sales of shares | | | | 9,953,786 | | | | | 40,754,167 | |
| Reinvestment of distributions | | | | – | | | | | 29,485,936 | |
| Cost of shares reacquired | | | | (16,325,416 | ) | | | | (56,127,426 | ) |
| Net increase (decrease) in net assets resulting from capital share transactions | | | | (6,371,630 | ) | | | | 14,112,677 | |
| Net decrease in net assets | | | | (48,097,798 | ) | | | | (20,310,599 | ) |
| NET ASSETS: | | | | | | | | | | |
| Beginning of year | | | $ | 116,989,838 | | | | $ | 137,300,437 | |
| End of year | | | $ | 68,892,040 | | | | $ | 116,989,838 | |
| | See Notes to Financial Statements. | 15 |
Financial Highlights
| | | | | Per Share Operating Performance: | | |
| | | | | Investment Operations: | | Distributions
to
shareholders
from: | | |
| | | | | | | | | | | | | |
| | | Net asset
value,
beginning of
period | | Net
investment
(loss)(a) | | Net
realized and
unrealized
gain (loss) | | Total from
investment
operations | | Net
realized
gain | | Net asset
value,
end of
period |
| 12/31/2022 | | | $34.61 | | | $ | (0.18 | ) | | | $(12.28 | ) | | $ | (12.46 | ) | | | $ | – | | | $ | 22.15 | |
| 12/31/2021 | | | 47.18 | | | | (0.42 | ) | | | (0.93 | ) | | | (1.35 | ) | | | | (11.22 | ) | | | 34.61 | |
| 12/31/2020 | | | 29.88 | | | | (0.30 | ) | | | 22.17 | | | | 21.87 | | | | | (4.57 | ) | | | 47.18 | |
| 12/31/2019 | | | 24.97 | | | | (0.27 | ) | | | 8.23 | | | | 7.96 | | | | | (3.05 | ) | | | 29.88 | |
| 12/31/2018 | | | 28.18 | | | | (0.21 | ) | | | 1.41 | | | | 1.20 | | | | | (4.41 | ) | | | 24.97 | |
| (a) | | Calculated using average shares outstanding during the period. |
| (b) | | Total return does not consider the effects of sales charges or other expenses imposed by an insurance company and assumes the reinvestment of all distributions. |
| 16 | See Notes to Financial Statements. |
| | | Ratios to Average Net Assets: | | Supplemental Data: |
| | | | | |
| | | | | |
Total
return(b)
(%) | | Total
expenses after
waivers and/or
reimburse-
ments
(%) | | Total
expenses
(%) | | Net
investment
(loss)
(%) | | Net assets,
end of
period
(000) | | Portfolio
turnover
rate
(%) |
| | (35.98 | ) | | | 1.04 | | | | 1.30 | | | | (0.74 | ) | | $ | 68,892 | | | | 125 | |
| | (2.75 | ) | | | 1.04 | | | | 1.15 | | | | (0.87 | ) | | | 116,990 | | | | 121 | |
| | 72.60 | | | | 1.04 | | | | 1.24 | | | | (0.84 | ) | | | 137,300 | | | | 113 | |
| | 31.77 | | | | 1.01 | | | | 1.27 | | | | (0.86 | ) | | | 79,374 | | | | 106 | |
| | 4.88 | | | | 0.94 | | | | 1.31 | | | | (0.63 | ) | | | 54,749 | | | | 112 | |
| | See Notes to Financial Statements. | 17 |
Notes to Financial Statements
Lord Abbett Series Fund, Inc. (the “Company”) is registered under the Investment Company Act of 1940, as amended (the “Act”), as a diversified, open-end management investment company and was incorporated under Maryland law in 1989. The Company consists of nine separate portfolios as of December 31, 2022. This report covers Developing Growth Portfolio (the “Fund”).
The Fund’s investment objective is long-term growth of capital. The Fund has Variable Contract class shares (“Class VC Shares”), which are currently issued and redeemed only in connection with investments in, and payments under, variable annuity contracts and variable life insurance policies issued by life insurance and insurance-related companies. The Fund generally is not available for purchase by new investors, existing shareholders may continue to purchase Fund shares.
The preparation of the financial statements in conformity with accounting principles generally accepted in the United States of America (“U.S. GAAP”) requires management to make certain estimates and assumptions that affect the reported amounts of assets and liabilities and disclosure of contingent assets and liabilities at the date of the financial statements and the reported amounts of increases and decreases in net assets from operations during the reporting period. Actual results could differ from those estimates. The Fund is considered an investment company under U.S. GAAP and follows the accounting and reporting guidance applicable to investment companies.
| 2. | SIGNIFICANT ACCOUNTING POLICIES |
| (a) | Investment Valuation–Under procedures approved by the Fund’s Board of Directors (the “Board”), the Board has designated the determination of fair value of the Fund’s portfolio investments to Lord, Abbett & Co. LLC (“Lord Abbett”), as valuation designee. Accordingly, Lord Abbett is responsible for, among other things, assessing and managing valuation risks, establishing, applying and testing fair value methodologies, and evaluating pricing services. Lord Abbett has formed a Pricing Committee that performs these responsibilities on behalf of Lord Abbett, administers the pricing and valuation of portfolio investments and ensures that prices utilized reasonably reflect fair value. Among other things, these procedures allow Lord Abbett, subject to Board oversight, to utilize independent pricing services, quotations from securities and financial instrument dealers and other market sources to determine fair value. |
| | |
| | Securities actively traded on any recognized U.S. or non-U.S. exchange or on The NASDAQ Stock Market LLC are valued at the last sale price or official closing price on the exchange or system on which they are principally traded. Events occurring after the close of trading on non-U.S. exchanges may result in adjustments to the valuation of foreign securities to reflect their fair value as of the close of regular trading on the New York Stock Exchange. When valuing foreign equity securities that meet certain criteria, the Board has approved the use of an independent fair valuation service that values such securities to reflect market trading that occurs after the close of the applicable foreign markets of comparable securities or other instruments that correlate to the fair-valued securities. Unlisted equity securities are valued at the last quoted sale price or, if no sale price is available, at the mean between the most recently quoted bid and ask prices. |
| | |
| | Securities for which prices are not readily available are valued at fair value as determined by the Pricing Committee. The Pricing Committee considers a number of factors, including observable and unobservable inputs, when arriving at fair value. The Pricing Committee may use related or comparable assets or liabilities, recent transactions, market multiples, book |
18
Notes to Financial Statements (continued)
| | values, and other relevant information to determine the fair value of portfolio investments. The Board or a designated committee thereof periodically reviews reports that may include fair value determinations made by the Pricing Committee, related market activity, inputs and assumptions, and retrospective comparison of prices of subsequent purchases and sales transactions to fair value determinations made by the Pricing Committee. |
| | |
| | Investments in open-end money market mutual funds are valued at their NAV as of the close of each business day. Short-term securities with 60 days or less remaining to maturity are valued using the amortized cost method, which approximates fair value. |
| | |
| (b) | Security Transactions–Security transactions are recorded as of the date that the securities are purchased or sold (trade date). Realized gains and losses on sales of portfolio securities are calculated using the identified-cost method. |
| | |
| (c) | Investment Income–Dividend income is recorded on the ex-dividend date. Interest income is recorded on the accrual basis as earned. Discounts are accreted and premiums are amortized using the effective interest method and are included in Interest and other, if applicable, on the Statement of Operations. Withholding taxes on foreign dividends have been provided for in accordance with the applicable country’s tax rules and rates. |
| | |
| (d) | Income Taxes–It is the policy of the Fund to meet the requirements of Subchapter M of the Internal Revenue Code applicable to regulated investment companies and to distribute substantially all taxable income and capital gains to its shareholders. Therefore, no income tax provision is required. |
| | |
| | The Fund files U.S. federal and various state and local tax returns. No income tax returns are currently under examination. The statute of limitations on the Fund’s filed U.S. federal tax returns remains open for the fiscal years ended December 31, 2019 through December 31, 2022. The statutes of limitations on the Fund’s state and local tax returns may remain open for an additional year depending upon the jurisdiction. |
| | |
| (e) | Expenses–Expenses incurred by the Company that do not specifically relate to an individual fund are generally allocated to the funds within the Company on a pro rata basis by relative net assets. |
| | |
| (f) | Foreign Transactions–The books and records of the Fund are maintained in U.S. dollars and transactions denominated in foreign currencies are recorded in the Fund’s records at the rate prevailing when earned or recorded. Asset and liability accounts that are denominated in foreign currencies are adjusted daily to reflect current exchange rates and any unrealized gain (loss), if applicable, is included in Net change in unrealized appreciation/depreciation on translation of assets and liabilities denominated in foreign currencies on the Fund’s Statement of Operations. The resultant exchange gains and losses upon settlement of such transactions, if applicable, are included in Net realized gain (loss) on foreign currency related transactions on the Fund’s Statement of Operations. The Fund does not isolate that portion of the results of operations arising as a result of changes in the foreign exchange rates from the changes in market prices of the securities. |
| | |
| | The Fund uses foreign currency exchange contracts to facilitate transactions in foreign-denominated securities. Losses from these transactions may arise from changes in the value of the foreign currency or if the counterparties do not perform under the contracts’ terms. |
19
Notes to Financial Statements (continued)
| (g) | Repurchase Agreements–The Fund may enter into repurchase agreements with respect to securities. A repurchase agreement is a transaction in which a fund acquires a security and simultaneously commits to resell that security to the seller (a bank or securities dealer) at an agreed-upon price on an agreed-upon date. The Fund requires at all times that the repurchase agreement be collateralized by cash, or by securities of the U.S. Government, its agencies, its instrumentalities, or U.S. Government sponsored enterprises having a value equal to, or in excess of, the value of the repurchase agreement (including accrued interest). If the seller of the agreement defaults on its obligation to repurchase the underlying securities at a time when the fair value of these securities has declined, the Fund may incur a loss upon disposition of the securities. |
| | |
| (h) | Fair Value Measurements–Fair value is defined as the price that the Fund would receive upon selling an investment or transferring a liability in an orderly transaction to an independent buyer in the principal or most advantageous market of the investment. A three-tier hierarchy is used to maximize the use of observable market data and minimize the use of unobservable inputs and to establish classification of fair value measurements for disclosure purposes. Inputs refer broadly to the assumptions that market participants would use in pricing the asset or liability, including assumptions about risk - for example, the risk inherent in a particular valuation technique used to measure fair value (such as a pricing model) and/or the risk inherent in the inputs to the valuation technique. Inputs may be observable or unobservable. Observable inputs reflect the assumptions market participants would use in pricing the asset or liability. Observable inputs are based on market data obtained from sources independent of the reporting entity. Unobservable inputs reflect the reporting entity’s own assumptions about the assumptions market participants would use in pricing the asset or liability. Unobservable inputs are based on the best information available in the circumstances. The three-tier hierarchy classification is determined based on the lowest level of inputs that is significant to the fair value measurement, and is summarized in the three broad Levels listed below: |
| | • | Level 1 – | unadjusted quoted prices in active markets for identical investments; |
| | | | |
| | • | Level 2 – | other significant observable inputs (including quoted prices for similar investments, interest rates, prepayment speeds, credit risk, etc.); and |
| | | | |
| | • | Level 3 – | significant unobservable inputs (including the Fund’s own assumptions in determining the fair value of investments). |
| | A summary of inputs used in valuing the Fund’s investments as of December 31, 2022 and, if applicable, Level 3 rollforwards for the fiscal year then ended is included in the Fund’s Schedule of Investments. |
| | |
| | Changes in valuation techniques may result in transfers into or out of an assigned level within the three-tier hierarchy. The inputs or methodology used for valuing securities are not necessarily an indication of the risk associated with investing in those securities. |
| 3. | MANAGEMENT FEE AND OTHER TRANSACTIONS WITH AFFILIATES |
Management Fee
The Company has a management agreement with Lord Abbett, pursuant to which Lord Abbett provides the Fund with investment management services and executive and other personnel, provides office space and pays for ordinary and necessary office and clerical expenses relating to research and statistical work and supervision of the Fund’s investment portfolio. The management fee is accrued daily and payable monthly.
20
Notes to Financial Statements (continued)
The management fee is based on the Fund’s average daily net assets at the following annual rate:
| First $100 million | .75% |
| Over $100 million | .50% |
For the fiscal year ended December 31, 2022, the effective management fee, net of any applicable waivers, was at an annualized rate of 0.54% of the Fund’s average daily net assets.
In addition, Lord Abbett provides certain administrative services to the Fund pursuant to an Administrative Services Agreement in return for a fee at an annual rate of .04% of the Fund’s average daily net assets. The fund administration fee is accrued daily and payable monthly. Lord Abbett voluntarily waived $35,220 of fund administration fees during the fiscal year ended December 31, 2022.
For the fiscal year ended December 31, 2022 and continuing through April 30, 2023, Lord Abbett has contractually agreed to waive its fees and reimburse expenses to the extent necessary to limit total net annual operating expenses to an annual rate of 1.04%. This agreement may be terminated only upon the approval of the Board.
The Company, on behalf of the Fund, has entered into services arrangements with certain insurance companies. Under these arrangements, certain insurance companies will be compensated up to .25% of the average daily net asset value (“NAV”) of the Fund’s Class VC Shares held in the insurance company’s separate account to service and maintain the Variable Contract owners’ accounts. This amount is included in non 12b-1 service fees on the Statement of Operations. The Fund may also compensate certain insurance companies, third-party administrators and other entities for providing recordkeeping, sub-transfer agency and other administrative services to the Fund. This amount is included in Shareholder servicing on the Statement of Operations.
One Director and certain of the Company’s officers have an interest in Lord Abbett.
| 4. | DISTRIBUTIONS AND CAPITAL LOSS CARRYFORWARDS |
Dividends from net investment income, if any, are declared and paid at least semi-annually. Taxable net realized gains from investment transactions, reduced by allowable capital loss carryforwards, if any, are declared and distributed to shareholders at least annually. The capital loss carryforward amount, if any, is available to offset future net capital gains. Dividends and distributions to shareholders are recorded on the ex-dividend date. The amounts of dividends and distributions from net investment income and net realized capital gains are determined in accordance with federal income tax regulations, which may differ from U.S. GAAP. These book/tax differences are either considered temporary or permanent in nature. To the extent these differences are permanent in nature, such amounts are reclassified within the components of net assets based on their federal tax basis treatment; temporary differences do not require reclassification. Dividends and distributions that exceed earnings and profits for tax purposes are reported as a tax return of capital.
21
Notes to Financial Statements (continued)
The tax character of distributions paid during the fiscal years ended December 31, 2022 and 2021 was as follows:
| | | Year Ended
12/31/2022 | | | Year Ended
12/31/2021 | |
| Distributions paid from: | | | | | | | | |
| Ordinary income | | $ | – | | | $ | 2,393,402 | |
| Net long-term capital gains | | | – | | | | 27,092,534 | |
| Total distributions paid | | $ | – | | | $ | 29,485,936 | |
As of December 31, 2022, the components of accumulated gains (losses) on a tax-basis were as follows:
| Capital loss carryforwards* | | $ | (26,295,927 | ) |
| Temporary differences | | | (8,345 | ) |
| Unrealized gains – net | | | 157,551 | |
| Total accumulated gains (losses) – net | | $ | (26,146,721 | ) |
| * | The capital losses will carry forward indefinitely. |
As of December 31, 2022, the aggregate unrealized security gains and losses on investments and other financial instruments based on cost for U.S. federal income tax purposes were as follows:
| Tax cost | | $ | 69,136,187 | |
| Gross unrealized gain | | | 5,860,432 | |
| Gross unrealized loss | | | (5,702,881 | ) |
| Net unrealized security gain | | $ | 157,551 | |
The difference between book-basis and tax-basis unrealized gains (losses) is attributable to the tax treatment of wash sales.
Permanent items identified during the fiscal year ended December 31, 2022 have been reclassified among the components of net assets based on their tax basis treatment as follows:
Total Distributable
Earnings (Loss) | Paid-in Capital | |
| $652,837 | | $ | (652,837 | ) |
The permanent differences are attributable to the tax treatment of net operating losses.
| 5. | PORTFOLIO SECURITIES TRANSACTIONS |
Purchases and sales of investment securities (excluding short-term investments) for the fiscal year ended December 31, 2022 were as follows:
| Purchases | | | Sales | |
| $ | 102,535,083 | | | $ | 109,368,118 | |
There were no purchases or sales of U.S. Government securities for the fiscal year ended December 31, 2022.
The Fund is permitted to purchase and sell securities (“cross-trade”) from and to other Lord Abbett funds or client accounts pursuant to procedures approved by the Board in compliance with Rule 17a-7 under the Act (the “Rule”). Each cross-trade is executed at a fair market price in compliance with provisions of the Rule. For the fiscal year ended December 31, 2022, the Fund engaged in cross-trade purchases of $16,709 and sales of $104,198 which resulted in a net realized gain (loss) of $3,435.
22
Notes to Financial Statements (continued)
| 6. | DISCLOSURES ABOUT OFFSETTING ASSETS AND LIABILITIES |
The Financial Accounting Standards Board requires disclosures intended to help better assess the effect or potential effect of offsetting arrangements on a fund’s financial position. The following tables illustrate gross and net information about recognized assets and liabilities eligible for offset in the Statement of Assets and Liabilities; and disclose such amounts subject to an enforceable master netting agreement or similar agreement, by the counterparty. A master netting agreement is an agreement between a fund and a counterparty which provides for the net settlement of amounts owed under all contracts traded under that agreement, as well as cash collateral, through a single payment by one party to the other in the event of default on or termination of any one contract. The Fund’s accounting policy with respect to balance sheet offsetting is that, absent an event of default by the counterparty or a termination of the agreement, the master netting agreement does not result in an offset of reported amounts of financial assets and liabilities in the Statement of Assets and Liabilities across transactions between the Fund and the applicable counterparty:
| Description | Gross Amounts of
Recognized Assets | Gross Amounts
Offset in the
Statement of Assets
and Liabilities | Net Amounts of
Assets Presented
in the Statement of
Assets and Liabilities |
| Repurchase Agreements | $1,437,113 | $ – | $1,437,113 |
| Total | $1,437,113 | $ – | $1,437,113 |
| | | Net Amount
of Assets
Presented in | | Amounts Not Offset in the
Statement of Assets and Liabilities | | |
| Counterparty | | the Statement
of Assets and
Liabilities | | Financial
Instruments | | Cash
Collateral
Received(a) | | Securities
Collateral
Received(a) | | Net
Amount(b) |
| Fixed Income Clearing Corp. | | $1,437,113 | | $ – | | $ – | | $(1,437,113) | | $ – |
| Total | | $1,437,113 | | $ – | | $ – | | $(1,437,113) | | $ – |
| (a) | Collateral disclosed is limited to an amount not to exceed 100% of the net amount of assets (liabilities) presented in the Statement of Assets and Liabilities, for each respective counterparty. |
| (b) | Net amount represents the amount owed to the Fund by the counterparty as of December 31, 2022. |
| 7. | DIRECTORS’ REMUNERATION |
The Company’s officers and one Director, who are associated with Lord Abbett, do not receive any compensation from the Company for serving in such capacities. Independent Directors’ fees are allocated among all Lord Abbett-sponsored funds based on the net assets of each fund. There is an equity-based plan available to all Independent Directors under which Independent Directors may elect to defer receipt of a portion of Directors’ fees. The deferred amounts are treated as though equivalent dollar amounts had been invested in the Fund. Such amounts and earnings accrued thereon are included in Directors’ fees on the Statement of Operations and in Directors’ fees payable on the Statement of Assets and Liabilities and are not deductible for U.S. federal income tax purposes until such amounts are paid.
23
Notes to Financial Statements (continued)
The Company has entered into an arrangement with its transfer agent and custodian, whereby credits realized as a result of uninvested cash balances are used to reduce a portion of the Fund’s expenses.
For the period ended August 3, 2022, the Fund and certain other funds managed by Lord Abbett (collectively, the “Participating Funds”) entered into a syndicated line of credit facility with various lenders for $1.275 billion (the “Syndicated Facility”) whereas State Street Bank and Trust Company (“SSB”) participated as a lender and as agent for the lenders. The Participating Funds were subject to graduated borrowing limits of one-third of fund net assets (if fund net assets are less than $750 million), $250 million, $300 million, $700 million, or $1 billion, based on past borrowings and likelihood of future borrowings, among other factors.
Effective August 4, 2022, the Participating Funds entered into a Syndicated Facility with various lenders for $1.625 billion whereas SSB participates as a lender and as agent for the lenders. The Participating Funds were subject to graduated borrowing limits of one-third of fund net assets (if fund net assets are less than $750 million), $250 million, $300 million, $700 million, or $1 billion, based on past borrowings and likelihood of future borrowings, among other factors.
For the period ended August 3, 2022, the Participating Funds were party to an additional line of credit facility with SSB for $330 million (the “Bilateral Facility”), $250 million committed and $80 million uncommitted. Under the Bilateral Facility, the Participating Funds are subject to graduated borrowing limits of one-third of fund net assets (if net assets are less than $750 million), $250 million, $300 million, or $330 million, based on past borrowings and likelihood of future borrowings, among other factors.
Effective August 4, 2022, the Participating Funds are party to an additional uncommitted line of credit facility with SSB for $330 million. Under the Bilateral Facility, the Participating Funds are subject to borrowing limits of one-third of fund net assets (if net assets are less than $750 million), or $250 million based on past borrowings and likelihood of future borrowings, among other factors.
The Syndicated Facility and the Bilateral Facility are to be used for temporary or emergency purposes as additional sources of liquidity to satisfy redemptions.
For the year ended December 31, 2022, the Fund did not utilize the Syndicated Facility or Bilateral Facility.
| 10. | INTERFUND LENDING PROGRAM |
Pursuant to an exemptive order issued by the U.S. Securities and Exchange Commission (“SEC exemptive order”) certain registered open-end management investment companies managed by Lord Abbett, including the Fund, participate in a joint lending and borrowing program (the “Interfund Lending Program”). The SEC exemptive order allows the funds that participate in the Interfund Lending Program to borrow money from and lend money to each other for temporary or emergency purposes subject to the limitations and conditions.
For the fiscal year ended December 31, 2022, the Fund did not participate as a borrower or lender in the Interfund Lending Program.
24
Notes to Financial Statements (continued)
| 11. | CUSTODIAN AND ACCOUNTING AGENT |
SSB is the Company’s custodian and accounting agent. SSB performs custodial, accounting and recordkeeping functions relating to portfolio transactions and calculating the Fund’s NAV.
| 12. | SECURITIES LENDING AGREEMENT |
The Fund has established a securities lending agreement with Citibank, N.A. for the lending of securities to qualified brokers in exchange for securities or cash collateral equal to at least the market value of securities loaned, plus interest, if applicable. Cash collateral is invested in an approved money market fund. In accordance with the Fund’s securities lending agreement, the market value of securities on loan is determined each day at the close of business and any additional collateral required to cover the value of securities on loan is delivered to the Fund on the next business day. As with other extensions of credit, the Fund may experience a delay in the recovery of its securities or incur a loss should the borrower of the securities breach its agreement with the Fund or the borrower becomes insolvent at a time when the collateral is insufficient to cover the cost of repurchasing securities on loan. Any income earned from securities lending is included in Securities lending net income on the Fund’s Statement of Operations.
The initial collateral received by the Fund is required to have a value equal to at least 100% of the market value of the securities loaned. The collateral must be marked-to-market daily to cover increases in the market value of the securities loaned (or potentially a decline in the value of the collateral). In general, the risk of borrower default will be borne by Citibank, N.A.; the Fund will bear the risk of loss with respect to the investment of the cash collateral. The advantage of such loans is that the Fund continues to receive income on loaned securities while receiving a portion of any securities lending fees and earning returns on the cash amounts which may be reinvested for the purchase of investments in securities.
As of December 31, 2022, the market value of securities loaned and collateral received for the Fund were as follows:
Market Value
of Securities
Loaned | | Collateral
Received(1) |
| $610,481 | | $632,816 |
| (1) | Statement of Assets and Liabilities location: Payable for collateral due to broker for securities lending. |
The Fund is subject to the general risks and considerations associated with equity investing. The value of an investment will fluctuate in response to movements in the equity securities markets in general and to the changing prospects of individual companies in which the Fund invests.
The Fund has particular risks associated with growth stocks. Different types of stocks shift in and out of favor over time depending on market and economic conditions. Growth stocks tend to be more volatile than other stocks. Growth stocks are often more sensitive to market fluctuations than other securities because their market prices are highly sensitive to future earnings expectations. In addition, if the Fund’s assessment of a company’s potential for growth or market conditions is wrong, it could suffer losses or produce poor performance relative to other funds, even in a favorable market. The Fund invests primarily in small-cap growth company stocks, which tend to be more volatile and can be less liquid than other types of stocks. The shares of small and
25
Notes to Financial Statements (concluded)
mid-sized companies tend to trade less frequently than those of larger, more established companies, which can adversely affect the pricing of these securities and the ability to sell these securities in the future. Small-cap companies may also have more limited product lines, markets or financial resources, and typically experience a higher risk of failure than large-cap companies. Because the Fund may invest a portion of its assets in foreign securities and American Depositary Receipts, it may experience increased market, industry and sector, liquidity, currency, political, information and other risks. The securities of foreign companies also may be subject to inadequate exchange control regulations, the imposition of economic sanctions or other government restrictions, higher transaction and other costs, and delays in settlement to the extent they are traded on non-U.S. exchanges or markets.
Geopolitical and other events (e.g., wars, terrorism, natural disasters, epidemics or pandemics such as the COVID-19 outbreak which began in late 2019) may disrupt securities markets and adversely affect global economies and markets, thereby decreasing the value of the Fund’s investments. Market disruptions can also prevent the Fund from implementing its investment strategies and achieving its investment objective.
The transmission of COVID-19 and efforts to contain its spread have resulted in, among other things, border closings and other significant travel restrictions and disruptions, significant disruptions to business operations, supply chains and customer activity, lower consumer demand for goods and services, event cancellations and restrictions, service cancellations, reductions and other changes, significant challenges in healthcare service preparation and delivery, and prolonged quarantines, as well as general concern and uncertainty. The impact of the COVID-19 outbreak has, and could again, negatively affect the global economy, the economies of individual countries, and the financial performance of individual issuers, sectors, industries, asset classes, and markets in significant and unforeseen ways.
The COVID-19 pandemic and its effects may last for an extended period of time. Although the long-term economic fallout of COVID-19 is difficult to predict, it has contributed to, and is likely to continue to contribute to, market volatility, inflation and systemic economic weakness. The foregoing could disrupt the operations of the Fund and its service providers, adversely affect the value and liquidity of the Fund’s investments, and negatively impact the Fund’s performance and your investment in the Fund.
These factors, and others, can affect the Fund’s performance.
| 14. | SUMMARY OF CAPITAL TRANSACTIONS |
Transactions in shares of capital stock were as follows:
| | | Year Ended
December 31, 2022 | | | Year Ended
December 31, 2021 | |
| Shares sold | | | 397,735 | | | | 821,205 | |
| Reinvestment of distributions | | | – | | | | 834,272 | |
| Shares reacquired | | | (668,373 | ) | | | (1,184,978 | ) |
| Increase (decrease) | | | (270,638 | ) | | | 470,499 | |
26
Report of Independent Registered Public Accounting Firm
To the shareholders and the Board of Directors of Lord Abbett Series Fund, Inc.
Opinion on the Financial Statements and Financial Highlights
We have audited the accompanying statement of assets and liabilities, including the schedule of investments, of Developing Growth Portfolio, one of the funds constituting Lord Abbett Series Fund, Inc. (the “Fund”), as of December 31, 2022, the related statement of operations for the year then ended, the statements of changes in net assets for each of the two years in the period then ended, the financial highlights for each of the five years in the period then ended, and the related notes. In our opinion, the financial statements and financial highlights present fairly, in all material respects, the financial position of Developing Growth Portfolio of the Fund as of December 31, 2022, and the results of its operations for the year then ended, the changes in its net assets for each of the two years in the period then ended, and the financial highlights for each of the five years in the period then ended in conformity with accounting principles generally accepted in the United States of America.
Basis for Opinion
These financial statements and financial highlights are the responsibility of the Fund’s management. Our responsibility is to express an opinion on the Fund’s financial statements and financial highlights based on our audits. We are a public accounting firm registered with the Public Company Accounting Oversight Board (United States) (PCAOB) and are required to be independent with respect to the Fund in accordance with the U.S. federal securities laws and the applicable rules and regulations of the Securities and Exchange Commission and the PCAOB.
We conducted our audits in accordance with the standards of the PCAOB. Those standards require that we plan and perform the audit to obtain reasonable assurance about whether the financial statements and financial highlights are free of material misstatement, whether due to error or fraud. The Fund is not required to have, nor were we engaged to perform, an audit of its internal control over financial reporting. As part of our audits we are required to obtain an understanding of internal control over financial reporting but not for the purpose of expressing an opinion on the effectiveness of the Fund’s internal control over financial reporting. Accordingly, we express no such opinion.
Our audits included performing procedures to assess the risks of material misstatement of the financial statements and financial highlights, whether due to error or fraud, and performing procedures that respond to those risks. Such procedures included examining, on a test basis, evidence regarding the amounts and disclosures in the financial statements and financial highlights. Our audits also included evaluating the accounting principles used and significant estimates made by management, as well as evaluating the overall presentation of the financial statements and financial highlights. Our procedures included confirmation of securities owned as of December 31, 2022, by correspondence with the custodian and brokers; when replies were not received from brokers, we performed other auditing procedures. We believe that our audits provide a reasonable basis for our opinion.
DELOITTE & TOUCHE LLP
New York, New York
February 14, 2023
We have served as the auditor of one or more Lord Abbett Family of Funds’ investment companies since 1932.
27
Basic Information About Management
The Board is responsible for the management of the business and affairs of the Fund in accordance with the laws of the state of organization. The Board elects officers who are responsible for the day-to-day operations of the Fund and who execute policies authorized by the Board. The Board also approves an investment adviser to the Fund and continues to monitor the cost and quality of the services the investment adviser provides, and annually considers whether to renew the contract with the investment adviser. Generally, each Board member holds office until his/her successor is elected and qualified or until his/her earlier resignation or removal, as provided in the Fund’s organizational documents.
Lord, Abbett & Co. LLC (“Lord Abbett”), a Delaware limited liability company, is the Fund’s investment adviser. Designated Lord Abbett personnel are responsible for the day-to-day management of the Fund.
Independent Board Members
The following Independent Board Members also are board members of each of the 15 investment companies in the Lord Abbett Family of Funds, which consist of 63 investment portfolios.
Name, Address and
Year of Birth | | Current Position and
Length of Service
with the Fund | | Principal Occupation and Other Directorships
During the Past Five Years |
Evelyn E. Guernsey
Lord, Abbett & Co. LLC
c/o Legal Dept.
90 Hudson Street
Jersey City, NJ 07302
(1955) | | Board member since 2011;
Vice Chair since 2023 | | Principal Occupation: None. Other Directorships: None. |
| | | | | |
Julie A. Hill
Lord, Abbett & Co. LLC
c/o Legal Dept.
90 Hudson Street
Jersey City, NJ 07302
(1946) | | Board member since 2004 | | Principal Occupation: Owner and CEO of The Hill Company, a business consulting firm (since 1998). Other Directorships: Previously served as director of Anthem, Inc., a health benefits company (1994–2021). |
| | | | | |
Kathleen M. Lutito
Lord, Abbett & Co. LLC
c/o Legal Dept.
90 Hudson Street
Jersey City, NJ 07302
(1963) | | Board member since 2017 | | Principal Occupation: President and Chief Investment Officer of CenturyLink Investment Management Company (since 2006). Other Directorships: None. |
| | | | | |
James M. McTaggart
Lord, Abbett & Co. LLC
c/o Legal Dept.
90 Hudson Street
Jersey City, NJ 07302
(1947) | | Board member since 2012 | | Principal Occupation: Owner of McTaggart LLC (since 2011). Other Directorships: None. |
| | | | | |
Charles O. Prince
Lord, Abbett & Co. LLC
c/o Legal Dept.
90 Hudson Street
Jersey City, NJ 07302
(1950) | | Board member since 2019 | | Principal Occupation: None. Formerly Chair and Chief Executive Officer, Citigroup, Inc. (Retired 2007). Other Directorships: Previously served as director of Johnson & Johnson (2005–2022). Previously served as director of Xerox Corporation (2007–2018). |
28
Basic Information About Management (continued)
Name, Address and
Year of Birth | | Current Position and
Length of Service
with the Fund | | Principal Occupation and Other Directorships
During the Past Five Years |
Karla M. Rabusch
Lord, Abbett & Co. LLC
c/o Legal Dept.
90 Hudson Street
Jersey City, NJ 07302
(1959) | | Board member since 2017 | | Principal Occupation: President and Director of Wells Fargo Funds Management, LLC (2003–2017); President of Wells Fargo Funds (2003–2016). Other Directorships: None. |
| | | | | |
Lorin Patrick Taylor Radtke
Lord, Abbett & Co. LLC
c/o Legal Dept.
90 Hudson Street
Jersey City, NJ 07302
(1968) | | Board member since 2021 | | Principal Occupation: Partner and Co-Founder of M Seven 8 Partners LLC, a venture capital firm (since 2016). Formerly Partner, Goldman Sachs (1992–2016). Other Directorships: Currently serves as director of Assured Guaranty (2021–Present), Virtual Combine (2018–Present), and Mariposa Family Learning Center (2021–Present). Previously served as director of SummerMoon Coffee (2022). |
| | | | | |
Leah Song Richardson
Lord, Abbett & Co. LLC
c/o Legal Dept.
90 Hudson Street
Jersey City, NJ 07302
(1966) | | Board member since 2021 | | Principal Occupation: President of Colorado College (since 2021) and was formerly Dean at University of California, Irvine–School of Law (2017–2021) and formerly Professor of Law at University of California, Irvine (2014–2017). Other Directorships: None. |
| | | | | |
Mark A. Schmid
Lord, Abbett & Co. LLC
c/o Legal Dept.
90 Hudson Street
Jersey City, NJ 07302
(1959) | | Board member since 2016 | | Principal Occupation: Vice President and Chief Investment Officer of the University of Chicago (2009–2021). Other Directorships: None. |
| | | | | |
James L.L. Tullis
Lord, Abbett & Co. LLC
c/o Legal Dept.
90 Hudson Street
Jersey City, NJ 07302
(1947) | | Board member since 2006;
Chair since 2017 | | Principal Occupation: Chair of Tullis Health Investors-FL LLC (since 2018); CEO of Tullis-Dickerson and Co. Inc., a venture capital management firm (1990–2016). Other Directorships: Currently serves as Chair of Crane Co. (since 2020, director since 1998), Director of Alphatec Spine (since 2018), and Director of Exagen Inc. (since 2019). Previously served as director of electroCore, Inc. (2018–2020). |
Interested Board Members
Mr. Sieg is affiliated with Lord Abbett and is an “interested person” of the Fund as defined in the Act. Mr. Sieg is a board member of each of the 15 investment companies in the Lord Abbett Family of Funds, which consist of 63 investment portfolios. Mr. Sieg is an officer of the Lord Abbett Family of Funds.
29
Basic Information About Management (continued)
Name, Address and
Year of Birth | | Current Position and
Length of Service
with the Fund | | Principal Occupation and Other Directorships
During the Past Five Years |
Douglas B. Sieg
Lord, Abbett & Co. LLC
90 Hudson Street
Jersey City, NJ 07302
(1969) | | Board member since 2016 | | Principal Occupation: Managing Partner of Lord Abbett (since 2018) and was formerly Head of Client Services, joined Lord Abbett in 1994. Other Directorships: None. |
Officers
None of the officers listed below have received compensation from the Fund. All of the officers of the Fund also may be officers of the other Lord Abbett Funds and maintain offices at 90 Hudson Street, Jersey City, NJ 07302. Unless otherwise indicated, the position(s) and title(s) listed under the “Principal Occupation During the Past Five Years” column indicate each officer’s position(s) and title(s) with Lord Abbett. Each officer serves for an indefinite term (i.e., until his or her death, resignation, retirement, or removal).
Name and
Year of Birth | | Current Position
with the Fund | | Length of Service
of Current
Position | | Principal Occupation
During the Past Five Years |
Douglas B. Sieg
(1969) | | President and Chief Executive Officer | | Elected as President and Chief Executive Officer in 2018 | | Managing Partner of Lord Abbett (since 2018) and was formerly Head of Client Services, joined Lord Abbett in 1994. |
| | | | | | | |
Jackson C. Chan
(1964) | | AML Compliance Officer | | Elected in 2018 | | Deputy Chief Compliance Officer and Director of Regulatory Affairs, joined Lord Abbett in 2014. |
| | | | | | | |
Michael J. Hebert
(1976) | | Chief Financial Officer and Treasurer | | Elected as Chief Financial Officer and Treasurer in 2021 | | Head of Global Fund Finance, joined Lord Abbett in 2021 and was formerly Vice President at Eaton Vance Management (EVM) (2014–2021) and Calvert Research & Management (CRM) (2016–2021), and Assistant Treasurer of registered investment companies managed, advised or administered by EVM and CRM during such years. |
| | | | | | | |
Jennifer C. Karam
(1970) | | Vice President and Assistant Secretary | | Elected in 2022 | | Partner and Senior Deputy General Counsel, joined Lord Abbett in 2012. |
| | | | | | | |
Joseph M. McGill
(1962) | | Chief Compliance Officer | | Elected in 2014 | | Partner and Chief Compliance Officer, joined Lord Abbett in 2014. |
30
Basic Information About Management (concluded)
Name and
Year of Birth | | Current Position
with the Fund | | Length of Service
of Current
Position | | Principal Occupation
During the Past Five Years |
| | | | | | | |
Parker J. Milender
(1989) | | Vice President and Assistant Secretary | | Elected in 2023 | | Counsel, joined Lord Abbett in 2021 and was formerly an Associate at Milbank LLP (2017–2021) |
| | | | | | | |
Matthew A. Press
(1987) | | Vice President and Assistant Secretary | | Elected in 2023 | | Counsel, joined Lord Abbett in 2022 and was formerly an Associate at Clifford Chance US LLP (2014–2022). |
| | | | | | | |
Lawrence B. Stoller
(1963) | | Vice President, Secretary and Chief Legal Officer | | Elected as Vice President and Secretary in 2007 and Chief Legal Officer in 2019 | | Partner and General Counsel, joined Lord Abbett in 2007. |
| | | | | | | |
Victoria Zozulya
(1983) | | Vice President and Assistant Secretary | | Elected in 2022 | | Counsel, joined Lord Abbett in 2022 and was formerly Senior Director and Counsel at Equitable (2018–2022) and Assistant General Counsel at Neuberger Berman (2014–2018). |
| | | | | | | |
Nicholas D. Emguschowa
(1986) | | Data Protection Officer | | Elected in 2022 | | Assistant General Counsel, joined Lord Abbett in 2018 and was formerly Associate at Shearman & Sterling (2014–2018). |
Please call 888-522-2388 for a copy of the statement of additional information, which contains further information about the Fund’s Board members. It is available free upon request.
31
Householding
The Company has adopted a policy that allows it to send only one copy of the Fund’s prospectus, proxy material, annual report and semiannual report (or related notice of internet availability of annual report and semiannual report) to certain shareholders residing at the same “household.” This reduces Fund expenses, which benefits you and other shareholders. If you need additional copies or do not want your mailings to be “householded,” please call Lord Abbett at 888-522-2388 or send a written request with your name, the name of your fund or funds and your account number or numbers to Lord Abbett Family of Funds, P.O. Box 219336, Kansas City, MO 64121.
Proxy Voting Policies, Procedures and Records
A description of the policies and procedures that Lord Abbett uses to vote proxies related to the Fund’s portfolio securities, and information on how Lord Abbett voted the Fund’s proxies during the 12-month period ended June 30 are available without charge, upon request, (i) by calling 888-522-2388; (ii) on Lord Abbett’s website at www.lordabbett.com; and (iii) on the Securities and Exchange Commission’s (“SEC”) website at www.sec.gov.
Shareholder Reports and Quarterly Portfolio Disclosure
The Fund is required to file its complete schedule of portfolio holdings with the SEC for its first and third fiscal quarters as an attachment to Form N-PORT. Copies of the filings are available without charge, upon request on the SEC’s website at www.sec.gov and may be available by calling Lord Abbett at 888-522-2388.
32
 | | | | |
 |
 | | | | |
 |
| This report, when not used for the general information of shareholders of the Fund, is to be distributed only if preceded or accompanied by a current fund prospectus. | | | | |
| | | | | |
Lord Abbett mutual fund shares are distributed by
LORD ABBETT DISTRIBUTOR LLC. | | Lord Abbett Series Fund, Inc. Developing Growth Portfolio | | SFDG-PORT-2 (02/23) |

LORD ABBETT
ANNUAL REPORT
Lord Abbett
Series Fund—Fundamental Equity Portfolio
For the fiscal year ended December 31, 2022
Table of Contents
Lord Abbett Series Fund — Fundamental Equity Portfolio
Annual Report
For the fiscal year ended December 31, 2022
 From left to right: James L.L. Tullis, Independent Chair of the Lord Abbett Funds and Douglas B. Sieg, Director, President and Chief Executive Officer of the Lord Abbett Funds. | | Dear Shareholders: We are pleased to provide you with this overview of the performance of Lord Abbett Series Fund – Fundamental Equity Portfolio for the fiscal year ended December 31, 2022. On this page and the following pages, we discuss the major factors that influenced fiscal year performance. For detailed and timely information about the Fund, please visit our website at www.lordabbett.com, where you can also access the quarterly commentaries that provide updates on the Fund’s performance and other portfolio related updates. Thank you for investing in Lord Abbett mutual funds. We value the trust that you place in us and look forward to serving your investment needs in the years to come. Best regards, 
Douglas B. Sieg Director, President and Chief Executive Officer |
For the fiscal year ended December 31, 2022, the Fund returned –11.98%, reflecting performance at the net asset value (“NAV”) of Class VC shares with all distributions reinvested, compared to its benchmark, the Russell 1000® Value Index*, which returned –7.54% over the same period.
U.S. markets faced many challenges throughout the twelve-month period ending December 31, 2022, including the spread of the Omicron variant of COVID-19, supply chain dislocations, labor shortages, inflationary pressures, tighter fiscal and monetary policy, and Russia’s invasion of Ukraine. The Dow Jones Industrial Average and S&P 500® Index fell –6.86% and –18.11%, respectively, while the tech-heavy Nasdaq Composite suffered even greater
losses, falling –32.54%. Value stocks1 significantly outperformed growth stocks2 (–7.98% vs –28.97%), while large cap stocks3 slightly edged out small cap stocks4 (–19.13% vs –20.44%).
To begin the twelve-month period, U.S. markets grappled with COVID-19 cases hitting the highest levels of the pandemic, rising above 580,000 new cases in the last week of December 2021, more than doubling the previous record high. The spike in cases occurred shortly after the World Health Organization designated the newly discovered Omicron variant as a “variant of concern”, leading to one of the largest selloffs of U.S. risk assets since the start of the pandemic, amid fears that the world would succumb to a new wave of infections.
1
However, negative sentiment quickly reversed as cases proved to be generally less severe than prior strains. Market sentiment also increased after the Center for Disease Control shortened its suggested isolation policy for those infected from 10 days to five.
Inflationary concerns began to take focus towards the end of 2021 and became a dominant story throughout the period. Headline consumer price index (CPI) readings had hovered a little above 5% year-over-year for most of 2021, which led investors to question whether this period of rising prices would be more persistent than originally thought. This debate was intensified by the December 2021 headline CPI rising 7.0% year-over-year, the fastest pace since 1982. The sharp increase in prices was generally due to supply and demand imbalances across multiple industries, led initially by energy, food, and used cars. Inflation readings continued to climb throughout the first half of 2022, peaking at 9.1% year-over-year in June. Increases in energy costs were even more profound, rising by more than 30% year-over-year by the end of June. The energy sector, which had been subject to rising consumer demand as global economies reopened from lockdowns induced by COVID-19, faced added friction with Russia’s invasion of Ukraine since Russia has been a large exporter of oil and certain minerals. Various sanctions imposed on Russia from Western nations led to a surge in commodity prices, with crude oil reaching over $100 per barrel for the first time since 2014.
The surge in prices forced the U.S. Federal Reserve (Fed) into a more aggressive approach to combating inflation. After remaining mostly consistent in its messaging that price pressures would likely be transitory, elevated and more persistent inflation pressures caused the Fed to move the target federal funds rate into more
restrictive territory. This resulted in a 25 basis point (bps) hike in the federal funds rate at the March Federal Open Market Committee (FOMC) meeting, the first hike in more than three years. Six additional rate hikes of 50 bps, 75 bps, 75 bps, 75 bps, 75 bps, and 50 bps, respectively, followed in the succeeding months as inflation prints continued to come in hotter than expected, resulting in a federal funds rate of 4.5% by the end of the period, the highest level in 15 years. While the shift down in the pace of rate hikes supported the narrative that the Fed may begin to cut rates by the end of 2023, the Fed’s updated Summary of Economic Projections showed a more hawkish outlook, raising the outlook for the fed funds rate through 2025 from September’s forecasts – including a median forecast of 5.1% for 2023, 4.1% in 2024, and 3.1% in 2025. Fed Chair Powell also struck a hawkish tone in the press conference following the December FOMC meeting, sticking to the higher-for-longer messaging. Bond yields shot up over the period in response to this aggressive policy, leading to a bearish curve flattening and ultimately a yield curve inversion, as shorter-term yields moved higher than longer-term yields.
Separately, global markets faced increased geopolitical tensions due to Russia’s invasion of Ukraine on February 23rd. Tensions remained elevated for the remainder of the twelve-month period, as Russia continued to weaponize energy flows, annexed four Ukrainian regions, and ratcheted up its nuclear warnings. In addition, the rhetoric between the U.S. and China over Taiwan further heated up after U.S. House of Representatives Speaker Nancy Pelosi visited Taiwan in August.
Key macroeconomic indicators mostly trended lower throughout the period, with the U.S. reporting negative gross domestic product of –1.6% in the first quarter of
2
2022 and –0.6% in the second quarter before growing 3.2% in the third quarter. Worries among investors that a recession was pending continued to grow, leading to a decline in the consumer confidence index to lower levels than during the height of the COVID-19 pandemic and the global financial crisis of 2008.
Despite rising recessionary signs, select bright spots in the U.S. economy supported the idea that a potential recession would be shallow. For example, one positive development was the peak inflation narrative, which included a 99-day stretch of declines in U.S. gasoline prices and November CPI coming in better than expected on both the headline and core numbers. In addition, apartment rents fell for the first time in nearly two years in July, and lumber prices declined by more than 70% from their March peak late in the third quarter, falling back to pre-COVID levels. The third quarter of the 2022 earnings season also generated a lot of “better-than-feared” takeaways, including a common theme of relatively stable demand and pricing power protecting margins. While third quarter earnings were slightly below expectations, comments from management generally provided evidence of healthy consumer spending. Capital return and capital expenditures were also mentioned as relative bright spots as companies flagged easing labor shortages and supply chain constraints. The U.S. labor market also remained strong over the period, with the national unemployment rate at 3.5% as of the end of December.
In terms of the Fund’s key performance drivers, over the twelve-month period ending December 31, 2022, security selection within the Consumer Discretionary sector detracted from the Fund’s relative performance. Within the Consumer Discretionary, sector the Fund’s position in Caesars Entertainment, a casino management company, detracted most from
relative performance. Shares fell after the company reported that revenue was short of expectations in the first quarter. The company faced headwinds throughout the period as it had notable financial leverage. We believe the company should benefit from both the reduction of its overall leverage as well as the resumption of international travel. The Fund’s position in Alcoa Corp., which engages in the production of bauxite, alumina, and aluminum products, also detracted from relative performance. Shares fell after the company stated in the second quarter that supply chain disruptions were easing, but not as quickly as the company had projected at the end of the first quarter. The impact of that meant that there would be less shipments in the second quarter than what the company had expected. The Fund’s position in Alphabet, Inc., a multinational technology company that specializes in Internet-related services and products, also detracted from relative performance. Shares fell throughout the period as large cap technology stocks came under pressure. More specifically, there were growing concerns over Alphabet’s digital advertising business as the competition in this space continued to grow.
Conversely, one of the largest contributors to relative performance during the twelve-month period ending December 31, 2022, was UnitedHealth Group, Inc., a health care coverage provider. Managed care companies such as UnitedHealth Group continued to see strong performance at the beginning of 2022 despite investors’ expectation that medical cost trends would remain subdued as the pandemic continued to delay procedures. Shares of the company rose after reporting fourth quarter earnings with revenue above expectations. Shares continued to rally after it was announced that LHC Group would be acquired by UnitedHealth for $5.4B cash. The Fund’s position in Lockheed Martin Corp., a global security and aerospace company, also
3
contributed to relative performance. The ongoing tensions between Russia and Ukraine have built up momentum in the defense sector and the U.S. government is Lockheed Martin’s largest customer. We believe the U.S. national defense budget could be larger than most are predicting, and the company should subsequently benefit from this. The Fund’s position in Allstate Corporation, an insurance company, also contributed to relative performance. Shares rallied over the period as the company reported several quarters of earnings above consensus expectations. Auto
insurance margins have suffered due to increases in accident frequency as the economy reopens as well as increased claims costs mostly attributable to inflation. Allstate’s management is undertaking pricing actions that we expect will be sufficient to restore profitability over the medium-term.
The Fund’s portfolio is actively managed and, therefore, its holdings and the weightings of a particular issuer or particular sector as a percentage of portfolio assets are subject to change. Sectors may include many industries.
* The Russell 1000® Value Index measures the performance of those Russell 1000® companies with lower price-to-book ratios and lower forecasted growth values.
1 As represented by the Russell 3000® Value Index as of 12/31/2022.
2 As represented by the Russell 3000® Growth Index as of 12/31/2022.
3 As represented by the Russell 1000® Index as of 12/31/2022.
4 As represented by the Russell 2000® Index as of 12/31/2022.
Unless otherwise specified, indexes reflect total return, with all dividends reinvested. Indexes are unmanaged, do not reflect the deduction of fees or expenses, and are not available for direct investment.
Important Performance and Other Information
Performance data quoted in the following pages reflect past performance and are no guarantee of future results. Current performance may be higher or lower than the performance quoted. The investment return and principal value of an investment in the Fund will fluctuate so that shares, on any given day or when redeemed, may be worth more or less than their original cost. You can obtain performance data current to the most recent month end by calling Lord Abbett at 888-522-2388 or referring to www.lordabbett.com.
During certain periods shown, expense waivers and reimbursements were in place. Without such expense waivers and reimbursements, the Fund’s returns would have been lower.
The annual commentary above discusses the views of the Fund’s management and various portfolio holdings of the Fund as of December 31, 2022. These views and portfolio holdings may have changed after this date. Information provided in the commentary is not a recommendation to buy or sell securities. Because the Fund’s portfolio is actively managed and may change significantly, the Fund may no longer own the securities described above or may have otherwise changed its position in the securities. For more recent information about the Fund’s portfolio holdings, please visit www.lordabbett.com.
A Note about Risk: See Notes to Financial Statements for a discussion of investment risks. For a more detailed discussion of the risks associated with the Fund, please see the Fund’s prospectus.
Mutual funds are not insured by the FDIC, are not deposits or other obligations of, or guaranteed by, banks, and are subject to investment risks including possible loss of principal amount invested.
The Fund serves as an underlying investment vehicle for variable annuity contracts and variable life insurance policies.
4
Investment Comparison
Below is a comparison of a $10,000 investment in Class VC shares with the same investment in the Russell 1000® Value Index, Russell 3000® Index, Russell 3000® Value Index, and S&P 500® Index, assuming reinvestment of all dividends and distributions. The Fund’s shares are sold only to insurance company separate accounts that fund certain variable annuity and variable life contracts. This line graph comparison does not reflect the sales charges or other expenses of these contracts. If those sales charges and expenses were reflected, returns would be lower. The graph and performance table below do not reflect the deduction of taxes that a shareholder would pay on Fund distributions or the redemption of Fund shares. During certain periods, expenses of the Fund have been waived or reimbursed by Lord Abbett; without such waiver or reimbursement of expenses, the Fund’s returns would have been lower. During certain periods, expenses of the Fund have been waived or reimbursed by Lord Abbett; without such waiver or reimbursement of expenses, the Fund’s returns would have been lower. Past performance is no guarantee of future results.

Average Annual Total Returns for the
Periods Ended December 31, 2022 |
| | | 1 Year | | 5 Years | | 10 Years | |
| Class VC | | -11.98% | | 4.94% | | 8.82% | |
| 1 | Performance for each unmanaged index does not reflect any fees or expenses. The performance of each index is not necessarily representative of the Fund’s performance. |
5
Expense Example
As a shareholder of the Fund, you incur ongoing costs, including management fees; expenses related to the Fund’s services arrangements with certain insurance companies; and other Fund expenses. This Example is intended to help you understand your ongoing costs (in dollars) of investing in the Fund and to compare these costs with the ongoing costs of investing in other mutual funds.
The Example is based on an investment of $1,000 invested at the beginning of the period and held for the entire period (July 1, 2022 through December 31, 2022).
The Example reflects only expenses that are deducted from the assets of the Fund. Fees and expenses, including sales charges applicable to the various insurance products that invest in the Fund, are not reflected in this Example. If such fees and expenses were reflected in the Example, the total expenses shown would be higher. Fees and expenses regarding such variable insurance products are separately described in the prospectus related to those products.
Actual Expenses
The first line of the table on the following page provides information about actual account values and actual expenses. You may use the information in this line, together with the amount you invested, to estimate the expenses that you paid over the period. Simply divide your account value by $1,000 (for example, an $8,600 account value divided by $1,000 = 8.6), then multiply the result by the number in the first line under the heading titled “Expenses Paid During Period 7/1/22 – 12/31/22” to estimate the expenses you paid on your account during this period.
Hypothetical Example for Comparison Purposes
The second line of the table on the following page provides information about hypothetical account values and hypothetical expenses based on the Fund’s actual expense ratio and an assumed rate of return of 5% per year before expenses, which is not the Fund’s actual return. The hypothetical account values and expenses may not be used to estimate the actual ending account balance or expenses you paid for the period. You may use this information to compare the ongoing costs of investing in the Fund and other funds. To do so, compare this 5% hypothetical example with the 5% hypothetical examples that appear in the shareholder reports of the other funds.
6
Please note that the expenses shown in the table are meant to highlight your ongoing costs only and do not reflect any transactional costs, such as sales charges. Therefore, the second line of the table is useful in comparing ongoing costs only, and will not help you determine the relative total costs of owning different funds. In addition, if these transactional costs were included, your costs would have been higher.
| | | Beginning
Account
Value | | Ending
Account
Value | | Expenses
Paid During
Period† | |
| | | 7/1/22 | | 12/31/22 | | 7/1/22 -
12/31/22 | |
| Class VC | | | | | | | | | |
| Actual | | $ | 1,000.00 | | | $ | 1,060.50 | | | $ | 5.61 | |
| Hypothetical (5% Return Before Expenses) | | $ | 1,000.00 | | | $ | 1,019.76 | | | $ | 5.50 | |
| † | Net expenses are equal to the Fund’s annualized expense ratio of 1.08%, multiplied by the average account value over the period, multiplied by 184/365 (to reflect one-half year period). |
Portfolio Holdings Presented by Sector
December 31, 2022
| Sector* | %** |
| Communication Services | 4.39 | % |
| Consumer Discretionary | 7.63 | % |
| Consumer Staples | 5.66 | % |
| Energy | 7.95 | % |
| Financials | 20.55 | % |
| Health Care | 14.57 | % |
| Industrials | 15.28 | % |
| Information Technology | 12.13 | % |
| Materials | 4.70 | % |
| Real Estate | 2.30 | % |
| Utilities | 2.96 | % |
| Repurchase Agreements | 1.88 | % |
| Total | 100.00 | % |
| * | | A sector may comprise several industries. |
| ** | | Represents percent of total investments, which excludes derivatives. |
7
Schedule of Investments
December 31, 2022
| Investments | | Shares | | | Fair
Value | |
| LONG-TERM INVESTMENTS 99.38% | | |
| | | | | | | | | |
| COMMON STOCKS 99.38% | |
| | | | | | | | | |
| Aerospace & Defense 4.17% | |
| Lockheed Martin Corp. | | | 6,480 | | | $ | 3,152,455 | |
| Raytheon Technologies Corp. | | | 40,430 | | | | 4,080,196 | |
| Total | | | | | | | 7,232,651 | |
| | | | | | | | | |
| Automobiles 1.30% | |
| General Motors Co. | | | 66,870 | | | | 2,249,507 | |
| | | | | | | | | |
| Banks 5.46% | |
| East West Bancorp, Inc. | | | 32,440 | | | | 2,137,796 | |
| JPMorgan Chase & Co. | | | 30,730 | | | | 4,120,893 | |
| Wells Fargo & Co. | | | 78,170 | | | | 3,227,639 | |
| Total | | | | | | | 9,486,328 | |
| | | | | | | | | |
| Beverages 1.07% | | | | | | | | |
| Carlsberg A/S Class B(a) | | | 14,000 | | | | 1,857,057 | |
| | | | | | | | | |
| Biotechnology 1.98% | | | | | | | | |
| AbbVie, Inc. | | | 21,280 | | | | 3,439,061 | |
| | | | | | | | | |
| Building Products 1.71% | | | | | | | | |
| Masco Corp. | | | 36,480 | | | | 1,702,522 | |
| Masonite International Corp.* | | | 15,630 | | | | 1,259,934 | |
| Total | | | | | | | 2,962,456 | |
| | | | | | | | | |
| Capital Markets 6.31% | | | | | | | | |
| Ameriprise Financial, Inc. | | | 10,420 | | | | 3,244,476 | |
| Charles Schwab Corp. (The) | | | 38,040 | | | | 3,167,210 | |
| KKR & Co., Inc. | | | 35,800 | | | | 1,661,836 | |
| Morgan Stanley | | | 33,950 | | | | 2,886,429 | |
| Total | | | | | | | 10,959,951 | |
| | | | | | | | | |
| Chemicals 2.21% | | | | | | | | |
| Avient Corp. | | | 34,480 | | | | 1,164,045 | |
| Valvoline, Inc. | | | 81,900 | | | | 2,674,035 | |
| Total | | | | | | | 3,838,080 | |
| Investments | | Shares | | | Fair
Value | |
| Construction & Engineering 2.71% | |
| AECOM | | | 18,800 | | | $ | 1,596,684 | |
| EMCOR Group, Inc. | | | 20,940 | | | | 3,101,423 | |
| Total | | | | | | | 4,698,107 | |
| | | | | | | | | |
| Consumer Finance 1.38% | | | | | | | | |
| American Express Co. | | | 16,270 | | | | 2,403,892 | |
| | | | | | | | | |
| Containers & Packaging 1.15% | | | | | | | | |
| Avery Dennison Corp. | | | 11,010 | | | | 1,992,810 | |
| | | | | | | | | |
| Electric: Utilities 3.00% | | | | | | | | |
| Entergy Corp. | | | 24,260 | | | | 2,729,250 | |
| NextEra Energy, Inc. | | | 29,610 | | | | 2,475,396 | |
| Total | | | | | | | 5,204,646 | |
| | | | | | | | | |
| Electronic Equipment, Instruments & Components 1.18% | |
| Teledyne Technologies, Inc.* | | | 5,110 | | | | 2,043,540 | |
| | | | | | | | | |
| Energy Equipment & Services 1.86% | |
| NOV, Inc. | | | 154,500 | | | | 3,227,505 | |
| | | | | | | | | |
| Equity Real Estate Investment Trusts 2.33% | |
| American Homes 4 Rent Class A | | | 56,640 | | | | 1,707,130 | |
| Prologis, Inc. | | | 20,700 | | | | 2,333,511 | |
| Total | | | | | | | 4,040,641 | |
| | | | | | | | | |
| Food & Staples Retailing 1.75% | | | | | | | | |
| BJ’s Wholesale Club Holdings, Inc.* | | | 45,930 | | | | 3,038,729 | |
| | | | | | | | | |
| Health Care Providers & Services 5.61% | |
| CVS Health Corp. | | | 26,500 | | | | 2,469,535 | |
| Tenet Healthcare Corp.* | | | 42,760 | | | | 2,086,260 | |
| UnitedHealth Group, Inc. | | | 9,790 | | | | 5,190,462 | |
| Total | | | | | | | 9,746,257 | |
| | | | | | | | | |
| Hotels, Restaurants & Leisure 1.19% | |
| Caesars Entertainment, Inc.* | | | 49,730 | | | | 2,068,768 | |
| | | | | | | | | |
| Household Durables 1.47% | | | | | | | | |
| Helen of Troy Ltd.* | | | 22,990 | | | | 2,549,821 | |
| 8 | See Notes to Financial Statements. |
Schedule of Investments (continued)
December 31, 2022
| Investments | | Shares | | | Fair
Value | |
| Household Products 1.27% | | | | | | | | |
| Spectrum Brands Holdings, Inc. | | | 36,140 | | | $ | 2,201,649 | |
| | |
| Information Technology Services 3.98% | |
| Euronet Worldwide, Inc.* | | | 20,360 | | | | 1,921,577 | |
| Fiserv, Inc.* | | | 28,300 | | | | 2,860,281 | |
| PayPal Holdings, Inc.* | | | 30,000 | | | | 2,136,600 | |
| Total | | | | | | | 6,918,458 | |
| | | | | | | | | |
| Insurance 7.65% | | | | | | | | |
| Allstate Corp. (The) | | | 27,520 | | | | 3,731,712 | |
| Arch Capital Group Ltd.* | | | 42,130 | | | | 2,644,921 | |
| Arthur J Gallagher & Co. | | | 14,810 | | | | 2,792,277 | |
| Assurant, Inc. | | | 10,810 | | | | 1,351,899 | |
| RenaissanceRe Holdings Ltd. | | | 14,950 | | | | 2,754,239 | |
| Total | | | | | | | 13,275,048 | |
| | |
| Interactive Media & Services 1.88% | |
| Alphabet, Inc. Class A* | | | 36,970 | | | | 3,261,863 | |
| | |
| Life Sciences Tools & Services 1.53% | |
| Thermo Fisher Scientific, Inc. | | | 4,820 | | | | 2,654,326 | |
| | | | | | | | | |
| Machinery 3.22% | | | | | | | | |
| Crane Holdings Co. | | | 25,964 | | | | 2,608,084 | |
| Parker-Hannifin Corp. | | | 10,220 | | | | 2,974,020 | |
| Total | | | | | | | 5,582,104 | |
| | | | | | | | | |
| Media 1.15% | | | | | | | | |
| Comcast Corp. Class A | | | 57,080 | | | | 1,996,088 | |
| | | | | | | | | |
| Metals & Mining 1.40% | | | | | | | | |
| Alcoa Corp. | | | 22,300 | | | | 1,013,981 | |
| Reliance Steel & Aluminum Co. 6,960 | | | | | | | 1,408,982 | |
| Total | | | | | | | 2,422,963 | |
| Investments | | Shares | | | Fair
Value | |
| Multi-Line Retail 1.44% | | | | | | | | |
| Target Corp. | | | 16,750 | | | $ | 2,496,420 | |
| | | | | | | | | |
| Oil, Gas & Consumable Fuels 6.20% | |
| Chesapeake Energy Corp. | | | 35,493 | | | | 3,349,474 | |
| Pioneer Natural Resources Co. | | | 15,290 | | | | 3,492,083 | |
| Shell plc ADR | | | 68,770 | | | | 3,916,452 | |
| Total | | | | | | | 10,758,009 | |
| | | | | | | | | |
| Personal Products 1.65% | | | | | | | | |
| BellRing Brands, Inc.* | | | 111,590 | | | | 2,861,168 | |
| | | | | | | | | |
| Pharmaceuticals 5.63% | | | | | | | | |
| Eli Lilly & Co. | | | 4,290 | | | | 1,569,454 | |
| Organon & Co. | | | 130,580 | | | | 3,647,099 | |
| Pfizer, Inc. | | | 89,030 | | | | 4,561,897 | |
| Total | | | | | | | 9,778,450 | |
| | | | | | | | | |
| Road & Rail 1.26% | | | | | | | | |
| Norfolk Southern Corp. | | | 8,910 | | | | 2,195,602 | |
| | | | | | | | | |
| Semiconductors & Semiconductor Equipment 2.81% | |
| KLA Corp. | | | 4,420 | | | | 1,666,472 | |
| Micron Technology, Inc. | | | 29,760 | | | | 1,487,405 | |
| Texas Instruments, Inc. | | | 10,460 | | | | 1,728,201 | |
| Total | | | | | | | 4,882,078 | |
| | | | | | | | | |
| Software 3.07% | | | | | | | | |
| Adobe, Inc.* | | | 8,080 | | | | 2,719,162 | |
| Microsoft Corp. | | | 10,900 | | | | 2,614,038 | |
| Total | | | | | | | 5,333,200 | |
| | | | | | | | | |
| Specialty Retail 2.33% | | | | | | | | |
| AutoZone, Inc.* | | | 730 | | | | 1,800,311 | |
| Lowe’s Cos., Inc. | | | 11,290 | | | | 2,249,420 | |
| Total | | | | | | | 4,049,731 | |
| | | | | | | | | |
| Technology Hardware, Storage & Peripherals 1.24% | |
| NetApp, Inc. | | | 35,900 | | | | 2,156,154 | |
| | See Notes to Financial Statements. | 9 |
Schedule of Investments (concluded)
December 31, 2022
| Investments | | Shares | | | Fair
Value | |
| Trading Companies & Distributors 2.41% | |
| AerCap Holdings NV (Ireland)*(b) | | | 46,080 | | | $ | 2,687,386 | |
| MRC Global, Inc.* | | | 129,950 | | | | 1,504,821 | |
| Total | | | | | | | 4,192,207 | |
| | | | | | | | | |
| Wireless Telecommunication Services 1.42% | |
| T-Mobile US, Inc.* | | | 17,580 | | | | 2,461,200 | |
Total Common Stocks
(cost $169,965,235) | | | | | | | 172,516,525 | |
| Investments | | Principal
Amount | | | Fair
Value | |
| SHORT-TERM INVESTMENTS 1.90% | |
| | | | | | | | | |
| Repurchase Agreements 1.90% | |
Repurchase Agreement dated 12/30/2022, 2.05% due 1/3/2023 with Fixed Income Clearing Corp. collateralized by $3,352,000 of U.S. Treasury Note at 4.275% due 4/30/2024; value: $3,368,277; proceeds: $3,302,946
(cost $3,302,194) | | $ | 3,302,194 | | | $ | 3,302,194 | |
Total Investments in Securities 101.28%
(cost $173,267,429) | | | | | | | 175,818,719 | |
| Other Assets and Liabilities – Net (1.28)% | | | | | | | (2,218,379 | ) |
| Net Assets 100.00% | | | | | | $ | 173,600,340 | |
| ADR | | American Depositary Receipt. |
| * | | Non-income producing security. |
| (a) | | Investment in non-U.S. dollar denominated securities. |
| (b) | | Foreign security traded in U.S. dollars. |
The following is a summary of the inputs used as of December 31, 2022 in valuing the Fund’s investments carried at fair value(1):
| Investment Type(2) | | Level 1 | | | Level 2 | | | Level 3 | | | Total | |
| Long-Term Investments | | | | | | | | | | | | | | | | | | |
| Common Stocks | | | | | | | | | | | | | | | | | | |
| Beverages | | $ | – | | | | $ | 1,857,057 | | | | $ | – | | | $ | 1,857,057 | |
| Remaining Industries | | | 170,659,468 | | | | | – | | | | | – | | | | 170,659,468 | |
| Short-Term Investments | | | | | | | | | | | | | | | | | | |
| Repurchase Agreements | | | – | | | | | 3,302,194 | | | | | – | | | | 3,302,194 | |
| Total | | $ | 170,659,468 | | | | $ | 5,159,251 | | | | $ | – | | | $ | 175,818,719 | |
| (1) | | Refer to Note 2(h) for a description of fair value measurements and the three-tier hierarchy of inputs. |
| (2) | | See Schedule of Investments for fair values in each industry and identification of foreign issuers and/or geography. The table above is presented by Investment Type. Industries are presented within an Investment Type should such Investment Type include securities classified as two or more levels within the three-tier fair value hierarchy. When applicable, each Level 3 security is identified on the Schedule of Investments along with the valuation technique utilized. |
A reconciliation of Level 3 investments is presented when the Fund has a material amount of Level 3 investments at the beginning or end of the year in relation to the Fund’s net assets.
| 10 | See Notes to Financial Statements. |
Statement of Assets and Liabilities
December 31, 2022
| ASSETS: | | | | |
| Investments in securities, at fair value (cost $173,267,429) | | $ | 175,818,719 | |
| Cash | | | 132 | |
| Receivables: | | | | |
| Investment securities sold | | | 351,547 | |
| Interest and dividends | | | 82,919 | |
| From advisor (See Note 3) | | | 18,066 | |
| Capital shares sold | | | 992 | |
| Securities lending income receivable | | | 117 | |
| Prepaid expenses | | | 383 | |
| Total assets | | | 176,272,875 | |
| LIABILITIES: | | | | |
| Payables: | | | | |
| Capital shares reacquired | | | 2,163,568 | |
| Transfer agent fees | | | 253,968 | |
| Management fee | | | 113,857 | |
| Directors’ fees | | | 45,876 | |
| Fund administration | | | 6,072 | |
| Foreign currency overdraft (cost $5) | | | 5 | |
| Accrued expenses | | | 89,189 | |
| Total liabilities | | | 2,672,535 | |
| NET ASSETS | | $ | 173,600,340 | |
| COMPOSITION OF NET ASSETS: | | | | |
| Paid-in capital | | $ | 173,021,419 | |
| Total distributable earnings (loss) | | | 578,921 | |
| Net Assets | | $ | 173,600,340 | |
| Outstanding shares (110 million shares of common stock authorized, $.001 par value) | | | 11,449,453 | |
| Net asset value, offering and redemption price per share (Net assets divided by outstanding shares) | | $ | 15.16 | |
| | See Notes to Financial Statements. | 11 |
Statement of Operations
For the Year Ended December 31, 2022
| Investment income: | | | | |
| Dividends (net of foreign withholding taxes of $5,577) | | $ | 4,377,291 | |
| Securities lending net income | | | 3,894 | |
| Interest and other | | | 25,732 | |
| Total investment income | | | 4,406,917 | |
| Expenses: | | | | |
| Management fee | | | 1,543,216 | |
| Non 12b-1 service fees | | | 522,857 | |
| Shareholder servicing | | | 223,630 | |
| Fund administration | | | 83,772 | |
| Professional | | | 47,243 | |
| Custody | | | 35,367 | |
| Reports to shareholders | | | 28,213 | |
| Directors’ fees | | | 3,885 | |
| Other | | | 41,651 | |
| Gross expenses | | | 2,529,834 | |
| Expense reductions (See Note 8) | | | (2,290 | ) |
| Fees waived and expenses reimbursed (See Note 3) | | | (265,694 | ) |
| Net expenses | | | 2,261,850 | |
| Net investment income | | | 2,145,067 | |
| Net realized and unrealized gain (loss): | | | | |
| Net realized gain (loss) on investments | | | 21,758,945 | |
| Net realized gain (loss) on foreign currency related transactions | | | 2,152 | |
| Net change in unrealized appreciation/depreciation on investments | | | (60,158,091 | ) |
| Net change in unrealized appreciation/depreciation on translation of assets and liabilities denominated in foreign currencies | | | (905 | ) |
| Net realized and unrealized gain (loss) | | | (38,397,899 | ) |
| Net Decrease in Net Assets Resulting From Operations | | $ | (36,252,832 | ) |
| 12 | See Notes to Financial Statements. |
Statements of Changes in Net Assets
| INCREASE (DECREASE) IN NET ASSETS | | For the Year Ended
December 31, 2022 | | | For the Year Ended
December 31, 2021 | |
| Operations: | | | | | | | | | | |
| Net investment income | | | $ | 2,145,067 | | | | $ | 2,466,148 | |
| Net realized gain (loss) on investments and foreign currency related transactions | | | | 21,761,097 | | | | | 45,134,908 | |
| Net change in unrealized appreciation/depreciation on investments and translation of assets and liabilities denominated in foreign currencies | | | | (60,158,996 | ) | | | | 28,289,536 | |
| Net increase (decrease) in net assets resulting from operations | | | | (36,252,832 | ) | | | | 75,890,592 | |
| Distributions to shareholders: | | | | (26,291,775 | ) | | | | (15,232,278 | ) |
| Capital share transactions (See Note 14): | | | | | | | | | | |
| Net proceeds from sales of shares | | | | 55,747,790 | | | | | 3,372,455 | |
| Reinvestment of distributions | | | | 26,291,775 | | | | | 15,232,278 | |
| Cost of shares reacquired | | | | (161,060,237 | ) | | | | (66,300,822 | ) |
| Net decrease in net assets resulting from capital share transactions | | | | (79,020,672 | ) | | | | (47,696,089 | ) |
| Net increase (decrease) in net assets | | | | (141,565,279 | ) | | | | 12,962,225 | |
| NET ASSETS: | | | | | | | | | | |
| Beginning of year | | | $ | 315,165,619 | | | | $ | 302,203,394 | |
| End of year | | | $ | 173,600,340 | | | | $ | 315,165,619 | |
| | See Notes to Financial Statements. | 13 |
Financial Highlights
| | | | | Per Share Operating Performance: |
| | | | | Investment Operations: | | Distributions to
shareholders from: |
| | | Net asset
value,
beginning
of period | | Net
invest-
ment
income(a) | | Net
realized
and
unrealized
gain (loss) | | Total
from
invest-
ment
opera-
tions | | Net
investment
income | | Net
realized
gain | | Total
distri-
butions |
| 12/31/2022 | | $ | 20.11 | | | $ | 0.18 | | | $ | (2.62 | ) | | $ | (2.44 | ) | | $ | (0.19 | ) | | $ | (2.32 | ) | | $ | (2.51 | ) |
| 12/31/2021 | | | 16.61 | | | | 0.15 | | | | 4.36 | | | | 4.51 | | | | (0.16 | ) | | | (0.85 | ) | | | (1.01 | ) |
| 12/31/2020 | | | 16.55 | | | | 0.22 | | | | 0.05 | (c) | | | 0.27 | | | | (0.19 | ) | | | (0.02 | ) | | | (0.21 | ) |
| 12/31/2019 | | | 14.13 | | | | 0.21 | | | | 2.84 | | | | 3.05 | | | | (0.21 | ) | | | (0.42 | ) | | | (0.63 | ) |
| 12/31/2018 | | | 18.86 | | | | 0.20 | | | | (1.78 | ) | | | (1.58 | ) | | | (0.28 | ) | | | (2.87 | ) | | | (3.15 | ) |
| (a) | Calculated using average shares outstanding during the period. |
| (b) | Total return does not consider the effects of sales charges or other expenses imposed by an insurance company and assumes the reinvestment of all distributions. |
| (c) | Realized and unrealized gain (loss) per share does not correlate to the aggregate of the net realized and unrealized gain (loss) in the Statement of Operations for the year ended December 31, 2020, primarily due to the timing of the sales and repurchases of the Fund’s shares in relation to fluctuating market values of the Fund’s portfolio. |
| 14 | See Notes to Financial Statements. |
| | | | | Ratios to Average Net Assets: | | Supplemental Data: |
| | | | | | | | | | | | | |
Net
asset
value,
end of
period | | Total
return(b)
(%) | | Total
expenses
after
waivers
and/or reim-
bursements
(%) | | Total
expenses
(%) | | Net
investment
income
(%) | | Net
assets,
end of
period
(000) | | Portfolio
turnover
rate
(%) |
| $ | 15.16 | | | | (11.98 | ) | | | 1.08 | | | | 1.21 | | | | 1.03 | | | $ | 173,600 | | | | 62 | |
| | 20.11 | | | | 27.31 | | | | 1.08 | | | | 1.17 | | | | 0.78 | | | | 315,166 | | | | 76 | |
| | 16.61 | | | | 1.77 | | | | 1.08 | | | | 1.19 | | | | 1.48 | | | | 302,203 | | | | 130 | |
| | 16.55 | | | | 21.51 | | | | 1.11 | | | | 1.19 | | | | 1.35 | | | | 327,999 | | | | 124 | |
| | 14.13 | | | | (8.16 | ) | | | 1.18 | | | | 1.19 | | | | 1.09 | | | | 207,728 | | | | 117 | |
| | See Notes to Financial Statements. | 15 |
Notes to Financial Statements
Lord Abbett Series Fund, Inc. (the “Company”) is registered under the Investment Company Act of 1940, as amended (the “Act”), as a diversified, open-end management investment company and was incorporated under Maryland law in 1989. The Company consists of nine separate portfolios as of December 31, 2022. This report covers Fundamental Equity Portfolio (the “Fund”).
The Fund’s investment objective is long-term growth of capital and income without excessive fluctuations in market value. The Fund has Variable Contract class shares (“Class VC Shares”), which are currently issued and redeemed only in connection with investments in, and payments under, variable annuity contracts and variable life insurance policies issued by life insurance and insurance-related companies.
The preparation of the financial statements in conformity with accounting principles generally accepted in the United States of America (“U.S. GAAP”) requires management to make certain estimates and assumptions that affect the reported amounts of assets and liabilities and disclosure of contingent assets and liabilities at the date of the financial statements and the reported amounts of increases and decreases in net assets from operations during the reporting period. Actual results could differ from those estimates. The Fund is considered an investment company under U.S. GAAP and follows the accounting and reporting guidance applicable to investment companies.
| 2. | SIGNIFICANT ACCOUNTING POLICIES |
| (a) | Investment Valuation–Under procedures approved by the Fund’s Board of Directors (the “Board”), the Board has designated the determination of fair value of the Fund’s portfolio investments to Lord, Abbett & Co. LLC (“Lord Abbett”), as valuation designee. Accordingly, Lord Abbett is responsible for, among other things, assessing and managing valuation risks, establishing, applying and testing fair value methodologies, and evaluating pricing services. Lord Abbett has formed a Pricing Committee that performs these responsibilities on behalf of Lord Abbett, administers the pricing and valuation of portfolio investments and ensures that prices utilized reasonably reflect fair value. Among other things, these procedures allow Lord Abbett, subject to Board oversight, to utilize independent pricing services, quotations from securities and financial instrument dealers and other market sources to determine fair value. |
| | |
| | Securities actively traded on any recognized U.S. or non-U.S. exchange or on The NASDAQ Stock Market LLC are valued at the last sale price or official closing price on the exchange or system on which they are principally traded. Events occurring after the close of trading on non-U.S. exchanges may result in adjustments to the valuation of foreign securities to reflect their fair value as of the close of regular trading on the New York Stock Exchange. When valuing foreign equity securities that meet certain criteria, the Board has approved the use of an independent fair valuation service that values such securities to reflect market trading that occurs after the close of the applicable foreign markets of comparable securities or other instruments that correlate to the fair-valued securities. Unlisted equity securities are valued at the last quoted sale price or, if no sale price is available, at the mean between the most recently quoted bid and ask prices. |
| | |
| | Securities for which prices are not readily available are valued at fair value as determined by the Pricing Committee. The Pricing Committee considers a number of factors, including observable and unobservable inputs, when arriving at fair value. The Pricing Committee may |
16
Notes to Financial Statements (continued)
| | use related or comparable assets or liabilities, recent transactions, market multiples, book values, and other relevant information to determine the fair value of portfolio investments. The Board or a designated committee thereof periodically reviews reports that may include fair value determinations made by the Pricing Committee, related market activity, inputs and assumptions, and retrospective comparison of prices of subsequent purchases and sales transactions to fair value determinations made by the Pricing Committee. |
| | |
| | Investments in open-end money market mutual funds are valued at their NAV as of the close of each business day. Short-term securities with 60 days or less remaining to maturity are valued using the amortized cost method, which approximates fair value. |
| | |
| (b) | Security Transactions–Security transactions are recorded as of the date that the securities are purchased or sold (trade date). Realized gains and losses on sales of portfolio securities are calculated using the identified-cost method. |
| | |
| (c) | Investment Income–Dividend income is recorded on the ex-dividend date. Interest income is recorded on the accrual basis as earned. Discounts are accreted and premiums are amortized using the effective interest method and are included in Interest and other, if applicable, on the Statement of Operations. Withholding taxes on foreign dividends have been provided for in accordance with the applicable country’s tax rules and rates. |
| | |
| (d) | Income Taxes–It is the policy of the Fund to meet the requirements of Subchapter M of the Internal Revenue Code applicable to regulated investment companies and to distribute substantially all taxable income and capital gains to its shareholders. Therefore, no income tax provision is required. |
| | |
| | The Fund files U.S. federal and various state and local tax returns. No income tax returns are currently under examination. The statute of limitations on the Fund’s filed U.S. federal tax returns remains open for the fiscal years ended December 31, 2019 through December 31, 2022. The statutes of limitations on the Fund’s state and local tax returns may remain open for an additional year depending upon the jurisdiction. |
| | |
| (e) | Expenses–Expenses incurred by the Company that do not specifically relate to an individual fund are generally allocated to the funds within the Company on a pro rata basis by relative net assets. |
| | |
| (f) | Foreign Transactions–The books and records of the Fund are maintained in U.S. dollars and transactions denominated in foreign currencies are recorded in the Fund’s records at the rate prevailing when earned or recorded. Asset and liability accounts that are denominated in foreign currencies are adjusted daily to reflect current exchange rates and any unrealized gain (loss), if applicable, is included in Net change in unrealized appreciation/depreciation on translation of assets and liabilities denominated in foreign currencies on the Fund’s Statement of Operations. The resultant exchange gains and losses upon settlement of such transactions, if applicable, are included in Net realized gain (loss) on foreign currency related transactions on the Fund’s Statement of Operations. The Fund does not isolate that portion of the results of operations arising as a result of changes in the foreign exchange rates from the changes in market prices of the securities. |
| | |
| | The Fund uses foreign currency exchange contracts to facilitate transactions in foreign-denominated securities. Losses from these transactions may arise from changes in the value of the foreign currency or if the counterparties do not perform under the contracts’ terms. |
| | |
| (g) | Repurchase Agreements–The Fund may enter into repurchase agreements with respect to securities. A repurchase agreement is a transaction in which a fund acquires a security and |
17
Notes to Financial Statements (continued)
| | simultaneously commits to resell that security to the seller (a bank or securities dealer) at an agreed-upon price on an agreed-upon date. The Fund requires at all times that the repurchase agreement be collateralized by cash, or by securities of the U.S. Government, its agencies, its instrumentalities, or U.S. Government sponsored enterprises having a value equal to, or in excess of, the value of the repurchase agreement (including accrued interest). If the seller of the agreement defaults on its obligation to repurchase the underlying securities at a time when the fair value of these securities has declined, the Fund may incur a loss upon disposition of the securities. |
| | |
| (h) | Fair Value Measurements–Fair value is defined as the price that the Fund would receive upon selling an investment or transferring a liability in an orderly transaction to an independent buyer in the principal or most advantageous market of the investment. A three-tier hierarchy is used to maximize the use of observable market data and minimize the use of unobservable inputs and to establish classification of fair value measurements for disclosure purposes. Inputs refer broadly to the assumptions that market participants would use in pricing the asset or liability, including assumptions about risk - for example, the risk inherent in a particular valuation technique used to measure fair value (such as a pricing model) and/or the risk inherent in the inputs to the valuation technique. Inputs may be observable or unobservable. Observable inputs reflect the assumptions market participants would use in pricing the asset or liability. Observable inputs are based on market data obtained from sources independent of the reporting entity. Unobservable inputs reflect the reporting entity’s own assumptions about the assumptions market participants would use in pricing the asset or liability. Unobservable inputs are based on the best information available in the circumstances. The three-tier hierarchy classification is determined based on the lowest level of inputs that is significant to the fair value measurement, and is summarized in the three broad Levels listed below: |
| | • | Level 1 – | unadjusted quoted prices in active markets for identical investments; |
| | • | Level 2 – | other significant observable inputs (including quoted prices for similar investments, interest rates, prepayment speeds, credit risk, etc.); and |
| | • | Level 3 – | significant unobservable inputs (including the Fund’s own assumptions in determining the fair value of investments). |
| | A summary of inputs used in valuing the Fund’s investments as of December 31, 2022 and, if applicable, Level 3 rollforwards for the fiscal year then ended is included in the Fund’s Schedule of Investments. |
| | |
| | Changes in valuation techniques may result in transfers into or out of an assigned level within the three-tier hierarchy. The inputs or methodology used for valuing securities are not necessarily an indication of the risk associated with investing in those securities. |
| 3. | MANAGEMENT FEE AND OTHER TRANSACTIONS WITH AFFILIATES |
Management Fee
The Company has a management agreement with Lord Abbett, pursuant to which Lord Abbett provides the Fund with investment management services and executive and other personnel, provides office space and pays for ordinary and necessary office and clerical expenses relating to research and statistical work and supervision of the Fund’s investment portfolio. The management fee is accrued daily and payable monthly.
18
Notes to Financial Statements (continued)
The management fee is based on the Fund’s average daily net assets at the following annual rate:
| First $200 million | .75% |
| Next $300 million | .65% |
| Over $500 million | .50% |
For the fiscal year ended December 31, 2022, the effective management fee, net of any applicable waivers, was at an annualized rate of 0.63% of the Fund’s average daily net assets.
In addition, Lord Abbett provides certain administrative services to the Fund pursuant to an Administrative Services Agreement in return for a fee at an annual rate of .04% of the Fund’s average daily net assets. The fund administration fee is accrued daily and payable monthly. Lord Abbett voluntarily waived $35,367 of fund administration fees during the fiscal year ended December 31, 2022.
For the fiscal year ended December 31, 2022 and continuing through April 30, 2023, Lord Abbett has contractually agreed to waive its fees and reimburse expenses to the extent necessary to limit total net annual operating expenses to an annual rate of 1.08%. This agreement may be terminated only upon the approval of the Board.
The Company, on behalf of the Fund, has entered into services arrangements with certain insurance companies. Under these arrangements, certain insurance companies will be compensated up to .25% of the average daily net asset value (“NAV”) of the Fund’s Class VC Shares held in the insurance company’s separate account to service and maintain the Variable Contract owners’ accounts. This amount is included in non 12b-1 service fees on the Statement of Operations. The Fund may also compensate certain insurance companies, third-party administrators and other entities for providing recordkeeping, sub-transfer agency and other administrative services to the Fund. This amount is included in Shareholder servicing on the Statement of Operations.
One Director and certain of the Company’s officers have an interest in Lord Abbett.
| 4. | DISTRIBUTIONS AND CAPITAL LOSS CARRYFORWARDS |
Dividends from net investment income, if any, are declared and paid at least semi-annually. Taxable net realized gains from investment transactions, reduced by allowable capital loss carryforwards, if any, are declared and distributed to shareholders at least annually. The capital loss carryforward amount, if any, is available to offset future net capital gains. Dividends and distributions to shareholders are recorded on the ex-dividend date. The amounts of dividends and distributions from net investment income and net realized capital gains are determined in accordance with federal income tax regulations, which may differ from U.S. GAAP. These book/tax differences are either considered temporary or permanent in nature. To the extent these differences are permanent in nature, such amounts are reclassified within the components of net assets based on their federal tax basis treatment; temporary differences do not require reclassification. Dividends and distributions that exceed earnings and profits for tax purposes are reported as a tax return of capital.
The tax character of distributions paid during the fiscal years ended December 31, 2022 and 2021 was as follows:
| | | Year Ended | | | Year Ended | |
| | | 12/31/2022 | | | 12/31/2021 | |
| Distributions paid from: | | | | | | | | |
| Ordinary income | | $ | 2,032,225 | | | $ | 13,393,132 | |
| Net long-term capital gains | | | 24,259,550 | | | | 1,839,146 | |
| Total distributions paid | | $ | 26,291,775 | | | $ | 15,232,278 | |
19
Notes to Financial Statements (continued)
As of December 31, 2022, the components of accumulated gains on a tax-basis were as follows:
| Undistributed ordinary income — net | | $ | 6,369 | |
| Undistributed long-term capital gains | | | 794,175 | |
| Total undistributed earnings | | | 800,544 | |
| Temporary differences | | | (45,876 | ) |
| Unrealized losses — net | | | (175,747 | ) |
| Total accumulated gains — net | | $ | 578,921 | |
As of December 31, 2022, the aggregate unrealized security gains and losses on investments and other financial instruments based on cost for U.S. federal income tax purposes were as follows:
| Tax cost | | $ | 175,992,738 | |
| Gross unrealized gain | | | 14,752,697 | |
| Gross unrealized loss | | | (14,926,716 | ) |
| Net unrealized security loss | | $ | (174,019 | ) |
The difference between book-basis and tax-basis unrealized gains (losses) is attributable to the tax treatment of other financial instruments, certain securities and wash sales.
| 5. | PORTFOLIO SECURITIES TRANSACTIONS |
Purchases and sales of investment securities (excluding short-term investments) for the fiscal year ended December 31, 2022 were as follows:
| Purchases | Sales |
| $128,999,191 | $231,132,387 |
There were no purchases or sales of U.S. Government securities for the fiscal year ended December 31, 2022.
The Fund is permitted to purchase and sell securities (“cross-trade”) from and to other Lord Abbett funds or client accounts pursuant to procedures approved by the Board in compliance with Rule 17a-7 under the Act (the “Rule”). Each cross-trade is executed at a fair market price in compliance with provisions of the Rule. For the fiscal year ended December 31, 2022, the Fund engaged in cross-trade purchases of $49,550.
| 6. | DISCLOSURES ABOUT OFFSETTING ASSETS AND LIABILITIES |
The Financial Accounting Standards Board requires disclosures intended to help better assess the effect or potential effect of offsetting arrangements on a fund’s financial position. The following tables illustrate gross and net information about recognized assets and liabilities eligible for offset in the Statement of Assets and Liabilities; and disclose such amounts subject to an enforceable master netting agreement or similar agreement, by the counterparty. A master netting agreement is an agreement between a fund and a counterparty which provides for the net settlement of amounts owed under all contracts traded under that agreement, as well as cash collateral, through a single payment by one party to the other in the event of default on or termination of any one contract. The Fund’s accounting policy with respect to balance sheet offsetting is that, absent an event of default by the counterparty or a termination of the agreement, the master netting agreement does not result in an offset of reported amounts of financial assets and liabilities in the Statement of Assets and Liabilities across transactions between the Fund and the applicable counterparty:
20
Notes to Financial Statements (continued)
| Description | Gross Amounts of
Recognized Assets | Gross Amounts
Offset in the
Statement of Assets
and Liabilities | Net Amounts of
Assets Presented
in the Statement of
Assets and Liabilities |
| Repurchase Agreements | $3,302,194 | $ – | $3,302,194 |
| Total | $3,302,194 | $ – | $3,302,194 |
| | | Net Amount
of Assets
Presented in | | Amounts Not Offset in the
Statement of Assets and Liabilities | | | |
| Counterparty | | the Statement
of Assets and
Liabilities | | Financial
Instruments | | Cash
Collateral
Received(a) | | Securities
Collateral
Received(a) | | | Net
Amount(b) |
| Fixed Income Clearing Corp. | | $3,302,194 | | $ – | | $ – | | $(3,302,194 | ) | | $ – |
| Total | | $3,302,194 | | $ – | | $ – | | $(3,302,194 | ) | | $ – |
| (a) | Collateral disclosed is limited to an amount not to exceed 100% of the net amount of assets (liabilities) presented in the Statement of Assets and Liabilities, for each respective counterparty. |
| (b) | Net amount represents the amount owed to the Fund by the counterparty as of December 31, 2022. |
| 7. | DIRECTORS’ REMUNERATION |
The Company’s officers and one Director, who are associated with Lord Abbett, do not receive any compensation from the Company for serving in such capacities. Independent Directors’ fees are allocated among all Lord Abbett-sponsored funds based on the net assets of each fund. There is an equity-based plan available to all Independent Directors under which Independent Directors may elect to defer receipt of a portion of Directors’ fees. The deferred amounts are treated as though equivalent dollar amounts had been invested in the Fund. Such amounts and earnings accrued thereon are included in Directors’ fees on the Statement of Operations and in Directors’ fees payable on the Statement of Assets and Liabilities and are not deductible for U.S. federal income tax purposes until such amounts are paid.
The Company has entered into an arrangement with its transfer agent and custodian, whereby credits realized as a result of uninvested cash balances are used to reduce a portion of the Fund’s expenses.
For the period ended August 3, 2022, the Fund and certain other funds managed by Lord Abbett (collectively, the “Participating Funds”) entered into a syndicated line of credit facility with various lenders for $1.275 billion (the “Syndicated Facility”) whereas State Street Bank and Trust Company (“SSB”) participated as a lender and as agent for the lenders. The Participating Funds were subject to graduated borrowing limits of one-third of fund net assets (if fund net assets are less than $750 million), $250 million, $300 million, $700 million, or $1 billion, based on past borrowings and likelihood of future borrowings, among other factors.
Effective August 4, 2022, the Participating Funds entered into a Syndicated Facility with various lenders for $1.625 billion whereas SSB participates as a lender and as agent for the lenders. The Participating Funds were subject to graduated borrowing limits of one-third of fund net assets (if fund net assets are less than $750 million), $250 million, $300 million, $700 million, or $1 billion, based on past borrowings and likelihood of future borrowings, among other factors.
21
Notes to Financial Statements (continued)
For the period ended August 3, 2022, the Participating Funds were party to an additional line of credit facility with SSB for $330 million (the “Bilateral Facility”), $250 million committed and $80 million uncommitted. Under the Bilateral Facility, the Participating Funds are subject to graduated borrowing limits of one-third of fund net assets (if net assets are less than $750 million), $250 million, $300 million, or $330 million, based on past borrowings and likelihood of future borrowings, among other factors.
Effective August 4, 2022, the Participating Funds are party to an additional uncommitted line of credit facility with SSB for $330 million. Under the Bilateral Facility, the Participating Funds are subject to borrowing limits of one-third of fund net assets (if net assets are less than $750 million), or $250 million based on past borrowings and likelihood of future borrowings, among other factors.
The Syndicated Facility and the Bilateral Facility are to be used for temporary or emergency purposes as additional sources of liquidity to satisfy redemptions.
For the year ended December 31, 2022, the Fund did not utilize the Syndicated Facility or Bilateral Facility.
| 10. | INTERFUND LENDING PROGRAM |
Pursuant to an exemptive order issued by the U.S. Securities and Exchange Commission (“SEC exemptive order”) certain registered open-end management investment companies managed by Lord Abbett, including the Fund, participate in a joint lending and borrowing program (the “Interfund Lending Program”). The SEC exemptive order allows the funds that participate in the Interfund Lending Program to borrow money from and lend money to each other for temporary or emergency purposes subject to the limitations and conditions.
For the fiscal year ended December 31, 2022, the Fund did not participate as a borrower or lender in the Interfund Lending Program.
| 11. | CUSTODIAN AND ACCOUNTING AGENT |
SSB is the Company’s custodian and accounting agent. SSB performs custodial, accounting and recordkeeping functions relating to portfolio transactions and calculating the Fund’s NAV.
| 12. | SECURITIES LENDING AGREEMENT |
The Fund has established a securities lending agreement with Citibank, N.A. for the lending of securities to qualified brokers in exchange for securities or cash collateral equal to at least the market value of securities loaned, plus interest, if applicable. Cash collateral is invested in an approved money market fund. In accordance with the Fund’s securities lending agreement, the market value of securities on loan is determined each day at the close of business and any additional collateral required to cover the value of securities on loan is delivered to the Fund on the next business day. As with other extensions of credit, the Fund may experience a delay in the recovery of its securities or incur a loss should the borrower of the securities breach its agreement with the Fund or the borrower becomes insolvent at a time when the collateral is insufficient to cover the cost of repurchasing securities on loan. Any income earned from securities lending is included in Securities lending net income on the Fund’s Statement of Operations.
The initial collateral received by the Fund is required to have a value equal to at least 100% of the market value of the securities loaned. The collateral must be marked-to-market daily to cover increases in the market value of the securities loaned (or potentially a decline in the value of the collateral). In general, the risk of borrower default will be borne by Citibank, N.A.; the Fund will bear
22
Notes to Financial Statements (continued)
the risk of loss with respect to the investment of the cash collateral. The advantage of such loans is that the Fund continues to receive income on loaned securities while receiving a portion of any securities lending fees and earning returns on the cash amounts which may be reinvested for the purchase of investments in securities.
As of December 31, 2022 the Fund did not loan any securities.
The Fund is subject to the general risks and considerations associated with equity investing, as well as the particular risks associated with value and mid-sized company stocks. The value of an investment will fluctuate in response to movements in the equity securities market in general and to the changing prospects of individual companies in which the Fund invests. The market may, over an extended period of time, fail to recognize the intrinsic value of particular value stocks the Fund may hold. Value investing also is subject to the risk that the company judged to be undervalued may actually be appropriately priced or even overpriced. The mid-sized company stocks in which the Fund invests may be less able to weather economic shifts or other adverse developments than those of larger, more established companies. Although investing in mid-sized companies offers the potential for above average returns, these companies may not succeed and the value of their stock could decline significantly. Mid-sized companies also may fall out of favor relative to larger companies in certain market cycles, causing the Fund to incur losses or under perform. In addition, if the Fund’s assessment of a company’s value or prospects for exceeding earnings expectations or market conditions is wrong, the Fund could suffer losses or produce poor performance relative to other funds, even in a rising market.
Due to the Fund’s investment exposure to foreign companies and American Depositary Receipts, the Fund may experience increased market, industry and sector, liquidity, currency, political, information, and other risks. The securities of foreign companies also may be subject to inadequate exchange control regulations, the imposition of economic sanctions or other government restrictions, higher transaction and other costs, and delays in settlement to the extent they are traded on non-U.S. exchanges or markets.
Geopolitical and other events (e.g., wars, terrorism, natural disasters, epidemics or pandemics such as the COVID-19 outbreak which began in late 2019) may disrupt securities markets and adversely affect global economies and markets, thereby decreasing the value of the Fund’s investments. Market disruptions can also prevent the Fund from implementing its investment strategies and achieving its investment objective.
The transmission of COVID-19 and efforts to contain its spread have resulted in, among other things, border closings and other significant travel restrictions and disruptions, significant disruptions to business operations, supply chains and customer activity, lower consumer demand for goods and services, event cancellations and restrictions, service cancellations, reductions and other changes, significant challenges in healthcare service preparation and delivery, and prolonged quarantines, as well as general concern and uncertainty. The impact of the COVID-19 outbreak has, and could again, negatively affect the global economy, the economies of individual countries, and the financial performance of individual issuers, sectors, industries, asset classes, and markets in significant and unforeseen ways.
The COVID-19 pandemic and its effects may last for an extended period of time. Although the economic fallout of COVID-19 is difficult to predict, it has contributed to and is likely to continue to contribute to, market volatility, inflation and systemic economic weakness. The foregoing could disrupt the operations of the Fund and its service providers, adversely affect the value and liquidity
23
Notes to Financial Statements (concluded)
of the Fund’s investments, and negatively impact the Fund’s performance and your investment in the Fund.
These factors, and others, can affect the Fund’s performance.
| 14. | SUMMARY OF CAPITAL TRANSACTIONS |
Transactions in shares of capital stock were as follows:
| | | Year Ended
December 31, 2022 | | | Year Ended
December 31, 2021 | |
| Shares sold | | | 2,985,626 | | | | 174,831 | |
| Reinvestment of distributions | | | 1,719,970 | | | | 773,212 | |
| Shares reacquired | | | (8,927,942 | ) | | | (3,473,784 | ) |
| Decrease | | | (4,222,346 | ) | | | (2,525,741 | ) |
24
Report of Independent Registered Public Accounting Firm
To the shareholders and the Board of Directors of Lord Abbett Series Fund, Inc.
Opinion on the Financial Statements and Financial Highlights
We have audited the accompanying statement of assets and liabilities, including the schedule of investments, of Fundamental Equity Portfolio, one of the funds constituting Lord Abbett Series Fund, Inc. (the “Fund”), as of December 31, 2022, the related statement of operations for the year then ended, the statements of changes in net assets for each of the two years in the period then ended, the financial highlights for each of the five years in the period then ended, and the related notes. In our opinion, the financial statements and financial highlights present fairly, in all material respects, the financial position of Fundamental Equity Portfolio of the Fund as of December 31, 2022, and the results of its operations for the year then ended, the changes in its net assets for each of the two years in the period then ended, and the financial highlights for each of the five years in the period then ended in conformity with accounting principles generally accepted in the United States of America.
Basis for Opinion
These financial statements and financial highlights are the responsibility of the Fund’s management. Our responsibility is to express an opinion on the Fund’s financial statements and financial highlights based on our audits. We are a public accounting firm registered with the Public Company Accounting Oversight Board (United States) (PCAOB) and are required to be independent with respect to the Fund in accordance with the U.S. federal securities laws and the applicable rules and regulations of the Securities and Exchange Commission and the PCAOB.
We conducted our audits in accordance with the standards of the PCAOB. Those standards require that we plan and perform the audit to obtain reasonable assurance about whether the financial statements and financial highlights are free of material misstatement, whether due to error or fraud. The Fund is not required to have, nor were we engaged to perform, an audit of its internal control over financial reporting. As part of our audits we are required to obtain an understanding of internal control over financial reporting but not for the purpose of expressing an opinion on the effectiveness of the Fund’s internal control over financial reporting. Accordingly, we express no such opinion.
Our audits included performing procedures to assess the risks of material misstatement of the financial statements and financial highlights, whether due to error or fraud, and performing procedures that respond to those risks. Such procedures included examining, on a test basis, evidence regarding the amounts and disclosures in the financial statements and financial highlights. Our audits also included evaluating the accounting principles used and significant estimates made by management, as well as evaluating the overall presentation of the financial statements and financial highlights. Our procedures included confirmation of securities owned as of December 31, 2022, by correspondence with the custodian and brokers; when replies were not received from brokers, we performed other auditing procedures. We believe that our audits provide a reasonable basis for our opinion.
DELOITTE & TOUCHE LLP
New York, New York
February 14, 2023
We have served as the auditor of one or more Lord Abbett Family of Funds’ investment companies since 1932.
25
Basic Information About Management
The Board is responsible for the management of the business and affairs of the Fund in accordance with the laws of the state of organization. The Board elects officers who are responsible for the day-to-day operations of the Fund and who execute policies authorized by the Board. The Board also approves an investment adviser to the Fund and continues to monitor the cost and quality of the services the investment adviser provides, and annually considers whether to renew the contract with the investment adviser. Generally, each Board member holds office until his/her successor is elected and qualified or until his/her earlier resignation or removal, as provided in the Fund’s organizational documents.
Lord, Abbett & Co. LLC (“Lord Abbett”), a Delaware limited liability company, is the Fund’s investment adviser. Designated Lord Abbett personnel are responsible for the day-to-day management of the Fund.
Independent Board Members
The following Independent Board Members also are board members of each of the 15 investment companies in the Lord Abbett Family of Funds, which consist of 63 investment portfolios.
Name, Address and
Year of Birth | | Current Position and
Length of Service
with the Fund | | Principal Occupation and Other Directorships
During the Past Five Years |
Evelyn E. Guernsey
Lord, Abbett & Co. LLC
c/o Legal Dept.
90 Hudson Street
Jersey City, NJ 07302
(1955) | | Board member since 2011;
Vice Chair since 2023 | | Principal Occupation: None. Other Directorships: None. |
| | | | | |
Julie A. Hill
Lord, Abbett & Co. LLC
c/o Legal Dept.
90 Hudson Street
Jersey City, NJ 07302
(1946) | | Board member since 2004 | | Principal Occupation: Owner and CEO of The Hill Company, a business consulting firm (since 1998). Other Directorships: Previously served as director of Anthem, Inc., a health benefits company (1994–2021). |
| | | | | |
Kathleen M. Lutito
Lord, Abbett & Co. LLC
c/o Legal Dept.
90 Hudson Street
Jersey City, NJ 07302
(1963) | | Board member since 2017 | | Principal Occupation: President and Chief Investment Officer of CenturyLink Investment Management Company (since 2006). Other Directorships: None. |
| | | | | |
James M. McTaggart
Lord, Abbett & Co. LLC
c/o Legal Dept.
90 Hudson Street
Jersey City, NJ 07302
(1947) | | Board member since 2012 | | Principal Occupation: Owner of McTaggart LLC (since 2011). Other Directorships: None. |
| | | | | |
Charles O. Prince
Lord, Abbett & Co. LLC
c/o Legal Dept.
90 Hudson Street
Jersey City, NJ 07302
(1950) | | Board member since 2019 | | Principal Occupation: None. Formerly Chair and Chief Executive Officer, Citigroup, Inc. (Retired 2007). Other Directorships: Previously served as director of Johnson & Johnson (2005–2022). Previously served as director of Xerox Corporation (2007–2018). |
26
Basic Information About Management (continued)
Name, Address and
Year of Birth | | Current Position and
Length of Service
with the Fund | | Principal Occupation and Other Directorships
During the Past Five Years |
Karla M. Rabusch
Lord, Abbett & Co. LLC
c/o Legal Dept.
90 Hudson Street
Jersey City, NJ 07302
(1959) | | Board member since 2017 | | Principal Occupation: President and Director of Wells Fargo Funds Management, LLC (2003–2017); President of Wells Fargo Funds (2003–2016). Other Directorships: None. |
| | | | | |
Lorin Patrick Taylor Radtke
Lord, Abbett & Co. LLC
c/o Legal Dept.
90 Hudson Street
Jersey City, NJ 07302
(1968) | | Board member since 2021 | | Principal Occupation: Partner and Co-Founder of M Seven 8 Partners LLC, a venture capital firm (since 2016). Formerly Partner, Goldman Sachs (1992–2016). Other Directorships: Currently serves as director of Assured Guaranty (2021–Present), Virtual Combine (2018–Present), and Mariposa Family Learning Center (2021–Present). Previously served as director of SummerMoon Coffee (2022). |
| | | | | |
Leah Song Richardson
Lord, Abbett & Co. LLC
c/o Legal Dept.
90 Hudson Street
Jersey City, NJ 07302
(1966) | | Board member since 2021 | | Principal Occupation: President of Colorado College (since 2021) and was formerly Dean at University of California, Irvine–School of Law (2017–2021) and formerly Professor of Law at University of California, Irvine (2014–2017). Other Directorships: None. |
| | | | | |
Mark A. Schmid
Lord, Abbett & Co. LLC
c/o Legal Dept.
90 Hudson Street
Jersey City, NJ 07302
(1959) | | Board member since 2016 | | Principal Occupation: Vice President and Chief Investment Officer of the University of Chicago (2009–2021). Other Directorships: None. |
| | | | | |
James L.L. Tullis
Lord, Abbett & Co. LLC
c/o Legal Dept.
90 Hudson Street
Jersey City, NJ 07302
(1947) | | Board member since 2006;
Chair since 2017 | | Principal Occupation: Chair of Tullis Health Investors – FL LLC (since 2018); CEO of Tullis–Dickerson and Co. Inc., a venture capital management firm (1990–2016). Other Directorships: Currently serves as Chair of Crane Co. (since 2020, director since 1998), Director of Alphatec Spine (since 2018), and Director of Exagen Inc. (since 2019). Previously served as director of electroCore, Inc. (2018–2020). |
Interested Board Members
Mr. Sieg is affiliated with Lord Abbett and is an “interested person” of the Fund as defined in the Act. Mr. Sieg is a board member of each of the 15 investment companies in the Lord Abbett Family of Funds, which consist of 63 investment portfolios. Mr. Sieg is an officer of the Lord Abbett Family of Funds.
Name, Address and
Year of Birth | | Current Position and
Length of Service
with the Fund | | Principal Occupation and Other Directorships
During the Past Five Years |
Douglas B. Sieg
Lord, Abbett & Co. LLC
90 Hudson Street
Jersey City, NJ 07302
(1969) | | Board member since 2016 | | Principal Occupation: Managing Partner of Lord Abbett (since 2018) and was formerly Head of Client Services, joined Lord Abbett in 1994. Other Directorships: None. |
27
Basic Information About Management (continued)
Officers
None of the officers listed below have received compensation from the Fund. All of the officers of the Fund also may be officers of the other Lord Abbett Funds and maintain offices at 90 Hudson Street, Jersey City, NJ 07302. Unless otherwise indicated, the position(s) and title(s) listed under the “Principal Occupation During the Past Five Years” column indicate each officer’s position(s) and title(s) with Lord Abbett. Each officer serves for an indefinite term (i.e., until his or her death, resignation, retirement, or removal).
Name and
Year of Birth | | Current Position
with the Fund | | Length of Service
of Current
Position | | Principal Occupation
During the Past Five Years |
Douglas B. Sieg
(1969) | | President and Chief Executive Officer | | Elected as President and Chief Executive Officer in 2018 | | Managing Partner of Lord Abbett (since 2018) and was formerly Head of Client Services, joined Lord Abbett in 1994. |
| | | | | | | |
Jackson C. Chan
(1964) | | AML Compliance Officer | | Elected in 2018 | | Deputy Chief Compliance Officer and Director of Regulatory Affairs, joined Lord Abbett in 2014. |
| | | | | | | |
Michael J. Hebert
(1976) | | Chief Financial Officer and Treasurer | | Elected as Chief Financial Officer and Treasurer in 2021 | | Head of Global Fund Finance, joined Lord Abbett in 2021 and was formerly Vice President at Eaton Vance Management (EVM) (2014-2021) and Calvert Research & Management (CRM) (2016-2021), and Assistant Treasurer of registered investment companies managed, advised or administered by EVM and CRM during such years. |
| | | | | | | |
Jennifer C. Karam
(1970) | | Vice President and Assistant Secretary | | Elected in 2022 | | Partner and Senior Deputy General Counsel, joined Lord Abbett in 2012. |
| | | | | | | |
Joseph M. McGill
(1962) | | Chief Compliance Officer | | Elected in 2014 | | Partner and Chief Compliance Officer, joined Lord Abbett in 2014. |
| | | | | | | |
Parker J. Milender
(1989) | | Vice President and Assistant Secretary | | Elected in 2023 | | Counsel, joined Lord Abbett in 2021 and was formerly an Associate at Milbank LLP (2017–2021). |
| | | | | | | |
Matthew A. Press
(1987) | | Vice President and Assistant Secretary | | Elected in 2023 | | Counsel, joined Lord Abbett in 2022 and was formerly an Associate at Clifford Chance US LLP (2014–2022). |
| | | | | | | |
Lawrence B. Stoller
(1963) | | Vice President, Secretary and Chief Legal Officer | | Elected as Vice President and Secretary in 2007 and Chief Legal Officer in 2019 | | Partner and General Counsel, joined Lord Abbett in 2007. |
28
Basic Information About Management (concluded)
Name and
Year of Birth | | Current Position
with the Fund | | Length of Service
of Current
Position | | Principal Occupation
During the Past Five Years |
Victoria Zozulya
(1983) | | Vice President and Assistant Secretary | | Elected in 2022 | | Counsel, joined Lord Abbett in 2022 and was formerly Senior Director and Counsel at Equitable (2018-2022) and Assistant General Counsel at Neuberger Berman (2014-2018). |
| | | | | | | |
Nicholas D. Emguschowa
(1986) | | Data Protection Officer | | Elected in 2022 | | Assistant General Counsel, joined Lord Abbett in 2018 and was formerly Associate at Shearman & Sterling (2014-2018). |
Please call 888-522-2388 for a copy of the statement of additional information, which contains further information about the Fund’s Board members. It is available free upon request.
29
Householding
The Company has adopted a policy that allows it to send only one copy of the Fund’s prospectus, proxy material, annual report and semiannual report (or related notice of internet availability of annual report and semiannual report) to certain shareholders residing at the same “household.” This reduces Fund expenses, which benefits you and other shareholders. If you need additional copies or do not want your mailings to be “householded,” please call Lord Abbett at 888-522-2388 or send a written request with your name, the name of your fund or funds and your account number or numbers to Lord Abbett Family of Funds, P.O. Box 219336, Kansas City, MO 64121.
Proxy Voting Policies, Procedures and Records
A description of the policies and procedures that Lord Abbett uses to vote proxies related to the Fund’s portfolio securities, and information on how Lord Abbett voted the Fund’s proxies during the 12-month period ended June 30 are available without charge, upon request, (i) by calling 888-522-2388; (ii) on Lord Abbett’s website at www.lordabbett.com; and (iii) on the Securities and Exchange Commission’s (“SEC”) website at www.sec.gov.
Shareholder Reports and Quarterly Portfolio Disclosure
The Fund is required to file its complete schedule of portfolio holdings with the SEC for its first and third fiscal quarters as an attachment to Form N-PORT. Copies of the filings are available without charge, upon request on the SEC’s website at www.sec.gov and may be available by calling Lord Abbett at 888-522-2388.
Tax Information (unaudited) For corporate shareholders, 100% of the Fund’s ordinary income distributions qualified for the dividends received deduction. Additionally, of the distributions paid to the shareholders during the fiscal year ended December 31, 2022, $24,259,550 represent long-term capital gains. |
30


| This report, when not used for the general information of shareholders of the Fund, is to be distributed only if preceded or accompanied by a current fund prospectus. | | | | |
| | | | | |
Lord Abbett mutual fund shares are distributed by LORD ABBETT DISTRIBUTOR LLC. | | Lord Abbett Series Fund, Inc. Fundamental Equity Portfolio | | SFFE-PORT-2
(02/23) |

LORD ABBETT
ANNUAL REPORT
Lord Abbett
Series Fund—Growth and Income Portfolio
For the fiscal year ended December 31, 2022
Table of Contents
Lord Abbett Series Fund – Growth and Income Portfolio
Annual Report
For the fiscal year ended December 31, 2022

From left to right: James L.L. Tullis, Independent Chair of the Lord Abbett Funds and Douglas B. Sieg, Director, President and Chief Executive Officer of the Lord Abbett Funds. | | Dear Shareholders: We are pleased to provide you with this overview of the performance of Lord Abbett Series Fund – Growth and Income Portfolio for the fiscal year ended December 31, 2022. On this page and the following pages, we discuss the major factors that influenced fiscal year performance. For detailed and timely information about the Fund, please visit our website at www.lordabbett.com, where you can also access the quarterly commentaries that provide updates on the Fund’s performance and other portfolio related updates. Thank you for investing in Lord Abbett mutual funds. We value the trust that you place in us and look forward to serving your investment needs in the years to come. Best regards, 
Douglas B. Sieg Director, President and Chief Executive Officer |
For the fiscal year ended December 31, 2022, the Fund returned –9.44%, reflecting performance at the net asset value (NAV) of Class VC shares with all distributions reinvested, compared to its benchmark, the Russell 1000® Value Index*, which returned –7.54% over the same period.
U.S. markets faced many challenges throughout the twelve-month period ending December 31, 2022, including the spread of the Omicron variant of COVID-19, supply chain dislocations, labor shortages, inflationary pressures, tighter fiscal and monetary policy, and Russia’s invasion of Ukraine. The Dow Jones Industrial Average
and S&P 500® Index fell –6.86% and –18.11%, respectively, while the tech-heavy Nasdaq Composite suffered even greater losses, falling –32.54%. Value stocks1 significantly outperformed growth stocks2 (–7.98% vs –28.97%), while large cap stocks3 slightly edged out small cap stocks4 (–19.13% vs –20.44%).
To begin the twelve-month period, U.S. markets grappled with COVID-19 cases hitting the highest levels of the pandemic, rising above 580,000 new cases in the last week of December 2021, more than doubling the previous record high. The spike in cases occurred shortly after the World Health
1
Organization designated the newly discovered Omicron variant as a “variant of concern”, leading to one of the largest selloffs of U.S. risk assets since the start of the pandemic, amid fears that the world would succumb to a new wave of infections. However, negative sentiment quickly reversed as cases proved to be generally less severe than prior strains. Market sentiment also increased after the Center for Disease Control shortened its suggested isolation policy for those infected from 10 days to five.
Inflationary concerns began to take focus towards the end of 2021 and became a dominant story throughout the period. Headline consumer price index (CPI) readings had hovered a little above 5% year-over-year for most of 2021, which led investors to question whether this period of rising prices would be more persistent than originally thought. This debate was intensified by the December 2021 headline CPI rising 7.0% year-over-year, the fastest pace since 1982. The sharp increase in prices was generally due to supply and demand imbalances across multiple industries, led initially by energy, food, and used cars. Inflation readings continued to climb throughout the first half of 2022, peaking at 9.1% year-over-year in June. Increases in energy costs were even more profound, rising by more than 30% year-over-year by the end of June. The energy sector, which had been subject to rising consumer demand as global economies reopened from lockdowns induced by COVID-19, faced added friction with Russia’s invasion of Ukraine since Russia has been a large exporter of oil and certain minerals. Various
sanctions imposed on Russia from Western nations led to a surge in commodity prices, with crude oil reaching over $100 per barrel for the first time since 2014.
The surge in prices forced the U.S. Federal Reserve (Fed) into a more aggressive approach to combating inflation. After remaining mostly consistent in its messaging that price pressures would likely be transitory, elevated and more persistent inflation pressures caused the Fed to move the target federal funds rate into more restrictive territory. This resulted in a 25 basis point (bps) hike in the federal funds rate at the March Federal Open Market Committee (FOMC) meeting, the first hike in more than three years. Six additional rate hikes of 50 bps, 75 bps, 75 bps, 75 bps, 75 bps, and 50 bps, respectively, followed in the succeeding months as inflation prints continued to come in hotter than expected, resulting in a federal funds rate of 4.5% by the end of the period, the highest level in 15 years. While the shift down in the pace of rate hikes supported the narrative that the Fed may begin to cut rates by the end of 2023, the Fed’s updated Summary of Economic Projections showed a more hawkish outlook, raising the outlook for the fed funds rate through 2025 from September’s forecasts – including a median forecast of 5.1% for 2023, 4.1% in 2024, and 3.1% in 2025. Fed Chair Powell also struck a hawkish tone in the press conference following the December FOMC meeting, sticking to the higher-for-longer messaging. Bond yields shot up over the period in response to this aggressive policy, leading to a bearish curve flattening and ultimately a yield curve inversion, as shorter-term yields moved higher than longer-term yields.
2
Separately, global markets faced increased geopolitical tensions due to Russia’s invasion of Ukraine on February 23rd. Tensions remained elevated for the remainder of the twelve-month period, as Russia continued to weaponize energy flows, annexed four Ukrainian regions, and ratcheted up its nuclear warnings. In addition, the rhetoric between the U.S. and China over Taiwan further heated up after U.S. House of Representatives Speaker Nancy Pelosi visited Taiwan in August.
Key macroeconomic indicators mostly trended lower throughout the period, with the U.S. reporting negative gross domestic product of –1.6% in the first quarter of 2022 and –0.6% in the second quarter before growing 3.2% in the third quarter. Worries among investors that a recession was pending continued to grow, leading to a decline in the consumer confidence index to lower levels than during the height of the COVID-19 pandemic and the global financial crisis of 2008.
Despite rising recessionary signs, select bright spots in the U.S. economy supported the idea that a potential recession would be shallow. For example, one positive development was the peak inflation narrative, which included a 99-day stretch of declines in U.S. gasoline prices and November CPI coming in better than expected on both the headline and core numbers. In addition, apartment rents fell for the first time in nearly two years in July, and lumber prices declined by more than 70% from their March peak late in the third quarter, falling back to pre-COVID levels. The third quarter of the 2022 earnings season also generated a lot of
“better-than-feared” takeaways, including a common theme of relatively stable demand and pricing power protecting margins. While third quarter earnings were slightly below expectations, comments from management generally provided evidence of healthy consumer spending. Capital return and capital expenditures were also mentioned as relative bright spots as companies flagged easing labor shortages and supply chain constraints. The U.S. labor market also remained strong over the period, with the national unemployment rate at 3.5% as of the end of December.
In terms of the Fund’s key performance drivers, over the twelve-month period ending December 31, 2022, security selection within the Consumer Discretionary sector detracted from the Fund’s relative performance. Within the Consumer Discretionary sector, the Fund’s position in Caesars Entertainment, a casino management company, detracted most from relative performance. Shares fell after the company reported that revenue was short of expectations in the first quarter. The company faced headwinds throughout the period as it had notable financial leverage. We believe the company should benefit both from the company’s intention to reduce its overall leverage as well as the resumption of international travel. The Fund’s position in Alcoa Corp., which engages in the production of bauxite, alumina, and aluminum products, also detracted from relative performance. Shares fell after the company stated in the second quarter that supply chain disruptions were easing, but not as quickly as the company
3
had projected at the end of the first quarter. The impact of that meant that there would be less shipments in the second quarter than what the company had expected. The Fund’s position in Alphabet, Inc., a multinational technology company that specializes in Internet-related services and products, also detracted from relative performance. Shares fell throughout the period as large cap technology stocks came under pressure. More specifically, there were growing concerns over Alphabet’s digital advertising business as the competition in this space continued to grow.
Conversely, one of the largest contributors to relative performance during the twelve-month period ending December 31, 2022, was UnitedHealth Group, Inc., a health care coverage provider. Managed care companies such as UnitedHealth Group continued to see strong performance at the beginning of 2022 despite investors’ expectation that medical cost trends would remain subdued as the pandemic continued to delay procedures. Shares of the company rose after reporting fourth quarter earnings with revenue above expectations. Shares continued to rally after it was announced that LHC Group would be acquired by
UnitedHealth for $5.4B cash. The Fund’s position in Lockheed Martin Corp., a global security and aerospace company, also contributed to relative performance. The ongoing tensions between Russia and Ukraine have built up momentum in the defense sector and the U.S. government is Lockheed Martin’s largest customer. We believe the U.S. national defense budget could be larger than most are predicting, and the company should subsequently benefit from this. The Fund’s position in Allstate Corporation, an insurance company, also contributed to relative performance. Shares rallied over the period as the company reported several quarters of earnings above consensus expectations. Auto insurance margins have suffered due to increases in accident frequency as the economy reopens as well as increased claims costs mostly attributable to inflation. Allstate’s management is undertaking pricing actions that we expect will be sufficient to restore profitability over the medium-term.
The Fund’s portfolio is actively managed and, therefore, its holdings and the weightings of a particular issuer or particular sector as a percentage of portfolio assets are subject to change.
* The Russell 1000® Value Index measures the performance of those Russell 1000® companies with lower price-to-book ratios and lower forecasted growth values.
1 As represented by the Russell 3000® Value Index as of 12/31/2022.
2 As represented by the Russell 3000® Growth Index as of 12/31/2022.
3 As represented by the Russell 1000® Index as of 12/31/2022.
4 As represented by the Russell 2000® Index as of 12/31/2022.
Unless otherwise specified, indexes reflect total return, with all dividends reinvested. Indexes are unmanaged, do not reflect the deduction of fees or expenses, and are not available for direct investment.
4
Important Performance and Other Information
Performance data quoted in the following pages reflect past performance and are no guarantee of future results. Current performance may be higher or lower than the performance quoted. The investment return and principal value of an investment in the Fund will fluctuate so that shares, on any given day or when redeemed, may be worth more or less than their original cost. You can obtain performance data current to the most recent month end by calling Lord Abbett at 888-522-2388 or referring to www.lordabbett.com.
During certain periods shown, expense waivers and reimbursements were in place. Without such expense waivers and reimbursements, the Fund’s returns would have been lower.
The annual commentary above discusses the views of the Fund’s management and various portfolio holdings of the Fund as of December 31, 2022. These views and portfolio holdings may have changed after this date. Information provided in the commentary is
not a recommendation to buy or sell securities. Because the Fund’s portfolio is actively managed and may change significantly, the Fund may no longer own the securities described above or may have otherwise changed its position in the securities. For more recent information about the Fund’s portfolio holdings, please visit www.lordabbett.com.
A Note about Risk: See Notes to Financial Statements for a discussion of investment risks. For a more detailed discussion of the risks associated with the Fund, please see the Fund’s prospectus.
Mutual funds are not insured by the FDIC, are not deposits or other obligations of, or guaranteed by, banks, and are subject to investment risks including possible loss of principal amount invested.
The Fund serves as an underlying investment vehicle for variable annuity contracts and variable life insurance policies.
5
Investment Comparison
Below is a comparison of a $10,000 investment in Class VC shares with the same investment in the Russell 1000® Value Index, the S&P 500® Index and the S&P 500® Value Index, assuming reinvestment of all dividends and distributions. The Fund’s shares are sold only to insurance company separate accounts that fund certain variable annuity and variable life contracts. This line graph comparison does not reflect the sales charges or other expenses of these contracts. If those sales charges and expenses were reflected, returns would be lower. The graph and performance table below do not reflect the deduction of taxes that a shareholder would pay on Fund distributions or the redemption of Fund shares. During certain periods, expenses of the Fund have been waived or reimbursed by Lord Abbett; without such waiver or reimbursement of expenses, the Fund’s returns would have been lower. Past performance is no guarantee of future results.
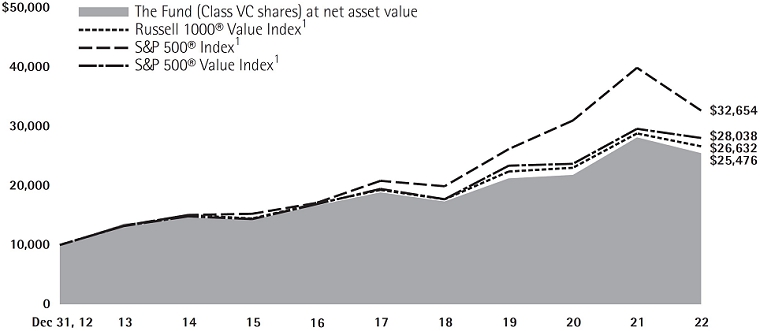
Average Annual Total Returns for the
Periods Ended December 31, 2022
| | | 1 Year | | 5 Years | | 10 Years | |
| Class VC | | -9.44% | | 6.19% | | 9.80% | |
| 1 | Performance for each unmanaged index does not reflect any fees or expenses. The performance of each index is not necessarily representative of the Fund’s performance. |
6
Expense Example
As a shareholder of the Fund, you incur ongoing costs, including management fees; expenses related to the Fund’s services arrangements with certain insurance companies; and other Fund expenses. This Example is intended to help you understand your ongoing costs (in dollars) of investing in the Fund and to compare these costs with the ongoing costs of investing in other mutual funds.
The Example is based on an investment of $1,000 invested at the beginning of the period and held for the entire period (July 1, 2022 through December 31, 2022).
The Example reflects only expenses that are deducted from the assets of the Fund. Fees and expenses, including sales charges applicable to the various insurance products that invest in the Fund, are not reflected in this Example. If such fees and expenses were reflected in the Example, the total expenses shown would be higher. Fees and expenses regarding such variable insurance products are separately described in the prospectus related to those products.
Actual Expenses
The first line of the table on the following page provides information about actual account values and actual expenses. You may use the information in this line, together with the amount you invested, to estimate the expenses that you paid over the period. Simply divide your account value by $1,000 (for example, an $8,600 account value divided by $1,000 = 8.6), then multiply the result by the number in the first line under the heading titled “Expenses Paid During Period 7/1/22 – 12/31/22” to estimate the expenses you paid on your account during this period.
Hypothetical Example for Comparison Purposes
The second line of the table on the following page provides information about hypothetical account values and hypothetical expenses based on the Fund’s actual expense ratio and an assumed rate of return of 5% per year before expenses, which is not the Fund’s actual return. The hypothetical account values and expenses may not be used to estimate the actual ending account balance or expenses you paid for the period. You may use this information to compare the ongoing costs of investing in the Fund and other funds. To do so, compare this 5% hypothetical example with the 5% hypothetical examples that appear in the shareholder reports of the other funds.
7
Please note that the expenses shown in the table are meant to highlight your ongoing costs only and do not reflect any transactional costs, such as sales charges. Therefore, the second line of the table is useful in comparing ongoing costs only, and will not help you determine the relative total costs of owning different funds. In addition, if these transactional costs were included, your costs would have been higher.
| | | Beginning
Account
Value | | Ending
Account
Value | | Expenses
Paid During
Period† | |
| | | 7/1/22 | | 12/31/22 | | 7/1/22 -
12/31/22 | |
| Class VC | | | | | | | | | | | | |
| Actual | | $ | 1,000.00 | | | $ | 1,073.40 | | | $ | 4.86 | |
| Hypothetical (5% Return Before Expenses) | | $ | 1,000.00 | | | $ | 1,020.52 | | | $ | 4.74 | |
| † | Net expenses are equal to the Fund’s annualized expense ratio of 0.93%, multiplied by the average account value over the period, multiplied by 184/365 (to reflect one-half year period). |
Portfolio Holdings Presented by Sector
December 31, 2022
| Sector* | %** |
| Communication Services | 4.92 | % |
| Consumer Discretionary | 6.57 | % |
| Consumer Staples | 5.27 | % |
| Energy | 8.55 | % |
| Financials | 21.42 | % |
| Health Care | 15.88 | % |
| Industrials | 14.01 | % |
| Information Technology | 12.00 | % |
| Materials | 4.79 | % |
| Real Estate | 2.32 | % |
| Utilities | 2.36 | % |
| Repurchase Agreements | 1.91 | % |
| Total | 100.00 | % |
| * | | A sector may comprise several industries. |
| ** | | Represents percent of total investments, which excludes derivatives. |
8
Schedule of Investments
December 31, 2022
| Investments | | Shares | | | Fair
Value | |
| LONG-TERM INVESTMENTS 99.06% | | | | | | | | |
| | | | | | | | | |
| COMMON STOCKS 99.06% | | | | | | | | |
| | | | | | | | | |
| Aerospace & Defense 4.79% | | | | | | | | |
| Lockheed Martin Corp. | | | 19,860 | | | $ | 9,661,691 | |
| Raytheon Technologies Corp. | | | 134,890 | | | | 13,613,099 | |
| Total | | | | | | | 23,274,790 | |
| | | | | | | | | |
| Automobiles 1.45% | | | | | | | | |
| General Motors Co. | | | 209,310 | | | | 7,041,188 | |
| | | | | | | | | |
| Banks 5.81% | | | | | | | | |
| East West Bancorp, Inc. | | | 92,170 | | | | 6,074,003 | |
| JPMorgan Chase & Co. | | | 97,840 | | | | 13,120,344 | |
| Wells Fargo & Co. | | | 219,870 | | | | 9,078,432 | |
| Total | | | | | | | 28,272,779 | |
| | | | | | | | | |
| Beverages 1.06% | | | | | | | | |
| Carlsberg A/S Class B | | | 39,030 | | | | 5,177,210 | |
| | | | | | | | | |
| Biotechnology 2.22% | | | | | | | | |
| AbbVie, Inc. | | | 66,910 | | | | 10,813,325 | |
| | | | | | | | | |
| Building Products 1.24% | | | | | | | | |
| Masco Corp. | | | 128,930 | | | | 6,017,163 | |
| | | | | | | | | |
| Capital Markets 6.67% | | | | | | | | |
| Ameriprise Financial, Inc. | | | 34,460 | | | | 10,729,810 | |
| Charles Schwab Corp. (The) | | | 108,490 | | | | 9,032,878 | |
| KKR & Co., Inc. | | | 102,400 | | | | 4,753,408 | |
| Morgan Stanley | | | 92,950 | | | | 7,902,609 | |
| Total | | | | | | | 32,418,705 | |
| | | | | | | | | |
| Chemicals 2.29% | | | | | | | | |
| Dow, Inc. | | | 71,310 | | | | 3,593,311 | |
| Valvoline, Inc. | | | 231,122 | | | | 7,546,133 | |
| Total | | | | | | | 11,139,444 | |
| | | | | | | | | |
| Construction & Engineering 2.71% | | | | | | | | |
| EMCOR Group, Inc. | | | 58,230 | | | | 8,624,445 | |
| Jacobs Solutions, Inc. | | | 37,850 | | | | 4,544,650 | |
| Total | | | | | | | 13,169,095 | |
| | | | | | | | | |
| Consumer Finance 1.40% | | | | | | | | |
| American Express Co. | | | 46,110 | | | | 6,812,753 | |
| Investments | | Shares | | | Fair
Value | |
| Containers & Packaging 1.10% | | | | | | | | |
| Avery Dennison Corp. | | | 29,650 | | | $ | 5,366,650 | |
| | | | | | | | | |
| Electric: Utilities 2.38% | | | | | | | | |
| NextEra Energy, Inc. | | | 85,460 | | | | 7,144,456 | |
| NRG Energy, Inc. | | | 139,120 | | | | 4,426,798 | |
| Total | | | | | | | 11,571,254 | |
| | | | | | | | | |
| Electronic Equipment, Instruments & Components 1.21% | | | |
| Teledyne Technologies, Inc.* | | | 14,670 | | | | 5,866,680 | |
| | | | | | | | | |
| Energy Equipment & Services 2.48% | | | | | |
| Schlumberger NV | | | 225,310 | | | | 12,045,073 | |
| | | | | | | | | |
| Equity Real Estate Investment Trusts 2.34% | | | | |
| American Homes 4 Rent Class A | | | 160,920 | | | | 4,850,129 | |
| Prologis, Inc. | | | 58,090 | | | | 6,548,486 | |
| Total | | | | | | | 11,398,615 | |
| | | | | | | | | |
| Food & Staples Retailing 1.76% | | | | | | | | |
| BJ’s Wholesale Club | | | | | | | | |
| Holdings, Inc.* | | | 129,390 | | | | 8,560,442 | |
| | | | | | | | | |
| Health Care Providers & Services 6.07% | | | | |
| CVS Health Corp. | | | 74,990 | | | | 6,988,318 | |
| McKesson Corp. | | | 21,460 | | | | 8,050,075 | |
| UnitedHealth Group, Inc. | | | 27,330 | | | | 14,489,820 | |
| Total | | | | | | | 29,528,213 | |
| | | | | | | | | |
| Hotels, Restaurants & Leisure 1.25% | | | | |
| Caesars Entertainment, Inc.* | | | 146,190 | | | | 6,081,504 | |
| | | | | | | | | |
| Household Products 2.50% | | | | | | | | |
| Procter & Gamble Co. (The) | | | 80,150 | | | | 12,147,534 | |
| | | | | | | | | |
| Information Technology Services 2.92% | | | | |
| Fiserv, Inc.* | | | 80,830 | | | | 8,169,488 | |
| PayPal Holdings, Inc.* | | | 84,570 | | | | 6,023,076 | |
| Total | | | | | | | 14,192,564 | |
| | | | | | | | | |
| Insurance 7.75% | | | | | | | | |
| Allstate Corp. (The) | | | 78,140 | | | | 10,595,784 | |
| Arch Capital Group Ltd.* | | | 122,140 | | | | 7,667,949 | |
| | See Notes to Financial Statements. | 9 |
Schedule of Investments (continued)
December 31, 2022
| Investments | | Shares | | | Fair
Value | |
| Insurance (continued) | | | | | | | | |
| Arthur J Gallagher & Co. | | | 41,640 | | | $ | 7,850,806 | |
| Assurant, Inc. | | | 30,540 | | | | 3,819,332 | |
| RenaissanceRe Holdings Ltd. | | | 42,070 | | | | 7,750,556 | |
| Total | | | | | | | 37,684,427 | |
| | | | | | | | | |
| Interactive Media & Services 1.87% | | | | | |
| Alphabet, Inc. Class A* | | | 102,930 | | | | 9,081,514 | |
| | | | | | | | | |
| Life Sciences Tools & Services 1.50% | | | | |
| Thermo Fisher Scientific, Inc. | | | 13,210 | | | | 7,274,615 | |
| | | | | | | | | |
| Machinery 1.90% | | | | | | | | |
| Parker-Hannifin Corp. | | | 31,750 | | | | 9,239,250 | |
| | | | | | | | | |
| Media 1.43% | | | | | | | | |
| Comcast Corp. Class A | | | 198,700 | | | | 6,948,539 | |
| | | | | | | | | |
| Metals & Mining 1.44% | | | | | | | | |
| Alcoa Corp. | | | 65,170 | | | | 2,963,280 | |
| Reliance Steel & Aluminum Co. | | | 19,910 | | | | 4,030,580 | |
| Total | | | | | | | 6,993,860 | |
| | | | | | | | | |
| Multi-Line Retail 1.50% | | | | | | | | |
| Target Corp. | | | 49,090 | | | | 7,316,374 | |
| | | | | | | | | |
| Oil, Gas & Consumable Fuels 6.16% | | | | | |
| Chesapeake Energy Corp. | | | 100,698 | | | | 9,502,870 | |
| Pioneer Natural Resources Co. | | | 39,860 | | | | 9,103,626 | |
| Shell plc ADR | | | 198,980 | | | | 11,331,911 | |
| Total | | | | | | | 29,938,407 | |
| | | | | | | | | |
| Pharmaceuticals 6.25% | | | | | |
| Eli Lilly & Co. | | | 15,080 | | | | 5,516,867 | |
| Organon & Co. | | | 367,750 | | | | 10,271,257 | |
| Pfizer, Inc. | | | 284,620 | | | | 14,583,929 | |
| Total | | | | | | | 30,372,053 | |
| Investments | | Shares | | | Fair
Value | |
| Road & Rail 1.61% | | | | | | | | |
| Norfolk Southern Corp. | | | 31,720 | | | $ | 7,816,442 | |
| | | | | | | | | |
| Semiconductors & Semiconductor Equipment 3.37% | | | | | |
| KLA Corp. | | | 12,900 | | | | 4,863,687 | |
| Micron Technology, Inc. | | | 98,310 | | | | 4,913,534 | |
| Texas Instruments, Inc. | | | 40,170 | | | | 6,636,887 | |
| Total | | | | | | | 16,414,108 | |
| | | | | | | | | |
| Software 3.31% | | | | | | | | |
| Adobe, Inc.* | | | 22,890 | | | | 7,703,172 | |
| Microsoft Corp. | | | 35,040 | | | | 8,403,293 | |
| Total | | | | | | | 16,106,465 | |
| | | | | | | | | |
| Specialty Retail 2.44% | | | | | |
| AutoZone, Inc.* | | | 2,230 | | | | 5,499,581 | |
| Lowe’s Cos., Inc. | | | 31,850 | | | | 6,345,794 | |
| Total | | | | | | | 11,845,375 | |
| | | | | | | | | |
| Technology Hardware, Storage & Peripherals 1.30% | | | | |
| NetApp, Inc. | | | 105,590 | | | | 6,341,735 | |
| | | | | | | | | |
| Trading Companies & Distributors 1.91% | | | |
| AerCap Holdings NV (Ireland)*(a) | | | 159,380 | | | | 9,295,042 | |
| | | | | | | | | |
| Wireless Telecommunication Services 1.67% | | | |
| T-Mobile US, Inc.* | | | 58,040 | | | | 8,125,600 | |
Total Common Stocks
(cost $432,540,071) | | | | | | | 481,688,787 | |
| 10 | See Notes to Financial Statements. |
Schedule of Investments (concluded)
December 31, 2022
| Investments | | Principal
Amount | | | Fair
Value | |
| SHORT-TERM INVESTMENTS 1.93% | | | |
| | | | | | | | | |
| Repurchase Agreements 1.93% | | | |
Repurchase Agreement dated 12/30/2022, 2.05% due 1/3/2023 with Fixed Income Clearing Corp. collateralized by $9,538,500 of U.S. Treasury Note at 4.275% due 4/30/2024; value: $9,584,819; proceeds: $9,398,989
(cost $9,396,849) | | $ | 9,396,849 | | | $ | 9,396,849 | |
Total Investments in Securities 100.99%
(cost $441,936,920) | | | | | | | 491,085,636 | |
| Other Assets and Liabilities – Net (0.99)% | | | | | | | (4,826,785 | ) |
| Net Assets 100.00% | | | | | | $ | 486,258,851 | |
| ADR | | American Depositary Receipt. |
| * | | Non-income producing security. |
| (a) | | Foreign security traded in U.S. dollars. |
The following is a summary of the inputs used as of December 31, 2022 in valuing the Fund’s investments carried at fair value(1):
| Investment Type(2) | | Level 1 | | | Level 2 | | | Level 3 | | | Total | |
| Long-Term Investments | | | | | | | | | | | | | | | | | | |
| Common Stocks | | | | | | | | | | | | | | | | | | |
| Beverages | | $ | – | | | | $ | 5,177,210 | | | | $ | – | | | $ | 5,177,210 | |
| Remaining Industries | | | 476,511,577 | | | | | – | | | | | – | | | | 476,511,577 | |
| Short-Term Investments | | | | | | | | | | | | | | | | | | |
| Repurchase Agreements | | | – | | | | | 9,396,849 | | | | | – | | | | 9,396,849 | |
| Total | | $ | 476,511,577 | | | | $ | 14,574,059 | | | | $ | – | | | $ | 491,085,636 | |
| (1) | | Refer to Note 2(h) for a description of fair value measurements and the three-tier hierarchy of inputs. |
| (2) | | See Schedule of Investments for fair values in each industry and identification of foreign issuers and/or geography. The table above is presented by Investment Type. Industries are presented within an Investment Type should such Investment Type include securities classified as two or more levels within the three-tier fair value hierarchy. When applicable, each Level 3 security is identified on the Schedule of Investments along with the valuation technique utilized. |
A reconciliation of Level 3 investments is presented when the Fund has a material amount of Level 3 investments at the beginning or end of the year in relation to the Fund’s net assets.
| | See Notes to Financial Statements. | 11 |
Statement of Assets and Liabilities
December 31, 2022
| ASSETS: | | | | |
| Investments in securities, at fair value (cost $441,936,920) | | $ | 491,085,636 | |
| Cash | | | 349 | |
| Receivables: | | | | |
| Investment securities sold | | | 1,022,216 | |
| Interest and dividends | | | 256,826 | |
| Capital shares sold | | | 31,011 | |
| Securities lending income receivable | | | 312 | |
| Prepaid expenses and other assets | | | 2,329 | |
| Total assets | | | 492,398,679 | |
| LIABILITIES: | | | | |
| Payables: | | | | |
| Capital shares reacquired | | | 4,468,179 | |
| Transfer agent fees | | | 1,200,440 | |
| Management fee | | | 209,999 | |
| Directors’ fees | | | 137,697 | |
| Fund administration | | | 16,800 | |
| Accrued expenses | | | 106,713 | |
| Total liabilities | | | 6,139,828 | |
| NET ASSETS | | $ | 486,258,851 | |
| COMPOSITION OF NET ASSETS: | | | | |
| Paid-in capital | | $ | 437,016,587 | |
| Total distributable earnings (loss) | | | 49,242,264 | |
| Net Assets | | $ | 486,258,851 | |
| Outstanding shares (200 million shares of common stock authorized, $.001 par value) | | | 14,822,878 | |
| Net asset value, offering and redemption price per share (Net assets divided by outstanding shares) | | $ | 32.80 | |
| 12 | See Notes to Financial Statements. |
Statement of Operations
For the Year Ended December 31, 2022
| Investment income: | | | | |
| Dividends (net of foreign withholding taxes of $16,247) | | $ | 11,717,987 | |
| Securities lending net income | | | 1,205 | |
| Interest and other | | | 71,435 | |
| Interest earned from Interfund Lending (See Note 10) | | | 286 | |
| Total investment income | | | 11,790,913 | |
| Expenses: | | | | |
| Management fee | | | 2,627,792 | |
| Non 12b-1 service fees | | | 1,313,586 | |
| Shareholder servicing | | | 557,604 | |
| Fund administration | | | 210,223 | |
| Reports to shareholders | | | 56,639 | |
| Professional | | | 55,873 | |
| Custody | | | 24,623 | |
| Directors’ fees | | | 9,473 | |
| Other | | | 76,059 | |
| Gross expenses | | | 4,931,872 | |
| Expense reductions (See Note 8) | | | (6,570 | ) |
| Fees waived and expenses reimbursed (See Note 3) | | | (24,623 | ) |
| Net expenses | | | 4,900,679 | |
| Net investment income | | | 6,890,234 | |
| Net realized and unrealized gain (loss): | | | | |
| Net realized gain (loss) on investments | | | 40,535,002 | |
| Net realized gain (loss) on foreign currency related transactions | | | 5,885 | |
| Net change in unrealized appreciation/depreciation on investments | | | (104,082,846 | ) |
| Net change in unrealized appreciation/depreciation on translation of assets and liabilities denominated in foreign currencies | | | (1,759 | ) |
| Net realized and unrealized gain (loss) | | | (63,543,718 | ) |
| Net Decrease in Net Assets Resulting From Operations | | $ | (56,653,484 | ) |
| | See Notes to Financial Statements. | 13 |
Statements of Changes in Net Assets
| INCREASE (DECREASE) IN NET ASSETS | | For the Year Ended
December 31, 2022 | | | For the Year Ended
December 31, 2021 | |
| Operations: | | | | | | | | | | |
| Net investment income | | | $ | 6,890,234 | | | | $ | 6,108,746 | |
| Net realized gain (loss) on investments and foreign currency related transactions | | | | 40,540,887 | | | | | 85,218,580 | |
| Net change in unrealized appreciation/depreciation on investments and translation of assets and liabilities denominated in foreign currencies | | | | (104,084,605 | ) | | | | 59,147,588 | |
| Net increase (decrease) in net assets resulting from operations | | | | (56,653,484 | ) | | | | 150,474,914 | |
| Distributions to shareholders: | | | | (47,082,116 | ) | | | | (68,119,055 | ) |
| Capital share transactions (See Note 14): | | | | | | | | | | |
| Net proceeds from sales of shares | | | | 11,464,087 | | | | | 7,468,120 | |
| Reinvestment of distributions | | | | 47,082,116 | | | | | 68,119,055 | |
| Cost of shares reacquired | | | | (79,149,333 | ) | | | | (100,203,090 | ) |
| Net decrease in net assets resulting from capital share transactions | | | | (20,603,130 | ) | | | | (24,615,915 | ) |
| Net increase (decrease) in net assets | | | | (124,338,730 | ) | | | | 57,739,944 | |
| NET ASSETS: | | | | | | | | | | |
| Beginning of year | | | $ | 610,597,581 | | | | $ | 552,857,637 | |
| End of year | | | $ | 486,258,851 | | | | $ | 610,597,581 | |
| 14 | See Notes to Financial Statements. |
This page is intentionally left blank.
15
Financial Highlights
| | | | | Per Share Operating Performance: |
| | | | | Investment Operations: | | Distributions to
shareholders from: |
| | | Net asset
value,
beginning
of period | | Net
invest-
ment
income(a) | | Net
realized
and
unrealized
gain (loss) | | Total
from
invest-
ment
oper-
ations | | Net
invest-
ment
income | | Net
realized
gain | | Total
distri-
butions |
| 12/31/2022 | | | $40.04 | | | | $0.48 | | | | $(4.29 | ) | | $ | (3.81 | ) | | $ | (0.48 | ) | | $ | (2.95 | ) | | $ | (3.43 | ) |
| 12/31/2021 | | | 34.94 | | | | 0.41 | | | | 9.63 | | | | 10.04 | | | | (0.44 | ) | | | (4.50 | ) | | | (4.94 | ) |
| 12/31/2020 | | | 34.57 | | | | 0.53 | | | | 0.39 | | | | 0.92 | | | | (0.55 | ) | | | – | | | | (0.55 | ) |
| 12/31/2019 | | | 30.65 | | | | 0.55 | | | | 6.31 | | | | 6.86 | | | | (0.58 | ) | | | (2.36 | ) | | | (2.94 | ) |
| 12/31/2018 | | | 37.15 | | | | 0.50 | | | | (3.53 | ) | | | (3.03 | ) | | | (0.52 | ) | | | (2.95 | ) | | | (3.47 | ) |
| (a) | Calculated using average shares outstanding during the period. |
| (b) | Total return does not consider the effects of sales charges or other expenses imposed by an insurance company and assumes the reinvestment of all distributions. |
| 16 | See Notes to Financial Statements. |
| | | | | Ratios to Average Net Assets: | | Supplemental Data: |
| | | | | | | |
| | | | | | | |
Net
asset
value,
end of
period | | Total
return(b)
(%) | | Total expenses
after waivers
and/or
reimbursements
(%) | | Total
expenses
(%) | | Net
investment
income
(%) | | Net
assets,
end of
period
(000) | | Portfolio
turnover
rate
(%) |
| | $32.80 | | | | (9.44 | ) | | | 0.93 | | | | 0.94 | | | | 1.31 | | | | $486,259 | | | | 36 | |
| | 40.04 | | | | 29.02 | | | | 0.92 | | | | 0.93 | | | | 1.03 | | | | 610,598 | | | | 66 | |
| | 34.94 | | | | 2.70 | | | | 0.94 | | | | 0.94 | | | | 1.70 | | | | 552,858 | | | | 67 | |
| | 34.57 | | | | 22.49 | | | | 0.94 | | | | 0.94 | | | | 1.59 | | | | 581,851 | | | | 76 | |
| | 30.65 | | | | (8.14 | ) | | | 0.93 | | | | 0.93 | | | | 1.35 | | | | 547,667 | | | | 89 | |
| | See Notes to Financial Statements. | 17 |
Notes to Financial Statements
Lord Abbett Series Fund, Inc. (the “Company”) is registered under the Investment Company Act of 1940, as amended (the “Act”), as a diversified, open-end management investment company and was incorporated under Maryland law in 1989. The Company consists of nine separate portfolios as of December 31, 2022. This report covers Growth and Income Portfolio (the “Fund”).
The Fund’s investment objective is long-term growth of capital and income without excessive fluctuations in market value. The Fund has Variable Contract class shares (“Class VC Shares”), which are currently issued and redeemed only in connection with investments in, and payments under, variable annuity contracts and variable life insurance policies issued by life insurance and insurance-related companies.
The preparation of the financial statements in conformity with accounting principles generally accepted in the United States of America (“U.S. GAAP”) requires management to make certain estimates and assumptions that affect the reported amounts of assets and liabilities and disclosure of contingent assets and liabilities at the date of the financial statements and the reported amounts of increases and decreases in net assets from operations during the reporting period. Actual results could differ from those estimates. The Fund is considered an investment company under U.S. GAAP and follows the accounting and reporting guidance applicable to investment companies.
| 2. | SIGNIFICANT ACCOUNTING POLICIES |
| (a) | Investment Valuation–Under procedures approved by the Fund’s Board of Directors (the “Board”), the Board has designated the determination of fair value of the Fund’s portfolio investments to Lord, Abbett & Co. LLC (“Lord Abbett”), as its valuation designee. Accordingly, Lord Abbett is responsible for, among other things, assessing and managing valuation risks, establishing, applying and testing fair value methodologies, and evaluating pricing services. Lord Abbett has formed a Pricing Committee that performs these responsibilities on behalf of Lord Abbett, administers the pricing and valuation of portfolio investments and ensures that prices utilized reasonably reflect fair value. Among other things, these procedures allow Lord Abbett, subject to Board oversight, to utilize independent pricing services, quotations from securities and financial instrument dealers and other market sources to determine fair value. |
| | |
| | Securities actively traded on any recognized U.S. or non-U.S. exchange or on The NASDAQ Stock Market LLC are valued at the last sale price or official closing price on the exchange or system on which they are principally traded. Events occurring after the close of trading on non-U.S. exchanges may result in adjustments to the valuation of foreign securities to reflect their fair value as of the close of regular trading on the New York Stock Exchange. When valuing foreign equity securities that meet certain criteria, the Board has approved the use of an independent fair valuation service that values such securities to reflect market trading that occurs after the close of the applicable foreign markets of comparable securities or other instruments that correlate to the fair-valued securities. Unlisted equity securities are valued at the last quoted sale price or, if no sale price is available, at the mean between the most recently quoted bid and ask prices. |
| | |
| | Securities for which prices are not readily available are valued at fair value as determined by the Pricing Committee. The Pricing Committee considers a number of factors, including observable and unobservable inputs, when arriving at fair value. The Pricing Committee may use related or comparable assets or liabilities, recent transactions, market multiples, book |
18
Notes to Financial Statements (continued)
| | values, and other relevant information to determine the fair value of portfolio investments. The Board or a designated committee thereof periodically reviews reports that may include fair value determinations made by the Pricing Committee, related market activity, inputs and assumptions, and retrospective comparison of prices of subsequent purchases and sales transactions to fair value determinations made by the Pricing Committee. |
| | |
| | Investments in open-end money market mutual funds are valued at their NAV as of the close of each business day. Short-term securities with 60 days or less remaining to maturity are valued using the amortized cost method, which approximates fair value. |
| | |
| (b) | Security Transactions–Security transactions are recorded as of the date that the securities are purchased or sold (trade date). Realized gains and losses on sales of portfolio securities are calculated using the identified-cost method. |
| | |
| (c) | Investment Income–Dividend income is recorded on the ex-dividend date. Interest income is recorded on the accrual basis as earned. Discounts are accreted and premiums are amortized using the effective interest method and are included in Interest and other, if applicable, on the Statement of Operations. Withholding taxes on foreign dividends have been provided for in accordance with the applicable country’s tax rules and rates. |
| | |
| (d) | Income Taxes–It is the policy of the Fund to meet the requirements of Subchapter M of the Internal Revenue Code applicable to regulated investment companies and to distribute substantially all taxable income and capital gains to its shareholders. Therefore, no income tax provision is required. |
| | |
| | The Fund files U.S. federal and various state and local tax returns. No income tax returns are currently under examination. The statute of limitations on the Fund’s filed U.S. federal tax returns remains open for the fiscal years ended December 31, 2019 through December 31, 2022. The statutes of limitations on the Fund’s state and local tax returns may remain open for an additional year depending upon the jurisdiction. |
| | |
| (e) | Expenses–Expenses incurred by the Company that do not specifically relate to an individual fund are generally allocated to the funds within the Company on a pro rata basis by relative net assets. |
| | |
| (f) | Foreign Transactions–The books and records of the Fund are maintained in U.S. dollars and transactions denominated in foreign currencies are recorded in the Fund’s records at the rate prevailing when earned or recorded. Asset and liability accounts that are denominated in foreign currencies are adjusted daily to reflect current exchange rates and any unrealized gain (loss), if applicable, is included in Net change in unrealized appreciation/depreciation on translation of assets and liabilities denominated in foreign currencies on the Fund’s Statement of Operations. The resultant exchange gains and losses upon settlement of such transactions, if applicable, are included in Net realized gain (loss) on foreign currency related transactions on the Fund’s Statement of Operations. The Fund does not isolate that portion of the results of operations arising as a result of changes in the foreign exchange rates from the changes in market prices of the securities. |
| | |
| | The Fund uses foreign currency exchange contracts to facilitate transactions in foreign-denominated securities. Losses from these transactions may arise from changes in the value of the foreign currency or if the counterparties do not perform under the contracts’ terms. |
| | |
| (g) | Repurchase Agreements–The Fund may enter into repurchase agreements with respect to securities. A repurchase agreement is a transaction in which a fund acquires a security and |
19
Notes to Financial Statements (continued)
| | simultaneously commits to resell that security to the seller (a bank or securities dealer) at an agreed-upon price on an agreed-upon date. The Fund requires at all times that the repurchase agreement be collateralized by cash, or by securities of the U.S. Government, its agencies, its instrumentalities, or U.S. Government sponsored enterprises having a value equal to, or in excess of, the value of the repurchase agreement (including accrued interest). If the seller of the agreement defaults on its obligation to repurchase the underlying securities at a time when the fair value of these securities has declined, the Fund may incur a loss upon disposition of the securities. |
| | |
| (h) | Fair Value Measurements–Fair value is defined as the price that the Fund would receive upon selling an investment or transferring a liability in an orderly transaction to an independent buyer in the principal or most advantageous market of the investment. A three-tier hierarchy is used to maximize the use of observable market data and minimize the use of unobservable inputs and to establish classification of fair value measurements for disclosure purposes. Inputs refer broadly to the assumptions that market participants would use in pricing the asset or liability, including assumptions about risk - for example, the risk inherent in a particular valuation technique used to measure fair value (such as a pricing model) and/or the risk inherent in the inputs to the valuation technique. Inputs may be observable or unobservable. Observable inputs reflect the assumptions market participants would use in pricing the asset or liability. Observable inputs are based on market data obtained from sources independent of the reporting entity. Unobservable inputs reflect the reporting entity’s own assumptions about the assumptions market participants would use in pricing the asset or liability. Unobservable inputs are based on the best information available in the circumstances. The three-tier hierarchy classification is determined based on the lowest level of inputs that is significant to the fair value measurement, and is summarized in the three broad Levels listed below: |
| | • | Level 1 – | unadjusted quoted prices in active markets for identical investments; |
| | | | |
| | • | Level 2 – | other significant observable inputs (including quoted prices for similar investments, interest rates, prepayment speeds, credit risk, etc.); and |
| | | | |
| | • | Level 3 – | significant unobservable inputs (including the Fund’s own assumptions in determining the fair value of investments). |
| | A summary of inputs used in valuing the Fund’s investments as of December 31, 2022 and, if applicable, Level 3 rollforwards for the fiscal year then ended is included in the Fund’s Schedule of Investments. |
| | |
| | Changes in valuation techniques may result in transfers into or out of an assigned level within the three-tier hierarchy. The inputs or methodology used for valuing securities are not necessarily an indication of the risk associated with investing in those securities. |
| 3. | MANAGEMENT FEE AND OTHER TRANSACTIONS WITH AFFILIATES |
Management Fee
The Company has a management agreement with Lord Abbett, pursuant to which Lord Abbett provides the Fund with investment management services and executive and other personnel, provides office space and pays for ordinary and necessary office and clerical expenses relating to research and statistical work and supervision of the Fund’s investment portfolio. The management fee is accrued daily and payable monthly.
20
Notes to Financial Statements (continued)
The management fee is based on the Fund’s average daily net assets at the following annual rate:
| First $1 billion | .50% |
| Over $1 billion | .45% |
For the fiscal year ended December 31, 2022, the effective management fee, net of any applicable waivers, was at an annualized rate of .50% of the Fund’s average daily net assets.
In addition, Lord Abbett provides certain administrative services to the Fund pursuant to an Administrative Services Agreement in return for a fee at an annual rate of .04% of the Fund’s average daily net assets. The fund administration fee is accrued daily and payable monthly. Lord Abbett voluntarily waived $24,623 of fund administration fees during the fiscal year ended December 31, 2022.
The Company, on behalf of the Fund, has entered into services arrangements with certain insurance companies. Under these arrangements, certain insurance companies will be compensated up to .25% of the average daily net asset value (“NAV”) of the Fund’s Class VC Shares held in the insurance company’s separate account to service and maintain the Variable Contract owners’ accounts. This amount is included in non 12b-1 service fees on the Statement of Operations. The Fund may also compensate certain insurance companies, third-party administrators and other entities for providing recordkeeping, sub-transfer agency and other administrative services to the Fund. This amount is included in Shareholder servicing on the Statement of Operations.
One Director and certain of the Company’s officers have an interest in Lord Abbett.
| 4. | DISTRIBUTIONS AND CAPITAL LOSS CARRYFORWARDS |
Dividends from net investment income, if any, are declared and paid at least semi-annually. Taxable net realized gains from investment transactions, reduced by allowable capital loss carryforwards, if any, are declared and distributed to shareholders at least annually. The capital loss carryforward amount, if any, is available to offset future net capital gains. Dividends and distributions to shareholders are recorded on the ex-dividend date. The amounts of dividends and distributions from net investment income and net realized capital gains are determined in accordance with federal income tax regulations, which may differ from U.S. GAAP. These book/tax differences are either considered temporary or permanent in nature. To the extent these differences are permanent in nature, such amounts are reclassified within the components of net assets based on their federal tax basis treatment; temporary differences do not require reclassification. Dividends and distributions that exceed earnings and profits for tax purposes are reported as a tax return of capital.
The tax character of distributions paid during the fiscal years ended December 31, 2022 and December 31, 2021 was as follows:
| | | Year Ended
12/31/2022 | | | Year Ended
12/31/2021 | |
| Distributions paid from: | | | | | | | | |
| Ordinary income | | $ | 6,633,583 | | | $ | 19,958,344 | |
| Net long-term capital gains | | | 40,448,533 | | | | 48,160,711 | |
| Total distributions paid | | $ | 47,082,116 | | | $ | 68,119,055 | |
21
Notes to Financial Statements (continued)
As of December 31, 2022, the components of accumulated gains (losses) on a tax-basis were as follows:
| Undistributed ordinary income – net | | $ | 62,277 | |
| Undistributed long-term capital gains | | | 770,569 | |
| Total undistributed earnings | | | 832,846 | |
| Temporary differences | | | (137,697 | ) |
| Unrealized gains (losses) – net | | | 48,547,115 | |
| Total accumulated gains (losses) – net | | $ | 49,242,264 | |
As of December 31, 2022, the aggregate unrealized security gains (losses) on investments and other financial instruments based on cost for U.S. federal income tax purposes were as follows:
| Tax cost | | $ | 442,535,178 | |
| Gross unrealized gain | | | 78,115,962 | |
| Gross unrealized loss | | | (29,565,504 | ) |
| Net unrealized security gain (loss) | | $ | 48,550,458 | |
The difference between book-basis and tax-basis unrealized gains (losses) is attributable to the tax treatment of certain securities and wash sales.
| 5. | PORTFOLIO SECURITIES TRANSACTIONS |
Purchases and sales of investment securities (excluding short-term investments) for the fiscal year ended December 31, 2022 were as follows:
| Purchases | Sales |
| $189,249,580 | $259,952,591 |
There were no purchases or sales of U.S. Government securities for the fiscal year ended December 31, 2022.
The Fund is permitted to purchase and sell securities (“cross-trade”) from and to other Lord Abbett funds or client accounts pursuant to procedures approved by the Board in compliance with Rule 17a-7 under the Act (the “Rule”). Each cross-trade is executed at a fair market price in compliance with provisions of the Rule. For the fiscal year ended December 31, 2022, the Fund engaged in cross-trades purchases of $272,924.
| 6. | DISCLOSURES ABOUT OFFSETTING ASSETS AND LIABILITIES |
The Financial Accounting Standards Board requires disclosures intended to help better assess the effect or potential effect of offsetting arrangements on a fund’s financial position. The following tables illustrate gross and net information about recognized assets and liabilities eligible for offset in the Statement of Assets and Liabilities, and disclose such amounts subject to an enforceable master netting agreement or similar agreement, by the counterparty. A master netting agreement is an agreement between a fund and a counterparty which provides for the net settlement of amounts owed under all contracts traded under that agreement, as well as cash collateral, through a single payment by one party to the other in the event of default on or termination of any one contract. The Fund’s accounting policy with respect to balance sheet offsetting is that, absent an event of default by the counterparty or a termination of the agreement, the master netting agreement does not result in an offset of reported amounts of financial assets and liabilities in the
22
Notes to Financial Statements (continued)
Statement of Assets and Liabilities across transactions between the Fund and the applicable counterparty:
| Description | Gross Amounts of
Recognized Assets | Gross Amounts
Offset in the
Statement of Assets
and Liabilities | Net Amounts of
Assets Presented
in the Statement of
Assets and Liabilities |
| Repurchase Agreements | $9,396,849 | $ – | $9,396,849 |
| Total | $9,396,849 | $ – | $9,396,849 |
| | | Net Amount of Assets Presented in | | Amounts Not Offset in the
Statement of Assets and Liabilities | | |
| Counterparty | | the Statement of Assets and Liabilities | | Financial Instruments | | Cash Collateral Received(a | ) | Securities Collateral Received(a | ) | Net Amount(b) |
| Fixed Income Clearing Corp. | | $9,396,849 | | $ – | | $ – | | $(9,396,849 | ) | $ – |
| Total | | $9,396,849 | | $ – | | $ – | | $(9,396,849 | ) | $ – |
| (a) | Collateral disclosed is limited to an amount not to exceed 100% of the net amount of assets (liabilities) presented in the Statement of Assets and Liabilities, for each respective counterparty. |
| (b) | Net amount represents the amount owed to the Fund by the counterparty as of December 31, 2022. |
| 7. | DIRECTORS’ REMUNERATION |
The Company’s officers and one Director, who are associated with Lord Abbett, do not receive any compensation from the Company for serving in such capacities. Independent Directors’ fees are allocated among all Lord Abbett-sponsored funds based on the net assets of each fund. There is an equity-based plan available to all Independent Directors under which Independent Directors may elect to defer receipt of a portion of Directors’ fees. The deferred amounts are treated as though equivalent dollar amounts had been invested in the Fund. Such amounts and earnings accrued thereon are included in Directors’ fees on the Statement of Operations and in Directors’ fees payable on the Statement of Assets and Liabilities and are not deductible for U.S. federal income tax purposes until such amounts are paid.
The Company has entered into an arrangement with its transfer agent and custodian, whereby credits realized as a result of uninvested cash balances are used to reduce a portion of the Fund’s expenses.
For the period ended August 3, 2022, the Fund and certain other funds managed by Lord Abbett (collectively, the “Participating Funds”) entered into a syndicated line of credit facility with various lenders for $1.275 billion (the “Syndicated Facility”) whereas State Street Bank and Trust Company (“SSB”) participated as a lender and as agent for the lenders. The Participating Funds were subject to graduated borrowing limits of one-third of fund net assets (if fund net assets are less than $750 million), $250 million, $300 million, $700 million, or $1 billion, based on past borrowings and likelihood of future borrowings, among other factors.
Effective August 4, 2022, the Participating Funds entered into a Syndicated Facility with various lenders for $1.625 billion whereas SSB participates as a lender and as agent for the lenders. The
23
Notes to Financial Statements (continued)
Participating Funds were subject to graduated borrowing limits of one-third of fund net assets (if fund net assets are less than $750 million), $250 million, $300 million, $700 million, or $1 billion, based on past borrowings and likelihood of future borrowings, among other factors.
For the period ended August 3, 2022, the Participating Funds were party to an additional line of credit facility with SSB for $330 million (the “Bilateral Facility”), $250 million committed and $80 million uncommitted. Under the Bilateral Facility, the Participating Funds are subject to graduated borrowing limits of one-third of fund net assets (if net assets are less than $750 million), $250 million, $300 million, or $330 million, based on past borrowings and likelihood of future borrowings, among other factors.
Effective August 4, 2022, the Participating Funds are party to an additional uncommitted line of credit facility with SSB for $330 million. Under the Bilateral Facility, the Participating Funds are subject to borrowing limits of one-third of fund net assets (if net assets are less than $750 million), or $250 million based on past borrowings and likelihood of future borrowings, among other factors.
The Syndicated Facility and the Bilateral Facility are to be used for temporary or emergency purposes as additional sources of liquidity to satisfy redemptions.
For the year ended December 31, 2022, the Fund did not utilize the Syndicated Facility or Bilateral Facility.
| 10. | INTERFUND LENDING PROGRAM |
Pursuant to an exemptive order issued by the U.S. Securities and Exchange Commission (“SEC exemptive order”) certain registered open-end management investment companies managed by Lord Abbett, including the Fund, participate in a joint lending and borrowing program (the “Interfund Lending Program”). The SEC exemptive order allows the funds that participate in the Interfund Lending Program to borrow money from and lend money to each other for temporary or emergency purposes subject to the limitations and conditions.
For the fiscal year ended December 31, 2022 the Fund participated as a lender in the Interfund Lending Program. For the period in which the loan was outstanding, the average amount loaned, interest rate and interest income were as follows:
Average
Amount Loaned | | Average
Interest Rate | | Interest
Income* |
| $10,228,858 | | 1.02 % | | $ 286 |
| * | Statement of Operations location: Interest earned from Interfund Lending. |
| 11. | CUSTODIAN AND ACCOUNTING AGENT |
SSB is the Company’s custodian and accounting agent. SSB performs custodial, accounting and recordkeeping functions relating to portfolio transactions and calculating the Fund’s NAV.
| 12. | SECURITIES LENDING AGREEMENT |
The Fund has established a securities lending agreement with Citibank, N.A. for the lending of securities to qualified brokers in exchange for securities or cash collateral equal to at least the market value of securities loaned, plus interest, if applicable. Cash collateral is invested in an approved money market fund. In accordance with the Fund’s securities lending agreement, the market value of securities on loan is determined each day at the close of business and any
24
Notes to Financial Statements (continued)
additional collateral required to cover the value of securities on loan is delivered to the Fund on the next business day. As with other extensions of credit, the Fund may experience a delay in the recovery of its securities or incur a loss should the borrower of the securities breach its agreement with the Fund or the borrower becomes insolvent at a time when the collateral is insufficient to cover the cost of repurchasing securities on loan. Any income earned from securities lending is included in Securities lending net income on the Fund’s Statement of Operations.
The initial collateral received by the Fund is required to have a value equal to at least 100% of the market value of the securities loaned. The collateral must be marked-to-market daily to cover increases in the market value of the securities loaned (or potentially a decline in the value of the collateral). In general, the risk of borrower default will be borne by Citibank, N.A.; the Fund will bear the risk of loss with respect to the investment of the cash collateral. The advantage of such loans is that the Fund continues to receive income on loaned securities while receiving a portion of any securities lending fees and earning returns on the cash amounts which may be reinvested for the purchase of investments in securities.
As of December 31, 2022 the Fund did not loan any securities.
The Fund is subject to the general risks and considerations associated with equity investing, as well as the particular risks associated with value stocks. The value of an investment will fluctuate in response to movements in the equity securities market in general and to the changing prospects of individual companies in which the Fund invests. The market may, over an extended period of time, fail to recognize the intrinsic value of particular value stocks the Fund may hold. Value investing also is subject to the risk that the company judged to be undervalued may actually be appropriately priced or even overpriced. Large-cap value stocks may perform differently than the market as a whole and other types of stocks, such as small company stocks and growth stocks. This is because different types of stocks tend to shift in and out of favor over time depending on market and economic conditions as well as investor sentiment. In addition, large companies may have smaller rates of growth as compared to successful but well established smaller companies. The market may fail to recognize the intrinsic value of particular value stocks for a long time. In addition, if the Fund’s assessment of a company’s value or prospects for exceeding earnings expectations or market conditions is wrong, the Fund could suffer losses or produce poor performance relative to other funds, even in a favorable market.
Due to the Fund’s investment exposure to foreign companies and American Depositary Receipts, the Fund may experience increased market, industry and sector liquidity, currency, political, information, and other risks. The securities of foreign companies also may be subject to inadequate exchange control regulations, the imposition of economic sanctions or other government restrictions, higher transaction and other costs, and delays in settlement to the extent they are traded on non-U.S. exchanges or markets.
Geopolitical and other events (e.g., wars, terrorism, natural disasters, epidemics or pandemics such as the COVID-19 outbreak which began in late 2019) may disrupt securities markets and adversely affect global economies and markets, thereby decreasing the value of the Fund’s investments. Market disruptions can also prevent the Fund from implementing its investment strategies and achieving its investment objective.
The transmission of COVID-19 and efforts to contain its spread have resulted in, among other things, border closings and other significant travel restrictions and disruptions, significant
25
Notes to Financial Statements (concluded)
disruptions to business operations, supply chains and customer activity, lower consumer demand for goods and services, event cancellations and restrictions, service cancellations, reductions and other changes, significant challenges in healthcare service preparation and delivery, and prolonged quarantines, as well as general concern and uncertainty. The impact of the COVID-19 outbreak has, and could again, negatively affect the global economy, the economies of individual countries, and the financial performance of individual issuers, sectors, industries, asset classes, and markets in significant and unforeseen ways.
The COVID-19 pandemic and its effects may last for an extended period of time. Although the economic fallout of COVID-19 is difficult to predict, it has contributed to and is likely to continue to contribute to, market volatility, inflation and systemic economic weakness. The foregoing could disrupt the operations of the Fund and its service providers, adversely affect the value and liquidity of the Fund’s investments, and negatively impact the Fund’s performance and your investment in the Fund.
These factors, and others, can affect the Fund’s performance.
| 14. | SUMMARY OF CAPITAL TRANSACTIONS |
Transactions in shares of capital stock were as follows:
| | | Year Ended
December 31, 2022 | | | Year Ended
December 31, 2021 | |
| Shares sold | | | 312,982 | | | | 182,973 | |
| Reinvestment of distributions | | | 1,438,694 | | | | 1,735,960 | |
| Shares reacquired | | | (2,177,278 | ) | | | (2,494,375 | ) |
| Decrease | | | (425,602 | ) | | | (575,442 | ) |
26
Report of Independent Registered Public Accounting Firm
To the shareholders and the Board of Directors of Lord Abbett Series Fund, Inc.
Opinion on the Financial Statements and Financial Highlights
We have audited the accompanying statement of assets and liabilities, including the schedule of investments, of Growth and Income Portfolio, one of the funds constituting Lord Abbett Series Fund, Inc. (the “Fund”), as of December 31, 2022, the related statement of operations for the year then ended, the statements of changes in net assets for each of the two years in the period then ended, the financial highlights for each of the five years in the period then ended, and the related notes. In our opinion, the financial statements and financial highlights present fairly, in all material respects, the financial position of Growth and Income Portfolio of the Fund as of December 31, 2022, and the results of its operations for the year then ended, the changes in its net assets for each of the two years in the period then ended, and the financial highlights for each of the five years in the period then ended in conformity with accounting principles generally accepted in the United States of America.
Basis for Opinion
These financial statements and financial highlights are the responsibility of the Fund’s management. Our responsibility is to express an opinion on the Fund’s financial statements and financial highlights based on our audits. We are a public accounting firm registered with the Public Company Accounting Oversight Board (United States) (PCAOB) and are required to be independent with respect to the Fund in accordance with the U.S. federal securities laws and the applicable rules and regulations of the Securities and Exchange Commission and the PCAOB.
We conducted our audits in accordance with the standards of the PCAOB. Those standards require that we plan and perform the audit to obtain reasonable assurance about whether the financial statements and financial highlights are free of material misstatement, whether due to error or fraud. The Fund is not required to have, nor were we engaged to perform, an audit of its internal control over financial reporting. As part of our audits we are required to obtain an understanding of internal control over financial reporting but not for the purpose of expressing an opinion on the effectiveness of the Fund’s internal control over financial reporting. Accordingly, we express no such opinion.
Our audits included performing procedures to assess the risks of material misstatement of the financial statements and financial highlights, whether due to error or fraud, and performing procedures that respond to those risks. Such procedures included examining, on a test basis, evidence regarding the amounts and disclosures in the financial statements and financial highlights. Our audits also included evaluating the accounting principles used and significant estimates made by management, as well as evaluating the overall presentation of the financial statements and financial highlights. Our procedures included confirmation of securities owned as of December 31, 2022, by correspondence with the custodian and brokers; when replies were not received from brokers, we performed other auditing procedures. We believe that our audits provide a reasonable basis for our opinion.
DELOITTE & TOUCHE LLP
New York, New York
February 14, 2023
We have served as the auditor of one or more Lord Abbett Family of Funds’ investment companies since 1932.
27
Basic Information About Management
The Board is responsible for the management of the business and affairs of the Fund in accordance with the laws of the state of organization. The Board elects officers who are responsible for the day-to-day operations of the Fund and who execute policies authorized by the Board. The Board also approves an investment adviser to the Fund and continues to monitor the cost and quality of the services the investment adviser provides, and annually considers whether to renew the contract with the investment adviser. Generally, each Board member holds office until his/her successor is elected and qualified or until his/her earlier resignation or removal, as provided in the Fund’s organizational documents.
Lord, Abbett & Co. LLC (“Lord Abbett”), a Delaware limited liability company, is the Fund’s investment adviser. Designated Lord Abbett personnel are responsible for the day-to-day management of the Fund.
Independent Board Members
The following Independent Board Members also are board members of each of the 15 investment companies in the Lord Abbett Family of Funds, which consist of 63 investment portfolios.
Name, Address and
Year of Birth | | Current Position and
Length of Service
with the Fund | | Principal Occupation and Other Directorships
During the Past Five Years |
Evelyn E. Guernsey
Lord, Abbett & Co. LLC
c/o Legal Dept.
90 Hudson Street
Jersey City, NJ 07302
(1955) | | Board member since 2011;
Vice Chair since 2023 | | Principal Occupation: None.
Other Directorships: None. |
| | | | | |
Julie A. Hill
Lord, Abbett & Co. LLC
c/o Legal Dept.
90 Hudson Street
Jersey City, NJ 07302
(1946) | | Board member since 2004 | | Principal Occupation: Owner and CEO of The Hill Company, a business consulting firm (since 1998).
Other Directorships: Previously served as director of Anthem, Inc., a health benefits company (1994–2021). |
| | | | | |
Kathleen M. Lutito
Lord, Abbett & Co. LLC
c/o Legal Dept.
90 Hudson Street
Jersey City, NJ 07302
(1963) | | Board member since 2017 | | Principal Occupation: President and Chief Investment Officer of CenturyLink Investment Management Company (since 2006).
Other Directorships: None. |
| | | | | |
James M. McTaggart
Lord, Abbett & Co. LLC
c/o Legal Dept.
90 Hudson Street
Jersey City, NJ 07302
(1947) | | Board member since 2012 | | Principal Occupation: Owner of McTaggart LLC (since 2011).
Other Directorships: None. |
| | | | | |
Charles O. Prince
Lord, Abbett & Co. LLC
c/o Legal Dept.
90 Hudson Street
Jersey City, NJ 07302
(1950) | | Board member since 2019 | | Principal Occupation: None. Formerly Chair and Chief Executive Officer, Citigroup, Inc. (Retired 2007).
Other Directorships: Previously served as director of Johnson & Johnson (2005–2022). Previously served as director of Xerox Corporation (2007–2018). |
28
Basic Information About Management (continued)
Name, Address and
Year of Birth | | Current Position and
Length of Service
with the Fund | | Principal Occupation and Other Directorships
During the Past Five Years |
Karla M. Rabusch
Lord, Abbett & Co. LLC
c/o Legal Dept.
90 Hudson Street
Jersey City, NJ 07302
(1959) | | Board member since 2017 | | Principal Occupation: President and Director of Wells Fargo Funds Management, LLC (2003–2017); President of Wells Fargo Funds (2003–2016).
Other Directorships: None. |
| | | | | |
Lorin Patrick Taylor Radtke
Lord, Abbett & Co. LLC
c/o Legal Dept.
90 Hudson Street
Jersey City, NJ 07302
(1968) | | Board member since 2021 | | Principal Occupation: Partner and Co-Founder of M Seven 8 Partners LLC, a venture capital firm (since 2016). Formerly Partner, Goldman Sachs (1992–2016).
Other Directorships: Currently serves as director of Assured Guaranty (2021–Present), Virtual Combine (2018–Present), and Mariposa Family Learning Center (2021–Present). Previously served as director of SummerMoon Coffee (2022). |
| | | | | |
Leah Song Richardson
Lord, Abbett & Co. LLC
c/o Legal Dept.
90 Hudson Street
Jersey City, NJ 07302
(1966) | | Board member since 2021 | | Principal Occupation: President of Colorado College (since 2021) and was formerly Dean at University of California, Irvine–School of Law (2017–2021) and formerly Professor of Law at University of California, Irvine (2014–2017).
Other Directorships: None. |
| | | | | |
Mark A. Schmid
Lord, Abbett & Co.
LLC c/o Legal Dept.
90 Hudson Street
Jersey City, NJ 07302
(1959) | | Board member since 2016 | | Principal Occupation: Vice President and Chief Investment Officer of the University of Chicago (2009–2021).
Other Directorships: None. |
| | | | | |
James L.L. Tullis
Lord, Abbett & Co. LLC
c/o Legal Dept.
90 Hudson Street
Jersey City, NJ 07302
(1947) | | Board member since 2006; Chair since 2017 | | Principal Occupation: Chair of Tullis Health Investors – FL LLC (since 2018); CEO of Tullis-Dickerson and Co. Inc., a venture capital management firm (1990–2016).
Other Directorships: Currently serves as Chair of Crane Co. (since 2020, director since 1998), Director of Alphatec Spine (since 2018), and Director of Exagen Inc. (since 2019). Previously served as director of electroCore, Inc. (2018–2020). |
Interested Board Members
Mr. Sieg is affiliated with Lord Abbett and is an “interested person” of the Fund as defined in the Act. Mr. Sieg is a board member of each of the 15 investment companies in the Lord Abbett Family of Funds, which consist of 63 investment portfolios. Mr. Sieg is an officer of the Lord Abbett Family of Funds.
29
Basic Information About Management (continued)
Name, Address and
Year of Birth | | Current Position and
Length of Service
with the Fund | | Principal Occupation and Other Directorships
During the Past Five Years |
Douglas B. Sieg
Lord, Abbett & Co. LLC
90 Hudson Street
Jersey City, NJ 07302
(1969) | | Board member since 2016 | | Principal Occupation: Managing Partner of Lord Abbett (since 2018) and was formerly Head of Client Services, joined Lord Abbett in 1994.
Other Directorships: None. |
Officers
None of the officers listed below have received compensation from the Fund. All of the officers of the Fund also may be officers of the other Lord Abbett Funds and maintain offices at 90 Hudson Street, Jersey City, NJ 07302. Unless otherwise indicated, the position(s) and title(s) listed under the “Principal Occupation During the Past Five Years” column indicate each officer’s position(s) and title(s) with Lord Abbett. Each officer serves for an indefinite term (i.e., until his or her death, resignation, retirement, or removal).
Name and
Year of Birth | | Current Position
with the Fund | | Length of Service
of Current
Position | | Principal Occupation
During the Past Five Years |
Douglas B. Sieg
(1969) | | President and Chief Executive Officer | | Elected as President and Chief Executive Officer in 2018 | | Managing Partner of Lord Abbett (since 2018) and was formerly Head of Client Services, joined Lord Abbett in 1994. |
| | | | | | | |
Jackson C. Chan
(1964) | | AML Compliance Officer | | Elected in 2018 | | Deputy Chief Compliance Officer and Director of Regulatory Affairs, joined Lord Abbett in 2014. |
| | | | | | | |
Michael J. Hebert
(1976) | | Chief Financial Officer and Treasurer | | Elected as Chief Financial Officer and Treasurer in 2021 | | Head of Global Fund Finance, joined Lord Abbett in 2021 and was formerly Vice President at Eaton Vance Management (EVM) (2014–2021) and Calvert Research & Management (CRM) (2016–2021), and Assistant Treasurer of registered investment companies managed, advised or administered by EVM and CRM during such years. |
| | | | | | | |
Jennifer C. Karam
(1970) | | Vice President and Assistant Secretary | | Elected in 2022 | | Partner and Senior Deputy General Counsel, joined Lord Abbett in 2012. |
| | | | | | | |
Joseph M. McGill
(1962) | | Chief Compliance Officer | | Elected in 2014 | | Partner and Chief Compliance Officer, joined Lord Abbett in 2014. |
| | | | | | | |
Parker J. Milender
(1989) | | Vice President and Assistant Secretary | | Elected in 2023 | | Counsel, joined Lord Abbett in 2021 and was formerly an Associate at Milbank LLP (2017–2021). |
30
Basic Information About Management (concluded)
Name and
Year of Birth | | Current Position
with the Fund | | Length of Service
of Current
Position | | Principal Occupation
During the Past Five Years |
Matthew A. Press
(1987) | | Vice President and Assistant Secretary | | Elected in 2023 | | Counsel, joined Lord Abbett in 2022 and was formerly an Associate at Clifford Chance US LLP (2014–2022). |
| | | | | | | |
Lawrence B. Stoller
(1963) | | Vice President, Secretary and Chief Legal Officer | | Elected as Vice President and Secretary in 2007 and Chief Legal Officer in 2019 | | Partner and General Counsel, joined Lord Abbett in 2007. |
| | | | | | | |
Victoria Zozulya
(1983) | | Vice President and Assistant Secretary | | Elected in 2022 | | Counsel, joined Lord Abbett in 2022 and was formerly Senior Director and Counsel at Equitable (2018–2022) and Assistant General Counsel at Neuberger Berman (2014–2018). |
| | | | | | | |
Nicholas D. Emguschowa
(1986) | | Data Protection Officer | | Elected in 2022 | | Assistant General Counsel, joined Lord Abbett in 2018 and was formerly Associate at Shearman & Sterling (2014–2018). |
Please call 888-522-2388 for a copy of the statement of additional information, which contains further information about the Fund’s Board members. It is available free upon request.
31
Householding
The Company has adopted a policy that allows it to send only one copy of the Fund’s prospectus, proxy material, annual report and semiannual report (or related notice of internet availability of annual report and semiannual report) to certain shareholders residing at the same “household.” This reduces Fund expenses, which benefits you and other shareholders. If you need additional copies or do not want your mailings to be “householded,” please call Lord Abbett at 888-522-2388 or send a written request with your name, the name of your fund or funds and your account number or numbers to Lord Abbett Family of Funds, P.O. Box 219336, Kansas City, MO 64121.
Proxy Voting Policies, Procedures and Records
A description of the policies and procedures that Lord Abbett uses to vote proxies related to the Fund’s portfolio securities, and information on how Lord Abbett voted the Fund’s proxies during the 12-month period ended June 30 are available without charge, upon request, (i) by calling 888-522-2388; (ii) on Lord Abbett’s website at www.lordabbett.com; and (iii) on the Securities and Exchange Commission’s (“SEC”) website at www.sec.gov.
Shareholder Reports and Quarterly Portfolio Disclosure
The Fund is required to file its complete schedule of portfolio holdings with the SEC for its first and third fiscal quarters as an attachment to Form N-PORT. Copies of the filings are available without charge, upon request on the SEC’s website at www.sec.gov and may be available by calling Lord Abbett at 888-522-2388.
Tax Information (unaudited)
For corporate shareholders, 100% of the Fund’s ordinary income distributions qualified for the dividends received deduction.
Additionally, of the distributions paid to the shareholders during the fiscal year ended December 31, 2022, $40,448,533 represent long-term capital gains.
32


| This report, when not used for the general information of shareholders of the Fund, is to be distributed only if preceded or accompanied by a current fund prospectus. | | | | |
| | | | | |
Lord Abbett mutual fund shares are distributed by
LORD ABBETT DISTRIBUTOR LLC. | | Lord Abbett Series Fund, Inc. Growth and Income Portfolio | | LASFGI-2
(02/23) |

LORD ABBETT
ANNUAL REPORT
Lord Abbett
Series Fund—Growth Opportunities Portfolio
For the fiscal year ended December 31, 2022
Table of Contents
Lord Abbett Series Funds – Growth Opportunities Portfolio
Annual Report
For the fiscal year ended December 31, 2022
 From left to right: James L.L. Tullis, Independent Chair of the Lord Abbett Funds and Douglas B. Sieg, Director, President and Chief Executive Officer of the Lord Abbett Funds. | | Dear Shareholders: We are pleased to provide you with this overview of the performance of Lord Abbett Series Fund — Growth Opportunities Portfolio for the fiscal year ended December 31, 2022. On this page and the following pages, we discuss the major factors that influenced fiscal year performance. For detailed and timely information about the Fund, please visit our website at www.lordabbett.com, where you can also access the quarterly commentaries that provide updates on the Fund’s performance and other portfolio related updates. Thank you for investing in Lord Abbett mutual funds. We value the trust that you place in us and look forward to serving your investment needs in the years to come. Best regards,  Douglas B. Sieg Director, President and Chief Executive Officer |
For the fiscal year ended December 31, 2022, the Fund returned -32.53%, reflecting performance at the net asset value (“NAV”) of Class VC shares with all distributions reinvested, compared to its benchmark, the Russell Midcap® Growth Index1, which returned -26.72% over the same period.
U.S. markets faced many challenges throughout the twelve-month period ending December 31, 2022, including the spread of the Omicron variant of COVID-19, supply chain dislocations, labor shortages, inflationary pressures, tighter fiscal and monetary policy, and Russia’s invasion of Ukraine. The Dow Jones Industrial Average and S&P 500® Index fell -6.86% and -18.11%, respectively, while the tech-heavy Nasdaq Composite suffered even greater losses, falling -32.54%. Value stocks2
significantly outperformed growth stocks3 (-7.98% vs -28.97%), while large cap stocks4 slightly edged out small cap stocks5 (-19.13% vs -20.44%).
To begin the twelve-month period, U.S. markets grappled with COVID-19 cases hitting the highest levels of the pandemic, rising above 580,000 new cases in the last week of December 2021, more than doubling the previous record high. The spike in cases occurred shortly after the World Health Organization designated the newly discovered Omicron variant as a “variant of concern”, leading to one of the largest selloffs of U.S. risk assets since the start of the pandemic, amid fears that the world would succumb to a new wave of infections. However, negative sentiment quickly reversed as cases proved to be
1
generally less severe than prior strains. Market sentiment also increased after the Center for Disease Control shortened its suggested isolation policy for those infected from 10 days to five.
Inflationary concerns began to take focus towards the end of 2021 and became a dominant story throughout the period. Headline consumer price index (CPI) readings had hovered a little above 5% year-over-year for most of 2021, which led investors to question whether this period of rising prices would be more persistent than originally thought. This debate was intensified by the December 2021 headline CPI rising 7.0% year-over-year, the fastest pace since 1982. The sharp increase in prices was generally due to supply and demand imbalances across multiple industries, led initially by energy, food, and used cars. Inflation readings continued to climb throughout the first half of 2022, peaking at 9.1% year-over-year in June. Increases in energy costs were even more profound, rising by more than 30% year-over-year by the end of June. The energy sector, which had been subject to rising consumer demand as global economies reopened from lockdowns induced by COVID-19, faced added friction with Russia’s invasion of Ukraine since Russia has been a large exporter of oil and certain minerals. Various sanctions imposed on Russia from Western nations led to a surge in commodity prices, with crude oil reaching over $100 per barrel for the first time since 2014.
The surge in prices forced the U.S. Federal Reserve (Fed) into a more aggressive approach to combating inflation. After remaining mostly consistent in its messaging that price pressures would likely be transitory, elevated and more persistent inflation pressures caused the Fed to move the target federal funds rate into more restrictive territory. This resulted in a 25 basis point (bps) hike in the federal funds rate at the March Federal Open Market Committee (FOMC) meeting, the first hike in more than three years. Six additional rate hikes of
50 bps, 75 bps, 75 bps, 75 bps, 75 bps, and 50 bps, respectively, followed in the succeeding months as inflation prints continued to come in hotter than expected, resulting in a federal funds rate of 4.5% by the end of the period, the highest level in 15 years. While the shift down in the pace of rate hikes supported the narrative that the Fed may begin to cut rates by the end of 2023, the Fed’s updated Summary of Economic Projections showed a more hawkish outlook, raising the outlook for the fed funds rate through 2025 from September’s forecasts - including a median forecast of 5.1% for 2023, 4.1% in 2024, and 3.1% in 2025. Fed Chair Powell also struck a hawkish tone in the press conference following the December FOMC meeting, sticking to the higher-for-longer messaging. Bond yields shot up over the period in response to this aggressive policy, leading to a bearish curve flattening and ultimately a yield curve inversion, as shorter-term yields moved higher than longer-term yields.
Separately, global markets faced increased geopolitical tensions due to Russia’s invasion of Ukraine on February 23rd. Tensions remained elevated for the remainder of the twelve-month period, as Russia continued to weaponize energy flows, annexed four Ukrainian regions, and ratcheted up its nuclear warnings. In addition, the rhetoric between the U.S. and China over Taiwan further heated up after U.S. House of Representatives Speaker Nancy Pelosi visited Taiwan in August.
Key macroeconomic indicators mostly trended lower throughout the period, with the U.S. reporting negative gross domestic product of -1.6% in the first quarter of 2022 and -0.6% in the second quarter before growing 3.2% in the third quarter. Worries among investors that a recession was pending continued to grow, leading to a decline in the consumer confidence index to lower levels than during the height of the COVID-19 pandemic and the global financial crisis of 2008.
2
Despite rising recessionary signs, select bright spots in the U.S. economy supported the idea that a potential recession would be shallow. For example, one positive development was the peak inflation narrative, which included a 99-day stretch of declines in U.S. gasoline prices and November CPI coming in better than expected on both the headline and core numbers. In addition, apartment rents fell for the first time in nearly two years in July, and lumber prices declined by more than 70% from their March peak late in the third quarter, falling back to pre-COVID levels. The third quarter of the 2022 earnings season also generated a lot of “better-than-feared” takeaways, including a common theme of relatively stable demand and pricing power protecting margins. While third quarter earnings were slightly below expectations, comments from management generally provided evidence of healthy consumer spending. Capital return and capital expenditures were also mentioned as relative bright spots as companies flagged easing labor shortages and supply chain constraints. The U.S. labor market also remained strong over the period, with the national unemployment rate at 3.5% as of the end of December.
Over the twelve-month period ending December 31, 2022, Lord Abbett made the strategic decision to offer a single style of growth investing, led by our Innovation Growth team, which is led by F. Thomas O’Halloran, J.D., CFA, Partner & Portfolio Manager, and Matthew DeCicco, CFA, Partner & Director of Equities. As a result of this enhanced focus, the investment philosophy and process of the Growth Opportunities Portfolio changed to become consistent with the rest of the innovation growth suite of products. As such, the portfolio management team seeks to invest in the stocks of companies with strong business models, management, and competitive positions that are targeting markets that appear most likely to benefit from increased innovation.
As a result of supply chain dislocations, labor shortages, inflationary pressures, tighter fiscal and monetary policy, and the war in Ukraine, high innovation small and mid-cap companies, particularly those aggressively reinvesting in research and development to drive future revenues and earnings, underperformed lower growth, lower valuation stocks within the index during the period as investors had largely expressed a preference for companies with positive earnings today, compared to larger growth potential in the future. As such, the Fund’s exposure to small and mid-cap secular growth companies, such as MongoDB, Inc., a general-purpose database platform, was a primary drag on relative performance.
In addition, having no exposure to shares of companies related to the oil, gas, and consumable fuel industry throughout the first few months of 2022 was also a primary detractor from relative performance. Geopolitical tensions that ultimately culminated in the Russian invasion of Ukraine resulted in oil prices rising above $120 per barrel as the market anticipated a supply shortage.
Although security selection within the consumer discretionary sector contributed to relative performance over the period, the Fund’s position in Roku, Inc., a manufacturer of digital media players for video streaming, was a notable individual detractor. In February, shares of the stock fell after the company reported a revenue miss for the fourth quarter of 2021 and gave first-quarter 2022 guidance that was below analysts’ expectations. Management attributed the slowing revenue growth to continued supply chain disruptions impacting the U.S. television market.
Conversely, although security selection within the information technology sector was a net detractor from relative performance over the period, the Fund’s position in Enphase Energy, Inc., an energy technology company that develops and manufactures
3
solar micro-inverters, battery energy storage, and electric vehicle charging stations, was a standout individual contributor. Enphase benefited greatly from increased demand for solar solutions in Europe as a result of persistent energy shortages. In the company’s most recent quarterly earnings report, management reported top- and bottom-line earnings results that exceeded consensus expectations. Notably, Enphase’s reported strong revenue growth driven by growth in microinverter and IQ battery shipments.
As mentioned above, security selection within the consumer discretionary sector also contributed to relative performance over the period. Within the sector, the Fund’s off-benchmark position in Crocs, Inc., a manufacturer of casual footwear,
apparel, and accessories, was a notable contributor to relative performance. Shares of the stock soared in the fourth quarter after the company reported top- and bottom-line quarterly results that were above market expectations. Management also raised full year guidance, citing explosive growth in international sales, led by the Asia Pacific region. In addition, management also raised the medium-term outlook on Hey Dude, which Crocs acquired earlier in the year.
The Fund’s portfolio is actively managed and, therefore, its holdings and the weightings of a particular issuer or particular sector as a percentage of portfolio assets are subject to change. Sectors may include many industries.
1 The Russell Midcap® Growth Index measures the performance of those Russell Midcap® companies with higher price-to-book ratios and higher forecasted growth values.
2 As represented by the Russell 3000® Value Index as of 12/31/2022.
3 As represented by the Russell 3000® Growth Index as of 12/31/2022.
4 As represented by the Russell 1000® Index as of 12/31/2022.
5 As represented by the Russell 2000® Index as of 12/31/2022.
Unless otherwise specified, indexes reflect total return, with all dividends reinvested. Indexes are unmanaged, do not reflect the deduction of fees or expenses, and are not available for direct investment.
Important Performance and Other Information
Performance data quoted in the following pages reflect past performance and are no guarantee of future results. Current performance may be higher or lower than the performance quoted. The investment return and principal value of an investment in the Fund will fluctuate so that shares, on any given day or when redeemed, may be worth more or less than their original cost. You can obtain performance data current to the most recent month end by calling Lord Abbett at 888-522-2388 or referring to www.lordabbett.com.
During certain periods shown, expense waivers and reimbursements were in place. Without such expense waivers and reimbursements, the Fund’s returns would have been lower.
The annual commentary above discusses the views of the Fund’s management and various portfolio holdings of the Fund as of December 31, 2022. These views and portfolio holdings may have changed after this date. Information provided in the commentary is not a recommendation to buy or sell securities. Because the Fund’s portfolio is actively managed and may change significantly, the Fund may no longer own the securities described above or may have otherwise changed its position in the securities. For more recent information about the Fund’s portfolio holdings, please visit www.lordabbett.com.
A Note about Risk: See Notes to Financial Statements for a discussion of investment risks. For a more detailed discussion of the risks associated with the Fund, please see the Fund’s prospectus.
Mutual funds are not insured by the FDIC, are not deposits or other obligations of, or guaranteed by, banks, and are subject to investment risks including possible loss of principal amount invested.
The Fund serves as an underlying investment vehicle for variable annuity contracts and variable life insurance policies.
4
Investment Comparison
Below is a comparison of a $10,000 investment in Class VC shares with the same investment in both the Russell Midcap® Growth Index and the Russell Midcap® Index, assuming reinvestment of all dividends and distributions. The Fund’s shares are sold only to insurance company separate accounts that fund certain variable annuity and variable life contracts. The line graph comparison does not reflect the sales charges or other expenses of these contracts. If those sales charges and expenses were reflected, returns would be lower. The graph and performance table below do not reflect the deduction of taxes that a shareholder would pay on Fund distributions or the redemption of Fund shares. During certain periods, expenses of the Fund have been waived or reimbursed by Lord Abbett; without such waiver or reimbursement of expenses, the Fund’s returns would have been lower. During certain periods, expenses of the Fund have been waived or reimbursed by Lord Abbett; without such waiver or reimbursement of expenses, the Fund’s returns would have been lower. Past performance is no guarantee of future results.
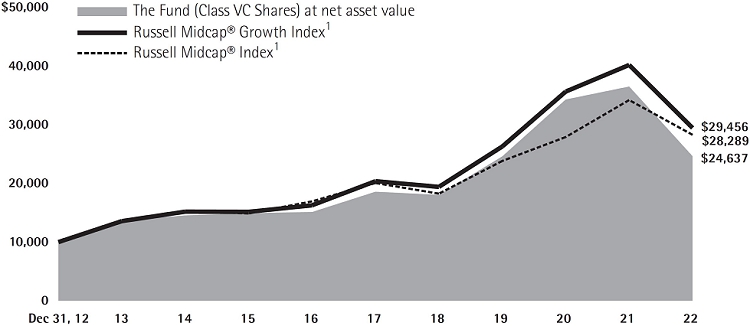
Average Annual Total Returns for the
Periods Ended December 31, 2022 |
| | | 1 Year | | 5 Years | | 10 Years | |
| Class VC | | -32.53% | | 5.80% | | 9.44% | |
1 Performance for each unmanaged index does not reflect any fees or expenses. The performance of each index is not necessarily representative of the Fund’s performance.
5
Expense Example
As a shareholder of the Fund, you incur ongoing costs, including management fees; expenses related to the Fund’s services arrangements with certain insurance companies; and other Fund expenses. This Example is intended to help you understand your ongoing costs (in dollars) of investing in the Fund and to compare these costs with the ongoing costs of investing in other mutual funds.
The Example is based on an investment of $1,000 invested at the beginning of the period and held for the entire period (July 1, 2022 through December 31, 2022).
The Example reflects only expenses that are deducted from the assets of the Fund. Fees and expenses, including sales charges applicable to the various insurance products that invest in the Fund, are not reflected in this Example. If such fees and expenses were reflected in the Example, the total expenses shown would be higher. Fees and expenses regarding such variable insurance products are separately described in the prospectus related to those products.
Actual Expenses
The first line of the table on the following page provides information about actual account values and actual expenses. You may use the information in this line, together with the amount you invested, to estimate the expenses that you paid over the period. Simply divide your account value by $1,000 (for example, an $8,600 account value divided by $1,000 = 8.6), then multiply the result by the number in the first line under the heading titled “Expenses Paid During Period 7/1/22 – 12/31/22” to estimate the expenses you paid on your account during this period.
Hypothetical Example for Comparison Purposes
The second line of the table on the following page provides information about hypothetical account values and hypothetical expenses based on the Fund’s actual expense ratio and an assumed rate of return of 5% per year before expenses, which is not the Fund’s actual return. The hypothetical account values and expenses may not be used to estimate the actual ending account balance or expenses you paid for the period. You may use this information to compare the ongoing costs of investing in the Fund and other funds. To do so, compare this 5% hypothetical example with the 5% hypothetical examples that appear in the shareholder reports of the other funds.
6
Please note that the expenses shown in the table are meant to highlight your ongoing costs only and do not reflect any transactional costs, such as sales charges. Therefore, the second line of the table is useful in comparing ongoing costs only, and will not help you determine the relative total costs of owning different funds. In addition, if these transactional costs were included, your costs would have been higher.
| | | Beginning
Account
Value | | Ending
Account
Value | | Expenses
Paid During
Period† | |
| | | 7/1/22 | | 12/31/22 | | 7/1/22 -
12/31/22 | |
| Class VC* | | | | | | | | | | | |
| Actual | | $ | 1,000.00 | | | $ | 977.40 | | | $ | 6.08 | | |
| Hypothetical (5% Return Before Expenses) | | $ | 1,000.00 | | | $ | 1,019.06 | | | $ | 6.21 | | |
| † | Net expenses are equal to the Fund’s annualized expense ratio of 1.22%, multiplied by the average account value over the period, multiplied by 184/365 (to reflect one-half year period). |
| | |
| * | The annualized expense ratio have been updated to 1.15%. Had this updated expense ratio been in place throughout the most recent fiscal half-year, expenses paid during the period would have been: |
| Actual | | $5.73 | |
| Hypothetical (5% Return Before Expenses) | | $5.85 | |
Portfolio Holdings Presented by Sector
December 31, 2022
| Sector* | | %** |
| Communication Services | | 2.36 | % |
| Consumer Discretionary | | 20.06 | % |
| Consumer Staples | | 0.83 | % |
| Energy | | 1.88 | % |
| Financials | | 2.30 | % |
| Health Care | | 21.51 | % |
| Industrials | | 15.73 | % |
| Information Technology | | 31.34 | % |
| Materials | | 0.78 | % |
| Repurchase Agreements | | 2.67 | % |
| Money Market Funds(a) | | 0.49 | % |
| Time Deposits(a) | | 0.05 | % |
| Total | | 100.00 | % |
| * | | A sector may comprise several industries. |
| ** | | Represents percent of total investments, which excludes derivatives. |
| (a) | | Securities were purchased with the cash collateral from loaned securities. |
7
Schedule of Investments
December 31, 2022
| Investments | | Shares | | | Fair
Value | |
| LONG-TERM INVESTMENTS 95.60% | | | | | | | | |
| | | | | | | | | |
| COMMON STOCKS 95.60% | | | | | | | | |
| | | | | | | | | |
| Aerospace & Defense 4.35% | | | | | | | | |
| Axon Enterprise, Inc.* | | | 5,442 | | | $ | 902,991 | |
| Parsons Corp.* | | | 8,434 | | | | 390,072 | |
| TransDigm Group, Inc. | | | 1,347 | | | | 848,139 | |
| Total | | | | | | | 2,141,202 | |
| | | | | | | | | |
| Beverages 0.82% | | | | | | | | |
| Celsius Holdings, Inc.* | | | 3,856 | | | | 401,178 | |
| | | | | | | | | |
| Biotechnology 10.22% | | | | | | | | |
| Alnylam Pharmaceuticals, Inc.* | | | 2,408 | | | | 572,261 | |
| Argenx SE ADR* | | | 2,449 | | | | 927,755 | |
| Biogen, Inc.* | | | 2,198 | | | | 608,670 | |
| Cytokinetics, Inc.* | | | 15,341 | | | | 702,925 | |
| Genmab A/S ADR* | | | 11,730 | | | | 497,117 | |
| Karuna Therapeutics, Inc.* | | | 3,038 | | | | 596,967 | |
| Krystal Biotech, Inc.* | | | 5,031 | | | | 398,556 | |
| Sarepta Therapeutics, Inc.* | | | 5,610 | | | | 726,944 | |
| Total | | | | | | | 5,031,195 | |
| | | | | | | | |
| Capital Markets 2.27% | | | | | | | | |
| MSCI, Inc. | | | 1,565 | | | | 727,991 | |
| Raymond James Financial, Inc. | | | 3,634 | | | | 388,293 | |
| Total | | | | | | | 1,116,284 | |
| | | | | | | | | |
| Communications Equipment 4.13% | | | | | | | | |
| Arista Networks, Inc.* | | | 8,172 | | | | 991,672 | |
| Calix, Inc.* | | | 15,230 | | | | 1,042,189 | |
| Total | | | | | | | 2,033,861 | |
| | | | | | | | | |
| Construction & Engineering 2.71% | | | | | | | | |
| Comfort Systems USA, Inc. | | | 4,504 | | | | 518,320 | |
| Quanta Services, Inc. | | | 5,726 | | | | 815,955 | |
| Total | | | | | | | 1,334,275 | |
| | | | | | | | | |
| Construction Materials 0.77% | | | | | | | | |
| Vulcan Materials Co. | | | 2,159 | | | | 378,063 | |
| Investments | | Shares | | | Fair
Value | |
| Electrical Equipment 2.38% | | | | | | | | |
| AMETEK, Inc. | | | 5,722 | | | $ | 799,478 | |
| Hubbell, Inc. | | | 1,578 | | | | 370,325 | |
| Total | | | | | | | 1,169,803 | |
| | | | | | | | | |
| Entertainment 1.69% | | | | | | | | |
| Warner Music Group Corp. Class A | | | 14,336 | | | | 502,047 | |
| World Wrestling Entertainment, Inc. Class A | | | 4,789 | | | | 328,142 | |
| Total | | | | | | | 830,189 | |
| | | | | | |
| Health Care Equipment & Supplies 7.35% | | | | | |
| Axonics, Inc.* | | | 6,865 | | | | 429,268 | |
| Cooper Cos., Inc. (The) | | | 1,156 | | | | 382,255 | |
| DexCom, Inc.* | | | 10,157 | | | | 1,150,179 | |
| IDEXX Laboratories, Inc.* | | | 968 | | | | 394,905 | |
| Insulet Corp.* | | | 3,418 | | | | 1,006,225 | |
| Shockwave Medical, Inc.* | | | 1,229 | | | | 252,695 | |
| Total | | | | | | | 3,615,527 | |
| | | | | | | | | |
| Health Care Technology 0.88% | | | | | | | | |
| Inspire Medical Systems, Inc.* | | | 1,728 | | | | 435,249 | |
| | | | | | | | | |
| Hotels, Restaurants & Leisure 6.20% | | | | | | |
| Chipotle Mexican Grill, Inc.* | | | 680 | | | | 943,493 | |
| Hilton Worldwide Holdings, Inc. | | | 3,759 | | | | 474,987 | |
| Planet Fitness, Inc. Class A* | | | 8,510 | | | | 670,588 | |
| Vail Resorts, Inc. | | | 1,687 | | | | 402,097 | |
| Wingstop, Inc. | | | 4,052 | | | | 557,636 | |
| Total | | | | | | | 3,048,801 | |
| | | | | | | | | |
| Information Technology Services 5.00% | | | | | |
| Block, Inc.* | | | 7,762 | | | | 487,764 | |
| Cloudflare, Inc. Class A* | | | 8,405 | | | | 379,990 | |
| Shopify, Inc. Class A (Canada)*(a) | | | 28,209 | | | | 979,134 | |
| Toast, Inc. Class A* | | | 33,953 | | | | 612,173 | |
| Total | | | | | | | 2,459,061 | |
| 8 | See Notes to Financial Statements. |
Schedule of Investments (continued)
December 31, 2022
| Investments | | Shares | | | Fair
Value | |
| Internet & Direct Marketing Retail 4.08% | | | | | |
| Coupang, Inc. (South Korea)*(a) | | | 33,166 | | | $ | 487,872 | |
| Etsy, Inc.* | | | 5,532 | | | | 662,623 | |
| MercadoLibre, Inc. (Uruguay)*(a) | | | 1,010 | | | | 854,702 | |
| Total | | | | | | | 2,005,197 | |
| | | | | | | | | |
| Life Sciences Tools & Services 1.75% | | | | | | |
| Agilent Technologies, Inc. | | | 4,230 | | | | 633,019 | |
| Repligen Corp.* | | | 1,357 | | | | 229,754 | |
| Total | | | | | | | 862,773 | |
| | | | | | | | | |
| Machinery 3.58% | | | | | | | | |
| AGCO Corp. | | | 6,390 | | | | 886,229 | |
| Fortive Corp. | | | 7,786 | | | | 500,251 | |
| Xylem, Inc. | | | 3,412 | | | | 377,265 | |
| Total | | | | | | | 1,763,745 | |
| | | | | | | | | |
| Oil, Gas & Consumable Fuels 1.85% | | | | | |
| Antero Resources Corp.* | | | 7,033 | | | | 217,953 | |
| Cheniere Energy, Inc. | | | 3,221 | | | | 483,021 | |
| EQT Corp. | | | 6,245 | | | | 211,268 | |
| Total | | | | | | | 912,242 | |
| | | | | | | | | |
| Pharmaceuticals 1.04% | | | | | | | | |
| Intra-Cellular Therapies, Inc.* | | | 9,688 | | | | 512,689 | |
| | | | | | | | | |
| Professional Services 1.79% | | | | | | | | |
| Booz Allen Hamilton Holding Corp. | | | 3,493 | | | | 365,088 | |
| CoStar Group, Inc.* | | | 6,688 | | | | 516,849 | |
| Total | | | | | | | 881,937 | |
| | | | | | | | | |
| Semiconductors & Semiconductor Equipment 9.68% | |
| Enphase Energy, Inc.* | | | 4,165 | | | | 1,103,558 | |
| First Solar, Inc.* | | | 2,297 | | | | 344,068 | |
| KLA Corp. | | | 1,352 | | | | 509,744 | |
| Lattice Semiconductor Corp.* | | | 10,072 | | | | 653,471 | |
| Monolithic Power Systems, Inc. | | | 1,565 | | | | 553,400 | |
| ON Semiconductor Corp.* | | | 6,426 | | | | 400,790 | |
| Rambus, Inc.* | | | 15,127 | | | | 541,849 | |
| SolarEdge Technologies, Inc. (Israel)*(a) | | | 2,325 | | | | 658,603 | |
| Total | | | | | | | 4,765,483 | |
| Investments | | Shares | | | Fair
Value | |
| Software 11.46% | | | | | | | | |
| Aspen Technology, Inc.* | | | 2,578 | | | $ | 529,521 | |
| Bentley Systems, Inc. Class B | | | 13,211 | | | | 488,279 | |
| Bill.com Holdings, Inc.* | | | 3,188 | | | | 347,364 | |
| Cadence Design Systems, Inc.* | | | 1,668 | | | | 267,948 | |
| Clear Secure, Inc. Class A | | | 25,578 | | | | 701,605 | |
| CyberArk Software Ltd. (Israel)*(a) | | | 3,219 | �� | | | 417,343 | |
| DoubleVerify Holdings, Inc.* | | | 17,884 | | | | 392,733 | |
| Gitlab, Inc. Class A* | | | 6,108 | | | | 277,547 | |
| Palo Alto Networks, Inc.* | | | 1,650 | | | | 230,241 | |
| Paycom Software, Inc.* | | | 2,021 | | | | 627,136 | |
| Paylocity Holding Corp.* | | | 1,725 | | | | 335,098 | |
| Roper Technologies, Inc. | | | 1,011 | | | | 436,843 | |
| Synopsys, Inc.* | | | 844 | | | | 269,481 | |
| Trade Desk, Inc. (The) Class A* | | | 7,072 | | | | 317,038 | |
| Total | | | | | | | 5,638,177 | |
| | | | | | | | | |
| Specialty Retail 3.65% | | | | | | | | |
| Dick’s Sporting Goods, Inc. | | | 3,679 | | | | 442,547 | |
| Tractor Supply Co. | | | 2,507 | | | | 564,000 | |
| Ulta Beauty, Inc.* | | | 1,685 | | | | 790,383 | |
| Total | | | | | | | 1,796,930 | |
| | | | | | | | | |
| Technology Hardware, Storage & Peripherals 1.33% | |
| Pure Storage, Inc. Class A* | | | 24,436 | | | | 653,907 | |
| | | | | | | | | |
| Textiles, Apparel & Luxury Goods 5.90% | | | | | |
| Crocs, Inc.* | | | 10,418 | | | | 1,129,624 | |
| Deckers Outdoor Corp.* | | | 2,246 | | | | 896,513 | |
| Lululemon Athletica, Inc. (Canada)*(a) | | | 2,731 | | | | 874,958 | |
| Total | | | | | | | 2,901,095 | |
| | | | | | | | | |
| Trading Companies & Distributors 0.72% | | | | | |
| WW Grainger, Inc. | | | 635 | | | | 353,219 | |
Total Common Stocks
(cost $46,048,810) | | | | | | | 47,042,082 | |
| | See Notes to Financial Statements. | 9 |
Schedule of Investments (continued)
December 31, 2022
| Investments | | Principal
Amount | | | Fair
Value | |
| SHORT-TERM INVESTMENTS 3.18% | | | | | | |
| | | | | | | | | |
| Repurchase Agreements 2.64% | | | | | | |
Repurchase Agreement dated 12/30/2022, 2.05% due 1/3/2023 with Fixed Income Clearing Corp. collateralized by $1,319,200 of U.S. Treasury Note at 4.275% due 4/30/2024; value: $1,325,606; proceeds: $1,299,863
(cost $1,299,567) | | $ | 1,299,567 | | | $ | 1,299,567 | |
| | | | | | | | | |
| | | Shares | | | | | |
| Money Market Funds 0.49% | | | | | | | | |
Fidelity Government Portfolio(b)
(cost $239,949) | | | 239,949 | | | | 239,949 | |
| | | | | | | | | |
| Time Deposits 0.05% | | | | | | | | |
CitiBank N.A.(b)
(cost $26,661) | | | 26,661 | | | | 26,661 | |
Total Short-Term Investments
(cost $1,566,177) | | | | | | | 1,566,177 | |
Total Investments in Securities 98.78%
(cost $47,614,987) | | | | 48,608,259 | |
| Other Assets and Liabilities – Net 1.22% | | | | 597,929 | |
| Net Assets 100.00% | | | | | | $ | 49,206,188 | |
| ADR | | American Depositary Receipt. |
| * | | Non-income producing security. |
| (a) | | Foreign security traded in U.S. dollars. |
| (b) | | Security was purchased with the cash collateral from loaned securities. |
| 10 | See Notes to Financial Statements. |
Schedule of Investments (concluded)
December 31, 2022
The following is a summary of the inputs used as of December 31, 2022 in valuing the Fund’s investments carried at fair value(1):
| Investment Type(2) | | Level 1 | | | Level 2 | | | Level 3 | | | Total | |
| Long-Term Investments | | | | | | | | | | | | | | | | |
| Common Stocks | | $ | 47,042,082 | | | $ | – | | | $ | – | | | $ | 47,042,082 | |
| Short-Term Investments | | | | | | | | | | | | | | | | |
| Repurchase Agreements | | | – | | | | 1,299,567 | | | | – | | | | 1,299,567 | |
| Money Market Funds | | | 239,949 | | | | – | | | | – | | | | 239,949 | |
| Time Deposits | | | – | | | | 26,661 | | | | – | | | | 26,661 | |
| Total | | $ | 47,282,031 | | | $ | 1,326,228 | | | $ | – | | | $ | 48,608,259 | |
| (1) | | Refer to Note 2(h) for a description of fair value measurements and the three-tier hierarchy of inputs. |
| (2) | | See Schedule of Investments for fair values in each industry and identification of foreign issuers and/or geography. When applicable each Level 3 security is identified on the Schedule of Investments along with the valuation technique utilized. |
A reconciliation of Level 3 investments is presented when the Fund has a material amount of Level 3 investments at the beginning or end of the year in relation to the Fund’s net assets.
| | See Notes to Financial Statements. | 11 |
Statement of Assets and Liabilities
December 31, 2022
| ASSETS: | | | | |
| Investments in securities, at fair value including $0 of securities loaned (cost $47,614,987) | | $ | 48,608,259 | |
| Cash | | | 37 | |
| Foreign cash, at value (cost $20,899) | | | 23,064 | |
| Receivables: | | | | |
| Investment securities sold | | | 1,346,292 | |
| Capital shares sold | | | 47,529 | |
| Interest and dividends | | | 9,549 | |
| Securities lending income receivable | | | 351 | |
| Prepaid expenses | | | 126 | |
| Total assets | | | 50,035,207 | |
| | | | | |
| LIABILITIES: | | | | |
| Payables: | | | | |
| Investment securities purchased | | | 324,668 | |
| Payable for collateral due to broker for securities lending | | | 266,610 | |
| Transfer agent fees | | | 91,485 | |
| Management fee | | | 27,896 | |
| Directors’ fees | | | 17,728 | |
| Capital shares reacquired | | | 11,916 | |
| Fund administration | | | 1,717 | |
| Accrued expenses | | | 86,999 | |
| Total liabilities | | | 829,019 | |
| NET ASSETS | | $ | 49,206,188 | |
| COMPOSITION OF NET ASSETS: | | | | |
| Paid-in capital | | $ | 58,933,836 | |
| Total distributable earnings (loss) | | | (9,727,648 | ) |
| Net Assets | | $ | 49,206,188 | |
| Outstanding shares (110 million shares of common stock authorized, $.001 par value) | | | 6,106,765 | |
| Net asset value, offering and redemption price per share (Net assets divided by outstanding shares) | | | $8.06 | |
| 12 | See Notes to Financial Statements. |
Statement of Operations
For the Year Ended December 31, 2022
| Investment income: | | | | |
| Dividends (net of foreign withholding taxes of $1,464) | | $ | 374,857 | |
| Securities lending net income | | | 1,363 | |
| Interest and other | | | 8,539 | |
| Total investment income | | | 384,759 | |
| Expenses: | | | | |
| Management fee | | | 439,754 | |
| Non 12b-1 service fees | | | 151,320 | |
| Shareholder servicing | | | 65,073 | |
| Professional | | | 43,460 | |
| Fund administration | | | 24,276 | |
| Reports to shareholders | | | 12,403 | |
| Custody | | | 8,269 | |
| Directors’ fees | | | 1,275 | |
| Other | | | 17,318 | |
| Gross expenses | | | 763,148 | |
| Expense reductions (See Note 8) | | | (739 | ) |
| Fees waived and expenses reimbursed (See Note 3) | | | (8,269 | ) |
| Net expenses | | | 754,140 | |
| Net investment loss | | | (369,381 | ) |
| Net realized and unrealized gain (loss): | | | | |
| Net realized gain (loss) on investments | | | (10,396,423 | ) |
| Net realized gain (loss) on foreign currency related transactions | | | (623 | ) |
| Net change in unrealized appreciation/depreciation on investments | | | (16,725,951 | ) |
| Net change in unrealized appreciation/depreciation on translation of assets and liabilities denominated in foreign currencies | | | 2,166 | |
| Net realized and unrealized gain (loss) | | | (27,120,831 | ) |
| Net Decrease in Net Assets Resulting From Operations | | $ | (27,490,212 | ) |
| | See Notes to Financial Statements. | 13 |
Statements of Changes in Net Assets
| INCREASE (DECREASE) IN NET ASSETS | | For the Year Ended
December 31, 2022 | | | For the Year Ended
December 31, 2021 | |
| Operations: | | | | | | | | | | |
| Net investment loss | | | $ | (369,381 | ) | | | $ | (1,081,872 | ) |
| Net realized gain (loss) on investments and foreign currency related transactions | | | | (10,397,046 | ) | | | | 28,079,401 | |
| Net change in unrealized appreciation/depreciation on investments and translation of assets and liabilities denominated in foreign currencies | | | | (16,723,785 | ) | | | | (19,407,170 | ) |
| Net increase (decrease) in net assets resulting from operations | | | | (27,490,212 | ) | | | | 7,590,359 | |
| Distributions to shareholders: | | | | (7,973,995 | ) | | | | (22,672,488 | ) |
| Capital share transactions (See Note 14): | | | | | | | | | | |
| Net proceeds from sales of shares | | | | 8,087,906 | | | | | 6,217,614 | |
| Reinvestment of distributions | | | | 7,973,995 | | | | | 22,672,488 | |
| Cost of shares reacquired | | | | (25,178,720 | ) | | | | (48,882,067 | ) |
| Net decrease in net assets resulting from capital share transactions | | | | (9,116,819 | ) | | | | (19,991,965 | ) |
| Net decrease in net assets | | | | (44,581,026 | ) | | | | (35,074,094 | ) |
| NET ASSETS: | | | | | | | | | | |
| Beginning of year | | | $ | 93,787,214 | | | | $ | 128,861,308 | |
| End of year | | | $ | 49,206,188 | | | | $ | 93,787,214 | |
| 14 | See Notes to Financial Statements. |
This page is intentionally left blank.
15
Financial Highlights
| | | | | Per Share Operating Performance: | | |
| | | | | Investment Operations: | | Distributions
to
shareholders
from: | | |
| | | | | | | | | | | | | |
| | | Net asset
value,
beginning
of period | | Net
investment
(loss)(a) | | Net
realized and
unrealized
gain (loss) | | Total from
investment
operations | | Net
realized
gain | | Net asset
value,
end of
period |
| 12/31/2022 | | $ | 13.69 | | | $ | (0.06 | ) | | $ | (4.24 | ) | | $ | (4.30 | ) | | $ | (1.33 | ) | | $ | 8.06 | |
| 12/31/2021 | | | 16.44 | | | | (0.14 | ) | | | 1.18 | | | | 1.04 | | | | (3.79 | ) | | | 13.69 | |
| 12/31/2020 | | | 13.02 | | | | (0.10 | ) | | | 5.24 | | | | 5.14 | | | | (1.72 | ) | | | 16.44 | |
| 12/31/2019 | | | 10.48 | | | | (0.03 | ) | | | 3.82 | | | | 3.79 | | | | (1.25 | ) | | | 13.02 | |
| 12/31/2018 | | | 14.20 | | | | (0.07 | ) | | | (0.42 | ) | | | (0.49 | ) | | | (3.23 | ) | | | 10.48 | |
| (a) | Calculated using average shares outstanding during the period. |
| (b) | Total return does not consider the effects of sales charges or other expenses imposed by an insurance company and assumes the reinvestment of all distributions. |
| 16 | See Notes to Financial Statements. |
| | | Ratios to Average Net Assets: | | Supplemental Data: |
| | | | | | | | | | | |
Total
return(b)
(%) | | Total
expenses after
waivers and/or
reimburse-
ments
(%) | | Total
expenses
(%) | | Net
investment
(loss)
(%) | | Net assets,
end of
period
(000) | | Portfolio
turnover
rate
(%) |
| | (32.53 | ) | | | 1.25 | | | | 1.26 | | | | (0.61 | ) | | $ | 49,206 | | | | 121 | |
| | 6.46 | | | | 1.20 | | | | 1.26 | | | | (0.85 | ) | | | 93,787 | | | | 58 | |
| | 39.38 | | | | 1.25 | | | | 1.25 | | | | (0.72 | ) | | | 128,861 | | | | 88 | |
| | 36.37 | | | | 1.22 | | | | 1.27 | | | | (0.27 | ) | | | 124,945 | | | | 45 | |
| | (2.89 | ) | | | 1.13 | | | | 1.29 | | | | (0.45 | ) | | | 66,492 | | | | 39 | |
| | See Notes to Financial Statements. | 17 |
Notes to Financial Statements
Lord Abbett Series Fund, Inc. (the “Company”) is registered under the Investment Company Act of 1940, as amended (the “Act”), as a diversified, open-end management investment company and was incorporated under Maryland law in 1989. The Company consists of nine separate portfolios as of December 31, 2022. This report covers Growth Opportunities Portfolio (the “Fund”).
The Fund’s investment objective is capital appreciation. The Fund has Variable Contract class shares (“Class VC Shares”), which are currently issued and redeemed only in connection with investments in, and payments under, variable annuity contracts and variable life insurance policies issued by life insurance and insurance-related companies.
The preparation of the financial statements in conformity with accounting principles generally accepted in the United States of America (“U.S. GAAP”) requires management to make certain estimates and assumptions that affect the reported amounts of assets and liabilities and disclosure of contingent assets and liabilities at the date of the financial statements and the reported amounts of increases and decreases in net assets from operations during the reporting period. Actual results could differ from those estimates. The Fund is considered an investment company under U.S. GAAP and follows the accounting and reporting guidance applicable to investment companies.
| 2. | SIGNIFICANT ACCOUNTING POLICIES |
| (a) | Investment Valuation–Under procedures approved by the Fund’s Board of Directors (the “Board”), the Board has designated the determination of fair value of the Fund’s portfolio investments to Lord, Abbett & Co. LLC (“Lord Abbett”), as valuation designee. Accordingly, Lord Abbett is responsible for, among other things, assessing and managing valuation risks, establishing, applying and testing fair value methodologies, and evaluating pricing services. Lord Abbett has formed a Pricing Committee that performs these responsibilities on behalf of Lord Abbett, administers the pricing and valuation of portfolio investments and ensures that prices utilized reasonably reflect fair value. Among other things, these procedures allow Lord Abbett, subject to Board oversight, to utilize independent pricing services, quotations from securities and financial instrument dealers and other market sources to determine fair value. |
| | |
| | Securities actively traded on any recognized U.S. or non-U.S. exchange or on The NASDAQ Stock Market LLC are valued at the last sale price or official closing price on the exchange or system on which they are principally traded. Events occurring after the close of trading on non-U.S. exchanges may result in adjustments to the valuation of foreign securities to reflect their fair value as of the close of regular trading on the New York Stock Exchange. When valuing foreign equity securities that meet certain criteria, the Board has approved the use of an independent fair valuation service that values such securities to reflect market trading that occurs after the close of the applicable foreign markets of comparable securities or other instruments that correlate to the fair-valued securities. Unlisted equity securities are valued at the last quoted sale price or, if no sale price is available, at the mean between the most recently quoted bid and ask prices. |
| | |
| | Securities for which prices are not readily available are valued at fair value as determined by the Pricing Committee. The Pricing Committee considers a number of factors, including observable and unobservable inputs, when arriving at fair value. The Pricing Committee may use related or comparable assets or liabilities, recent transactions, market multiples, book |
18
Notes to Financial Statements (continued)
| | values, and other relevant information to determine the fair value of portfolio investments. The Board or a designated committee thereof periodically reviews reports that may include fair value determinations made by the Pricing Committee, related market activity, inputs and assumptions, and retrospective comparison of prices of subsequent purchases and sales transactions to fair value determinations made by the Pricing Committee. |
| | |
| | Investments in open-end money market mutual funds are valued at their NAV as of the close of each business day. Short-term securities with 60 days or less remaining to maturity are valued using the amortized cost method, which approximates fair value. |
| | |
| (b) | Security Transactions–Security transactions are recorded as of the date that the securities are purchased or sold (trade date). Realized gains and losses on sales of portfolio securities are calculated using the identified- cost method. |
| | |
| (c) | Investment Income–Dividend income is recorded on the ex-dividend date. Interest income is recorded on the accrual basis as earned. Discounts are accreted and premiums are amortized using the effective interest method and are included in Interest and other, if applicable, on the Statement of Operations. Withholding taxes on foreign dividends have been provided for in accordance with the applicable country’s tax rules and rates. |
| | |
| (d) | Income Taxes–It is the policy of the Fund to meet the requirements of Subchapter M of the Internal Revenue Code applicable to regulated investment companies and to distribute substantially all taxable income and capital gains to its shareholders. Therefore, no income tax provision is required. |
| | |
| | The Fund files U.S. federal and various state and local tax returns. No income tax returns are currently under examination. The statute of limitations on the Fund’s filed U.S. federal tax returns remains open for the fiscal years ended December 31, 2019 through December 31, 2022. The statutes of limitations on the Fund’s state and local tax returns may remain open for an additional year depending upon the jurisdiction. |
| | |
| (e) | Expenses–Expenses incurred by the Company that do not specifically relate to an individual fund are generally allocated to the funds within the Company on a pro rata basis by relative net assets. |
| | |
| (f) | Foreign Transactions–The books and records of the Fund are maintained in U.S. dollars and transactions denominated in foreign currencies are recorded in the Fund’s records at the rate prevailing when earned or recorded. Asset and liability accounts that are denominated in foreign currencies are adjusted daily to reflect current exchange rates and any unrealized gain (loss), if applicable, is included in Net change in unrealized appreciation/depreciation on translation of assets and liabilities denominated in foreign currencies on the Fund’s Statement of Operations. The resultant exchange gains and losses upon settlement of such transactions, if applicable, are included in Net realized gain (loss) on foreign currency related transactions on the Fund’s Statement of Operations. The Fund does not isolate that portion of the results of operations arising as a result of changes in the foreign exchange rates from the changes in market prices of the securities. |
| | |
| | The Fund uses foreign currency exchange contracts to facilitate transactions in foreign-denominated securities. Losses from these transactions may arise from changes in the value of the foreign currency or if the counterparties do not perform under the contracts’ terms. |
19
Notes to Financial Statements (continued)
| (g) | Repurchase Agreements–The Fund may enter into repurchase agreements with respect to securities. A repurchase agreement is a transaction in which a fund acquires a security and simultaneously commits to resell that security to the seller (a bank or securities dealer) at an agreed-upon price on an agreed-upon date. The Fund requires at all times that the repurchase agreement be collateralized by cash, or by securities of the U.S. Government, its agencies, its instrumentalities, or U.S. Government sponsored enterprises having a value equal to, or in excess of, the value of the repurchase agreement (including accrued interest). If the seller of the agreement defaults on its obligation to repurchase the underlying securities at a time when the fair value of these securities has declined, the Fund may incur a loss upon disposition of the securities. |
| | |
| (h) | Fair Value Measurements–Fair value is defined as the price that the Fund would receive upon selling an investment or transferring a liability in an orderly transaction to an independent buyer in the principal or most advantageous market of the investment. A three-tier hierarchy is used to maximize the use of observable market data and minimize the use of unobservable inputs and to establish classification of fair value measurements for disclosure purposes. Inputs refer broadly to the assumptions that market participants would use in pricing the asset or liability, including assumptions about risk - for example, the risk inherent in a particular valuation technique used to measure fair value (such as a pricing model) and/or the risk inherent in the inputs to the valuation technique. Inputs may be observable or unobservable. Observable inputs reflect the assumptions market participants would use in pricing the asset or liability. Observable inputs are based on market data obtained from sources independent of the reporting entity. Unobservable inputs reflect the reporting entity’s own assumptions about the assumptions market participants would use in pricing the asset or liability. Unobservable inputs are based on the best information available in the circumstances. The three-tier hierarchy classification is determined based on the lowest level of inputs that is significant to the fair value measurement, and is summarized in the three broad Levels listed below: |
| | • | Level 1 – | unadjusted quoted prices in active markets for identical investments; |
| | | | |
| | • | Level 2 – | other significant observable inputs (including quoted prices for similar investments, interest rates, prepayment speeds, credit risk, etc.); and |
| | | | |
| | • | Level 3 – | significant unobservable inputs (including the Fund’s own assumptions in determining the fair value of investments). |
| | A summary of inputs used in valuing the Fund’s investments as of December 31, 2022 and, if applicable, Level 3 rollforwards for the fiscal year then ended is included in the Fund’s Schedule of Investments. |
| | |
| | Changes in valuation techniques may result in transfers into or out of an assigned level within the three-tier hierarchy. The inputs or methodology used for valuing securities are not necessarily an indication of the risk associated with investing in those securities. |
20
Notes to Financial Statements (continued)
| 3. | MANAGEMENT FEE AND OTHER TRANSACTIONS WITH AFFILIATES |
Management Fee
The Company has a management agreement with Lord Abbett, pursuant to which Lord Abbett provides the Fund with investment management services and executive and other personnel, provides office space and pays for ordinary and necessary office and clerical expenses relating to research and statistical work and supervision of the Fund’s investment portfolio. The management fee is accrued daily and payable monthly.
Prior to September 16, 2022, the management fee was based on the Fund’s average daily net assets at the following annual rate:
| First $1 billion | .75% |
| Next $1 billion | .65% |
| Next $1 billion | .60% |
| Over $3 billion | .58% |
Effective September 16, 2022, the management fee is based on the Fund’s average daily net assets at the following annual rate:
| First $1 billion | .65% |
| Next $3 billion | .63% |
| Next $1 billion | .60% |
| Over $5 billion | .58% |
For the fiscal year ended December 31, 2022, the effective management fee, net of any applicable waivers, was at an annualized rate of 0.73% of the Fund’s average daily net assets.
In addition, Lord Abbett provides certain administrative services to the Fund pursuant to an Administrative Services Agreement in return for a fee at an annual rate of .04% of the Fund’s average daily net assets. The fund administration fee is accrued daily and payable monthly. Lord Abbett voluntarily waived $8,269 of fund administration fees during the fiscal year ended December 31, 2022.
The Company, on behalf of the Fund, has entered into services arrangements with certain insurance companies. Under these arrangements, certain insurance companies will be compensated up to .25% of the average daily net asset value (“NAV”) of the Fund’s Class VC Shares held in the insurance company’s separate account to service and maintain the Variable Contract owners’ accounts. This amount is included in non 12b-1 service fees on the Statement of Operations. The Fund may also compensate certain insurance companies, third-party administrators and other entities for providing recordkeeping, sub-transfer agency and other administrative services to the Fund. This amount is included in Shareholder servicing on the Statement of Operations.
One Director and certain of the Company’s officers have an interest in Lord Abbett.
| 4. | DISTRIBUTIONS AND CAPITAL LOSS CARRYFORWARDS |
Dividends from net investment income, if any, are declared and paid at least semi-annually. Taxable net realized gains from investment transactions, reduced by allowable capital loss carryforwards, if any, are declared and distributed to shareholders at least annually. The capital loss carryforward amount, if any, is available to offset future net capital gains. Dividends and distributions to shareholders are recorded on the ex-dividend date. The amounts of dividends and distributions from
21
Notes to Financial Statements (continued)
net investment income and net realized capital gains are determined in accordance with federal income tax regulations, which may differ from U.S. GAAP. These book/tax differences are either considered temporary or permanent in nature. To the extent these differences are permanent in nature, such amounts are reclassified within the components of net assets based on their federal tax basis treatment; temporary differences do not require reclassification. Dividends and distributions that exceed earnings and profits for tax purposes are reported as a tax return of capital.
The tax character of distributions paid during the fiscal years ended December 31, 2022 and 2021 was as follows:
| | | Year Ended
12/31/2022 | | | Year Ended
12/31/2021 |
| Distributions paid from: | | | | | | | |
| Ordinary income | | $ | 363,598 | | | $ | 5,686,948 |
| Net long-term capital gains | | | 7,610,397 | | | | 16,985,540 |
| Total distributions paid | | $ | 7,973,995 | | | $ | 22,672,488 |
As of December 31, 2022, the components of accumulated losses on a tax-basis were as follows:
| Capital loss carryforwards* | | $ | (9,966,738 | ) |
| Temporary differences | | | (17,728 | ) |
| Unrealized gains – net | | | 256,818 | |
| Total accumulated losses – net | | $ | (9,727,648 | ) |
| * | The capital losses will carry forward indefinitely. |
As of December 31, 2022, the aggregate unrealized security gains and losses on investments and other financial instruments based on cost for U.S. federal income tax purposes were as follows:
| Tax cost | | $ | 48,353,606 | |
| Gross unrealized gain | | | 3,070,283 | |
| Gross unrealized loss | | | (2,815,630 | ) |
| Net unrealized security gain | | $ | 254,653 | |
The difference between book-basis and tax-basis unrealized gains (losses) is attributable to the tax treatment of wash sales.
Permanent items identified during the fiscal year ended December 31, 2022 have been reclassified among the components of net assets based on their tax basis treatment as follows:
Total Distributable
Earnings (Loss) | | Paid-in Capital | |
| $372,256 | | $(372,256 | ) |
The permanent differences are attributable to the tax treatment of certain distributions and net operating losses.
| 5. | PORTFOLIO SECURITIES TRANSACTIONS |
Purchases and sales of investment securities (excluding short-term investments) for the fiscal year ended December 31, 2022 were as follows:
| Purchases | | Sales |
| $73,667,911 | | $91,726,933 |
There were no purchases or sales of U.S. Government securities for the fiscal year ended December 31, 2022.
22
Notes to Financial Statements (continued)
The Fund is permitted to purchase and sell securities (“cross-trade”) from and to other Lord Abbett funds or client accounts pursuant to procedures approved by the Board in compliance with Rule 17a-7 under the Act (the “Rule”). Each cross-trade is executed at a fair market price in compliance with provisions of the Rule. For the fiscal year ended December 31, 2022, the Fund engaged in cross-trades purchases of $756,396.
| 6. | DISCLOSURES ABOUT OFFSETTING ASSETS AND LIABILITIES |
The Financial Accounting Standards Board requires disclosures intended to help better assess the effect or potential effect of offsetting arrangements on a fund’s financial position. The following tables illustrate gross and net information about recognized assets and liabilities eligible for offset in the Statement of Assets and Liabilities; and disclose such amounts subject to an enforceable master netting agreement or similar agreement, by the counterparty. A master netting agreement is an agreement between a fund and a counterparty which provides for the net settlement of amounts owed under all contracts traded under that agreement, as well as cash collateral, through a single payment by one party to the other in the event of default on or termination of any one contract. The Fund’s accounting policy with respect to balance sheet offsetting is that, absent an event of default by the counterparty or a termination of the agreement, the master netting agreement does not result in an offset of reported amounts of financial assets and liabilities in the Statement of Assets and Liabilities across transactions between the Fund and the applicable counterparty:
| Description | Gross Amounts of
Recognized Assets | Gross Amounts
Offset in the
Statement of Assets
and Liabilities | Net Amounts of
Assets Presented
in the Statement of
Assets and Liabilities |
| Repurchase Agreements | $1,299,567 | $ – | $1,299,567 |
| Total | $1,299,567 | $ – | $1,299,567 |
| | | Net Amount
of Assets
Presented in
the Statement
of Assets and
Liabilities | | | Amounts Not Offset in the
Statement of Assets and Liabilities | | | | |
| Counterparty | | | | Financial
Instruments | | | Cash
Collateral
Received(a | ) | | Securities
Collateral
Received(a | ) | | Net
Amount(b | ) |
| Fixed Income Clearing Corp. | | $ | 1,299,567 | | | $ | – | | | $ | – | | | $ | (1,299,567 | ) | | $ | – | |
| Total | | $ | 1,299,567 | | | $ | – | | | $ | – | | | $ | (1,299,567 | ) | | $ | – | |
| (a) | Collateral disclosed is limited to an amount not to exceed 100% of the net amount of assets (liabilities) presented in the Statement of Assets and Liabilities, for each respective counterparty. |
| (b) | Net amount represents the amount owed to the Fund by the counterparty as of December 31, 2022. |
| 7. | DIRECTORS’ REMUNERATION |
The Company’s officers and one Director, who are associated with Lord Abbett, do not receive any compensation from the Company for serving in such capacities. Independent Directors’ fees are allocated among all Lord Abbett-sponsored funds based on the net assets of each fund. There is an equity-based plan available to all Independent Directors under which Independent Directors may elect to defer receipt of a portion of Directors’ fees. The deferred amounts are treated as though equivalent dollar amounts had been invested in the Fund. Such amounts and earnings accrued thereon are included in Directors’ fees on the Statement of Operations and in Directors’ fees payable on the Statement of Assets and Liabilities and are not deductible for U.S. federal income tax purposes until such amounts are paid.
23
Notes to Financial Statements (continued)
The Company has entered into an arrangement with its transfer agent and custodian, whereby credits realized as a result of uninvested cash balances are used to reduce a portion of the Fund’s expenses.
For the period ended August 3, 2022, the Fund and certain other funds managed by Lord Abbett (collectively, the “Participating Funds”) entered into a syndicated line of credit facility with various lenders for $1.275 billion (the “Syndicated Facility”) whereas State Street Bank and Trust Company (“SSB”) participated as a lender and as agent for the lenders. The Participating Funds were subject to graduated borrowing limits of one-third of fund net assets (if fund net assets are less than $750 million), $250 million, $300 million, $700 million, or $1 billion, based on past borrowings and likelihood of future borrowings, among other factors.
Effective August 4, 2022, the Participating Funds entered into a Syndicated Facility with various lenders for $1.625 billion whereas SSB participates as a lender and as agent for the lenders. The Participating Funds were subject to graduated borrowing limits of one-third of fund net assets (if fund net assets are less than $750 million), $250 million, $300 million, $700 million, or $1 billion, based on past borrowings and likelihood of future borrowings, among other factors.
For the period ended August 3, 2022, the Participating Funds were party to an additional line of credit facility with SSB for $330 million (the “Bilateral Facility”), $250 million committed and $80 million uncommitted. Under the Bilateral Facility, the Participating Funds are subject to graduated borrowing limits of one-third of fund net assets (if net assets are less than $750 million), $250 million, $300 million, or $330 million, based on past borrowings and likelihood of future borrowings, among other factors.
Effective August 4, 2022, the Participating Funds are party to an additional uncommitted line of credit facility with SSB for $330 million. Under the Bilateral Facility, the Participating Funds are subject to borrowing limits of one-third of fund net assets (if net assets are less than $750 million), or $250 million based on past borrowings and likelihood of future borrowings, among other factors.
The Syndicated Facility and the Bilateral Facility are to be used for temporary or emergency purposes as additional sources of liquidity to satisfy redemptions.
For the year ended December 31, 2022, the Fund did not utilize the Syndicated Facility or Bilateral Facility.
| 10. | INTERFUND LENDING PROGRAM |
Pursuant to an exemptive order issued by the U.S. Securities and Exchange Commission (“SEC exemptive order”) certain registered open-end management investment companies managed by Lord Abbett, including the Fund, participate in a joint lending and borrowing program (the “Interfund Lending Program”). The SEC exemptive order allows the funds that participate in the Interfund Lending Program to borrow money from and lend money to each other for temporary or emergency purposes subject to the limitations and conditions.
For the fiscal year ended December 31, 2022, the Fund did not participate as a borrower or lender in the Interfund Lending Program.
24
Notes to Financial Statements (continued)
| 11. | CUSTODIAN AND ACCOUNTING AGENT |
SSB is the Company’s custodian and accounting agent. SSB performs custodial, accounting and recordkeeping functions relating to portfolio transactions and calculating the Fund’s NAV.
| 12. | SECURITIES LENDING AGREEMENT |
The Fund has established a securities lending agreement with Citibank, N.A. for the lending of securities to qualified brokers in exchange for securities or cash collateral equal to at least the market value of securities loaned, plus interest, if applicable. Cash collateral is invested in an approved money market fund. In accordance with the Fund’s securities lending agreement, the market value of securities on loan is determined each day at the close of business and any additional collateral required to cover the value of securities on loan is delivered to the Fund on the next business day. As with other extensions of credit, the Fund may experience a delay in the recovery of its securities or incur a loss should the borrower of the securities breach its agreement with the Fund or the borrower becomes insolvent at a time when the collateral is insufficient to cover the cost of repurchasing securities on loan. Any income earned from securities lending is included in Securities lending net income on the Fund’s Statement of Operations.
The initial collateral received by the Fund is required to have a value equal to at least 100% of the market value of the securities loaned. The collateral must be marked-to-market daily to cover increases in the market value of the securities loaned (or potentially a decline in the value of the collateral). In general, the risk of borrower default will be borne by Citibank, N.A.; the Fund will bear the risk of loss with respect to the investment of the cash collateral. The advantage of such loans is that the Fund continues to receive income on loaned securities while receiving a portion of any securities lending fees and earning returns on the cash amounts which may be reinvested for the purchase of investments in securities.
As of December 31, 2022, the market value of securities loaned and collateral received for the Fund were as follows:
| | Market Value
of Securities
Loaned | | Collateral
Received(1) |
| | $ – | | $266,610 |
| (1) | Statement of Assets and Liabilities location: Payable for collateral due to broker for securities lending. |
The Fund is subject to the general risks and considerations associated with equity investing, as well as the particular risks associated with value and mid-sized company stocks. The value of an investment will fluctuate in response to movements in the equity securities market in general and to the changing prospects of individual companies in which the Fund invests. The market may, over an extended period of time, fail to recognize the intrinsic value of particular value stocks the Fund may hold. Value investing also is subject to the risk that the company judged to be undervalued may actually be appropriately priced or even overpriced. The mid-sized company stocks in which the Fund invests may be less able to weather economic shifts or other adverse developments than those of larger, more established companies. Although investing in mid-sized companies offers the potential for above average returns, these companies may not succeed and the value of their stock could decline significantly. Mid-sized companies also may fall out of favor relative to larger
25
Notes to Financial Statements (concluded)
companies in certain market cycles, causing the Fund to incur losses or under perform. In addition, if the Fund’s assessment of a company’s value or prospects for exceeding earnings expectations or market conditions is wrong, the Fund could suffer losses or produce poor performance relative to other funds, even in a rising market.
Due to the Fund’s investment exposure to foreign companies and American Depositary Receipts, the Fund may experience increased market, industry and sector liquidity, currency, political, information, and other risks. The securities of foreign companies also may be subject to inadequate exchange control regulations, the imposition of economic sanctions or other government restrictions, higher transaction and other costs, and delays in settlement to the extent they are traded on non-U.S. exchanges or markets.
Geopolitical and other events (e.g., wars, terrorism, natural disasters, epidemics or pandemics such as the COVID-19 outbreak which began in late 2019) may disrupt securities markets and adversely affect global economies and markets, thereby decreasing the value of the Fund’s investments. Market disruptions can also prevent the Fund from implementing its investment strategies and achieving its investment objective.
The transmission of COVID-19 and efforts to contain its spread have resulted in, among other things, border closings and other significant travel restrictions and disruptions, significant disruptions to business operations, supply chains and customer activity, lower consumer demand for goods and services, event cancellations and restrictions, service cancellations, reductions and other changes, significant challenges in healthcare service preparation and delivery, and prolonged quarantines, as well as general concern and uncertainty. The impact of the COVID-19 outbreak has, and could again, negatively affect the global economy, the economies of individual countries, and the financial performance of individual issuers, sectors, industries, asset classes, and markets in significant and unforeseen ways.
The COVID-19 pandemic and its effects may last for an extended period of time. Although the long-term economic fallout of COVID-19 is difficult to predict, it has contributed to, and is likely to continue to contribute to, market volatility, inflation and systemic economic weakness. The foregoing could disrupt the operations of the Fund and its service providers, adversely affect the value and liquidity of the Fund’s investments, and negatively impact the Fund’s performance and your investment in the Fund.
These factors, and others, can affect the Fund’s performance.
| 14. | SUMMARY OF CAPITAL TRANSACTIONS |
Transactions in shares of capital stock were as follows:
| | | Year Ended
December 31, 2022 | | | | Year Ended
December 31, 2021 | |
| Shares sold | | 812,206 | | | | 375,357 | |
| Reinvestment of distributions | | 874,341 | | | | 1,604,448 | |
| Shares reacquired | | (2,430,792 | ) | | | (2,966,889 | ) |
| Decrease | | (744,245 | ) | | | (987,084 | ) |
26
Report of Independent Registered Public Accounting Firm
To the shareholders and the Board of Directors of Lord Abbett Series Fund, Inc.
Opinion on the Financial Statements and Financial Highlights
We have audited the accompanying statement of assets and liabilities, including the schedule of investments, of Growth Opportunities Portfolio, one of the funds constituting Lord Abbett Series Fund, Inc. (the “Fund”), as of December 31, 2022, the related statement of operations for the year then ended, the statements of changes in net assets for each of the two years in the period then ended, the financial highlights for each of the five years in the period then ended, and the related notes. In our opinion, the financial statements and financial highlights present fairly, in all material respects, the financial position of Growth Opportunities Portfolio of the Fund as of December 31, 2022, and the results of its operations for the year then ended, the changes in its net assets for each of the two years in the period then ended, and the financial highlights for each of the five years in the period then ended in conformity with accounting principles generally accepted in the United States of America.
Basis for Opinion
These financial statements and financial highlights are the responsibility of the Fund’s management. Our responsibility is to express an opinion on the Fund’s financial statements and financial highlights based on our audits. We are a public accounting firm registered with the Public Company Accounting Oversight Board (United States) (PCAOB) and are required to be independent with respect to the Fund in accordance with the U.S. federal securities laws and the applicable rules and regulations of the Securities and Exchange Commission and the PCAOB.
We conducted our audits in accordance with the standards of the PCAOB. Those standards require that we plan and perform the audit to obtain reasonable assurance about whether the financial statements and financial highlights are free of material misstatement, whether due to error or fraud. The Fund is not required to have, nor were we engaged to perform, an audit of its internal control over financial reporting. As part of our audits we are required to obtain an understanding of internal control over financial reporting but not for the purpose of expressing an opinion on the effectiveness of the Fund’s internal control over financial reporting. Accordingly, we express no such opinion.
Our audits included performing procedures to assess the risks of material misstatement of the financial statements and financial highlights, whether due to error or fraud, and performing procedures that respond to those risks. Such procedures included examining, on a test basis, evidence regarding the amounts and disclosures in the financial statements and financial highlights. Our audits also included evaluating the accounting principles used and significant estimates made by management, as well as evaluating the overall presentation of the financial statements and financial highlights. Our procedures included confirmation of securities owned as of December 31, 2022, by correspondence with the custodian and brokers; when replies were not received from brokers, we performed other auditing procedures. We believe that our audits provide a reasonable basis for our opinion.
DELOITTE & TOUCHE LLP
New York, New York
February 14, 2023
We have served as the auditor of one or more Lord Abbett Family of Funds’ investment companies since 1932.
27
Basic Information About Management
The Board is responsible for the management of the business and affairs of the Fund in accordance with the laws of the state of organization. The Board elects officers who are responsible for the day-to-day operations of the Fund and who execute policies authorized by the Board. The Board also approves an investment adviser to the Fund and continues to monitor the cost and quality of the services the investment adviser provides, and annually considers whether to renew the contract with the investment adviser. Generally, each Board member holds office until his/her successor is elected and qualified or until his/her earlier resignation or removal, as provided in the Fund’s organizational documents.
Lord, Abbett & Co. LLC (“Lord Abbett”), a Delaware limited liability company, is the Fund’s investment adviser. Designated Lord Abbett personnel are responsible for the day-to-day management of the Fund.
Independent Board Members
The following Independent Board Members also are board members of each of the 15 investment companies in the Lord Abbett Family of Funds, which consist of 63 investment portfolios.
Name, Address and
Year of Birth | | Current Position and
Length of Service
with the Fund | | Principal Occupation and Other Directorships
During the Past Five Years |
| | | | | |
Evelyn E. Guernsey
Lord, Abbett & Co. LLC
c/o Legal Dept.
90 Hudson Street
Jersey City, NJ 07302
(1955) | | Board member since 2011;
Vice Chair since 2023 | | Principal Occupation: None. Other Directorships: None. |
| | | | | |
Julie A. Hill
Lord, Abbett & Co. LLC
c/o Legal Dept.
90 Hudson Street
Jersey City, NJ 07302
(1946) | | Board member since 2004 | | Principal Occupation: Owner and CEO of The Hill Company, a business consulting firm (since 1998). Other Directorships: Previously served as director of Anthem, Inc., a health benefits company (1994–2021). |
| | | | | |
Kathleen M. Lutito
Lord, Abbett & Co. LLC
c/o Legal Dept.
90 Hudson Street
Jersey City, NJ 07302
(1963) | | Board member since 2017 | | Principal Occupation: President and Chief Investment Officer of CenturyLink Investment Management Company (since 2006). Other Directorships: None. |
| | | | | |
James M. McTaggart
Lord, Abbett & Co. LLC
c/o Legal Dept.
90 Hudson Street
Jersey City, NJ 07302
(1947) | | Board member since 2012 | | Principal Occupation: Owner of McTaggart LLC (since 2011). Other Directorships: None. |
| | | | | |
Charles O. Prince
Lord, Abbett & Co. LLC
c/o Legal Dept.
90 Hudson Street
Jersey City, NJ 07302
(1950) | | Board member since 2019 | | Principal Occupation: None. Formerly Chair and Chief Executive Officer, Citigroup, Inc. (Retired 2007). Other Directorships: Previously served as director of Johnson & Johnson (2005–2022). Previously served as director of Xerox Corporation (2007–2018). |
28
Basic Information About Management (continued)
Name, Address and
Year of Birth | | Current Position and
Length of Service
with the Fund | | Principal Occupation and Other Directorships
During the Past Five Years |
| | | | | |
Karla M. Rabusch
Lord, Abbett & Co. LLC
c/o Legal Dept.
90 Hudson Street
Jersey City, NJ 07302
(1959) | | Board member since 2017 | | Principal Occupation: President and Director of Wells Fargo Funds Management, LLC (2003–2017); President of Wells Fargo Funds (2003–2016). Other Directorships: None. |
| | | | | |
Lorin Patrick Taylor Radtke
Lord, Abbett & Co. LLC
c/o Legal Dept.
90 Hudson Street
Jersey City, NJ 07302
(1968) | | Board member since 2021 | | Principal Occupation: Partner and Co-Founder of M Seven 8 Partners LLC, a venture capital firm (since 2016). Formerly Partner, Goldman Sachs (1992–2016). Other Directorships: Currently serves as director of Assured Guaranty (2021–Present), Virtual Combine (2018–Present), and Mariposa Family Learning Center (2021–Present). Previously served as director of SummerMoon Coffee (2022). |
| | | | | |
Leah Song Richardson
Lord, Abbett & Co. LLC
c/o Legal Dept.
90 Hudson Street
Jersey City, NJ 07302
(1966) | | Board member since 2021 | | Principal Occupation: President of Colorado College (since 2021) and was formerly Dean at University of California, Irvine–School of Law (2017–2021) and formerly Professor of Law at University of California, Irvine (2014–2017). Other Directorships: None. |
| | | | | |
Mark A. Schmid
Lord, Abbett & Co. LLC
c/o Legal Dept.
90 Hudson Street
Jersey City, NJ 07302
(1959) | | Board member since 2016 | | Principal Occupation: Vice President and Chief Investment Officer of the University of Chicago (2009–2021). Other Directorships: None. |
| | | | | |
James L.L. Tullis
Lord, Abbett & Co. LLC
c/o Legal Dept.
90 Hudson Street
Jersey City, NJ 07302
(1947) | | Board member since 2006;
Chair since 2017 | | Principal Occupation: Chair of Tullis Health Investors-FL LLC (since 2018); CEO of Tullis-Dickerson and Co. Inc., a venture capital management firm (1990–2016). Other Directorships: Currently serves as Chair of Crane Co. (since 2020, director since 1998), Director of Alphatec Spine (since 2018), and Director of Exagen Inc. (since 2019). Previously served as director of electroCore, Inc. (2018–2020). |
Interested Board Members
Mr. Sieg is affiliated with Lord Abbett and is an “interested person” of the Fund as defined in the Act. Mr. Sieg is a board member of each of the 15 investment companies in the Lord Abbett Family of Funds, which consist of 63 investment portfolios. Mr. Sieg is an officer of the Lord Abbett Family of Funds.
29
Basic Information About Management (continued)
Name, Address and
Year of Birth | | Current Position and
Length of Service
with the Fund | | Principal Occupation and Other Directorships
During the Past Five Years |
| | | | | |
Douglas B. Sieg
Lord, Abbett & Co. LLC
90 Hudson Street
Jersey City, NJ 07302
(1969) | | Board member since 2016 | | Principal Occupation: Managing Partner of Lord Abbett (since 2018) and was formerly Head of Client Services, joined Lord Abbett in 1994. Other Directorships: None. |
Officers
None of the officers listed below have received compensation from the Fund. All of the officers of the Fund also may be officers of the other Lord Abbett Funds and maintain offices at 90 Hudson Street, Jersey City, NJ 07302. Unless otherwise indicated, the position(s) and title(s) listed under the “Principal Occupation During the Past Five Years” column indicate each officer’s position(s) and title(s) with Lord Abbett. Each officer serves for an indefinite term (i.e., until his or her death, resignation, retirement, or removal).
Name and
Year of Birth | | Current Position
with the Fund | | Length of Service
of Current
Position | | Principal Occupation
During the Past Five Years |
| | | | | | | |
Douglas B. Sieg
(1969) | | President and Chief
Executive Officer | | Elected as President and Chief Executive Officer in 2018 | | Managing Partner of Lord Abbett (since 2018) and was formerly Head of Client Services, joined Lord Abbett in 1994. |
| | | | | | | |
Jackson C. Chan
(1964) | | AML Compliance Officer | | Elected in 2018 | | Deputy Chief Compliance Officer and Director of Regulatory Affairs, joined Lord Abbett in 2014. |
| | | | | | | |
Michael J. Hebert
(1976) | | Chief Financial Officer and Treasurer | | Elected as Chief Financial Officer and Treasurer in 2021 | | Head of Global Fund Finance, joined Lord Abbett in 2021 and was formerly Vice President at Eaton Vance Management (EVM) (2014–2021) and Calvert Research & Management (CRM) (2016–2021), and Assistant Treasurer of registered investment companies managed, advised or administered by EVM and CRM during such years. |
| | | | | | | |
Jennifer C. Karam
(1970) | | Vice President and Assistant Secretary | | Elected in 2022 | | Partner and Senior Deputy General Counsel, joined Lord Abbett in 2012. |
| | | | | | | |
Joseph M. McGill
(1962) | | Chief Compliance Officer | | Elected in 2014 | | Partner and Chief Compliance Officer, joined Lord Abbett in 2014. |
| | | | | | | |
Parker J. Milender
(1989) | | Vice President and Assistant Secretary | | Elected in 2023 | | Counsel, joined Lord Abbett in 2021 and was formerly an Associate at Milbank LLP (2017–2021). |
30
Basic Information About Management (concluded)
Name and
Year of Birth | | Current Position
with the Fund | | Length of Service
of Current
Position | | Principal Occupation
During the Past Five Years |
| | | | | | | |
Matthew A. Press
(1987) | | Vice President and Assistant Secretary | | Elected in 2023 | | Counsel, joined Lord Abbett in 2022 and was formerly an Associate at Clifford Chance US LLP (2014–2022). |
| | | | | | | |
Lawrence B. Stoller
(1963) | | Vice President, Secretary and Chief Legal Officer | | Elected as Vice President and Secretary in 2007 and Chief Legal Officer in 2019 | | Partner and General Counsel, joined Lord Abbett in 2007. |
| | | | | | | |
Victoria Zozulya
(1983) | | Vice President and Assistant Secretary | | Elected in 2022 | | Counsel, joined Lord Abbett in 2022 and was formerly Senior Director and Counsel at Equitable (2018–2022) and Assistant General Counsel at Neuberger Berman (2014–2018). |
| | | | | | | |
Nicholas D. Emguschowa
(1986) | | Data Protection Officer | | Elected in 2022 | | Assistant General Counsel, joined Lord Abbett in 2018 and was formerly Associate at Shearman & Sterling (2014–2018). |
Please call 888-522-2388 for a copy of the statement of additional information, which contains further information about the Fund’s Board members. It is available free upon request.
31
Householding
The Company has adopted a policy that allows it to send only one copy of the Fund’s prospectus, proxy material, annual report and semiannual report (or related notice of internet availability of annual report and semiannual report) to certain shareholders residing at the same “household.” This reduces Fund expenses, which benefits you and other shareholders. If you need additional copies or do not want your mailings to be “householded,” please call Lord Abbett at 888-522-2388 or send a written request with your name, the name of your fund or funds and your account number or numbers to Lord Abbett Family of Funds, P.O. Box 219336, Kansas City, MO 64121.
Proxy Voting Policies, Procedures and Records
A description of the policies and procedures that Lord Abbett uses to vote proxies related to the Fund’s portfolio securities, and information on how Lord Abbett voted the Fund’s proxies during the 12-month period ended June 30 are available without charge, upon request, (i) by calling 888-522-2388; (ii) on Lord Abbett’s website at www.lordabbett.com; and (iii) on the Securities and Exchange Commission’s (“SEC”) website at www.sec.gov.
Shareholder Reports and Quarterly Portfolio Disclosure
The Fund is required to file its complete schedule of portfolio holdings with the SEC for its first and third fiscal quarters as an attachment to Form N-PORT. Copies of the filings are available without charge, upon request on the SEC’s website at www.sec.gov and may be available by calling Lord Abbett at 888-522-2388.
Tax Information (unaudited) For corporate shareholders, 97% of the Fund’s ordinary income distributions qualified for the dividends received deduction. Additionally, of the distributions paid to the shareholders during the fiscal year ended December 31, 2022, $363,598 and $7,610,397, respectively, represent short-term capital gains and long-term capital gains. |
32
 | | | | |
 |
 | | | | |
 |
This report, when not used for the general information of shareholders of the Fund, is to be distributed only if preceded or accompanied by a current fund prospectus. | | | | |
| | | | | |
Lord Abbett mutual fund shares are distributed by
LORD ABBETT DISTRIBUTOR LLC. | | Lord Abbett Series Fund, Inc. Growth Opportunities Portfolio | | LASFGO-2
(02/23) |

LORD ABBETT
ANNUAL REPORT
Lord Abbett
Series Fund—Mid Cap Stock Portfolio
For the fiscal year ended December 31, 2022
Table of Contents
Lord Abbett Series Fund — Mid Cap Stock Portfolio
Annual Report
For the fiscal year ended December 31, 2022

From left to right: James L.L. Tullis, Independent Chair of the Lord Abbett Funds and Douglas B. Sieg, Director, President and Chief Executive Officer of the Lord Abbett Funds. | | Dear Shareholders: We are pleased to provide you with this overview of the performance of Lord Abbett Series Fund – Mid Cap Stock Portfolio for the fiscal year ended December 31, 2022. On this page and the following pages, we discuss the major factors that influenced fiscal year performance. For detailed and timely information about the Fund, please visit our website at www.lordabbett.com, where you can also access the quarterly commentaries that provide updates on the Fund’s performance and other portfolio related updates. Thank you for investing in Lord Abbett mutual funds. We value the trust that you place in us and look forward to serving your investment needs in the years to come. Best regards,  Douglas B. Sieg Director, President and Chief Executive Officer |
For the fiscal year ended December 31, 2022, the Fund returned –11.21%, reflecting performance at the net asset value (“NAV”) of Class VC shares with all distributions reinvested, compared to its benchmark, the Russell Midcap® Value Index*, which returned –12.03% over the same period.
U.S. markets faced many challenges throughout the twelve-month period ending December 31, 2022, including the spread of the Omicron variant of COVID-19, supply chain dislocations, labor shortages, inflationary pressures, tighter fiscal and monetary policy, and Russia’s invasion of Ukraine. The Dow Jones Industrial Average and S&P 500® Index fell –6.86% and –18.11%, respectively, while the tech-heavy
Nasdaq Composite suffered even greater losses, falling –32.54%. Value stocks1 significantly outperformed growth stocks2 (–7.98% vs –28.97%), while large cap stocks3 slightly edged out small cap stocks4 (–19.13% vs –20.44%).
To begin the twelve-month period, U.S. markets grappled with COVID-19 cases hitting the highest levels of the pandemic, rising above 580,000 new cases in the last week of December 2021, more than doubling the previous record high. The spike in cases occurred shortly after the World Health Organization designated the newly discovered Omicron variant as a “variant of concern”, leading to one of the largest selloffs of U.S. risk assets since the
1
start of the pandemic, amid fears that the world would succumb to a new wave of infections. However, negative sentiment quickly reversed as cases proved to be generally less severe than prior strains. Market sentiment also increased after the Center for Disease Control shortened its suggested isolation policy for those infected from 10 days to five.
Inflationary concerns began to take focus towards the end of 2021 and became a dominant story throughout the period. Headline consumer price index (CPI) readings had hovered a little above 5% year-over-year for most of 2021, which led investors to question whether this period of rising prices would be more persistent than originally thought. This debate was intensified by the December 2021 headline CPI rising 7.0% year-over-year, the fastest pace since 1982. The sharp increase in prices was generally due to supply and demand imbalances across multiple industries, led initially by energy, food, and used cars. Inflation readings continued to climb throughout the first half of 2022, peaking at 9.1% year-over-year in June. Increases in energy costs were even more profound, rising by more than 30% year-over-year by the end of June. The energy sector, which had been subject to rising consumer demand as global economies reopened from lockdowns induced by COVID-19, faced added friction with Russia’s invasion of Ukraine since Russia has been a large exporter of oil and certain minerals. Various sanctions imposed on Russia from Western nations led to a surge in commodity prices, with crude oil reaching over $100 per barrel for the first time since 2014.
The surge in prices forced the U.S. Federal Reserve (Fed) into a more aggressive approach to combating inflation. After remaining mostly consistent in its messaging
that price pressures would likely be transitory, elevated and more persistent inflation pressures caused the Fed to move the target federal funds rate into more restrictive territory. This resulted in a 25 basis point (bps) hike in the federal funds rate at the March Federal Open Market Committee (FOMC) meeting, the first hike in more than three years. Six additional rate hikes of 50 bps, 75 bps, 75 bps, 75 bps, 75 bps, and 50 bps, respectively, followed in the succeeding months as inflation prints continued to come in hotter than expected, resulting in a federal funds rate of 4.5% by the end of the period, the highest level in 15 years. While the shift down in the pace of rate hikes supported the narrative that the Fed may begin to cut rates by the end of 2023, the Fed’s updated Summary of Economic Projections showed a more hawkish outlook, raising the outlook for the fed funds rate through 2025 from September’s forecasts – including a median forecast of 5.1% for 2023, 4.1% in 2024, and 3.1% in 2025. Fed Chair Powell also struck a hawkish tone in the press conference following the December FOMC meeting, sticking to the higher-for-longer messaging. Bond yields shot up over the period in response to this aggressive policy, leading to a bearish curve flattening and ultimately a yield curve inversion, as shorter-term yields moved higher than longer-term yields.
Separately, global markets faced increased geopolitical tensions due to Russia’s invasion of Ukraine on February 23rd. Tensions remained elevated for the remainder of the twelve-month period, as Russia continued to weaponize energy flows, annexed four Ukrainian regions, and ratcheted up its nuclear warnings. In addition, the rhetoric between the U.S. and China over Taiwan further heated up after U.S. House of Representatives Speaker Nancy Pelosi visited Taiwan in August.
2
Key macroeconomic indicators mostly trended lower throughout the period, with the U.S. reporting negative gross domestic product of –1.6% in the first quarter of 2022 and –0.6% in the second quarter before growing 3.2% in the third quarter. Worries among investors that a recession was pending continued to grow, leading to a decline in the consumer confidence index to lower levels than during the height of the COVID-19 pandemic and the global financial crisis of 2008.
Despite rising recessionary signs, select bright spots in the U.S. economy supported the idea that a potential recession would be shallow. For example, one positive development was the peak inflation narrative, which included a 99-day stretch of declines in U.S. gasoline prices and November CPI coming in better than expected on both the headline and core numbers. In addition, apartment rents fell for the first time in nearly two years in July, and lumber prices declined by more than 70% from their March peak late in the third quarter, falling back to pre-COVID levels. The third quarter of the 2022 earnings season also generated a lot of “better-than-feared” takeaways, including a common theme of relatively stable demand and pricing power protecting margins. While third quarter earnings were slightly below expectations, comments from management generally provided evidence of healthy consumer spending. Capital return and capital expenditures were also mentioned as relative bright spots as companies flagged easing labor shortages and supply chain constraints. The U.S. labor market also remained strong over the period, with the national unemployment rate at 3.5% as of the end of December.
In terms of the Fund’s key performance drivers, over the twelve-month period ending December 31, 2022, security
selection within the Industrials sector contributed to the Fund’s relative performance. Within the Industrials sector, EMCOR Group, Inc., which engages in the provision of electrical and mechanical construction, and facilities services, contributed to relative performance. Shares rallied after the company reported third quarter earnings above expectations. The Fund’s position in Nexstar Media Group, Inc., a television broadcasting and digital media company, also contributed to relative performance. Shares rallied after the company announced that the board approved a new share repurchase program authorizing the company to repurchase up to $1.5B of its common stock. The Fund’s position in Curtiss-Wright Corporation, a global integrated business that provides engineered products, solutions, and services mainly to the aerospace and defense markets, also contributed to relative performance. Shares rallied after the company reported strong second quarter earnings, followed by another strong third quarter earnings report. In the second quarter specifically, the company reported new orders of $776M, up 13%, reflecting strong aerospace & defense market demand.
Conversely, one of the largest detractors from relative performance during the twelve-month period ending December 31, 2022, was Caesars Entertainment, a casino management company. Shares fell after the company reported that revenue was short of expectations in the first quarter. The company faced headwinds throughout the period as it had notable financial leverage. We believe the company should benefit both from the company’s intention to reduce its overall leverage as well as the resumption of international travel. The Fund’s position in KKR & Co., Inc. a leading alternatives investment firm, also
3
detracted from relative performance. Amid the flattening of the yield curve, rate volatility, and skepticism around global growth prospects, the Financials sector came under pressure. In addition to the sector headwinds, shares of KKR & Co. were negatively impacted by its failure to close its acquisition of Telecom Italia. We believe the company stands to benefit from increasing allocations to alternatives by retail and institutional investors as well as a rising proportion of fee-related income. The Fund’s position in Spectrum Brands Holdings, Inc., a consumer products and home essentials company, also
detracted from relative performance. Shares fell after Assa Abloy, which engages in the provision of intelligent lock and security solutions, issued a statement regarding the U.S. DOJ’s blocking of Assa Abloys’s proposed acquisition of the hardware and home improvement division of Spectrum Brands.
The Fund’s portfolio is actively managed and, therefore, its holdings and the weightings of a particular issuer or particular sector as a percentage of portfolio assets are subject to change. Sectors may include many industries.
* The Russell Midcap® Value Index measures the performance of those Russell Midcap companies with lower price-to-book ratios and lower forecasted growth values. The stocks are also members of the Russell 1000® Value index.
1 As represented by the Russell 3000® Value Index as of 12/31/2022.
2 As represented by the Russell 3000® Growth Index as of 12/31/2022.
3 As represented by the Russell 1000® Index as of 12/31/2022.
4 As represented by the Russell 2000® Index as of 12/31/2022.
Unless otherwise specified, indexes reflect total return, with all dividends reinvested. Indexes are unmanaged, do not reflect the deduction of fees or expenses, and are not available for direct investment.
Important Performance and Other Information
Performance data quoted in the following pages reflect past performance and are no guarantee of future results. Current performance may be higher or lower than the performance quoted. The investment return and principal value of an investment in the Fund will fluctuate so that shares, on any given day or when redeemed, may be worth more or less than their original cost. You can obtain performance data current to the most recent month end by calling Lord Abbett at 888-522-2388 or referring to www.lordabbett.com.
During certain periods shown, expense waivers and reimbursements were in place. Without such expense waivers and reimbursements, the Fund’s returns would have been lower.
The annual commentary above discusses the views of the Fund’s management and various portfolio holdings of the Fund as of December 31, 2022. These views and portfolio holdings may have changed after this date. Information provided in the commentary is not a recommendation to buy or sell securities. Because the Fund’s portfolio is actively managed and may change significantly, the Fund may no longer own the securities described above or may have otherwise changed its position in the securities. For more recent information about the Fund’s portfolio holdings, please visit www.lordabbett.com.
A Note about Risk: See Notes to Financial Statements for a discussion of investment risks. For a more detailed discussion of the risks associated with the Fund, please see the Fund’s prospectus.
Mutual funds are not insured by the FDIC, are not deposits or other obligations of, or guaranteed by, banks, and are subject to investment risks including possible loss of principal amount invested.
The Fund serves as an underlying investment vehicle for variable annuity contracts and variable life insurance policies.
4
Investment Comparison
Below is a comparison of a $10,000 investment in Class VC shares with the same investment in both the Russell Midcap® Value Index and the S&P MidCap 400® Value Index, assuming reinvestment of all dividends and distributions. The Fund’s shares are sold only to insurance company separate accounts that fund certain variable annuity and variable life contracts. This line graph comparison does not reflect the sales charges or other expenses of these contracts. If those sales charges and expenses were reflected, returns would be lower. The graph and performance table below do not reflect the deduction of taxes that a shareholder would pay on Fund distributions or the redemption of Fund shares. During certain periods, expenses of the Fund have been waived or reimbursed by Lord Abbett; without such waiver or reimbursement of expenses, the Fund’s returns would have been lower. Past performance is no guarantee of future results.
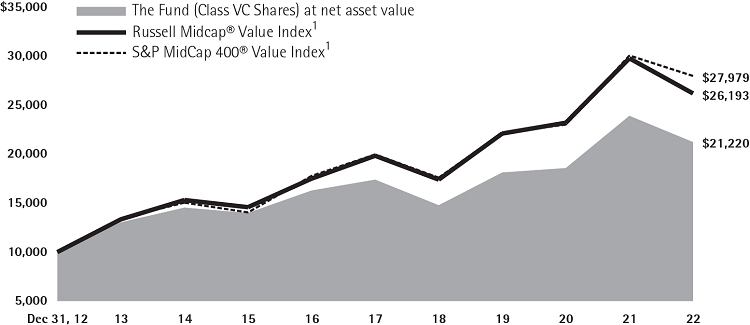
Average Annual Total Returns for the
Periods Ended December 31, 2022 | |
| | | 1 Year | | 5 Years | | 10 Years | |
| Class VC | | -11.21% | | 4.06% | | 7.81% | |
1 Performance for each unmanaged index does not reflect any fees or expenses. The performance of each index is not necessarily representative of the Fund’s performance.
5
Expense Example
As a shareholder of the Fund, you incur ongoing costs, including management fees; expenses related to the Fund’s services arrangements with certain insurance companies; and other Fund expenses. This Example is intended to help you understand your ongoing costs (in dollars) of investing in the Fund and to compare these costs with the ongoing costs of investing in other mutual funds.
The Example is based on an investment of $1,000 invested at the beginning of the period and held for the entire period (July 1, 2022 through December 31, 2022).
The Example reflects only expenses that are deducted from the assets of the Fund. Fees and expenses, including sales charges applicable to the various insurance products that invest in the Fund, are not reflected in this Example. If such fees and expenses were reflected in the Example, the total expenses shown would be higher. Fees and expenses regarding such variable insurance products are separately described in the prospectus related to those products.
Actual Expenses
The first line of the table on the following page provides information about actual account values and actual expenses. You may use the information in this line, together with the amount you invested, to estimate the expenses that you paid over the period. Simply divide your account value by $1,000 (for example, an $8,600 account value divided by $1,000 = 8.6), then multiply the result by the number in the first line under the heading titled “Expenses Paid During Period 7/1/22 – 12/31/22” to estimate the expenses you paid on your account during this period.
Hypothetical Example for Comparison Purposes
The second line of the table on the following page provides information about hypothetical account values and hypothetical expenses based on the Fund’s actual expense ratio and an assumed rate of return of 5% per year before expenses, which is not the Fund’s actual return. The hypothetical account values and expenses may not be used to estimate the actual ending account balance or expenses you paid for the period. You may use this information to compare the ongoing costs of investing in the Fund and other funds. To do so, compare this 5% hypothetical example with the 5% hypothetical examples that appear in the shareholder reports of the other funds.
6
Please note that the expenses shown in the table are meant to highlight your ongoing costs only and do not reflect any transactional costs, such as sales charges. Therefore, the second line of the table is useful in comparing ongoing costs only, and will not help you determine the relative total costs of owning different funds. In addition, if these transactional costs were included, your costs would have been higher.
| | | Beginning
Account
Value | | Ending
Account
Value | | Expenses
Paid During
Period† | |
| | | 7/1/22 | | 12/31/22 | | 7/1/22 –
12/31/22 | |
| Class VC | | | | | | | | | | | | | |
| Actual | | $ | 1,000.00 | | | $ | 1,073.70 | | | $ | 6.01 | | |
| Hypothetical (5% Return Before Expenses) | | $ | 1,000.00 | | | $ | 1,019.41 | | | $ | 5.85 | | |
| † | Net expenses are equal to the Fund’s annualized expense ratio of 1.15%, multiplied by the average account value over the period, multiplied by 184/365 (to reflect one-half year period). |
Portfolio Holdings Presented by Sector
December 31, 2022
| Sector* | | %** |
| Communication Services | | 1.15 | % |
| Consumer Discretionary | | 7.55 | % |
| Consumer Staples | | 5.17 | % |
| Energy | | 6.07 | % |
| Financials | | 19.89 | % |
| Health Care | | 9.20 | % |
| Industrials | | 19.23 | % |
| Information Technology | | 9.02 | % |
| Materials | | 7.68 | % |
| Real Estate | | 6.24 | % |
| Utilities | | 6.34 | % |
| Repurchase Agreements | | 2.46 | % |
| Total | | 100.00 | % |
| * | | A sector may comprise several industries. |
| ** | | Represents percent of total investments, which excludes derivatives. |
7
Schedule of Investments
December 31, 2022
| Investments | | Shares | | | Fair
Value | |
| LONG-TERM INVESTMENTS 98.25% | | | | | | | | |
| | | | | | | | | |
| COMMON STOCKS 98.25% | | | | | | | | |
| | | | | | | | | |
| Aerospace & Defense 2.32% | | | | | | | | |
| Curtiss-Wright Corp. | | | 32,290 | | | $ | 5,392,107 | |
| | | | | | | | | |
| Automobiles 0.59% | | | | | | | | |
| Harley-Davidson, Inc. | | | 33,140 | | | | 1,378,624 | |
| | | | | | | | | |
| Banks 3.84% | | | | | | | | |
| Columbia Banking System, Inc. | | | 79,530 | | | | 2,396,239 | |
| East West Bancorp, Inc. | | | 51,190 | | | | 3,373,421 | |
| Popular, Inc. | | | 47,840 | | | | 3,172,749 | |
| Total | | | | | | | 8,942,409 | |
| | | | | | | | | |
| Beverages 1.30% | | | | | | | | |
| Carlsberg A/S Class B | | | 22,810 | | | | 3,025,677 | |
| | | | | | | | | |
| Biotechnology 1.55% | | | | | | | | |
| Horizon Therapeutics plc* | | | 31,723 | | | | 3,610,077 | |
| | | | | | | | | |
| Building Products 1.56% | | | | | | | | |
| Masco Corp. | | | 77,740 | | | | 3,628,126 | |
| | | | | | | | | |
| Capital Markets 5.50% | | | | | | | | |
| Ameriprise Financial, Inc. | | | 18,020 | | | | 5,610,887 | |
| Evercore, Inc. Class A | | | 28,710 | | | | 3,131,687 | |
| KKR & Co., Inc. | | | 87,479 | | | | 4,060,775 | |
| Total | | | | | | | 12,803,349 | |
| | | | | | | | | |
| Chemicals 2.96% | | | | | | | | |
| Corteva, Inc. | | | 48,970 | | | | 2,878,457 | |
| Valvoline, Inc. | | | 123,286 | | | | 4,025,288 | |
| Total | | | | | | | 6,903,745 | |
| | | | | | | | | |
| Communications Equipment 1.49% | | | | | | |
| F5, Inc.* | | | 24,190 | | | | 3,471,507 | |
| | | | | | | | | |
| Construction & Engineering 4.35% | | | | | | | | |
| AECOM | | | 54,160 | | | | 4,599,809 | |
| EMCOR Group, Inc. | | | 37,400 | | | | 5,539,314 | |
| Total | | | | | | | 10,139,123 | |
| Investments | | Shares | | | Fair
Value | |
| Construction Materials 1.71% | | | | | | | | |
| Eagle Materials, Inc. | | | 30,050 | | | $ | 3,992,143 | |
| | | | | | | | | |
| Containers & Packaging 1.22% | | | | | | | | |
| Avery Dennison Corp. | | | 15,760 | | | | 2,852,560 | |
| | | | | | | | | |
| Diversified Financial Services 0.50% | | | | | |
| Equitable Holdings, Inc. | | | 40,500 | | | | 1,162,350 | |
| | | | | | | | | |
| Electric: Utilities 4.59% | | | | | | | | |
| Entergy Corp. | | | 40,370 | | | | 4,541,625 | |
| NRG Energy, Inc. | | | 74,092 | | | | 2,357,607 | |
| Portland General Electric Co. | | | 77,320 | | | | 3,788,680 | |
| Total | | | | | | | 10,687,912 | |
| | | | | | | | | |
| Electrical Equipment 1.54% | | | | | | | | |
| Sensata Technologies Holding plc | | | 88,760 | | | | 3,584,129 | |
| | | | | | | | | |
| Electronic Equipment, Instruments & Components 1.70% | |
| Teledyne Technologies, Inc.* | | | 9,920 | | | | 3,967,107 | |
| | | | | | | | | |
| Energy Equipment & Services 2.10% | | | | |
| NOV, Inc. | | | 233,660 | | | | 4,881,157 | |
| | | | | | | | | |
| Equity Real Estate Investment Trusts 6.29% | | | | |
| American Homes 4 Rent Class A | | | 97,590 | | | | 2,941,363 | |
| Camden Property Trust | | | 28,420 | | | | 3,179,630 | |
| First Industrial Realty Trust, Inc. | | | 48,490 | | | | 2,340,127 | |
| Kimco Realty Corp. | | | 187,930 | | | | 3,980,357 | |
| Life Storage, Inc. | | | 22,320 | | | | 2,198,520 | |
| Total | | | | | | | 14,639,997 | |
| | | | | | | | | |
| Food & Staples Retailing 1.75% | | | | | | | | |
| BJ’s Wholesale Club | | | | | | | | |
| Holdings, Inc.* | | | 61,610 | | | | 4,076,118 | |
| | | | | | | | | |
| Health Care Providers & Services 5.40% | | | | |
| AmerisourceBergen Corp. | | | 27,240 | | | | 4,513,940 | |
| Molina Healthcare, Inc.* | | | 14,820 | | | | 4,893,860 | |
| Tenet Healthcare Corp.* | | | 65,030 | | | | 3,172,814 | |
| Total | | | | | | | 12,580,614 | |
| 8 | See Notes to Financial Statements. |
Schedule of Investments (continued)
December 31, 2022
| Investments | | Shares | | | Fair
Value | |
| Hotels, Restaurants & Leisure 1.51% | | | | |
| Caesars Entertainment, Inc.* | | | 84,390 | | | $ | 3,510,624 | |
| | | | | | | | | |
| Household Durables 1.47% | | | | | | | | |
| Helen of Troy Ltd.* | | | 30,840 | | | | 3,420,464 | |
| | | | | | | | | |
| Household Products 2.16% | | | | | | | | |
| Reynolds Consumer Products, Inc. | | | 38,880 | | | | 1,165,622 | |
| Spectrum Brands Holdings, Inc. | | | 63,290 | | | | 3,855,627 | |
| Total | | | | | | | 5,021,249 | |
| | | | | | | | | |
| Information Technology Services 3.00% | | | | | |
| Euronet Worldwide, Inc.* | | | 34,640 | | | | 3,269,323 | |
| Global Payments, Inc. | | | 37,540 | | | | 3,728,473 | |
| Total | | | | | | | 6,997,796 | |
| | | | | | | | | |
| Insurance 10.20% | | | | | | | | |
| Allstate Corp. (The) | | | 43,510 | | | | 5,899,956 | |
| American Financial Group, Inc./OH | | | 24,710 | | | | 3,392,189 | |
| Arch Capital Group Ltd.* | | | 67,780 | | | | 4,255,228 | |
| Arthur J Gallagher & Co. | | | 21,700 | | | | 4,091,318 | |
| Assurant, Inc. | | | 20,220 | | | | 2,528,713 | |
| RenaissanceRe Holdings Ltd. | | | 19,530 | | | | 3,598,012 | |
| Total | | | | | | | 23,765,416 | |
| | | | | | | | | |
| Machinery 7.58% | | | | | | | | |
| Crane Holdings Co. | | | 41,237 | | | | 4,142,257 | |
| Otis Worldwide Corp. | | | 52,820 | | | | 4,136,334 | |
| Parker-Hannifin Corp. | | | 18,760 | | | | 5,459,160 | |
| Westinghouse Air Brake Technologies Corp. | | | 39,350 | | | | 3,927,523 | |
| Total | | | | | | | 17,665,274 | |
| | | | | | | | | |
| Media 1.16% | | | | | | | | |
| Nexstar Media Group, Inc. | | | 15,390 | | | | 2,693,712 | |
| | | | | | | | | |
| Metals & Mining 1.84% | | | | | | | | |
| Alcoa Corp. | | | 37,480 | | | | 1,704,215 | |
| Reliance Steel & Aluminum Co. | | | 12,720 | | | | 2,575,037 | |
| Total | | | | | | | 4,279,252 | |
| Investments | | Shares | | | Fair
Value | |
| Multi-Utilities 1.80% | | | | | | | | |
| CMS Energy Corp. | | | 66,120 | | | $ | 4,187,380 | |
| | | | | | | | | |
| Oil, Gas & Consumable Fuels 4.02% | | | |
| Chesapeake Energy Corp. | | | 50,014 | | | | 4,719,821 | |
| Devon Energy Corp. | | | 75,560 | | | | 4,647,696 | |
| Total | | | | | | | 9,367,517 | |
| | | | | | | | | |
| Pharmaceuticals 2.32% | | | | | | | | |
| Organon & Co. | | | 193,520 | | | | 5,405,014 | |
| | | | | | | | | |
| Semiconductors & Semiconductor Equipment 1.19% | |
| Teradyne, Inc. | | | 31,840 | | | | 2,781,224 | |
| | | | | | | | | |
| Specialty Retail 1.69% | | | | | | | | |
| AutoZone, Inc.* | | | 1,600 | | | | 3,945,888 | |
| | | | | | | | | |
| Technology Hardware, Storage & Peripherals 1.69% | |
| NetApp, Inc. | | | 65,610 | | | | 3,940,537 | |
| | | | | | | | | |
| Textiles, Apparel & Luxury Goods 2.34% | | | |
| Deckers Outdoor Corp.* | | | 6,272 | | | | 2,503,531 | |
| Tapestry, Inc. | | | 77,660 | | | | 2,957,293 | |
| Total | | | | | | | 5,460,824 | |
| | | | | | | | | |
| Trading Companies & Distributors 2.02% | | | |
| AerCap Holdings NV (Ireland)*(a) | | | 80,650 | | | | 4,703,508 | |
Total Common Stocks
(cost $210,801,268) | | | | | | | 228,864,510 | |
| | See Notes to Financial Statements. | 9 |
Schedule of Investments (concluded)
December 31, 2022
| Investments | | Principal
Amount | | | Fair
Value | |
| SHORT-TERM INVESTMENTS 2.48% | | | | | |
| | | | | | | | | |
| REPURCHASE AGREEMENTS 2.48% | | | | | |
Repurchase Agreement dated 12/30/2022, 2.05% due 1/3/2023 with Fixed Income Clearing Corp. collateralized by $5,865,900 of U.S. Treasury Note at 4.275% due 4/30/2024; value: $5,894,385; proceeds: $5,780,080
(cost $5,778,764) | | $ | 5,778,764 | | | $ | 5,778,764 | |
Total Investments in Securities 100.73%
(cost $216,580,032) | | | | | | | 234,643,274 | |
| Other Assets and Liabilities – Net (0.73)% | | | | | | | (1,708,120 | ) |
| Net Assets 100.00% | | | | | | $ | 232,935,154 | |
| * | | Non-income producing security. |
| (a) | | Foreign security traded in U.S. dollars. |
The following is a summary of the inputs used as of December 31, 2022 in valuing the Fund’s investments carried at fair value(1):
| Investment Type(2) | | Level 1 | | | Level 2 | | | Level 3 | | | Total |
| Long-Term Investments | | | | | | | | | | | | | | | |
| Common Stocks | | | | | | | | | | | | | | | |
| Beverages | | $ | – | | | $ | 3,025,677 | | | $ | – | | | $ | 3,025,677 |
| Remaining Industries | | | 225,838,833 | | | | – | | | | – | | | | 225,838,833 |
| Short-Term Investments | | | | | | | | | | | | | | | |
| Repurchase Agreements | | | – | | | | 5,778,764 | | | | – | | | | 5,778,764 |
| Total | | $ | 225,838,833 | | | $ | 8,804,441 | | | $ | – | | | $ | 234,643,274 |
| (1) | | Refer to Note 2(i) for a description of fair value measurements and the three-tier hierarchy of inputs. |
| (2) | | See Schedule of Investments for fair values in each industry and identification of foreign issuers and/or geography. The table above is presented by Investment Type. Industries are presented within an Investment Type should such Investment Type include securities classified as two or more levels within the three-tier fair value hierarchy. When applicable, each Level 3 security is identified on the Schedule of Investments along with the valuation technique utilized. |
A reconciliation of Level 3 investments is presented when the Fund has a material amount of Level 3 investments at the beginning or end of the year in relation to the Fund’s net assets.
| 10 | See Notes to Financial Statements. |
Statement of Assets and Liabilities
December 31, 2022
| ASSETS: | | | | |
| Investments in securities, at fair value (cost $216,580,032) | | $ | 234,643,274 | |
| Cash | | | 267 | |
| Receivables: | | | | |
| Interest and dividends | | | 170,791 | |
| Capital shares sold | | | 9,190 | |
| Securities lending income receivable | | | 113 | |
| Prepaid expenses | | | 952 | |
| Total assets | | | 234,824,587 | |
| LIABILITIES: | | | | |
| Payables: | | | | |
| Capital shares reacquired | | | 894,560 | |
| Transfer agent fees | | | 685,940 | |
| Management fee | | | 146,885 | |
| Directors’ fees | | | 67,686 | |
| Fund administration | | | 7,994 | |
| Accrued expenses | | | 86,368 | |
| Total liabilities | | | 1,889,433 | |
| NET ASSETS | | $ | 232,935,154 | |
| COMPOSITION OF NET ASSETS: | | | | |
| Paid-in capital | | $ | 213,816,758 | |
| Total distributable earnings (loss) | | | 19,118,396 | |
| Net Assets | | $ | 232,935,154 | |
| Outstanding shares (200 million shares of common stock authorized, $.001 par value) | | | 10,089,935 | |
| Net asset value, offering and redemption price per share (Net assets divided by outstanding shares) | | | $23.09 | |
| | See Notes to Financial Statements. | 11 |
Statement of Operations
For the Year Ended December 31, 2022
| Investment income: | | | | |
| Dividends (net of foreign withholding taxes of $24,296) | | $ | 5,140,260 | |
| Securities lending net income | | | 437 | |
| Interest and other | | | 56,665 | |
| Total investment income | | | 5,197,362 | |
| Expenses: | | | | |
| Management fee | | | 1,815,979 | |
| Non 12b-1 service fees | | | 621,328 | |
| Shareholder servicing | | | 189,276 | |
| Fund administration | | | 99,445 | |
| Professional | | | 49,287 | |
| Reports to shareholders | | | 35,282 | |
| Custody | | | 22,386 | |
| Directors’ fees | | | 4,471 | |
| Other | | | 38,960 | |
| Gross expenses | | | 2,876,414 | |
| Expense reductions (See Note 8) | | | (3,093 | ) |
| Fees waived and expenses reimbursed (See Note 3) | | | (22,386 | ) |
| Net expenses | | | 2,850,935 | |
| Net investment income | | | 2,346,427 | |
| Net realized and unrealized gain (loss): | | | | |
| Net realized gain (loss) on investments | | | 13,112,220 | |
| Net realized gain (loss) on foreign currency related transactions | | | 446 | |
| Net change in unrealized appreciation/depreciation on investments | | | (47,864,990 | ) |
| Net change in unrealized appreciation/depreciation on translation of assets and liabilities denominated in foreign currencies | | | (1,228 | ) |
| Net realized and unrealized gain (loss) | | | (34,753,552 | ) |
| Net Decrease in Net Assets Resulting From Operations | | $ | (32,407,125 | ) |
| 12 | See Notes to Financial Statements. |
Statements of Changes in Net Assets
| INCREASE (DECREASE) IN NET ASSETS | For the Year Ended
December 31, 2022 | | | For the Year Ended
December 31, 2021 | |
| Operations: | | | | | | | | | | |
| Net investment income | | | $ | 2,346,427 | | | | $ | 1,677,662 | |
| Net realized gain (loss) on investments and foreign currency related transactions | | | | 13,112,666 | | | | | 38,914,628 | |
| Net change in unrealized appreciation/depreciation on investments and translation of assets and liabilities denominated in foreign currencies | | | | (47,866,218 | ) | | | | 29,420,416 | |
| Net increase (decrease) in net assets resulting from operations | | | | (32,407,125 | ) | | | | 70,012,706 | |
| Distributions to shareholders: | | | | (17,084,849 | ) | | | | (27,759,457 | ) |
| Capital share transactions (See Note 14): | | | | | | | | | | |
| Net proceeds from sales of shares | | | | 8,430,159 | | | | | 9,764,943 | |
| Reinvestment of distributions | | | | 17,084,849 | | | | | 27,759,457 | |
| Cost of shares reacquired | | | | (37,176,385 | ) | | | | (39,975,409 | ) |
| Net decrease in net assets resulting from capital share transactions | | | | (11,661,377 | ) | | | | (2,451,009 | ) |
| Net increase (decrease) in net assets | | | | (61,153,351 | ) | | | | 39,802,240 | |
| NET ASSETS: | | | | | | | | | | |
| Beginning of year | | | $ | 294,088,505 | | | | $ | 254,286,265 | |
| End of year | | | $ | 232,935,154 | | | | $ | 294,088,505 | |
| | See Notes to Financial Statements. | 13 |
Financial Highlights
| | | | | Per Share Operating Performance: |
| | | | | Investment Operations: | | Distributions to
shareholders from: |
| | | Net asset
value,
beginning
of period | | Net
invest-
ment
income(a) | | Net
realized
and
unrealized
gain (loss) | | Total
from
invest-
ment
opera-
tions | | Net
investment
income | | Net
realized
gain | | Total
distri-
butions |
| 12/31/2022 | | | $28.02 | | | | $0.24 | | | | $(3.39 | ) | | | $(3.15 | ) | | | $(0.21 | ) | | | $(1.57 | ) | | | $(1.78 | ) |
| 12/31/2021 | | | 24.09 | | | | 0.17 | | | | 6.67 | | | | 6.84 | | | | (0.17 | ) | | | (2.74 | ) | | | (2.91 | ) |
| 12/31/2020 | | | 23.74 | | | | 0.23 | | | | 0.36 | | | | 0.59 | | | | (0.24 | ) | | | — | | | | (0.24 | ) |
| 12/31/2019 | | | 19.87 | | | | 0.21 | | | | 4.27 | | | | 4.48 | | | | (0.21 | ) | | | (0.40 | ) | | | (0.61 | ) |
| 12/31/2018 | | | 24.51 | | | | 0.15 | | | | (3.83 | ) | | | (3.68 | ) | | | (0.17 | ) | | | (0.79 | ) | | | (0.96 | ) |
| (a) | Calculated using average shares outstanding during the period. |
| (b) | Total return does not consider the effects of sales charges or other expenses imposed by an insurance company and assumes the reinvestment of all distributions. |
| 14 | See Notes to Financial Statements. |
| | | | | Ratios to Average Net Assets: | | Supplemental Data: |
| | | | | | | | | | | | | |
| | | | | | | | | | | | | |
Net
asset
value,
end of
period | | Total
return(b)
(%) | | Total expenses
after waivers
and/or
reimbursements
(%) | | Total
expenses
(%) | | Net
investment
income
(%) | | Net
assets,
end of
period
(000) | | Portfolio
turnover
rate
(%) |
| $ | 23.09 | | | | (11.21 | ) | | | 1.15 | | | | 1.16 | | | | 0.94 | | | $ | 232,935 | | | | 36 | |
| | 28.02 | | | | 28.70 | | | | 1.13 | | | | 1.14 | | | | 0.59 | | | | 294,089 | | | | 60 | |
| | 24.09 | | | | 2.50 | | | | 1.17 | | | | 1.18 | | | | 1.11 | | | | 254,286 | | | | 67 | |
| | 23.74 | | | | 22.64 | | | | 1.17 | | | | 1.17 | | | | 0.91 | | | | 271,120 | | | | 79 | |
| | 19.87 | | | | (15.04 | ) | | | 1.17 | | | | 1.17 | | | | 0.64 | | | | 240,971 | | | | 50 | |
| | See Notes to Financial Statements. | 15 |
Notes to Financial Statements
Lord Abbett Series Fund, Inc. (the “Company”) is registered under the Investment Company Act of 1940, as amended (the “Act”), as a diversified, open-end management investment company and was incorporated under Maryland law in 1989. The Company consists of nine separate portfolios as of December 31, 2022. This report covers Mid Cap Stock Portfolio (the “Fund”).
The Fund’s investment objective is to seek capital appreciation through investments, primarily in equity securities, which are believed to be undervalued in the marketplace. The Fund has Variable Contract class shares (“Class VC Shares”), which are currently issued and redeemed only in connection with investments in, and payments under, variable annuity contracts and variable life insurance policies issued by life insurance and insurance-related companies.
The preparation of the financial statements in conformity with accounting principles generally accepted in the United States of America (“U.S. GAAP”) requires management to make certain estimates and assumptions that affect the reported amounts of assets and liabilities and disclosure of contingent assets and liabilities at the date of the financial statements and the reported amounts of increases and decreases in net assets from operations during the reporting period. Actual results could differ from those estimates. The Fund is considered an investment company under U.S. GAAP and follows the accounting and reporting guidance applicable to investment companies.
| 2. | SIGNIFICANT ACCOUNTING POLICIES |
| (a) | Investment Valuation–Under procedures approved by the Fund’s Board of Directors (the “Board”), the Board has designated the determination of fair value of the Fund’s portfolio investments to Lord, Abbett & Co. LLC (“Lord Abbett”), as its valuation designee. Accordingly, Lord Abbett is responsible for, among other things, assessing and managing valuation risks, establishing, applying and testing fair value methodologies, and evaluating pricing services. Lord Abbett has formed a Pricing Committee that performs these responsibilities on behalf of Lord Abbett, administers the pricing and valuation of portfolio investments and ensures that prices utilized reasonably reflect fair value. Among other things, these procedures allow Lord Abbett, subject to Board oversight, to utilize independent pricing services, quotations from securities and financial instrument dealers and other market sources to determine fair value. |
| | |
| | Securities actively traded on any recognized U.S. or non-U.S. exchange or on The NASDAQ Stock Market LLC are valued at the last sale price or official closing price on the exchange or system on which they are principally traded. Events occurring after the close of trading on non-U.S. exchanges may result in adjustments to the valuation of foreign securities to reflect their fair value as of the close of regular trading on the New York Stock Exchange. When valuing foreign equity securities that meet certain criteria, the Board has approved the use of an independent fair valuation service that values such securities to reflect market trading that occurs after the close of the applicable foreign markets of comparable securities or other instruments that correlate to the fair-valued securities. Unlisted equity securities are valued at the last quoted sale price or, if no sale price is available, at the mean between the most recently quoted bid and ask prices. |
| | |
| | Securities for which prices are not readily available are valued at fair value as determined by the Pricing Committee. The Pricing Committee considers a number of factors, including observable and unobservable inputs, when arriving at fair value. The Pricing Committee may |
16
Notes to Financial Statements (continued)
| | use related or comparable assets or liabilities, recent transactions, market multiples, book values, and other relevant information to determine the fair value of portfolio investments. The Board or a designated committee thereof periodically reviews reports that may include fair value determinations made by the Pricing Committee, related market activity, inputs and assumptions, and retrospective comparison of prices of subsequent purchases and sales transactions to fair value determinations made by the Pricing Committee. |
| | |
| | Investments in open-end money market mutual funds are valued at their NAV as of the close of each business day. Short-term securities with 60 days or less remaining to maturity are valued using the amortized cost method, which approximates fair value. |
| | |
| (b) | Security Transactions–Security transactions are recorded as of the date that the securities are purchased or sold (trade date). Realized gains and losses on sales of portfolio securities are calculated using the identified-cost method. |
| | |
| (c) | Investment Income–Dividend income is recorded on the ex-dividend date. Interest income is recorded on the accrual basis as earned. Discounts are accreted and premiums are amortized using the effective interest method and are included in Interest and other, if applicable, on the Statement of Operations. Withholding taxes on foreign dividends have been provided for in accordance with the applicable country’s tax rules and rates. |
| | |
| (d) | Income Taxes–It is the policy of the Fund to meet the requirements of Subchapter M of the Internal Revenue Code applicable to regulated investment companies and to distribute substantially all taxable income and capital gains to its shareholders. Therefore, no income tax provision is required. |
| | |
| | The Fund files U.S. federal and various state and local tax returns. No income tax returns are currently under examination. The statute of limitations on the Fund’s filed U.S. federal tax returns remains open for the fiscal years ended December 31, 2019 through December 31, 2022. The statutes of limitations on the Fund’s state and local tax returns may remain open for an additional year depending upon the jurisdiction. |
| | |
| (e) | Expenses–Expenses incurred by the Company that do not specifically relate to an individual fund are generally allocated to the funds within the Company on a pro rata basis by relative net assets. |
| | |
| (f) | Foreign Transactions–The books and records of the Fund are maintained in U.S. dollars and transactions denominated in foreign currencies are recorded in the Fund’s records at the rate prevailing when earned or recorded. Asset and liability accounts that are denominated in foreign currencies are adjusted daily to reflect current exchange rates and any unrealized gain (loss), if applicable, is included in Net change in unrealized appreciation/depreciation on translation of assets and liabilities denominated in foreign currencies on the Fund’s Statement of Operations. The resultant exchange gains and losses upon settlement of such transactions, if applicable, are included in Net realized gain (loss) on foreign currency related transactions on the Fund’s Statement of Operations. The Fund does not isolate that portion of the results of operations arising as a result of changes in the foreign exchange rates from the changes in market prices of the securities. |
| | |
| | The Fund uses foreign currency exchange contracts to facilitate transactions in foreign-denominated securities. Losses from these transactions may arise from changes in the value of the foreign currency or if the counterparties do not perform under the contracts’ terms. |
17
Notes to Financial Statements (continued)
| (g) | Forward Foreign Currency Exchange Contracts–The Fund may enter into forward foreign currency exchange contracts in order to reduce exposure to changes in foreign currency exchange rates on foreign portfolio holdings, or gain or reduce exposure to foreign currency solely for investment purposes. A forward foreign currency exchange contract is a commitment to purchase or sell a foreign currency at a future date at a negotiated rate. The contracts are valued daily at forward exchange rates and any unrealized gain (loss), if applicable, is included in Net change in unrealized appreciation/depreciation on forward foreign currency exchange contracts in the Fund’s Statement of Operations. The gain (loss) arising from the difference between the U.S. dollar cost of the original contract and the value of the forward foreign currency in U.S. dollars upon closing of such contracts is included, if applicable, in Net realized gain (loss) on forward foreign currency exchange contracts in the Fund’s Statement of Operations. |
| | |
| (h) | Repurchase Agreements–The Fund may enter into repurchase agreements with respect to securities. A repurchase agreement is a transaction in which a fund acquires a security and simultaneously commits to resell that security to the seller (a bank or securities dealer) at an agreed-upon price on an agreed-upon date. The Fund requires at all times that the repurchase agreement be collateralized by cash, or by securities of the U.S. Government, its agencies, its instrumentalities, or U.S. Government sponsored enterprises having a value equal to, or in excess of, the value of the repurchase agreement (including accrued interest). If the seller of the agreement defaults on its obligation to repurchase the underlying securities at a time when the fair value of these securities has declined, the Fund may incur a loss upon disposition of the securities. |
| | |
| (i) | Fair Value Measurements–Fair value is defined as the price that the Fund would receive upon selling an investment or transferring a liability in an orderly transaction to an independent buyer in the principal or most advantageous market of the investment. A three-tier hierarchy is used to maximize the use of observable market data and minimize the use of unobservable inputs and to establish classification of fair value measurements for disclosure purposes. Inputs refer broadly to the assumptions that market participants would use in pricing the asset or liability, including assumptions about risk – for example, the risk inherent in a particular valuation technique used to measure fair value (such as a pricing model) and/or the risk inherent in the inputs to the valuation technique. Inputs may be observable or unobservable. Observable inputs reflect the assumptions market participants would use in pricing the asset or liability. Observable inputs are based on market data obtained from sources independent of the reporting entity. Unobservable inputs reflect the reporting entity’s own assumptions about the assumptions market participants would use in pricing the asset or liability. Unobservable inputs are based on the best information available in the circumstances. The three-tier hierarchy classification is determined based on the lowest level of inputs that is significant to the fair value measurement, and is summarized in the three broad Levels listed below: |
| | |
| | • | Level 1 – | unadjusted quoted prices in active markets for identical investments; |
| | | | |
| | • | Level 2 – | other significant observable inputs (including quoted prices for similar investments, interest rates, prepayment speeds, credit risk, etc.); and |
| | | | |
| | • | Level 3 – | significant unobservable inputs (including the Fund’s own assumptions in determining the fair value of investments). |
| | | | |
| | A summary of inputs used in valuing the Fund’s investments as of December 31, 2022 and, if applicable, Level 3 rollforwards for the fiscal year then ended is included in the Fund’s Schedule of Investments. |
18
Notes to Financial Statements (continued)
Changes in valuation techniques may result in transfers into or out of an assigned level within the three-tier hierarchy. The inputs or methodology used for valuing securities are not necessarily an indication of the risk associated with investing in those securities.
| 3. | MANAGEMENT FEE AND OTHER TRANSACTIONS WITH AFFILIATES |
Management Fee
The Company has a management agreement with Lord Abbett, pursuant to which Lord Abbett provides the Fund with investment management services and executive and other personnel, provides office space and pays for ordinary and necessary office and clerical expenses relating to research and statistical work and supervision of the Fund’s investment portfolio. The management fee is accrued daily and payable monthly.
The management fee is based on the Fund’s average daily net assets at the following annual rate:
| First $200 million | .75% |
| Next $300 million | .65% |
| Over $500 million | .50% |
For the fiscal year ended December 31, 2022, the effective management fee was at an annualized rate of .73% of the Fund’s average daily net assets.
In addition, Lord Abbett provides certain administrative services to the Fund pursuant to an Administrative Services Agreement in return for a fee at an annual rate of .04% of the Fund’s average daily net assets. The fund administration fee is accrued daily and payable monthly. Lord Abbett voluntarily waived $22,386 of fund administration fees during the fiscal year ended December 31, 2022.
The Company, on behalf of the Fund, has entered into services arrangements with certain insurance companies. Under these arrangements, certain insurance companies will be compensated up to .25% of the average daily net asset value (“NAV”) of the Fund’s Class VC Shares held in the insurance company’s separate account to service and maintain the Variable Contract owners’ accounts. This amount is included in non 12b-1 service fees on the Statement of Operations. The Fund may also compensate certain insurance companies, third-party administrators and other entities for providing recordkeeping, sub-transfer agency and other administrative services to the Fund. This amount is included in Shareholder servicing on the Statement of Operations.
One Director and certain of the Company’s officers have an interest in Lord Abbett.
| 4. | DISTRIBUTIONS AND CAPITAL LOSS CARRYFORWARDS |
Dividends from net investment income, if any, are declared and paid at least semi-annually. Taxable net realized gains from investment transactions, reduced by allowable capital loss carryforwards, if any, are declared and distributed to shareholders at least annually. The capital loss carryforward amount, if any, is available to offset future net capital gains. Dividends and distributions to shareholders are recorded on the ex-dividend date. The amounts of dividends and distributions from net investment income and net realized capital gains are determined in accordance with federal income tax regulations, which may differ from U.S. GAAP. These book/tax differences are either considered temporary or permanent in nature. To the extent these differences are permanent in nature, such amounts are reclassified within the components of net assets based on their federal tax basis treatment; temporary differences do not require reclassification. Dividends and distributions that exceed earnings and profits for tax purposes are reported as a tax return of capital.
19
Notes to Financial Statements (continued)
The tax character of distributions paid during the fiscal years ended December 31, 2022 and 2021 was as follows:
| | | Year Ended | | | Year Ended |
| | | 12/31/2022 | | | 12/31/2021 |
| Distributions paid from: | | | | | | | |
| Ordinary income | | $ | 2,194,948 | | | $ | 6,793,515 |
| Net long-term capital gains | | | 14,889,901 | | | | 20,965,942 |
| Total distributions paid | | $ | 17,084,849 | | | $ | 27,759,457 |
As of December 31, 2022, the components of accumulated gains on a tax-basis were as follows:
| Undistributed long-term capital gains | | $ | 1,444,912 | |
| Total undistributed earnings | | | 1,444,912 | |
| Temporary differences | | | (67,686 | ) |
| Unrealized gains – net | | | 17,741,170 | |
| Total accumulated gains – net | | $ | 19,118,396 | |
As of December 31, 2022, the aggregate unrealized security gains and losses on investments and other financial instruments based on cost for U.S. federal income tax purposes were as follows:
| Tax cost | | $ | 216,900,853 | |
| Gross unrealized gain | | | 32,168,870 | |
| Gross unrealized loss | | | (14,426,449 | ) |
| Net unrealized security gain | | $ | 17,742,421 | |
The difference between book-basis and tax-basis unrealized gains (losses) is attributable to the tax treatment of certain distributions received and wash sales.
| 5. | PORTFOLIO SECURITIES TRANSACTIONS |
Purchases and sales of investment securities (excluding short-term investments) for the fiscal year ended December 31, 2022 were as follows:
| Purchases | | Sales |
| $88,836,687 | | $118,567,181 |
There were no purchases or sales of U.S. Government securities for the fiscal year ended December 31, 2022.
The Fund is permitted to purchase and sell securities (“cross-trade”) from and to other Lord Abbett funds or client accounts pursuant to procedures approved by the Board in compliance with Rule 17a-7 under the Act (the “Rule”). Each cross-trade is executed at a fair market price in compliance with provisions of the Rule. For the fiscal year ended December 31, 2022, the Fund did not engage in cross-trade transactions.
| 6. | DISCLOSURES ABOUT OFFSETTING ASSETS AND LIABILITIES |
The Financial Accounting Standards Board requires disclosures intended to help better assess the effect or potential effect of offsetting arrangements on a fund’s financial position. The following tables illustrate gross and net information about recognized assets and liabilities eligible for offset in the Statement of Assets and Liabilities, and disclose such amounts subject to an enforceable master netting agreement or similar agreement, by the counterparty. A master netting agreement
20
Notes to Financial Statements (continued)
is an agreement between a fund and a counterparty which provides for the net settlement of amounts owed under all contracts traded under that agreement, as well as cash collateral, through a single payment by one party to the other in the event of default on or termination of any one contract. The Fund’s accounting policy with respect to balance sheet offsetting is that, absent an event of default by the counterparty or a termination of the agreement, the master netting agreement does not result in an offset of reported amounts of financial assets and liabilities in the Statement of Assets and Liabilities across transactions between the Fund and the applicable counterparty:
| | | Gross Amounts | Net Amounts of |
| | | Offset in the | Assets Presented |
| | Gross Amounts of | Statement of Assets | in the Statement of |
| Description | Recognized Assets | and Liabilities | Assets and Liabilities |
| Repurchase Agreements | $5,778,764 | $ – | $5,778,764 |
| Total | $5,778,764 | $ – | $5,778,764 |
| | | Net Amount | | | | |
| | | of Assets | | Amounts Not Offset in the | | |
| | | Presented in | | Statement of Assets and Liabilities | | |
| | | the Statement | | | | Cash | | Securities | | |
| | | of Assets and | | Financial | | Collateral | | Collateral | | Net |
| Counterparty | | Liabilities | | Instruments | | Received(a) | | Received(a) | | Amount(b) |
| Fixed Income Clearing Corp. | | $5,778,764 | | $ – | | $ – | | $(5,778,764) | | $ – |
| Total | | $5,778,764 | | $ – | | $ – | | $(5,778,764) | | $ – |
| (a) | Collateral disclosed is limited to an amount not to exceed 100% of the net amount of assets (liabilities) presented in the Statement of Assets and Liabilities, for each respective counterparty. |
| (b) | Net amount represents the amount owed to the Fund by the counterparty as of December 31, 2022. |
| 7. | DIRECTORS’ REMUNERATION |
The Company’s officers and one Director, who are associated with Lord Abbett, do not receive any compensation from the Company for serving in such capacities. Independent Directors’ fees are allocated among all Lord Abbett-sponsored funds based on the net assets of each fund. There is an equity-based plan available to all Independent Directors under which Independent Directors may elect to defer receipt of a portion of Directors’ fees. The deferred amounts are treated as though equivalent dollar amounts had been invested in the Fund. Such amounts and earnings accrued thereon are included in Directors’ fees on the Statement of Operations and in Directors’ fees payable on the Statement of Assets and Liabilities and are not deductible for U.S. federal income tax purposes until such amounts are paid.
The Company has entered into an arrangement with its transfer agent and custodian, whereby credits realized as a result of uninvested cash balances are used to reduce a portion of the Fund’s expenses.
For the period ended August 3, 2022, the Fund and certain other funds managed by Lord Abbett (collectively, the “Participating Funds”) entered into a syndicated line of credit facility with various lenders for $1.275 billion (the “Syndicated Facility”) whereas State Street Bank and Trust Company (“SSB”) participated as a lender and as agent for the lenders. The Participating Funds were subject
21
Notes to Financial Statements (continued)
to graduated borrowing limits of one-third of fund net assets (if fund net assets are less than $750 million), $250 million, $300 million, $700 million, or $1 billion, based on past borrowings and likelihood of future borrowings, among other factors.
Effective August 4, 2022, the Participating Funds entered into a Syndicated Facility with various lenders for $1.625 billion whereas SSB participates as a lender and as agent for the lenders. The Participating Funds were subject to graduated borrowing limits of one-third of fund net assets (if fund net assets are less than $750 million), $250 million, $300 million, $700 million, or $1 billion, based on past borrowings and likelihood of future borrowings, among other factors.
For the period ended August 3, 2022, the Participating Funds were party to an additional line of credit facility with SSB for $330 million (the “Bilateral Facility”), $250 million committed and $80 million uncommitted. Under the Bilateral Facility, the Participating Funds are subject to graduated borrowing limits of one-third of fund net assets (if net assets are less than $750 million), $250 million, $300 million, or $330 million, based on past borrowings and likelihood of future borrowings, among other factors.
Effective August 4, 2022, the Participating Funds are party to an additional uncommitted line of credit facility with SSB for $330 million. Under the Bilateral Facility, the Participating Funds are subject to borrowing limits of one-third of fund net assets (if net assets are less than $750 million), or $250 million based on past borrowings and likelihood of future borrowings, among other factors.
The Syndicated Facility and the Bilateral Facility are to be used for temporary or emergency purposes as additional sources of liquidity to satisfy redemptions.
For the year ended December 31, 2022, the Fund did not utilize the Syndicated Facility or Bilateral Facility.
| 10. | INTERFUND LENDING PROGRAM |
Pursuant to an exemptive order issued by the U.S. Securities and Exchange Commission (“SEC exemptive order”) certain registered open-end management investment companies managed by Lord Abbett, including the Fund, participate in a joint lending and borrowing program (the “Interfund Lending Program”). The SEC exemptive order allows the funds that participate in the Interfund Lending Program to borrow money from and lend money to each other for temporary or emergency purposes subject to the limitations and conditions.
For the fiscal year ended December 31, 2022 the Fund did not participate as a borrower or lender in the Interfund Lending Program.
| 11. | CUSTODIAN AND ACCOUNTING AGENT |
SSB is the Company’s custodian and accounting agent. SSB performs custodial, accounting and recordkeeping functions relating to portfolio transactions and calculating the Fund’s NAV.
| 12. | SECURITIES LENDING AGREEMENT |
The Fund has established a securities lending agreement with Citibank, N.A. for the lending of securities to qualified brokers in exchange for securities or cash collateral equal to at least the market value of securities loaned, plus interest, if applicable. Cash collateral is invested in an approved money market fund. In accordance with the Fund’s securities lending agreement, the market value of securities on loan is determined each day at the close of business and any additional collateral required to cover the value of securities on loan is delivered to the Fund on the next business day. As with other extensions of credit, the Fund may experience a delay in the
22
Notes to Financial Statements (continued)
recovery of its securities or incur a loss should the borrower of the securities breach its agreement with the Fund or the borrower becomes insolvent at a time when the collateral is insufficient to cover the cost of repurchasing securities on loan. Any income earned from securities lending is included in Securities lending net income on the Fund’s Statement of Operations.
The initial collateral received by the Fund is required to have a value equal to at least 100% of the market value of the securities loaned. The collateral must be marked-to-market daily to cover increases in the market value of the securities loaned (or potentially a decline in the value of the collateral). In general, the risk of borrower default will be borne by Citibank, N.A.; the Fund will bear the risk of loss with respect to the investment of the cash collateral. The advantage of such loans is that the Fund continues to receive income on loaned securities while receiving a portion of any securities lending fees and earning returns on the cash amounts which may be reinvested for the purchase of investments in securities.
As of December 31, 2022, the Fund did not loan any securities.
The Fund is subject to the general risks and considerations associated with equity investing, as well as the particular risks associated with value and mid-sized company stocks. The value of an investment will fluctuate in response to movements in the equity securities market in general and to the changing prospects of individual companies in which the Fund invests. The market may, over an extended period of time, fail to recognize the intrinsic value of particular value stocks the Fund may hold. Value investing also is subject to the risk that the company judged to be undervalued may actually be appropriately priced or even overpriced. The mid-sized company stocks in which the Fund invests may be less able to weather economic shifts or other adverse developments than those of larger, more established companies. Although investing in mid-sized companies offers the potential for above average returns, these companies may not succeed and the value of their stock could decline significantly. Mid-sized companies also may fall out of favor relative to larger companies in certain market cycles, causing the Fund to incur losses or under perform. In addition, if the Fund’s assessment of a company’s value or prospects for exceeding earnings expectations or market conditions is wrong, the Fund could suffer losses or produce poor performance relative to other funds, even in a rising market.
Due to the Fund’s investment exposure to foreign companies and American Depositary Receipts, the Fund may experience increased market, industry and sector liquidity, currency, political, information, and other risks. The securities of foreign companies also may be subject to inadequate exchange control regulations, the imposition of economic sanctions or other government restrictions, higher transaction and other costs, and delays in settlement to the extent they are traded on non-U.S. exchanges or markets.
Geopolitical and other events (e.g., wars, terrorism, natural disasters, epidemics or pandemics such as the COVID-19 outbreak which began in late 2019) may disrupt securities markets and adversely affect global economies and markets, thereby decreasing the value of the Fund’s investments. Market disruptions can also prevent the Fund from implementing its investment strategies and achieving its investment objective.
The transmission of COVID-19 and efforts to contain its spread have resulted in, among other things, border closings and other significant travel restrictions and disruptions, significant disruptions to business operations, supply chains and customer activity, lower consumer demand
23
Notes to Financial Statements (concluded)
for goods and services, event cancellations and restrictions, service cancellations, reductions and other changes, significant challenges in healthcare service preparation and delivery, and prolonged quarantines, as well as general concern and uncertainty. The impact of the COVID-19 outbreak has, and could again, negatively affect the global economy, the economies of individual countries, and the financial performance of individual issuers, sectors, industries, asset classes, and markets in significant and unforeseen ways.
The COVID-19 pandemic and its effects may last for an extended period of time. Although the economic fallout of COVID-19 is difficult to predict, it has contributed to and is likely to continue to contribute to, market volatility, inflation and systemic economic weakness. The foregoing could disrupt the operations of the Fund and its service providers, adversely affect the value and liquidity of the Fund’s investments, and negatively impact the Fund’s performance and your investment in the Fund.
These factors, and others, can affect the Fund’s performance.
| 14. | SUMMARY OF CAPITAL TRANSACTIONS |
Transactions in shares of capital stock were as follows:
| | | Year Ended | | | Year Ended | |
| | | December 31, 2022 | | | December 31, 2021 | |
| Shares sold | | | 330,942 | | | | 346,015 | |
| Reinvestment of distributions | | | 738,969 | | | | 1,014,575 | |
| Shares reacquired | | | (1,475,079 | ) | | | (1,420,241 | ) |
| Decrease | | | (405,168 | ) | | | (59,651 | ) |
24
Report of Independent Registered Public Accounting Firm
To the shareholders and the Board of Directors of Lord Abbett Series Fund, Inc.
Opinion on the Financial Statements and Financial Highlights
We have audited the accompanying statement of assets and liabilities, including the schedule of investments, of Mid Cap Stock Portfolio, one of the funds constituting Lord Abbett Series Fund, Inc. (the “Fund”), as of December 31, 2022, the related statement of operations for the year then ended, the statements of changes in net assets for each of the two years in the period then ended, the financial highlights for each of the five years in the period then ended, and the related notes. In our opinion, the financial statements and financial highlights present fairly, in all material respects, the financial position of Mid Cap Stock Portfolio of the Fund as of December 31, 2022, and the results of its operations for the year then ended, the changes in its net assets for each of the two years in the period then ended, and the financial highlights for each of the five years in the period then ended in conformity with accounting principles generally accepted in the United States of America.
Basis for Opinion
These financial statements and financial highlights are the responsibility of the Fund’s management. Our responsibility is to express an opinion on the Fund’s financial statements and financial highlights based on our audits. We are a public accounting firm registered with the Public Company Accounting Oversight Board (United States) (PCAOB) and are required to be independent with respect to the Fund in accordance with the U.S. federal securities laws and the applicable rules and regulations of the Securities and Exchange Commission and the PCAOB.
We conducted our audits in accordance with the standards of the PCAOB. Those standards require that we plan and perform the audit to obtain reasonable assurance about whether the financial statements and financial highlights are free of material misstatement, whether due to error or fraud. The Fund is not required to have, nor were we engaged to perform, an audit of its internal control over financial reporting. As part of our audits we are required to obtain an understanding of internal control over financial reporting but not for the purpose of expressing an opinion on the effectiveness of the Fund’s internal control over financial reporting. Accordingly, we express no such opinion.
Our audits included performing procedures to assess the risks of material misstatement of the financial statements and financial highlights, whether due to error or fraud, and performing procedures that respond to those risks. Such procedures included examining, on a test basis, evidence regarding the amounts and disclosures in the financial statements and financial highlights. Our audits also included evaluating the accounting principles used and significant estimates made by management, as well as evaluating the overall presentation of the financial statements and financial highlights. Our procedures included confirmation of securities owned as of December 31, 2022, by correspondence with the custodian and brokers; when replies were not received from brokers, we performed other auditing procedures. We believe that our audits provide a reasonable basis for our opinion.
DELOITTE & TOUCHE LLP
New York, New York
February 14, 2023
We have served as the auditor of one or more Lord Abbett Family of Funds’ investment companies since 1932.
25
Basic Information About Management
The Board is responsible for the management of the business and affairs of the Fund in accordance with the laws of the state of organization. The Board elects officers who are responsible for the day-to-day operations of the Fund and who execute policies authorized by the Board. The Board also approves an investment adviser to the Fund and continues to monitor the cost and quality of the services the investment adviser provides, and annually considers whether to renew the contract with the investment adviser. Generally, each Board member holds office until his/her successor is elected and qualified or until his/her earlier resignation or removal, as provided in the Fund’s organizational documents.
Lord, Abbett & Co. LLC (“Lord Abbett”), a Delaware limited liability company, is the Fund’s investment adviser. Designated Lord Abbett personnel are responsible for the day-to-day management of the Fund.
Independent Board Members
The following Independent Board Members also are board members of each of the 15 investment companies in the Lord Abbett Family of Funds, which consist of 63 investment portfolios.
Name, Address and
Year of Birth | | Current Position and
Length of Service
with the Fund | | Principal Occupation and Other Directorships
During the Past Five Years |
Evelyn E. Guernsey
Lord, Abbett & Co. LLC
c/o Legal Dept.
90 Hudson Street
Jersey City, NJ 07302
(1955) | | Board member since 2011;
Vice Chair since 2023 | | Principal Occupation: None. Other Directorships: None. |
| | | | | |
Julie A. Hill
Lord, Abbett & Co. LLC
c/o Legal Dept.
90 Hudson Street
Jersey City, NJ 07302
(1946) | | Board member since 2004 | | Principal Occupation: Owner and CEO of The Hill Company, a business consulting firm (since 1998). Other Directorships: Previously served as director of Anthem, Inc., a health benefits company (1994–2021). |
| | | | | |
Kathleen M. Lutito
Lord, Abbett & Co. LLC
c/o Legal Dept.
90 Hudson Street
Jersey City, NJ 07302
(1963) | | Board member since 2017 | | Principal Occupation: President and Chief Investment Officer of CenturyLink Investment Management Company (since 2006). Other Directorships: None. |
| | | | | |
James M. McTaggart
Lord, Abbett & Co. LLC
c/o Legal Dept.
90 Hudson Street
Jersey City, NJ 07302
(1947) | | Board member since 2012 | | Principal Occupation: Owner of McTaggart LLC (since 2011). Other Directorships: None. |
| | | | | |
Charles O. Prince
Lord, Abbett & Co. LLC
c/o Legal Dept.
90 Hudson Street
Jersey City, NJ 07302
(1950) | | Board member since 2019 | | Principal Occupation: None. Formerly Chair and Chief Executive Officer, Citigroup, Inc. (Retired 2007). Other Directorships: Previously served as director of Johnson & Johnson (2005–2022). Previously served as director of Xerox Corporation (2007–2018). |
26
Basic Information About Management (continued)
Name, Address and
Year of Birth | | Current Position and
Length of Service
with the Fund | | Principal Occupation and Other Directorships
During the Past Five Years |
Karla M. Rabusch
Lord, Abbett & Co. LLC
c/o Legal Dept.
90 Hudson Street
Jersey City, NJ 07302
(1959) | | Board member since 2017 | | Principal Occupation: President and Director of Wells Fargo Funds Management, LLC (2003–2017); President of Wells Fargo Funds (2003–2016). Other Directorships: None. |
| | | | | |
Lorin Patrick Taylor Radtke
Lord, Abbett & Co. LLC
c/o Legal Dept.
90 Hudson Street
Jersey City, NJ 07302
(1968) | | Board member since 2021 | | Principal Occupation: Partner and Co-Founder of M Seven 8 Partners LLC, a venture capital firm (since 2016). Formerly partner, Goldman Sachs (1992–2016). Other Directorships: Currently serves as director of Assured Guaranty (2021–Present), Virtual Combine (2018–Present), and Mariposa Family Learning Center (2021–Present). Previously served as director of SummerMoon Coffee (2022). |
| | | | | |
Leah Song Richardson
Lord, Abbett & Co. LLC
c/o Legal Dept.
90 Hudson Street
Jersey City, NJ 07302
(1966) | | Board member since 2021 | | Principal Occupation: President of Colorado College (since 2021) and was formerly Dean at University of California, Irvine–School of Law (2017–2021) and formerly Professor of Law at University of California, Irvine (2014–2017). Other Directorships: None. |
| | | | | |
Mark A. Schmid
Lord, Abbett & Co. LLC
c/o Legal Dept.
90 Hudson Street
Jersey City, NJ 07302
(1959) | | Board member since 2016 | | Principal Occupation: Vice President and Chief Investment Officer of the University of Chicago (2009–2021). Other Directorships: None. |
| | | | | |
James L.L. Tullis
Lord, Abbett & Co. LLC
c/o Legal Dept.
90 Hudson Street
Jersey City, NJ 07302
(1947) | | Board member since 2006;
Chair since 2017 | | Principal Occupation: Chair of Tullis Health Investors – FL LLC (since 2018); CEO of Tullis-Dickerson and Co. Inc., a venture capital management firm (1990–2016). Other Directorships: Currently serves as Chair of Crane Co. (since 2020, director since 1998), Director of Alphatec Spine (since 2018), and Director of Exagen Inc. (since 2019). Previously served as director of electroCore, Inc. (2018–2020). |
Interested Board Members
Mr. Sieg is affiliated with Lord Abbett and is an “interested person” of the Fund as defined in the Act. Mr. Sieg is a board member of each of the 15 investment companies in the Lord Abbett Family of Funds, which consist of 63 investment portfolios. Mr. Sieg is an officer of the Lord Abbett Family of Funds.
27
Basic Information About Management (continued)
Name, Address and
Year of Birth | | Current Position and
Length of Service
with the Fund | | Principal Occupation and Other Directorships
During the Past Five Years |
Douglas B. Sieg
Lord, Abbett & Co. LLC
90 Hudson Street
Jersey City, NJ 07302
(1969) | | Board member since 2016 | | Principal Occupation: Managing Partner of Lord
Abbett (since 2018) and was formerly Head of Client
Services, joined Lord Abbett in 1994. Other Directorships: None. |
Officers
None of the officers listed below have received compensation from the Fund. All of the officers of the Fund also may be officers of the other Lord Abbett Funds and maintain offices at 90 Hudson Street, Jersey City, NJ 07302. Unless otherwise indicated, the position(s) and title(s) listed under the “Principal Occupation During the Past Five Years” column indicate each officer’s position(s) and title(s) with Lord Abbett. Each officer serves for an indefinite term (i.e., until his or her death, resignation, retirement, or removal).
Name and
Year of Birth | | Current Position
with the Fund | | Length of Service
of Current
Position | | Principal Occupation
During the Past Five Years |
Douglas B. Sieg
(1969) | | President and Chief Executive Officer | | Elected as President and Chief Executive Officer in 2018 | | Managing Partner of Lord Abbett (since 2018) and was formerly Head of Client Services, joined Lord Abbett in 1994. |
| | | | | | | |
Jackson C. Chan
(1964) | | AML Compliance Officer | | Elected in 2018 | | Deputy Chief Compliance Officer and Director of Regulatory Affairs, joined Lord Abbett in 2014. |
| | | | | | | |
Michael J. Hebert
(1976) | | Chief Financial Officer and Treasurer | | Elected as Chief Financial Officer and Treasurer in 2021 | | Head of Global Fund Finance, joined Lord Abbett in 2021 and was formerly Vice President at Eaton Vance Management (EVM) (2014–2021) and Calvert Research & Management (CRM) (2016–2021), and Assistant Treasurer of registered investment companies managed, advised or administered by EVM and CRM during such years. |
| | | | | | | |
Jennifer C. Karam
(1970) | | Vice President and Assistant Secretary | | Elected in 2022 | | Partner and Senior Deputy General Counsel, joined Lord Abbett in 2012. |
| | | | | | | |
Joseph M. McGill
(1962) | | Chief Compliance Officer | | Elected in 2014 | | Partner and Chief Compliance Officer, joined Lord Abbett in 2014. |
| | | | | | | |
Parker J. Milender
(1989) | | Vice President and Assistant Secretary | | Elected in 2023 | | Counsel, joined Lord Abbett in 2021 and was formerly an Associate at Milbank LLP (2017–2021). |
28
Basic Information About Management (concluded)
Name and
Year of Birth | | Current Position
with the Fund | | Length of Service
of Current
Position | | Principal Occupation
During the Past Five Years |
Matthew A. Press
(1987) | | Vice President and Assistant Secretary | | Elected in 2023 | | Counsel, joined Lord Abbett in 2022 and was formerly an Associate at Clifford Chance US LLP (2014–2022). |
| | | | | | | |
Lawrence B. Stoller
(1963) | | Vice President, Secretary and Chief Legal Officer | | Elected as Vice President and Secretary in 2007 and Chief Legal Officer in 2019 | | Partner and General Counsel, joined Lord Abbett in 2007. |
| | | | | | | |
Victoria Zozulya
(1983) | | Vice President and Assistant Secretary | | Elected in 2022 | | Counsel, joined Lord Abbett in 2022 and was formerly Senior Director and Counsel at Equitable (2018-2022) and Assistant General Counsel at Neuberger Berman (2014–2018). |
| | | | | | | |
Nicholas D. Emguschowa
(1986) | | Data Protection Officer | | Elected in 2022 | | Assistant General Counsel, joined Lord Abbett in 2018 and was formerly Associate at Shearman & Sterling (2014–2018). |
Please call 888-522-2388 for a copy of the statement of additional information, which contains further information about the Fund’s Board members. It is available free upon request.
29
Householding
The Company has adopted a policy that allows it to send only one copy of the Fund’s prospectus, proxy material, annual report and semiannual report (or related notice of internet availability of annual report and semiannual report) to certain shareholders residing at the same “household.” This reduces Fund expenses, which benefits you and other shareholders. If you need additional copies or do not want your mailings to be “householded,” please call Lord Abbett at 888-522-2388 or send a written request with your name, the name of your fund or funds and your account number or numbers to Lord Abbett Family of Funds, P.O. Box 219336, Kansas City, MO 64121.
Proxy Voting Policies, Procedures and Records
A description of the policies and procedures that Lord Abbett uses to vote proxies related to the Fund’s portfolio securities, and information on how Lord Abbett voted the Fund’s proxies during the 12-month period ended June 30 are available without charge, upon request, (i) by calling 888-522-2388; (ii) on Lord Abbett’s website at www.lordabbett.com; and (iii) on the Securities and Exchange Commission’s (“SEC”) website at www.sec.gov.
Shareholder Reports and Quarterly Portfolio Disclosure
The Fund is required to file its complete schedule of portfolio holdings with the SEC for its first and third fiscal quarters as an attachment to Form N-PORT. Copies of the filings are available without charge, upon request on the SEC’s website at www.sec.gov and may be available by calling Lord Abbett at 888-522-2388.
Tax Information (unaudited) For corporate shareholders, 95% of the Fund’s ordinary income distributions qualified for the dividends received deduction. Additionally, of the distributions paid to the shareholders during the fiscal year ended December 31, 2022, $234,286 and $14,889,901, respectively, represent short-term capital gains and long-term capital gains. |
30
 | | | | |
 |
 | | | | |
 |
This report, when not used for the general information of shareholders of the Fund, is to be distributed only if preceded or accompanied by a current fund prospectus. Lord Abbett mutual fund shares are distributed by
LORD ABBETT DISTRIBUTOR LLC. | | Lord Abbett Series Fund, Inc.
Mid Cap Stock Portfolio | | LASFMCV-2
(02/23) |

LORD ABBETT
ANNUAL REPORT
Lord Abbett
Series Fund—Short Duration Income Portfolio
For the fiscal year ended December 31, 2022
Table of Contents
Lord Abbett Series Fund – Short Duration Income
Portfolio Annual Report
For the fiscal year ended December 31, 2022
 From left to right: James L.L. Tullis, Independent Chair of the Lord Abbett Funds and Douglas B. Sieg, Director, President and Chief Executive Officer of the Lord Abbett Funds. | | Dear Shareholders: We are pleased to provide you with this overview of the performance of Lord Abbett Series Fund – Short Duration Income Portfolio for the fiscal year ended December 31, 2022. On this page and the following pages, we discuss the major factors that influenced fiscal year performance. For detailed and timely information about the Fund, please visit our website at www.lordabbett.com, where you can also access the quarterly commentaries that provide updates on the Fund’s performance and other portfolio related updates. Thank you for investing in Lord Abbett mutual funds. We value the trust that you place in us and look forward to serving your investment needs in the years to come. Best regards, 
Douglas B. Sieg
Director, President and Chief Executive Officer |
For the fiscal year ended December 31, 2022, the Fund returned -5.06%, reflecting performance at the net asset value (NAV) of Class VC shares with all distributions reinvested, compared to its benchmark, the ICE BofA 1-3 Year U.S. Corporate Index,* which returned -4.00%.
The twelve-month period ending December 31, 2022, introduced meaningful headwinds for U.S. markets that led to selloffs in virtually all asset classes. The major risks over the period were inflationary pressures, which reached multi-decade highs, and the most rapid pace of interest rate hikes implemented in history by the U.S.
Federal Reserve (Fed). Rates spiked across the U.S. yield curve as a result, with U.S. Treasury yields at almost all maturities reaching their highest levels in years. Other notable challenges for markets included supply chain dislocations and labor shortages influenced in part by the Omicron variant of COVID-19, as well as escalating geopolitical tensions headlined by Russia’s invasion of Ukraine.
The surge in rates over the year caused softness in both major fixed income and equity indices. Equities fared the worst amid the sell-off, with the S&P 500 Index1 returning -18.11% and experiencing its
1
worst year since the Global Financial Crisis (GFC). The tech-heavy NASDAQ2 also logged its worst year since 2008, declining -32.54% as growth-related stocks in semiconductor and software sectors suffered in the face of inflationary pressures. Within fixed income, higher rates caused underperformance in longer duration bonds. These included U.S. Treasuries3 and investment grade bonds4 which returned -12.46% and -15.76% over the period, respectively. However, high yield bond5 and leveraged loan6 indexes outperformed the investment grade index for the period because of their lower duration profiles. Notably, high yield bonds and leveraged loans returned -11.21% and -1.06%, respectively, outperforming higher quality bonds despite recessionary fears in the U.S. economy contributing to wider spreads. Leveraged loans in particular were able to significantly outperform relative to other assets given their insulation from rate volatility due to their floating-rate coupons.
Inflationary concerns began to take focus towards the end of 2021 before becoming a dominant storyline in 2022. Headline consumer price index (CPI) readings had hovered a little above 5% year-over-year for most of 2021, which led investors to question whether this period of rising prices would be more persistent than originally thought. This debate intensified in the beginning of the year as inflation readings continued as climb throughout the first half of 2022, with CPI peaking at 9.1% year-over-year in June. The surge in prices was due primarily to an imbalance between supply and demand
dynamics across multiple industries, including energy, food, and used cars.
Inflationary pressures throughout the period were most evident in energy costs, which rose more than 30% year-over-year by the end of June. The energy sector, which had been subject to rising consumer demand as global economies reopened from lockdowns induced by COVID-19, faced added friction with Russia’s invasion of Ukraine as Russia had been a large exporter of oil and certain minerals. Various sanctions were instilled on Russia from Western nations in response to their aggression towards Ukraine, which contributed to surging prices. Crude oil specifically reached over $100 per barrel, the highest value since 2014.
The Fed pivoted towards a much more hawkish stance on monetary policy during the period given the surge in inflation. After remaining mostly consistent in its messaging around expectations that price pressures would be transitory, elevated and more persistent inflation pressures caused the Fed to move the target federal funds rate into more restrictive territory. This resulted in a 25-basis point (bps) hike in the federal funds rate at the March Federal Open Market Committee (FOMC) meeting, the first hike in more than three years. Five additional rate hikes followed in the succeeding months, one of 50 bps, and four consecutive hikes of 75 bps and an additional one of 50 bps as inflation prints continued to come mostly in hotter than expected, resulting in a federal funds rate at a range of 4.25%-4.50% by the end of 2022. Bond yields shot up amid this aggressive policy, leading to a bearish
2
curve flattening and ultimately periods of significant yield curve inversion, with the spread between the 2-year and 10-year Treasury yields hitting its most negative level in more than 40 years.
Key macroeconomic indicators trended lower throughout the period. Most notably, the U.S. reported real GDP decline of -1.6% in the first quarter of 2022 and -0.9% in the second quarter before returning to growth in the third quarter. Worries of an impending recession resulted in consumer sentiment dropping to levels worse than during the height of the COVID-19 pandemic and the GFC of 2008.
Despite rising recessionary signs, select bright spots in the U.S. economy supported the idea that a potential recession would be shallow. One of the most positive developments seemed to be the traction behind the peak inflation narrative, which gained momentum in the fourth quarter from lower-than-expected CPI prints in both October and November. In addition, energy prices retracted from their multi-year highs, rent prices began to stabilize, and wage growth showed signs of softening. Job growth also remained strong in the period, and the U.S. national unemployment rate continued to hover around pre-COVID lows. Companies also cited relatively stable demand in both second and third quarter earnings seasons as consumers remained resilient despite higher prices. Separately, labor shortages eased, and supply chain frictions moderated, providing added benefits for companies managing generally higher input costs.
Consistent with the Fund’s strategy, the Fund continues to maintain exposure to a variety of bond market sectors in addition to the investment grade corporate bonds represented in the Fund’s benchmark. This provides portfolio diversification and allows for the flexibility to pursue relative value opportunities across sectors.
The largest detractor from the Fund’s absolute return during the period was a sharply rising 2-year Treasury yield, which proved to be a significant headwind to performance as the Fund is invested mainly at the 2-year part of the yield curve.
The commercial mortgage-backed securities (CMBS) allocation also detracted from the Fund’s relative performance given concerns of the impact of rising interest rates on capitalization rates and commercial real estate valuations and the potential for rising delinquency rates in an economic downturn.
The Fund’s allocation to investment grade corporate bonds was the primary contributor to relative performance over the period. Investment grade corporate credit held up relatively well over the period. Specifically, allocations to the energy and financial sectors drove positive performance. The Financials sector continues to be a notable overweight in the portfolio, as we favor the sector given what we believe to be strong management teams and healthy balance sheets. We also believe that the energy sector has focused heavily on capital discipline, thus, we have found idiosyncratic issues with relatively strong performance.
3
The Fund’s allocation to short-term, high yield corporate bonds also contributed to the Fund’s relative performance over the period. High yield as an asset class experienced modest spread widening over the period, however the strong risk-adjusted carry more than offset the effects of wider spreads.
The Fund’s portfolio is actively managed and, therefore, its holdings and the weightings of a particular issuer or particular sector as a percentage of portfolio assets are subject to change. Sectors may include many industries.
* The ICE BofA U.S. 1-3 Year U.S. Corporate Index is an unmanaged index comprised of U.S. dollar-denominated investment grade corporate debt securities publicly issued in the U.S. domestic market with between one and three years remaining to final maturity.
1 The S&P 500® Index is widely regarded as the standard for measuring large cap U.S. stock market performance and includes a representative sample of leading companies in leading industries.
2 The Nasdaq Composite Index is the market capitalization-weighted index of over 2,500 common equities listed on the Nasdaq stock exchange.
3 As represented by the U.S. Treasury component of the Bloomberg U.S. Government Index as of 12/31/2022.
4 As represented by the Bloomberg US Corp Investment Grade Index as of 12/31/2022.
5 As represented by the ICE BofA U.S. High Yield Constrained Index as of 12/31/2022.
6 As represented by the Credit Suisse Leveraged Loan Index as of 12/31/2022.
Unless otherwise specified, indexes reflect total return, with all dividends reinvested. Indexes are unmanaged, do not reflect the deduction of fees or expenses, and are not available for direct investment.
Important Performance and Other Information
Performance data quoted in the following pages reflect past performance and are no guarantee of future results. Current performance may be higher or lower than the performance quoted. The investment return and principal value of an investment in the Fund will fluctuate so that shares, on any given day or when redeemed, may
be worth more or less than their original cost. You can obtain performance data current to the most recent month end by calling Lord Abbett at 888-522-2388 or referring to www.lordabbett.com.
During certain periods shown, expense waivers and reimbursements were in place. Without such expense waivers and reimbursements, the Fund’s returns would have been lower.
The annual commentary above discusses the views of the Fund’s management and various portfolio holdings of the Fund as of December 31, 2022. These views and portfolio holdings may have changed after this date. Information provided in the commentary is not a recommendation to buy or sell securities. Because the Fund’s portfolio is actively managed and may change significantly, the Fund may no longer own the securities described above or may have otherwise changed its position in the securities. For more recent information about the Fund’s portfolio holdings, please visit www.lordabbett.com.
A Note about Risk: See Notes to Financial Statements for a discussion of investment risks. For a more detailed discussion of the risks associated with the Fund, please see the Fund’s prospectus.
Mutual funds are not insured by the FDIC, are not deposits or other obligations of, or guaranteed by, banks, and are subject to investment risks including possible loss of principal amount invested.
The Fund serves as an underlying investment vehicle for variable annuity contracts and variable life insurance policies.
4
Investment Comparison
Below is a comparison of a $10,000 investment in Class VC shares with the same investment in the ICE BofA 1-3 Year U.S. Corporate Index, assuming reinvestment of all dividends and distributions. The Fund’s shares are sold only to insurance company separate accounts that fund certain variable annuity and variable life contracts. This line graph comparison does not reflect the sales charges or other expenses of these contracts. If those sales charges and expenses were reflected, returns would be lower. The graph and performance table below do not reflect the deduction of taxes that a shareholder would pay on Fund distributions or the redemption of Fund shares. During the period, expenses of the Fund were waived or reimbursed by Lord Abbett; without such waiver or reimbursement of expenses, the Fund’s returns would have been lower. Past performance is no guarantee of future results.
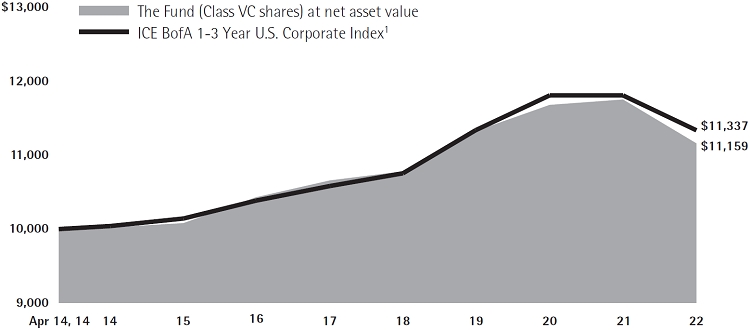
Average Annual Total Returns for the
Periods Ended December 31, 2022 |
| | | 1 Year | | 5 Years | | Life of Class | |
| Class VC2 | | -5.06% | | 0.92% | | 1.27% | |
1 Performance for the unmanaged index does not reflect any fees or expenses. The performance of the index is not necessarily representative of the Fund’s performance. Performance for the index began on April 14, 2014.
2 The Class VC shares commenced operations on April 4, 2014. Performance for the Class began on April 14, 2014.
5
Expense Example
As a shareholder of the Fund, you incur ongoing costs, including management fees; expenses related to the Fund’s services arrangements with certain insurance companies; and other Fund expenses. This Example is intended to help you understand your ongoing costs (in dollars) of investing in the Fund and to compare these costs with the ongoing costs of investing in other mutual funds.
The Example is based on an investment of $1,000 invested at the beginning of the period and held for the entire period (July 1, 2022 through December 31, 2022).
The Example reflects only expenses that are deducted from the assets of the Fund. Fees and expenses, including sales charges applicable to the various insurance products that invest in the Fund, are not reflected in this Example. If such fees and expenses were reflected in the Example, the total expenses shown would be higher. Fees and expenses regarding such variable insurance products are separately described in the prospectus related to those products.
Actual Expenses
The first line of the table on the following page provides information about actual account values and actual expenses. You may use the information in this line, together with the amount you invested, to estimate the expenses that you paid over the period. Simply divide your account value by $1,000 (for example, an $8,600 account value divided by $1,000 = 8.6), then multiply the result by the number in the first line under the heading titled “Expenses Paid During Period 7/1/22 – 12/31/22” to estimate the expenses you paid on your account during this period.
Hypothetical Example for Comparison Purposes
The second line of the table on the following page provides information about hypothetical account values and hypothetical expenses based on the Fund’s actual expense ratio and an assumed rate of return of 5% per year before expenses, which is not the Fund’s actual return. The hypothetical account values and expenses may not be used to estimate the actual ending account balance or expenses you paid for the period. You may use this information to compare the ongoing costs of investing in the Fund and other funds. To do so, compare this 5% hypothetical example with the 5% hypothetical examples that appear in the shareholder reports of the other funds.
6
Please note that the expenses shown in the table are meant to highlight your ongoing costs only and do not reflect any transactional costs, such as sales charges. Therefore, the second line of the table is useful in comparing ongoing costs only, and will not help you determine the relative total costs of owning different funds. In addition, if these transactional costs were included, your costs would have been higher.
| | | Beginning
Account
Value | | Ending
Account
Value | | Expenses
Paid During
Period† | |
| | | 7/1/22 | | 12/31/22 | | 7/1/22 –
12/31/22 | |
| Class VC | | | | | | | | | | | | | |
| Actual | | $ | 1,000.00 | | | $ | 996.10 | | | $ | 4.23 | | |
| Hypothetical (5% Return Before Expenses) | | $ | 1,000.00 | | | $ | 1,020.97 | | | $ | 4.28 | | |
| † | Net expenses are equal to the Fund’s annualized expense ratio of 0.84%, multiplied by the average account value over the period, multiplied by 184/365 (to reflect one-half year period). |
Portfolio Holdings Presented by Sector
December 31, 2022
| Sector* | | %** | |
| Asset Backed Securities | | 25.70 | % |
| Basic Materials | | 1.82 | % |
| Communications | | 2.61 | % |
| Consumer, Cyclical | | 3.28 | % |
| Consumer, Non-cyclical | | 5.14 | % |
| Energy | | 5.08 | % |
| Financials | | 26.45 | % |
| Health Care | | 0.87 | % |
| Industrials | | 1.15 | % |
| Materials and Processing | | 0.15 | % |
| Mortgage Securities | | 13.11 | % |
| Technology | | 1.70 | % |
| U.S. Government | | 6.31 | % |
| Utilities | | 4.82 | % |
| Repurchase Agreements | | 1.81 | % |
| Total | | 100.00 | % |
| * | A sector may comprise several industries. |
| ** | Represents percent of total investments, which excludes derivatives. |
7
Schedule of Investments
December 31, 2022
| Investments | | Interest
Rate | | Maturity
Date | | Principal
Amount | | | Fair
Value | |
| LONG-TERM INVESTMENTS 91.89% | | | | | | | | | | | | |
| | | | | | | | | | | | | |
| ASSET-BACKED SECURITIES 25.50% | | | | | | | | | | | | |
| | | | | | | | | | | | | |
| Automobiles 8.68% | | | | | | | | | | | | |
| Ally Auto Receivables Trust 2019-3 A3 | | 1.93% | | 5/15/2024 | | $ | 4,054 | | | $ | 4,049 | |
| AmeriCredit Automobile Receivables Trust 2020-1 B | | 1.48% | | 1/21/2025 | | | 40,711 | | | | 40,433 | |
| Avis Budget Rental Car Funding AESOP LLC 2020-2A A† | | 2.02% | | 2/20/2027 | | | 260,000 | | | | 235,995 | |
| Capital One Prime Auto Receivables Trust 2021-1 A2 | | 0.32% | | 2/18/2025 | | | 55,221 | | | | 54,566 | |
| Capital One Prime Auto Receivables Trust 2022-1 A3 | | 3.17% | | 4/15/2027 | | | 240,000 | | | | 232,403 | |
| Capital One Prime Auto Receivables Trust 2022-2 A2A | | 3.74% | | 9/15/2025 | | | 270,000 | | | | 267,480 | |
| Capital One Prime Auto Receivables Trust 2022-2 A3 | | 3.66% | | 5/17/2027 | | | 275,000 | | | | 268,817 | |
| CarMax Auto Owner Trust 2020-2 A3 | | 1.70% | | 11/15/2024 | | | 5,624 | | | | 5,586 | |
| CarMax Auto Owner Trust 2020-2 D | | 5.75% | | 5/17/2027 | | | 275,000 | | | | 269,908 | |
| Carvana Auto Receivables Trust 2021-N1 A | | 0.70% | | 1/10/2028 | | | 27,388 | | | | 25,525 | |
| Carvana Auto Receivables Trust 2022-P1 A3 | | 3.35% | | 2/10/2027 | | | 360,000 | | | | 346,265 | |
| Carvana Auto Receivables Trust 2022-P2 A4 | | 4.68% | | 2/10/2028 | | | 250,000 | | | | 241,860 | |
| CPS Auto Receivables Trust 2019-C D† | | 3.17% | | 6/16/2025 | | | 71,964 | | | | 71,746 | |
| Credit Acceptance Auto Loan Trust 2021-3A A† | | 1.00% | | 5/15/2030 | | | 250,000 | | | | 238,874 | |
| Drive Auto Receivables Trust 2019-2 D | | 3.69% | | 8/17/2026 | | | 30,844 | | | | 30,616 | |
| Drive Auto Receivables Trust 2019-4 D | | 2.70% | | 2/16/2027 | | | 71,180 | | | | 70,112 | |
| Drive Auto Receivables Trust 2021-1 C | | 1.02% | | 6/15/2027 | | | 100,000 | | | | 97,773 | |
| Drive Auto Receivables Trust 2021-1 D | | 1.45% | | 1/16/2029 | | | 100,000 | | | | 93,759 | |
| Drive Auto Receivables Trust 2021-2 D | | 1.39% | | 3/15/2029 | | | 171,000 | | | | 157,658 | |
| Enterprise Fleet Financing LLC 2020-2 A2† | | 0.61% | | 7/20/2026 | | | 69,256 | | | | 67,489 | |
| Exeter Automobile Receivables Trust 2021-1 C | | 0.98% | | 6/15/2026 | | | 55,000 | | | | 52,868 | |
| Exeter Automobile Receivables Trust 2021-1 D | | 1.40% | | 4/15/2027 | | | 50,000 | | | | 45,713 | |
| Exeter Automobile Receivables Trust 2021-3 B | | 0.69% | | 1/15/2026 | | | 512,606 | | | | 504,528 | |
| Fifth Third Auto Trust 2019-1 A4 | | 2.69% | | 11/16/2026 | | | 28,169 | | | | 28,147 | |
| First Investors Auto Owner Trust 2022-2A A | | 6.26% | | 7/15/2027 | | | 243,844 | | | | 242,731 | |
| Flagship Credit Auto Trust 2022-4 A2 | | 6.15% | | 9/15/2026 | | | 240,000 | | | | 241,441 | |
| Flagship Credit Auto Trust 2022-4 A3 | | 6.32% | | 6/15/2027 | | | 285,000 | | | | 287,161 | |
| Ford Credit Auto Owner Trust 2018-REV2 A† | | 3.47% | | 1/15/2030 | | | 200,000 | | | | 197,319 | |
| Ford Credit Auto Owner Trust 2020-C A3 | | 0.41% | | 7/15/2025 | | | 108,806 | | | | 106,192 | |
| Ford Credit Auto Owner Trust 2022-1 A† | | 3.88% | | 11/15/2034 | | | 240,000 | | | | 230,410 | |
| 8 | See Notes to Financial Statements. | |
Schedule of Investments (continued)
December 31, 2022
| Investments | | Interest
Rate | | Maturity
Date | | Principal
Amount | | | Fair
Value | |
| Automobiles (continued) | | | | | | | | | | | | |
| Ford Credit Auto Owner Trust REV1 2018-1 A† | | 3.19% | | 7/15/2031 | | $ | 495,000 | | | $ | 473,169 | |
| Ford Credit Auto Owner Trust REV1 2021-1 A† | | 1.37% | | 10/17/2033 | | | 150,000 | | | | 134,107 | |
| Ford Credit Auto Owner Trust REV2 2019-1 A† | | 3.52% | | 7/15/2030 | | | 200,000 | | | | 196,158 | |
| GLS Auto Receivables Issuer Trust 2021-3A A† | | 0.42% | | 1/15/2025 | | | 35,989 | | | | 35,804 | |
| GM Financial Automobile Leasing Trust 2020-3 A4 | | 0.51% | | 10/21/2024 | | | 165,367 | | | | 164,970 | |
| GM Financial Automobile Leasing Trust 2022-2 A3 | | 3.42% | | 6/20/2025 | | | 240,000 | | | | 234,868 | |
| GM Financial Automobile Leasing Trust 2022-3 A2A | | 4.01% | | 10/21/2024 | | | 290,000 | | | | 287,740 | |
| GM Financial Automobile Leasing Trust 2022-3 A3 | | 4.01% | | 9/22/2025 | | | 263,000 | | | | 258,570 | |
| GM Financial Consumer Automobile Receivables Trust 2021-1 A3 | | 0.35% | | 10/16/2025 | | | 87,436 | | | | 84,606 | |
| Hertz Vehicle Financing III LP 2021-2A A† | | 1.68% | | 12/27/2027 | | | 255,000 | | | | 222,395 | |
| Hertz Vehicle Financing LLC 2021-1A A† | | 1.21% | | 12/26/2025 | | | 175,000 | | | | 161,839 | |
| Mercedes-Benz Auto Receivables Trust 2022-1 A3 | | 5.21% | | 8/16/2027 | | | 115,000 | | | | 116,073 | |
| NextGear Floorplan Master Owner Trust 2020-1A A1† | | 5.118%
(1 Mo. LIBOR + .80% | )# | 2/15/2025 | | | 530,000 | | | | 529,678 | |
| Nissan Auto Lease Trust 2020-B A3 | | 0.43% | | 10/16/2023 | | | 1,514 | | | | 1,511 | |
| Nissan Auto Lease Trust 2022-A A3 | | 3.81% | | 5/15/2025 | | | 295,000 | | | | 290,604 | |
| OneMain Direct Auto Receivables Trust 2021-1A A† | | 0.87% | | 7/14/2028 | | | 225,000 | | | | 208,171 | |
| Santander Drive Auto Receivables Trust 2020-2 D | | 2.22% | | 9/15/2026 | | | 216,000 | | | | 210,424 | |
| Santander Drive Auto Receivables Trust 2021-1 C | | 0.75% | | 2/17/2026 | | | 90,977 | | | | 89,415 | |
| Santander Drive Auto Receivables Trust 2022-5 A2 | | 3.98% | | 1/15/2025 | | | 295,000 | | | | 293,542 | |
| Santander Drive Auto Receivables Trust 2022-6 A2 | | 4.37% | | 5/15/2025 | | | 295,000 | | | | 293,687 | |
| Santander Drive Auto Receivables Trust 2022-6 C | | 4.96% | | 11/15/2028 | | | 325,000 | | | | 314,599 | |
| Santander Retail Auto Lease Trust 2021-A A3† | | 0.51% | | 7/22/2024 | | | 305,000 | | | | 297,334 | |
| Santander Retail Auto Lease Trust 2021-C A2† | | 0.29% | | 4/22/2024 | | | 8,875 | | | | 8,863 | |
| Santander Retail Auto Lease Trust 2021-C A3† | | 0.50% | | 3/20/2025 | | | 140,000 | | | | 136,302 | |
| Toyota Auto Loan Extended Note Trust 2022-1A A† | | 3.82% | | 4/25/2035 | | | 250,000 | | | | 237,172 | |
| Westlake Automobile Receivables Trust 2019-2A D† | | 3.20% | | 11/15/2024 | | | 30,101 | | | | 30,039 | |
| Westlake Automobile Receivables Trust 2021-2A A2A† | | 0.32% | | 4/15/2025 | | | 75,999 | | | | 75,207 | |
| Westlake Automobile Receivables Trust 2021-2A C† | | 0.89% | | 7/15/2026 | | | 100,000 | | | | 93,980 | |
| World Omni Automobile Lease Securitization Trust 2020-B A3 | | 0.45% | | 2/15/2024 | | | 45,577 | | | | 45,317 | |
| World Omni Select Auto Trust 2019-A C | | 2.38% | | 12/15/2025 | | | 15,000 | | | | 14,829 | |
| World Omni Select Auto Trust 2019-A D | | 2.59% | | 12/15/2025 | | | 45,000 | | | | 44,394 | |
| Total | | | | | | | | | | | 10,342,791 | |
| | See Notes to Financial Statements. | 9 |
Schedule of Investments (continued)
December 31, 2022
| Investments | | Interest
Rate | | Maturity
Date | | Principal
Amount | | | Fair
Value | |
| Credit Card 2.14% | | | | | | | | | | | | |
| American Express Credit Account Master Trust 2022-2 A | | 3.39% | | 5/15/2027 | | $ | 425,000 | | | $ | 412,852 | |
| American Express Credit Account Master Trust 2022-3 A | | 3.75% | | 8/15/2027 | | | 455,000 | | | | 445,164 | |
| BA Credit Card Trust 2022-A2 A2 | | 5.00% | | 4/17/2028 | | | 110,000 | | | | 111,162 | |
| Capital One Multi-Asset Execution Trust 2022-A2 A | | 3.49% | | 5/15/2027 | | | 550,000 | | | | 535,269 | |
| Capital One Multi-Asset Execution Trust 2022-A3 Class A | | 4.95% | | 10/15/2027 | | | 220,000 | | | | 221,872 | |
| Chase Issuance Trust 2022-A1 A | | 3.97% | | 9/15/2027 | | | 235,000 | | | | 230,104 | |
| Discover Card Execution Note Trust 2022-A3 A3 | | 3.56% | | 7/15/2027 | | | 310,000 | | | | 301,199 | |
| Discover Card Execution Note Trust 2022-A4 Class A | | 5.03% | | 10/15/2027 | | | 295,000 | | | | 298,186 | |
| Total | | | | | | | | | | | 2,555,808 | |
| | | | | | | | | | | | | |
| Other 14.24% | | | | | | | | | | | | |
| ACAM Ltd. 2019-FL1 A† | | 5.84%
(1 Mo. Term SOFR + 1.51% | )# | 11/17/2034 | | | 82,112 | | | | 81,586 | |
| ACREC Ltd. 2021-FL1 A† | | 5.476%
(1 Mo. LIBOR + 1.15% | )# | 10/16/2036 | | | 300,000 | | | | 286,303 | |
| ACRES Commercial Realty Ltd. 2021-FL2 A† | | 5.726%
(1 Mo. LIBOR + 1.40% | )# | 1/15/2037 | | | 430,000 | | | | 414,264 | |
| Affirm Asset Securitization Trust 2021-B A† | | 1.03% | | 8/17/2026 | | | 175,000 | | | | 166,030 | |
| AMMC CLO Ltd. 2016-19A BR† | | 5.879%
(3 Mo. LIBOR + 1.80% | )# | 10/16/2028 | | | 250,000 | | | | 248,622 | |
| Amur Equipment Finance Receivables VII LLC 2019-1A A2† | | 2.63% | | 6/20/2024 | | | 821 | | | | 820 | |
| Apidos CLO XXII 2015-22A A1R† | | 5.303%
(3 Mo. LIBOR + 1.06% | )# | 4/20/2031 | | | 250,000 | | | | 245,004 | |
| Apidos CLO XXXI 2019-31A A1R† | | 5.179%
(3 Mo. LIBOR + 1.10% | )# | 4/15/2031 | | | 250,000 | | | | 245,682 | |
| Aqua Finance Trust 2021-A A† | | 1.54% | | 7/17/2046 | | | 147,430 | | | | 134,885 | |
| Arbor Realty Commercial Real Estate Notes Ltd. 2021-FL2 A† | | 5.418%
(1 Mo. LIBOR + 1.10% | )# | 5/15/2036 | | | 390,000 | | | | 378,402 | |
| Arbor Realty Commercial Real Estate Notes Ltd. 2021-FL3 A† | | 5.388%
(1 Mo. LIBOR + 1.07% | )# | 8/15/2034 | | | 150,000 | | | | 144,250 | |
| Arbor Realty Commercial Real Estate Notes Ltd. 2022-FL1 A† | | 5.257%
(1 Mo. SOFR + 1.45% | )# | 1/15/2037 | | | 230,000 | | | | 222,402 | |
| 10 | See Notes to Financial Statements. | |
Schedule of Investments (continued)
December 31, 2022
| Investments | | Interest
Rate | | Maturity
Date | | Principal
Amount | | | Fair
Value | |
| Other (continued) | | | | | | | | | | | | |
| ARES L CLO Ltd. 2018-50A AR† | | 5.129% (3 Mo. LIBOR + 1.05% | )# | 1/15/2032 | | $ | 250,000 | | | $ | 244,579 | |
| Bain Capital Credit CLO Ltd. 2017-1A A1R† | | 5.213%
(3 Mo. LIBOR + .97% | )# | 7/20/2030 | | | 246,001 | | | | 242,559 | |
| Bain Capital Credit CLO Ltd. 2020-5A A1† | | 5.463%
(3 Mo. LIBOR + 1.22% | )# | 1/20/2032 | | | 250,000 | | | | 245,647 | |
| Barings CLO Ltd. 2019-3A A1R† | | 5.313%
(3 Mo. LIBOR + 1.07% | )# | 4/20/2031 | | | 500,000 | | | | 490,987 | |
| BDS Ltd. 2021-FL10 A† | | 5.409%
(1 Mo. LIBOR + 1.07% | )# | 6/16/2036 | | | 200,000 | | | | 193,206 | |
| BDS Ltd. 2022-FL11 ATS† | | 6.121%
(1 Mo. Term SOFR + 1.80% | )# | 3/19/2039 | | | 330,000 | | | | 323,134 | |
| Benefit Street Partners CLO IV Ltd. 2014-IVA ARRR† | | 5.423%
(3 Mo. LIBOR + 1.18% | )# | 1/20/2032 | | | 250,000 | | | | 245,775 | |
| BlueMountain Fuji US CLO I Ltd. 2017-1A A1R† | | 5.223%
(3 Mo. LIBOR + .98% | )# | 7/20/2029 | | | 249,479 | | | | 244,906 | |
| BSPRT Issuer Ltd. 2021-FL7 A† | | 5.638%
(1 Mo. LIBOR + 1.32% | )# | 12/15/2038 | | | 240,000 | | | | 230,708 | |
| Carlyle Global Market Strategies CLO Ltd. 2015-1A AR3† | | 5.223%
(3 Mo. LIBOR + .98% | )# | 7/20/2031 | | | 247,444 | | | | 243,584 | |
| Carlyle US CLO Ltd. 2017-3A A1AR† | | 5.143%
(3 Mo. LIBOR + .90% | )# | 7/20/2029 | | | 247,837 | | | | 244,530 | |
| Carlyle US CLO Ltd. 2019-1A A1AR† | | 5.323%
(3 Mo. LIBOR + 1.08% | )# | 4/20/2031 | | | 250,000 | | | | 245,439 | |
| Cedar Funding X CLO Ltd. 2019-10A AR† | | 5.343%
(3 Mo. LIBOR + 1.10% | )# | 10/20/2032 | | | 250,000 | | | | 245,042 | |
| Cedar Funding XI Clo Ltd. 2019-11A A1R† | | 5.786%
(3 Mo. LIBOR + 1.05% | )# | 5/29/2032 | | | 220,000 | | | | 215,972 | |
| Cedar Funding XIV CLO Ltd. 2021-14A A† | | 5.179%
(3 Mo. LIBOR + 1.10% | )# | 7/15/2033 | | | 250,000 | | | | 245,626 | |
| CIFC Funding II Ltd. 2013-2A A1L2† | | 5.194%
(3 Mo. LIBOR + 1.00% | )# | 10/18/2030 | | | 250,000 | | | | 245,890 | |
| CoreVest American Finance Trust 2018-1 A† | | 3.804% | | 6/15/2051 | | | 241 | | | | 240 | |
| Dell Equipment Finance Trust 2021-2 A2† | | 0.33% | | 12/22/2026 | | | 54,973 | | | | 54,322 | |
| Dryden Senior Loan Fund 2017-47A A1R† | | 5.059%
(3 Mo. LIBOR + .98% | )# | 4/15/2028 | | | 236,427 | | | | 234,203 | |
| Galaxy XIX CLO Ltd. 2015-19A A1RR† | | 5.275%
(3 Mo. LIBOR + .95% | )# | 7/24/2030 | | | 149,505 | | | | 146,692 | |
| | See Notes to Financial Statements. | 11 |
Schedule of Investments (continued)
December 31, 2022
| Investments | | Interest
Rate | | Maturity
Date | | Principal
Amount | | | Fair
Value | |
| Other (continued) | | | | | | | | | | | | |
| Greystone CRE Notes Ltd. 2021-FL3 A† | | 5.338%
(1 Mo. LIBOR + 1.02% | )# | 7/15/2039 | | $ | 170,000 | | | $ | 162,293 | |
| HGI CRE CLO Ltd. 2021-FL2 A† | | 5.326%
(1 Mo. LIBOR + 1.00% | )# | 9/17/2036 | | | 300,000 | | | | 289,707 | |
| KKR CLO Ltd. 24 A1R† | | 5.323%
(3 Mo. LIBOR + 1.08% | )# | 4/20/2032 | | | 250,000 | | | | 244,847 | |
| KKR CLO Ltd. 38A A1† | | 5.184%
(3 Mo. Term SOFR + 1.32% | )# | 4/15/2033 | | | 250,000 | | | | 244,888 | |
| Lendmark Funding Trust 2021-2A A† | | 2.00% | | 4/20/2032 | | | 260,000 | | | | 215,908 | |
| LFT CRE Ltd. 2021-FL1 B† | | 6.068%
(1 Mo. LIBOR + 1.75% | )# | 6/15/2039 | | | 200,000 | | | | 194,573 | |
| LoanCore Issuer Ltd. 2019-CRE2 C† | | 6.318%
(1 Mo. LIBOR + 2.00% | )# | 5/15/2036 | | | 430,000 | | | | 417,134 | |
| LoanCore Issuer Ltd. 2022-CRE7 A† | | 5.358%
(1 Mo. SOFR + 1.55% | )# | 1/17/2037 | | | 260,000 | | | | 250,329 | |
| Madison Park Funding XI Ltd. 2013-11A AR2† | | 5.225%
(3 Mo. LIBOR + .90% | )# | 7/23/2029 | | | 242,246 | | | | 237,718 | |
| Magnetite Xxix Ltd. 2021-29A A† | | 5.069%
(3 Mo. LIBOR + .99% | )# | 1/15/2034 | | | 250,000 | | | | 245,314 | |
| Mariner Finance Issuance Trust 2021-BA A† | | 2.10% | | 11/20/2036 | | | 120,000 | | | | 101,422 | |
| Mariner Finance Issuance Trust 2022-AA A | | 6.45% | | 10/20/2037 | | | 330,000 | | | | 327,934 | |
| MF1 LLC 2022-FL9 A† | | 6.471%
(1 Mo. Term SOFR + 2.15% | )# | 6/19/2037 | | | 490,000 | | | | 485,789 | |
| MF1 Ltd. 2021-FL7 A† | | 5.419%
(1 Mo. LIBOR + 1.08% | )# | 10/16/2036 | | | 240,000 | | | | 230,246 | |
| MF1 Ltd. 2021-FL7 AS† | | 5.789%
(1 Mo. LIBOR + 1.45% | )# | 10/16/2036 | | | 230,000 | | | | 217,938 | |
| MF1 Ltd. 2022-FL8 A† | | 5.176%
(1 Mo. SOFR + 1.35% | )# | 2/19/2037 | | | 450,000 | | | | 433,742 | |
| Mountain View CLO LLC 2017-1A AR† | | 5.169%
(3 Mo. LIBOR + 1.09% | )# | 10/16/2029 | | | 233,545 | | | | 231,057 | |
| MVW Owner Trust 2017-1A A† | | 2.42% | | 12/20/2034 | | | 12,756 | | | | 12,469 | |
| New Economy Assets Phase 1 Sponsor LLC 2021-1 A1† | | 1.91% | | 10/20/2061 | | | 130,000 | | | | 110,084 | |
| OCP CLO Ltd. 2019-17A A1R† | | 5.283%
(3 Mo. LIBOR + 1.04% | )# | 7/20/2032 | | | 300,000 | | | | 292,373 | |
| Octagon Investment Partners XIV Ltd. 2012-1A AARR† | | 5.029%
(3 Mo. LIBOR + .95% | )# | 7/15/2029 | | | 248,710 | | | | 246,583 | |
| Octagon Investment Partners XVII Ltd. 2013-1A A1R2† | | 5.358%
(3 Mo. LIBOR + 1.00% | )# | 1/25/2031 | | | 250,000 | | | | 247,028 | |
| 12 | See Notes to Financial Statements. | |
Schedule of Investments (continued)
December 31, 2022
| Investments | | Interest
Rate | | Maturity
Date | | Principal
Amount | | | Fair
Value | |
| Other (continued) | | | | | | | | | | | | |
| Octagon Investment Partners XXI Ltd. 2014-1A AAR3† | | 5.65%
(3 Mo. LIBOR + 1.00% | )# | 2/14/2031 | | $ | 250,000 | | | $ | 245,923 | |
| Octane Receivables Trust 2021-1A A† | | 0.93% | | 3/22/2027 | | | 35,648 | | | | 34,454 | |
| Octane Receivables Trust 2022-1A A2† | | 4.18% | | 3/20/2028 | | | 158,617 | | | | 155,111 | |
| Octane Receivables Trust 2022-2A A† | | 5.11% | | 2/22/2028 | | | 167,428 | | | | 165,477 | |
| OneMain Financial Issuance Trust 2018-2A A† | | 3.57% | | 3/14/2033 | | | 100,000 | | | | 98,078 | |
| OneMain Financial Issuance Trust 2021-1A A1† | | 1.55% | | 6/16/2036 | | | 140,000 | | | | 119,379 | |
| OneMain Financial Issuance Trust 2022-3A A | | 5.94% | | 5/15/2034 | | | 245,000 | | | | 244,237 | |
| Orange Lake Timeshare Trust 2019-A A† | | 3.06% | | 4/9/2038 | | | 14,061 | | | | 13,329 | |
| Pagaya AI Debt Trust 2022-1 A† | | 2.03% | | 10/15/2029 | | | 261,002 | | | | 250,691 | |
| PFS Financing Corp. 2020-E A† | | 1.00% | | 10/15/2025 | | | 136,000 | | | | 131,154 | |
| PFS Financing Corp. 2020-G A† | | 0.97% | | 2/15/2026 | | | 108,000 | | | | 101,958 | |
| Rad CLO 2 Ltd. 2018-2A AR† | | 5.159%
(3 Mo. LIBOR + 1.08% | )# | 10/15/2031 | | | 250,000 | | | | 245,851 | |
| Rad CLO Ltd. 2020-7A A1† | | 5.279%
(3 Mo. LIBOR + 1.20% | )# | 4/17/2033 | | | 250,000 | | | | 245,084 | |
| Romark CLO Ltd. 2017-1A A2R† | | 5.975%
(3 Mo. LIBOR + 1.65% | )# | 10/23/2030 | | | 340,000 | | | | 326,946 | |
| SCF Equipment Leasing LLC 2019-2A A2† | | 2.47% | | 4/20/2026 | | | 141,993 | | | | 139,904 | |
| SCF Equipment Leasing LLC 2021-1A A3† | | 0.83% | | 8/21/2028 | | | 500,000 | | | | 475,643 | |
| SCF Equipment Leasing LLC 2022-1A A3† | | 2.92% | | 7/20/2029 | | | 220,000 | | | | 207,279 | |
| TCI-Flatiron CLO Ltd. 2018-1A ANR† | | 5.475%
(3 Mo. LIBOR + 1.06% | )# | 1/29/2032 | | | 250,000 | | | | 245,261 | |
| TCW CLO Ltd. 2022 1A A1† | | 5.40%
(3 Mo. Term SOFR + 1.34% | )# | 4/22/2033 | | | 350,000 | | | | 341,343 | |
| TICP CLO XIV Ltd. 2019-14A A1R† | | 5.323%
(3 Mo. LIBOR + 1.08% | )# | 10/20/2032 | | | 260,000 | | | | 255,218 | |
| Upstart Securitization Trust 2021-2 A† | | 0.91% | | 6/20/2031 | | | 28,147 | | | | 27,672 | |
| Upstart Securitization Trust 2021-5 A† | | 1.31% | | 11/20/2031 | | | 109,263 | | | | 104,624 | |
| Verizon Master Trust 2022-7 A1A | | 5.23% | | 11/22/2027 | | | 210,000 | | | | 211,325 | |
| Total | | | | | | | | | | | 16,976,608 | |
| | | | | | | | | | | | | |
| Student Loan 0.44% | | | | | | | | | | | | |
| Navient Private Education Refi Loan Trust 2020-FA A† | | 1.22% | | 7/15/2069 | | | 83,625 | | | | 74,295 | |
| Navient Private Education Refi Loan Trust 2021-CA A† | | 1.06% | | 10/15/2069 | | | 210,292 | | | | 178,974 | |
| Navient Private Education Refi Loan Trust 2022-A A† | | 2.23% | | 7/15/2070 | | | 195,414 | | | | 169,826 | |
| | See Notes to Financial Statements. | 13 |
Schedule of Investments (continued)
December 31, 2022
| Investments | | Interest
Rate | | Maturity
Date | | Principal
Amount | | | Fair
Value | |
| Student Loan (continued) | | | | | | | | | | | | |
| Nelnet Student Loan Trust 2021-A APT1† | | 1.36% | | 4/20/2062 | | $ | 81,364 | | | $ | 72,071 | |
| Towd Point Asset Trust 2018-SL1 A† | | 4.989%
(1 Mo. LIBOR + .60% | )# | 1/25/2046 | | | 23,579 | | | | 23,445 | |
| Total | | | | | | | | | | | 518,611 | |
| Total Asset-Backed Securities (cost $31,270,276) | | | | | | | | | | | 30,393,818 | |
| | | | | | | | | | | | | |
| | | | | | | | Shares | | | | | |
| | | | | | | | | | | | | |
| COMMON STOCKS 0.00% | | | | | | | | | | | | |
| | | | | | | | | | | | | |
| Banks | | | | | | | | | | | | |
Sable Bighorn LLC
(cost $0) | | | | | | | 16 | | | | 46 | (a) |
| | | | | | | | | | | | | |
| | | | | | | Principal
Amount | | | | | |
| | | | | | | | | | | | | |
| CORPORATE BONDS 47.59% | | | | | | | | | | | | |
| | | | | | | | | | | | | |
| Aerospace/Defense 0.10% | | | | | | | | | | | | |
| Bombardier, Inc. (Canada)†(b) | | 7.125% | | 6/15/2026 | | $ | 121,000 | | | | 117,616 | |
| | | | | | | | | | | | | |
| Agriculture 1.86% | | | | | | | | | | | | |
| BAT Capital Corp. | | 2.789% | | 9/6/2024 | | | 54,000 | | | | 51,706 | |
| BAT Capital Corp. | | 3.222% | | 8/15/2024 | | | 832,000 | | | | 801,638 | |
| Imperial Brands Finance plc (United Kingdom)†(b) | | 3.125% | | 7/26/2024 | | | 400,000 | | | | 382,632 | |
| Imperial Brands Finance plc (United Kingdom)†(b) | | 6.125% | | 7/27/2027 | | | 400,000 | | | | 398,719 | |
| Philip Morris International, Inc. | | 5.00% | | 11/17/2025 | | | 62,000 | | | | 62,348 | |
| Philip Morris International, Inc. | | 5.125% | | 11/17/2027 | | | 151,000 | | | | 152,370 | |
| Reynolds American, Inc. | | 4.45% | | 6/12/2025 | | | 14,000 | | | | 13,709 | |
| Viterra Finance BV (Netherlands)†(b) | | 2.00% | | 4/21/2026 | | | 411,000 | | | | 356,880 | |
| Total | | | | | | | | | | | 2,220,002 | |
| | | | | | | | | | | | | |
| Airlines 0.16% | | | | | | | | | | | | |
| Air Canada 2015-1 Class B Pass-Through Trust (Canada)†(b) | | 3.875% | | 9/15/2024 | | | 9,408 | | | | 9,343 | |
| Air Canada 2015-2 Class B Pass-Through Trust (Canada)†(b) | | 5.00% | | 6/15/2025 | | | 78,667 | | | | 77,047 | |
| American Airlines Group, Inc.† | | 3.75% | | 3/1/2025 | | | 92,000 | | | | 78,069 | |
| British Airways 2013-1 Class A Pass Through Trust (United Kingdom)†(b) | 4.625% | | 12/20/2025 | | | 23,772 | | | | 23,093 | |
| Total | | | | | | | | | | | 187,552 | |
| 14 | See Notes to Financial Statements. | |
Schedule of Investments (continued)
December 31, 2022
| Investments | | Interest
Rate | | Maturity
Date | | Principal
Amount | | | Fair
Value | |
| Apparel 0.03% | | | | | | | | | | | | |
| PVH Corp. | | 4.625% | | 7/10/2025 | | $ | 38,000 | | | $ | 36,729 | |
| | | | | | | | | | | | | |
| Auto Manufacturers 1.41% | | | | | | | | | | | | |
| Ford Motor Credit Co. LLC | | 5.584% | | 3/18/2024 | | | 200,000 | | | | 197,810 | |
| General Motors Financial Co., Inc. | | 2.75% | | 6/20/2025 | | | 134,000 | | | | 125,559 | |
| General Motors Financial Co., Inc. | | 2.90% | | 2/26/2025 | | | 54,000 | | | | 51,190 | |
| General Motors Financial Co., Inc. | | 3.70% | | 5/9/2023 | | | 92,000 | | | | 91,558 | |
| General Motors Financial Co., Inc. | | 3.95% | | 4/13/2024 | | | 140,000 | | | | 137,311 | |
| General Motors Financial Co., Inc. | | 4.25% | | 5/15/2023 | | | 23,000 | | | | 22,908 | |
| General Motors Financial Co., Inc. | | 5.10% | | 1/17/2024 | | | 132,000 | | | | 131,531 | |
| Hyundai Capital America† | | 0.80% | | 4/3/2023 | | | 80,000 | | | | 79,076 | |
| Hyundai Capital America† | | 0.80% | | 1/8/2024 | | | 160,000 | | | | 152,272 | |
| Hyundai Capital America† | | 0.875% | | 6/14/2024 | | | 160,000 | | | | 149,321 | |
| Hyundai Capital America† | | 1.00% | | 9/17/2024 | | | 47,000 | | | | 43,454 | |
| Hyundai Capital America† | | 1.25% | | 9/18/2023 | | | 218,000 | | | | 211,339 | |
| Hyundai Capital America† | | 1.30% | | 1/8/2026 | | | 75,000 | | | | 65,672 | |
| Hyundai Capital America† | | 1.50% | | 6/15/2026 | | | 91,000 | | | | 78,950 | |
| Hyundai Capital America† | | 5.875% | | 4/7/2025 | | | 137,000 | | | | 137,652 | |
| Total | | | | | | | | | | | 1,675,603 | |
| | | | | | | | | | | | | |
| Auto Parts & Equipment 0.14% | | | | | | | | | | | | |
| Clarios Global LP/Clarios U.S. Finance Co.† | | 8.50% | | 5/15/2027 | | | 173,000 | | | | 169,290 | |
| | | | | | | | | | | | | |
| Banks 18.21% | | | | | | | | | | | | |
| AIB Group plc (Ireland)†(b) | | 4.263%
(3 Mo. LIBOR + 1.87% | )# | 4/10/2025 | | | 600,000 | | | | 579,179 | |
| Australia & New Zealand Banking Group Ltd. (Australia)†(b) | | 4.40% | | 5/19/2026 | | | 200,000 | | | | 192,265 | |
| Bank of America Corp. | | 0.523%
(SOFR + 0.41% | )# | 6/14/2024 | | | 151,000 | | | | 147,435 | |
| Bank of America Corp. | | 0.981%
(SOFR + 0.91% | )# | 9/25/2025 | | | 37,000 | | | | 34,078 | |
| Bank of America Corp. | | 1.197%
(SOFR + 1.01% | )# | 10/24/2026 | | | 31,000 | | | | 27,591 | |
| Bank of America Corp. | | 1.319%
(SOFR + 1.15% | )# | 6/19/2026 | | | 89,000 | | | | 80,223 | |
| Bank of America Corp. | | 1.53%
(SOFR + 0.65% | )# | 12/6/2025 | | | 78,000 | | | | 71,995 | |
| Bank of America Corp. | | 2.456%
(3 Mo. LIBOR + .87% | )# | 10/22/2025 | | | 174,000 | | | | 164,523 | |
| | See Notes to Financial Statements. | 15 |
Schedule of Investments (continued)
December 31, 2022
| Investments | | Interest
Rate | | Maturity
Date | | Principal
Amount | | | Fair
Value | |
| Banks (continued) | | | | | | | | | | | | |
| Bank of America Corp. | | 3.384%
(SOFR + 1.33% | )# | 4/2/2026 | | $ | 213,000 | | | $ | 203,604 | |
| Bank of America Corp. | | 3.55%
(3 Mo. LIBOR + .78% | )# | 3/5/2024 | | | 200,000 | | | | 199,261 | |
| Bank of America Corp. | | 3.841%
(SOFR + 1.11% | )# | 4/25/2025 | | | 164,000 | | | | 160,201 | |
| Bank of America Corp. | | 3.864%
(3 Mo. LIBOR + .94% | )# | 7/23/2024 | | | 246,000 | | | | 243,826 | |
| Bank of America Corp. | | 3.95% | | 4/21/2025 | | | 157,000 | | | | 152,932 | |
| Bank of America Corp. | | 4.00% | | 1/22/2025 | | | 248,000 | | | | 242,929 | |
| Bank of America Corp. | | 4.948%
(SOFR + 2.04% | )# | 7/22/2028 | | | 168,000 | | | | 164,354 | |
| Bank of Ireland Group plc (Ireland)†(b) | | 2.029%
(1 Yr. Treasury CMT + 1.10% | )# | 9/30/2027 | | | 200,000 | | | | 169,133 | |
| Bank of Ireland Group PLC (Ireland)†(b) | | 6.253%
(1 Yr. Treasury CMT + 2.65% | )# | 9/16/2026 | | | 200,000 | | | | 198,532 | |
| Bank of Montreal (Canada)(b) | | 3.70% | | 6/7/2025 | | | 135,000 | | | | 131,123 | |
| Bank of Montreal (Canada)(b) | | 4.25% | | 9/14/2024 | | | 175,000 | | | | 172,785 | |
| BankUnited, Inc. | | 4.875% | | 11/17/2025 | | | 364,000 | | | | 358,725 | |
| Barclays plc (United Kingdom)(b) | | 3.932%
(3 Mo. LIBOR + 1.61% | )# | 5/7/2025 | | | 307,000 | | | | 297,869 | |
| Barclays plc (United Kingdom)(b) | | 4.338%
(3 Mo. LIBOR + 1.36% | )# | 5/16/2024 | | | 200,000 | | | | 198,638 | |
| BNP Paribas SA (France)†(b) | | 2.219%
(SOFR + 2.07% | )# | 6/9/2026 | | | 229,000 | | | | 210,457 | |
| BPCE SA (France)†(b) | | 4.50% | | 3/15/2025 | | | 200,000 | | | | 192,268 | |
| BPCE SA (France)†(b) | | 4.875% | | 4/1/2026 | | | 200,000 | | | | 190,570 | |
| Canadian Imperial Bank of Commerce (Canada)(b) | | 3.945% | | 8/4/2025 | | | 169,000 | | | | 165,225 | |
| Citigroup, Inc. | | 1.678%
(SOFR + 1.67% | )# | 5/15/2024 | | | 95,000 | | | | 93,668 | |
| Citigroup, Inc. | | 3.106%
(SOFR + 2.84% | )# | 4/8/2026 | | | 743,000 | | | | 703,940 | |
| Citigroup, Inc. | | 3.352%
(3 Mo. LIBOR + .90% | )# | 4/24/2025 | | | 233,000 | | | | 226,054 | |
| Citigroup, Inc. | | 3.875% | | 3/26/2025 | | | 59,000 | | | | 57,414 | |
| Citigroup, Inc. | | 4.044%
(3 Mo. LIBOR + 1.02% | )# | 6/1/2024 | | | 106,000 | | | | 105,311 | |
| Citigroup, Inc. | | 4.14%
(SOFR + 1.37% | )# | 5/24/2025 | | | 302,000 | | | | 296,317 | |
| Citigroup, Inc. | | 4.40% | | 6/10/2025 | | | 403,000 | | | | 395,922 | |
| 16 | See Notes to Financial Statements. | |
Schedule of Investments (continued)
December 31, 2022
| Investments | | Interest
Rate | | Maturity
Date | | Principal
Amount | | | Fair
Value | |
| Banks (continued) | | | | | | | | | | | | |
| Citizens Bank NA | | 4.575%
(SOFR + 2.00% | )# | 8/9/2028 | | $ | 250,000 | | | $ | 241,774 | |
| Citizens Bank NA | | 6.064% | # | 10/24/2025 | | | 250,000 | | | | 252,998 | |
| Credit Agricole SA (France)†(b) | | 4.375% | | 3/17/2025 | | | 435,000 | | | | 420,568 | |
| Credit Suisse Group AG (Switzerland)†(b) | | 2.193%
(SOFR + 2.04% | )# | 6/5/2026 | | | 250,000 | | | | 213,725 | |
| Danske Bank A/S (Denmark)†(b) | | 0.976%
(1 Yr. Treasury CMT + .55% | )# | 9/10/2025 | | | 200,000 | | | | 182,722 | |
| Danske Bank A/S (Denmark)†(b) | | 1.621%
(1 Yr. Treasury CMT + 1.35% | )# | 9/11/2026 | | | 200,000 | | | | 176,335 | |
| Danske Bank A/S (Denmark)†(b) | | 3.244%
(3 Mo. LIBOR + 1.59% | )# | 12/20/2025 | | | 400,000 | | | | 374,665 | |
| Danske Bank A/S (Denmark)†(b) | | 4.298%
(1 Yr. Treasury CMT + 1.75% | )# | 4/1/2028 | | | 200,000 | | | | 184,195 | |
| Danske Bank A/S (Denmark)†(b) | | 5.375% | | 1/12/2024 | | | 200,000 | | | | 198,424 | |
| Discover Bank | | 3.35% | | 2/6/2023 | | | 600,000 | | | | 598,913 | |
| Discover Bank | | 4.25% | | 3/13/2026 | | | 250,000 | | | | 238,039 | |
| First-Citizens Bank & Trust Co. | | 2.969% | | 9/27/2025 | | | 250,000 | | | | 236,517 | |
| First-Citizens Bank & Trust Co. | | 3.929%
(SOFR + 3.83% | )# | 6/19/2024 | | | 41,000 | | | | 40,651 | |
| FNB Corp. | | 2.20% | | 2/24/2023 | | | 53,000 | | | | 52,737 | |
| Goldman Sachs Group, Inc. (The) | | 0.657%
(SOFR + 0.51% | )# | 9/10/2024 | | | 151,000 | | | | 145,308 | |
| Goldman Sachs Group, Inc. (The) | | 1.948%
(SOFR + 0.91% | )# | 10/21/2027 | | | 231,000 | | | | 202,284 | |
| Goldman Sachs Group, Inc. (The) | | 2.64%
(SOFR + 1.11% | )# | 2/24/2028 | | | 75,000 | | | | 66,886 | |
| Goldman Sachs Group, Inc. (The) | | 4.25% | | 10/21/2025 | | | 18,000 | | | | 17,586 | |
| Goldman Sachs Group, Inc. (The) | | 4.482%
(SOFR + 1.73% | )# | 8/23/2028 | | | 152,000 | | | | 145,930 | |
| Goldman Sachs Group, Inc. (The) | | 4.598%
(SOFR + 0.70% | )# | 1/24/2025 | | | 153,000 | | | | 150,775 | |
| Goldman Sachs Group, Inc. (The) | | 5.442%
(3 Mo. LIBOR + .75% | )# | 2/23/2023 | | | 240,000 | | | | 240,128 | |
| HSBC Holdings plc (United Kingdom)(b) | | 0.732%
(SOFR + 0.53% | )# | 8/17/2024 | | | 200,000 | | | | 192,772 | |
| HSBC Holdings plc (United Kingdom)(b) | | 0.976%
(SOFR + 0.71% | )# | 5/24/2025 | | | 200,000 | | | | 185,280 | |
| Huntington Bancshares, Inc. | | 4.443%
(SOFR + 1.97% | )# | 8/4/2028 | | | 73,000 | | | | 69,652 | |
| | See Notes to Financial Statements. | 17 |
Schedule of Investments (continued)
December 31, 2022
| Investments | | Interest
Rate | | Maturity
Date | | Principal
Amount | | | Fair
Value | |
| Banks (continued) | | | | | | | | | | | | |
| Huntington National Bank (The) | | 4.008%
(SOFR + 1.21% | )# | 5/16/2025 | | $ | 250,000 | | | $ | 244,694 | |
| ING Groep NV (Netherlands)†(b) | 4.70%
(USD ICE 5 Yr. Swap rate + 1.94% | )# | 3/22/2028 | | | 200,000 | | | | 196,123 | |
| Intesa Sanpaolo SpA (Italy)†(b) | | 3.25% | | 9/23/2024 | | | 200,000 | | | | 189,824 | |
| Intesa Sanpaolo SpA (Italy)†(b) | | 5.017% | | 6/26/2024 | | | 400,000 | | | | 384,747 | |
| JPMorgan Chase & Co. | | 0.768%
(SOFR + 0.49% | )# | 8/9/2025 | | | 148,000 | | | | 136,684 | |
| JPMorgan Chase & Co. | | 0.824%
(SOFR + 0.54% | )# | 6/1/2025 | | | 172,000 | | | | 160,421 | |
| JPMorgan Chase & Co. | | 3.559%
(3 Mo. LIBOR + .73% | )# | 4/23/2024 | | | 301,000 | | | | 299,055 | |
| JPMorgan Chase & Co. | | 3.797%
(3 Mo. LIBOR + .89% | )# | 7/23/2024 | | | 95,000 | | | | 94,077 | |
| JPMorgan Chase & Co. | | 3.845%
(SOFR + 0.98% | )# | 6/14/2025 | | | 205,000 | | | | 200,548 | |
| JPMorgan Chase & Co. | | 4.851%
(SOFR + 1.99% | )# | 7/25/2028 | | | 169,000 | | | | 165,016 | |
| JPMorgan Chase & Co. | | 5.119%
(SOFR + 0.92% | )# | 2/24/2026 | | | 115,000 | | | | 113,164 | |
| JPMorgan Chase & Co. | | 5.379%
(SOFR + 1.18% | )# | 2/24/2028 | | | 77,000 | | | | 74,702 | |
| KeyBank NA | | 4.15% | | 8/8/2025 | | | 250,000 | | | | 244,493 | |
| Lloyds Banking Group plc (United Kingdom)(b) | | 4.582% | | 12/10/2025 | | | 200,000 | | | | 193,878 | |
| M&T Bank Corp. | | 4.553%
(SOFR Index + 1.78% | )# | 8/16/2028 | | | 94,000 | | | | 91,788 | |
| Macquarie Group Ltd. (Australia)†(b) | | 1.201%
(SOFR + 0.69% | )# | 10/14/2025 | | | 76,000 | | | | 69,794 | |
| Macquarie Group Ltd. (Australia)†(b) | | 1.34%
(SOFR + 1.07% | )# | 1/12/2027 | | | 65,000 | | | | 56,719 | |
| Macquarie Group Ltd. (Australia)†(b) | | 4.15%
(3 Mo. LIBOR + 1.33% | )# | 3/27/2024 | | | 75,000 | | | | 74,733 | |
| Macquarie Group Ltd. (Australia)†(b) | | 5.108%
(SOFR + 2.21% | )# | 8/9/2026 | | | 180,000 | | | | 179,424 | |
| Mitsubishi UFJ Financial Group, Inc. (Japan)(b) | | 0.962%
(1 Yr. Treasury CMT + .45% | )# | 10/11/2025 | | | 200,000 | | | | 184,022 | |
| Mitsubishi UFJ Financial Group, Inc. (Japan)(b) | | 4.788%
(1 Yr. Treasury CMT + 1.70% | )# | 7/18/2025 | | | 215,000 | | | | 212,987 | |
| Mitsubishi UFJ Financial Group, Inc. (Japan)(b) | | 5.063%
(1 Yr. Treasury CMT + 1.55% | )# | 9/12/2025 | | | 200,000 | | | | 198,707 | |
| Morgan Stanley | | 0.79%
(SOFR + 0.53% | )# | 5/30/2025 | | | 276,000 | | | | 256,741 | |
| 18 | See Notes to Financial Statements. |
Schedule of Investments (continued)
December 31, 2022
| Investments | | Interest
Rate | | Maturity
Date | | Principal
Amount | | | Fair
Value | |
| Banks (continued) | | | | | | | | | | | | |
| Morgan Stanley | | 0.791%
(SOFR + 0.51% | )# | 1/22/2025 | | $ | 187,000 | | | $ | 176,987 | |
| Morgan Stanley | | 3.62%
(SOFR + 1.16% | )# | 4/17/2025 | | | 94,000 | | | | 91,773 | |
| Morgan Stanley | | 3.737%
(3 Mo. LIBOR + .85% | )# | 4/24/2024 | | | 500,000 | | | | 497,361 | |
| Morgan Stanley | | 6.138% | # | 10/16/2026 | | | 270,000 | | | | 276,053 | |
| NatWest Group plc (United Kingdom)(b) | | 4.269%
(3 Mo. LIBOR + 1.76% | )# | 3/22/2025 | | | 295,000 | | | | 288,614 | |
| NatWest Group plc (United Kingdom)(b) | | 4.519%
(3 Mo. LIBOR + 1.55% | )# | 6/25/2024 | | | 200,000 | | | | 198,179 | |
| NatWest Markets plc (United Kingdom)†(b) | | 0.80% | | 8/12/2024 | | | 200,000 | | | | 185,416 | |
| Nordea Bank Abp (Finland)†(b) | | 3.60% | | 6/6/2025 | | | 200,000 | | | | 193,182 | |
| Popular, Inc. | | 6.125% | | 9/14/2023 | | | 18,000 | | | | 17,932 | |
| Royal Bank of Canada (Canada)(b) | | 3.97% | | 7/26/2024 | | | 83,000 | | | | 81,844 | |
| Royal Bank of Canada (Canada)(b) | | 4.24% | | 8/3/2027 | | | 152,000 | | | | 148,313 | |
| Royal Bank of Canada (Canada)(b) | | 6.00% | | 11/1/2027 | | | 80,000 | | | | 83,541 | |
| Santander Holdings USA, Inc. | | 2.49%
(SOFR + 1.25% | )# | 1/6/2028 | | | 68,000 | | | | 58,433 | |
| Santander Holdings USA, Inc. | | 5.807%
(SOFR + 2.33% | )# | 9/9/2026 | | | 60,000 | | | | 59,608 | |
| Santander UK Group Holdings plc (United Kingdom)(b) | | 1.089%
(SOFR + 0.79% | )# | 3/15/2025 | | | 400,000 | | | | 373,906 | |
| Santander UK Group Holdings plc (United Kingdom)(b) | | 2.469%
(SOFR + 1.22% | )# | 1/11/2028 | | | 200,000 | | | | 171,057 | |
| Santander UK Group Holdings plc (United Kingdom)†(b) | | 4.75% | | 9/15/2025 | | | 200,000 | | | | 190,758 | |
| Societe Generale SA (France)†(b) | | 2.226%
(1 Yr. Treasury CMT + 1.05% | )# | 1/21/2026 | | | 200,000 | | | | 184,088 | |
| Standard Chartered plc (United Kingdom)†(b) | | 0.991%
(1 Yr. Treasury CMT + .78% | )# | 1/12/2025 | | | 400,000 | | | | 378,067 | |
| Standard Chartered plc (United Kingdom)†(b) | | 1.214%
(1 Yr. Treasury CMT + .88% | )# | 3/23/2025 | | | 200,000 | | | | 188,830 | |
| Toronto-Dominion Bank (The) (Canada)(b) | | 3.766% | | 6/6/2025 | | | 481,000 | | | | 467,232 | |
| Toronto-Dominion Bank (The) (Canada)(b) | | 4.693% | | 9/15/2027 | | | 126,000 | | | | 124,777 | |
| U.S. Bancorp | | 4.548%
(SOFR + 1.66% | )# | 7/22/2028 | | | 117,000 | | | | 114,457 | |
| UBS AG (Switzerland)†(b) | | 5.125% | | 5/15/2024 | | | 600,000 | | | | 593,486 | |
| | See Notes to Financial Statements. | 19 |
Schedule of Investments (continued)
December 31, 2022
| Investments | | Interest
Rate | | Maturity
Date | | Principal
Amount | | | Fair
Value | |
| Banks (continued) | | | | | | | | | | | | |
| UBS Group AG (Switzerland)†(b) | | 4.488%
(1 Yr. Treasury CMT + 1.55% | )# | 5/12/2026 | | $ | 200,000 | | | $ | 195,653 | |
| UniCredit SpA (Italy)†(b) | | 7.83% | | 12/4/2023 | | | 350,000 | | | | 353,704 | |
| Wells Fargo & Co. | | 4.54%
(SOFR + 1.56% | )# | 8/15/2026 | | | 161,000 | | | | 157,934 | |
| Wells Fargo & Co. | | 4.808%
(SOFR + 1.98% | )# | 7/25/2028 | | | 169,000 | | | | 165,340 | |
| Total | | | | | | | | | | | 21,696,077 | |
| | | | | | | | | | | | | |
| Beverages 0.14% | | | | | | | | | | | | |
| Constellation Brands, Inc. | | 3.60% | | 2/15/2028 | | | 173,000 | | | | 160,629 | |
| | | | | | | | | | | | | |
| Biotechnology 0.14% | | | | | | | | | | | | |
| Illumina, Inc. | | 5.75% | | 12/13/2027 | | | 84,000 | | | | 85,195 | |
| Illumina, Inc. | | 5.80% | | 12/12/2025 | | | 84,000 | | | | 84,663 | |
| Total | | | | | | | | | | | 169,858 | |
| | | | | | | | | | | | | |
| Chemicals 0.49% | | | | | | | | | | | | |
| Celanese US Holdings LLC | | 5.90% | | 7/5/2024 | | | 297,000 | | | | 297,080 | |
| International Flavors & Fragrances, Inc.† | | 1.23% | | 10/1/2025 | | | 130,000 | | | | 114,959 | |
| Nutrien Ltd. | | 5.95% | | 11/7/2025 | | | 168,000 | | | | 171,602 | |
| Total | | | | | | | | | | | 583,641 | |
| | | | | | | | | | | | | |
| Commercial Services 0.49% | | | | | | | | | | | | |
| Global Payments, Inc. | | 2.65% | | 2/15/2025 | | | 36,000 | | | | 33,899 | |
| Global Payments, Inc. | | 3.75% | | 6/1/2023 | | | 106,000 | | | | 105,342 | |
| Global Payments, Inc. | | 4.95% | | 8/15/2027 | | | 178,000 | | | | 172,953 | |
| Sabre GLBL, Inc.† | | 7.375% | | 9/1/2025 | | | 148,000 | | | | 142,479 | |
| Triton Container International Ltd.† | | 0.80% | | 8/1/2023 | | | 103,000 | | | | 99,425 | |
| Triton Container International Ltd.† | | 1.15% | | 6/7/2024 | | | 30,000 | | | | 27,761 | |
| Total | | | | | | | | | | | 581,859 | |
| | | | | | | | | | | | | |
| Computers 0.67% | | | | | | | | | | | | |
| Dell International LLC/EMC Corp. | | 4.90% | | 10/1/2026 | | | 146,000 | | | | 143,910 | |
| Dell International LLC/EMC Corp. | | 5.45% | | 6/15/2023 | | | 139,000 | | | | 139,104 | |
| Dell International LLC/EMC Corp. | | 6.02% | | 6/15/2026 | | | 498,000 | | | | 508,650 | |
| Total | | | | | | | | | | | 791,664 | |
| | | | | | | | | | | | | |
| Diversified Financial Services 3.33% | | | | | | | | | | | | |
| AerCap Ireland Capital DAC/AerCap Global Aviation Trust (Ireland)(b) | | 1.75% | | 10/29/2024 | | | 150,000 | | | | 138,034 | |
| AerCap Ireland Capital DAC/AerCap Global Aviation Trust (Ireland)(b) | | 6.50% | | 7/15/2025 | | | 198,000 | | | | 200,816 | |
| 20 | See Notes to Financial Statements. |
Schedule of Investments (continued)
December 31, 2022
| Investments | | Interest
Rate | | Maturity
Date | | Principal
Amount | | | Fair
Value | |
| Diversified Financial Services (continued) | | | | | | | | | | | | |
| Air Lease Corp. | | 4.25% | | 2/1/2024 | | $ | 19,000 | | | $ | 18,681 | |
| Aircastle Ltd. | | 4.40% | | 9/25/2023 | | | 184,000 | | | | 182,220 | |
| Aircastle Ltd. | | 5.00% | | 4/1/2023 | | | 107,000 | | | | 106,838 | |
| Aircastle Ltd.† | | 5.25% | | 8/11/2025 | | | 113,000 | | | | 108,785 | |
| Ally Financial, Inc. | | 1.45% | | 10/2/2023 | | | 23,000 | | | | 22,303 | |
| Ally Financial, Inc. | | 3.875% | | 5/21/2024 | | | 232,000 | | | | 225,953 | |
| Ally Financial, Inc. | | 5.125% | | 9/30/2024 | | | 272,000 | | | | 269,493 | |
| Ally Financial, Inc. | | 5.75% | | 11/20/2025 | | | 103,000 | | | | 99,889 | |
| American Express Co. | | 3.95% | | 8/1/2025 | | | 114,000 | | | | 111,791 | |
| American Express Co. | | 5.85% | | 11/5/2027 | | | 91,000 | | | | 94,897 | |
| Aviation Capital Group LLC† | | 1.95% | | 1/30/2026 | | | 53,000 | | | | 46,196 | |
| Aviation Capital Group LLC† | | 3.875% | | 5/1/2023 | | | 92,000 | | | | 91,264 | |
| Aviation Capital Group LLC† | | 5.50% | | 12/15/2024 | | | 109,000 | | | | 107,154 | |
| Avolon Holdings Funding Ltd. (Ireland)†(b) | | 2.125% | | 2/21/2026 | | | 45,000 | | | | 38,778 | |
| Avolon Holdings Funding Ltd. (Ireland)†(b) | | 4.25% | | 4/15/2026 | | | 42,000 | | | | 38,123 | |
| Avolon Holdings Funding Ltd. (Ireland)†(b) | | 5.125% | | 10/1/2023 | | | 152,000 | | | | 150,339 | |
| Avolon Holdings Funding Ltd. (Ireland)†(b) | | 5.25% | | 5/15/2024 | | | 152,000 | | | | 149,057 | |
| Bread Financial Holdings, Inc.† | | 4.75% | | 12/15/2024 | | | 120,000 | | | | 106,598 | |
| Bread Financial Holdings, Inc.† | | 7.00% | | 1/15/2026 | | | 129,000 | | | | 112,951 | |
| Capital One Financial Corp. | | 4.166%
(SOFR + 1.37% | )# | 5/9/2025 | | | 96,000 | | | | 93,823 | |
| Capital One Financial Corp. | | 4.963%
(SOFR + 0.69% | )# | 12/6/2024 | | | 240,000 | | | | 235,485 | |
| Navient Corp. | | 5.50% | | 1/25/2023 | | | 194,000 | | | | 193,985 | |
| Navient Corp. | | 5.875% | | 10/25/2024 | | | 144,000 | | | | 139,579 | |
| Navient Corp. | | 6.125% | | 3/25/2024 | | | 165,000 | | | | 161,906 | |
| Navient Corp. | | 7.25% | | 9/25/2023 | | | 46,000 | | | | 46,106 | |
| Nuveen Finance LLC† | | 4.125% | | 11/1/2024 | | | 148,000 | | | | 144,173 | |
| OneMain Finance Corp. | | 6.125% | | 3/15/2024 | | | 139,000 | | | | 134,761 | |
| OneMain Finance Corp. | | 8.25% | | 10/1/2023 | | | 32,000 | | | | 32,303 | |
| Park Aerospace Holdings Ltd. (Ireland)†(b) | | 4.50% | | 3/15/2023 | | | 145,000 | | | | 144,653 | |
| Park Aerospace Holdings Ltd. (Ireland)†(b) | | 5.50% | | 2/15/2024 | | | 228,000 | | | | 225,129 | |
| Total | | | | | | | | | | | 3,972,063 | |
| | | | | | | | | | | | | |
| Electric 3.75% | | | | | | | | | | | | |
| AES Corp. (The)† | | 3.30% | | 7/15/2025 | | | 433,000 | | | | 409,021 | |
| Alexander Funding Trust† | | 1.841% | | 11/15/2023 | | | 217,000 | | | | 207,948 | |
| American Electric Power Co., Inc. | | 2.031% | | 3/15/2024 | | | 184,000 | | | | 177,496 | |
| American Electric Power Co., Inc. | | 5.75% | | 11/1/2027 | | | 70,000 | | | | 71,975 | |
| | See Notes to Financial Statements. | 21 |
Schedule of Investments (continued)
December 31, 2022
| Investments | | Interest
Rate | | Maturity
Date | | Principal
Amount | | | Fair
Value | |
| Electric (continued) | | | | | | | | | | | | |
| Ausgrid Finance Pty Ltd. (Australia)†(b) | | 3.85% | | 5/1/2023 | | $ | 225,000 | | | $ | 223,883 | |
| Calpine Corp.† | | 5.25% | | 6/1/2026 | | | 72,000 | | | | 68,699 | |
| Cleco Corporate Holdings LLC | | 3.743% | | 5/1/2026 | | | 264,000 | | | | 249,569 | |
| Comision Federal de Electricidad (Mexico)†(b) | | 4.75% | | 2/23/2027 | | | 200,000 | | | | 187,224 | |
| DTE Energy Co. | | 4.22% | | 11/1/2024 | | | 106,000 | | | | 104,269 | |
| Duke Energy Corp. | | 2.65% | | 9/1/2026 | | | 73,000 | | | | 67,520 | |
| Duke Energy Corp. | | 4.30% | | 3/15/2028 | | | 77,000 | | | | 74,233 | |
| Duke Energy Corp. | | 5.00% | | 12/8/2025 | | | 45,000 | | | | 44,953 | |
| Duke Energy Corp. | | 5.00% | | 12/8/2027 | | | 41,000 | | | | 40,842 | |
| Evergy Missouri West, Inc. | | 5.15% | | 12/15/2027 | | | 182,000 | | | | 181,655 | |
| Fells Point Funding Trust† | | 3.046% | | 1/31/2027 | | | 355,000 | | | | 323,588 | |
| FirstEnergy Transmission LLC† | | 4.35% | | 1/15/2025 | | | 247,000 | | | | 240,881 | |
| Jersey Central Power & Light Co.† | | 4.70% | | 4/1/2024 | | | 150,000 | | | | 147,973 | |
| NextEra Energy Capital Holdings, Inc. | | 4.20% | | 6/20/2024 | | | 43,000 | | | | 42,458 | |
| NextEra Energy Capital Holdings, Inc. | | 5.342%
(SOFR Index + 1.02% | )# | 3/21/2024 | | | 410,000 | | | | 407,800 | |
| NRG Energy, Inc.† | | 3.75% | | 6/15/2024 | | | 235,000 | | | | 226,467 | |
| OGE Energy Corp. | | 0.703% | | 5/26/2023 | | | 17,000 | | | | 16,701 | |
| Pacific Gas and Electric Co. | | 3.15% | | 1/1/2026 | | | 258,645 | | | | 240,615 | |
| Public Service Enterprise Group, Inc. | | 5.85% | | 11/15/2027 | | | 82,000 | | | | 84,528 | |
| Southern Co. (The) | | 5.113% | | 8/1/2027 | | | 177,000 | | | | 176,640 | |
| Vistra Operations Co. LLC† | | 3.55% | | 7/15/2024 | | | 350,000 | | | | 335,889 | |
| Vistra Operations Co. LLC† | | 4.875% | | 5/13/2024 | | | 123,000 | | | | 120,675 | |
| Total | | | | | | | | | | | 4,473,502 | |
| | | | | | | | | | | | | |
| Energy-Alternate Sources 0.09% | | | | | | | | | | | | |
| Enviva Partners LP/Enviva Partners Finance Corp.† | | 6.50% | | 1/15/2026 | | | 116,000 | | | | 109,437 | |
| | | | | | | | | | | | | |
| Entertainment 0.38% | | | | | | | | | | | | |
| Caesars Entertainment, Inc.† | | 6.25% | | 7/1/2025 | | | 43,000 | | | | 41,869 | |
| Warnermedia Holdings, Inc.† | | 3.428% | | 3/15/2024 | | | 233,000 | | | | 226,298 | |
| Warnermedia Holdings, Inc.† | | 3.638% | | 3/15/2025 | | | 115,000 | | | | 109,455 | |
| Warnermedia Holdings, Inc.† | | 3.788% | | 3/15/2025 | | | 82,000 | | | | 78,390 | |
| Total | | | | | | | | | | | 456,012 | |
| | | | | | | | | | | | | |
| Gas 0.69% | | | | | | | | | | | | |
| Atmos Energy Corp. | | 0.625% | | 3/9/2023 | | | 62,000 | | | | 61,548 | |
| Brooklyn Union Gas Co. (The)† | | 4.632% | | 8/5/2027 | | | 118,000 | | | | 112,761 | |
| National Fuel Gas Co. | | 5.50% | | 1/15/2026 | | | 211,000 | | | | 210,155 | |
| National Fuel Gas Co. | | 7.395% | | 3/30/2023 | | | 25,000 | | | | 25,026 | |
| 22 | See Notes to Financial Statements. |
Schedule of Investments (continued)
December 31, 2022
| Investments | | Interest
Rate | | Maturity
Date | | Principal
Amount | | | Fair
Value | |
| Gas (continued) | | | | | | | | | | | | |
| ONE Gas, Inc. | | 1.10% | | 3/11/2024 | | $ | 337,000 | | | $ | 323,293 | |
| Southwest Gas Corp. | | 5.80% | | 12/1/2027 | | | 89,000 | | | | 90,291 | |
| Total | | | | | | | | | | | 823,074 | |
| | | | | | | | | | | | | |
| Health Care-Products 0.15% | | | | | | | | | | | | |
| GE HealthCare Technologies, Inc. | | 5.60% | | 11/15/2025 | | | 182,000 | | | | 183,316 | |
| | | | | | | | | | | | | |
| Health Care-Services 0.65% | | | | | | | | | | | | |
| Centene Corp. | | 2.45% | | 7/15/2028 | | | 130,000 | | | | 109,976 | |
| Centene Corp. | | 4.25% | | 12/15/2027 | | | 270,000 | | | | 253,819 | |
| HCA, Inc. | | 5.00% | | 3/15/2024 | | | 29,000 | | | | 28,847 | |
| HCA, Inc. | | 5.25% | | 4/15/2025 | | | 237,000 | | | | 235,828 | |
| HCA, Inc. | | 5.25% | | 6/15/2026 | | | 18,000 | | | | 17,806 | |
| HCA, Inc. | | 5.375% | | 2/1/2025 | | | 52,000 | | | | 51,979 | |
| Humana, Inc. | | 5.75% | | 3/1/2028 | | | 74,000 | | | | 75,694 | |
| Total | | | | | | | | | | | 773,949 | |
| | | | | | | | | | | | | |
| Home Builders 0.23% | | | | | | | | | | | | |
| Beazer Homes USA, Inc. | | 6.75% | | 3/15/2025 | | | 121,000 | | | | 117,134 | |
| Lennar Corp. | | 4.875% | | 12/15/2023 | | | 81,000 | | | | 80,645 | |
| Toll Brothers Finance Corp. | | 4.375% | | 4/15/2023 | | | 30,000 | | | | 29,872 | |
| Toll Brothers Finance Corp. | | 4.875% | | 11/15/2025 | | | 45,000 | | | | 44,025 | |
| Total | | | | | | | | | | | 271,676 | |
| | | | | | | | | | | | | |
| Housewares 0.07% | | | | | | | | | | | | |
| Newell Brands, Inc. | | 4.45% | | 4/1/2026 | | | 82,000 | | | | 77,326 | |
| | | | | | | | | | | | | |
| Insurance 2.15% | | | | | | | | | | | | |
| CNO Financial Group, Inc. | | 5.25% | | 5/30/2025 | | | 280,000 | | | | 278,038 | |
| CNO Global Funding† | | 1.75% | | 10/7/2026 | | | 150,000 | | | | 131,714 | |
| Equitable Financial Life Global Funding† | | 1.40% | | 7/7/2025 | | | 143,000 | | | | 129,801 | |
| F&G Global Funding† | | 0.90% | | 9/20/2024 | | | 59,000 | | | | 53,950 | |
| F&G Global Funding† | | 1.75% | | 6/30/2026 | | | 332,000 | | | | 296,010 | |
| F&G Global Funding† | | 2.30% | | 4/11/2027 | | | 114,000 | | | | 100,398 | |
| F&G Global Funding† | | 5.15% | | 7/7/2025 | | | 307,000 | | | | 300,929 | |
| GA Global Funding Trust† | | 0.80% | | 9/13/2024 | | | 300,000 | | | | 274,316 | |
| GA Global Funding Trust† | | 3.85% | | 4/11/2025 | | | 372,000 | | | | 356,350 | |
| Jackson Financial, Inc. | | 5.17% | | 6/8/2027 | | | 68,000 | | | | 67,105 | |
| Jackson National Life Global Funding† | | 1.75% | | 1/12/2025 | | | 150,000 | | | | 139,328 | |
| Jackson National Life Global Funding | | 5.473%# | | 6/28/2024 | | | 245,000 | | | | 245,101 | |
| Kemper Corp. | | 4.35% | | 2/15/2025 | | | 44,000 | | | | 42,720 | |
| Metropolitan Life Global Funding I† | | 4.05% | | 8/25/2025 | | | 150,000 | | | | 146,806 | |
| Total | | | | | | | | | | | 2,562,566 | |
| | See Notes to Financial Statements. | 23 |
Schedule of Investments (continued)
December 31, 2022
| Investments | | Interest
Rate | | Maturity
Date | | Principal
Amount | | | Fair
Value | |
| Internet 0.72% | | | | | | | | | | | | |
| Amazon.com, Inc. | | 4.55% | | 12/1/2027 | | $ | 224,000 | | | $ | 223,664 | |
| Netflix, Inc.† | | 3.625% | | 6/15/2025 | | | 186,000 | | | | 178,383 | |
| Netflix, Inc. | | 4.375% | | 11/15/2026 | | | 471,000 | | | | 454,148 | |
| Total | | | | | | | | | | | 856,195 | |
| | | | | | | | | | | | | |
| Iron-Steel 0.09% | | | | | | | | | | | | |
| Baffinland Iron Mines Corp./Baffinland Iron Mines LP (Canada)†(b) | | 8.75% | | 7/15/2026 | | | 114,000 | | | | 108,270 | |
| | | | | | | | | | | | | |
| Lodging 0.34% | | | | | | | | | | | | |
| Hyatt Hotels Corp. | | 1.30% | | 10/1/2023 | | | 194,000 | | | | 188,635 | |
| Hyatt Hotels Corp. | | 1.80% | | 10/1/2024 | | | 57,000 | | | | 53,447 | |
| Wynn Las Vegas LLC/Wynn Las Vegas Capital Corp.† | | 4.25% | | 5/30/2023 | | | 164,000 | | | | 161,887 | |
| Total | | | | | | | | | | | 403,969 | |
| | | | | | | | | | | | | |
| Machinery-Diversified 0.22% | | | | | | | | | | | | |
| CNH Industrial NV (United Kingdom)(b) | | 4.50% | | 8/15/2023 | | | 88,000 | | | | 87,465 | |
| Granite US Holdings Corp.† | | 11.00% | | 10/1/2027 | | | 105,000 | | | | 110,797 | |
| Westinghouse Air Brake Technologies Corp. | | 4.40% | | 3/15/2024 | | | 69,000 | | | | 67,910 | |
| Total | | | | | | | | | | | 266,172 | |
| | | | | | | | | | | | | |
| Media 0.49% | | | | | | | | | | | | |
| AMC Networks, Inc. | | 4.75% | | 8/1/2025 | | | 35,000 | | | | 26,661 | |
| AMC Networks, Inc. | | 5.00% | | 4/1/2024 | | | 139,000 | | | | 130,208 | |
| CCO Holdings LLC/CCO Holdings Capital Corp.† | | 4.00% | | 3/1/2023 | | | 181,000 | | | | 180,325 | |
| Comcast Corp. | | 5.35% | | 11/15/2027 | | | 62,000 | | | | 63,430 | |
| FactSet Research Systems, Inc. | | 2.90% | | 3/1/2027 | | | 61,000 | | | | 55,462 | |
| Univision Communications, Inc.† | | 5.125% | | 2/15/2025 | | | 133,000 | | | | 126,938 | |
| Total | | | | | | | | | | | 583,024 | |
| | | | | | | | | | | | | |
| Mining 1.37% | | | | | | | | | | | | |
| Alcoa Nederland Holding BV (Netherlands)†(b) | | 5.50% | | 12/15/2027 | | | 200,000 | | | | 193,076 | |
| Alcoa Nederland Holding BV (Netherlands)†(b) | | 6.125% | | 5/15/2028 | | | 200,000 | | | | 197,377 | |
| Anglo American Capital plc (United Kingdom)†(b) | | 3.625% | | 9/11/2024 | | | 200,000 | | | | 193,644 | |
| Freeport Indonesia PT (Indonesia)†(b) | | 4.763% | | 4/14/2027 | | | 200,000 | | | | 193,000 | |
| Freeport-McMoRan, Inc. | | 3.875% | | 3/15/2023 | | | 15,000 | | | | 14,984 | |
| Freeport-McMoRan, Inc. | | 4.55% | | 11/14/2024 | | | 236,000 | | | | 232,909 | |
| Glencore Funding LLC† | | 1.625% | | 4/27/2026 | | | 54,000 | | | | 47,642 | |
| Glencore Funding LLC† | | 4.00% | | 3/27/2027 | | | 63,000 | | | | 59,549 | |
| Glencore Funding LLC† | | 4.125% | | 5/30/2023 | | | 211,000 | | | | 209,925 | |
| Glencore Funding LLC† | | 4.125% | | 3/12/2024 | | | 140,000 | | | | 137,821 | |
| Glencore Funding LLC† | | 4.625% | | 4/29/2024 | | | 28,000 | | | | 27,647 | |
| Kinross Gold Corp. (Canada)(b) | | 5.95% | | 3/15/2024 | | | 129,000 | | | | 129,532 | |
| Total | | | | | | | | | | | 1,637,106 | |
| 24 | See Notes to Financial Statements. |
Schedule of Investments (continued)
December 31, 2022
| Investments | | Interest
Rate | | Maturity
Date | | Principal
Amount | | | Fair
Value | |
| Miscellaneous Manufacturing 0.06% | | | | | | | | | | | | |
| Parker-Hannifin Corp. | | 3.65% | | 6/15/2024 | | $ | 78,000 | | | $ | 76,363 | |
| | | | | | | | | | | | | |
| Oil & Gas 3.49% | | | | | | | | | | | | |
| Aker BP ASA (Norway)†(b) | | 2.00% | | 7/15/2026 | | | 200,000 | | | | 176,908 | |
| Callon Petroleum Co. | | 6.375% | | 7/1/2026 | | | 62,000 | | | | 57,885 | |
| Chord Energy Corp.† | | 6.375% | | 6/1/2026 | | | 94,000 | | | | 91,680 | |
| CNX Resources Corp.† | | 7.25% | | 3/14/2027 | | | 11,000 | | | | 10,936 | |
| Continental Resources, Inc.† | | 2.268% | | 11/15/2026 | | | 128,000 | | | | 111,073 | |
| Continental Resources, Inc. | | 3.80% | | 6/1/2024 | | | 241,000 | | | | 234,748 | |
| Continental Resources, Inc. | | 4.375% | | 1/15/2028 | | | 209,000 | | | | 191,839 | |
| Continental Resources, Inc. | | 4.50% | | 4/15/2023 | | | 245,000 | | | | 244,969 | |
| CrownRock LP/CrownRock Finance, Inc.† | | 5.625% | | 10/15/2025 | | | 234,000 | | | | 226,286 | |
| Devon Energy Corp. | | 5.25% | | 10/15/2027 | | | 225,000 | | | | 223,033 | |
| Devon Energy Corp. | | 8.25% | | 8/1/2023 | | | 110,000 | | | | 111,519 | |
| EQT Corp.† | | 3.125% | | 5/15/2026 | | | 124,000 | | | | 114,121 | |
| EQT Corp. | | 5.70% | | 4/1/2028 | | | 82,000 | | | | 81,670 | |
| EQT Corp. | | 6.125% | | 2/1/2025 | | | 215,000 | | | | 215,856 | |
| Gulfport Energy Corp.† | | 8.00% | | 5/17/2026 | | | 173,000 | | | | 168,896 | |
| Laredo Petroleum, Inc. | | 9.50% | | 1/15/2025 | | | 185,000 | | | | 182,632 | |
| Magnolia Oil & Gas Operating LLC/Magnolia Oil & Gas Finance Corp.† | | 6.00% | | 8/1/2026 | | | 222,000 | | | | 213,464 | |
| Matador Resources Co. | | 5.875% | | 9/15/2026 | | | 208,000 | | | | 200,287 | |
| Ovintiv Exploration, Inc. | | 5.375% | | 1/1/2026 | | | 250,000 | | | | 247,785 | |
| PDC Energy, Inc. | | 5.75% | | 5/15/2026 | | | 54,000 | | | | 51,635 | |
| PDC Energy, Inc. | | 6.125% | | 9/15/2024 | | | 29,000 | | | | 28,885 | |
| Petroleos Mexicanos (Mexico)(b) | | 3.50% | | 1/30/2023 | | | 175,000 | | | | 174,515 | |
| Petroleos Mexicanos (Mexico)(b) | | 6.875% | | 8/4/2026 | | | 236,000 | | | | 223,420 | |
| Suncor Energy, Inc. (Canada)(b) | | 7.875% | | 6/15/2026 | | | 103,000 | | | | 110,708 | |
| Tengizchevroil Finance Co. International Ltd. (Kazakhstan)†(b) | | 2.625% | | 8/15/2025 | | | 200,000 | | | | 171,952 | |
| Viper Energy Partners LP† | | 5.375% | | 11/1/2027 | | | 130,000 | | | | 123,660 | |
| W&T Offshore, Inc.† | | 9.75% | | 11/1/2023 | | | 172,000 | | | | 169,226 | |
| Total | | | | | | | | | | | 4,159,588 | |
| | | | | | | | | | | | | |
| Oil & Gas Services 0.15% | | | | | | | | | | | | |
| Oceaneering International, Inc. | | 4.65% | | 11/15/2024 | | | 67,000 | | | | 64,091 | |
| Weatherford International Ltd.† | | 11.00% | | 12/1/2024 | | | 108,000 | | | | 110,568 | |
| Total | | | | | | | | | | | 174,659 | |
| | See Notes to Financial Statements. | 25 |
Schedule of Investments (continued)
December 31, 2022
| Investments | | Interest
Rate | | Maturity
Date | | Principal
Amount | | | Fair
Value | |
| Pharmaceuticals 0.86% | | | | | | | | | | | | |
| Bayer US Finance II LLC† | | 3.875% | | 12/15/2023 | | $ | 200,000 | | | $ | 197,180 | |
| Bayer US Finance II LLC† | | 4.25% | | 12/15/2025 | | | 300,000 | | | | 291,009 | |
| Bayer US Finance II LLC† | | 5.779%
(3 Mo. LIBOR + 1.01% | )# | 12/15/2023 | | | 425,000 | | | | 424,140 | |
| CVS Health Corp. | | 4.30% | | 3/25/2028 | | | 119,000 | | | | 115,324 | |
| Total | | | | | | | | | | | 1,027,653 | |
| | | | | | | | | | | | | |
| Pipelines 1.31% | | | | | | | | | | | | |
| Buckeye Partners LP | | 3.95% | | 12/1/2026 | | | 181,000 | | | | 162,221 | |
| Cheniere Corpus Christi Holdings LLC | | 5.875% | | 3/31/2025 | | | 166,000 | | | | 167,122 | |
| DCP Midstream Operating LP | | 5.375% | | 7/15/2025 | | | 50,000 | | | | 49,617 | |
| Energy Transfer LP | | 4.25% | | 3/15/2023 | | | 225,000 | | | | 224,468 | |
| Energy Transfer LP | | 5.875% | | 1/15/2024 | | | 154,000 | | | | 154,436 | |
| Kinder Morgan, Inc. | | 5.359%
(3 Mo. LIBOR + 1.28% | )# | 1/15/2023 | | | 110,000 | | | | 109,999 | |
| NOVA Gas Transmission Ltd. (Canada)(b) | | 7.875% | | 4/1/2023 | | | 110,000 | | | | 110,483 | |
| ONEOK, Inc. | | 7.50% | | 9/1/2023 | | | 116,000 | | | | 117,313 | |
| Plains All American Pipeline LP/PAA Finance Corp. | | 3.60% | | 11/1/2024 | | | 94,000 | | | | 90,949 | |
| Sabine Pass Liquefaction LLC | | 5.75% | | 5/15/2024 | | | 150,000 | | | | 150,117 | |
| Targa Resources Partners LP/Targa Resources Partners Finance Corp. | | 6.50% | | 7/15/2027 | | | 173,000 | | | | 174,379 | |
| Western Midstream Operating LP | | 5.041%
(3 Mo. LIBOR + 1.10% | )# | 1/13/2023 | | | 51,000 | | | | 50,924 | |
| Total | | | | | | | | | | | 1,562,028 | |
| | | | | | | | | | | | | |
| Real Estate 0.20% | | | | | | | | | | | | |
| American Tower Corp. | | 3.60% | | 1/15/2028 | | | 261,000 | | | | 240,331 | |
| | | | | | | | | | | | | |
| REITS 1.37% | | | | | | | | | | | | |
| American Tower Corp. | | 1.60% | | 4/15/2026 | | | 202,000 | | | | 179,830 | |
| American Tower Corp. | | 3.65% | | 3/15/2027 | | | 101,000 | | | | 94,483 | |
| Brixmor Operating Partnership LP | | 3.65% | | 6/15/2024 | | | 113,000 | | | | 109,588 | |
| EPR Properties | | 4.50% | | 6/1/2027 | | | 77,000 | | | | 67,506 | |
| EPR Properties | | 4.75% | | 12/15/2026 | | | 206,000 | | | | 185,365 | |
| GLP Capital LP/GLP Financing II, Inc. | | 5.375% | | 11/1/2023 | | | 77,000 | | | | 76,858 | |
| HAT Holdings I LLC/HAT Holdings II LLC† | | 3.375% | | 6/15/2026 | | | 36,000 | | | | 31,327 | |
| HAT Holdings I LLC/HAT Holdings II LLC† | | 6.00% | | 4/15/2025 | | | 37,000 | | | | 35,890 | |
| Kite Realty Group Trust | | 4.00% | | 3/15/2025 | | | 72,000 | | | | 68,549 | |
| VICI Properties LP/VICI Note Co., Inc.† | | 3.50% | | 2/15/2025 | | | 189,000 | | | | 178,503 | |
| VICI Properties LP/VICI Note Co., Inc.† | | 3.75% | | 2/15/2027 | | | 78,000 | | | | 70,931 | |
| 26 | See Notes to Financial Statements. |
Schedule of Investments (continued)
December 31, 2022
| Investments | | Interest
Rate | | Maturity
Date | | Principal
Amount | | | Fair
Value | |
| REITS (continued) | | | | | | | | | | | | |
| VICI Properties LP/VICI Note Co., Inc.† | | 4.625% | | 6/15/2025 | | $ | 118,000 | | | $ | 113,286 | |
| VICI Properties LP/VICI Note Co., Inc.† | | 5.625% | | 5/1/2024 | | | 297,000 | | | | 294,664 | |
| Vornado Realty LP | | 2.15% | | 6/1/2026 | | | 46,000 | | | | 38,927 | |
| Vornado Realty LP | | 3.50% | | 1/15/2025 | | | 97,000 | | | | 90,564 | |
| Total | | | | | | | | | | | 1,636,271 | |
| | | | | | | | | | | | | |
| Retail 0.07% | | | | | | | | | | | | |
| Specialty Building Products Holdings LLC/SBP Finance Corp.† | | 6.375% | | 9/30/2026 | | | 107,000 | | | | 86,321 | |
| | | | | | | | | | | | | |
| Savings & Loans 0.17% | | | | | | | | | | | | |
| Nationwide Building Society (United Kingdom)†(b) | | 3.766%
(3 Mo. LIBOR + 1.06% | )# | 3/8/2024 | | | 200,000 | | | | 198,918 | |
| | | | | | | | | | | | | |
| Semiconductors 0.53% | | | | | | | | | | | | |
| Microchip Technology, Inc. | | 0.972% | | 2/15/2024 | | | 137,000 | | | | 130,158 | |
| Microchip Technology, Inc. | | 2.67% | | 9/1/2023 | | | 229,000 | | | | 224,790 | |
| Microchip Technology, Inc. | | 4.25% | | 9/1/2025 | | | 99,000 | | | | 96,203 | |
| Microchip Technology, Inc. | | 4.333% | | 6/1/2023 | | | 125,000 | | | | 124,487 | |
| Qorvo, Inc.† | | 1.75% | | 12/15/2024 | | | 58,000 | | | | 53,491 | |
| Total | | | | | | | | | | | 629,129 | |
| | | | | | | | | | | | | |
| Software 0.30% | | | | | | | | | | | | |
| Fidelity National Information Services, Inc. | | 4.50% | | 7/15/2025 | | | 53,000 | | | | 52,021 | |
| Oracle Corp. | | 2.30% | | 3/25/2028 | | | 150,000 | | | | 130,186 | |
| Oracle Corp. | | 2.50% | | 4/1/2025 | | | 27,000 | | | | 25,480 | |
| Oracle Corp. | | 5.80% | | 11/10/2025 | | | 64,000 | | | | 65,504 | |
| Take-Two Interactive Software, Inc. | | 3.30% | | 3/28/2024 | | | 72,000 | | | | 70,351 | |
| Take-Two Interactive Software, Inc. | | 3.55% | | 4/14/2025 | | | 8,000 | | | | 7,706 | |
| Total | | | | | | | | | | | 351,248 | |
| | | | | | | | | | | | | |
| Telecommunications 0.45% | | | | | | | | | | | | |
| Altice France SA (France)†(b) | | 8.125% | | 2/1/2027 | | | 225,000 | | | | 205,412 | |
| T-Mobile USA, Inc. | | 2.25% | | 2/15/2026 | | | 126,000 | | | | 114,850 | |
| T-Mobile USA, Inc. | | 3.75% | | 4/15/2027 | | | 70,000 | | | | 66,040 | |
| Verizon Communications, Inc. | | 2.10% | | 3/22/2028 | | | 174,000 | | | | 151,315 | |
| Total | | | | | | | | | | | 537,617 | |
| | See Notes to Financial Statements. | 27 |
Schedule of Investments (continued)
December 31, 2022
| Investments | | Interest
Rate | | Maturity
Date | | Principal
Amount | | | Fair
Value | |
| Trucking & Leasing 0.07% | | | | | | | | | | | | |
| Fortress Transportation and Infrastructure Investors LLC† | | 6.50% | | 10/1/2025 | | $ | 89,000 | | | $ | 83,834 | |
| Total Corporate Bonds (cost $59,091,572) | | | | | | | | | | | 56,712,137 | |
| | | | | | | | | | | | | |
| FLOATING RATE LOANS(c) 3.06% | | | | | | | | | | | | |
| | | | | | | | | | | | | |
| Commercial Services 0.23% | | | | | | | | | | | | |
| Moneygram International, Inc 2021 Term Loan B | | 8.884%
(1 Mo. LIBOR + 4.50% | ) | 7/21/2026 | | | 279,155 | | | | 279,023 | |
| | | | | | | | | | | | | |
| Diversified Financial Services 0.19% | | | | | | | | | | | | |
| Cowen Inc Term Loan B | | 8.399%
(6 Mo. LIBOR + 3.25% | ) | 3/24/2028 | | | 230,194 | | | | 230,194 | |
| | | | | | | | | | | | | |
| Electronics 0.15% | | | | | | | | | | | | |
| Maxar Technologies Ltd. 2022 Term Loan B | | – | (d) | 6/14/2029 | | | 179,549 | | | | 179,629 | |
| | | | | | | | | | | | | |
| Health Care Services 0.26% | | | | | | | | | | | | |
| WP CityMD Bidco LLC 2021 1st Lien Term Loan B | | 7.634%
(1 Mo. LIBOR + 3.25% | ) | 12/22/2028 | | | 306,699 | | | | 306,448 | |
| | | | | | | | | | | | | |
| Lodging 0.11% | | | | | | | | | | | | |
| Caesars Resort Collection, LLC 2017 1st Lien Term Loan B | | 7.134%
(1 Mo. LIBOR + 2.75% | ) | 12/23/2024 | | | 135,883 | | | | 135,752 | |
| | | | | | | | | | | | | |
| Media 0.60% | | | | | | | | | | | | |
| Charter Communications Operating, LLC 2019 Term Loan B1 | | 6.14%
(1 Mo. LIBOR + 1.75% | ) | 4/30/2025 | | | 714,546 | | | | 712,424 | |
| | | | | | | | | | | | | |
| Pharmaceuticals 0.25% | | | | | | | | | | | | |
| Horizon Therapeutics USA Inc. 2021 Term Loan B2 | | – | (d) | 3/15/2028 | | | 299,239 | | | | 299,319 | |
| | | | | | | | | | | | | |
| Real Estate Investment Trusts 0.63% | | | | | | | | | | | | |
| American Tower Corporation 2021 First Lien Delayed Draw Term loan | | 5.563%
(1 Mo. LIBOR + 1.13% | ) | 12/8/2023 | | | 134,564 | | | | 133,891 | |
| Invitation Homes Operating Partnership LP 2020 Term Loan A | | 5.389%
(3 Mo. LIBOR + 1.00% | ) | 1/31/2025 | | | 628,665 | | | | 617,663 | |
| Total | | | | | | | | | | | 751,554 | |
| | | | | | | | | | | | | |
| Software 0.20% | | | | | | | | | | | | |
| Signify Health, LLC 2021 Term Loan B | | – | (d) | 6/22/2028 | | | 236,451 | | | | 234,087 | |
| 28 | See Notes to Financial Statements. |
Schedule of Investments (continued)
December 31, 2022
| Investments | | Interest
Rate | | Maturity
Date | | Principal
Amount | | | Fair
Value | |
| Telecommunications 0.19% | | | | | | | | | | | | |
| CenturyLink, Inc. 2020 Term Loan A | | 6.384%
(1 Mo. LIBOR + 2.00% | ) | 1/31/2025 | | $ | 227,727 | | | $ | 223,126 | |
| | | | | | | | | | | | | |
| Transportation 0.25% | | | | | | | | | | | | |
| XPO Logistics, Inc. 2018 Term Loan B | | 5.935%
(1 Mo. LIBOR + 1.75% | ) | 2/24/2025 | | | 300,173 | | | | 299,211 | |
| Total Floating Rate Loans (cost $3,669,881) | | | | | | | | | | | 3,650,767 | |
| | | | | | | | | | | | | |
| GOVERNMENT SPONSORED ENTERPRISES COLLATERALIZED MORTGAGE OBLIGATIONS 0.07% | | | | | |
| Government National Mortgage Assoc. 2014-112 A | | 3.00% | #(e) | 1/16/2048 | | | 2,810 | | | | 2,532 | |
| Government National Mortgage Assoc. 2014-78 IO | | 0.007% | #(e) | 3/16/2056 | | | 10,912 | | | | 41 | |
| Government National Mortgage Assoc. 2017-23 AB | | 2.60% | | 12/16/2057 | | | 12,302 | | | | 11,006 | |
| Government National Mortgage Assoc. 2017-44 AD | | 2.65% | | 11/17/2048 | | | 10,095 | | | | 9,594 | |
| Government National Mortgage Assoc. 2017-53 B | | 2.75% | | 3/16/2050 | | | 29,958 | | | | 27,026 | |
| Government National Mortgage Assoc. 2017-61 A | | 2.60% | | 8/16/2058 | | | 15,152 | | | | 13,976 | |
| Government National Mortgage Assoc. 2017-76 AS | | 2.65% | | 11/16/2050 | | | 19,378 | | | | 17,177 | |
| Total Government Sponsored Enterprises Collateralized Mortgage Obligations (cost $89,396) | | | | | 81,352 | |
| | | | | | | | | | | | | |
| GOVERNMENT SPONSORED ENTERPRISES PASS-THROUGHS 0.54% | | | |
| Federal Home Loan Bank Discount Notes | | Zero Coupon | | 3/14/2023 | | | 594,000 | | | | 589,003 | |
| Federal Home Loan Mortgage Corp. | | 2.893%
(12 Mo. LIBOR + 1.84% | )# | 6/1/2042 | | | 1,767 | | | | 1,780 | |
| Federal Home Loan Mortgage Corp. | | 3.685%
(12 Mo. LIBOR + 1.80% | )# | 6/1/2041 | | | 4,213 | | | | 4,285 | |
| Federal Home Loan Mortgage Corp. | | 4.142%
(12 Mo. LIBOR + 1.89% | )# | 12/1/2040 | | | 2,372 | | | | 2,375 | |
| Federal National Mortgage Assoc. | | 2.509%
(12 Mo. LIBOR + 1.81% | )# | 4/1/2040 | | | 5,853 | | | | 5,930 | |
| Federal National Mortgage Assoc. | | 3.108%
(12 Mo. LIBOR + 1.78% | )# | 10/1/2036 | | | 9,872 | | | | 10,029 | |
| Federal National Mortgage Assoc. | | 3.711%
(12 Mo. LIBOR + 1.79% | )# | 3/1/2042 | | | 2,148 | | | | 2,181 | |
| Federal National Mortgage Assoc. | | 3.806%
(12 Mo. LIBOR + 1.72% | )# | 6/1/2042 | | | 1,971 | | | | 2,010 | |
| Federal National Mortgage Assoc. | | 3.863%
(12 Mo. LIBOR + 1.81% | )# | 12/1/2040 | | | 660 | | | | 671 | |
| | See Notes to Financial Statements. | 29 |
Schedule of Investments (continued)
December 31, 2022
| Investments | | Interest
Rate | | Maturity
Date | | Principal
Amount | | | Fair
Value | |
| GOVERNMENT SPONSORED ENTERPRISES PASS-THROUGHS (continued) | | | |
| Federal National Mortgage Assoc. | | 3.876%
(12 Mo. LIBOR + 1.60% | )# | 12/1/2045 | | $ | 1,765 | | | $ | 1,814 | |
| Federal National Mortgage Assoc. | | 4.014%
(12 Mo. LIBOR + 1.80% | )# | 10/1/2040 | | | 174 | | | | 177 | |
| Federal National Mortgage Assoc. | | 4.05%
(12 Mo. LIBOR + 1.81% | )# | 1/1/2042 | | | 10,241 | | | | 10,428 | |
| Federal National Mortgage Assoc. | | 4.062%
(12 Mo. LIBOR + 1.81% | )# | 12/1/2040 | | | 287 | | | | 291 | |
| Federal National Mortgage Assoc. | | 5.039%
(12 Mo. LIBOR + 1.60% | )# | 12/1/2045 | | | 6,465 | | | | 6,637 | |
| Federal National Mortgage Assoc. | | 5.481%
(12 Mo. LIBOR + 1.60% | )# | 10/1/2045 | | | 1,071 | | | | 1,103 | |
| Total Government Sponsored Enterprises Pass-Throughs (cost $639,711) | | | 638,714 | |
| | | | | | | | | | | | | |
| MUNICIPAL BONDS 0.02% | | | | | | | | | | | | |
| | | | | | | | | | | | | |
| Government | | | | | | | | | | | | |
State of Illinois IL GO
(cost $27,936) | | 4.95% | | 6/1/2023 | | | 27,818 | | | | 27,835 | |
| | | | | | | | | | | | | |
| NON-AGENCY COMMERCIAL MORTGAGE-BACKED SECURITIES 12.90% | | | |
| Atrium Hotel Portfolio Trust 2017-ATRM A† | | 5.498%
(1 Mo. LIBOR + .93% | )# | 12/15/2036 | | | 100,000 | | | | 97,410 | |
| Atrium Hotel Portfolio Trust 2018-ATRM B† | | 5.748%
(1 Mo. LIBOR + 1.43% | )# | 6/15/2035 | | | 100,000 | | | | 95,170 | |
| Atrium Hotel Portfolio Trust 2018-ATRM C† | | 5.968%
(1 Mo. LIBOR + 1.65% | )# | 6/15/2035 | | | 100,000 | | | | 94,195 | |
| Bayview MSR Opportunity Master Fund Trust 2021-INV4 A11† | | 4.371%
(1 Mo. SOFR + 0.85% | )# | 10/25/2051 | | | 372,937 | | | | 338,448 | |
| BBCMS Mortgage Trust 2018-TALL A† | | 5.04%
(1 Mo. LIBOR + .72% | )# | 3/15/2037 | | | 200,000 | | | | 185,160 | |
| BB-UBS Trust 2012-TFT A† | | 2.892% | | 6/5/2030 | | | 77,472 | | | | 75,421 | |
| BB-UBS Trust 2012-TFT B† | | 3.559% | #(e) | 6/5/2030 | | | 100,000 | | | | 90,166 | (a) |
| BB-UBS Trust 2012-TFT C† | | 3.559% | #(e) | 6/5/2030 | | | 100,000 | | | | 86,220 | |
| Benchmark 2019-B12 Mortgage Trust TCA† | | 3.44% | #(e) | 8/15/2052 | | | 203,000 | | | | 187,741 | |
| Benchmark 2019-B12 Mortgage Trust TCB† | | 3.44% | #(e) | 8/15/2052 | | | 225,000 | | | | 203,199 | |
| BFLD 2019-DPLO F† | | 6.858%
(1 Mo. LIBOR + 2.54% | )# | 10/15/2034 | | | 250,000 | | | | 235,446 | |
| BX Commercial Mortgage Trust 2019-XL A† | | 5.37%
(1 Mo. Term SOFR + 1.03% | )# | 10/15/2036 | | | 150,532 | | | | 148,779 | |
| BX Commercial Mortgage Trust 2021-ACNT A† | | 5.168%
(1 Mo. LIBOR + .85% | )# | 11/15/2038 | | | 240,000 | | | | 231,271 | |
| 30 | See Notes to Financial Statements. |
Schedule of Investments (continued)
December 31, 2022
| Investments | | Interest
Rate | | Maturity
Date | | Principal
Amount | | | Fair
Value | |
| NON-AGENCY COMMERCIAL MORTGAGE-BACKED SECURITIES (continued) | | | |
| BX Commercial Mortgage Trust 2021-XL2 A† | | 5.007%
(1 Mo. LIBOR + .69% | )# | 10/15/2038 | | $ | 528,228 | | | $ | 508,481 | |
| BX Trust 2021-ARIA E† | | 6.563%
(1 Mo. LIBOR + 2.24% | )# | 10/15/2036 | | | 390,000 | | | | 355,232 | |
| BX Trust 2022-LBA6 A† | 5.336%
(1 Mo. Term SOFR + 1.00% | )# | 1/15/2039 | | | 610,000 | | | | 590,384 | |
| BX Trust 2022-PSB A† | 6.787%
(1 Mo. Term SOFR + 2.45% | )# | 8/15/2039 | | | 474,510 | | | | 474,170 | |
| BXHPP Trust 2021-FILM A† | | 4.968%
(1 Mo. LIBOR + .65% | )# | 8/15/2036 | | | 280,000 | | | | 262,417 | |
| BXHPP Trust 2021-FILM B† | | 5.218%
(1 Mo. LIBOR + .90% | )# | 8/15/2036 | | | 290,000 | | | | 264,190 | |
| BXP Trust 2017-CQHP A† | | 5.168%
(1 Mo. LIBOR + .85% | )# | 11/15/2034 | | | 43,000 | | | | 41,207 | |
| CFCRE Commercial Mortgage Trust 2016-C6 XA | | 1.093% | #(e) | 11/10/2049 | | | 177,440 | | | | 5,649 | |
| CFCRE Commercial Mortgage Trust 2016-C7 XA | | 0.66% | #(e) | 12/10/2054 | | | 174,639 | | | | 3,756 | |
| CFCRE Commercial Mortgage Trust 2018-TAN A† | | 4.236% | | 2/15/2033 | | | 134,000 | | | | 132,809 | |
| Citigroup Commercial Mortgage Trust 2015-GC27 AAB | | 2.944% | | 2/10/2048 | | | 3,699 | | | | 3,609 | |
| Citigroup Commercial Mortgage Trust 2015-GC31 XA | | 0.336% | #(e) | 6/10/2048 | | | 876,538 | | | | 6,218 | |
| COMM 2014-UBS5 Mortgage Trust XB1† | | 0.095% | #(e) | 9/10/2047 | | | 2,000,000 | | | | 4,924 | |
| Commercial Mortgage Pass-Through Certificates 2012-CR3 B† | | 3.922% | | 10/15/2045 | | | 200,000 | | | | 174,957 | |
| Commercial Mortgage Pass-Through Certificates 2012-LTRT A2† | | 3.40% | | 10/5/2030 | | | 95,288 | | | | 81,969 | |
| Commercial Mortgage Pass-Through Certificates 2013-CR12 A3 | | 3.765% | | 10/10/2046 | | | 40,926 | | | | 40,461 | |
| Commercial Mortgage Pass-Through Certificates 2013-CR18 A5 | | 3.828% | | 7/15/2047 | | | 170,000 | | | | 165,012 | |
| Commercial Mortgage Pass-Through Certificates 2013-SFS A1† | | 1.873% | | 4/12/2035 | | | 7,731 | | | | 7,664 | |
| Commercial Mortgage Pass-Through Certificates 2014-CR19 A4 | | 3.532% | | 8/10/2047 | | | 20,561 | | | | 19,729 | |
| Commercial Mortgage Pass-Through Certificates 2014-UBS3 A4 | | 3.819% | | 6/10/2047 | | | 184,000 | | | | 178,712 | |
| Commercial Mortgage Pass-Through Certificates 2015-PC1 XA† | | 0.406% | #(e) | 7/10/2050 | | | 65,176 | | | | 494 | |
| Commercial Mortgage Pass-Through Certificates 2016-CD1 XA | | 1.367% | #(e) | 8/10/2049 | | | 46,451 | | | | 1,653 | |
| | See Notes to Financial Statements. | 31 |
Schedule of Investments (continued)
December 31, 2022
| Investments | | Interest
Rate | | Maturity
Date | | Principal
Amount | | | Fair
Value | |
| NON-AGENCY COMMERCIAL MORTGAGE-BACKED SECURITIES (continued) | | | |
| Connecticut Avenue Securities Trust 2022-R08 1M1† | | 6.478%
(1 Mo. SOFR + 2.55% | )# | 7/25/2042 | | $ | 278,485 | | | $ | 279,557 | |
| Credit Suisse Commercial Mortgage Securities Corp. 2017-MOON X† | | Zero Coupon | #(e) | 7/10/2034 | | | 28,539,482 | | | | 1,495 | |
| Credit Suisse Mortgage Capital Certificates 2019-ICE4 A† | | 5.298%
(1 Mo. LIBOR + .98% | )# | 5/15/2036 | | | 434,000 | | | | 429,464 | |
| Credit Suisse Mortgage Capital Certificates Trust 2014-USA X1† | | 0.54% | #(e) | 9/15/2037 | | | 978,382 | | | | 11,155 | |
| Credit Suisse Mortgage Capital Certificates Trust 2017-PFHP A† | | 5.268%
(1 Mo. LIBOR + .95% | )# | 12/15/2030 | | | 50,000 | | | | 48,035 | |
| Credit Suisse Mortgage Capital Certificates Trust 2021-ADV A† | | 5.718%
(1 Mo. LIBOR + 1.40% | )# | 7/15/2038 | | | 100,000 | | | | 94,131 | |
| Credit Suisse Mortgage Capital Certificates Trust 2021-NQM3 A1† | | 1.015% | #(e) | 4/25/2066 | | | 56,787 | | | | 44,925 | |
| CSAIL Commercial Mortgage Trust 2016-C6 XA | | 1.863% | #(e) | 1/15/2049 | | | 609,280 | | | | 28,608 | |
| DBGS Mortgage Trust 2021-W52 A† | | 5.713%
(1 Mo. LIBOR + 1.39% | )# | 10/15/2036 | | | 160,000 | | | | 150,654 | |
| DBGS Mortgage Trust 2021-W52 C† | | 6.618%
(1 Mo. LIBOR + 2.30% | )# | 10/15/2036 | | | 310,000 | | | | 277,273 | |
| DBJPM Mortgage Trust 2016-C3 XA | | 1.424% | #(e) | 8/10/2049 | | | 182,248 | | | | 7,097 | |
| DBWF Mortgage Trust 2015-LCM A1† | | 2.998% | | 6/10/2034 | | | 9,006 | | | | 8,290 | |
| DBWF Mortgage Trust 2016-85T XA† | | 0.014% | #(e) | 12/10/2036 | | | 3,140,000 | | | | 5,859 | |
| DBWF Mortgage Trust 2018-GLKS C† | | 6.189%
(1 Mo. LIBOR + 1.75% | )# | 12/19/2030 | | | 200,000 | | | | 191,991 | |
| EQUS Mortgage Trust 2021-EQAZ B† | | 5.418%
(1 Mo. LIBOR + 1.10% | )# | 10/15/2038 | | | 99,998 | | | | 95,682 | |
| EQUS Mortgage Trust 2021-EQAZ C† | | 5.668%
(1 Mo. LIBOR + 1.35% | )# | 10/15/2038 | | | 99,998 | | | | 95,208 | |
| Fontainebleau Miami Beach Trust 2019-FBLU A† | | 3.144% | | 12/10/2036 | | | 100,000 | | | | 93,460 | |
| Fontainebleau Miami Beach Trust 2019-FBLU B† | | 3.447% | | 12/10/2036 | | | 100,000 | | | | 93,338 | |
| Freddie Mac STACR REMIC Trust 2021-HQA3 M1† | | 4.778%
(1 Mo. SOFR + 0.85% | )# | 9/25/2041 | | | 110,031 | | | | 105,143 | |
| Freddie Mac STACR REMIC Trust 2022-DNA4 M1A† | | 6.128%
(1 Mo. SOFR + 2.20% | )# | 5/25/2042 | | | 258,563 | | | | 257,886 | |
| Freddie Mac STACR REMIC Trust 2022-HQA3 M1A† | | 6.228%
(1 Mo. SOFR + 2.30% | )# | 8/25/2042 | | | 239,359 | | | | 239,238 | |
| Great Wolf Trust 2019-WOLF C† | | 5.951%
(1 Mo. LIBOR + 1.63% | )# | 12/15/2036 | | | 300,000 | | | | 286,946 | |
| 32 | See Notes to Financial Statements. |
Schedule of Investments (continued)
December 31, 2022
| Investments | | Interest
Rate | | Maturity
Date | | Principal
Amount | | | Fair
Value | |
| NON-AGENCY COMMERCIAL MORTGAGE-BACKED SECURITIES (continued) | | | | |
| GS Mortgage Securities Corp Trust 2017-485L XB† | | 0.111% | #(e) | 2/10/2037 | | $ | 1,590,000 | | | $ | 8,940 | |
| GS Mortgage Securities Corp Trust 2022-ECI A† | | 6.531%
(1 Mo. Term SOFR + 2.19% | )# | 8/15/2039 | | | 470,000 | | | | 465,747 | |
| GS Mortgage Securities Corp. II 2012-BWTR A† | | 2.954% | | 11/5/2034 | | | 214,000 | | | | 187,560 | |
| GS Mortgage Securities Corp. II 2021-ARDN A† | | 5.568%
(1 Mo. LIBOR + 1.25% | )# | 11/15/2036 | | | 630,000 | | | | 610,997 | |
| GS Mortgage Securities Corp. Trust 2017-GPTX A† | | 2.856% | | 5/10/2034 | | | 100,000 | | | | 93,425 | |
| GS Mortgage Securities Corp. Trust 2018-RIVR A† | | 5.268%
(1 Mo. LIBOR + .95% | )# | 7/15/2035 | | | 99,828 | | | | 93,128 | |
| GS Mortgage Securities Corp. Trust 2019-SMP B† | | 5.818%
(1 Mo. LIBOR + 1.50% | )# | 8/15/2032 | | | 500,000 | | | | 484,279 | |
| GS Mortgage Securities Corp. Trust 2021-ROSS A† | | 5.468%
(1 Mo. LIBOR + 1.15% | )# | 5/15/2026 | | | 100,000 | | | | 93,707 | |
| GS Mortgage Securities Corp. Trust 2021-ROSS H† | | 10.218%
(1 Mo. LIBOR + 5.90% | )# | 5/15/2026 | | | 100,000 | | | | 82,389 | |
| GS Mortgage Securities Trust 2011-GC5 B† | | 5.154% | #(e) | 8/10/2044 | | | 107,000 | | | | 93,087 | |
| GS Mortgage Securities Trust 2013-G1 A2† | | 3.557% | #(e) | 4/10/2031 | | | 52,355 | | | | 52,032 | |
| GS Mortgage Securities Trust 2013-GCJ14 A5 | | 4.243% | | 8/10/2046 | | | 100,000 | | | | 99,026 | |
| GS Mortgage Securities Trust 2014-GC18 A4 | | 4.074% | | 1/10/2047 | | | 151,000 | | | | 147,802 | |
| GS Mortgage Securities Trust 2015-GS1 XB | | 0.18% | #(e) | 11/10/2048 | | | 1,082,000 | | | | 6,322 | |
| HMH Trust 2017-NSS A† | | 3.062% | | 7/5/2031 | | | 100,000 | | | | 94,400 | |
| HMH Trust 2017-NSS B† | | 3.343% | | 7/5/2031 | | | 100,000 | | | | 95,320 | |
| HMH Trust 2017-NSS C† | | 3.787% | | 7/5/2031 | | | 100,000 | | | | 94,300 | (a) |
| HMH Trust 2017-NSS D† | | 4.723% | | 7/5/2031 | | | 100,000 | | | | 93,313 | (a) |
| HONO Mortgage Trust 2021-LULU A† | | 5.468%
(1 Mo. LIBOR + 1.15% | )# | 10/15/2036 | | | 100,000 | | | | 95,408 | |
| Hudsons Bay Simon JV Trust 2015-HB7 B7† | | 4.666% | | 8/5/2034 | | | 179,000 | | | | 150,993 | |
| Hudsons Bay Simon JV Trust 2015-HB7 XA7† | | 1.245% | #(e) | 8/5/2034 | | | 1,000,000 | | | | 138 | |
| Irvine Core Office Trust 2013-IRV A1† | | 2.068% | | 5/15/2048 | | | 2,011 | | | | 1,999 | |
| Irvine Core Office Trust 2013-IRV A2† | | 3.173% | #(e) | 5/15/2048 | | | 27,000 | | | | 26,693 | |
| | See Notes to Financial Statements. | 33 |
Schedule of Investments (continued)
December 31, 2022
| Investments | | Interest
Rate | | Maturity
Date | | Principal
Amount | | | Fair
Value | |
| NON-AGENCY COMMERCIAL MORTGAGE-BACKED SECURITIES (continued) | | | |
| JP Morgan Chase Commercial Mortgage Securities Trust 2020-MKST E† | | 6.818%
(1 Mo. LIBOR + 2.25% | )# | 12/15/2036 | | $ | 420,000 | | | $ | 334,567 | |
| JPMBB Commercial Mortgage Securities Trust 2015-C30 XA | | 0.433% | #(e) | 7/15/2048 | | | 711,938 | | | | 6,568 | |
| JPMorgan Chase Commercial Mortgage Securities Trust 2014-C26 XA | | 0.934% | #(e) | 1/15/2048 | | | 621,559 | | | | 8,292 | |
| JPMorgan Chase Commercial Mortgage Securities Trust 2014-DSTY A† | | 3.429% | | 6/10/2027 | | | 200,000 | | | | 92,833 | |
| JPMorgan Chase Commercial Mortgage Securities Trust 2016-JP4 XA | | 0.587% | #(e) | 12/15/2049 | | | 782,919 | | | | 13,419 | |
| JPMorgan Chase Commercial Mortgage Securities Trust 2017-JP7 XA | | 0.988% | #(e) | 9/15/2050 | | | 888,277 | | | | 28,513 | |
| JPMorgan Chase Commercial Mortgage Securities Trust 2018-BCON A† | | 3.735% | | 1/5/2031 | | | 243,000 | | | | 242,785 | |
| JPMorgan Chase Commercial Mortgage Securities Trust 2018-PTC A† | | 5.768%
(1 Mo. LIBOR + 1.45% | )# | 4/15/2031 | | | 90,000 | | | | 81,665 | |
| JPMorgan Chase Commercial Mortgage Securities Trust 2018-PTC B† | | 6.468%
(1 Mo. LIBOR + 2.15% | )# | 4/15/2031 | | | 24,000 | | | | 21,590 | |
| JPMorgan Chase Commercial Mortgage Securities Trust 2018-PTC C† | | 6.868%
(1 Mo. LIBOR + 2.55% | )# | 4/15/2031 | | | 18,000 | | | | 15,907 | |
| JPMorgan Chase Commercial Mortgage Securities Trust 2019-ICON XA† | | 1.336% | #(e) | 1/5/2034 | | | 3,332,000 | | | | 28,489 | |
| JPMorgan Chase Commercial Mortgage Securities Trust 2020-ACE XA† | | 0.344% | #(e) | 1/10/2037 | | | 9,368,548 | | | | 67,465 | |
| KIND Trust 2021-KIND A† | | 5.268%
(1 Mo. LIBOR + .95% | )# | 8/15/2038 | | | 158,852 | | | | 150,350 | |
| KKR Industrial Portfolio Trust 2021-KDIP A† | | 4.868%
(1 Mo. LIBOR + .55% | )# | 12/15/2037 | | | 31,244 | | | | 30,222 | |
| Life Mortgage Trust 2022-BMR2 A1† | | 5.631%
(1 Mo. Term SOFR + 1.30% | )# | 5/15/2039 | | | 260,000 | | | | 253,956 | |
| LoanCore Issuer Ltd. 2019-CRE3 AS† | | 5.688%
(1 Mo. LIBOR + 1.37% | )# | 4/15/2034 | | | 36,145 | | | | 36,133 | |
| LSTAR Commercial Mortgage Trust 2016-4 XA† | | 1.697% | #(e) | 3/10/2049 | | | 542,724 | | | | 11,531 | |
| LSTAR Commercial Mortgage Trust 2017-5 A3† | | 4.50% | | 3/10/2050 | | | 75,658 | | | | 75,645 | |
| Morgan Stanley Bank of America Merrill Lynch Trust 2012-CKSV A2† | | 3.277% | | 10/15/2030 | | | 97,564 | | | | 79,559 | |
| Morgan Stanley Bank of America Merrill Lynch Trust 2013-C11 A4 | | 4.198% | #(e) | 8/15/2046 | | | 139,000 | | | | 137,019 | |
| 34 | See Notes to Financial Statements. |
Schedule of Investments (continued)
December 31, 2022
| Investments | | Interest
Rate | | Maturity
Date | | Principal
Amount | | | Fair
Value | |
| NON-AGENCY COMMERCIAL MORTGAGE-BACKED SECURITIES (continued) | | | |
| Morgan Stanley Bank of America Merrill Lynch Trust 2015-C23 XA | | 0.554% | #(e) | 7/15/2050 | | $ | 359,964 | | | $ | 3,814 | |
| Morgan Stanley Bank of America Merrill Lynch Trust 2016-C31 XA | | 1.274% | #(e) | 11/15/2049 | | | 813,047 | | | | 29,449 | |
| Morgan Stanley Capital I Trust 2015-UBS8 ASB | | 3.626% | | 12/15/2048 | | | 6,776 | | | | 6,578 | |
| Morgan Stanley Capital I Trust 2016-UB11 XB | | 0.883% | #(e) | 8/15/2049 | | | 1,000,000 | | | | 28,258 | |
| MSCG Trust 2015-ALDR A1† | | 2.612% | | 6/7/2035 | | | 7,067 | | | | 6,666 | |
| MTN Commercial Mortgage Trust 2022-LPFL A† | | 5.733%
(1 Mo. Term SOFR + 1.40% | )# | 3/15/2039 | | | 300,000 | | | | 292,546 | |
| NYO Commercial Mortgage Trust 2021-1290 A† | | 5.413%
(1 Mo. LIBOR + 1.10% | )# | 11/15/2038 | | | 360,000 | | | | 327,389 | |
| One New York Plaza Trust 2020-1NYP A† | | 5.268%
(1 Mo. LIBOR + .95% | )# | 1/15/2036 | | | 100,000 | | | | 94,530 | |
| One New York Plaza Trust 2020-1NYP AJ† | | 5.568%
(1 Mo. LIBOR + 1.25% | )# | 1/15/2036 | | | 120,000 | | | | 112,293 | |
| Palisades Center Trust 2016-PLSD A† | | 2.713% | | 4/13/2033 | | | 10,000 | | | | 6,700 | |
| Palisades Center Trust 2016-PLSD D† | | 4.737% | | 4/13/2033 | | | 77,000 | | | | 12,128 | |
| PFP Ltd. 2021-7 A† | | 5.168%
(1 Mo. LIBOR + .85% | )# | 4/14/2038 | | | 87,790 | | | | 86,242 | |
| RBS Commercial Funding, Inc. Trust 2013-SMV A† | | 3.26% | | 3/11/2031 | | | 100,000 | | | | 99,404 | |
| Ready Capital Mortgage Financing LLC 2021-FL6 A† | | 5.339%
(1 Mo. LIBOR + .95% | )# | 7/25/2036 | | | 133,749 | | | | 127,993 | |
| SFO Commercial Mortgage Trust 2021-555 A† | | 5.468%
(1 Mo. LIBOR + 1.15% | )# | 5/15/2038 | | | 110,000 | | | | 101,117 | |
| SG Commercial Mortgage Securities Trust 2019-787E X† | | 0.305% | #(e) | 2/15/2041 | | | 4,149,000 | | | | 76,751 | |
| Shops at Crystals Trust 2016-CSTL XB† | | 0.203% | #(e) | 7/5/2036 | | | 1,000,000 | | | | 7,121 | |
| SLIDE 2018-FUN XCP† | | 0.976% | #(e) | 12/15/2020 | | | 1,508,151 | | | | 15 | |
| SMRT 2022-MINI A† | | 5.336%
(1 Mo. Term SOFR + 1.00% | )# | 1/15/2039 | | | 610,000 | | | | 589,637 | |
| UBS-BAMLL Trust 2012-WRM D† | | 4.238% | #(e) | 6/10/2030 | | | 100,000 | | | | 90,473 | (a) |
| UBS-Barclays Commercial Mortgage Trust 2013-C5 XA† | | 0.775% | #(e) | 3/10/2046 | | | 105,230 | | | | 2 | |
| Verus Securitization Trust 2020-4 A1† | | 1.502% | | 5/25/2065 | | | 26,989 | | | | 24,184 | |
| Verus Securitization Trust 2021-R2 A1† | | 0.918% | #(e) | 2/25/2064 | | | 36,056 | | | | 32,852 | |
| Verus Securitization Trust 2021-R3 A1† | | 1.02% | #(e) | 4/25/2064 | | | 48,564 | | | | 42,088 | |
| | See Notes to Financial Statements. | 35 |
Schedule of Investments (continued)
December 31, 2022
| Investments | | Interest
Rate | | Maturity
Date | | Principal
Amount | | | Fair
Value | |
| NON-AGENCY COMMERCIAL MORTGAGE-BACKED SECURITIES (continued) | | | |
| Wells Fargo Commercial Mortgage Trust 2015-C29 XB | | 0.014% | #(e) | 6/15/2048 | | $ | 2,000,000 | | | $ | 2,328 | |
| Wells Fargo Commercial Mortgage Trust 2015-SG1 XA | | 0.655% | #(e) | 9/15/2048 | | | 824,774 | | | | 11,132 | |
| Wells Fargo Commercial Mortgage Trust 2016-BNK1 XA | | 1.716% | #(e) | 8/15/2049 | | | 911,551 | | | | 42,787 | |
| Total Non-Agency Commercial Mortgage-Backed Securities (cost $16,460,132) | | | 15,379,748 | |
| | | | | | | | | | | | | |
| U.S. TREASURY OBLIGATIONS 2.21% | | | | | | | | | | | | |
| U.S. Treasury Note | | 3.875% | | 11/30/2027 | | | 1,357,000 | | | | 1,349,791 | |
| U.S. Treasury Note | | 3.875% | | 12/31/2027 | | | 1,291,000 | | | | 1,283,738 | |
| Total U.S. Treasury Obligations (cost $2,635,292) | | | | | | | | | | | 2,633,529 | |
| Total Long-Term Investments (cost $113,884,196) | | | | | | | | | | | 109,517,946 | |
| | | | | | | | | | | | | |
| SHORT-TERM INVESTMENTS 7.35% | | | | | | | | | | | | |
| | | | | | | | | | | | | |
| COMMERCIAL PAPER 2.02% | | | | | | | | | | | | |
| | | | | | | | | | | | | |
| Beverages 0.21% | | | | | | | | | | | | |
| Constellation Brands, Inc. | | 5.009% | | 1/4/2023 | | | 250,000 | | | | 249,897 | |
| | | | | | | | | | | | | |
| Electric 0.34% | | | | | | | | | | | | |
| Electricite de France SA | | 4.871% | | 1/5/2023 | | | 404,000 | | | | 403,785 | |
| | | | | | | | | | | | | |
| Electronics 0.43% | | | | | | | | | | | | |
| JABIL, Inc. | | 5.339% | | 1/9/2023 | | | 250,000 | | | | 249,706 | |
| JABIL, Inc. | | 5.339% | | 1/9/2023 | | | 267,000 | | | | 266,691 | |
| Total | | | | | | | | | | | 516,397 | |
| | | | | | | | | | | | | |
| Health Care-Services 0.72% | | | | | | | | | | | | |
| CATHOLIC HLTH INTS | | 5.503% | | 1/24/2023 | | | 866,000 | | | | 863,012 | |
| | | | | | | | | | | | | |
| Home Furnishings 0.32% | | | | | | | | | | | | |
| Leggett & Platt, Inc. | | 4.697% | | 1/3/2023 | | | 375,000 | | | | 374,904 | |
| Total Commercial Paper (cost $2,407,995) | | | | | | | | | | | 2,407,995 | |
| | | | | | | | | | | | | |
| U.S. TREASURY OBLIGATIONS 3.54% | | | | | | | | | | | | |
| U.S. Treasury Bill | | 4.51% | | 4/11/2023 | | | 2,269,000 | | | | 2,242,131 | |
| U.S. Treasury Bill | | 4.23% | | 2/21/2023 | | | 1,981,000 | | | | 1,969,806 | |
| Total U.S. Treasury Obligations (cost $4,210,825) | | | | | | | | | | | 4,211,937 | |
| 36 | See Notes to Financial Statements. |
Schedule of Investments (continued)
December 31, 2022
| Investments | | Principal
Amount | | | Fair
Value | |
| REPURCHASE AGREEMENTS 1.79% | | | | | | | | |
Repurchase Agreement dated 12/30/2022, 2.050% due 1/3/2023 with Fixed Income Clearing Corp. collateralized by $2,169,000 of U.S. Treasury Note at 4.275% due 4/30/2024; value: $2,179,533; proceeds: $2,137,215
(cost $2,136,729) | | | $2,136,729 | | | $ | 2,136,729 | |
| Total Short-Term Investments (cost $8,755,549) | | | | | | | 8,756,661 | |
| Total Investments in Securities 99.24% (cost $122,639,745) | | | | | | | 118,274,607 | |
| Other Assets and Liabilities – Net(f) 0.76% | | | | | | | 905,451 | |
| Net Assets 100.00% | | | | | | $ | 119,180,058 | |
| CMT | Constant Maturity Rate. |
| ICE | Intercontinental Exchange. |
| IO | Interest Only. |
| LIBOR | London Interbank Offered Rate. |
| REITS | Real Estate Investment Trusts. |
| SOFR | Secured Overnight Financing Rate. |
| † | | Security was purchased pursuant to Rule 144A under the Securities Act of 1933 and, unless registered under such Act or exempted from registration, may only be resold to qualified institutional buyers. At December 31, 2022, the total value of Rule 144A securities was $57,597,563, which represents 48.33% of net assets. |
| # | | Variable rate security. The interest rate represents the rate in effect at December 31, 2022. |
| (a) | | Level 3 Investment as described in Note 2(o) in the Notes to Financials. Security valued utilizing third party pricing information without adjustment. Such valuations are based on unobservable inputs. A significant change in third party information could result in a significantly lower or higher value of such Level 3 investments. |
| (b) | | Foreign security traded in U.S. dollars. |
| (c) | | Floating Rate Loans in which the Fund invests generally pay interest at rates which are periodically re-determined at a margin above the London Interbank Offered Rate (“LIBOR”) or the prime rate offered by major U.S. banks. The rate(s) shown is the rate(s) in effect at December 31, 2022. |
| (d) | | Interest Rate to be determined. |
| (e) | | Interest rate is based on the weighted average interest rates of the underlying mortgages within the mortgage pool. |
| (f) | | Other Assets and Liabilities - Net include net unrealized appreciation/depreciation on futures contracts and swaps as follows: |
Centrally Cleared Consumer Price Index (“CPI”) Swaps at December 31, 2022:
Swap
Counterparty | | Payments to be
Made By
The Fund at
Termination Date | | Payments to be
Received By
The Fund at
Termination Date | | Termination
Date | | Notional
Amount | | | Value/Unrealized
Appreciation | |
| Goldman Sachs | | 2.399% | | CPI Urban Consumer NSA | | 10/4/2023 | | $ | 602,340 | | | | $ | 2,205 | |
| Goldman Sachs | | 4.145% | | CPI Urban Consumer NSA | | 4/15/2024 | | | 581,000 | | | | | 1,626 | |
| Total Unrealized Appreciation on Centrally Cleared CPI Swaps | | | | | | | | $ | 3,831 | |
| | See Notes to Financial Statements. | 37 |
Schedule of Investments (concluded)
December 31, 2022
Futures Contracts at December 31, 2022:
| Type | | Expiration | | Contracts | | Position | | Notional
Amount | | | Notional
Value | | | Unrealized
Appreciation | |
| U.S. 2-Year Treasury Notes | | March 2023 | | 246 | | Long | | | $50,389,087 | | | | $50,449,219 | | | | $ | 60,132 | |
| U.S. 5-Year Treasury Notes | | March 2023 | | 83 | | Short | | | (8,976,470 | ) | | | (8,958,164 | ) | | | | 18,306 | |
| Total Unrealized Appreciation on Futures Contracts | | | | | | | | | | | $ | 78,438 | |
The following is a summary of the inputs used as of December 31, 2022 in valuing the Fund’s investments carried at fair value(1):
| Investment Type(2) | | Level 1 | | | Level 2 | | | Level 3 | | | Total | |
| Long-Term Investments | | | | | | | | | | | | | | | | |
| Asset-Backed Securities | | $ | – | | | $ | 30,393,818 | | | $ | – | | | $ | 30,393,818 | |
| Common Stocks | | | – | | | | – | | | | 46 | | | | 46 | |
| Corporate Bonds | | | – | | | | 56,712,137 | | | | – | | | | 56,712,137 | |
| Floating Rate Loans | | | – | | | | 3,650,767 | | | | – | | | | 3,650,767 | |
| Government Sponsored Enterprises Collateralized Mortgage Obligations | | | – | | | | 81,352 | | | | – | | | | 81,352 | |
| Government Sponsored Enterprises Pass-Throughs | | | – | | | | 638,714 | | | | – | | | | 638,714 | |
| Municipal Bonds | | | – | | | | 27,835 | | | | – | | | | 27,835 | |
| Non-Agency Commercial Mortgage-Backed Securities | | | – | | | | 15,011,496 | | | | 368,252 | | | | 15,379,748 | |
| U.S. Treasury Obligations | | | – | | | | 2,633,529 | | | | – | | | | 2,633,529 | |
| Short-Term Investments | | | | | | | | | | | | | | | | |
| Commercial Paper | | | – | | | | 2,407,995 | | | | – | | | | 2,407,995 | |
| U.S. Treasury Obligations | | | – | | | | 4,211,937 | | | | – | | | | 4,211,937 | |
| Repurchase Agreements | | | – | | | | 2,136,729 | | | | – | | | | 2,136,729 | |
| Total | | $ | – | | | $ | 117,906,309 | | | $ | 368,298 | | | $ | 118,274,607 | |
| Other Financial Instruments | | | | | | | | | | | | | | | | |
| Centrally Cleared CPI Swap Contracts | | | | | | | | | | | | | | | | |
| Assets | | $ | – | | | $ | 3,831 | | | $ | – | | | $ | 3,831 | |
| Liabilities | | | – | | | | – | | | | – | | | | – | |
| Futures Contracts | | | | | | | | | | | | | | | | |
| Assets | | | 78,438 | | | | – | | | | – | | | | 78,438 | |
| Liabilities | | | – | | | | – | | | | – | | | | – | |
| Total | | $ | 78,438 | | | $ | 3,831 | | | $ | – | | | $ | 82,269 | |
| (1) | | Refer to Note 2(o) for a description of fair value measurements and the three-tier hierarchy of inputs. |
| (2) | | See Schedule of Investments for fair values in each industry and identification of foreign issuers and/or geography. The table above is presented by Investment Type. Industries are presented within an Investment Type should such Investment Type include securities classified as two or more levels within the three-tier fair value hierarchy. When applicable, each Level 3 security is identified on the Schedule of Investments along with the valuation technique utilized. |
A reconciliation of Level 3 investments is presented when the Fund has a material amount of Level 3 investments at the beginning or end of the year in relation to the Fund’s net assets. Management has determined not to provide a reconciliation as the balance of Level 3 investments was not considered to be material to the Fund’s net assets at the beginning or end of the year.
| 38 | See Notes to Financial Statements. |
Statement of Assets and Liabilities
December 31, 2022
| ASSETS: | | | |
| Investments in securities, at fair value (cost $122,639,745) | | | $118,274,607 | |
| Cash | | | 499,023 | |
| Deposits with brokers for futures collateral | | | 278,128 | |
| Receivables: | | | | |
| Investment securities sold | | | 1,627,934 | |
| Interest | | | 816,257 | |
| Capital shares sold | | | 44,724 | |
| Variation margin for centrally cleared swap agreements | | | 1,027 | |
| Prepaid expenses | | | 350 | |
| Total assets | | | 121,542,050 | |
| LIABILITIES: | | | | |
| Payables: | | | | |
| Investment securities purchased | | | 2,022,932 | |
| Transfer agent fees | | | 175,145 | |
| Capital shares reacquired | | | 46,716 | |
| Management fee | | | 35,019 | |
| Variation margin for futures contracts | | | 19,048 | |
| Directors’ fees | | | 8,309 | |
| Fund administration | | | 4,002 | |
| Accrued expenses | | | 50,821 | |
| Total liabilities | | | 2,361,992 | |
| NET ASSETS | | | $119,180,058 | |
| COMPOSITION OF NET ASSETS: | | | | |
| Paid-in capital | | | $133,772,161 | |
| Total distributable earnings (loss) | | | (14,592,103 | ) |
| Net Assets | | | $119,180,058 | |
| Outstanding shares (200 million shares of common stock authorized, $.001 par value) | | | 9,173,126 | |
| Net asset value, offering and redemption price per share (Net assets divided by outstanding shares) | | | $12.99 | |
| | | |
| | See Notes to Financial Statements. | 39 |
Statement of Operations
For the Year Ended December 31, 2022
| Investment income: | | | |
| Interest and other | | $ | 3,525,580 | |
| Expenses: | | | | |
| Management fee | | | 418,295 | |
| Non 12b-1 service fees | | | 298,786 | |
| Shareholder servicing | | | 138,945 | |
| Professional | | | 52,041 | |
| Fund administration | | | 47,805 | |
| Reports to shareholders | | | 19,108 | |
| Custody | | | 12,014 | |
| Directors’ fees | | | 2,132 | |
| Other | | | 17,785 | |
| Gross expenses | | | 1,006,911 | |
| Expense reductions (See Note 9) | | | (1,552 | ) |
| Fees waived and expenses reimbursed (See Note 3) | | | (12,014 | ) |
| Net expenses | | | 993,345 | |
| Net investment income | | | 2,532,235 | |
| Net realized and unrealized gain (loss): | | | | |
| Net realized gain (loss) on investments | | | (1,844,784 | ) |
| Net realized gain (loss) on futures contracts | | | (2,536,170 | ) |
| Net realized gain (loss) on swap contracts | | | (23,148 | ) |
| Net change in unrealized appreciation/depreciation on investments | | | (4,426,733 | ) |
| Net change in unrealized appreciation/depreciation on futures contracts | | | 117,529 | |
| Net change in unrealized appreciation/depreciation on swap contracts | | | 3,831 | |
| Net realized and unrealized gain (loss) | | | (8,709,475 | ) |
| Net Decrease in Net Assets Resulting From Operations | | $ | (6,177,240 | ) |
| | |
| 40 | See Notes to Financial Statements. |
Statements of Changes in Net Assets
For the Year Ended December 31, 2022
| INCREASE (DECREASE) IN NET ASSETS | | For the Year Ended
December 31, 2022 | | | For the Year Ended
December 31, 2021 | |
| Operations: | | | | | | | | |
| Net investment income | | $ | 2,532,235 | | | $ | 1,600,363 | |
| Net realized gain (loss) on investments, futures contracts and swaps | | | (4,404,102 | ) | | | 702,485 | |
| Net change in unrealized appreciation/depreciation on investments, futures contracts and swaps | | | (4,305,373 | ) | | | (1,609,810 | ) |
| Net increase (decrease) in net assets resulting from operations | | | (6,177,240 | ) | | | 693,038 | |
| Distributions to shareholders: | | | (3,457,341 | ) | | | (2,684,842 | ) |
| Capital share transactions (See Note 15): | | | | | | | | |
| Net proceeds from sales of shares | | | 47,716,359 | | | | 47,706,154 | |
| Reinvestment of distributions | | | 3,457,341 | | | | 2,684,842 | |
| Cost of shares reacquired | | | (42,918,177 | ) | | | (35,940,692 | ) |
| Net increase in net assets resulting from capital share transactions | | | 8,255,523 | | | | 14,450,304 | |
| Net increase (decrease) in net assets | | | (1,379,058 | ) | | | 12,458,500 | |
| NET ASSETS: | | | | | | | | |
| Beginning of year | | $ | 120,559,116 | | | $ | 108,100,616 | |
| End of year | | $ | 119,180,058 | | | $ | 120,559,116 | |
| | | |
| | See Notes to Financial Statements. | 41 |
Financial Highlights
| | | | | Per Share Operating Performance: | | |
| | | | | Investment Operations: | | Distributions
to
shareholders
from: | | |
| | | Net asset
value,
beginning
of period | | Net
investment
income(a) | | Net
realized
and
unrealized
gain (loss) | | Total
from
investment
operations | | Net
investment
income | | Net
asset
value,
end of
period |
| 12/31/2022 | | $ | 14.09 | | | $ | 0.29 | | | $ | (1.00 | ) | | $ | (0.71 | ) | | $ | (0.39 | ) | | $ | 12.99 | |
| 12/31/2021 | | | 14.31 | | | | 0.20 | | | | (0.10 | ) | | | 0.10 | | | | (0.32 | ) | | | 14.09 | |
| 12/31/2020 | | | 14.27 | | | | 0.29 | | | | 0.15 | | | | 0.44 | | | | (0.40 | ) | | | 14.31 | |
| 12/31/2019 | | | 14.05 | | | | 0.38 | | | | 0.33 | | | | 0.71 | | | | (0.49 | ) | | | 14.27 | |
| 12/31/2018 | | | 14.38 | | | | 0.36 | | | | (0.20 | ) | | | 0.16 | | | | (0.49 | ) | | | 14.05 | |
| | |
| (a) | Calculated based on average shares outstanding during the period. |
| (b) | Total return does not consider the effects of sales charges or other expenses imposed by an insurance company and assumes the reinvestment of all distributions. |
| | |
| 42 | See Notes to Financial Statements. |
| | | Ratios to Average Net Assets: | | Supplemental Data: | |
Total
return(b)
(%) | | Total expenses
after waivers
and/or
reimbursements
(%) | | Total
expenses
(%) | | Net
investment
income
(%) | | Net
assets,
end of
period
(000) | | Portfolio
turnover
rate
(%) | |
| | (5.06 | ) | | | 0.83 | | | | 0.84 | | | | 2.12 | | | $ | 119,180 | | | | 71 | | |
| | 0.63 | | | | 0.81 | | | | 0.83 | | | | 1.40 | | | | 120,559 | | | | 66 | | |
| | 3.13 | | | | 0.84 | | | | 0.86 | | | | 2.04 | | | | 108,101 | | | | 79 | | |
| | 5.06 | | | | 0.88 | | | | 0.90 | | | | 2.66 | | | | 100,107 | | | | 56 | | |
| | 1.15 | | | | 0.83 | | | | 0.92 | | | | 2.48 | | | | 79,197 | | | | 65 | | |
| | | |
| | See Notes to Financial Statements. | 43 |
Notes to Financial Statements
Lord Abbett Series Fund, Inc. (the “Company”) is registered under the Investment Company Act of 1940, as amended (the “Act”), as a diversified, open-end management investment company and was incorporated under Maryland law in 1989. The Company consists of nine separate portfolios as of December 31, 2022. This report covers Short Duration Income Portfolio (the “Fund”).
The Fund’s investment objective is to seek a high level of income consistent with preservation of capital. The Fund has Variable Contract class shares (“Class VC Shares”), which are currently issued and redeemed only in connection with investments in, and payments under, variable annuity contracts and variable life insurance policies issued by life insurance and insurance-related companies.
The preparation of the financial statements in conformity with accounting principles generally accepted in the United States of America (“U.S. GAAP”) requires management to make certain estimates and assumptions that affect the reported amounts of assets and liabilities and disclosure of contingent assets and liabilities at the date of the financial statements and the reported amounts of increases and decreases in net assets from operations during the reporting period. Actual results could differ from those estimates. The Fund is considered an investment company under U.S. GAAP and follows the accounting and reporting guidance applicable to investment companies.
| 2. | SIGNIFICANT ACCOUNTING POLICIES |
| (a) | Investment Valuation–Under procedures approved by the Fund’s Board of Directors (the “Board”), the Board has designated the determination of fair value of the Fund’s portfolio investments to Lord, Abbett & Co. LLC (“Lord Abbett”), as its valuation designee. Accordingly, Lord Abbett is responsible for, among other things, assessing and managing valuation risks, establishing, applying and testing fair value methodologies, and evaluating pricing services. Lord Abbett has formed a Pricing Committee that performs these responsibilities on behalf of Lord Abbett, administers the pricing and valuation of portfolio investments and ensures that prices utilized reasonably reflect fair value. Among other things, these procedures allow Lord Abbett, subject to Board oversight, to utilize independent pricing services, quotations from securities and financial instrument dealers and other market sources to determine fair value. |
| | |
| | Securities actively traded on any recognized U.S. or non-U.S. exchange or on The NASDAQ Stock Market LLC are valued at the last sale price or official closing price on the exchange or system on which they are principally traded. Events occurring after the close of trading on non-U.S. exchanges may result in adjustments to the valuation of foreign securities to reflect their fair value as of the close of regular trading on the New York Stock Exchange. When valuing foreign equity securities that meet certain criteria, the Board has approved the use of an independent fair valuation service that values such securities to reflect market trading that occurs after the close of the applicable foreign markets of comparable securities or other instruments that correlate to the fair-valued securities. Unlisted equity securities are valued at the last quoted sale price or, if no sale price is available, at the mean between the most recently quoted bid and ask prices. Exchange traded options and futures contracts are valued at the last quoted sale price in the market where they are principally traded. If no sale has occurred, the mean between the most recently quoted bid and ask prices is used. Fixed income securities are valued based on evaluated prices supplied by independent pricing services, which reflect broker/dealer supplied valuations |
44
Notes to Financial Statements (continued)
| | and the independent pricing services’ own electronic data processing techniques. Floating rate loans are valued at the average of bid and ask quotations obtained from dealers in loans on the basis of prices supplied by independent pricing services. Forward foreign currency exchange contracts are valued using daily forward exchange rates. Swaps are valued daily using independent pricing services or quotations from broker/dealers to the extent available. |
| | |
| | Securities for which prices are not readily available are valued at fair value as determined by the Pricing Committee. The Pricing Committee considers a number of factors, including observable and unobservable inputs, when arriving at fair value. The Pricing Committee may use observable inputs such as yield curves, broker quotes, observable trading activity, option adjusted spread models and other relevant information to determine the fair value of portfolio investments. The Board or a designated committee thereof periodically reviews reports that may include fair value determinations made by the Pricing Committee, related market activity, inputs and assumptions, and retrospective comparison of prices of subsequent purchases and sales transactions to fair value determinations made by the Pricing Committee. |
| | |
| | Short-term securities with 60 days or less remaining to maturity are valued using the amortized cost method, which approximates fair value. |
| | |
| (b) | Security Transactions–Security transactions are recorded as of the date that the securities are purchased or sold (trade date). Realized gains and losses on sales of portfolio securities are calculated using the identified-cost method. |
| | |
| (c) | Investment Income–Dividend income is recorded on the ex-dividend date. Interest income is recorded on the accrual basis as earned. Discounts are accreted and premiums are amortized using the effective interest method and are included in Interest and other, if applicable, on the Statement of Operations. |
| | |
| (d) | Income Taxes–It is the policy of the Fund to meet the requirements of Subchapter M of the Internal Revenue Code applicable to regulated investment companies and to distribute substantially all taxable income and capital gains to its shareholders. Therefore, no income tax provision is required. |
| | |
| | The Fund files U.S. federal and various state and local tax returns. No income tax returns are currently under examination. The statute of limitations on the Fund’s filed U.S. federal tax returns remains open for the fiscal years ended December 31, 2019 through December 31, 2022. The statutes of limitations on the Fund’s state and local tax returns may remain open for an additional year depending upon the jurisdiction. |
| | |
| (e) | Expenses–Expenses incurred by the Company that do not specifically relate to an individual fund are generally allocated to the funds within the Company on a pro rata basis by relative net assets. |
| | |
| (f) | Foreign Transactions–The books and records of the Fund are maintained in U.S. dollars and transactions denominated in foreign currencies are recorded in the Fund’s records at the rate prevailing when earned or recorded. Asset and liability accounts that are denominated in foreign currencies are adjusted daily to reflect current exchange rates and any unrealized gain (loss), if applicable, is included in Net change in unrealized appreciation/depreciation on translation of assets and liabilities denominated in foreign currencies on the Fund’s Statement of Operations. The resultant exchange gains and losses upon settlement of such transactions, if applicable, are included in Net realized gain (loss) on foreign currency related transactions on |
45
Notes to Financial Statements (continued)
| | the Fund’s Statement of Operations. The Fund does not isolate that portion of the results of operations arising as a result of changes in the foreign exchange rates from the changes in market prices of the securities. |
| | |
| | The Fund uses foreign currency exchange contracts to facilitate transactions in foreign-denominated securities. Losses from these transactions may arise from changes in the value of the foreign currency or if the counterparties do not perform under the contracts’ terms. |
| | |
| (g) | Forward Foreign Currency Exchange Contracts–The Fund may enter into forward foreign currency exchange contracts in order to reduce exposure to changes in foreign currency exchange rates on foreign portfolio holdings, or gain or reduce exposure to foreign currency solely for investment purposes. A forward foreign currency exchange contract is a commitment to purchase or sell a foreign currency at a future date at a negotiated rate. The contracts are valued daily at forward exchange rates and any unrealized gain (loss), if applicable, is included in Net change in unrealized appreciation/depreciation on forward foreign currency exchange contracts in the Fund’s Statement of Operations. The gain (loss) arising from the difference between the U.S. dollar cost of the original contract and the value of the forward foreign currency in U.S. dollars upon closing of such contracts is included, if applicable, in Net realized gain (loss) on forward foreign currency exchange contracts in the Fund’s Statement of Operations. |
| | |
| (h) | Futures Contracts–The Fund may purchase and sell futures contracts to enhance returns, to attempt to economically hedge some of its investment risk, or as a substitute position in lieu of holding the underlying asset on which the instrument is based. At the time of entering into a futures transaction, an investor is required to deposit and maintain a specified amount of cash or eligible securities called “initial margin.” Subsequent payments made or received by the Fund called “variation margin” are made on a daily basis as the market price of the futures contract fluctuates. The Fund will record an unrealized gain (loss) based on the amount of variation margin. When a contract is closed, a realized gain (loss) is recorded equal to the difference between the opening and closing value of the contract. |
| | |
| (i) | Repurchase Agreements–The Fund may enter into repurchase agreements with respect to securities. A repurchase agreement is a transaction in which a fund acquires a security and simultaneously commits to resell that security to the seller (a bank or securities dealer) at an agreed-upon price on an agreed-upon date. The Fund requires at all times that the repurchase agreement be collateralized by cash, or by securities of the U.S. Government, its agencies, its instrumentalities, or U.S. Government sponsored enterprises having a value equal to, or in excess of, the value of the repurchase agreement (including accrued interest). If the seller of the agreement defaults on its obligation to repurchase the underlying securities at a time when the fair value of these securities has declined, the Fund may incur a loss upon disposition of the securities. |
| | |
| (j) | When-Issued, Forward Transactions or To-Be-Announced (“TBA”) Transactions–The Fund may purchase portfolio securities on a when-issued or forward basis. When-issued, forward transactions or TBA transactions involve a commitment by the Fund to purchase securities, with payment and delivery (“settlement”) to take place in the future, in order to secure what is considered to be an advantageous price or yield at the time of entering into the transaction. During the period between purchase and settlement, the fair value of the securities will fluctuate and assets consisting of cash and/or marketable securities (normally short-term U.S. Government or U.S. Government sponsored enterprise securities) marked to market daily in an amount sufficient to make payment at settlement will be segregated at the Fund’s custodian in order to pay for the commitment. At the time the Fund makes the commitment to purchase |
46
Notes to Financial Statements (continued)
| | a security on a when-issued basis, it will record the transaction and reflect the liability for the purchase and fair value of the security in determining its NAV. The Fund, generally, has the ability to close out a purchase obligation on or before the settlement date rather than take delivery of the security. Under no circumstances will settlement for such securities take place more than 120 days after the purchase date. |
| | |
| (k) | Reverse Repurchase Agreements–The Fund may enter into reverse repurchase agreements. In a reverse repurchase agreement, a fund sells a security to a securities dealer or bank for cash and also agrees to repurchase the same security later at a set price. Reverse repurchase agreements expose the Fund to credit risk (that is, the risk that the counterparty will fail to resell the security to the Fund). Engaging in reverse repurchase agreements also may involve the use of leverage, in that the Fund may reinvest the cash it receives in additional securities. Reverse repurchase agreements involve the risk that the market value of the securities to be repurchased by the Fund may decline below the repurchase price. |
| | |
| | For the fiscal year ended December 31, 2022, the Fund did not have reverse repurchase agreements. |
| | |
| (l) | Floating Rate Loans–The Fund may invest in floating rate loans, which usually take the form of loan participations and assignments. Loan participations and assignments are agreements to make money available to U.S. or foreign corporations, partnerships or other business entities (the “Borrower”) in a specified amount, at a specified rate and within a specified time. A loan is typically originated, negotiated and structured by a U.S. or foreign bank, insurance company or other financial institution (the “Agent”) for a group of loan investors (“Loan Investors”). The Agent typically administers and enforces the loan on behalf of the other Loan Investors in the syndicate and may hold any collateral on behalf of the Loan Investors. Such loan participations and assignments are typically senior, secured and collateralized in nature. The Fund records an investment when the Borrower withdraws money and records interest as earned. These loans pay interest at rates which are periodically reset by reference to a base lending rate plus a spread. These base lending rates are generally the prime rate offered by a designated U.S. bank or London InterBank Offered Rate (“LIBOR”). |
| | |
| | The loans in which the Fund invests may be subject to some restrictions on resale. For example, the Fund may be contractually obligated to receive approval from the Agent and/or Borrower prior to the sale of these investments. The Fund generally has no right to enforce compliance with the terms of the loan agreement with the Borrower. As a result, the Fund assumes the credit risk of the Borrower, the selling participant and any other persons interpositioned between the Fund and the Borrower (“Intermediate Participants”). In the event that the Borrower, selling participant or Intermediate Participants become insolvent or enter into bankruptcy, the Fund may incur certain costs and delays in realizing payment or may suffer a loss of principal and/or interest. |
| | |
| | Unfunded commitments represent the remaining obligation of the Fund to the Borrower. At any point in time, up to the maturity date of the issue, the Borrower may demand the unfunded portion. Until demanded by the Borrower, unfunded commitments are not recognized as an asset on the Statement of Assets and Liabilities. Unrealized appreciation/depreciation on unfunded commitments, if any, on the Statement of Assets and Liabilities represent mark to market of the unfunded portion of the Fund’s floating rate notes. |
| | |
| | As of December 31, 2022, the Fund did not have loan commitments. |
47
Notes to Financial Statements (continued)
| (m) | Inflation-Linked Derivatives–The Fund may invest in inflation-linked derivatives, such as Consumer Price Index Swap Agreements (“CPI swaps”). A CPI swap is a contract in which one party agrees to pay a fixed rate in exchange for a variable rate, which is the rate of change in the CPI during the life of the contract. Payments are based on a notional amount of principal. The Fund will normally enter into CPI swap contracts on a zero coupon basis, meaning that the floating rate will be based on the cumulative CPI during the life of the contract, and the fixed rate will compound until the swap’s maturity date, at which point the payments are netted. The swaps are valued daily and any unrealized gain (loss) is included in the Net change in unrealized appreciation/depreciation on swap contracts in the Fund’s Statement of Operations. A liquidation payment received or made at the termination or maturity of the swap is recorded in realized gain (loss) and is included in Net realized gain (loss) on swap contracts in the Fund’s Statement of Operations. Daily changes in valuation of centrally cleared CPI swaps, if any, are recorded as a receivable or payable for the change in value as appropriate (“variation margin”) on the Statement of Assets and Liabilities. For the centrally cleared CPI swaps, there was minimal counterparty risk to the Fund, since such CPI swaps entered into were traded through a central clearinghouse, which guarantees against default. |
| | |
| (n) | Credit Default Swaps–The Fund may enter into credit default swap contracts in order to hedge credit risk or for speculation purposes. As a seller of a credit default swap contract (“seller of protection”), the Fund is required to pay the notional amount or other agreed-upon value of a referenced debt obligation to the counterparty in the event of a default by or other credit event involving the referenced issuer, obligation or index. In return, the Fund receives from the counterparty a periodic stream of payments over the term of the contract. |
| | |
| | As a purchaser of a credit default swap contract (“buyer of protection”), the Fund would receive the notional amount or other agreed upon value of a referenced debt obligation from the counterparty in the event of default by or other credit event involving the referenced issuer, obligation or index. In return, the Fund makes periodic payments to the counterparty over the term of the contracts, provided no event of default has occurred. |
| | |
| | These credit default swaps may have as a reference obligation corporate or sovereign issuers or credit indexes. These credit indexes are comprised of a basket of securities representing a particular sector of the market. |
| | |
| | Credit default swaps are fair valued based upon quotations from counterparties, brokers or market-makers and the change in value, if any, is recorded as unrealized appreciation or depreciation. For a credit default swap sold by the Fund, payment of the agreed-upon amount made by the Fund in the event of default of the referenced debt obligation is recorded as the cost of the referenced debt obligation purchased/received. For a credit default swap purchased by the Fund, the agreed-upon amount received by the Fund in the event of default of the referenced debt obligation is recorded as proceeds from sale/delivery of the referenced debt obligation and the resulting gain or loss realized on the referenced debt obligation is recorded as such by the Fund. |
| | |
| | Any upfront payments made or received upon entering a credit default swap contract would be amortized or accreted over the life of the swap and recorded as realized gains or losses. Collateral, in the form of cash or securities, may be required to be held in segregated accounts with the custodian bank or broker in accordance with the swap agreement. The value and credit rating of each credit default swap where the Fund is the seller of protection, are both measures of the current payment/performance risk of the swap. As the value of the swap changes as a |
48
Notes to Financial Statements (continued)
| | positive or negative percentage of the total notional amount, the payment/performance risk may decrease or increase, respectively. The maximum potential amount of future payments (undiscounted) that the Fund as a seller of protection could be required to make under a credit default swap agreement would be an amount equal to the notional amount of the agreement. These potential amounts would be partially offset by any recovery values of the respective referenced obligations, upfront payments received upon entering into the agreement, or net amounts received from the settlement of buy protection credit default swap agreements entered into by the Fund for the same referenced entity or entities. |
| | |
| | Entering into credit default swaps involves credit and market risk. Such risks involve the possibility that there will be no liquid market for these agreements, that the counterparty to the agreements may default on its obligation to perform or disagree as to the meaning of the contractual terms in the agreements, and that there may be unfavorable changes in interest rates, and that Lord Abbett does not correctly predict the creditworthiness of the issuers of the reference obligation on which the credit default swap is based. For the centrally cleared credit default swaps, there was minimal counterparty risk to the Fund, since such credit default swaps entered into were traded through a central clearinghouse, which guarantees against default. |
| | |
| (o) | Fair Value Measurements–Fair value is defined as the price that the Fund would receive upon selling an investment or transferring a liability in an orderly transaction to an independent buyer in the principal or most advantageous market of the investment. A three-tier hierarchy is used to maximize the use of observable market data and minimize the use of unobservable inputs and to establish classification of fair value measurements for disclosure purposes. Inputs refer broadly to the assumptions that market participants would use in pricing the asset or liability, including assumptions about risk – for example, the risk inherent in a particular valuation technique used to measure fair value (such as a pricing model) and/or the risk inherent in the inputs to the valuation technique. Inputs may be observable or unobservable. Observable inputs reflect the assumptions market participants would use in pricing the asset or liability. Observable inputs are based on market data obtained from sources independent of the reporting entity. Unobservable inputs reflect the reporting entity’s own assumptions about the assumptions market participants would use in pricing the asset or liability. Unobservable inputs are based on the best information available in the circumstances. The three-tier hierarchy classification is determined based on the lowest level of inputs that is significant to the fair value measurement, and is summarized in the three broad Levels listed below: |
| | • | Level 1 - | unadjusted quoted prices in active markets for identical investments; |
| | | | |
| | • | Level 2 - | other significant observable inputs (including quoted prices for similar investments, interest rates, prepayment speeds, credit risk, etc.); and |
| | | | |
| | • | Level 3 - | significant unobservable inputs (including the Fund’s own assumptions in determining the fair value of investments). |
A summary of inputs used in valuing the Fund’s investments and other financial instruments as of December 31, 2022 and, if applicable, Level 3 rollforwards for the fiscal year then ended is included in the Fund’s Schedule of Investments.
Changes in valuation techniques may result in transfers into or out of an assigned level within the three-tier hierarchy. The inputs or methodology used for valuing securities are not necessarily an indication of the risk associated with investing in those securities.
49
Notes to Financial Statements (continued)
| 3. | MANAGEMENT FEE AND OTHER TRANSACTIONS WITH AFFILIATES |
Management Fee
The Company has a management agreement with Lord Abbett, pursuant to which Lord Abbett provides the Fund with investment management services and executive and other personnel, provides office space and pays for ordinary and necessary office and clerical expenses relating to research and statistical work and supervision of the Fund’s investment portfolio. The management fee is accrued daily and payable monthly.
The management fee is based on the Fund’s average daily net assets at the following annual rate:
| First $1 billion | .35% |
| Next $1 billion | .30% |
| Over $2 billion | .25% |
For the fiscal year ended December 31, 2022, the effective management fee, net of any applicable waivers, was at an annualized rate of .35% of the Fund’s average daily net assets.
In addition, Lord Abbett provides certain administrative services to the Fund pursuant to an Administrative Services Agreement in return for a fee at an annual rate of .04% of the Fund’s average daily net assets. The fund administration fee is accrued daily and payable monthly. Lord Abbett voluntarily waived $12,014 of fund administration fees during the fiscal year ended December 31, 2022.
The Company, on behalf of the Fund, has entered into services arrangements with certain insurance companies. Under these arrangements, certain insurance companies will be compensated up to .25% of the average daily net asset value (“NAV”) of the Fund’s Class VC Shares held in the insurance company’s separate account to service and maintain the Variable Contract owners’ accounts. This amount is included in non 12b-1 service fees on the Statement of Operations. The Fund may also compensate certain insurance companies, third-party administrators and other entities for providing recordkeeping, sub-transfer agency and other administrative services to the Fund. This amount is included in Shareholder servicing on the Statement of Operations.
One Director and certain of the Company’s officers have an interest in Lord Abbett.
| 4. | DISTRIBUTIONS AND CAPITAL LOSS CARRYFORWARDS |
Dividends from net investment income, if any, are declared and paid at least semi-annually. Taxable net realized gains from investment transactions, reduced by allowable capital loss carryforwards, if any, are declared and distributed to shareholders at least annually. The capital loss carryforward amount, if any, is available to offset future net capital gains. Dividends and distributions to shareholders are recorded on the ex-dividend date. The amounts of dividends and distributions from net investment income and net realized capital gains are determined in accordance with federal income tax regulations, which may differ from U.S. GAAP. These book/tax differences are either considered temporary or permanent in nature. To the extent these differences are permanent in nature, such amounts are reclassified within the components of net assets based on their federal tax basis treatment; temporary differences do not require reclassification. Dividends and distributions that exceed earnings and profits for tax purposes are reported as a tax return of capital.
The tax character of distributions paid during the fiscal years ended December 31, 2022 and December 31, 2021 was as follows:
| | | Year Ended
12/31/2022 | | | Year Ended
12/31/2021 | |
| Distributions paid from: | | | | | | | | |
| Ordinary income | | | $3,457,341 | | | | $2,684,842 | |
| Total distributions paid | | | $3,457,341 | | | | $2,684,842 | |
50
Notes to Financial Statements (continued)
As of December 31, 2022, the components of accumulated gains (losses) on a tax-basis were as follows:
| Undistributed ordinary income – net | | $ | 27,714 | |
| Total undistributed earnings | | | 27,714 | |
| Capital loss carryforwards* | | | (8,090,160 | ) |
| Temporary differences | | | (8,539 | ) |
| Unrealized losses – net | | | (6,521,118 | ) |
| Total accumulated losses – net | | $ | (14,592,103 | ) |
| * | The capital losses will carry forward indefinitely. |
As of December 31, 2022, the aggregate unrealized security gains (losses) on investments and other financial instruments based on cost for U.S. federal income tax purposes were as follows:
| Tax cost | | $ | 124,877,994 | |
| Gross unrealized gain | | | 179,622 | |
| Gross unrealized loss | | | (6,700,740 | ) |
| Net unrealized security gain (loss) | | $ | (6,521,118 | ) |
The difference between book-basis and tax-basis unrealized gains (losses) is attributable to the tax treatment of other financial instruments, amortization of premium and wash sales.
| 5. | PORTFOLIO SECURITIES TRANSACTIONS |
Purchases and sales of investment securities (excluding short-term investments) for the fiscal year ended December 31, 2022 were as follows:
U.S.
Government
Purchases* | | | Non-U.S.
Government
Purchases | | | U.S.
Government
Sales* | | | Non-U.S.
Government
Sales | |
| | $17,125,761 | | | | $65,875,143 | | | | $17,384,083 | | | | $62,468,340 | |
| * | Includes U.S. Government sponsored enterprise securities. |
The Fund is permitted to purchase and sell securities (“cross-trade”) from and to other Lord Abbett funds or client accounts pursuant to procedures approved by the Board in compliance with Rule 17a-7 under the Act (the “Rule”). Each cross-trade is executed at a fair market price in compliance with provisions of the Rule. For the fiscal year ended December 31, 2022, the Fund engaged in cross-trade purchases of $1,700,112.
| 6. | DISCLOSURES ABOUT DERIVATIVE INSTRUMENTS AND HEDGING ACTIVITIES |
The Fund entered into U.S. Treasury futures contracts for the fiscal year ended December 31, 2022 (as described in note 2(h)) to hedge against changes in interest rates. The Fund bears the risk of interest rates moving unexpectedly, in which case the Fund may not achieve the anticipated benefits of the futures contracts and realize a loss. There is minimal counterparty credit risk to the Fund since futures are exchange traded and the exchange’s clearinghouse, as counterparty to all exchange traded futures, guarantees futures against default.
The Fund entered into CPI swaps for the fiscal year ended December 31, 2022 (as described in Note 2(m)) to speculate the rate of inflation in the U.S. economy. The Fund’s use of CPI swaps involves the risk that Lord Abbett will not accurately predict expectations of inflation or interest rates, and the Fund’s returns could be reduced as a result. The Fund’s risk of loss from counterparty credit risk is the unrealized appreciation on CPI swaps. For the centrally cleared CPI swaps, there is minimal counterparty credit risk to the Fund since these CPI swaps are traded through a central clearinghouse. As a counterparty to all centrally cleared CPI swaps, the clearinghouse guarantees CPI swaps against default.
51
Notes to Financial Statements (continued)
The Fund entered into credit default swaps for the fiscal year ended December 31, 2022 (as described in Note 2(n)) for investment purposes, to economically hedge credit risk or for speculative purposes. Credit default swaps involve the exchange of a fixed rate premium for protection against the loss in value of an underlying security within the index in the event of a defined credit event, such as payment default or bankruptcy. Under a credit default swap one party acts as a guarantor by receiving the fixed periodic payment in exchange for the commitment to purchase the underlying security at par if the defined credit event occurs. Upon the occurrence of a defined credit event, the difference between the value of the reference obligation and the swap’s notional amount is recorded as realized gain or loss on swap transactions in the Statement of Operations. The Fund’s maximum risk of loss from counterparty risk, either as the protection seller or as the protection buyer, is the fair value of the contract. For the centrally cleared credit default swaps, there is minimal counterparty credit risk to the Fund since these credit default swaps are traded through a central clearinghouse. As a counterparty to all centrally cleared credit default swaps, the clearinghouse guarantees credit default swaps against default.
As of December 31, 2022, the Fund had the following derivatives at fair value, grouped into appropriate risk categories that illustrate the Funds use of derivative instruments:
| Asset Derivatives | | Interest Rate
Contracts | | | Inflation Linked
Contracts | |
| Centrally Cleared CPI Swap Contracts(1) | | $ | – | | | $ | 3,831 | |
| Futures Contracts(2) | | | 78,438 | | | | – | |
| (1) | Statement of Assets and Liabilities location: Includes cumulative unrealized appreciation/depreciation of centrally cleared swap contracts as reported in the Schedule of Investments. Only current day’s variation margin is reported within the Statement of Assets and Liabilities. |
| (2) | Statement of Assets and Liabilities location: Includes cumulative unrealized appreciation/depreciation on futures contracts as reported in the Schedule of Investments. Only current day’s variation margin reported is within the Statement of Assets and Liabilities. |
Transactions in derivative instruments for the for the fiscal year ended December 31, 2022, were as follows:
| | Inflation
Linked/
Interest
Rate
Contracts | | Credit
Contracts | |
| Net Realized Gain (Loss) | | | | | | |
| Credit Default Swaps Contracts(1) | | | – | | | $ | (23,148 | ) |
| Futures Contracts(2) | | $ | (2,536,170 | ) | | | – | |
| Net Change in Unrealized Appreciation/Depreciation | | | | | | | | |
| CPI/Interest Rate Swaps(3) | | | 3,831 | | | | – | |
| Futures Contracts(4) | | | 117,529 | | | | – | |
| Average Number of Contracts/Notional Amounts* | | | | | | | | |
| CPI/Interest Rate Swap Contracts(5) | | $ | 364,105 | | | | – | |
| Credit Default Swaps Contracts(5) | | | – | | | | – | (7) |
| Futures Contracts(6) | | | 269 | | | | – | |
| * | Calculated based on the number of contracts or notional amounts for the fiscal year ended December 31, 2022. |
| (1) | Statement of Operations location: Net realized gain (loss) on swap contracts. |
| (2) | Statement of Operations location: Net realized gain (loss) on futures contracts. |
| (3) | Statement of Operations location: Net change in unrealized appreciation/depreciation on swap contracts. |
| (4) | Statement of Operations location: Net change in unrealized appreciation/depreciation on futures contracts. |
| (5) | Amount represents notional amounts in U.S. dollars. |
| (6) | Amount represents number of contracts. |
| (7) | Contract less than $1. |
52
Notes to Financial Statements (continued)
| 7. | DISCLOSURES ABOUT OFFSETTING ASSETS AND LIABILITIES |
The Financial Accounting Standards Board requires disclosures intended to help better assess the effect or potential effect of offsetting arrangements on a fund’s financial position. The following tables illustrate gross and net information about recognized assets and liabilities eligible for offset in the Statement of Assets and Liabilities; and disclose such amounts subject to an enforceable master netting agreement or similar agreement, by the counterparty. A master netting agreement is an agreement between a fund and a counterparty which provides for the net settlement of amounts owed under all contracts traded under that agreement, as well as cash collateral, through a single payment by one party to the other in the event of default on or termination of any one contract. The Fund’s accounting policy with respect to balance sheet offsetting is that, absent an event of default by the counterparty or a termination of the agreement, the master netting agreement does not result in an offset of reported amounts of financial assets and liabilities in the Statement of Assets and Liabilities across transactions between the Fund and the applicable counterparty:
| Description | | Gross Amounts of
Recognized Assets | | Gross Amounts
Offset in the
Statement of Assets
and Liabilities | | Net Amounts of
Assets Presented
in the Statement of
Assets and Liabilities |
| Repurchase Agreements | | $2,136,729 | | $ – | | $2,136,729 |
| Total | | $2,136,729 | | $ – | | $2,136,729 |
| | | Net Amount
of Assets
Presented in
the Statement
of Assets and
Liabilities | |
Amounts Not Offset in the
Statement of Assets and Liabilities | | | |
| Counterparty | | | Financial
Instruments | | Cash
Collateral
Received(a | ) | Securities
Collateral
Received(a | ) | Net
Amount(b | ) |
| Fixed Income Clearing Corp. | | $2,136,729 | | $ – | | $ – | | $(2,136,729 | ) | $ – | |
| Total | | $2,136,729 | | $ – | | $ – | | $(2,136,729 | ) | $ – | |
| (a) | Collateral disclosed is limited to an amount not to exceed 100% of the net amount of assets (liabilities) presented in the Statement of Assets and Liabilities, for each respective counterparty. |
| (b) | Net amount represents the amount owed to the Fund by the counterparty as of December 31, 2022. |
| 8. | DIRECTORS’ REMUNERATION |
The Company’s officers and one Director, who are associated with Lord Abbett, do not receive any compensation from the Company for serving in such capacities. Independent Directors’ fees are allocated among all Lord Abbett-sponsored funds based on the net assets of each fund. There is an equity-based plan available to all Independent Directors under which Independent Directors may elect to defer receipt of a portion of Directors’ fees. The deferred amounts are treated as though equivalent dollar amounts had been invested in the Fund. Such amounts and earnings accrued thereon are included in Directors’ fees on the Statement of Operations and in Directors’ fees payable on the Statement of Assets and Liabilities and are not deductible for U.S. federal income tax purposes until such amounts are paid.
The Company has entered into an arrangement with its transfer agent and custodian, whereby credits realized as a result of uninvested cash balances are used to reduce a portion of the Fund’s expenses.
53
Notes to Financial Statements (continued)
For the period ended August 3, 2022, the Fund and certain other funds managed by Lord Abbett (collectively, the “Participating Funds”) entered into a syndicated line of credit facility with various lenders for $1.275 billion (the “Syndicated Facility”) whereas State Street Bank and Trust Company (“SSB”) participated as a lender and as agent for the lenders. The Participating Funds were subject to graduated borrowing limits of one-third of fund net assets (if fund net assets are less than $750 million), $250 million, $300 million, $700 million, or $1 billion, based on past borrowings and likelihood of future borrowings, among other factors.
Effective August 4, 2022, the Participating Funds entered into a Syndicated Facility with various lenders for $1.625 billion whereas SSB participates as a lender and as agent for the lenders. The Participating Funds were subject to graduated borrowing limits of one-third of fund net assets (if fund net assets are less than $750 million), $250 million, $300 million, $700 million, or $1 billion, based on past borrowings and likelihood of future borrowings, among other factors.
For the period ended August 3, 2022, the Participating Funds were party to an additional line of credit facility with SSB for $330 million (the “Bilateral Facility”), $250 million committed and $80 million uncommitted. Under the Bilateral Facility, the Participating Funds are subject to graduated borrowing limits of one-third of fund net assets (if net assets are less than $750 million), $250 million, $300 million, or $330 million, based on past borrowings and likelihood of future borrowings, among other factors.
Effective August 4, 2022, the Participating Funds are party to an additional uncommitted line of credit facility with SSB for $330 million. Under the Bilateral Facility, the Participating Funds are subject to borrowing limits of one-third of fund net assets (if net assets are less than $750 million), or $250 million based on past borrowings and likelihood of future borrowings, among other factors.
The Syndicated Facility and the Bilateral Facility are to be used for temporary or emergency purposes as additional sources of liquidity to satisfy redemptions.
For the year ended December 31, 2022, the Fund did not utilize the Syndicated Facility or Bilateral Facility.
| 11. | INTERFUND LENDING PROGRAM |
Pursuant to an exemptive order issued by the U.S. Securities and Exchange Commission (“SEC exemptive order”) certain registered open-end management investment companies managed by Lord Abbett, including the Fund, participate in a joint lending and borrowing program (the “Interfund Lending Program”). The SEC exemptive order allows the funds that participate in the Interfund Lending Program to borrow money from and lend money to each other for temporary or emergency purposes subject to the limitations and conditions.
For the fiscal year ended December 31, 2022, the Fund did not participate as a borrower or lender in the Interfund Lending Program.
| 12. | CUSTODIAN AND ACCOUNTING AGENT |
SSB is the Company’s custodian and accounting agent. SSB performs custodial, accounting and recordkeeping functions relating to portfolio transactions and calculating the Fund’s NAV.
| 13. | SECURITIES LENDING AGREEMENT |
The Fund has established a securities lending agreement with Citibank, N.A. for the lending of securities to qualified brokers in exchange for securities or cash collateral equal to at least the
54
Notes to Financial Statements (continued)
market value of securities loaned, plus interest, if applicable. Cash collateral is invested in an approved money market fund. In accordance with the Fund’s securities lending agreement, the market value of securities on loan is determined each day at the close of business and any additional collateral required to cover the value of securities on loan is delivered to the Fund on the next business day. As with other extensions of credit, the Fund may experience a delay in the recovery of its securities or incur a loss should the borrower of the securities breach its agreement with the Fund or the borrower becomes insolvent at a time when the collateral is insufficient to cover the cost of repurchasing securities on loan. Any income earned from securities lending is included in Securities lending net income on the Fund’s Statement of Operations.
The initial collateral received by the Fund is required to have a value equal to at least 100% of the market value of the securities loaned. The collateral must be marked-to-market daily to cover increases in the market value of the securities loaned (or potentially a decline in the value of the collateral). In general, the risk of borrower default will be borne by Citibank, N.A.; the Fund will bear the risk of loss with respect to the investment of the cash collateral. The advantage of such loans is that the Fund continues to receive income on loaned securities while receiving a portion of any securities lending fees and earning returns on the cash amounts which may be reinvested for the purchase of investments in securities.
As of December 31, 2022, the Fund did not loan any securities.
The Fund is subject to the general risks and considerations associated with investing in fixed income securities, including the risk that issuers will fail to make timely payments of principal or interest or default altogether. The value of an investment will change as interest rates fluctuate and in response to market movements. When interest rates rise, the prices of fixed income securities are likely to decline; when interest rates fall, such prices tend to rise. Longer-term securities are usually more sensitive to interest rate changes. There is also the risk that an issuer of a fixed income security will fail to make timely payments of principal and/or interest to the Fund, a risk that is greater with high-yield bonds (sometimes called “junk bonds”) in which the Fund may substantially invest. Some issuers, particularly of high-yield bonds, may default as to principal and/or interest payments after the Fund purchases its securities. A default, or concerns in the market about an increase in risk of default, may result in losses to the Fund. High-yield bonds are subject to greater price fluctuations, as well as additional risks. The market for below investment grade securities may be less liquid, which may make such securities more difficult to sell at an acceptable price, especially during periods of financial distress, increased market volatility, or significant market decline.
The Fund is subject to the general risks and considerations associated with investing in convertible securities, which have both equity and fixed income risk characteristics, including market, credit, liquidity, and interest rate risks. Generally, convertible securities offer lower interest or dividend yields than non-convertible securities of similar quality and less potential for gains or capital appreciation in a rising equity securities market than equity securities. They tend to be more volatile than other fixed income securities, and the markets for convertible securities may be less liquid than markets for stocks or bonds. A significant portion of convertible securities have below investment grade credit ratings and are subject to increased credit and liquidity risks.
Certain instruments in which the Fund may invest rely in some fashion upon LIBOR. On March 5, 2021, the United Kingdom Financial Conduct Authority (FCA) and LIBOR’s administrator, ICE Benchmark Administration (IBA), announced that most LIBOR settings will no longer be published after the end of 2021 and a majority of U.S. dollar LIBOR settings will no longer be published after
55
Notes to Financial Statements (concluded)
June 30, 2023. Abandonment of or modifications to LIBOR could have adverse impacts on newly issued financial instruments and existing financial instruments which reference LIBOR and lead to significant short-term and long-term uncertainty and market instability.
The Fund’s investment exposure to foreign (which may include emerging market) companies presents increased market, liquidity, currency, political, information and other risks. As compared with companies organized and operated in the U.S., these companies may be more vulnerable to economic, political and social instability and subject to less government supervision, lack of transparency, inadequate regulatory and accounting standards, and foreign taxes. The securities of foreign companies also may be subject to inadequate exchange control regulations, the imposition of economic sanctions or other government restrictions, higher transaction and other costs, and delays in settlement to the extent they are traded on non-U.S. exchanges or markets. The cost of the Fund’s potential use of forward foreign currency exchange contracts varies with factors such as the currencies involved, the length of the contract period and the market conditions prevailing.
The Fund is subject to the risks associated with derivatives, which may be different from and greater than the risks associated with directly investing in securities. Derivatives may be subject to risks such as liquidity risk, leveraging risk, interest rate risk, market risk, and credit risk. Illiquid securities may lower the Fund’s returns since the Fund may be unable to sell these securities at their desired time or price. Derivatives also may involve the risk of mispricing or improper valuation and the risk that changes in the value of the derivative may not correlate perfectly with the value of the underlying asset, rate or index. Whether the Fund’s use of derivatives is successful will depend on, among other things, the Fund’s ability to correctly forecast market movements, changes in foreign exchange and interest rates, and other factors. If the Fund incorrectly forecasts these and other factors, its performance could suffer. The Fund’s use of derivatives could result in a loss exceeding the amount of the Fund’s investment in these instruments.
The Fund may invest in swap contracts. Swap contracts are bilateral agreements between a fund and its counterparty. Each party is exposed to the risk of default by the other. In addition, they may involve a small investment of cash compared to the risk assumed with the result that small changes may produce disproportionate and substantial gains or losses to the Fund.
The Fund may invest in credit default swap contracts. The risks associated with the Fund’s investment in credit default swaps are greater than if the Fund invested directly in the reference obligation because they are subject to illiquidity risk, counterparty risk, and credit risk at both the counterparty and underlying issuer levels.
The Fund may invest in floating rate or adjustable rate senior loans, which are subject to increased credit and liquidity risks. Senior loans are business loans made to borrowers that may be U.S. or foreign corporations, partnerships, or other business entities. The senior loans in which the Fund may invest may consist primarily of senior loans that are rated below investment grade or, if unrated, deemed by Lord Abbett to be equivalent to below investment grade securities. Below investment grade senior loans, as in the case of high-yield debt securities, or junk bonds, are usually more credit sensitive than interest rate sensitive, although the value of these instruments may be impacted by broader interest rate swings in the overall fixed income market. In addition, senior loans may be subject to structural subordination.
The Fund is subject to the risk of investing a significant portion of its assets in securities issued or guaranteed by the U.S. Government or its agencies and instrumentalities (such as the Government National Mortgage Association (“Ginnie Mae”), the Federal National Mortgage Association (“Fannie Mae”), or the Federal Home Loan Mortgage Corporation (“Freddie Mac”)). Unlike Ginnie Mae securities, securities issued or guaranteed by U.S. Government-related organizations such as Fannie
56
Mae and Freddie Mac are not backed by the full faith and credit of the U.S. Government and no assurance can be given that the U.S. Government would provide financial support to its agencies and instrumentalities if not required to do so by law. Consequently, the Fund may be required to look principally to the agency issuing or guaranteeing the obligation. In addition, the Fund may invest in non-agency backed and mortgage related securities, which are issued by the private institutions, not by the government-sponsored enterprises. Such securities may be particularly sensitive to changes in economic conditions, including delinquencies and/or defaults, and changes in prevailing interest rates. These changes can affect the value, income and/or liquidity of such positions. When interest rates are declining, the value of these securities with prepayment features may not increase as much as other fixed income securities. Early principal repayment may deprive the Fund of income payments above current markets rates. The prepayment rate also will affect the price and volatility of a mortgage-related security. In addition, securities of government sponsored enterprises are guaranteed with respect to the timely payment of interest and principal by the particular enterprise involved, not by the U.S. Government.
Geopolitical and other events (e.g., wars, terrorism, natural disasters, epidemics or pandemics such as the COVID-19 outbreak which began in late 2019) may disrupt securities markets and adversely affect global economies and markets, thereby decreasing the value of the Fund’s investments. Market disruptions can also prevent the Fund from implementing its investment strategies and achieving its investment objective.
The transmission of COVID-19 and efforts to contain its spread have resulted in, among other things, border closings and other significant travel restrictions and disruptions, significant disruptions to business operations, supply chains and customer activity, lower consumer demand for goods and services, event cancellations and restrictions, service cancellations, reductions and other changes, significant challenges in healthcare service preparation and delivery, and prolonged quarantines, as well as general concern and uncertainty. The impact of the COVID-19 outbreak has, and could again, negatively affect the global economy, the economies of individual countries, and the financial performance of individual issuers, sectors, industries, asset classes, and markets in significant and unforeseen ways.
The COVID-19 pandemic and its effects may last for an extended period of time. Although the long-term economic fallout of COVID-19 is difficult to predict, it has contributed to, and is likely to continue to contribute to, market volatility, inflation and systemic economic weakness. The foregoing could disrupt the operations of each Fund and its service providers, adversely affect the value and liquidity of each Fund’s investments, and negatively impact each Fund’s performance and your investment in each Fund.
These factors, and others, can affect the Fund’s performance.
| 15. | SUMMARY OF CAPITAL TRANSACTIONS |
Transactions in shares of capital stock were as follows:
| | Year Ended
December 31, 2022 | | Year Ended
December 31, 2021 | |
| Shares sold | | | 3,523,305 | | | | 3,310,929 | |
| Reinvestment of distributions | | | 265,541 | | | | 190,685 | |
| Shares reacquired | | | (3,174,205 | ) | | | (2,495,844 | ) |
| Increase | | | 614,641 | | | | 1,005,770 | |
57
Report of Independent Registered Public Accounting Firm
To the shareholders and the Board of Directors of Lord Abbett Series Fund, Inc.
Opinion on the Financial Statements and Financial Highlights
We have audited the accompanying statement of assets and liabilities, including the schedule of investments, of Short Duration Income Portfolio, one of the funds constituting Lord Abbett Series Fund, Inc. (the “Fund”), as of December 31, 2022, the related statement of operations for the year then ended, the statements of changes in net assets for each of the two years in the period then ended, the financial highlights for each of the five years in the period then ended, and the related notes. In our opinion, the financial statements and financial highlights present fairly, in all material respects, the financial position of Short Duration Income Portfolio of the Fund as of December 31, 2022, and the results of its operations for the year then ended, the changes in its net assets for each of the two years in the period then ended, and the financial highlights for each of the five years in the period then ended in conformity with accounting principles generally accepted in the United States of America.
Basis for Opinion
These financial statements and financial highlights are the responsibility of the Fund’s management. Our responsibility is to express an opinion on the Fund’s financial statements and financial highlights based on our audits. We are a public accounting firm registered with the Public Company Accounting Oversight Board (United States) (PCAOB) and are required to be independent with respect to the Fund in accordance with the U.S. federal securities laws and the applicable rules and regulations of the Securities and Exchange Commission and the PCAOB.
We conducted our audits in accordance with the standards of the PCAOB. Those standards require that we plan and perform the audit to obtain reasonable assurance about whether the financial statements and financial highlights are free of material misstatement, whether due to error or fraud. The Fund is not required to have, nor were we engaged to perform, an audit of its internal control over financial reporting. As part of our audits we are required to obtain an understanding of internal control over financial reporting but not for the purpose of expressing an opinion on the effectiveness of the Fund’s internal control over financial reporting. Accordingly, we express no such opinion.
Our audits included performing procedures to assess the risks of material misstatement of the financial statements and financial highlights, whether due to error or fraud, and performing procedures that respond to those risks. Such procedures included examining, on a test basis, evidence regarding the amounts and disclosures in the financial statements and financial highlights. Our audits also included evaluating the accounting principles used and significant estimates made by management, as well as evaluating the overall presentation of the financial statements and financial highlights. Our procedures included confirmation of securities owned as of December 31, 2022, by correspondence with the custodian, brokers and selling or agent banks; when replies were not received from brokers and selling or agent banks, we performed other auditing procedures. We believe that our audits provide a reasonable basis for our opinion.
DELOITTE & TOUCHE LLP
New York, New York
February 14, 2023
We have served as the auditor of one or more Lord Abbett Family of Funds’ investment companies since 1932.
58
Basic Information About Management
The Board is responsible for the management of the business and affairs of the Fund in accordance with the laws of the state of organization. The Board elects officers who are responsible for the day-to-day operations of the Fund and who execute policies authorized by the Board. The Board also approves an investment adviser to the Fund and continues to monitor the cost and quality of the services the investment adviser provides, and annually considers whether to renew the contract with the investment adviser. Generally, each Board member holds office until his/her successor is elected and qualified or until his/her earlier resignation or removal, as provided in the Fund’s organizational documents.
Lord, Abbett & Co. LLC (“Lord Abbett”), a Delaware limited liability company, is the Fund’s investment adviser. Designated Lord Abbett personnel are responsible for the day-to-day management of the Fund.
Independent Board Members
The following Independent Board Members also are board members of each of the 15 investment companies in the Lord Abbett Family of Funds, which consist of 63 investment portfolios.
Name, Address and
Year of Birth | | Current Position and
Length of Service
with the Fund | | Principal Occupation and Other Directorships
During the Past Five Years |
Evelyn E. Guernsey
Lord, Abbett & Co. LLC
c/o Legal Dept.
90 Hudson Street
Jersey City, NJ 07302
(1955) | | Board member since 2011;
Vice Chair since 2023 | | Principal Occupation: None.
Other Directorships: None. |
| | | | | |
Julie A. Hill
Lord, Abbett & Co. LLC
c/o Legal Dept.
90 Hudson Street
Jersey City, NJ 07302
(1946) | | Board member since 2004 | | Principal Occupation: Owner and CEO of The Hill Company, a business consulting firm (since 1998).
Other Directorships: Previously served as director of Anthem, Inc., a health benefits company (1994–2021). |
| | | | | |
Kathleen M. Lutito
Lord, Abbett & Co. LLC
c/o Legal Dept.
90 Hudson Street
Jersey City, NJ 07302
(1963) | | Board member since 2017 | | Principal Occupation: President and Chief Investment Officer of CenturyLink Investment Management Company (since 2006).
Other Directorships: None. |
| | | | | |
James M. McTaggart
Lord, Abbett & Co. LLC
c/o Legal Dept.
90 Hudson Street
Jersey City, NJ 07302
(1947) | | Board member since 2012 | | Principal Occupation: Owner of McTaggart LLC (since 2011).
Other Directorships: None. |
| | | | | |
Charles O. Prince
Lord, Abbett & Co. LLC
c/o Legal Dept.
90 Hudson Street
Jersey City, NJ 07302
(1950) | | Board member since 2019 | | Principal Occupation: None. Formerly Chair and Chief Executive Officer, Citigroup, Inc. (Retired 2007).
Other Directorships: Previously served as director of Johnson & Johnson (2005–2022). Previously served as director of Xerox Corporation (2007–2018). |
59
Basic Information About Management (continued)
Name, Address and
Year of Birth | | Current Position and
Length of Service
with the Fund | | Principal Occupation and Other Directorships
During the Past Five Years |
Karla M. Rabusch
Lord, Abbett & Co. LLC
c/o Legal Dept.
90 Hudson Street
Jersey City, NJ 07302
(1959) | | Board member since 2017 | | Principal Occupation: President and Director of Wells Fargo Funds Management, LLC (2003–2017); President of Wells Fargo Funds (2003–2016).
Other Directorships: None. |
| | | | | |
Lorin Patrick Taylor Radtke
Lord, Abbett & Co. LLC
c/o Legal Dept.
90 Hudson Street
Jersey City, NJ 07302
(1968) | | Board member since 2021 | | Principal Occupation: Partner and Co-Founder of M Seven 8 Partners LLC, a venture capital firm (since 2016). Formerly Partner, Goldman Sachs (1992–2016).
Other Directorships: Currently serves as director of Assured Guaranty (2021–Present), Virtual Combine (2018–Present), and Mariposa Family Learning Center (2021–Present). Previously served as director of SummerMoon Coffee (2022). |
| | | | | |
Leah Song Richardson
Lord, Abbett & Co. LLC
c/o Legal Dept.
90 Hudson Street
Jersey City, NJ 07302
(1966) | | Board member since 2021 | | Principal Occupation: President of Colorado College (since 2021) and was formerly Dean at University of California, Irvine – School of Law (2017–2021) and formerly Professor of Law at University of California, Irvine (2014–2017).
Other Directorships: None. |
| | | | | |
Mark A. Schmid
Lord, Abbett & Co. LLC
c/o Legal Dept.
90 Hudson Street
Jersey City, NJ 07302
(1959) | | Board member since 2016 | | Principal Occupation: Vice President and Chief Investment Officer of the University of Chicago (2009–2021).
Other Directorships: None. |
| | | | | |
James L.L. Tullis
Lord, Abbett & Co. LLC
c/o Legal Dept.
90 Hudson Street
Jersey City, NJ 07302
(1947) | | Board member since 2006;
Chair since 2017 | | Principal Occupation: Chair of Tullis Health Investors - FL LLC (since 2018); CEO of Tullis-Dickerson and Co. Inc., a venture capital management firm (1990–2016).
Other Directorships: Currently serves as Chair of Crane Co. (since 2020, director since 1998), Director of Alphatec Spine (since 2018), and Director of Exagen Inc. (since 2019). Previously served as director of electroCore, Inc. (2018–2020). |
Interested Board Members
Mr. Sieg is affiliated with Lord Abbett and is an “interested person” of the Fund as defined in the Act. Mr. Sieg is a board member of each of the 15 investment companies in the Lord Abbett Family of Funds, which consist of 63 investment portfolios. Mr. Sieg is an officer of the Lord Abbett Family of Funds.
60
Basic Information About Management (continued)
Name, Address and
Year of Birth | | Current Position and
Length of Service
with the Fund | | Principal Occupation and Other Directorships
During the Past Five Years |
Douglas B. Sieg
Lord, Abbett & Co. LLC
90 Hudson Street
Jersey City, NJ 07302
(1969) | | Board member since 2016 | | Principal Occupation: Managing Partner of Lord Abbett (since 2018) and was formerly Head of Client Services, joined Lord Abbett in 1994.
Other Directorships: None. |
Officers
None of the officers listed below have received compensation from the Fund. All of the officers of the Fund also may be officers of the other Lord Abbett Funds and maintain offices at 90 Hudson Street, Jersey City, NJ 07302. Unless otherwise indicated, the position(s) and title(s) listed under the “Principal Occupation During the Past Five Years” column indicate each officer’s position(s) and title(s) with Lord Abbett. Each officer serves for an indefinite term (i.e., until his or her death, resignation, retirement, or removal).
Name and
Year of Birth | | Current Position
with the Fund | | Length of Service
of Current
Position | | Principal Occupation
During the Past Five Years |
Douglas B. Sieg
(1969) | | President and Chief Executive Officer | | Elected as President and Chief Executive Officer in 2018 | | Managing Partner of Lord Abbett (since 2018) and was formerly Head of Client Services, joined Lord Abbett in 1994. |
| | | | | | | |
Jackson C. Chan
(1964) | | AML Compliance Officer | | Elected in 2018 | | Deputy Chief Compliance Officer and Director of Regulatory Affairs, joined Lord Abbett in 2014. |
| | | | | | | |
Michael J. Hebert
(1976) | | Chief Financial Officer and Treasurer | | Elected as Chief Financial Officer and Treasurer in 2021 | | Head of Global Fund Finance, joined Lord Abbett in 2021 and was formerly Vice President at Eaton Vance Management (EVM) (2014–2021) and Calvert Research & Management (CRM) (2016–2021), and Assistant Treasurer of registered investment companies managed, advised or administered by EVM and CRM during such years. |
| | | | | | | |
Jennifer C. Karam
(1970) | | Vice President and
Assistant Secretary | | Elected in 2022 | | Partner and Senior Deputy General Counsel, joined Lord Abbett in 2012. |
| | | | | | | |
Joseph M. McGill
(1962) | | Chief Compliance Officer | | Elected in 2014 | | Partner and Chief Compliance Officer, joined Lord Abbett in 2014. |
61
Basic Information About Management (concluded)
Name and
Year of Birth | | Current Position
with the Fund | | Length of Service
of Current
Position | | Principal Occupation
During the Past Five Years |
Parker J. Milender
(1989) | | Vice President and
Assistant Secretary | | Elected in 2023 | | Counsel, joined Lord Abbett in 2021 and was formerly an Associate at Milbank LLP (2017–2021). |
| | | | | | | |
Matthew A. Press
(1987) | | Vice President and
Assistant Secretary | | Elected in 2023 | | Counsel, joined Lord Abbett in 2022 and was formerly an Associate at Clifford Chance US LLP (2014–2022). |
| | | | | | | |
Lawrence B. Stoller
(1963) | | Vice President, Secretary
and Chief Legal Officer | | Elected as Vice President and Secretary in 2007 and Chief Legal Officer in 2019 | | Partner and General Counsel, joined Lord Abbett in 2007. |
| | | | | | | |
Victoria Zozulya
(1983) | | Vice President and
Assistant Secretary | | Elected in 2022 | | Counsel, joined Lord Abbett in 2022 and was formerly Senior Director and Counsel at Equitable (2018–2022) and Assistant General Counsel at Neuberger Berman (2014–2018). |
| | | | | | | |
Nicholas D. Emguschowa
(1986) | | Data Protection
Officer | | Elected in 2022 | | Assistant General Counsel, joined Lord Abbett in 2018 and was formerly Associate at Shearman & Sterling (2014–2018). |
Please call 888-522-2388 for a copy of the statement of additional information, which contains further information about the Fund’s Board members. It is available free upon request.
62
Householding
The Company has adopted a policy that allows it to send only one copy of the Fund’s prospectus, proxy material, annual report and semiannual report (or related notice of internet availability of annual report and semiannual report) to certain shareholders residing at the same “household.” This reduces Fund expenses, which benefits you and other shareholders. If you need additional copies or do not want your mailings to be “householded,” please call Lord Abbett at 888-522-2388 or send a written request with your name, the name of your fund or funds and your account number or numbers to Lord Abbett Family of Funds, P.O. Box 219336, Kansas City, MO 64121.
Proxy Voting Policies, Procedures and Records
A description of the policies and procedures that Lord Abbett uses to vote proxies related to the Fund’s portfolio securities, and information on how Lord Abbett voted the Fund’s proxies during the 12-month period ended June 30 are available without charge, upon request, (i) by calling 888-522-2388; (ii) on Lord Abbett’s website at www.lordabbett.com; and (iii) on the Securities and Exchange Commission’s (“SEC”) website at www.sec.gov.
Shareholder Reports and Quarterly Portfolio Disclosure
The Fund is required to file its complete schedule of portfolio holdings with the SEC for its first and third fiscal quarters as an attachment to Form N-PORT. Copies of the filings are available without charge, upon request on the SEC’s website at www.sec.gov and may be available by calling Lord Abbett at 888-522-2388.
63


| This report, when not used for the general information of shareholders of the Fund, is to be distributed only if preceded or accompanied by a current fund prospectus. | | | | |
| | | | |
Lord Abbett mutual fund shares are distributed by LORD ABBETT DISTRIBUTOR LLC. | | Lord Abbett Series Fund, Inc. Short Duration Income Portfolio | | SFSDI-PORT-2
(02/23) |

LORD ABBETT
ANNUAL REPORT
Lord Abbett
Series Fund—Total Return Portfolio
For the fiscal year ended December 31, 2022
Table of Contents
Lord Abbett Series Fund — Total Return Portfolio
Annual Report
For the fiscal year ended December 31, 2022

From left to right: James L.L. Tullis, Independent Chair of the Lord Abbett Funds and Douglas B. Sieg, Director, President, and Chief Executive Officer of the Lord Abbett Funds. | | Dear Shareholders: We are pleased to provide you with this overview of the performance of Lord Abbett Series Fund - Total Return Portfolio for the fiscal year ended December 31, 2022. On this page and the following pages, we discuss the major factors that influenced fiscal year performance. For detailed and timely information about the Fund, please visit our website at www.lordabbett.com, where you can also access the quarterly commentaries that provide updates on the Fund’s performance and other portfolio related updates. Thank you for investing in Lord Abbett mutual funds. We value the trust that you place in us and look forward to serving your investment needs in the years to come. Best regards, 
Douglas B. Sieg Director, President and Chief Executive Officer |
For the fiscal year ended December 31, 2022, the Fund returned –14.05%, reflecting performance at the net asset value (NAV) of Class VC shares with all distributions reinvested, compared to its benchmark, the Bloomberg U.S. Aggregate Bond Index*, which returned –13.01% over the same period.
The twelve-month period ending December 31, 2022, introduced meaningful headwinds for U.S. markets that led to selloffs in virtually all asset classes. The major risks over the period were inflationary pressures, which reached multi-decade highs, and the most rapid
pace of interest rate hikes implemented in history by the U.S. Federal Reserve (Fed). Rates spiked across the U.S. yield curve as a result, with U.S. Treasury yields at almost all maturities reaching their highest levels in years. Other notable challenges for markets included supply chain dislocations and labor shortages influenced in part by the Omicron variant of COVID-19, as well as escalating geopolitical tensions headlined by Russia’s invasion of Ukraine.
The surge in rates over the year caused softness in both major fixed income and equity indices. Equities fared the worst amid the sell-off, with the S&P 500 Index1
1
returning –18.11% and experiencing its worst year since the Global Financial Crisis (GFC). The tech-heavy NASDAQ2 also logged its worst year since 2008, declining –32.54% as growth-related stocks in semiconductor and software sectors suffered in the face of inflationary pressures. Within fixed income, higher rates caused underperformance in longer duration bonds. These included U.S. Treasuries3 and investment grade bonds4 which returned –12.46% and –15.76% over the period, respectively. However, high yield bond5 and leveraged loan6 indexes outperformed the investment grade index for the period because of their lower duration profiles. Notably, high yield bonds and leveraged loans returned –11.21% and –1.06%, respectively, outperforming higher quality bonds despite recessionary fears in the U.S. economy contributing to wider spreads. Leveraged loans in particular were able to significantly outperform relative to other assets given their insulation from rate volatility due to their floating-rate coupons.
Inflationary concerns began to take focus towards the end of 2021 before becoming a dominant storyline in 2022. Headline consumer price index (CPI) readings had hovered a little above 5% year-over-year for most of 2021, which led investors to question whether this period of rising prices would be more persistent than originally thought. This debate intensified in the beginning of the year as inflation readings continued as climb
throughout the first half of 2022, with CPI peaking at 9.1% year-over-year in June. The surge in prices was due primarily to an imbalance between supply and demand dynamics across multiple industries, including energy, food, and used cars.
Inflationary pressures throughout the period were most evident in energy costs, which rose more than 30% year-over-year by the end of June. The energy sector, which had been subject to rising consumer demand as global economies reopened from lockdowns induced by COVID-19, faced added friction with Russia’s invasion of Ukraine as Russia had been a large exporter of oil and certain minerals. Various sanctions were instilled on Russia from Western nations in response to their aggression towards Ukraine, which contributed to surging prices. Crude oil specifically reached over $100 per barrel, the highest value since 2014.
The Fed pivoted towards a much more hawkish stance on monetary policy during the period given the surge in inflation. After remaining mostly consistent in its messaging around expectations that price pressures would be transitory, elevated and more persistent inflation pressures caused the Fed to move the target federal funds rate into more restrictive territory. This resulted in a 25-basis point (bps) hike in the federal funds rate at the March Federal Open Market Committee (FOMC) meeting, the first hike in more than three years. Five additional rate hikes followed in the succeeding months, one of 50 bps, and
2
four consecutive hikes of 75 bps and an additional one of 50 bps as inflation prints continued to come mostly in hotter than expected, resulting in a federal funds rate at a range of 4.25%–4.50% by the end of 2022. Bond yields shot up amid this aggressive policy, leading to a bearish curve flattening and ultimately periods of significant yield curve inversion, with the spread between the 2-year and 10-year Treasury yields hitting its most negative level in more than 40 years.
Key macroeconomic indicators trended lower throughout the period. Most notably, the U.S. reported real GDP decline of –1.6% in the first quarter of 2022 and –0.9% in the second quarter before returning to growth in the third quarter. Worries of an impending recession resulted in consumer sentiment dropping to levels worse than during the height of the COVID-19 pandemic and the GFC of 2008.
Despite rising recessionary signs, select bright spots in the U.S. economy supported the idea that a potential recession would be shallow. One of the most positive developments seemed to be the traction behind the peak inflation narrative, which gained momentum in the fourth quarter from lower-than-expected CPI prints in both October and November. In addition, energy prices retracted from their multi-year highs, rent prices began to stabilize, and wage growth showed signs of softening. Job growth also remained strong in the period, and the U.S. national unemployment rate continued to hover
around pre-COVID lows. Companies also cited relatively stable demand in both second and third quarter earnings seasons as consumers remained resilient despite higher prices. Separately, labor shortages eased, and supply chain frictions moderated, providing added benefits for companies managing generally higher input costs.
For the twelve-month period ended December 31, 2022, the Fund’s underweight position to duration versus the benchmark was the largest contributor to relative performance as interest rates sold off and interest rate sensitive bonds were negatively affected.
Also contributing to relative performance was an off-benchmark allocation to asset-backed securities (ABS). The short-term, high quality ABS allocation outperformed the broader benchmark over the period as the sector was better insulated against rising interest rates than other fixed income sectors with longer duration profiles.
Another contributor to relative performance over the period was security selection within agency mortgage-backed securities (MBS). Specifically, our focus on higher coupon agency MBS benefitted relative performance as higher carry offset some of the principal losses driven by rate volatility.
The largest detractor from relative performance over the period was an overweight to high yield credit. High yield credit underperformed the Fund’s
3
benchmark on a duration-adjusted basis, as investors weighed the risks of owning lower quality companies amidst rising interest rates and higher financing costs.
Also detracting from relative performance was security selection within commercial mortgage-backed securities (CMBS) and investment-grade corporate credit.
Another detractor from relative performance was the Fund’s allocation to collateralized loan obligations (CLO) and
commercial mortgage-backed securities (CMBS) which underperformed the Fund’s benchmark as increased market volatility and liquidity concerns acted as headwinds.
The Fund’s portfolio is actively managed and, therefore, its holdings and the weightings of a particular issuer or particular sector as a percentage of portfolio assets are subject to change. Sectors may include many industries.
* The Bloomberg U.S. Aggregate Bond Index represents securities that are SEC-registered, taxable, and dollar denominated. The index covers the U.S. investment grade fixed rate bond market, with index components for government and corporate securities, mortgage pass-through securities, and asset-backed securities. Total return comprises price appreciation/depreciation and income as a percentage of the original investment.
1 The S&P 500® Index is widely regarded as the standard for measuring large cap U.S. stock market performance and includes a representative sample of leading companies in leading industries.
2 The Nasdaq Composite Index is the market capitalization-weighted index of over 2,500 common equities listed on the Nasdaq stock exchange.
3 As represented by the U.S. Treasury component of the Bloomberg U.S. Government Index as of 12/31/2022.
4 As represented by the Bloomberg US Corp Investment Grade Index as of 12/31/2022.
5 As represented by the ICE BofA U.S. High Yield Constrained Index as of 12/31/2022.
6 As represented by the Credit Suisse Leveraged Loan Index as of 12/31/2022.
Unless otherwise specified, indexes reflect total return, with all dividends reinvested. Indexes are unmanaged, do not reflect the deduction of fees or expenses, and are not available for direct investment.
Important Performance and Other Information
Performance data quoted in the following pages reflect past performance and are no guarantee of future results. Current performance may be higher or lower than the performance quoted.
The investment return and principal value of an investment in the Fund will fluctuate so that shares, on any given day or when redeemed, may be worth more or less than their original cost. You can obtain performance data current to the most recent month end by calling Lord Abbett at 888-522-2388 or referring to www.lordabbett.com.
During certain periods shown, expense waivers and reimbursements were in place. Without such expense waivers and reimbursements, the Fund’s returns would have been lower.
The annual commentary above discusses the views of the Fund’s management and various portfolio holdings of the Fund as of December 31, 2022. These views and portfolio holdings may have changed after this date. Information provided in the commentary is not a recommendation to buy or sell securities. Because the Fund’s portfolio is actively managed and may change significantly, the Fund may no longer own the securities described above or may have otherwise changed its position in the securities. For more recent information about the Fund’s portfolio holdings, please visit www.lordabbett.com.
A Note about Risk: See Notes to Financial Statements for a discussion of investment risks. For a more detailed discussion of the risks associated with the Fund, please see the Fund’s prospectus.
Mutual funds are not insured by the FDIC, are not deposits or other obligations of, or guaranteed by, banks, and are subject to investment risks including possible loss of principal amount invested.
The Fund serves as an underlying investment vehicle for variable annuity contracts and variable life insurance policies.
4
Investment Comparison
Below is a comparison of a $10,000 investment in Class VC shares with the same investment in the Bloomberg U.S. Aggregate Bond® Index and the Barclays U.S. Universal Index, assuming reinvestment of all dividends and distributions. The Fund’s shares are sold only to insurance company separate accounts that fund certain variable annuity and variable life contracts. The line graph comparison does not reflect the sales charges or other expenses of these contracts. If those sales charges and expenses were reflected, returns would be lower. The graph and performance table below do not reflect the deduction of taxes that a shareholder would pay on Fund distributions or the redemption of Fund shares. During the period, expenses of the Fund were waived or reimbursed by Lord Abbett; without such waiver or reimbursement of expenses, the Fund’s returns would have been lower. Past performance is no guarantee of future results.
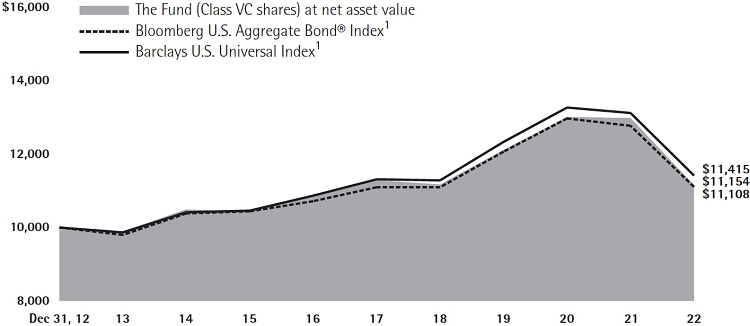
Average Annual Total Returns for the
Periods Ended December 31, 2022 |
| | | 1 Year | | 5 Years | | 10 Years | |
| Class VC | | -14.05% | | -0.23% | | 1.10% | |
1 Performance for each unmanaged index does not reflect any fees or expenses. The performance of each index is not necessarily representative of the Fund’s performance.
5
Expense Example
As a shareholder of the Fund, you incur ongoing costs, including management fees; expenses related to the Fund’s services arrangements with certain insurance companies; and other Fund expenses. This Example is intended to help you understand your ongoing costs (in dollars) of investing in the Fund and to compare these costs with the ongoing costs of investing in other mutual funds.
The Example is based on an investment of $1,000 invested at the beginning of the period and held for the entire period (July 1, 2022 through December 31, 2022).
The Example reflects only expenses that are deducted from the assets of the Fund. Fees and expenses, including sales charges applicable to the various insurance products that invest in the Fund, are not reflected in this Example. If such fees and expenses were reflected in the Example, the total expenses shown would be higher. Fees and expenses regarding such variable insurance products are separately described in the prospectus related to those products.
Actual Expenses
The first line of the table on the following page provides information about actual account values and actual expenses. You may use the information in this line, together with the amount you invested, to estimate the expenses that you paid over the period. Simply divide your account value by $1,000 (for example, an $8,600 account value divided by $1,000 = 8.6), then multiply the result by the number in the first line under the heading titled “Expenses Paid During Period 7/1/22 – 12/31/22” to estimate the expenses you paid on your account during this period.
Hypothetical Example for Comparison Purposes
The second line of the table on the following page provides information about hypothetical account values and hypothetical expenses based on the Fund’s actual expense ratio and an assumed rate of return of 5% per year before expenses, which is not the Fund’s actual return. The hypothetical account values and expenses may not be used to estimate the actual ending account balance or expenses you paid for the period. You may use this information to compare the ongoing costs of investing in the Fund and other funds. To do so, compare this 5% hypothetical example with the 5% hypothetical examples that appear in the shareholder reports of the other funds.
6
Please note that the expenses shown in the table are meant to highlight your ongoing costs only and do not reflect any transactional costs, such as sales charges (loads). Therefore, the second line of the table is useful in comparing ongoing costs only, and will not help you determine the relative total costs of owning different funds. In addition, if these transactional costs were included, your costs would have been higher.
| | | Beginning
Account
Value | | Ending
Account
Value | | Expenses
Paid During
Period† |
| | | 7/1/22 | | 12/31/22 | | 7/1/22 –
12/31/22 |
| Class VC | | | | | | | | | | | | |
| Actual | | $ | 1,000.00 | | | $ | 972.00 | | | $ | 3.53 | |
| Hypothetical (5% Return Before Expenses) | | $ | 1,000.00 | | | $ | 1,021.63 | | | $ | 3.62 | |
| † | Net expenses are equal to the Fund’s annualized expense ratio of 0.71%, multiplied by the average account value over the period, multiplied by 184/365 (to reflect one-half year period). |
Portfolio Holdings Presented by Sector
December 31, 2022
| Sector* | %** |
| Asset Backed Securities | 14.28 | % |
| Basic Materials | 1.36 | % |
| Communications | 3.70 | % |
| Consumer Cyclical | 1.43 | % |
| Consumer Non-cyclical | 6.67 | % |
| Energy | 4.06 | % |
| Financials | 12.31 | % |
| Foreign Government | 3.64 | % |
| Industrials | 0.65 | % |
| Mortgage–Backed Securities | 5.41 | % |
| Technology | 1.06 | % |
| U.S. Government | 39.49 | % |
| Utilities | 4.10 | % |
| Repurchase Agreements | 1.84 | % |
| Total | 100.00 | % |
| * | | A sector may comprise several industries. |
| ** | | Represents percent of total investments, which excludes derivatives. |
7
Schedule of Investments
December 31, 2022
| Investments | | Interest
Rate | | Maturity
Date | | Principal
Amount | | | Fair
Value | |
| LONG-TERM INVESTMENTS 107.94% | | | | | | | | | | | | |
| | | | | | | | | | | | | |
| ASSET-BACKED SECURITIES 15.82% | | | | | | | | | | | | |
| | | | | | | | | | | | | |
| Automobiles 5.22% | | | | | | | | | | | | |
| Avid Automobile Receivables Trust 2019-1 C† | | 3.14% | | 7/15/2026 | | $ | 436,696 | | | $ | 434,518 | |
| Carvana Auto Receivables Trust NP1 2020-N1A E† | | 5.20% | | 7/15/2027 | | | 1,500,000 | | | | 1,383,035 | |
| CPS Auto Receivables Trust 2019-B E† | | 5.00% | | 3/17/2025 | | | 575,000 | | | | 573,402 | |
| CPS Auto Receivables Trust 2020-C C† | | 1.71% | | 8/17/2026 | | | 214,688 | | | | 213,340 | |
| Exeter Automobile Receivables Trust 2018-3A E† | | 5.43% | | 8/15/2024 | | | 1,940,000 | | | | 1,937,497 | |
| Exeter Automobile Receivables Trust 2020-2A E† | | 7.19% | | 9/15/2027 | | | 2,380,000 | | | | 2,375,240 | |
| First Investors Auto Owner Trust 2021-1A E† | | 3.35% | | 4/15/2027 | | | 1,000,000 | | | | 880,430 | |
| Flagship Credit Auto Trust 2018-3 E† | | 5.28% | | 12/15/2025 | | | 1,425,000 | | | | 1,395,601 | |
| Flagship Credit Auto Trust 2018-4 E† | | 5.51% | | 3/16/2026 | | | 1,675,000 | | | | 1,630,525 | |
| Flagship Credit Auto Trust 2021-1 A† | | 0.31% | | 6/16/2025 | | | 139,267 | | | | 138,557 | |
| Flagship Credit Auto Trust 2022-3 A3† | | 4.55% | | 4/15/2027 | | | 2,010,000 | | | | 1,980,117 | |
| GM Financial Automobile Leasing Trust 2022-2 A2 | | 2.93% | | 10/21/2024 | | | 2,655,656 | | | | 2,625,420 | |
| Hertz Vehicle Financing III LP 2021-2A A† | | 1.68% | | 12/27/2027 | | | 1,669,000 | | | | 1,455,599 | |
| Santander Consumer Auto Receivables Trust 2020-BA C† | | 1.29% | | 4/15/2026 | | | 2,081,000 | | | | 2,006,310 | |
| Santander Consumer Auto Receivables Trust 2021-AA E† | | 3.28% | | 3/15/2027 | | | 1,386,000 | | | | 1,249,474 | |
| Santander Drive Auto Receivables Trust 2020-3 D | | 1.64% | | 11/16/2026 | | | 2,350,000 | | | | 2,253,683 | |
| Santander Drive Auto Receivables Trust 2022-5 C | | 4.74% | | 10/16/2028 | | | 2,055,000 | | | | 1,988,259 | |
| Santander Drive Auto Receivables Trust 2022-6 C | | 4.96% | | 11/15/2028 | | | 2,310,000 | | | | 2,236,074 | |
| Westlake Automobile Receivables Trust 2019-2A D† | | 3.20% | | 11/15/2024 | | | 703,522 | | | | 702,071 | |
| Westlake Automobile Receivables Trust 2020-3A E† | | 3.34% | | 6/15/2026 | | | 1,450,000 | | | | 1,390,562 | |
| Westlake Automobile Receivables Trust 2021-1A E† | | 2.33% | | 8/17/2026 | | | 1,850,000 | | | | 1,699,395 | |
| Total | | | | | | | | | | | 30,549,109 | |
| | | | | | | | | | | | | |
| Credit Card 1.06% | | | | | | | | | | | | |
| American Express Credit Account Master Trust 2022-3 A | | 3.75% | | 8/15/2027 | | | 1,350,000 | | | | 1,320,816 | |
| BA Credit Card Trust 2022-A2 A2 | | 5.00% | | 4/17/2028 | | | 2,820,000 | | | | 2,849,799 | |
| Discover Card Execution Note Trust 2022-A3 A3 | | 3.56% | | 7/15/2027 | | | 2,085,000 | | | | 2,025,805 | |
| Total | | | | | | | | | | | 6,196,420 | |
| | | | | | | | | | | | | |
| Home Equity 0.00% | | | | | | | | | | | | |
| New Century Home Equity Loan Trust 2005-A A6 | | 4.694% | | 8/25/2035 | | | 2,787 | | | | 2,634 | |
| 8 | See Notes to Financial Statements. |
Schedule of Investments (continued)
December 31, 2022
| Investments | | Interest
Rate | | Maturity
Date | | Principal
Amount | | | Fair
Value | |
| Other 9.51% | | | | | | | | | | | | |
| Apidos CLO XXVI 2017-26A A2R† | | 5.694%
(3 Mo. LIBOR + 1.50% | )# | 7/18/2029 | | $ | 570,000 | | | $ | 553,348 | |
| Arbor Realty Commercial Real Estate Notes Ltd. 2021-FL2 E† | | 7.268%
(1 Mo. LIBOR + 2.95% | )# | 5/15/2036 | | | 330,000 | | | | 302,596 | |
| Ares XL CLO Ltd. 2016-40A A1RR† | | 4.949%
(3 Mo. LIBOR + .87% | )# | 1/15/2029 | | | 759,420 | | | | 751,021 | |
| Avant Loans Funding Trust 2022-REV1 A† | | 6.54% | | 9/15/2031 | | | 2,765,000 | | | | 2,702,184 | |
| Bain Capital Credit CLO 2019-2A AR† | | 5.179%
(3 Mo. LIBOR + 1.10% | )# | 10/17/2032 | | | 1,690,000 | | | | 1,654,227 | |
| Barings CLO Ltd. 2019-3A A1R† | | 5.313%
(3 Mo. LIBOR + 1.07% | )# | 4/20/2031 | | | 2,000,000 | | | | 1,963,946 | |
| Carlyle US CLO Ltd. 2019-1A A1AR† | | 5.323%
(3 Mo. LIBOR + 1.08% | )# | 4/20/2031 | | | 1,330,000 | | | | 1,305,736 | |
| Carlyle US CLO Ltd. 2021-1A A1† | | 5.219%
(3 Mo. LIBOR + 1.14% | )# | 4/15/2034 | | | 2,860,000 | | | | 2,781,863 | |
| CIFC Funding I Ltd. 2021-1A A1† | | 5.468%
(3 Mo. LIBOR + 1.11% | )# | 4/25/2033 | | | 2,690,000 | | | | 2,651,361 | |
| CIFC Funding V Ltd. 2014-5A A1R2† | | 5.279%
(3 Mo. LIBOR + 1.20% | )# | 10/17/2031 | | | 640,000 | | | | 632,132 | |
| Dryden Senior Loan Fund 2017-47A BR† | | 5.549%
(3 Mo. LIBOR + 1.47% | )# | 4/15/2028 | | | 1,990,000 | | | | 1,938,279 | |
| Goldentree Loan Opportunities X Ltd. 2015-10A AR† | | 5.363%
(3 Mo. LIBOR + 1.12% | )# | 7/20/2031 | | | 750,000 | | | | 741,357 | |
| HGI CRE CLO Ltd. 2021-FL1 C† | | 6.026%
(1 Mo. LIBOR + 1.70% | )# | 6/16/2036 | | | 1,150,000 | | | | 1,071,017 | |
| Lending Funding Trust 2020-2A A† | | 2.32% | | 4/21/2031 | | | 1,840,000 | | | | 1,604,041 | |
| Lendmark Funding Trust 2021-1A A† | | 1.90% | | 11/20/2031 | | | 1,400,000 | | | | 1,190,397 | |
| Lendmark Funding Trust 2021-2A D† | | 4.46% | | 4/20/2032 | | | 650,000 | | | | 477,841 | |
| LoanCore Issuer Ltd. 2022-CRE7 A† | | 5.358%
(1 Mo. SOFR + 1.55% | )# | 1/17/2037 | | | 1,350,000 | | | | 1,299,784 | |
| Logan CLO I Ltd. 2021-1A A† | | 5.403%
(3 Mo. LIBOR + 1.16% | )# | 7/20/2034 | | | 1,040,000 | | | | 1,014,584 | |
| Magnetite VII Ltd. 2012-7A A1R2† | | 4.879%
(3 Mo. LIBOR + .80% | )# | 1/15/2028 | | | 1,614,977 | | | | 1,593,202 | |
| Marble Point CLO XVII Ltd. 2020-1A A† | | 5.543%
(3 Mo. LIBOR + 1.30% | )# | 4/20/2033 | | | 1,134,614 | | | | 1,114,758 | |
| Mariner Finance Issuance Trust 2021-BA E† | | 4.68% | | 11/20/2036 | | | 650,000 | | | | 489,331 | |
| Marlette Funding Trust 2020-2A D† | | 4.65% | | 9/16/2030 | | | 2,070,000 | | | | 2,025,688 | |
| ME Funding LLC 2019-1 A2† | | 6.448% | | 7/30/2049 | | | 1,951,640 | | | | 1,879,092 | |
| | See Notes to Financial Statements. | 9 |
Schedule of Investments (continued)
December 31, 2022
| Investments | | Interest
Rate | | Maturity
Date | | Principal
Amount | | | Fair
Value | |
| Other (continued) | | | | | | | | | | | | |
| Mountain View CLO LLC 2017-1A AR† | | 5.169%
(3 Mo. LIBOR + 1.09% | )# | 10/16/2029 | | $ | 978,058 | | | $ | 967,636 | |
| Neuberger Berman Loan Advisers CLO Ltd. 2019-35A A1† | | 5.567%
(3 Mo. LIBOR + 1.34% | )# | 1/19/2033 | | | 2,000,000 | | | | 1,972,035 | |
| OCP CLO Ltd. 2019-16A AR† | | 4.909%
(3 Mo. LIBOR + 1.00% | )# | 4/10/2033 | | | 1,510,000 | | | | 1,476,323 | |
| OneMain Financial Issuance Trust 2020-2A C† | | 2.76% | | 9/14/2035 | | | 2,745,000 | | | | 2,295,938 | |
| Rad CLO Ltd. 2020-7A A1† | | 5.279%
(3 Mo. LIBOR + 1.20% | )# | 4/17/2033 | | | 2,072,404 | | | | 2,031,656 | |
| SCF Equipment Leasing LLC 2019-2A B† | | 2.76% | | 8/20/2026 | | | 1,442,000 | | | | 1,389,692 | |
| SCF Equipment Leasing LLC 2021-1A D† | | 1.93% | | 9/20/2030 | | | 1,369,000 | | | | 1,204,938 | |
| SEB Funding LLC 2021-1A A2† | | 4.969% | | 1/30/2052 | | | 1,536,150 | | | | 1,304,576 | |
| Signal Peak CLO Ltd. 2020-8A A† | | 5.513%
(3 Mo. LIBOR + 1.27% | )# | 4/20/2033 | | | 2,004,915 | | | | 1,954,963 | |
| Sunrun Demeter Issuer 2021-2A A† | | 2.27% | | 1/30/2057 | | | 761,192 | | | | 595,627 | |
| TCW CLO Ltd. 2022 1A A1† | | 5.40%
(3 Mo. Term SOFR + 1.34% | )# | 4/22/2033 | | | 1,500,000 | | | | 1,462,900 | |
| Verizon Master Trust 2022-1 A | | 1.04% | | 1/20/2027 | | | 4,500,000 | | | | 4,402,351 | |
| Verizon Master Trust 2022-7 A1A | | 5.23% | | 11/22/2027 | | | 2,820,000 | | | | 2,837,800 | |
| Total | | | | | | | | | | | 55,634,220 | |
| | | | | | | | | | | | | |
| Student Loan 0.03% | | | | | | | | | | | | |
| Towd Point Asset Trust 2018-SL1 A† | | 4.989%
(1 Mo. LIBOR + .60% | )# | 1/25/2046 | | | 190,381 | | | | 189,306 | |
| Total Asset-Backed Securities (cost $97,219,131) | | | | | | | | | | | 92,571,689 | |
| | | | | | | | | | | | | |
| CORPORATE BONDS 41.20% | | | | | | | | | | | | |
| | | | | | | | | | | | | |
| Aerospace/Defense 0.29% | | | | | | | | | | | | |
| Bombardier, Inc. (Canada)†(a) | | 6.00% | | 2/15/2028 | | | 622,000 | | | | 575,935 | |
| TransDigm, Inc. | | 4.625% | | 1/15/2029 | | | 639,000 | | | | 562,975 | |
| TransDigm, Inc. | | 6.375% | | 6/15/2026 | | | 569,000 | | | | 554,442 | |
| Total | | | | | | | | | | | 1,693,352 | |
| | | | | | | | | | | | | |
| Agriculture 1.19% | | | | | | | | | | | | |
| BAT Capital Corp. | | 3.222% | | 8/15/2024 | | | 1,432,000 | | | | 1,379,742 | |
| Cargill, Inc.† | | 4.00% | | 6/22/2032 | | | 2,907,000 | | | | 2,686,172 | |
| MHP Lux SA (Luxembourg)†(a) | | 6.25% | | 9/19/2029 | | | 829,000 | | | | 394,297 | |
| Philip Morris International, Inc. | | 5.625% | | 11/17/2029 | | | 1,302,000 | | | | 1,323,910 | |
| Viterra Finance BV (Netherlands)†(a) | | 4.90% | | 4/21/2027 | | | 1,219,000 | | | | 1,148,879 | |
| Total | | | | | | | | | | | 6,933,000 | |
| 10 | See Notes to Financial Statements. |
Schedule of Investments (continued)
December 31, 2022
| Investments | | Interest
Rate | | Maturity
Date | | Principal
Amount | | | Fair
Value | |
| Airlines 0.46% | | | | | | | | | | | | |
| American Airlines, Inc.† | | 11.75% | | 7/15/2025 | | $ | 352,000 | | | $ | 378,340 | |
| British Airways Pass-Through Trust A (United Kingdom)†(a) | | 4.25% | | 5/15/2034 | | | 1,105,561 | | | | 992,092 | |
| Delta Air Lines, Inc.† | | 7.00% | | 5/1/2025 | | | 1,287,000 | | | | 1,316,406 | |
| Total | | | | | | | | | | | 2,686,838 | |
| | | | | | | | | | | | | |
| Apparel 0.19% | | | | | | | | | | | | |
| Levi Strauss & Co.† | | 3.50% | | 3/1/2031 | | | 661,000 | | | | 525,488 | |
| PVH Corp. | | 7.75% | | 11/15/2023 | | | 561,000 | | | | 572,343 | |
| Total | | | | | | | | | | | 1,097,831 | |
| | | | | | | | | | | | | |
| Auto Manufacturers 0.26% | | | | | | | | | | | | |
| Ford Motor Co. | | 3.25% | | 2/12/2032 | | | 2,008,000 | | | | 1,509,457 | |
| | | | | | | | | | | | | |
| Banks 9.15% | | | | | | | | | | | | |
| ABN AMRO Bank NV (Netherlands)†(a) | | 3.324%
(5 Yr. Treasury
CMT + 1.90% | )# | 3/13/2037 | | | 800,000 | | | | 580,152 | |
| Bank of America Corp. | | 2.087%
(SOFR + 1.06% | )# | 6/14/2029 | | | 1,549,000 | | | | 1,306,204 | |
| Bank of America Corp. | | 2.687%
(SOFR + 1.32% | )# | 4/22/2032 | | | 1,000,000 | | | | 802,785 | |
| Bank of America Corp. | | 3.97%
(3 Mo. LIBOR + 1.07% | )# | 3/5/2029 | | | 3,996,000 | | | | 3,694,259 | |
| BankUnited, Inc. | | 5.125% | | 6/11/2030 | | | 1,140,000 | | | | 1,058,698 | |
| BNP Paribas SA (France)†(a) | | 4.375%
(5 Yr. Swap rate + 1.48% | )# | 3/1/2033 | | | 1,296,000 | | | | 1,147,414 | |
| Citigroup, Inc. | | 2.666%
(SOFR + 1.15% | )# | 1/29/2031 | | | 816,000 | | | | 671,014 | |
| Citigroup, Inc. | | 3.887%
(3 Mo. LIBOR + 1.56% | )# | 1/10/2028 | | | 2,186,000 | | | | 2,045,858 | |
| Citigroup, Inc. | | 3.98%
(3 Mo. LIBOR + 1.34% | )# | 3/20/2030 | | | 4,576,000 | | | | 4,136,324 | |
| Citigroup, Inc. | | 4.14%
(SOFR + 1.37% | )# | 5/24/2025 | | | 605,000 | | | | 593,615 | |
| Danske Bank A/S (Denmark)†(a) | | 3.773%
(1 Yr. Treasury
CMT + 1.45% | )# | 3/28/2025 | | | 2,071,000 | | | | 2,007,682 | |
| Danske Bank A/S (Denmark)†(a) | | 4.375% | | 6/12/2028 | | | 200,000 | | | | 183,758 | |
| Goldman Sachs Group, Inc. (The) | | 2.383%
(SOFR + 1.25% | )# | 7/21/2032 | | | 1,500,000 | | | | 1,167,485 | |
| JPMorgan Chase & Co. | | 2.963%
(SOFR + 1.26% | )# | 1/25/2033 | | | 2,378,000 | | | | 1,941,656 | |
| | See Notes to Financial Statements. | 11 |
Schedule of Investments (continued)
December 31, 2022
| Investments | | Interest
Rate | | Maturity
Date | | Principal
Amount | | | Fair
Value | |
| Banks (continued) | | | | | | | | | | | | |
| JPMorgan Chase & Co. | | 3.54%
(3 Mo. LIBOR + 1.38% | )# | 5/1/2028 | | $ | 2,477,000 | | | $ | 2,283,112 | |
| JPMorgan Chase & Co. | | 3.782%
(3 Mo. LIBOR + 1.34% | )# | 2/1/2028 | | | 1,015,000 | | | | 949,776 | |
| Macquarie Bank Ltd. (Australia)†(a) | | 3.624% | | 6/3/2030 | | | 516,000 | | | | 418,314 | |
| Macquarie Group Ltd. (Australia)†(a) | | 2.691%
(SOFR + 1.44% | )# | 6/23/2032 | | | 2,044,000 | | | | 1,573,231 | |
| Macquarie Group Ltd. (Australia)†(a) | | 4.654%
(3 Mo. LIBOR + 1.73% | )# | 3/27/2029 | | | 1,931,000 | | | | 1,806,266 | |
| Morgan Stanley | | 2.239%
(SOFR + 1.18% | )# | 7/21/2032 | | | 1,433,000 | | | | 1,102,821 | |
| Morgan Stanley | | 2.484%
(SOFR + 1.36% | )# | 9/16/2036 | | | 1,088,000 | | | | 791,400 | |
| Morgan Stanley | | 4.431%
(3 Mo. LIBOR + 1.63% | )# | 1/23/2030 | | | 4,792,000 | | | | 4,469,621 | |
| Royal Bank of Canada (Canada)(a) | | 6.00% | | 11/1/2027 | | | 1,456,000 | | | | 1,520,441 | |
| Santander UK Group Holdings plc (United Kingdom)(a) | | 3.373%
(3 Mo. LIBOR + 1.08% | )# | 1/5/2024 | | | 1,846,000 | | | | 1,846,000 | |
| State Street Corp. | | 4.164%
(SOFR + 1.73% | )# | 8/4/2033 | | | 994,000 | | | | 921,157 | |
| Toronto-Dominion Bank (The) (Canada)(a) | | 4.456% | | 6/8/2032 | | | 800,000 | | | | 764,948 | |
| UBS AG (Switzerland)†(a) | | 5.125% | | 5/15/2024 | | | 1,399,000 | | | | 1,383,811 | |
| US Bancorp | | 4.967%
(SOFR + 2.11% | )# | 7/22/2033 | | | 2,235,000 | | | | 2,127,128 | |
| Wachovia Corp. | | 7.574% | | 8/1/2026 | | | 660,000 | | | | 712,633 | |
| Wells Fargo & Co. | | 2.188%
(SOFR + 2.00% | )# | 4/30/2026 | | | 1,422,000 | | | | 1,324,620 | |
| Wells Fargo & Co. | | 2.393%
(SOFR + 2.10% | )# | 6/2/2028 | | | 5,043,000 | | | | 4,458,501 | |
| Wells Fargo & Co. | | 3.35%
(SOFR + 1.50% | )# | 3/2/2033 | | | 1,349,000 | | | | 1,140,017 | |
| Wells Fargo & Co. | | 3.584%
(3 Mo. LIBOR + 1.31% | )# | 5/22/2028 | | | 1,873,000 | | | | 1,741,960 | |
| Westpac Banking Corp. (Australia)(a) | | 2.894%
(5 Yr. Treasury
CMT + 1.35% | )# | 2/4/2030 | | | 912,000 | | | | 836,791 | |
| Total | | | | | | | | | | | 53,509,452 | |
| | | | | | | | | | | | | |
| Beverages 0.27% | | | | | | | | | | | | |
| Anheuser-Busch Cos. LLC/Anheuser-Busch InBev Worldwide, Inc. | | 4.70% | | 2/1/2036 | | | 1,663,000 | | | | 1,576,889 | |
| 12 | See Notes to Financial Statements. |
Schedule of Investments (continued)
December 31, 2022
| Investments | | Interest
Rate | | Maturity
Date | | Principal
Amount | | | Fair
Value | |
| Biotechnology 0.06% | | | | | | | | | | |
| Baxalta, Inc. | | 4.00% | | 6/23/2025 | | $ | 375,000 | | | $ | 365,573 | |
| | | | | | | | | | | | | |
| Building Materials 0.09% | | | | | | | | | | | | |
| Standard Industries, Inc.† | | 4.375% | | 7/15/2030 | | | 677,000 | | | | 553,115 | |
| | | | | | | | | | | | | |
| Chemicals 0.42% | | | | | | | | | | | | |
| CVR Partners LP/CVR Nitrogen Finance Corp.† | | 6.125% | | 6/15/2028 | | | 649,000 | | | | 583,067 | |
| International Flavors & Fragrances, Inc.† | | 1.23% | | 10/1/2025 | | | 2,094,000 | | | | 1,851,719 | |
| Total | | | | | | | | | | | 2,434,786 | |
| | | | | | | | | | | | | |
| Coal 0.09% | | | | | | | | | | | | |
| SunCoke Energy, Inc.† | | 4.875% | | 6/30/2029 | | | 643,000 | | | | 552,779 | |
| | | | | | | | | | | | | |
| Commercial Services 0.51% | | | | | | | | | | | | |
| Adani Ports & Special Economic Zone Ltd. (India)(a) | | 4.00% | | 7/30/2027 | | | 670,000 | | | | 586,865 | |
| Gartner, Inc.† | | 3.75% | | 10/1/2030 | | | 337,000 | | | | 291,000 | |
| Global Payments, Inc. | | 4.00% | | 6/1/2023 | | | 1,988,000 | | | | 1,976,317 | |
| United Rentals North America, Inc. | | 4.00% | | 7/15/2030 | | | 155,000 | | | | 132,768 | |
| Total | | | | | | | | | | | 2,986,950 | |
| | | | | | | | | | | | | |
| Cosmetics/Personal Care 0.20% | | | | | | | | | | | | |
| GSK Consumer Healthcare Capital U.S. LLC | | 3.625% | | 3/24/2032 | | | 1,343,000 | | | | 1,182,745 | |
| | | | | | | | | | | | | |
| Diversified Financial Services 2.78% | | | | | | | | | | | | |
| AerCap Ireland Capital DAC/AerCap Global Aviation Trust (Ireland)(a) | | 4.875% | | 1/16/2024 | | | 523,000 | | | | 518,225 | |
| Aircastle Ltd.† | | 2.85% | | 1/26/2028 | | | 1,114,000 | | | | 912,823 | |
| Ally Financial, Inc. | | 8.00% | | 11/1/2031 | | | 763,000 | | | | 789,757 | |
| American Express Co. | | 4.42%
(SOFR + 1.76% | )# | 8/3/2033 | | | 1,180,000 | | | | 1,118,217 | |
| Aviation Capital Group LLC† | | 1.95% | | 1/30/2026 | | | 812,000 | | | | 707,764 | |
| Aviation Capital Group LLC† | | 5.50% | | 12/15/2024 | | | 1,928,000 | | | | 1,895,350 | |
| Avolon Holdings Funding Ltd. (Ireland)†(a) | | 2.125% | | 2/21/2026 | | | 2,161,000 | | | | 1,862,201 | |
| Avolon Holdings Funding Ltd. (Ireland)†(a) | | 4.25% | | 4/15/2026 | | | 928,000 | | | | 842,326 | |
| CPPIB Capital, Inc. (Canada)†(a) | | 4.818%
(SOFR Index + 1.25% | )# | 4/4/2025 | | | 3,800,000 | | | | 3,870,876 | |
| Intercontinental Exchange, Inc. | | 4.00% | | 9/15/2027 | | | 2,821,000 | | | | 2,728,315 | |
| Neuberger Berman Group LLC/Neuberger Berman Finance Corp.† | | 4.50% | | 3/15/2027 | | | 469,000 | | | | 446,489 | |
| Neuberger Berman Group LLC/Neuberger Berman Finance Corp.† | | 4.875% | | 4/15/2045 | | | 677,000 | | | | 549,353 | |
| Total | | | | | | | | | | | 16,241,696 | |
| | See Notes to Financial Statements. | 13 |
Schedule of Investments (continued)
December 31, 2022
| Investments | | Interest
Rate | | Maturity
Date | | Principal
Amount | | | Fair
Value | |
| Electric 3.44% | | | | | | | | | | | | |
| AEP Transmission Co. LLC | | 4.50% | | 6/15/2052 | | $ | 1,284,000 | | | $ | 1,136,581 | |
| AES Corp. (The)† | | 3.95% | | 7/15/2030 | | | 1,138,000 | | | | 1,008,951 | |
| Alfa Desarrollo SpA (Chile)†(a) | | 4.55% | | 9/27/2051 | | | 988,384 | | | | 752,799 | |
| Ausgrid Finance Pty Ltd. (Australia)†(a) | | 4.35% | | 8/1/2028 | | | 1,118,000 | | | | 1,038,658 | |
| Calpine Corp.† | | 5.125% | | 3/15/2028 | | | 609,000 | | | | 544,646 | |
| Constellation Energy Generation LLC | | 6.25% | | 10/1/2039 | | | 1,303,000 | | | | 1,334,836 | |
| Consumers Energy Co. | | 4.20% | | 9/1/2052 | | | 606,000 | | | | 521,893 | |
| Duke Energy Corp. | | 4.50% | | 8/15/2032 | | | 2,578,000 | | | | 2,422,530 | |
| Indianapolis Power & Light Co.† | | 5.65% | | 12/1/2032 | | | 2,543,000 | | | | 2,616,182 | |
| Minejesa Capital BV (Netherlands)†(a) | | 4.625% | | 8/10/2030 | | | 1,335,000 | | | | 1,175,067 | |
| NextEra Energy Capital Holdings, Inc. | | 4.255% | | 9/1/2024 | | | 66,000 | | | | 65,147 | |
| NextEra Energy Capital Holdings, Inc. | | 5.00% | | 7/15/2032 | | | 619,000 | | | | 608,978 | |
| NRG Energy, Inc.† | | 4.45% | | 6/15/2029 | | | 537,000 | | | | 475,974 | |
| Perusahaan Perseroan Persero PT Perusahaan Listrik Negara (Indonesia)†(a) | | 3.00% | | 6/30/2030 | | | 1,390,000 | | | | 1,142,632 | |
| Southern Co. (The) | | 4.475% | | 8/1/2024 | | | 2,400,000 | | | | 2,371,412 | |
| Vistra Operations Co. LLC† | | 3.55% | | 7/15/2024 | | | 3,061,000 | | | | 2,937,586 | |
| Total | | | | | | | | | | | 20,153,872 | |
| | | | | | | | | | | | | |
| Entertainment 0.30% | | | | | | | | | | | | |
| Jacobs Entertainment, Inc.† | | 6.75% | | 2/15/2029 | | | 609,000 | | | | 550,494 | |
| Live Nation Entertainment, Inc.† | | 4.75% | | 10/15/2027 | | | 604,000 | | | | 538,693 | |
| Warnermedia Holdings, Inc.† | | 3.428% | | 3/15/2024 | | | 705,000 | | | | 684,720 | |
| Total | | | | | | | | | | | 1,773,907 | |
| | | | | | | | | | | | | |
| Food 0.10% | | | | | | | | | | | | |
| Albertsons Cos., Inc./Safeway, Inc./New Albertsons LP/Albertsons LLC† | | 3.50% | | 3/15/2029 | | | 709,000 | | | | 596,404 | |
| | | | | | | | | | | | | |
| Gas 1.10% | | | | | | | | | | | | |
| CenterPoint Energy Resources Corp. | | 4.40% | | 7/1/2032 | | | 1,443,000 | | | | 1,388,010 | |
| National Fuel Gas Co. | | 5.50% | | 1/15/2026 | | | 1,622,000 | | | | 1,615,506 | |
| NiSource, Inc. | | 2.95% | | 9/1/2029 | | | 1,952,000 | | | | 1,697,123 | |
| ONE Gas, Inc. | | 1.10% | | 3/11/2024 | | | 550,000 | | | | 527,630 | |
| Southwest Gas Corp. | | 4.05% | | 3/15/2032 | | | 1,373,000 | | | | 1,209,337 | |
| Total | | | | | | | | | | | 6,437,606 | |
| 14 | See Notes to Financial Statements. |
Schedule of Investments (continued)
December 31, 2022
| Investments | | Interest
Rate | | Maturity
Date | | Principal
Amount | | | Fair
Value | |
| Health Care-Products 0.80% | | | | | | | | | | | | |
| GE HealthCare Technologies, Inc.† | | 5.65% | | 11/15/2027 | | $ | 2,613,000 | | | $ | 2,648,156 | |
| Medline Borrower LP† | | 3.875% | | 4/1/2029 | | | 663,000 | | | | 535,535 | |
| PerkinElmer, Inc. | | 0.85% | | 9/15/2024 | | | 1,605,000 | | | | 1,488,350 | |
| Total | | | | | | | | | | | 4,672,041 | |
| | | | | | | | | | | | | |
| Health Care-Services 2.32% | | | | | | | | | | | | |
| Centene Corp. | | 3.375% | | 2/15/2030 | | | 2,531,000 | | | | 2,145,339 | |
| Centene Corp. | | 4.25% | | 12/15/2027 | | | 869,000 | | | | 816,919 | |
| Elevance Health, Inc. | | 2.25% | | 5/15/2030 | | | 2,100,000 | | | | 1,742,002 | |
| Elevance Health, Inc. | | 5.50% | | 10/15/2032 | | | 1,327,000 | | | | 1,362,676 | |
| Humana, Inc. | | 1.35% | | 2/3/2027 | | | 1,718,000 | | | | 1,487,785 | |
| Humana, Inc. | | 5.875% | | 3/1/2033 | | | 2,041,000 | | | | 2,113,529 | |
| UnitedHealth Group, Inc. | | 4.00% | | 5/15/2029 | | | 2,642,000 | | | | 2,528,938 | |
| UnitedHealth Group, Inc. | | 5.25% | | 2/15/2028 | | | 1,368,000 | | | | 1,400,976 | |
| Total | | | | | | | | | | | 13,598,164 | |
| | | | | | | | | | | | | |
| Insurance 0.54% | | | | | | | | | | | | |
| Assurant, Inc. | | 2.65% | | 1/15/2032 | | | 595,000 | | | | 441,474 | |
| First American Financial Corp. | | 2.40% | | 8/15/2031 | | | 939,000 | | | | 688,555 | |
| GA Global Funding Trust† | | 3.85% | | 4/11/2025 | | | 1,689,000 | | | | 1,617,943 | |
| Metropolitan Life Global Funding I† | | 4.05% | | 8/25/2025 | | | 444,000 | | | | 434,545 | |
| Total | | | | | | | | | | | 3,182,517 | |
| | | | | | | | | | | | | |
| Internet 1.14% | | | | | | | | | | | | |
| Amazon.com, Inc. | | 4.70% | | 12/1/2032 | | | 4,226,000 | | | | 4,196,717 | |
| Netflix, Inc. | | 6.375% | | 5/15/2029 | | | 1,833,000 | | | | 1,889,763 | |
| Prosus NV (Netherlands)†(a) | | 3.257% | | 1/19/2027 | | | 660,000 | | | | 590,921 | |
| Total | | | | | | | | | | | 6,677,401 | |
| | | | | | | | | | | | | |
| Iron-Steel 0.10% | | | | | | | | | | | | |
| United States Steel Corp. | | 6.875% | | 3/1/2029 | | | 587,000 | | | | 570,562 | |
| | | | | | | | | | | | | |
| Leisure Time 0.10% | | | | | | | | | | | | |
| Life Time, Inc.† | | 5.75% | | 1/15/2026 | | | 325,000 | | | | 302,819 | |
| Royal Caribbean Cruises Ltd.† | | 8.25% | | 1/15/2029 | | | 297,000 | | | | 298,856 | |
| Total | | | | | | | | | | | 601,675 | |
| | | | | | | | | | | | | |
| Machinery-Diversified 0.33% | | | | | | | | | | | | |
| nVent Finance Sarl (Luxembourg)(a) | | 4.55% | | 4/15/2028 | | | 2,097,000 | | | | 1,929,172 | |
| | See Notes to Financial Statements. | 15 |
Schedule of Investments (continued)
December 31, 2022
| Investments | | Interest
Rate | | Maturity
Date | | Principal
Amount | | | Fair
Value | |
| Media 1.47% | | | | | | | | | | | | |
| AMC Networks, Inc. | | 4.25% | | 2/15/2029 | | $ | 677,000 | | | $ | 422,832 | |
| CCO Holdings LLC/CCO Holdings Capital Corp.† | | 4.75% | | 3/1/2030 | | | 1,312,000 | | | | 1,134,486 | |
| Charter Communications Operating LLC/Charter Communications Operating Capital | | 2.25% | | 1/15/2029 | | | 1,381,000 | | | | 1,114,070 | |
| Comcast Corp. | | 5.50% | | 11/15/2032 | | | 3,250,000 | | | | 3,399,329 | |
| FactSet Research Systems, Inc. | | 3.45% | | 3/1/2032 | | | 2,105,000 | | | | 1,770,433 | |
| Time Warner Cable Enterprises LLC | | 8.375% | | 7/15/2033 | | | 502,000 | | | | 559,311 | |
| Time Warner Cable LLC | | 7.30% | | 7/1/2038 | | | 211,000 | | | | 210,109 | |
| Total | | | | | | | | | | | 8,610,570 | |
| | | | | | | | | | | | | |
| Mining 0.99% | | | | | | | | | | | | |
| Alcoa Nederland Holding BV (Netherlands)†(a) | | 4.125% | | 3/31/2029 | | | 634,000 | | | | 563,375 | |
| Alcoa Nederland Holding BV (Netherlands)†(a) | | 6.125% | | 5/15/2028 | | | 1,119,000 | | | | 1,104,324 | |
| Anglo American Capital plc (United Kingdom)†(a) | | 4.00% | | 9/11/2027 | | | 2,455,000 | | | | 2,316,947 | |
| FMG Resources August 2006 Pty Ltd. (Australia)†(a) | | 4.375% | | 4/1/2031 | | | 696,000 | | | | 580,192 | |
| Glencore Funding LLC† | | 4.875% | | 3/12/2029 | | | 1,297,000 | | | | 1,245,795 | |
| Total | | | | | | | | | | | 5,810,633 | |
| | | | | | | | | | | | | |
| Multi-National 1.43% | | | | | | | | | | | | |
| Inter-American Investment Corp. | | 2.625% | | 4/22/2025 | | | 1,700,000 | | | | 1,628,516 | |
| International Bank for Reconstruction & Development | | 3.829%
(SOFR + 1.13% | )# | 1/13/2023 | | | 6,764,000 | | | | 6,764,036 | |
| Total | | | | | | | | | | | 8,392,552 | |
| | | | | | | | | | | | | |
| Oil & Gas 2.80% | | | | | | | | | | | | |
| California Resources Corp.† | | 7.125% | | 2/1/2026 | | | 642,000 | | | | 617,745 | |
| Callon Petroleum Co.† | | 8.00% | | 8/1/2028 | | | 633,000 | | | | 604,248 | |
| Comstock Resources, Inc.† | | 6.75% | | 3/1/2029 | | | 666,000 | | | | 602,270 | |
| Continental Resources, Inc.† | | 5.75% | | 1/15/2031 | | | 3,189,000 | | | | 2,974,780 | |
| Diamondback Energy, Inc. | | 3.125% | | 3/24/2031 | | | 2,136,000 | | | | 1,773,919 | |
| Diamondback Energy, Inc. | | 3.50% | | 12/1/2029 | | | 665,000 | | | | 584,875 | |
| EQT Corp. | | 7.00% | | 2/1/2030 | | | 3,141,000 | | | | 3,262,871 | |
| Laredo Petroleum, Inc. | | 9.50% | | 1/15/2025 | | | 579,000 | | | | 571,589 | |
| Occidental Petroleum Corp. | | 6.125% | | 1/1/2031 | | | 303,000 | | | | 306,368 | |
| Occidental Petroleum Corp. | | 6.625% | | 9/1/2030 | | | 1,719,000 | | | | 1,780,257 | |
| Ovintiv, Inc. | | 6.50% | | 2/1/2038 | | | 1,193,000 | | | | 1,186,654 | |
| Petroleos Mexicanos (Mexico)(a) | | 6.70% | | 2/16/2032 | | | 1,768,000 | | | | 1,391,773 | |
| SM Energy Co. | | 6.75% | | 9/15/2026 | | | 726,000 | | | | 705,980 | |
| Total | | | | | | | | | | | 16,363,329 | |
| 16 | See Notes to Financial Statements. |
Schedule of Investments (continued)
December 31, 2022
| Investments | | Interest
Rate | | Maturity
Date | | Principal
Amount | | | Fair
Value | |
| Pharmaceuticals 1.95% | | | | | | | | | | | | |
| AbbVie, Inc. | | 3.20% | | 11/21/2029 | | $ | 1,522,000 | | | $ | 1,375,510 | |
| Bayer Corp.† | | 6.65% | | 2/15/2028 | | | 670,000 | | | | 685,931 | |
| BellRing Brands, Inc.† | | 7.00% | | 3/15/2030 | | | 577,000 | | | | 555,954 | |
| Cigna Corp. | | 2.40% | | 3/15/2030 | | | 2,832,000 | | | | 2,378,814 | |
| Cigna Corp. | | 4.375% | | 10/15/2028 | | | 295,000 | | | | 285,106 | |
| CVS Health Corp. | | 1.75% | | 8/21/2030 | | | 1,918,000 | | | | 1,515,936 | |
| CVS Health Corp. | | 3.25% | | 8/15/2029 | | | 3,857,000 | | | | 3,458,884 | |
| Option Care Health, Inc.† | | 4.375% | | 10/31/2029 | | | 655,000 | | | | 573,770 | |
| Organon & Co./Organon Foreign Debt Co-Issuer BV† | | 4.125% | | 4/30/2028 | | | 643,000 | | | | 570,437 | |
| Total | | | | | | | | | | | 11,400,342 | |
| | | | | | | | | | | | | |
| Pipelines 1.61% | | | | | | | | | | | | |
| Buckeye Partners LP | | 6.375%
(3 Mo. LIBOR + 4.02% | )# | 1/22/2078 | | | 688,000 | | | | 586,549 | |
| Cheniere Energy Partners LP | | 3.25% | | 1/31/2032 | | | 692,000 | | | | 550,871 | |
| CNX Midstream Partners LP† | | 4.75% | | 4/15/2030 | | | 637,000 | | | | 523,592 | |
| Eastern Gas Transmission & Storage, Inc. | | 3.00% | | 11/15/2029 | | | 846,000 | | | | 732,178 | |
| EIG Pearl Holdings Sarl (Luxembourg)†(a) | | 3.545% | | 8/31/2036 | | | 1,380,000 | | | | 1,161,452 | |
| Galaxy Pipeline Assets Bidco Ltd. (United Arab Emirates)†(a) | | 3.25% | | 9/30/2040 | | | 1,613,000 | | | | 1,254,275 | |
| Kinder Morgan Energy Partners LP | | 4.25% | | 9/1/2024 | | | 1,360,000 | | | | 1,337,741 | |
| NGPL PipeCo LLC† | | 3.25% | | 7/15/2031 | | | 1,489,000 | | | | 1,215,055 | |
| Sabine Pass Liquefaction LLC | | 5.625% | | 3/1/2025 | | | 1,512,000 | | | | 1,515,267 | |
| Venture Global Calcasieu Pass LLC† | | 4.125% | | 8/15/2031 | | | 600,000 | | | | 512,250 | |
| Total | | | | | | | | | | | 9,389,230 | |
| | | | | | | | | | | | | |
| Real Estate 0.08% | | | | | | | | | | | | |
| American Tower Corp. | | 2.95% | | 1/15/2025 | | | 497,000 | | | | 474,400 | |
| | | | | | | | | | | | | |
| REITS 1.10% | | | | | | | | | | | | |
| American Tower Corp. | | 2.40% | | 3/15/2025 | | | 949,000 | | | | 893,576 | |
| American Tower Corp. | | 3.80% | | 8/15/2029 | | | 1,760,000 | | | | 1,600,437 | |
| Crown Castle, Inc. | | 3.30% | | 7/1/2030 | | | 2,308,000 | | | | 2,024,474 | |
| EPR Properties | | 4.95% | | 4/15/2028 | | | 1,069,000 | | | | 913,748 | |
| VICI Properties LP/VICI Note Co., Inc.† | | 5.625% | | 5/1/2024 | | | 1,000,000 | | | | 992,135 | |
| Total | | | | | | | | | | | 6,424,370 | |
| | See Notes to Financial Statements. | 17 |
Schedule of Investments (continued)
December 31, 2022
| Investments | | Interest
Rate | | Maturity
Date | | Principal
Amount | | | Fair
Value | |
| Retail 0.16% | | | | | | | | | | | | |
| Macy's Retail Holdings LLC† | | 5.875% | | 4/1/2029 | | $ | 617,000 | | | $ | 547,201 | |
| Murphy Oil USA, Inc. | | 4.75% | | 9/15/2029 | | | 404,000 | | | | 370,389 | |
| Total | | | | | | | | | | | 917,590 | |
| | | | | | | | | | | | | |
| Semiconductors 0.59% | | | | | | | | | | | | |
| Advanced Micro Devices, Inc. | | 3.924% | | 6/1/2032 | | | 1,189,000 | | | | 1,108,296 | |
| Advanced Micro Devices, Inc. | | 4.393% | | 6/1/2052 | | | 1,036,000 | | | | 915,934 | |
| Broadcom, Inc.† | | 4.15% | | 4/15/2032 | | | 1,591,000 | | | | 1,401,029 | |
| Total | | | | | | | | | | | 3,425,259 | |
| | | | | | | | | | | | | |
| Software 0.59% | | | | | | | | | | | | |
| Oracle Corp. | | 2.875% | | 3/25/2031 | | | 2,024,000 | | | | 1,683,127 | |
| Oracle Corp. | | 6.25% | | 11/9/2032 | | | 577,000 | | | | 605,723 | |
| Workday, Inc. | | 3.80% | | 4/1/2032 | | | 1,290,000 | | | | 1,142,336 | |
| Total | | | | | | | | | | | 3,431,186 | |
| | | | | | | | | | | | | |
| Sovereign 0.71% | | | | | | | | | | | | |
| Export Finance & Insurance Corp. (Australia)†(a) | | 4.625% | | 10/26/2027 | | | 1,455,000 | | | | 1,471,341 | |
| Svensk Exportkredit AB (Sweden)(a) | | 4.625% | | 11/28/2025 | | | 2,706,000 | | | | 2,708,570 | |
| Total | | | | | | | | | | | 4,179,911 | |
| | | | | | | | | | | | | |
| Telecommunications 1.49% | | | | | | | | | | | | |
| AT&T, Inc. | | 4.30% | | 2/15/2030 | | | 1,016,000 | | | | 959,067 | |
| Frontier Communications Holdings LLC† | | 5.00% | | 5/1/2028 | | | 641,000 | | | | 560,240 | |
| Sprint Capital Corp. | | 6.875% | | 11/15/2028 | | | 520,000 | | | | 540,901 | |
| Sprint Capital Corp. | | 8.75% | | 3/15/2032 | | | 1,122,000 | | | | 1,337,822 | |
| T-Mobile USA, Inc. | | 3.50% | | 4/15/2025 | | | 853,000 | | | | 821,074 | |
| T-Mobile USA, Inc. | | 3.875% | | 4/15/2030 | | | 2,769,000 | | | | 2,514,697 | |
| Verizon Communications, Inc. | | 2.355% | | 3/15/2032 | | | 2,465,000 | | | | 1,960,532 | |
| Total | | | | | | | | | | | 8,694,333 | |
| Total Corporate Bonds (cost $260,026,143) | | | | | | | | | | | 241,031,489 | |
| | | | | | | | | | | | | |
| FLOATING RATE LOANS(b) 0.11% | | | | | | | | | | | | |
| | | | | | | | | | | | | |
| Pharmaceuticals | | | | | | | | | | | | |
Packaging Coordinators Midco, Inc. 2020 1st Lien Term Loan
(cost $668,307) | | 8.23%
(3 Mo. LIBOR + 3.50% | ) | 11/30/2027 | | | 668,569 | | | | 635,739 | |
| 18 | See Notes to Financial Statements. |
Schedule of Investments (continued)
December 31, 2022
| Investments | | Interest
Rate | | Maturity
Date | | Principal
Amount | | | Fair
Value | |
| FOREIGN GOVERNMENT OBLIGATIONS(a) 2.14% | | | | | | | | | | | | |
| | | | | | | | | | | | | |
| Canada 0.71% | | | | | | | | | | | | |
| Export Development Canada† | | 0.52% | | 5/26/2024 | | $ | 1,400,000 | | | $ | 1,319,367 | |
| Province of Ontario Canada | | 3.10% | | 5/19/2027 | | | 2,964,000 | | | | 2,815,826 | |
| Total | | | | | | | | | | | 4,135,193 | |
| | | | | | | | | | | | | |
| Japan 0.58% | | | | | | | | | | | | |
| Japan Bank for International Cooperation | | 3.875% | | 9/16/2025 | | | 1,998,000 | | | | 1,955,135 | |
| Japan International Cooperation Agency | | 3.25% | | 5/25/2027 | | | 1,516,000 | | | | 1,438,207 | |
| Total | | | | | | | | | | | 3,393,342 | |
| | | | | | | | | | | | | |
| Nigeria 0.08% | | | | | | | | | | | | |
| Republic of Nigeria† | | 7.143% | | 2/23/2030 | | | 605,000 | | | | 465,460 | |
| | | | | | | | | | | | | |
| Norway 0.41% | | | | | | | | | | | | |
| Kommunalbanken AS† | | 5.306%
(SOFR Index + 1.00% | )# | 6/17/2026 | | | 2,350,000 | | | | 2,392,401 | |
| | | | | | | | | | | | | |
| Panama 0.23% | | | | | | | | | | | | |
| Republic of Panama | | 2.252% | | 9/29/2032 | | | 1,848,000 | | | | 1,375,384 | |
| | | | | | | | | | | | | |
| Senegal 0.09% | | | | | | | | | | | | |
| Republic of Senegal† | | 6.25% | | 5/23/2033 | | | 640,000 | | | | 530,795 | |
| | | | | | | | | | | | | |
| Sri Lanka 0.04% | | | | | | | | | | | | |
| Sri Lanka Government International Bond†(e) | | 5.875% | | 7/25/2022 | | | 670,000 | | | | 221,192 | |
| Total Foreign Government Obligations (cost $13,315,857) | | | | | | | | | | | 12,513,767 | |
| | | | | | | | | | | | | |
| GOVERNMENT SPONSORED ENTERPRISES COLLATERALIZED MORTGAGE OBLIGATIONS 1.17% | | | | | | | | |
| Freddie Mac Multifamily Structured Pass Through Certificates K145 A2 | | 2.58% | | 5/25/2032 | | | 2,596,000 | | | | 2,219,196 | |
| Freddie Mac Multifamily Structured Pass Through Certificates K149 A2 | | 3.53% | #(c) | 8/25/2032 | | | 964,000 | | | | 891,608 | |
| Freddie Mac Multifamily Structured Pass Through Certificates K-150 A2 | | 3.71% | #(c) | 9/25/2032 | | | 1,402,000 | | | | 1,315,671 | |
| Freddie Mac Multifamily Structured Pass Through Certificates KG07 A2 | | 3.123% | #(c) | 8/25/2032 | | | 2,510,000 | | | | 2,242,502 | |
| Freddie Mac Multifamily Structured Pass Through Certificates Q001 XA | | 2.116% | #(c) | 2/25/2032 | | | 2,453,629 | | | | 198,679 | |
| Total Government Sponsored Enterprises Collateralized Mortgage Obligations (cost $6,895,757) | | | | | | | 6,867,656 | |
| | See Notes to Financial Statements. | 19 |
Schedule of Investments (continued)
December 31, 2022
| Investments | | Interest
Rate | | Maturity
Date | | Principal
Amount | | | Fair
Value | |
| GOVERNMENT SPONSORED ENTERPRISES PASS-THROUGHS 23.13% | | | | | | | | | |
| Fannie Mae or Freddie Mac(d) | | 2.00% | | TBA | | $ | 3,428,000 | | | $ | 2,793,095 | |
| Fannie Mae or Freddie Mac(d) | | 3.00% | | TBA | | | 8,421,000 | | | | 7,394,716 | |
| Fannie Mae or Freddie Mac(d) | | 3.50% | | TBA | | | 684,000 | | | | 621,493 | |
| Fannie Mae or Freddie Mac(d) | | 4.00% | | TBA | | | 4,276,000 | | | | 4,059,676 | |
| Fannie Mae or Freddie Mac(d) | | 4.50% | | TBA | | | 7,075,000 | | | | 6,946,834 | |
| Fannie Mae or Freddie Mac(d) | | 5.00% | | TBA | | | 4,850,000 | | | | 4,872,722 | |
| Fannie Mae or Freddie Mac(d) | | 6.00% | | TBA | | | 2,740,000 | | | | 2,780,351 | |
| Fannie Mae or Freddie Mac(d) | | 6.50% | | TBA | | | 5,219,000 | | | | 5,343,060 | |
| Fannie Mae Pool | | 2.00% | | 6/1/2051 | | | 2,516,906 | | | | 2,056,786 | |
| Fannie Mae Pool | | 2.50% | | 8/1/2050 -
5/1/2052 | | | 30,662,416 | | | | 26,410,284 | |
| Fannie Mae Pool | | 3.00% | | 12/1/2048 -
1/1/2051 | | | 4,842,263 | | | | 4,329,355 | |
| Fannie Mae Pool | | 3.50% | | 7/1/2045 -
4/1/2052 | | | 4,091,528 | | | | 3,771,453 | |
| Fannie Mae Pool | | 4.00% | | 5/1/2052 -
6/1/2052 | | | 4,617,583 | | | | 4,382,119 | |
| Fannie Mae Pool | | 5.00% | | 7/1/2052 -
8/1/2052 | | | 4,187,945 | | | | 4,185,088 | |
| Federal Home Loan Mortgage Corp. | | 2.00% | | 10/1/2051 | | | 1,991,946 | | | | 1,625,932 | |
| Federal Home Loan Mortgage Corp. | | 2.50% | | 11/1/2050 -
7/1/2051 | | | 3,437,420 | | | | 2,944,543 | |
| Federal Home Loan Mortgage Corp. | | 3.50% | | 2/1/2046 | | | 1,113,395 | | | | 1,041,577 | |
| Federal Home Loan Mortgage Corp. | | 4.50% | | 8/1/2052 | | | 2,760,399 | | | | 2,687,911 | |
| Federal Home Loan Mortgage Corp. | | 5.00% | | 7/1/2052 -
8/1/2052 | | | 5,837,387 | | | | 5,827,607 | |
| Federal National Mortgage Assoc. | | 3.711%
(12 Mo. LIBOR + 1.79% | )# | 3/1/2042 | | | 96,674 | | | | 98,155 | |
| Ginnie Mae(d) | | 3.00% | | TBA | | | 8,750,000 | | | | 7,799,002 | |
| Ginnie Mae(d) | | 3.50% | | TBA | | | 1,525,000 | | | | 1,401,365 | |
| Ginnie Mae(d) | | 4.00% | | TBA | | | 5,367,000 | | | | 5,079,382 | |
| Ginnie Mae(d) | | 4.50% | | TBA | | | 7,895,000 | | | | 7,661,595 | |
| Ginnie Mae(d) | | 5.00% | | TBA | | | 5,837,000 | | | | 5,784,007 | |
| Ginnie Mae(d) | | 5.50% | | TBA | | | 6,531,000 | | | | 6,564,787 | |
| Ginnie Mae(d) | | 6.00% | | TBA | | | 6,801,000 | | | | 6,897,371 | |
| Total Government Sponsored Enterprises Pass-Throughs (cost $138,736,372) | | | | | | | | | 135,360,266 | |
| 20 | See Notes to Financial Statements. |
Schedule of Investments (continued)
December 31, 2022
| Investments | | Interest
Rate | | Maturity
Date | | Principal
Amount | | | Fair
Value | |
| MUNICIPAL BONDS 0.37% | | | | | | | | | | | | |
| | | | | | | | | | | | | |
| Government | | | | | | | | | | | | |
| Foothill-Eastern Transportation Corridor Agency CA | | 4.094% | | 1/15/2049 | | $ | 660,000 | | | $ | 500,482 | |
| New Jersey Transportation Trust Fund Authority NJ | | 4.131% | | 6/15/2042 | | | 1,140,000 | | | | 918,930 | |
| New York City Transitional Finance Authority Future Tax Secured Revenue NY | | 1.95% | | 8/1/2034 | | | 675,000 | | | | 479,315 | |
| Regents of the University of California Medical Center Pooled Revenue CA | | 3.006% | | 5/15/2050 | | | 375,000 | | | | 248,448 | |
| Total Municipal Bonds (cost $2,966,074) | | | | | | | | | | | 2,147,175 | |
| | | | | | | | | | | | | |
| NON-AGENCY COMMERCIAL MORTGAGE-BACKED SECURITIES 7.16% | | | | | | | | | | |
| Angel Oak Mortgage Trust 2020-1 A1† | | 2.466% | #(c) | 12/25/2059 | | | 70,653 | | | | 66,295 | |
| BBCMS Mortgage Trust 2019-BWAY A† | | 5.274%
(1 Mo. LIBOR + .96% | )# | 11/15/2034 | | | 655,000 | | | | 608,025 | |
| BBCMS Mortgage Trust 2019-BWAY B† | | 5.628%
(1 Mo. LIBOR + 1.31% | )# | 11/15/2034 | | | 288,000 | | | | 264,806 | |
| BFLD 2019-DPLO F† | | 6.858%
(1 Mo. LIBOR + 2.54% | )# | 10/15/2034 | | | 790,000 | | | | 744,008 | |
| BHMS 2018-ATLS A† | | 5.568%
(1 Mo. LIBOR + 1.25% | )# | 7/15/2035 | | | 1,080,000 | | | | 1,038,718 | |
| BHMS 2018-ATLS C† | | 6.218%
(1 Mo. LIBOR + 1.90% | )# | 7/15/2035 | | | 630,000 | | | | 592,376 | |
| BRAVO Residential Funding Trust 2021-NQM2 A1† | | 0.97% | #(c) | 3/25/2060 | | | 1,892,645 | | | | 1,780,907 | |
| BX Trust 2018-GW A† | | 5.118%
(1 Mo. LIBOR + .80% | )# | 5/15/2035 | | | 1,710,000 | | | | 1,668,914 | |
| BX Trust 2021-ARIA E† | | 6.563%
(1 Mo. LIBOR + 2.24% | )# | 10/15/2036 | | | 2,300,000 | | | | 2,094,960 | |
| CIM Retail Portfolio Trust 2021-RETL E† | | 8.068%
(1 Mo. LIBOR + 3.75% | )# | 8/15/2036 | | | 1,380,000 | | | | 1,319,936 | |
| Citigroup Commercial Mortgage Trust 2016-GC36 D† | | 2.85% | | 2/10/2049 | | | 1,250,000 | | | | 682,317 | |
| Commercial Mortgage Pass-Through Certificates 2014-CR17 A5 | | 3.977% | | 5/10/2047 | | | 1,000,000 | | | | 975,819 | |
| Commercial Mortgage Pass-Through Certificates 2014-CR19 XA | | 0.932% | #(c) | 8/10/2047 | | | 440,784 | | | | 4,817 | |
| Commercial Mortgage Pass-Through Certificates 2015-PC1 C | | 4.293% | #(c) | 7/10/2050 | | | 730,000 | | | | 648,580 | |
| Connecticut Avenue Securities Trust 2021-R01 1M2† | | 5.478%
(1 Mo. SOFR + 1.55% | )# | 10/25/2041 | | | 820,000 | | | | 799,701 | |
| | See Notes to Financial Statements. | 21 |
Schedule of Investments (continued)
December 31, 2022
| Investments | | Interest
Rate | | Maturity
Date | | Principal
Amount | | | Fair
Value | |
| NON-AGENCY COMMERCIAL MORTGAGE-BACKED SECURITIES (continued) | | | | | | | | | | |
| Credit Suisse Mortgage Capital Certificates 2020-SPT1 A1† | | 1.616% | | 4/25/2065 | | $ | 125,278 | | | $ | 121,196 | |
| CSAIL Commercial Mortgage Trust 2019-C18 AS | | 3.321% | | 12/15/2052 | | | 708,895 | | | | 593,289 | |
| CSMC 2021-BHAR C† | | 6.318%
(1 Mo. LIBOR + 2.00% | )# | 11/15/2038 | | | 1,250,000 | | | | 1,157,712 | |
| CSMC Trust 2020-AFC1 A1† | | 2.24% | #(c) | 2/25/2050 | | | 221,063 | | | | 203,855 | |
| DBWF Mortgage Trust 2018-GLKS A† | | 5.469%
(1 Mo. LIBOR + 1.03% | )# | 12/19/2030 | | | 1,100,000 | | | | 1,068,862 | |
| Deephaven Residential Mortgage Trust 2021-3 A1† | | 1.194% | #(c) | 8/25/2066 | | | 1,923,036 | | | | 1,572,776 | |
| Fannie Mae Connecticut Avenue Securities 2021-R02 2M2† | | 5.928%
(1 Mo. SOFR + 2.00% | )# | 11/25/2041 | | | 790,000 | | | | 736,416 | |
| Freddie Mac STACR REMIC Trust 2021-DNA3 M2† | | 6.028%
(1 Mo. SOFR + 2.10% | )# | 10/25/2033 | | | 1,290,000 | | | | 1,265,966 | |
| Freddie Mac STACR REMIC Trust 2021-DNA6 M2† | | 5.428%
(1 Mo. SOFR + 1.50% | )# | 10/25/2041 | | | 1,427,000 | | | | 1,357,390 | |
| Freddie Mac STACR REMIC Trust 2021-DNA7 M2† | | 5.728%
(1 Mo. SOFR + 1.80% | )# | 11/25/2041 | | | 1,000,000 | | | | 940,839 | |
| Freddie Mac STACR REMIC Trust 2022-HQA3 M1A† | | 6.228%
(1 Mo. SOFR + 2.30% | )# | 8/25/2042 | | | 861,692 | | | | 861,257 | |
| Freddie Mac Structured Agency Credit Risk Debt Notes 2022-HQA2 M1A† | | 6.578%
(1 Mo. SOFR + 2.65% | )# | 7/25/2042 | | | 1,678,670 | | | | 1,687,927 | |
| Great Wolf Trust 2019-WOLF A† | | 5.352%
(1 Mo. LIBOR + 1.03% | )# | 12/15/2036 | | | 3,216,000 | | | | 3,126,757 | |
| GS Mortgage Securities Corp Trust 2022-ECI A† | 6.531%
(1 Mo. Term SOFR + 2.19% | )# | 8/15/2039 | | | 1,820,000 | | | | 1,803,529 | |
| GS Mortgage Securities Corp. II 2021-ARDN B† | | 5.968%
(1 Mo. LIBOR + 1.65% | )# | 11/15/2036 | | | 1,450,000 | | | | 1,398,708 | |
| GS Mortgage Securities Corp. Trust 2018-RIVR A† | | 5.268%
(1 Mo. LIBOR + .95% | )# | 7/15/2035 | | | 681,826 | | | | 636,064 | |
| GS Mortgage Securities Corp. Trust 2021-ROSS G† | | 8.968%
(1 Mo. LIBOR + 4.65% | )# | 5/15/2026 | | | 1,230,000 | | | | 1,015,415 | |
| JPMorgan Chase Commercial Mortgage Securities Trust 2015-C30 C | | 4.23% | #(c) | 7/15/2048 | | | 374,000 | | | | 329,865 | |
| JPMorgan Chase Commercial Mortgage Securities Trust 2018-MINN A† | | 5.588%
(1 Mo. LIBOR + 1.27% | )# | 11/15/2035 | | | 542,000 | | | | 518,310 | |
| 22 | See Notes to Financial Statements. |
Schedule of Investments (continued)
December 31, 2022
| Investments | | Interest
Rate | | Maturity
Date | | Principal
Amount | | | Fair
Value | |
| NON-AGENCY COMMERCIAL MORTGAGE-BACKED SECURITIES (continued) | | | | | | | | | | |
| KIND Trust 2021-KIND D† | | 6.618%
(1 Mo. LIBOR + 2.30% | )# | 8/15/2038 | | $ | 1,161,605 | | | $ | 1,048,191 | |
| Merrill Lynch Mortgage Investors Trust 2006-AF2 AF1 | | 6.25% | | 10/25/2036 | | | 7,105 | | | | 3,436 | |
| Morgan Stanley Bank of America Merrill Lynch Trust 2015-C23 XA | | 0.554% | #(c) | 7/15/2050 | | | 14,398,573 | | | | 152,566 | |
| New Residential Mortgage Loan Trust 2020-NQM1 A1† | | 2.464% | #(c) | 1/26/2060 | | | 78,663 | | | | 70,454 | |
| Ready Capital Mortgage Financing LLC 2021-FL6 C† | | 6.289%
(1 Mo. LIBOR + 1.90% | )# | 7/25/2036 | | | 1,100,000 | | | | 1,040,823 | |
| Ready Capital Mortgage Financing LLC 2022-FL8 A† | | 5.594%
(1 Mo. SOFR + 1.65% | )# | 1/25/2037 | | | 2,130,000 | | | | 2,075,370 | |
| Residential Mortgage Loan Trust 2020-1 A1† | | 2.376% | #(c) | 1/26/2060 | | | 43,546 | | | | 41,641 | |
| Starwood Mortgage Residential Trust 2020-1 A1† | | 2.275% | #(c) | 2/25/2050 | | | 18,770 | | | | 18,041 | |
| Starwood Mortgage Residential Trust 2020-3 A1† | | 1.486% | #(c) | 4/25/2065 | | | 416,569 | | | | 383,184 | |
| Structured Asset Securities Corp. 2006-3H 1A2 | | 5.75% | | 12/25/2035 | | $ | 3,356 | | | $ | 3,188 | |
| Verus Securitization Trust 2020-1 A1† | | 2.417% | | 1/25/2060 | | | 126,372 | | | | 119,542 | |
| Verus Securitization Trust 2020-5 A1† | | 1.218% | | 5/25/2065 | | | 565,802 | | | | 515,792 | |
| Verus Securitization Trust 2021-2 A1† | | 1.031% | #(c) | 2/25/2066 | | | 1,051,807 | | | | 878,384 | |
| Vista Point Securitization Trust 2020-2 A1† | | 1.475% | #(c) | 4/25/2065 | | | 307,194 | | | | 269,539 | |
| Wells Fargo Commercial Mortgage Trust 2013-LC12 D† | | 4.296% | #(c) | 7/15/2046 | | | 364,000 | | | | 126,759 | |
| Wells Fargo Commercial Mortgage Trust 2017-C41 AS | | 3.785% | #(c) | 11/15/2050 | | | 1,629,962 | | | | 1,468,472 | |
| Total Non-Agency Commercial Mortgage-Backed Securities (cost $44,802,214) | | | | | | | | | 41,901,694 | |
| | | | | | | | | | | | | |
| U.S. TREASURY OBLIGATIONS 16.84% | | | | | | | | | | | | |
| U.S. Treasury Bond | | 1.25% | | 5/15/2050 | | | 4,260,000 | | | | 2,294,160 | |
| U.S. Treasury Bond | | 2.00% | | 11/15/2041 | | | 3,138,000 | | | | 2,242,138 | |
| U.S. Treasury Bond | | 3.00% | | 8/15/2052 | | | 15,571,000 | | | | 12,833,910 | |
| U.S. Treasury Bond | | 4.00% | | 11/15/2042 | | | 3,990,000 | | | | 3,907,706 | |
| U.S. Treasury Note | | 3.875% | | 11/30/2027 | | | 25,647,000 | | | | 25,510,750 | |
| U.S. Treasury Note | | 3.875% | | 11/30/2029 | | | 9,820,000 | | | | 9,756,324 | |
| U.S. Treasury Note | | 4.125% | | 11/15/2032 | | | 3,500,000 | | | | 3,572,461 | |
| U.S. Treasury Note | | 4.25% | | 12/31/2024 | | | 38,567,000 | | | | 38,435,932 | |
| Total U.S. Treasury Obligations (cost $99,273,705) | | | | | | | | | | | 98,553,381 | |
| Total Long-Term Investments (cost $663,903,560) | | | | | | | | | | | 631,582,856 | |
| | See Notes to Financial Statements. | 23 |
Schedule of Investments (continued)
December 31, 2022
| Investments | | Interest
Rate | | Maturity
Date | | Principal
Amount | | | Fair
Value | |
| SHORT-TERM INVESTMENTS 2.86% | | | | | | | | | | |
| | | | | | | | | | | |
| U.S. TREASURY OBLIGATIONS 0.82% | | | | | | | | | | |
| U.S. Treasury Bill (Cost $4,766,198) | | 4.51% | | 4/11/2023 | | $ | 4,825,000 | | | $ | 4,767,864 | |
| | | | | | | | | | | | | |
| REPURCHASE AGREEMENTS 2.04% | | | | | | | | | | | | |
Repurchase Agreement dated 12/30/2022, 2.050% due 1/3/2023 with Fixed Income Clearing Corp. collateralized by $12,204,500 of U.S. Treasury Note at 4.360% due 10/31/2024; value: $12,186,437; proceeds: $11,950,142
(cost $11,947,421) | | | | | | | 11,947,421 | | | | 11,947,421 | |
| Total Short-Term Investments (cost $16,713,619) | | | | | | | | | | | 16,715,285 | |
| Total Investments in Securities 110.80% (cost $680,617,179) | | | | | | | | | | | 648,298,141 | |
| Other Assets and Liabilities – Net(f) (10.80)% | | | | | | | | | | | (63,202,189) | |
| Net Assets 100.00% | | | | | | | | | | $ | 585,095,952 | |
| CMT | Constant Maturity Rate. |
| LIBOR | London Interbank Offered Rate. |
| REITS | Real Estate Investment Trusts. |
| SOFR | Secured Overnight Financing Rate. |
| † | Security was purchased pursuant to Rule 144A under the Securities Act of 1933 and, unless registered under such Act or exempted from registration, may only be resold to qualified institutional buyers. At December 31, 2022, the total value of Rule 144A securities was $188,977,429, which represents 32.30% of net assets. |
| # | Variable rate security. The interest rate represents the rate in effect at December 31, 2022. |
| (a) | Foreign security traded in U.S. dollars. |
| (b) | Floating Rate Loans in which the Fund invests generally pay interest at rates which are periodically re-determined at a margin above the London Interbank Offered Rate (“LIBOR”) or the prime rate offered by major U.S. banks. The rate(s) shown is the rate(s) in effect at December 31, 2022. |
| (c) | Interest rate is based on the weighted average interest rates of the underlying mortgages within the mortgage pool. |
| (d) | To-be-announced (“TBA”). Security purchased on a forward commitment basis with an approximate principal and maturity date. Actual principal and maturity will be determined upon settlement when the specific mortgage pools are assigned. |
| (e) | Defaulted (non-income producing security). |
| (f) | Other Assets and Liabilities – Net include net unrealized appreciation/depreciation on futures contracts and swaps as follows: |
Centrally Cleared Credit Default Swaps on Indexes - Sell Protection at December 31, 2022(1):
Referenced
Indexes | | Central
Clearing
Party | | Fund
Receives
(Quarterly) | | Termination
Date | | Notional
Amount | | | Payments
Upfront(2) | | | Value | | | Unrealized
Appreciation(3) | |
| Markit CDX.EM.38(4)(5) | | Goldman Sachs | | 1.000% | | 12/20/2027 | | | $11,950,000 | | | | $(721,250 | ) | | | $(698,520 | ) | | | $22,730 | |
| 24 | See Notes to Financial Statements. |
Schedule of Investments (continued)
December 31, 2022
Referenced
Indexes | | Central
Clearing
Party | | Fund
Receives
(Quarterly) | | Termination
Date | | Notional
Amount | | | Payments
Upfront(2) | | | Value | | | Unrealized
Depreciation(3) | |
| Markit CDX.NA.IG.39(4)(6) | | Goldman Sachs | | 1.000% | | 12/20/2027 | | | $12,750,000 | | | | $114,131 | | | | $101,618 | | | | $(12,513 | ) |
| (1) | | If the Fund is a seller of protection and a credit event occurs, as defined under the terms of that particular swap agreement, the Fund will either (i) pay to the buyer of protection an amount equal to the notional amount of the swap and take delivery of the referenced obligation or underlying securities comprising the referenced index or (ii) pay a net settlement amount in the form of cash or securities equal to the notional amount of the swap less the recovery value of the referenced obligation or underlying securities. |
| (2) | | Upfront payments paid (received) are presented net of amortization. |
| (3) | | Total unrealized appreciation on Credit Default Swaps on Indexes amounted to $22,730. Total unrealized depreciation on Credit Default Swaps on Indexes amounted to $12,513. |
| (4) | | Central Clearinghouse: Intercontinental Exchange (ICE). |
| (5) | | The Referenced Index is for the Centrally Cleared Credit Default Swaps on Indexes, which is comprised of a basket of emerging markets securities. |
| (6) | | The Referenced Index is for the Centrally Cleared Credit Default Swaps on Indexes, which is comprised of a basket of investment grade securities. |
Futures Contracts at December 31, 2022:
| Type | | Expiration | | Contracts | | Position | | Notional
Amount | | | Notional
Value | | | Unrealized
Appreciation | |
| U.S. 10-Year Ultra Treasury Note | | March 2023 | | 193 | | Short | | | $(22,958,540 | ) | | | $(22,828,281 | ) | | | $130,259 | |
| | | | | | | | | | | | | | | | | | | |
| Type | | Expiration | | Contracts | | Position | | Notional
Amount | | | Notional
Value | | | Unrealized
Depreciation | |
| U.S. Long Bond | | March 2023 | | 199 | | Long | | | $25,173,247 | | | | $24,943,406 | | | | $(229,841 | ) |
| U.S. 2-Year Treasury Notes | | March 2023 | | 81 | | Long | | | 16,698,141 | | | | 16,611,328 | | | | (86,813 | ) |
| U.S. Ultra Treasury Bond | | March 2023 | | 248 | | Long | | | 34,211,180 | | | | 33,309,500 | | | | (901,680 | ) |
| Total Unrealized Depreciation on Futures Contracts | | | | | | | | | | | | | $(1,218,334 | ) |
| | See Notes to Financial Statements. | 25 |
Schedule of Investments (concluded)
December 31, 2022
The following is a summary of the inputs used as of December 31, 2022 in valuing the Fund’s investments carried at fair value(1):
| Investment Type(2) | | Level 1 | | | Level 2 | | | Level 3 | | | Total | |
| Long-Term Investments | | | | | | | | | | | | | | | | |
| Asset-Backed Securities | | $ | – | | | $ | 92,571,689 | | | $ | – | | | $ | 92,571,689 | |
| Corporate Bonds | | | – | | | | 241,031,489 | | | | – | | | | 241,031,489 | |
| Floating Rate Loans | | | – | | | | 635,739 | | | | – | | | | 635,739 | |
| Foreign Government Obligations | | | – | | | | 12,513,767 | | | | – | | | | 12,513,767 | |
| Government Sponsored Enterprises Collateralized Mortgage Obligations | | | – | | | | 6,867,656 | | | | – | | | | 6,867,656 | |
| Government Sponsored Enterprises Pass-Throughs | | | – | | | | 135,360,266 | | | | – | | | | 135,360,266 | |
| Municipal Bonds | | | – | | | | 2,147,175 | | | | – | | | | 2,147,175 | |
| Non-Agency Commercial Mortgage-Backed Securities | | | – | | | | 41,901,694 | | | | – | | | | 41,901,694 | |
| U.S. Treasury Obligations | | | – | | | | 98,553,381 | | | | – | | | | 98,553,381 | |
| Short-Term Investments | | | | | | | | | | | | | | | | |
| U.S. Treasury Obligations | | | – | | | | 4,767,864 | | | | – | | | | 4,767,864 | |
| Repurchase Agreements | | | – | | | | 11,947,421 | | | | – | | | | 11,947,421 | |
| Total | | $ | – | | | $ | 648,298,141 | | | $ | – | | | $ | 648,298,141 | |
| Other Financial Instruments | | | | | | | | | | | | | | | | |
| Centrally Cleared Credit Default Swap Contracts | | | | | | | | | | | | | | | | |
| Assets | | $ | – | | | $ | 101,618 | | | $ | – | | | $ | 101,618 | |
| Liabilities | | | – | | | | (698,520 | ) | | | – | | | | (698,520 | ) |
| Futures Contracts | | | | | | | | | | | | | | | | |
| Assets | | | 130,259 | | | | – | | | | – | | | | 130,259 | |
| Liabilities | | | (1,218,334 | ) | | | – | | | | – | | | | (1,218,334 | ) |
| Total | | $ | (1,088,075 | ) | | $ | (596,902 | ) | | $ | – | | | $ | (1,684,977 | ) |
| (1) | | Refer to Note 2(q) for a description of fair value measurements and the three-tier hierarchy of inputs. |
| (2) | | See Schedule of Investments for fair values in each industry and identification of foreign issuer and/or geography. When applicable, each Level 3 security is identified on the Schedule of Investments along with the valuation technique utilized. |
A reconciliation of Level 3 investments is presented when the Fund has a material amount of Level 3 investments at the beginning or end of the year in relation to the Fund’s net assets. Management has determined not to provide a reconciliation as the balance of Level 3 investments was not considered to be material to the Fund's net assets at the beginning or end of the year.
| 26 | See Notes to Financial Statements. |
Statement of Assets and Liabilities
December 31, 2022
| ASSETS: | | | |
| Investments in securities, at fair value (cost $680,617,179) | | $ | 648,298,141 | |
| Cash | | | 513 | |
| Deposits with brokers for futures collateral | | | 2,162,591 | |
| Deposits with brokers for swaps collateral | | | 1,911,650 | |
| Receivables: | | | | |
| Investment securities sold | | | 154,015,713 | |
| Interest | | | 4,333,219 | |
| Capital shares sold | | | 881,876 | |
| Prepaid expenses | | | 4,064 | |
| Total assets | | | 811,607,767 | |
| LIABILITIES: | | | | |
| Payables: | | | | |
| Investment securities purchased | | | 225,196,079 | |
| Transfer agent fees | | | 683,814 | |
| Capital shares reacquired | | | 177,204 | |
| Variation margin for futures contracts | | | 151,529 | |
| Management fee | | | 135,755 | |
| Directors' fees | | | 64,531 | |
| Fund administration | | | 19,394 | |
| Variation margin for centrally cleared credit default swap agreements | | | 1,383 | |
| Accrued expenses and other liabilities | | | 82,126 | |
| Total liabilities | | | 226,511,815 | |
| NET ASSETS | | $ | 585,095,952 | |
| COMPOSITION OF NET ASSETS: | | | | |
| Paid-in capital | | $ | 697,323,914 | |
| Total distributable earnings (loss) | | | (112,227,962 | ) |
| Net Assets | | $ | 585,095,952 | |
| Outstanding shares (130 million shares of common stock authorized, $.001 par value) | | | 41,942,339 | |
| Net asset value, offering and redemption price per share (Net assets divided by outstanding shares) | | | $13.95 | |
| | See Notes to Financial Statements. | 27 |
Statement of Operations
For the Year Ended December 31, 2022
| Investment income: | | | |
| Interest and other (net of foreign withholding taxes of $463) | | $ | 20,301,042 | |
| Interest earned from Interfund Lending (See Note 11) | | | 1,718 | |
| Total investment income | | | 20,302,760 | |
| Expenses: | | | | |
| Management fee | | | 1,670,689 | |
| Non 12b-1 service fees | | | 1,491,215 | |
| Shareholder servicing | | | 632,660 | |
| Fund administration | | | 238,670 | |
| Professional | | | 70,667 | |
| Reports to shareholders | | | 25,270 | |
| Custody | | | 19,802 | |
| Directors' fees | | | 10,831 | |
| Other | | | 88,867 | |
| Gross expenses | | | 4,248,671 | |
| Expense reductions (See Note 9) | | | (7,501 | ) |
| Fees waived and expenses reimbursed (See Note 3) | | | (19,802 | ) |
| Net expenses | | | 4,221,368 | |
| Net investment income | | | 16,081,392 | |
| Net realized and unrealized gain (loss): | | | | |
| Net realized gain (loss) on investments | | | (54,532,224 | ) |
| Net realized gain (loss) on futures contracts | | | (18,423,430 | ) |
| Net realized gain (loss) on swap contracts | | | 702,917 | |
| Net realized gain (loss) on foreign currency related transactions | | | (606 | ) |
| Net change in unrealized appreciation/depreciation on investments | | | (35,078,850 | ) |
| Net change in unrealized appreciation/depreciation on futures contracts | | | (1,781,330 | ) |
| Net change in unrealized appreciation/depreciation on swap contracts | | | 42,631 | |
| Net realized and unrealized gain (loss) | | | (109,070,892 | ) |
| Net Decrease in Net Assets Resulting From Operations | | $ | (92,989,500 | ) |
| 28 | See Notes to Financial Statements. |
Statements of Changes in Net Assets
| INCREASE (DECREASE) IN NET ASSETS | | For the Year Ended
December 31, 2022 | | | For the Year Ended
December 31, 2021 | |
| Operations: | | | | | | | | | | |
| Net investment income | | | $ | 16,081,392 | | | | $ | 10,979,572 | |
| Net realized gain (loss) on investments, futures contracts, swaps and foreign currency related transactions | | | | (72,253,343 | ) | | | | 5,700,498 | |
| Net change in unrealized appreciation/depreciation on investments, futures contracts, swaps and translation of assets and liabilities denominated in foreign currencies | | | | (36,817,549 | ) | | | | (17,473,072 | ) |
| Net decrease in net assets resulting from operations | | | | (92,989,500 | ) | | | | (793,002 | ) |
| Distributions to shareholders: | | | | (19,978,214 | ) | | | | (17,629,159 | ) |
| Return of capital: | | | | (1,072,532 | ) | | | | – | |
| Total distributions to shareholders: | | | | (21,050,746 | ) | | | | (17,629,159 | ) |
| Capital share transactions (See Note 15): | | | | | | | | | | |
| Net proceeds from sales of shares | | | | 115,361,526 | | | | | 132,664,441 | |
| Reinvestment of distributions | | | | 21,050,746 | | | | | 17,629,159 | |
| Cost of shares reacquired | | | | (97,899,074 | ) | | | | (154,832,501 | ) |
| Net increase (decrease) in net assets resulting from capital share transactions | | | | 38,513,198 | | | | | (4,538,901 | ) |
| Net decrease in net assets | | | | (75,527,048 | ) | | | | (22,961,062 | ) |
| NET ASSETS: | | | | | | | | | | |
| Beginning of year | | | $ | 660,623,000 | | | | $ | 683,584,062 | |
| End of year | | | $ | 585,095,952 | | | | $ | 660,623,000 | |
| | See Notes to Financial Statements. | 29 |
Financial Highlights
| | | | | | Per Share Operating Performance: |
| | | | | | Investment Operations: | | Distributions to
shareholders from: |
| | | Net asset
value,
beginning
of period | | Net
invest-
ment
income(a) | | Net
realized
and
unrealized
gain (loss) | | Total
from
invest-
ment
opera-
tions | | Net
investment
income | | Return
of
capital | | Net
realized
gain |
| 12/31/2022 | | $ | 16.85 | | | $ | 0.41 | | | $ | (2.77 | ) | | $ | (2.36 | ) | | $ | (0.48 | ) | | $ | (0.03 | ) | | $ | (0.03 | ) |
| 12/31/2021 | | | 17.34 | | | | 0.27 | | | | (0.30 | ) | | | (0.03 | ) | | | (0.34 | ) | | | – | | | | (0.12 | ) |
| 12/31/2020 | | | 16.85 | | | | 0.36 | | | | 0.88 | | | | 1.24 | | | | (0.42 | ) | | | – | | | | (0.33 | ) |
| 12/31/2019 | | | 15.96 | | | | 0.42 | | | | 0.92 | | | | 1.34 | | | | (0.45 | ) | | | – | | | | – | |
| 12/31/2018 | | | 16.65 | | | | 0.44 | | | | (0.60 | ) | | | (0.16 | ) | | | (0.53 | ) | | | – | | | | – | |
| (a) | Calculated using average shares outstanding during the period. |
| (b) | Total return does not consider the effects of sales charges or other expenses imposed by an insurance company and assumes the reinvestment of all distributions. |
| 30 | See Notes to Financial Statements. |
| | | | | | | Ratios to Average Net Assets: | | Supplemental Data: | | | |
| | | | | | | | | | | | |
Total
distri-
butions | | Net
asset
value,
end of
period | | Total
return(b)
(%) | | Total
expenses
after
waivers
and/or reim-
bursements (%) | | Total
expenses
(%) | | Net
investment
income
(%) | | Net
assets,
end of
period
(000) | | Portfolio
turnover
rate
(%) |
| $ | (0.54 | ) | | $ | 13.95 | | | | (14.05 | ) | | | 0.71 | | | | 0.71 | | | | 2.70 | | | $ | 585,096 | | | | 485 | |
| | (0.46 | ) | | | 16.85 | | | | (0.24 | ) | | | 0.70 | | | | 0.71 | | | | 1.59 | | | | 660,623 | | | | 376 | |
| | (0.75 | ) | | | 17.34 | | | | 7.43 | | | | 0.71 | | | | 0.72 | | | | 2.05 | | | | 683,584 | | | | 541 | |
| | (0.45 | ) | | | 16.85 | | | | 8.41 | | | | 0.71 | | | | 0.78 | | | | 2.50 | | | | 651,469 | | | | 715 | |
| | (0.53 | ) | | | 15.96 | | | | (1.03 | ) | | | 0.67 | | | | 0.89 | | | | 2.70 | | | | 561,610 | | | | 611 | |
| | See Notes to Financial Statements. | 31 |
Notes to Financial Statements
Lord Abbett Series Fund, Inc. (the “Company”) is registered under the Investment Company Act of 1940, as amended (“the Act”), as a diversified, open-end management investment company and was incorporated under Maryland law in 1989. The Company consists of nine separate portfolios as of December 31, 2022. This report covers Total Return Portfolio (the “Fund”).
The Fund’s investment objective is to seek income and capital appreciation to produce a high total return. The Fund has Variable Contract class shares (“Class VC Shares”), which are currently issued and redeemed only in connection with investments in, and payments under, variable annuity contracts and variable life insurance policies issued by life insurance and insurance-related companies.
The preparation of the financial statements in conformity with accounting principles generally accepted in the United States of America (“U.S. GAAP”) requires management to make certain estimates and assumptions that affect the reported amounts of assets and liabilities and disclosure of contingent assets and liabilities at the date of the financial statements and the reported amounts of increases and decreases in net assets from operations during the reporting period. Actual results could differ from those estimates. The Fund is considered an investment company under U.S. GAAP and follows the accounting and reporting guidance applicable to investment companies.
| 2. | SIGNIFICANT ACCOUNTING POLICIES |
| (a) | Investment Valuation–Under procedures approved by the Fund’s Board of Directors (the “Board”), the Board has designated the determination of fair value of the Fund’s portfolio investments to Lord, Abbett & Co. LLC (“Lord Abbett”), as its valuation designee. Accordingly, Lord Abbett is responsible for, among other things, assessing and managing valuation risks, establishing, applying and testing fair value methodologies, and evaluating pricing services. Lord Abbett has formed a Pricing Committee that performs these responsibilities on behalf of Lord Abbett, administers the pricing and valuation of portfolio investments and ensures that prices utilized reasonably reflect fair value. Among other things, these procedures allow Lord Abbett, subject to Board oversight, to utilize independent pricing services, quotations from securities and financial instrument dealers and other market sources to determine fair value. |
| | |
| | Securities actively traded on any recognized U.S. or non-U.S. exchange or on The NASDAQ Stock Market LLC are valued at the last sale price or official closing price on the exchange or system on which they are principally traded. Events occurring after the close of trading on non-U.S. exchanges may result in adjustments to the valuation of foreign securities to reflect their fair value as of the close of regular trading on the New York Stock Exchange. When valuing foreign equity securities that meet certain criteria, the Board has approved the use of an independent fair valuation service that values such securities to reflect market trading that occurs after the close of the applicable foreign markets of comparable securities or other instruments that correlate to the fair-valued securities. Unlisted equity securities are valued at the last quoted sale price or, if no sale price is available, at the mean between the most recently quoted bid and asked prices. Fixed income securities are valued based on evaluated prices supplied by independent pricing services, which reflect broker/dealer supplied valuations and the independent pricing services’ own electronic data processing techniques. Floating rate loans are valued at the average of bid and ask quotations obtained from dealers in loans on the basis of prices supplied by independent pricing services. Forward foreign currency exchange contracts are valued using daily forward exchange rates. Exchange traded options and futures contracts are valued at the last quoted sale price in the market where they are principally traded. If no sale has occurred, the mean between the most recently quoted bid and ask prices is used. Swaps are valued daily using independent pricing services or quotations from broker/dealers to the extent available. |
32
Notes to Financial Statements (continued)
| | Securities for which prices are not readily available are valued at fair value as determined by the Pricing Committee. The Pricing Committee considers a number of factors, including observable and unobservable inputs, when arriving at fair value. The Pricing Committee may use observable inputs such as yield curves, broker quotes, observable trading activity, option adjusted spread models and other relevant information to determine the fair value of portfolio investments. The Board or a designated committee thereof periodically reviews reports that may include fair value determinations made by the Pricing Committee, related market activity, inputs and assumptions, and retrospective comparison of prices of subsequent purchases and sales transactions to fair value determinations made by the Pricing Committee. |
| | |
| | Short-term securities with 60 days or less remaining to maturity are valued using the amortized cost method, which approximates fair value. |
| | |
| (b) | Security Transactions–Security transactions are recorded as of the date that the securities are purchased or sold (trade date). Realized gains and losses on sales of portfolio securities are calculated using the identified-cost method. |
| | |
| (c) | Investment Income–Dividend income is recorded on the ex-dividend date. Interest income is recorded on the accrual basis as earned. Discounts are accreted and premiums are amortized using the effective interest method and are included in Interest and other, if applicable, on the Statement of Operations. Withholding taxes on foreign dividends have been provided for in accordance with the applicable country’s tax rules and rates. |
| | |
| (d) | Income Taxes–It is the policy of the Fund to meet the requirements of Subchapter M of the Internal Revenue Code applicable to regulated investment companies and to distribute substantially all taxable income and capital gains to its shareholders. Therefore, no income tax provision is required. |
| | |
| | The Fund files U.S. federal and various state and local tax returns. No income tax returns are currently under examination. The statute of limitations on the Fund’s filed U.S. federal tax returns remains open for the fiscal years ended December 31, 2019 through December 31, 2022. The statutes of limitations on the Fund’s state and local tax returns may remain open for an additional year depending upon the jurisdiction. |
| | |
| (e) | Expenses–Expenses incurred by the Company that do not specifically relate to an individual fund are generally allocated to the funds within the Company on a pro rata basis by relative net assets. |
| | |
| (f) | Foreign Transactions–The books and records of the Fund are maintained in U.S. dollars and transactions denominated in foreign currencies are recorded in the Fund’s records at the rate prevailing when earned or recorded. Asset and liability accounts that are denominated in foreign currencies are adjusted daily to reflect current exchange rates and any unrealized gain (loss), if applicable, is included in Net change in unrealized appreciation/depreciation on translation of assets and liabilities denominated in foreign currencies on the Fund’s Statement of Operations. The resultant exchange gains and losses upon settlement of such transactions, if applicable, are included in Net realized gain (loss) on foreign currency related transactions on the Fund’s Statement of Operations. The Fund does not isolate that portion of the results of operations arising as a result of changes in the foreign exchange rates from the changes in market prices of the securities. |
33
Notes to Financial Statements (continued)
| | The Fund uses foreign currency exchange contracts to facilitate transactions in foreign-denominated securities. Losses from these transactions may arise from changes in the value of the foreign currency or if the counterparties do not perform under the contracts’ terms. |
| | |
| (g) | Forward Foreign Currency Exchange Contracts–The Fund may enter into forward foreign currency exchange contracts in order to reduce exposure to changes in foreign currency exchange rates on foreign portfolio holdings, or gain or reduce exposure to foreign currency solely for investment purposes. A forward foreign currency exchange contract is a commitment to purchase or sell a foreign currency at a future date at a negotiated rate. The contracts are valued daily at forward exchange rates and any unrealized gain (loss), if applicable, is included in Net change in unrealized appreciation/depreciation on forward foreign currency exchange contracts in the Fund’s Statement of Operations. The gain (loss) arising from the difference between the U.S. dollar cost of the original contract and the value of the forward foreign currency in U.S. dollars upon closing of such contracts is included, if applicable, in Net realized gain (loss) on forward foreign currency exchange contracts in the Fund’s Statement of Operations. |
| | |
| (h) | Futures Contracts–The Fund may purchase and sell futures contracts to enhance returns, to attempt to economically hedge some of its investment risk, or as a substitute position in lieu of holding the underlying asset on which the instrument is based. At the time of entering into a futures transaction, an investor is required to deposit and maintain a specified amount of cash or eligible securities called “initial margin.” Subsequent payments made or received by the Fund called “variation margin” are made on a daily basis as the market price of the futures contract fluctuates. The Fund will record an unrealized gain (loss) based on the amount of variation margin. When a contract is closed, a realized gain (loss) is recorded equal to the difference between the opening and closing value of the contract. |
| | |
| (i) | Inflation-Linked Derivatives–The Fund may invest in inflation-linked derivatives, such as Consumer Price Index Swap Agreements (“CPI swaps”). A CPI swap is a contract in which one party agrees to pay a fixed rate in exchange for a variable rate, which is the rate of change in the CPI during the life of the contract. Payments are based on a notional amount of principal. The Fund will normally enter into CPI swap contracts on a zero coupon basis, meaning that the floating rate will be based on the cumulative CPI during the life of the contract, and the fixed rate will compound until the swap’s maturity date, at which point the payments are netted. The swaps are valued daily and any unrealized gain (loss) is included in the Net change in unrealized appreciation/depreciation on swap contracts in the Fund’s Statement of Operations. A liquidation payment received or made at the termination or maturity of the swap is recorded in realized gain (loss) and is included in Net realized gain (loss) on swap contracts in the Fund’s Statement of Operations. Daily changes in valuation of centrally cleared CPI swaps, if any, are recorded as a receivable or payable for the change in value as appropriate (“variation margin”) on the Statement of Assets and Liabilities. For the centrally cleared CPI swaps, there was minimal counterparty risk to the Fund, since such CPI swaps entered into were traded through a central clearinghouse, which guarantees against default. |
| | |
| (j) | Credit Default Swaps–The Fund may enter into credit default swap contracts in order to hedge credit risk or for speculation purposes. As a seller of a credit default swap contract (“seller of protection”), the Fund is required to pay the notional amount or other agreed-upon value of a referenced debt obligation to the counterparty in the event of a default by or other credit event involving the referenced issuer, obligation or index. In return, the Fund receives from the counterparty a periodic stream of payments over the term of the contract. |
34
Notes to Financial Statements (continued)
| | As a purchaser of a credit default swap contract (“buyer of protection”), the Fund would receive the notional amount or other agreed upon value of a referenced debt obligation from the counterparty in the event of default by or other credit event involving the referenced issuer, obligation or index. In return, the Fund makes periodic payments to the counterparty over the term of the contracts, provided no event of default has occurred. |
| | |
| | These credit default swaps may have as a reference obligation corporate or sovereign issuers or credit indexes. These credit indexes are comprised of a basket of securities representing a particular sector of the market. |
| | |
| | Credit default swaps are fair valued based upon quotations from counterparties, brokers or market-makers and the change in value, if any, is recorded as unrealized appreciation or depreciation. For a credit default swap sold by the Fund, payment of the agreed-upon amount made by the Fund in the event of default of the referenced debt obligation is recorded as the cost of the referenced debt obligation purchased/received. For a credit default swap purchased by the Fund, the agreed-upon amount received by the Fund in the event of default of the referenced debt obligation is recorded as proceeds from sale/delivery of the referenced debt obligation and the resulting gain or loss realized on the referenced debt obligation is recorded as such by the Fund. |
| | |
| | Any upfront payments made or received upon entering a credit default swap contract would be amortized or accreted over the life of the swap and recorded as realized gains or losses. Collateral, in the form of cash or securities, may be required to be held in segregated accounts with the custodian bank or broker in accordance with the swap agreement. The value and credit rating of each credit default swap where the Fund is the seller of protection, are both measures of the current payment/performance risk of the swap. As the value of the swap changes as a positive or negative percentage of the total notional amount, the payment/performance risk may decrease or increase, respectively. The maximum potential amount of future payments (undiscounted) that the Fund as a seller of protection could be required to make under a credit default swap agreement would be an amount equal to the notional amount of the agreement. These potential amounts would be partially offset by any recovery values of the respective referenced obligations, upfront payments received upon entering into the agreement, or net amounts received from the settlement of buy protection credit default swap agreements entered into by the Fund for the same referenced entity or entities. |
| | |
| | Entering into credit default swaps involves credit and market risk. Such risks involve the possibility that there will be no liquid market for these agreements, that the counterparty to the agreements may default on its obligation to perform or disagree as to the meaning of the contractual terms in the agreements, and that there may be unfavorable changes in interest rates, and that Lord Abbett does not correctly predict the creditworthiness of the issuers of the reference obligation on which the credit default swap is based. For the centrally cleared credit default swaps, there was minimal counterparty risk to the Fund, since such credit default swaps entered into were traded through a central clearinghouse, which guarantees against default. |
| | |
| (k) | Repurchase Agreements–The Fund may enter into repurchase agreements with respect to securities. A repurchase agreement is a transaction in which a fund acquires a security and simultaneously commits to resell that security to the seller (a bank or securities dealer) at an agreed-upon price on an agreed-upon date. The Fund requires at all times that the repurchase agreement be collateralized by cash, or by securities of the U.S. Government, its agencies, its instrumentalities, or U.S. Government sponsored enterprises having a value equal to, or in |
35
Notes to Financial Statements (continued)
| | excess of, the value of the repurchase agreement (including accrued interest). If the seller of the agreement defaults on its obligation to repurchase the underlying securities at a time when the fair value of these securities has declined, the Fund may incur a loss upon disposition of the securities. |
| | |
| (l) | When-Issued, Forward Transactions or To-Be-Announced (“TBA”) Transactions–The Fund may purchase portfolio securities on a when-issued or forward basis. When-issued, forward transactions or TBA transactions involve a commitment by the Fund to purchase securities, with payment and delivery (“settlement”) to take place in the future, in order to secure what is considered to be an advantageous price or yield at the time of entering into the transaction. During the period between purchase and settlement, the fair value of the securities will fluctuate and assets consisting of cash and/or marketable securities (normally short-term U.S. Government or U.S. Government sponsored enterprise securities) marked to market daily in an amount sufficient to make payment at settlement will be segregated at the Fund’s custodian in order to pay for the commitment. At the time the Fund makes the commitment to purchase a security on a when-issued basis, it will record the transaction and reflect the liability for the purchase and fair value of the security in determining its NAV. The Fund, generally, has the ability to close out a purchase obligation on or before the settlement date rather than take delivery of the security. Under no circumstances will settlement for such securities take place more than 120 days after the purchase date. |
| | |
| (m) | Mortgage Dollar Rolls–The Fund may enter into mortgage dollar rolls in which a Fund sells mortgage-backed securities for delivery in the current month and simultaneously contracts with the same counterparty to repurchase similar (same type, coupon and maturity) but not identical securities on a specified future date. During the roll period, the Fund loses the right to receive principal (including prepayments of principal) and interest paid on the securities sold. |
| | |
| (n) | Reverse Repurchase Agreements–The Fund may enter into reverse repurchase agreements. In a reverse repurchase agreement, a fund sells a security to a securities dealer or bank for cash and also agrees to repurchase the same security later at a set price. Reverse repurchase agreements expose the Fund to credit risk (that is, the risk that the counterparty will fail to resell the security to the Fund). Engaging in reverse repurchase agreements also may involve the use of leverage, in that the Fund may reinvest the cash it receives in additional securities. Reverse repurchase agreements involve the risk that the market value of the securities to be repurchased by the Fund may decline below the repurchase price. |
| | |
| | For the fiscal year ended December 31, 2022, the Fund did not have reverse repurchase agreements. |
| | |
| (o) | Floating Rate Loans–The Fund may invest in floating rate loans, which usually take the form of loan participations and assignments. Loan participations and assignments are agreements to make money available to U.S. or foreign corporations, partnerships or other business entities (the “Borrower”) in a specified amount, at a specified rate and within a specified time. A loan is typically originated, negotiated and structured by a U.S. or foreign bank, insurance company or other financial institution (the “Agent”) for a group of loan investors (“Loan Investors”). The Agent typically administers and enforces the loan on behalf of the other Loan Investors in the syndicate and may hold any collateral on behalf of the Loan Investors. Such loan participations and assignments are typically senior, secured and collateralized in nature. The Fund records an investment when the Borrower withdraws money and records interest as earned. These loans pay interest at rates which are periodically reset by reference to a base lending rate plus a |
36
Notes to Financial Statements (continued)
| | spread. These base lending rates are generally the prime rate offered by a designated U.S. bank or London InterBank Offered Rate (“LIBOR”). |
| | |
| | The loans in which the Fund invests may be subject to some restrictions on resale. For example, the Fund may be contractually obligated to receive approval from the Agent and/or Borrower prior to the sale of these investments. The Fund generally has no right to enforce compliance with the terms of the loan agreement with the Borrower. As a result, the Fund assumes the credit risk of the Borrower, the selling participant and any other persons interpositioned between the Fund and the Borrower (“Intermediate Participants”). In the event that the Borrower, selling participant or Intermediate Participants become insolvent or enter into bankruptcy, the Fund may incur certain costs and delays in realizing payment or may suffer a loss of principal and/or interest. |
| | |
| | Unfunded commitments represent the remaining obligation of the Fund to the Borrower. At any point in time, up to the maturity date of the issue, the Borrower may demand the unfunded portion. Until demanded by the Borrower, unfunded commitments are not recognized as an asset on the Statement of Assets and Liabilities. Unrealized appreciation/depreciation on unfunded commitments, if any, on the Statement of Assets and Liabilities represents mark to market of the unfunded portion of the Fund’s floating rate notes. |
| | |
| | As of December 31, 2022, the Fund did not have unfunded loan commitments. |
| | |
| (p) | Interest Rate Swaps–The Fund may enter into interest rate swap agreements. Pursuant to interest rate swap agreements, a Fund either makes floating-rate payments to the counterparty (or Central counterparty clearing house (“CCP”) in the case of centrally cleared swaps) based on a benchmark interest rate in exchange for fixed-rate payments or a Fund makes fixed-rate payments to the counterparty or CCP in exchange for payments on a floating benchmark interest rate. Payments received or made, including amortization of upfront payments/receipts, are recorded as realized gains or losses. During the term of the outstanding swap agreement, changes in the underlying value of the swap are recorded as unrealized gains or losses. For centrally cleared swaps, the daily change in valuation is recorded as a receivable or payable for variation margin and settled in cash with the CCP daily. The value of the swap is determined by changes in the relationship between two rates of interest. A Fund is exposed to credit loss in the event of non-performance by the swap counterparty. In the case of centrally cleared swaps, counterparty risk is minimal due to protections provided by the CCP. Risk may also arise from movements in interest rates. |
| | |
| (q) | Fair Value Measurements–Fair value is defined as the price that the Fund would receive upon selling an investment or transferring a liability in an orderly transaction to an independent buyer in the principal or most advantageous market of the investment. A three-tier hierarchy is used to maximize the use of observable market data and minimize the use of unobservable inputs and to establish classification of fair value measurements for disclosure purposes. Inputs refer broadly to the assumptions that market participants would use in pricing the asset or liability, including assumptions about risk - for example, the risk inherent in a particular valuation technique used to measure fair value (such as a pricing model) and/or the risk inherent in the inputs to the valuation technique. Inputs may be observable or unobservable. Observable inputs reflect the assumptions market participants would use in pricing the asset or liability. Observable inputs are based on market data obtained from sources independent of the reporting entity. Unobservable inputs reflect the reporting entity’s own assumptions about the assumptions market participants would use in pricing the asset or liability. Unobservable inputs |
37
Notes to Financial Statements (continued)
| | are based on the best information available in the circumstances. The three-tier hierarchy classification is determined based on the lowest level of inputs that is significant to the fair value measurement, and is summarized in the three broad Levels listed below: |
| | • | Level 1 - | unadjusted quoted prices in active markets for identical investments; |
| | | | |
| | • | Level 2 - | other significant observable inputs (including quoted prices for similar investments, interest rates, prepayment speeds, credit risk, etc.); and |
| | | | |
| | • | Level 3 - | significant unobservable inputs (including the Fund’s own assumptions in determining the fair value of investments). |
| | A summary of inputs used in valuing the Fund’s investments and other financial instruments as of December 31, 2022 and, if applicable, Level 3 rollforwards for the fiscal year then ended is included in the Fund’s Schedule of Investments. |
| | |
| | Changes in valuation techniques may result in transfers into or out of an assigned level within the three-tier hierarchy. The inputs or methodology used for valuing securities are not necessarily an indication of the risk associated with investing in those securities. |
| 3. | MANAGEMENT FEE AND OTHER TRANSACTIONS WITH AFFILIATES |
Management Fee
The Company has a management agreement with Lord Abbett, pursuant to which Lord Abbett provides the Fund with investment management services and executive and other personnel, provides office space and pays for ordinary and necessary office and clerical expenses relating to research and statistical work and supervision of the Fund’s investment portfolio. The management fee is accrued daily and payable monthly.
The management fee is based on the Fund’s average daily net assets at the following annual rate:
| First $4 billion | .28% |
| Next $11 billion | .26% |
| Over $15 billion | .25% |
For the fiscal year ended December 31, 2022, the effective management fee, net of any applicable waivers, was at an annual rate of .28% of the Fund’s average daily net assets.
In addition, Lord Abbett provides certain administrative services to the Fund pursuant to an Administrative Services Agreement in return for a fee at an annual rate of .04% of the Fund’s average daily net assets. The fund administration fee is accrued daily and payable monthly. Lord Abbett voluntarily waived $19,802 of fund administration fees during the fiscal year ended December 31, 2022.
The Company, on behalf of the Fund, has entered into services arrangements with certain insurance companies. Under these arrangements, certain insurance companies will be compensated up to .25% of the average daily net asset value (“NAV”) of the Fund’s Class VC Shares held in the insurance company’s separate account to service and maintain the Variable Contract owners’ accounts. This amount is included in Non 12b-1 service fees on the Statement of Operations. The Fund may also compensate certain insurance companies, third-party administrators and other entities for providing recordkeeping, sub-transfer agency and other administrative services to the Fund. This amount is included in Shareholder servicing on the Statement of Operations.
One Director and certain of the Company’s officers have an interest in Lord Abbett.
38
Notes to Financial Statements (continued)
| 4. | DISTRIBUTIONS AND CAPITAL LOSS CARRYFORWARDS |
Dividends from net investment income, if any, are declared and paid at least semi-annually. Taxable net realized gains from investment transactions, reduced by allowable capital loss carryforwards, if any, are declared and distributed to shareholders at least annually. The capital loss carryforward amount, if any, is available to offset future net capital gains. Dividends and distributions to shareholders are recorded on the ex-dividend date. The amounts of dividends and distributions from net investment income and net realized capital gains are determined in accordance with federal income tax regulations, which may differ from U.S. GAAP. These book/tax differences are either considered temporary or permanent in nature. To the extent these differences are permanent in nature, such amounts are reclassified within the components of net assets based on their federal tax basis treatment; temporary differences do not require reclassification. Dividends and distributions that exceed earnings and profits for tax purposes are reported as a tax return of capital.
The tax character of distributions paid during the fiscal years ended December 31, 2022 and 2021 was as follows:
| | | Year Ended
12/31/2022 | | | Year Ended
12/31/2021 | |
| Distributions paid from: | | | | | | | | |
| Ordinary income | | $ | 18,681,623 | | | $ | 12,857,073 | |
| Net long-term capital gains | | | 1,296,591 | | | | 4,772,086 | |
| Tax return of capital | | | 1,072,532 | | | | – | |
| Total distributions paid | | $ | 21,050,746 | | | $ | 17,629,159 | |
As of December 31, 2022, the components of accumulated losses on a tax-basis were as follows:
| Capital loss carryforwards* | | $ | (76,346,458 | ) |
| Temporary differences | | | (77,933 | ) |
| Unrealized losses – net | | | (35,803,571 | ) |
| Total accumulated losses – net | | $ | (112,227,962 | ) |
| * | The capital losses will carry forward indefinitely. |
As of December 31, 2022, the aggregate unrealized security gains and losses on investments and other financial instruments based on cost for U.S. federal income tax purposes were as follows:
| Tax cost | | $ | 683,023,854 | |
| Gross unrealized gain | | | 1,356,080 | |
| Gross unrealized loss | | | (37,159,651 | ) |
| Net unrealized security loss | | $ | (35,803,571 | ) |
The difference between book-basis and tax-basis unrealized gains (losses) is attributable to the tax treatment of other financial instruments, premium amortization and wash sales.
| 5. | PORTFOLIO SECURITIES TRANSACTIONS |
Purchases and sales of investment securities (excluding short-term investments) for the fiscal year ended December 31, 2022 were as follows:
U.S.
Government
Purchases* | | | Non-U.S.
Government
Purchases | | | U.S.
Government
Sales* | | | Non-U.S.
Government
Sales | |
| $ | 2,817,731,229 | | | | $346,738,416 | | | | $2,745,609,522 | | | | $337,007,372 | |
| * | Includes U.S. Government sponsored enterprises securities. |
39
Notes to Financial Statements (continued)
The Fund is permitted to purchase and sell securities (“cross-trade”) from and to other Lord Abbett funds or client accounts pursuant to procedures approved by the Board in compliance with Rule 17a-7 under the Act (the “Rule”). Each cross-trade is executed at a fair market price in compliance with provisions of the Rule. For the fiscal year ended December 31, 2022, the Fund engaged in cross-trade purchases of $6,313,920 and sales of $1,208,549 which resulted in a net realized gain (loss) of $(79,392).
| 6. | DISCLOSURES ABOUT DERIVATIVE INSTRUMENTS AND HEDGING ACTIVITIES |
The Fund entered into U.S. Treasury futures contracts for the fiscal year ended December 31, 2022 (as described in Note 2(h)) to economically hedge against changes in interest rates. The Fund bears the risk of interest rates moving unexpectedly, in which case the Fund may not achieve the anticipated benefits of the futures contracts and realize a loss. There is minimal counterparty credit risk to the Fund since futures are exchange traded and the exchange’s clearinghouse, as counterparty to all exchange traded futures, guarantees futures against default.
The Fund entered into credit default swaps for the fiscal year ended December 31, 2022 (as described in Note 2(j)) for investment purposes, to economically hedge credit risk or for speculative purposes. Credit default swaps involve the exchange of a fixed rate premium for protection against the loss in value of an underlying security within the index in the event of a defined credit event, such as payment default or bankruptcy. Under a credit default swap one party acts as a guarantor by receiving the fixed periodic payment in exchange for the commitment to purchase the underlying security at par if the defined credit event occurs. Upon the occurrence of a defined credit event, the difference between the value of the reference obligation and the swap’s notional amount is recorded as realized gain or loss on swap transactions in the Statement of Operations. The Fund’s maximum risk of loss from counterparty risk, either as the protection seller or as the protection buyer, is the fair value of the contract. For the centrally cleared credit default swaps, there is minimal counterparty credit risk to the Fund since these credit default swaps are traded through a central clearinghouse. As a counterparty to all centrally cleared credit default swaps, the clearinghouse guarantees credit default swaps against default.
The Fund entered into interest rate swaps for the fiscal year ended December 31, 2022 (as described in Note 2(p)) in order to enhance returns or hedge against interest rate risk. Interest rate swaps are agreements in which one party pays a stream of interest payments, either fixed or floating, for another party’s stream of interest payments, either fixed or floating, on the same notional amount for a specified period of time. The interest rate swap agreement will normally be entered into on a zero coupon basis, meaning that the floating rate will be based on the cumulative of the variable rate, and the fixed rate will compound until the swap’s maturity date, at which point the payments would be netted.
The Fund entered into CPI swaps for the fiscal year ended December 31, 2022 (as described in Note 2(i)) to speculate the rate of inflation in the U.S. economy. The Fund’s use of CPI swaps involves the risk that Lord Abbett will not accurately predict expectations of inflation or interest rates, and the Fund’s returns could be reduced as a result. The Fund’s risk of loss from counterparty credit risk is the unrealized appreciation on CPI swaps. For the centrally cleared CPI swaps, there is minimal counterparty credit risk to the Fund since these CPI swaps are traded through a central clearinghouse. As a counterparty to all centrally cleared CPI swaps, the clearinghouse guarantees CPI swaps against default.
40
Notes to Financial Statements (continued)
As of December 31, 2022, the Fund had the following derivatives at fair value, grouped into appropriate risk categories that illustrate the Fund’s use of derivative instruments:
| Asset Derivatives | | Interest
Rate
Contracts | | | Credit
Contracts | |
| Centrally Cleared Credit Default Swap Contracts(1) | | $ | – | | | $ | 101,618 | |
| Futures Contracts(2) | | | 130,259 | | | | – | |
| | | | | | | | | |
| Liability Derivatives | | | | | | | | |
| Centrally Cleared Credit Default Swap Contracts(1) | | | – | | | | 698,520 | |
| Futures Contracts(2) | | | 1,218,334 | | | | – | |
| (1) | Statement of Assets and Liabilities location: Includes cumulative unrealized appreciation/depreciation of centrally cleared swap contracts as reported in the Schedule of Investments. Only current day’s variation margin is reported within the Statement of Assets and Liabilities. |
| (2) | Statement of Assets and Liabilities location: Includes cumulative unrealized appreciation/depreciation of futures contracts as reported in the Schedule of Investments. Only current day’s variation margin is reported within the Statement of Assets and Liabilities. |
Transactions in derivative instruments for the for the fiscal year ended December 31, 2022, were as follows:
| | | Inflation
Linked/
Interest
Rate
Contracts | | | Credit
Contracts | |
| Net Realized Gain (Loss) | | | | | | | | |
| CPI/Interest Rate Swap Contracts(1) | | $ | 281,544 | | | | – | |
| Credit Default Swap Contracts(1) | | | – | | | $ | 421,373 | |
| Futures Contracts(2) | | $ | (18,423,430 | ) | | | – | |
| Net Change in Unrealized Appreciation/ Depreciation | | | | | | | | |
| Credit Default Swap Contracts(3) | | | – | | | $ | 42,631 | |
| Futures Contracts(4) | | $ | (1,781,330 | ) | | | – | |
| Average Number of Contracts/ Notional Amounts* | | | | | | | | |
| Centrally Cleared Credit Default Swap Contracts(5) | | | – | | | $ | 12,873,225 | |
| CPI/Interest Rate Swap Contracts(5) | | $ | 3,774,459 | | | | – | |
| Futures Contracts(6) | | | 733 | | | | – | |
| * | Calculated based on the number of contracts or notional amounts for the year ended December 31, 2022. |
| (1) | Statement of Operations location: Net realized gain (loss) on swap contracts. |
| (2) | Statement of Operations location: Net realized gain (loss) on futures contracts. |
| (3) | Statement of Operations location: Net change in unrealized appreciation/depreciation on swap contracts. |
| (4) | Statement of Operations location: Net change in unrealized appreciation/depreciation on futures contracts. |
| (5) | Amount represents notional amounts in U.S. dollars. |
| (6) | Amount represents number of contracts. |
| 7. | DISCLOSURES ABOUT OFFSETTING ASSETS AND LIABILITIES |
The Financial Accounting Standards Board requires disclosures intended to help better assess the effect or potential effect of offsetting arrangements on a fund’s financial position. The following tables illustrate gross and net information about recognized assets and liabilities eligible for offset in the Statement of Assets and Liabilities; and disclose such amounts subject to an enforceable master netting agreement or similar agreement, by the counterparty. A master netting agreement is an
41
Notes to Financial Statements (continued)
agreement between a fund and a counterparty which provides for the net settlement of amounts owed under all contracts traded under that agreement, as well as cash collateral, through a single payment by one party to the other in the event of default on or termination of any one contract. The Fund’s accounting policy with respect to balance sheet offsetting is that, absent an event of default by the counterparty or a termination of the agreement, the master netting agreement does not result in an offset of reported amounts of financial assets and liabilities in the Statement of Assets and Liabilities across transactions between the Fund and the applicable counterparty:
| Description | | Gross Amounts of
Recognized Assets | | Gross Amounts
Offset in the
Statement of Assets
and Liabilities | | | Net Amounts of
Assets Presented
in the Statement of
Assets and Liabilities |
| Repurchase Agreements | | $11,947,421 | | $ | – | | | $11,947,421 |
| Total | | $11,947,421 | | $ | – | | | $11,947,421 |
| | | Net Amount
of Assets
Presented in | | | Amounts Not Offset in the
Statement of Assets and Liabilities | | | | |
Counterparty | | the Statement
of Assets and
Liabilities | | | Financial
Instruments | | | Cash
Collateral
Received(a | ) | | Securities
Collateral
Received(a | ) | | Net
Amount(b) |
| Fixed Income Clearing Corp. | | | $11,947,421 | | | $ | – | | | $ | – | | | $ | (11,947,421 | ) | | $ | – |
| Total | | | $11,947,421 | | | $ | – | | | $ | – | | | $ | (11,947,421 | ) | | $ | – |
| (a) | Collateral disclosed is limited to an amount not to exceed 100% of the net amount of assets (liabilities) presented in the Statement of Assets and Liabilities, for each respective counterparty. |
| (b) | Net amount represents the amount owed to the Fund by the counterparty as of December 31, 2022. |
| 8. | DIRECTORS’ REMUNERATION |
The Company’s officers and one Director, who are associated with Lord Abbett, do not receive any compensation from the Company for serving in such capacities. Independent Directors’ fees are allocated among all Lord Abbett-sponsored funds based on the net assets of each fund. There is an equity-based plan available to all Independent Directors under which Independent Directors may elect to defer receipt of a portion of Directors’ fees. The deferred amounts are treated as though equivalent dollar amounts had been invested in the Fund. Such amounts and earnings accrued thereon are included in Directors’ fees on the Statement of Operations and in Directors’ fees payable on the Statement of Assets and Liabilities and are not deductible for U.S. federal income tax purposes until such amounts are paid.
The Company has entered into an arrangement with its transfer agent and custodian, whereby credits realized as a result of uninvested cash balances are used to reduce a portion of the Fund’s expenses.
For the period ended August 3, 2022, the Fund and certain other funds managed by Lord Abbett (collectively, the “Participating Funds”) entered into a syndicated line of credit facility with various lenders for $1.275 billion (the “Syndicated Facility”) whereas State Street Bank and Trust Company (“SSB”) participated as a lender and as agent for the lenders. The Participating Funds were subject to graduated borrowing limits of one-third of fund net assets (if fund net assets are less than $750 million), $250 million, $300 million, $700 million, or $1 billion, based on past borrowings and likelihood of future borrowings, among other factors.
42
Notes to Financial Statements (continued)
Effective August 4, 2022, the Participating Funds entered into a Syndicated Facility with various lenders for $1.625 billion whereas SSB participates as a lender and as agent for the lenders. The Participating Funds were subject to graduated borrowing limits of one-third of fund net assets (if fund net assets are less than $750 million), $250 million, $300 million, $700 million, or $1 billion, based on past borrowings and likelihood of future borrowings, among other factors.
For the period ended August 3, 2022, the Participating Funds were party to an additional line of credit facility with SSB for $330 million (the “Bilateral Facility”), $250 million committed and $80 million uncommitted. Under the Bilateral Facility, the Participating Funds are subject to graduated borrowing limits of one-third of fund net assets (if net assets are less than $750 million), $250 million, $300 million, or $330 million, based on past borrowings and likelihood of future borrowings, among other factors.
Effective August 4, 2022, the Participating Funds are party to an additional uncommitted line of credit facility with SSB for $330 million. Under the Bilateral Facility, the Participating Funds are subject to borrowing limits of one-third of fund net assets (if net assets are less than $750 million), or $250 million based on past borrowings and likelihood of future borrowings, among other factors.
The Syndicated Facility and the Bilateral Facility are to be used for temporary or emergency purposes as additional sources of liquidity to satisfy redemptions.
For the year ended December 31, 2022, the Fund did not utilize the Syndicated Facility or Bilateral Facility.
| 11. | INTERFUND LENDING PROGRAM |
Pursuant to an exemptive order issued by the U.S. Securities and Exchange Commission (“SEC exemptive order”) certain registered open-end management investment companies managed by Lord Abbett, including the Fund, participate in a joint lending and borrowing program (the “Interfund Lending Program”). The SEC exemptive order allows the funds that participate in the Interfund Lending Program to borrow money from and lend money to each other for temporary or emergency purposes subject to the limitations and conditions.
For the fiscal year ended December 31, 2022 the Fund participated as a lender in the Interfund Lending Program. For the period in which the loan was outstanding, the average amount loaned, interest rate and interest income were as follows:
Average
Amount Loaned | | Average
Interest Rate | | Interest
Income* |
| $21,102,219 | | 0.80% | | $1,718 |
| * | Statement of Operations location: Interest earned from Interfund Lending. |
| 12. | CUSTODIAN AND ACCOUNTING AGENT |
SSB is the Company’s custodian and accounting agent. SSB performs custodial, accounting and recordkeeping functions relating to portfolio transactions and calculating the Fund’s NAV.
| 13. | SECURITIES LENDING AGREEMENT |
The Fund has established a securities lending agreement with Citibank, N.A. for the lending of securities to qualified brokers in exchange for securities or cash collateral equal to at least the market value of securities loaned, plus interest, if applicable. Cash collateral is invested in an approved money market fund. In accordance with the Fund’s securities lending agreement, the
43
Notes to Financial Statements (continued)
market value of securities on loan is determined each day at the close of business and any additional collateral required to cover the value of securities on loan is delivered to the Fund on the next business day. As with other extensions of credit, the Fund may experience a delay in the recovery of its securities or incur a loss should the borrower of the securities breach its agreement with the Fund or the borrower becomes insolvent at a time when the collateral is insufficient to cover the cost of repurchasing securities on loan. Any income earned from securities lending is included in Securities lending net income on the Fund’s Statement of Operations.
The initial collateral received by the Fund is required to have a value equal to at least 100% of the market value of the securities loaned. The collateral must be marked-to-market daily to cover increases in the market value of the securities loaned (or potentially a decline in the value of the collateral). In general, the risk of borrower default will be borne by Citibank, N.A.; the Fund will bear the risk of loss with respect to the investment of the cash collateral. The advantage of such loans is that the Fund continues to receive income on loaned securities while receiving a portion of any securities lending fees and earning returns on the cash amounts which may be reinvested for the purchase of investments in securities.
As of December 31, 2022, the Fund did not loan any securities.
The Fund is subject to the general risks and considerations associated with investing in fixed income securities, including the risk that issuers will fail to make timely payments of principal or interest or default altogether. The value of an investment will change as interest rates fluctuate and in response to market movements. When interest rates rise, the prices of fixed income securities are likely to decline; when interest rates fall, such prices tend to rise. Longer-term securities are usually more sensitive to interest rate changes. There is also the risk that an issuer of a fixed income security will fail to make timely payments of principal and/or interest to the Fund, a risk that is greater with high-yield bonds (sometimes called “junk bonds”) in which the Fund may substantially invest. Some issuers, particularly of high-yield bonds, may default as to principal and/or interest payments after the Fund purchases its securities. A default, or concerns in the market about an increase in risk of default, may result in losses to the Fund. High-yield bonds are subject to greater price fluctuations, as well as additional risks. The market for below investment grade securities may be less liquid, which may make such securities more difficult to sell at an acceptable price, especially during periods of financial distress, increased market volatility, or significant market decline.
The Fund is subject to the general risks and considerations associated with investing in convertible securities, which have both equity and fixed income risk characteristics, including market, credit, liquidity, and interest rate risks. Generally, convertible securities offer lower interest or dividend yields than non-convertible securities of similar quality, and less potential for gains or capital appreciation in a rising equity securities market than equity securities. They tend to be more volatile than other fixed income securities, and the markets for convertible securities may be less liquid than markets for stocks or bonds. A significant portion of convertible securities have below investment grade credit ratings and are subject to increased credit and liquidity risks.
Certain instruments in which the Fund may invest rely in some fashion upon LIBOR. On March 5, 2021, the United Kingdom Financial Conduct Authority (FCA) and LIBOR’s administrator, ICE Benchmark Administration (IBA), announced that most LIBOR settings will no longer be published after the end of 2021 and a majority of U.S. dollar LIBOR settings will no longer be published after June 30, 2023. Abandonment of or modifications to LIBOR could have adverse impacts on newly issued financial instruments and existing financial instruments which reference LIBOR and lead to significant short-term and long-term uncertainty and market instability.
44
Notes to Financial Statements (continued)
The Fund’s investment exposure to foreign (which may include emerging market) companies presents increased market, liquidity, currency, political, information and other risks. As compared with companies organized and operated in the U.S., these companies may be more vulnerable to economic, political and social instability and subject to less government supervision, lack of transparency, inadequate regulatory and accounting standards, and foreign taxes. The securities of foreign companies also may be subject to inadequate exchange control regulations, the imposition of economic sanctions or other government restrictions, higher transaction and other costs, and delays in settlement to the extent they are traded on non-U.S. exchanges or markets. The cost of the Fund’s potential use of forward foreign currency exchange contracts varies with factors such as the currencies involved, the length of the contract period and the market conditions prevailing.
The Fund is subject to the risks associated with derivatives, which may be different from and greater than the risks associated with directly investing in securities. Derivatives may be subject to risks such as liquidity risk, leveraging risk, interest rate risk, market risk, and credit risk. Illiquid securities may lower the Fund’s returns since the Fund may be unable to sell these securities at their desired time or price. Derivatives also may involve the risk of mispricing or improper valuation and the risk that changes in the value of the derivative may not correlate perfectly with the value of the underlying asset, rate or index. Whether the Fund’s use of derivatives is successful will depend on, among other things, the Fund’s ability to correctly forecast market movements, changes in foreign exchange and interest rates, and other factors. If the Fund incorrectly forecasts these and other factors, the Fund’s performance could suffer. The Fund’s use of derivatives could result in a loss exceeding the amount of the Fund’s investment in these instruments.
The Fund may invest in swap contracts. Swap contracts are bilateral agreements between a fund and its counterparty. Each party is exposed to the risk of default by the other. In addition, they may involve a small investment of cash compared to the risk assumed with the result that small changes may produce disproportionate and substantial gains or losses to the Fund.
The Fund may invest in credit default swap contracts. The risks associated with the Fund’s investment in credit default swaps are greater than if the Fund invested directly in the reference obligation because they are subject to illiquidity risk, counterparty risk, and credit risk at both the counterparty and underlying issuer levels.
The Fund may invest in floating rate or adjustable rate senior loans, which are subject to increased credit and liquidity risks. Senior loans are business loans made to borrowers that may be U.S. or foreign corporations, partnerships, or other business entities. The senior loans in which the Fund may invest may consist primarily of senior loans that are rated below investment grade or, if unrated, deemed by Lord Abbett to be equivalent to below investment grade securities. Below investment grade senior loans, as in the case of high-yield debt securities, or junk bonds, are usually more credit sensitive than interest rate sensitive, although the value of these instruments may be impacted by broader interest rate swings in the overall fixed income market. In addition, senior loans may be subject to structural subordination.
The Fund is subject to the risk of investing a significant portion of its assets in securities issued or guaranteed by the U.S. Government or its agencies and instrumentalities (such as the Government National Mortgage Association (“Ginnie Mae”), the Federal National Mortgage Association (“Fannie Mae”), or the Federal Home Loan Mortgage Corporation (“Freddie Mac”)). Unlike Ginnie Mae securities, securities issued or guaranteed by U.S. Government-related organizations such as Fannie Mae and Freddie Mac are not backed by the full faith and credit of the U.S. Government and no assurance can be given that the U.S. Government would provide financial support to its agencies and instrumentalities if not required to do so by law. Consequently, the Fund may be required to look principally to the agency issuing or guaranteeing the obligation. In addition, the Fund may invest in non-agency backed and mortgage related securities, which are issued by the private institutions, not by the government-sponsored enterprises. Such securities may be particularly sensitive to changes in economic conditions, including delinquencies and/or defaults, and changes
45
Notes to Financial Statements (concluded)
in prevailing interest rates. These changes can affect the value, income and/or liquidity of such positions. When interest rates are declining, the value of these securities with prepayment features may not increase as much as other fixed income securities. Early principal repayment may deprive the Fund of income payments above current markets rates. The prepayment rate also will affect the price and volatility of a mortgage-related security. In addition, securities of government sponsored enterprises are guaranteed with respect to the timely payment of interest and principal by the particular enterprise involved, not by the U.S. Government.
Geopolitical and other events (e.g., wars, terrorism, natural disasters, epidemics or pandemics such as the COVID-19 outbreak which began in late 2019) may disrupt securities markets and adversely affect global economies and markets, thereby decreasing the value of the Fund’s investments. Market disruptions can also prevent the Funds from implementing its investment strategies and achieving its investment objective.
The transmission of COVID-19 and efforts to contain its spread have resulted in, among other things, border closings and other significant travel restrictions and disruptions, significant disruptions to business operations, supply chains and customer activity, lower consumer demand for goods and services, event cancellations and restrictions, service cancellations, reductions and other changes, significant challenges in healthcare service preparation and delivery, and prolonged quarantines, as well as general concern and uncertainty. The impact of the COVID-19 outbreak has, and could again, negatively affect the global economy, the economies of individual countries, and the financial performance of individual issuers, sectors, industries, asset classes, and markets in significant and unforeseen ways.
The COVID-19 pandemic and its effects may last for an extended period of time. Although the long-term economic fallout of COVID-19 is difficult to predict, it has contributed to, and is likely to continue to contribute to, market volatility, inflation and systemic economic weakness. The foregoing could disrupt the operations of the Fund and its service providers, adversely affect the value and liquidity of the Fund’s investments, and negatively impact the Fund’s performance and your investment in the Fund.
These factors, and others, can affect the Fund’s performance.
| 15. | SUMMARY OF CAPITAL TRANSACTIONS |
Transactions in shares of capital stock were as follows:
| | | Year Ended
December 31, 2022 | | | Year Ended
December 31, 2021 | |
| Shares sold | | | 7,640,758 | | | | 7,714,522 | |
| Reinvestment of distributions | | | 1,486,247 | | | | 1,042,466 | |
| Shares reacquired | | | (6,397,275 | ) | | | (8,957,445 | ) |
| Increase (decrease) | | | 2,729,730 | | | | (200,457 | ) |
46
Report of Independent Registered Public Accounting Firm
To the shareholders and the Board of Directors of Lord Abbett Series Fund, Inc.
Opinion on the Financial Statements and Financial Highlights
We have audited the accompanying statement of assets and liabilities, including the schedule of investments, of Total Return Portfolio, one of the funds constituting Lord Abbett Series Fund, Inc. (the “Fund”), as of December 31, 2022, the related statement of operations for the year then ended, the statements of changes in net assets for each of the two years in the period then ended, the financial highlights for each of the five years in the period then ended, and the related notes. In our opinion, the financial statements and financial highlights present fairly, in all material respects, the financial position of Total Return Portfolio of the Fund as of December 31, 2022, and the results of its operations for the year then ended, the changes in its net assets for each of the two years in the period then ended, and the financial highlights for each of the five years in the period then ended in conformity with accounting principles generally accepted in the United States of America.
Basis for Opinion
These financial statements and financial highlights are the responsibility of the Fund’s management. Our responsibility is to express an opinion on the Fund’s financial statements and financial highlights based on our audits. We are a public accounting firm registered with the Public Company Accounting Oversight Board (United States) (PCAOB) and are required to be independent with respect to the Fund in accordance with the U.S. federal securities laws and the applicable rules and regulations of the Securities and Exchange Commission and the PCAOB.
We conducted our audits in accordance with the standards of the PCAOB. Those standards require that we plan and perform the audit to obtain reasonable assurance about whether the financial statements and financial highlights are free of material misstatement, whether due to error or fraud. The Fund is not required to have, nor were we engaged to perform, an audit of its internal control over financial reporting. As part of our audits we are required to obtain an understanding of internal control over financial reporting but not for the purpose of expressing an opinion on the effectiveness of the Fund’s internal control over financial reporting. Accordingly, we express no such opinion.
Our audits included performing procedures to assess the risks of material misstatement of the financial statements and financial highlights, whether due to error or fraud, and performing procedures that respond to those risks. Such procedures included examining, on a test basis, evidence regarding the amounts and disclosures in the financial statements and financial highlights. Our audits also included evaluating the accounting principles used and significant estimates made by management, as well as evaluating the overall presentation of the financial statements and financial highlights. Our procedures included confirmation of securities owned as of December 31, 2022, by correspondence with the custodian, brokers and selling or agent banks; when replies were not received from brokers and selling or agent banks, we performed other auditing procedures. We believe that our audits provide a reasonable basis for our opinion.
DELOITTE & TOUCHE LLP
New York, New York
February 14, 2023
We have served as the auditor of one or more Lord Abbett Family of Funds’ investment companies since 1932.
47
Basic Information About Management
The Board is responsible for the management of the business and affairs of the Fund in accordance with the laws of the state of organization. The Board elects officers who are responsible for the day-to-day operations of the Fund and who execute policies authorized by the Board. The Board also approves an investment adviser to the Fund and continues to monitor the cost and quality of the services the investment adviser provides, and annually considers whether to renew the contract with the investment adviser. Generally, each Board member holds office until his/her successor is elected and qualified or until his/her earlier resignation or removal, as provided in the Fund’s organizational documents.
Lord, Abbett & Co. LLC (“Lord Abbett”), a Delaware limited liability company, is the Fund’s investment adviser. Designated Lord Abbett personnel are responsible for the day-to-day management of the Fund.
Independent Board Members
The following Independent Board Members also are board members of each of the 15 investment companies in the Lord Abbett Family of Funds, which consist of 63 investment portfolios.
Name, Address and
Year of Birth | | Current Position and
Length of Service
with the Fund | | Principal Occupation and Other Directorships
During the Past Five Years |
Evelyn E. Guernsey
Lord, Abbett & Co. LLC
c/o Legal Dept.
90 Hudson Street
Jersey City, NJ 07302
(1955) | | Board member since 2011;
Vice Chair since 2023 | | Principal Occupation: None. Other Directorships: None. |
Julie A. Hill
Lord, Abbett & Co. LLC
c/o Legal Dept.
90 Hudson Street
Jersey City, NJ 07302
(1946) | | Board member since 2004 | | Principal Occupation: Owner and CEO of The Hill Company, a business consulting firm (since 1998). Other Directorships: Previously served as director of Anthem, Inc., a health benefits company (1994–2021). |
Kathleen M. Lutito
Lord, Abbett & Co. LLC
c/o Legal Dept.
90 Hudson Street
Jersey City, NJ 07302
(1963) | | Board member since 2017 | | Principal Occupation: President and Chief Investment Officer of CenturyLink Investment Management Company (since 2006). Other Directorships: None. |
James M. McTaggart
Lord, Abbett & Co. LLC
c/o Legal Dept.
90 Hudson Street
Jersey City, NJ 07302
(1947) | | Board member since 2012 | | Principal Occupation: Owner of McTaggart LLC (since 2011). Other Directorships: None. |
Charles O. Prince
Lord, Abbett & Co. LLC
c/o Legal Dept.
90 Hudson Street
Jersey City, NJ 07302
(1950) | | Board member since 2019 | | Principal Occupation: None. Formerly Chair and Chief Executive Officer, Citigroup, Inc. (Retired 2007). Other Directorships: Previously served as director of Johnson & Johnson (2005–2022). Previously served as director of Xerox Corporation (2007–2018). |
48
Basic Information About Management (continued)
Name, Address and
Year of Birth | | Current Position and
Length of Service
with the Fund | | Principal Occupation and Other Directorships
During the Past Five Years |
Karla M. Rabusch
Lord, Abbett & Co. LLC
c/o Legal Dept.
90 Hudson Street
Jersey City, NJ 07302
(1959) | | Board member since 2017 | | Principal Occupation: President and Director of Wells Fargo Funds Management, LLC (2003–2017); President of Wells Fargo Funds (2003–2016). Other Directorships: None. |
| | | | | |
Lorin Patrick Taylor Radtke
Lord, Abbett & Co. LLC
c/o Legal Dept.
90 Hudson Street
Jersey City, NJ 07302
(1968) | | Board member since 2021 | | Principal Occupation: Partner and Co-Founder of M Seven 8 Partners LLC, a venture capital firm (since 2016). Formerly Partner, Goldman Sachs (1992–2016). Other Directorships: Currently serves as director of Assured Guaranty (2021–Present), Virtual Combine (2018–Present), and Mariposa Family Learning Center (2021–Present). Previously served as director of SummerMoon Coffee (2022). |
| | | | | |
Leah Song Richardson
Lord, Abbett & Co. LLC
c/o Legal Dept.
90 Hudson Street
Jersey City, NJ 07302
(1966) | | Board member since 2021 | | Principal Occupation: President of Colorado College (since 2021) and was formerly Dean at University of California, Irvine – School of Law (2017–2021) and formerly Professor of Law at University of California, Irvine (2014–2017). Other Directorships: None. |
| | | | | |
Mark A. Schmid
Lord, Abbett & Co. LLC
c/o Legal Dept.
90 Hudson Street
Jersey City, NJ 07302
(1959) | | Board member since 2016 | | Principal Occupation: Vice President and Chief Investment Officer of the University of Chicago (2009–2021). Other Directorships: None. |
| | | | | |
James L.L. Tullis
Lord, Abbett & Co. LLC
c/o Legal Dept.
90 Hudson Street
Jersey City, NJ 07302
(1947) | | Board member since 2006;
Chair since 2017 | | Principal Occupation: Chair of Tullis Health Investors - FL LLC (since 2018); CEO of Tullis-Dickerson and Co. Inc., a venture capital management firm (1990–2016). Other Directorships: Currently serves as Chair of Crane Co. (since 2020, director since 1998), Director of Alphatec Spine (since 2018), and Director of Exagen Inc. (since 2019). Previously served as director of electroCore, Inc. (2018–2020). |
Interested Board Members
Mr. Sieg is affiliated with Lord Abbett and is an “interested person” of the Fund as defined in the Act. Mr. Sieg is a board member of each of the 15 investment companies in the Lord Abbett Family of Funds, which consist of 63 investment portfolios. Mr. Sieg is an officer of the Lord Abbett Family of Funds.
49
Basic Information About Management (continued)
Name, Address and
Year of Birth | | Current Position and
Length of Service
with the Fund | | Principal Occupation and Other Directorships
During the Past Five Years |
Douglas B. Sieg
Lord, Abbett & Co. LLC
90 Hudson Street
Jersey City, NJ 07302
(1969) | | Board member since 2016 | | Principal Occupation: Managing Partner of Lord Abbett (since 2018) and was formerly Head of Client Services, joined Lord Abbett in 1994. Other Directorships: None. |
Officers
None of the officers listed below have received compensation from the Fund. All of the officers of the Fund also may be officers of the other Lord Abbett Funds and maintain offices at 90 Hudson Street, Jersey City, NJ 07302. Unless otherwise indicated, the position(s) and title(s) listed under the “Principal Occupation During the Past Five Years” column indicate each officer’s position(s) and title(s) with Lord Abbett. Each officer serves for an indefinite term (i.e., until his or her death, resignation, retirement, or removal).
Name and
Year of Birth | | Current Position
with the Fund | | Length of Service
of Current
Position | | Principal Occupation
During the Past Five Years |
Douglas B. Sieg
(1969) | | President and Chief Executive Officer | | Elected as President and Chief Executive Officer in 2018 | | Managing Partner of Lord Abbett (since 2018) and was formerly Head of Client Services, joined Lord Abbett in 1994. |
| | | | | | | |
Jackson C. Chan
(1964) | | AML Compliance Officer | | Elected in 2018 | | Deputy Chief Compliance Officer and Director of Regulatory Affairs, joined Lord Abbett in 2014. |
| | | | | | | |
Michael J. Hebert
(1976) | | Chief Financial Officer and Treasurer | | Elected as Chief Financial Officer and Treasurer in 2021 | | Head of Global Fund Finance, joined Lord Abbett in 2021 and was formerly Vice President at Eaton Vance Management (EVM) (2014–2021) and Calvert Research & Management (CRM) (2016–2021), and Assistant Treasurer of registered investment companies managed, advised or administered by EVM and CRM during such years. |
| | | | | | | |
Jennifer C. Karam
(1970) | | Vice President and Assistant Secretary | | Elected in 2022 | | Partner and Senior Deputy General Counsel, joined Lord Abbett in 2012. |
| | | | | | | |
Joseph M. McGill
(1962) | | Chief Compliance Officer | | Elected in 2014 | | Partner and Chief Compliance Officer, joined Lord Abbett in 2014. |
| | | | | | | |
Parker J. Milender
(1989) | | Vice President and Assistant Secretary | | Elected in 2023 | | Counsel, joined Lord Abbett in 2021 and was formerly an Associate at Milbank LLP (2017–2021). |
50
Basic Information About Management (concluded)
Name and
Year of Birth | | Current Position
with the Fund | | Length of Service
of Current
Position | | Principal Occupation
During the Past Five Years |
Matthew A. Press
(1987) | | Vice President and Assistant Secretary | | Elected in 2023 | | Counsel, joined Lord Abbett in 2022 and was formerly an Associate at Clifford Chance US LLP (2014–2022). |
| | | | | | | |
Lawrence B. Stoller
(1963) | | Vice President, Secretary and Chief Legal Officer | | Elected as Vice President and Secretary in 2007 and Chief Legal Officer in 2019 | | Partner and General Counsel, joined Lord Abbett in 2007. |
| | | | | | | |
Victoria Zozulya
(1983) | | Vice President and Assistant Secretary | | Elected in 2022 | | Counsel, joined Lord Abbett in 2022 and was formerly Senior Director and Counsel at Equitable (2018–2022) and Assistant General Counsel at Neuberger Berman (2014–2018). |
| | | | | | | |
Nicholas D. Emguschowa
(1986) | | Data Protection Officer | | Elected in 2022 | | Assistant General Counsel, joined Lord Abbett in 2018 and was formerly Associate at Shearman & Sterling (2014–2018). |
Please call 888-522-2388 for a copy of the statement of additional information, which contains further information about the Fund’s Board members. It is available free upon request.
51
Householding
The Company has adopted a policy that allows it to send only one copy of the Fund’s prospectus, proxy material, annual report and semiannual report (or related notice of internet availability of annual report and semiannual report) to certain shareholders residing at the same “household.” This reduces Fund expenses, which benefits you and other shareholders. If you need additional copies or do not want your mailings to be “householded,” please call Lord Abbett at 888-522-2388 or send a written request with your name, the name of your fund or funds and your account number or numbers to Lord Abbett Family of Funds, P.O. Box 219336, Kansas City, MO 64121.
Proxy Voting Policies, Procedures and Records
A description of the policies and procedures that Lord Abbett uses to vote proxies related to the Fund’s portfolio securities, and information on how Lord Abbett voted the Fund’s proxies during the 12-month period ended June 30 are available without charge, upon request, (i) by calling 888-522-2388; (ii) on Lord Abbett’s website at www.lordabbett.com; and (iii) on the Securities and Exchange Commission’s (“SEC”) website at www.sec.gov.
Shareholder Reports and Quarterly Portfolio Disclosure
The Fund is required to file its complete schedule of portfolio holdings with the SEC for its first and third fiscal quarters as an attachment to Form N-PORT. Copies of the filings are available without charge, upon request on the SEC’s website at www.sec.gov and may be available by calling Lord Abbett at 888-522-2388.
Tax Information (unaudited) Of the distributions paid to the shareholders during the fiscal year ended December 31, 2022, $1,296,591 represent long-term capital gains. |
52


| | | | |
This report, when not used for the general information of shareholders of the Fund, is to be distributed only if preceded or accompanied by a current fund prospectus. Lord Abbett mutual fund shares are distributed by
LORD ABBETT DISTRIBUTOR LLC. | | Lord Abbett Series Fund, Inc. Total Return Portfolio | SFTR-PORT-2
(02/23) |
| (a) | In accordance with applicable requirements, the Registrant adopted a Sarbanes-Oxley Code of Ethics on June 19, 2003 that applies to the principal executive officer and senior financial officers of the Registrant (“Code of Ethics”). The Code of Ethics was in effect during the fiscal year ended December 31, 2022 (the “Period”). |
| (c) | The Registrant has not amended the Code of Ethics as described in Form N-CSR during the Period. |
| (d) | The Registrant has not granted any waiver, including an implicit waiver, from a provision of the Code of Ethics as described in Form N-CSR during the Period. |
| (f) | See Item 13(a)(1) concerning the filing of the Code of Ethics. |
| Item 3: | Audit Committee Financial Expert. |
The Registrant’s board of directors has determined that each of the following independent directors who are members of the audit committee is an audit committee financial expert: Evelyn E. Guernsey, Karla M. Rabusch and Mark A. Schmid. Each of these persons is independent within the meaning of the Form N-CSR.
| Item 4: | Principal Accountant Fees and Services. |
In response to sections (a), (b), (c) and (d) of Item 4, the aggregate fees billed to the Registrant for the fiscal years ended December 31, 2022 and 2021 by the Registrant’s principal accounting firm, Deloitte & Touche LLP, the member firms of Deloitte Touche Tohmatsu and their respective affiliates (collectively, “Deloitte”) were as follows:
| | Fiscal year ended: |
| | |
| | 2022 | 2021 |
| | | |
| Audit Fees {a} | $381,000 | $363,500 |
| | | |
| Audit-Related Fees | - 0 - | - 0 - |
| | | |
| Total audit and audit-related fees | 381,000 | 363,500 |
| | | |
| | | |
| Tax Fees {b} | - 0 - | 53,870 |
| | | |
| All Other Fees | - 0 - | - 0 - |
| | | |
| Total Fees | $381,000 | $417,370 |
{a} Consists of fees for audits of the Registrant’s annual financial statements.
{b} Fees for the fiscal year ended December 31, 2022 and 2021 consist of fees for preparing the U.S. Income Tax Return for Regulated Investment Companies, New Jersey Corporation Business Tax Return, New Jersey Annual Report Form, U.S. Return of Excise Tax on Undistributed Income of Investment Companies, IRS Forms 1099-MISC and 1096 Annual Summary and Transmittal of U.S. Information Returns.
(e) (1) Pursuant to Rule 2-01(c) (7) of Regulation S-X, the Registrant’s Audit Committee has adopted pre-approval policies and procedures. Such policies and procedures generally provide that the Audit Committee must pre-approve:
| · | any audit, audit-related, tax, and other services to be provided to the Lord Abbett Funds, including the Registrant, and |
| · | any audit-related, tax, and other services to be provided to the Registrant’s investment adviser and any entity controlling, controlled by or under common control with the investment adviser that provides ongoing services to one or more Funds comprising the Registrant if the engagement relates directly to operations and financial reporting of a Fund, by the independent auditor to assure that the provision of such services does not impair the auditor’s independence. |
The Audit Committee has delegated pre-approval authority to its Chairman, subject to a fee limit of $10,000 per event, and not to exceed $25,000 annually. The Chairman will report any pre-approval decisions to the Audit Committee at its next scheduled meeting. Unless a type of service to be provided by the independent auditor has received general pre-approval, it must be pre-approved by the Audit Committee. Any proposed services
exceeding pre-approved cost levels will require specific pre-approval by the Audit Committee.
(e) (2) With respect to the services described in paragraphs (b) through (d) of this Item 4, no amount was approved by the Audit Committee pursuant to paragraph (c)(7)(i)(C) of Rule 2-01 of Regulation S-X.
(f) Not applicable.
(g) The aggregate non-audit fees billed by Deloitte for services rendered to the Registrant are shown above in the response to Item 4 (a), (b), (c) and (d) as “All Other Fees”.
The aggregate non-audit fees billed by Deloitte for services rendered to the Registrant’s investment adviser, Lord, Abbett & Co. LLC (“Lord Abbett”), for the fiscal years ended December 31, 2022 and 2021 were:
| | Fiscal year ended: |
| | |
| | 2022 | 2021 |
| | | |
| All Other Fees {a} | $270,000 | 220,000 |
{a} Consist of fees for Independent Services Auditors’ Report on Controls Placed in Operation and Tests of Operating Effectiveness related to Lord Abbett’s Asset Management Services (“SOC-1 Report”).
The aggregate non-audit fees billed by Deloitte for services rendered to entities under the common control of Lord Abbett for the fiscal years ended December 31, 2022 and 2021 were:
| | Fiscal year ended: |
| | |
| | 2022 | 2021 |
| | | |
| All Other Fees | $ - 0 - | $ - 0- |
(h) The Registrant’s Audit Committee has considered the provision of non-audit services that were rendered to the Registrant’s investment adviser, and any entity controlling, controlled by or under common control with the investment adviser that provides ongoing services to the Registrant, that were not pre-approved pursuant to Rule 2-01 (c)(7)(ii) of Regulation S-X and has determined that the provision of such services is compatible with maintaining Deloitte’s independence.
(i) Not Applicable.
(j) Not Applicable.
| Item 5: | Audit Committee of Listed Registrants. |
Not applicable.
The Schedule of Investments is included as part of the Reports to Shareholders under Item 1.
| Item 7: | Disclosure of Proxy Voting Policies and Procedures for Closed-End Management Investment Companies. |
Not applicable.
| Item 8: | Portfolio Managers of Closed-End Management Investment Companies. |
Not applicable.
| Item 9: | Purchases of Equity Securities by Closed-End Management Investment Company and Affiliated Purchasers. |
Not applicable.
| Item 10: | Submission of Matters to a Vote of Security Holders. |
Not applicable.
| Item 11: | Controls and Procedures. |
| (a) | The principal executive officer and principal financial & accounting officer have concluded as of a date within 90 days of the filing date of this report, |
based on their evaluation of the Registrant’s disclosure controls and procedures (as defined in Rule 30a-3(c) under the Investment Company Act of 1940), that the design of such procedures is effective to provide reasonable assurance that material information required to be disclosed by the Registrant on Form N-CSR is recorded, processed, summarized and reported within the time periods specified in the Commission’s rules and forms.
| (b) | There were no changes in the Registrant’s internal control over financial reporting (as defined in Rule 30a-3(d) under the Investment Company Act of 1940) that occurred during the period covered by this report that have materially affected, or are reasonably likely to materially affect, the Registrant’s internal control over financial reporting. |
| Item 12: | Disclosure of Securities Lending Activities for Closed-End Management Investment Companies. |
Not applicable.
SIGNATURES
Pursuant to the requirements of the Securities Exchange Act of 1934 and the Investment Company Act of 1940, the Registrant has duly caused this report to be signed on its behalf by the undersigned, thereunto duly authorized.
| | LORD ABBETT SERIES FUND, INC. |
| | | | |
| | | By: | /s/ Douglas B. Sieg |
| | | | Douglas B. Sieg |
| | | | President and Chief Executive Officer |
Date: February 17, 2023
Pursuant to the requirements of the Securities Exchange Act of 1934 and the Investment Company Act of 1940, this report has been signed below by the following persons on behalf of the Registrant and in the capacities and on the dates indicated.
| | | By: | /s/ Douglas B. Sieg |
| | | | Douglas B. Sieg |
| | | | President and Chief Executive Officer |
Date: February 17, 2023
| | | By: | /s/ Michael J. Hebert |
| | | | Michael J. Hebert |
| | | | Chief Financial Officer and Treasurer |
Date: February 17, 2023