| | | | | | | | | 
|
|
| | | | | | | | | 2002 Annual Report |
|
| | | | | | | | | Sky Financial Group, Inc. |
| | | | | | | | | |

|
| | | | | Our Vision |
|
| | | | | Is Clear. |
|
| | | | | Our Focus |
|
| | | | | Is Sharp. |
Dear Fellow Shareholder:

2002 proved to be another strong year for Sky Financial Group and our employees deserve to take great pride in this accomplishment. Our success was the result of implementing specific measures to deliver value to our clients while generating profitability for our shareholders.
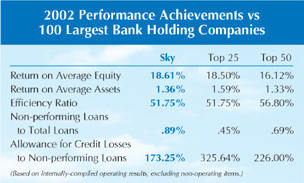
I am pleased to report that operating earnings per share, excluding non-operating items, grew to a record $1.60 in 2002, representing a 10.3% increase from 2001 operating earnings of $1.45. Our net income per share also reached a record $1.52, a 4.8% increase over 2001. On an operating basis, our return on average shareholders’ equity for 2002 was 18.61%, while our return on assets was 1.36%. Sky’s performance, as evidenced by these key profitability measures, continued to be excellent despite challenging economic times.
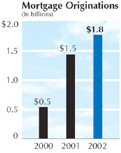
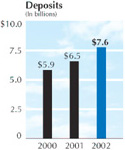
Benefiting from the strong growth in revenues and reflecting the full achievement of merger-related synergies from our acquisitions, our efficiency ratio improved to 51.75% in 2002 from 52.09% in the prior year. Our continued focus on Sky Trek, our sales and service strategy, supplemented by acquisitions, helped Sky increase loans by 22% and deposits by 16%. Mortgage originations, at nearly $1.8 billion, were once again at record levels in 2002, demonstrating our ongoing ability to meet our clients’ needs during a favorable rate environment.
For the fourth consecutive year – every year since Sky’s formation – our performance compared favorably to the nation’s largest 100 financial institutions. Our return on equity and efficiency ratio ranked among the top 25% of this group.
1

Sky’s positive results in 2002 were guided by our Strategic Vision – an aggressive plan to discover and build new sales and growth opportunities. We’ve accomplished our growth and profitability by being able to expand as plans dictate – with minimum disruption to ongoing operations. We have incorporated new acquisitions and executed programs swiftly and efficiently with constant attention to our clients.
The key to our success is a continued focus on these strategic priorities:
| | n | | Organizational synergies |
| | n | | Growth of fee-based businesses |
Organic Growth
“Organic growth” is the term we use to define how we build or expand relationships with our new and existing clients to become a premier sales and service organization. It’s about focusing on clients who present the greatest opportunity and delivering high quality, competitive products. It requires us to completely understand the needs of our clients and the communities we serve.
Building on our earlier achievements with Sky Trek, our client-needs-based sales and service process, we continue to benefit by packaging and promoting financial products for our clients in new and innovative ways. The resulting sales and service performance throughout our company is a testament to our ability to organically grow our business.
One of the prime components of our success over the last few years is our regional strategy. We now have seven regions functioning under the Sky brand. Each of these operates with local empowerment and accountability in lending, personnel and pricing of services. Our regional presidents are the center of this strategy and they drive the ultimate growth and profitability in their markets. When we acquire a new financial institution, this proven regional concept is the basis for its integration into Sky.
Today, sales and marketing initiatives in our regions are developed around specifically targeted client, product and market criteria. This allows us to measure the contribution of each program to the bottom line.

| | 
| | 
|
Our frontline sales staff is the heart of our Sky Trek sales culture. They are one of the keys to our successful organic growth. | | As a part of a summer appreciation campaign, Sky sent employee and client winners to the annual International Balloon Fiesta in New Mexico. | | Mortgage originations hit record levels at the end of 2002. These numbers continue to demonstrate our ability to meet clients’ mortgage needs. |
3
Contents
Letter to Shareholders | | 1 |
Sky Financial Group Board of Directors | | 14 |
Summary of Financial Data | | 15 |
Management’s Discussion and Analysis of Financial Condition and Results of Operations | | 16 |
Reports of Management and Independent Auditors | | 29 |
Consolidated Balance Sheets | | 30 |
Consolidated Statements of Income | | 31 |
Consolidated Statements of Changes in Shareholders’ Equity | | 32 |
Consolidated Statements of Cash Flows | | 33 |
Notes to Consolidated Financial Statements | | 34 |
Sky Boards of Directors | | 58 |
Sky Management | | 59 |
Shareholder Information and Acknowledgements | | 60 |
Financial Highlights
(Dollars in thousands, except per share data)
| | | 2002
| | | 2001
| | | Percent Change
| |
For the Year | | | | | | | | | | | |
Net income | | $ | 127,807 | | | $ | 120,663 | | | 5.9 | % |
Operating earnings (1) | | | 134,591 | | | | 120,290 | | | 11.9 | |
Return on average assets(1) | | | 1.36 | % | | | 1.39 | % | | | |
Return on average common equity(1) | | | 18.61 | % | | | 19.05 | % | | | |
Per Common Share Data | | | | | | | | | | | |
Basic net income | | $ | 1.53 | | | $ | 1.46 | | | 4.8 | % |
Diluted net income | | | 1.52 | | | | 1.45 | | | 4.8 | |
Diluted operating earnings (1) | | | 1.60 | | | | 1.45 | | | 10.3 | |
Dividends | | | 0.77 | | | | 0.74 | | | 4.1 | |
Book value at year end | | | 9.54 | | | | 7.92 | | | 20.5 | |
At Year End | | | | | | | | | | | |
Assets | | $ | 11,013,943 | | | $ | 9,220,228 | | | 19.5 | % |
Loans | | | 7,885,521 | | | | 6,473,989 | | | 21.8 | |
Deposits | | | 7,615,420 | | | | 6,542,177 | | | 16.4 | |
Shareholders’ equity | | | 832,433 | | | | 648,444 | | | 28.4 | |
Average for the Year | | | | | | | | | | | |
Assets | | $ | 9,889,259 | | | $ | 8,669,603 | | | 14.1 | % |
Loans | | | 6,973,039 | | | | 6,186,602 | | | 12.7 | |
Deposits | | | 7,016,506 | | | | 6,142,966 | | | 14.2 | |
Shareholders’ equity | | | 723,242 | | | | 631,419 | | | 14.5 | |
Quarterly Financial Highlights
| | | First
| | Second
| | Third
| | Fourth
|
2002 | | | | | | | | | | | | |
Net interest income | | $ | 83,976 | | $ | 87,354 | | $ | 89,222 | | $ | 101,133 |
Provision for credit losses | | | 9,322 | | | 9,444 | | | 9,711 | | | 15,101 |
Net income | | | 31,713 | | | 29,124 | | | 33,032 | | | 33,938 |
Operating earnings(1) | | | 31,713 | | | 32,797 | | | 33,032 | | | 37,048 |
Basic net income per share | | | 0.38 | | | 0.35 | | | 0.40 | | | 0.39 |
Diluted net income per share | | | 0.38 | | | 0.35 | | | 0.40 | | | 0.39 |
Diluted operating earnings per share (1) | | | 0.38 | | | 0.39 | | | 0.40 | | | 0.42 |
2001 | | | | | | | | | | | | |
Net interest income | | $ | 76,777 | | $ | 79,745 | | $ | 83,043 | | $ | 86,032 |
Provision for credit losses | | | 6,656 | | | 8,568 | | | 9,122 | | | 10,289 |
Net income | | | 28,837 | | | 29,232 | | | 30,653 | | | 31,941 |
Operating earnings(1) | | | 28,425 | | | 29,232 | | | 30,653 | | | 31,980 |
Basic net income per share | | | 0.35 | | | 0.35 | | | 0.37 | | | 0.39 |
Diluted net income per share | | | 0.35 | | | 0.35 | | | 0.37 | | | 0.39 |
Diluted operating earnings per share(1) | | | 0.34 | | | 0.35 | | | 0.37 | | | 0.39 |
(1) For comparability purposes, certain ratios and financial data exclude non-operating gains and merger and restructuring expenses. After-tax non-operating items reduced net income $6.8 million in 2002 and increased net income $0.4 million in 2001.

Our targeted marketing initiatives and Sky Trek process are at the core of our organic growth. Throughout 2002, we initiated several sales and service campaigns designed to develop and expand client relationships and provide superior service. Using a needs analysis process, our employees are quickly able to identify the right product or service for each client.
One significant example of our relationship-building process was “Sky Financial Fitness 2002.” This initiative was the single most successful sales and service program in Sky’s history. We were able to increase our new money deposits and investment sales by $232 million, new consumer and home equity lines by $175 million, and add another $75 million in commercial loans in the final phase of the campaign. Our trust and commercial services units were also able to add over $3 million in fee income.
Our private banking area expanded in 2002 to enhance our service to individuals with a higher net worth as well as to professional corporations. This program is a unique, disciplined approach that is led by a regional manager who carefully matches a client’s needs with the financial service partners within the Sky organization. This enables us to offer the highest quality portfolio of professional services to these clients while providing us with an invaluable referral source.
Another key ingredient to organic growth is our strong community involvement in each region and our local board input to our business activities. Employees are actively encouraged to support local civic and charitable organizations as volunteers. In early 2002, Sky committed to providing $1.5 billion over the next three years toward loans, investments and donations back to the community. By the end of 2002, over $700 million was provided to our local communities as part of this commitment and we are proud to report that this puts us well ahead of our three-year schedule.
While these growth and community statistics are impressive, we believe this is only the beginning of our success in this arena. We’re positioned to generate further achievements as we continue to mine our data and deploy additional initiatives with even more precision in 2003.
Organizational Synergies
In order to support and deliver on our promises to clients and shareholders, we have developed a wide array of programs that enable us to provide a first-rate client experience while contributing positively to our bottom line. The driving force behind these initiatives is to increase efficiencies and improve effectiveness across the entire organization.

| | 
| | 
|
|
The vintage fire truck from Sky’s Mid Am Region was a great tool to support community events, parades and social gatherings. | | Federal Home Loan Bank President Charles Thiemann presents Tom Weissling, Regional President of Sky Bank, with grant money to use for the Welcome Home mortgage program. | | Sky’s three-year deposit growth was the result of targeted marketing, our Sky Trek sales and service process, and acquisitions. |
5

In 2002, we benefited from our first full year of focused sales support teams. This new structure enables our frontline sales personnel to concentrate their efforts on the financial needs of our diverse range of clients, backed by our high quality support teams.
At the retail and business banking level, our consolidated online banking and bill payment products recognize the growing segment of our client base that prefers to do their banking at home or in their office. We expect this delivery channel to evolve dynamically to support additional functions and provide even greater convenience.
The performance and information generated for our online banking product is directly linked to the most significant technology improvement in Sky’s history – the conversion in May 2002 of several different computer systems to one centralized system. Sky’s largest technology deployment to date, this new system is truly the core of all our information, from client loans and deposit accounts to our organizational ledgers, sales projections and profitability measures. The system and its linked technologies make information more accessible and manageable, and therefore more useful and valuable to our employees and clients.
Also introduced with the core system in 2002 was our Enterprise client sales and transaction system. This new browser-based technology will be fully deployed in all Sky financial centers in mid-2003. Using web-based software and hardware, Enterprise allows our client-contact employees to set up new accounts, order checks, process transactions and gather valuable marketing information. Our frontline employees have embraced this new technology and they understand its usefulness in serving the daily needs of the clients who enter one of our 230 financial centers.
Growth in Fee-Based Businesses
Sky is committed to expanding its targeted fee income businesses. In 2002, brokerage and insurance commissions grew over $12 million, or 49% from the prior year. This was attributable to solid core growth through our existing operations and the acquisitions of two insurance agencies in 2002 – Celaris Group in January and Value Added Benefits in April. Celaris was one of Ohio’s largest and most recognized insurance agencies and complements our existing insurance businesses of Picton Cavanaugh and Meyer & Eckenrode Insurance Group. Value Added Benefits specializes in the wholesale distribution of group and individual health insurance products.

| | 
| | 
|
Sky Bank’s Grandview financial center opened with some fanfare. One of its clients won a new car as a part of its grand opening sweepstakes. | | Sharon Speyer (right), Regional President, enjoys the festivities as she participates in the Juvenile Diabetes Research Foundation’s Walk To Cure Diabetes. | | Fannie Mae honored Sky in 2002 for its new products and marketing approaches to multi-cultural lending. |
7

9
In December 2002, we combined Celaris and Picton Cavanaugh to form Sky Insurance. This was the first step toward a more fully integrated insurance offering. Adopting the Sky Insurance brand enables us to present a unified message to our clients, allowing a natural migration from product to product. With Meyer & Eckenrode, the Sky Insurance group is one of the largest 45 insurance agencies in the United States.
In 2002, Sky Financial Solutions, our healthcare financing affiliate, completed the second full year in which it retained loans in its portfolio as opposed to selling them and realizing a profit immediately. While operating at a net loss for the full year, Sky Financial Solutions reported a net profit in the fourth quarter 2002. We expect Sky Financial Solutions to contribute positively to earnings for the full year 2003.
Asset Quality
Although Sky’s asset quality ratios at year-end 2002 reflect higher levels of non-performing loans, overall, our asset quality has remained strong through the challenging economy of the past two years. Our allowance for credit losses at year-end was 1.54% of total loans, providing coverage of 173% of non-performing loans. For 2002, the allowance was nearly three times the net loan losses to loans ratio of .55%. Asset quality remains a strategic priority for Sky, and with our strong credit management, we anticipate improvements in the future as the economy recovers.
Acquisitions
In addition to our outstanding organic growth for 2002, we experienced one of the most significant acquisition years in Sky’s history. This major component of our Strategic Vision positions us to capitalize on opportunities in markets where we see significant prospects for growth. Our strategy enables us to more efficiently acquire and integrate bank and non-bank assets, cultures and technologies, with little or no disruption of existing client services and business operations. Our acquisition strategy has allowed us to add locations, products and services that complement and strengthen our existing businesses.
Our seventh region, Pittsburgh, led by regional president Vince Locher, is a perfect example of how our regional concept is complemented by our acquisition strategy. The integration of Three Rivers Bank into Sky in October gives us a strong presence in Pittsburgh and the opportunity to expand our franchise in one of the top cities in the United States.
|

The Ottawa Main financial center was one of three new offices opened in Sky Bank’s financial services network in 2002.
| | 
Sky announced three acquisitions in 2002 that will help us achieve significant growth. | | 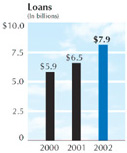
Total loans continued their upward trend in 2002 with a 22% increase over 2001’s year-end results. |
9

We are also excited about our pending acquisition of Metropolitan Bank & Trust in Cleveland, Ohio. As with Three Rivers Bank, Metropolitan has an important presence in a major contiguous market. Metropolitan will be our eighth region and will fit nicely into our regional financial services structure. This market includes the 24 Metropolitan offices and complements one existing Sky Bank office in Chagrin Falls and Sky’s Trust division, headquartered in Pepper Pike. Dick Hollington III, Corporate Director of Financial Services, has been appointed to lead this region when it becomes a part of Sky in the second quarter of 2003.
In addition to our geographic expansion, we continue to balance our product portfolio with financial services acquisitions. Celaris Group and Value Added Benefits were key additions in 2002.
We have been consistent and measurably successful in adding to and enhancing the Sky brand with these types of acquisitions. In 2002, we were able to add $1.0 billion in assets, 25 financial centers in the Pittsburgh area, and approximately 60,000 clients. With the integration of Metropolitan Bank & Trust in 2003, we will add 24 additional offices and $1.5 billion in assets.
A Clear Plan Of Action
While 2002 was one of the most significant years in our history, we will continue to implement enhanced technology and make process improvements that enable our high-quality people to better serve our clients. In 2003, our Strategic Vision will continue to serve as our roadmap for delivering profitable growth.
One activity targeted for 2003 is the redesign of our financial centers. While the redesign will not physically change the appearance of our offices, it will redefine employee roles and responsibilities to serve our clients more effectively. We have also analyzed data from each individual financial center market, identifying the opportunities and needs of that specific area. Doing business this way will enable us to better understand our clients’ needs based on the market, which will help our sales and service teams in each region improve their overall effectiveness.
Related to the pending change in our financial centers, we will be improving the way we deliver commercial loans, both large and small, to our business clients. In 2003, specialized lenders called Business Bankers will work with our financial centers to proactively deliver products and services to our small business clients. New centralized support areas will underwrite small business loans and also handle ongoing servicing needs. These modifications will enhance our business model for offering commercial products in the future and allow us to grow at an increased rate.

Sky Bank has been honored the past several years by the Small Business Administration (SBA) as a top lender of small business loans. | | 
The Toledo Junior Achievement Grand Prix is one of hundreds of Sky sponsored events throughout our regions and affiliates. | | 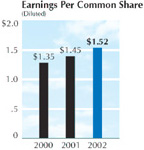
Sky’s three-year EPS growth can be attributed to solid progress in achieving the Sky Vision. |
11

In 2003, we will enhance our technology implementation, focusing on continued deployment of the Enterprise system along with expanding the capabilities of our central data warehouse and profitability systems. The warehouse provides our sales personnel with account histories and other key information to leverage our knowledge of each client, enabling us to strengthen relationships. This information is the foundation for targeted marketing initiatives that are complemented by sales and service campaigns and provides the tools for accurate tracking and measurement of these efforts. The profitability systems enable Sky to reward and recognize profit centers responsible for positive bottom line impact and provide a baseline for ongoing assessment.
Lastly, we anticipate another successful integration in 2003 with the addition of Metropolitan Bank & Trust. We have a proven integration model that was highly successful in 2002 with the addition of Three Rivers Bank. Experienced performance teams, comprised of leaders from Sky and Metropolitan, have been working on the Metropolitan integration since November 2002 with a goal of final conversion in the second quarter of 2003.
Stock Price and Corporate Governance
In 2002, our stock price remained relatively stable, while the stock market as a whole struggled. We are confident that our financial performance and the successful execution of our strategies, including acquisitions, will generate a superior long-term value and reward for Sky shareholders.
In response to the well-publicized failures in corporate governance of a few large U.S. corporations, Congress enacted the Sarbanes-Oxley Act of 2002 and the NASDAQ proposed rules relating to corporate governance for its members. Sky is proud to say that many of the new governance requirements will not impact the way we conduct business, as we have been observing these sound governance practices for years. A majority of our directors are deemed “independent” under the Act. Our Nominating, Audit and Compensation Committees are composed solely of “independent” directors. We regularly convene executive sessions of the Board of Directors without management present. Furthermore, the company has long utilized a Code of Ethics, which obligates every employee and director to subscribe to ethical business practices.
As Sky begins a new year, we take pride that we are one of the top performers in our industry, yet we look forward with much anticipation to what has yet to be accomplished. The year 2002 was another strong one for our company, and we forecast continued and exciting growth in 2003.

Marty E. Adams
Chairman, President and CEO
13
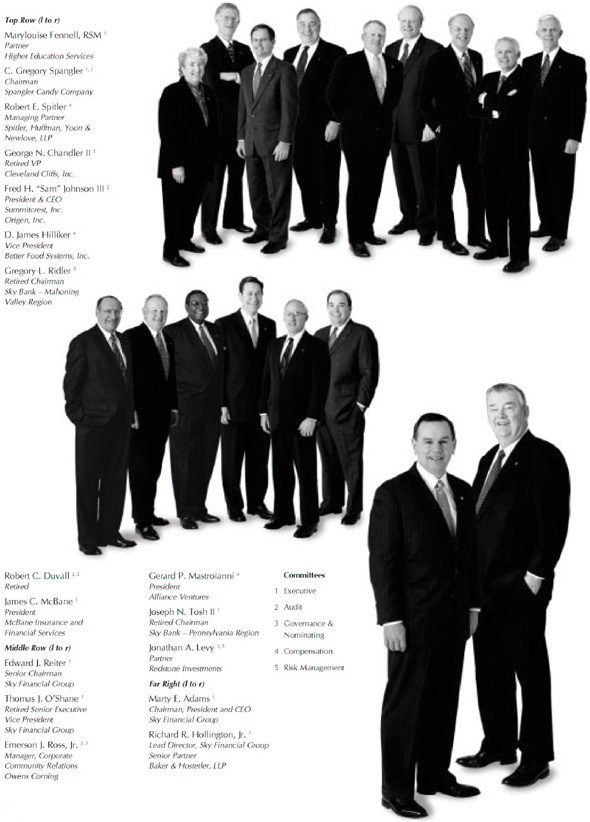
Sky Financial Group Board of Directors
14
Summary of Financial Data
(Dollars in thousands, except per share data)
December 31,
| | 2002
| | | 2001
| | | 2000
| | | 1999
| | | 1998
| |
Consolidated Statements of Income | | | | | | | | | | | | | | | | | | | | |
Interest income | | $ | 625,906 | | | $ | 642,376 | | | $ | 626,015 | | | $ | 573,595 | | | $ | 575,695 | |
Interest expense | | | 264,221 | | | | 316,779 | | | | 322,219 | | | | 269,950 | | | | 285,912 | |
| | |
|
|
| |
|
|
| |
|
|
| |
|
|
| |
|
|
|
Net interest income | | | 361,685 | | | | 325,597 | | | | 303,796 | | | | 303,645 | | | | 289,783 | |
Provision for credit losses | | | 43,577 | | | | 34,635 | | | | 22,250 | | | | 20,712 | | | | 31,992 | |
| | |
|
|
| |
|
|
| |
|
|
| |
|
|
| |
|
|
|
Net interest income after provision for credit losses | | | 318,108 | | | | 290,962 | | | | 281,546 | | | | 282,933 | | | | 257,791 | |
Non-interest income | | | 149,881 | | | | 126,240 | | | | 121,958 | | | | 124,342 | | | | 124,550 | |
Non-interest expenses | | | 276,814 | | | | 237,220 | | | | 235,407 | | | | 302,497 | | | | 306,567 | |
| | |
|
|
| |
|
|
| |
|
|
| |
|
|
| |
|
|
|
Income before income taxes | | | 191,175 | | | | 179,982 | | | | 168,097 | | | | 104,778 | | | | 75,774 | |
Income taxes | | | 63,368 | | | | 59,319 | | | | 53,724 | | | | 33,596 | | | | 23,811 | |
| | |
|
|
| |
|
|
| |
|
|
| |
|
|
| |
|
|
|
Net income(1) | | $ | 127,807 | | | $ | 120,663 | | | $ | 114,373 | | | $ | 71,182 | | | $ | 51,963 | |
| | |
|
|
| |
|
|
| |
|
|
| |
|
|
| |
|
|
|
Per Common Share(2) | | | | | | | | | | | | | | | | | | | | |
Basic net income(1) | | $ | 1.53 | | | $ | 1.46 | | | $ | 1.35 | | | $ | 0.83 | | | $ | 0.61 | |
Diluted net income(1) | | | 1.52 | | | | 1.45 | | | | 1.35 | | | | 0.82 | | | | 0.60 | |
Cash dividends declared | | | 0.77 | | | | 0.74 | | | | 0.72 | | | | 0.70 | | | | 0.54 | |
Book value at year-end | | | 9.54 | | | | 7.92 | | | | 7.31 | | | | 6.61 | | | | 7.13 | |
Weighted average shares outstanding – basic | | | 83,439,000 | | | | 82,449,000 | | | | 84,604,000 | | | | 85,938,000 | | | | 85,759,000 | |
Weighted average shares outstanding – diluted | | | 84,096,000 | | | | 83,028,000 | | | | 84,967,000 | | | | 86,774,000 | | | | 86,897,000 | |
Consolidated Balance Sheets (Year-End) | | | | | | | | | | | | | | | | | | | | |
Total assets | | $ | 11,013,943 | | | $ | 9,220,228 | | | $ | 8,386,802 | | | $ | 8,063,756 | | | $ | 8,033,266 | |
Securities available for sale | | | 2,247,181 | | | | 1,996,843 | | | | 1,846,517 | | | | 1,868,839 | | | | 2,126,833 | |
Securities held to maturity | | | — | | | | — | | | | — | | | | — | | | | 23,910 | |
Loans held for sale | | | 69,333 | | | | 85,474 | | | | 13,984 | | | | 9,006 | | | | 96,221 | |
Loans | | | 7,885,521 | | | | 6,473,989 | | | | 5,916,098 | | | | 5,477,494 | | | | 5,110,827 | |
Allowance for credit losses | | | 121,372 | | | | 103,523 | | | | 93,261 | | | | 86,750 | | | | 80,748 | |
Deposits | | | 7,615,420 | | | | 6,542,177 | | | | 5,891,932 | | | | 5,758,691 | | | | 6,006,912 | |
Debt and FHLB advances | | | 1,600,750 | | | | 1,204,145 | | | | 1,042,044 | | | | 964,557 | | | | 665,906 | |
Total shareholders’ equity | | | 832,433 | | | | 648,444 | | | | 609,690 | | | | 566,331 | | | | 611,713 | |
Selected Financial Ratios | | | | | | | | | | | | | | | | | | | | |
Return on average assets(1) | | | 1.29 | % | | | 1.39 | % | | | 1.41 | % | | | 0.91 | % | | | 0.68 | % |
Return on average shareholders’ equity(1) | | | 17.67 | | | | 19.11 | | | | 19.78 | | | | 11.60 | | | | 8.14 | |
Dividend payout ratio | | | 50.43 | | | | 50.61 | | | | 53.66 | | | | 78.98 | | | | 86.95 | |
Net interest margin, fully-taxable equivalent | | | 3.93 | | | | 4.04 | | | | 4.12 | | | | 4.28 | | | | 4.16 | |
Average loans to average deposits | | | 99.38 | | | | 100.71 | | | | 98.06 | | | | 90.58 | | | | 85.99 | |
Average equity to average assets | | | 7.31 | | | | 7.28 | | | | 7.15 | | | | 7.83 | | | | 8.33 | |
Allowance for credit losses to period-end loans | | | 1.54 | | | | 1.60 | | | | 1.58 | | | | 1.58 | | | | 1.58 | |
Allowance for credit losses to total non-performing loans | | | 173.25 | | | | 303.55 | | | | 434.58 | | | | 445.10 | | | | 517.75 | |
Non-performing loans to period-end loans | | | 0.89 | | | | 0.53 | | | | 0.36 | | | | 0.36 | | | | 0.31 | |
Net charge-offs to average loans | | | 0.47 | | | | 0.39 | | | | 0.28 | | | | 0.28 | | | | 0.36 | |
(1) The net income presented above is in accordance with accounting principles generally accepted in the United States (U.S. GAAP) and includes items of income and expense not defined by management as part of operating earnings (hereinafter referred to as “non-operating.”) Further discussion of these non-operating items and operating earnings can be found in the “Results of Operations” section of Management’s Discussion and Analysis of Financial Condition and Results of Operations.
(2) Per share data has been restated to reflect the ten percent stock dividend declared and paid in 2000, 1999 and 1998 and the two-for-one stock split declared on May 12, 1998 and acquisitions accounted for as poolings-of-interests. (see Note 2 of the Financial Statements).
15
Management’s Discussion and Analysis of Financial Condition and Results of Operations
(Dollars in thousands, except per share data)
The following discussion and analysis represents a review of Sky Financial’s consolidated financial condition and results of operations. This review should be read in conjunction with the consolidated financial statements presented elsewhere in this report. Financial data for all periods has been restated to reflect mergers accounted for as pooling-of-interests and stock dividends in prior periods. For further discussion of mergers and acquisitions, see Note 2 of the consolidated financial statements.
Summary of Earnings and Non-operating Items
Net income for 2002 was $127,807 or $1.52 per diluted share, up from $120,663 or $1.45 per diluted share in 2001 and $114,373 or $1.35 per diluted share in 2000. Net income included after-tax non-operating items, which decreased net income $6,784 or $0.08 per diluted share in 2002, increased net income $373 or less than $0.01 per diluted share in 2001, and reduced net income $3,703 or $0.04 per diluted share in 2000.
In addition to reporting net income in accordance with generally accepted accounting principles (“GAAP”), Sky Financial has, since its merger of equals in 1998, also reported operating earnings. Operating earnings are net income adjusted to exclude the results of certain significant transactions or events not representative of ongoing operations (“non-operating items”). The following table reconciles GAAP income to operating earnings.
Table 1Operating Income Reconciliation
Year ended December 31,
| | 2002
| | 2001
| | | 2000
|
Net income | | | $127,807 | | $ | 120,663 | | | | $114,373 |
Non-operating items | | | 6,784 | | | (373 | ) | | | 3,703 |
| | |
|
| |
|
|
| |
|
|
Operating earnings | | $ | 134,591 | | $ | 120,290 | | | $ | 118,076 |
| | |
|
| |
|
|
| |
|
|
For 2002, Sky Financial’s after-tax non-operating items included $3,674 of restructuring expenses resulting from the implementation of a new technology platform in the second quarter and $3,110 resulting from the completed acquisition of Three Rivers Bancorp in the fourth quarter.
For 2001, Sky Financial’s after-tax non-operating items included $892 related to gains on the termination of a merger-related pension plan and the sale of Sky Investments, partially offset by $519 of restructuring expenses relating to the acquisition of ten branch offices representing approximately $289 million in deposits.
For 2000, Sky Financial’s after-tax non-operating items included $2,596 for net losses on the sales of securities, resulting from a restructuring of the securities portfolio in the third quarter, and $2,514 of restructuring expenses, including costs to complete the name changes of its commercial banks and a loss on the sale of its collection agency, partially offset by $1,407 in gains on the termination of merger-related pension plans and the sale of credit card receivables.
Results of Operations
Operating earnings, which exclude the affect of non-operating items, were $134,591 or $1.60 per diluted share in 2002 compared to $120,290 or $1.45 per diluted share in 2001, and $118,076 or $1.39 per diluted share in 2000. On this same basis, return on average equity was 18.61% and return on average assets was 1.36% in 2002 compared to 19.05% and 1.39%, respectively, in 2001 and 20.42% and 1.46%, respectively, in 2000.
The improved operating earnings over the last two years has resulted primarily from Sky Financial’s success in growing revenues, both organically and through acquisitions, while maintaining consistent expense controls and overcoming the impact of higher credit costs from a weak economy in 2002 and 2001.
In 2002, Sky Financial’s operating earnings increase over the prior year reflects growth in total revenues, net interest income and non-interest income, of $61,220, or 13.6%, while operating expenses grew $25,132, or 12.7%, and the provision for credit losses increased $8,942.
The 2001 operating earnings increase resulted from growth in total revenues of $23,201 or 5.4%, while operating expenses rose $4,881 or 2.1% and the provision for credit losses increased $12,385.
Business Line Results
Sky Financial is managed along three primary business lines: community banking, financial service affiliates and Sky Financial Solutions (SFS). The community banking group is comprised of Sky Financial’s commercial bank, Sky Bank, which services businesses and consumers through a regional structure. In October 2002, Sky Financial completed the acquisition of Three Rivers Bancorp. Substantially all of the assets of Three Rivers became part of the community banking segment. In October 2001, Sky acquired 10 branches and $289 million in deposits, which were all added to the community banking business.
The financial service affiliates include Sky Financial’s current businesses relating to trust and investment management, insurance agency operations and other financial related services. During 2002, Sky Financial acquired two insurance agencies, Celaris Group, Inc. and Value Added Benefits, Ltd. Historically, the financial services segment also includes non-conforming mortgage lending (which discontinued loan originations in December 2000), broker/dealer operations (which was sold in March 2001), and collection activities (which was sold in December 2000).
SFS is Sky Financial’s subsidiary specializing in financing to health care professionals, primarily dentists. In the third quarter 2000, SFS began retaining its loan originations, which in prior periods had been sold into the secondary market. Since the redesign, SFS no longer recognizes gain on sale revenues and has operated at a net loss until reporting net income of $199 for the fourth quarter 2002. SFS is expected to continue operating profitably over the next year with growth in net interest income exceeding increases in operating expenses and provisions for credit losses.
Additional information regarding Sky Financial’s business lines, and the financial measurement methodologies is provided in Note 22 of the consolidated financial statements. Prior year amounts have been restated to conform to the current business line structure. Table 2 summarizes Sky Financial’s business line results for each of the last three years.
Table 2Business Line Results
| | | Net Income (Loss)
| |
Year ended December 31,
| | 2002
| | | 2001
| | | 2000
| |
Community Banking | | $ | 132,176 | | | $ | 130,136 | | | $ | 126,613 | |
Financial Service Affiliates | | | 4,883 | | | | 3,014 | | | | 2,656 | |
Sky Financial Solutions | | | (4,341 | ) | | | (7,989 | ) | | | (6,248 | ) |
Parent and Other | | | (4,911 | ) | | | (4,498 | ) | | | (8,648 | ) |
| | |
|
|
| |
|
|
| |
|
|
|
Consolidated | | $ | 127,807 | | | $ | 120,663 | | | $ | 114,373 | |
| | |
|
|
| |
|
|
| |
|
|
|
16
Community banking net income in 2002 reflects the benefit of the Three Rivers acquisition in addition to higher revenues from solid organic growth in loans and deposits and record mortgage banking levels. Operating expenses also increased to support the higher revenues, and provisions for credit losses continued to reflect higher credit losses from a slow economy.
In 2001, community banking net income rose primarily due to increased net interest income, generated by strong growth in loans and deposits, and non-interest income, mainly from significant increases in mortgage banking and service charge revenues. The growth in revenues exceeded the rise in operating expenses to support revenue growth and provisions for credit losses, which increased due to higher credit losses from a weak economy in 2001.
The community banking results for 2002 reflect a return on equity of 19.12%, a return on assets of 1.43% and an efficiency ratio of 46.43% versus 21.67%, 1.57% and 44.73%, respectively, in 2001.
The financial service affiliates have improved earnings in each of the last two years reflecting Sky Financial’s focused efforts on expanding its profitable trust and insurance agency businesses, and reducing the impact of its under-performing companies.
SFS, in the year 2000, implemented a new program to retain its loan originations in its loan portfolio, which eliminated the gains on the sales of these loan originations. The decline in 2001 earnings at SFS resulted from the full-year effect of the implementation change. In 2002, SFS again operated at a net loss, although the loss was reduced from the prior year due to an increase in net interest income generated by a larger loan portfolio. In the fourth quarter 2002, SFS reported net income of $199 and SFS is expected to operate at a profit for the next year.
Parent and other includes the net funding costs of the parent company and all significant non-operating items of income and expense. In 2002, an increase in non-operating charges more than offset the benefit of lower interest rates, reducing the net funding cost of the parent. In 2001, the net loss reduced from the prior year due to higher non-operating charges in 2000.
Net Interest Income
Net interest income, the difference between interest income earned on interest-earning assets and interest expense incurred on interest-bearing liabilities, is the most significant component of Sky Financial’s earnings. Net interest income is affected by changes in the volumes, rates and composition of interest-earning assets and interest-bearing liabilities.
Table 3 summarizes net interest income and net interest margin for each of the three years ended December 31, 2002.
Table 3Net Interest Income
Year ended December 31,
| | 2002
| | | 2001
| | | 2000
| |
Net interest income | | $ | 361,685 | | | $ | 325,597 | | | $ | 303,796 | |
Taxable equivalent adjustments to net interest income | | | 3,166 | | | | 3,539 | | | | 6,730 | |
| | |
|
|
| |
|
|
| |
|
|
|
Net interest income, fully taxable equivalent | | $ | 364,851 | | | $ | 329,136 | | | $ | 310,526 | |
| | |
|
|
| |
|
|
| |
|
|
|
Net interest margin | | | 3.90 | % | | | 4.00 | % | | | 4.03 | % |
Taxable equivalent adjustment | | | .03 | | | | .04 | | | | .09 | |
| | |
|
|
| |
|
|
| |
|
|
|
Net interest margin, fully taxable equivalent | | | 3.93 | % | | | 4.04 | % | | | 4.12 | % |
| | |
|
|
| |
|
|
| |
|
|
|
Sky Financial’s net interest income was $361,685 in 2002, increased from $325,597 in 2001. In 2002, average-earning assets grew 14%, after growing 8.1% in 2001. In 2002, net interest income increased due to strong organic growth in earning assets as well as the additional growth from the Three Rivers acquisition on October 1, notwithstanding a lower net interest margin. In 2001, net interest income increased due to growth in earning assets despite a lower net interest margin due to a reduced interest rate environment. The net interest margin, on a fully tax-equivalent basis, was 3.93% for 2002, compared with 4.04% and 4.12% in the preceding two years. In the decreasing rate environment of 2002, the net interest margin did remain relatively stable during the year with a slight improvement in the fourth quarter. In 2001, the net interest margin declined, impacted by the fourth quarter acquisition of $289 million in deposits.
Table 4 reflects the components of Sky Financial’s net interest income for each of the three years ended December 31, 2002, setting forth: (i) average assets, liabilities, and shareholders’ equity, (ii) interest income earned on interest-earning assets and interest expense incurred on interest-bearing liabilities, (iii) average yields earned on interest-earning assets and average rates incurred on interest-bearing liabilities, (iv) the net interest rate spread (i.e., the average yield earned on interest-earning assets less the average rate incurred on interest-bearing liabilities), and (v) the net interest margin (i.e., net interest income divided by average interest-earning assets). Rates are computed on a tax-equivalent basis. Non-accrual loans have been included in the average loan balances.
17
Management’s Discussion and Analysis of Financial Condition and Results of Operations
(Dollars in thousands, except per share data)
Table 4Three-Year Average Balance Sheet and Net Interest Margin
Year ended December 31,
| | 2002
| | | 2001
| | | 2000
| |
| | | Average Balance
| | Interest
| | Rate
| | | Average Balance
| | Interest
| | Rate
| | | Average Balance
| | Interest
| | Rate
| |
Interest-earning assets | | | | | | | | | | | | | | | | | | | | | | | | | | | |
Interest-earning deposits | | $ | 42,588 | | $ | 652 | | 1.53 | % | | $ | 21,093 | | $ | 1,039 | | 4.93 | % | | $ | 17,074 | | $ | 1,015 | | 5.94 | % |
Federal funds sold and other | | | 11,180 | | | 166 | | 1.48 | | | | 18,280 | | | 836 | | 4.57 | | | | 6,022 | | | 363 | | 6.03 | |
Securities | | | 2,197,795 | | | 119,675 | | 5.45 | | | | 1,869,200 | | | 118,242 | | 6.33 | | | | 1,835,888 | | | 123,641 | | 6.73 | |
Loans and loans held for sale | | | 7,022,576 | | | 508,579 | | 7.24 | | | | 6,228,708 | | | 525,798 | | 8.44 | | | | 5,669,637 | | | 507,726 | | 8.96 | |
| | |
|
| |
|
| |
|
| |
|
| |
|
| |
|
| |
|
| |
|
| |
|
|
Total interest-earning assets | | | 9,274,139 | | | 629,072 | | 6.78 | | | | 8,137,281 | | | 645,915 | | 7.94 | | | | 7,528,621 | | | 632,745 | | 8.41 | |
| | |
|
| |
|
| |
|
| |
|
| |
|
| |
|
| |
|
| |
|
| |
|
|
Non-earning assets | | | 615,120 | | | | | | | | | 532,322 | | | | | | | | | 562,126 | | | | | | |
| | |
|
| | | | | | | |
|
| | | | | | | |
|
| | | | | | |
Total assets | | $ | 9,889,259 | | | | | | | | $ | 8,669,603 | | | | | | | | $ | 8,090,747 | | | | | | |
| | |
|
| | | | | | | |
|
| | | | | | | |
|
| | | | | | |
Interest-bearing liabilities | | | | | | | | | | | | | | | | | | | | | | | | | | | |
Demand deposits | | $ | 107,325 | | $ | 2,003 | | 1.87 | | | $ | 140,541 | | $ | 2,669 | | 1.90 | % | | $ | 141,744 | | $ | 3,372 | | 2.38 | % |
Savings deposits | | | 2,660,130 | | | 34,554 | | 1.30 | | | | 1,944,521 | | | 38,987 | | 2.00 | | | | 1,844,659 | | | 47,168 | | 2.56 | |
Time deposits | | | 3,384,936 | | | 139,708 | | 4.13 | | | | 3,308,884 | | | 179,022 | | 5.41 | | | | 3,045,522 | | | 171,671 | | 5.64 | |
| | |
|
| |
|
| |
|
| |
|
| |
|
| |
|
| |
|
| |
|
| |
|
|
Total interest-bearing deposits | | | 6,152,391 | | | 176,265 | | 2.86 | | | | 5,393,946 | | | 220,678 | | 4.09 | | | | 5,031,925 | | | 222,211 | | 4.42 | |
Short-term borrowings | | | 732,230 | | | 19,438 | | 2.65 | | | | 695,527 | | | 27,633 | | 3.97 | | | | 667,301 | | | 35,977 | | 5.39 | |
Trust preferred securities | | | 110,687 | | | 7,750 | | 7.00 | | | | 108,600 | | | 10,486 | | 9.66 | | | | 93,946 | | | 9,121 | | 9.71 | |
Asset-backed notes | | | 374,517 | | | 23,996 | | 6.41 | | | | 126,522 | | | 8,411 | | 6.65 | | | | — | | | — | | — | |
Debt and FHLB advances | | | 813,592 | | | 36,772 | | 4.52 | | | | 842,060 | | | 49,571 | | 5.89 | | | | 868,977 | | | 54,910 | | 6.32 | |
| | |
|
| |
|
| |
|
| |
|
| |
|
| |
|
| |
|
| |
|
| |
|
|
Total interest- bearing liabilities | | | 8,183,417 | | | 264,221 | | 3.23 | | | | 7,166,655 | | | 316,779 | | 4.42 | | | | 6,662,149 | | | 322,219 | | 4.84 | |
| | |
|
| |
|
| |
|
| |
|
| |
|
| |
|
| |
|
| |
|
| |
|
|
Non-interest- bearing liabilities | | | 982,600 | | | | | | | | | 871,529 | | | | | | | | | 850,291 | | | | | | |
Shareholders’ equity | | | 723,242 | | | | | | | | | 631,419 | | | | | | | | | 578,307 | | | | | | |
| | |
|
| | | | | | | |
|
| | | | | | | |
|
| | | | | | |
Total liabilities and equity | | $ | 9,889,259 | | | | | | | | $ | 8,669,603 | | | | | | | | $ | 8,090,747 | | | | | | |
| | |
|
| | | | | | | |
|
| | | | | | | |
|
| | | | | | |
Net interest income, fully taxable equivalent; Net interest spread | | | | | $ | 364,851 | | 3.55 | % | | | | | $ | 329,136 | | 3.52 | % | | | | | $ | 310,526 | | 3.57 | % |
| | | | | |
|
| |
|
| | | | |
|
| |
|
| | | | |
|
| |
|
|
Net interest income, fully taxable equivalent; to earning assets | | | | | | | | 3.93 | % | | | | | | | | 4.04 | % | | | | | | | | 4.12 | % |
| | | | | | | | |
|
| | | | | | | |
|
| | | | | | | |
|
|
- Loan fees are included in interest income.
18
Net interest income may also be analyzed by segregating the volume and rate components of interest income and interest expense. Table 5 presents an analysis of increases and decreases in interest income and expense in terms of changes in volume and interest rates during the three years ended December 31, 2002. Changes not due solely to either a change in volume or a change in rate have been allocated proportionally to both changes due to volume and rate. The table is presented on a tax-equivalent basis.
Table 5Net Interest Income – Rate/Volume Analysis
Year ended December 31,
| | 2002
| | | 2001
| |
| | | Change from 2001 in interest
income or expense due to
| | | Change from 2000 in interest
income or expense due to
| |
| | | Volume
| | | Rate
| | | Total
| | | Volume
| | | Rate
| | | Total
| |
Interest income attributable to: | | | | | | | | | | | | | | | | | | | | | | | | |
Interest-bearing deposits | | $ | 1,061 | | | $ | (1,448 | ) | | $ | (387 | ) | | $ | 239 | | | $ | (215 | ) | | $ | 24 | |
Federal funds sold | | | (325 | ) | | | (345 | ) | | | (670 | ) | | | 739 | | | | (266 | ) | | | 473 | |
Securities | | | 20,840 | | | | (19,407 | ) | | | 1,433 | | | | 2,243 | | | | (7,642 | ) | | | (5,399 | ) |
Loans, net | | | 66,961 | | | | (84,180 | ) | | | (17,219 | ) | | | 50,066 | | | | (31,994 | ) | | | 18,072 | |
| | |
|
|
| |
|
|
| |
|
|
| |
|
|
| |
|
|
| |
|
|
|
Total interest income | | | 88,537 | | | | (105,380 | ) | | | (16,843 | ) | | | 53,287 | | | | (40,117 | ) | | | 13,170 | |
| | |
|
|
| |
|
|
| |
|
|
| |
|
|
| |
|
|
| |
|
|
|
Interest expense attributable to: | | | | | | | | | | | | | | | | | | | | | | | | |
Deposits: | | | | | | | | | | | | | | | | | | | | | | | | |
Interest-bearing demand | | | (631 | ) | | | (35 | ) | | | (666 | ) | | | (29 | ) | | | (674 | ) | | | (703 | ) |
Savings | | | 14,271 | | | | (18,704 | ) | | | (4,433 | ) | | | 2,553 | | | | (10,734 | ) | | | (8,181 | ) |
Time | | | 4,114 | | | | (43,428 | ) | | | (39,314 | ) | | | 14,845 | | | | (7,494 | ) | | | 7,351 | |
| | |
|
|
| |
|
|
| |
|
|
| |
|
|
| |
|
|
| |
|
|
|
Total deposits | | | 17,754 | | | | (62,167 | ) | | | (44,413 | ) | | | 17,369 | | | | (18,902 | ) | | | (1,533 | ) |
Short-term borrowings | | | 1,455 | | | | (9,650 | ) | | | (8,195 | ) | | | 1,522 | | | | (9,866 | ) | | | (8,344 | ) |
Trust preferred securities | | | 202 | | | | (2,938 | ) | | | (2,736 | ) | | | 1,423 | | | | (58 | ) | | | 1,365 | |
Asset-backed notes | | | 16,494 | | | | (909 | ) | | | 15,585 | | | | 8,411 | | | | — | | | | 8,411 | |
Debt and FHLB advances | | | (1,682 | ) | | | (11,117 | ) | | | (12,799 | ) | | | (1,701 | ) | | | (3,638 | ) | | | (5,339 | ) |
| | |
|
|
| |
|
|
| |
|
|
| |
|
|
| |
|
|
| |
|
|
|
Total interest expense | | | 34,223 | | | | (86,781 | ) | | | (52,558 | ) | | | 27,024 | | | | (32,464 | ) | | | (5,440 | ) |
| | |
|
|
| |
|
|
| |
|
|
| |
|
|
| |
|
|
| |
|
|
|
Net interest income | | $ | 54,314 | | | $ | (18,599 | ) | | $ | 35,715 | | | $ | 26,263 | | | $ | (7,653 | ) | | $ | 18,610 | |
| | |
|
|
| |
|
|
| |
|
|
| |
|
|
| |
|
|
| |
|
|
|
Non-Interest Income
Total non-interest income in 2002 increased $23,641 from 2001, which was $4,282 higher than 2000. The increase in 2002 was primarily from growth in brokerage and insurance commissions due to growth in sales and the acquisition of two agencies during 2002 (see Note 2) and from growth of $4,733 in mortgage banking revenues due to higher origination volumes generated in the lower rate environment. The growth in non-interest revenues was also positively impacted by the completed acquisition of Three Rivers Bancorp on October 1, 2002. The increase in 2001 was primarily from growth in mortgage banking revenues due to higher origination volumes generated in the lower rate environment, more than offsetting declines in revenues from businesses sold or redesigned during 2000. Table 6 summarizes the sources of Sky Financial’s non-interest income.
Table 6Non-Interest Income
Year ended December 31,
| | 2002
| | 2001
| | 2000
| | | 2002 Vs. 2001
| | | 2001 Vs. 2000
| |
Trust services income | | $ | 13,479 | | $ | 14,398 | | $ | 15,147 | | | (6 | )% | | (5 | )% |
Service charges and fees on deposit accounts | | | 34,499 | | | 31,416 | | | 27,003 | | | 10 | | | 16 | |
Mortgage banking income | | | 28,626 | | | 23,893 | | | 12,204 | | | 20 | | | 96 | |
Brokerage and insurance commissions | | | 36,807 | | | 24,598 | | | 29,177 | | | 50 | | | (16 | ) |
Net securities gains (losses) | | | 2,479 | | | 2,475 | | | (3,023 | ) | | — | | | 182 | |
Net gains on sales of commercial financing loans | | | — | | | — | | | 7,586 | | | — | | | (100 | ) |
Transaction fees | | | 7,666 | | | 7,139 | | | 6,650 | | | 7 | | | 7 | |
Merchant income | | | 3,559 | | | 3,351 | | | 3,378 | | | 6 | | | (1 | ) |
International department fees | | | 1,544 | | | 1,766 | | | 1,248 | | | (13 | ) | | 42 | |
Gain on sales of credit card accounts and other loans | | | — | | | — | | | 1,681 | | | — | | | (100 | ) |
Income from bank-owned life insurance | | | 5,817 | | | 5,435 | | | 5,323 | | | 7 | | | 2 | |
Other | | | 15,405 | | | 11,769 | | | 15,584 | | | 31 | | | (24 | ) |
| | |
|
| |
|
| |
|
|
| |
|
| |
|
|
Total non-interest income | | $ | 149,881 | | $ | 126,240 | | $ | 121,958 | | | 19 | % | | 4 | % |
| | |
|
| |
|
| |
|
|
| |
|
| |
|
|
19
Management’s Discussion and Analysis of Financial Condition and Results of Operations
(Dollars in thousands, except per share data)
Brokerage commissions on investment and insurance products increased $12,209 or 50% in 2002 and decreased $4,579 or 16% in 2001. The 2002 revenue increase was from the acquisition of two insurance agencies, Celaris Group, Inc. in January of 2002, and Value Added Benefits, LTD. in April of 2002 and from increased sales volumes through Sky Financial’s bank sales representatives. The addition of the new agencies increased revenues $12,625 during 2002. The remaining change was due to revenue growth from existing agencies offset by lower revenues due to Sky’s sale of its independent broker/dealer in 2001. The revenue decrease in 2001 was due to the sale of the independent broker/dealer, which contributed revenues of $2,838 in 2001 compared with $17,637 in 2000. Insurance revenues in 2001 increased to $18,585 in 2001 compared with $10,615 in 2000, mainly due to the full-year benefit from Meyer & Eckenrode acquired in July 2000.
Mortgage banking consists of net gains on the sales of mortgage loans and mortgage loan servicing fees. Mortgage banking income increased $4,733 in 2002 after increasing $11,689 in 2001. The increase over the last year was primarily due to a continued favorable interest rate environment, which increased volumes of mortgages originated and sold. Total volume of loans sold in 2002 increased 18.2% over 2001 after increasing 253% over 2000. In December 2000, Sky Financial discontinued the origination of loans through its non-conforming mortgage subsidiary, which in 2000 realized $1.2 million in gains on the sales of its loan originations.
Service charges and fees on deposits increased $3,083 in 2002 and $4,413 in 2001. The increase in 2002 continues to reflect the benefits from growth in deposit accounts, both organic and through acquisition, and fee structure modifications company wide.
Trust services income, which continued to be impacted by changes in the equity markets, decreased $919 or 6% in 2002, after decreasing $749 or 5%, in 2001. New business volume revenues continue to increase but were more than offset by market-driven revenue changes and lower estate fee income.
For the year 2002, Sky Financial realized net gains on the sales of securities of $2,479 compared with net gains of $2,475 in 2001. In 2000, Sky Financial realized net losses on the sales of securities of $3,023, resulting from the restructuring of the securities portfolio during the third quarter in which net losses of $3,993 were realized.
In 2001 and 2002, Sky Financial’s results reflect no gains on the sales of commercial financing loans. In mid-year 2000, Sky Financial ceased selling these loan originations into the secondary market and began retaining them in its loan portfolio, thereby eliminating gains on the sales.
In 2002, other income did not include any non-operating gains. Other income in 2001 included non-operating gains of $855 from the termination of a merger related pension plan and $632 from the sale of Sky Financial’s independent broker/dealer. In 2000, other income included non-operating gains of $1,873 from the termination of acquired pension plans and $727 from the sale of $5 million of credit card receivables.
Non-Interest Expense
Total non-interest expense increased $39,594 or 17% in 2002 compared with an increase of $1,813 or 1% in 2001. On an operating basis, excluding merger, integration and restructuring expenses, total non-interest expense rose $29,956 or 12.6% in 2002 and $4,881 or 2.1% in 2001. In 2002, acquisitions contributed to the rise in expenses. In addition to Three Rivers Bancorp acquired October 1, 2002, growth included Celaris Group and Value Added Benefits acquired in January and April 2002, respectively, and a full year of operating cost for branches and deposits acquired in October 2001. The efficiency ratio, which measures operating expenses as a percent of total operating revenues, was 51.75% in 2002, 52.09% in 2001 and 53.37% in 2000.
Non-interest expense includes costs, other than interest, that are incurred in the operations of Sky Financial. Table 7 summarizes the components of Sky Financial’s non-interest expense.
Table 7Non-Interest Expense
Year ended December 31,
| | 2002
| | 2001
| | 2000
| | 2002 Vs. 2001
| | | 2001 Vs. 2000
| |
Salaries and employee benefits | | $ | 151,692 | | $ | 125,410 | | $ | 117,957 | | 21 | % | | 6 | % |
Occupancy and equipment expense | | | 40,177 | | | 36,017 | | | 37,004 | | 12 | | | (3 | ) |
Merger, integration and restructuring expense | | | 10,437 | | | 799 | | | 3,867 | | 1,206 | | | (79 | ) |
Brokerage commissions | | | 208 | | | 2,107 | | | 11,973 | | (90 | ) | | (82 | ) |
State franchise taxes | | | 3,411 | | | 7,067 | | | 7,097 | | (52 | ) | | — | |
Printing and supplies | | | 5,020 | | | 5,004 | | | 5,149 | | — | | | (3 | ) |
Legal and other professional fees | | | 7,855 | | | 8,127 | | | 6,747 | | (3 | ) | | 20 | |
Telephone | | | 6,278 | | | 5,648 | | | 5,939 | | 11 | | | (5 | ) |
Loan costs | | | 5,743 | | | 4,390 | | | 3,761 | | 31 | | | 17 | |
Marketing | | | 7,755 | | | 7,155 | | | 6,825 | | 8 | | | 5 | |
Amortization of intangible assets | | | 4,033 | | | 4,897 | | | 4,831 | | (18 | ) | | 1 | |
Other | | | 34,205 | | | 30,599 | | | 24,257 | | 12 | | | 26 | |
| | |
|
| |
|
| |
|
| |
|
| |
|
|
Total non-interest expense | | $ | 276,814 | | $ | 237,220 | | $ | 235,407 | | 17 | % | | 1 | % |
| | |
|
| |
|
| |
|
| |
|
| |
|
|
Salaries and employee benefits increased $26,282 or 21% in 2002 and $7,453 or 6%, in 2001. The increase in 2002 was primarily due to acquisitions and an increase in performance-based compensation. The increase in 2001 was primarily due to higher performance-based compensation.
Brokerage commissions expense declined $1,899 or 90%, after declining $9,866 or 82% in 2001. The declines in 2002 and 2001 were due to the sale by Sky Financial of its independent broker/dealer in 2001.
20
Loans costs increased $1,543 or 49% in 2002 and $663 or 27% in 2001. The increase was primarily due to costs associated with higher loan volumes and higher loan collection activities.
Franchise taxes declined $3,656 in 2002 and $30 in 2001. The 2002 expense reflects the full-year impact of the consolidation of bank charters in 2001.
Amortization of intangible assets decreased $864 in 2002 and increased $66 in 2001. The decrease in 2002 relates primarily to the adoption of SFAS No. 147. See Note 1 of the consolidated financial statement for further discussion.
Merger, integration and restructuring charges were $10,437 in 2002, $799 in 2001, and $3,867 in 2000. In 2002, restructuring charges included $5,652 pertaining to Sky Financial’s implementation of a new technology platform and associated processes and $4,784 related to the acquisition of Three Rivers Bancorp. In 2001, restructuring charges included $706 for the integration into Sky Bank of ten branches acquired in October and $93 for additional redesign of the financial service affiliates. In 2000, restructuring charges included $515 for the loss on the sale of its collection agency business and $3,352 for the further development of Sky Financial’s regional bank design, including expenses to complete the name changes of all of its commercial banks. Further discussion of the mergers and the related restructuring expenses is included in Notes 2 and 16 of the consolidated financial statements.
Loan Portfolio
Real estate loans, including construction and mortgage loans, approximated 55% of total loans at December 31, 2002, up from 54% at year-end 2001. The rise reflects stronger growth in commercial mortgages than declines in residential real estate loans due to higher refinancing activity. Sky Financial’s general collateral policy for residential real estate mortgages is to follow FNMA and FHLMC guidelines, which generally require a loan-to-value ratio of 80% or private mortgage insurance for loan-to-value ratios in excess of 80%.
Commercial loans comprise 34% of the total loan portfolio, increasing slightly from 33% in 2001. Growth in this portfolio reflects new business development in existing markets, as well as growth in the SFS loan portfolio. Beginning in July of 2000, Sky Financial began retaining in its loan portfolio the commercial financing loans originated through its subsidiary, SFS. SFS originates loans to healthcare professionals primarily for equipment acquisitions, practice acquisitions, practice startups, business expansions, working capital and debt consolidation. The SFS loans were previously sold to investors in the secondary market by a third-party intermediary. The amount of collateral required on commercial loans is generally determined based on a loan-by-loan assessment. Loan-to-value ratios for commercial loans typically range from 60% to 80%. Factors that are considered include, among other things, the purpose of the loan, the current financial status of the borrower and the borrower’s prior credit history. Sky Financial has participated in a small portfolio of shared national credits. These individual credit relationships total less than one-half of one percent of the total loan portfolio with the businesses located in our current market area.
The remaining portion of Sky Financial’s loan portfolio is installment loans, credit card loans and other loans and leases, which decreased to 11% of the loan portfolio from 13% in the prior year. Sky Financial makes consumer loans on both a secured and unsecured basis depending, in part, on the nature, purpose and term of the loan. Loan-to-value ratios for secured consumer loans range from 70% to 90% as a general rule.
As of December 31, 2002, Sky Financial did not have any loan concentrations that exceeded 10% of total loans. Sky Financial monitors the levels of market segments contained in the loan portfolio. Sky Financial considers loans originated by SFS as a market segment and has been managing the overall loan balances since the change in 2000 to retaining loans originated by SFS in its loan portfolio.
Table 8Loan Portfolio
December 31,
| | 2002
| | | 2001
| | | 2000
| | | 1999
| | | 1998
| |
Real estate loans: | | | | | | | | | | | | | | | | | | | | |
Construction | | $ | 410,955 | | | $ | 295,154 | | | $ | 210,135 | | | $ | 176,940 | | | $ | 175,706 | |
Residential mortgage | | | 1,614,048 | | | | 1,464,572 | | | | 1,866,111 | | | | 1,744,162 | | | | 1,739,132 | |
Non-residential mortgage | | | 2,290,053 | | | | 1,719,074 | | | | 1,575,907 | | | | 1,296,019 | | | | 1,251,977 | |
Commercial, financial and agricultural loans | | | 2,706,078 | | | | 2,144,846 | | | | 1,582,195 | | | | 1,337,112 | | | | 1,095,364 | |
Installment and credit card loans | | | 864,387 | | | | 850,343 | | | | 681,750 | | | | 923,261 | | | | 848,648 | |
| | |
|
|
| |
|
|
| |
|
|
| |
|
|
| |
|
|
|
Total loans | | $ | 7,885,521 | | | $ | 6,473,989 | | | $ | 5,916,098 | | | $ | 5,477,494 | | | $ | 5,110,827 | |
| | |
|
|
| |
|
|
| |
|
|
| |
|
|
| |
|
|
|
Real estate loans: | | | | | | | | | | | | | | | | | | | | |
Construction | | | 5.2 | % | | | 4.6 | % | | | 3.6 | % | | | 3.2 | % | | | 3.4 | % |
Residential mortgage | | | 20.5 | | | | 22.6 | | | | 31.5 | | | | 31.8 | | | | 34.0 | |
Non-residential mortgage | | | 29.0 | | | | 26.6 | | | | 26.6 | | | | 23.7 | | | | 24.5 | |
Commercial, financial and agricultural loans | | | 34.3 | | | | 33.1 | | | | 26.8 | | | | 24.4 | | | | 21.5 | |
Installment and credit card loans | | | 11.0 | | | | 13.1 | | | | 11.5 | | | | 16.9 | | | | 16.6 | |
| | |
|
|
| |
|
|
| |
|
|
| |
|
|
| |
|
|
|
Total loans | | | 100.0 | % | | | 100.0 | % | | | 100.0 | % | | | 100.0 | % | | | 100.0 | % |
| | |
|
|
| |
|
|
| |
|
|
| |
|
|
| |
|
|
|
In the above table, home equity term loans are included in residential mortgage for years 2002, 2001 and 2000 and are included in installment and credit card in 1999 and prior years.
21
Management’s Discussion and Analysis of Financial Condition and Results of Operations
(Dollars in thousands, except per share data)
Table 9 shows the amount of commercial, financial and agricultural loans and real estate construction loans outstanding as of December 31, 2002, which based on the remaining scheduled repayments of principal, are due in the periods indicated. Also, the amounts due after one year are classified according to their sensitivity to changes in interest rates.
Table 9Loan Maturity and Price Sensitivity
December 31, 2002
| | Due In 1 Year
| | Due In 1 Year-5 Years
| | Due After 5 Years
| | Total
|
Commercial, financial and agricultural | | $ | 1,543,696 | | $ | 483,640 | | $ | 678,742 | | $ | 2,706,078 |
Construction | | | 276,653 | | | 119,783 | | | 14,519 | | | 410,955 |
| | |
|
| |
|
| |
|
| |
|
|
Total | | $ | 1,820,349 | | $ | 603,423 | | $ | 693,261 | | $ | 3,117,033 |
| | |
|
| |
|
| |
|
| |
|
|
Total due after one year: | | | | | | | | | | | | |
Fixed rate commercial, financial, agricultural and construction | | | | | $ | 151,831 | | $ | 687,694 | | $ | 839,525 |
Variable rate commercial, financial, agricultural and construction | | | | | | 451,592 | | | 5,567 | | | 457,159 |
| | | | | |
|
| |
|
| |
|
|
Total | | | | | $ | 603,423 | | $ | 693,261 | | $ | 1,296,684 |
| | | | | |
|
| |
|
| |
|
|
Actual maturities of loans will differ from the contractual maturities presented in the table above because of prepayments, rollovers and renegotiation of payment terms, among other factors.
Under-Performing Assets
Residential mortgage, installment and other consumer loans are collectively evaluated for impairment. Individual commercial loans exceeding size thresholds established by management are evaluated for impairment. Impaired loans are recorded at the loan’s fair value by the establishment of a specific allowance where necessary. The fair value of the collateral-dependent loans is determined by the fair value of the underlying collateral. The fair value of noncollateral-dependent loans is determined by discounting expected future interest and principal payments at the loan’s effective interest rate. At year-end 2002, impaired loans were $53,041 compared with $18,032 at year-end 2001.
Non-accrual loans are comprised principally of loans 90 days past due as well as certain loans, which are current but where serious doubt exists as to the ability of the borrower to comply with the repayment terms. Interest previously accrued and not yet paid on non-accrual loans is reversed or charged against the allowance for credit losses during the period in which the loan is placed in a non-accrual status, except where Sky Financial has determined that such loans are adequately secured as to principal and interest. Interest earned thereafter is included in income only to the extent that it is received in cash. In certain cases, interest received may be credited against principal outstanding under the cost recovery method.
The increase in non-performing loans in 2002 has resulted from the decline in general economic trends experienced over the last two years. Non-accrual loans increased from $33,319 at December 31, 2001 to $66,855 at year-end 2002. In June 2002, Sky placed on non-accrual $22.8 million of loans that are secured by pools of commercial leases for which payment is over 90 days past due. These loans are guaranteed by surety bonds or insurance policies issued by three creditworthy insurance companies. Sky is engaged in litigation with these insurance companies to enforce their payment obligations, as are a number of other banks nationwide. After consultation with its counsel as to the strength of its position, Sky Financial believes that the credits are well secured and the prospects for recovery of all principal and interest are good.
At year-end 2002, non-performing assets were $74,236, an increase from $36,571 at the prior year-end. The increase was primarily in non-performing loans, which include the $22.8 million of non-accrual loans described earlier and, which at year-end 2002, totaled $70,058 or .89% of total loans outstanding, compared with $34,104 or .53%, of total loans outstanding at year-end 2001.
Loans now performing, but where some concerns exist as to the ability of the borrower to comply with present loan repayment terms, excluding non-performing loans, approximated $85,929 and $58,761 at December 31, 2002 and 2001, respectively, and are being closely monitored by management and the Boards of Directors of Sky Financial and its subsidiaries. The classification of these loans, however, does not imply that management expects losses on each of these loans, but believes that a higher level of scrutiny is prudent under the circumstances. The increase in loans where some concern exists is reflective of the weaker economy. These loans require close monitoring despite the fact that they are performing according to their terms. Such classifications relate to specific concerns relating to each individual borrower and do not relate to any concentrated risk elements common to all loans in this group.
Table 10Under-Performing Assets
December 31,
| | 2002
| | | 2001
| | | 2000
| | | 1999
| | | 1999
| |
Non-accrual loans | | $ | 66,855 | | | $ | 33,319 | | | $ | 20,329 | | | $ | 17,423 | | | $ | 13,570 | |
Restructured loans | | | 3,203 | | | | 785 | | | | 1,131 | | | | 2,067 | | | | 2,026 | |
| | |
|
|
| |
|
|
| |
|
|
| |
|
|
| |
|
|
|
Total non-performing loans | | | 70,058 | | | | 34,104 | | | | 21,460 | | | | 19,490 | | | | 15,596 | |
Other real estate owned | | | 4,178 | | | | 2,467 | | | | 2,221 | | | | 3,293 | | | | 1,977 | |
| | |
|
|
| |
|
|
| |
|
|
| |
|
|
| |
|
|
|
Total non-performing assets | | $ | 74,236 | | | $ | 36,571 | | | $ | 23,681 | | | $ | 22,783 | | | $ | 17,573 | |
| | |
|
|
| |
|
|
| |
|
|
| |
|
|
| |
|
|
|
Loans 90 days or more past due and still accruing interest | | $ | 12,458 | | | $ | 15,902 | | | $ | 10,294 | | | $ | 9,538 | | | $ | 7,797 | |
| | |
|
|
| |
|
|
| |
|
|
| |
|
|
| |
|
|
|
Non-performing loans to total loans | | | 0.89 | % | | | 0.53 | % | | | 0.36 | % | | | 0.36 | % | | | 0.31 | % |
Non-performing assets to total loans plus other real estate owned | | | 0.94 | | | | 0.56 | | | | 0.40 | | | | 0.42 | | | | 0.34 | |
Allowance for credit losses to total non-performing loans | | | 173.25 | | | | 303.55 | | | | 434.58 | | | | 445.10 | | | | 517.75 | |
Loans 90 days or more past due and not on non-accrual to total loans | | | 0.16 | | | | 0.25 | | | | 0.17 | | | | 0.17 | | | | 0.15 | |
22
Provision and Allowance for Credit Losses
The provision for credit losses represents the charge to income necessary to adjust the allowance for credit losses to an amount that represents management’s assessment of the estimated probable credit losses inherent in Sky Financial’s loan portfolio that have been incurred at each balance sheet date. All lending activity contains associated risks of loan losses. Sky Financial recognizes these credit risks as a necessary element of its business activity. To assist in identifying and managing potential loan losses, Sky Financial maintains a loan review function that continuously evaluates individual credit relationships as well as overall loan portfolio conditions. One of the primary objectives of this loan review function is to make recommendations to management as to both specific loss reserves and overall portfolio loss reserves.
The provision for credit losses expense for 2002 was $43,577, compared with $34,635 for 2001 and $22,250 in 2000. The changes in the provision for credit losses were attributable to the changes in net loan charge-offs, increasing non-performing loans, the recognition of changes in current risk factors and the addition to the portfolio of new loans originated at SFS, beginning in the third quarter of 2000.
Table 11Allowance for Credit Losses
Year Ended December 31,
| | 2002
| | | 2001
| | | 2000
| | | 1999
| | | 1998
| |
Balance at beginning of the period | | $ | 103,523 | | | $ | 93,261 | | | $ | 86,750 | | | $ | 80,748 | | | $ | 66,553 | |
Loans charged-off: | | | | | | | | | | | | | | | | | | | | |
Real estate | | | (7,898 | ) | | | (2,926 | ) | | | (1,798 | ) | | | (2,803 | ) | | | (3,861 | ) |
Commercial, financial and agricultural loans | | | (10,997 | ) | | | (10,826 | ) | | | (8,024 | ) | | | (3,366 | ) | | | (7,719 | ) |
Installment and credit card | | | (19,700 | ) | | | (17,467 | ) | | | (13,678 | ) | | | (14,233 | ) | | | (11,757 | ) |
Other loans | | | (859 | ) | | | — | | | | (453 | ) | | | (68 | ) | | | (5 | ) |
| | |
|
|
| |
|
|
| |
|
|
| |
|
|
| |
|
|
|
Total charge-offs | | | (39,454 | ) | | | (31,219 | ) | | | (23,953 | ) | | | (20,470 | ) | | | (23,342 | ) |
| | |
|
|
| |
|
|
| |
|
|
| |
|
|
| |
|
|
|
Recoveries: | | | | | | | | | | | | | | | | | | | | |
Real estate | | | 1,011 | | | | 376 | | | | 1,032 | | | | 938 | | | | 551 | |
Commercial, financial and agricultural loans | | | 1,037 | | | | 2,226 | | | | 3,483 | | | | 1,711 | | | | 2,334 | |
Installment and credit card | | | 4,795 | | | | 4,212 | | | | 3,567 | | | | 3,052 | | | | 2,627 | |
Other loans | | | 1 | | | | 32 | | | | 132 | | | | 25 | | | | 33 | |
| | |
|
|
| |
|
|
| |
|
|
| |
|
|
| |
|
|
|
Total recoveries | | | 6,844 | | | | 6,846 | | | | 8,214 | | | | 5,726 | | | | 5,545 | |
| | |
|
|
| |
|
|
| |
|
|
| |
|
|
| |
|
|
|
Net loans charged-off | | | (32,610 | ) | | | (24,373 | ) | | | (15,739 | ) | | | (14,744 | ) | | | (17,797 | ) |
Provision charged to operating expense | | | 43,577 | | | | 34,635 | | | | 22,250 | | | | 20,712 | | | | 31,992 | |
Reserve of acquired institutions | | | 6,882 | | | | — | | | | — | | | | — | | | | — | |
Effect of conforming year end of pooled entity | | | — | | | | — | | | | — | | | | 34 | | | | — | |
| | |
|
|
| |
|
|
| |
|
|
| |
|
|
| |
|
|
|
Balance at the end of the period | | $ | 121,372 | | | $ | 103,523 | | | $ | 93,261 | | | $ | 86,750 | | | $ | 80,748 | |
| | |
|
|
| |
|
|
| |
|
|
| |
|
|
| |
|
|
|
Net charge-offs to average loans outstanding | | | 0.47 | % | | | 0.39 | % | | | 0.28 | % | | | 0.28 | % | | | 0.36 | % |
Allowance for credit losses to total loans | | | 1.54 | | | | 1.60 | | | | 1.58 | | | | 1.58 | | | | 1.58 | |
Allowance for credit losses to total non-performing loans | | | 173.25 | | | | 303.55 | | | | 434.58 | | | | 445.10 | | | | 517.75 | |
Sky Financial maintains an allowance for credit losses at a level adequate to absorb management’s estimate of probable losses inherent in the loan portfolio. The allowance is comprised of a general allowance, a specific allowance for identified problem loans and an unallocated allowance.
The general allowance is determined by applying estimated loss factors to the credit exposures from outstanding loans. For construction, commercial and commercial real estate loans, loss factors are applied based on internal risk grades of these loans. For residential real estate, installment, credit card and other loans, loss factors are applied on a portfolio basis. Loss factors are based on Sky Financial’s historical loss experience and are reviewed for modification on a quarterly basis, along with other factors affecting the collectibility of the loan portfolio.
Specific allowances are established for all criticized and classified loans, where management has determined that, due to identified significant conditions, it is probable that a loss has been incurred that exceeds the general allowance loss factor for those loans. The unallocated allowance recognizes the estimation risk associated with the allocated general and specific allowances and incorporates management’s evaluation of existing conditions that are not included in the allocated allowance determinations. These conditions are reviewed quarterly by management and include general economic conditions, credit quality trends, and internal loan review and regulatory examination findings.
At December 31, 2002, the allowance for credit losses was $121,372 or 1.54% of total loans outstanding, and 173% of total non-performing loans, compared to an allowance at December 31, 2001 of $103,523 or 1.60% of total loans outstanding and 304% of total non-performing loans. At year-end 2002, the allocated portion of the allowance for credit losses was $111,298 compared with $92,042 at year-end 2001.
23
Management’s Discussion and Analysis of Financial Condition and Results of Operations
(Dollars in thousands, except per share data)
The increase to the allowance of 20.9% resulted primarily from the overall growth in total loans of 21.8% and the adjustment and extension of loss factors for components of certain segments within the loan portfolio, particularly the commercial financing segment. The allocated reserve amount also was impacted by the addition of the Three Rivers Bank reserve, which was fully allocated. At year-end 2002, the unallocated portion of the allowance for credit losses was $10,073 compared with $11,481 at year-end 2001. The decrease in the unallocated allowance was attributable to a decrease in Sky Financial’s estimation risk associated with its specific and general allowances, while the outlook for general economic conditions has stabilized.
Net charge-offs increased to $32,610 or .47% of average total loans, compared with $24,373 or .39% of average total loans in 2001. The increase in net charge-offs was primarily in the installment and commercial, financial and agricultural loan portfolios.
At December 31, 2002, average annual net charge-offs for the past three years were .38% of average loans compared with .32% at December 31, 2001. Based on these averages for net charge-offs, the allowance for credit losses represented 5 years of net credit losses at December 31, 2002 and 5.7 years of net credit losses at December 31, 2001.
Table 12Allocation of the Allowance for Credit Losses
December 31,
| | 2002
| | 2001
| | 2000
| | 1999
| | 1998
|
Construction | | $ | 2,257 | | $ | 2,387 | | $ | 1,132 | | $ | 707 | | $ | 693 |
Real estate | | | 36,071 | | | 29,332 | | | 27,091 | | | 22,186 | | | 21,771 |
Commercial, financial and agricultural | | | 47,217 | | | 34,567 | | | 22,628 | | | 16,165 | | | 14,568 |
Installment and credit card | | | 25,754 | | | 25,756 | | | 25,606 | | | 22,434 | | | 17,976 |
Unallocated | | | 10,073 | | | 11,481 | | | 16,804 | | | 25,258 | | | 25,740 |
| | |
|
| |
|
| |
|
| |
|
| |
|
|
Total | | $ | 121,372 | | $ | 103,523 | | $ | 93,261 | | $ | 86,750 | | $ | 80,748 |
| | |
|
| |
|
| |
|
| |
|
| |
|
|
The overall increase in the allowance for credit losses in 2002 was mainly due to the 21.8% growth in total loans from 2001. This was particularly reflected in the increased allowance for commercial, financial and agricultural loans, as that portion of the loan portfolio grew 26% in 2002 overall, with 17% generated by the community banking segment and 9% by SFS.
The increased allowance allocation for real estate loans principally reflects a shift in the real estate portfolio from residential mortgage loans to non-residential mortgage loans. Non-residential loans increased to 53% of the real estate portfolio at year-end 2002 compared to 47% at year-end 2001.
Securities
The investment portfolio at Sky Financial is used as a management tool to maintain acceptable levels of liquidity and exposure to changes in market interest rates. The portfolio yield is maximized once these criteria are satisfied. During the last two years, the portfolio has shifted to include a greater percentage of mortgage-backed securities. Mortgage-backed securities offer monthly principal and interest and may be used as collateral in a variety of financial transactions to secure sources of wholesale funding. The market for agency mortgage-backed securities is large and liquid. It is the practice of Sky Financial to purchase mortgage-backed securities with average expected lives of two to four years. Since this type of security may extend or contract, a pre-purchase analysis is completed. Most securities purchased have structures that limit changes to duration as market rates change.
In 2002, total securities available for sale increased $250 million, which was due to the acquisition of Three Rivers Bancorp, which added $369 million to the portfolio.
In 2001, total securities available for sale increased $150 million, primarily due to the additional funding from deposit growth, including the branch deposits acquired in October. During 2000, the investment portfolio was restructured. Municipal and U.S. Treasury securities were reduced, while U.S. agency debt securities and mortgage-backed securities were increased. This portfolio restructuring was undertaken to optimize the liquidity, cash flow and investment yield while maintaining the portfolio’s credit quality and average life.
The portfolio contains mortgage-backed securities and, to a limited extent, other securities, that have uncertain cash flow characteristics. The variable cash flows present additional risk to Sky Financial in the form of prepayment or extension risk primarily caused by changes in market interest rates. This additional risk is generally rewarded in the form of higher yields.
Sky Financial utilizes a variety of tools to monitor and minimize this risk. All securities must pass a stress test at the time of purchase estimating how the security would perform in various interest rate environments. Additionally, the corporate investment policy defines certain types of high-risk securities ineligible for purchase, including securities that may not return full principal to Sky Financial. It is also the practice of Sky Financial to minimize premiums paid on mortgage securities to avoid yield reduction if prepayments accelerate. These policies help to insure that there will be no material impact from these investments to the financial statements due to changes in market interest rates.
There are no securities of any single issuer where the aggregate carrying value of such securities exceed 10% of shareholders’ equity, except those of the U.S. Treasury, U.S. Government agencies and substantially all mortgage-backed securities issued by Federal Home Loan Mortgage Corporation, Federal National Mortgage Association and Government National Mortgage Association. Table 14 shows (at amortized cost) the contractual maturities and weighted average yields of Sky Financial’s securities as of December 31, 2002. Expected maturities will differ from contractual maturities because issuers may have the right to call or prepay obligations with or without call or prepayment penalties. Mortgage-backed securities are presented in the table based on current prepayment assumptions. The weighted average yields on income from tax exempt obligations of state and political subdivisions have been adjusted to a tax equivalent basis.
24
Table 13Securities Available for Sale
| | | Estimated Fair Value
|
December 31,
| | 2002
| | 2001
| | 2000
|
U.S. Treasury securities and obligations of | | | | | | | | | |
U.S. Government agencies and corporations | | $ | 466,564 | | $ | 494,474 | | $ | 619,549 |
Obligations of states and political subdivisions | | | 15,242 | | | 32,912 | | | 48,045 |
Corporate and other securities | | | 71,896 | | | 75,744 | | | 78,246 |
Mortgage-backed securities | | | 1,584,861 | | | 1,279,227 | | | 987,622 |
| | |
|
| |
|
| |
|
|
Total debt securities available for sale | | | 2,138,563 | | | 1,882,357 | | | 1,733,462 |
Marketable equity securities | | | 108,618 | | | 114,486 | | | 113,055 |
| | |
|
| |
|
| |
|
|
Total securities available for sale | | $ | 2,247,181 | | $ | 1,996,843 | | $ | 1,846,517 |
| | |
|
| |
|
| |
|
|
Table 14Maturity Distribution of Debt Securities Portfolio (At Amortized Cost)
| | | Within 1 Year
| | | 1-5 Years
| | | 5-10 Years
| | | Over 10 Years
| |
December 31, 2002
| | Amount
| | Yield
| | | Amount
| | Yield
| | | Amount
| | Yield
| | | Amount
| | Yield
| |
U.S. Treasury and U.S. Government agencies and corporations | | $ | 34,062 | | 5.32 | % | | $ | 419,667 | | 5.22 | % | | $ | 3,100 | | 5.64 | % | | | — | | — | |
Obligations of states and political subdivisions | | | 780 | | 4.59 | | | | 2,568 | | 5.24 | | | | 6,752 | | 5.40 | | | $ | 5,113 | | 6.68 | % |
Corporate and other securities | | | 4,902 | | 6.76 | | | | 6,402 | | 5.30 | | | | 5,341 | | 6.83 | | | | 54,357 | | 8.07 | |
Mortgage-backed securities | | | 90,561 | | 6.33 | | | | 1,394,922 | | 5.94 | | | | 57,061 | | 5.48 | | | | — | | — | |
| | |
|
| |
|
| |
|
| |
|
| |
|
| |
|
| |
|
| |
|
|
Total debt securities available for sale | | $ | 130,305 | | 6.07 | % | | $ | 1,823,559 | | 5.77 | % | | $ | 72,254 | | 5.58 | % | | $ | 59,470 | | 7.95 | % |
| | |
|
| |
|
| |
|
| |
|
| |
|
| |
|
| |
|
| |
|
|
Funding Sources
Sky Financial obtains its funding through a variety of sources. Retail deposits are gathered from individuals and businesses within the local communities served by the banking affiliate. Deposits encompass the full range of banking products including checking, savings and time deposits. In addition, Sky Financial obtains funds under a number of borrowing arrangements. The banking affiliate is a member of the Federal Home Loan Bank and may obtain both overnight and term advances. The banking affiliate also obtains funds through securities sold under repurchase agreement and federal funds lines. SFS maintains a line of credit with a non-affiliated bank to fund loans until permanent funding can be arranged through the issuance of asset-backed notes in a limited offering. Beginning in 2001, Sky Financial, through its affiliates, began issuing fixed and variable interest rate asset-backed notes in which repayment is secured and provided by the cash flows of commercial loans originated at SFS. These notes are used to provide permanent funding for the SFS loans. The parent company also maintains a line of credit with a group of non-affiliated banks.
Table 15Funding Sources
| | | Average Amounts Outstanding
| | Average Rate Paid
| |
Year Ended December 31,
| | 2002
| | 2001
| | 2000
| | 2002
| | | 2001
| | | 2000
| |
Non-interest-bearing demand deposits | | $ | 864,115 | | $ | 749,020 | | $ | 736,811 | | | | | | | | | |
Interest-bearing demand deposits | | | 107,325 | | | 140,541 | | | 141,744 | | 1.87 | % | | 1.90 | % | | 2.38 | % |
Savings deposits | | | 2,660,130 | | | 1,944,521 | | | 1,844,659 | | 1.30 | | | 2.00 | | | 2.56 | |
Time deposits | | | 3,384,936 | | | 3,308,884 | | | 3,045,522 | | 4.13 | | | 5.41 | | | 5.64 | |
| | |
|
| |
|
| |
|
| | | | | | | | | |
Total deposits | | | 7,016,506 | | | 6,142,966 | | | 5,768,736 | | | | | | | | | |
Short-term borrowings | | | 732,230 | | | 695,527 | | | 667,301 | | 2.65 | | | 3.97 | | | 5.39 | |
Trust preferred securities | | | 110,687 | | | 108,600 | | | 93,946 | | 7.00 | | | 9.66 | | | 9.71 | |
Asset-backed notes | | | 374,517 | | | 126,522 | | | — | | 6.41 | | | 6.65 | | | .0– | |
Debt and FHLB advances | | | 813,592 | | | 842,060 | | | 868,977 | | 4.52 | | | 5.89 | | | 6.32 | |
| | |
|
| |
|
| |
|
| | | | | | | | | |
Total funding sources | | $ | 9,047,532 | | $ | 7,915,675 | | $ | 7,398,960 | | | | | | | | | |
| | |
|
| |
|
| |
|
| | | | | | | | | |
25
Management’s Discussion and Analysis of Financial Condition and Results of Operations
(Dollars in thousands, except per share data)
Table 16 is a schedule of maturities of time deposits in denominations of $100,000 or more as of December 31, 2002:
Table 16Maturity of Time Deposits of $100,000 or More
Three months or less | | $ | 350,073 |
Three through six months | | | 484,021 |
Six through twelve months | | | 255,954 |
Over twelve months | | | 45,418 |
| | |
|
|
Total | | $ | 1,135,466 |
| | |
|
|
Short-Term Borrowings
Table 17 sets forth certain information relative to the securities sold under agreements to repurchase and federal funds purchased. While repurchase agreements are generally sold to local government entities and businesses and have maturity terms of overnight to 30 days, $214,000 have terms greater than one year. Federal funds purchased generally have overnight terms.
Table 17Short-Term Borrowings
December 31,
| | 2002
| | | 2001
| | | 2000
| |
Securities sold under agreements to repurchase and | | | | | | | | | | | | |
federal funds purchased at period-end | | $ | 795,125 | | | $ | 685,450 | | | $ | 702,985 | |
Weighted average interest rate at period-end | | | 2.24 | % | | | 3.28 | % | | | 5.62 | % |
Maximum outstanding at any month-end during the year | | $ | 890,920 | | | $ | 776,422 | | | $ | 741,264 | |
Average amount outstanding | | | 732,230 | | | | 695,527 | | | | 667,301 | |
Weighted average rates during the year | | | 2.65 | % | | | 3.97 | % | | | 5.39 | % |
For further information on the securities sold under agreements to repurchase see Note 8.
Liquidity Management
Management of liquidity is of continuing importance to the banking industry. The liquidity of a financial institution reflects its ability to meet loan requests, to accommodate possible outflows of deposits and to take advantage of interest rate market opportunities. The ability of a financial institution to meet its current financial obligations is a function of balance sheet structure, the ability to liquidate assets, and the availability of alternative sources of funds.
In addition to maintaining a stable core deposit base, Sky Financial’s banking subsidiary maintains adequate liquidity primarily through the use of investment securities and unused borrowing capacity. At December 31, 2002, securities with maturities of one year or less totaled $40,839. In addition, the mortgage-backed securities provide an estimated cash flow of approximately $748,887 over a twelve-month timeframe. The banking subsidiary is a member of the Federal Home Loan Bank (FHLB). The FHLB provides a reliable source of funds over and above retail deposits. As of December 31, 2002, the banking subsidiary had total credit availability with the FHLB of $861,137, of which $773,378 was outstanding.
Sky Financial, through one of its affiliates, entered into a conduit warehousing facility with a financial institution to provide up to $125,000 of interim funding for loans originated by SFS. Term funding is obtained later through the issuance of asset-backed notes in a limited offering.
Sky Financial is a holding company and does not conduct operations. Its primary sources of liquidity are borrowings from outside sources and dividends paid to it by its subsidiaries. For the banking subsidiary, regulatory approval is required in order to pay dividends in excess of the subsidiary’s earnings retained for the current year plus retained net profits for the prior two years. During 2002, Sky Bank paid a special dividend to Sky Financial as part of a recapitalization transaction. As a result, there are no dividends that could be paid to Sky Financial by its banking subsidiary, without prior regulatory approval, as of December 31, 2002.
Additionally, in order to enhance liquidity, Sky Financial is not expecting to make any share repurchases during 2003. Sky Financial maintains a $120,000 line of credit with a group of unaffiliated banks that expires March 30, 2003. It is anticipated that the line will be renewed. As of December 31, 2002, Sky Financial had a $59,000 outstanding balance on the line of credit.
The Corporation manages liquidity risk primarily through the Corporate Asset / Liability Committee. Policies addressing different aspects of liquidity management are covered within the Assets / Liability Policy. Management has increased its monitoring of liquidity levels and has implemented strategies to increase liquidity. Strategies implemented over 2002 include new retail deposit campaigns, deposit retention initiatives, a complete review of asset pledging requirements, the addition of brokered CD’s to the funding mix, and additional federal funds lines.
Capital Resources
Shareholders’ equity at year-end 2002 totaled $832,433, compared to $648,444 at December 31, 2001, an increase of 28.4%. The increase was primarily due to the issuance of stock for the acquisition of Three Rivers.
The Federal Reserve Board has established risk-based capital guidelines that must be observed by financial holding companies and banks. Sky Financial has consistently maintained the regulatory capital ratios of the corporation and its bank above “well capitalized” requirements. For further information on capital ratios, see Note 21 of the consolidated financial statements. On October 24, 2002, Sky Financial announced an agreement to acquire Metropolitan Financial Corp. Sky Financial expects to complete the merger during the second quarter of 2003. Upon completion of the merger, Sky Financial anticipates that its regulatory capital ratios will be reduced by 50 to 60 basis points at the corporate level and 10 to 30 basis points at the bank
26
level. However, these ratios will still remain above the well-capitalized requirements at both the corporate and bank levels.
The capital position is managed through balance sheet size and composition, issuance of debt and equity instruments, treasury stock activities, dividend policies and retention of earnings.
In September 2002, Sky Financial’s Board of Directors authorized the repurchase of up to 1,000,000 shares of Sky Financial common stock over a twelve-month period in the open market or in privately-negotiated transactions. Shares repurchased by Sky Financial are for use in its stock option plans and for general corporate purposes. Sky has not purchased any amounts under the current authorization and does not expect to make any share repurchases due to the pending merger of Metropolitan Financial Corp. During 2002, Sky Financial repurchased 784,000 shares under a previous authorization.
As of December 31, 2002, Sky Financial has $108,600 of capital securities, classified as debt on the balance sheet, which are considered to be Tier I capital for regulatory purposes.
Market Risk Management
Market risk is the risk that a financial institution’s earnings and capital, or its ability to meet its business objectives, will be adversely affected by movements in market rates or prices such as interest rates, foreign exchange rates, equity prices, credit spreads and or commodity prices. Within Sky Financial, the dominant market risk exposure is changes in interest rates. The negative effect of this exposure is felt through the net interest spread, mortgage banking revenues and the market values of various assets and liabilities.
Sky Financial manages market risk through its Asset / Liability Committees (ALCO) at both the subsidiary and consolidated levels. These committees assess interest rate risk exposure through three primary measurements: rate sensitive assets divided by rate sensitive liabilities (or “Gap ratios”), interest rate shock simulations of net interest income at risk and economic value of equity risk simulation.
Sky Financial also utilizes interest rate swaps and caps to effectively move its liability interest rate repricing down the yield curve to more effectively match the repricing characteristics of its assets. At December 31, 2002, the fair value of Sky Financial’s derivative arrangements aggregated $8,742 on contracts with notional amounts of $278,629. Sky Financial monitors and manages its rate sensitivity position to maximize net interest income, while minimizing the risk due to changes in interest rates. One method Sky Financial uses to manage its interest rate risk is a rate sensitivity gap analysis.
The difference between a financial institution’s interest rate sensitive assets (i.e. assets that will mature or reprice within a specific time period) and interest rate sensitive liabilities (i.e. liabilities that will mature or reprice within the same time period) is commonly referred to as its “interest rate sensitivity gap” or “gap.” An institution having more interest rate sensitive assets than interest rate sensitive liabilities within a given time period is said to have a “positive gap,” which generally means that if interest rates increase, a company’s net interest income will increase and if interest rates decrease, its net interest income will decrease. An institution having more interest rate sensitive liabilities than interest rate assets within a given time period is said to have a “negative gap,” which generally means that if interest rates increase, a company’s net interest income will decrease and if interest rates decrease, its net interest income will increase. The current policy imposes limits at the 6-month and 12-month time periods that is measured in terms of the ratio of cumulative rate sensitive assets divided by rate sensitive liabilities or (RSA/RSL). Table 18 presents the gap position of Sky Financial at December 31, 2002 and 2001.
Table 18Gap Position
| | | Year-end 2002
| | | Year-end 2001
| | | ALCO Guidelines
| |
| | | | | Max
| | | Min
| |
Six month | | 118.4 | % | | 107.1 | % | | 125 | % | | 95 | % |
One year | | 114.8 | % | | 98.0 | % | | 125 | % | | 95 | % |
The interest rate shock simulation analysis measures the potential effect on earnings that an instantaneous parallel change in general interest rates could have on net interest income and economic value of equity. Sky Financial applies hypothetical interest rate shocks up 300, 200 and 100 basis points and down 100 basis points to its financial instruments based on the assumed cash flows. Under the current interest rate environment, a declining 200 basis point or greater scenario is improbable and therefore provide no meaningful results. The economic value of equity measures the price risk of the entire balance sheet by discounting expected cash flows of all assets and liabilities and netting the result. This provides a longer-term view of the interest rate risk profile of the company; that is focused on the current economic value of assets and liabilities that make up the balance sheet at a static point in time. The shock then examines how the economic value of the company would change if market rates were different. As demonstrated in Table 19, as of December 31, 2002 and 2001, the projected volatility of net interest income and economic value of equity due to the hypothetical changes in market rates is within ALCO guidelines for the up 200 and 100 basis point scenarios. Sky Financial is intentionally not attempting to fix the out-of-guideline condition under the 100 basis point down scenario, which under the current interest rate environment is highly unlikely. Recently, the Corporation started to monitor the effect of a 300 basis point up scenario. No policy limit has been proposed by management as of December 31, 2002.
Table 19Rate Shock Analysis
| | | Year-end 2002
| | | Year-end 2001
| | | ALCO Guidelines
| |
One year net interest income change | | | | | | | | | |
+300 Basis points | | 15.2 | % | | — | % | | — | % |
+200 Basis points | | 12.0 | | | (0.2 | ) | | (10.0 | ) |
+100 Basis points | | 7.6 | | | 0.0 | | | (5.0 | ) |
-100 Basis points | | (6.0 | ) | | (0.3 | ) | | (5.0 | ) |
| | | | | | | | | | |
Net present value of equity change | | | | | | | | | |
+300 Basis points | | 7.8 | | | — | | | — | |
+200 Basis points | | 10.0 | | | (12.8 | ) | | (15.0 | ) |
+100 Basis points | | 7.7 | | | (6.6 | ) | | (10.0 | ) |
-100 Basis points | | 9.2 | | | 6.6 | | | (10.0 | ) |
The preceeding analysis is based on numerous assumptions, including relative levels of market interest rates, loan prepayments and reactions of depositors to changes in interest rates, and should not be relied upon as being indicative of actual results. Further, the analysis does not necessarily contemplate all actions Sky Financial may undertake in response to changes in interest rates.
27
Management’s Discussion and Analysis of Financial Condition and Results of Operations
(Dollars in thousands, except per share data)
Effects of Inflation
The assets and liabilities of Sky Financial are primarily monetary in nature and are more directly affected by the fluctuation in interest rates than inflation. Movement in interest rates is a result of the perceived changes in inflation as well as monetary and fiscal policies. Interest rates and inflation do not necessarily move with the same velocity or within the same period; therefore, a direct relationship to the inflation rate cannot be shown. The financial information presented in this report has been prepared in accordance with generally accepted accounting principles, which require that Sky Financial measure financial position and operating results primarily in terms of historical dollars.
Pending Acquisition
On October 24, 2002, Sky Financial announced an agreement to acquire Metropolitan Financial Corp. (Metropolitan), a $1.5 billion savings and loan holding company headquartered in Highland Hills, Ohio, and its wholly-owned subsidiary, Metropolitan Bank and Trust Company. This acquisition will enhance Sky Financial’s presence in the greater Cleveland area. At the election of Metropolitan shareholders, between 55% and 70% of the Metropolitan shares will be exchanged for Sky Financial common stock and the remaining balance will be settled in cash. The transaction, currently valued at $78 million, is anticipated to close during the second quarter of 2003. Not considering the merger-related charges discussed below, the merger is expected to be accretive to diluted earnings per share by approximately $.02 for the year 2003 due to the expected cost savings benefits achieved through the integration of systems and support functions, improved branch efficiencies and increased alternative delivery channels for financial products and services. As a result of cost savings efforts, Sky Financial expects to reduce approximately 30% of Metropolitan’s non-interest expense or $5.4 million on an annual basis and $3.1 million during 2003 after the completion of the merger. After-tax merger related charges of approximately $3.9 million or $.05 per diluted share are expected to be recognized in the second quarter of 2003. Upon completion of the merger, Sky Financial anticipates that its regulatory capital ratios will be reduced by 50 to 60 basis points at the corporate level and 10 to 30 basis points at the bank level. However, these ratios will still remain above the well-capitalized requirements at both the corporate and bank levels.
Critical Accounting Policies and Estimates
The accounting and reporting policies of Sky Financial are in accordance with accounting principles generally accepted within the United States of America and conform to general practices within the banking industry. Accounting and reporting policies for the allowance for credit losses and mortgage servicing rights are deemed critical since they involve the use of estimates and require significant management judgments. Application of assumptions different than those used by management could result in material changes in Sky Financial’s financial position or results of operations. Note 1 (Summary of Significant Accounting Policies) and Note 4 (Loans and Allowance for Credit Losses), as described in the notes to the financial statements, provide detail with regard to Sky Financial’s methodology and reporting of the allowance for credit losses. Accounting for mortgage servicing rights is also discussed in the financial statements in the Summary of Significant Accounting Policies footnote.
Forward Looking Statements
This report includes forward-looking statements by Sky Financial relating to such matters as anticipated operating results, business line results, credit quality expectations, prospects for new lines of business, technological developments, economic trends (including interest rates), reorganization transactions and similar matters. Such statements are based upon the current beliefs and expectations of Sky Financial’s management and are subject to risks and uncertainties. While Sky Financial believes that the assumptions underlying the forward-looking statements contained herein are reasonable, any of the assumptions could prove to be inaccurate, and accordingly, actual results and experience could differ materially from the anticipated results or other expectations expressed by Sky Financial in its forward-looking statements. Factors that could cause actual results or experience to differ from results discussed in the forward-looking statements include, but are not limited to: economic conditions; volatility and direction of market interest rates; loan origination projections and operating results of SFS; governmental legislation and regulation, including changes in accounting regulation or standards; material unforeseen changes in the financial condition or results of operations of Sky Financial’s clients; client reaction to and unforeseen complications with respect to Sky Financial’s integration of acquisitions; difficulties in realizing expected cost savings and revenue generation from acquisitions; difficulties associated with data conversions in Sky Financial’s migration to a single platform system; and other risks identified from time-to-time in Sky Financial’s other public documents on file with the Securities and Exchange Commission. The Private Securities Litigation Reform Act of 1995 provides a safe harbor for forward-looking statements, and the purpose of this paragraph is to secure the use of the safe harbor provisions.
28
Reports of Management and Independent Auditors
Report of Management
Management of Sky Financial Group, Inc. is responsible for the preparation, content and integrity of the consolidated financial statements and all other information whether audited or unaudited in this annual report. The consolidated financial statements have been prepared in accordance with accounting principles generally accepted in the United States of America and, where necessary, are based on management’s best estimates and judgment. The financial information contained elsewhere in this annual report is consistent with that contained in the consolidated financial statements.
Sky Financial Group, Inc.’s independent auditors have been engaged to perform an audit of the consolidated financial statements in accordance with auditing standards generally accepted in the United States of America and the independent auditors’ report expresses their opinion as to the fair presentation of the consolidated financial statements in accordance with accounting principles generally accepted in the United States of America.
Management maintains accounting systems and internal controls to meet its responsibilities for reliable consolidated financial statements. There are inherent limitations in the effectiveness of internal controls, including the possibility of errors or irregularities. Furthermore, because of changes in conditions, the effectiveness of internal controls may vary over time. Management believes that these systems and controls provide reasonable assurance that assets are safeguarded and transactions are properly recorded and executed, in accordance with management’s authorization. An internal audit function is maintained to continually evaluate the adequacy and effectiveness of such internal controls, policies, and procedures.
The Board of Directors pursues its oversight role for the financial statements through the Audit Committee, which is composed entirely of outside directors. The Audit Committee meets periodically with management, the internal auditors and the independent auditors, to discuss internal controls and accounting, auditing and financial reporting matters. The Audit Committee reviews and approves the scope of internal and external audits, as well as recommendations made with respect to internal controls by the independent and internal auditors and the various regulatory agencies.
Marty E. Adams
Chairman, President and Chief Executive Officer

Kevin T. Thompson
Executive Vice President and Chief Financial Officer
Report of Independent Auditors
Board of Directors and Shareholders
Sky Financial Group, Inc.
Bowling Green, Ohio
We have audited the accompanying consolidated balance sheets of Sky Financial Group, Inc. as of December 31, 2002 and 2001, and the related consolidated statements of income, changes in shareholders’ equity and cash flows for each of the three years in the period ended December 31, 2002. These financial statements are the responsibility of Sky Financial Group, Inc.’s management. Our responsibility is to express an opinion on these financial statements based on our audits.
We conducted our audits in accordance with auditing standards generally accepted in the United States of America. Those standards require that we plan and perform the audit to obtain reasonable assurance about whether the financial statements are free of material misstatement. An audit includes examining, on a test basis, evidence supporting the amounts and disclosures in the financial statements. An audit also includes assessing the accounting principles used and significant estimates made by management, as well as evaluating the overall financial statement presentation. We believe that our audits provide a reasonable basis for our opinion.
In our opinion, the consolidated financial statements referred to above present fairly, in all material respects, the consolidated financial position of Sky Financial Group, Inc. as of December 31, 2002 and 2001, and the consolidated results of its operations and its cash flows for each of the three years in the period ended December 31, 2002 in conformity with accounting principles generally accepted in the United States of America.
As disclosed in Note 1, Sky Financial Group, Inc. adopted new accounting guidance for goodwill and intangible assets in 2002 and for derivative instruments and hedging activities during 2001.

Crowe, Chizek and Company LLP
Columbus, Ohio
January 21, 2003
29
Consolidated Balance Sheets
(Dollars in thousands, except per share data)
December 31,
| | 2002
| | | 2001
| |
Assets | | | | | | | | |
Cash and due from banks | | $ | 253,172 | | | $ | 272,196 | |
Interest-earning deposits with financial institutions | | | 61,345 | | | | 39,171 | |
Federal funds sold | | | 11,100 | | | | 8,000 | |
Loans held for sale | | | 69,333 | | | | 85,474 | |
Securities available for sale | | | 2,247,181 | | | | 1,996,843 | |
Total loans | | | 7,885,521 | | | | 6,473,989 | |
Less allowance for credit losses | | | (121,372 | ) | | | (103,523 | ) |
| | |
|
|
| |
|
|
|
Net loans | | | 7,764,149 | | | | 6,370,466 | |
Premises and equipment | | | 133,356 | | | | 112,137 | |
Goodwill | | | 108,776 | | | | 33,912 | |
Core deposit and other intangibles | | | 43,903 | | | | 26,799 | |
Accrued interest receivable and other assets | | | 321,628 | | | | 275,230 | |
| | |
|
|
| |
|
|
|
Total assets | | $ | 11,013,943 | | | $ | 9,220,228 | |
| | |
|
|
| |
|
|
|
Liabilities | | | | | | | | |
Deposits | | | | | | | | |
Non-interest-bearing deposits | | $ | 997,017 | | | $ | 822,436 | |
Interest-bearing deposits | | | 6,618,403 | | | | 5,719,741 | |
| | |
|
|
| |
|
|
|
Total deposits | | | 7,615,420 | | | | 6,542,177 | |
Securities sold under repurchase agreements and federal funds purchased | | | 795,125 | | | | 685,450 | |
Debt and Federal Home Loan Bank advances | | | 1,484,258 | | | | 1,095,545 | |
Obligated mandatorily redeemable capital securities of subsidiary trusts | | | 116,492 | | | | 108,600 | |
Accrued interest payable and other liabilities | | | 170,215 | | | | 140,012 | |
| | |
|
|
| |
|
|
|
Total liabilities | | | 10,181,510 | | | | 8,571,784 | |
| | |
|
|
| |
|
|
|
Shareholders’ Equity | | | | | | | | |
Serial preferred stock, $10.00 par value; 10,000,000 shares authorized; none issued | | | — | | | | — | |
Common stock, no par value; 150,000,000 shares authorized; 87,276,888 and 84,011,214 shares issued in 2002 and 2001 | | | 658,767 | | | | 596,397 | |
Retained earnings | | | 149,543 | | | | 86,113 | |
Treasury stock; 220,781 and 2,164,099 shares in 2002 and 2001 | | | (3,965 | ) | | | (39,505 | ) |
Unearned ESOP | | | — | | | | (123 | ) |
Accumulated other comprehensive income | | | 28,088 | | | | 5,562 | |
| | |
|
|
| |
|
|
|
Total shareholders’ equity | | | 832,433 | | | | 648,444 | |
| | |
|
|
| |
|
|
|
Total liabilities and shareholders’ equity | | $ | 11,013,943 | | | $ | 9,220,228 | |
| | |
|
|
| |
|
|
|
The accompanying notes are an integral part of the financial statements.
30
Consolidated Statements of Income
(Dollars in thousands, except per share data)
For The Years Ended December 31,
| | 2002
| | 2001
| | 2000
| |
Interest Income | | | | | | | | | | |
Loans, including fees | | $ | 508,579 | | $ | 523,672 | | $ | 505,203 | |
Securities | | | | | | | | | | |
Taxable | | | 115,261 | | | 114,947 | | | 113,193 | |
Nontaxable | | | 1,248 | | | 1,882 | | | 6,241 | |
Federal funds sold and other | | | 818 | | | 1,875 | | | 1,378 | |
| | |
|
| |
|
| |
|
|
|
Total interest income | | | 625,906 | | | 642,376 | | | 626,015 | |
| | |
|
| |
|
| |
|
|
|
|
Interest Expense | | | | | | | | | | |
Deposits | | | 176,265 | | | 220,678 | | | 222,211 | |
Borrowed funds | | | 87,956 | | | 96,101 | | | 100,008 | |
| | |
|
| |
|
| |
|
|
|
Total interest expense | | | 264,221 | | | 316,779 | | | 322,219 | |
| | |
|
| |
|
| |
|
|
|
Net interest income | | | 361,685 | | | 325,597 | | | 303,796 | |
Provision for credit losses | | | 43,577 | | | 34,635 | | | 22,250 | |
| | |
|
| |
|
| |
|
|
|
Net interest income after provision for credit losses | | | 318,108 | | | 290,962 | | | 281,546 | |
| | |
|
| |
|
| |
|
|
|
|
Non-Interest Income | | | | | | | | | | |
Trust services income | | | 13,479 | | | 14,398 | | | 15,147 | |
Service charges and fees on deposit accounts | | | 34,499 | | | 31,416 | | | 27,003 | |
Mortgage banking income | | | 28,626 | | | 23,893 | | | 12,204 | |
Brokerage and insurance commissions | | | 36,807 | | | 24,598 | | | 29,177 | |
Collection agency fees | | | — | | | — | | | 1,912 | |
Net securities gains (losses) | | | 2,479 | | | 2,475 | | | (3,023 | ) |
Net gains on sales of commercial financing loans | | | — | | | — | | | 7,586 | |
Other income | | | 33,991 | | | 29,460 | | | 31,952 | |
| | |
|
| |
|
| |
|
|
|
Total non-interest income | | | 149,881 | | | 126,240 | | | 121,958 | |
| | |
|
| |
|
| |
|
|
|
|
Non-Interest Expenses | | | | | | | | | | |
Salaries and employee benefits | | | 151,692 | | | 125,410 | | | 117,957 | |
Occupancy and equipment expense | | | 40,177 | | | 36,017 | | | 37,004 | |
Merger, integration and restructuring expense | | | 10,437 | | | 799 | | | 3,867 | |
Other operating expense | | | 74,508 | | | 74,994 | | | 76,579 | |
| | |
|
| |
|
| |
|
|
|
Total non-interest expenses | | | 276,814 | | | 237,220 | | | 235,407 | |
| | |
|
| |
|
| |
|
|
|
Income before income taxes | | | 191,175 | | | 179,982 | | | 168,097 | |
Income taxes | | | 63,368 | | | 59,319 | | | 53,724 | |
| | |
|
| |
|
| |
|
|
|
Net Income | | $ | 127,807 | | $ | 120,663 | | $ | 114,373 | |
| | |
|
| |
|
| |
|
|
|
Earnings Per Common Share | | | | | | | | | | |
Basic | | $ | 1.53 | | $ | 1.46 | | $ | 1.35 | |
Diluted | | | 1.52 | | | 1.45 | | | 1.35 | |
The accompanying notes are an integral part of the financial statements.
31
Consolidated Statements of Changes in Shareholders’ Equity
(Dollars and shares in thousands, except per share data)
| | | Common Shares
| | | Treasury Shares
| | | Common Stock
| | | Retained Earnings
| | | Stock
| | | Unearned Treasury ESOP
| | | Accumulated
Other Comprehensive Income (Loss)
| | | Total
| |
Balance, December 31, 1999 | | 78,163 | | | 274 | | | $ | 571,543 | | | $ | 34,381 | | | $ | (6,215 | ) | | $ | (717 | ) | | $ | (32,661 | ) | | $ | 566,331 | |
| | |
|
| |
|
| |
|
|
| |
|
|
| |
|
|
| |
|
|
| |
|
|
| |
|
|
|
Comprehensive income | | | | | | | | | | | | | | | | | | | | | | | | | | | | | | |
Net income | | | | | | | | | | | | | 114,373 | | | | | | | | | | | | | | | | 114,373 | |
Other comprehensive | | | | | | | | | | | | | | | | | | | | | | | | | 28,820 | | | | 28,820 | |
| | | | | | | | | | | | | | | | | | | | | | | | | | | | |
|
|
|
Total comprehensive income | | | | | | | | | | | | | | | | | | | | | | | | | | | | | 143,193 | |
| | | | | | | | | | | | | | | | | | | | | | | | | | | | |
|
|
|
Cash dividends ($.72 per share) | | | | | | | | | | | | | (61,377 | ) | | | | | | | | | | | | | | | (61,377 | ) |
Treasury shares acquired | | | | | 3,064 | | | | | | | | | | | | (52,820 | ) | | | | | | | | | | | (52,820 | ) |
| | | | | | | | | | | | | | | | | | | | | | | | | | | | | | | |
Treasury shares issued for stock option exercises | | | | | (323 | ) | | | (1,889 | ) | | | | | | | 5,774 | | | | | | | | | | | | 3,885 | |
Shares issued to acquire Meyer & Eckenrode Insurance Agency,Inc. | | 603 | | | | | | | 9,610 | | | | | | | | | | | | | | | | | | | | 9,610 | |
10% common stock dividend | | 5,223 | | | (2,407 | ) | | | 17,904 | | | | (60,674 | ) | | | 42,770 | | | | | | | | | | | | | |
Fractional shares and other items | | 27 | | | | | | | 555 | | | | (104 | ) | | | | | | | 417 | | | | | | | | 868 | |
| | |
|
| |
|
| |
|
|
| |
|
|
| |
|
|
| |
|
|
| |
|
|
| |
|
|
|
Balance, December 31, 2000 | | 84,016 | | | 608 | | | | 597,723 | | | | 26,599 | | | | (10,491 | ) | | | (300 | ) | | | (3,841 | ) | | | 609,690 | |
| | |
|
| |
|
| |
|
|
| |
|
|
| |
|
|
| |
|
|
| |
|
|
| |
|
|
|
Comprehensive income | | | | | | | | | | | | | | | | | | | | | | | | | | | | | | |
Net income | | | | | | | | | | | | | 120,663 | | | | | | | | | | | | | | | | 120,663 | |
Other comprehensive income | | | | | | | | | | | | | | | | | | | | | | | | | 9,403 | | | | 9,403 | |
| | | | | | | | | | | | | | | | | | | | | | | | | | | | |
|
|
|
Total comprehensive income | | | | | | | | | | | | | | | | | | | | | | | | | | | | | 130,066 | |
| | | | | | | | | | | | | | | | | | | | | | | | | | | | |
|
|
|
Cash dividends ($.74 per share) | | | | | | | | | | | | | (61,067 | ) | | | | | | | | | | | | | | | (61,067 | ) |
Treasury shares acquired | | | | | 1,856 | | | | | | | | | | | | (34,571 | ) | | | | | | | | | | | (34,571 | ) |
Treasury shares issued for stock option exercises | | | | | (300 | ) | | | (1,548 | ) | | | | | | | 5,557 | | | | | | | | | | | | 4,009 | |
Fractional shares and other items | | (5 | ) | | | | | | 222 | | | | (82 | ) | | | | | | | 177 | | | | | | | | 317 | |
| | |
|
| |
|
| |
|
|
| |
|
|
| |
|
|
| |
|
|
| |
|
|
| |
|
|
|
Balance, December 31, 2001 | | 84,011 | | | 2,164 | | | | 596,397 | | | | 86,113 | | | | (39,505 | ) | | | (123 | ) | | | 5,562 | | | | 648,444 | |
| | |
|
| |
|
| |
|
|
| |
|
|
| |
|
|
| |
|
|
| |
|
|
| |
|
|
|
Comprehensive income | | | | | | | | | | | | | | | | | | | | | | | | | | | | | | |
Net income | | | | | | | | | | | | | 127,807 | | | | | | | | | | | | | | | | 127,807 | |
Other comprehensive income | | | | | | | | | | | | | | | | | | | | | | | | | 22,526 | | | | 22,526 | |
| | | | | | | | | | | | | | | | | | | | | | | | | | | | |
|
|
|
Total comprehensive income | | | | | | | | | | | | | | | | | | | | | | | | | | | | | 150,333 | |
| | | | | | | | | | | | | | | | | | | | | | | | | | | | |
|
|
|
Cash dividends ($.77 per share) | | | | | | | | | | | | | (64,459 | ) | | | | | | | | | | | | | | | (64,459 | ) |
Treasury shares acquired | | | | | 784 | | | | | | | | | | | | (16,403 | ) | | | | | | | | | | | (16,403 | ) |
Treasury shares issued for stock option exercises | | | | | (335 | ) | | | (3,253 | ) | | | | | | | 6,998 | | | | | | | | | | | | 3,745 | |
Shares issued for stock option exercises | | 33 | | | | | | | 498 | | | | | | | | | | | | | | | | | | | | 498 | |
Shares issued to acquire Three Rivers Bancorp | | 3,222 | | | (1,632 | ) | | | 63,667 | | | | | | | | 31,160 | | | | | | | | | | | | 94,827 | |
Shares issued to acquire Celaris Group, Inc. | | | | | (748 | ) | | | 1,564 | | | | | | | | 13,785 | | | | | | | | | | | | 15,349 | |
Fractional shares and other items | | 11 | | | (12 | ) | | | (106 | ) | | | 82 | | | | | | | | 123 | | | | | | | | 99 | |
| | |
|
| |
|
| |
|
|
| |
|
|
| |
|
|
| |
|
|
| |
|
|
| |
|
|
|
Balance, December 31, 2002 | | 87,277 | | | 221 | | | $ | 658,767 | | | $ | 149,543 | | | $ | (3,965 | ) | | $ | — | | | $ | 28,088 | | | $ | 832,433 | |
| | |
|
| |
|
| |
|
|
| |
|
|
| |
|
|
| |
|
|
| |
|
|
| |
|
|
|
The accompanying notes are an integral part of the financial statements.
32
Consolidated Statements of Cash Flows
(Dollars in thousands)
For The Years Ended December 31,
| | 2002
| | | 2001
| | | 2000
| |
Operating Activities | | | | | | | | | | | | |
Net income | | $ | 127,807 | | | $ | 120,663 | | | $ | 114,373 | |
Adjustments to reconcile net income to net cash from operating activities: | | | | | | | | | | | | |
Depreciation, amortization and valuation adjustments | | | 27,369 | | | | 20,090 | | | | 19,107 | |
Net gains on sales of assets | | | (2,339 | ) | | | (18,575 | ) | | | (15,084 | ) |
Provision for credit losses | | | 43,577 | | | | 34,635 | | | | 22,250 | |
Net change in loans held for sale | | | (6,839 | ) | | | (56,547 | ) | | | 7,504 | |
Net change in other assets and liabilities | | | (14,687 | ) | | | (51,494 | ) | | | (11,526 | ) |
| | |
|
|
| |
|
|
| |
|
|
|
Net cash from operating activities | | | 174,888 | | | | 48,772 | | | | 136,624 | |
| | |
|
|
| |
|
|
| |
|
|
|
Investing Activities | | | | | | | | | | | | |
Net decrease (increase) in interest-earning deposits with financial institutions | | | (22,174 | ) | | | (21,446 | ) | | | (639 | ) |
Net decrease (increase) in federal funds sold | | | (3,100 | ) | | | (8,000 | ) | | | 3,100 | |
Securities available for sale: | | | | | | | | | | | | |
Proceeds from maturities and payments | | | 1,028,862 | | | | 859,843 | | | | 383,612 | |
Proceeds from sales | | | 423,106 | | | | 201,797 | | | | 276,520 | |
Purchases | | | (1,315,494 | ) | | | (1,187,287 | ) | | | (596,441 | ) |
Proceeds from sales of non-mortgage loans | | | 22,980 | | | | 14,950 | | | | 51,322 | |
Net increase in loans | | | (848,650 | ) | | | (601,278 | ) | | | (506,131 | ) |
Purchases of premises and equipment | | | (28,449 | ) | | | (13,972 | ) | | | (15,442 | ) |
Proceeds from sales of premises and equipment | | | 4,104 | | | | 3,177 | | | | 2,580 | |
Proceeds from sales of other real estate | | | 1,608 | | | | 4,249 | | | | 4,006 | |
Cash paid for Celaris Group, Inc., net of cash acquired | | | (1,000 | ) | | | — | | | | — | |
Cash paid for Three Rivers Bancorp, net of cash acquired | | | (7,339 | ) | | | — | | | | — | |
Cash paid for Value Added Benefits Ltd., net of cash acquired | | | (1,900 | ) | | | — | | | | — | |
Other items | | | 851 | | | | 1,437 | | | | 271 | |
| | |
|
|
| |
|
|
| |
|
|
|
Net cash from investing activities | | | (746,595 | ) | | | (746,530 | ) | | | (397,242 | ) |
| | |
|
|
| |
|
|
| |
|
|
|
Financing Activities | | | | | | | | | | | | |
Cash transferred in connection with sale of branch deposits | | | — | | | | — | | | | (9,830 | ) |
Purchases of branch deposits, net | | | — | | | | 289,220 | | | | — | |
Net (decrease) increase in deposit accounts | | | 302,993 | | | | 361,025 | | | | 143,748 | |
Net increase (decrease) in federal funds and repurchase agreements | | | 109,675 | | | | (17,535 | ) | | | 45,072 | |
Net increase (decrease) in short-term FHLB advances | | | 180,000 | | | | 8,000 | | | | (105,700 | ) |
Proceeds from trust preferred securities | | | — | | | | — | | | | 60,000 | |
Proceeds from asset-backed notes | | | 269,629 | | | | 292,080 | | | | — | |
Repayment of asset-backed notes | | | (26,059 | ) | | | (1,950 | ) | | | — | |
Proceeds from issuance of debt and long-term FHLB advances | | | 190,000 | | | | 55,165 | | | | 548,083 | |
Repayment of debt and long-term FHLB advances | | | (398,764 | ) | | | (191,194 | ) | | | (424,896 | ) |
Cash dividends and fractional shares paid | | | (62,631 | ) | | | (60,536 | ) | | | (61,962 | ) |
Proceeds from issuance of common stock | | | 4,243 | | | | 4,009 | | | | 3,885 | |
Treasury stock purchases | | | (16,403 | ) | | | (34,571 | ) | | | (52,820 | ) |
Other items | | | — | | | | (118 | ) | | | 417 | |
| | |
|
|
| |
|
|
| |
|
|
|
Net cash from financing activities | | | 552,683 | | | | 703,595 | | | | 145,997 | |
| | |
|
|
| |
|
|
| |
|
|
|
Net increase (decrease) in cash and due from banks | | | (19,024 | ) | | | 5,837 | | | | (114,621 | ) |
Cash and due from banks at beginning of year | | | 272,196 | | | | 266,359 | | | | 380,980 | |
| | |
|
|
| |
|
|
| |
|
|
|
Cash and due from banks at end of year | | $ | 253,172 | | | $ | 272,196 | | | $ | 266,359 | |
| | |
|
|
| |
|
|
| |
|
|
|
Supplemental Disclosures | | | | | | | | | | | | |
Interest paid | | $ | 257,604 | | | $ | 321,674 | | | $ | 324,659 | |
Income taxes paid | | | 62,981 | | | | 52,042 | | | | 48,136 | |
Value of shares issued to acquire Celaris Group, Inc. | | | 15,349 | | | | — | | | | — | |
Value of shares issued to acquire Three Rivers Bancorp, Inc. | | | 94,827 | | | | — | | | | — | |
Value of shares issued to acquire Meyer & Eckenrode Insurance Group, Inc. | | | — | | | | — | | | | 9,610 | |
Non-cash activity related to the acquisitions included the purchase of assets with a fair value of $1,074,914 and the assumption of liabilities of $956,874 in 2002 and the purchase of assets with a fair market value of $14,116 and the assumption of liabilities of $4,506 in 2000.
The accompanying notes are an integral part of the financial statements.
33
Notes to Consolidated Financial Statements
(Dollars in thousands, except per share data)
Note 1Summary of Significant Accounting Policies
Sky Financial Group, Inc. (Sky Financial) is a financial holding company headquartered in Bowling Green, Ohio, that owns and operates Sky Bank, which is primarily engaged in the commercial and consumer banking business in Ohio, Pennsylvania, Indiana, Michigan and West Virginia. Sky Financial also operates businesses relating to commercial finance lending, insurance, brokerage, trust and other financial-related services.
Basis of Presentation
The accounting and reporting policies followed by Sky Financial conform to accounting principles generally accepted in the United States of America (U.S. GAAP) and to general practices within the financial services industry. The preparation of financial statements requires management to make estimates and assumptions that affect the reported amounts of assets and liabilities and disclosure of contingent assets and liabilities at the date of the financial statements. Actual results could differ from those estimates. The allowance for credit losses, fair values of financial instruments and status of contingencies are particularly subject to change.
Consolidation
The consolidated financial statements of Sky Financial include the accounts of Sky Bank, Sky Financial Solutions, Inc. (SFS), Sky Trust, N.A. (Sky Trust), Sky Insurance, Inc. (Sky Insurance), Meyer & Eckenrode Insurance Group, Inc. (Meyer & Eckenrode), and various other insignificant subsidiaries. All significant intercompany transactions and accounts have been eliminated in consolidation.
During 2002, Sky Insurance was formed through the merger of Picton Cavanaugh, Inc. and two insurance agencies acquired during the year, Celaris Group, Inc. and Value Added Benefits, Ltd.
Securities
Sky Financial classifies its securities as held to maturity, trading or available for sale. Securities classified as available for sale are those that management intends to sell or that could be sold for liquidity, investment management or similar reasons, even if there is not a present intention to make such a sale. Equity securities that have a readily determinable fair value are also classified as available for sale. Securities classified as available for sale are carried at estimated fair value with unrealized appreciation or depreciation recorded, net of tax, in other comprehensive income. Securities classified as held to maturity are stated at cost, adjusted for amortization of premiums and accretion of discounts using the interest method. Securities classified as held to maturity are those that management has the positive intent and ability to hold to maturity. Trading securities are acquired for sale in the near term and are carried at fair value, with unrealized holding gains and losses reflected in earnings. Sky Financial held no trading securities or securities classified as held to maturity during any period presented. Certain restricted equity securities, such as stock of the Federal Home Loan Bank of Cincinnati, are carried at cost. Amortization of premiums and accretion of discounts are recorded in interest income using the interest method over the period to maturity, which is sometimes estimated. Gains and losses on security sales are calculated using the specific identification method to determine the security’s cost.
Derivative Financial Instruments
Sky Financial’s hedging policies permit the use of interest rate swaps, caps and floors to manage interest rate risk or to hedge specified assets and liabilities. Sky Financial does not use derivative financial instruments for trading purposes. Interest rate swaps were entered into as cash flow and fair value hedges for the purpose of modifying the interest rate characteristics for the funding of certain loans within Sky Financial’s loan portfolio and for trust preferred securities. The interest rate swaps involve no exchange of principal either at inception or upon maturity; rather, it involves the periodic exchange of interest payments arising from an underlying notional principal amount. Interest rate caps were entered into as cash flow hedges for purposes of modifying the interest rate characteristics of federal funds purchased. At inception, Sky Financial paid $1,456 for the interest rate caps.
Beginning January 1, 2001, all derivative instruments are recorded at their fair values, as required by a new accounting pronouncement. If derivative instruments are designated as hedges of fair values, both the change in the fair value of the hedge and the hedged item are included in current earnings. Fair value adjustments related to cash flow hedges are recorded in other comprehensive income, net of tax, and reclassified to earnings when the hedged transaction is reflected in earnings. Ineffective portions of hedges are reflected in earnings as they occur. Prior to January 1, 2001, derivatives were accounted for using settlement accounting and reported at their initial cost, and unrealized gains and losses resulting from changes in its fair value not recorded in the financial statements. Revenues or expenses associated with these agreements were accounted for on an accrual basis and recognized as an adjustment to interest income or expense, based on the interest rates currently in effect for such contracts. The adoption of the new accounting pronouncement on January 1, 2001 resulted in a pre-tax reduction of other comprehensive income of $1,231.
Loans Held for Sale
Certain residential mortgage loans are originated for sale in the secondary mortgage loan market. Additionally, certain other loans and leases are periodically identified to be sold. These loans and leases are classified as loans held for sale and carried at the lower of cost or estimated fair value. Fair value is determined on the basis of rates quoted in the respective secondary market for the type of loan or lease held for sale. Loans are generally sold at a premium or discount from the carrying amount of the loans. Such premium or discount is recognized at the date of sale. Fixed commitments may be used at the time loans are originated or identified for sale to mitigate interest rate risk. The fair value of fixed commitments to originate and sell loans held for sale was not material.
Mortgage Servicing Rights
The cost of mortgage loans sold or securitized is allocated between the mortgage servicing rights and the cost of the mortgage based on the relative fair values of each. The fair value of the mortgage servicing rights is determined by discounting expected servicing income cash flows, net of certain servicing costs.
Mortgage servicing rights are amortized in proportion to, and over the period of, estimated net servicing income. Management periodically evaluates mortgage servicing rights for impairment by discounting the expected future cash flows, taking into consideration the estimated level of prepayments based upon current industry expectations.
34
Interest and Fees on Loans
Interest income on loans is accrued over the term of the loans using the simple-interest method based on the amount of principal outstanding. The accrual of interest is discontinued on a loan when management believes that the collection of interest is doubtful. Payments on these loans are recorded as principal reductions. Loan origination and commitment fees and certain direct loan origination costs are deferred and amortized as an adjustment to the related loan’s yield. Sky Financial is amortizing these amounts over the contractual life of the related loans.
Allowance for Credit Losses
The allowance for credit losses is an amount that management believes will be adequate to absorb probable incurred losses in existing loans and leases and is established through a provision for credit losses charged to expense. Loans and leases are charged against the allowance for credit losses when management believes the full collectibility of the loan is unlikely. The allowance and provision take into consideration such factors as past loss experience, changes in the nature and volume of the portfolio, overall portfolio quality, loan concentrations, specific problem loans, leases and current economic conditions that affect the borrower’s ability to pay. Allowances established to provide for losses under commitments to extend credit, or recourse provisions under loan and lease sales agreements or servicing agreements are classified with other liabilities.
A loan is considered impaired when it is probable that not all principal and interest amounts will be collected according to the loan contract. Residential mortgage, installment and other consumer loans are collectively evaluated for impairment. Individual commercial loans exceeding size thresholds established by management are evaluated for impairment. Impaired loans are recorded at the loan’s fair value by the establishment of a specific allowance where necessary. The fair value of collateral-dependent loans is determined by the fair value of the underlying collateral. The fair value of noncollateral-dependent loans is determined by discounting expected future interest and principal payments at the loan’s effective interest rate.
Foreclosed Assets
Assets acquired through or instead of loan foreclosure are initially recorded at the lower of the loan balance or fair value when acquired, establishing a new cost basis. If fair value declines, a valuation allowance is recorded through expense. Costs after acquisition are expensed.
Premises and Equipment
Premises and equipment are stated at cost less accumulated depreciation, which is computed primarily using the straight-line method. The adjusted cost of the specific assets sold or disposed of is used to compute gains or losses on disposal. These assets are reviewed for impairment when events indicate their carrying value may not be recoverable.
Company-Owned Life Insurance
Sky Financial has purchased life insurance polices on certain executives. These policies are recorded at their cash surrender value, or the amount that can be realized.
Intangible Assets
Core deposit intangible assets acquired before 1992 are amortized using the straight-line method over periods ranging from 10 to 15 years. Core deposit intangible assets acquired on or after January 1, 1992 are amortized using an accelerated method over periods ranging from 10 to 15 years. Prior to January 1, 2002, goodwill was amortized using the straight-line method over periods ranging from 15 to 25 years. Beginning in 2002, the Company ceased amortizing goodwill in accordance with a new accounting pronouncement. Goodwill is reviewed for impairment on an annual basis.
Merger, Integration and Restructuring Expense
Included in other operating expense are charges for merger, integration and restructuring expenses, which primarily represent professional fees, other personnel related costs, valuation adjustments for certain premises, equipment and other assets, and integration costs related to mergers, acquisitions, and corporate restructuring. (See Note 16.)
Income Taxes
Sky Financial utilizes an asset and liability approach for financial accounting and reporting of income taxes. The provision for income taxes is the sum of taxes currently payable and the change in deferred tax assets and liabilities. Deferred income taxes are provided using the current tax rate for differences between the tax basis of assets and liabilities and their carrying amounts for financial reporting purposes.
Stock Dividends and Treasury Stock
Shares of Sky Financial stock may be acquired for reissuance in connection with stock option plans, for future stock dividend declarations and for general corporate purposes. The treasury shares acquired are recorded at cost. The fair value of shares issued in stock dividends is transferred from retained earnings to common stock, to the extent of available retained earnings. Any excess of fair value over available retained earnings is considered a return of capital and thus is transferred from paid-in capital.
Stock-Based Compensation
Employee compensation expense under stock option plans is reported under the intrinsic value method. No stock based compensation cost is reflected in net income, as all options granted had an exercise price equal to or greater than the market price of the underlying common stock at grant date. The following table illustrates the effect on net income and earning per share if expense was measured using the fair value recognition provisions of FASB Statement No. 123 “Accounting for Stock Options.” Amounts in prior years have been restated to conform with current year’s presentation.
35
Notes to Consolidated Financial Statements
(Dollars in thousands, except per share data)
Note 1Summary of Significant Accounting Policies (continued)
| | | 2002
| | | 2001
| | | 2000
| |
Net income as reported | | $ | 127,807 | | | $ | 120,663 | | | $ | 114,373 | |
Pro forma impact | | | (2,629 | ) | | | (2,192 | ) | | | (1,913 | ) |
Pro forma net income | | | 125,178 | | | | 118,471 | | | | 112,460 | |
| | |
|
|
| |
|
|
| |
|
|
|
Basic earnings per share as reported | | $ | 1.53 | | | $ | 1.46 | | | $ | 1.35 | |
Pro forma impact | | | (.03 | ) | | | (.02 | ) | | | (.02 | ) |
Pro forma basic earnings per share | | | 1.50 | | | | 1.44 | | | | 1.33 | |
| | |
|
|
| |
|
|
| |
|
|
|
Diluted earnings per share as reported | | $ | 1.52 | | | $ | 1.45 | | | $ | 1.35 | |
Pro forma impact | | | (.03 | ) | | | (.02 | ) | | | (.03 | ) |
Pro forma diluted earnings per share | | | 1.49 | | | | 1.43 | | | | 1.32 | |
| | |
|
|
| |
|
|
| |
|
|
|
The pro forma effects are computed using option-pricing models, with the following weighted average assumptions as of the grant date:
| | | 2002
| | | 2001
| | | 2000
| |
Risk-free interest rate | | 5.15 | % | | 4.58 | % | | 6.13 | % |
Expected option life (years) | | 7.00 | | | 5.66 | | | 5.37 | |
Expected stock price volatility | | 28 | % | | 25 | % | | 26 | % |
Dividend yield | | 3.60 | % | | 4.27 | % | | 4.82 | % |
Statement of Cash Flows
Sky Financial considers cash on hand, deposits maintained with the Federal Reserve Bank and cash due from other banks, all of which are included in the caption “cash and due from banks,” as cash for purposes of the Statement of Cash Flows. Sky Financial reports net cash flows for federal funds sold and purchased, interest-bearing deposits with other financial institutions, client loan transactions, deposit transactions, repurchase agreements, and short-term borrowings.
Comprehensive Income
Comprehensive income consists of net income and other comprehensive income. Other comprehensive income includes unrealized gains and losses on securities available for sale and adjustments related to cash flow hedges that are also recognized as separate components of equity.
New Accounting Pronouncements
On December 31, 2002, the Financial Accounting Standards Board (FASB) issued Statement of Financial Accounting Standards issued (SFAS) No. 148. “Accounting for Stock-Based Compensation—Transition and Disclosure,” which amends SFAS No. 123, “Accounting for Stock-Based Compensation.” SFAS No. 148 provides alternative methods of transition for a voluntary change to the fair value based method of accounting for stock-based employee compensation. In addition, SFAS No. 148 requires disclosure of the pro forma effects of using the fair value based method of accounting for stock-based compensation and requires that these disclosures be included in interim as well as annual financial statements. The disclosure provisions of SFAS No. 148 were adopted on December 31, 2002 and did not have a material impact on Sky Financial.
In June 2001, the FASB issued SFAS No. 143, “Accounting for Asset Retirement Obligations.” This Statement addresses financial accounting and reporting for legal obligations associated with the sale, abandonment, disposal, recycling or other than temporary removal from service of tangible long-lived assets. SFAS No. 143 requires an asset retirement obligation to be recognized at fair value when it is incurred, if a reasonable estimate of its fair value can be made at the time. Otherwise, the obligation should be recorded as soon as its fair value can be reasonably estimated. This statement, which is effective for Sky Financial on January 1, 2003, is not expected to have a material impact on Sky Financial.
In June 2002, the FASB issued SFAS No. 146 “Accounting for Costs Associated with Exit or Disposal Activities.” This statement addresses the timing of recognition of a liability for exit and disposal costs at the time a liability is incurred, rather than at a plan commitment date, as previously required by US GAAP. Exit or disposal costs will be measured at the fair value and will be subsequently adjusted for changes in estimated cash flows. This statement is effective for Sky Financial beginning in fiscal 2003 and is not expected to have a material effect on Sky Financial.
In April 2002, the FASB issued SFAS No. 145, “Rescission of FASB Statements No. 4, 44, and 64, Amendment of FASB Statement No. 13, and Technical Corrections.” This Statement eliminates inconsistencies in the required accounting for sale-leaseback transactions. The adoption of SFAS No. 145 during May 2002 did not have a material effect on Sky Financial.
Effective January 1, 2002, Sky Financial adopted SFAS No. 144, “Accounting for the Impairment and Disposal of Long-Term Assets.” This Statement eliminates the requirement that the allocation of goodwill to long-lived assets be tested for impairment and details both a probability-weighted and “primary-asset” approach to estimate cash flows in testing for impairment of a long-lived asset. Adoption of SFAS No. 144 did not have a material effect on Sky Financial.
Effective January 1, 2002, Sky Financial adopted SFAS No. 142 “Goodwill and Other Intangible Assets” and SFAS No. 147 “Acquisition of Certain Financial Institutions.” In accordance with these standards, Sky Financial reclassified intangible assets associated with certain branch acquisitions to goodwill and ceased amortizing goodwill as of the date of adoption. Identifiable intangible assets with finite useful lives continue to
36
be amortized in accordance with Sky Financial’s accounting policies. Annual impairment testing is required for goodwill with impairment being recorded if the carrying amount of goodwill exceeds its implied fair value. See Note 6 for discussion of the impact of adopting these standards.
Effective July 1, 2001, Sky Financial adopted SFAS No. 141, “Business Combinations,” which requires all business combinations to be recorded using the purchase method of accounting for any transaction initiated after June 30, 2001. Under the purchase method, all identifiable tangible and intangible assets and liabilities of the acquired company must be recorded at fair value at date of acquisition, and the excess of cost over fair value of net assets acquired is recorded as goodwill.
Reclassifications
Certain items in the prior year financial statements were reclassified to conform to the current presentation.
Note 2Mergers, Acquisitions, Business Formations and Divestitures
On October 24, 2002, Sky Financial announced an agreement to acquire Metropolitan Financial Corp. (Metropolitan), a $1.5 billion savings and loan holding company headquartered in Highland Hills, Ohio, and its wholly-owned subsidiary, Metropolitan Bank and Trust Company. At the election of Metropolitan shareholders, between 55% and 70% of the Metropolitan shares will be exchanged for Sky Financial common stock and the remaining balance will be settled in cash. The transaction, currently valued at $78 million, is anticipated to close during the second quarter of 2003.
On October 1, 2002, Sky Financial acquired Three Rivers Bancorp (Three Rivers), a $1 billion bank holding company located in Monroeville, Pennsylvania and its wholly-owned subsidiary, Three Rivers Bank and Trust Company, by acquiring all of the outstanding capital stock of Three Rivers for a total purchase price of $136,626. The purchase price consisted of approximately 4,854,000 shares of Sky Financial common stock and cash of $41,799. The value of the common shares issued was determined based on the market price of Sky Financial’s common stock on the day that the final terms of the acquisition were agreed to and announced. The results of operations have been included in the consolidated financial statements since the date of acquisition. The acquisition complements Sky Financial’s operations in Western Pennsylvania by enhancing its presence in the Pittsburgh metropolitan area.
The following table presents the allocation of the acquisition cost for Three Rivers, including professional fees and other related acquisition costs, to assets acquired and liabilities assumed, based on their fair values:
Cash | | $ | 34,460 |
Loans | | | 592,284 |
Securities available for sale | | | 362,348 |
Premises and equipment | | | 12,625 |
Core deposit intangible assets | | | 20,130 |
Goodwill | | | 55,985 |
Other assets | | | 13,092 |
| | |
|
|
Total assets acquired | | $ | 1,090,924 |
| | |
|
|
Deposits | | | 770,250 |
FHLB advances | | | 173,907 |
Other liabilities | | | 10,141 |
| | |
|
|
Total liabilities acquired | | | 954,298 |
| | |
|
|
Net assets acquired | | $ | 136,626 |
| | |
|
|
The core deposit intangible assets are being amortized over 10 years.
The following (unaudited) pro forma consolidated results of operations have been prepared as if the acquisition of Three Rivers occurred as of January 1, 2001:
December 31,
| | 2002
| | 2001
|
Net interest income | | $ | 382,237 | | $ | 349,215 |
Net income | | | 135,186 | | | 130,746 |
Net income per share – Basic | | | 1.56 | | | 1.50 |
Net income per share – Diluted | | | 1.55 | | | 1.49 |
During 2002, Sky Financial recorded merger integration and restructuring charges totaling $3.1 million after tax related to the acquisition. See Note 16 for additional discussion. The pro forma information presented is for information purposes only and is not indicative of the results of operations that actually would have been achieved had the acquisition been consummated as of that time, nor is it intended to be a projection.
In April 2002, Sky Financial acquired Value Added Benefits, Ltd., a wholesale insurance agency headquartered in Cleveland, Ohio, for $1.9 million in cash.
In January 2002, Sky Financial completed the acquisition of Celaris Group, Inc., a full service insurance agency headquartered in Bowling Green, Ohio. In connection with the acquisition, Sky Financial paid $1 million in cash and issued .75 million shares of Sky Financial common stock. During the third quarter 2002, Value Added Benefits, Ltd. was merged into Celaris Group, Inc. In December 2002, Celaris Group, Inc. merged with Picton Cavanaugh, Inc. to form Sky Insurance, Inc. Prior operations of Celaris and Value Added Benefits are not material.
In September 2001, Sky Financial acquired Barney C. Guttman and Associates, Inc., an investment management and financial services firm for $0.6 million in cash, which was accounted for as a purchase.
On July 13, 2000, Sky Financial acquired the Meyer & Eckenrode Insurance Group, Inc., a full service insurance agency based in Carnegie, Pennsylvania. Meyer & Eckenrode shareholders received 0.66 million shares of Sky Financial common stock in a tax-free exchange accounted for as a purchase. Meyer & Eckenrode’s results of operations are included in Sky Financial’s consolidated statement of income from the date of acquisition. Prior results of operations were not material.
37
Notes to Consolidated Financial Statements
(Dollars in thousands, except per share data)
Note 2Mergers, Acquisitions, Business Formations and Divestitures (continued)
The following table summarizes Sky Financial’s acquisitions.
Entity
| | Location
| | Date
| | Total Assets
| | Cash Paid
| | Shares Issued
|
Three Rivers Bancorp, Inc. | | Monroeville, PA | | October 1, 2002 | | $ | 1.1 billion | | $ | 41.8 million | | 4.9 million |
Value Added Benefits, Ltd. | | Cleveland, OH | | April 9, 2002 | | | .1 million | | | 1.9 million | | — |
Celaris Group, Inc. | | Bowling Green, OH | | January 30, 2002 | | | 18.5 million | | | — | | .8 million |
Barney C. Guttman & Associates, Inc. | | Pittsburgh, PA | | September 24, 2001 | | | .6 million | | | .6 million | | — |
Meyer & Eckenrode Insurance Group, Inc. | | Carnegie, PA | | July 13, 2000 | | | 9.6 million | | | — | | .6 million |
Branch Acquisitions
On October 27, 2001, Sky Bank completed the acquisition of ten branch offices of Standard Federal Bank, F.S.B., representing total deposits of approximately $289 million. The purchase premium of $21,257 includes a $4,534 core deposit intangible and $16,723 of other intangibles. In accordance with SFAS 147, the other intangible assets were reclassified to goodwill and amortization ceased effective January 1, 2002.
Business Formations
Effective January 1, 2000, Sky Financial centralized its entire trust business into a newly-chartered trust company, Sky Trust. To facilitate the formation, the trust business of each bank affiliate and Mid Am Private Trust, N.A. was transferred to Sky Trust, and Mid Am Private Trust was merged into Sky Trust. Sky Trust, a wholly-owned subsidiary of Sky Financial, is headquartered in Pepper Pike, Ohio.
Business Divestitures
In March 2001, Sky Financial completed the sale of Sky Investments, Inc., its independent broker/dealer business. The sale resulted in a $0.6 million pre-tax gain.
In December 2000, Sky Financial sold substantially all of the assets of Sky Asset Management Services, Inc., its collection agency located in Clearwater, Florida. The sale resulted in a before-tax loss of $0.5 million, which is included in merger, integration and restructuring expense in the consolidated statement of income.
Note 3Securities Available for Sale
The estimated fair values and unrealized gains and losses of securities available for sale at year-end are as follows:
| | | Estimated Fair Value
| | Gross Unrealized Gains
| | Gross Unrealized Losses
| |
2002 | | | | | | | | | | |
U.S. Treasury and U.S. Government agencies and corporations | | $ | 466,564 | | $ | 9,735 | | $ | — | |
Obligations of states and political subdivisions | | | 15,242 | | | 205 | | | (176 | ) |
Corporate and other securities | | | 71,896 | | | 1,754 | | | (1,319 | ) |
Mortgage-backed securities | | | 1,584,861 | | | 37,956 | | | (197 | ) |
| | |
|
| |
|
| |
|
|
|
Total debt securities available for sale | | | 2,138,563 | | | 49,650 | | | (1,692 | ) |
Marketable equity securities | | | 108,618 | | | 4,884 | | | (1,451 | ) |
| | |
|
| |
|
| |
|
|
|
Total securities available for sale | | $ | 2,247,181 | | $ | 54,534 | | $ | (3,143 | ) |
| | |
|
| |
|
| |
|
|
|
2001 | | | | | | | | | | |
U.S. Treasury and U.S. Government agencies and corporations | | $ | 494,474 | | $ | 11,717 | | $ | (9 | ) |
Obligations of states and political subdivisions | | | 32,912 | | | 255 | | | (311 | ) |
Corporate and other securities | | | 75,744 | | | 527 | | | (2,864 | ) |
Mortgage-backed securities | | | 1,279,227 | | | 12,706 | | | (8,044 | ) |
| | |
|
| |
|
| |
|
|
|
Total debt securities available for sale | | | 1,882,357 | | | 25,205 | | | (11,228 | ) |
Marketable equity securities | | | 114,486 | | | 7,903 | | | (4,392 | ) |
| | |
|
| |
|
| |
|
|
|
Total securities available for sale | | $ | 1,996,843 | | $ | 33,108 | | $ | (15,620 | ) |
| | |
|
| |
|
| |
|
|
|
38
Note 3Securities Available for Sale (continued)
The estimated fair value of debt securities at December 31, 2002, by contractual maturity, are shown in the accompanying table. Expected maturities will likely differ from contractual maturities because some issuers have the right to call or prepay obligations with or without call or prepayment penalties.
| | | Estimated Fair Value
|
Due in one year or less | | $ | 40,839 |
Due after one year through five years | | | 437,243 |
Due after five years through ten years | | | 15,785 |
Due after ten years | | | 59,835 |
Mortgage-backed securities | | | 1,584,861 |
| | |
|
|
Total debt securities available for sale | | $ | 2,138,563 |
| | |
|
|
The gross realized gains and losses from the sales of securities are as follows:
| | | 2002
| | 2001
| | 2000
|
Gross realized gains on sales | | $ | 5,137 | | $ | 5,156 | | $ | 1,378 |
Gross realized losses on sales | | | 2,658 | | | 2,681 | | | 4,401 |
Securities pledged to secure public deposits and repurchase agreements totaled $1,858,602 and $1,421,276 at December 31, 2002 and 2001, respectively.
Note 4Loans and Allowance for Credit Losses
The loan portfolio at year-end was as follows:
| | | 2002
| | 2001
|
Real estate loans: | | | | | | |
Construction | | $ | 410,955 | | $ | 295,154 |
Residential mortgage | | | 1,614,048 | | | 1,464,572 |
Non-residential mortgage | | | 2,290,053 | | | 1,719,074 |
Commercial, financial and agricultural loans | | | 2,706,078 | | | 2,144,846 |
Installment and credit card loans | | | 864,387 | | | 850,343 |
| | |
|
| |
|
|
Total loans | | $ | 7,885,521 | | $ | 6,473,989 |
| | |
|
| |
|
|
Most of Sky Financial’s business activity is conducted through Sky Bank with clients in the respective local areas of the bank. These areas encompass parts of eastern Ohio, western Ohio, eastern Indiana, southeastern Michigan, western Pennsylvania and northern West Virginia. Sky Bank’s loan portfolio is diversified, consisting of commercial, residential, agribusiness, consumer and small business loans. In Sky Bank’s loan portfolio, no significant industry concentrations exist, and amounts related to highly leveraged transactions are not significant.
Sky Financial Solutions’ lending is conducted with clients throughout the United States. The SFS loan portfolio consists of commercial financing loans to healthcare professionals, primarily dentists. The SFS loan portfolio totaled $571,658 and $319,991 at December 31, 2002 and 2001, respectively.
Sky Financial evaluates each client’s creditworthiness on a case-by-case basis. The amount of collateral obtained is based on management’s evaluation of the client. Collateral held relating to commercial, financial, agricultural and commercial mortgages varies, but may include accounts receivable, inventory, property, plant and equipment, and income-producing commercial properties. Loans on which the accrual of interest has been discontinued totaled $70,058 and $34,104 at December 31, 2002 and 2001, respectively.
In the normal course of business, Sky Financial has made loans to certain directors, executive officers and their associates. Loan activity relating to these individuals for 2002 is as follows:
Aggregate balance – December 31, 2001 | | $ | 58,280 | |
New loans | | | 40,443 | |
Repayments | | | (39,240 | ) |
Other changes | | | (29,842 | ) |
| | |
|
|
|
Aggregate balance – December 31, 2002 | | $ | 29,641 | |
| | |
|
|
|
Other changes represent loans applicable to one reporting period that are excludable from the other reporting period. Activity in the allowance for credit losses was as follows:
| | | 2002
| | | 2001
| | | 2000
| |
Balance at beginning of year | | $ | 103,523 | | | $ | 93,261 | | | $ | 86,750 | |
Provision for credit losses | | | 43,577 | | | | 34,635 | | | | 22,250 | |
Recoveries | | | 6,844 | | | | 6,846 | | | | 8,214 | |
Allowance of acquired institution | | | 6,882 | | | | — | | | | — | |
Loans charged-off | | | (39,454 | ) | | | (31,219 | ) | | | (23,953 | ) |
| | |
|
|
| |
|
|
| |
|
|
|
Balance at end of year | | $ | 121,372 | | | $ | 103,523 | | | $ | 93,261 | |
| | |
|
|
| |
|
|
| |
|
|
|
Information regarding impaired loans is as follows:
| | | 2002
| | 2001
| | 2000
|
Year-end impaired loans with no allowance for credit losses allocated | | $ | — | | $ | — | | $ | 1,658 |
Year-end impaired loans with allowance for credit losses allocated | | | 53,041 | | | 18,032 | | | 7,141 |
Year-end allowance for credit losses allocated to impaired loans | | | 12,584 | | | 5,176 | | | 1,173 |
Average investment in impaired loans during the year | | | 45,198 | | | 17,519 | | | 9,378 |
Cash-basis interest income recognized during the year | | | 2,360 | | | 951 | | | 664 |
39
Notes to Consolidated Financial Statements
(Dollars in thousands, except per share data)
Note 5Premises and Equipment
Premises and equipment as of year end are summarized as follows:
| | | 2002
| | | 2001
| |
Land, buildings and improvements | | $ | 140,156 | | | $ | 127,393 | |
Equipment, furniture and fixtures | | | 131,676 | | | | 112,584 | |
Construction in process | | | 4,413 | | | | 5,000 | |
| | |
|
|
| |
|
|
|
Total premises and equipment | | | 276,245 | | | | 244,977 | |
Less accumulated depreciation and amortization | | | (142,889 | ) | | | (132,840 | ) |
| | |
|
|
| |
|
|
|
Premises and equipment, net | | $ | 133,356 | | | $ | 112,137 | |
| | |
|
|
| |
|
|
|
Included in premises and equipment are buildings, land and land improvements that secure capitalized leases with a cost of $2,989 and $4,299, less accumulated amortization and depreciation of $2,208 and $3,697 at December 31, 2002 and 2001, respectively. Rental payments for land are treated as operating lease expense. Total rent expense amounted to $5,642 in 2002, $3,530 in 2001, and $3,286 in 2000.
Note 6Goodwill and Intangible Assets
Net goodwill at December 31, 2002 and 2001, was $108,776 and $33,912 respectively.
Net goodwill activity by segment during 2002 was as follows:
| | | Community Banking
| | Financial Services Affiliates
| | Total
|
Balance at January 1, 2002 | | $ | 23,134 | | $ | 10,778 | | $ | 33,912 |
Acquired Goodwill | | | 55,985 | | | 18,879 | | | 74,864 |
| | |
|
| |
|
| |
|
|
Balance at December 31, 2002 | | $ | 79,119 | | $ | 29,657 | | $ | 108,776 |
| | |
|
| |
|
| |
|
|
Effective January 1, 2002, Sky Financial adopted new accounting guidance changing post-acquisition accounting for goodwill and certain intangible assets. In accordance with this guidance, goodwill is not amortized but is reviewed annually for impairment. Sky Financial completed the initial impairment test required by the new guidance during the second quarter of 2002 and determined that goodwill recorded at January 1, 2002 is not impaired. The following table presents a reconciliation between originally reported net income adjusted for the effect of the new accounting pronouncement:
| | | 2002
| | 2001
| | 2000
|
Reported net income | | $ | 127,807 | | $ | 120,663 | | $ | 114,373 |
Effect of goodwill amortization expense (net of tax) | | | — | | | 1,877 | | | 1,642 |
| | |
|
| |
|
| |
|
|
Net income adjusted | | $ | 127,807 | | $ | 122,540 | | $ | 116,015 |
| | |
|
| |
|
| |
|
|
| | | 2002
| | 2001
| | 2000
|
| | | Basic
| | Diluted
| | Basic
| | Diluted
| | Basic
| | Diluted
|
Reported net income | | $ | 1.53 | | $ | 1.52 | | $ | 1.46 | | $ | 1.45 | | $ | 1.35 | | $ | 1.35 |
Goodwill amortization | | | — | | | — | | | .02 | | | .02 | | | .02 | | | .02 |
| | |
|
| |
|
| |
|
| |
|
| |
|
| |
|
|
Adjusted net income | | $ | 1.53 | | $ | 1.52 | | $ | 1.48 | | $ | 1.47 | | $ | 1.37 | | $ | 1.37 |
| | |
|
| |
|
| |
|
| |
|
| |
|
| |
|
|
Included in goodwill amortization for 2001 is $230 ($150 after tax) related to goodwill amortization of branch acquisitions. Other intangible assets at December 31, 2002 and 2001 were $43,903 and $26,799, respectively, net of accumulated amortization of $3,966 and $5,296, respectively. These assets consist primarily of core deposits intangibles and are continuing to be amortized in accordance with Sky Financial’s policy. Amortization expense related to the intangible assets was $4,033 and $3,020 during 2002 and 2001, respectively. For the years ended December 31, 2003 through 2007, estimated future amortization expense is approximately $3,806 per year.
40
Note 7Interest-Bearing Deposits
Total interest-bearing deposits as presented on the balance sheet are comprised of the following classifications at year-end:
| | | 2002
| | 2001
|
Interest-bearing demand | | $ | 132,272 | | $ | 147,695 |
Savings | | | 2,816,863 | | | 2,241,303 |
Time | | | | | | |
In denominations under $100,000 | | | 2,533,802 | | | 2,414,408 |
In denominations of $100,000 or more | | | 1,135,466 | | | 916,335 |
| | |
|
| |
|
|
Total interest-bearing deposits | | $ | 6,618,403 | | $ | 5,719,741 |
| | |
|
| |
|
|
At December 31, 2002, the scheduled maturities of time deposits are as follows:
2003 | | $ | 2,135,840 |
2004 | | | 723,168 |
2005 | | | 213,435 |
2006 | | | 368,590 |
2007 | | | 214,354 |
Thereafter | | | 13,881 |
| | |
|
|
| | | $ | 3,669,268 |
| | |
|
|
Note 8Securities Sold Under Repurchase Agreements and Federal Funds Purchased
Sky Financial has retail repurchase agreements with clients within its local market areas, as well as federal funds purchased from other banks. These borrowings are collateralized with securities owned by Sky Bank and held in its safekeeping accounts at independent correspondent banks.
Sky Financial also has repurchase agreements with brokerage firms that are in possession of the underlying securities. The securities are returned to Sky Financial at the maturity of the agreements.
The following table summarizes certain information relative to these borrowings:
| | | 2002
| | | 2001
| |
Outstanding at year-end | | $ | 795,125 | | | $ | 685,450 | |
Weighted average interest rate at year-end | | | 2.24 | % | | | 3.28 | % |
Maximum amount outstanding as of any month-end | | $ | 890,920 | | | $ | 776,422 | |
Average amount outstanding | | | 732,230 | | | | 695,527 | |
Approximate weighted average interest rate during the year | | | 2.65 | % | | | 3.97 | % |
Included in the above as of December 31, 2002, are repurchase agreements in excess of one year as summarized below:
| | | | | Weighted Average Life in Years Based on Stated Maturity
| | Weighted Average Life in Years Based on Call Dates
|
Stated maturity in 2006 | | $ | 45,000 | | 3.1 | | 0.4 |
Stated maturity in 2008 | | | 139,000 | | 5.5 | | 0.1 |
Stated maturity in 2011 | | | 30,000 | | 8.1 | | 1.1 |
| | |
|
| |
| |
|
Total repurchase agreements in excess of one year | | $ | 214,000 | | 5.4 | | 0.3 |
| | |
|
| |
| |
|
The weighted average rate on repurchase agreements in excess of one year was 5.38% at December 31, 2002 and 2001.
At December 31, 2001, repurchase agreements in excess of one year were $214,000 with a weighted average life based on stated maturity of 6.4 years and a weighted average life based on call dates of 0.6 years
41
Notes to Consolidated Financial Statements
(Dollars in thousands, except per share data)
Note 9Debt and Federal Home Loan Bank Advances
Sky Financial’s debt and Federal Home Loan Bank (“FHLB”) advances are comprised of the following at year-end:
| | | 2002
| | 2001
|
Borrowings under bank lines of credit | | $ | 59,149 | | $ | 89,161 |
Asset-backed notes | | | | | | |
2001-A, Class A-1, due December 2011 at 6.425% | | | 26,547 | | | 36,155 |
2001-A, Class A-2, due December 2011 at 6.95% | | | 45,000 | | | 45,000 |
2001-B, Class A-1, due July 2012 at 5.55% | | | 43,036 | | | 54,215 |
2001-B, Class A-2, due July 2012 at 6.39% | | | 49,760 | | | 49,760 |
2001-C, Class A-1, due January 2013 at 4.555% | | | 28,568 | | | 33,000 |
2001-C, Class A-2, due January 2013 at 5.925% | | | 72,000 | | | 72,000 |
2002-A, Class A-1, due July 2018 at 5.398% | | | 59,160 | | | — |
2002-A, Class A-2, due July 2018 at 6.705% | | | 90,000 | | | — |
2002-B, Class A-1, due November 2012 at 2.682% (variable) | | | 119,629 | | | — |
Borrowings under FHLB lines of credit at weighted interest rate of 3.65% for 2002 | | | 773,378 | | | 662,216 |
Subordinated note at 7.08%, due January 2008 | | | 50,000 | | | 50,000 |
Subordinated note at 6.125%, due October 2012 | | | 65,000 | | | — |
Obligated mandatorily redeemable capital securities of subsidiary trusts: | | | | | | |
Interest at 9.875%, due February 2027 | | | 27,901 | | | 25,000 |
Interest at 10.20%, due June 2027 | | | 24,437 | | | 23,600 |
Interest at 9.34%, due May 2030 | | | 64,154 | | | 60,000 |
Capital lease obligations | | | 1,526 | | | 1,496 |
Other items | | | 1,505 | | | 2,542 |
| | |
|
| |
|
|
Total | | $ | 1,600,750 | | $ | 1,204,145 |
| | |
|
| |
|
|
FHLB advances are collateralized by all shares of FHLB stock owned by the subsidiary bank and by 100% of the subsidiary bank’s qualified residential mortgage loans. Based on the carrying amount of FHLB stock owned by the subsidiary bank, total FHLB advances are limited to approximately $861,137, subject to the availability of qualified residential mortgage loans for pledging.
At December 31, 2002, required annual principal payments on debt and FHLB advances are presented below. Because repayment of the asset-backed notes is based on the cash flows of loans that will likely pay off before their contractual maturity, the expected maturity of the asset-backed notes is less than contractual maturity.
2003 | | $ | 541,589 |
2004 | | | 95,798 |
2005 | | | 181,731 |
2006 | | | 86,887 |
2007 | | | 84,599 |
Thereafter | | | 610,146 |
| | |
|
|
| | | $ | 1,600,750 |
| | |
|
|
During September 2002, Sky Bank sold $65,000 in subordinated note arrangements in a private transaction pursuant to an applicable exemption from registration under the Securities Act of 1933. Sky Bank used the proceeds to pay down certain subordinated indebtedness owed to Sky Financial. Sky Financial used some of the proceeds received from Sky Bank to fund the cash payment due Three Rivers Bancorp, Inc. shareholders (see Note 2) and for general working capital purposes.
On August 16, 2000, Sky Financial, through one of its affiliates, entered into a conduit warehousing facility to provide interim funding for certain commercial loans until term funding is obtained through the issuance of asset-backed notes. Under this facility, an unrelated financial institution is providing up to $125,000 through a commitment period ending August 16, 2003. Depending on how the lender funds the facility, interest on a particular advance is accrued based on a rate equal to either the lender’s commercial paper borrowing rate or the sum of 1.75% and the average of the London Interbank Offering Rate (LIBOR), as adjusted. In addition to interest, annual fees associated with the facility include 0.90% of the outstanding advances plus 0.30% of the unused principal amount of the facility. Interest rate swaps are entered into during the warehousing period to fix the effective interest rate of debt used to fund the commercial loans. These swaps are accounted for as cash flow hedges. A total of $19,161 was outstanding on this facility at year end 2001 at a weighted average rate of 2.375%. No amounts were outstanding at December 31, 2002.
Associated with the conduit warehousing facility, Sky Financial entered into a standby letter of credit with a financial institution in the amount of $11,250 with an expiration of August 15, 2003. The agreement contains covenants that require Sky Financial, among other things, to maintain minimum tangible net worth, as defined, of $450,000 and a positive net income during each fiscal year. Sky Financial, through one of its affiliates, issued $150,000 of fixed-interest-rate asset-backed notes and $119,629 of variable-rate asset-backed notes in 2002 and $150,000 of fixed interest rate asset backed notes in 2001 to provide term funding for the commercial loans.
Sky Financial maintains a credit facility with a group of financial institutions in the form of a short-term line of credit. This line of credit is subject to renewal on an annual basis. The commitment on the line was $120,000 in 2002 and $95,000 in 2001. Interest on advances taken on the facility is accrued at either the lead financial institution’s prime rate, a formula based on the LIBOR, or a formula based on the federal funds rate. Sky Financial may elect the interest rate method to be applied to amounts outstanding in $100 increments. The agreement provides for a quarterly fee of .125% on the commitment amount of the credit facility. The agreement contains convenants that require Sky Financial, among other things, to maintain a minimum tangible net worth of $625,000 as defined by the agreement, minimum specified capital ratios, and acceptable levels of asset quality. The average amount outstanding in 2002 was $75,841, with an average cost of 1.51%, compared to $53,803, with an average cost of 4.51% in 2001.
42
Note 9Debt and Federal Home Loan Bank Advances (continued)
Beginning in 1997, Sky Financial has issued obligated mandatorily redeemable capital securities through fully consolidated subsidiaries in private placements. The amounts of these capital securities in the table represent the par value adjusted for any unamortized discount or other basis adjustments related to hedging the debt with derivative instruments. See Notes 1 and 10 for further discussion on derivative instruments. The debts are redeemable after a certain date at their stated face values or at a premium if redemption occurs before that date. The following table summarizes the issuance date, par value, interest rate, redemption price, redemption date and hedge adjusted weighted average interest price for the mandatorily redeemable capital securities at December 31, 2002:
| | | Issuance Date
| | Par Value
| | Interest Rate
| | | Redemption Price
| | | Redemption Date
| | Hedge Weighted Average
| |
Sky Financial Capital Trust I | | March 31, 2000 | | $ | 60,000 | | 9.340 | % | | 104.67 | % | | May 1, 2010 | | 4.91 | % |
Mid Am Capital Trust I | | June 30, 1997 | | $ | 23,600 | | 10.200 | % | | 105.10 | % | | June 1, 2007 | | 5.67 | % |
First Western Capital Trust I | | February 11, 1997 | | $ | 25,000 | | 9.875 | % | | 104.94 | % | | February 1, 2007 | | 4.96 | % |
On January 16, 1998, Mid Am, Inc., a merged affiliate, issued $50,000 of 7.08% subordinated debt in a private placement transaction. The subordinated debt matures in 2008. For regulatory capital purposes, the subordinated debt is considered Tier II capital.
Sky Financial maintained letters of credit from two third-party financial institutions supporting a credit enhancement for loans sold by SFS. These letters of credit totaled $16,500.
Note 10Derivative Instruments and Hedging Activities
Sky Financial’s hedging policies permit the use of interest rate swaps, caps and floors to manage interest rate risk or to hedge specified assets and liabilities. Sky Financial uses derivative instruments, primarily interest rate swaps, to manage interest rate risk and match the rates on certain assets by hedging the fair value of certain fixed-rate debt, which converts the debt to variable rates and by hedging the cash flow variability associated with certain variable rate debt by converting the debt to fixed rates.
Fair Value Hedges –Interest Rate Swaps
During March 2002, Sky Financial entered into interest rate swap arrangements to exchange the fixed rate of borrowings on $35,000 of the 9.34% trust preferred security due May 2030 and $25,000 of the 9.875% trust preferred security due February 2027 for variable rate payments based on LIBOR. During September 2002, Sky Financial entered into interest rate swap arrangements to exchange the fixed rate of borrowings on $23,600 of the 10.20% trust preferred security due June 2027 and the remaining $25,000 of the 9.34% trust preferred due May 2030 to variable rate payments based on LIBOR. The interest rate swaps involve no exchange of principal either at inception or maturity and have maturities and call options identical to the trust preferred security agreements. The arrangements have been designated as fair value hedges. The swaps are carried at their fair value and the carrying amount of the trust preferred securities includes the change in their fair values since the inception of the hedge. Because the hedging arrangement is considered highly effective, changes in the swap’s fair values exactly offset the corresponding changes in the fair value of the trust preferred securities and, as a result, the change in fair value does not result in an impact on net income.
Cash Flow Hedges –Interest Rate Swaps
During December 2002 and 2001, Sky Financial entered into various amortizing interest rate swaps, whereby it pays a fixed rate of interest and receives a variable rate based on LIBOR. The swap is designed to fix the rate on borrowings of $119,629 and $19,161 at December 31, 2002 and 2001. The swap is considered to be highly effective. Accordingly, any change in the swap’s fair value is recorded in other comprehensive income, net of tax.
Interest Rate Caps
Sky Financial has entered into two interest rate cap arrangements, and paid $1,456 to hedge its market risk on $48.6 million of federal funds purchased. The interest rate caps are designed to offset the impact of changes in the federal fund purchased rate above the weighted average stated rate of 5.90%, and, as such, is considered to be highly effective. Accordingly, any change in the market value is recorded in other comprehensive income. The interest rate caps, with notional amounts of $23,600 and $25,000 mature in June 2007 and May 2010, respectively, and have a fair value of $780 at December 13, 2002.
Management believes that all hedging transactions will remain fully effective during 2003 and, as such, no material amounts are expected to be reclassified to income from other comprehensive income due to ineffectiveness.
The following table presents the contract/notional and fair value amounts of all derivative transactions at December 31, 2002 and 2001:
| | | Notional Amount
| | Fair Value
| | | Fixed Rate
| | | Variable Rate
| | | Maturity Years
|
At December 31, 2002 | | | | | | | | | | | | | | | |
Interest rate swaps | | | | | | | | | | | | | | | |
Fair value hedges | | $ | 108,600 | | $ | 7,891 | | | 9.65 | % | | 5.09 | % | | 26.02 |
Cash flow hedges | | | 121,429 | | | 91 | | | 3.78 | | | 1.38 | | | 12.00 |
Interest rate caps | | | 48,600 | | | 780 | | | | | | | | | 6.00 |
| | |
|
| |
|
|
| |
|
| |
|
| |
|
At December 31, 2001 | | | | | | | | | | | | | | | |
Interest rate swaps | | | | | | | | | | | | | | | |
Cash flow hedges | | $ | 6,379 | | $ | (73 | ) | | 5.20 | % | | 1.94 | % | | 9.00 |
| | |
|
| |
|
|
| |
|
| |
|
| |
|
43
Notes to Consolidated Financial Statements
(Dollars in thousands, except per share data)
Note 11Income Taxes
Income taxes consisted of the following:
| | | 2002
| | | 2001
| | | 2000
| |
Current | | | | | | | | | | | | |
Federal | | $ | 65,574 | | | $ | 54,770 | | | $ | 51,762 | |
State and local | | | 196 | | | | 92 | | | | (172 | ) |
| | |
|
|
| |
|
|
| |
|
|
|
| | | | 65,770 | | | | 54,862 | | | | 51,590 | |
| | |
|
|
| |
|
|
| |
|
|
|
Deferred | | | | | | | | | | | | |
Federal | | | (2,389 | ) | | | 4,472 | | | | 2,133 | |
State and local | | | (13 | ) | | | (15 | ) | | | 1 | |
| | |
|
|
| |
|
|
| |
|
|
|
| | | | (2,402 | ) | | | 4,457 | | | | 2,134 | |
| | |
|
|
| |
|
|
| |
|
|
|
Total provision for income taxes | | $ | 63,368 | | | $ | 59,319 | | | $ | 53,724 | |
| | |
|
|
| |
|
|
| |
|
|
|
The sources of gross deferred tax assets and liabilities were as follows at year end:
| | | 2002
| | | 2001
| | | 2000
| |
Items giving rise to deferred tax assets: | | | | | | | | | | | | |
Allowance for loan losses in excess of tax reserve | | $ | 41,969 | | | $ | 35,108 | | | $ | 30,903 | |
Merger, integration and restructuring expense | | | 1,867 | | | | 352 | | | | 1,924 | |
Intangible assets | | | 8,166 | | | | 8,797 | | | | 9,182 | |
Deferred compensation | | | 8,140 | | | | 7,633 | | | | 7,838 | |
Unrealized loss on securities available for sale | | | — | | | | — | | | | 2,067 | |
Cash flow hedge | | | 2,862 | | | | 3,126 | | | | — | |
Other | | | 4,110 | | | | 5,015 | | | | 6,876 | |
| | |
|
|
| |
|
|
| |
|
|
|
| | | | 67,114 | | | | 60,031 | | | | 58,790 | |
| | |
|
|
| |
|
|
| |
|
|
|
Items giving rise to deferred tax liabilities: | | | | | | | | | | | | |
Depreciation | | | (366 | ) | | | (246 | ) | | | — | |
FHLB stock dividends | | | (7,606 | ) | | | (6,522 | ) | | | (5,295 | ) |
Mortgage servicing rights | | | (5,960 | ) | | | (5,955 | ) | | | (5,113 | ) |
Unrealized gain on securities available for sale | | | (17,986 | ) | | | (6,121 | ) | | | — | |
Net deferred loan fees and cost | | | (5,195 | ) | | | (3,225 | ) | | | (95 | ) |
Purchase accounting adjustments | | | (4,541 | ) | | | — | | | | — | |
Other | | | (796 | ) | | | (1,020 | ) | | | (1,826 | ) |
| | |
|
|
| |
|
|
| |
|
|
|
| | | | (42,450 | ) | | | (23,089 | ) | | | (12,329 | ) |
| | |
|
|
| |
|
|
| |
|
|
|
Net deferred tax asset | | $ | 24,664 | | | $ | 36,942 | | | $ | 46,461 | |
| | |
|
|
| |
|
|
| |
|
|
|
Sky Financial has sufficient taxes paid in current and prior years to warrant recording the full deferred tax asset without a valuation allowance.
Total federal income tax expense differs from the expected amounts computed by applying the statutory federal tax rate of 35% to income before taxes. The reasons for this difference are as follows:
| | | 2002
| | | 2001
| | | 2000
| |
| | | Amount
| | | Tax Rate
| | | Amount
| | | Tax Rate
| | | Amount
| | | Tax Rate
| |
Income tax expense based upon the federal statutory rate on income before income taxes | | $ | 66,911 | | | 35.0 | % | | $ | 62,994 | | | 35.0 | % | | $ | 58,834 | | | 35.0 | % |
Tax exempt income | | | (1,691 | ) | | (0.9 | ) | | | (1,778 | ) | | (1.0 | ) | | | (3,426 | ) | | (2.0 | ) |
Bank-owned life insurance earnings | | | (1,912 | ) | | (1.0 | ) | | | (1,849 | ) | | (1.0 | ) | | | (1,916 | ) | | (1.1 | ) |
Other | | | 60 | | | 0.0 | | | | (48 | ) | | 0.0 | | | | 232 | | | .1 | |
| | |
|
|
| |
|
| |
|
|
| |
|
| |
|
|
| |
|
|
| | | $ | 63,368 | | | 33.1 | % | | $ | 59,319 | | | 33.0 | % | | $ | 53,724 | | | 32.0 | % |
| | |
|
|
| |
|
| |
|
|
| |
|
| |
|
|
| |
|
|
Tax expense (benefit) attributable to securities gains and losses totaled $868, $866, and $(1,058) in 2002, 2001 and 2000.
44
Note 12Other Comprehensive Income
Other comprehensive income consisted of the following:
| | | 2002
| | | 2001
| | | 2000
| |
Other comprehensive income | | | | | | | | | | | | |
Securities available for sale: | | | | | | | | | | | | |
Unrealized gains arising during period | | $ | 36,382 | | | $ | 25,871 | | | $ | 41,317 | |
Reclassification adjustment for (gains) losses included in income | | | (2,479 | ) | | | (2,475 | ) | | | 3,023 | |
Cash flow hedge derivatives: | | | | | | | | | | | | |
Adoption of SFAS No. 133 | | | — | | | | (1,231 | ) | | | — | |
Change in fair value on cash flow hedge derivatives | | | (2,402 | ) | | | (8,474 | ) | | | — | |
Amounts reclassified to interest expense | | | 3,155 | | | | 775 | | | | — | |
| | |
|
|
| |
|
|
| |
|
|
|
Total | | | 34,656 | | | | 14,466 | | | | 44,340 | |
Tax effect | | | (12,130 | ) | | | (5,063 | ) | | | (15,520 | ) |
| | |
|
|
| |
|
|
| |
|
|
|
Total other comprehensive income (loss) | | $ | 22,526 | | | $ | 9,403 | | | $ | 28,820 | |
| | |
|
|
| |
|
|
| |
|
|
|
At December 31, 2002, accumulated other comprehensive income, net of tax, includes $(4,069) related to cash flow hedging activities, of which $60 relates to cash flow hedges with outstanding interest rate swaps at year-end, $(4,636) relates to forecasted transactions that are being reclassified out of other comprehensive income and recognized as interest expense over the life of the related transaction and $507 relates to interest rate caps. During 2003, $1,947 ($1,265 net of tax) of this amount is expected to be recognized as interest expense.
Note 13Earnings Per Common Share
Basic earnings per share is computed by dividing net income by the weighted average number of shares outstanding during the period, as restated for shares issued for stock dividends. Diluted earnings per share is computed using the weighted average number of shares determined for the basic computation plus the dilutive effect of potential common shares issuable under stock options.
Basic and diluted earnings per share computations were as follows:
| | | 2002
| | 2001
| | 2000
|
Numerator | | | | | | | | | |
Net income (basic and diluted) | | $ | 127,807 | | $ | 120,663 | | $ | 114,373 |
| | |
|
| |
|
| |
|
|
Denominator | | | | | | | | | |
Weighted-average common shares outstanding (basic) | | | 83,439,000 | | | 82,449,000 | | | 84,604,000 |
Dilutive effect of stock options | | | 657,000 | | | 579,000 | | | 363,000 |
| | |
|
| |
|
| |
|
|
Weighted-average common shares outstanding (diluted) | | | 84,096,000 | | | 83,028,000 | | | 84,967,000 |
| | |
|
| |
|
| |
|
|
Earnings Per Common Share | | | | | | | | | |
Basic | | $ | 1.53 | | $ | 1.46 | | $ | 1.35 |
Diluted | | | 1.52 | | | 1.45 | | | 1.35 |
Weighted shares under option of 2,113,000, 1,780,000 and 3,192,000 were excluded from the diluted earnings per share calculation in 2002, 2001 and 2000, respectively, as they were anti-dilutive.
45
Notes to Consolidated Financial Statements
(Dollars in thousands, except per share data)
Note 14Fair Values of Financial Instruments
The following table shows carrying values and the related estimated fair values of financial instruments at year end. Items that are not financial instruments are not included.
| | | 2002
| | | 2001
| |
| | | Carrying Amounts
| | | Estimated Fair Value
| | | Carrying Amounts
| | | Estimated Fair Value
| |
Financial Assets: | | | | | | | | | | | | | | | | |
Cash and due from banks | | $ | 253,172 | | | $ | 253,172 | | | $ | 272,196 | | | $ | 272,196 | |
Interest-bearing deposits with other financial institutions | | | 61,345 | | | | 61,345 | | | | 39,171 | | | | 39,171 | |
Federal funds sold | | | 11,100 | | | | 11,100 | | | | 8,000 | | | | 8,000 | |
Securities available for sale | | | 2,247,181 | | | | 2,247,181 | | | | 1,996,843 | | | | 1,996,843 | |
Loans held for sale and loans, net of the allowance for credit losses | | | 7,833,482 | | | | 7,924,599 | | | | 6,455,940 | | | | 6,661,261 | |
Accrued interest receivable | | | 78,964 | | | | 78,964 | | | | 62,421 | | | | 62,421 | |
Financial Liabilities: | | | | | | | | | | | | | | | | |
Deposits | | | (7,615,420 | ) | | | (7,593,855 | ) | | | (6,542,177 | ) | | | (6,593,025 | ) |
Securities sold under repurchase agreements and federal funds purchased | | | (795,125 | ) | | | (824,458 | ) | | | (685,450 | ) | | | (722,923 | ) |
Debt, FHLB advances and trust preferred securities | | | (1,600,750 | ) | | | (1,675,405 | ) | | | (1,202,649 | ) | | | (1,222,199 | ) |
Accrued interest payable | | | (25,925 | ) | | | (25,925 | ) | | | (19,308 | ) | | | (19,308 | ) |
Derivative Financial Instruments: | | | | | | | | | | | | | | | | |
Interest rate swaps | | | 7,982 | | | | 7,982 | | | | (73 | ) | | | (73 | ) |
Interest rate caps | | | 780 | | | | 780 | | | | — | | | | — | |
For purposes of the above disclosures of estimated fair value, the following assumptions were used: the carrying values for cash and due from banks, federal funds sold, interest-bearing deposits in other financial institutions and accrued interest were considered to approximate fair value; the estimated fair value for securities was based on quoted market values for the individual securities or for equivalent securities; carrying value is considered to approximate fair value for loans that contractually reprice at intervals of less than six months; the estimated fair value for other loans was based on estimates of the rate Sky Financial would charge for similar loans at December 31, 2002 and 2001, applied over estimated payment periods; the estimated fair value for demand and savings deposits was based on their carrying value; the estimated fair value for certificates of deposit and borrowings was based on estimates of the rate Sky Financial would pay on such obligations at December 31, 2002 and 2001, applied for the time period until maturity. The fair value of interest rate swaps and caps represents the estimated amount the company would receive or pay to terminate the agreements, considering current interest rates, as well as the current credit-worthiness of the counterparties. The capital lease obligations of $1,526 and $1,496 at December 31, 2002 and 2001 are not included in the fair value disclosures. The estimated fair value of commitments were not material.
While these estimates of fair values are based on management’s judgment of appropriate factors, there is no assurance that, if Sky Financial had disposed of such items at December 31, 2002 or 2001, the estimated fair values would necessarily have been achieved at that date, since market values may differ depending on various circumstances. The estimated fair values at December 31, 2002 and 2001 should not necessarily be considered to apply at subsequent dates.
In addition, other assets and liabilities of Sky Financial that are not defined as financial instruments were excluded from the above disclosures, such as property and equipment and life insurance contracts. In addition, non-financial instruments typically not recognized in financial statements (but which may have value) were not included in the above disclosures. These include, among other items, the estimated earning power of core deposit accounts, the value of a trained work force, client goodwill, and similar items.
46
Note 15Other Income and Other Operating Expense
The following is a summary of other income and other operating expense:
| | | 2002
| | 2001
| | 2000
|
Other Income | | | | | | | | | |
International department fees | | $ | 1,544 | | $ | 1,766 | | $ | 1,248 |
Transaction fees | | | 7,666 | | | 7,139 | | | 6,650 |
Merchant income | | | 3,559 | | | 3,351 | | | 3,378 |
Gain on sale of deposits and branch offices | | | — | | | — | | | 560 |
Gains on sales of credit card accounts and other loans | | | — | | | — | | | 1,681 |
Income from bank-owned life insurance | | | 5,817 | | | 5,435 | | | 5,323 |
Other | | | 15,405 | | | 11,769 | | | 13,112 |
| | |
|
| |
|
| |
|
|
Total other income | | $ | 33,991 | | $ | 29,460 | | $ | 31,952 |
| | |
|
| |
|
| |
|
|
Other Operating Expense | | | | | | | | | |
Brokerage commissions | | $ | 208 | | $ | 2,107 | | $ | 11,973 |
State franchise taxes | | | 3,411 | | | 7,067 | | | 7,097 |
Printing and supplies | | | 5,020 | | | 5,004 | | | 5,149 |
Legal and other professional fees | | | 7,855 | | | 8,127 | | | 6,747 |
Telephone | | | 6,278 | | | 5,648 | | | 5,939 |
Loan costs | | | 5,743 | | | 4,390 | | | 3,761 |
Marketing | | | 7,755 | | | 7,155 | | | 6,825 |
Amortization of intangible assets | | | 4,033 | | | 4,897 | | | 4,831 |
Other | | | 34,205 | | | 30,599 | | | 24,257 |
| | |
|
| |
|
| |
|
|
Total other operating expense | | $ | 74,508 | | $ | 74,994 | | $ | 76,579 |
| | |
|
| |
|
| |
|
|
Note 16Merger, Integration and Restructuring Expenses
In 2002, Sky Financial recorded merger, integration and restructuring charges totaling $10,437 ($6,784 after tax or $.08 per diluted share), which consisted of $4,784 ($3,110 after tax or $.04 per diluted share) related to the acquisition of Three Rivers Bancorp and $5,653 ($3,674 after tax or $.04 per diluted share) related to Sky Financial’s implementation of a new technology platform company-wide.
Pre-tax merger, integration and restructuring costs incurred during 2002 for the Three Rivers acquisition included severance and other related employee costs of $2,005, conversion out-sourcing costs of $405, transaction costs of $233, lease termination costs of $203, marketing and communication expenses of $150 and other merger and integration-related costs of $1,788. During 2002, approximately $3,653 of these charges were paid, with the remaining charges to be settled during 2003.
Pre-tax merger, integration and restructuring costs incurred during 2002 for Sky Financial’s new technology platform implementation included severance and other related employee costs of $1,663, valuation adjustments of property, equipment and other assets of $851, marketing and communication expenses of $500, lease termination costs of $676 and other merger and integration-related costs of $1,963. All costs were paid during 2002.
During 2002, 169 positions were eliminated as part of the integration of Three Rivers Bancorp and the new technology platform and processes implementation. Of this total, 18 accepted transfers to other positions, 13 accepted outside employment and 138 were involuntarily terminated with severance.
In 2001, Sky Financial recorded merger, integration and restructuring charges totaling $750 ($487 after tax or $.01 per diluted share) associated with the acquisition of $289 million in deposits and ten locations from Standard Federal Bank in October 2001. Included in the pre-tax total are valuation adjustments of property, equipment and other assets of $434, transaction costs of $3, marketing and communication expenses of $174 and other merger and integration-related costs of $139. The transaction and integration of the branches were completed in 2001
Also during 2001, Sky Financial incurred severance and other related employee costs of $49 ($32 after-tax) associated with the reorganization of Sky Financial’s financial service affiliates. These costs were paid during 2001.
In 2000, Sky Financial recorded merger, integration and restructuring charges totaling $3,792 ($2,465 after tax or $.03 per diluted share) associated with Mid Am Bank and The Ohio Bank officially changing their names to Sky Bank as announced in December of 2000. Included in the pre-tax total were severance and other related employee costs of $721, valuation adjustments of property, equipment and other assets of $810, communication expenses of $800, product standardization costs of $305 and other merger and integration-related costs of $1,156. Costs associated with the name change were paid during the first quarter of 2001.
Also recognized during 2000 were transaction costs of $75 ($49 after tax) taken as part of the reorganization of its financial service affiliates in late 2000, which, as previously stated, was completed in 2001.
47
Notes to Consolidated Financial Statements
(Dollars in thousands, except per share data)
Note 16Merger,Integration and Restructuring Expenses (continued)
Asset valuation adjustments were comprised of charges to reflect, at fair market value, redundant premises and equipment planned for disposal and the current valuation of intangible assets related to the mergers. The impairment of these assets results from the significant change in the extent or manner of their use and their relative value to the merged corporation. Fair values for significant fixed assets were determined by professional appraisal.
The following is a summary of activity in the merger, integration and restructuring liability for 2002 and 2001:
| | | 2002
| | | 2001
| |
Beginning balance | | $ | 4,208 | | | $ | 7,248 | |
Accruals | | | 10,437 | | | | 799 | |
Balance from acquired entity | | | 2,973 | | | | — | |
Cash payments | | | (11,837 | ) | | | (3,839 | ) |
| | |
|
|
| |
|
|
|
Ending balance | | $ | 5,781 | | | $ | 4,208 | |
| | |
|
|
| |
|
|
|
Note 17Employee Benefits
Sky Financial maintains two plans, Employee Stock Ownership and Savings Plan and Employee Stock Ownership Pension Plan as its primary ongoing retirement plans, as well as a supplemental retirement plan for certain individuals. Beginning in 2000, all employees of Sky Financial were eligible to participate.
Employee Stock Ownership and Savings Plan
The plan provides for contributions by Sky Financial as determined on a year-by-year basis. These contributions were 6%, 6% and 4% of eligible employee compensation in 2002, 2001 and 2000, respectively. Under the 401(k) portion of the Plan, employees may contribute a percentage of their eligible compensation with a company match of such contributions up to a maximum match of 3%. Employees may contribute to this plan upon employment. Employer matching contributions commence after the employees have completed twelve months of service. Expenses related to this plan were $5,669, $6,510 and $4,051 in 2002, 2001 and 2000.
During 2000, ESOP plans of merged affiliates with remaining loan obligations of $123 and $300 as of December 31, 2001 and 2000, respectively, were consolidated into the Sky Financial plan. Unallocated shares totaled 12,526 as of December 31, 2001 and 25,123 as of December 31, 2000. During 2002, the remaining loan obligation of merged plans was paid off resulting in the release of all unallocated shares.
Employee Stock Ownership Pension Plan
Sky Financial also sponsors an Employee Stock Ownership Pension Plan that provides for an annual employer contribution equal to 3% of eligible employees’ annual compensation. Expenses related to this plan were $2,834, $2,239 and $1,920 in 2002, 2001 and 2000.
Total shares of Sky Financial common stock held by the Employee Stock Ownership and Savings Plan and the Employee Stock Ownership Pension Plan as of December 31, 2002 were 1,866,043.
Supplemental Retirement Plan
This plan replaces retirement benefits eliminated under Sky Financial’s qualified retirement plans because of eligible compensation limitations under current tax law. Sky Financial’s contribution under the plan is determined by multiplying the excess of employees’ eligible compensation over the established limitation by the contribution level established by the Board of Directors for Sky Financial’s qualified plans. The contribution rates were 12%, 12% and 10% in 2002, 2001 and 2000, respectively. Expenses related to this plan were $248, $308 and $209 in 2002, 2001 and 2000.
Frozen Pension Plan
In connection with Sky Financial’s acquisition of Three Rivers Bancorp, Inc., Sky Financial sponsors a funded defined benefit pension plan for eligible employees who are 21 years of age with one or more years of service. Benefits paid to retirees are based on age at retirement, years of credited service, and average compensation. The plan was frozen during the fourth quarter of 2002. Since this was contemplated in the Three Rivers acquisition, a curtailment gain was considered in arriving at the benefit obligation and prepaid pension cost recorded at the acquisition date. Sky Financial’s funding policy is to contribute the amount required to meet the requirements as defined by the Internal Revenue Code.
48
Note 17Employee Benefits (continued)
The following table sets forth the benefit obligation, fair value of plan assets, and the funded status of Sky Financial’s plans; amounts recognized in Sky Financial’s financial statements; and the principal weighted average assumptions used at December 31, 2002:
Change in Benefit Obligation | | | | |
Benefit obligation at October 1, 2002 | | $ | 5,580 | |
Service cost | | | 139 | |
Interest cost | | | 95 | |
Actuarial (gain)/loss | | | 0 | |
Benefits paid | | | (29 | ) |
| | |
|
|
|
Benefit obligation at December 31, 2002 | | $ | 5,785 | |
| | |
|
|
|
Change in Plan Assets | | | | |
Fair value of plan assets at October 1, 2002 | | $ | 5,643 | |
Actuarial gain on plan assets | | | 338 | |
Employer contributions | | | — | |
Benefits paid | | | (29 | ) |
Expenses paid | | | (12 | ) |
| | |
|
|
|
Fair value of plan assets at December 31, 2002 | | $ | 5,940 | |
| | |
|
|
|
Funded Status | | $ | 155 | |
Unrecognized transition obligation / (asset) | | | — | |
Unrecognized prior service cost | | | — | |
Unrecognized actuarial (gain)/loss | | | (217 | ) |
| | |
|
|
|
Net amount recognized | | $ | (62 | ) |
| | |
|
|
|
Amounts Recognized in the Statement of Financial Position | | | | |
Prepaid benefit cost | | $ | — | |
Accrued benefit liability | | | (62 | ) |
Intangible asset | | | — | |
Accumulated other comprehensive income | | | — | |
| | |
|
|
|
Net amount recognized | | $ | (62 | ) |
| | |
|
|
|
Components of Net Periodic Benefit Cost—10/1/2002 | | | | |
through 12/31/2002 | | | | |
Service cost | | $ | 139 | |
Interest cost | | | 95 | |
Expected return on plan assets | | | (109 | ) |
Amortization of transition obligation/(assets) | | | — | |
Amortization of prior service cost | | | — | |
Recognized actuarial (gain)/loss | | | — | |
| | |
|
|
|
Total | | $ | 125 | |
| | |
|
|
|
Weighted-average Assumptions at December 31, 2002 | | | | |
Discount rate | | | 6.75 | % |
Expected return on assets | | | 8.00 | |
A summary of the other retirement plans of merged affiliates follows.
Other Plans of Merged Affiliates
Sky Financial, as part of its overall employee benefits design, settles plans of merged affiliates through consolidation into existing plans or termination of the plan. In 2002, Sky merged the Citizens Employee Stock Ownership Plan into Sky’s ESOP plan.
In 2001, Sky Financial completed the settlement of the Citizens and Century defined contribution profit sharing plans. Sky Financial also completed the settlement of the Citizens Defined Benefit Plan recording a gain of $855 from the reversion of excess plan assets. A portion of the excess funding was used to make direct contributions to existing plans.
In 2000, Sky Financial completed the settlement of defined contribution profit sharing plans acquired, recording a gain of $1.9 million from the reversion of excess plan assets. A portion of the excess funding was used to make direct contributions to existing plans.
Sky Financial pays health insurance premiums for certain employees after retirement. Sky Financial accrued the costs of retirees’ health and other post-retirement benefits during the working career of active employees. The expense and liability under this plan are not material in any period presented.
49
Notes to Consolidated Financial Statements
(Dollars in thousands, except per share data)
Note 18Stock Options
Options to purchase Sky Financial’s stock have been granted to directors, officers and employees under various stock option plans. The Sky Financial Group, Inc. 1998 Stock Option Plan for Employees and the Amended and Restated Sky Financial Group, Inc. 1998 Stock Option Plan for Directors were approved by Sky Financial’s shareholders in 1998. Under these plans, options may be granted to purchase a maximum of 6.5 million common shares, or 7.5% of the number of issued and outstanding common shares at the time of the adoption of the plans, adjusted for all subsequent stock dividends, splits and stock-for-stock acquisitions. Options expire 10 years after the date of grant and are issued at an option price no less than the market price of Sky Financial’s stock on the date of grant. Certain individuals, including directors, may also elect to receive options, determined under a formula, in lieu of a portion of their salary or director fees, as applicable. Options granted to directors are fully vested and immediately exercisable at the time of grant. Options granted to officers and other key employees are generally exercisable at 40% after two years and in annual 20% increments thereafter, except for options received in lieu of salary, which are immediately exercisable.
A summary of the activity in the plans is as follows:
| | | 2002
| | 2001
| | 2000
|
| | | Shares
| | | Weighted Average Exercise Price
| | Shares
| | | Weighted Average Exercise Price
| | Shares
| | | Weighted Average Exercise Price
|
| | | | | | | | | | | | | | | | | | | |
| | | | | | | | | | | | | | | | | | | |
| | | | | | | | | | | | | | | | | | | |
Outstanding at beginning of year | | 5,817,070 | | | $ | 17.36 | | 5,257,584 | | | $ | 17.14 | | 4,388,645 | | | $ | 16.80 |
Granted | | 1,177,705 | | | | 21.70 | | 1,100,684 | | | | 17.40 | | 1,489,572 | | | | 16.64 |
Exercised | | (394,910 | ) | | | 11.49 | | (302,805 | ) | | | 11.93 | | (346,548 | ) | | | 8.52 |
Forfeited | | (137,444 | ) | | | 19.58 | | (238,393 | ) | | | 19.61 | | (274,085 | ) | | | 20.13 |
| | |
|
| |
|
| |
|
| |
|
| |
|
| |
|
|
Outstanding at end of year | | 6,462,421 | | | $ | 18.47 | | 5,817,070 | | | $ | 17.36 | | 5,257,584 | | | $ | 17.14 |
| | |
|
| |
|
| |
|
| |
|
| |
|
| |
|
|
Options exercisable at year-end | | 4,641,024 | | | $ | 18.21 | | 4,086,104 | | | $ | 17.18 | | 3,785,482 | | | $ | 16.45 |
Weighted average fair value of options | | | | | | | | | | | | | | | | | | |
granted during year | | | | | $ | 5.55 | | | | | $ | 3.26 | | | | | $ | 3.39 |
Options outstanding at year-end 2002 were as follows:
| | | Outstanding
| | Exercisable
|
Range of Exercise Prices
| | Number
| | Weighted Average Contractual Life (Years)
| | Number
| | Weighted Average Exercise Price
|
$3 to $ 10 | | 307,703 | | 1.79 | | 307,682 | | $ | 9.09 |
$10 to $ 15 | | 603,604 | | 3.17 | | 599,277 | | | 12.55 |
$15 to $ 20 | | 2,731,981 | | 7.51 | | 1,697,823 | | | 17.19 |
$20 to $ 25 | | 2,722,198 | | 7.41 | | 1,939,687 | | | 21.92 |
$25 to $ 30 | | 96,935 | | 5.68 | | 96,555 | | | 25.79 |
| | |
| |
| |
| |
|
|
Outstanding at year-end | | 6,462,421 | | 6.76 | | 4,641,024 | | $ | 18.21 |
| | |
| |
| |
| |
|
|
50
Note 18 Stock Options (continued)
Sky Financial maintains a Stock Appreciation Rights (SAR) plan under which SARs were granted in tandem with stock options until 1998. Expense related to the SARs was $(75) in 2002, $109 in 2001, and $(63) in 2000. A summary of the activity in this plan follows:
| | | 2002
| | 2001
| | 2000
|
| | | SARs
| | | Weighted Average Exercise Price
| | SARs
| | | Weighted Average Exercise Price
| | SARs
| | | Weighted Average Exercise Price
|
Outstanding at beginning of year | | 18,618 | | | $ | 14.96 | | 23,576 | | | $ | 14.30 | | 25,045 | | | $ | 14.25 |
Granted | | — | | | | — | | — | | | | — | | — | | | | — |
Exercised | | (3,667 | ) | | | 9.53 | | (4,470 | ) | | | 10.54 | | (954 | ) | | | 11.01 |
Forfeited | | (336 | ) | | | 19.06 | | (488) | | | | 23.71 | | (515 | ) | | | 18.35 |
| | |
|
| |
|
| |
|
| |
|
| |
|
| |
|
|
Outstanding at end of year | | 14,615 | | | $ | 16.21 | | 18,618 | | | $ | 14.96 | | 23,576 | | | $ | 14.30 |
| | |
|
| |
|
| |
|
| |
|
| |
|
| |
|
|
Note 19Other Financial Instruments
Credit Commitments and Letters of Credit
Sky Financial is a party to financial instruments with off-balance-sheet risk in the normal course of business to meet the financing needs of its clients located primarily within its local business areas. These instruments include commitments to extend credit, standby letters of credit and international commercial letters of credit.
Sky Financial’s exposure to credit loss in the event of non-performance by the other party to the financial instrument for commitments to extend credit, standby letters of credit and letters of credit is represented by the contractual amount of those instruments. Sky Financial uses the same credit policies in making commitments and conditional obligations as it does for on-balance-sheet instruments.
Financial instruments whose contract amounts represent credit risk at December 31 are presented below:
| | | 2002
| | 2001
|
Commitments to extend credit | | $ | 2,512,990 | | $ | 1,544,359 |
Standby letters of credit | | | 331,787 | | | 262,440 |
Letters of credit | | | 1,083 | | | 2,179 |
The majority of the unfunded commitments at December 31, 2002 and 2001 are variable rate commitments, with approximately 29% or $817,000 and 10% or $180,000 having fixed rates in 2002 and 2001, respectively.
Commitments to extend credit are agreements to lend to a client as long as there is no violation of any condition established in the contract. Commitments generally have fixed expiration dates ranging from one to five years, variable interest rates tied to the prime rate and U.S. Treasury bill rates and may require payment of a fee. Because many of the commitments are expected to expire without being drawn upon, the total commitment amounts do not necessarily represent future cash requirements.
Standby letters of credit are conditional commitments issued by Sky Financial to guarantee the performance of a client to a third party. Those guarantees are primarily issued to support public and private borrowing arrangements, including bond financing and similar transactions. The expiration date of substantially all standby letters of credit extend for a period ranging from thirty days to seven years.
The credit risk involved in issuing letters of credit is essentially the same as that involved in extending loan facilities to clients. Sky Financial holds marketable securities, certificates of deposits, real estate, inventory and equipment as collateral supporting those commitments for which collateral is deemed necessary.
Letters of credit are instruments used to facilitate trade, most commonly international trade, by substituting Sky Financial’s credit for that of a commercial importing company. The terms are generally one to three months. The letters of credit are primarily unsecured.
Recourse Obligation
Most of Sky Financial’s business activity is with clients located within the respective local business areas of its bank subsidiary. However, SFS’s loan and lease activities are with clients in medical and dental-related fields located throughout the United States. Substantially all loans and leases originated by SFS until June 30, 2000 were sold in the secondary market. In connection with those sales, SFS retains limited servicing and limited recourse liability. The servicing is limited to responsibility to collect delinquent accounts based on information provided by the purchaser of the loans and leases. A liability was established at the time each loan or lease was sold based on the fair value of the servicing liability. In addition, SFS recorded a liability for the estimated recourse for credit losses that is limited to an aggregate of 10% of the purchase price of the loans and leases sold. The fair value of the servicing liability and the estimated recourse liability reduced the amount of gain or increased the loss of the loans and leases sold. At December 31, 2002 and 2001, the outstanding balance of loans and leases sold were $283,355 and $383,859, respectively. A portion of the purchase price is deferred and paid to SFS on a delayed basis. At December 31, 2002 and 2001, SFS recorded receivables of $8,189 and $9,217, respectively, for deferred sales proceeds. Changes in the liability for recourse provisions relating to sold loans and leases is as follows:
| | | 2002
| | | 2001
| |
Balance at beginning of year | | $ | 6,236 | | | $ | 10,898 | |
Provision for recourse liability | | | 2,100 | | | | 600 | |
Recourse claims paid | | | (4,639 | ) | | | (6,040 | ) |
Recoveries of claims paid | | | 579 | | | | 778 | |
| | |
|
|
| |
|
|
|
Balance at end of year | | $ | 4,276 | | | $ | 6,236 | |
| | |
|
|
| |
|
|
|
51
Notes to Consolidated Financial Statements
(Dollars in thousands, except per share data)
Note 20Mortgage Banking Activities
Sky Financial conducts mortgage banking operations through its banking subsidiary. The primary activity relates to the origination and sale of fixed and variable rate residential mortgages in the secondary market. Sky Financial normally retains the servicing of the loans it sells. Loans are primarily originated in Sky Financial’s community banking market areas of Ohio, Pennsylvania, Michigan, Indiana and West Virginia.
The following table summarizes information relating to Sky Financial’s mortgage banking activity as of December 31:
| | | 2002
| | | 2001
| |
Amounts held in agency accounts | | $ | 18,566 | | | $ | 12,525 | |
Amounts held in escrow accounts | | | 15,068 | | | | 11,995 | |
Mortgage banking receivables for advanced funds | | | 1,141 | | | | 761 | |
Unpaid mortgage loan principal for loans serviced for investors | | | 2,983,959 | | | | 2,607,989 | |
| | |
|
|
| |
|
|
|
Mortgage servicing rights, net of accumulated amortization | | $ | 19,491 | | | $ | 17,977 | |
Allowance for impairment of capitalized mortgage servicing rights | | | (2,462 | ) | | | (1,023 | ) |
| | |
|
|
| |
|
|
|
Net mortgage servicing rights | | $ | 17,029 | | | $ | 16,954 | |
| | |
|
|
| |
|
|
|
In 2002, 2001 and 2000, Sky Financial sold certain servicing rights on mortgages that had an outstanding principal balance of $16,967, $16,896 and $29,267 respectively, and realized no gain or loss in 2002, 2001 or 2000. At December 31, 2002, Sky Financial had firm commitments for the sale of approximately $70,943 of loans held for sale. The fair value of these commitments is not material. No provision for loss on the carrying amount on loans held for sale is considered necessary at December 31, 2002.
Mortgage Servicing Rights:
| | | 2002
| | | 2001
| |
Balance at beginning of year | | $ | 16,954 | | | $ | 14,608 | |
Originations | | | 12,982 | | | | 11,817 | |
Amortization | | | (11,468 | ) | | | (8,450 | ) |
Impairment | | | (1,439 | ) | | | (1,021 | ) |
| | |
|
|
| |
|
|
|
Balance at end of year | | $ | 17,029 | | | $ | 16,954 | |
| | |
|
|
| |
|
|
|
Impairment Reserve:
| | | 2002
| | 2001
|
Balance at beginning of year | | $ | 1,023 | | $ | 1,022 |
Impairment | | | 1,439 | | | 1,021 |
| | |
|
| |
|
|
Balance at end of year | | $ | 2,462 | | $ | 1,023 |
| | |
|
| |
|
|
Note 21Regulatory Matters
Capital Maintenance Requirements
Sky Financial and Sky Bank must observe capital guidelines established by federal and state regulatory authorities. Failure to meet specified minimum capital requirements can result in certain mandatory actions by primary regulators of Sky Financial and Sky Bank that could have a material effect on Sky Financial’s financial condition or results of operations. Under capital adequacy guidelines, Sky Financial and Sky Bank must meet specific quantitative measures of their assets, liabilities and certain off-balance-sheet items as determined under regulatory accounting practices. Sky Financial’s and Sky Bank’s capital amounts and classification are also subject to qualitative judgments by the regulators about components, risk weightings and other factors. Management believes, as of December 31, 2002, that Sky Financial and Sky Bank meet all capital adequacy requirements to which they are subject.
Sky Financial and Sky Bank have been notified by their respective regulators that, as of the most recent regulatory examinations, each is regarded as well capitalized under the regulatory framework for prompt corrective action. Such determinations have been made evaluating Sky Financial and Sky Bank under Tier 1, total capital, and leverage ratios. There are no conditions or events since these notifications that management believes have changed any of the well-capitalized categorizations of Sky Financial and Sky Bank.
52
Note 21Regulatory Matters (continued)
Sky Financial and Sky Bank’s capital ratios are presented in the following table:
| | | Actual
| | | Minimum Required for Capital Adequacy Purposes
| | | Required to be Well Capitalized Under Prompt Corrective Action Regulations
| |
| | | Amount
| | Ratio
| | | Amount
| | Ratio
| | | Amount
| | Ratio
| |
December 31, 2002 | | | | | | | | | | | | | | | | | | |
Total capital to risk-weighted assets | | | | | | | | | | | | | | | | | | |
Sky Financial | | $ | 990,098 | | 11.0 | % | | $ | 718,887 | | 8.0 | % | | $ | 898,609 | | 10.0 | % |
Sky Bank | | | 841,128 | | 10.6 | | | | 633,468 | | 8.0 | | | | 791,835 | | 10.0 | |
Tier 1 capital to risk-weighted assets | | | | | | | | | | | | | | | | | | |
Sky Financial | | $ | 754,371 | | 8.4 | % | | $ | 359,444 | | 4.0 | % | | $ | 539,166 | | 6.0 | % |
Sky Bank | | | 665,374 | | 8.4 | | | | 316,734 | | 4.0 | | | | 475,101 | | 6.0 | |
Tier 1 capital to average assets | | | | | | | | | | | | | | | | | | |
Sky Financial | | $ | 754,371 | | 7.0 | % | | $ | 432,217 | | 4.0 | % | | $ | 540,272 | | 5.0 | % |
Sky Bank | | | 665,374 | | 6.6 | | | | 403,404 | | 4.0 | | | | 504,254 | | 5.0 | |
December 31, 2001 | | | | | | | | | | | | | | | | | | |
Total capital to risk-weighted assets | | | | | | | | | | | | | | | | | | |
Sky Financial | | $ | 830,001 | | 11.3 | % | | $ | 586,323 | | 8.0 | % | | $ | 732,903 | | 10.0 | % |
Sky Bank | | | 701,211 | | 10.8 | | | | 517,458 | | 8.0 | | | | 646,823 | | 10.0 | |
Tier 1 capital to risk-weighted assets | | | | | | | | | | | | | | | | | | |
Sky Financial | | $ | 684,685 | | 9.3 | % | | $ | 293,161 | | 4.0 | % | | $ | 439,742 | | 6.0 | % |
Sky Bank | | | 543,764 | | 8.4 | | | | 258,729 | | 4.0 | | | | 388,094 | | 6.0 | |
Tier 1 capital to average assets | | | | | | | | | | | | | | | | | | |
Sky Financial | | $ | 684,685 | | 7.6 | % | | $ | 362,101 | | 4.0 | % | | $ | 452,626 | | 5.0 | % |
Sky Bank | | | 543,764 | | 6.4 | | | | 342,486 | | 4.0 | | | | 428,107 | | 5.0 | |
Restrictions on Subsidiary Dividends
Dividends paid by Sky Financial are mainly provided for by dividends from its subsidiaries. However, certain restrictions exist regarding the ability of Sky Bank to transfer funds to Sky Financial in the form of cash dividends, loans or advances. Regulatory approval is required in order to pay dividends in excess of Sky Bank’s earnings retained for the current year plus retained net profits since January 1, 2000. During 2002, Sky Bank paid a special dividend to Sky Financial as part of a recapitalization transaction. As a result of this dividend, no amounts were available for distribution to Sky Financial without prior regulatory approval at December 31, 2002.
Note 22Line of Business Reporting
Sky Financial manages and operates three major lines of business: community banking, financial service affiliates and Sky Financial Solutions. Community banking includes lending and related services to businesses and consumers, mortgage banking and deposit-gathering. Financial service affiliates consist of non-banking companies currently engaged in trust services, insurance and other related services, while prior periods also included broker/dealer operations, non-conforming mortgage lending and collection activities. Sky Financial Solutions is engaged in commercial finance lending and leasing to health care professionals.
The reported line of business results reflect the underlying operating performance within the business units. Parent and Other is comprised of the parent company and several smaller business units. It includes the net funding cost of the parent company, intercompany eliminations and all significant non-operating items of income and expense company wide. Expenses for centrally provided services and support are fully allocated based principally upon estimated usage of services. Prior periods have been presented to conform with current reporting methodologies.
53
Notes to Consolidated Financial Statements
(Dollars in thousands, except per share data)
Note 22Line of Business Reporting
Selected segment information is included in the following table:
| | | Community Banking
| | | Financial Service Affiliates
| | | Sky Financial Solutions
| | | Parent and Other
| | | Consolidated Total
|
| | | | | | | | | | | | | | | | | | | | |
2002 | | | | | | | | | | | | | | | | | | | |
Net interest income | | $ | 344,664 | | | $ | 772 | | | $ | 20,450 | | | $ | (4,201 | ) | | $ | 361,685 |
Provision for credit losses | | | 36,579 | | | | 1,080 | | | | 5,918 | | | | — | | | | 43,577 |
| | |
|
|
| |
|
|
| |
|
|
| |
|
|
| |
|
|
Net interest income after provision | | | 308,085 | | | | (308 | ) | | | 14,532 | | | | (4,201 | ) | | | 318,108 |
Non-interest income | | | 96,981 | | | | 48,859 | | | | 3,066 | | | | 975 | | | | 149,881 |
Non-interest expense | | | 206,530 | | | | 40,429 | | | | 24,284 | | | | 5,571 | | | | 276,814 |
| | |
|
|
| |
|
|
| |
|
|
| |
|
|
| |
|
|
Income (loss) before income taxes | | | 198,536 | | | | 8,122 | | | | (6,686 | ) | | | (8,797 | ) | | | 191,175 |
Income tax expense (benefit) | | | 66,360 | | | | 3,239 | | | | (2,345 | ) | | | (3,886 | ) | | | 63,368 |
| | |
|
|
| |
|
|
| |
|
|
| |
|
|
| |
|
|
Net income (loss) | | $ | 132,176 | | | $ | 4,883 | | | $ | (4,341 | ) | | $ | (4,911 | ) | | $ | 127,807 |
| | |
|
|
| |
|
|
| |
|
|
| |
|
|
| |
|
|
Intersegment revenues (expense) | | $ | (26,834 | ) | | $ | (1,428 | ) | | $ | 222 | | | $ | 28,040 | | | $ | — |
| | |
|
|
| |
|
|
| |
|
|
| |
|
|
| |
|
|
Average assets | | $ | 9,216,294 | | | $ | 73,618 | | | $ | 494,144 | | | $ | 105,203 | | | $ | 9,889,259 |
| | |
|
|
| |
|
|
| |
|
|
| |
|
|
| |
|
|
Depreciation and amortization | | $ | 13,410 | | | $ | 778 | | | $ | 457 | | | $ | 1,599 | | | $ | 16,244 |
| | |
|
|
| |
|
|
| |
|
|
| |
|
|
| |
|
|
2001 | | | | | | | | | | | | | | | | | | | |
Net interest income | | $ | 321,115 | | | $ | 1,255 | | | $ | 8,712 | | | $ | (5,485 | ) | | $ | 325,597 |
Provision for credit losses | | | 26,384 | | | | 1,000 | | | | 7,251 | | | | — | | | | 34,635 |
| | |
|
|
| |
|
|
| |
|
|
| |
|
|
| |
|
|
Net interest income after provision | | | 294,731 | | | | 255 | | | | 1,461 | | | | (5,485 | ) | | | 290,962 |
Non-interest income | | | 82,961 | | | | 37,328 | | | | 2,497 | | | | 3,454 | | | | 126,240 |
Non-interest expense | | | 182,294 | | | | 32,247 | | | | 16,342 | | | | 6,337 | | | | 237,220 |
| | |
|
|
| |
|
|
| |
|
|
| |
|
|
| |
|
|
Income (loss) before income taxes | | | 195,398 | | | | 5,336 | | | | (12,384 | ) | | | (8,368 | ) | | | 179,982 |
Income tax expense (benefit) | | | 65,262 | | | | 2,322 | | | | (4,395 | ) | | | (3,870 | ) | | | 59,319 |
| | |
|
|
| |
|
|
| |
|
|
| |
|
|
| |
|
|
Net income (loss) | | $ | 130,136 | | | $ | 3,014 | | | $ | (7,989 | ) | | $ | (4,498 | ) | | $ | 120,663 |
| | |
|
|
| |
|
|
| |
|
|
| |
|
|
| |
|
|
Intersegment revenues (expense) | | $ | (49,011 | ) | | $ | (1,861 | ) | | $ | 213 | | | $ | 50,659 | | | $ | — |
| | |
|
|
| |
|
|
| |
|
|
| |
|
|
| |
|
|
Average assets | | $ | 8,264,927 | | | $ | 61,940 | | | $ | 245,091 | | | $ | 97,645 | | | $ | 8,669,603 |
| | |
|
|
| |
|
|
| |
|
|
| |
|
|
| |
|
|
Depreciation and amortization | | $ | 12,262 | | | $ | 1,346 | | | $ | 552 | | | $ | 4,738 | | | $ | 18,898 |
| | |
|
|
| |
|
|
| |
|
|
| |
|
|
| |
|
|
2000 | | | | | | | | | | | | | | | | | | | |
Net interest income | | $ | 311,010 | | | $ | 1,350 | | | $ | 1,584 | | | $ | (10,148 | ) | | $ | 303,796 |
Provision for credit losses | | | 17,413 | | | | 381 | | | | 4,456 | | | | — | | | | 22,250 |
| | |
|
|
| |
|
|
| |
|
|
| |
|
|
| |
|
|
Net interest income after provision | | | 293,597 | | | | 969 | | | | (2,872 | ) | | | (10,148 | ) | | | 281,546 |
Non-interest income | | | 68,231 | | | | 48,022 | | | | 9,587 | | | | (3,882 | ) | | | 121,958 |
Non-interest expense | | | 174,683 | | | | 44,614 | | | | 16,429 | | | | (319 | ) | | | 235,407 |
| | |
|
|
| |
|
|
| |
|
|
| |
|
|
| |
|
|
Income (loss) before income taxes | | | 187,145 | | | | 4,377 | | | | (9,714 | ) | | | (13,711 | ) | | | 168,097 |
Income tax expense (benefit) | | | 60,532 | | | | 1,721 | | | | (3,466 | ) | | | (5,063 | ) | | | 53,724 |
| | |
|
|
| |
|
|
| |
|
|
| |
|
|
| |
|
|
Net income (loss) | | $ | 126,613 | | | $ | 2,656 | | | $ | (6,248 | ) | | $ | (8,648 | ) | | $ | 114,373 |
| | |
|
|
| |
|
|
| |
|
|
| |
|
|
| |
|
|
Intersegment revenues (expense) | | $ | (43,642 | ) | | $ | (5,065 | ) | | $ | (442 | ) | | $ | 49,149 | | | $ | — |
| | |
|
|
| |
|
|
| |
|
|
| |
|
|
| |
|
|
Average assets | | $ | 7,890,393 | | | $ | 56,780 | | | $ | 43,081 | | | $ | 100,493 | | | $ | 8,090,747 |
| | |
|
|
| |
|
|
| |
|
|
| |
|
|
| |
|
|
Depreciation and amortization | | $ | 13,011 | | | $ | 1,271 | | | $ | 552 | | | $ | 4,329 | | | $ | 19,163 |
| | |
|
|
| |
|
|
| |
|
|
| |
|
|
| |
|
|
54
Note 23Condensed Parent Company Financial Information
Condensed Parent Company Balance Sheets
December 31,
| | 2002
| | 2001
|
Assets | | | | | | |
Cash and due from banks | | $ | 1,924 | | $ | 7,179 |
Securities available for sale | | | 34,367 | | | 41,186 |
Investment in bank subsidiaries | | | 731,449 | | | 628,121 |
Investment in nonbank subsidiaries | | | 216,520 | | | 29,141 |
Receivable from subsidiaries | | | 75,390 | | | 135,906 |
Premises and equipment | | | 7,751 | | | 7,245 |
Other assets | | | 57,097 | | | 64,090 |
| | |
|
| |
|
|
Total assets | | $ | 1,124,498 | | $ | 912,868 |
| | |
|
| |
|
|
Liabilities | | | | | | |
Debt | | $ | 219,081 | | $ | 206,307 |
Other liabilities | | | 72,984 | | | 58,117 |
| | |
|
| |
|
|
Total liabilities | | | 292,065 | | | 264,424 |
Shareholders’ Equity | | | 832,433 | | | 648,444 |
| | |
|
| |
|
|
Total liabilities and shareholders’ equity | | $ | 1,124,498 | | $ | 912,868 |
| | |
|
| |
|
|
Condensed Parent Company Statements of Income
For years ended December 31,
| | 2002
| | | 2001
| | | 2000
| |
Income | | | | | | | | | | | | |
Dividends from bank subsidiaries | | $ | 190,000 | | | $ | 73,300 | | | $ | 139,400 | |
Dividends from nonbank subsidiaries | | | — | | | | 1,000 | | | | 2,767 | |
Management fees | | | 18,512 | | | | 16,485 | | | | 13,835 | |
Other income | | | 9,341 | | | | 14,567 | | | | 10,461 | |
| | |
|
|
| |
|
|
| |
|
|
|
Total income | | | 217,853 | | | | 105,352 | | | | 166,463 | |
| | |
|
|
| |
|
|
| |
|
|
|
Expenses | | | | | | | | | | | | |
Interest expense | | | 15,501 | | | | 14,392 | | | | 15,505 | |
Salaries and employee benefits | | | 12,427 | | | | 11,750 | | | | 6,656 | |
Occupancy and equipment expense | | | 1,892 | | | | 1,581 | | | | 1,445 | |
Merger, integration and restructuring expense | | | 7,181 | | | | 93 | | | | 1,383 | |
Other operating expense | | | 7,553 | | | | 10,874 | | | | 6,442 | |
| | |
|
|
| |
|
|
| |
|
|
|
Total expenses | | | 44,554 | | | | 38,690 | | | | 31,431 | |
| | |
|
|
| |
|
|
| |
|
|
|
Income before income taxes and equity in undistributed net income of subsidiaries | | | 173,299 | | | | 66,662 | | | | 135,032 | |
Income tax benefit | | | 6,555 | | | | 3,532 | | | | 3,048 | |
| | |
|
|
| |
|
|
| |
|
|
|
Income before equity in undistributed net income of subsidiaries | | | 179,854 | | | | 70,194 | | | | 138,080 | |
Equity in undistributed net income of bank subsidiaries | | | (31,093 | ) | | | 58,199 | | | | (13,681 | ) |
Equity in undistributed net income of nonbank subsidiaries | | | (20,954 | ) | | | (7,730 | ) | | | (10,026 | ) |
| | |
|
|
| |
|
|
| |
|
|
|
Net Income | | $ | 127,807 | | | $ | 120,663 | | | $ | 114,373 | |
| | |
|
|
| |
|
|
| |
|
|
|
55
Notes to Consolidated Financial Statements
(Dollars in thousands, except per share data)
Note 23Condensed Parent Company Financial Information (continued)
Condensed Parent Company Statements of Cash Flows
For years ended December 31,
| | 2002
| | | 2001
| | | 2000
| |
Operating Activities | | | | | | | | | | | | |
Net income | | $ | 127,807 | | | $ | 120,663 | | | $ | 114,373 | |
Adjustments to reconcile net income to net cash from operating activities: | | | | | | | | | | | | |
Equity in undistributed net income of bank subsidiaries | | | 31,093 | | | | (58,199 | ) | | | 13,681 | |
Equity in undistributed net income of nonbank subsidiaries | | | 20,954 | | | | 7,730 | | | | 10,026 | |
Depreciation and amortization | | | 772 | | | | 704 | | | | 679 | |
Net loss (gain) on sales of assets | | | 151 | | | | (1,669 | ) | | | 175 | |
Net change in other assets and liabilities | | | (25,700 | ) | | | (11,152 | ) | | | 22,937 | |
| | |
|
|
| |
|
|
| |
|
|
|
Net cash from operating activities | | | 155,077 | | | | 58,077 | | | | 161,871 | |
| | |
|
|
| |
|
|
| |
|
|
|
Investing Activities | | | | | | | | | | | | |
Capital contributions to bank subsidiaries | | | (12,449 | ) | | | (650 | ) | | | (12,235 | ) |
Capital contributions to nonbank subsidiaries | | | (119,677 | ) | | | (25,625 | ) | | | (4,356 | ) |
Return of capital from nonbank subsidiary | | | — | | | | — | | | | 3,000 | |
Loan to subsidiary | | | — | | | | (182,250 | ) | | | (59,500 | ) |
Net loan payments | | | 69,635 | | | | 168,900 | | | | 42,575 | |
Securities available for sale: | | | | | | | | | | | | |
Proceeds from maturities and payments | | | 9,317 | | | | 382 | | | | 9,469 | |
Proceeds from sales | | | 4,698 | | | | 19,091 | | | | 419 | |
Purchases | | | (4,000 | ) | | | (17,590 | ) | | | (17,805 | ) |
Proceeds from sales of premises and equipment | | | — | | | | 630 | | | | — | |
Purchases of premises and equipment | | | (1,379 | ) | | | (570 | ) | | | (224 | ) |
Cash paid for Celaris Group, Inc., net of cash acquired | | | (1,000 | ) | | | — | | | | — | |
Cash paid for Three Rivers Bancorp, net of cash acquired | | | (41,799 | ) | | | — | | | | — | |
Cash paid for Value Added Benefits, Ltd., net of cash acquired | | | (1,900 | ) | | | — | | | | — | |
Other items | | | — | | | | 1,437 | | | | — | |
| | |
|
|
| |
|
|
| |
|
|
|
Net cash from investing activities | | | (98,554 | ) | | | (36,245 | ) | | | (38,657 | ) |
| | |
|
|
| |
|
|
| |
|
|
|
Financing Activities | | | | | | | | | | | | |
Proceeds from issuance of debt | | | 13,013 | | | | 184,000 | | | | 142,356 | |
Repayment of debt | | | — | | | | (114,000 | ) | | | (164,500 | ) |
Proceeds from issuance of common stock | | | 4,243 | | | | 4,009 | | | | 3,885 | |
Cash dividends and fractional shares paid | | | (62,631 | ) | | | (60,536 | ) | | | (61,962 | ) |
Treasury stock purchases | | | (16,403 | ) | | | (34,571 | ) | | | (52,820 | ) |
Other items | | | — | | | | (118 | ) | | | 417 | |
| | |
|
|
| |
|
|
| |
|
|
|
Net cash from financing activities | | | (61,778 | ) | | | (21,216 | ) | | | (132,624 | ) |
| | |
|
|
| |
|
|
| |
|
|
|
Net change in cash and due from banks | | | (5,255 | ) | | | 616 | | | | (9,410 | ) |
Cash and due from banks at beginning of year | | | 7,179 | | | | 6,563 | | | | 15,973 | |
| | |
|
|
| |
|
|
| |
|
|
|
Cash and due from banks at end of year | | $ | 1,924 | | | $ | 7,179 | | | $ | 6,563 | |
| | |
|
|
| |
|
|
| |
|
|
|
56
Note 24Other Matters
Legal Matters
Between August 2000 and December 2001, Sky Bank provided financing to a commercial borrower and its affiliated entities for the purchase of three separate portfolios of commercial lease pools, and a warehouse line of credit to finance lease pools. These loans, totaling $30 million with a current outstanding balance of $22.8 million, are secured by assignments of the payment streams from the underlying leases, surety bonds, and a limited guarantee from the sole member of the commercial borrower.
Upon default of these commercial loans, Sky Bank made demand for payment from Illinois Union Insurance Company (“IU”), RLI Insurance Company (“RLI”) and Royal Indemnity Insurance Company (“Royal”) under the relevant surety bonds and insurance policies. IU, RLI and Royal (the “Sureties”) have failed to make the payments required under the surety bonds and insurance policies. As a result, on April 11, 2002, Sky Bank filed suit against each of the Sureties in the Court of Common Pleas, Cuyahoga County, Ohio, which were subsequently removed to Federal District Court, Northeastern District of Ohio, Eastern Division. Sky Bank’s complaints claim breach of contract, bad faith and allege that the Sureties are liable for the payments due to Sky Bank under the terms of the bonds and are estopped from asserting fraud as a defense to paying any claims under the bonds.
Sky Bank, in addition to numerous other financial institutions, had been named in two separate lawsuits filed by IU in Federal District Court, District of Nevada and RLI in Federal District Court, Southern District of California. Both IU and RLI are seeking to rescind surety bonds or collateral security insurance policies that were assigned to Sky Bank by the borrower as credit enhancements for lease pools. The Sureties allege that the originator of the leases fraudulently induced the insurers to issue the surety bonds, and that the bonds are therefore void.
On October 25, 2002, the Judicial Panel on Multi-District Litigation (MDL) issued an order transferring approximately 28 pending related cases, including the above-referenced litigation, to the Federal District Court, Northeastern District of Ohio, Eastern Division, under MDL Docket No. 1490. Preliminary dispositive motions are pending, and discovery is underway.
Sky Financial has reviewed the relevant matters of fact and law with special counsel and believes that it has substantial and meritorious claims against the Sureties, due in part to the fact that under the terms of the bonds, the Sureties undertake the responsibility for all credit and fraud underwriting, and waive all defenses associated with the bonds, including defenses of fraud. Sky Financial has and will continue to vigorously assert all the rights and remedies available to it to obtain payment under the bonds.
While the ultimate outcome of this matter cannot be determined at this time, Sky Financial management does not believe that the outcome of any of these pending legal proceedings will materially affect the consolidated financial position or results of operations of Sky Financial.
In addition, Sky Financial is, from time to time, involved in various lawsuits and claims that arise in the normal course of business. In the opinion of management, any liabilities that may result from these lawsuits and claims will not materially affect the consolidated financial position or results of operations of Sky Financial.
Cash and Due from Banks
Sky Financial’s subsidiary bank is required to have cash on hand or on deposit with the Federal Reserve Bank to meet its regulatory reserve requirements. The reserve requirements at December 31, 2002 and 2001 approximated $26,515 and $39,088, respectively. These balances do not earn interest.
Restricted Assets
Sky Financial has certain assets of subsidiaries that are included in the consolidated financial statements that are not available to secure additional financing or otherwise satisfy claims of creditors of Sky Financial, or any of its subsidiaries.
As of December 31, 2002, the outstanding amount of these assets was $543 million.
Treasury Shares
Included in treasury shares at December 31, 2002 are 220,781 of shares held in rabbi trusts for certain employees of Sky Financial.
Note 25Quarterly Financial Information (Unaudited)
| | | First
| | Second
| | | Third
| | Fourth
| |
2002 | | | | | | | | | | | | | | |
Total interest income | | $ | 151,599 | | $ | 154,418 | | | $ | 153,624 | | $ | 166,264 | |
Net interest income | | | 83,976 | | | 87,354 | | | | 89,222 | | | 101,133 | |
Provision for credit losses | | | 9,322 | | | 9,444 | | | | 9,711 | | | 15,101 | |
Net income(1) | | | 31,713 | | | 29,124 | (2) | | | 33,032 | | | 33,938 | (2) |
| | | | | | | | | | | | | | | |
|
Basic net income per share | | | 0.38 | | | 0.35 | | | | 0.40 | | | 0.39 | |
Diluted net income per share | | | 0.38 | | | 0.35 | | | | 0.40 | | | 0.39 | |
|
2001 | | | | | | | | | | | | | | |
Total interest income | | $ | 162,709 | | $ | 161,062 | | | $ | 160,743 | | $ | 157,862 | |
Net interest income | | | 76,777 | | | 79,745 | | | | 83,043 | | | 86,032 | |
Provision for credit losses | | | 6,656 | | | 8,568 | | | | 9,122 | | | 10,289 | |
Net income | | | 28,837 | | | 29,232 | | | | 30,653 | | | 31,941 | |
|
Basic net income per share | | | 0.35 | | | 0.35 | | | | 0.37 | | | 0.39 | |
Diluted net income per share | | | 0.35 | | | 0.35 | | | | 0.37 | | | 0.39 | |
(1) As more fully explained in Note 1, Sky Financial adopted SFAS 147 during 2002. Adoption of this statement resulted in a restatement in both the first and second quarter of 2002, increasing net income by $226 in each quarter.
(2) The second and fourth quarter of 2002 reflect the impact of merger, integration and restructuring charges associated with Sky’s new technology implementation and the Three Rivers acquisition.
57
Sky Boards of Directors
Sky Bank Regional Boards
Mahoning Valley Region
William J. Bresnahan*
Lee Burdman
Rex A. Ferry
Frank Hierro
Chander M. Kohli, M.D.
Parker T. McHenry
Mid Am Region
Joel S. Beren
Paul C. Betz
David A. Bryan
Floyd D. Craft
Ralph W. Gallagher*
Kathleen S. Hanley
Patrick J. Johnson*
Marilyn O. McAlear
G . Ray Medlin, Jr.
Dane C. Nelson
Sharon S. Speyer
Ohio Bank Region
Paul V. Ballinger*
C. Richard Beckett
John A. Cole
John C. Fergus II*
Beth B. Heck
Thomas A. Heydinger
Samuel J. Kiehl III
Patrick W. Rooney
(Deceased 12/18/02)
Kevin R. Sonnycalb
Thomas J. Weissling
Ohio Valley Region
Keith D. Burgett*
Paul P. Carapellotti
David E. D’Anniballe
Carl Frankovitch
Rick L. Hull
Kenneth E. McConnell
William C. Shivers
Lee A. Smith
(Deceased 9/12/02)
Pittsburgh Region
Vincent W. Locher
Demetrios (Jim) T. Patrinos
Mary Pat Soltis
Charles A. Warden
Stark/Summit Region
Louis M. Altman
Dr. David A. Bitonte*
Dr. John L. Ewing, Jr.
Fred J. Haupt
Paul T. Schumacher
Lester S. Sherman
Dewey VanHoose III
Western Pennsylvania Region
Del E. Goedeker*
Thomas E. Libeg
Floyd H. McElwain*
Barbara Bateman McNees
Roger W. Richards
Stephen R. Sant
Steven C. Warner
Sky Financial Solutions
Marty E. Adams*
Gerald D. Aller
Paul T. Appel
Keith D. Burgett
Robert E. Dorr
D. James Hilliker
H. Lee Kinney
Thomas J. O’Shane*
Douglas J. Shierson
Robert E. Spitler
Robert E. Stearns
Sky Trust
Marty E. Adams
Robert C. Duvall
David A. Gordon
Frank I. Harding III
David L. Hayes
Richard R. Hollington III
Randall C. Hunt
Patrick J. Johnson
Robert E. Morrison, Jr.
Harold F. Reed, Jr.
Gregory L. Ridler
Karl B. Schroedel II
Patrick A. Sebastiano
C. Gregory Spangler
Richard E. White
Sky Insurance Group
Marty E. Adams
Jerry J. Batt
George N. Chandler II
Richard R. Hollington III
Charles I. Homan
Jonathan A. Levy
Thomas S. Mansell
Robert W. Meyer
Thomas J. O’Shane
Timothy J. Paradiso
| * | | Also serves on Sky Bank’s Board of Directors |
58
Sky Management
Sky Financial Group Executive Management
Marty E. Adams
Chairman,
President & CEO
Richard R. Hollington III
EVP/Corporate Director of Financial Services
Frank J. Koch
EVP/Senior Credit Officer
W. Granger Souder, Jr.
EVP/General Counsel & Corporate Secretary
Les Starr
EVP/Operations and Technology
Kevin T. Thompson
EVP/Chief Financial Officer
Perry C. Atwood
SVP/Director of Sales
Caren L. Cantrell
Division EVP/Financial Services Operations
Phillip C. Clinard
SVP/Director of Change Management Office
Thomas A. Sciorilli
SVP/Chief Human Resources Officer
Curtis E. Shepherd
SVP/Director of Marketing and Product Management
Christopher L. Whitford
Division EVP/Chief Technology Officer
Sky Bank Regional Presidents
Frank Hierro
Mahoning Valley Region
Rick L. Hull
Ohio Valley Region
Vincent W. Locher
Pittsburgh Region
Stephen R. Sant
Western Pennsylvania Region
Sharon S. Speyer
Mid Am Region
Dewey VanHoose III
Stark/Summit Region
Thomas J. Weissling
Ohio Bank Region
Sky Insurance Group
Timothy J. Paradiso
CEO
Sky Insurance
Jerry J. Batt
President
Meyer & Eckenrode Insurance Group
Robert W. Meyer
President
Sky Trust
Robert E. Morrison, Jr.
President & CEO
Sky Financial Solutions
Robert E. Dorr
President & CEO
59
Shareholder Information and Acknowledgements
Quarterly Common Stock Prices, Dividends and Yields
| | | High
| | Low
| | Book Value per Share
| | Dividend per Share
| | Dividend Yield
| |
2002 | | | | | | | | | | | | | | | |
Fourth Quarter | | $ | 20.78 | | $ | 17.56 | | $ | 9.54 | | $ | 0.20 | | 4.17 | % |
Third Quarter | | | 22.13 | | | 17.25 | | | 8.70 | | | 0.19 | | 3.86 | |
Second Quarter | | | 23.80 | | | 20.05 | | | 8.51 | | | 0.19 | | 3.47 | |
First Quarter | | | 22.43 | | | 19.82 | | | 8.14 | | | 0.19 | | 3.60 | |
2001 | | | | | | | | | | | | | | | |
Fourth Quarter | | $ | 20.75 | | $ | 18.56 | | $ | 7.92 | | $ | 0.19 | | 3.87 | % |
Third Quarter | | | 20.90 | | | 17.80 | | | 7.86 | | | 0.19 | | 3.93 | |
Second Quarter | | | 19.99 | | | 16.88 | | | 7.67 | | | 0.18 | | 3.91 | |
First Quarter | | | 18.63 | | | 15.69 | | | 7.51 | | | 0.18 | | 4.20 | |
2000 | | | | | | | | | | | | | | | |
Fourth Quarter | | $ | 17.69 | | $ | 12.61 | | $ | 7.31 | | $ | 0.18 | | 4.75 | % |
Third Quarter | | | 17.39 | | | 14.37 | | | 6.96 | | | 0.18 | | 4.58 | |
Second Quarter | | | 17.05 | | | 13.36 | | | 6.80 | | | 0.18 | | 4.78 | |
First Quarter | | | 18.53 | | | 12.50 | | | 6.71 | | | 0.18 | | 4.69 | |
Stock Information at December 31, 2002
| | | Common Stock
|
Shares authorized | | | 150,000,000 |
Shares issued | | | 87,276,888 |
Treasury shares | | | 220,781 |
Number of shareholders of record | | | 18,358 |
Closing market price per share | | $ | 19.91 |
Book value per share | | $ | 9.54 |
Stock exchange | | | NASDAQ |
Stock symbol | | | SKYF |
Dividend Reinvestment Plan
Sky Financial offers a Dividend Reinvestment Plan that allows shareholders to reinvest their Sky Financial Group, Inc. dividends in additional Company common stock at the prevailing market price. The plan has 8,658 participants, or 47.2 percent of our common shareholders of record. Plan information may be obtained by calling the Shareholder Relations Department at (800) 576-5007, or by writing: Sky Financial Group, Inc. Dividend Reinvestment Plan, 10 East Main Street, Salineville, Ohio 43945.
Corporate Information
Annual Meeting
Place: Hilton Garden Inn &
Gateway Conference Center
Cleveland, Ohio
Date: April 16, 2003
Time: 10:00 a.m.
Headquarters
Write:
Sky Financial Group, Inc.
221 South Church Street
P. O. Box 428
Bowling Green, Ohio 43402
Telephone: (419) 327-6300
Shareholder Relations and Form 10-K
Write:
Sky Financial Group, Inc.
Shareholder Relations
10 East Main Street
Salineville, Ohio 43945
Contact:
Tracey L. Reeder
VP/Shareholder Relations
Telephone: (800) 576-5007
Transfer Agent
Write:
The Bank of New York
Receive and Deliver
Dept.-11W
P. O. Box 11002
Church Street Station
New York, New York 10286
Telephone: (888) 683-4901
Online Information
More information
concerning Sky Financial
and its affiliates can be found
on our website at
www.skyfi.com.
Acknowledgements
A special thanks to the following employees who helped produce this report: |
|
Tim Allison Renee Appelhans Tammy Atterholt Eric Benington Meagan Billyk Mark Carr Phil Clinard Diane Critchet Vicky Dielman Sharlyn Dimick Tim Dirrim Miguel Every Amy Hackenberg | | John Hallack Greg Harris Bob Hawker Mark Herron Don Hileman Jennifer Iliff Deborah Krzeminski Vince Locher April Mangett Tony Mazurek Mike Moore Amanda Murphy Julie Myers | | Tracey Reeder John Reisner Kelly Semer Lydia Shank Curtis Shepherd Terry Sobczak Granger Souder Eric Stachler Gwen Stallard Kevin Thompson Dave Walter Nicole Woodard | | |
The following clients and shareholders assisted in the completion of this year’s annual report:
Lesniewicz Associates –Design and Copywriting
Flying Colors –Printing
Jim Rohman –Photography
Pastor Jon Goshay
Pam Oyer
Demetrios “Jim” Patrinos
John Wagner
60
Regionally Positioned for Performance
Banking Mahoning Valley Region 23 Federal Plaza Youngstown, OH 44503 (330) 742-7000 Mid Am Region 519 Madison Ave. Toledo, OH 43604 (419) 249-3300 Ohio Bank Region 236 S. Main St. Findlay, OH 45840 (419) 424-4000 Ohio Valley Region 10 E. Main St. Salineville, OH 43945 (330) 679-2328 Western Pennsylvania Region 101 E. Washington St. New Castle, PA 16101 (724) 652-5511 Pittsburgh Region 336 Fourth Ave. Pittsburgh, PA 15222 (412) 227-6500 Stark/Summit Region 4767 Munson St. NW Canton, OH 44718 (330) 498-4623 | | 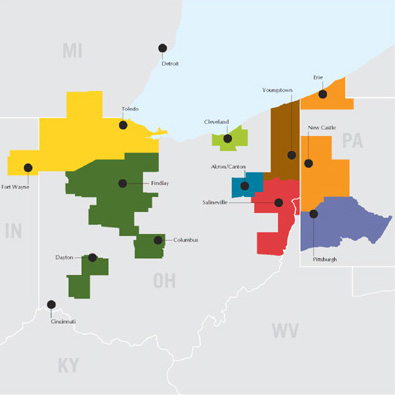
|
|
Investment & Trust Services Sky Trust 30050 Chagrin Blvd., Suite 150 Pepper Pike, OH 44124 (216) 378-2810 Insurance Sky Insurance 1695 Indian Wood Circle Maumee, OH 43537 (419) 720-7900 Meyer & Eckenrode Insurance Group 200 Third St. Carnegie, PA 15106 (412) 276-7727 Healthcare Financing Sky Financial Solutions 2740 Airport Dr., Suite 300 Columbus, OH 43219 (800) 360-0667 Internet Access Sky Access 24 North Park Ave., 2nd Floor Lisbon, OH 44432 (330) 424-6683 | | Sky Bank Regions ¨ Greater Cleveland Region ¨ Mid Am Region ¨ Ohio Bank Region ¨ Ohio Valley Region ¨ Mahoning Valley Region ¨ Pittsburgh Region ¨ Stark/Summit Region ¨ Western Pennsylvania Region |
www.skyfi.com