Exhibit 99(b)
Feeding Tomorrow
2011 Summary Annual Report


Food and Our Future
| | | | |
| We look to tomorrow with big aspirations. | | 2 | | Performance Highlights |
We envision a world where no child goes to bed hungry, where dinner tables in every home are filled with healthy food. This aspiration motivates us as stewards of the resources and relationships with which we have been entrusted. Our products play an important role in helping feed a rising world population. We are proud of our contribution to global food production, and excited by the value we believe can be generated as we grow our company. This summary report provides an update on our performance and strategies, each designed to create lasting value. As we create such value, we know that what we do today is helping to feed tomorrow. | | 4 | | Value Reporting |
| | 6 | | Business Overview |
| | 8 | | Value of Fertilizer |
| | 12 | | Building Value |
| | 18 | | Strategies |
| | 20 | | Performance |
| | 33 | | Governance & Compensation |
| | | | |
| | | | |
| | | | |

| | | | |
| Financial data are stated in US dollars unless otherwise noted. | | | 1 | |
Performance Highlights
| | | | | | | | | | | | | | | | | | | | |
| | | 2011 | | | 2010 | | | 2009 | | | 2008 | | | 2007 | |
Financial Results1 | | | | | | | | | | | | | | | | | | | | |
(in millions of US dollars except per-share amounts) | | | | | | | | | | | | | | | | | | | | |
Sales | | | 8,715 | | | | 6,539 | | | | 3,977 | | | | 9,447 | | | | 5,234 | |
Gross margin | | | 4,286 | | | | 2,690 | | | | 1,015 | | | | 4,861 | | | | 1,882 | |
Net income | | | 3,081 | | | | 1,775 | | | | 981 | | | | 3,466 | | | | 1,104 | |
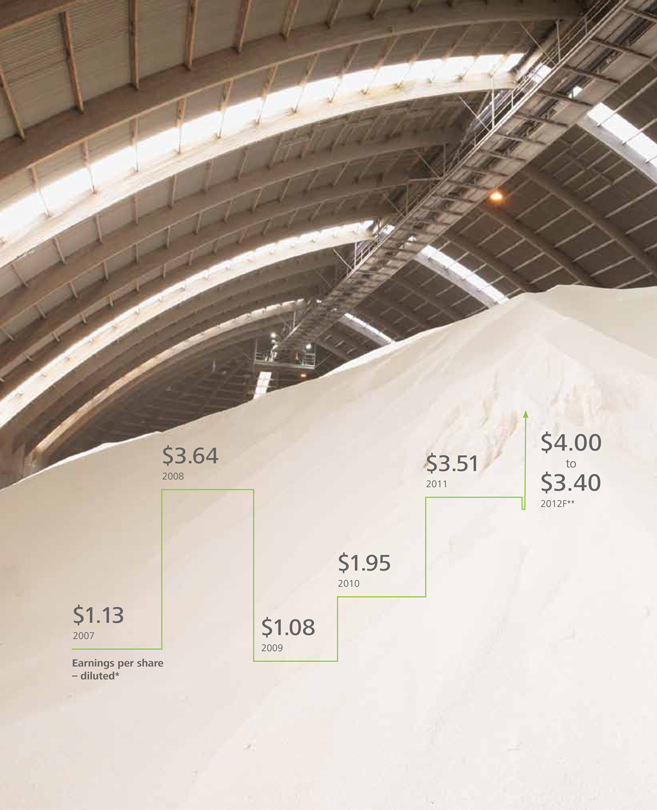
Net income per share – diluted | | | 3.51 | | | | 1.95 | | | | 1.08 | | | | 3.64 | | | | 1.13 | |
Cash provided by operating activities | | | 3,485 | | | | 3,131 | | | | 924 | | | | 3,013 | | | | 1,689 | |
Cash additions to property, plant and equipment | | | 2,176 | | | | 2,079 | | | | 1,764 | | | | 1,198 | | | | 607 | |
| | | | | |
Non-Financial Results | | | | | | | | | | | | | | | | | | | | |
Customers | | | | | | | | | | | | | | | | | | | | |
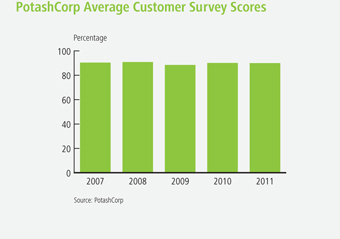
Average customer survey score | | | 90 | % | | | 90 | % | | | 89 | % | | | 91 | % | | | 90 | % |
Community | | | | | | | | | | | | | | | | | | | | |
Average community survey score (out of five) | | | 4.4 | | | | 4.2 | | | | 4.1 | | | | 4.0 | | | | 4.1 | |
Employees | | | | | | | | | | | | | | | | | | | | |
Average employee engagement score | | | 73 | % | | | 73 | % | | | 76 | % | | | 79 | % | | | 69 | % |
Safety | | | | | | | | | | | | | | | | | | | | |
Total site2severity injury rate3 | | | 0.54 | | | | 0.38 | | | | 0.74 | | | | 0.97 | | | | n/a | |
Environment | | | | | | | | | | | | | | | | | | | | |
Environmental incidents4 | | | 14 | | | | 20 | | | | 22 | | | | 19 | | | | 25 | |
| 1 | As we adopted International Financial Reporting Standards (IFRS) with effect from January 1, 2010, 2007 to 2009 information is presented on a previous Canadian generally accepted accounting principles (GAAP) basis. Accordingly, information for 2007 to 2009 may not be comparable to 2011 and 2010. |
| 2 | Total site includes PotashCorp employees, contractors and all others on site. |
| 3 | Severity injury rate is the total of lost-time injuries and modified work injuries for every 200,000 hours worked. |
| 4 | Includes releases, permit excursion and spills |
80%
Increase in diluted earnings per share from 2010
30%
Reduction in environmental incidents from 2010
$3.5billion
Record cash provided by operating activities in 2011
Segment highlights
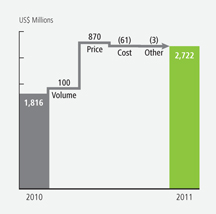
Potash
Tight supply/demand fundamentals prevailed for most of the year. Prices increased in both spot and contract markets, which raised our average realized price 30 percent compared to 2010 levels. Record offshore shipments by Canpotex helped push our total sales volumes 5 percent above those in 2010.
$2.7billion
2011 Gross Margin
50%
Increase compared to 2010
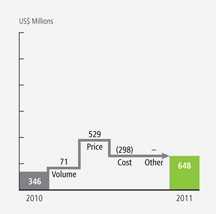
Phosphate
While prices for all products rose, strong agricultural fundamentals meant the largest increases were in solid and liquid fertilizers. We allocated a larger percentage of our production to these product lines to capitalize on higher-margin opportunities. Higher sulfur and ammonia input costs resulted in increased cost of goods sold on a per-tonne basis.
$0.6billion
2011 Gross Margin
87%
Increase compared to 2010
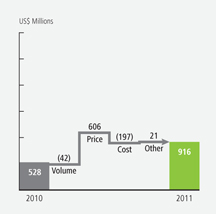
Nitrogen
Strong industrial and agricultural demand, along with tight global supplies, resulted in average realized prices climbing above those of 2010 – which more than offset rising per-tonne cost of goods sold.
$0.9billion
2011 Gross Margin
73%
Increase compared to 2010
3
Value Reporting
| | |
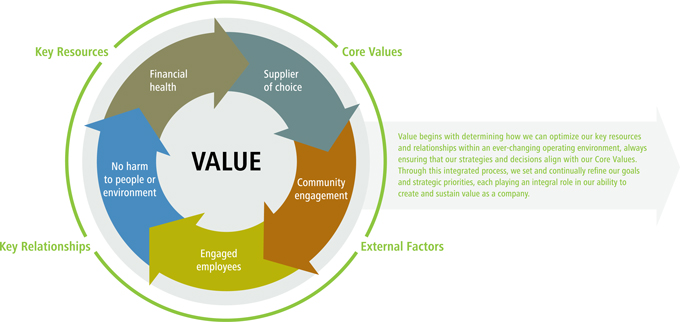
To be successful in a changing world, you have to evolve. Our reporting continues to reflect an evolution in the way we discuss how we create and sustain value in our business. | | “ We believe we have a responsibility not just to create value, but to help people better understand what we offer to the world.” |
| Although we have always managed our business in an integrated manner, this year we sought to improve the way we convey the connections among the factors that inform our strategies. We are doing this because we believe we have a responsibility not just to create value, but to help people better understand what we offer to the world. | |
| |
| You will see the same level of accountability for the company’s financial performance in the pages that follow, and online, but we have taken a step forward by discussing our financial and sustainability strategies and performance together, reflecting their interdependence. Our reporting will continue to evolve as we look for better ways to clearly and concisely communicate the role our strategies play in creating value for our key stakeholders. | | |
| |
This summary report is a record of our process and progress in our pursuit of that worthy goal. | | 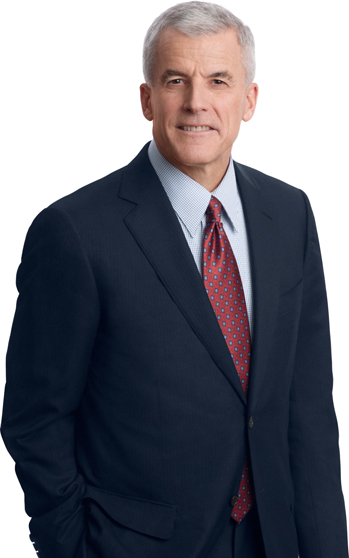
|
 | |
| William J. Doyle | |
| President and Chief Executive Officer | |
February 21, 2012 | |
| |
| |
| |
| |
| |
| |
| |
| |
| |
| |
| |
| |
| |
| |
| |
| |
| |
| |
| |
| |
| |
| |
| |
| |
| |
| |
| |
| |
| |
| |
| | |
About Our Business
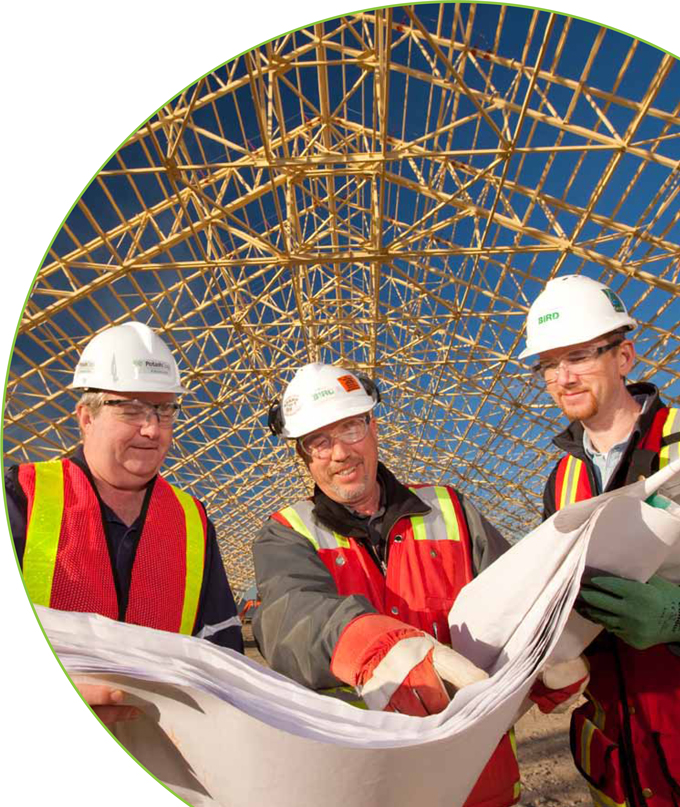
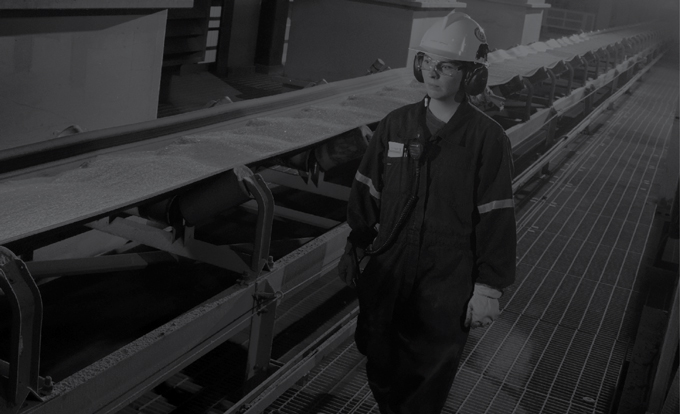
Rocanville general manager Stephen Fortney, left, examines plans for the facility’s 520,000 tonne storage building with contractors Andy Brzuskiewicz and Paul Bergman.
Our Business – An Overview
Our Vision:
To play a key role in the global food solution while building long-term value for all stakeholders.
Who We Are:
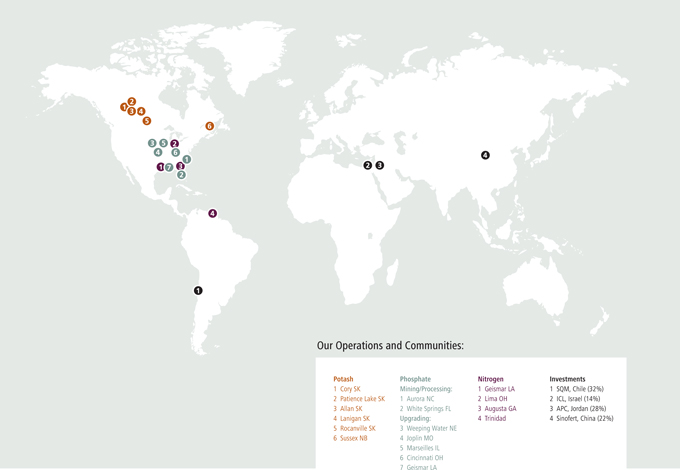
PotashCorp is the world’s largest fertilizer company by capacity1, producing the three primary crop nutrients –potash (K), phosphate (P) and nitrogen (N). Through our Canadian operations, we are responsible for about 20 percent of global potash capacity. In addition, we hold strategic investments in other potash-related businesses in South America, the Middle East and Asia. We complement our potash assets with focused positions in phosphate and nitrogen.
With operations and business interests in seven countries, PotashCorp is an international enterprise and a major player in meeting the growing challenge of feeding the world.
Our Business Segments
2011 DATA
Percentage of World Capacity1
PHOSPHATE
5%
#3 in the world
NITROGEN
2%
#3 in the world
Sales Volumes by Segment
n Fertilizer
n Feed
n Industrial
Sales Volumes by Region
n North America
n Offshore
Gross Margin
Percentage of Net Sales
Total Site3Severity Injury Rate4
| 1 | Based on nameplate capacity at year-end 2011, which may exceed operational capability (estimated annual achievable production level) |
| 2 | Does not include employees not allocated to individual nutrient segments |
| 3 | Total site includes PotashCorp employees, contractors and all others on site. |
| 4 | Site severity injury rate is the total of lost-time injuries and modified work injuries for every 200,000 hours worked. |
7
The Value of Fertilizer
| | |
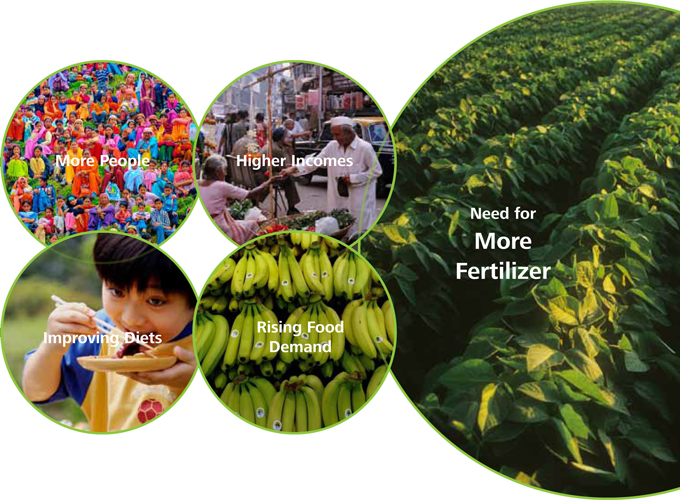
 | | As population rises to a projected 9 billion-plus by 2050 and diets improve in developing countries, the world faces unprecedented challenges to keep pace with the growing demand for food. Modern agriculture – which includes the use of balanced fertilization – is essential to address this need. |
| | Research shows that approximately 50 percent of food production can be attributed to fertilizer use, and we believe fertilizer will become even more important in the coming years. By following science-based fertilization practices, farmers today can grow more food while using less land, sparing the forests that protect our air and preserving the resources upon which life depends. |
| | The Food and Agriculture Organization of the United Nations (FAO) estimates that crop production must rise 70 percent by 2050 to meet the accelerating need for food. With declining arable land per capita, this means every acre must become more productive. |
| | To grow more food, the world needs more fertilizer. This is particularly true in developing countries where farmers often do not apply crop nutrients at recommended levels and yields are well below those of the developed world. |
| | With demand for food rising and farmers motivated by strong agricultural fundamentals, the need for fertilizer has never been greater. As the world’s largest producer by capacity*, we play an important role in meeting this need. |
9billion +
Expected global population by 2050
Source: United Nations
~ 50%
Current crop yield directly attributable to fertilizer use
Source: Agronomy Journal (January-February 2005), IPNI
70%
Estimated increase in crop production required by 2050
Source: FAO
590billion
Equivalent tonnes of CO2that modern agriculture has kept from entering the atmosphere since the early 1960s
Source: PNAS (May 2010)
| * | See nameplate capacity description on Page 7 |
Global Development Story
As population rises and people around the world strive to improve their quality of life – including the quality of their diets – farmers face mounting pressure to produce enough food from resources. Proper fertility practices are key to helping farmers deliver more food for more people.
9

Helps produce more – and better – food
Potash works synergistically with nitrogen and phosphate to improve crop yields. Often called the “quality nutrient,” potash enhances the taste, texture and nutrient value of food while helping to strengthen root systems, improve water retention and increase resistance to pests and diseases.
A limited resource, a global need
Potash is most commonly mined from underground deposits left behind by ancient evaporated seas. These deposits are geographically concentrated, with Saskatchewan holding almost half of the world’s known reserves. In addition to availability, high capital costs and long lead times associated with developing new capacity limit the number of global producers.
12
Countries in the world with significant
potash production
~ 50%
Percentage of world’s known potash reserves located in Saskatchewan
Source: US Geological Survey
Helps reduce humanity’s footprint
As well as increasing food production, potash plays a vital role in meeting other global challenges. By helping to increase crop yields, it preserves forests that might otherwise be converted to farming and thus reduces CO2 emissions. Because it helps plants retain water, potash improves their use of this vital resource. With declining fresh water per capita and ongoing concerns about the impacts of drought on food production, the need to efficiently use water has never been greater.
10
20%
PotashCorp’s approximate percentage of world capacity*
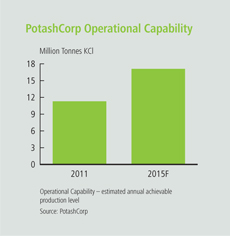
17.1mmt
PotashCorp’s expected operational capability by 2015
Nitrogen and phosphate add value and depth
Our world-class phosphate and nitrogen businesses allow us to serve our customers with a full complement of fertilizer products. Our unique strengths and strategies in each of these nutrients have historically generated strong margins with less cyclicality.
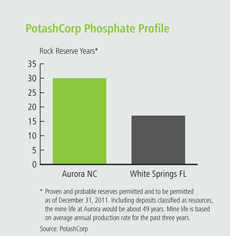
| • | | In phosphate, we use our high-quality rock to make a diverse range of products so we can adapt to changing market conditions. As the most diversified global phosphate company, we emphasize the products that offer the best returns with the least volatility. |
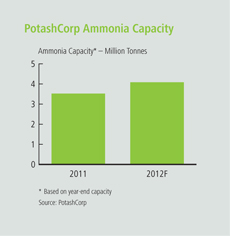
| • | | In nitrogen, we leverage our delivered cost advantage to the large US market. We focus on supplying industrial products, as demand for them has historically been less seasonal than fertilizer and transportation costs can be minimized due to proximity to customers. |
A unique position
We are the world’s largest potash producer by capacity, with operations located in an economically and politically stable country. With six mines, we can add brownfield capacity in less time and at lower cost than new development (greenfield). As stewards of a unique and long-lived resource, we recognize the importance of managing it with a long-term view.
A growing advantage
Between now and 2015, we expect to add about half of the world’s new potash operational capability. We believe this will uniquely position us to capitalize on the anticipated growth in demand. We have completed approximately 75 percent of our capital spending on expansions that are expected to raise our operational capability to 17.1 million tonnes by 2015 – nearly double what it was before we completed our first project in 2005
Global reach and potential
We add to our global potash position with investments in offshore potash-related businesses: Arab Potash Company (APC) in Jordan, Israel Chemicals Ltd. (ICL) in Israel, Sociedad Quimica y Minera (SQM) in Chile and Sinofert Holdings Limited (Sinofert) in China. Through these investments we gain greater exposure to key growth markets and enhance the long-term financial value of our company.
| * | See nameplate capacity description on Page 7 |
11
An Integrated Business Model
We believe that our ability to deliver superior long-term financial returns is the cornerstone of establishing enduring value for all stakeholders. Strong financial performance rewards our shareholders and, at the same time, allows us to focus on our broader social and environmental responsibilities and contribute to the long-term prosperity of our customers, employees, suppliers and communities.
| • | | Industry-leading potash position |
| • | | Access to long-lived, high-quality potash reserves |
| • | | Focused positions in phosphate and nitrogen |
| • | | Financial strength and flexibility |
| • | | Management team with extensive industry experience |
| • | | Talented and engaged employees |
| • | | Strong supply chain and partnerships |


| • | | We operate with integrity |
| • | | Our overriding concern is safety of people and the environment |
| • | | We listen to all stakeholders |
| • | | We strive for continuing improvement |
| • | | We are accessible, accountable and transparent |

Learn more at PotashCorp2011AR.com/Business_Model
GOAL
Create superior long-term shareholder value
Our Strategic Approach
| • | | Devise and execute strategies that prioritize future earnings growth and reduce volatility across all business segments |
| • | | Strategically use capital to build competitive advantages, especially in potash |
| • | | Develop and implement governance practices that minimize risk, maximize management performance and ensure we operate with integrity and transparency |
Targets
| 22 | Total shareholder return |
| 23 | Governance practices ranking |
GOAL
Be the supplier of choice to the markets we serve
Our Strategic Approach
| • | | Build our potash operational capability to meet expected growth in global demand |
| • | | Invest in our transportation and distribution system to efficiently meet our customers’ needs |
| • | | Establish standards for customer service and product quality that set us apart from our competitors |
Targets
| 24 | Product quality and service measurements |
| 25 | Number of quality-related customer complaints |
GOAL
Building Strong relationships with and improve the socioeconomic well-being of our communities
Our Strategic Approach
| • | | Contribute to economic growth by creating direct and indirect jobs, purchasing locally, attracting investment and paying our fair share of taxes |
| • | | Target community investments in organizations and projects that bring sustaining value in the regions where we operate, and more widely, through corporate and site contributions, matching of employee gifts, in-kind contributions and employee volunteerism. |
| • | | Participate in outreach projects to share information and best practices about fertilizer use, environmental matters and safety |
Targets
| 27 | Community leader surveys |
| 27 | Employee matching gift and donation participation |
GOAL
Attract and retain talented, motivated and productive employees who are committed to our long-term goals
Our Strategic Approach
| • | | Offer competitive compensation and provide opportunities for employee development and advancement |
| • | | Promote from within when qualified candidates are available for open positions |
| • | | Provide equal opportunity in hiring, promotions, wages, benefits, and terms and conditions of employment |
| • | | Communicate our goals and expectations clearly, particularly in matters regarding ethics and workplace behavior |
Targets
| 28 | Employee engagement scores |
| 28 | Senior staff internal promotion metrics |
| 29 | External staff-level employment acceptance rate |
GOAL
Achieve no harm to people and no damage to the environment
Our Strategic Approach
| • | | Use peer-to-peer behavior-based process to improve safety and environmental performance |
| • | | Meet or exceed all federal, state, provincial and local safety and environmental requirements |
| • | | Use our Best Practices program to pilot and refine innovative processes that improve safety and efficiency and minimize water, waste and emissions |
| • | | Actively preserve habitat and promote natural biodiversity in areas where we operate |
Targets
| 30 | Site severity injury rates and life-altering injuries |
| 30 | Greenhouse gas emissions |
| 31 | Reportable environmental incidents |
| 31 | Water usage per product tonne |
16
Creating Value Through Strategy
In all areas of our business, we set goals and design strategies that focus on delivering sustainable value while appropriately balancing stakeholder interests. We demonstrate our accountability by tracking and reporting our progress against targets related to each goal.
Segment Strategies in Focus
We devise strategies and set priorities in each of our nutrient segments that align with our company-wide goals, focusing on the areas that may best support these goals. While each of our nutrients is important to our success, we believe our unique leverage in potash provides the greatest opportunity for growth in the years ahead.
POTASH
Our Strategic Approach
| • | | Build on our potash position whenever value-enhancing opportunities arise |
| • | | Match production to market demand to reduce downside risk and conserve the long-term value of our potash resources |
PHOSPHATE
Our Strategic Approach
| • | | Optimize product mix to maximize gross margin and reduce volatility |
| • | | Among the three nutrients, the phosphate business consumes the most water and generates the largest waste streams so we focus on environmental initiatives |
NITROGEN
Our Strategic Approach
| • | | Enhance gross margin and earnings stability by being a lower delivered cost supplier to the large US nitrogen market |
| • | | As nitrogen is the largest consumer of energy among the three nutrients, we focus on initiatives to improve energy efficiency |
Priorities
| • | | Expand operational capability to meet rising demand |
| • | | Enhance transportation and distribution capability |
| • | | Attract and retain a skilled workforce |
| • | | Structure operations so majority of costs are variable and production can be altered economically |
Priorities
| • | | Leverage our lower-cost, high-quality permitted rock supply |
| • | | Enhance our sulfur and ammonia supply position |
| • | | Focus on land and water conservation efforts |
Priorities
| • | | Optimize/expand our existing nitrogen production facilities |
| • | | Maintain our supply position to industrial markets |
| • | | Reduce direct greenhouse gas emissions and improve energy efficiency |
For information on our risks, visitPotashCorp2011AR.com/risks

Performance
Impacting Our Performance
2011: Factors
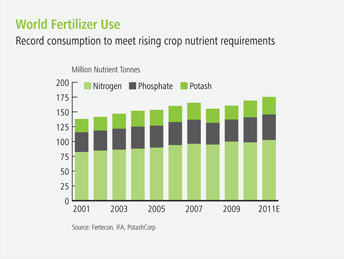
Record demand pressures global fertilizer supply
Rising demand for agricultural commodities continued to support prices well above historical averages for a wide range of crops. This economic incentive and the nutrient requirements necessary to produce increased yields contributed to record world fertilizer demand. This was especially true for potash as global shipments reached an estimated 55 million tonnes, nearly eclipsing the previous record.
The strength in agriculture markets, along with tight supply/demand fundamentals in all three nutrients, resulted in rising prices through much of the year.
Learn more: PotashCorp2011AR.com/factors
2012: Outlook
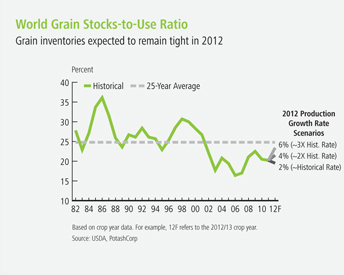
Fertilizer demand expected to remain robust
We anticipate that rising food demand will continue to pressure world grain inventories, which are already well below historical levels, providing support to crop prices. This environment is expected to encourage farmers around the world to apply the nutrients required to maximize production, driving increased fertilizer consumption. The International Fertilizer Industry Association (IFA) projects that world fertilizer use will increase by 2.3 percent in 2012, with potash rising by more than 3 percent.
While fertilizer buyers began 2012 purchasing cautiously, we anticipate that shipments will accelerate as the year progresses, to meet strong projected consumption.
Learn more: PotashCorp2011AR.com/outlook
Building a Better Tomorrow
In 2011, we delivered our second-highest earnings per share on record, nearly surpassing the total achieved in 2008. These strong earnings – and the potential for rising earnings in the years ahead – not only create opportunities for our shareholders, they are the foundation for generating value for all stakeholders.
| * | As we adopted IFRS with effect from January 1, 2010, 2007 to 2009 information is presented on a previous Canadian GAAP basis. Accordingly, information for previous years may not be comparable to 2010 and 2011. |
21
GOAL
Create superior long-term shareholder value
Why Our Performance Matters
Strong financial performance enables us to generate superior returns for our shareholders, which makes it possible for us to access capital to help grow our business. Further, it affords us the ability to maintain employment and create new jobs, to support our communities, to contribute taxes to local economies and to invest in the people and resources that will serve the long-term needs of our customers.
Targets
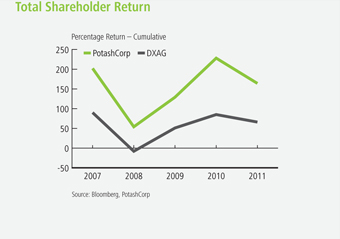
Total Shareholder Return (TSR)
Context
By tracking the return to investors through capital gains and dividends, then comparing that number to the performance of our peers and benchmark, we measure our ability to create and execute strategies that deliver shareholder value.
Target
Exceed TSR performance for our sector* and the DAXglobal Agribusiness Index (DXAG)
Performance partially achieved
PotashCorp’s TSR of -19.5 percent outperformed the sector’s return of -22.8 percent. However, our performance trailed the DAXglobal Agribusiness Index return of -10.2 percent. While we outperformed this index for most of 2011, the slowdown in fertilizer demand in the fourth quarter resulted in weaker relative performance for the balance of the year.
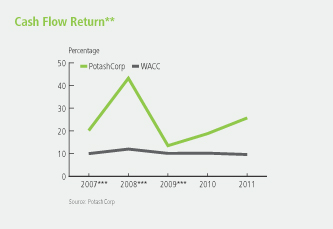
Cash Flow Return (CFR)
Context
Calculated on the total cost basis of the company’s assets rather than on their depreciated value, cash flow return measures the effectiveness of our investment outlay.
Target
Exceed CFR** for our sector*
Performance achieved
We continue to generate CFR above our weighted average cost of capital (WACC), which was 9.6 percent. This produced positive returns for investors on capital deployed. Our 2011 CFR of 26 percent exceeded that of our sector. This was driven primarily by a 66 percent increase in our operating income due to improved earnings across all three nutrients.
| * | Sector: Weighted average (based on market capitalization) for Agrium, APC, CF Industries, ICL, Intrepid, K+S, Mosaic, SQM, Uralkali and Yara for most recent four fiscal quarters available |
| ** | See reconciliation and description of certain non-IFRS measures on Page 78 of the 2011 annual report |
| *** | Figures prepared in accordance with previous Canadian GAAP |

Governance
Context
Our governance practices grow from our Core Values. By listening and being accountable to our stakeholders, we build trust and support, which enhances our ability to execute our strategies.
Target
Remain in the top quartile of governance practices as measured by predetermined external reviews
Performance achieved
We ranked in the top quartile in all predetermined reviews. PotashCorp’s corporate governance practices received top ranking out of 253 companies evaluated by The Globe and Mail Board Games in 2011.
Progress Toward Our Goal
1 Delivering long-term earnings growth
We are committed to strategies in each nutrient segment that are designed to provide earnings growth with reduced volatility. In 2011, we delivered earnings per share of $3.51, up 80 percent from 2010.
2 Strengthening our global potash business
Our expansions, which represent approximately half of the operational capability expected to be added in the industry by 2015, should provide a substantial growth advantage for our company as potash demand rises. In addition to these expansion plans, we continually seek to build on our potash position as value-adding opportunities occur.
3 Strategic use of capital
With most of our major potash capital expenditures expected to be completed by 2013, we anticipate increased free cash flow in subsequent years. We look for ways to deploy capital that provide the greatest long-term returns for our shareholders, such as organic growth, mergers and acquisitions, dividends and share repurchases.
~75%
Expenditures on our CDN $7.7 billion
potash expansion program completed
4x
Increase in dividend since beginning of 2011*
$6.3 billion
Shares repurchased since 1999
23
GOAL
Be the supplier of choice to the markets we serve
Why Our Performance Matters
By helping improve our customers’ opportunities for success, we strengthen our own ability to grow, to remain profitable for the long term and to serve the interests of all our stakeholders.
Targets
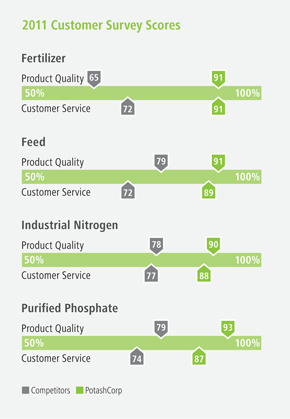
Product Quality and Service Measurements
Context
We continually seek to meet the needs of our customers, emphasizing the criteria they have identified as most important: quality and customer service.
Target
Outperform competitors on quality and service as measured by independent surveys
Performance achieved
We outperformed our competitors in all quality and service categories in 2011. Customer surveys show that we consistently outperform competitors in these areas and that our sales team stands out for its knowledge of our customers, products and industry.

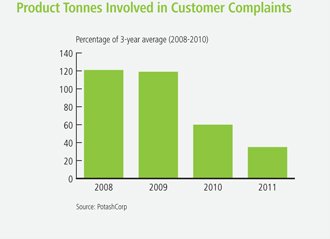
Number of Quality-Related Customer Complaints
Context
Product quality is an important aspect of our ability to be the supplier of choice to the markets we serve. We work hard to ensure our products are best-in-class.
Target
Reduce the number of product tonnes involved in customer complaints below the average of the prior three years
Performance achieved
Our commitment to producing quality products continues to be evident in both our survey results and our low number of quality-related claims. In 2011, this focus on quality reduced the number of tonnes involved in customer complaints to 35 percent of the previous three-year average.
Progress Toward Our Goal
1 Improving rail cycle times through investment
Our potash expansion projects not only give our customers a reliable source for product, they are designed to improve our loading speed and capability to move that product more quickly. In addition, investment in our transportation infrastructure – both as a member of Canpotex and through our own domestic system – will enhance our ability to meet our customer needs today and in the years ahead.
2 Maintaining commitment to sharing information
We continue to provide information that helps customers make informed business decisions. We prioritize relationship-building and provide fertilizer industry analysis on our website to help customers understand the factors that could affect their businesses.
3 Building the next generation sales force
In 2011, we added new customer representative and sales positions to prepare for tomorrow’s service challenges. Each new employee learns about our markets, our customers and our way of doing business from one of the most experienced teams in the industry.
#1
PotashCorp’s 2011 performance in independent customer surveys versus peers
1,000
New high-capacity railcars purchased by PotashCorp in 2010 and 2011
35%
Reduction in number of tonnes involved in customer complaints from previous three-year average
25
GOAL
Build strong relationships with and improve the socioeconomic well-being of our communities
Why Our Performance Matters
To grow our company and sustain our success, we strive to create long-term, mutually beneficial relationships with the communities where we operate. By building trust and goodwill, we are more likely to receive support for our development plans and attract talent for our operations. By being a good neighbor, we can invest with confidence in the company’s future.
Targets
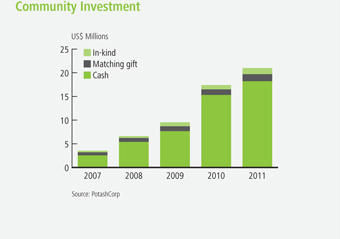
Community Investments
Context
We strive to enhance quality of life in the places where we operate by focusing our community investment strategy on education, health care, and the development and improvement of recreational facilities. The amount we invest in each community is guided by the gross margin we generate in its region.
Target
Invest 1 percent of consolidated income before income taxes (on a five-year rolling average) in community initiatives
Performance achieved
Our 2011 community investments were 1 percent of the five-year average of consolidated income before income taxes – a total of $21 million. This record-setting investment was driven by two key factors: a change in our target from after-tax to pre-tax earnings, and higher overall company earnings.
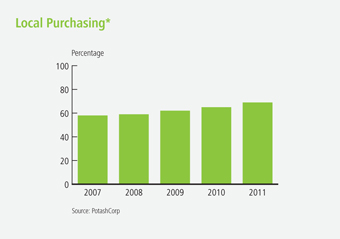
Local Purchasing
Context
By supporting local suppliers, PotashCorp benefits from proximity and security of supply, contributes to local economies and helps attract additional investment to the area. Each of these factors can contribute to improved community support for our operations.
Target
Purchase 60 percent of goods locally*
Performance achieved
Local spending was 69 percent in 2011.
| * | Local purchasing excludes major expansions, energy, raw materials and transportation |

Community Leader Surveys
Context
We ask community leaders to assess our social and environmental responsibility, and what impact we have on their communities.
Target
Achieve 4 (performing well) out of 5 on community leader surveys
Performance achieved
Our 2011 average community survey score was 4.4. Scores for each community surveyed were: Allan (4.0), Lanigan (4.4), Lima (4.4), New Brunswick (4.2) and White Springs (4.8).
Employee Matching Gift and Donation Participation
Context
Supporting causes and organizations that our employees value helps us create a more engaged workplace and positively impact our communities. We encourage our employees to contribute their time and money through our company-sponsored volunteer and matching gift programs.
Target
Achieve a 10 percent increase in employee participation in the matching gift program from 2010 levels
Performance achieved
Participation in our matching gift program rose 12 percent, with total contributions reaching $2.9 million.
In addition, our company and employees support communities through company-sponsored volunteerism and non-cash donations.
Progress Toward Our Goal
1 Growing together
Our expansion projects are adding jobs and creating new opportunities for local suppliers and businesses. We also invest in communities through strategic philanthropy that supports their ongoing development, not just one-time events. Given our potential for rising earnings, our community investments will grow in the years ahead.
2 Encouraging others to give
We strive to increase opportunities for employees to participate in programs offered by the United Way, Nutrients for Life and other organizations, through our matching gift program. For 2012, we have removed the one-year waiting period for new employees to participate in the program and are working to improve employee awareness of it so support can be given in areas that matter most to them.
3 Committing to community outreach and involvement
We attended or hosted 225 community meetings in 2011, and launched a local Twitter account to inform people of community events and causes. We continue to look for ways to improve our outreach and deepen our involvement in our communities.
$21 million
2011 community investment
36,000
Person-years of employment in Saskatchewan estimated as a result of our expansion projects
43%
2011 increase in company-sponsored volunteerism and non-cash donations
27
GOAL
Attract and retain talented, motivated and productive employees who are committed to our long-term goals
Why Our Performance Matters
Our company’s need for technical expertise requires a talented and motivated workforce to maintain our competitive advantage and reach our goals.
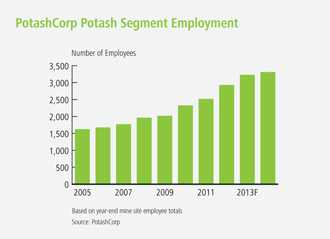
Securing quality talent is even more critical now as our potash expansions continue, competition for qualified candidates rises and more-experienced employees approach retirement.
Targets
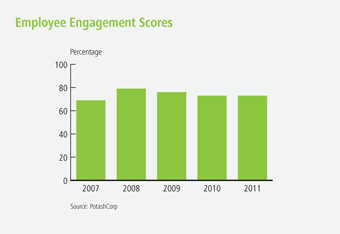
Employee Engagement Scores
Context
Employee engagement is an important metric that helps us measure the alignment our people have with our goals as an organization, and their commitment to the company’s success.
Target
Achieve an average employee engagement score of at least 75 percent on the annual survey
Performance not achieved
The average employee engagement score was 73 percent in 2011. Our surveyed employees continue to emphasize the need for better communication between supervisors and their teams. Efforts to improve performance in this area are ongoing, as Human Resources and management continue to enhance our leadership training and integrate our leadership core competencies in recruitment and performance management.
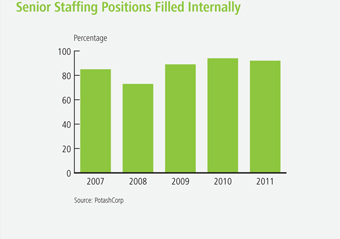
Promoting From Within
Context
We try to fill the majority of vacancies for senior positions with qualified internal candidates who are ready for new and greater challenges. We believe this approach motivates our people, broadens their knowledge, rewards consistent efforts and provides continuity for our business.
Target
Fill at least 75 percent of senior staff openings with qualified internal candidates
Performance achieved
We filled 92 percent of senior staff openings with qualified internal candidates.
External Acceptance Rate
Context
The company’s growth and the need to replace employees at or nearing retirement make it necessary for us to attract a significant quantity of new talent. This is a key metric to determine our attractiveness in an increasingly competitive labor market.
Target
Achieve an acceptance rate of 85 percent on all external staff-level employment offers made
Performance achieved
An acceptance rate of 93 percent indicates that we remain competitive in the industry and an employer of choice in the regions where we operate.
Progress Toward Our Goal
1 Partnering with the Aboriginal community
We are making significant efforts to build a more diverse workforce. We signed a Memorandum of Understanding with the Saskatoon Tribal Council – rooted in common values of respect, communication and education – designed to increase opportunities for First Nations workers and suppliers.
2 Developing tomorrow’s leaders
We estimate that in the next three years, we will add almost 800 positions in potash and need to replace approximately 300 retiring employees. With such significant growth, leadership training is a primary focus. All our sites have adopted leadership core competencies, and many have incorporated these guidelines into their selection criteria and performance evaluations.
3 Enhancing recruitment outreach
PotashCorp participated in more career fairs and student events across Canada and the US in 2011 than ever before. We have developed partnerships with post-secondary institutions and other mining companies to attract required talent to Saskatchewan. We have also significantly enhanced our scholarships to build a talented and diversified workforce.
69
Students hired into summer internships or co-op positions in 2011
136
Average number of training hours per employee in 2011
61%
2011 increase in scholarship and bursary funds awarded
29
GOAL
Achieve no harm to people and no damage to the environment
Why Our Performance Matters
Creating safe and environmentally sound operations is so vital to our company that it is embedded in our goals and Core Values. Rooted in respect for people and the planet, this goal reflects our priority of doing the right thing – and doing it well.
Targets
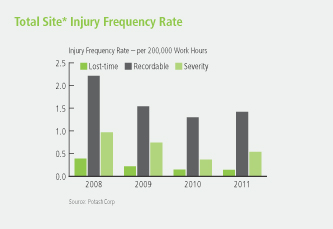
Site Severity Injury Rates and Life-Altering Injuries
Context
Our No. 1 focus is to keep our people safe. We strive to continually improve our safety systems, to prevent accidents and promote safe behavior, and to ensure accountability throughout our operations by reporting on our performance.
Target
| • | | Achieve zero life-altering injuries at our sites |
| • | | Reduce total site* severity injury rate** by 35 percent from 2008 levels by the end of 2012 |
Performance
not achieved
Sadly, we had a fatality at our Aurora phosphate facility in 2011.
on track
We have achieved a 44 percent reduction from 2008 through 2011.
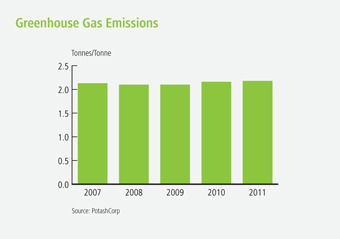
Greenhouse Gas Emissions
Context
Our target to reduce total greenhouse gas (GHG) emissions by 10 percent is voluntary and not required by regulations.
Our nitrogen production is responsible for more than 85 percent of our total GHG emissions, mostly through ammonia and nitric acid production. An ammonia plant emits CO2 by burning fuel and as a byproduct of production. Some of this CO2 is sold as a product, while some is used to make urea. The remainder is vented as process CO2.
Target
Reduce company-wide GHG emissions per tonne of product by 10 percent by the end of 2012, compared to 2007
Performance on track
We installed GHG controls at our largest nitric acid plant in 2011, which is expected to lower overall company-wide emissions in future years.
| * | Total site includes PotashCorp employees, contractors and all others on site. |
| ** | Severity injury rate is the total of lost-time injuries and modified work injuries for every 200,000 hours worked. |
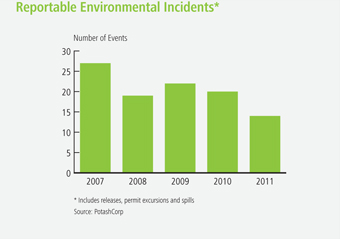
Reportable Environmental Incidents
Context
To be a good neighbor, we must care for our resources and pay attention to our environmental footprint. We measure and report all environmental incidents that occur within our operations while looking for ways to reduce all negative impacts.
Target
Reduce total reportable incidents (releases, permit excursions and spills) by 10 percent from our 2010 levels
Performance achieved
We had 14 reportable incidents in 2011, which represented a 30 percent reduction from 2010 levels. This was the lowest number of incidents since we began reporting these data.
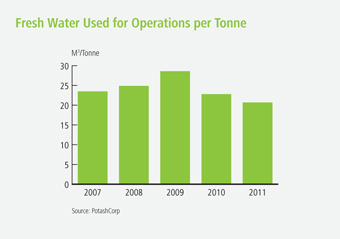
Water Usage per Product Tonne
Context
After evaluating our use, discharges and local availability in 2010, we established a new water use efficiency target in 2011. Most of our operations are closed loop by design to minimize water losses.
Target
Maintain or reduce company-wide water usage per tonne of product
Performance achieved
Company-wide water usage in processing plants decreased by 9 percent from 2010 levels. In 2011, 92 percent of the water used in our operations was recycled.
31

GOAL
Achieve no harm to people and no damage to the environment
(continued)
Progress Toward Our Goal
1 Keeping safety at the forefront
Our employees understand how safety impacts everyone every day. PotashCorp’s safety record and all incidents are shared daily across the company to help ensure we learn from our experience. At each of our sites, we stress the importance of getting back to basics – refocusing on validating our safety procedures and ensuring they are being used effectively.
2 Recognizing results
In 2011, most of our facilities reached safety milestones, which were recognized company-wide as we believe recognizing our employees in this way is critical to the ongoing development of our “culture of caring.” The International Fertilizer Industry Association recognized PCS Nitrogen Trinidad for its excellent safety, health and environmental performance by selecting it as first runner-up for the prestigious Green Leaf Award.
3 Implementing best practices
At all our sites, we are implementing a process aimed at preventing serious injuries and fatalities (SIF). Applying what we learned through participation in a research project led by Behavioral Science Technology (BST), our strategy focuses on the potential outcome of incidents and near-misses. By identifying and investigating incidents with SIF potential, we can better develop action plans to eliminate such exposures.
4 Developing new environmental targets
We are monitoring waste and water usage with the aim of setting new reduction targets in 2013. We have included energy efficiency and environmental observation metrics in our short-term incentive plans (STIP) at sites to better align our reward structure with environmental performance.
5 Protecting water, land and air
Water: We are exploring projects at our phosphate facilities –the largest user of water in our operations – to improve efficiency. In 2011, we installed reverse osmosis technology to increase water recycling at our Lima nitrogen facility, reducing overall use.
Land: While our production process does impact land, particularly in our phosphate operations, we remain steadfast in our commitment to restore land disturbed at Aurora and White Springs.
Air: Beyond complying with all required laws and regulations, we search for ways to reduce GHG and other emissions. In 2011, we completed the installation of air pollution controls at one of our nitric acid plants at Geismar, which has reduced its GHG emissions by an estimated 75 percent.
2 to 1
Acres restored for each acre used in our phosphate mining at Aurora
30%
Reduction in reportable environmental incidents
44%
Reduction in site severity injury rate from 2008 levels
Building and protecting value with governance
Governance and Remuneration at PotashCorp
Our Board of Directors and its committees fulfill their responsibility to stakeholders by developing governance and remuneration practices that minimize risk, maximize management performance and ensure the integrity and transparency of the company.
Combined with stakeholder engagement efforts, such practices help build long-term value for the company, reduce reputational risk and protect the interests of the stakeholders who are essential to PotashCorp’s success.
By monitoring regulatory developments and company disclosure, the Board continually evaluates and enhances PotashCorp’s corporate governance practices.
The Board is also committed to engaging stakeholders on compensation, sustainability, governance and other important items to determine and better serve their interests.
Board’s view on directors
Each director must possess and exhibit the highest degree of integrity, professionalism, values and independent judgment. Directors and senior officers are bound by the “PotashCorp Governance Principles” and “PotashCorp Core Values and Code of Conduct,” which can be found together with other governance-related documents on the company’s website.
We believe boards function most effectively when individual directors are free from conflicts of interest and exercise independent judgment in discharging their responsibilities. We comply with the independence requirements of all applicable regulators.
All directors are elected by the shareholders each year at the annual meeting of shareholders. When filling director vacancies, the greatest emphasis is on finding the best qualified candidates given the Board’s particular needs and circumstances.
| | | | |
| # 1 | | PotashCorp’s governance ranking among 253 companies in The Globe and Mail Board Games in 2011 | | |
| | | |  |
| | |
| | | | More information on our director nomination and Board renewal process can be found in the Corporate Governance section of our 2012 Proxy Circular. |
33
Our Approach to Executive Compensation
We design executive compensation policies to attract, motivate and retain world-class talent to lead our company and to maximize long-term shareholder value. Our program:
| • | | Links much of executive compensation to performance that drives long-term stakeholder value; |
| • | | Aligns executive interests with shareholders through stock ownership requirements; |
| • | | Benchmarks compensation levels to a peer group median, providing executives with the opportunity to earn above the median through short-, medium- and long-term incentive plans; and |
| • | | Helps guard against excessive risk-taking. |
Aligning compensation with company goals
At PotashCorp, accountability is a core value. To that end, we annually set targets that reflect the interests of our stakeholders and hold ourselves accountable to these targets. We design our compensation plans to help drive achievement of our goals and objectives.
The compensation committee considers it a serious responsibility to maintain full transparency and garner feedback from our shareholders on our executive compensation program. In 2011 and 2010, we reached out to stakeholders through our website, and provided an opportunity for them to comment through a survey.
Please visitPotashCorp.com to participate in the 2012 executive compensation survey.
Pay for Performance
| | |
Goal | | Alignment with Compensation |
| |
| Create superior shareholder value | | At-risk incentive compensation plans include short-term, medium-term and long-term cycles and are based on TSR, share appreciation or a related measure. |
| Be the supplier of choice to the markets we serve | | The short-term incentive program (STIP) is based on annual Board-approved goals for sales, productivity and profitability. Achieving them requires us to meet the needs of our customers. |
| Build strong relationships with and improve the socioeconomic well-being of our communities | | Our policy is to invest 1 percent of consolidated income before income taxes on a five-year rolling average in the communities in which we work and other philanthropic programs. We actively encourage all employees, particularly executives, to participate in philanthropic programs in our communities, and we offer gift-matching opportunities for our employees. To make this investment in our communities, it is important to sustain earnings on a consistent basis. |
| Attract and retain talented, motivated and productive employees who are committed to our long-term goals | | Target compensation is competitive with the industry average. Executives are motivated to achieve strong results through opportunities to earn above target based on company and individual performance. |
Achieve no harm to people and no damage to the environment | | At all plant locations, one-half of the annual STIP payout depends on performance in relation to local metrics, a significant portion of which relates to safety and environmental performance. |
To learn more about our compensation practices and policies, visitPotashCorp.com
| | |
| 34 | | Governance and Compensation |
Board of Directors


Learn more atPotashCorp.com

Top to bottom(l to r)
Christopher M. BurleyA,D
Calgary AB
William J. Doyle
Saskatoon SK
John W. EsteyB,C
Glenview IL
Gerald W. Grandey
Saskatoon SK
C. Steven HoffmanC,D
Lincolnshire IL
Dallas J. Howe (Chair)A
Calgary AB
Alice D. LabergeA,D
Vancouver BC
Keith G. MartellB,D
Saskatoon SK
Jeffrey J. McCaigB,D
Calgary AB
Mary MogfordA,B
Newcastle ON
Paul J. Schoenhals* B,C
Calgary AB
E. Robert Stromberg* C
Jackfish Lake SK
Elena Viyella De PalizaC
Dominican Republic
Committees:
| (A) | Corporate Governance and Nominating (B) Compensation |
| (C) | Safety, Health and Environment (D) Audit |
35
Senior Management
Top(l to r)
William J. Doyle
President and Chief Executive Officer
Wayne R. Brownlee
Executive Vice President
and Chief Financial Officer
G. David Delaney
Executive Vice President
and Chief Operating Officer
Stephen F. Dowdle
President, PCS Sales
Garth W. Moore
President, PCS Potash
Middle(l to r)
Brent E. Heimann
President, PCS Phosphate
and PCS Nitrogen
Joseph A. Podwika
Senior Vice President,
General Counsel and Secretary
Robert A. Jaspar
Senior Vice President,
Information Technology
Denis A. Sirois
Vice President and Corporate Controller
Daphne J. Arnason
Vice President, Internal Audit
Bottom(l to r)
Denita C. Stann
Vice President, Investor and Public Relations
Lee M. Knafelc
Vice President, Human Resources and Administration
Mark F. Fracchia
Vice President, Safety, Health and Environment
Darryl S. Stann
Vice President, Procurement
Company Information and Disclosure
Investor Inquiries
Denita Stann, Vice President, Investor and Public Relations
Canada: (800) 667-0403
US: (800) 667-3930
email: ir@potashcorp.com
Visit us at www.potashcorp.com
Corporate Headquarters
Suite 500, 122 – 1st Ave S
Saskatoon SK S7K 7G3
Canada
Phone: (306) 933-8500
Forward-Looking Statements
This 2011 Summary Annual Report contains forward-looking statements or forward-looking information (forward-looking statements). These statements can be identified by expressions of belief, expectation or intention, as well as those statements that are not historical fact. These statements are based on certain factors and assumptions as set forth in this 2011 Summary Annual Report, including with respect to: foreign exchange rates; expected growth, results of operations, performance, business prospects and opportunities; and effective tax rates. While the company considers these factors and assumptions to be reasonable based on information currently available, they may prove to be incorrect. Several factors could cause actual results to differ materially from those in the forward-looking statements, including, but not limited to: variations from our assumptions with respect to foreign exchange rates, expected growth, results of operations, performance, business prospects and opportunities, and effective tax rates; fluctuations in supply and demand in the fertilizer, sulfur, transportation and petrochemical markets; costs and availability of transportation and distribution for our raw materials and products, including railcars and ocean freight; changes in competitive pressures, including pricing pressures; adverse or uncertain economic conditions and changes in credit and financial markets; the results of sales contract negotiations with major markets; the European sovereign debt crisis and the recent downgrade of US sovereign debt and political concerns over budgetary matters; timing and impact of capital expenditures; risks associated with natural gas and other hedging activities; changes in capital markets and corresponding effects on the company’s investments; unexpected or adverse weather conditions; changes in currency and exchange rates; unexpected geological or environmental conditions, including water inflows; imprecision in reserve estimates; adverse developments in new and pending legal proceedings or government investigations; acquisitions we may undertake; strikes or other forms of work stoppage or slowdowns; changes in, and the effects of, government policies and regulations; and earnings, exchange rates and the decisions of taxing authorities, all of which could affect our effective tax rates. Additional risks and uncertainties can be found in our Form 10-K for the fiscal year ended December 31, 2011 under the captions “Forward-Looking Statements” and “Item 1A – Risk Factors” and in our filings with the US Securities and Exchange Commission and the Canadian provincial securities commissions. Forward-looking statements are given only as at the date of this report and the company disclaims any obligation to update or revise the forward-looking statements, whether as a result of new information, future events or otherwise, except as required by law.
Market and Industry Data Statement
Some of the market and industry data contained in this Summary Annual Report are based on internal surveys, market research, independent industry publications or other publicly available information. Although we believe that the independent sources used by us are reliable, we have not independently verified and cannot guarantee the accuracy or completeness of this information. Similarly, we believe our internal research is reliable, but such research has not been verified by any independent sources.
Information in the preparation of this Summary Annual Report is based on statistical data and other material available at February 21, 2012.
Sources, Abbreviations and Terms
| | |
| APC | | Arab Potash Company Ltd. (Amman: ARPT), Jordan |
| |
| Canpotex | | Canpotex Limited, Canada |
| |
| ICL | | Israel Chemicals Ltd. (Tel Aviv: ICL), Israel |
| |
| MT | | Metric tonne |
| |
| MMT | | Million metric tonnes |
| |
| NYSE | | New York Stock Exchange, USA |
| |
| Sinofert | | Sinofert Holdings Limited (HKSE, 0297.HK), China |
| |
| SQM | | Sociedad Quimica y Minera de Chile S.A. (Santiago Bolsa de Comercio Exchange, NYSE: SQM), Chile |

PotashCorp2011AR.com
| | |
 | | PotashCorp.com Visit us online |
| |
 | | Facebook.com/PotashCorp Find us on Facebook |
| |
 | | Twitter.com/PotashCorp Follow us on Twitter |