Exhibit 13
Feeding Tomorrow
2011 Annual Report


Inside:
| | |
Introduction |
| |
| 2 | | CEO Letter |
| |
| 7 | | A Comparison of Our Nutrients |
| |
| 8 | | Comparison to Peers |
|
| |
|
Management’s Discussion & Analysis |
|
Operating Context |
| |
| 10 | | Business Overview |
| |
| 12 | | The Value of Fertilizer |
|
Business Model |
| |
| 15 | | How We Create Value |
| |
| 20 | | Risks to Our Strategy |
|
Performance |
| |
| 23 | | Highlights |
| |
| 26 | | Factors Affecting Our 2011 Performance |
| |
| 28 | | 2012 Outlook |
| |
| 31 | | Goals & Targets |
|
Our Nutrients |
|
Potash |
| |
| 44 | | What Matters |
| |
| 45 | | Our Markets |
| |
| 46 | | Our Strategic Approach |
| |
| 46 | | Priorities |
| |
| 49 | | Results & Performance |
|
Phosphate |
| |
| 53 | | What Matters |
| |
| 53 | | Our Markets |
| |
| 54 | | Our Strategic Approach |
| |
| 54 | | Priorities |
| |
| 55 | | Results & Performance |
| | |
Nitrogen |
| |
| 59 | | What Matters |
| |
| 59 | | Our Markets |
| |
| 60 | | Our Strategic Approach |
| |
| 60 | | Priorities |
| |
| 61 | | Results & Performance |
|
Financial Structure |
| |
| 64 | | Expenses & Other Income |
| |
| 65 | | Quarterly Results |
| |
| 67 | | Financial Condition Review |
| |
| 68 | | Liquidity & Capital Resources |
| |
| 70 | | Capital Structure & Management |
| |
| 72 | | Other Financial Information |
| |
| 73 | | Governance & Remuneration |
| |
| 77 | | Forward-Looking Statements |
| |
| 78 | | Non-IFRS Financial Measures |
|
| |
| |
| 79 | | 11 Year Data |
|
| |
|
Financials |
| |
| 85 | | Management’s Responsibility for Financial Reporting |
| |
| 86 | | Independent Registered Chartered Accountants’ Reports |
| |
| 88 | | Consolidated Financial Statements |
|
| |
| |
| 156 | | Shareholder Information |
| |
| 157 | | Appendix |
|
| |
|
| Financial data in this report are stated in US dollars unless otherwise noted. |

Food and Our Future
We look to tomorrow with big aspirations.
We envision a world where no child goes to bed hungry, where dinner tables in every home are filled with healthy food. This aspiration motivates us as stewards of the resources and relationships with which we have been entrusted.
Our products play an important role in helping feed a rising world population. We are proud of our contribution to global food production, and excited by the value we believe can be generated for our stakeholders as we grow our company.
This report provides an update on our performance and strategies in all areas of our business, each designed to create lasting value. As we create such value, we know that what we do today is helping to feed tomorrow.
| | |
| PotashCorp 2011 Annual Report | | 1 |
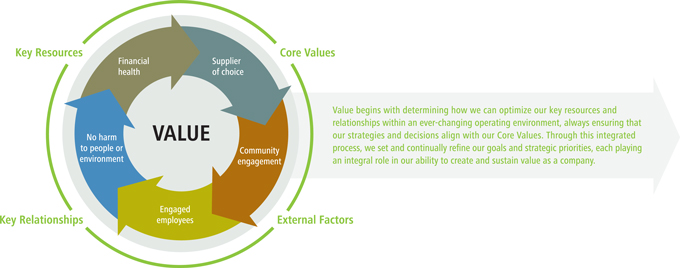
Value Reporting
To be successful in a changing world, you have to evolve. Our reporting continues to reflect an evolution in the way we discuss how we create and sustain value in our business.
Although we have always managed our business in an integrated manner, this year we sought to improve the way we convey the connections among the factors that inform our strategies. We are doing this because we believe we have a responsibility not just to create value, but to help people better understand what we offer to the world.
You will see the same level of accountability for the company’s financial performance in the pages that follow, and online, but we have taken a step forward by discussing our financial and sustainability strategies and performance together, reflecting their interdependence. Our reporting will continue to evolve as we look for better ways to clearly and concisely communicate the role our strategies play in creating value for our key stakeholders.
This integrated report is a record of our process and progress in our pursuit of that worthy goal.
William J. Doyle
President and
Chief Executive Officer
CEO Letter
Part of a Bigger World
Throughout history, human progress has been rooted in agriculture. The ability to grow nutritious food has provided people with the opportunity to lead healthier lives, build stronger communities and create industries and social systems that support continuing advancement.
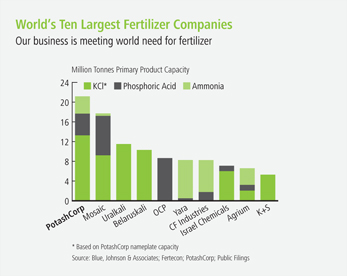
As the world’s largest fertilizer producer by capacity, PotashCorp plays an integral role in agriculture. Approximately 50 percent of global food production can be attributed to the use of nitrogen, phosphate and potash – the three essential crop nutrients we produce. In simple terms, our products help grow food.

| | |
| 2 | | PotashCorp 2011 Annual Report |
Ours is a business that connects us to people on every continent and inspires us to contribute to positive change – where we work, where we live and where we serve our customers. We recognize that we are part of a bigger world and that our performance as a fertilizer supplier, an employer, a community leader and an investment choice can create value beyond traditional measures.
Rather than accept a narrow view of our role, we work closely with our stakeholders to understand their needs and maximize the long-term benefits of our world-class assets.
By building strong relationships, prudently managing our resources and operating according to consistent, transparent values, we believe we can generate superior long-term financial performance. And, with strong and sustainable financial returns, we can grow to meet the needs of our customers and create opportunities for our people and our communities.
It is a circle of success that not only serves our company and our stakeholders, we believe it can help increase global food security and drive social and economic progress.
As Aristotle wrote 2,500 years ago, the whole is greater than the sum of its parts. At PotashCorp, we understand that our contributions to food production are felt on a broad scale.
A World With Growing Needs
While the past half-century brought unprecedented growth in food production, the challenge today is to keep pace with ongoing population and economic development.
World population has surpassed 7 billion – nearly double the number on the planet when I joined the fertilizer business almost 40 years ago. In recent decades, we have seen prosperity improve on a global scale, especially in the developing world, making it possible for millions of additional people to enjoy more and better food. While this is a tremendously positive human development story, the need to produce more food per acre puts constant pressure on the world’s farmers and their soils.
This challenge of feeding a growing world is not expected to subside. The United Nations estimates that the global population will exceed 9 billion by 2050 – another 2 billion people who need to eat. It is not good enough to hope for a record harvest; the world must generate higher crop yields year after year.
This is the reality facing global agriculture. To feed tomorrow, we need to start today.
“We believe we have a responsibility not just to create value, but to help people better understand what we offer the world.”
– William J. Doyle

| | |
| PotashCorp 2011 Annual Report | | 3 |
2011 Highlights
$3.51 per share*
80 percent increase in earnings from the previous year
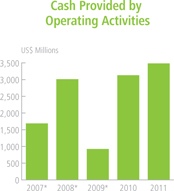
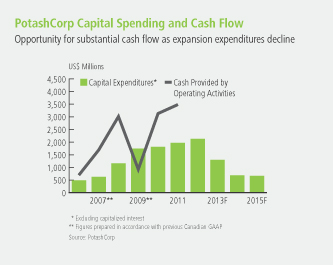
$3.5 billion
Record cash provided by operating activities
$21 million
Contribution to community organizations and causes
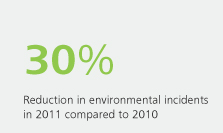
30%
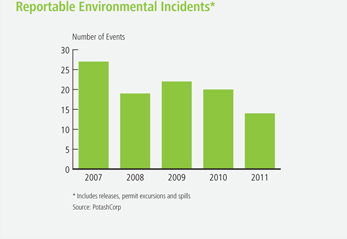
Reduction in reportable environmental incidents
Preparing Today
At PotashCorp, we recognize that creating sustainable value requires an integrated focus which acknowledges the needs of all those who are key to the ongoing success of our business.
To achieve this, we pursue long-term priorities which stem from the company goals that support our continuing growth and that of our stakeholders. In 2011, we took important steps forward in each of these areas.
We delivered the second-highest earnings per share in our history, 80 percent more than the previous year. Despite this strong financial result, our share performance was affected by macroeconomic uncertainty in the second half of the year and the resulting temporary slowdown in fertilizer demand. While we outperformed our fertilizer peer group, our total shareholder return failed to exceed that of our benchmark, the DAXglobal Agribusiness Index.
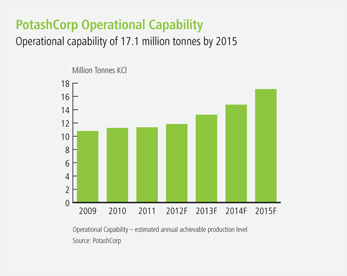
However, our strong financial performance and record cash flow allowed us to raise our dividend in both 2011 and 2012, and supported ongoing investment in our industry-leading potash expansion program. In 2011, we spent nearly $1.5 billion and moved a step closer to our expected 17.1 million tonnes of operational capability by 2015.
Our willingness and ability to prepare for our customers’ long-term needs, combined with the knowledge of our sales team and strength of our distribution system, helped us remain the supplier
| * | Diluted net income per share. |
| | |
| 4 | | PotashCorp 2011 Annual Report |
of choice in customer surveys again in 2011. While these results suggest that we are doing many things right, we know we must earn our stripes each and every day.
The value of our operations and ongoing expansion program is also being felt in our communities, as we create opportunities for people inside our company and attract new talent for the future. In 2011, we hired and trained 475 new employees and worked closely with local suppliers, creating economic benefits that help keep our communities growing. According to a recent economic impact study, our potash expansions are expected to create more than 36,000 person-years of employment in Saskatchewan, helping to drive the province’s strong economy.
We recognize that a community is built on more than its economy and that we can play a leadership role in improving the areas where we operate. We contributed a record $21 million to organizations and causes in 2011 – a product of our continuing financial strength. I am so proud that our employees also stepped up to the plate, not only through their financial contributions that we match as a company but through their tremendous volunteerism and participation in community events.
By being a good neighbor, we earn trust and support that are necessary to fuel our future growth. In each of the communities surveyed in 2011, PotashCorp earned recognition for leadership and contributions, but we also asked for feedback about things we could do better.
Every relationship is important to understanding the full measure of our performance, but we place one priority above all others: protecting our people.
Sadly, we experienced a fatality at our Aurora phosphate operation during the year – a painful reminder to every person in our company that we must always be vigilant in our focus on safety. This commitment resonates from the Board of Directors through our executive team to each and every front-line employee.
We also place priority on reducing our environmental impact. In 2011, our reportable environmental incidents decreased by 30 percent from the 2010 level – the lowest total in our company history. This demonstrates the commitment of our people to environmental responsibility today, so we can do our part in providing a better world tomorrow.
Feeding Tomorrow
We are confident that our value as a company and the importance of our contribution to global food production will rise in the years ahead.
The push to increase crop yields, underpinned by the basics of soil science and supportive crop economics, is expected to create more demand for all three essential crop nutrients. However, we believe it will have the greatest effect on potash, which historically has been under-applied in many developing regions.
| | |
| PotashCorp 2011 Annual Report | | 5 |
In 2011, global potash shipments reached an estimated 55 million tonnes, nearly eclipsing the previous record. We expect further increases in 2012 and beyond, and new supply will be required to meet this demand.
Many companies are now making announcements about staking new potash deposits, beginning feasibility studies or commencing early development work. These are initiatives that – if they proceed – will take significant capital investment and require many years to construct and ramp up to full production.
Against this backdrop, our decision to initiate expansions almost a decade ago differentiates us from our peers. We have now spent approximately 75 percent of the anticipated capital designed to almost double the capability we had when the program was initiated in 2003. We have completed projects at Rocanville, Allan, Lanigan, Cory and Patience Lake and have introduced new production in response to growing demand. We are ramping up production at Cory in 2012 and continue our major projects at Allan, Rocanville and New Brunswick.
While others are prospecting, planning or searching for capital, we are ready to bring on more new supply over the next five years than any other company. Our commitment to these projects – even through the depths of the recession in 2009 – means we were building when few others were, giving us what we believe will be a clear time and cost advantage.
By recognizing the long-term nature of our business, we are ready to contribute to feeding tomorrow and to deliver the benefits to all our stakeholders.
Responsible Long-Term Stewardship
Today’s world brings heightened expectations and new opportunities for our company, but we will continue to follow the same patient, disciplined and responsible approach that has defined PotashCorp for more than two decades.
We have access to some of the world’s best potash resources and we recognize our responsibility to be a good steward and maximize their long-term value – for our company and for those who will depend on them to protect soil fertility for generations to come.
As optimistic as we are about the future, we know that growth in the fertilizer industry does not follow a straight line. Even with the increase in global food demand, commodity and financial markets were volatile in 2011 because of macroeconomic issues such as concerns related to sovereign debt. This caused farmers and fertilizer dealers to move cautiously as the year came to a close.
We responded as we have in the past by taking production downtime. This strategy of matching supply to demand reflects our continuing operational discipline and our commitment to thinking for the future. Our priority is long-term, responsible resource management rather than short-term rewards.
Measuring Value
In 2011, the Canadian Institute of Chartered Accountants (CICA) honored us with an award for the best financial reporting in Canada – the ninth consecutive year we have earned a place on the CICA awards list. Still, for the benefit of our stakeholders, we strive for continuing improvement.
This year you will see a further evolution in our reporting as we endeavor to provide all those who share our interest in PotashCorp with the best information possible to assess our performance. This approach is supported by a progressive and engaged Board of Directors which sets the stage for a high-performing company that delivers more than financial excellence.
This integrated way of operating – and now reporting – reflects the thinking of management and the commitment of our people. We believe that our approach will help us evolve as a company while playing a key role in feeding tomorrow.

William J. Doyle
President and Chief Executive Officer
February 21, 2012
| | |
| 6 | | PotashCorp 2011 Annual Report |
| | | | | | |
 | |  | |  | |  |
| | | |
| How Used | | Fertilizer: | | Fertilizer: | | Fertilizer: |
| | | |
| | Improves root strength and disease resistance, assists water retention, enhances taste, color and texture of food | | Aids in photosynthesis, speeds crop maturity | | Builds proteins and enzymes, speeds plant growth |
| | | |
| | Feed: | | Feed: | | Feed: |
| | | |
| | Aids in animal growth and milk production | | Assists in muscle repair and skeletal development | | Essential to RNA, DMA and cell maturation |
| | | |
| | Industrial: | | Industrial: | | Industrial: |
| | | |
| | | Used in soaps, water softeners, de-icers, drilling muds and food products | | Used in soft drinks, food additives and metal treatments | | Used in plastics, resins and adhesives |
| | | |
| How Produced | | Mined from evaporated sea deposits | | Mined from ancient sea fossils | | Synthesized from air using steam and natural gas or coal |
| | | | |
| Number of Producing Countries | | 12 | | ~ 40 | | ~ 60 |
| | | |
| Percentage of Global Production Traded | | 76% | | 11% | | 12% |
| | | | |
| Raw Material Volatility | | Low | | Moderate-High | | Low-High |
| | | |
Time for Greenfield (including ramp-up) | | Minimum 7 years1 | | 3-4 years | | Minimum 3 years |
| | | | |
Cost of Greenfield (excluding infrastructure) | | CDN $4.1 billion1 2 million tonnes KCl | | US $1.6 billion2 1 million tonnes P2O5 | | US $1.7 billion3 1 million tonnes NH3 |
| | | |
Cost of Greenfield (including infrastructure)4 | | CDN $4.7-$6.3 billion 2 million tonnes KCl | | US $2.1-$2.3 billion 1 million tonnes P2O5 | | US $1.8-$2.0 billion 1 million tonnes NH3 |
| 1 | Estimated time and cost for a conventional greenfield mine in Saskatchewan |
| 2 | Phosphate rock mine, sulfuric acid plant, phosphoric acid plant and DAP/MAP granulation plant |
| 4 | Includes rail, utility systems, port facilities and, if applicable, cost of deposit |
Source: Fertecon, CRU, AMEC, PotashCorp
| | |
| PotashCorp 2011 Annual Report | | 7 |
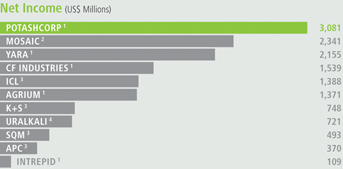
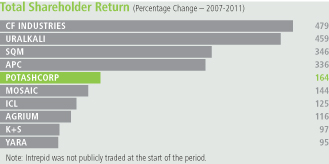
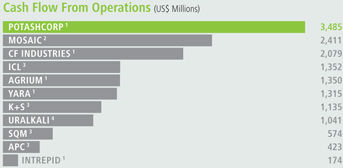
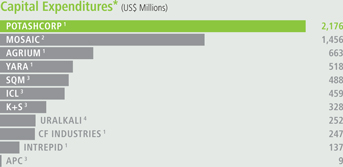
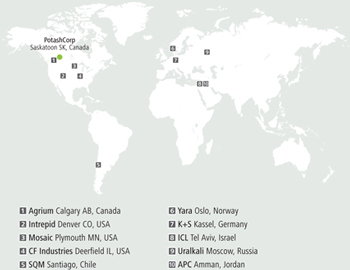
Comparison to Peers
Peers in Our Industry
In our efforts to achieve the highest sustainable results for our shareholders, management evaluated our 2011 performance against the DAXglobal Agribusiness Index and our peers in the fertilizer sector. Some of the key metrics tracked are set out on this page.
Comparability of peer information
This information is included for comparison only. All peer group financial information included in the performance summary was obtained from publicly available reports published by the respective companies. We have not independently verified and cannot guarantee the accuracy or completeness of such information.
Readers are cautioned that not all of the companies identified in this group prepare their financial statements (and accompanying notes) in accordance with International Financial Reporting Standards (IFRS), as issued by the International Accounting Standards Board (IASB). Accounting principles generally accepted in the foreign jurisdictions in which these peers operate may vary in certain material respects from IFRS, as issued by the IASB. Further, companies which do prepare their statements according to IFRS may use varying interpretations of the standards. Such differences (if and as applicable) have not been identified or quantified for this performance summary. For those companies with fiscal year-ends other than December 31, all financial information was based on the 12-month period comprising the most recent four fiscal quarters reported upon by such companies. In addition to the issues described above, the different reporting periods among the peer group may affect comparability of the information presented.
Source: Bloomberg
* Capital expenditures = additions to property, plant and equipment
1 Year ended December 31, 2011
2 Most recent four fiscal quarters ended November 30, 2011
3 Most recent four fiscal quarters ended September 30, 2011
4 Most recent two fiscal halfs ended June 30, 2011
| | |
| 8 | | PotashCorp 2011 Annual Report |
Management’s Discussion & Analysis
of Financial Condition and Results of Operations (in US dollars)
The following discussion and analysis is the responsibility of management and is as of February 21, 2012. The Board of Directors carries out its responsibility for review of this disclosure principally through its audit committee, comprised exclusively of independent directors. The audit committee reviews this disclosure and recommends its approval by the Board of Directors. Additional information relating to PotashCorp (which is not incorporated by reference herein) can be found in our regulatory filings on SEDAR at www.sedar.com and on EDGAR at www.sec.gov.
All references to per-share amounts pertain to diluted net income per share (EPS) as described in Note 22 to the consolidated financial statements.

Laboratory technician Karrie-Ann Noble observes construction of the new mill at our Rocanville potash mine.
Our Business – An Overview
Our Vision:
To play a key role in the global food solution while building long-term value for all stakeholders.
Who We Are:
PotashCorp is the world’s largest fertilizer company by capacity1, producing the three primary crop nutrients – potash (K), phosphate (P) and nitrogen (N). Through our Canadian operations, we are responsible for about 20 percent of global potash capacity. In addition, we hold strategic investments in other potash-related businesses in South America, the Middle East and Asia. We complement our potash assets with focused positions in phosphate and nitrogen.
With operations and business interests in seven countries, PotashCorp is an international enterprise and a major player in meeting the growing challenge of feeding the world.
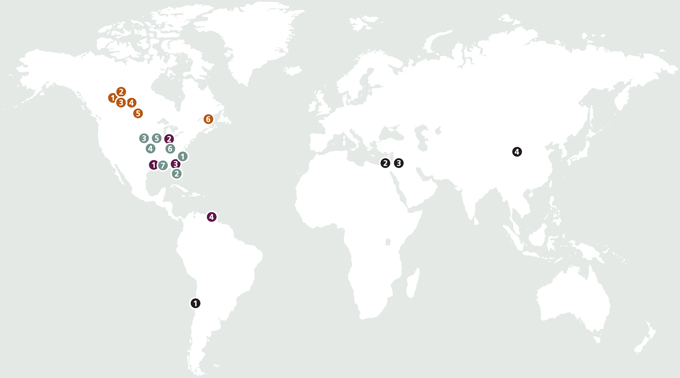
Our Operations and Communities:
| | | | | | |
| Potash | | Phosphate | | Nitrogen | | Investments |
| 1 Cory SK | | Mining/Processing: | | 1 Geismar LA | | 1 SQM, Chile (32%) |
| 2 Patience Lake SK | | 1 Aurora NC | | 2 Lima OH | | 2 ICL, Israel (14%) |
| 3 Allan SK | | 2 White Springs FL | | 3 Augusta GA | | 3 APC, Jordan (28%) |
| 4 Lanigan SK | | Upgrading: | | 4 Trinidad | | 4 Sinofert, China (22%) |
| 5 Rocanville SK | | 3 Weeping Water NE | | | | |
| 6 Sussex NB | | 4 Joplin MO | | | | |
| | 5 Marseilles IL | | | | |
| | 6 Cincinnati OH | | | | |
| | 7 Geismar LA | | | | |
| | |
| 10 | | PotashCorp 2011 Annual Report |
Our Business Segments
| | | | | | |
| 2011 DATA | | POTASH | | PHOSPHATE | | NITROGEN |
| | | |
| Percentage of World Capacity1 | | 20% #1 in the world | | 5% #3 in the world | | 2% #3 in the world |
Sales Volumes by Segment
n Fertilizer
n Feed
n Industrial
Sales Volumes by Region
n North America
n Offshore
Gross Margin
Percentage of Net Sales
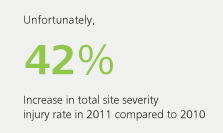
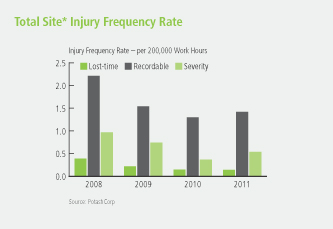
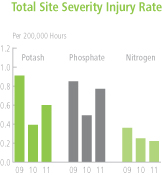
Total Site3Severity Injury Rate4
| 1 | Based on nameplate capacity at year-end 2011, which may exceed operational capability (estimated annual achievable production level) |
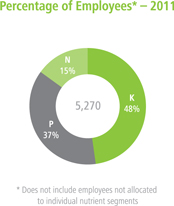
| 2 | Does not include employees not allocated to individual nutrient segments |
| 3 | Total site includes PotashCorp employees, contractors and all others on site. |
| 4 | Site severity injury rate is the total of lost-time injuries and modified work injuries for every 200,000 hours worked. |
| | |
| PotashCorp 2011 Annual Report | | 11 |
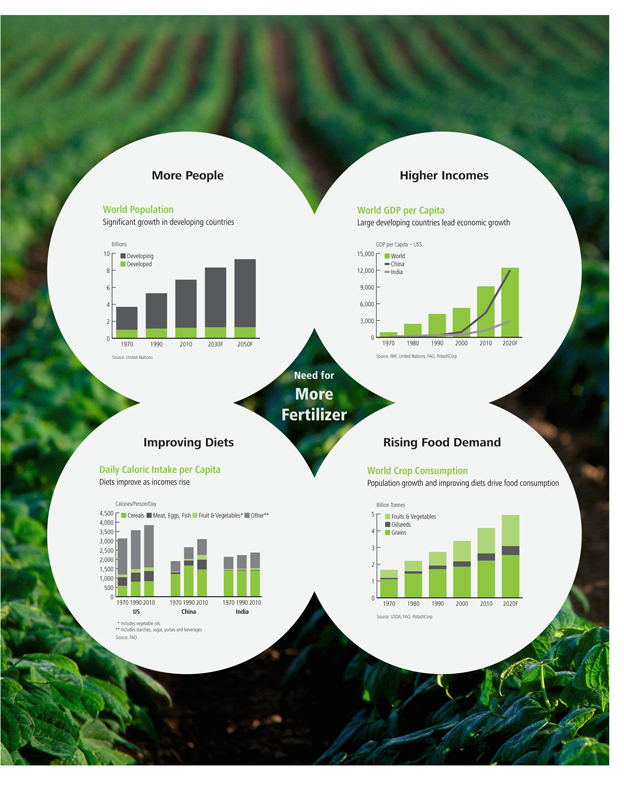
The Value of Fertilizer
| | |
 | | As population rises to a projected 9 billion-plus by 2050 and diets improve in developing countries, the world faces unprecedented challenges to keep pace with the growing demand for food. Modern agriculture – which includes the use of balanced fertilization – is essential to address this need. |
| | Research shows that approximately 50 percent of food production can be attributed to fertilizer use, and we believe fertilizer will become even more important in the coming years. By following science-based fertilization practices, farmers today can grow more food while using less land, sparing the forests that protect our air and preserving the resources upon which life depends. |
| | The Food and Agriculture Organization of the United Nations (FAO) estimates that crop production must rise 70 percent by 2050 to meet the accelerating need for food. With declining arable land per capita, this means every acre must become more productive. |
| | To grow more food, the world needs more fertilizer. This is particularly true in developing countries where farmers often do not apply crop nutrients at recommended levels and yields are well below those of the developed world. |
| | With demand for food rising and farmers motivated by strong agricultural fundamentals, the need for fertilizer has never been greater. As the world’s largest producer by capacity*, we play an important role in meeting this need. |
9billion +
Expected global population by 2050
Source: United Nations
~ 50%
Current crop yield directly attributable to fertilizer use
Source: Agronomy Journal (January-February 2005), IPNI
70%
Estimated increase in crop production required by 2050
Source: FAO
590billion
Equivalent tonnes of CO2that modern agriculture has kept from entering the atmosphere since the early 1960s
Source: PNAS (May 2010)
| * | See nameplate capacity description on Page 11. |
| | |
| 12 | | PotashCorp 2011 Annual Report |
| | |
| PotashCorp 2011 Annual Report | | 13 |
An Integrated Business Model
We believe that our ability to deliver superior long-term financial returns is the cornerstone of establishing enduring value for all stakeholders. Strong financial performance rewards our shareholders and, at the same time, allows us to focus on our broader social and environmental responsibilities and contribute to the long-term prosperity of our customers, employees, suppliers and communities.

Industry-leading potash position
With six potash mines in Canada, we are the world’s largest producer by capacity* in an industry characterized by substantial barriers to entry, few producers and no known substitutes. We enhance this position with strategic investments in four global potash-focused companies.
Access to long-lived, high-quality potash reserves
Our potash facilities have access to decades of reserves and are among the lowest-cost potash mines in the world, with well-established infrastructure in place.
Focused positions in phosphate and nitrogen
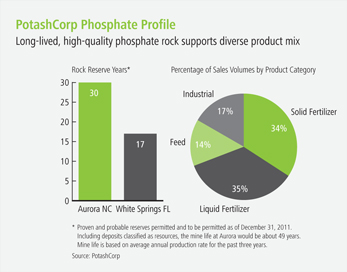
Our high-quality, long-lived phosphate rock reserves give us the flexibility to produce a variety of products to maximize gross margin and reduce volatility. In nitrogen, the proximity of our plants to key markets provides a delivered cost advantage.
Financial strength and flexibility
A strong balance sheet – with what we consider low debt to equity – and proven track record of generating robust cash flow help ensure the access to capital we need to grow our business. We use this capital to invest in our company’s competitive advantages, further enhancing the value of our business.
Management team with extensive industry experience
Our experienced management team has deep-rooted knowledge and a long track record of leadership in conceiving, developing and implementing effective long-term strategies designed to protect and increase the company’s value.
Talented and engaged employees
Fair compensation and a commitment to develop and promote from within have helped build a workforce focused on using best practices to drive efficiency.
Strong supply chain and partnerships
In North America, we leverage our world-class distribution network to help us be the supplier of choice to our customers. Offshore, our partnership with marketing organizations Canpotex and PhosChem enables us to reliably and efficiently meet the growing needs of our customers.
Customers
Through regular communication and annual surveys, we work to understand how we can best serve the needs of our customers in ways that benefit their businesses and ours. We incorporate customer feedback to improve our service, products and processes.
Investors
We strive to communicate and report clearly to build trust with our investors, using ongoing engagement and annual surveys to gather feedback that improves our strategies and performance.
Communities
We seek to maximize our positive economic and social impact by building strong relationships within our communities, investing time and money in development initiatives that benefit the public and eliciting feedback through surveys and in-person meetings.
Employees
We engage with our employees and gather feedback to enhance their satisfaction and motivation. We look for ways to align performance with incentives and to cultivate long-term positive relationships with our workforce.
Suppliers and partners
We strive to establish strong relationships and partnerships to improve our ability to navigate through the opportunities and risks that impact our business. We focus on opportunities that enhance growth for our company and our partners.
| * | See nameplate capacity description on Page 11. |
We operate with integrity
We seek to treat people fairly and communicate promptly, completely and accurately with our stakeholders.
Our overriding concern is safety of people and the environment
We strive to create a “culture of caring” that extends throughout the workplace and beyond, constantly seeking ways to improve our safety and environmental performance and process.
We listen to all stakeholders
We engage in ongoing dialogue with all our stakeholders, looking for opportunities to strengthen our relationships, understand their needs and improve our performance.
We strive for continuing improvement
Through review and implementation of our Best Practices program, we focus on making management, safety, environmental and production processes more efficient and successful.
We share what we learn
Education is vital to our business. We work to empower all our employees to learn and teach, creating leaders within the company and our communities.
We are accessible, accountable and transparent
We establish annual goals and objectives for our fiscal, safety, environmental and social performance to help stakeholders understand the company’s direction, values and progress. We are committed to best practices in stakeholder communication and reporting on our performance.
Global economy
Population growth and improving economic conditions in the developing world are the key long-term drivers of the rising demand for food and fertilizer, and the performance and growth prospects for our company. Macroeconomic factors can affect short-term customer behaviors.
Supply/demand drivers
We monitor supply/demand fundamentals for each of our nutrients, as they play an integral role in the development of our strategies and in the company’s performance.
Laws and regulations
We operate in multiple jurisdictions and are subject to legal and regulatory mandates in all of those areas. We monitor compliance with the changing regulatory landscape in all aspects of our business.
Workforce demographics
Competition for skilled labor has increased substantially in recent years, particularly in Western Canada. We work continually to improve our recruitment and retention efforts to meet the needs of our business.
Tax environment
Our assets are located in regions of the world that historically are politically stable, with typically fair taxation policies.
| | |
| 16 | | PotashCorp 2011 Annual Report |
GOAL
Create superior long-term shareholder value
Our Strategic Approach
| • | | Devise and execute strategies that prioritize future earnings growth and reduce volatility across all business segments |
| • | | Strategically use capital to build competitive advantages, especially in potash |
| • | | Develop and implement governance practices that minimize risk, maximize management performance and ensure we operate with integrity and transparency |
Targets
| 32 | Total shareholder return |
| 33 | Governance practices ranking |
GOAL
Be the supplier of choice to the markets we serve
Our Strategic Approach
| • | | Build our potash operational capability to meet expected growth in global demand |
| • | | Invest in our transportation and distribution system to efficiently meet our customers’ needs |
| • | | Establish standards for customer service and product quality that set us apart from our competitors |
Targets
| 34 | Product quality and service measurements |
| 35 | Number of quality-related customer complaints |
GOAL
Build strong relationships with and improve the socioeconomic well-being of our communities
Our Strategic Approach
| • | | Contribute to economic growth by creating direct and indirect jobs, purchasing locally, attracting investment and paying our fair share of taxes |
| • | | Target community investments in organizations and projects that bring sustaining value in the regions where we operate, and more widely, through corporate and site contributions, matching of employee gifts, in-kind contributions and employee volunteerism. |
| • | | Participate in outreach projects to share information and best practices about fertilizer use, environmental matters and safety |
Targets
| 37 | Community leader surveys |
| 37 | Employee matching gift and donation participation |
| | |
| PotashCorp 2011 Annual Report | | 17 |
GOAL
Attract and retain talented, motivated and productive employees who are committed to our long-term goals
Our Strategic Approach
| • | | Offer competitive compensation and provide opportunities for employee development and advancement |
| • | | Promote from within when qualified candidates are available for open positions |
| • | | Provide equal opportunity in hiring, promotions, wages, benefits, and terms and conditions of employment |
| • | | Communicate our goals and expectations clearly, particularly in matters regarding ethics and workplace behavior |
Targets
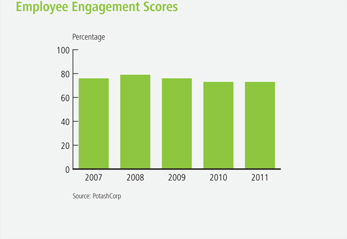
| 38 | Employee engagement scores |
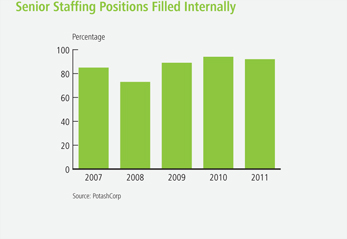
| 38 | Senior staff internal promotion metrics |
| 39 | External staff-level employment acceptance rate |
GOAL
Achieve no harm to people and no damage to the environment
Our Strategic Approach
| • | | Use peer-to-peer behavior-based process to improve safety and environmental performance |
| • | | Meet or exceed all federal, state, provincial and local environmental and safety requirements |
| • | | Use our Best Practices program to pilot and refine innovative processes that improve safety and efficiency and minimize water, waste and emissions |
| • | | Actively preserve habitat and promote natural biodiversity in areas where we operate |
Targets
| 40 | Site severity injury rates and life-altering injuries |
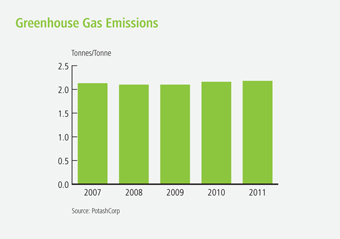
| 40 | Greenhouse gas emissions |
| 41 | Reportable environmental incidents |
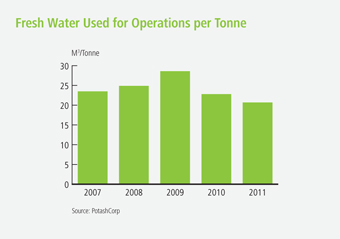
| 41 | Water usage per product tonne |
Creating Value Through Strategy
In all areas of our business, we set goals and design strategies that focus on delivering sustainable value while appropriately balancing stakeholder interests. We demonstrate our accountability by tracking and reporting our progress against targets related to each goal.

Risks to Our Strategy
Our Approach to Managing Risk
We must effectively manage risks associated with our business goals, which we achieve through the successful execution of our corporate strategy. After evaluating risks for their potential severity and likelihood to adversely affect the company, we rank them and determine the most appropriate responses among accept, control, share, transfer, diversify or avoid.
The risks that can threaten our business are often integrated, and affect each other. Only by understanding the inherent risks within each risk category can we design and implement mitigation activities so we can execute our strategies and meet our business goals within acceptable residual risk tolerances.
Our assessment of risk considers both financial and non-financial items. Six categories of risks have been identified within our global environment: market/business, distribution, operational, financial, compliance and organizational.
We view damage to our reputation as the most severe risk consequence faced by PotashCorp, which could impact the
execution of our corporate strategy. We mitigate this risk by acting ethically and with integrity while striving to continually build goodwill through a commitment to sustainability, transparency, effective communication and corporate governance best practices.
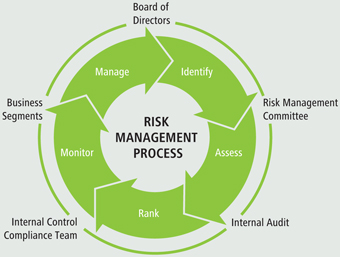
Our Risk Management Process
After identifying an inherent risk, we assess it against our risk ranking matrix as if no mitigation measures had been taken. Through the matrix, we weigh the severity and likelihood of such a potential event, and establish relative risk levels from A through E to guide our mitigation activities.
We can lower risk by reducing the likelihood of the initiating event occurring or by reducing significance of the consequence if it does occur.
Residual risk remains after mitigation and control measures are applied to an identified risk. We endeavor to be fully aware of all potential risks that could adversely affect PotashCorp, and to choose appropriately the levels of residual risk we accept.
| | | | | | | | | | | | | | | | |
| PotashCorp Risk Management Ranking Methodology |
Risk Ranking Matrix | | SEVERITY OF CONSEQUENCE |
| | 1 | | 2 | | 3 | | 4 | | 5 |
| | Negligible | | Low | | Acceptable | | Major | | Extreme |
LIKELIHOOD OR FREQUENCY | | | 5 | | | Probable(0-6 months) | | C | | B | | B | | A | | A |
| | | 4 | | | High(6 months-2 years) | | D | | C | | B | | B | | A |
| | | 3 | | | Medium(2-10 years) | | D | | D | | C | | B | | B |
| | | 2 | | | Low(10-50 years) | | E | | D | | D | | C | | B |
| | | 1 | | | Remote(> 50 years) | | E | | E | | D | | D | | C |
A Extreme: Initiate mitigation activities immediately to reduce risk. If such activities cannot sufficiently reduce risk level, consider discontinuation of the applicable business operation to avoid the risk.
B Major: Initiate mitigation activities at next available opportunity to reduce risk. If such activities cannot sufficiently reduce the risk level, Board approval is required to confirm acceptance of this level of risk.
C Acceptable: Level of risk is acceptable within tolerances of the risk management policy. Additional risk mitigation activities may be considered if benefits significantly exceed cost.
D Low: Monitor risk according to risk management policy requirements, but no additional activities required.
E Negligible:Consider discontinuing any related mitigation activities so resources can be directed to higher-value activities, provided such discontinuance does not adversely affect any other risk areas.
| | |
| 20 | | PotashCorp 2011 Annual Report |
Risk Management Roles and Responsibilities
The roles and responsibilities of the various participants in our risk management program are outlined in our risk governance structure.
Board of Directors:
| • | | Oversees the risk management process to ensure the program is appropriate and regularly reviewed and evaluated. The responsibilities include ensuring adequate policies, procedures and systems are in place to implement the strategy and manage risk. This is primarily accomplished through its committees: |
| | - | The audit committee monitors the company risk management process quarterly, or more frequently if required, focusing primarily on financial and regulatory compliance risk. |
| | - | The safety, health and environment committee and corporate governance and nominating committee focus primarily on risks in their areas of oversight. |
| | - | The compensation committee focuses on risks in its area of oversight, including assessment of compensation programs to ensure they do not encourage increased corporate risk. |
Risk management committee:
| • | | Comprised of cross-functional members of the senior management team, this committee monitors our overall risk profile associated with our business goals and corporate strategy. |
| • | | Establishes the risk management process to identify, assess, rank, monitor and manage risks. |
| | • | | Maintains our company-wide risk management framework, and regularly reviews our risk management policy and regulatory requirements. |
| | • | | Reports quarterly, or more frequently if required, to the CEO and the audit committee on all significant risks, including new or increased risks resulting from changes in operations or external factors. |
| | • | | Reports to the Board of Directors at an annual presentation and discussion on risk management. |
Internal audit:
| • | | Provides independent and objective assurance and consulting services to evaluate and report to management and the audit committee on the effectiveness of governance, risk management and control processes. |
Internal control compliance team:
| • | | Ensures identification and management of risks related to internal controls over financial reporting by reviewing and testing such controls. |
Business segments:
| • | | Identify and manage risks within their areas of responsibility. |
Key Business Risks
Risks specific to our company are discussed below. In addition to the following, please refer to the information under the section entitled “Risk Factors” in Item 1 of our Form 10-K for the fiscal year ended December 31, 2011 for a more complete discussion of significant risks we face.
New potash supply creates market imbalance
Tight supply/demand fundamentals and strong gross margins have encouraged investment in new potash capacity. If supply rises faster than world consumption, prices could be depressed for a prolonged period, negatively affecting our financial performance. While we anticipate that long-term growth in consumption will require increased supply, we know that fluctuations in demand are characteristic of this market. We attempt to mitigate this risk and protect our margins by producing to meet market demand.
| | |
| PotashCorp 2011 Annual Report | | 21 |
Global potash demand insufficient to consume PotashCorp capacity
In preparation for an anticipated increase in world potash demand, we are investing in expansion and debottlenecking projects that we expect will be completed by 2015. If our estimates of future potash demand prove to be overstated, our return on this investment may be lower than expected due to lower earnings and the related opportunity cost of expending significant capital before it was needed. Our low percentage of fixed costs and other operating processes allows us to remain profitable at reduced production rates.
Lack of adequate transportation and distribution infrastructure
An integrated transportation and distribution infrastructure of railcars, barges, ocean freightliners, and warehouse and port storage facilities delivers potash to our customers quickly and efficiently. Short-term problems – such as railcar shortages, strikes, derailments or adverse weather – could disrupt or slow delivery time, which could lead to customer dissatisfaction, loss of sales and higher distribution costs, making it difficult to achieve our growth plans.
We attempt to mitigate this risk by working internally and through Canpotex to ensure processes are streamlined and sufficient investment is made in transportation and distribution infrastructure to help potash move as smoothly as possible.
Underground potash mines face particular risks
Water-bearing strata that pose the risk of water inflow often exist in the vicinity of underground mines. We are successfully managing water inflows at our New Brunswick operation, while our other conventional mines currently have no significant water inflows. At Esterhazy, where our mineral rights are mined by another producer under a mining and processing agreement, water inflows are being managed.
Unexpected rock falls that can result in life-threatening injuries are a risk for all underground mining companies. We use advanced monitoring and geophysical techniques to help predict problematic situations.
Cyclicality in phosphate
Fluctuations in demand, changes in available supply and volatility in raw material costs have historically caused short-term cyclicality in phosphate markets. Volatility has often been exacerbated because of the significant involvement in
the industry by governments, which typically follow operating philosophies that favor production over profitability.
Growth in world consumption may be outpaced over the next few years by increased competitive supply of solid fertilizer, potentially depressing prices and affecting our phosphate margins. We take action to mitigate this risk through our product diversification, leveraging our strengths in less cyclical industrial and feed products and streamlining our operations and logistics to minimize costs.
Cyclicality in nitrogen
Price cyclicality can result when nitrogen supply is increased without consideration of demand, a situation that may occur in an industry that is highly fragmented and regional due to the extensive availability of natural gas. To mitigate this risk, we have longer-term gas contracts in Trinidad primarily indexed to ammonia prices and employ gas price hedging strategies for our US plants. We focus on supplying less cyclical industrial markets.
Security and downstream products risks
Deliberate, malicious acts involving our facilities or our downstream products could cause injury, property damage or harm to our reputation. We regularly monitor and evaluate ongoing security risks at our facilities and take steps to address potential issues. We have a comprehensive system for tracking the transport and delivery of all our industrial ammonium nitrate and ammonia sales, and our systems are regularly reviewed to ensure they remain effective. We address and mitigate risk of intentional adulteration with testing and recall procedures for our food grade and animal feed products.
Security risks related to information technology systems
As an integrated fertilizer and related industrial and feed products company, information technology and related processes do not form the core of our business. However, in response to a risk of unauthorized access to confidential information, which could result from a breach of our information technology systems, we have taken measures to protect confidential information and the manner in which it is processed and communicated. Because the information systems we use continue to change, we regularly test them, and we also periodically employ third-party security providers to monitor and strengthen them. We provide education to our employees to attempt to minimize the risk of breaches, error, malfeasance or other irregularities.
| | |
| 22 | | PotashCorp 2011 Annual Report |
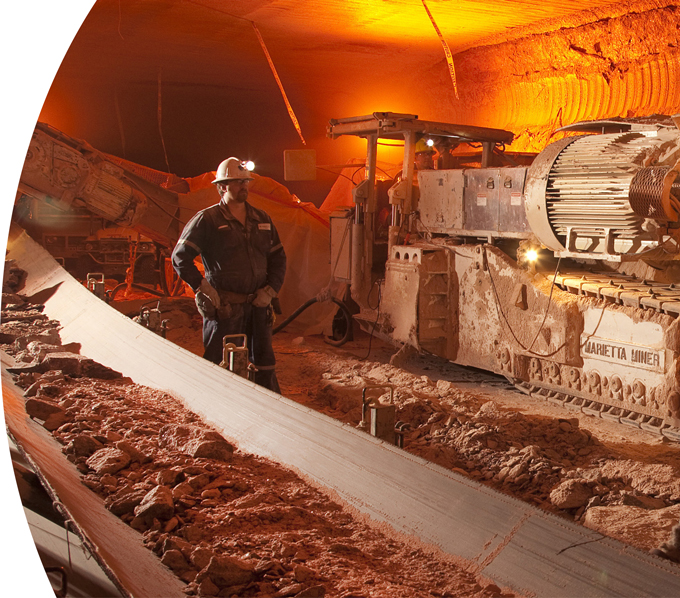
Jamie Collins, Mine Practical Training Coordinator, supervises the operations of a boring machine at our Lanigan potash mine.
Performance
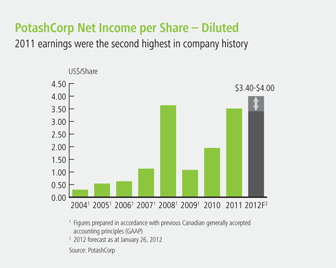
In 2011, we delivered our second-highest earnings per share on record, nearly surpassing the total achieved in 2008. These strong earnings – and the potential for rising earnings in the years ahead – not only create opportunities for our shareholders, they enhance our ability to generate value for all stakeholders.
* Figures prepared in accordance with previous Canadian GAAP
Financial Performance Highlights
| | | | | | | | | | |
| (in millions of US dollars except ratio percentages and per-share amounts) | | 2011 | | 2010 | | 20091 | | 20081 | | 20071 |
| | | | | | | | | | |
Financial Position | | | | | | | | | | |
Current assets | | 2,408 | | 2,095 | | 2,272 | | 2,267 | | 1,811 |
Property, plant and equipment | | 9,922 | | 8,141 | | 6,413 | | 4,812 | | 3,887 |
Other long-term assets | | 3,927 | | 5,311 | | 4,237 | | 3,170 | | 4,019 |
Total assets | | 16,257 | | 15,547 | | 12,922 | | 10,249 | | 9,717 |
Current liabilities | | 2,194 | | 3,144 | | 1,577 | | 2,623 | | 1,002 |
Long-term debt | | 3,705 | | 3,707 | | 3,319 | | 1,740 | | 1,339 |
Other long-term liabilities | | 2,511 | | 2,011 | | 1,586 | | 1,351 | | 1,382 |
Shareholders’ equity | | 7,847 | | 6,685 | | 6,440 | | 4,535 | | 5,994 |
Total liabilities and shareholders’ equity | | 16,257 | | 15,547 | | 12,922 | | 10,249 | | 9,717 |
Total debt to capital percentage | | 36.6 | | 45.5 | | 38.6 | | 40.3 | | 19.3 |
Working capital ratio | | 1.10 | | 0.67 | | 1.44 | | 0.86 | | 1.81 |
| | | | | |
Financial Results | | | | | | | | | | |
Sales | | 8,715 | | 6,539 | | 3,977 | | 9,447 | | 5,234 |
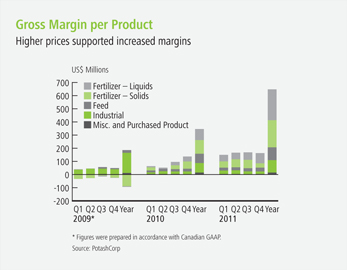
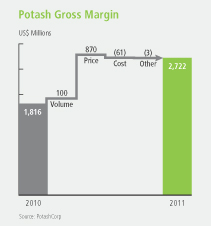
Gross margin – Potash | | 2,722 | | 1,816 | | 731 | | 3,056 | | 912 |
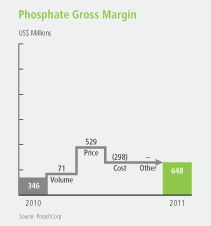
Gross margin – Phosphate | | 648 | | 346 | | 92 | | 1,068 | | 434 |
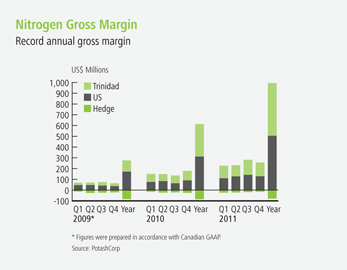
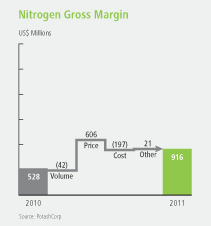
Gross margin – Nitrogen | | 916 | | 528 | | 192 | | 737 | | 536 |
Total gross margin | | 4,286 | | 2,690 | | 1,015 | | 4,861 | | 1,882 |
Total gross margin as a percentage of sales | | 49 | | 41 | | 26 | | 51 | | 36 |
Net income | | 3,081 | | 1,775 | | 981 | | 3,466 | | 1,104 |
Net income per share – diluted | | 3.51 | | 1.95 | | 1.08 | | 3.64 | | 1.13 |
Cash provided by operating activities | | 3,485 | | 3,131 | | 924 | | 3,013 | | 1,689 |
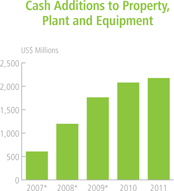
Cash additions to property, plant and equipment | | 2,176 | | 2,079 | | 1,764 | | 1,198 | | 607 |
| 1 | As we adopted International Financial Reporting Standards (IFRS) with effect from January 1, 2010, our 2007 to 2009 information is presented on a previous Canadian generally accepted accounting principles (GAAP) basis. Accordingly, information for prior years may not be comparable to 2010 and 2011. |
| | |
| PotashCorp 2011 Annual Report | | 23 |
We report our results (including gross margin) in three business segments: potash, phosphate and nitrogen, as described in Note 16 to the consolidated financial statements. Our reporting structure reflects how we manage our business and how we classify our operations for planning and measuring performance. We include net sales in our segment disclosures in the consolidated financial statements pursuant to International Financial Reporting Standards (IFRS) as issued by the International Accounting Standards Board (IASB), which require segmentation based upon our internal organization and reporting of revenue and profit
measures derived from internal accounting methods. As a component of gross margin, net sales (and the related per-tonne amounts) are primary revenue measures we use and review in making decisions about operating matters on a business segment basis. These decisions include assessments about performance and the resources to be allocated to these segments. We also use net sales (and the related per-tonne amounts) for business planning and monthly forecasting. Net sales are calculated as sales revenues less freight, transportation and distribution expenses. Realized prices refer to net sales prices.
2011 Earnings Compared to Guidance
Our initial midpoint estimate for 2011 EPS, based on the outlook and assumptions described in our 2010 Financial Review Annual Report, was approximately $3.00. The final result was $3.51. The factors contributing to this increase from our guidance midpoint were:
| | | | |
| Potash offshore realized prices | | $ | 0.18 | |
| Potash North America realized prices | | | 0.08 | |
| Potash offshore sales volumes | | | (0.06 | ) |
| Potash North America sales volumes | | | (0.13 | ) |
| Increased other potash costs | | | (0.02 | ) |
| Increased provincial mining taxes | | | (0.02 | ) |
| Subtotal potash | | | 0.03 | |
| Phosphate realized prices | | | 0.23 | |
| Phosphate sales volumes | | | 0.08 | |
| Increased sulfur input costs | | | (0.05 | ) |
| Increased ammonia input costs | | | (0.05 | ) |
| Increased rock costs | | | (0.02 | ) |
| Increased other phosphate costs | | | (0.03 | ) |
| Subtotal phosphate | | | 0.16 | |
| Nitrogen realized prices | | | 0.36 | |
| Manufactured nitrogen sales volumes | | | (0.01 | ) |
| Increased cost of natural gas | | | (0.12 | ) |
| Decreased other nitrogen costs | | | 0.04 | |
| Subtotal nitrogen | | | 0.27 | |
| Increased share of earnings of equity-accounted investees | | | 0.06 | |
| Increased dividend income | | | 0.01 | |
| Increased other expenses | | | (0.01 | ) |
| Increased finance costs | | | (0.03 | ) |
| Subtotal other | | | 0.03 | |
| Subtotal of the above | | | 0.49 | |
| Lower income tax rate on ordinary income | | | 0.05 | |
| Discrete items impacting income taxes | | | (0.03 | ) |
| Total variance from 2011 EPS guidance | | $ | 0.51 | |
2011 Earnings Compared to 2010
Our EPS for 2010 was $1.95. The final EPS for 2011 was $3.51. The factors contributing to this increase from last year’s actual results were:
| | | | |
| Potash offshore realized prices | | $ | 0.44 | |
| Potash North America realized prices | | | 0.30 | |
| Potash offshore sales volumes | | | 0.11 | |
| Potash North America sales volumes | | | (0.06 | ) |
| Increased potash costs due to foreign exchange | | | (0.04 | ) |
| Increased other potash costs | | | (0.01 | ) |
| Increased provincial mining taxes | | | (0.06 | ) |
| Subtotal potash | | | 0.68 | |
| Phosphate realized prices | | | 0.43 | |
| Phosphate sales volumes | | | 0.06 | |
| Increased sulfur input costs | | | (0.13 | ) |
| Increased ammonia input costs | | | (0.03 | ) |
| Increased rock costs | | | (0.02 | ) |
| Increased other phosphate costs | | | (0.07 | ) |
| Subtotal phosphate | | | 0.24 | |
| Nitrogen realized prices | | | 0.49 | |
| Manufactured nitrogen sales volumes | | | (0.04 | ) |
| Increased cost of natural gas | | | (0.12 | ) |
| Increased other nitrogen costs | | | (0.01 | ) |
| Subtotal nitrogen | | | 0.32 | |
| Decreased selling and administrative expenses | | | 0.01 | |
| Increased share of earnings of equity-accounted investees | | | 0.07 | |
| Decreased dividend income | | | (0.02 | ) |
| Decreased other expenses | | | 0.09 | |
| Increased finance costs | | | (0.03 | ) |
| Subtotal other | | | 0.12 | |
| Subtotal of the above | | | 1.36 | |
Reduction in weighted average shares outstanding | | | 0.12 | |
| Discrete items impacting income taxes | | | 0.08 | |
| Total variance from 2010 EPS | | $ | 1.56 | |
| | |
| 24 | | PotashCorp 2011 Annual Report |
Non-Financial Performance Highlights
| | | | | | | | | | |
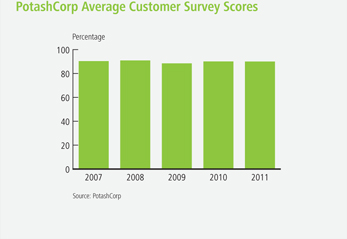
Customers | | | | | | | | | | |
Average customer survey scores1 | | 90% | | 90% | | 89% | | 91% | | 90% |
| | | | | |
Community | ���� | | | | | | | | | |
Community investment ($ millions)2 | | 21 | | 17 | | 10 | | 7 | | 4 |
Taxes and royalties ($ millions) 3 | | 997 | | 620 | | (8) | | 1,684 | | 507 |
| | | | | |
Employees | | | | | | | | | | |
Average employee engagement score4 | | 73% | | 73% | | 76% | | 79% | | 69% |
| | | | | |
Environment | | | | | | | | | | |
Environmental incidents5 | | 14 | | 20 | | 22 | | 19 | | 25 |
| | | | | |
Safety | | | | | | | | | | |
Total site 6 severity injury rate7 | | 0.54 | | 0.38 | | 0.74 | | 0.97 | | n/a |
| | n/a | = not available as data had not been previously compiled consistent with current methodology |
| | 1 | The annual customer satisfaction survey is conducted online by an independent third party and includes a select group of top customers from each sales segment and region to form a Customer Advisory Council. Customers were asked to commit to participate in annual satisfaction surveys for five years, to ensure consistent measurement and reporting of customer satisfaction. Results are determined by taking a simple average of the eight metrics described on Page 34. |
| | 2 | Represents cash disbursements, matching of employee gifts and in-kind contributions of equipment, goods, services and employee volunteerism (on corporate time). |
| | 3 | Includes current income taxes, potash production tax, resource surcharge, royalties, municipal taxes and other miscellaneous taxes less investment tax credits calculated on an accrual basis. |
| | 4 | A confidential external survey is administered to every employee every second year. |
| | 5 | Includes reportable quantity releases (a release whose quantity equals or exceeds the US Environmental Protection Agency’s notification level and is reportable to the National Response Center (NRC)), permit excursions (an exceedance of a federal, state, provincial or local permit condition or regulatory limit) and provincial reportable spills (an unconfined spill or release into the environment). |
| | 6 | Total site includes PotashCorp employees, contractors and all others on site. |
| | 7 | Total of lost-time injuries (a lost-time injury or illness occurs when the injured person is unable to return to work on his/her next scheduled workday after the injury) and modified work injuries (a work-related injury or illness where a licensed health care professional or the employer recommends that the employee not perform one or more of the routine functions of the job or not work the full workday that the employee would have otherwise worked) for every 200,000 hours worked. |
| | |
| PotashCorp 2011 Annual Report | | 25 |
Factors Affecting Our 2011 Performance
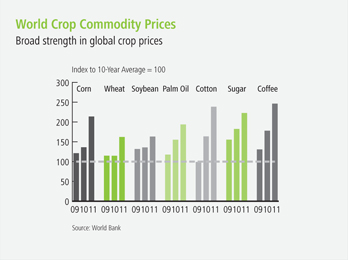
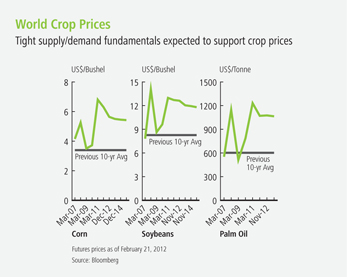
Broad strength in crop commodity prices supports farmer returns
Rising demand for agricultural commodities continued to pressure global grain supplies in 2011. Prices for a wide range of crops remained well above historical averages, despite increased volatility related to global economic uncertainties in the second half of the year.
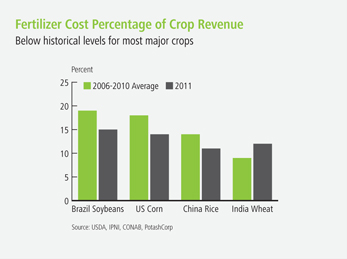
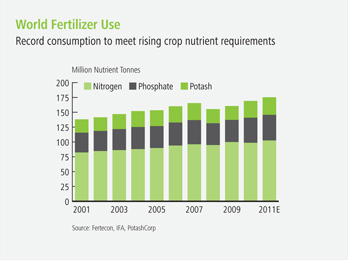
Higher prices for their crops more than offset farmers’ increased input costs, resulting in record or near-record returns in most growing regions. This economic incentive and the nutrient requirements necessary to produce increased yields contributed to record global fertilizer demand.
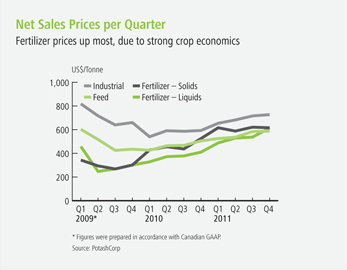
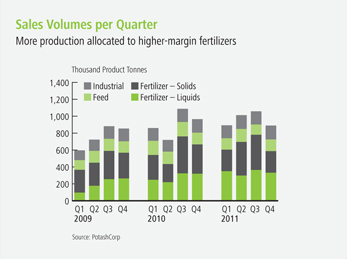
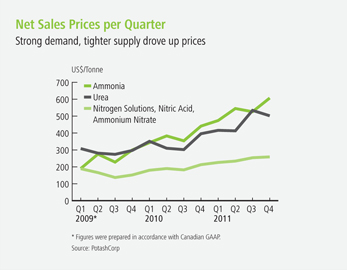
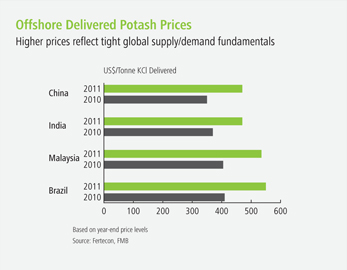
Record demand pressures global fertilizer supply; prices climb
Potash
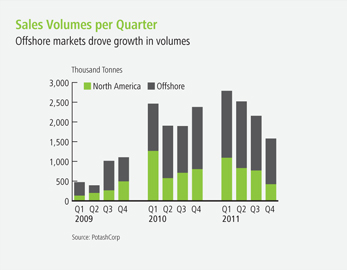
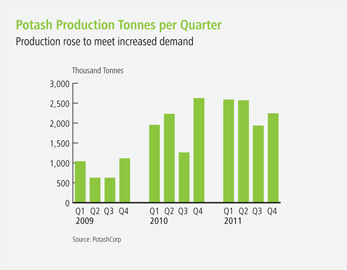
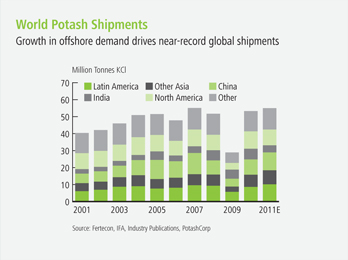
World potash demand increased by more than 3 percent to approximately 55 million tonnes in 2011. Strong demand in Latin America, China and Southeast Asian countries offset reduced shipments to North America and India. Deliveries to India were impacted by extended contract negotiations. We believe global producers operated at or near full capability for most of the year to meet increased demand.
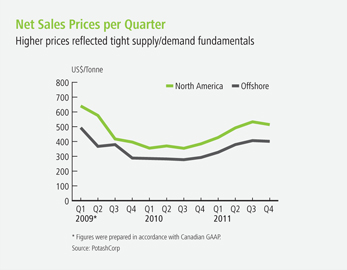
Potash prices rose in response to the strength in agriculture fundamentals and the pressure on world potash supply. Prices in offshore spot markets such as Brazil and Malaysia increased by more than $125 per tonne during the year and contracts with customers in China and India climbed $120 per tonne and $100 per tonne, respectively, compared to the end of 2010. US Midwest wholesale prices rose by approximately $55 per tonne during the year.
Phosphate
Global phosphate fertilizer trade was similar to 2010 levels as increased shipments to Latin America offset lower sales to India. Supply tightened due to production outages in North Africa and the Middle East and permanent shutdowns of plants in the US and Spain.
Phosphate rock prices increased, impacting costs for producers without their own supply, and prices for sulfur and ammonia inputs rose. Phosphate prices increased in response to relatively tight supply/demand fundamentals and higher production costs.
| | |
| 26 | | PotashCorp 2011 Annual Report |
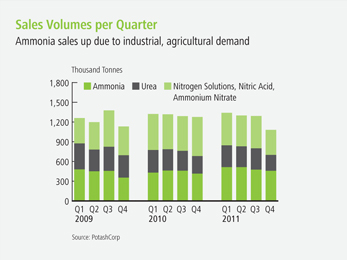
Nitrogen
Strong agricultural and industrial markets drove nitrogen consumption to record levels in 2011. Supply was affected by unplanned maintenance and gas supply outages in major producing regions such as Trinidad, Europe, Australia and North Africa, construction delays on new projects and reduced urea exports from China.
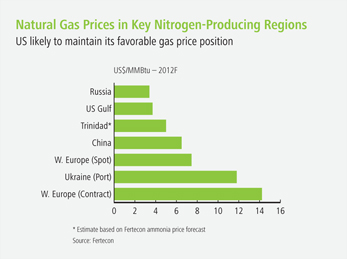
Prices for nitrogen products moved higher in response to robust demand and tight supply. US nitrogen producers benefited from favorable natural gas costs compared to suppliers in Ukraine, Western Europe and China.
Global macroeconomic concerns make fertilizer buyers cautious in fourth quarter
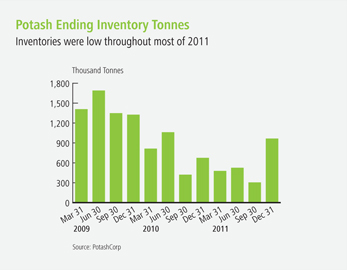
While supportive crop economics kept consumption relatively strong in most markets throughout the fourth quarter, fertilizer dealers purchased more cautiously in response to global macroeconomic concerns. They focused on immediate needs by drawing down inventories and purchasing limited quantities from suppliers.
As demand slowed, prices for nitrogen and phosphate softened during the quarter. While potash pricing remained relatively stable in most major markets, the North American market pulled back slightly on weak demand and increased pressure from record offshore imports.
Competition for materials and skilled labor increases potash expansion costs
Despite weakness in many developed economies, Western Canada remained a region of significant economic strength.
In this environment, the cost for securing certain materials and skilled labor rose in 2011. As a result, the estimated cost of our potash expansion program increased from CDN $7.3 billion to CDN $7.7 billion.

| | |
| PotashCorp 2011 Annual Report | | 27 |
2012 Outlook
Strong agricultural markets expected to support fertilizer demand
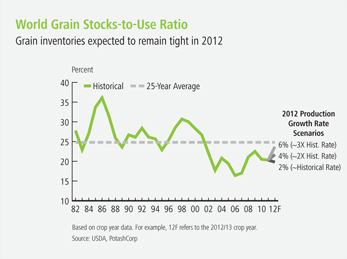
Global demand for grain and oilseeds is projected to increase by more than 2 percent in the 2012/13 crop year, driven by population growth and the ongoing expansion of developing economies. We anticipate that rising demand will continue to pressure world grain inventories, already well below historical levels.
While global macroeconomic concerns are expected to continue in 2012 and could result in crop price volatility, we project that underlying tight supply/demand fundamentals will support pricing above historical average levels. This environment is expected to encourage farmers around the world to apply the nutrients required to maximize production, driving increased fertilizer consumption. The International Fertilizer Industry Association (IFA) projects that world fertilizer use will increase by 2.3 percent in 2012, with potash rising by more than 3 percent.
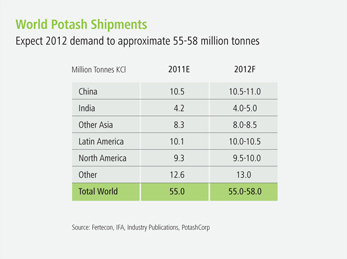
Growth in major offshore markets expected to push potash demand to record levels
Potash customers are expected to purchase cautiously early in 2012 but we anticipate shipments will accelerate as the year progresses, to meet strong projected consumption. We estimate that global demand will rise from approximately 55 million tonnes in 2011 to 55-58 million tonnes in 2012.
We anticipate that Latin American demand could exceed the 2011 record, supported by strong crop economics and increased acreage for key crops such as soybeans, sugar cane and corn. China is expected to increase its potash purchases in 2012 to stimulate yields in order to meet its rising crop requirements. India’s demand is unlikely to materially exceed 2011 levels due to uncertainty around its government subsidy levels and higher retail potash prices. Demand from other Asian markets is expected to be similar to the record volumes purchased in 2011. Shipments to North American customers are projected to exceed those of the previous year as growers increase acreage of important consuming crops such as corn.
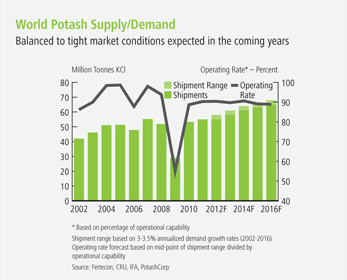
Limited new capacity is likely to become operational in 2012, and we believe global potash operating rates may approach historical highs later in the year.
| | |
| 28 | | PotashCorp 2011 Annual Report |
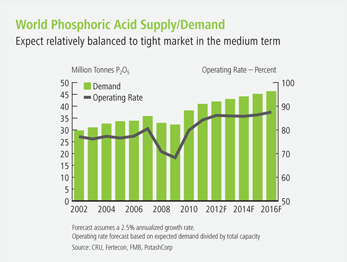
Balanced to tight markets anticipated for phosphate
Limited new phosphate capacity is expected to come on line in 2012 beyond the ongoing ramp-up of the Ma’aden facility in Saudi Arabia. China’s total phosphate exports are expected to decline from the 2011 record as the government adjusts export tax policies in an attempt to keep more resources in the country. With phosphate fertilizer consumption forecast to grow at 3 percent, we anticipate balanced to tight phosphate markets in 2012.
Global rock prices are expected to remain well above historical levels. Prices for sulfur and ammonia inputs are expected to soften from levels established in the second half of 2011.
US nitrogen producers expected to benefit from lower gas prices
Global nitrogen fertilizer consumption is expected to rise by approximately 2 percent in 2012, driven by strong agricultural fundamentals and relatively stable industrial consumption. New export-oriented capacity is anticipated to come on line in the second half of 2012 in North Africa and the Middle East, potentially leading to some softening in markets later in the year.
Natural gas prices for producers in Europe, Ukraine and China are expected to be well above historical average levels. US nitrogen producers are expected to maintain their favorable cost position relative to suppliers in those countries.
| | |
| PotashCorp 2011 Annual Report | | 29 |
2012 Earnings per Share and Related Sensitivities
The company’s estimate for 2012 EPS (as of January 26, 2012) ranged from $3.40 to $4.00 based on the outlook and assumptions as at that date described herein, which compared to the 2011 actual results of $3.51. The expected primary causes of this variance are presented in the accompanying graph.
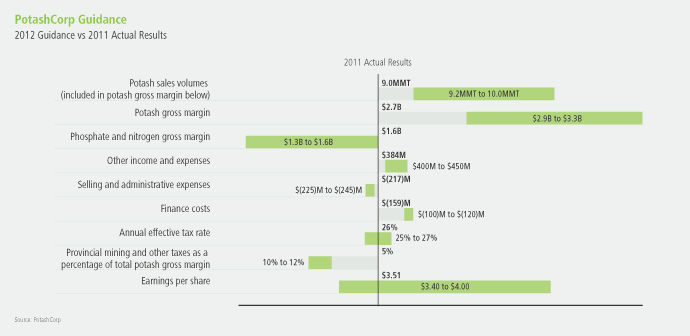
A number of factors affect the earnings of the company’s three nutrient segments. The table below shows the key factors and their approximate effect on EPS based on the assumptions used in the 2012 earnings guidance.
| | | | |
| Input Cost Sensitivities | | Effect on
EPS |
| NYMEX gas price increases by $1/MMBtu | | Nitrogen | | + 0.02 |
| | Potash | | – 0.01 |
| Sulfur changes by $20/long ton | | Phosphate | | ± 0.03 |
| Canadian to US dollar strengthens by $0.01 | | Canadian operating expenses net of provincial taxes | | – 0.01 |
| | Translation gain/loss | | – 0.00 |
| Saskatchewan potash capital expenditures reduced by $100 million | | Provincial mining and other taxes | | – 0.02 |
| | | | |
| Price and Volume Sensitivities | | Effect on
EPS |
Price | | Potash changes by $20/tonne | | ± 0.14 |
| | | DAP/MAP changes by $20/tonne | | ± 0.02 |
| | | Ammonia increases by $20/tonne | | |
| | | • Nitrogen | | + 0.02 |
| | | • Phosphate | | – 0.00 |
| | | Urea changes by $20/tonne | | ± 0.02 |
Volume | | Potash changes by 100,000 tonnes | | ± 0.03 |
| | | |
| | | Nitrogen changes by 50,000 N tonnes | | ± 0.02 |
| | | |
| | | Phosphate changes by 50,000 P2O5 tonnes | | ± 0.01 |
| | |
| 30 | | PotashCorp 2011 Annual Report |

Goals and Targets
GOAL
Create superior long-term shareholder value
Why Our Performance Matters
Strong financial performance enables us to generate superior returns for our shareholders, which makes it possible for us to access capital to help grow our business. Further, it affords us the ability to maintain employment and create new jobs, to support our communities, to contribute taxes to local economies and to invest in the people and resources that will serve the long-term needs of our customers.
Targets
Total Shareholder Return (TSR)
Context
By tracking the return to investors through capital gains and dividends, then comparing that number to the performance of our peers and benchmark, we measure our ability to create and execute strategies that deliver shareholder value.
Target
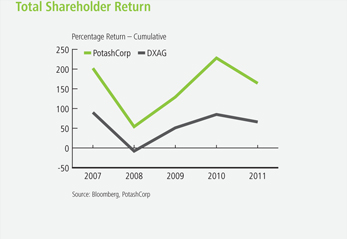
Exceed TSR performance for our sector* and the DAXglobal Agribusiness Index (DXAG)
Performancepartially achieved
PotashCorp’s TSR of -19.5 percent outperformed the sector’s return of -22.8 percent. However, our performance trailed the DAXglobal Agribusiness Index return of -10.2 percent. While we outperformed this index for most of 2011, the slowdown in fertilizer demand in the fourth quarter resulted in weaker relative performance for the balance of the year.
Cash Flow Return (CFR)
Context
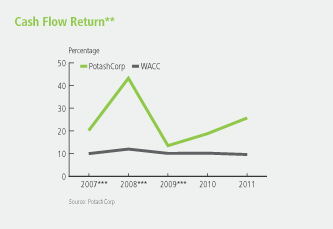
Calculated on the total cost basis of the company’s assets rather than on their depreciated value, cash flow return measures the effectiveness of our investment outlay.
Target
Exceed CFR** for our sector*
Performanceachieved
We continue to generate CFR above our weighted average cost of capital (WACC), which was 9.6 percent. This produced positive returns for investors on capital deployed. Our 2011 CFR of 26 percent exceeded that of our sector. This was driven primarily by a 66 percent increase in our operating income due to improved earnings across all three nutrients.
| * | Sector: Weighted average (based on market capitalization) for Agrium, APC, CF Industries, ICL, Intrepid, K+S, Mosaic, SQM, Uralkali and Yara for most recent four fiscal quarters available |
| ** | See reconciliation and description of certain non-IFRS measures on Page 78 |
| *** | Figures prepared in accordance with previous Canadian GAAP |
| | |
| 32 | | PotashCorp 2011 Annual Report |

Governance
Context
Our governance practices grow from our Core Values. By listening and being accountable to our stakeholders, we build trust and support, which enhances our ability to execute our strategies.
Target
Remain in the top quartile of governance practices as measured by predetermined external reviews
Performanceachieved
We ranked in the top quartile in all predetermined reviews. PotashCorp’s corporate governance practices received top ranking out of 253 companies evaluated by The Globe and Mail Board Games in 2011.
Progress Toward Our Goal
1 Delivering long-term earnings growth
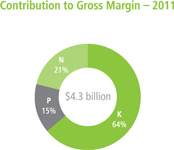
In 2011, we delivered earnings per share of $3.51, up 80 percent from 2010. Nearly two-thirds of our gross margin was from potash. Our cumulative 20-year TSR of 5,140 percent reflects the long-term effectiveness of our strategies.
2 Strengthening our global potash business
By 2015, we expect to increase our operational capability by more than 50 percent from 2011 levels. We have already spent approximately 75 percent of the anticipated CDN $7.7 billion in capital.
Expected to represent approximately half of the operational capability likely to be added in the industry by 2015, our expansions should provide us with a substantial growth opportunity, relative to our peers, as potash demand rises.
3 Strategic use of capital
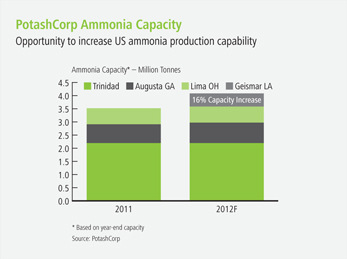
In addition to our potash expansions, we have committed to resume our ammonia production at Geismar in 2012 to capitalize on advantageous US natural gas costs.
In 2011, we paid down a portion of our long-term debt. We doubled our dividend in both 2011 and 2012.
With most of our major potash capital expenditures expected in subsequent years. We will continue to look for ways to deploy our assets that provide the greatest returns for our shareholders, such as organic growth, mergers and acquisitions, dividends and share repurchases.
2012 Targets
| 1 | Exceed total shareholder return performance for our sector* and the DAXglobal Agribusiness Index |
| 2 | Exceed cash flow return** on investment for our sector* |
| 3 | Remain in the top quartile of governance practices as measured by predetermined external reviews |
| 4 | Increase potash operational capability to 17.1 million tonnes by 2015 |
| | |
| PotashCorp 2011 Annual Report | | 33 |
GOAL
Be the supplier of choice
to the markets we serve
Why Our Performance Matters
By helping improve our customers’ opportunities for success, we strengthen our own ability to grow, to remain profitable for the long term and to serve the interests of all our stakeholders.
Targets
Product Quality and Service Measurements
Context
We continually seek to meet the needs of our customers, emphasizing the criteria they have identified as most important: quality and customer service.
Target
Outperform competitors on quality and service as measured by independent surveys
Performanceachieved
We outperformed our competitors in all quality and service categories in 2011. Customer surveys show that we consistently outperform competitors in these areas and that our sales team stands out for its knowledge of our customers, products and industry.
| | |
| 34 | | PotashCorp 2011 Annual Report |

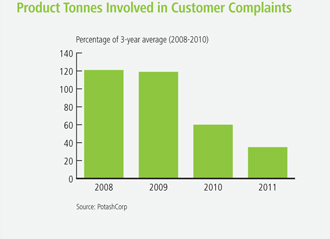
Number of Quality-Related Customer Complaints
Context
Product quality is an important aspect of our ability to be the supplier of choice to the markets we serve. We work hard to ensure our products are best-in-class.
Target
Reduce the number of product tonnes involved in customer complaints below the average of the prior three years
Performanceachieved
Our commitment to producing quality products continues to be evident in both our survey results and our low number of quality-related claims. In 2011, this focus on quality reduced the number of tonnes involved in customer complaints to 35 percent of the previous three-year average.
Progress Toward Our Goal
1 Improving rail cycle times through investment
Our potash expansion projects not only give our customers a reliable source for needed products, they are designed to improve our loading speed and capability to move product more quickly.
As a member of Canpotex, we are contributing to the development of a state-of-the-art railcar maintenance and staging facility in Saskatchewan. This investment is expected to improve the cost, reliability and efficiency of the distribution network, benefiting the railways, Canpotex and customers.
In the domestic market, PotashCorp has begun construction of a regional distribution center in Hammond, Indiana, which is expected to reduce rail cycle times and improve distribution efficiency.
2 Maintaining commitment to sharing information
We continue to provide information that helps customers make informed decisions for their businesses. We prioritize relationship building, providing 24/7 access to customer service agents.
We use our website to provide analysis on current trends in the fertilizer industry, as well as updates on our own company developments, to help customers understand the factors that are likely to affect their businesses.
3 Building the next generation sales force
In 2011, we added new customer representative and sales positions as we prepare to meet tomorrow’s service challenges. Each new employee is given hands-on opportunities to learn about our markets, our customers and our way of doing business from one of the most experienced teams in the industry.
2012 Targets
| 1 | Outperform competitor groups on quality and service as measured by independent surveys |
| 2 | Reduce the number of product tonnes involved in customer complaints below the prior three-year average |
| 3 | Reduce domestic rail cycle time by 10 percent in 2014, compared to 2011 levels |
| | |
| PotashCorp 2011 Annual Report | | 35 |
GOAL
Build strong relationships with and improve the socioeconomic well-being of our communities
Why Our Performance Matters
To grow our company and sustain our success, we strive to create long-term, mutually beneficial relationships with the communities where we operate. By building trust and goodwill, we are more likely to receive support for our development plans and attract talent for our operations. By being a good neighbor, we can invest with confidence in the company’s future.
Targets
Community Investments
Context
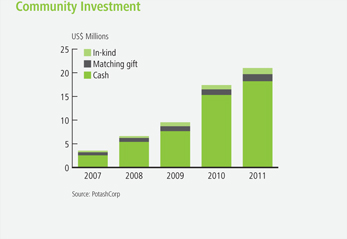
We strive to enhance quality of life in the places where we operate by focusing our community investment strategy on education, health care and the development and improvement of recreational facilities. The amount we invest in each community is guided by the gross margin we generate in its region.
Target
Invest 1 percent of consolidated income before income taxes (on a five-year rolling average) in community initiatives
Performanceachieved
Our 2011 community investments were 1 percent of the five-year average of consolidated income before income taxes – a total of $21 million. This record-setting investment was driven by two key factors: a change in our target from after-tax to pre-tax earnings, and higher overall company earnings.
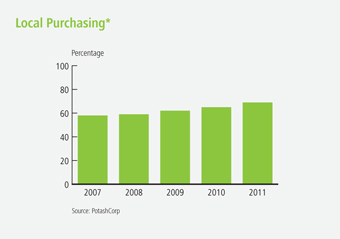
Local Purchasing
Context
By supporting local suppliers, PotashCorp benefits from proximity and security of supply, contributes to local economies and helps attract additional investment to the area. Each of these factors can contribute to improved community support for our operations.
Target
Purchase 60 percent of goods locally*
Performanceachieved
Local spending was 69 percent in 2011.
| * | Local purchasing excludes major expansions, energy, raw materials and transportation |
| | |
| 36 | | PotashCorp 2011 Annual Report |

Community Leader Surveys
Context
We ask community leaders to assess our social and environmental responsibility, and what impact we have on their communities.
Target
Achieve 4 (performing well) out of 5 on community leader surveys
Performanceachieved
Our 2011 average community survey score was 4.4. Scores for each community surveyed were: Allan (4.0), Lanigan (4.4), Lima (4.4), New Brunswick (4.2) and White Springs (4.8).
Employee Matching Gift and Donation Participation
Context
Supporting causes and organizations that our employees value helps us create a more engaged workplace and positively impact our communities. We encourage our employees to contribute their time and money through our company-sponsored volunteer and matching gift programs.
Target
Achieve a 10 percent increase in employee participation in the matching gift program from 2010 levels
Performanceachieved
Participation in our matching gift program rose 12 percent with total contributions reaching $2.9 million.
In addition, our company and employees support communities through company-sponsored volunteerism and non-cash donations.
Progress Toward Our Goal
1 Growing together
Our expansion projects are adding jobs, and creating new opportunities for local suppliers and business.
Beyond our capital spending, we focus on investments that impact the long-term well-being of our communities. In 2011, we announced the largest single commitment in company history – a multi-million-dollar, multi-year plan to help bring helicopter air ambulance service to the province of Saskatchewan.
In Trinidad, we continue to support the ongoing development of the PCS Model Farm & Agricultural Resource Center. Born out of our community surveys and launched in 2009, this state-of-the-art training facility helps local farmers develop the skills and understanding needed to maximize the commercial output of their land.
2 Encouraging others to give
Within our facilities and corporate offices, we strive to increase opportunities for employees to participate in programs offered by the United Way, Nutrients for Life and other organizations, through our matching gift program. For 2012, we have removed the one-year waiting period for new employees to participate in the matching gift program. When natural disasters such as the Joplin tornado or Aurora hurricane impact our communities, we remove the upper limits on matching gift donations.
3 Committing to community outreach and involvement
In 2011, we attended or hosted 225 community meetings. We also launched a local community Twitter account designed to inform people of local community events and causes. We continue to look for ways to improve our outreach and to listen for opportunities to serve our communities. In 2011, we launched a PotashCorp expansion website to better inform stakeholders of our expansion efforts and progress.
2012 Targets
| 1 | Invest 1 percent of consolidated income before income taxes (on a five-year rolling average) in community initiatives |
| 2 | Achieve 4 (performing well) out of 5 on community leader surveys |
| 3 | Achieve a 10 percent increase in matching gift donations and in the number of employees participating in the program from 2011 levels |
| | |
| PotashCorp 2011 Annual Report | | 37 |
GOAL
Attract and retain talented, motivated and productive employees who are committed to our long-term goals
Why Our Performance Matters
Our company’s need for technical expertise requires a talented and motivated workforce to maintain our competitive advantage and reach our goals.
Securing quality talent is even more critical now as our potash expansions continue, competition for qualified candidates rises and more-experienced employees approach retirement.
Targets
Employee Engagement Scores
Context
Employee engagement is an important metric that helps us measure the alignment our people have with our goals as an organization, and their commitment to the company’s success.
Target
Achieve an average employee engagement score of at least 75 percent on the annual survey
Performancenot achieved
The average employee engagement score was 73 percent in 2011. Our surveyed employees continue to emphasize the need for better communication between supervisors and their teams. Efforts to improve performance in this area are ongoing, as Human Resources and management continue to enhance our leadership training and integrate our leadership core competencies in recruitment and performance management.
Promoting From Within
Context
We try to fill the majority of vacancies for senior positions with qualified internal candidates who are ready for new and greater challenges. We believe this approach motivates our people, broadens their knowledge, rewards consistent efforts and provides continuity for our business.
Target
Fill at least 75 percent of senior staff openings with qualified internal candidates
Performanceachieved
We filled 92 percent of senior staff openings with qualified internal candidates.
| | |
| 38 | | PotashCorp 2011 Annual Report |

External Acceptance Rate
Context
The company’s growth and the need to replace employees at or nearing retirement make it necessary for us to attract a significant quantity of new talent, so this is a key metric to determine our attractiveness in an increasingly competitive labor market.
Target
Achieve an acceptance rate of 85 percent on all external staff-level employment offers made
Performanceachieved
An acceptance rate of 93 percent indicates that we remain competitive in the industry and an employer of choice in the regions where we operate.
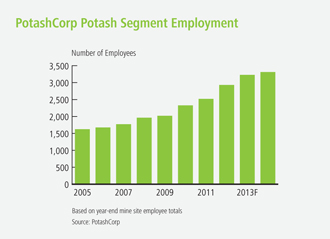
Progress Toward Our Goal
1 Partnering with the Aboriginal community
We are building mutually beneficial relationships with the Aboriginal community, Saskatchewan’s fastest-growing demographic.
Significant efforts were made in 2011 to help build a diverse workforce in the province that can meet our growing needs. We signed a Memorandum of Understanding, rooted in common values of respect, communication and education, with the Saskatoon Tribal Council to increase opportunities for First Nations workers and suppliers. All Saskatchewan employees and every Board member attended Aboriginal awareness training.
2 Developing tomorrow’s leaders
We expect to add almost 800 positions in potash and need to replace approximately 300 retiring employees in the next three years.
Leadership training is a primary focus as we work to prepare employees to lead at all levels of the company. All our sites have adopted leadership core competencies with their management teams and many have incorporated them into their selection criteria and performance evaluations.
3 Enhancing recruitment outreach
In 2011, PotashCorp took part in “Stake a Claim in Saskatchewan,” a partnership between the province’s post-secondary institutions and mining companies to attract senior engineers, business people and trades people to Saskatchewan. We continued to participate in career fairs and student events across Canada and the US.
As well as career profiles of full-time employees, our website now carries items about recent summer students who describe their PotashCorp experience. We are making greater use of social media to announce employment opportunities and events, and we have significantly enhanced our scholarships, which target communities where we operate, programs whose graduates we hire, women in trades and Aboriginal students.
2012 Targets
| 1 | Achieve an average employee engagement score of 75 percent on the annual survey |
| 2 | Fill 75 percent of senior staff openings with qualified internal candidates |
| 3 | Achieve an acceptance rate of 90 percent on all external employment offers made |
| 4 | Maintain an annual employee turnover rate (excluding retirements) of 5 percent or less |
| | |
| PotashCorp 2011 Annual Report | | 39 |
GOAL
Achieve no harm to people and no damage to the environment
Why Our Performance Matters
Creating safe and environmentally sound operations is so vital to our company that it is embedded in our goals and Core Values. Rooted in respect for people and the planet, this goal reflects our priority of doing the right thing – and doing it well.
Targets
Site Severity Injury Rates and Life-Altering Injuries
Context
Our No. 1 focus is to keep our people safe. We strive to continually improve our safety systems, to prevent accidents and promote safe behavior, and to ensure accountability throughout our operations by reporting on our performance.
Target
| • | | Achieve zero life-altering injuries at our sites |
| • | | Reduce total site* severity injury rate** by 35 percent from 2008 levels by the end of 2012 |
Performance
not achieved
Sadly, we had a fatality at our Aurora phosphate facility in 2011.
on track
We have achieved a 44 percent reduction from 2008 through 2011.
Greenhouse Gas Emissions
Context
Our target to reduce total greenhouse gas (GHG) emissions by 10 percent is voluntary and not required by regulations.
Our nitrogen production is responsible for more than 85 percent of our total GHG emissions, mostly through ammonia and nitric acid production. An ammonia plant emits CO2 by burning fuel and as a byproduct of production. Some of this CO2 is sold as a product, while some is used to make urea. The remainder is vented as process CO2.
Target
Reduce company-wide GHG emissions per tonne of product by 10 percent by the end of 2012, compared to 2007
Performanceon track
We installed GHG controls at our largest nitric acid plant in 2011, which is expected to lower overall company-wide emissions in future years.
| * | Total site includes PotashCorp employees, contractors and all others on site. |
| ** | Severity injury rate is the total of lost-time injuries and modified work injuries for every 200,000 hours worked. |
| | |
| 40 | | PotashCorp 2011 Annual Report |
Reportable Environmental Incidents
Context
To be a good neighbor, we must care for our resources and pay attention to our environmental footprint. We measure and report all environmental incidents that occur within our operations while looking for ways to reduce all negative impacts.
Target
Reduce total reportable incidents (releases, permit excursions and spills) by 10 percent from our 2010 levels
Performanceachieved
We had 14 reportable incidents in 2011, which represented a 30 percent reduction from 2010 levels. This was the lowest number of incidents since we began reporting these data.
Water Usage per Product Tonne
Context
After evaluating our use, discharges and local availability in 2010, we established a new water use efficiency target in 2011. Most of our operations are closed loop by design to minimize water losses.
Target
Maintain or reduce company-wide water usage per tonne of product
Performanceachieved
Company-wide water usage in processing plants decreased by 9 percent from 2010 levels. In 2011, 92 percent of the water used in our operations was recycled.
| | |
| PotashCorp 2011 Annual Report | | 41 |
GOAL
Achieve no harm to people and no damage to the environment
(continued)

Progress Toward Our Goal
1 Keeping safety at the forefront
Our employees understand how safety impacts everyone every day. PotashCorp’s safety record and all incidents are shared daily across the company to help ensure we learn from our experience. At each of our sites, we stress the importance of getting back to basics – refocusing on validating our safety procedures and ensuring they are being used effectively.
2 Recognizing results
In 2011, most of our operations reached safety milestones, all of which were recognized company-wide. We believe recognizing our employees in this way is critical to the ongoing development of our “culture of caring.” The International Fertilizer Industry Association recognized PCS Nitrogen Trinidad for its excellent safety, health and environmental performance by selecting it as first runner-up for the prestigious Green Leaf Award.
3 Implementing best practices
At all our sites, we are implementing a process aimed at preventing serious injuries and fatalities (SIF). Applying what we learned through participation in a research project led by Behavioral Science Technology (BST), our strategy focuses on the potential outcome of incidents and near-misses. By identifying and investigating incidents with SIF potential, we can better develop action plans to eliminate such exposures.
4 Developing new environmental targets
We are monitoring waste and water usage with the aim of setting new reduction targets in 2013. We have included energy efficiency and environmental observation metrics in our short-term incentive plans at sites, to better align our reward structure with environmental performance.
5 Protecting water, land and air
Water:We are exploring projects at our phosphate facilities – the largest user of water in our operations – to improve our efficiency. In 2011, we installed reverse osmosis technology at our Lima nitrogen facility to increase water recycling, reducing overall use.
Land: While our production process does impact land use, particularly in our phosphate operations, we remain steadfast in our commitment to restore land disturbed at Aurora and White Springs. Each year we plant 30,000-40,000 trees, although that figure can be raised significantly by additional reclamation projects.
Air: Beyond complying with all required laws and regulations, we continually search for ways to reduce GHG and other emissions. In 2011, we completed the installation of air pollution controls at one of our nitric acid plants at Geismar, which has reduced its GHG emissions by an estimated 75 percent.
2012 Targets
| 1 | Achieve zero life-altering injuries at our sites |
| 2 | Reduce total site* severity injury rate** by 35 percent from 2008 levels by the end of 2012 |
| 3 | Reduce total site recordable injury rate to 1.3 (per 200,000 hours worked) or lower |
| 4 | Reduce company-wide GHG emissions per tonne of product by 10 percent by the end of 2012, compared to 2007 |
| 5 | Reduce total reportable incidents (releases, permit excursions and spills) by 10 percent from 2011 levels |
| 6 | Maintain company-wide water usage per tonne of product at 2011 levels or less |
| * | Total site includes PotashCorp employees, contractors and all others on site. |
| ** | Severity injury rate is the total of lost-time injuries and modified work injuries for every 200,000 hours worked. |
| | |
| 42 | | PotashCorp 2011 Annual Report |
Our Nutrients
We devise strategies and set priorities in each of our nutrient segments that align with our company-wide goals. While each nutrient is important to our success, we believe our unique leverage in potash provides the greatest opportunity for growth in the years ahead.

Operator Chris Bauml changes rotor bits on a borer at our Lanigan facility.
Potash
Snapshot of Potash
Our Strategic Approach
| • | | Build on our potash position whenever value-enhancing opportunities arise |
| • | | Match production to market demand to reduce downside risk and conserve the long-term value of our potash resources |
Risks
| • | | New supply creates market imbalance |
| • | | Global demand insufficient to consume PotashCorp capacity |
| • | | Lack of adequate transportation and distribution infrastructure |
| • | | Underground mines face risks of water inflow and unexpected rock falls |
For more detail on potash segment risks, see Pages 21-22.
Priorities
| • | | Expand operational capability to meet rising demand |
| • | | Enhance transportation and distribution capability |
| • | | Attract and retain a skilled workforce |
| • | | Structure operations so majority of costs are variable |
Mitigation
| • | | Pace internal growth to rising market demand, and match production to demand |
| • | | Work with partners to ensure sufficient investment is made in transportation and distribution infrastructure |
| • | | Use advanced monitoring and geophysical techniques to help predict problematic situations |
Potash
What Matters in Potash
Economically mineable deposits are geographically concentrated
Potash is produced in only 12 countries around the world as high-quality, economically mineable deposits are rare. The quality of a deposit is dependent on geological factors such as ore thickness, consistency, depth and potassium content. Canada accounts for almost half of the world’s known reserves, as reported by the US Geological Survey, and 35 percent of world capacity.
Demand is rising, and major consumers have little or no indigenous production capability
Over the past 10 years, potash consumption grew annually by more than 3 percent, surpassing the growth rates for the other primary nutrients. Most of this growth was in offshore markets where potash has historically been under-applied as measured against scientifically recommended levels.
These growing markets have little or no indigenous production capability and are heavily reliant on imports. Trade typically accounts for approximately 80 percent of global potash demand, an important difference from other major crop nutrients. The continuing rise expected in offshore demand offers an opportunity for producers able to increase export capabilities.
Significant investment of capital and time required to build new capacity
The cost and time required to build new capacity make entry into the potash business risky. We estimate that a conventional 2-million-tonne greenfield mine in Saskatchewan would require upfront capital of CDN $4.1 billion inside the plant gate. That figure could exceed CDN $6 billion when costs for developing the necessary distribution infrastructure and potential purchase of a deposit are factored in. We estimate that a minimum of seven years would be required from the start of development to full operational capability, assuming no major permitting or construction difficulties. The time and cost to build solution mines are estimated to be slightly lower, but they could have higher production costs than conventional mines as they are more energy-intensive.
While brownfield projects can be constructed at a considerable discount to the cost of greenfield mines, both the cost and time required to complete them have increased. We believe many of the less complex projects have been completed and expect some brownfield projects under construction today may take up to seven years to achieve full operational capability.
The rising cost of building new capacity also reflects the current pressure on the materials and skilled labor required to complete these projects. We believe competition in Western Canada for engineers and contractors will continue to increase due to announced construction projects in a broad range of resource sectors.
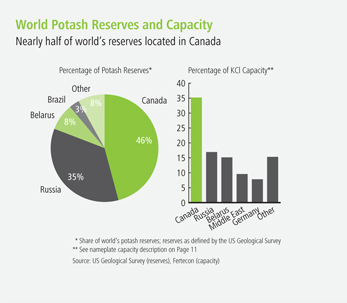
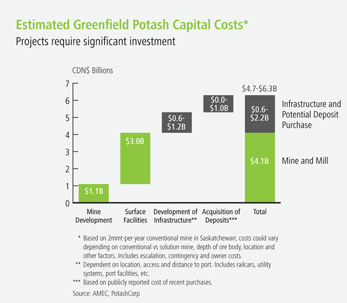
| | |
| 44 | | PotashCorp 2011 Annual Report |
Our Potash Markets
Fertilizer, the primary use for potash, typically makes up more than 90 percent of our annual sales volumes. Industrial uses such as soaps, water softeners, de-icers, drilling muds and food products comprise the rest.
Offshore markets accounted for 66 percent of our sales volumes, for application on a wide range of crops such as grains, oilseeds, sugar cane, cotton, fruits and vegetables. The remainder was sold in North America for application on crops such as corn and soybeans, which account for more than half of the potash fertilizer consumed in this market.
Offshore markets
The potash-hungry markets in Asia and Latin America account for 95 percent of Canpotex sales volumes. These are growth markets because their thriving economies and rising populations are putting significant pressure on their long-term food production capabilities. As they strive for better yields, increasing potash application will play a major role because they have historically under-applied it relative to the other primary nutrients.
Customers in Asia mainly buy standard-grade potash for direct application or use in the manufacture of compound fertilizer products. The larger, more uniform granular product is the potash of choice in Latin America, particularly Brazil, which consumes nearly all its supply in this form. As their agricultural
practices improve, we expect other developing offshore markets to increasingly demand granular product because it blends readily with other crop nutrients.
We supply these growing markets mainly through Canpotex, which has terminals at ports in Vancouver, British Columbia and Portland, Oregon on the West Coast of North America. PCS Sales handles offshore shipments from our New Brunswick facility through a nearby port on Canada’s East Coast. Both Canpotex and PCS Sales compete with Belarusian Potash Company (BPC), the marketing agency for suppliers in the former Soviet Union, and producers such as ICL, K+S and SQM.
North American market
In this relatively mature and stable market for granular potash, the vast majority of demand is supplied by North American producers.
We supply our North American customers primarily by rail from both Saskatchewan and New Brunswick, particularly from our Rocanville facility, which is just 150 km from the US border. Wholesalers, retailers and cooperatives are our main customers, purchasing in the spot market from PCS Sales. We believe our more than 150 owned or leased US distribution points give us the most extensive domestic distribution network in the potash business.
Mosaic, Agrium and Intrepid Potash are our main competitors in North America, along with offshore imports into the US Gulf and East Coast, primarily from BPC and ICL.
Primary Potash Market Profile
| | | | | | | | | | |
Country/region | | 2011 domestic
producer sales
(million tonnes KCl) | | 2011 offshore
imports
(million tonnes KCl) | | Annualized
consumption
growth rate
(2001-2011) | | Main purchasing
method | | Key consuming
crops |
China | | 4.1 | | 6.4 | | 5.6% | | 6-month contract | | Fruits, vegetables,
rice |
India | | 0 | | 4.2 | | 6.3% | | 6-month contract | | Rice, fruits,
vegetables, sugar
cane |
Other Asia | | 0 | | 8.3 | | 4.6% | | Spot market
& 6-month contracts | | Oil palm, rice,
sugar cane, fruits
and vegetables |
Latin America | | 2.3 | | 7.8 | | 4.8% | | Spot market | | Soybeans, sugar
cane, corn |
North America | | 7.7 | | 1.6 | | 0.3% | | Spot market | | Corn, soybeans |
Source: Fertecon, IFA, industry publications, PotashCorp
| | |
| PotashCorp 2011 Annual Report | | 45 |
Potash
Our Strategic Approach in Potash
We have followed two clearly defined strategies in our potash business for more than two decades, which we believe have contributed to our company’s success and served our stakeholders well.
Strategy 1:
Build on our potash position whenever value-enhancing opportunities arise. This includes brownfield expansion and debottlenecking projects at our existing mines and equity investments in other potash-related companies that add to our global enterprise and contribute to our bottom line.
Strategy 2:
Match production to market demand to reduce downside risk and conserve the long-term value of our potash resources.
Potash Priorities
Expand operational capability to meet rising demand
With six mines available to expand and a significant cost advantage compared to greenfield projects, we initiated expansion and debottlenecking projects at all our facilities beginning in 2003, in preparation for rising world demand. At the end of 2011, we had completed five of nine projects and approximately 75 percent of the projected capital expenditures.
We expect our expansions still underway will provide approximately half of the operational capability that is being added around the world by 2015. Our remaining projects are: an expansion to the mill at Allan, the second phase of Cory’s debottlenecking and expansion project, a larger replacement mine and expanded mill at New Brunswick and a mine and mill expansion at Rocanville. Construction at Allan and Cory is scheduled for completion in 2012, New Brunswick in 2013 and Rocanville in 2014.
After construction is complete, each facility is expected to begin a ramp-up period that could take up to two years. All our projects are expected to be ramped up by 2015, with the capability to produce 17.1 million tonnes of potash.
PotashCorp’s Strategic Potash Investments
| | | | | | | | |
| | | SQM, Chile | | APC, Jordan | | Sinofert, China | | ICL, Israel |
Company Profile | | World’s leading producer of specialty plant nutrition products, lithium and iodine | | Potash producer with logistical advantage in delivering to India and certain other Asian countries | | Largest fertilizer importer and distributor in China Typically distributes more than half of the potash used in China | | Potash producer with logistical advantage in delivering to India and certain other Asian countries Producer of phosphate, bromine and magnesium |
| | | | |
Potash Capacity* | | 1.8 million tonnes KCl | | 2.5 million tonnes KCl | | No primary potash capacity | | 6.0 million tonnes KCl |
| | | | |
PotashCorp Ownership | | 32 percent | | 28 percent | | 22 percent | | 14 percent |
| | | | |
Board Representation | | Right to designate three of eight board members | | Right to designate three of 13 board members and the top four management positions | | Right to designate two of seven board members | | No board members |
| | | | |
Market Value** | | US $4.4 billion | | US $1.4 billion | | US $0.4 billion | | US $1.8 billion |
| * | Based on reported capacity on December 31, 2011 |
| ** | Market value of PotashCorp investment as at December 31, 2011 |
Source: Fertecon, CRU, Bloomberg, public filings, PotashCorp
| | |
| 46 | | PotashCorp 2011 Annual Report |
Our expansion program includes increases in our compaction capability so we can produce more granular product. By 2015, we expect to increase this production capability by almost 75 percent from 2010 levels.
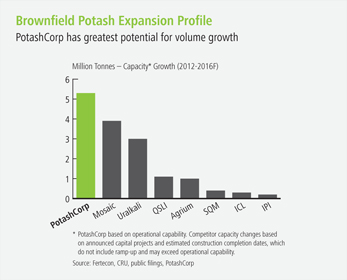
Enhance transportation and distribution capability
Our ability to serve our customers efficiently and reliably requires transportation and distribution infrastructure that matches our rising operational capability. As part of our expansion program, we have enhanced storage and loadout capability at our mines to move our potash to market more quickly and consistently.
We serve the North American market with approximately 4,200 potash railcars (owned or leased) – including 1,000 high-capacity cars purchased in 2010 and 2011 to upgrade our fleet and increase product volumes per train load. We announced plans to build a 136,000-square-foot regional distribution center in Hammond, Indiana that will reduce the delivery time and cost to serve key potash markets in the US Midwest.
To support expected growth in offshore markets, Canpotex expects to complete the expansion at its Vancouver terminal in 2012, increasing its annual capacity to 15 million tonnes. It is evaluating plans to build new terminal capacity on Canada’s West Coast that would increase its export capacity to approximately 25 million tonnes.
| | | | | | | | | | | | | | |
Facility | | Capacity
Expansions/
Debottlenecking1 | | Actual and
Expected
Investment
(CDN$ billions) | | | Expected
Remaining
Spending2
(CDN$ billions) | | | Actual and
Expected
Construction
Completion3 | | Expected
Operational
Capability
Following Ramp-Up |
Construction Projects Completed (2005-2011) |
Rocanville | | 0.75 MMT | | $ | 0.13 | | | | | | | 2005 | | |
Allan | | 0.40 MMT | | $ | 0.21 | | | | | | | 2007 | | |
Lanigan | | 1.50 MMT | | $ | 0.41 | | | | | | | 2008 | | 3.6 MMT |
Patience Lake | | 0.36 MMT | | $ | 0.11 | | | | | | | 2009 | | 0.6 MMT |
Cory I | | 1.20 MMT | | $ | 0.90 | | | | | | | 2010 | | |
Projects in Progress | | | | | | | | | | | | | | |
Cory II | | 1.00 MMT | | $ | 0.74 | | | $ | 0.03 | | | 2012 | | 2.7 MMT |
Allan | | 1.00 MMT | | $ | 0.77 | | | $ | 0.25 | | | 2012 | | 2.7 MMT |
New Brunswick4 | | 1.20 MMT | | $ | 1.66 | | | $ | 0.34 | | | 2013 | | 1.8 MMT |
Rocanville | | 2.70 MMT | | $ | 2.80 | | | $ | 1.35 | | | 2014 | | 5.7 MMT |
Total All Projects | | 10.11 MMT | | $ | 7.73 | | | $ | 1.97 | | | | | 17.1 MMT |
| 1 | Includes, as applicable, both bringing back previously idled capacity and expansions to capacity and does not necessarily reflect current operational capability |
| 2 | After December 31, 2011 |
| 3 | Construction completion does not include ramp-up time |
| 4 | Net capacity increase assuming closure of existing 0.8MMT mine |
| | |
| PotashCorp 2011 Annual Report | | 47 |
Potash
Canpotex has received nine new ocean vessels since 2009 and committed to eight more to be delivered between 2012 and 2014. Its 5,000 leased railcars move potash to its West Coast terminals under long-term contracts with Canadian and US rail carriers. Canpotex is building a CDN $60 million railcar maintenance and staging facility near Lanigan, Saskatchewan that is expected to enhance its railcar fleet performance and support efficiencies that benefit suppliers and customers.
Attract and retain a skilled workforce
We are increasing our focus on recruiting as we continue to expand our potash operations and as the labor market tightens in Western Canada. Over the next three years, we expect to add approximately 30 percent more potash employees, compared to 2011. As well as being proactive in hiring and retaining employees, we need to ensure they have the skills and training required to work effectively and safely within our facilities.
We provide a wide range of scholarships and bursaries that encourage enrolment in education for jobs in high demand and support students in the communities in which we operate. We supplement this with internship and trainee programs that provide valuable on-the-job experience for prospective and new employees.
Saskatchewan’s Aboriginal people are the fastest-growing segment of the province’s population and an important resource for our future employment needs. Our Aboriginal engagement strategy involves a multifaceted approach designed to make the company more accessible and attractive to potential employees and suppliers. We are providing training programs for students to gain hands-on experience in mining. All of our Saskatchewan employees and all Board members received Aboriginal awareness training in 2011.
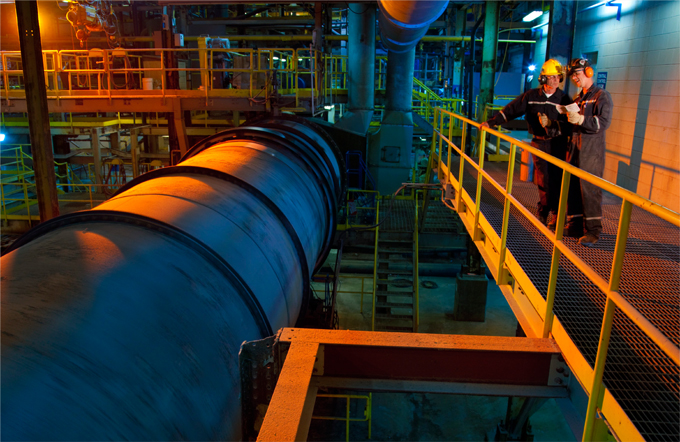
Mill Operator Gerry Woroniuk and Troy Alberts, Apprentice Electrician, complete an Employee Safety Audit card beside a rotary dryer in Patience Lake’s mill.
| | |
| 48 | | PotashCorp 2011 Annual Report |
Potash Performance
| | | | | | | | | | | | | | | | | | | | | | | | | | | | | | | | | | | | |
| | | Dollars (millions) | | | | | | Tonnes
(thousands) | | | | | | Average per Tonne1 | | | | |
| |
| | | 2011 | | | 2010 | | | % Increase
(Decrease) | | | 2011 | | | 2010 | | | % Increase
(Decrease) | | | 2011 | | | 2010 | | | % Increase
(Decrease) | |
| |
Manufactured product | | | | | | | | | | | | | | | | | | | | | | | | | | | | | | | | | | | | |
Net sales | | | | | | | | | | | | | | | | | | | | | | | | | | | | | | | | | | | | |
North America | | $ | 1,502 | | | $ | 1,222 | | | | 23 | | | | 3,114 | | | | 3,355 | | | | (7 | ) | | $ | 482 | | | $ | 364 | | | | 32 | |
Offshore | | | 2,223 | | | | 1,506 | | | | 48 | | | | 5,932 | | | | 5,289 | | | | 12 | | | $ | 375 | | | $ | 285 | | | | 32 | |
| |
| | | 3,725 | | | | 2,728 | | | | 37 | | | | 9,046 | | | | 8,644 | | | | 5 | | | $ | 412 | | | $ | 316 | | | | 30 | |
Cost of goods sold | | | (1,007 | ) | | | (919 | ) | | | 10 | | | | | | | | | | | | | | | $ | (112 | ) | | $ | (107 | ) | | | 5 | |
| |
Gross margin | | | 2,718 | | | | 1,809 | | | | 50 | | | | | | | | | | | | | | | $ | 300 | | | $ | 209 | | | | 44 | |
Other miscellaneous and purchased product gross margin2 | | | 4 | | | | 7 | | | | (43 | ) | | | | | | | | | | | | | | | | | | | | | | | | |
| |
Gross Margin | | $ | 2,722 | | | $ | 1,816 | | | | 50 | | | | | | | | | | | | | | | $ | 301 | | | $ | 210 | | | | 43 | |
| |
Note 16 to the consolidated financial statements provides information pertaining to our business segments.
| 1 | Rounding differences may occur due to the use of whole dollars in per-tonne calculations. |
| 2 | Comprised of net sales of $14 million (2010 – $14 million) less cost of goods sold of $10 million (2010 – $7 million). |
| | | | | | | | | | | | |
| | | 2011 | | | 2010 | | | % Increase
(Decrease) | |
| |
KCl tonnes produced (thousands) | | | 9,343 | | | | 8,078 | | | | 16 | |
Total site severity injury rate | | | 0.60 | | | | 0.39 | | | | 54 | |
Environmental incidents | | | 9 | | | | 8 | | | | 13 | |
Potash gross margin variance attributable to:
Dollars (millions)
| | | | | | | | | | | | | | | | |
| | | 2011 vs 2010 | |
| |
| | | Change in
Sales Volumes | | | Change in Prices/Costs | | | Total | |
| | | | Net Sales | | | Cost of Goods Sold | | |
| |
Manufactured product | | | | | | | | | | | | | | | | |
North America | | $ | (72 | ) | | $ | 367 | | | $ | 6 | | | $ | 301 | |
Offshore | | | 140 | | | | 535 | | | | (67 | ) | | | 608 | |
Change in market mix | | | 32 | | | | (32 | ) | | | — | | | | — | |
| |
Total manufactured product | | $ | 100 | | | $ | 870 | | | $ | (61 | ) | | | 909 | |
Other miscellaneous and purchased product | | | | | | | | | | | | | | | (3 | ) |
| |
Total | | | | | | | | | | | | | | $ | 906 | |
| |
| | |
| PotashCorp 2011 Annual Report | | 49 |
Performance: 2011 vs 2010
Financial
The most significant contributors to the change in total gross margin were as follows (direction of arrows refers to impact on gross margin):
Net sales prices
 | Higher average realized prices reflected tight supply/demand fundamentals and the continued upward movement in spot and contract market pricing levels in late 2010 and most of 2011. |
Sales volumes
| Record Canpotex shipments to offshore markets were the result of growth in demand from nearly all major offshore markets, driven by supportive commodity prices and lower customer inventories at the start of the year. |
| Canpotex’s increased shipments to Latin America, other Asian countries (excluding China and India) and China exceeded the decline in sales to India, which had been largely absent from the market in 2011 until new contracts were signed in August 2011. |
 | North American volumes fell in the latter part of the year as dealers were cautious and limited purchases. |
Cost of goods sold
| The Canadian dollar strengthened relative to the US dollar. |
| 47 shutdown weeks incurred in 2011 (66 weeks taken in 2010) were for planned annual maintenance, expansion-related activities and inventory adjustments. |
| Offshore cost of goods sold variance was negative due to more of that product coming from our higher-cost mines as compared to last year. |
| North American cost of goods sold variance was positive as a relatively higher percentage of products produced at lower-cost mines, or using lower-cost processes, was sold. |
Market mix caused a favorable variance in sales volumes and an unfavorable variance in net sales prices as a result of selling more lower-priced product to offshore customers (and less higher-priced product to North America) from relatively higher-cost mines. North American customers prefer premium-priced granular product over standard product more typically consumed offshore.
Non-Financial
| • | | Total site severity injury rate per 200,000 hours worked increased to 0.60 in 2011 from 0.39 in 2010. |
| • | | Total employees increased by 192. New collective bargaining agreements at Allan, Cory and Patience Lake were signed in 2011 and extend to 2014. |
��
| | |
| 50 | | PotashCorp 2011 Annual Report |
Canpotex sales to major markets were as follows:
| | | | | | | | | | | | | | | | |
| | | Percentage of Annual Sales Volumes | | | | | | | |
| | | 2011 | | | 2010 | | | Increase (Decrease) | | | % Increase (Decrease) | |
| |
China | | | 17 | | | | 14 | | | | 3 | | | | 21 | |
India | | | 9 | | | | 14 | | | | (5 | ) | | | (36 | ) |
Other Asian countries1 | | | 43 | | | | 41 | | | | 2 | | | | 5 | |
Latin America | | | 26 | | | | 25 | | | | 1 | | | | 4 | |
Other countries | | | 5 | | | | 6 | | | | (1 | ) | | | (17 | ) |
| |
| | | 100 | | | | 100 | | | | | | | | | |
| |
| 1 | All Asian countries except China and India |
Potash Production
(million tonnes KCl)
| | | | | | | | | | | | | | | | | | | | | | | | | | | | |
| | | Nameplate
Capacity1 | | | Operational
Capability (2012)2 | | | Operational
Capability (2011)2 | | | 2011 | | | Production
2010 | | | 2009 | | | Employees | |
| |
Lanigan SK | | | 3.828 | | | | 3.291 | | | | 3.400 | | | | 3.042 | | | | 2.368 | | | | 0.702 | | | | 588 | |
Rocanville SK | | | 3.044 | | | | 2.701 | | | | 2.800 | | | | 2.430 | | | | 2.183 | | | | 0.949 | | | | 475 | |
Allan SK | | | 1.885 | | | | 1.648 | | | | 1.400 | | | | 1.019 | | | | 1.104 | | | | 0.686 | | | | 441 | |
Cory SK | | | 1.361 | | | | 2.023 | | | | 1.500 | | | | 0.778 | | | | 0.551 | | | | 0.416 | | | | 499 | |
Patience Lake SK | | | 1.033 | | | | 0.407 | | | | 0.500 | | | | 0.390 | | | | 0.372 | | | | 0.101 | | | | 95 | |
Esterhazy SK3 | | | 1.313 | | | | 1.012 | | | | 0.943 | | | | 0.943 | | | | 0.855 | | | | 0.276 | | | | — | |
New Brunswick NB | | | 0.800 | | | | 0.762 | | | | 0.800 | | | | 0.741 | | | | 0.645 | | | | 0.275 | | | | 415 | |
| |
Total | | | 13.264 | | | | 11.844 | | | | 11.343 | | | | 9.343 | | | | 8.078 | | | | 3.405 | | | | 2,513 | 4 |
| |
| 1 | Includes, where applicable, previously idled capacity that can be brought into operation with capital investment (debottlenecking projects) |
| 2 | Estimated annual achievable production level (estimated at beginning of year). Estimate does not include inventory-related shutdowns and unplanned downtime. |
| 3 | PotashCorp’s mineral rights at Esterhazy are mined by Mosaic Potash Esterhazy Limited Partnership under a mining and processing agreement which will terminate on December 31, 2012. In 2011, the company received 0.943 million tonnes of finished product, and in 2012 will receive 1.012 million tones. Notwithstanding termination of the agreement on December 31, 2012, the company will receive 0.112 million tonnes in the first quarter of 2013. |
| 4 | Seven employees work at Cassidy Lake NB for a total potash workforce of 2,520. |
| | |
| PotashCorp 2011 Annual Report | | 51 |
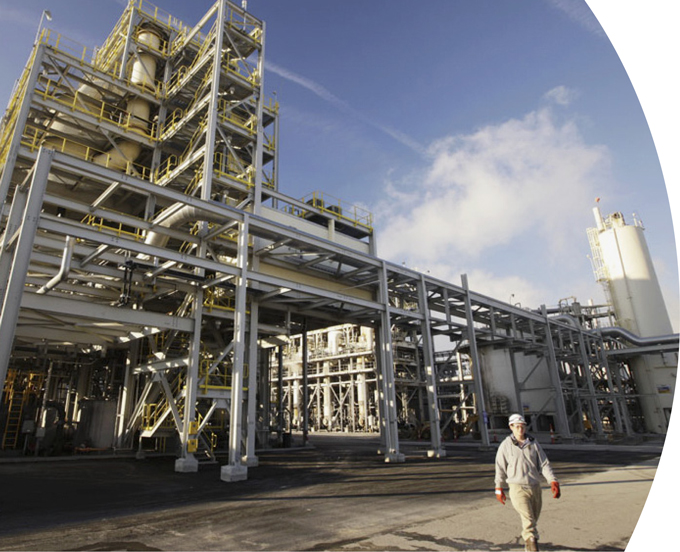
Phosphoric acid evaporators at Aurora are shown here with Matt Erwin, Evaporator Operator.
Phosphate
Snapshot of Phosphate
Our Strategic Approach
| • | | Optimize product mix to maximize gross margin and reduce volatility |
| • | | Among the three nutrients, the phosphate business consumes the most water and generates the largest waste streams so we focus on environmental initiatives |
Risk
| • | | Cyclicality due to fluctuations in demand, changes in available supply and volatility in raw material costs |
Priorities
| • | | Leverage our lower-cost, high-quality permitted rock supply |
| • | | Enhance our sulfur and ammonia supply position |
| • | | Focus on land and water conservation efforts |
Mitigation
| • | | Leverage our strengths in less cyclical industrial and feed products and streamline our operations and logistics to minimize costs |
For more detail on phosphate segment risks, see Page 22.
Phosphate
What Matters in Phosphate
Rock of high quality and lower cost is key to success
We consider access to lower-cost phosphate rock the most important requirement for a successful phosphate business. This is a geographically concentrated resource with almost three-quarters of world production located in China, the US and North Africa. Morocco alone typically supplies approximately one-third of global exports.
Approximately 30 percent of global phosphate producers are non-integrated and must rely on rock imports or domestic purchases. Prices for the feedstock have been driven well above historical levels by the strong growth in demand for phosphate and the need for investment in new rock capacity.
The US has significant high-quality rock reserves and produces the majority of its domestic rock requirements. Imports have increased in recent years as permits to mine are now more difficult to obtain. This highlights the importance of having long-lived permitted reserves.
Changes in sulfur and ammonia markets can impact profitability
Along with rock, sulfur is an important input in phosphate production. Ammonia is also needed to produce many fertilizers and certain industrial products. Prices for phosphate products typically reflect changes in these input costs, but time lags between when the raw materials are purchased and when the finished products can be sold may affect profitability.
India and China are major drivers of phosphate fertilizer trade
With a limited indigenous supply of phosphate rock, India relies primarily on imports to meet its rising requirements for phosphate fertilizer. It uses imported rock, phosphoric acid, ammonia and sulfur to make solid phosphate fertilizers. To meet rising demand, it also imports these finished products and now accounts for approximately one-third of global DAP and MAP trade.
While China has emerged as a major exporter of solid phosphate fertilizers, the availability of its supply has fluctuated depending on global price levels and on government export tax policies. After exporting record volumes in 2011, it levied more restrictive export taxes for 2012 in an attempt to ensure adequate domestic supplies of phosphate fertilizer.
Our Phosphate Markets
Fertilizer accounts for more than 90 percent of global phosphoric acid use, but it makes up only 69 percent of our annual phosphate sales volumes because of our diverse product line. Nearly two-thirds of our product is sold in North America, where we commonly benefit from higher realized prices because of our proximity to end customers. We make the majority of our offshore sales to India and Latin America.
PCS Sales handles our North American fertilizer business and our feed and industrial sales in all markets. Our phosphate fertilizers are sold offshore by PhosChem, a US marketing association that also includes Mosaic. Most of our offshore sales are shipped through a terminal at Morehead City, North Carolina.
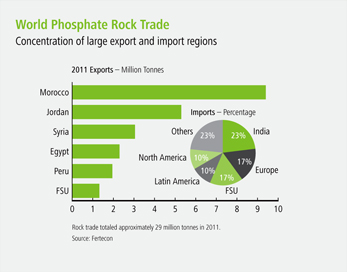
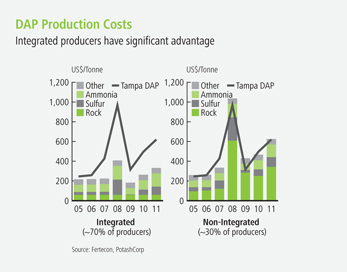
| | |
| PotashCorp 2011 Annual Report | | 53 |
Our competitors for North American phosphate fertilizer sales are Mosaic, CF Industries, Mississippi Phosphates, Simplot and Agrium, and in offshore markets we compete primarily with Office Cherifien des Phosphates (OCP), as well as Russian and Chinese producers. We compete with Innophos, ICL and Chinese producers for industrial sales, and with Mosaic, Simplot, Chinese and Russian producers for feed sales.
Our Strategic Approach in Phosphate
Our strategy in phosphate is to produce the industry’s most diversified mix of products to maximize returns and provide earnings stability. We have built our position in the historically more stable feed and industrial businesses, which benefit from having fewer global producers than the fertilizer segment. To support the long-term viability of our operations, we focus on initiatives that preserve habitat and promote natural biodiversity in surrounding areas.
Phosphate Priorities
Leverage our lower-cost, high-quality permitted rock supply
As the world’s third largest phosphate producer by capacity, we have mines at Aurora, North Carolina and White Springs, Florida, and mine 94 percent of our phosphate rock requirements. We have permits at Aurora allowing for more than 30 years of mining, and a life-of-mine permit at White Springs. We import a specific type of rock for our Geismar phosphate facility to meet certain customer product requirements.
The high quality of our rock, particularly at Aurora, allows us to produce the most diversified product line in the industry. In
2011, 59 percent of our solid fertilizers, 68 percent of our liquid fertilizers and all of our purified acid were produced at Aurora.
Enhance our sulfur and ammonia supply position
We obtain most of our sulfur requirements from North American sources and supplement this with imported product. Our offshore supply options can be limited because sulfur shipped in the US is in molten form while most world trade is in solid form. We are reviewing various options to enhance our long-term supply position.
The cost of delivering ammonia to our phosphate facilities has been affected by increased rail carrier rates. To improve our ammonia cost position, we are evaluating options to enhance supply from our US nitrogen plants. In addition, our product mix flexibility could allow us to produce more liquid fertilizer products, which are less reliant on ammonia inputs.
Focus on land and water conservation efforts
Support for our operations from communities, governments and other stakeholders is dependent on our good stewardship of the environment. We focus on reducing the impact of our mining operations on nearby land and water resources. We have a commitment to return two acres for every acre disturbed in Aurora and a minimum of one acre per acre mined in White Springs. We have implemented reclamation and wetland mitigation projects at our facilities that cover approximately 20,000 acres.
We are exploring options to improve on water use efficiency at our phosphate facilities, which are the largest users of water among our operations.
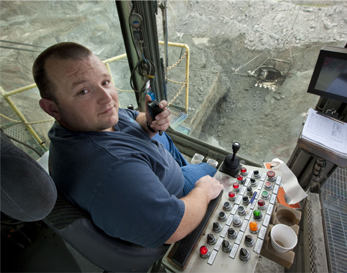
Daniel Stonebreaker operates one of Aurora’s huge draglines, used to mine phosphate rock.
| | |
| 54 | | PotashCorp 2011 Annual Report |
Phosphate Performance
| | | | | | | | | | | | | | | | | | | | | | | | | | | | | | | | | | | | |
| | | Dollars (millions) | | | | | | Tonnes (thousands) | | | | | | Average per Tonne1 | | | | |
| |
| | | 2011 | | | 2010 | | | % Increase
(Decrease) | | | 2011 | | | 2010 | | | % Increase
(Decrease) | | | 2011 | | | 2010 | | | % Increase
(Decrease) | |
| |
| |
Manufactured product | | | | | | | | | | | | | | | | | | | | | | | | | | | | | | | | | | | | |
Net sales | | | | | | | | | | | | | | | | | | | | | | | | | | | | | | | | | | | | |
Fertilizers – liquids | | $ | 727 | | | $ | 416 | | | | 75 | | | | 1,342 | | | | 1,111 | | | | 21 | �� | | $ | 541 | | | $ | 375 | | | | 44 | |
Fertilizers – solids | | | 806 | | | | 597 | | | | 35 | | | | 1,324 | | | | 1,291 | | | | 3 | | | $ | 609 | | | $ | 462 | | | | 32 | |
Feed | | | 305 | | | | 289 | | | | 6 | | | | 548 | | | | 622 | | | | (12 | ) | | $ | 557 | | | $ | 464 | | | | 20 | |
Industrial | | | 445 | | | | 351 | | | | 27 | | | | 640 | | | | 608 | | | | 5 | | | $ | 695 | | | $ | 577 | | | | 20 | |
| |
| | | 2,283 | | | | 1,653 | | | | 38 | | | | 3,854 | | | | 3,632 | | | | 6 | | | $ | 592 | | | $ | 455 | | | | 30 | |
Cost of goods sold | | | (1,650 | ) | | | (1,322 | ) | | | 25 | | | | | | | | | | | | | | | $ | (428 | ) | | $ | (364 | ) | | | 18 | |
| |
Gross margin | | | 633 | | | | 331 | | | | 91 | | | | | | | | | | | | | | | $ | 164 | | | $ | 91 | | | | 80 | |
Other miscellaneous and purchased product gross margin2 | | | 15 | | | | 15 | | | | — | | | | | | | | | | | | | | | | | | | | | | | | | |
| |
Gross Margin | | $ | 648 | | | $ | 346 | | | | 87 | | | | | | | | | | | | | | | $ | 168 | | | $ | 95 | | | | 77 | |
| |
Note 16 to the consolidated financial statements provides information pertaining to our business segments.
| 1 | Rounding differences may occur due to the use of whole dollars in per-tonne calculations. |
| 2 | Comprised of net sales of $29 million (2010 – $25 million) less cost of goods sold of $14 million (2010 – $10 million). |
| | | | | | | | | | | | |
| | | 2011 | | | 2010 | | | % Increase
(Decrease) | |
| |
P2O5tonnes produced (thousands) | | | 2,204 | | | | 1,987 | | | | 11 | |
P2O5operating rate percentage | | | 93 | | | | 84 | | | | 11 | |
Total site severity injury rate | | | 0.77 | | | | 0.49 | | | | 57 | |
Environmental incidents | | | 2 | | | | 7 | | | | (71 | ) |
Phosphate gross margin variance attributable to:
Dollars (millions)
| | | | | | | | | | | | | | | | |
| | | 2011 vs 2010 | |
| |
| | | Change in Sales Volumes | | | Change in Prices/Costs | | | | |
| | | | Net Sales | | | Cost of Goods Sold | | | Total | |
| |
Manufactured product | | | | | | | | | | | | | | | | |
Fertilizer – liquids | | $ | 50 | | | $ | 224 | | | $ | (123 | ) | | $ | 151 | |
Fertilizer – solids | | | 8 | | | | 194 | | | | (101 | ) | | | 101 | |
Feed | | | (19 | ) | | | 51 | | | | (6 | ) | | | 26 | |
Industrial | | | 17 | | | | 75 | | | | (68 | ) | | | 24 | |
Change in product mix | | | 15 | | | | (15 | ) | | | — | | | | — | |
| |
Total manufactured product | | $ | 71 | | | $ | 529 | | | $ | (298 | ) | | | 302 | |
Other miscellaneous and purchased product | | | | | | | | | | | | | | | — | |
| |
Total | | | | | | | | | | | | | | $ | 302 | |
| |
| | |
| PotashCorp 2011 Annual Report | | 55 |
Performance: 2011 vs 2010
Financial
The most significant contributors to the change in total gross margin were as follows (direction of arrows refers to impact on gross margin):
Net sales prices
| Prices for phosphate products rose in response to supportive crop economics, tight supply/demand fundamentals and higher raw material prices. |
| The largest price increases were evident in liquid and solid fertilizers, which were supported by strong agricultural fundamentals. Prices for feed were slower to respond because of challenging livestock fundamentals. Industrial prices lagged as they were influenced by certain longer-term contracts. |
Sales volumes
| Fertilizer volumes grew as we allocated more production to these product lines to capitalize on higher-margin opportunity. |
| Demand for feed products was impacted by reduced livestock numbers and the use of substitute feed ingredients. |
Cost of goods sold
| Costs were impacted by higher sulfur costs (up 58 percent). |
| Solid fertilizer costs reflected higher ammonia costs (up 24 percent). |
| The change in fertilizer costs was higher than in feed and industrial costs due to a higher allocation of fixed costs (a result of fertilizer production volumes increasing more significantly than volumes for the other products). |
Non-Financial
| • | | Total site severity injury rate per 200,000 hours worked increased to 0.77 in 2011 from 0.49 in 2010. |
| | |
| 56 | | PotashCorp 2011 Annual Report |
Phosphate Production
(million tonnes product)
| | | | | | | | | | | | | | | | | | | | | | | | | | | | | | | | | | | | | | | | | | | | | | | | | | | | | | | | | | | | |
| | | AURORA | | | WHITE SPRINGS | | | GEISMAR | |
| | | Annual Capacity | | | | | | Production | | | Annual Capacity | | | | | | Production | | | Annual Capacity | | | | | | Production | |
| | | | | | | 2011 | | | 2010 | | | 2009 | | | | | | | 2011 | | | 2010 | | | 2009 | | | | | | | 2011 | | | 2010 | | | 2009 | |
| |
Liquids: MGA1 | | | 1.956 | 2 | | | | | | | 1.956 | | | | 1.859 | | | | 1.486 | | | | 1.908 | | | | | | | | 0.002 | | | | — | | | | — | | | | 0.337 | | | | | | | | 0.228 | | | | 0.226 | | | | 0.233 | |
SPA | | | 0.676 | | | | | | | | 0.255 | | | | 0.206 | | | | 0.166 | | | | 1.138 | | | | | | | | 0.795 | | | | 0.691 | | | | 0.476 | | | | 0.196 | | | | | | | | — | | | | — | | | | — | |
Solids (total) | | | 1.247 | | | | DAP | | | | 0.474 | | | | 0.542 | | | | 0.532 | | | | 0.710 | | | | DAP | | | | — | | | | — | | | | — | | | | — | | | | DAP | | | | — | | | | — | | | | — | |
| | | | | | | MAP | | | | 0.365 | | | | 0.374 | | | | 0.304 | | | | | | | | MAP | | | | 0.590 | | | | 0.374 | | | | 0.184 | | | | | | | | MAP | | | | — | | | | — | | | | �� | |
| | | | | | | | | | | | | | | | | | | | | | | | | | | | | | | | | | | | |
DAP/MAP (total) | | | | | | | | | | | 0.839 | | | | 0.916 | | | | 0.836 | | | | | | | | | | | | 0.590 | | | | 0.374 | | | | 0.184 | | | | | | | | | | | | — | | | | — | | | | — | |
| |
| 1 | A substantial portion is consumed internally in the production of downstream products. The balance is exported to phosphate fertilizer producers and sold domestically to dealers who custom-mix liquid fertilizer. |
Rock and Acid Production
| | | | | | | | | | | | | | | | | | | | | | | | | | | | | | | | | | | | |
| | | Phosphate Rock Production (million tonnes) | | | Phosphoric Acid (million tonnes P2O5) | | | | |
| | | Annual Capacity | | | Production | | | Annual Capacity | | | Production | | | Employees | |
| | | | 2011 | | | 2010 | | | 2009 | | | | 2011 | | | 2010 | | | 2009 | | |
| |
Aurora NC | | | 6.000 | | | | 4.617 | | | | 4.068 | | | | 4.198 | | | | 1.202 | | | | 1.177 | | | | 1.146 | | | | 0.932 | | | | 1,071 | |
White Springs FL | | | 3.600 | | | | 2.697 | | | | 1.783 | | | | 2.499 | | | | 0.966 | | | | 0.889 | | | | 0.705 | | | | 0.433 | | | | 698 | |
Geismar LA | | | — | | | | — | | | | — | | | | — | | | | 0.202 | | | | 0.138 | | | | 0.136 | | | | 0.140 | | | | 78 | |
| |
Total | | | 9.600 | | | | 7.314 | | | | 5.851 | | | | 6.697 | | | | 2.370 | | | | 2.204 | | | | 1.987 | | | | 1.505 | | | | 1,847 | |
| |
Purified Acid Production
(million tonnes P2O5)
| | | | | | | | | | | | | | | | |
| | | Annual Capacity | | | Production | |
| | | | 2011 | | | 2010 | | | 2009 | |
| |
Aurora NC | | | 0.333 | | | | 0.247 | | | | 0.233 | | | | 0.173 | |
| |
Purified acid is a feedstock for production of downstream industrial products such as metal brighteners, cola drinks and pharmaceuticals.
Phosphate Products for Food and Technical Applications
| | | | | | | | | | | | |
| Cincinnati OH | | 2011 | | | 2010 | | | 2009 | |
| |
Purified acid feedstock utilized (tonnes P2O5) | | | 10,911 | | | | 12,719 | | | | 10,107 | |
| |
Product tonnes processed: | | | | | | | | | | | | |
Acid phosphates | | | 14,337 | | | | 17,448 | | | | 14,345 | |
Specialty phosphates | | | 5,635 | | | | 9,259 | | | | 6,494 | |
| |
Employees | | | 23 | | | | 22 | | | | 21 | |
| |
One phosphate employee is located in Newgulf TX.
Phosphate Feed Production
(million tonnes)
| | | | | | | | | | | | | | | | | | | | |
| | | Annual Capacity | | | Production | | | | |
| | | | 2011 | | | 2010 | | | 2009 | | | Employees | |
| |
Marseilles IL | | | 0.278 | | | | 0.201 | | | | 0.211 | | | | 0.137 | | | | 36 | |
White Springs FL (Monocal)1 | | | 0.272 | | | | — | | | | — | | | | — | | | | — | |
Weeping Water NE | | | 0.209 | | | | 0.083 | | | | 0.077 | | | | 0.079 | | | | 35 | |
Joplin MO | | | 0.163 | | | | 0.053 | | | | 0.053 | | | | 0.058 | | | | 24 | |
Aurora NC (DFP) | | | 0.159 | | | | 0.038 | | | | 0.068 | | | | 0.058 | | | | 9 | |
| |
Total | | | 1.081 | | | | 0.375 | | | | 0.409 | | | | 0.332 | | | | 104 | |
| |
| 1 | Ceased production January 1, 2009 |
| | |
| PotashCorp 2011 Annual Report | | 57 |
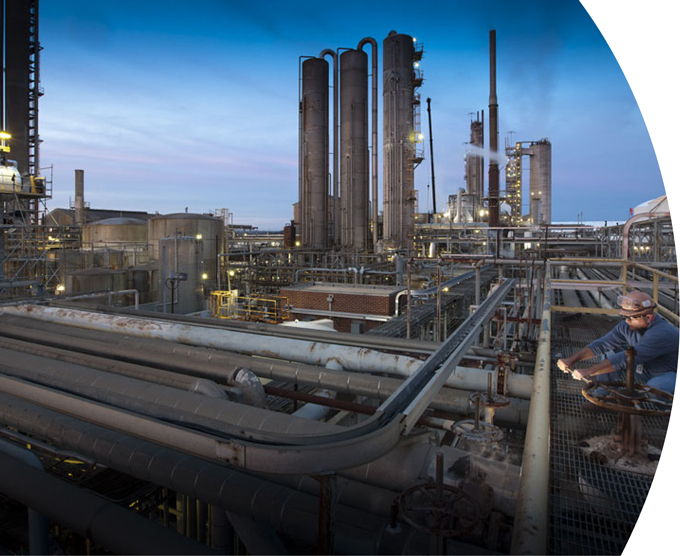
Les Hammock, one of Augusta’s team leaders, adjusts a steam valve in the plant’s utilities area.
Nitrogen
Snapshot of Nitrogen
Our Strategic Approach
| • | | Enhance gross margin and earnings stability by being a lower delivered cost supplier to the large US nitrogen market |
| • | | As nitrogen is the largest consumer of energy among the three nutrients, we focus on initiatives that can reduce its environmental impact |
Risk
| • | | Price cyclicality in an industry that is highly fragmented and regional |
Priorities
| • | | Optimize/expand our existing nitrogen production facilities |
| • | | Maintain our supply position to industrial markets |
| • | | Reduce direct greenhouse gas emissions and improve energy efficiency |
Mitigation
| • | | We have longer-term gas contracts in Trinidad primarily indexed to ammonia prices and employ gas price hedging strategies for our US plants |
| • | | We focus on supplying less cyclical industrial markets |
For more detail on nitrogen segment risks, see Page 22.
Nitrogen
What Matters in Nitrogen
Nitrogen success depends on lower-cost natural gas
Most nitrogen production around the world is derived from natural gas, which can make up 70-85 percent of the cash cost of producing a tonne of ammonia, the feedstock for all downstream nitrogen products. We believe this makes long-term access to lower-cost gas essential to sustainable success in the nitrogen business.
Russia, North Africa and the Middle East have large supplies of lower-cost natural gas and are major nitrogen exporters. Currently, US nitrogen production is in a favorable cost position, primarily because increased shale gas supply has lowered domestic gas prices. Western Europe, Ukraine and China have experienced rising natural gas prices in recent years, so producers in these regions are currently higher-cost suppliers.
Proximity to ammonia markets is important
Natural gas feedstock is prevalent in most nitrogen-consuming markets, so only 12 percent of world ammonia production is traded across borders. The cost and difficulty of transporting ammonia in expensive pressurized railcars and refrigerated rail and ocean vessels also limit such trade. Hence, proximity to the end consumer is another vital factor for success in the nitrogen business.
The US is the world’s largest importer of ammonia and the second largest consumer. Domestic producers, particularly those operating away from the major ports, have significant transportation advantages over offshore suppliers. Trinidad is less than a week’s sailing time from the US and therefore well positioned, compared to other offshore exporters, to supply this key market. Exports from this country account for approximately 70 percent of US offshore ammonia supply.
Pricing volatility is common in nitrogen markets
The extensive availability of natural gas makes nitrogen a highly fragmented and regionalized business. The 10 largest producers account for only 18 percent of world ammonia capacity. Because of this market structure and the relatively short time required to construct new capacity, nitrogen markets have typically been more volatile than potash and phosphate.
Our Nitrogen Markets
While fertilizer use accounts for approximately 80 percent of nitrogen production around the world, this segment comprised 31 percent of our total nitrogen sales volumes in 2011. Instead, we focus on supplying the historically more stable industrial market. We sell the majority of our product in North America, 87 percent of our sales volumes in 2011. Customers in Latin America account for most of our offshore sales.
Our nitrogen products are sold by PCS Sales in both North American and offshore markets. Because of logistical constraints and high transportation costs, sales – particularly of ammonia – are generally regional. Our US plants are mainly located in the interior so are less affected by offshore imports than producers close to the US Gulf and the Mississippi River.
We manage transportation costs and ensure economical delivery of our Trinidad product through long-term leases of ammonia vessels at fixed prices. We own facilities or have major supply contracts at six deepwater US ports, which gives us logistical strength and flexibility for these imports.
In the US market, we compete with other domestic producers, including CF Industries, Agrium and Koch, and with imported
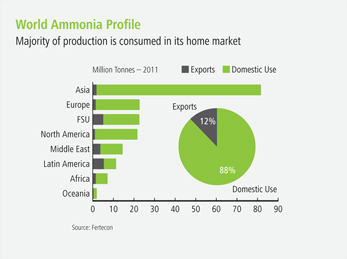

| | |
| PotashCorp 2011 Annual Report | | 59 |
product from suppliers in the Middle East, North Africa, Trinidad, Russia and China.
Our Strategic Approach in Nitrogen
We seek to enhance gross margin and earnings stability by being a lower delivered cost supplier to the large US nitrogen market. We supplement this with an emphasis on sales to industrial customers that value long-term, secure supply. As our nitrogen operations are the largest contributor to company-wide GHG emissions, we focus on initiatives that can reduce their environmental impact.
Nitrogen Priorities
Optimize/expand our existing nitrogen production facilities
Supported by competitive US natural gas prices, we are investing $158 million to resume ammonia production at our plant in Geismar, Louisiana. We anticipate this process will be complete in the third quarter of 2012, increasing our ammonia capacity by approximately 500,000 tonnes. We are implementing a small ammonia expansion project at our Augusta, Georgia facility and continue to evaluate opportunities to further increase our US nitrogen capacity. Given the historical variability in nitrogen and natural gas markets, we are focusing on projects that we believe will have short payback periods.
We have four ammonia plants in Trinidad that are an important part of our nitrogen success. We produced 61 percent of our ammonia in Trinidad in 2011 with natural gas contracts primarily
indexed to ammonia prices. This supports profitability when those prices rise and helps protect margins if they fall. The gas contract for our smallest Trinidad plant expired in 2011 and we are currently renegotiating it.
Maintain our supply position to industrial markets
Traditionally, industrial markets have provided more stable demand and margins than fertilizer. Industrial customers purchased 52 percent of the solid urea and 81 percent of the ammonia sold from our US plants in 2011.
Product reliability and being a lower delivered cost supplier are important to maintaining our supply position to the industrial market. We benefit from lower transportation and distribution costs as we deliver more than half of our US-produced ammonia sales volumes by pipeline to industrial customers. We leverage our long-term ammonia vessel leases, deepwater US port positions and close proximity of our Trinidad facilities to serve industrial customers in the US Gulf.
Reduce direct greenhouse gas emissions and improve energy efficiency
Lowering emissions levels from our nitrogen plants is essential to meeting our voluntary commitment to reducing company-wide GHG emissions per tonne. We installed nitrous oxide controls at our largest nitric acid plant and are evaluating the implementation of this technology at our other facilities. We have included energy efficiency and environmental observation metrics in our short-term incentive plans at sites, to better align our reward structure with environmental performance.
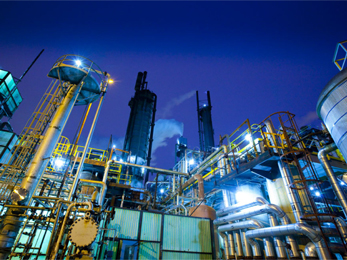
The absorber and stripper towers of the purification section of Lima’s ammonia unit stand tall against the Ohio sky.
| | |
| 60 | | PotashCorp 2011 Annual Report |
Nitrogen Performance
| | | | | | | | | | | | | | | | | | | | | | | | | | | | | | | | | | | | |
| | | Dollars (millions) | | | | | | Tonnes (thousands) | | | | | | Average per Tonne1 | | | | |
| |
| | | 2011 | | | 2010 | | | % Increase
(Decrease) | | | 2011 | | | 2010 | | | % Increase
(Decrease) | | | 2011 | | | 2010 | | | % Increase
(Decrease) | |
| |
Manufactured product | | | | | | | | | | | | | | | | | | | | | | | | | | | | | | | | | | | | |
Net sales | | | | | | | | | | | | | | | | | | | | | | | | | | | | | | | | | | | | |
Ammonia | | $ | 1,052 | | | $ | 670 | | | | 57 | | | | 1,961 | | | | 1,765 | | | | 11 | | | $ | 536 | | | $ | 380 | | | | 41 | |
Urea | | | 564 | | | | 419 | | | | 35 | | | | 1,214 | | | | 1,237 | | | | (2 | ) | | $ | 464 | | | $ | 338 | | | | 37 | |
Nitrogen solutions, nitric acid, ammonium nitrate | | | 445 | | | | 422 | | | | 5 | | | | 1,837 | | | | 2,204 | | | | (17 | ) | | $ | 242 | | | $ | 192 | | | | 26 | |
| |
| | | 2,061 | | | | 1,511 | | | | 36 | | | | 5,012 | | | | 5,206 | | | | (4 | ) | | $ | 411 | | | $ | 290 | | | | 42 | |
Cost of goods sold | | | (1,193 | ) | | | (1,010 | ) | | | 18 | | | | | | | | | | | | | | | $ | (238 | ) | | $ | (194 | ) | | | 23 | |
| |
Gross margin | | | 868 | | | | 501 | | | | 73 | | | | | | | | | | | | | | | $ | 173 | | | $ | 96 | | | | 80 | |
Other miscellaneous and purchased product gross margin2 | | | 48 | | | | 27 | | | | 78 | | | | | | | | | | | | | | | | | | | | | | | | | |
| |
Gross Margin | | $ | 916 | | | $ | 528 | | | | 73 | | | | | | | | | | | | | | | $ | 183 | | | $ | 101 | | | | 81 | |
| |
Note 16 to the consolidated financial statements provides information pertaining to our business segments.
| 1 | Rounding differences may occur due to the use of whole dollars in per-tonne calculations. |
| 2 | Comprised of net sales of $107 million (2010 – $120 million) less cost of goods sold of $59 million (2010 – $93 million). |
| | | | | | | | | | |
| | | 2011 | | | 2010 | | | % Increase
(Decrease) |
|
N tonnes produced (thousands) | | | 2,813 | | | | 2,767 | | | 2 |
Total site severity injury rate | | | 0.22 | | | | 0.25 | | | (12) |
Environmental incidents | | | 3 | | | | 5 | | | (40) |
| | | | | | | | | | | | |
| | | Sales Tonnes (thousands) | | | | Average Net Sales Price per Tonne | | |
|
| | | 2011 | | 2010 | | % Increase
(Decrease) | | 2011 | | 2010 | | % Increase
(Decrease) |
|
Fertilizer | | 1,553 | | 1,997 | | (22) | | $430 | | $277 | | 55 |
Industrial and Feed | | 3,459 | | 3,209 | | 8 | | $403 | | $298 | | 35 |
|
| | 5,012 | | 5,206 | | (4) | | $411 | | $290 | | 42 |
|
Nitrogen gross margin variance attributable to:
Dollars (millions)
| | | | | | | | | | | | | | | | |
| | | 2011 vs 2010 | |
| |
| | | Change in Sales Volumes | | | Change in Prices/Costs | | | | |
| | | | Net Sales | | | Cost of Goods Sold | | | Total | |
| |
Manufactured product | | | | | | | | | | | | | | | | |
Ammonia | | $ | 41 | | | $ | 307 | | | $ | (111 | ) | | $ | 237 | |
Urea | | | (8 | ) | | | 153 | | | | (37 | ) | | | 108 | |
Solutions, nitric acid, ammonium nitrate | | | (22 | ) | | | 93 | | | | (55 | ) | | | 16 | |
US natural gas hedge | | | — | | | | — | | | | 6 | | | | 6 | |
Change in product mix | | | (53 | ) | | | 53 | | | | — | | | | — | |
| |
Total manufactured product | | $ | (42 | ) | | $ | 606 | | | $ | (197 | ) | | | 367 | |
Other miscellaneous and purchased product | | | | | | | | | | | | | | | 21 | |
| |
Total | | | | | | | | | | | | | | $ | 388 | |
| |
| | |
| PotashCorp 2011 Annual Report | | 61 |
Performance: 2011 vs 2010
Financial
The most significant contributors to the change in total gross margin were as follows (direction of arrows refers to impact on gross margin):
Net sales prices
| Realized prices increased as a result of strong demand and tight global supplies. Ammonia production was impacted by unplanned maintenance and gas supply outages in key producing regions such as Trinidad, Europe, Australia and North Africa and construction delays on new projects. Urea was further impacted by reduced exports from China. |
Sales volumes
| Ammonia rose to meet strong industrial and agricultural demand. |
| Nitrogen solutions sales declined at our Geismar plant due to a lack of carbon dioxide from external sources in 2011. Carbon dioxide will be available from the Geismar ammonia plant when it is restarted in the third quarter of 2012, allowing us to produce nitrogen solutions without reliance on an external carbon dioxide source. |
Cost of goods sold
| Average natural gas costs in production, including our hedge position, increased 20 percent. Natural gas costs in Trinidad production rose 46 percent while our US spot costs for natural gas used in production decreased 8 percent. Including losses on our hedge position, US gas prices declined 10 percent. |
Product mix caused an unfavorable variance in sales volumes and a favorable variance in sales prices due to lower sales volumes in lower-priced nitrogen solutions, nitric acid and ammonium nitrate being offset by increased ammonia sales volumes.
Non-Financial
| • | | Total site severity injury rate per 200,000 hours worked declined to 0.22 in 2011 from 0.25 in 2010. |
| | |
| 62 | | PotashCorp 2011 Annual Report |
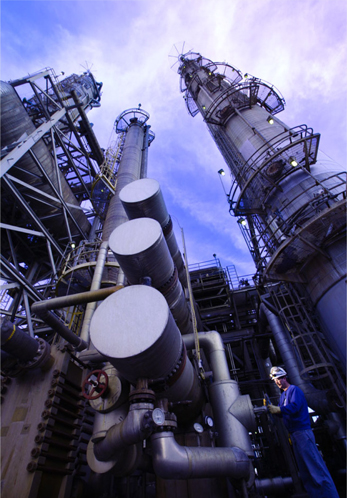
Process Technician Marc Cason adjusts a process condensate valve at Augusta’s ammonia plant.
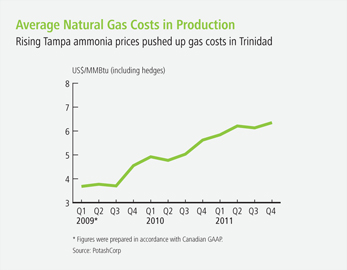
Nitrogen Production
(million tonnes)
| | | | | | | | | | | | | | | | |
| | | Annual Capacity | | | | | | Production | | | | |
| | | | 2011 | | | 2010 | | | 2009 | |
| |
Ammonia1 | | | | | | | | | | | | | | | | |
Trinidad2 | | | 2.194 | | | | 2.094 | | | | 2.194 | | | | 1.858 | |
Augusta GA2 | | | 0.717 | | | | 0.717 | | | | 0.693 | �� | | | 0.690 | |
Lima OH2 | | | 0.611 | | | | 0.611 | | | | 0.482 | | | | 0.555 | |
| |
Total | | | 3.522 | | | | 3.422 | | | | 3.369 | | | | 3.103 | |
| |
| | | | |
Urea Solids | | | | | | | | | | | | | | | | |
Trinidad | | | 0.709 | | | | 0.616 | | | | 0.709 | | | | 0.674 | |
Augusta GA | | | 0.471 | | | | 0.266 | | | | 0.335 | | | | 0.382 | |
Lima OH | | | 0.353 | | | | 0.338 | | | | 0.253 | | | | 0.353 | |
Geismar LA | | | — | | | | — | | | | — | | | | — | |
| |
Total | | | 1.533 | | | | 1.220 | | | | 1.297 | | | | 1.409 | |
| |
| | | | |
Nitrogen Solutions3 | | | | | | | | | | | | | | | | |
Trinidad | | | — | | | | — | | | | — | | | | — | |
Augusta GA | | | 0.581 | | | | 0.324 | | | | 0.350 | | | | 0.228 | |
Lima OH | | | 0.227 | | | | 0.094 | | | | 0.084 | | | | 0.071 | |
Geismar LA | | | 1.028 | | | | 0.083 | | | | 0.524 | | | | 0.291 | |
| |
Total | | | 1.836 | | | | 0.501 | | | | 0.958 | | | | 0.590 | |
| |
| | | | |
Nitric Acid1,4 | | | | | | | | | | | | | | | | |
Trinidad | | | — | | | | — | | | | — | | | | — | |
Augusta GA | | | 0.604 | | | | 0.594 | | | | 0.580 | | | | 0.503 | |
Lima OH | | | 0.117 | | | | 0.112 | | | | 0.096 | | | | 0.080 | |
Geismar LA | | | 0.844 | | | | 0.503 | | | | 0.639 | | | | 0.440 | |
| |
Total | | | 1.565 | | | | 1.209 | | | | 1.315 | | | | 1.023 | |
| |
| | | | |
Ammonium Nitrate Solids | | | | | | | | | | | | | | | | |
Trinidad | | | — | | | | — | | | | — | | | | — | |
Augusta GA | | | 0.576 | | | | 0.541 | | | | 0.504 | | | | 0.511 | |
Lima OH | | | — | | | | — | | | | — | | | | — | |
Geismar LA | | | — | | | | — | | | | — | | | | — | |
| |
Total | | | 0.576 | | | | 0.541 | | | | 0.504 | | | | 0.511 | |
| |
| | | | |
Employees | | | | | | | | | | | | | | | | |
Trinidad | | | 418 | | | | | | | | | | | | | |
Augusta GA | | | 132 | | | | | | | | | | | | | |
Lima OH | | | 132 | | | | | | | | | | | | | |
Geismar LA | | | 93 | | | | | | | | | | | | | |
| |
Total | | | 775 | 5 | | | | | | | | | | | | |
| |
| 1 | A substantial portion is upgraded to value-added products. |
| 5 | 383 contract employees work at the nitrogen plants, for a total workforce of 1,158. |
| | |
| PotashCorp 2011 Annual Report | | 63 |
Other Expenses and Income
| | | | | | | | | | | | |
| Dollars (millions), except percentage amounts | | | | | | | | % Increase
(Decrease) | |
| | | 2011 | | | 2010 | | |
Selling and administrative | | | $ (217 | ) | | | $ (228 | ) | | | (5 | ) |
Provincial mining and other taxes | | | (147 | ) | | | (77 | ) | | | 91 | |
Share of earnings of equity-accounted investees | | | 261 | | | | 174 | | | | 50 | |
Dividend income | | | 136 | | | | 163 | | | | (17 | ) |
Other expenses | | | (13 | ) | | | (125 | ) | | | (90 | ) |
Finance costs | | | (159 | ) | | | (121 | ) | | | 31 | |
Income taxes | | | (1,066 | ) | | | (701 | ) | | | 52 | |
2011 vs 2010
Provincial mining and other taxes are comprised mainly of the Saskatchewan Potash Production Tax (PPT) and a resource surcharge. The PPT is comprised of a base tax per tonne of product sold and an additional tax based on mine profit, which is reduced by an amount based on potash capital expenditures. The resource surcharge is a percentage (3 percent) of the value of the company’s Saskatchewan resource sales. The PPT expense increased as a result of higher potash profitability, but was partially offset by loss carryforwards. There was no PPT in 2010 due to lower profitability and loss carryforwards. The resource surcharge rose as a result of higher potash sales revenues during 2011.
Our share of earnings of equity-accounted investees, including APC and SQM, was higher than last year due to increased earnings by these companies.
Finance costs increased primarily as a result of lower capitalized interest in 2011 as expansion projects became available for use. Weighted average debt obligations outstanding and the associated interest rates were as follows:
| | | | | | | | | | | | |
| Dollars (millions), except percentage amounts | |
| | | 2011 | | | 2010 | | | % Change | |
Long-term debt 1 | | | | | | | | | | | | |
Wtd avg outstanding | | $ | 4,032 | | | $ | 3,459 | | | | 17 | |
Wtd avg interest rate | | | 5.3% | | | | 5.7% | | | | (7 | ) |
Short-term debt 1 | | | | | | | | | | | | |
Wtd avg outstanding | | $ | 950 | | | $ | 536 | | | | 77 | |
Wtd avg interest rate | | | 0.4% | | | | 0.5% | | | | (20 | ) |
| | 1 | Obligations (long-term debt includes current portion) |
Income taxes increased due to higher income before taxes. The annual effective tax rate on ordinary earnings was 26 percent in both 2011 and 2010. The effective tax rate including discrete items decreased to 26 percent in 2011 from 28 percent in 2010. Total discrete tax adjustments that impacted the rates were $1 million (2010 – $63 million). Significant items recorded included the following:
| Ÿ | | In 2011, a current tax recovery of $21 million for previously paid withholding taxes; |
| Ÿ | | In 2011, a current tax recovery of $14 million due to income tax losses in a foreign jurisdiction; |
| Ÿ | | In 2011, a deferred tax expense of $26 million to adjust amounts related to partnerships; and |
| Ÿ | | In 2010, a current tax expense of $81 million and a deferred tax recovery of $45 million to adjust the 2009 income tax provision to the income tax returns filed during 2010. |
For 2011, 75 percent of the effective tax rate on the current year’s ordinary earnings pertained to current income taxes and 25 percent related to deferred income taxes. The increase in the current portion from 68 percent in 2010 was largely due to higher income before taxes.
| | |
| 64 | | PotashCorp 2011 Annual Report |
Quarterly Results
Quarterly Results and Review of Fourth-Quarter Performance
| | | | | | | | | | | | | | | | | | | | | | | | | | | | | | | | | | | | | | | | |
| (in millions of US dollars except per-share amounts, and as otherwise noted) | |
| | | 2011 | | | 2010 | |
| | | Q1 | | | Q2 | | | Q3 | | | Q4 | | | Total | | | Q1 | | | Q2 | | | Q3 | | | Q4 | | | Total | |
Financial Results | | | | | | | | | | | | | | | | | | | | | | | | | | | | | | | | | | | | | | | | |
Sales | | $ | 2,204 | | | $ | 2,325 | | | $ | 2,321 | | | $ | 1,865 | | | $ | 8,715 | | | $ | 1,714 | | | $ | 1,437 | | | $ | 1,575 | | | $ | 1,813 | | | $ | 6,539 | |
Less: Freight, transportation and distribution | | | (149 | ) | | | (132 | ) | | | (129 | ) | | | (86 | ) | | | (496 | ) | | | (155 | ) | | | (99 | ) | | | (119 | ) | | | (115 | ) | | | (488 | ) |
Cost of goods sold | | | (959 | ) | | | (1,025 | ) | | | (1,060 | ) | | | (889 | ) | | | (3,933 | ) | | | (830 | ) | | | (753 | ) | | | (906 | ) | | | (872 | ) | | | (3,361 | ) |
Gross margin | | | 1,096 | | | | 1,168 | | | | 1,132 | | | | 890 | | | | 4,286 | | | | 729 | | | | 585 | | | | 550 | | | | 826 | | | | 2,690 | |
Operating income | | | 1,025 | | | | 1,175 | | | | 1,142 | | | | 964 | | | | 4,306 | | | | 666 | | | | 679 | | | | 517 | | | | 735 | | | | 2,597 | |
Net income | | | 732 | | | | 840 | | | | 826 | | | | 683 | | | | 3,081 | | | | 444 | | | | 480 | | | | 343 | | | | 508 | | | | 1,775 | |
Other comprehensive (loss) income | | | (246 | ) | | | (94 | ) | | | (1,121 | ) | | | (253 | ) | | | (1,714 | ) | | | 81 | | | | (847 | ) | | | 880 | | | | 457 | | | | 571 | |
Net income per share 1 | | | 0.84 | | | | 0.96 | | | | 0.94 | | | | 0.78 | | | | 3.51 | | | | 0.49 | | | | 0.53 | | | | 0.38 | | | | 0.56 | | | | 1.95 | |
Cash provided by operating activities | | | 690 | | | | 1,064 | | | | 865 | | | | 866 | | | | 3,485 | | | | 811 | | | | 996 | | | | 587 | | | | 737 | | | | 3,131 | |
| | | | | | | | | | |
Non-Financial Results | | | | | | | | | | | | | | | | | | | | | | | | | | | | | | | | | | | | | | | | |
Production (KCl Tonnes – thousands) | | | 2,592 | | | | 2,570 | | | | 1,937 | | | | 2,244 | | | | 9,343 | | | | 1,955 | | | | 2,232 | | | | 1,263 | | | | 2,628 | | | | 8,078 | |
P2O5 operating rate percentage | | | 90 | | | | 93 | | | | 95 | | | | 94 | | | | 93 | | | | 76 | | | | 83 | | | | 88 | | | | 89 | | | | 84 | |
Production (N Tonnes – thousands) | | | 686 | | | | 705 | | | | 724 | | | | 698 | | | | 2,813 | | | | 738 | | | | 713 | | | | 601 | | | | 715 | | | | 2,767 | |
Site severity injury rate | | | 0.72 | | | | 0.49 | | | | 0.46 | | | | 0.52 | | | | 0.54 | | | | 0.43 | | | | 0.39 | | | | 0.36 | | | | 0.34 | | | | 0.38 | |
Environmental incidents | | | 3 | | | | 5 | | | | 3 | | | | 3 | | | | 14 | | | | 6 | | | | 6 | | | | 1 | | | | 7 | | | | 20 | |
| | 1 | Net income per share for each quarter has been computed based on the weighted average number of shares issued and outstanding during the respective quarter; therefore, quarterly amounts may not add to the annual total. Per-share calculations are based on dollar and share amounts each rounded to the nearest thousand. |
| | | Certain aspects of our business can be impacted by seasonal factors. Fertilizers are sold primarily for spring and fall application in both Northern and Southern hemispheres. However, planting conditions and the timing of customer purchases will vary each year, and fertilizer sales can be expected to shift from one quarter to another. Most feed and industrial sales are by contract and are more evenly distributed throughout the year. |
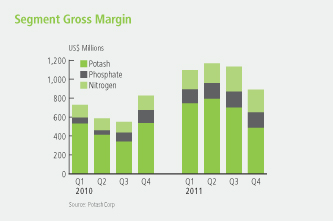
Highlights of our 2011 fourth quarter compared to the same quarter in 2010 include (direction of arrows refers to impact on net income):
 | Despite higher realized prices, significantly lower sales volumes resulted in lower potash gross margin. In North America, fertilizer dealers worked from existing inventories to meet immediate needs, which resulted in lower sales volumes. Shipments to fulfill contract commitments to China and India accounted for 20 percent and 23 percent, respectively, of Canpotex’s volumes, a larger portion than in the previous year. Shipments to other Asian and Latin American markets represented 35 percent and 15 percent, respectively, of Canpotex’s sales volumes. Our average realized price was higher than in the same period of 2010, but declined from the trailing quarter – a product of a higher percentage of sales |
| | |
| PotashCorp 2011 Annual Report | | 65 |
| | shipped to lower-netback offshore contract markets, increased fixed transportation and distribution costs per tonne (as a result of lower North American volumes) and increased competition from offshore imports in certain regions of the US. Cost of goods sold was affected, in part, by 19 shutdown weeks (2010 – 6 weeks) for expansion-related work, maintenance and inventory adjustments to match reduced demand. |
 | Phosphate gross margin rose. Slower demand for solid phosphate fertilizer products was partially offset by stable volumes in other product lines, highlighting the value of our diversified production. Despite the softening of spot markets during the fourth quarter, average realized phosphate prices remained well above those in the fourth quarter of 2010, reflecting realized price increases throughout most of 2011. Cost of goods sold increased, mainly due to higher costs of sulfur (50 percent) and ammonia (27 percent). |
| Nitrogen gross margin grew. Strong industrial and agricultural demand paired with tight product supplies through much of the year led to higher prices across all nitrogen products. Ammonia sales increased due to higher industrial demand. Urea reflected the allocation of available nitrogen production |
| | to products that provided higher gross margin. Nitrogen solutions volumes at Geismar continued to be impacted by the limited availability of carbon dioxide necessary for production. Our total average cost of natural gas used in production, including hedge, increased 13 percent (Trinidad gas costs increased 36 percent while US spot prices declined 5 percent), resulting in increased cost of goods sold. |
| Share of earnings of equity investees was higher mainly as a result of SQM. |
| Dividend income was higher as a result of dividends paid by ICL. |
| Other expenses were lower as takeover response costs fell from 2010. |
| The effective tax rate, including discrete items, was 27 percent (2010 – 28 percent). Included in this rate in fourth-quarter 2011 was a deferred tax expense of $26 million to adjust amounts related to partnerships. |
| Other comprehensive loss in 2011 and other comprehensive income in 2010 reflected mainly the change in fair value of our investments in ICL and Sinofert. |
| | | | | | | | | | | | | | | | | | | | | | | | |
| | | Three Months Ended December 31 | |
| | | Sales Tonnes (thousands) | | | Average Net Sales Price per MT | |
| | | 2011 | | | 2010 | | | % Increase
(Decrease) | | | 2011 | | | 2010 | | | % Increase
(Decrease) | |
Potash | | | | | | | | | | | | | | | | | | | | | | | | |
Manufactured Product | | | | | | | | | | | | | | | | | | | | | | | | |
North America | | | 422 | | | | 804 | | | | (48 | ) | | $ | 514 | | | $ | 384 | | | | 34 | |
Offshore | | | 1,159 | | | | 1,575 | | | | (26 | ) | | $ | 401 | | | $ | 292 | | | | 37 | |
Manufactured Product | | | 1,581 | | | | 2,379 | | | | (34 | ) | | $ | 431 | | | $ | 323 | | | | 33 | |
Phosphate | | | | | | | | | | | | | | | | | | | | | | | | |
Manufactured Product | | | | | | | | | | | | | | | | | | | | | | | | |
Fertilizer – Liquids | | | 331 | | | | 320 | | | | 3 | | | $ | 614 | | | $ | 410 | | | | 50 | |
Fertilizer – Solids | | | 255 | | | | 346 | | | | (26 | ) | | $ | 616 | | | $ | 525 | | | | 17 | |
Feed | | | 139 | | | | 139 | | | | – | | | $ | 588 | | | $ | 505 | | | | 16 | |
Industrial | | | 165 | | | | 160 | | | | 3 | | | $ | 727 | | | $ | 593 | | | | 23 | |
Manufactured Product | | | 890 | | | | 965 | | | | (8 | ) | | $ | 631 | | | $ | 495 | | | | 27 | |
Nitrogen | | | | | | | | | | | | | | | | | | | | | | | | |
Manufactured Product | | | | | | | | | | | | | | | | | | | | | | | | |
Ammonia | | | 458 | | | | 415 | | | | 10 | | | $ | 607 | | | $ | 441 | | | | 38 | |
Urea | | | 242 | | | | 267 | | | | (9 | ) | | $ | 502 | | | $ | 396 | | | | 27 | |
Nitrogen solutions, nitric acid, ammonium nitrate | | | 381 | | | | 595 | | | | (36 | ) | | $ | 259 | | | $ | 213 | | | | 22 | |
Manufactured Product | | | 1,081 | | | | 1,277 | | | | (15 | ) | | $ | 461 | | | $ | 325 | | | | 42 | |
| | |
| 66 | | PotashCorp 2011 Annual Report |
Financial Condition Review
Balance Sheet Analysis
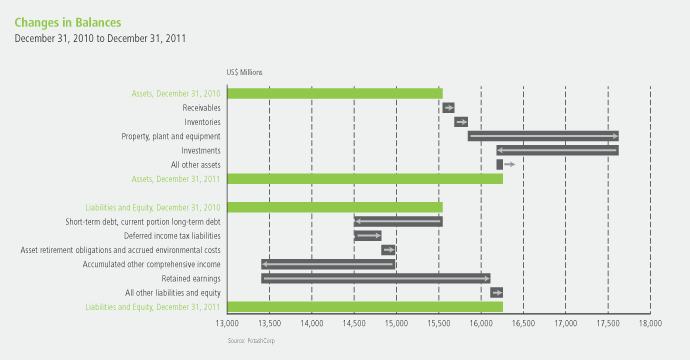
As of December 31, 2011, total assets increased 5 percent while total liabilities declined 5 percent and total equity rose 17 percent compared to December 31, 2010.
Property, plant and equipment increased primarily due to our previously announced potash capacity expansions and other potash projects (79 percent). Available-for-sale investments declined due to the lower fair value of our investments in Sinofert (discussed further in Note 6 to the consolidated financial statements) and ICL. As at December 31, 2011, $387 million (2010 – $299 million) of our cash and cash equivalents was held in certain foreign subsidiaries. There are no current plans to repatriate these funds in a taxable manner.
Short-term debt and current portion of long-term debt decreased as a result of repaying 10-year senior notes in the second quarter of 2011 and commercial paper repayments exceeding issuances. Deferred income tax liabilities increased primarily due to tax depreciation exceeding accounting depreciation, reduced deferred tax assets on unexercised stock options and a partial offset from the tax impact on the remeasurement of our defined benefit plans.
Significant changes in equity were primarily the result of net income being offset, in part, by other comprehensive losses, which was mainly the result of declines in the value of our available-for-sale investments.
| | |
| PotashCorp 2011 Annual Report | | 67 |
Liquidity and Capital Resources
The following section explains how we manage our cash and capital resources to carry out our strategy and deliver results.
Liquidity risk arises from our general funding needs and in the management of our assets, liabilities and optimal capital structure. We manage liquidity risk to maintain sufficient liquid financial resources to fund our financial position and meet our commitments and obligations in a cost-effective manner.
Cash Requirements
The following aggregated information about our contractual obligations and other commitments summarizes certain of our liquidity and capital resource requirements. The information presented in the table below does not include obligations that have original maturities of less than one year, planned (but not legally committed) capital expenditures or potential share repurchases.
Contractual Obligations and Other Commitments
| | | | | | | | | | | | | | | | | | | | |
| Dollars (millions) at December 31, 2011 | | | | | | | | | | | | | | | |
| | | Payments Due by Period | |
| | | Total | | | Within 1 Year | | | 1 to 3 Years | | | 3 to 5 Years | | | Over 5 Years | |
Long-term debt obligations | | | 3,757 | | | | 7 | | | | 750 | | | | 500 | | | | 2,500 | |
Estimated interest payments on long-term debt obligations | | | 2,266 | | | | 191 | | | | 348 | | | | 281 | | | | 1,446 | |
Operating leases | | | 508 | | | | 90 | | | | 160 | | | | 115 | | | | 143 | |
Purchase commitments | | | 841 | | | | 426 | | | | 226 | | | | 98 | | | | 91 | |
Capital commitments | | | 475 | | | | 393 | | | | 82 | | | | – | | | | – | |
Other commitments | | | 79 | | | | 29 | | | | 26 | | | | 8 | | | | 16 | |
Asset retirement obligations and environmental costs | | | 641 | | | | 26 | | | | 67 | | | | 53 | | | | 495 | |
Other long-term liabilities | | | 1,982 | | | | 132 | | | | 246 | | | | 189 | | | | 1,415 | |
Total | | | 10,549 | | | | 1,294 | | | | 1,905 | | | | 1,244 | | | | 6,106 | |
Long-term debt
As described in Note 12 to the consolidated financial statements, long-term debt consists of $3,750 million of senior notes that were issued under US shelf registration statements, a net of $6 million under back-to-back loan arrangements and other commitments of $1 million payable over the next year.
Our senior notes have no sinking fund requirements and are not subject to any financial test covenants but are subject to certain customary covenants and events of default as described in Notes 9 and 12 to the consolidated financial statements. The company was in compliance with all such covenants as at December 31, 2011, and at this time anticipates being in compliance with such covenants in 2012. Under certain conditions related to a change in control, the company is required to make an offer to purchase all, or any part, of the senior notes due in 2014, 2015, 2017, 2019, 2020, 2036 and 2040 at 101 percent of the principal amount of the senior notes repurchased, plus accrued interest.
The estimated interest payments on long-term debt in the above table include our cumulative scheduled interest payments on fixed and variable rate long-term debt. Interest on variable rate debt is based on interest rates prevailing at December 31, 2011.
Operating leases
We have long-term operating lease agreements for land, buildings, port facilities, equipment, ocean-going transportation vessels and railcars, the latest of which expires in 2038. The most significant operating leases consist of railcars (extends to approximately 2030), four vessels for transporting ammonia from Trinidad (one agreement runs until 2017 while the others terminate in 2016) and two barges for transporting phosphoric acid (expire in 2013 and 2022).
Purchase commitments
We have long-term natural gas contracts with the National Gas Company of Trinidad and Tobago Limited, the latest of which expires in 2018. The contracts provide for prices that vary primarily with ammonia market prices, escalating floor prices
| | |
| 68 | | PotashCorp 2011 Annual Report |
and minimum purchase quantities. The commitments included in the table above are based on floor prices and minimum purchase quantities.
We have agreements for the purchase of sulfur for use in the production of phosphoric acid, which provide for minimum purchase quantities and certain prices based on market rates at the time of delivery. Purchase obligations and other commitments included in the table above are based on expected contract prices.
Capital commitments
The company has various long-term contracts related to capital projects, the latest of which expires in 2014. The commitments included in the table on Page 68 are based on expected contract prices.
Based on anticipated exchange rates, during 2012 we expect to incur capital expenditures, including capitalized interest, of approximately $1,760 million for opportunity capital, approximately $440 million to sustain operations at existing levels, approximately $178 million for major repairs and maintenance (including plant turnarounds) and approximately $30 million for site improvements.
Other commitments
Other commitments consist principally of amounts relating to pipeline capacity, throughput and various rail and vessel freight contracts, the latest of which expires in 2018, and mineral lease commitments, the latest of which expires in 2032.
Asset retirement obligations
Commitments associated with our asset retirement obligations are expected to occur principally over the next 80 years for phosphate and over a longer period for potash.
Other long-term liabilities
Other long-term liabilities consist primarily of pension and other post-retirement benefits, income taxes, deferred income taxes and environmental costs.
Deferred income tax liabilities may vary according to changes in tax laws, tax rates and the operating results of the company. Since it is impractical to determine whether there will be a cash impact in any particular year, all long-term deferred income tax liabilities have been reflected in the “over 5 years” category in the table on Page 68.
Sources and Uses of Cash
The company’s cash flows from operating, investing and financing activities, as reflected in the Consolidated Statements of Cash Flow, are summarized in the following table:
| | | | | | | | | | | | |
| Dollars (millions), except percentage amounts | |
| | | 2011 | | | 2010 | | | % Increase
(Decrease) | |
Cash provided by operating activities | | $ | 3,485 | | | $ | 3,131 | | | | 11 | |
Cash used in investing activities | | | (2,251 | ) | | | (2,572 | ) | | | (12 | ) |
Cash used in financing activities | | | (1,216 | ) | | | (532 | ) | | | 129 | |
Increase in cash and cash equivalents | | $ | 18 | | | $ | 27 | | | | (33 | ) |
| | | | | | | | | | | | | | | | | | | | |
| Dollars (millions), except ratio and percentage amounts | |
| | | December 31 | | | December 31 | | | January 1 | | | % Increase (Decrease) | |
| | | 2011 | | | 2010 | | | 2010 | | | 2011 | | | 2010 | |
Current assets | | $ | 2,408 | | | $ | 2,095 | | | $ | 2,292 | | | | 15 | | | | (9 | ) |
Current liabilities | | | (2,194 | ) | | | (3,144 | ) | | | (1,598 | ) | | | (30 | ) | | | 97 | |
Working capital | | | 214 | | | | (1,049 | ) | | | 694 | | | | n/m | | | | n/m | |
Current ratio | | | 1.10 | | | | 0.67 | | | | 1.43 | | | | 64 | | | | (53 | ) |
| n/m = not meaningful | | | | | | | | | | | | | | | | | | | | |
| | |
| PotashCorp 2011 Annual Report | | 69 |
Liquidity needs can be met through a variety of sources, including: cash generated from operations, drawdowns under our long-term revolving credit facilities, issuances of commercial paper and short-term borrowings under our line of credit. Our primary uses of funds are operational expenses, sustaining and opportunity capital spending, intercorporate investments, dividends, and interest and principal payments on our debt securities.
Cash provided by operating activities rose due to higher net income and was partially offset by changes in non-cash operating working capital, which was impacted by increased receivables and inventories (both fell during 2010) and increased payables and accrued charges (increased during 2010). Increases to provisions for deferred income tax resulted from accelerated capital deductions. Contributions to pension benefit plans were higher in 2011 than in 2010 due partially to increased funding to underfunded pension plans, tax planning and expected changes to actuarial pension assumptions.
Cash used in investing activities was primarily for additions to property, plant and equipment, of which approximately 79 percent (2010 – 79 percent) related to the potash segment. Also in 2010, additional shares of ICL were purchased.
In 2010, we issued $1 billion of senior notes and repurchased $2 billion of our common shares (42,190,020 shares). No such activities occurred in 2011, although we did repay 10-year senior notes that matured.
We believe that internally generated cash flow, supplemented by available borrowings under our existing financing sources if necessary, will be sufficient to meet our anticipated capital expenditures and other cash requirements for at least the next 12 months, exclusive of any possible acquisitions. At this time, we do not reasonably expect any presently known trend or uncertainty to affect our ability to access our historical sources of liquidity.
Capital Structure and Management
Capital Structure
See Note 25 to the consolidated financial statements for information pertaining to our capital structure.
Principal Debt Instruments
| | | | | | | | | | | | |
| Dollars (millions) at December 31, 2011 | |
| | | Total
Amount | | | Amount Outstanding
and Committed | | | Amount
Available | |
Credit facilities1 | | $ | 3,500 | | | $ | 829 | | | $ | 2,671 | |
Line of credit | | | 75 | | | | 23 | 2 | | | 52 | |
| | 1 | In 2011, the company established a commercial paper program in the US. The authorized aggregate amount under the company’s commercial paper programs in Canada and the US is $1,500 million. The amounts available under the commercial paper programs are limited to the availability of backup funds under the credit facilities. Included in the amount outstanding and committed is $829 million of commercial paper. Per the terms of the agreements, the commercial paper outstanding and committed, as applicable under the Canadian program, is based on the US dollar balance or equivalent thereof in lawful money of other currencies at the time of issue. Accordingly, subsequent changes in the exchange rate applicable to Canadian dollar-denominated commercial paper have no impact on this balance. |
| | 2 | Letters of credit committed. We also have an uncommitted $30 million letter of credit facility under which $28 million was outstanding at December 31, 2011. |
We use a combination of short-term and long-term debt to finance our operations. We typically pay floating rates of interest on our short-term debt and credit facilities, and fixed rates on our senior notes. As of December 31, 2011, interest rates ranged from 0.39 percent to 0.47 percent on outstanding commercial paper denominated in US dollars.
Our two syndicated credit facilities provide for unsecured advances up to the total facilities amount less direct borrowings
and amounts committed in respect of commercial paper outstanding. The $2,750 million credit facility was increased from $2,500 million in September 2011 and the maturity was extended from December 11, 2012 to December 11, 2016. We also have a $75 million short-term line of credit that is available through August 2012 and an uncommitted $30 million letter of credit facility that is due on demand. Direct borrowings, outstanding commercial paper and outstanding letters of credit
| | |
| 70 | | PotashCorp 2011 Annual Report |
reduce the amounts available under the line of credit and the credit facilities. The line of credit and credit facilities have financial tests and other covenants (detailed in Notes 9 and 12 to the consolidated financial statements) with which we must comply at each quarter-end. Non-compliance with any such
covenants could result in accelerated payment of amounts borrowed and termination of lenders’ further funding obligations under the credit facilities and line of credit. We were in compliance with all covenants as of December 31, 2011.
Our ability to access reasonably priced debt in the capital markets is dependent, in part, on the quality of our credit ratings. We continue to maintain investment grade credit ratings for our long-term debt. A downgrade of the credit rating of our long-term debt by Standard & Poor’s would increase the interest rates applicable to borrowings under our syndicated credit facilities and our line of credit.
Commercial paper markets are normally a source of same-day cash for the company. Our access to the Canadian and US commercial paper markets primarily depends on maintaining our current short-term credit ratings as well as general conditions in the money markets.
A security rating is not a recommendation to buy, sell or hold securities. Such rating may be subject to revision or withdrawal at any time by the respective credit rating agency and each rating should be evaluated independently of any other rating.
Our $3,750 million of senior notes were issued under US shelf registration statements.
For 2011, our weighted average cost of capital was 9.6 percent (2010 – 10.2 percent), of which 90 percent represented the cost of equity (2010 – 91 percent).
| | | | | | | | | | |
| | | Long-Term Debt | | Short-Term Debt |
| Rating (outlook) | | Dec 31, 2011 | | Dec 31, 2010 | | Dec 31, 2011 | | | Dec 31, 2010 |
Moody’s | | Baa1 (positive) | | Baa1 (positive) | | | P-2 | | | n/a |
Standard & Poor’s | | A- (stable) | | A- (negative) | | | A-2 | 1 | | A-2 |
DBRS | | n/a | | n/a | | | R1 low | | | R1 low |
| | 1 | S&P assigned a global commercial paper rating of A-2, but rated our commercial paper A-1 (low) on a Canadian scale. |
n/a = not applicable
Outstanding Share Data
Refer to Notes 15 and 23 to the consolidated financial statements for information pertaining to our outstanding shares and options.
Off-Balance Sheet Arrangements
In the normal course of operations, PotashCorp engages in a variety of transactions that, under IFRS, are either not recorded on our Consolidated Statements of Financial Position or are recorded on our Consolidated Statements of Financial Position in amounts that differ from the full contract amounts. Principal off-balance sheet activities we undertake include operating leases, agreement to reimburse losses of Canpotex, issuance of guarantee contracts, certain derivative instruments and long-term contracts. We do not reasonably expect any presently known trend or uncertainty to affect our ability to continue using these arrangements, which are discussed below.
Contingencies
Refer to Note 27 to the consolidated financial statements for a contingency related to Canpotex.
Guarantee contracts
Refer to Note 28 to the consolidated financial statements for information pertaining to our guarantees.
Derivative instruments
We use derivative financial instruments to manage exposure to commodity price and foreign exchange rate fluctuations. Refer to Note 11 to the consolidated financial statements for further information. Except for certain non-financial derivatives that have qualified for and for which we have documented a normal purchase or normal sale exception in accordance with accounting standards, derivatives are recorded on the Consolidated Statements of Financial Position at fair value and marked-to-market each reporting period regardless of whether they are designated as hedges for IFRS purposes.
Leases and long-term contracts
Certain of our long-term raw materials agreements contain fixed price and/or volume components. Our significant agreements, and the related obligations under such agreements, are discussed in Cash Requirements on Page 68.
| | |
| PotashCorp 2011 Annual Report | | 71 |
Other Financial Information
Market Risks Associated With Financial
Instruments
Market risk is the potential for loss from adverse changes in the market value of financial instruments. The level of market risk to which we are exposed varies depending on the composition of our derivative instrument portfolio, as well as current and expected market conditions. A discussion of enterprise-wide risk management can be found on Pages 20 to 22. A discussion of price risk, interest rate risk, foreign exchange risk, credit risk and liquidity risk, including relevant risk sensitivities, can be found in Note 24 to the consolidated financial statements.
Related Party Transactions
Refer to Note 29 to the consolidated financial statements for information pertaining to transactions with related parties.
Critical Accounting Estimates
Our discussion and analysis of our financial condition and results of operations are based upon our consolidated financial statements, which have been prepared in accordance with IFRS.
Our significant accounting policies and accounting estimates are contained in the consolidated financial statements (see Note 2 for description of policies or references to notes where such
policies are contained). Certain of these policies involve critical accounting estimates because they require us to make particularly subjective or complex judgments about matters that are inherently uncertain and because of the likelihood that materially different amounts could be reported under different conditions or using different assumptions. We have discussed the development, selection and application of our key accounting policies, and the critical accounting estimates and assumptions they involve, with the audit committee of the Board of Directors.
Recent Accounting Changes, Effective Dates and Adoption of IFRS
Refer to Note 2 to the consolidated financial statements for information pertaining to accounting changes effective in 2011 and for information on issued accounting pronouncements that will be effective in future years.
We applied IFRS as of January 1, 2010 and retrospectively applied all effective IFRS, meaning that the comparative financial information provided uses the same accounting policies throughout all periods. The changes in our reported results were the result of our adoption of IFRS and not an underlying change in our business. We also applied certain optional and mandatory exemptions. The effects of the changes on our accounting policies and financial results are outlined in Note 30 to the consolidated financial statements.
| | |
| 72 | | PotashCorp 2011 Annual Report |
Governance and Remuneration
Message From the Chairman
The Board of Directors plays an important role in creating long-term, sustainable value for stakeholders through oversight of PotashCorp’s strategy and risk. To protect the value of the company’s assets and ensure the successful execution of its strategies, we believe, requires the highest standard of corporate governance. Through the Board’s corporate governance and nominating committee, we regularly evaluate and enhance PotashCorp’s corporate governance practices by monitoring Canadian, US and other regulatory developments that affect corporate governance and the transparency of public company disclosure.
Listening to stakeholders is a core value at the company. The Board is committed to engaging actively with stakeholders on topics such as compensation, sustainability, governance and other important items. We have an established process for interested parties who wish to communicate with members of the Board, including the Chair or the non-management directors as a group.
PotashCorp’s corporate governance practices received top ranking out of 253 companies evaluated in The Globe and Mail’s 2011 Board Games (a review of corporate governance practices in Canada). The Board has developed and implemented governance practices to minimize risk, while helping to maximize management performance and ensure the company operates with integrity and transparency. We plan to build on these practices to grow value for the long term.
Sincerely,

D. J. Howe
Board Chair
February 21, 2012
Role of the Board
The Board is responsible for the stewardship and oversight of the management of the company and its global business. It has the statutory authority and obligation to protect and enhance the assets of the company in the interest of all shareholders. Although directors may be elected by the shareholders to bring special expertise or a point of view to Board deliberations, they are not chosen to represent a particular constituency. The best interests of the company and our shareholders must be paramount at all times.
The involvement and commitment of directors is evidenced by regular Board and committee meeting attendance, preparation, and active participation in setting goals and requiring performance in the interest of shareholders.
Board’s View on Directors
Each director must possess and exhibit the highest degree of integrity, professionalism, values and independent judgment. Directors and senior officers are bound by the “PotashCorp Governance Principles” and “PotashCorp Core Values and Code of Conduct,” which can be found together with other governance-related documents on the company’s website.
We believe boards function most effectively when individual directors are free from conflicts of interest and exercise independent judgment in discharging their responsibilities. We comply with the independence requirements of all applicable regulators. No more than two employees serve as directors at any time. As of the date of this annual report, 10 of 13, or 77 percent, of the corporation’s directors are independent.
All directors are elected by the shareholders each year at the annual meeting of shareholders. A nominee for a position on the Board must meet certain legal qualification standards and possess and exhibit the highest degree of integrity, professionalism, values and independent judgment. When filling director vacancies, the greatest emphasis is on finding the best qualified candidates given the Board’s particular needs and circumstances but a director candidate’s diversity of gender, race, nationality or other attributes may be considered favorably in assessing the candidate, to promote a diverse and high functioning Board.
The corporate governance and nominating committee reviewed the director succession plan and the Board appointed a new board member during 2011. Also, with the retirement of two current directors in 2012, two new directors have been nominated for election at this year’s annual shareholder meeting.
| | |
| PotashCorp 2011 Annual Report | | 73 |
More information on our director nomination and Board makeup can be found in the Corporate Governance section of our Proxy Circular for our Annual and Special Meeting of Shareholders to be held on May 17, 2012 (2012 Proxy Circular).
Key Activities and Priorities
The following items represent the significant activities and priorities for the Board in 2011:
| Ÿ | | The Board continued to oversee and approve the corporation’s business strategy and strategic planning process. |
| Ÿ | | The Board continued to oversee the risk management process, as described more fully on Page 21. |
| Ÿ | | The Board, principally through the audit committee, continued its oversight and monitoring of the corporation’s financial planning and reporting processes. |
| Ÿ | | Recognizing the importance of ongoing director education, the Board and its committees participated in presentations, attended internal and external site tours, and received information on numerous matters and topics in 2011. Two directors are accredited under the Institute of Corporate Directors (ICD) Director Education Program, and all are members of ICD and the National Association of Corporate Directors (NACD). Additionally, at least one or all board members received training/education in: Aboriginal awareness, financial reporting, workplace safety, executive compensation, shareholder engagement, investor relations, global economic issues, corporate governance, directors compensation, board diversity, governmental, regulatory and public affairs and sustainability. |
| Ÿ | | The compensation committee and Board met to review management succession plans and discuss ways to improve the succession planning process during the year. The committee and Board also met with the CEO to discuss succession plans for the positions of CEO and other senior executive officers. The Board regularly interacts with the senior management team and periodically attends company events to build relationships with the people who represent PotashCorp’s future. |
Approach to Executive Compensation
The Board is responsible for executive compensation, with support by the standing compensation committee, and together they are committed to getting it right, both for shareholders and for the company’s long-term success.
Our philosophy
PotashCorp’s executive compensation programs are designed to align the interests of management with those of shareholders. We believe the executive compensation program designed by our Board of Directors:
| Ÿ | | Attracts and retains motivated world-class talent; |
| Ÿ | | Links much of executive compensation to performance that drives long-term stakeholder value; |
| Ÿ | | Aligns executive interests with shareholders through stock ownership requirements; and |
| Ÿ | | Helps guard against excessive risk-taking. |
This program is discussed in depth in the Compensation Discussion and Analysis section of our 2012 Proxy Circular.
Our compensation structure
The program’s key elements are base salary, short-term incentives, performance units granted under a medium-term incentive plan (MTIP), performance stock options under a long-term incentive plan, retirement benefits and severance benefits.
To emphasize performance-based compensation, we typically benchmark total cash compensation levels (salary and annual short-term incentive targets) to the median of a comparable group of companies and provide the opportunity to earn total compensation above the median through medium- and long-term incentive plans.
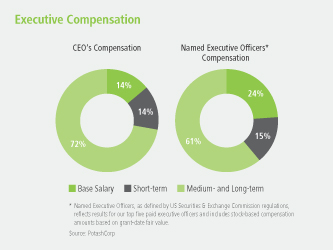
The Board has designed the plans with the key principles that our shareholders should earn a return before our executives can earn incentive compensation and that the payouts are in proportion to shareholders’ returns. As a result, we emphasize pay-for- performance, with “at-risk” components of total compensation linked directly to total shareholder return and cash flow return.
| | |
| 74 | | PotashCorp 2011 Annual Report |
Certain performance measurements must be achieved before vesting will occur under our MTIP and performance option plans. It is important to us that compensation be affordable and properly aligned with the company’s performance. With the assistance of an independent compensation consultant, the Board reviews compensation practices against these important requirements.
| | | | | | | | | | |
| Category | | Component | | Form | | Eligibility | | Performance
Period | | Determination |
| Base Salary | | Salary | | Cash | | All salaried employees | | Annual | | ŸThe only fixed component of total direct compensation is typically set annually and at median of comparator data. |
| At-Risk Compensation | | Short-term incentive plan (STIP) | | Cash | | All executives, most salaried staff and hourly union and non-union employees | | 1 year | | ŸBased on achieving Board-established cash flow return metric; our operating sites’ STIP programs also require achievement of certain safety, environmental and operational targets. ŸNo payout for achieving less than 50 percent of target; maximum payout is capped at two times target regardless of cash flow return achieved, subject to adjustment (+/-30 percent) based on individual performance for salaried staff. |
| | Medium-term incentive plan (MTIP) | | Performance share units | | All executives and senior management (74 people) | | 3-year performance cycle (2009 MTIP began on January 1, 2009 and ended on December 31, 2011; 2012 MTIP began on January 1, 2012 and will end on December 31, 2014) | | ŸOne-half of payout based on absolute TSR1 and half based on our TSR relative to peer group index2. ŸNo payout if minimum performance objectives are not achieved; maximum payout on each component is capped at 150 percent of target; maximum price escalation is capped at three times the starting price for the 2009 MTIP and four times the starting price of the 2012 MTIP3. |
| | Long-term incentives (Performance Option Plan) | | Performance options | | All executives, senior management and other selected management (270 people) | | 3-year cycle (vesting) | | ŸPerformance options incorporate a performance-based vesting schedule measuring the three-year average excess of cash flow return over our weighted average cost of capital. ŸValue of options based on share price appreciation over 10-year option period. ŸAwarded once per year, following shareholder approval; no off-cycle option grants during the year. |
| | | | | | | | | | |
| Category | | Compensation
Element | | Form | | Eligibility | | Measurement
Period | | Determination |
Retirement Plans | | Retirement benefits | | Cash | | All employees | | Pensionable service period, some to maximum of 35 years | | ŸCanada: Contributory defined contribution pension plan for all staff and non-union hourly employees and certain union locations, including savings and performance contribution features. Defined benefit pension plans for certain other union locations. ŸUnited States: Defined benefit pension and contributory defined contribution savings plans, including performance contribution feature, for all staff and non-union hourly employees and certain union locations. Defined contribution pension plan for certain other union locations. ŸTrinidad: Contributory defined benefit pension and stock purchase plans for all staff and hourly employees. ŸSupplemental plans are designed to deliver average benefits based on comparative compensation information. |
| | |
| PotashCorp 2011 Annual Report | | 75 |
| | | | | | | | | | |
| Category | | Compensation
Element | | Form | | Eligibility | | Measurement
Period | | Determination |
| Severance | | Severance benefits | | Cash, insurance or other benefits | | General benefits for all employees; change in control benefits for three employees | | Upon termination of employment | | ŸTwo weeks of salary for each complete year of service, subject to a minimum of four weeks and a maximum of 52 weeks, are generally awarded in connection with termination without cause. ŸChange in control payments generally require “double trigger” of change in control and termination or significant change in executive’s duties. ŸOnly three legacy change in control contracts. |
| 1 | TSR is the total shareholder return on an investment in PotashCorp stock from the time the investment is made. It has two components: (1) growth in share price and (2) related dividend income on the shares. |
| 2 | DAXglobal Agribusiness Index with dividends. |
| 3 | As discussed in the Compensation Discussion and Analysis section of our 2012 Proxy Circular. |
Affordability
To measure affordability, our independent compensation consultant measures the realized pay (as described in the 2012 Proxy Circular) earned by our five most-highly compensated officers as a percentage of PotashCorp’s net income. This percentage over the three years ended December 31, 2010 was the lowest among our Comparator Group (as described in our 2012 Proxy Circular) at just 0.6 percent.
Aligning Compensation With Company Goals
At PotashCorp, accountability is a core value. To that end, we annually set targets that reflect the interests of our stakeholders to measure our performance against these targets. We design our compensation plans to help drive achievement of our goals and objectives:
| | |
| Goal | | Discussion |
| 1. Create superior shareholder value | | At-risk incentive compensation plans include short-term, medium-term and long-term cycles and are based on TSR, share appreciation or a related measure. |
| 2. Be the supplier of choice to the markets we serve | | The STIP is based on annual Board-approved goals for sales, productivity and profitability. Achieving them requires us to meet the needs of customers throughout the period. |
3. Build strong relationships with and improve the socioeconomic well-being of our communities | | Our policy is to invest 1 percent of consolidated income before income taxes on a five-year rolling average in the communities in which we work and other philanthropic programs. We actively encourage all employees, particularly executives, to participate in philanthropic programs in our communities and we offer gift-matching opportunities for our employees. To make this investment in our communities, it is important to sustain earnings on a consistent basis. |
4. Attract and retain talented, motivated and productive employees who are committed to our long-term goals | | Target compensation is competitive with the industry average. Executives are motivated to achieve strong results through opportunities to earn above target based on company and individual performance. |
5. Achieve no harm to people and no damage to the environment | | At all plant locations, one-half of the annual STIP payout depends on performance in relation to local metrics, a significant portion of which relates to safety and environmental performance. |
Managing Risk
Risk management begins with an active Board and management team engaged in analyzing the many risks our company faces and working with company leaders to manage those risks. Compensation programs can help mitigate risk-taking, but risks cannot be managed solely by remote control through these programs.
We believe that our compensation programs help guard against undue risk-taking by capping the compensation payments from the company, even in the case of extraordinary performance. In 2010, Towers Watson analyzed our programs from a risk-management perspective and concluded that our plans were not reasonably likely to have a material adverse effect on our company. As part of its risk assessment, Towers Watson considered elements such as our Policy on Recoupment of Unearned Compensation, our significant share ownership
| | |
| 76 | | PotashCorp 2011 Annual Report |
requirements and significant percentage of compensation made in the form of long-term and medium-term awards, all of which align incentives with appropriate risk-taking. In December 2011, Towers Watson performed a review of its 2010 assessment and, based on this review, concluded that (1) the methodology used in 2010 was consistent with market practice in 2011 in terms of how an assessment of this nature would be conducted and (2) there were no material changes in 2011, including any changes in program design or policies, that would necessitate another comprehensive risk assessment in 2011. The compensation committee agreed with the conclusions of Towers Watson and determined that PotashCorp’s compensation programs do not create risks that are reasonably likely to have a material adverse effect on PotashCorp. At the recommendation of Towers Watson, we intend to engage our compensation consultant to conduct periodic comprehensive risk assessments.
For additional information regarding risk management, see Risk Management on Pages 20-22.
Shareholder Engagement
The compensation committee considers it a serious responsibility to maintain full transparency and gather feedback from our shareholders on our executive compensation program. In 2011 and 2010, we reached out to stakeholders through our website, which included video interviews with the Chair of the Board of Directors and the Chair of the compensation committee on our executive compensation program. Additionally, we provided an opportunity for our stakeholders to comment through a survey. Please visit www.potashcorp.com to participate in the 2012 survey.
Forward-Looking Statements
This 2011 annual report, including the “Outlook” section of Management’s Discussion & Analysis of Financial Condition and Results of Operations, contains forward-looking statements or forward-looking information (“forward-looking statements”). These statements can be identified by expressions of belief, expectation or intention, as well as those statements that are not historical fact. These statements are based on certain factors and assumptions as set forth in this 2011 annual report, including with respect to: foreign exchange rates, expected growth, results of operations, performance, business prospects and opportunities, and effective tax rates. While the company considers these factors and assumptions to be reasonable based on information currently available, they may prove to be incorrect. Several factors could cause actual results to differ materially from those expressed in the forward-looking statements, including, but not limited to: variations from our assumptions with respect to foreign exchange rates, expected growth, results of operations, performance, business prospects and opportunities, and effective tax rates; fluctuations in supply and demand in the fertilizer, sulfur, transportation and petrochemical markets; costs and availability of transportation and distribution for our raw materials and products, including railcars and ocean freight; changes in competitive pressures, including pricing pressures; adverse or uncertain economic conditions and changes in credit and financial markets; the
results of sales contract negotiations with major markets; the European sovereign debt crisis and the recent downgrade of US sovereign debt and political concerns over budgetary matters; timing and impact of capital expenditures; risks associated with natural gas and other hedging activities; changes in capital markets and corresponding effects on the company’s investments; unexpected or adverse weather conditions; changes in currency and exchange rates; unexpected geological or environmental conditions, including water inflows; imprecision in reserve estimates; adverse developments in new and pending legal proceedings or government investigations; acquisitions we may undertake; strikes or other forms of work stoppage or slowdowns; changes in, and the effects of, government policies and regulations; and earnings, exchange rates and the decisions of taxing authorities, all of which could affect our effective tax rates. Additional risks and uncertainties can be found in our Form 10-K for the fiscal year ended December 31, 2011 under the captions “Forward-Looking Statements” and “Item 1A – Risk Factors” and in our filings with the US Securities and Exchange Commission and the Canadian provincial securities commissions. Forward-looking statements are given only as at the date of this report and the company disclaims any obligation to update or revise the forward-looking statements, whether as a result of new information, future events or otherwise, except as required by law.
| | |
| PotashCorp 2011 Annual Report | | 77 |
Non-IFRS Financial Measures
PotashCorp uses cash flow and cash flow return (both non-IFRS financial measures) as supplemental measures to evaluate the performance of the company’s assets in terms of the cash flow they have generated. Calculated on the total cost basis of the company’s assets rather than on the depreciated value, these measures reflect cash returned on the total investment outlay. The company believes these measures are one of the best predictors of shareholder value. As such, management believes this information to be useful to investors.
Generally, these measures are a numerical measure of a company’s performance, financial position or cash flows that either excludes or includes amounts that are not normally excluded or included in the most directly comparable measure calculated and presented in accordance with IFRS. Cash flow and cash flow return are not measures of financial performance (nor
do they have standardized meanings) under IFRS. In evaluating these measures, investors should consider that the methodology applied in calculating such measures may differ among companies and analysts.
The company uses both IFRS and certain non-IFRS measures to assess performance. Management believes the non-IFRS measures provide useful supplemental information to investors in order that they may evaluate PotashCorp’s financial performance using the same measures as management. Management believes that, as a result, the investor is afforded greater transparency in assessing the financial performance of the company. These non-IFRS financial measures should not be considered as a substitute for, nor superior to, measures of financial performance prepared in accordance with IFRS.
| | | | | | | | | | | | | | | | | | | | | | | | | | | | | | | | | | | | | | | | | | | | |
| (in millions of US dollars except percentage amounts) | | | | | | | | | | | | | | | | | | | |
| | | | 2011 | | | | 2010 | | | | 2009 | 1 | | | 2008 | 1 | | | 2007 | 1 | | | 2006 | 1 | | | 2005 | 1 | | | 2004 | 1 | | | 2003 | 1 | | | 2002 | 1 | | | 2001 | 1 |
Net income (loss) | | | 3,081 | | | | 1,775 | | | | 981 | | | | 3,466 | | | | 1,104 | | | | 607 | | | | 543 | | | | 299 | | | | (84 | ) | | | 55 | | | | 95 | |
Total assets | | | 16,257 | | | | 15,547 | | | | 12,922 | | | | 10,249 | | | | 9,717 | | | | 6,217 | | | | 5,358 | | | | 5,127 | | | | 4,567 | | | | 4,623 | | | | 4,532 | |
Return on assets | | | 19.0% | | | | 11.4% | | | | 7.6% | | | | 33.8% | | | | 11.4% | | | | 9.8% | | | | 10.1% | | | | 5.8% | | | | (1.8% | ) | | | 1.2% | | | | 2.1% | |
Net income (loss) | | | 3,081 | | | | 1,775 | | | | 981 | | | | 3,466 | | | | 1,104 | | | | 607 | | | | 543 | | | | 299 | | | | (84 | ) | | | 55 | | | | 95 | |
Income taxes | | | 1,066 | | | | 701 | | | | 79 | | | | 1,060 | | | | 417 | | | | 142 | | | | 267 | | | | 132 | | | | – | | | | 31 | | | | 53 | |
Change in unrealized loss (gain) on derivatives included in net income | | | 1 | | | | – | | | | (56 | ) | | | 69 | | | | (17 | ) | | | – | | | | – | | | | – | | | | – | | | | – | | | | – | |
Finance costs | | | 159 | | | | 121 | | | | 121 | | | | 63 | | | | 69 | | | | 86 | | | | 82 | | | | 84 | | | | 91 | | | | 83 | | | | 80 | |
Current income taxes | | | (700 | ) | | | (479 | ) | | | 120 | | | | (995 | ) | | | (297 | ) | | | (108 | ) | | | (227 | ) | | | (105 | ) | | | – | | | | (24 | ) | | | (21 | ) |
Depreciation and amortization | | | 489 | | | | 449 | | | | 312 | | | | 328 | | | | 291 | | | | 242 | | | | 242 | | | | 240 | | | | 227 | | | | 217 | | | | 186 | |
Cash flow 2 | | | 4,096 | | | | 2,567 | | | | 1,557 | | | | 3,991 | | | | 1,567 | | | | 969 | | | | 907 | | | | 650 | | | | 234 | | | | 362 | | | | 393 | |
Total assets | | | 16,257 | | | | 15,547 | | | | 12,922 | | | | 10,249 | | | | 9,717 | | | | 6,217 | | | | 5,358 | | | | 5,127 | | | | 4,567 | | | | 4,623 | | | | 4,532 | |
Cash and cash equivalents | | | (430 | ) | | | (412 | ) | | | (385 | ) | | | (277 | ) | | | (720 | ) | | | (326 | ) | | | (94 | ) | | | (459 | ) | | | (5 | ) | | | (25 | ) | | | (45 | ) |
Fair value of derivative assets | | | (10 | ) | | | (5 | ) | | | (9 | ) | | | (18 | ) | | | (135 | ) | | | – | | | | – | | | | – | | | | – | | | | – | | | | – | |
Accumulated depreciation of property, plant and equipment | | | 3,653 | | | | 3,171 | | | | 2,712 | | | | 2,527 | | | | 2,281 | | | | 2,074 | | | | 1,928 | | | | 1,755 | | | | 1,576 | | | | 1,455 | | | | 1,274 | |
Net unrealized gains on available-for-sale securities | | | (982 | ) | | | (2,563 | ) | | | (1,900 | ) | | | (886 | ) | | | (2,284 | ) | | | – | | | | – | | | | – | | | | – | | | | – | | | | – | |
Accumulated amortization of other assets and intangible assets | | | 93 | | | | 76 | | | | 57 | | | | 81 | | | | 66 | | | | 80 | | | | 73 | | | | 72 | | | | 77 | | | | 64 | | | | 49 | |
Payables and accrued charges | | | (1,295 | ) | | | (1,198 | ) | | | (798 | ) | | | (1,191 | ) | | | (912 | ) | | | (545 | ) | | | (843 | ) | | | (600 | ) | | | (380 | ) | | | (347 | ) | | | (271 | ) |
Adjusted assets | | | 17,286 | | | | 14,616 | | | | 12,599 | | | | 10,485 | | | | 8,013 | | | | 7,500 | | | | 6,422 | | | | 5,895 | | | | 5,835 | | | | 5,770 | | | | 5,539 | |
Average adjusted assets | | | 15,951 | | | | 13,627 | 4 | | | 11,542 | | | | 9,249 | | | | 7,757 | | | | 6,961 | | | | 6,159 | | | | 5,865 | | | | 5,803 | | | | 5,655 | | | | 5,094 | |
Cash flow return 3 | | | 25.7% | | | | 18.8% | | | | 13.5% | | | | 43.2% | | | | 20.2% | | | | 13.9% | | | | 14.7% | | | | 11.1% | | | | 4.0% | | | | 6.4% | | | | 7.7% | |
| | 1 | As we adopted IFRS with effect from January 1, 2010, our 2001 to 2009 information is presented on a previous Canadian GAAP basis and, to the extent such information constitutes Canadian non-GAAP measures, is reconciled to the most directly comparable measure calculated in accordance with previous Canadian GAAP. Accordingly, information for 2001 to 2009 may not be comparable to 2010 and 2011. |
| | 2 | Cash flow = net income or loss + income taxes + change in unrealized loss/(gain) on derivatives included in net income + finance costs – current income taxes + depreciation and amortization. |
| | 3 | Cash flow return = cash flow / average (total assets – cash and cash equivalents – fair value of derivative assets + accumulated depreciation and amortization – net unrealized gains on available-for-sale securities – payables and accrued charges). |
| | 4 | Based on adjusted assets as of January 1, 2010 of $12,637, which was calculated similarly to 2009 under previous Canadian GAAP except the following IFRS amounts were used: total assets of $12,842, accumulated depreciation of property, plant and equipment of $2,850 and payables and accrued charges of $(817). |
| | |
| 78 | | PotashCorp 2011 Annual Report |
11 Year Data
Summary Financial Performance Indicators
| | | | | | | | | | | | | | | | | | | | | | | | | | | | | | | | | | | | | | | | | | | | |
| (in millions of US dollars except per-share, percentage and as otherwise noted) | |
| | | | 2011 | | | | 2010 | | | | 2009 | 1 | | | 2008 | 1 | | | 2007 | 1 | | | 2006 | 1 | | | 2005 | 1 | | | 2004 | 1 | | | 2003 | 1 | | | 2002 | 1 | | | 2001 | 1 |
Net income (loss)2 | | | 3,081 | | | | 1,775 | | | | 981 | | | | 3,466 | | | | 1,104 | | | | 607 | | | | 543 | | | | 299 | | | | (84 | ) | | | 55 | | | | 95 | |
Net income (loss) per share – diluted | | | 3.51 | | | | 1.95 | | | | 1.08 | | | | 3.64 | | | | 1.13 | | | | 0.63 | | | | 0.54 | | | | 0.30 | | | | (0.09 | ) | | | 0.06 | | | | 0.10 | |
EBITDA3 | | | 4,795 | | | | 3,046 | | | | 1,493 | | | | 4,917 | | | | 1,881 | | | | 1,077 | | | | 1,134 | | | | 755 | | | | 234 | | | | 386 | | | | 414 | |
Net income (loss) as percentage of sales | | | 35.4% | | | | 27.1% | | | | 24.7% | | | | 36.7% | | | | 21.1% | | | | 16.1% | | | | 14.1% | | | | 9.2% | | | | (3.0% | ) | | | 2.5% | | | | 4.0% | |
EBITDA margin4 | | | 58.3% | | | | 50.3% | | | | 40.8% | | | | 54.7% | | | | 39.5% | | | | 31.9% | | | | 32.6% | | | | 26.0% | | | | 9.5% | | | | 20.0% | | | | 19.8% | |
Cash flow prior to working capital changes 5 | | | 3,704 | | | | 2,509 | | | | 1,351 | | | | 3,781 | | | | 1,525 | | | | 941 | | | | 860 | | | | 538 | | | | 369 | | | | 289 | | | | 304 | |
Cash provided by operating activities | | | 3,485 | | | | 3,131 | | | | 924 | | | | 3,013 | | | | 1,689 | | | | 697 | | | | 865 | | | | 658 | | | | 386 | | | | 316 | | | | 34 | |
Free cash flow 6 | | | 1,456 | | | | 359 | | | | (467 | ) | | | 2,536 | | | | 926 | | | | 431 | | | | 483 | | | | 315 | | | | 185 | | | | 41 | | | | (256 | ) |
Return on assetssee page 78 | | | 19.0% | | | | 11.4% | | | | 7.6% | | | | 33.8% | | | | 11.4% | | | | 9.8% | | | | 10.1% | | | | 5.8% | | | | (1.8% | ) | | | 1.2% | | | | 2.1% | |
Cash flow returnsee page 78 | | | 25.7% | | | | 18.8% | | | | 13.5% | | | | 43.2% | | | | 20.2% | | | | 13.9% | | | | 14.7% | | | | 11.1% | | | | 4.0% | | | | 6.4% | | | | 7.7% | |
Weighted average cost of capital | | | 9.6% | | | | 10.2% | | | | 10.1% | | | | 12.0% | | | | 10.0% | | | | 8.8% | | | | 8.3% | | | | 8.4% | | | | 7.3% | | | | 7.3% | | | | 7.7% | |
Total shareholder return | | | (19.5% | ) | | | 43.0% | | | | 48.7% | | | | (48.9% | ) | | | 201.8% | | | | 79.7% | | | | (2.7% | ) | | | 93.5% | | | | 37.7% | | | | 5.3% | | | | (20.2% | ) |
Total debt to capital | | | 36.6% | | | | 45.5% | | | | 38.6% | | | | 40.3% | | | | 19.3% | | | | 41.0% | | | | 41.5% | | | | 36.4% | | | | 42.3% | | | | 42.2% | | | | 42.6% | |
Net debt to capital7 | | | 34.3% | | | | 43.6% | | | | 36.3% | | | | 38.1% | | | | 10.6% | | | | 36.6% | | | | 39.9% | | | | 27.5% | | | | 42.2% | | | | 41.8% | | | | 41.8% | |
Total debt to net income (loss) | | | 1.5 | | | | 3.1 | | | | 4.1 | | | | 0.9 | | | | 1.3 | | | | 3.2 | | | | 2.8 | | | | 4.6 | | | | (17.2 | ) | | | 27.2 | | | | 15.9 | |
Net debt to EBITDA8 | | | 0.9 | | | | 1.7 | | | | 2.5 | | | | 0.6 | | | | 0.4 | | | | 1.5 | | | | 1.2 | | | | 1.2 | | | | 6.2 | | | | 3.8 | | | | 3.6 | |
Total assets | | | 16,257 | | | | 15,547 | | | | 12,922 | | | | 10,249 | | | | 9,717 | | | | 6,217 | | | | 5,358 | | | | 5,127 | | | | 4,567 | | | | 4,623 | | | | 4,532 | |
Shareholders’ equity | | | 7,847 | | | | 6,685 | | | | 6,440 | | | | 4,535 | | | | 5,994 | | | | 2,755 | | | | 2,133 | | | | 2,386 | | | | 1,974 | | | | 2,050 | | | | 2,043 | |
Financial Data, Reconciliations and Calculations
| | | | | | | | | | | | | | | | | | | | | | | | | | | | | | | | | | | | | | | | | | | | |
| (in millions of US dollars except share, per-share and tonnage amounts, and as otherwise noted) | |
| | | 2011 | | | 2010 | | | 2009 1 | | | 2008 1 | | | 2007 1 | | | 2006 1 | | | 2005 1 | | | 2004 1 | | | 2003 1 | | | 2002 1 | | | 2001 1 | |
Net income (loss)2 | | | 3,081 | | | | 1,775 | | | | 981 | | | | 3,466 | | | | 1,104 | | | | 607 | | | | 543 | | | | 299 | | | | (84 | ) | | | 55 | | | | 95 | |
Finance costs | | | 159 | | | | 121 | | | | 121 | | | | 63 | | | | 69 | | | | 86 | | | | 82 | | | | 84 | | | | 91 | | | | 83 | | | | 80 | |
Income taxes | | | 1,066 | | | | 701 | | | | 79 | | | | 1,060 | | | | 417 | | | | 142 | | | | 267 | | | | 132 | | | | – | | | | 31 | | | | 53 | |
Depreciation and amortization | | | 489 | | | | 449 | | | | 312 | | | | 328 | | | | 291 | | | | 242 | | | | 242 | | | | 240 | | | | 227 | | | | 217 | | | | 186 | |
EBITDA3 | | | 4,795 | | | | 3,046 | | | | 1,493 | | | | 4,917 | | | | 1,881 | | | | 1,077 | | | | 1,134 | | | | 755 | | | | 234 | | | | 386 | | | | 414 | |
| | | | | | | | | | | |
Net income as percentage of sales | | | 35.4% | | | | 27.1% | | | | 24.7% | | | | 36.7% | | | | 21.1% | | | | 16.1% | | | | 14.1% | | | | 9.2% | | | | (3.0% | ) | | | 2.5% | | | | 4.0% | |
EBITDA margin4 | | | 58.3% | | | | 50.3% | | | | 40.8% | | | | 54.7% | | | | 39.5% | | | | 31.9% | | | | 32.6% | | | | 26.0% | | | | 9.5% | | | | 20.0% | | | | 19.8% | |
| | | | | | | | | | | |
Cash flow prior to working capital changes 5 | | | 3,704 | | | | 2,509 | | | | 1,351 | | | | 3,781 | | | | 1,525 | | | | 941 | | | | 860 | | | | 538 | | | | 369 | | | | 289 | | | | 304 | |
Receivables | | | (155 | ) | | | 256 | | | | 53 | | | | (594 | ) | | | (155 | ) | | | 11 | | | | (107 | ) | | | (52 | ) | | | (39 | ) | | | (11 | ) | | | 70 | |
Inventories | | | (146 | ) | | | 66 | | | | 88 | | | | (324 | ) | | | 61 | | | | 14 | | | | (120 | ) | | | (11 | ) | | | 12 | | | | (18 | ) | | | (76 | ) |
Prepaid expenses and other current assets | | | (1 | ) | | | (6 | ) | | | 21 | | | | (24 | ) | | | 7 | | | | – | | | | (6 | ) | | | (6 | ) | | | 11 | | | | (4 | ) | | | 2 | |
Payables and accrued charges | | | 83 | | | | 306 | | | | (589 | ) | | | 174 | | | | 251 | | | | (269 | ) | | | 238 | | | | 189 | | | | 33 | | | | 60 | | | | (266 | ) |
Changes in non-cash operating working capital | | | (219 | ) | | | 622 | | | | (427 | ) | | | (768 | ) | | | 164 | | | | (244 | ) | | | 5 | | | | 120 | | | | 17 | | | | 27 | | | | (270 | ) |
Cash provided by operating activities | | | 3,485 | | | | 3,131 | | | | 924 | | | | 3,013 | | | | 1,689 | | | | 697 | | | | 865 | | | | 658 | | | | 386 | | | | 316 | | | | 34 | |
Additions to property, plant and equipment | | | (2,176 | ) | | | (2,079 | ) | | | (1,764 | ) | | | (1,198 | ) | | | (607 | ) | | | (509 | ) | | | (383 | ) | | | (220 | ) | | | (151 | ) | | | (212 | ) | | | (514 | ) |
Other assets and intangible assets | | | (72 | ) | | | (71 | ) | | | (54 | ) | | | (47 | ) | | | 8 | | | | (1 | ) | | | 6 | | | | (3 | ) | | | (33 | ) | | | (36 | ) | | | (46 | ) |
Changes in non-cash operating working capital | | | 219 | | | | (622 | ) | | | 427 | | | | 768 | | | | (164 | ) | | | 244 | | | | (5 | ) | | | (120 | ) | | | (17 | ) | | | (27 | ) | | | 270 | |
Free cash flow | | | 1,456 | | | | 359 | | | | (467 | ) | | | 2,536 | | | | 926 | | | | 431 | | | | 483 | | | | 315 | | | | 185 | | | | 41 | | | | (256 | ) |
Footnotes detailed on Pages 82-83
| | |
| PotashCorp 2011 Annual Report | | 79 |
| | | | | | | | | | | | | | | | | | | | | | | | | | | | | | | | | | | | | | | | | | | | |
| | | 2011 | | | 2010 | | | 2009 1 | | | 2008 1 | | | 2007 1 | | | 2006 1 | | | 2005 1 | | | 2004 1 | | | 2003 1 | | | 2002 1 | | | 2001 1 | |
Weighted average cost of capital | | | 9.6% | | | | 10.2% | | | | 10.1% | | | | 12.0% | | | | 10.0% | | | | 8.8% | | | | 8.3% | | | | 8.4% | | | | 7.3% | | | | 7.3% | | | | 7.7% | |
| | | | | | | | | | | |
End of year closing price (dollars) | | | 41.28 | | | | 51.61 | | | | 36.17 | | | | 24.41 | | | | 47.99 | | | | 15.94 | | | | 8.91 | | | | 9.23 | | | | 4.80 | | | | 3.53 | | | | 3.41 | |
Beginning of year opening price (dollars) | | | 51.61 | | | | 36.17 | | | | 24.41 | | | | 47.99 | | | | 15.94 | | | | 8.91 | | | | 9.23 | | | | 4.80 | | | | 3.53 | | | | 3.41 | | | | 4.35 | |
Change in share price (dollars) | | | (10.33 | ) | | | 15.44 | | | | 11.76 | | | | (23.58 | ) | | | 32.05 | | | | 7.03 | | | | (0.32 | ) | | | 4.43 | | | | 1.27 | | | | 0.12 | | | | (0.94 | ) |
Dividends declared per share (dollars) | | | 0.28 | | | | 0.13 | | | | 0.13 | | | | 0.13 | | | | 0.12 | | | | 0.07 | | | | 0.07 | | | | 0.06 | | | | 0.06 | | | | 0.06 | | | | 0.06 | |
Total shareholder return | | | (19.5% | ) | | | 43.0% | | | | 48.7% | | | | (48.9% | ) | | | 201.8% | | | | 79.7% | | | | (2.7% | ) | | | 93.5% | | | | 37.7% | | | | 5.3% | | | | (20.2% | ) |
| | | | | | | | | | | |
Short-term debt | | | 829 | | | | 1,274 | | | | 727 | | | | 1,324 | | | | 90 | | | | 158 | | | | 252 | | | | 94 | | | | 176 | | | | 473 | | | | 501 | |
Current portion of long-term debt | | | 3 | | | | 597 | | | | 2 | | | | – | | | | – | | | | 400 | | | | 1 | | | | 10 | | | | 1 | | | | 3 | | | | – | |
Long-term debt | | | 3,701 | | | | 3,702 | | | | 3,319 | | | | 1,740 | | | | 1,339 | | | | 1,357 | | | | 1,258 | | | | 1,259 | | | | 1,269 | | | | 1,020 | | | | 1,014 | |
Total debt | | | 4,533 | | | | 5,573 | | | | 4,048 | | | | 3,064 | | | | 1,429 | | | | 1,915 | | | | 1,511 | | | | 1,363 | | | | 1,446 | | | | 1,496 | | | | 1,515 | |
Cash and cash equivalents | | | (430 | ) | | | (412 | ) | | | (385 | ) | | | (277 | ) | | | (720 | ) | | | (326 | ) | | | (94 | ) | | | (459 | ) | | | (5 | ) | | | (25 | ) | | | (45 | ) |
Net debt7 | | | 4,103 | | | | 5,161 | | | | 3,663 | | | | 2,787 | | | | 709 | | | | 1,589 | | | | 1,417 | | | | 904 | | | | 1,441 | | | | 1,471 | | | | 1,470 | |
Shareholders’ equity | | | 7,847 | | | | 6,685 | | | | 6,440 | | | | 4,535 | | | | 5,994 | | | | 2,755 | | | | 2,133 | | | | 2,386 | | | | 1,974 | | | | 2,050 | | | | 2,043 | |
Total debt to capital | | | 36.6% | | | | 45.5% | | | | 38.6% | | | | 40.3% | | | | 19.3% | | | | 41.0% | | | | 41.5% | | | | 36.4% | | | | 42.3% | | | | 42.2% | | | | 42.6% | |
Net debt to capital7 | | | 34.3% | | | | 43.6% | | | | 36.3% | | | | 38.1% | | | | 10.6% | | | | 36.6% | | | | 39.9% | | | | 27.5% | | | | 42.2% | | | | 41.8% | | | | 41.8% | |
Total debt to net income (loss) | | | 1.5 | | | | 3.1 | | | | 4.1 | | | | 0.9 | | | | 1.3 | | | | 3.2 | | | | 2.8 | | | | 4.6 | | | | (17.2 | ) | | | 27.2 | | | | 15.9 | |
Net debt to EBITDA8 | | | 0.9 | | | | 1.7 | | | | 2.5 | | | | 0.6 | | | | 0.4 | | | | 1.5 | | | | 1.2 | | | | 1.2 | | | | 6.2 | | | | 3.8 | | | | 3.6 | |
| | | | | | | | | | | |
Current assets | | | 2,408 | | | | 2,095 | | | | 2,272 | | | | 2,267 | | | | 1,811 | | | | 1,310 | | | | 1,111 | | | | 1,244 | | | | 734 | | | | 832 | | | | 820 | |
Current liabilities | | | (2,194 | ) | | | (3,144 | ) | | | (1,577 | ) | | | (2,623 | ) | | | (1,002 | ) | | | (1,104 | ) | | | (1,096 | ) | | | (704 | ) | | | (558 | ) | | | (823 | ) | | | (773 | ) |
Working capital | | | 214 | | | | (1,049 | ) | | | 695 | | | | (356 | ) | | | 809 | | | | 206 | | | | 15 | | | | 540 | | | | 176 | | | | 9 | | | | 47 | |
Cash and cash equivalents | | | (430 | ) | | | (412 | ) | | | (385 | ) | | | (277 | ) | | | (720 | ) | | | (326 | ) | | | (94 | ) | | | (459 | ) | | | (5 | ) | | | (25 | ) | | | (45 | ) |
Short-term debt | | | 829 | | | | 1,274 | | | | 727 | | | | 1,324 | | | | 90 | | | | 158 | | | | 252 | | | | 94 | | | | 176 | | | | 473 | | | | 501 | |
Current portion of long-term debt | | | 3 | | | | 597 | | | | 2 | | | | – | | | | – | | | | 400 | | | | 1 | | | | 10 | | | | 1 | | | | 3 | | | | – | |
Non-cash operating working capital | | | 616 | | | | 410 | | | | 1,039 | | | | 691 | | | | 179 | | | | 438 | | | | 174 | | | | 185 | | | | 348 | | | | 460 | | | | 503 | |
| | | | | | | | | | | |
Sales | | | | | | | | | | | | | | | | | | | | | | | | | | | | | | | | | | | | | | | | | | | | |
Potash | | | 3,983 | | | | 3,001 | | | | 1,316 | | | | 4,068 | | | | 1,797 | | | | 1,228 | | | | 1,341 | | | | 1,056 | | | | 759 | | | | 669 | | | | 670 | |
Phosphate | | | 2,478 | | | | 1,822 | | | | 1,374 | | | | 2,881 | | | | 1,637 | | | | 1,255 | | | | 1,137 | | | | 978 | | | | 884 | | | | 714 | | | | 732 | |
Nitrogen | | | 2,254 | | | | 1,716 | | | | 1,287 | | | | 2,498 | | | | 1,800 | | | | 1,284 | | | | 1,369 | | | | 1,210 | | | | 1,156 | | | | 841 | | | | 994 | |
Total sales | | | 8,715 | | | | 6,539 | | | | 3,977 | | | | 9,447 | | | | 5,234 | | | | 3,767 | | | | 3,847 | | | | 3,244 | | | | 2,799 | | | | 2,224 | | | | 2,396 | |
Freight, transportation and distribution | | | (496 | ) | | | (488 | ) | | | (319 | ) | | | (458 | ) | | | (470 | ) | | | (390 | ) | | | (371 | ) | | | (343 | ) | | | (333 | ) | | | (295 | ) | | | (300 | ) |
Net sales9 | | | 8,219 | | | | 6,051 | | | | 3,658 | | | | 8,989 | | | | 4,764 | | | | 3,377 | | | | 3,476 | | | | 2,901 | | | | 2,466 | | | | 1,929 | | | | 2,096 | |
| | | | | | | | | | | |
Potash net sales | | | | | | | | | | | | | | | | | | | | | | | | | | | | | | | | | | | | | | | | | | | | |
North America | | | 1,502 | | | | 1,222 | | | | 507 | | | | 1,308 | | | | 657 | | | | 471 | | | | 496 | | | | 348 | | | | 231 | | | | 215 | | | | 232 | |
Offshore | | | 2,223 | | | | 1,506 | | | | 699 | | | | 2,527 | | | | 910 | | | | 576 | | | | 668 | | | | 505 | | | | 336 | | | | 301 | | | | 293 | |
Miscellaneous and purchased product | | | 14 | | | | 14 | | | | 16 | | | | 24 | | | | 14 | | | | 12 | | | | 13 | | | | 43 | | | | 52 | | | | 29 | | | | 21 | |
Total potash net sales | | | 3,739 | | | | 2,742 | | | | 1,222 | | | | 3,859 | | | | 1,581 | | | | 1,059 | | | | 1,177 | | | | 896 | | | | 619 | | | | 545 | | | | 546 | |
| | | | | | | | | | | |
Gross margin | | | | | | | | | | | | | | | | | | | | | | | | | | | | | | | | | | | | | | | | | | | | |
Potash | | | 2,722 | | | | 1,816 | | | | 731 | | | | 3,056 | | | | 912 | | | | 561 | | | | 707 | | | | 423 | | | | 204 | | | | 221 | | | | 206 | |
Phosphate | | | 648 | | | | 346 | | | | 92 | | | | 1,068 | | | | 434 | | | | 84 | | | | 99 | | | | 15 | | | | (17 | ) | | | 42 | | | | 65 | |
Nitrogen | | | 916 | | | | 528 | | | | 192 | | | | 737 | | | | 536 | | | | 316 | | | | 319 | | | | 243 | | | | 193 | | | | 47 | | | | 95 | |
Total gross margin | | | 4,286 | | | | 2,690 | | | | 1,015 | | | | 4,861 | | | | 1,882 | | | | 961 | | | | 1,125 | | | | 681 | | | | 380 | | | | 310 | | | | 366 | |
Footnotes detailed on Pages 82-83
| | |
| 80 | | PotashCorp 2011 Annual Report |
| | | | | | | | | | | | | | | | | | | | | | | | | | | | | | | | | | | | | | | | | | | | |
| | | 2011 | | | 2010 | | | 2009 1 | | | 2008 1 | | | 2007 1 | | | 2006 1 | | | 2005 1 | | | 2004 1 | | | 2003 1 | | | 2002 1 | | | 2001 1 | |
Depreciation and amortization | | | | | | | | | | | | | | | | | | | | | | | | | | | | | | | | | | | | | | | | | | | | |
Potash | | | 142 | | | | 125 | | | | 40 | | | | 82 | | | | 72 | | | | 58 | | | | 65 | | | | 66 | | | | 52 | | | | 44 | | | | 34 | |
Phosphate | | | 207 | | | | 197 | | | | 164 | | | | 141 | | | | 121 | | | | 95 | | | | 95 | | | | 84 | | | | 79 | | | | 77 | | | | 72 | |
Nitrogen | | | 132 | | | | 119 | | | | 99 | | | | 97 | | | | 88 | | | | 77 | | | | 72 | | | | 80 | | | | 86 | | | | 88 | | | | 73 | |
Other | | | 8 | | | | 8 | | | | 9 | | | | 8 | | | | 10 | | | | 12 | | | | 10 | | | | 10 | | | | 10 | | | | 8 | | | | 7 | |
Total depreciation and amortization | | | 489 | | | | 449 | | | | 312 | | | | 328 | | | | 291 | | | | 242 | | | | 242 | | | | 240 | | | | 227 | | | | 217 | | | | 186 | |
| | | | | | | | | | | |
Operating income | | | 4,306 | | | | 2,597 | | | | 1,181 | | | | 4,589 | | | | 1,589 | | | | 835 | | | | 893 | | | | 514 | | | | 7 | | | | 170 | | | | 228 | |
| | | | | | | | | | | |
Net income (loss) per share – basic | | | 3.60 | | | | 2.00 | | | | 1.11 | | | | 3.76 | | | | 1.17 | | | | 0.65 | | | | 0.56 | | | | 0.31 | | | | (0.09 | ) | | | 0.06 | | | | 0.10 | |
Net income (loss) per share – diluted | | | 3.51 | | | | 1.95 | | | | 1.08 | | | | 3.64 | | | | 1.13 | | | | 0.63 | | | | 0.54 | | | | 0.30 | | | | (0.09 | ) | | | 0.06 | | | | 0.10 | |
| | | | | | | | | | | |
Dividends declared per share | | | 0.28 | | | | 0.13 | | | | 0.13 | | | | 0.13 | | | | 0.12 | | | | 0.07 | | | | 0.07 | | | | 0.06 | | | | 0.06 | | | | 0.06 | | | | 0.06 | |
| | | | | | | | | | | |
Capital spending | | | | | | | | | | | | | | | | | | | | | | | | | | | | | | | | | | | | | | | | | | | | |
Sustaining | | | 509 | | | | 523 | | | | 416 | | | | 303 | | | | 204 | | | | 154 | | | | 127 | | | | 126 | | | | 112 | | | | 102 | | | | 83 | |
Opportunity | | | 1,667 | | | | 1,556 | | | | 1,348 | | | | 895 | | | | 403 | | | | 355 | | | | 256 | | | | 95 | | | | 39 | | | | 110 | | | | 47 | |
Trinidad plant lease buyout | | | – | | | | – | | | | – | | | | – | | | | – | | | | – | | | | – | | | | – | | | | – | | | | – | | | | 384 | |
Total capital spending | | | 2,176 | | | | 2,079 | | | | 1,764 | | | | 1,198 | | | | 607 | | | | 509 | | | | 383 | | | | 221 | | | | 151 | | | | 212 | | | | 514 | |
| | | | | | | | | | | |
Weighted average shares outstanding | | | | | | | | | | | | | | | | | | | | | | | | | | | | | | | | | | | | | | | | | | | | |
Basic (thousands) | | | 855,677 | | | | 886,371 | | | | 886,740 | | | | 922,439 | | | | 946,923 | | | | 935,640 | | | | 977,112 | | | | 971,703 | | | | 940,140 | | | | 936,378 | | | | 933,822 | |
Diluted (thousands) | | | 876,637 | | | | 911,093 | | | | 911,828 | | | | 952,313 | | | | 972,924 | | | | 956,067 | | | | 999,702 | | | | 996,651 | | | | 940,140 | | | | 941,688 | | | | 939,348 | |
| | | | | | | | | | | |
Shares outstanding at the end of the year (thousands) 10 | | | 858,703 | | | | 853,123 | | | | 887,927 | | | | 885,603 | | | | 949,233 | | | | 943,209 | | | | 932,346 | | | | 995,679 | | | | 956,016 | | | | 937,404 | | | | 935,136 | |
Non-Financial Data, Operating Data and Calculations
| | | | | | | | | | | | | | | | | | | | | | | | | | | | | | | | | | | | | | | | | | | | |
| | | 2011 | | | 2010 | | | 2009 | | | 2008 | | | 2007 | | | 2006 | | | 2005 | | | 2004 | | | 2003 | | | 2002 | | | 2001 | |
Customers | | | | | | | | | | | | | | | | | | | | | | | | | | | | | | | | | | | | | | | | | | | | |
Average customer survey score 11 | | | 90% | | | | 90% | | | | 89% | | | | 91% | | | | 90% | | | | n/a | | | | n/a | | | | n/a | | | | n/a | | | | n/a | | | | n/a | |
| | | | | | | | | | | |
Community | | | | | | | | | | | | | | | | | | | | | | | | | | | | | | | | | | | | | | | | | | | | |
Community investment ($ millions) 12 | | | 21 | | | | 17 | | | | 10 | | | | 7 | | | | 4 | | | | 4 | | | | 4 | | | | 4 | | | | 2 | | | | 2 | | | | 2 | |
Taxes and royalties ($ millions) 13 | | | 997 | | | | 620 | | | | (8 | ) | | | 1,684 | | | | 507 | | | | 238 | | | | 430 | | | | 251 | | | | 102 | | | | 126 | | | | 124 | |
| | | | | | | | | | | |
Employees | | | | | | | | | | | | | | | | | | | | | | | | | | | | | | | | | | | | | | | | | | | | |
Employees at year-end (actual #) | | | 5,703 | | | | 5,486 | | | | 5,136 | | | | 5,301 | | | | 5,003 | | | | 4,871 | | | | 4,879 | | | | 4,906 | | | | 4,904 | | | | 5,199 | | | | 4,997 | |
Average employee engagement score 14 | | | 73% | | | | 73% | | | | 76% | | | | 79% | | | | 69% | | | | 66% | | | | n/a | | | | n/a | | | | n/a | | | | n/a | | | | n/a | |
Gender diversity – proportion of females | | | 8% | | | | 8% | | | | 9% | | | | 9% | | | | 9% | | | | 9% | | | | 9% | | | | 8% | | | | n/a | | | | n/a | | | | n/a | |
| | | | | | | | | | | |
Environment | | | | | | | | | | | | | | | | | | | | | | | | | | | | | �� | | | | | | | | | | | | | | | |
Environmental incidents | | | 14 | | | | 20 | | | | 22 | | | | 19 | | | | 25 | | | | 26 | | | | n/a | | | | n/a | | | | n/a | | | | n/a | | | | n/a | |
Direct energy used (000 terajoule) | | | 165.5 | | | | 161.8 | | | | 152.1 | | | | 153.9 | | | | 159.3 | | | | n/a | | | | n/a | | | | n/a | | | | n/a | | | | n/a | | | | n/a | |
| | | | | | | | | | | |
Safety | | | | | | | | | | | | | | | | | | | | | | | | | | | | | | | | | | | | | | | | | | | | |
Total site severity injury rate (per 200,000 work hours) | | | 0.54 | | | | 0.38 | | | | 0.74 | | | | 0.97 | | | | n/a | | | | n/a | | | | n/a | | | | n/a | | | | n/a | | | | n/a | | | | n/a | |
n/a = not available as data had not been previously compiled consistent with current methodology
Footnotes detailed on Pages 82-83
| | |
| PotashCorp 2011 Annual Report | | 81 |
| | | | | | | | | | | | | | | | | | | | | | | | | | | | | | | | | | | | | | | | | | | | |
| | | 2011 | | | 2010 | | | 2009 | | | 2008 | | | 2007 | | | 2006 | | | 2005 | | | 2004 | | | 2003 | | | 2002 | | | 2001 | |
Production (thousands) | | | | | | | | | | | | | | | | | | | | | | | | | | | | | | | | | | | | | | | | | | | | |
Potash production (KCI) tonnage | | | 9,343 | | | | 8,078 | | | | 3,405 | | | | 8,697 | | | | 9,159 | | | | 7,018 | | | | 8,816 | | | | 7,914 | | | | 7,094 | | | | 6,447 | | | | 6,128 | |
Phosphate production (P2O5) tonnage | | | 2,204 | | | | 1,987 | | | | 1,505 | | | | 1,942 | | | | 2,164 | | | | 2,108 | | | | 2,097 | | | | 1,962 | | | | 1,861 | | | | 1,512 | | | | 1,573 | |
Nitrogen production (N) tonnage | | | 2,813 | | | | 2,767 | | | | 2,551 | | | | 2,780 | | | | 2,986 | | | | 2,579 | | | | 2,600 | | | | 2,558 | | | | 2,619 | | | | 2,990 | | | | 3,032 | |
| | | | | | | | | | | |
Sales (thousands) | | | | | | | | | | | | | | | | | | | | | | | | | | | | | | | | | | | | | | | | | | | | |
Potash sales – manufactured product tonnes | | | | | | | | | | | | | | | | | | | | | | | | | | | | | | | | | | | | | | | | | | | | |
North America | | | 3,114 | | | | 3,355 | | | | 1,093 | | | | 2,962 | | | | 3,471 | | | | 2,785 | | | | 3,144 | | | | 3,246 | | | | 2,870 | | | | 2,780 | | | | 2,894 | |
Offshore | | | 5,932 | �� | | | 5,289 | | | | 1,895 | | | | 5,585 | | | | 5,929 | | | | 4,411 | | | | 5,020 | | | | 5,030 | | | | 4,213 | | | | 3,547 | | | | 3,349 | |
Potash sales | | | 9,046 | | | | 8,644 | | | | 2,988 | | | | 8,547 | | | | 9,400 | | | | 7,196 | | | | 8,164 | | | | 8,276 | | | | 7,083 | | | | 6,327 | | | | 6,243 | |
Phosphate sales – manufactured product tonnes | | | 3,854 | | | | 3,632 | | | | 3,055 | | | | 3,322 | | | | 4,151 | | | | 3,970 | | | | 3,860 | | | | 3,675 | | | | 3,560 | | | | 2,809 | | | | 2,987 | |
Nitrogen sales – manufactured product tonnes | | | 5,012 | | | | 5,206 | | | | 4,967 | | | | 5,042 | | | | 5,731 | | | | 4,675 | | | | 4,843 | | | | 4,738 | | | | 5,370 | | | | 5,943 | | | | 5,753 | |
Non-IFRS Financial Measures and Footnotes to Reconciliations and Calculations
(in millions of US dollars except share and per-share amounts)
Generally,a non-IFRS financial measure is a numerical measure of a company’s performance, financial position or cash flows that either excludes or includes amounts that are not normally excluded or included in the most directly comparable measure calculated and presented in accordance with IFRS. EBITDA, adjusted EBITDA, EBITDA margin, cash flow prior to working capital changes, free cash flow, cash flow, cash flow return, net debt, net debt to capital, net debt to EBITDA and consolidated net sales are not measures of financial performance (nor do they have standardized meanings) under IFRS. In evaluating these measures, investors should consider that the methodology applied in calculating such measures may differ among companies and analysts.
The company uses both IFRS and certain non-IFRS measures to assess performance. Management believes these non-IFRS measures provide useful supplemental information to investors in order that
they may evaluate PotashCorp’s financial performance using the same measures as management. Management believes that, as a result, the investor is afforded greater transparency in assessing the financial performance of the company. These non-IFRS financial measures should not be considered as a substitute for, nor superior to, measures of financial performance prepared in accordance with IFRS.
| 1 | As we adopted IFRS with effect from January 1, 2010, our 2001 to 2009 annual information is presented on a previous Canadian GAAP basis and, to the extent such information constitutes Canadian non-GAAP measures, is reconciled to the most directly comparable measure calculated in accordance with previous Canadian GAAP. Accordingly, our information for 2001 to 2009 may not be comparable to 2010 and 2011. |
| 2 | There were no discontinued operations in any of the accounting periods. After-tax effects of certain items affecting net income were as follows: |
| | | | | | | | | | | | | | | | | | | | | | | | | | | | | | | | |
| | | 2011 | | | 2010 | | | 2009 1 | | | 2008 1 | | | 2007 1 | | | 2006 1 | | | 2004 1 | | | 2003 1 | |
Takeover response costs | | $ | 1 | | | $ | 56 | | | $ | – | | | $ | – | | | $ | – | | | $ | – | | | $ | – | | | $ | – | |
Loss (gain) on sale of assets | | | – | | | | – | | | | 6 | | | | (16 | ) | | | – | | | | – | | | | (37 | ) | | | – | |
(Recovery) impairment of auction rate securities | | | – | | | | – | | | | (91 | ) | | | 67 | | | | 19 | | | | – | | | | – | | | | – | |
Impairment of property, plant and equipment | | | – | | | | – | | | | – | | | | – | | | | – | | | | 5 | | | | – | | | | 90 | |
Plant shutdown and closure and office consolidation | | | – | | | | – | | | | – | | | | – | | | | – | | | | – | | | | 6 | | | | 114 | |
Total after-tax effects on net income | | $ | 1 | | | $ | 56 | | | $ | (85 | ) | | $ | 51 | | | $ | 19 | | | $ | 5 | | | $ | (31 | ) | | $ | 204 | |
| 3 | PotashCorp uses EBITDA and adjusted EBITDA as supplemental financial measures of its operational performance. Management believes EBITDA and adjusted EBITDA to be important measures as they exclude the effects of items which primarily reflect the impact of long-term investment decisions, rather than the performance of the company’s day-to-day operations. As compared to net income (loss) according to IFRS, these measures are limited in that they do not reflect the periodic costs of certain capitalized tangible and intangible assets used in generating |
| | revenues in the company’s business, or the charges associated with impairments, costs associated with takeover response and certain gains and losses on disposal of assets. Management evaluates such items through other financial measures such as capital expenditures and cash flow provided by operating activities. The company believes that these measurements are useful to measure a company’s ability to service debt and to meet other payment obligations or as a valuation measurement. |
| | EBITDA has not been adjusted for the effects of the following items: |
| | | | | | | | | | | | | | | | | | | | | | | | | | | | | | | | |
| | | 2011 | | | 2010 | | | 2009 1 | | | 2008 1 | | | 2007 1 | | | 2006 1 | | | 2004 1 | | | 2003 1 | |
Takeover response costs | | $ | 2 | | | $ | 73 | | | $ | – | | | $ | – | | | $ | – | | | $ | – | | | $ | – | | | $ | – | |
Loss (gain) on sale of assets | | | – | | | | – | | | | 8 | | | | (21 | ) | | | – | | | | – | | | | (37 | ) | | | – | |
(Recovery) impairment of auction rate securities | | | – | | | | – | | | | (115 | ) | | | 89 | | | | 27 | | | | – | | | | – | | | | – | |
Impairment of property, plant and equipment | | | – | | | | – | | | | – | | | | – | | | | – | | | | 6 | | | | – | | | | 132 | |
Plant shutdown and closure and office consolidation | | | – | | | | – | | | | – | | | | – | | | | – | | | | – | | | | 6 | | | | 114 | |
Total items included in EBITDA | | | 2 | | | | 73 | | | | (107 | ) | | | 68 | | | | 27 | | | | 6 | | | | (31 | ) | | | 246 | |
EBITDA | | | 4,795 | | | | 3,046 | | | | 1,493 | | | | 4,917 | | | | 1,881 | | | | 1,077 | | | | 755 | | | | 234 | |
Adjusted EBITDA | | $ | 4,797 | | | $ | 3,119 | | | $ | 1,386 | | | $ | 4,985 | | | $ | 1,908 | | | $ | 1,083 | | | $ | 724 | | | $ | 480 | |
| | |
| 82 | | PotashCorp 2011 Annual Report |
| 4 | EBITDA margin is calculated as EBITDA divided by net sales (sales less freight, transportation and distribution). Management believes comparing the company’s operations (excluding the impact of long-term investment decisions) to net sales earned (net of costs to deliver product) is an important indicator of efficiency. In addition to the limitations given above in using EBITDA as compared to net income, EBITDA margin as compared to net income as a percentage of sales is also limited in that freight, transportation and distribution costs are incurred and valued independently of sales; EBITDA also includes earnings from equity investees whose sales are not included in consolidated sales. Management evaluates these expenses individually on the consolidated statements of income. |
| 5 | Cash flow prior to working capital changes is defined as the cash provided by operating activities, exclusive of changes in non-cash operating working capital. PotashCorp uses cash flow prior to working capital changes as a supplemental financial measure in its evaluation of liquidity. Management believes that adjusting principally for the swings in non-cash working capital items due to seasonality assists management in making long-term liquidity assessments. The company also believes that this measurement is useful as a measure of liquidity or as a valuation measurement. |
| 6 | Free cash flow is defined as cash provided by operating activities less additions to property, plant and equipment, other assets and intangible assets and changes in non-cash operating working capital. The company uses free cash flow as a supplemental financial measure in its evaluation of liquidity and financial strength. It believes that adjusting principally for the swings in non-cash operating working capital items due to seasonality or other timing issues, additions to property, plant and equipment, and changes to other assets assists management in the long-term assessment of liquidity and financial strength. The company also believes that this measurement is useful as an indicator of its ability to service its debt, meet other payment obligations and make strategic investments. Readers should be aware that free cash flow does not represent residual cash flow available for discretionary expenditures. |
| 7 | Management believes that net debt and net-debt-to-capital ratio are useful to investors because they are helpful in determining the company’s leverage. It also believes that, since the company has the ability to and may elect to use a portion of cash and cash equivalents to retire debt or to incur additional expenditures without increasing debt, it is appropriate to apply cash and cash equivalents to debt in calculating net debt and net debt to capital. PotashCorp believes that this measurement is useful as a financial leverage measure. |
| 8 | Net debt to EBITDA shows the maximum number of years it would take to retire the company’s net debt using the current year’s EBITDA and helps PotashCorp evaluate the appropriateness of current debt levels relative to earnings generated by operations. In addition to the limitation of using EBITDA discussed above, net debt to EBITDA is limited in that this measure assumes all earnings are used to repay principal and no interest payments or taxes. |
| 9 | Management includes net sales in its segment disclosures in the consolidated financial statements pursuant to IFRS, which requires segmentation based upon the company’s internal organization and reporting of revenue and profit measures derived from internal accounting methods. As a component of gross margin, net sales (and related per-tonne amounts and other ratios) are primary revenue measures it uses and reviews in making decisions about operating matters on a business segment basis. These decisions include assessments about potash, phosphate and nitrogen performance and the resources to be allocated to these segments. It also uses net sales (and related per-tonne amounts and other ratios) for business segment planning and monthly forecasting. Net sales are calculated as sales revenues less freight, transportation and distribution expenses. Net sales presented on a consolidated basis rather than by business segment is considered a non-IFRS financial measure. |
| 10 | Common shares were repurchased in 2010, 2008, 2005, 2000 and 1999 in the amounts of 42.190 million, 68.547 million, 85.500 million, 18.630 million and 5.670 million, respectively. |
| 11 | The annual customer satisfaction survey is conducted online by an independent third party and includes a select group of top customers from each sales segment and region to form a Customer Advisory Council. Customers were asked to commit to participate in annual satisfaction surveys for five years, to ensure consistent measurement and reporting of customer satisfaction. Results are determined by taking a simple average of the eight metrics described on Page 34. |
| 12 | Represents cash disbursements, matching of employee gifts and in-kind contributions of equipment, goods, services and employee volunteerism (on corporate time). |
| 13 | Includes current income taxes, potash production tax, resource surcharge, royalties, municipal taxes and other miscellaneous taxes less investment tax credits calculated on an accrual basis. |
| 14 | A confidential external survey is administered to every employee every second year. |
| | |
| PotashCorp 2011 Annual Report | | 83 |
Financial Terms
Adjusted EBITDA = EBITDA + takeover response costs + impairment charges/recoveries – loss (gain) on sale of assets + shutdown / closure-related costs
Average adjusted assets = simple average of the current year’s adjusted assets and the previous year’s adjusted assets, except when a material acquisition occurred, in which case the weighted average rather than the simple average is calculated; the last material acquisition was in 1997
Cash flow = net income or loss + income taxes + change in unrealized loss/(gain) on derivatives included in net income + finance costs – current income taxes + depreciation and amortization
Cash flow return = cash flow / average (total assets – cash and cash equivalents – fair value of derivative assets + accumulated depreciation and amortization – net unrealized gains on available-for-sale securities – payables and accrued charges)
Current income taxes = income tax expense (recovery) – provision for (recovery of) deferred income tax
EBITDA = earnings (net income or loss) before finance costs, taxes, depreciation and amortization
EBITDA margin = EBITDA / net sales
Free cash flow = cash provided by operating activities – additions to property, plant and equipment – other assets and intangible assets – changes in non-cash operating working capital
Market value of total capital = market value of total debt – cash and cash equivalents + market value of equity
Net debt to capital = (total debt – cash and cash equivalents) /(total debt – cash and cash equivalents + total shareholders’ equity)
Net debt to EBITDA = (total debt – cash and cash equivalents) /EBITDA
Net sales = sales – freight – transportation and distribution
Return on assets = net income or loss / total assets
Total debt to capital = total debt / (total debt + total shareholders’ equity)
Total debt to net income or loss = total debt / net income or loss
Total shareholder return = (change in market price per common share + dividends per share) / beginning market price per common share
Weighted average cost of capital = simple quarterly average of ((market value of total debt – cash and cash equivalents) /market value of total capital x after-tax cost of debt + market value of equity / market value of total capital x cost of equity)
Non-Financial Terms
Total site severity injury rate = total of lost-time injuries (a lost-time injury or illness occurs when the injured person is unable to return to work on his/her next scheduled workday after the injury) + modified work injuries (a work-related injury or illness where a licensed health care professional or the employer recommends that the employee not perform one or more of the routine functions of the job or not work the full workday that the employee would have otherwise worked) for every 200,000 hours worked. Total site includes PotashCorp employees, contractors and all others on site.
Environmental incidents = reportable quantity releases (a release whose quantity equals or exceeds the US Environmental Protection Agency’s notification level and is reportable to the National Response Center (NRC)) + permit excursions (an exceedance of a federal, state, provincial or local permit condition or regulatory limit) + provincial reportable spills (an unconfined spill or release into the environment).
| | |
| 84 | | PotashCorp 2011 Annual Report |
Management’s Responsibility
Management’s Responsibility for Financial Reporting
Management’s report on financial statements
The accompanying consolidated financial statements and related financial information are the responsibility of PotashCorp management. They have been prepared in accordance with International Financial Reporting Standards as issued by the International Accounting Standards Board and include amounts based on estimates and judgments. Financial information included elsewhere in this report is consistent with the consolidated financial statements.
Our independent registered chartered accountants, Deloitte & Touche LLP, provide an audit of the consolidated financial statements, as reflected in their report for 2011 included on Page 87.
The consolidated financial statements are approved by the Board of Directors on the recommendation of the audit committee.
The audit committee of the Board of Directors is composed entirely of independent directors. PotashCorp’s interim condensed consolidated financial statements and MD&A are discussed and analyzed by the audit committee with management and the independent registered chartered accountants before such information is approved by the committee and submitted to securities commissions or other regulatory authorities. The annual consolidated financial statements and MD&A are also analyzed by the audit committee together with management and the independent registered chartered accountants and are approved by the Board of Directors.
In addition, the audit committee has the duty to review critical accounting policies and significant estimates and judgments underlying the consolidated financial statements as presented by management, and to approve the fees of the independent registered chartered accountants.
Deloitte & Touche LLP, the independent registered chartered accountants, have full and independent access to the audit committee to discuss their audit and related matters.
|
Management’s report on internal control over financial reporting Management is responsible for establishing and maintaining an adequate system of internal control over financial reporting. During the past year, we have directed efforts to improve our internal control over financial reporting. Internal control over financial reporting is a process designed to provide reasonable assurance regarding the reliability of financial reporting and the preparation of consolidated financial statements for external reporting purposes in accordance with International Financial Reporting Standards as issued by the International Accounting Standards Board. Because of its inherent limitations, internal control over financial reporting may not prevent or detect misstatements. Management has assessed the effectiveness of the company’s internal control over financial reporting based on the framework in Internal Control – Integrated Framework issued by the Committee of Sponsoring Organizations of the Treadway Commission (COSO) and concluded that the company’s internal control over financial reporting was effective as of December 31, 2011. The effectiveness of the company’s internal control over financial reporting as of December 31, 2011 has been audited by Deloitte & Touche LLP, as reflected in their report for 2011 included on Page 86. |
| | |

W. Doyle President and Chief Executive Officer February 21, 2012 | | 
W. Brownlee Executive Vice President and Chief Financial Officer |
| | |
| PotashCorp 2011 Annual Report | | 85 |
Report of Independent Registered Chartered Accountants
To the Board of Directors and Shareholders of Potash Corporation of Saskatchewan Inc.
We have audited the internal control over financial reporting of Potash Corporation of Saskatchewan Inc. and subsidiaries (the “Company”) as of December 31, 2011, based on the criteria established inInternal Control — Integrated Frameworkissued by the Committee of Sponsoring Organizations of the Treadway Commission. The Company’s management is responsible for maintaining effective internal control over financial reporting and for its assessment of the effectiveness of internal control over financial reporting, included in the accompanying Management’s Report on Internal Control Over Financial Reporting. Our responsibility is to express an opinion on the Company’s internal control over financial reporting based on our audit.
We conducted our audit in accordance with the standards of the Public Company Accounting Oversight Board (United States). Those standards require that we plan and perform the audit to obtain reasonable assurance about whether effective internal control over financial reporting was maintained in all material respects. Our audit included obtaining an understanding of internal control over financial reporting, assessing the risk that a material weakness exists, testing and evaluating the design and operating effectiveness of internal control based on the assessed risk, and performing such other procedures as we considered necessary in the circumstances. We believe that our audit provides a reasonable basis for our opinion.
A company’s internal control over financial reporting is a process designed by, or under the supervision of, the company’s principal executive and principal financial officers, or persons performing similar functions, and effected by the company’s board of directors, management, and other personnel to provide reasonable assurance regarding the reliability of financial reporting and the preparation of financial statements for external purposes in accordance with generally accepted accounting principles. A company’s internal control over financial reporting includes those policies and procedures that (1) pertain to the maintenance of records that, in reasonable detail, accurately and fairly reflect the transactions and dispositions of the assets of the company; (2) provide reasonable assurance that transactions are recorded as necessary to permit preparation of financial statements in accordance with generally accepted accounting principles, and that receipts and expenditures of the company are being made only in accordance with authorizations of management and directors of the company; and (3) provide reasonable assurance regarding prevention or timely detection of unauthorized acquisition, use, or disposition of the company’s assets that could have a material effect on the financial statements.
Because of the inherent limitations of internal control over financial reporting, including the possibility of collusion or improper management override of controls, material misstatements due to error or fraud may not be prevented or detected on a timely basis. Also, projections of any evaluation of the effectiveness of the internal control over financial reporting to future periods are subject to the risk that the controls may become inadequate because of changes in conditions, or that the degree of compliance with the policies or procedures may deteriorate.
In our opinion, the Company maintained, in all material respects, effective internal control over financial reporting as of December 31, 2011, based on the criteria established inInternal Control—Integrated Frameworkissued by the Committee of Sponsoring Organizations of the Treadway Commission.
We have also audited, in accordance with the standards of the Public Company Accounting Oversight Board (United States), the consolidated financial statements as of and for the year ended December 31, 2011 of the Company and our report dated February 21, 2012 expressed an unqualified opinion on those consolidated financial statements.

Independent Registered Chartered Accountants
Saskatoon, Canada
February 21, 2012
| | |
| 86 | | PotashCorp 2011 Annual Report |
Report of Independent Registered Chartered Accountants
To The Board of Directors and Shareholders of Potash Corporation of Saskatchewan Inc.
We have audited the accompanying consolidated statements of financial position of Potash Corporation of Saskatchewan Inc. and subsidiaries (the “Company”) as of December 31, 2011, December 31, 2010 and January 1, 2010, and the related consolidated statements of income, comprehensive income, changes in equity, and cash flow for each of the two years in the period ended December 31, 2011. These financial statements are the responsibility of the Company’s management. Our responsibility is to express an opinion on these financial statements based on our audits.
We conducted our audits in accordance with the standards of the Public Company Accounting Oversight Board (United States). Those standards require that we plan and perform the audit to obtain reasonable assurance about whether the financial statements are free of material misstatement. An audit includes examining, on a test basis, evidence supporting the amounts and disclosures in the financial statements. An audit also includes assessing the accounting principles used and significant estimates made by management, as well as evaluating the overall financial statement presentation. We believe that our audits provide a reasonable basis for our opinion.
In our opinion, such consolidated financial statements present fairly, in all material respects, the financial position of Potash Corporation of Saskatchewan Inc. and subsidiaries as of December 31, 2011, December 31, 2010 and January 1, 2010, and the results of their operations and their cash flows for each of the two years in the period ended December 31, 2011, in conformity with International Financial Reporting Standards.
We have also audited, in accordance with the standards of the Public Company Accounting Oversight Board (United States), the Company’s internal control over financial reporting as of December 31, 2011, based on the criteria established inInternal Control — Integrated Frameworkissued by the Committee of Sponsoring Organizations of the Treadway Commission and our report dated February 21, 2012 expressed an unqualified opinion on the Company’s internal control over financial reporting.

Independent Registered Chartered Accountants
Saskatoon, Canada
February 21, 2012
| | |
| PotashCorp 2011 Annual Report | | 87 |
Consolidated Financial Statements
Consolidated Statements of Financial Position
| | | | | | | | | | | | | | |
| As at | | | | In millions of US dollars | |
| Notes | | | | December 31,
2011 | | | December 31,
2010 | | | January 1,
2010 | |
| | Assets | | | | | | | | | | | | |
| | Current assets | | | | | | | | | | | | |
| | Cash and cash equivalents | | $ | 430 | | | $ | 412 | | | $ | 385 | |
Note 3 | | Receivables | | | 1,195 | | | | 1,059 | | | | 1,214 | |
Note 4 | | Inventories | | | 731 | | | | 570 | | | | 624 | |
| | | Prepaid expenses and other current assets | | | 52 | | | | 54 | | | | 69 | |
| | | | | 2,408 | | | | 2,095 | | | | 2,292 | |
| | Non-current assets | | | | | | | | | | | | |
Note 5 | | Property, plant and equipment | | | 9,922 | | | | 8,141 | | | | 6,444 | |
Note 6 | | Investments in equity-accounted investees | | | 1,187 | | | | 1,051 | | | | 955 | |
Note 6 | | Available-for-sale investments | | | 2,265 | | | | 3,842 | | | | 2,760 | |
Note 7 | | Other assets | | | 360 | | | | 303 | | | | 274 | |
Note 8 | | Intangible assets | | | 115 | | | | 115 | | | | 117 | |
| | | Total Assets | | $ | 16,257 | | | $ | 15,547 | | | $ | 12,842 | |
| | Liabilities | | | | | | | | | | | | |
| | Current liabilities | | | | | | | | | | | | |
Note 9, 12 | | Short-term debt and current portion of long-term debt | | $ | 832 | | | $ | 1,871 | | | $ | 729 | |
Note 10 | | Payables and accrued charges | | | 1,295 | | | | 1,198 | | | | 817 | |
Note 11 | | Current portion of derivative instrument liabilities | | | 67 | | | | 75 | | | | 52 | |
| | | | | 2,194 | | | | 3,144 | | | | 1,598 | |
| | Non-current liabilities | | | | | | | | | | | | |
Note 12 | | Long-term debt | | | 3,705 | | | | 3,707 | | | | 3,319 | |
Note 11 | | Derivative instrument liabilities | | | 204 | | | | 204 | | | | 123 | |
Note 21 | | Deferred income tax liabilities | | | 1,052 | | | | 737 | | | | 643 | |
Note 13 | | Pension and other post-retirement benefit liabilities | | | 552 | | | | 468 | | | | 455 | |
Note 14 | | Asset retirement obligations and accrued environmental costs | | | 615 | | | | 455 | | | | 300 | |
| | | Other non-current liabilities and deferred credits | | | 88 | | | | 147 | | | | 99 | |
| | | Total Liabilities | | | 8,410 | | | | 8,862 | | | | 6,537 | |
| | Shareholders’ Equity | | | | | | | | | | | | |
Note 15 | | Share capital | | | 1,483 | | | | 1,431 | | | | 1,430 | |
| | Contributed surplus | | | 291 | | | | 308 | | | | 273 | |
| | Accumulated other comprehensive income | | | 816 | | | | 2,394 | | | | 1,798 | |
| | | Retained earnings | | | 5,257 | | | | 2,552 | | | | 2,804 | |
| | | Total Shareholders’ Equity | | | 7,847 | | | | 6,685 | | | | 6,305 | |
| | | Total Liabilities and Shareholders’ Equity | | $ | 16,257 | | | $ | 15,547 | | | $ | 12,842 | |
Note 26 | | Commitments | | | | | | | | | | | | |
Note 27 | | Contingencies and Other Matters | | | | | | | | | | | | |
Note 28 | | Guarantees | | | | | | | | | | | | |
(See Notes to the Consolidated Financial Statements)
Approved by the Board of Directors,
| | |

| | 
|
| Director | | Director |
| | |
| 88 | | PotashCorp 2011 Annual Report |
Consolidated Statements of Income
| | | | | | | | | | | | |
| For the years ended December 31 | | In millions of US dollars except per-share amounts | |
| Notes | | | | | | 2011 | | | 2010 | |
Note 16 | | Sales | | | | $ | 8,715 | | | $ | 6,539 | |
| | Freight, transportation and distribution | | | | | (496 | ) | | | (488 | ) |
Note 17 | | Cost of goods sold | | | | | (3,933 | ) | | | (3,361 | ) |
| | | Gross Margin | | | | | 4,286 | | | | 2,690 | |
| | | | |
Note 17 | | Selling and administrative expenses | | | | | (217 | ) | | | (228 | ) |
Note 18 | | Provincial mining and other taxes | | | | | (147 | ) | | | (77 | ) |
| | Share of earnings of equity-accounted investees | | | | | 261 | | | | 174 | |
| | Dividend income | | | | | 136 | | | | 163 | |
Note 19 | | Other expenses | | | | | (13 | ) | | | (125 | ) |
| | | | |
| | Operating Income | | | | | 4,306 | | | | 2,597 | |
| | | | |
Note 20 | | Finance Costs | | | | | (159 | ) | | | (121 | ) |
| | | | |
| | Income Before Income Taxes | | | | | 4,147 | | | | 2,476 | |
| | | | |
Note 21 | | Income Taxes | | | | | (1,066 | ) | | | (701 | ) |
| | | | |
| | | Net Income | | | | $ | 3,081 | | | $ | 1,775 | |
| | | | |
Note 22 | | Net Income per Share – Basic | | | | $ | 3.60 | | | $ | 2.00 | |
| | | | |
Note 22 | | Net Income per Share – Diluted | | | | $ | 3.51 | | | $ | 1.95 | |
| | | | |
| | | Dividends Declared per Share | | | | $ | 0.28 | | | $ | 0.13 | |
(See Notes to the Consolidated Financial Statements)
| | |
| PotashCorp 2011 Annual Report | | 89 |
Consolidated Statements of Comprehensive Income
| | | | | | | | |
| For the years ended December 31 | | In millions of US dollars | |
| (Net of related income taxes) | | 2011 | | | 2010 | |
Net Income | | $ | 3,081 | | | $ | 1,775 | |
Other comprehensive (loss) income | | | | | | | | |
Net (decrease) increase in net unrealized gains on available-for-sale investments 1 | | | (1,581 | ) | | | 663 | |
Net actuarial losses on defined benefit plans2 | | | (136 | ) | | | (25 | ) |
Net losses on derivatives designated as cash flow hedges3 | | | (38 | ) | | | (119 | ) |
Reclassification to income of net losses on cash flow hedges4 | | | 47 | | | | 53 | |
Other | | | (6 | ) | | | (1 | ) |
Other Comprehensive (Loss) Income | | $ | (1,714 | ) | | $ | 571 | |
Comprehensive Income | | $ | 1,367 | | | $ | 2,346 | |
| 1 | Available-for-sale investments are comprised of shares in Israel Chemicals Ltd. and Sinofert Holdings Limited. |
| 2 | Net of income taxes of $75 (2010 – $11). |
| 3 | Cash flow hedges are comprised of natural gas derivative instruments and are net of income taxes of $24 (2010 – $72). |
| 4 | Net of income taxes of $(29) (2010 – $(32)). |
(See Notes to the Consolidated Financial Statements)
| | |
| 90 | | PotashCorp 2011 Annual Report |
Consolidated Statements of Cash Flow
| | | | | | | | | | | | | | | | |
| For the years ended December 31 | | In millions of US dollars | |
| | | | | | 2011 | | | | | | 2010 | |
Operating Activities | | | | | | | | | | | | | | | | |
Net income | | | | | | $ | 3,081 | | | | | | | $ | 1,775 | |
Adjustments to reconcile net income to cash provided by operating activities | | | | | | | | | | | | | | | | |
Depreciation and amortization | | | 489 | | | | | | | | 449 | | | | | |
Share-based compensation | | | 24 | | | | | | | | 24 | | | | | |
Realized excess tax benefit related to share-based compensation | | | 29 | | | | | | | | 45 | | | | | |
Provision for deferred income tax | | | 337 | | | | | | | | 177 | | | | | |
Undistributed earnings of equity-accounted investees | | | (133 | ) | | | | | | | (96 | ) | | | | |
Pension and other post-retirement benefits | | | (122 | ) | | | | | | | (24 | ) | | | | |
Asset retirement obligations and accrued environmental costs | | | 39 | | | | | | | | 77 | | | | | |
Other long-term liabilities and miscellaneous | | | (40 | ) | | | | | | | 82 | | | | | |
| | | | | | | | | | | | | | | | |
Subtotal of adjustments | | | | | | | 623 | | | | | | | | 734 | |
Changes in non-cash operating working capital | | | | | | | | | | | | | | | | |
Receivables | | | (155 | ) | | | | | | | 256 | | | | | |
Inventories | | | (146 | ) | | | | | | | 66 | | | | | |
Prepaid expenses and other current assets | | | (1 | ) | | | | | | | (6 | ) | | | | |
Payables and accrued charges | | | 83 | | | | | | | | 306 | | | | | |
| | | | | | | | | | | | | | | | |
Subtotal of changes in non-cash operating working capital | | | | | | | (219 | ) | | | | | | | 622 | |
Cash provided by operating activities | | | | | | | 3,485 | | | | | | | | 3,131 | |
| Investing Activities | | | | | | | | | | | | | | | | |
Additions to property, plant and equipment | | | | | | | (2,176 | ) | | | | | | | (2,079 | ) |
Purchase of long-term investments | | | | | | | (3 | ) | | | | | | | (422 | ) |
Other assets and intangible assets | | | | | | | (72 | ) | | | | | | | (71 | ) |
Cash used in investing activities | | | | | | | (2,251 | ) | | | | | | | (2,572 | ) |
Cash before financing activities | | | | | | | 1,234 | | | | | | | | 559 | |
Financing Activities | | | | | | | | | | | | | | | | |
Proceeds from long-term debt obligations | | | | | | | – | | | | | | | | 1,794 | |
Repayment of and finance costs on long-term debt obligations | | | | | | | (607 | ) | | | | | | | (810 | ) |
(Repayments of) proceeds from short-term debt obligations | | | | | | | (445 | ) | | | | | | | 547 | |
Dividends | | | | | | | (208 | ) | | | | | | | (119 | ) |
Repurchase of common shares | | | | | | | – | | | | | | | | (2,000 | ) |
Issuance of common shares | | | | | | | 44 | | | | | | | | 56 | |
Cash used in financing activities | | | | | | | (1,216 | ) | | | | | | | (532 | ) |
Increase in Cash and Cash Equivalents | | | | | | | 18 | | | | | | | | 27 | |
Cash and Cash Equivalents, Beginning of Year | | | | | | | 412 | | | | | | | | 385 | |
Cash and Cash Equivalents, End of Year | | | | | | $ | 430 | | | | | | | $ | 412 | |
Cash and cash equivalents comprised of: | | | | | | | | | | | | | | | | |
Cash | | | | | | $ | 46 | | | | | | | $ | 115 | |
Short-term investments | | | | | | | 384 | | | | | | | | 297 | |
| | | | | | | $ | 430 | | | | | | | $ | 412 | |
Supplemental cash flow disclosure | | | | | | | | | | | | | | | | |
Interest paid | | | | | | $ | 233 | | | | | | | $ | 212 | |
Income taxes paid (recovered) | | | | | | $ | 623 | | | | | | | $ | (45 | ) |
(See Notes to the Consolidated Financial Statements)
| | |
| PotashCorp 2011 Annual Report | | 91 |
Consolidated Statements of Changes in Equity
| | | | | | | | | | | | | | | | | | | | | | | | | | | | | | | | | | | | |
In millions of US dollars | |
| | | Equity Attributable to Common Shareholders 1 | |
| | | | | | | | | Accumulated Other Comprehensive Income | | | | | | | |
| | | Share
Capital | | | Contributed
Surplus | | | Net
unrealized
gains on
available- for-sale
investments | | | Net
unrealized
losses on
derivatives
designated as
cash flow
hedges | | | Net
actuarial
losses on
defined
benefit
plans | | | Other | | | Total
Accumulated
Other
Comprehensive
Income | | | Retained
Earnings | | | Total
Equity | |
Balance – December 31, 2010 | | $ | 1,431 | | | $ | 308 | | | $ | 2,563 | | | $ | (177 | ) | | $ | – | 2 | | $ | 8 | | | $ | 2,394 | | | $ | 2,552 | | | $ | 6,685 | |
Net income | | | – | | | | – | | | | – | | | | – | | | | – | | | | – | | | | – | | | | 3,081 | | | | 3,081 | |
Other comprehensive (loss) income | | | – | | | | – | | | | (1,581 | ) | | | 9 | | | | (136 | ) | | | (6 | ) | | | (1,714 | ) | | | – | | | | (1,714 | ) |
Effect of share-based compensation | | | – | | | | (9 | ) | | | – | | | | – | | | | – | | | | – | | | | – | | | | – | | | | (9 | ) |
Dividends declared | | | – | | | | – | | | | – | | | | – | | | | – | | | | – | | | | – | | | | (240 | ) | | | (240 | ) |
Issuance of common shares | | | 52 | | | | (8 | ) | | | – | | | | – | | | | – | | | | – | | | | – | | | | – | | | | 44 | |
Transfer of actuarial losses on defined benefit plans | | | – | | | | – | | | | – | | | | – | | | | 136 | | | | – | | | | 136 | | | | (136 | ) | | | – | |
Balance – December 31, 2011 | | $ | 1,483 | | | $ | 291 | | | $ | 982 | | | $ | (168 | ) | | $ | – | 2 | | $ | 2 | | | $ | 816 | | | $ | 5,257 | | | $ | 7,847 | |
| 1 | All equity transactions are attributable to common shareholders. |
| 2 | Any amounts incurred during a period are closed out to retained earnings at each period-end. Therefore, no balance exists in the reserve at beginning or end of period. |
| | | | | | | | | | | | | | | | | | | | | | | | | | | | | | | | | | | | |
| | | Equity Attributable to Common Shareholders 1 | |
| | | | | | | | | Accumulated Other Comprehensive Income | | | | | | | |
| | | Share
Capital | | | Contributed
Surplus | | | Unrealized
gains on
available- for-sale
investments | | | Net
unrealized
losses on
derivatives
designated as
cash flow
hedges | | | Net
actuarial
losses on
defined
benefit
plans | | | Other | | | Total
Accumulated
Other
Comprehensive
Income | | | Retained
Earnings | | | Total
Equity | |
Balance – January 1, 2010 | | $ | 1,430 | | | $ | 273 | | | $ | 1,900 | | | $ | (111 | ) | | $ | – | 2 | | $ | 9 | | | $ | 1,798 | | | $ | 2,804 | | | $ | 6,305 | |
Net income | | | – | | | | – | | | | – | | | | – | | | | – | | | | – | | | | – | | | | 1,775 | | | | 1,775 | |
Other comprehensive income (loss) | | | – | | | | – | | | | 663 | | | | (66 | ) | | | (25 | ) | | | (1 | ) | | | 571 | | | | – | | | | 571 | |
Share repurchase | | | (69 | ) | | | (47 | ) | | | – | | | | – | | | | – | | | | – | | | | – | | | | (1,884 | ) | | | (2,000 | ) |
Effect of share-based compensation | | | – | | | | 96 | | | | – | | | | – | | | | – | | | | – | | | | – | | | | – | | | | 96 | |
Dividends declared | | | – | | | | – | | | | – | | | | – | | | | – | | | | – | | | | – | | | | (118 | ) | | | (118 | ) |
Issuance of common shares | | | 70 | | | | (14 | ) | | | – | | | | – | | | | – | | | | – | | | | – | | | | – | | | | 56 | |
Transfer of actuarial losses on defined benefit plans | | | – | | | | – | | | | – | | | | – | | | | 25 | | | | – | | | | 25 | | | | (25 | )�� | | | – | |
Balance – December 31, 2010 | | $ | 1,431 | | | $ | 308 | | | $ | 2,563 | | | $ | (177 | ) | | $ | – | 2 | | $ | 8 | | | $ | 2,394 | | | $ | 2,552 | | | $ | 6,685 | |
| 1 | All equity transactions are attributable to common shareholders. |
| 2 | Any amounts incurred during a period are closed out to retained earnings at each period-end. Therefore, no balance exists in the reserve at beginning or end of period. |
(See Notes to the Consolidated Financial Statements)
| | |
| 92 | | PotashCorp 2011 Annual Report |
Notes
to the PotashCorp 2011
Consolidated Financial Statements
| | | | |
| Note 1 | | Description of Business | | 93 |
| Note 2 | | Basis of Presentation | | 93 |
| Note 3 | | Receivables | | 98 |
| Note 4 | | Inventories | | 98 |
| Note 5 | | Property, Plant and Equipment | | 99 |
| Note 6 | | Investments | | 101 |
| Note 7 | | Other Assets | | 103 |
| Note 8 | | Intangible Assets | | 104 |
| Note 9 | | Short-Term Debt | | 105 |
| Note 10 | | Payables and Accrued Charges | | 106 |
| Note 11 | | Derivative Instruments | | 106 |
| Note 12 | | Long-Term Debt | | 108 |
| Note 13 | | Pension and Other Post-Retirement Benefits | | 109 |
| Note 14 | | Provisions for Asset Retirement, Environmental and Other Obligations | | 114 |
| Note 15 | | Share Capital | | 117 |
| Note 16 | | Segment Information | | 117 |
| Note 17 | | Nature of Expenses | | 119 |
| Note 18 | | Provincial Mining and Other Taxes | | 120 |
| Note 19 | | Other Expenses | | 120 |
| Note 20 | | Finance Costs | | 120 |
| Note 21 | | Income Taxes | | 121 |
| Note 22 | | Net Income per Share | | 124 |
| Note 23 | | Share-Based Compensation | | 124 |
| Note 24 | | Financial Instruments and Related Risk Management | | 128 |
| Note 25 | | Capital Management | | 134 |
| Note 26 | | Commitments | | 135 |
| Note 27 | | Contingencies and Other Matters | | 136 |
| Note 28 | | Guarantees | | 140 |
| Note 29 | | Related Party Transactions | | 141 |
| Note 30 | | Transition to IFRS | | 141 |
| | |
| | | In millions of US dollars except as otherwise noted |
| | | | |
NOTE 1 | | | | DESCRIPTION OF BUSINESS |
With its subsidiaries, Potash Corporation of Saskatchewan Inc. (“PCS”) – together known as “PotashCorp” or “the company” except to the extent the context otherwise requires – forms an integrated fertilizer and related industrial and feed products company. The company has producing assets in the following locations:
| – | | five mines and mills and mining rights to potash reserves at a sixth location (expires December 31, 2012), all in the province of Saskatchewan |
| – | | one mine and mill in the province of New Brunswick |
| – | | a mine and processing plants in the state of North Carolina |
| – | | a mine and two processing plants in the state of Florida |
| – | | a processing plant in the state of Louisiana |
| – | | phosphate feed plants in the states of Nebraska, Illinois, Missouri, North Carolina and Florida |
| – | | an industrial phosphoric acid plant in the state of Ohio |
| – | | three plants, one located in each of the states of Georgia, Louisiana and Ohio |
| – | | large-scale operations in Trinidad |
In North America, the company leases or owns 207 terminal and warehouse facilities, some of which have multi-product capability, for a total of 270 distribution points, and services customers with a fleet of approximately 9,950 railcars. In the offshore market, it leases one warehouse in China and one in Malaysia and has ownership in a joint venture which leases a dry bulk fertilizer port terminal in Brazil. PotashCorp sells potash from its Saskatchewan mines for use outside North America exclusively to Canpotex Limited (“Canpotex”). A potash export, sales and marketing company owned in equal shares by the three producers in Saskatchewan (including the company), Canpotex resells potash to offshore customers. PCS Sales (Canada) Inc. and PCS Sales (USA), Inc., wholly owned subsidiaries of PCS, execute marketing and sales for the company’s potash, phosphate and nitrogen products in North America and offshore marketing and sales for the company’s New Brunswick potash. Phosphate Chemicals Export Association, Inc. (“PhosChem”), a phosphate export association established under United States law, is the principal vehicle through which the company executes offshore marketing and sales for its phosphate fertilizers. PCS Sales (USA), Inc. generally handles offshore marketing and sales for the company’s nitrogen products.
| | | | |
NOTE 2 | | | | BASIS OF PRESENTATION |
The company previously prepared its financial statements in accordance with Canadian generally accepted accounting principles (“Canadian GAAP”) as set out in the Handbook of the Canadian Institute of Chartered Accountants (“CICA Handbook”). In 2010, the CICA Handbook was revised to incorporate International Financial Reporting Standards (“IFRS”), and required publicly accountable enterprises to apply these standards effective for years beginning on or after January 1, 2011, with early adoption permitted. Accordingly, these consolidated financial statements are in accordance with IFRS, as issued by the International Accounting Standards Board (“IASB”). In these consolidated financial statements, the term “Canadian GAAP” refers to Canadian GAAP before the company’s adoption of IFRS.
These consolidated financial statements have been prepared in accordance with IFRS and First-Time Adoption of International Financial Reporting Standards (“IFRS 1”). Subject to certain transition elections disclosed in Note 30, the company has consistently applied the same accounting policies in its opening IFRS statement of financial position as at January 1, 2010 and throughout all periods presented, as if these policies had always been in effect. Note 30 describes the impact of the transition to IFRS on the company’s
reported financial position and financial performance, including the nature and effect of significant changes in accounting policies from those used in its Canadian GAAP consolidated financial statements as at January 1, 2010 and December 31, 2010, and for the year ended December 31, 2010.
The company is a foreign private issuer in the US that voluntarily files its consolidated financial statements with the Securities and Exchange Commission (the “SEC”) on US domestic filer forms. In connection with the company’s transition to IFRS, it is permitted to file two years of financial statements presented in accordance with IFRS, instead of three, in the company’s audited consolidated financial statements. In addition, the company is permitted to file with the SEC its audited consolidated financial statements under IFRS without a reconciliation to US generally accepted accounting principles (“US GAAP”). As a result, the company no longer prepares a reconciliation of its results to US GAAP. It is possible that certain of the company’s accounting policies could be different from US GAAP.
These consolidated financial statements were authorized by the Board of Directors for issue on February 21, 2012.
| | |
| PotashCorp 2011 Annual Report | | 93 |
| | |
| | | In millions of US dollars except as otherwise noted |
NOTE 2 Basis of Presentation continued
These consolidated financial statements were prepared under the historical cost convention, except for certain items not carried at historical cost as discussed in the applicable accounting policies.
Significant Accounting Policies
Principles of consolidation
Subsidiaries are all entities (including special purpose entities) over which the company has the power to govern the financial and operating policies so as to obtain benefits from its activities that generally accompany an equity interest controlling more than one-half of the voting rights. The existence and effect of potential voting rights that are currently exercisable or convertible are considered when assessing whether the company controls another entity. Subsidiaries are fully consolidated from the date on which control is transferred to the company. They are deconsolidated from the date that control ceases. Principal (wholly owned) operating subsidiaries are:
| Ÿ | | PCS Sales (Canada) Inc. |
| | – | | PCS Joint Venture, Ltd. (“PCS Joint Venture”) |
| Ÿ | | PCS Phosphate Company, Inc. (“PCS Phosphate”) |
| | – | | PCS Purified Phosphates |
| Ÿ | | White Springs Agricultural Chemicals, Inc. (“White Springs”) |
| Ÿ | | PCS Nitrogen Fertilizer, L.P. |
| Ÿ | | PCS Nitrogen Ohio, L.P. |
| Ÿ | | PCS Nitrogen Trinidad Limited |
| Ÿ | | PCS Cassidy Lake Company |
All significant intercompany balances and transactions are eliminated.
|
Foreign currency transactions |
Items included in the consolidated financial statements of the company and each of its subsidiaries are measured using the currency of the primary economic environment in which the individual entity operates (“the functional currency”). The consolidated financial statements are presented in United States dollars (“US dollars”), which is the functional currency of the company and the majority of its subsidiaries.
Foreign currency transactions, including Canadian, Trinidadian and Chilean currency operating transactions, are generally translated to US dollars at the average exchange rate for the previous month. Monetary assets and liabilities are translated at period-end exchange rates. Foreign exchange gains and losses resulting from the settlement of such transactions, and from the translation at period-end exchange rates of monetary assets and liabilities denominated in foreign currencies, are recognized in net income in the period in which they arise. Foreign exchange gains and losses are presented in the statements of income within other income or other expenses as applicable.
Translation differences on non-monetary assets and liabilities carried at fair value are recognized as part of changes in fair value. Translation differences on non-monetary financial assets such as investments in equity securities classified as available-for-sale are included in other comprehensive income (“OCI”).
Cash equivalents
Highly liquid investments with a maturity of three months or less from the date of purchase are considered to be cash equivalents.
The company has classified freight and other transportation and distribution costs incurred relating to product inventory stored at warehouse and terminal facilities as prepaid expenses.
Long-lived asset impairment
Assets that have an indefinite useful life (i.e., goodwill) are not subject to amortization and are tested at least annually for impairment (typically in April), or more frequently if events or circumstances indicate there may be an impairment. At the end of each reporting period, the company reviews the carrying amounts of both its long-lived assets to be held and used and its identifiable intangible assets with finite lives to determine whether there is any indication that they have suffered an impairment loss. For assessing impairment, assets are grouped at the lowest levels for which there are separately identifiable cash flows (this can be at the asset or cash-generating unit level). A cash-generating unit is the smallest identifiable group of assets that generates cash inflows which are largely independent of the cash inflows from other assets or groups of assets. If an indication of impairment exists, the recoverable amount of the asset is estimated in order to determine the extent of the impairment loss (if any). An impairment loss is recognized as the amount by which the asset’s carrying amount exceeds its recoverable amount. If the recoverable amount of the cash-generating unit is less than its carrying amount, the impairment loss is allocated first to reduce the carrying amount of any goodwill allocated to the unit and then to the other assets of the unit pro rata on the basis of the carrying amount of each asset in the unit. The recoverable amount is the higher of an asset’s fair value less costs to sell and value in use. In assessing value in use, the estimated future cash flows are discounted to their present value using a pre-tax discount rate that reflects current market assessments of the time value of money and the risks specific to the asset for which the estimates of future cash flows have not been adjusted. Non-financial assets, other than goodwill, that previously suffered an impairment loss are reviewed for possible reversal of the impairment at each reporting date.
| | |
| 94 | | PotashCorp 2011 Annual Report |
| | |
| | | In millions of US dollars except as otherwise noted |
NOTE 2 Basis of Presentation continued
|
Additional accounting policies To facilitate a better understanding of our consolidated financial statements, we have disclosed our significant accounting policies (with the exception of those identified above) throughout the following notes, with the related financial disclosures by major caption: |
|
Accounting Estimates and Judgments |
Certain of the company’s policies involve accounting estimates and judgments because they require the company to make subjective or complex judgments about matters that are inherently uncertain and because of the likelihood that materially different amounts could be reported under different conditions or using different assumptions.
The following section discusses the accounting estimates, judgments and assumptions that the company has made and how they affect the amounts reported in the consolidated financial statements.
In the normal course of business, the company may enter into arrangements that are created to accomplish a narrow and well-defined objective. Any such
special purpose entities (“SPE”) must be consolidated when the substance of the relationship between the company and the SPE indicates that the SPE is controlled by the company. Assessing the substance of such a relationship involves considerable judgment. In addition to the general indicators of control, such as the company’s proportion of voting rights, power to govern the financial and operating policies of the entity and power to appoint or remove the majority of the board of directors, the company considers several additional factors to determine whether in substance it controls the SPE, even in cases where it controls less than half of the voting rights or owns little or none of the SPE’s equity.
|
Long-lived asset impairment |
The impairment process begins with the identification of the appropriate asset or cash-generating unit for purposes of impairment testing. Identification and measurement of any impairment are based on the asset’s recoverable amount, which is the higher of its fair value less costs to sell and its value in use. Value in use is generally based on an estimate of discounted future cash flows. Judgment is required in determining the appropriate discount rate. Assumptions must also be made about future sales, margins and market conditions over the long-term life of the assets or cash-generating units.
The company cannot predict if an event that triggers impairment will occur, when it will occur or how it will affect reported asset amounts. Although estimates are reasonable and consistent with current conditions, internal planning and expected future operations, such estimates are subject to significant uncertainties and judgments. As a result, it is reasonably possible that the amounts reported for asset impairments could be different if different assumptions were used or if market and other conditions were to change. The changes could result in non-cash charges that could materially affect the company’s consolidated financial statements.
Restructuring charges
Plant shutdowns, sales of business units or other corporate restructurings trigger incremental costs to the company (i.e., expenses for employee termination, contract termination and other exit costs). Because such activities are complex processes that can take several months to complete, they involve making and reassessing estimates.
| | |
| PotashCorp 2011 Annual Report | | 95 |
| | |
| | | In millions of US dollars except as otherwise noted |
NOTE 2 Basis of Presentation continued
|
Additional accounting estimates and judgments To facilitate a better understanding of the company’s consolidated financial statements, it has disclosed its significant accounting estimates and judgments (with the exception of those identified above) throughout the following notes with the related financial disclosures by major caption: |
|
Recent Accounting Pronouncements |
The following new standards and amendments or interpretations to existing standards have been published and are mandatory for periods beginning on or after January 1, 2011, or later:
|
IFRS 9, Financial Instruments |
In November 2009, the IASB issued guidance on the classification and measurement of financial assets. Under IFRS 9, financial assets will generally be measured initially at fair value plus particular transaction costs, and subsequently at either amortized cost or fair value. In October 2010, the IASB issued additions to IFRS 9 relating to accounting for financial liabilities. Under the new requirements, an entity choosing to measure a financial liability at fair value will present the portion of any change in its fair value due to changes in the entity’s own credit risk in OCI, rather than within net income. In December 2011, the IASB issued amendments which modify the requirements for transition from International Accounting Standard (“IAS”) 39 to IFRS 9. The modifications introduce new disclosure requirements and eliminate the requirement to restate prior periods. The standard is to be applied prospectively and will be effective for periods commencing on or after January 1, 2015, with earlier application permitted. The company is reviewing the standard to determine the potential impact, if any, on its consolidated financial statements.
Amendments to IFRIC 14, Prepayments of a Minimum Funding Requirement
In November 2009, the International Financial Reporting Interpretations Committee (“IFRIC”) issued amendments to IFRIC 14 relating to the prepayments
of a minimum funding requirement for an employee defined benefit plan. The amendments apply when an entity is subject to minimum funding requirements and makes early contributions to cover those requirements. The amendments permit treating the benefit of such an early payment as an asset. The amendment must be applied from the beginning of the first comparative period presented in the first financial statements in which it is applied. The amendments became effective for periods commencing on or after January 1, 2011. The company has applied these amendments, which had no effect on these consolidated financial statements.
Amendments to IFRS 7, Financial Instruments: Disclosures
In May 2010, the IASB issued amendments to IFRS 7 as part of its annual improvements process. The amendments addressed various requirements relating to the disclosure of financial instruments and became effective for annual periods commencing on or after January 1, 2011. The company has applied these amendments by providing the appropriate disclosures in Note 24 to these consolidated financial statements.
|
Amendments to IFRS 7, Financial Instruments: Disclosures – Transfers of Financial Assets |
In October 2010, the IASB issued amendments to IFRS 7. The amendments require additional disclosures to assist users of financial statements in evaluating the risk exposures relating to transfers of financial assets that are not derecognized or for which the entity has a continuing involvement. The amendments became effective for annual periods beginning on or after July 1, 2011. The company does not typically retain any continuing involvement in financial assets once transferred and the application of these amendments had no effect on these consolidated financial statements.
IFRS 10, Consolidated Financial Statements
In May 2011, the IASB issued guidance establishing principles for the presentation and preparation of consolidated financial statements when an entity controls one or more other entities. IFRS 10 (which supersedes IAS 27 and Standing Interpretations Committee (“SIC”) 12) builds on existing principles by identifying the concept of control as the determining factor in whether an entity should be included within the consolidated financial statements of the parent company. The standard provides additional guidance to help determine control where this is difficult to assess. It is to be applied retrospectively, in most circumstances, and will be effective for annual periods commencing on or after January 1, 2013, with earlier application permitted. The company is reviewing the standard to determine the potential impact, if any, on its consolidated financial statements.
| | |
| 96 | | PotashCorp 2011 Annual Report |
| | |
| | | In millions of US dollars except as otherwise noted |
NOTE 2 Basis of Presentation continued
|
IFRS 11, Joint Arrangements |
In May 2011, the IASB issued guidance establishing principles for financial reporting by parties to a joint arrangement. IFRS 11 (which supersedes IAS 31 and SIC 13) requires a party to a joint arrangement to determine the type of arrangement, either a joint operation or a joint venture, by assessing its rights and obligations arising from the arrangement. The existing policy choice of proportionate consolidation for jointly controlled entities has been eliminated and under IFRS 11, equity accounting is mandatory for participants in joint ventures. The standard is to be applied prospectively and will be effective for annual periods commencing on or after January 1, 2013, with earlier application permitted. The company is reviewing the standard to determine the potential impact, if any, on its consolidated financial statements.
IFRS 12, Disclosure of Interests in Other Entities
In May 2011, the IASB issued guidance relating to the disclosure requirements of interests in other entities. IFRS 12 is a new and comprehensive standard on disclosure requirements for all forms of interest in other entities, including subsidiaries, joint arrangements, associates and unconsolidated structured entities. The standard is to be applied prospectively and will be effective for annual periods commencing on or after January 1, 2013, with earlier application permitted. The company is reviewing the standard to determine the potential impact, if any, on its consolidated financial statements.
|
IFRS 13, Fair Value Measurement |
In May 2011, the IASB issued guidance establishing a single source for fair value measurement. IFRS 13 defines fair value, sets out a framework for measuring it and introduces consistent requirements for disclosures on fair value measurements. It does not determine when an asset, a liability or an entity’s own equity instrument is measured at fair value. Rather, the measurement and disclosure requirements of IFRS 13 apply when another standard requires or permits the item to be measured at fair value, with limited exceptions. The standard is to be applied prospectively and will be effective for annual periods commencing on or after January 1, 2013, with earlier application permitted. The company is reviewing the standard to determine the potential impact, if any, on its consolidated financial statements.
Amendments to IAS 1, Presentation of Financial Statements
In June 2011, the IASB issued amendments to IAS 1 requiring items within OCI that may be reclassified to the profit or loss section of the income statement to be grouped together. The amendments are to be applied retrospectively and will be effective for annual periods commencing on or after July 1, 2012, with earlier application permitted. The company is reviewing these amendments to determine the potential impact, if any, on its consolidated financial statements.
|
Amendments to IAS 19, Employee Benefits |
In June 2011, the IASB issued amendments to IAS 19 relating to the recognition and measurement of post-employment defined benefit expense and termination benefits, and to the disclosures for all employee benefits. The amendments will require remeasurements (actuarial gains and losses and the actual return on plan assets) to be recognized immediately in other comprehensive income and all service cost and interest income (expense) to be recognized immediately in net income. Interest income (expense) will be calculated by applying the discount rate to the net defined benefit asset (liability). The amendments are to be applied retrospectively, except for changes to the carrying value of assets that include capitalized employee benefit costs, which are to be applied prospectively. The amendments will be effective for annual periods commencing on or after January 1, 2013, with earlier application permitted. The company is reviewing these amendments to determine the potential impact, if any, on its consolidated financial statements.
Amendments to IAS 32, Offsetting Financial Assets and Financial Liabilities and IFRS 7, Disclosures
In December 2011, the IASB issued amendments to IAS 32 and IFRS 7 as part of its offsetting project. The amendments clarify certain items regarding offsetting financial assets and financial liabilities and also address common disclosure requirements. The amendments are to be applied retrospectively and will be effective for annual periods commencing on or after January 1, 2013 for IFRS 7 and January 1, 2014 for IAS 32, with earlier application permitted. If IAS 32 is early adopted, the disclosures required by the amendments to IFRS 7 must be provided. The company is reviewing these amendments to determine the potential impact, if any, on its consolidated financial statements.
IFRIC 20, Stripping Costs in the Production Phase of a Surface Mine
In October 2011, the IFRIC issued IFRIC 20 clarifying the requirements for accounting for stripping costs in the production phase of a surface mine. This interpretation clarifies when production stripping should lead to the recognition of an asset and how that asset should be measured, both initially and in subsequent periods. The interpretation will be effective for annual periods commencing on or after January 1, 2013, with earlier application permitted. The company is reviewing this interpretation to determine the potential impact, if any, on its consolidated financial statements.
| | |
| PotashCorp 2011 Annual Report | | 97 |
| | |
| | | In millions of US dollars except as otherwise noted |
Accounting Policies
Trade receivables are recognized initially at fair value and subsequently measured at amortized cost less provision for impairment of trade accounts receivable. Such a provision is established when there is reasonable expectation that the company will not be able to collect all amounts due. The carrying amount of the trade receivables is reduced through the use of the provision for impairment account, and the amount of any increase in the provision for impairment is recognized in the consolidated statements of income. When a trade receivable is uncollectible, it is written off against the provision for impairment account for trade accounts receivable. Subsequent recoveries of amounts previously written off are credited to the consolidated statements of income.
Supporting Information
| | | | | | | | | | | | |
| | | December 31, | | | December 31, | | | January 1, | |
| | | 2011 | | | 2010 | | | 2010 | |
Trade accounts – Canpotex (Note 29) | | $ | 291 | | | $ | 298 | | | $ | 164 | |
– Other | | | 609 | | | | 448 | | | | 264 | |
Less provision for impairment of trade accounts receivable | | | (8 | ) | | | (8 | ) | | | (8 | ) |
| | | 892 | | | | 738 | | | | 420 | |
Margin deposits on derivative instruments | | | 189 | | | | 198 | | | | 109 | |
Income taxes receivable (Note 21) | | | 21 | | | | 46 | | | | 363 | |
Provincial mining and other taxes receivable | | | 44 | | | | – | | | | 235 | |
Other non-trade accounts | | | 49 | | | | 77 | | | | 87 | |
| | | $ | 1,195 | | | $ | 1,059 | | | $ | 1,214 | |
Inventories of finished products, intermediate products, raw materials, and materials and supplies are valued at the lower of cost and net realizable value. Costs, allocated to inventory using the weighted average cost method, include direct acquisition costs, direct costs related to the units of production and a systematic allocation of fixed and variable production overhead, as applicable. Net realizable value for finished products, intermediate products and raw materials is generally considered to be the selling price of the finished product in the ordinary course of business less the estimated costs of completion and estimated costs to make the sale. In certain circumstances, particularly pertaining to the company’s materials and supplies inventories, replacement cost is considered to be the best available measure of net realizable value. Inventory is reviewed monthly to ensure the carrying value does not exceed net realizable value. If so, a writedown is recognized. The writedown may be reversed if the circumstances which caused it no longer exist.
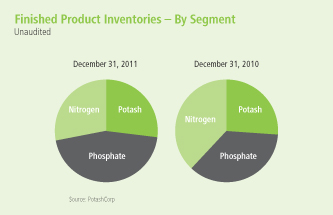
| | |
| 98 | | PotashCorp 2011 Annual Report |
| | |
| | | In millions of US dollars except as otherwise noted |
NOTE 4 Inventories continued
Supporting Information
| | | | | | | | | | | | |
| | | December 31, | | | December 31, | | | January 1, | |
| | | 2011 | | | 2010 | | | 2010 | |
Finished products | | $ | 395 | | | $ | 255 | | | $ | 303 | |
Intermediate products | | | 98 | | | | 127 | | | | 159 | |
Raw materials | | | 91 | | | | 65 | | | | 51 | |
Materials and supplies | | | 147 | | | | 123 | | | | 111 | |
| | | $ | 731 | | | $ | 570 | | | $ | 624 | |
Items affecting cost of goods sold | | | 2011 | | | | 2010 | | | | | |
Expensed inventories | | $ | 3,653 | | | $ | 3,087 | | | | | |
Reserves, reversals and writedowns of inventories | | | 8 | | | | 5 | | | | | |
| | | $ | 3,661 | | | $ | 3,092 | | | | | |
| | | | |
NOTE 5 | | | | PROPERTY, PLANT AND EQUIPMENT |
Property, plant and equipment (which include certain mine development costs, pre-stripping costs and assets under construction) are carried at cost (which includes all expenditures directly attributable to bringing the asset to the location and installing it in working condition for its intended use) less accumulated depreciation less any recognized impairment loss. The cost of property, plant and equipment is reduced by the amount of related investment tax credits to which the company is entitled. Costs of additions, betterments, renewals and borrowings during construction are capitalized. Borrowing costs directly attributable to the acquisition, construction or production of assets that necessarily take a substantial period of time to ready for their intended use are added to the cost of those assets, until such time as the assets are substantially ready for their intended use. The capitalization rate is based on the weighted average interest rate on all of the company’s outstanding third-party debt. All other borrowing costs are charged through finance costs in the period in which they are incurred. Each part of an item of property, plant and equipment with a cost that is significant in relation to the item’s total cost is depreciated separately. When the cost of replacing part of an item of property, plant and equipment is capitalized, the carrying amount of the replaced part is derecognized. The cost of major inspections and overhauls is capitalized and depreciated over the period until the next major inspection or overhaul. Maintenance and repair expenditures that do not improve or extend productive life are expensed in the period incurred.
Any gain or loss arising on the disposal or retirement of an item of property, plant and equipment is determined as the difference between the sale proceeds and the carrying amount of the asset, and is recognized in operating income.
|
| Accounting Estimates and Judgments |
Determination of which costs are directly attributable (e.g., labor, overhead) is a matter of judgment. Capitalization of costs ceases when an item is substantially complete and in the location and condition necessary for it to be capable of operating in the manner intended by management. Determining when an asset, or a portion thereof, meets these criteria requires consideration of the circumstances and the industry in which it is to be operated, normally predetermined by management with reference to such factors as productive capacity. This determination is a matter of judgment that can be complex and subject to differing interpretations and views, particularly when significant capital projects contain multiple phases over an extended period of time.
Certain mining and milling assets are depreciated using the units-of-production method based on the shorter of estimates of reserves or service lives. Pre-stripping costs are depreciated on a units-of-production basis over the ore mined from the mineable acreage stripped. Land is not depreciated. Other asset classes are depreciated on a straight-line basis as follows: land improvements 5 to 40 years, buildings and improvements 4 to 40 years and machinery and equipment (comprised primarily of plant equipment) 20 to 40 years.
Depreciation of assets under construction commences when the assets are ready for their intended use and is subject to management judgment. Their residual values and useful lives are reviewed, and adjusted if appropriate, at the end of each reporting period. Changes in the expected useful life or the expected pattern of consumption of future economic benefits embodied in the asset are accounted for by changing the depreciation period or method, as appropriate, and are treated as changes in accounting estimates.
| | |
| PotashCorp 2011 Annual Report | | 99 |
| | |
| | | In millions of US dollars except as otherwise noted |
NOTE 5 Property, Plant and Equipment continued
The company assesses its existing assets and depreciable lives in connection with the review of mine and plant operating plans at the end of each reporting period. When it is determined that assigned asset lives do not reflect the expected remaining period of benefit, prospective changes are made to their depreciable lives. Uncertainties are inherent in estimating reserve quantities, particularly as they relate to assumptions regarding future prices, the geology of the company’s mines, the mining methods used and the related costs incurred to develop and mine the company’s reserves. Changes in these assumptions could result in material adjustments to reserve estimates, which could result in changes to units-of-production depreciation expense in future periods, particularly if reserve estimates are reduced.
Supporting Information
| | | | | | | | | | | | | | | | | | | | | | | | |
| | | Land and
Improvements | | | Buildings and
Improvements | | | Machinery
and
Equipment | | | Mine
Development
Costs | | | Assets Under
Construction | | | Total | |
Carrying amount – December 31, 2010 | | $ | 332 | | | $ | 1,248 | | | $ | 4,331 | | | $ | 260 | | | $ | 1,970 | | | $ | 8,141 | |
Investment tax credits | | | – | | | | – | | | | (31 | ) | | | – | | | | (41 | ) | | | (72 | ) |
Additions | | | – | | | | 2 | | | | 40 | | | | 141 | | | | 2,202 | | | | 2,385 | |
Disposals | | | – | | | | (10 | ) | | | (1 | ) | | | (1 | ) | | | – | | | | (12 | ) |
Transfers | | | 82 | | | | 842 | | | | 824 | | | | 136 | | | | (1,884 | ) | | | – | |
Depreciation | | | (12 | ) | | | (43 | ) | | | (384 | ) | | | (81 | ) | | | – | | | | (520 | ) |
Carrying amount – December 31, 2011 | | $ | 402 | | | $ | 2,039 | | | $ | 4,779 | | | $ | 455 | | | $ | 2,247 | | | $ | 9,922 | |
Balance at December 31, 2011 comprised of: | | | | | | | | | | | | | | | | | | | | | | | | |
Cost | | $ | 499 | | | $ | 2,345 | | | $ | 7,657 | | | $ | 827 | | | $ | 2,247 | | | $ | 13,575 | |
Accumulated depreciation | | | (97 | ) | | | (306 | ) | | | (2,878 | ) | | | (372 | ) | | | – | | | | (3,653 | ) |
Carrying amount | | $ | 402 | | | $ | 2,039 | | | $ | 4,779 | | | $ | 455 | | | $ | 2,247 | | | $ | 9,922 | |
Carrying amount – January 1, 2010 | | $ | 280 | | | $ | 676 | | | $ | 3,233 | | | $ | 168 | | | $ | 2,087 | | | $ | 6,444 | |
Investment tax credits | | | – | | | | – | | | | – | | | | – | | | | (36 | ) | | | (36 | ) |
Impairment losses | | | – | | | | – | | | | (2 | ) | | | – | | | | – | | | | (2 | ) |
Additions | | | 2 | | | | 12 | | | | 156 | | | | 82 | | | | 1,962 | | | | 2,214 | |
Disposals | | | – | | | | (3 | ) | | | (22 | ) | | | – | | | | – | | | | (25 | ) |
Transfers | | | 59 | | | | 595 | | | | 1,322 | | | | 67 | | | | (2,043 | ) | | | – | |
Depreciation | | | (9 | ) | | | (32 | ) | | | (356 | ) | | | (57 | ) | | | – | | | | (454 | ) |
Carrying amount – December 31, 2010 | | $ | 332 | | | $ | 1,248 | | | $ | 4,331 | | | $ | 260 | | | $ | 1,970 | | | $ | 8,141 | |
Balance at December 31, 2010 comprised of: | | | | | | | | | | | | | | | | | | | | | | | | |
Cost | | $ | 417 | | | $ | 1,513 | | | $ | 6,864 | | | $ | 548 | | | $ | 1,970 | | | $ | 11,312 | |
Accumulated depreciation | | | (85 | ) | | | (265 | ) | | | (2,533 | ) | | | (288 | ) | | | – | | | | (3,171 | ) |
Carrying amount | | $ | 332 | | | $ | 1,248 | | | $ | 4,331 | | | $ | 260 | | | $ | 1,970 | | | $ | 8,141 | |
Balance at January 1, 2010 comprised of: | | | | | | | | | | | | | | | | | | | | | | | | |
Cost | | $ | 356 | | | $ | 911 | | | $ | 5,540 | | | $ | 400 | | | $ | 2,087 | | | $ | 9,294 | |
Accumulated depreciation | | | (76 | ) | | | (235 | ) | | | (2,307 | ) | | | (232 | ) | | | – | | | | (2,850 | ) |
Carrying amount | | $ | 280 | | | $ | 676 | | | $ | 3,233 | | | $ | 168 | | | $ | 2,087 | | | $ | 6,444 | |
| | |
| 100 | | PotashCorp 2011 Annual Report |
| | |
| | | In millions of US dollars except as otherwise noted |
NOTE 5 Property, Plant and Equipment continued
Depreciation of property, plant and equipment included in cost of goods sold and in selling and administrative expenses was $478 in 2011 (2010 – $441). Depreciation of property, plant and equipment included in the cost of property, plant and equipment and inventory was $42 in 2011 (2010 – $13).
Acquiring or constructing property, plant and equipment by incurring a liability does not result in a cash outflow for the company until the liability is paid. In the period the related liability is incurred, the change in operating accounts payable on the consolidated statements of cash flow is typically reduced by such amount. In the period the liability is paid, the amount is reflected as a cash outflow for investing activities. The applicable net change in accounts payable that was reclassified (to) from investing activities to (from) operating activities on the consolidated statements of cash flow in 2011 was $(3) (2010 – $14).
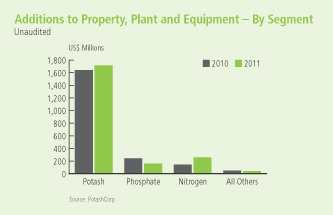
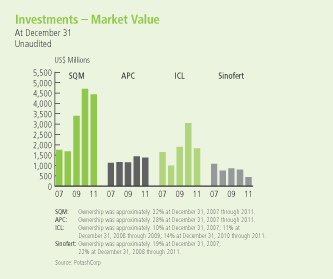
Investments in Equity-Accounted Investees
Investments in which the company exercises significant influence (but does not control) are accounted for using the equity method. Such investees that are not jointly controlled entities are referred to as associates. The company’s interests in jointly controlled entities are also accounted for using the equity method.
These associates and jointly controlled entities follow similar accounting principles and policies to PotashCorp. The proportionate share of any net income or losses from investments accounted for using the equity method, and any gain or loss on disposal, are recorded in net income. The company’s share of its associates’ post-acquisition movements in OCI is recognized in the company’s OCI. The cumulative post-acquisition movements in net income and in OCI are adjusted against the carrying amount of the investment. Dividends received from associates reduce the value of the company’s investment. An impairment test is performed when there is objective evidence of impairment, such as significant adverse changes in the environment in which the equity-accounted investee operates or a significant or prolonged decline in the fair value of the investment below its cost. An impairment loss is recorded when the recoverable amount becomes lower than the carrying amount, recoverable amount being the higher of value in use and fair value less costs to sell. Impairment losses are reversed if the recoverable amount subsequently exceeds the carrying amount.
|
Accounting Estimates and Judgments |
Significant influence is the power to participate in the financial and operating policy decisions of the investee but is not control or joint control over those policies. Judgment is necessary in determining when significant influence exists.
The company’s 22 percent ownership of Sinofert Holdings Limited (“Sinofert”) does not constitute significant influence and its investment is therefore accounted for as an available-for-sale investment.
| | |
| PotashCorp 2011 Annual Report | | 101 |
| | |
| | | In millions of US dollars except as otherwise noted |
NOTE 6 Investments continued
Supporting Information
| | | | | | | | | | | | |
| | | December 31,
2011 | | | December 31,
2010 | | | January 1, 2010 | |
Sociedad Quimica y Minera de Chile S.A. (“SQM”) – 32 percent ownership; quoted market value of $4,429 | | $ | 728 | | | $ | 649 | | | $ | 587 | |
Arab Potash Company Ltd. (“APC”) – 28 percent ownership; quoted market value of $1,383 | | | 433 | | | | 382 | | | | 349 | |
Other | | | 26 | | | | 20 | | | | 19 | |
| | | $ | 1,187 | | | $ | 1,051 | | | $ | 955 | |
Summarized financial information of the company’s associates (SQM, APC, Canpotex and others) is as follows:
| | | | | | | | | | | | |
| | | December 31,
2011 | | | December 31,
2010 | | | January 1, 2010 | |
Current assets | | $ | 3,661 | | | $ | 3,067 | | | $ | 2,629 | |
Non-current assets | | | 2,799 | | | | 2,464 | | | | 2,265 | |
Current liabilities | | | 1,663 | | | | 1,355 | | | | 1,174 | |
Non-current liabilities | | | 1,453 | | | | 1,305 | | | | 1,210 | |
Non-controlling interest | | | 52 | | | | 48 | | | | 46 | |
| | | | | | | | |
| | | 2011 | | | 2010 | |
Sales | | $ | 7,609 | | | $ | 5,642 | |
Gross profit | | | 1,458 | | | | 1,029 | |
Income from continuing operations and net income | | | 989 | | | | 625 | |
Dividends received from these investments in 2011 were $128 (2010 – $79).
Available-for-Sale Investments
Accounting Policies
The fair value of investments designated as available-for-sale is recorded in the consolidated statements of financial position, with unrealized gains and losses, net of related income taxes, recorded in accumulated other comprehensive income (“AOCI”). The cost of investments sold is based on the weighted average method. Realized gains and losses on these investments are removed from AOCI and recorded in net income. The company assesses at the end of each reporting period whether there is objective evidence of impairment. A significant or prolonged decline in the fair value of the investment below its cost would be evidence that the assets are impaired. If objective evidence of impairment were to exist, the impaired amount (i.e., the unrealized loss) would be recognized in net income; any subsequent reversals would be recognized in OCI and would not flow back into net income. See Note 24 for a description of how the company determines fair value for its investments.
Accounting Estimates and Judgments
The determination of when an investment is impaired requires significant judgment. In making this judgment, the company evaluates, among other factors, the duration and extent to which the fair value of the investment is less than its cost.
At December 31, 2011, the company assessed whether there was objective evidence that its investment in Sinofert was impaired. The fair value of this investment, recorded in the consolidated statements of financial position, was $439 compared to the cost of $579. Factors considered in assessing impairment included the length of time and extent to which fair value had been below cost, and current financial and market conditions specific to Sinofert. The company concluded that objective evidence of impairment did not exist as at December 31, 2011 and, as a result, the unrealized holding loss of $140 was included in AOCI. Impairment will be assessed again in future reporting periods if the fair value of the company’s investment in Sinofert is below cost.
| | |
| 102 | | PotashCorp 2011 Annual Report |
| | |
| | | In millions of US dollars except as otherwise noted |
NOTE 6 Investments continued
Supporting Information
| | | | | | | | | | | | |
| | | December 31,
2011 | | | December 31,
2010 | | | January 1, 2010 | |
Israel Chemicals Ltd. (“ICL”) – 14 percent ownership | | $ | 1,826 | | | $ | 3,046 | | | $ | 1,896 | |
Sinofert – 22 percent ownership | | | 439 | | | | 796 | | | | 864 | |
| | | $ | 2,265 | | | $ | 3,842 | | | $ | 2,760 | |
In 2011, the company purchased additional shares in Sinofert for cash consideration of $4, of which $3 was settled during the year. The company’s ownership percentage remained at approximately 22 percent.
Accounting Estimates and Judgments
The costs of certain ammonia catalysts are capitalized to other assets and are amortized, net of residual value, on a straight-line basis over their estimated useful lives of 3 to 10 years.
Upfront lease costs are capitalized to other assets and amortized over the life of the leases on a straight-line basis, the latest of which extends through 2038.
Supporting Information
| | | | | | | | | | | | |
| | | December 31,
2011 | | | December 31,
2010 | | | January 1, 2010 | |
Long-term income taxes receivable (Note 21) | | $ | 117 | | | $ | 122 | | | $ | 78 | |
Investment tax credits receivable | | | 111 | | | | 41 | | | | 46 | |
Ammonia catalysts – net of accumulated amortization of $27 (December 31, 2010 – $17; January 1, 2010 – $9) | | | 37 | | | | 37 | | | | 44 | |
Accrued pension benefit asset (Note 13) | | | 20 | | | | 26 | | | | 29 | |
Upfront lease costs – net of accumulated amortization of $7 (December 31, 2010 – $6; January 1, 2010 – $4) | | | 20 | | | | 21 | | | | 23 | |
Deferred income tax assets (Note 21) | | | 19 | | | | 38 | | | | 31 | |
Derivative instrument assets (Note 11) | | | 6 | | | | – | | | | 3 | |
Other – net of accumulated amortization of $15 (December 31, 2010 – $11; January 1, 2010 – $6) | | | 30 | | | | 18 | | | | 20 | |
| | | $ | 360 | | | $ | 303 | | | $ | 274 | |
Amortization of other assets included in cost of goods sold and in selling and administrative expenses was $9 (2010 – $5).
| | |
| PotashCorp 2011 Annual Report | | 103 |
| | |
| | | In millions of US dollars except as otherwise noted |
Accounting Policies
Intangible assets are recorded initially at cost and relate primarily to production and technology rights, contractual customer relationships, computer software and goodwill. Internally generated intangible assets relate to computer software and other developed projects. An intangible asset is recognized when it is probable that the expected future economic benefits attributable to the asset will flow to the company and the cost of the asset can be measured reliably.
Costs associated with maintaining computer software programs are recognized as an expense as incurred. Development costs that are directly attributable to the design and testing of identifiable and unique software products controlled by the company are recognized as intangible assets when the following criteria are met:
| Ÿ | | It is technically feasible to complete the software product so that it will be available for use; |
| Ÿ | | Management intends to complete the software product and use or sell it; |
| Ÿ | | The software product can be used or sold; |
| Ÿ | | It can be demonstrated how the software product will generate probable future economic benefits; |
| Ÿ | | Adequate technical, financial and other resources to complete the development and to use or sell the software product are available; and |
| Ÿ | | The expenditure attributable to the software product during its development can be reliably measured. |
Directly attributable costs that are capitalized as part of the software product include applicable employee costs. Development costs previously recognized as an expense are not recognized as an asset in a subsequent period.
Amortization expense is recognized in net income in the expense category consistent with the function of the intangible asset. The assets’ useful lives are
reviewed, and adjusted if appropriate, at the end of each reporting period. Changes in the expected useful life or the expected pattern of consumption of future economic benefits embodied in the asset are accounted for by changing the amortization period or method, as appropriate, and are treated as changes in accounting estimates.
All business combinations are accounted for using the purchase method. Identifiable intangible assets are recognized separately from goodwill. Goodwill is carried at cost, is no longer amortized and represents the excess of the cost of an acquisition over the fair value of the company’s share of the net identifiable assets of the acquired subsidiary or equity method investee at the date of acquisition. Separately recognized goodwill is carried at cost less accumulated amortization and impairment losses. Gains and losses on the disposal of an entity include the carrying amount of goodwill relating to the entity sold.
Accounting Estimates and Judgments
An intangible asset is defined as being identifiable, able to bring future economic benefits to the company and controlled by it. An asset meets the identifiability criterion when it is separable or arises from contractual rights. Judgment is necessary to determine whether expenditures made by the company on non-tangible items represent intangible assets eligible for capitalization. Finite-lived intangible assets are accounted for at cost and are amortized on a straight-line basis over their estimated useful lives.
Goodwill is allocated to cash-generating units or groups of cash-generating units for the purpose of impairment testing based on the level at which it is monitored by management, and not at a level higher than an operating segment. The allocation is made to those cash-generating units or groups of cash-generating units that are expected to benefit from the business combination in which the goodwill arose.
| | |
| 104 | | PotashCorp 2011 Annual Report |
| | |
| | | In millions of US dollars except as otherwise noted |
NOTE 8 Intangible Assets continued
|
Supporting Information Goodwill is the only intangible asset with an indefinite useful life recognized by the company. All other intangible assets have finite useful lives. |
| | | | | | | | | | | | |
| | | Goodwill 1 | | | Other | | | Total | |
Carrying amount – December 31, 2010 | | $ | 97 | | | $ | 18 | | | $ | 115 | |
Additions | | | – | | | | 2 | | | | 2 | |
Amortization | | | – | | | | (2 | ) | | | (2 | ) |
Carrying amount – December 31, 2011 | | $ | 97 | | | $ | 18 | | | $ | 115 | |
Balance at December 31, 2011 comprised of: | | | | | | | | | | | | |
Cost | | $ | 104 | | | $ | 55 | | | $ | 159 | |
Accumulated amortization | | | (7 | ) | | | (37 | ) | | | (44 | ) |
Carrying amount | | $ | 97 | | | $ | 18 | | | $ | 115 | |
Carrying amount – January 1, 2010 | | $ | 97 | | | $ | 20 | | | $ | 117 | |
Additions | | | – | | | | 1 | | | | 1 | |
Amortization | | | – | | | | (3 | ) | | | (3 | ) |
Carrying amount – December 31, 2010 | | $ | 97 | | | $ | 18 | | | $ | 115 | |
Balance at December 31, 2010 comprised of: | | | | | | | | | | | | |
Cost | | $ | 104 | | | $ | 53 | | | $ | 157 | |
Accumulated amortization | | | (7 | ) | | | (35 | ) | | | (42 | ) |
Carrying amount | | $ | 97 | | | $ | 18 | | | $ | 115 | |
Balance at January 1, 2010 comprised of: | | | | | | | | | | | | |
Cost | | $ | 104 | | | $ | 51 | | | $ | 155 | |
Accumulated amortization | | | (7 | ) | | | (31 | ) | | | (38 | ) |
Carrying amount | | $ | 97 | | | $ | 20 | | | $ | 117 | |
| 1 | The company’s aggregate carrying amount of goodwill is $97 (December 31, 2010 – $97; January 1, 2010 – $97), representing 1.2 percent of shareholders’ equity at December 31, 2011 (December 31, 2010 – 1.5 percent; January 1, 2010 – 1.5 percent). Substantially all of the company’s recorded goodwill relates to the nitrogen segment. |
| | | | | | | | | | | | |
| | | December 31,
2011 | | | December 31,
2010 | | | January 1,
2010 | |
Commercial paper | | $ | 829 | | | $ | 1,274 | | | $ | 727 | |
The amount available under the commercial paper program is limited to the availability of backup funds under the credit facilities.
The company has a $75 unsecured line of credit available for short-term financing. Net of letters of credit of $23 and direct borrowings of $NIL, $52 was available at December 31, 2011 (December 31, 2010 – $66; January 1, 2010 – $42). The line of credit is available through August 2012.
The line of credit is subject to financial tests and other covenants. The principal covenants require a debt-to-capital ratio of less than or equal to 0.60:1, a long-term-debt-to-EBITDA (as defined in the agreement to be earnings before interest, income taxes, provincial mining and other taxes, depreciation, amortization and other non-cash expenses, and unrealized gains and losses in respect of hedging instruments) ratio of less than or equal to 3.5:1 and debt of subsidiaries not to exceed $650. The line of credit is subject to other customary covenants and events of default, including an event of default for non-payment of other debt in excess of CDN $40. Non-compliance with such covenants could result in accelerated payment of amounts due under the line of credit, and its termination. The company was in compliance with the above-mentioned covenants at December 31, 2011.
| | |
| PotashCorp 2011 Annual Report | | 105 |
| | |
| | | In millions of US dollars except as otherwise noted |
| | | | |
NOTE 10 | | | | PAYABLES AND ACCRUED CHARGES |
| | | | | | | | | | | | |
| | | December 31,
2011 | | | December 31,
2010 | | | January 1, 2010 | |
Trade accounts | | $ | 578 | | | $ | 592 | | | $ | 509 | |
Income taxes (Note 21) | | | 271 | | | | 167 | | | | 17 | |
Accrued compensation | | | 111 | | | | 120 | | | | 45 | |
Deferred revenue | | | 67 | | | | 53 | | | | 34 | |
Dividends | | | 60 | | | | 28 | | | | 30 | |
Accrued interest | | | 42 | | | | 49 | | | | 48 | |
Other taxes | | | 34 | | | | 47 | | | | 9 | |
Current portion of asset retirement obligations and accrued environmental costs (Note 14) | | | 26 | | | | 26 | | | | 40 | |
Accrued deferred share units | | | 25 | | | | 30 | | | | 20 | |
Current portion of pension and other post-retirement benefits (Note 13) | | | 8 | | | | 9 | | | | 8 | |
Other payables and other accrued charges | | | 73 | | | | 77 | | | | 57 | |
| | | $ | 1,295 | | | $ | 1,198 | | | $ | 817 | |
| | | | |
NOTE 11 | | | | DERIVATIVE INSTRUMENTS |
Accounting Policies
Derivative financial instruments are used by the company to manage its exposure to commodity price, exchange rate and interest rate fluctuations. The company recognizes its derivative instruments at fair value on the consolidated statements of financial position where appropriate. Contracts to buy or sell a non-financial item that can be settled net in cash or another financial instrument, or by exchanging financial instruments, as if the contracts were financial instruments (except contracts that were entered into and continue to be held for the purpose of the receipt or delivery of a non-financial item in accordance with expected purchase, sale or usage requirements), are accounted for as derivative financial instruments.
The accounting for changes in the fair value (i.e., gains or losses) of a derivative instrument depends on whether it has been designated and qualifies as part of a hedging relationship. For instruments designated as fair value hedges, the effective portion of the change in the fair value of the derivative is offset in net income against the change in fair value, attributed to the risk being hedged, of the underlying hedged asset, liability or firm commitment. For cash flow hedges, the effective portion of the change in the fair value of the derivative is accumulated in OCI until the variability in cash flows being hedged is recognized in net income in future accounting periods. Ineffective portions of hedges are recorded in net income in the current period. The change in fair value of derivative instruments not designated as hedges is recorded in net income in the current period.
The company’s policy is not to use derivative instruments for trading or speculative purposes, although it may choose not to designate an economic hedging relationship as an accounting hedge. The company formally documents all relationships between hedging instruments and hedged items,
as well as its risk management objective and strategy for undertaking the hedge transaction. This process includes linking derivatives to specific assets and liabilities or to specific firm commitments or forecast transactions. The company also assesses, both at the hedge’s inception and on an ongoing basis, whether the derivatives used in hedging transactions are expected to be or were, as appropriate, highly effective in offsetting changes in fair values of hedged items. Hedge effectiveness related to the company’s natural gas hedges is assessed on a prospective and retrospective basis using regression analyses.
A hedging relationship may be terminated because the hedge ceases to be effective, the underlying asset or liability being hedged is derecognized, or the derivative instrument is no longer designated as a hedging instrument. In such instances, the difference between the fair value and the accrued value of the hedging derivatives upon termination is deferred and recognized in net income on the same basis that gains, losses, revenue and expenses of the previously hedged item are recognized. If a cash flow hedging relationship is terminated because it is no longer probable that the anticipated transaction will occur, then the net gain or loss accumulated in OCI is recognized in current period net income.
Accounting Estimates and Judgments
Most derivative instruments are recorded on the statements of financial position at fair value and must be remeasured at each reporting date; changes in the fair value are recorded in either net income or OCI. Uncertainties, estimates and use of judgment inherent in applying the standards include the assessment of contracts as derivative instruments and for embedded derivatives, application of hedge accounting and valuation of derivatives at fair value (discussed further in Note 24).
| | |
| 106 | | PotashCorp 2011 Annual Report |
| | |
| | | In millions of US dollars except as otherwise noted |
NOTE 11 Derivative Instruments continued
In determining whether a contract represents a derivative or contains an embedded derivative, the most significant area where judgment has been applied pertains to the determination as to whether the contract can be settled net, one of the criteria in determining whether a contract for a non-financial asset is considered a derivative and accounted for as such. Judgment is also applied in determining whether an embedded derivative is closely related to the host contract, in which case bifurcation and separate accounting are not necessary.
To obtain and maintain hedge accounting for its natural gas derivative instruments, the company must be able to establish that the hedging instrument is effective at offsetting the risk of the hedged item both retrospectively and prospectively, and ensure documentation meets stringent requirements. The process to test effectiveness requires the application of judgment and estimation, including determining the number of data points to test to ensure adequate and appropriate measurement to confirm or dispel hedge effectiveness and valuation of data within effectiveness tests where external existing data available do not perfectly match the company’s circumstances. Judgment and estimation are also used to assess credit risk separately in the company’s hedge effectiveness testing.
Supporting Information
Significant recent derivatives included the following:
| Ÿ | | Natural gas futures, swaps and option agreements to manage the cost of natural gas, generally designated as cash flow hedges of anticipated transactions. The portion of gain or loss on derivative instruments designated as cash flow hedges that is deferred in AOCI is reclassified into cost of goods sold when the product containing the hedged item impacts earnings. Any hedge ineffectiveness is recorded in cost of goods sold in the current period. |
| Ÿ | | Foreign currency forward contracts for the primary purpose of limiting exposure to exchange rate fluctuations relating to expenditures denominated in currencies other than the US dollar and foreign currency swap contracts to limit exposure to exchange rate fluctuations relating to Canadian dollar-denominated commercial paper. These contracts are not designated as hedging instruments for accounting purposes. Accordingly, they are recorded at fair value with changes in fair value recognized through other income or other expenses, as applicable, in net income. |
| | | | | | | | | | | | |
| | | December 31, 2011 | |
| | | Assets | | | Liabilities | | | Net | |
Natural gas hedging derivatives | | $ | 6 | | | $ | 271 | | | $ | (265 | ) |
Foreign currency derivatives | | | 4 | | | | – | | | | 4 | |
Total | | | 10 | | | | 271 | | | | (261 | ) |
Less current portion | | | (4 | ) | | | (67 | ) | | | 63 | |
Long-term portion | | $ | 6 | | | $ | 204 | | | $ | (198 | ) |
| | | | | | | | | | | | |
| | | December 31, 2010 | |
| | | Assets | | | Liabilities | | | Net | |
Natural gas hedging derivatives | | $ | – | | | $ | 279 | | | $ | (279 | ) |
Foreign currency derivatives | | | 5 | | | | – | | | | 5 | |
Total | | | 5 | | | | 279 | | | | (274 | ) |
Less current portion | | | (5 | ) | | | (75 | ) | | | 70 | |
Long-term portion | | $ | – | | | $ | 204 | | | $ | (204 | ) |
| | | | | | | | | | | | |
| | | January 1, 2010 | |
| | | Assets | | | Liabilities | | | Net | |
Natural gas hedging derivatives | | $ | 4 | | | $ | 175 | | | $ | (171 | ) |
Foreign currency derivatives | | | 5 | | | | – | | | | 5 | |
Total | | | 9 | | | | 175 | | | | (166 | ) |
Less current portion | | | (6 | ) | | | (52 | ) | | | 46 | |
Long-term portion | | $ | 3 | | | $ | 123 | | | $ | (120 | ) |
As at December 31, 2011, the company had natural gas derivatives qualifying for hedge accounting in the form of swaps, which represented a notional amount of 40 million MMBtu with maturities in 2012 through 2019. At December 31, 2010, the notional amount of swaps was 103 million MMBtu with maturities in 2011 through 2019. At January 1, 2010, the notional amount of swaps was 123 million MMBtu with maturities in 2010 through 2019.
As at December 31, 2011, the company had entered into foreign currency forward contracts to sell US dollars and receive Canadian dollars in the notional amount of $160 (December 31, 2010 – $170, January 1, 2010 – $140) at an average exchange rate of 1.0437 (December 31, 2010 – 1.0170, January 1, 2010 – 1.0681) per US dollar with maturities in 2012. At December 31, 2011, the company had no foreign currency swaps to sell US dollars and receive Canadian dollars (notional amount at December 31, 2010 – $69, January 1, 2010 – $263; average exchange rate at December 31, 2010 – 1.0174, January 1, 2010 – 1.0551 per US dollar).
For the year ended December 31, 2011, losses before taxes of $62 were recognized in OCI (2010 – $191). For the year ended December 31, 2011, losses before taxes of $76 (2010 – $85) were reclassified from AOCI and recognized in cost of goods sold excluding ineffectiveness, which changed these losses by $NIL in both years. Of the losses before taxes at December 31, 2011, approximately $68 (2010 – $76) will be reclassified to cost of goods sold within the next 12 months. See Note 24 for a description of how the company determined fair value for its derivative instruments.
| | |
| PotashCorp 2011 Annual Report | | 107 |
| | |
| | | In millions of US dollars except as otherwise noted |
Accounting Policy
Issue costs of long-term debt obligations and gains and losses on interest rate swaps qualifying for hedge accounting are capitalized to long-term obligations and are amortized to expense over the term of the related liability using the effective interest method.
Supporting Information
| | | | | | | | | | | | |
| | | December 31,
2011 | | | December 31,
2010 | | | January 1,
2010 | |
Senior notes1 | | | | | | | | | | | | |
7.750% notes due May 31, 2011 | | $ | – | | | $ | 600 | | | $ | 600 | |
4.875% notes due March 1, 2013 | | | 250 | | | | 250 | | | | 250 | |
5.250% notes due May 15, 2014 | | | 500 | | | | 500 | | | | 500 | |
3.750% notes due September 30, 2015 | | | 500 | | | | 500 | | | | 500 | |
3.250% notes due December 1, 2017 | | | 500 | | | | 500 | | | | – | |
6.500% notes due May 15, 2019 | | | 500 | | | | 500 | | | | 500 | |
4.875% notes due March 30, 2020 | | | 500 | | | | 500 | | | | 500 | |
5.875% notes due December 1, 2036 | | | 500 | | | | 500 | | | | 500 | |
5.625% notes due December 1, 2040 | | | 500 | | | | 500 | | | | – | |
Other | | | 7 | | | | 7 | | | | 8 | |
| | | 3,757 | | | | 4,357 | | | | 3,358 | |
Less net unamortized debt costs | | | (49 | ) | | | (54 | ) | | | (42 | ) |
Add unamortized interest rate swap gains | | | – | | | | 1 | | | | 2 | |
| | | 3,708 | | | | 4,304 | | | | 3,318 | |
Less current maturities | | | (7 | ) | | | (602 | ) | | | (2 | ) |
Add current portion of amortization | | | 4 | | | | 5 | | | | 3 | |
| | | $ | 3,705 | | | $ | 3,707 | | | $ | 3,319 | |
| 1 | Each series of senior notes is unsecured and has no sinking fund requirements prior to maturity. Each series is redeemable, in whole or in part, at the company’s option, at any time prior to maturity for a price not less than the principal amount of the notes to be redeemed, plus accrued and unpaid interest. Under certain conditions related to a change in control, the company is required to make an offer to purchase all, or any part, of the senior notes other than those maturing in 2013 at 101 percent of the principal amount of the notes repurchased, plus accrued and unpaid interest. |
The company has two long-term revolving credit facilities that provide for unsecured borrowings: a $750 credit facility that matures on May 31, 2013 and a $2,750 credit facility that matures on December 11, 2016. No borrowings were outstanding under these credit facilities at December 31, 2011, December 31, 2010 or January 1, 2010. These credit facilities also backstop the company’s commercial paper program and the availability of borrowings is reduced by the amount of commercial paper outstanding (December 31, 2011 – $829; December 31, 2010 – $1,272; January 1, 2010 – $725). During the year ended December 31, 2011, the company borrowed and repaid $NIL (2010 – $810) under its long-term credit facilities. Interest rates on borrowings under its credit facilities in 2010 ranged from 0.60 percent to 3.75 percent.
Other long-term debt in the above table includes a net financial liability of $6 (December 31, 2010 – $6; January 1, 2010 – $6) pursuant to back-to-back loan arrangements involving certain financial assets and financial liabilities.
The company has presented financial assets of $505 and financial liabilities of $511 on a net basis related to these arrangements because a legal right to set-off exists, and it intends to settle with the same party on a net basis.
The senior notes are not subject to any financial test covenants but are subject to certain customary covenants (including limitations on liens and on sale and leaseback transactions) and events of default, including an event of default for acceleration of other debt in excess of $50. Principal covenants and events of default under the $750 credit facility are the same as those under the line of credit described in Note 9 with the addition of a minimum tangible net worth covenant in an amount greater than or equal to $1,250.
Principal covenants and events of default under the $2,750 credit facility are as follows: a debt-to-capital ratio of less than or equal to 0.60:1, a long-term-debt-to-EBITDA (as defined in the agreement to be earnings before interest, income taxes, provincial mining and other taxes, depreciation, amortization
| | |
| 108 | | PotashCorp 2011 Annual Report |
| | |
| | | In millions of US dollars except as otherwise noted |
NOTE 12 Long-Term Debt continued
and other non-cash expenses, and unrealized gains and losses in respect of hedging instruments) ratio of less than or equal to 3.5:1, debt of subsidiaries not to exceed $1,000 and a $300 permitted lien basket. The credit facility is subject to other customary covenants and events of default, including an event of default for non-payment of other debt in excess of CDN $100. Non-compliance with such covenants could result in accelerated payment of amounts due under the credit facility, and its termination. The back-to-back loan arrangements are not subject to any financial test covenants but are subject to certain customary covenants and events of default, including, for other long-term debt, an event of default for non-payment of other debt in excess of $25. Non-compliance with such covenants could result in accelerated
payment of the related debt. The company was in compliance with the above-mentioned covenants at December 31, 2011.
Long-term debt obligations at December 31, 2011 will mature as follows:
| | | | |
2012 | | $ | 7 | |
2013 | | | 250 | |
2014 | | | 500 | |
2015 | | | 500 | |
2016 | | | – | |
Subsequent years | | | 2,500 | |
| | | $ | 3,757 | |
| | | | |
NOTE 13 | | | | PENSION AND OTHER POST-RETIREMENT BENEFITS |
Accounting Policies
The company offers a number of benefit plans that provide pension and other post-retirement benefits to qualified employees: defined benefit pension plans, supplemental pension plans, defined contribution plans and health, disability, dental and life insurance plans.
Defined benefit plans
The company accrues its obligations under employee benefit plans and the related costs, net of plan assets and unvested prior service costs. The cost of pensions and other retirement benefits earned by employees generally is actuarially determined using the projected unit credit method and management’s best estimate of expected plan investment performance, salary escalation, retirement ages of employees and expected health-care costs. Actuaries perform valuations on a regular basis to determine the actuarial present value of the accrued pension and other post-employment benefits. For the purpose of calculating the expected return on plan assets, such assets are valued at fair value. Prior service costs from plan amendments are deferred and amortized on a straight-line basis over the average period until the benefits become vested. However, to the extent that benefits are already vested, such prior service costs are recognized immediately.
Actuarial gains (losses) arise from the difference between the actual rate of return on plan assets for a period and the expected long-term rate of return on plan assets for that period, or from changes in actuarial assumptions used to determine the defined benefit obligation. The company’s policy is to recognize in OCI all actuarial gains (losses) for defined benefit plans immediately in the period in which they arise.
When the restructuring of a benefit plan simultaneously gives rise to both a curtailment and a settlement of obligation, the curtailment is accounted for prior to the settlement.
Pension and other post-employment benefit expense includes, as applicable, the net of management’s best estimate of the cost of benefits provided, interest cost of projected benefits, expected return on plan assets, prior service costs and the effect of any curtailments or settlements.
Defined contribution plans
Defined contribution plan costs are recognized in net income for services rendered by employees during the period.
Accounting Estimates and Judgments
The company sponsors plans that provide pension and other post-retirement benefits for most of its employees. The calculation of employee benefit plan expenses and obligations depends on assumptions such as discount rates, expected rates of return on assets, health-care cost trend rates, projected salary increases, retirement age, mortality and termination rates. These assumptions are determined by management and are reviewed annually by the company’s independent actuaries.
The company’s discount rate assumption reflects the weighted average interest rate at which the pension and other post-retirement liabilities could be effectively settled at the measurement date. The rate varies by country. The company determines the discount rate using a yield curve approach. Based on the respective plans’ demographics, expected future pension benefits and medical claims payments are measured and discounted to determine the present value of the expected future cash flows. The cash flows are discounted using yields on high-quality AA-rated non-callable bonds with cash flows of similar timing where there is a deep market for such bonds. Where the company does not believe there is a deep market for such bonds (such as for terms in excess of 10 years in Canada), the cash flows are discounted using a yield curve derived from yields on provincial bonds rated AA or better to which a spread adjustment is added to reflect the additional risk of corporate bonds.
| | |
| PotashCorp 2011 Annual Report | | 109 |
| | |
| | | In millions of US dollars except as otherwise noted |
NOTE 13 Pension and Other Post-Retirement Benefits continued
The resulting rates are used by the company to determine the final discount rate. The rate selected for the December 31, 2011 measurement date will be used to determine expense for fiscal 2012 unless significant market fluctuations require an update during 2012, at which time a new rate will be selected.
The expected long-term rate of return on assets is determined using a building block approach. The expected real rate of return for each individual asset class is determined based on expected future performance. These rates are weighted based on the current asset portfolio. A separate determination is made of the underlying impact of expenses, inflation, rebalancing, diversification and the actively managed portfolio premium. The resulting total expected asset return is compared to the historical returns achieved by the portfolio. Based on these input items, the company selects a final rate.
|
| The assumptions used to determine the benefit obligation and expense for the company’s significant plans were as follows (weighted average as of December 31): |
| | | | | | | | | | | | | | | | |
| | | Pension | | | Other | |
| | | 2011 | | | 2010 | | | 2011 | | | 2010 | |
Discount rate – obligation, % | | | 4.60 | | | | 5.45 | | | | 4.60 | | | | 5.45 | |
Discount rate – expense, % | | | 5.45 | 1 | | | 5.85 | | | | 5.45 | 1 | | | 5.85 | |
Long-term rate of return on assets, % | | | 7.00 | | | | 7.00 | | | | n/a | | | | n/a | |
Rate of increase in compensation levels, % | | | 4.00 | | | | 4.00 | | | | n/a | | | | n/a | |
| 1 | Discount rate changed from 5.45 percent to 4.75 percent, effective October 1, 2011, as a result of significant market fluctuations that had occurred since the prior year-end. |
Assumptions regarding future mortality experience are set based on actuarial advice in accordance with published statistics and experience in each country.
The average remaining service period of the active employees covered by the company’s pension plans is 12.4 years (2010 – 11.6 years). The average remaining service period of the active employees covered by the company’s other benefit plans is 12.9 years (2010 – 12.1 years).
The assumed health-care cost trend rate for the company’s significant retiree medical plan is 6 percent. Effective January 1, 2004, the largest retiree medical plan limits the company’s share of annual medical cost increases to 75 percent of the first 6 percent of total medical inflation for recent and future non-union retirees. Any cost increases in excess of this amount are funded by retiree contributions.
Sensitivity of Assumptions
Sensitivity to changes in key assumptions for the company’s pension and other post-retirement benefit plans would have been as follows:
| | | | | | | | | | | | | | | | |
| | | 2011 | | | 2010 | |
| | | Benefit Obligation | | | Expense in
Income
Before Income
Taxes | | | Benefit Obligation | | | Expense in
Income
Before Income
Taxes | |
As reported | | $ | 1,417 | | | | | | | $ | 1,191 | | | | | |
Discount rate | | | | | | | | | | | | | | | | |
Impact of 1.0 percentage point decrease | | | 232 | | | $ | 8 | | | | 179 | | | $ | 1 | |
Impact of 1.0 percentage point increase | | | (183 | ) | | | (7 | ) | | | (149 | ) | | | (4 | ) |
Expected long-term rate of return | | | | | | | | | | | | | | | | |
Impact of 1.0 percentage point decrease | | | n/a | | | | 7 | | | | n/a | | | | 7 | |
Impact of 1.0 percentage point increase | | | n/a | | | | (7 | ) | | | n/a | | | | (5 | ) |
Rate of compensation increase | | | | | | | | | | | | | | | | |
Impact of 1.0 percentage point decrease | | | (24 | ) | | | (3 | ) | | | (19 | ) | | | (1 | ) |
Impact of 1.0 percentage point increase | | | 27 | | | | 3 | | | | 21 | | | | 1 | |
Medical cost trend rate | | | | | | | | | | | | | | | | |
Impact of 1.0 percentage point decrease | | | (32 | ) | | | (3 | ) | | | (38 | ) | | | (4 | ) |
Impact of 1.0 percentage point increase | | | 14 | | | | 4 | | | | 17 | | | | 5 | |
| | |
| 110 | | PotashCorp 2011 Annual Report |
| | |
| | | In millions of US dollars except as otherwise noted |
NOTE 13 Pension and Other Post-Retirement Benefits continued
The above sensitivities are hypothetical and should be used with caution. Changes in amounts based on a 1.0 percentage point variation in assumptions generally cannot be extrapolated because the relationship of the change in assumption to the change in amounts may not be linear. The sensitivities have been calculated independently of changes in other key variables. Changes in one factor may result in changes in another, which could amplify or reduce certain sensitivities.
Supporting Information
Substantially all employees of the company are participants in either a defined contribution or a defined benefit pension plan. Benefits are based on a combination of years of service and/or compensation levels, depending on the plan.
The company has established a supplemental defined benefit retirement income plan for senior management that is unfunded, non-contributory and provides a supplementary pension benefit. It is provided for by charges to earnings sufficient to meet the projected benefit obligation.
United States
Substantially all employees of the company are participants in either a defined contribution or a defined benefit pension plan. Benefits are based on a combination of years of service and compensation levels, depending on the plan. Contributions to the US plans are made to meet or exceed minimum funding requirements of the Employee Retirement Income Security Act of 1974 (“ERISA”) and associated Internal Revenue Service regulations and procedures.
Trinidad
Substantially all employees of the company are participants in both a defined contribution and a defined benefit pension plan. Benefits are based on a combination of years of service and compensation levels, depending on the plan.
Other post-retirement plans
The company provides contributory health-care plans and non-contributory life insurance benefits for certain retired employees. These plans contain certain cost-sharing features such as deductibles and coinsurance, and are unfunded, with benefits subject to change.
Defined benefit plans
The components of total expense recognized in the consolidated statements of income for the company’s pension and other post-retirement benefit plans, computed actuarially, were as follows:
| | | | | | | | | | | | | | | | | | | | | | | | | | | | | | | | | | |
| | | Pension | | | | | Other | | | | | Total | |
| | | 2011 | | | | | 2010 | | | | | 2011 | | | | | 2010 | | | | | 2011 | | | | | 2010 | |
Current service cost for benefits earned during the year | | $ | 24 | | | | | $ | 20 | | | | | $ | 8 | | | | | $ | 7 | | | | | $ | 32 | | | | | $ | 27 | |
Interest cost on benefit obligations | | | 49 | | | | | | 47 | | | | | | 16 | | | | | | 16 | | | | | | 65 | | | | | | 63 | |
Expected return on plan assets | | | (53 | ) | | | | | (47 | ) | | | | | – | | | | | | – | | | | | | (53 | ) | | | | | (47 | ) |
Prior service costs | | | 4 | | | | | | – | | | | | | (1 | ) | | | | | (1 | ) | | | | | 3 | | | | | | (1 | ) |
Plan settlements | | | – | | | | | | (1 | ) | | | | | – | | | | | | – | | | | | | – | | | | | | (1 | ) |
Total expense recognized in net income | | $ | 24 | | | | | $ | 19 | | | | | $ | 23 | | | | | $ | 22 | | | | | $ | 47 | | | | | $ | 41 | |
Of the total expense recognized in net income, $38 (2010 – $33) was included in cost of goods sold and $9 (2010 – $8) in selling and administrative expenses.
(Gains) losses relating to the company’s pension and other post-retirement benefit plans recognized in OCI in the consolidated statements of comprehensive income were as follows:
| | | | | | | | | | | | | | | | | | | | | | | | | | | | | | | | | | |
| | | Pension | | | | | Other | | | | | Total | |
| | | 2011 | | | | | 2010 | | | | | 2011 | | | | | 2010 | | | | | 2011 | | | | | 2010 | |
Actuarial loss on benefit obligations | | $ | 116 | | | | | $ | 66 | | | | | $ | 53 | | | | | $ | 7 | | | | | $ | 169 | | | | | $ | 73 | |
Actuarial loss (gain) on plan assets | | | 42 | | | | | | (37 | ) | | | | | – | | | | | | – | | | | | | 42 | | | | | | (37 | ) |
Total loss recognized in OCI | | $ | 158 | | | | | $ | 29 | | | | | $ | 53 | | | | | $ | 7 | | | | | $ | 211 | | | | | $ | 36 | |
The cumulative amount of actuarial losses recognized in OCI since the company’s adoption of IFRS on January 1, 2010 was $247 at December 31, 2011 (December 31, 2010 – $36; January 1, 2010 – $NIL).
| | |
| PotashCorp 2011 Annual Report | | 111 |
| | |
| | | In millions of US dollars except as otherwise noted |
NOTE 13 Pension and Other Post-Retirement Benefits continued
The change in benefit obligations and the change in plan assets for the above pension and other post-retirement plans were as follows:
| | | | | | | | | | | | | | | | | | | | | | | | | | | | | | | | | | | | |
| | | | | | Pension | | | | | | | | | Other | | | | | | | | | Total | | | | |
| | | Dec 31,
2011 | | | Dec 31,
2010 | | | Jan 1,
2010 | | | Dec 31,
2011 | | | Dec 31,
2010 | | | Jan 1,
2010 | | | Dec 31,
2011 | | | Dec 31,
2010 | | | Jan 1,
2010 | |
Change in benefit obligations | | | | | | | | | | | | | | | | | | | | | | | | | | | | | | | | | | | | |
Balance, beginning of year | | $ | 893 | | | $ | 792 | | | | | | | $ | 298 | | | $ | 276 | | | | | | | $ | 1,191 | | | $ | 1,068 | | | | | |
Current service cost | | | 24 | | | | 20 | | | | | | | | 8 | | | | 7 | | | | | | | | 32 | | | | 27 | | | | | |
Interest cost | | | 49 | | | | 47 | | | | | | | | 16 | | | | 16 | | | | | | | | 65 | | | | 63 | | | | | |
Actuarial loss | | | 116 | | | | 66 | | | | | | | | 53 | | | | 7 | | | | | | | | 169 | | | | 73 | | | | | |
Foreign exchange rate changes | | | 1 | | | | 4 | | | | | | | | (1 | ) | | | 2 | | | | | | | | – | | | | 6 | | | | | |
Contributions by plan participants | | | – | | | | – | | | | | | | | 4 | | | | – | | | | | | | | 4 | | | | – | | | | | |
Benefits paid | | | (38 | ) | | | (35 | ) | | | | | | | (12 | ) | | | (9 | ) | | | | | | | (50 | ) | | | (44 | ) | | | | |
Prior service costs | | | 6 | | | | – | | | | | | | | – | | | | (1 | ) | | | | | | | 6 | | | | (1 | ) | | | | |
Plan settlements | | | – | | | | (1 | ) | | | | | | | – | | | | – | | | | | | | | – | | | | (1 | ) | | | | |
Balance, end of year | | | 1,051 | | | | 893 | | | $ | 792 | | | | 366 | | | | 298 | | | $ | 276 | | | | 1,417 | | | | 1,191 | | | $ | 1,068 | |
Change in plan assets | | | | | | | | | | | | | | | | | | | | | | | | | | | | | | | | | | | | |
Fair value, beginning of year | | | 753 | | | | 649 | | | | | | | | – | | | | – | | | | | | | | 753 | | | | 649 | | | | | |
Expected return on plan assets | | | 53 | | | | 47 | | | | | | | | – | | | | – | | | | | | | | 53 | | | | 47 | | | | | |
Actuarial (loss) gain | | | (42 | ) | | | 37 | | | | | | | | – | | | | – | | | | | | | | (42 | ) | | | 37 | | | | | |
Foreign exchange rate changes | | | 2 | | | | 2 | | | | | | | | – | | | | – | | | | | | | | 2 | | | | 2 | | | | | |
Contributions by plan participants | | | – | | | | – | | | | | | | | 4 | | | | – | | | | | | | | 4 | | | | – | | | | | |
Employer contributions | | | 159 | | | | 54 | | | | | | | | 8 | | | | 9 | | | | | | | | 167 | | | | 63 | | | | | |
Benefits paid | | | (38 | ) | | | (35 | ) | | | | | | | (12 | ) | | | (9 | ) | | | | | | | (50 | ) | | | (44 | ) | | | | |
Plan settlements | | | – | | | | (1 | ) | | | | | | | – | | | | – | | | | | | | | – | | | | (1 | ) | | | | |
Fair value, end of year | | | 887 | | | | 753 | | | | 649 | | | | – | | | | – | | | | – | | | | 887 | | | | 753 | | | | 649 | |
Funded status | | | (164 | ) | | | (140 | ) | | | (143 | ) | | | (366 | ) | | | (298 | ) | | | (276 | ) | | | (530 | ) | | | (438 | ) | | | (419 | ) |
Unvested prior service costs not recognized in statements of financial position | | | 2 | | | | – | | | | – | | | | (12 | ) | | | (13 | ) | | | (15 | ) | | | (10 | ) | | | (13 | ) | | | (15 | ) |
Pension and other post-retirement benefit liabilities | | $ | (162 | ) | | $ | (140 | ) | | $ | (143 | ) | | $ | (378 | ) | | $ | (311 | ) | | $ | (291 | ) | | $ | (540 | ) | | $ | (451 | ) | | $ | (434 | ) |
Balance comprised of: | | | | | | | | | | | | | | | | | | | | | | | | | | | | | | | | | | | | |
Non-current assets | | | | | | | | | | | | | | | | | | | | | | | | | | | | | | | | | | | | |
Other assets (Note 7) | | $ | 20 | | | $ | 26 | | | $ | 29 | | | $ | – | | | $ | – | | | $ | – | | | $ | 20 | | | $ | 26 | | | $ | 29 | |
Current liabilities | | | | | | | | | | | | | | | | | | | | | | | | | | | | | | | | | | | | |
Payables and accrued charges (Note 10) | | | – | | | | – | | | | – | | | | (8 | ) | | | (9 | ) | | | (8 | ) | | | (8 | ) | | | (9 | ) | | | (8 | ) |
Non-current liabilities | | | | | | | | | | | | | | | | | | | | | | | | | | | | | | | | | | | | |
Pension and other post-retirement benefit liabilities | | | (182 | ) | | | (166 | ) | | | (172 | ) | | | (370 | ) | | | (302 | ) | | | (283 | ) | | | (552 | ) | | | (468 | ) | | | (455 | ) |
Pension and other post-retirement benefit liabilities | | $ | (162 | ) | | $ | (140 | ) | | $ | (143 | ) | | $ | (378 | ) | | $ | (311 | ) | | $ | (291 | ) | | $ | (540 | ) | | $ | (451 | ) | | $ | (434 | ) |
|
The present value of funded and unfunded benefit obligations was as follows: | |
| | | | | | Pension | | | | | | | | | Other | | | | | | | | | Total | | | | |
| | | Dec 31,
2011 | | | Dec 31,
2010 | | | Jan 1,
2010 | | | Dec 31,
2011 | | | Dec 31,
2010 | | | Jan 1,
2010 | | | Dec 31,
2011 | | | Dec 31,
2010 | | | Jan 1,
2010 | |
Present value of wholly or partly funded benefit obligations | | $ | 993 | | | $ | 838 | | | $ | 745 | | | $ | – | | | $ | – | | | $ | – | | | $ | 993 | | | $ | 838 | | | $ | 745 | |
Present value of unfunded benefit obligations | | | 58 | | | | 55 | | | | 47 | | | | 366 | | | | 298 | | | | 276 | | | | 424 | | | | 353 | | | | 323 | |
Letters of credit secured certain of the Canadian unfunded defined benefit plan liabilities as at December 31, 2011 and 2010, and January 1, 2010.
| | |
| 112 | | PotashCorp 2011 Annual Report |
| | |
| | | In millions of US dollars except as otherwise noted |
NOTE 13 Pension and Other Post-Retirement Benefits continued
Plan assets
Approximate asset allocations, by asset category, of the company’s significant pension plans were as follows at December 31:
| | | | | | | | | | | | |
| Asset Category | | Target | | | 2011 | | | 2010 | |
Equity securities | | | 65% | | | | 49% | | | | 63% | |
Debt securities | | | 35% | | | | 51% | | | | 37% | |
Total | | | 100% | | | | 100% | | | | 100% | |
The company employs a total return on investment approach whereby a mix of equities and fixed income investments is used to maximize the long-term return of plan assets for a prudent level of risk. Risk tolerance is established through careful consideration of plan liabilities, plan funded status and corporate financial condition. The investment portfolio contains a diversified blend of equity and fixed income investments.
Furthermore, equity investments are diversified across US and non-US stocks, as well as growth, value and small and large capitalizations. US equities are also diversified across actively managed and passively invested portfolios. Other assets such as private equity, real estate and hedge funds are not used at this time. Investment risk is measured and monitored on an ongoing basis through quarterly investment portfolio reviews, annual liability measurements and periodic asset/liability studies. The investment strategy in Trinidad is largely dictated by local investment restrictions (maximum of 50 percent in equities and 20 percent foreign) and asset availability since the local equity market is small and there is little secondary market activity in debt securities.
Defined contribution plans
All of the company’s Canadian salaried employees and certain hourly employees participate in the PCS Inc. Savings Plan and may make voluntary contributions. The company contribution provides a minimum of 3 percent (to a maximum of 6 percent) of salary based on company performance. Its contributions in 2011 were $8 (2010 – $7).
Certain of the company’s Canadian employees participate in the contributory PCS Inc. Pension Plan. The member contributes to the plan at the rate of 5.5 percent of his/her earnings, or such other percentage amount as may be established by a collective agreement, and the company contributes for each
member at the same rate. The member may also elect to make voluntary additional contributions. The company’s contributions in 2011 were $11 (2010 – $9).
All of the company’s US employees may participate in defined contribution savings plans, which are subject to US federal tax limitations and provide for voluntary employee salary deduction contributions. The company contribution provides a minimum of 0 percent (to a maximum of 6 percent) of salary depending on employee contributions and company performance. Its 2011 contributions were $8 (2010 – $7).
Certain of the company’s Trinidad employees participate in a defined contribution plan. The company contributes to the plan at the rate of 4 percent of the earnings of a participating employee. Its contributions in 2011 were $1 (2010 – $1).
Cash payments
Total cash payments for pensions and other post-retirement benefits for 2011, consisting of cash contributed by the company to its funded pension plans, cash payments directly to beneficiaries for its unfunded other benefit plans and cash contributed to its defined contribution plans, were $195 (2010 – $87). Approximately $85 is expected to be contributed by the company to all pension and post-retirement plans during 2012.
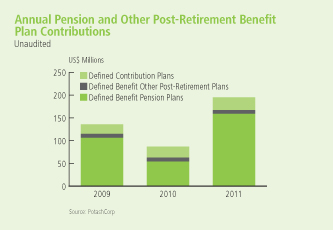
| | |
| PotashCorp 2011 Annual Report | | 113 |
| | |
| | | In millions of US dollars except as otherwise noted |
| | | | |
NOTE 14 | | | | PROVISIONS FOR ASSET RETIREMENT, ENVIRONMENTAL AND OTHER OBLIGATIONS |
Accounting Policies
Provisions are recognized when: the company has a present legal or constructive obligation as a result of past events; it is probable that an outflow of resources will be required to settle the obligation; and the amount has been reliably estimated. Provisions are not recognized for costs that need to be incurred to operate in the future or expected future operating losses.
Provisions are measured at the present value of the expenditures expected to be required to settle the obligation, using a pre-tax risk-free discount rate that reflects current market assessments of the time value of money and the risks specific to the obligation.
Environmental costs that relate to current operations are expensed or capitalized, as appropriate. Environmental costs may be capitalized if they extend the life of the property, increase its capacity, mitigate or prevent contamination from future operations, or relate to legal or constructive asset retirement obligations. Costs that relate to existing conditions caused by past operations and that do not contribute to current or future revenue generation are expensed. Provisions for estimated costs are recorded when environmental remedial efforts are likely and the costs can be reasonably estimated. In determining the provisions, the company uses the most current information available, including similar past experiences, available technology, regulations in effect, the timing of remediation and cost-sharing arrangements.
The company recognizes provisions for decommissioning obligations (also known as asset retirement obligations) primarily related to mining and mineral activities. The major categories of asset retirement obligations are reclamation and restoration costs at the company’s potash and phosphate mining operations, including management of materials generated by mining and mineral processing, such as various mine tailings and gypsum; land reclamation and revegetation programs; decommissioning of underground and surface operating facilities; general cleanup activities aimed at returning the areas to an environmentally acceptable condition; and post-closure care and maintenance.
The present value of a liability for a decommissioning obligation is recognized in the period in which it is incurred if a reasonable estimate of present value can be made. The associated costs are: capitalized as part of the carrying amount of any related long-lived asset and then amortized over its estimated remaining useful life; capitalized as part of inventory; or expensed in the period. The best estimate of the amount required to settle the obligation is reviewed at the end of each reporting period and updated to reflect changes in the discount and foreign exchange rates and the amount or timing of the
underlying cash flows. When there is a change in the best estimate, an adjustment is recorded against the carrying value of the provision and any related asset, and the effect is then recognized in net income over the remaining life of the asset. The increase in the provision due to the passage of time is recognized as a finance cost. A gain or loss may be incurred upon settlement of the liability.
Accounting Estimates and Judgments
The company has recorded provisions relating to asset retirement obligations, environmental and other matters. Most of these costs will not be settled for a number of years, therefore requiring the company to make estimates over a long period. Environmental laws and regulations and interpretations by regulatory authorities could change or circumstances affecting the company’s operations could change, either of which could result in significant changes to its current plans. The recorded provisions are based on the company’s best estimate of costs required to settle the obligations, taking into account the nature, extent and timing of current and proposed reclamation and closure techniques in view of present environmental laws and regulations. It is reasonably possible that the ultimate costs could change in the future and that changes to these estimates could have a material effect on the company’s consolidated financial statements.
The estimation of asset retirement obligation costs depends on the development of environmentally acceptable closure and post-closure plans. In some cases, this may require significant research and development to identify preferred methods for such plans that are economically sound and that, in most cases, may not be implemented for several decades. The company uses appropriate technical resources, including outside consultants, to develop specific site closure and post-closure plans in accordance with the requirements of the various jurisdictions in which it operates. Other than certain land reclamation programs, settlement of the obligations is typically correlated with mine life estimates. Cash flow payments are expected to occur principally over the next 80 years for the company’s phosphate operations. Payments relating to most potash operations are not expected to occur until after that time.
Other environmental obligations generally relate to regulatory compliance, environmental management practices associated with ongoing operations other than mining, site assessment, and remediation of environmental contamination related to the activities of the company and its predecessors, including waste disposal practices and ownership and operation of real property and facilities.
| | |
| 114 | | PotashCorp 2011 Annual Report |
| | |
| | | In millions of US dollars except as otherwise noted |
NOTE 14 Provisions for Asset Retirement, Environmental and Other Obligations continued
Sensitivity of Assumptions
Sensitivity of asset retirement obligations to changes in the discount rate and inflation rate on the recorded liability as at December 31, 2011 is as follows:
| | | | | | | | | | | | | | | | | | | | | | | | |
| | | Undiscounted
Cash Flows | | | Discounted
Cash Flows | | | Discount Rate | | | Inflation Rate | |
| | | | | +0.5% | | | -0.5% | | | +0.5% | | | -0.5% | |
Potash obligation 1 | | $ | 1,030 | 2 | | $ | 28 | | | | $ (3 | ) | | $ | 5 | | | | $ 6 | | | | $ (3 | ) |
Phosphate obligation | | | 1,768 | | | | 587 | | | | (61 | ) | | | 82 | | | | 82 | | | | (62 | ) |
Nitrogen obligation | | | 62 | | | | 2 | | | | – | | | | 1 | | | | 1 | | | | – | |
| 1 | Stated in Canadian dollars. |
| 2 | Represents total undiscounted cash flows in the first year of decommissioning. Excludes subsequent years of tailings dissolution and final decommissioning, which takes an additional 55-264 years. |
Supporting Information
Following is a reconciliation of asset retirement, environmental restoration and other obligations:
| | | | | | | | | | | | | | | | | | | | |
| | | Asset
Retirement
Obligations | | | Environmental
Restoration
Obligations | | | Subtotal | | | Constructive
Obligation for
Donations | | | Total | |
Balance – December 31, 2010 | | $ | 456 | | | $ | 25 | | | $ | 481 | | | $ | 5 | | | $ | 486 | |
Charged (credited) to income: | | | | | | | | | | | | | | | | | | | | |
New obligations | | | 28 | | | | – | | | | 28 | | | | 10 | | | | 38 | |
Change in discount rate | | | 38 | | | | – | | | | 38 | | | | – | | | | 38 | |
Change in other estimates | | | (15 | ) | | | 14 | | | | (1 | ) | | | – | | | | (1 | ) |
Unwinding of discount | | | 16 | | | | – | | | | 16 | | | | – | | | | 16 | |
Capitalized to property, plant and equipment | | | | | | | | | | | | | | | | | | | | |
Change in discount rate | | | 102 | | | | – | | | | 102 | | | | – | | | | 102 | |
Change in other estimates | | | 20 | | | | – | | | | 20 | | | | – | | | | 20 | |
Settled during period | | | (27 | ) | | | (15 | ) | | | (42 | ) | | | (2 | ) | | | (44 | ) |
Exchange differences | | | (1 | ) | | | – | | | | (1 | ) | | | – | | | | (1 | ) |
Balance – December 31, 2011 | | $ | 617 | | | $ | 24 | | | $ | 641 | | | $ | 13 | | | $ | 654 | |
| | | | | |
Balance at December 31, 2011 comprised of: | | | | | | | | | | | | | | | | | | | | |
| | | | | |
Current liabilities | | | | | | | | | | | | | | | | | | | | |
Payables and accrued charges (Note 10) | | $ | 19 | | | $ | 7 | | | $ | 26 | | | $ | 13 | | | $ | 39 | |
Non-current liabilities | | | | | | | | | | | | | | | | | | | | |
Asset retirement obligations and accrued environmental costs | | | 598 | | | | 17 | | | | 615 | | | | – | | | | 615 | |
| | | $ | 617 | | | $ | 24 | | | $ | 641 | | | $ | 13 | | | $ | 654 | |
| | |
| PotashCorp 2011 Annual Report | | 115 |
| | |
| | | In millions of US dollars except as otherwise noted |
NOTE 14 Provisions for Asset Retirement, Environmental and Other Obligations continued
| | | | | | | | | | | | | | | | | | | | |
| | | Asset
Retirement
Obligations | | | Environmental
Restoration
Obligations | | | Subtotal | | | Constructive
Obligation
for
Donations | | | Total | |
Balance – January 1, 2010 | | $ | 309 | | | $ | 31 | | | $ | 340 | | | $ | 2 | | | $ | 342 | |
Charged to income: | | | | | | | | | | | | | | | | | | | | |
New obligations | | | 5 | | | | 3 | | | | 8 | | | | 5 | | | | 13 | |
Change in discount rate | | | 37 | | | | – | | | | 37 | | | | – | | | | 37 | |
Change in other estimates | | | 9 | | | | – | | | | 9 | | | | – | | | | 9 | |
Unwinding of discount | | | 11 | | | | – | | | | 11 | | | | – | | | | 11 | |
Capitalized to property, plant and equipment | | | | | | | | | | | | | | | | | | | | |
Change in discount rate | | | 21 | | | | – | | | | 21 | | | | – | | | | 21 | |
Change in other estimates | | | 86 | | | | – | | | | 86 | | | | – | | | | 86 | |
Settled during period | | | (24 | ) | | | (9 | ) | | | (33 | ) | | | (2 | ) | | | (35 | ) |
Exchange differences | | | 2 | | | | – | | | | 2 | | | | – | | | | 2 | |
Balance – December 31, 2010 | | $ | 456 | | | $ | 25 | | | $ | 481 | | | $ | 5 | | | $ | 486 | |
| | | | | |
Balance at December 31, 2010 comprised of: | | | | | | | | | | | | | | | | | | | | |
| | | | | |
Current liabilities | | | | | | | | | | | | | | | | | | | | |
Payables and accrued charges (Note 10) | | $ | 17 | | | $ | 9 | | | $ | 26 | | | $ | 5 | | | $ | 31 | |
Non-current liabilities | | | | | | | | | | | | | | | | | | | | |
Asset retirement obligations and accrued environmental costs | | | 439 | | | | 16 | | | | 455 | | | | – | | | | 455 | |
| | | $ | 456 | | | $ | 25 | | | $ | 481 | | | $ | 5 | | | $ | 486 | |
| | | | | |
Balance at January 1, 2010 comprised of: | | | | | | | | | | | | | | | | | | | | |
| | | | | |
Current liabilities | | | | | | | | | | | | | | | | | | | | |
Payables and accrued charges (Note 10) | | $ | 22 | | | $ | 18 | | | $ | 40 | | | $ | 2 | | | $ | 42 | |
Non-current liabilities | | | | | | | | | | | | | | | | | | | | |
Asset retirement obligations and accrued environmental costs | | | 287 | | | | 13 | | | | 300 | | | | – | | | | 300 | |
| | | $ | 309 | | | $ | 31 | | | $ | 340 | | | $ | 2 | | | $ | 342 | |
The estimated cash flows required to settle the asset retirement obligations have been discounted at a risk-free rate, specific to the timing of cash flows and the jurisdiction of the obligation. The rate for phosphate operations ranged from 0.97 percent to 2.86 percent at December 31, 2011 (December 31, 2010 – 1.97 percent to 4.34 percent; January 1, 2010 – 2.56 percent to 4.63 percent). The rate for potash operations primarily was 6 percent at December 31, 2011 (December 31, 2010 – 6 percent; January 1, 2010 – 7 percent).
Environmental operating and capital expenditures
Our operations are subject to numerous environmental requirements under federal, provincial, state and local laws and regulations of Canada, the United States, and Trinidad and Tobago. These laws and regulations govern matters
such as air emissions, wastewater discharges, land use and reclamation and solid and hazardous waste management. Many of these laws, regulations and permit requirements are becoming increasingly stringent, and the cost of compliance with these requirements can be expected to rise over time.
The company’s operating expenses, other than costs associated with asset retirement obligations, relating to compliance with environmental laws and regulations governing ongoing operations for 2011 were $131 (2010 – $134).
The company routinely undertakes environmental capital projects. In 2011, capital expenditures of $67 (2010 – $60) were incurred to meet pollution prevention and control objectives and $2 (2010 – $1) were incurred to meet other environmental objectives.
| | |
| 116 | | PotashCorp 2011 Annual Report |
| | |
| | | In millions of US dollars except as otherwise noted |
Authorized
The company is authorized to issue an unlimited number of common shares without par value and an unlimited number of first preferred shares. The common shares are not redeemable or convertible. The first preferred shares may be issued in one or more series with rights and conditions to be determined by the Board of Directors. No first preferred shares have been issued.
Issued
| | | | | | | | |
| | | Number of
Common Shares | | | Consideration | |
Balance, January 1, 2010 | | | 887,926,650 | | | $ | 1,430 | |
Issued under option plans | | | 7,339,116 | | | | 68 | |
Issued for dividend reinvestment plan | | | 46,947 | | | | 2 | |
Repurchased | | | (42,190,020 | ) | | | (69 | ) |
Balance, December 31, 2010 | | | 853,122,693 | | | $ | 1,431 | |
Issued under option plans | | | 5,490,335 | | | | 48 | |
Issued for dividend reinvestment plan | | | 89,963 | | | | 4 | |
Balance, December 31, 2011 | | | 858,702,991 | | | $ | 1,483 | |
| | | | |
NOTE 16 | | | | SEGMENT INFORMATION |
Accounting Policies
Inter-segment sales are made under terms that approximate market value. The accounting policies of the segments are the same as those described in Note 2 and other relevant notes and are measured in a manner consistent with that of the financial statements.
Sales revenue is recognized when the product is shipped, the sales price and costs incurred or to be incurred can be measured reliably, and collectibility is probable. Revenue is recorded based on the FOB mine, plant, warehouse or terminal price, except for certain vessel sales or specific product sales that are shipped on a delivered basis. Transportation costs are recovered from the
customer through sales pricing. Revenue is measured at the fair value of the consideration received or receivable, taking into account the amount of any trade discounts and volume rebates allowed.
The company’s operating segments have been determined based on reports reviewed by the Chief Executive Officer, its chief operating decision maker, that are used to make strategic decisions. The company has three reportable operating segments: potash, phosphate and nitrogen. These operating segments are differentiated by the chemical nutrient contained in the product that each produces.
| | | | | | | | | | | | | | | | | | | | |
2011 | | | | | | | | | | | | | | | | | | | | |
| | | Potash | | | Phosphate | | | Nitrogen | | | All Others | | | Consolidated | |
Sales | | $ | 3,983 | | | $ | 2,478 | | | $ | 2,254 | | | $ | – | | | $ | 8,715 | |
Freight, transportation and distribution | | | (244 | ) | | | (166 | ) | | | (86 | ) | | | – | | | | (496 | ) |
Net sales – third party | | | 3,739 | | | | 2,312 | | | | 2,168 | | | | – | | | | | |
Cost of goods sold | | | (1,017 | ) | | | (1,664 | ) | | | (1,252 | ) | | | – | | | | (3,933 | ) |
Gross margin | | | 2,722 | | | | 648 | | | | 916 | | | | – | | | | 4,286 | |
Depreciation and amortization | | | (142 | ) | | | (207 | ) | | | (132 | ) | | | (8 | ) | | | (489 | ) |
Inter-segment sales | | | – | | | | – | | | | 187 | | | | – | | | | – | |
Cash flows for additions to property, plant and equipment | | | 1,717 | | | | 159 | | | | 260 | | | | 40 | | | | 2,176 | |
| | |
| PotashCorp 2011 Annual Report | | 117 |
| | |
| | | In millions of US dollars except as otherwise noted |
NOTE 16 Segment Information continued
| | | | | | | | | | | | | | | | | | | | |
| 2010 | | | | | | | | | | | | | | | |
| | | Potash | | | Phosphate | | | Nitrogen | | | All Others | | | Consolidated | |
Sales | | $ | 3,001 | | | $ | 1,822 | | | $ | 1,716 | | | $ | – | | | $ | 6,539 | |
Freight, transportation and distribution | | | (259 | ) | | | (144 | ) | | | (85 | ) | | | – | | | | (488 | ) |
Net sales – third party | | | 2,742 | | | | 1,678 | | | | 1,631 | | | | – | | | | | |
Cost of goods sold | | | (926 | ) | | | (1,332 | ) | | | (1,103 | ) | | | – | | | | (3,361 | ) |
Gross margin | | | 1,816 | | | | 346 | | | | 528 | | | | – | | | | 2,690 | |
Depreciation and amortization | | | (125 | ) | | | (197 | ) | | | (119 | ) | | | (8 | ) | | | (449 | ) |
Inter-segment sales | | | – | | | | – | | | | 119 | | | | – | | | | – | |
Cash flows for additions to property, plant and equipment | | | 1,643 | | | | 242 | | | | 144 | | | | 50 | | | | 2,079 | |
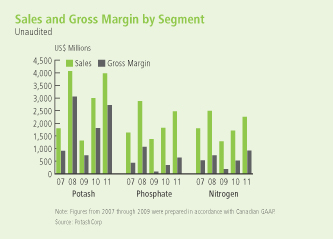
As described in Note 1, Canpotex and PhosChem execute offshore marketing, sales and distribution functions for certain of the company’s products. Financial information by geographic area is summarized in the following table:
| | | | | | | | | | | | | | | | | | | | |
| 2011 | | Country of Origin | |
| | | Canada | | | United States | | | Trinidad | | | Other | | | Consolidated | |
Sales to customers outside the company | | | | | | | | | | | | | | | | | | | | |
Canada | | $ | 142 | | | $ | 183 | | | $ | – | | | $ | – | | | $ | 325 | |
United States | | | 1,580 | | | | 2,576 | | | | 819 | | | | – | | | | 4,975 | |
Canpotex (Canpotex’s 2011 sales volumes were made to: Latin America 26%, India 9%, China 17%, other Asian countries 43%, other countries 5%) | | | 1,956 | | | | – | | | | – | | | | – | | | | 1,956 | |
PhosChem (PhosChem’s 2011 sales volumes were made to: India 54%, Latin America 27%, China NIL%, other countries 11%, other Asian countries 8%) | | | – | | | | 563 | | | | – | | | | – | | | | 563 | |
Mexico | | | 19 | | | | 114 | | | | 14 | | | | – | | | | 147 | |
Brazil | | | 160 | | | | 50 | | | | 9 | | | | – | | | | 219 | |
Colombia | | | 42 | | | | 8 | | | | 80 | | | | – | | | | 130 | |
Other Latin America | | | 84 | | | | 42 | | | | 242 | | | | – | | | | 368 | |
Other | | | – | | | | 23 | | | | 9 | | | | – | | | | 32 | |
| | | $ | 3,983 | | | $ | 3,559 | | | $ | 1,173 | | | $ | – | | | $ | 8,715 | |
Non-current assets 1 | | $ | 6,783 | | | $ | 2,775 | | | $ | 660 | | | $ | 23 | | | $ | 10,241 | |
| 1 | Includes non-current assets other than financial instruments, deferred tax assets and post-employment benefit assets. |
| | |
| 118 | | PotashCorp 2011 Annual Report |
| | |
| | | In millions of US dollars except as otherwise noted |
NOTE 16 Segment Information continued
| | | | | | | | | | | | | | | | | | | | |
| 2010 | | Country of Origin | |
| | | Canada | | | United States | | | Trinidad | | | Other | | | Consolidated | |
Sales to customers outside the company | | | | | | | | | | | | | | | | | | | | |
Canada | | $ | 138 | | | $ | 103 | | | $ | – | | | $ | – | | | $ | 241 | |
United States | | | 1,315 | | | | 2,074 | | | | 638 | | | | – | | | | 4,027 | |
Canpotex (Canpotex’s 2010 sales volumes were made to: Latin America 25%, India 14%, China 14%, other Asian countries 41%, other countries 6%) | | | 1,273 | | | | – | | | | – | | | | – | | | | 1,273 | |
PhosChem (PhosChem’s 2010 sales volumes were made to: India 58%, Latin America 20%, China 2%, other countries 11%, other Asian countries 9%) | | | – | | | | 396 | | | | – | | | | – | | | | 396 | |
Mexico | | | 19 | | | | 75 | | | | 2 | | | | – | | | | 96 | |
Brazil | | | 134 | | | | 34 | | | | – | | | | – | | | | 168 | |
Colombia | | | 38 | | | | 13 | | | | 70 | | | | – | | | | 121 | |
Other Latin America | | | 79 | | | | 37 | | | | 66 | | | | – | | | | 182 | |
Other | | | 5 | | | | 22 | | | | 8 | | | | – | | | | 35 | |
| | | $ | 3,001 | | | $ | 2,754 | | | $ | 784 | | | $ | – | | | $ | 6,539 | |
Non-current assets 1 | | $ | 5,246 | | | $ | 2,575 | | | $ | 633 | | | $ | – | | | $ | 8,454 | |
| 1 | Includes non-current assets other than financial instruments, deferred tax assets and post-employment benefit assets. |
| | | | |
NOTE 17 | | | | NATURE OF EXPENSES |
| | | | |
Accounting Policies
The primary components of cost of goods sold are labor, employee benefits, services, raw materials (including inbound freight and purchasing and receiving costs), operating supplies, energy costs, royalties, property and miscellaneous taxes, and depreciation and amortization.
The primary components of selling and administrative expenses are compensation, other employee benefits, supplies, communications, travel, professional services, and depreciation and amortization.
| | | | | | | | | | | | |
| 2011 | | Cost of
Goods Sold | | | Selling and
Administrative
Expenses | | | Total | |
Employee costs | | $ | 611 | | | $ | 98 | | | $ | 709 | |
Depreciation and amortization | | | 483 | | | | 6 | | | | 489 | |
Other | | | 2,839 | | | | 113 | | | | 2,952 | |
Total | | $ | 3,933 | | | $ | 217 | | | $ | 4,150 | |
| | | | | | | | | | | | |
| 2010 | | Cost of
Goods Sold | | | Selling and
Administrative
Expenses | | | Total | |
Employee costs | | $ | 604 | | | $ | 128 | | | $ | 732 | |
Depreciation and amortization | | | 441 | | | | 8 | | | | 449 | |
Other | | | 2,316 | | | | 92 | | | | 2,408 | |
Total | | $ | 3,361 | | | $ | 228 | | | $ | 3,589 | |
| | |
| PotashCorp 2011 Annual Report | | 119 |
| | |
| | | In millions of US dollars except as otherwise noted |
| | | | |
NOTE 18 | | | | PROVINCIAL MINING AND OTHER TAXES |
| | | | | | | | |
| | | 2011 | | | 2010 | |
Saskatchewan resource surcharge and other | | $ | 108 | | | $ | 77 | |
Potash Production Tax | | | 39 | | | | – | |
| | | $ | 147 | | | $ | 77 | |
| | | | | | | | |
| | | 2011 | | | 2010 | |
Foreign exchange (gain) loss | | $ | (7 | ) | | $ | 17 | |
Takeover response costs | | | 2 | | | | 73 | |
Other | | | 18 | | | | 35 | |
| | | $ | 13 | | | $ | 125 | |
Included in takeover response costs are financial advisory, legal and other fees incurred relating to PotashCorp’s response to an unsolicited offer made in August 2010 to purchase all of its outstanding common shares. The offer was withdrawn in November 2010.
| | | | | | | | |
| | | 2011 | | | 2010 | |
Interest expense on | | | | | | | | |
Short-term debt | | $ | 8 | | | $ | 8 | |
Long-term debt | | | 227 | | | | 217 | |
Unwinding of discount on asset retirement obligations (Note 14) | | | 16 | | | | 11 | |
Borrowing costs capitalized to property, plant and equipment | | | (84 | ) | | | (107 | ) |
Interest income | | | (8 | ) | | | (8 | ) |
| | | $ | 159 | | | $ | 121 | |
Borrowing costs capitalized to property, plant and equipment during the year were calculated by applying a capitalization rate of 4.4 percent in 2011 (2010 – 5.0 percent) to expenditures on qualifying assets.
| | |
| 120 | | PotashCorp 2011 Annual Report |
| | |
| | | In millions of US dollars except as otherwise noted |
Accounting Policies
Taxation on earnings comprises current and deferred income tax. Taxation is recognized in the statements of income except to the extent that it relates to items recognized in OCI or contributed surplus, in which case the tax is recognized in OCI or contributed surplus as applicable.
Current income tax is generally the expected tax payable on the taxable income for the year calculated using rates enacted or substantively enacted at the statements of financial position date in the countries where the company’s subsidiaries and equity-accounted investees operate and generate taxable income. It includes any adjustment to income tax payable or recoverable in respect of previous years. The realized and unrealized excess tax benefit from share-based payment arrangements is recognized in contributed surplus as either current tax (realized amounts) or deferred tax (unrealized amounts).
Uncertain income tax positions are accounted for using the standards applicable to current income tax liabilities and assets; i.e., both liabilities and assets are recorded when probable and measured at the amount expected to be paid to (recovered from) the taxation authorities using the company’s best estimate of the amount.
Deferred income tax is recognized using the liability method, based on temporary differences between consolidated financial statements carrying amounts of assets and liabilities and their respective income tax bases. Deferred income tax is determined using tax rates that have been enacted or substantively enacted by the statement of financial position date and are expected to apply when the related deferred income tax asset is realized or the deferred income tax liability is settled. The tax effect of certain temporary differences is not recognized, principally with respect to temporary differences relating to investments in subsidiaries, jointly controlled entities and equity-accounted investees where the company is able to control the reversal of the temporary difference and that difference is not expected to reverse in the foreseeable future. Deferred income tax is not accounted for if it arises from initial recognition of an asset or liability in a transaction other than a business combination that at the time of the transaction affects neither accounting nor taxable profit or loss. The amount of deferred income tax recognized is based on the expected manner and timing of realization or settlement of the carrying amount of assets and liabilities. Deferred income tax assets are recognized only to the extent that it is probable that future taxable profit will be available against which the temporary differences can be utilized. Deferred income tax
assets are reviewed at each statement of financial position date and amended to the extent that it is no longer probable that the related tax benefit will be realized.
Current income tax assets and liabilities are offset when the company has a legally enforceable right to offset the recognized amounts and intends either to settle on a net basis, or to realize the asset and settle the liability simultaneously. Normally, the company would only have a legally enforceable right to set off a current tax asset against a current tax liability when they relate to income taxes levied by the same taxation authority and the authority permits the company to make or receive a single net payment. Deferred income tax assets and liabilities are offset when the company has a legally enforceable right to set off current tax assets against current tax liabilities and the deferred tax assets and liabilities relate to income taxes levied by the same taxation authority on either: (1) the same taxable entity; or (2) different taxable entities which intend either to settle current tax liabilities and assets on a net basis, or to realize the assets and settle the liabilities simultaneously in each future period in which significant amounts of deferred tax liabilities or assets are expected to be settled or recovered.
Accounting Estimates and Judgments
The company operates in a specialized industry and in several tax jurisdictions. As a result, its income is subject to various rates of taxation. The breadth of its operations and the global complexity of tax regulations require assessments of uncertainties and judgments in estimating the taxes the company will ultimately pay. The final taxes paid are dependent upon many factors, including negotiations with taxing authorities in various jurisdictions, outcomes of tax litigation and resolution of disputes arising from federal, provincial, state and local tax audits. The resolution of these uncertainties and the associated final taxes may result in adjustments to the company’s tax assets and tax liabilities.
The company estimates deferred income taxes based upon temporary differences between the assets and liabilities that it reports in its consolidated financial statements and the tax bases of its assets and liabilities as determined under applicable tax laws. The amount of deferred tax assets recognized is generally limited to the extent that it is probable that taxable profit will be available against which the related deductible temporary differences can be utilized. Therefore, the amount of the deferred income tax asset recognized and considered realizable could be reduced if projected income is not achieved.
| | |
| PotashCorp 2011 Annual Report | | 121 |
| | |
| | | In millions of US dollars except as otherwise noted |
NOTE 21 Income Taxes continued
Supporting Information
|
Income taxes in net income The provision for income taxes differs from the amount that would have resulted from applying the Canadian statutory income tax rates to income before income taxes as follows: |
| | | | | | | | |
| | | 2011 | | | 2010 | |
Income before income taxes: | | | | | | | | |
Canada | | $ | 2,355 | | | $ | 1,274 | |
United States | | | 957 | | | | 562 | |
Trinidad | | | 430 | | | | 285 | |
Other | | | 405 | | | | 355 | |
| | | $ | 4,147 | | | $ | 2,476 | |
Canadian federal and provincial statutory income tax rate | | | 28.31% | | | | 29.94% | |
Income tax at statutory rates | | $ | 1,174 | | | $ | 741 | |
Adjusted for the effect of: | | | | | | | | |
Non-taxable income | | | (106 | ) | | | (95 | ) |
Production-related deductions | | | (68 | ) | | | (35 | ) |
Tax rate differential on temporary differences | | | (20 | ) | | | (18 | ) |
Income tax recoveries in a foreign jurisdiction | | | (14 | ) | | | – | |
Additional tax deductions | | | (12 | ) | | | (12 | ) |
Impact of foreign tax rates | | | 82 | | | | 35 | |
Adjustment to prior years’ deferred taxes | | | 26 | | | | 9 | |
Share-based compensation | | | 11 | | | | 3 | |
Withholding taxes | | | 2 | | | | 11 | |
Prior year provision to income tax returns filed | | | 1 | | | | 36 | |
Other | | | (10 | ) | | | 26 | |
Income tax expense included in net income | | $ | 1,066 | | | $ | 701 | |
The decrease in the Canadian federal and provincial statutory income tax rate from 2010 to 2011 was the result of legislated decreases in federal and New Brunswick income tax rates.
Total income tax expense, included in net income, was comprised of the following:
| | | | | | | | |
| | | 2011 | | | 2010 | |
Current income tax: | | | | | | | | |
Current income tax on profits for the year | | $ | 794 | | | $ | 434 | |
Adjustments in respect of prior years | | | (65 | ) | | | 90 | |
Total current income tax expense | | | 729 | | | | 524 | |
Deferred income tax: | | | | | | | | |
Origination and reversal of temporary differences | | | 271 | | | | 205 | |
Adjustments in respect of prior years | | | 52 | | | | (28 | ) |
Impact of tax rate changes | | | 7 | | | | – | |
Impact of a writedown of a deferred tax asset | | | 7 | | | | – | |
Total deferred income tax expense | | | 337 | | | | 177 | |
Income tax expense included in net income | | $ | 1,066 | | | $ | 701 | |
Income taxes in contributed surplus
The income taxes charged (credited) to contributed surplus were:
| | | | | | | | |
| | | 2011 | | | 2010 | |
Share-based compensation excess tax benefit: | | | | | | | | |
Current income tax (realized) | | $ | (29 | ) | | $ | (45 | ) |
Deferred income tax (unrealized) | | | 62 | | | | (27 | ) |
Total income tax charged (credited) to contributed surplus | | $ | 33 | | | $ | (72 | ) |
Income tax balances
Income tax balances within the consolidated statements of financial position were comprised of the following:
| | | | | | | | | | | | | | |
| Income Tax Assets (Liabilities) | | Statements of Financial Position Location | | Dec 31,
2011 | | | Dec 31,
2010 | | | Jan 1,
2010 | |
Current income tax assets: | | | | | | | | | | | | | | |
Current | | Receivables (Note 3) | | $ | 21 | | | $ | 46 | | | $ | 363 | |
Non-current | | Other assets (Note 7) | | | 117 | | | | 122 | | | | 78 | |
Deferred income tax assets | | Other assets (Note 7) | | | 19 | | | | 38 | | | | 31 | |
Total income tax assets | | | | $ | 157 | | | $ | 206 | | | $ | 472 | |
Current income tax liabilities: | | | | | | | | | | | | | | |
Current | | Payables and accrued charges (Note 10) | | $ | (271 | ) | | $ | (167 | ) | | $ | (17 | ) |
Non-current | | Other non-current liabilities and deferred credits | | | (85 | ) | | | (142 | ) | | | (95 | ) |
Deferred income tax liabilities | | Deferred income tax liabilities | | | (1,052 | ) | | | (737 | ) | | | (643 | ) |
Total income tax liabilities | | | | $ | (1,408 | ) | | $ | (1,046 | ) | | $ | (755 | ) |
| | |
| 122 | | PotashCorp 2011 Annual Report |
| | |
| | | In millions of US dollars except as otherwise noted |
NOTE 21 Income Taxes continued
Deferred income taxes
In respect of each type of temporary difference, unused tax loss and unused tax credit, the amounts of deferred tax assets and liabilities recognized in the statements of financial position and the amount of the deferred tax recovery or expense recognized in net income were:
| | | | | | | | | | | | | | | | | | | | |
| | | Deferred Income Tax Assets
(Liabilities) | | | Deferred Tax
Recovery (Expense)
Recognized in Net Income | |
| | | Dec 31,
2011 | | | Dec 31,
2010 | | | Jan 1,
2010 | | | 2011 | | | 2010 | |
Deferred income tax assets: | | | | | | | | | | | | | | | | | | | | |
Tax loss and other carryforwards | | $ | 58 | | | $ | 94 | | | $ | 72 | | | $ | (35 | ) | | $ | 22 | |
Asset retirement obligations and accrued environmental costs | | | 124 | | | | 95 | | | | 53 | | | | 29 | | | | 42 | |
Derivative instrument liabilities | | | 101 | | | | 106 | | | | 66 | | | | – | | | | – | |
Inventories | | | 57 | | | | 39 | | | | 60 | | | | 18 | | | | (21 | ) |
Post-retirement benefits and share-based compensation | | | 275 | | | | 315 | | | | 284 | | | | (53 | ) | | | (7 | ) |
Other assets | | | 20 | | | | 30 | | | | 20 | | | | (8 | ) | | | 6 | |
Deferred income tax liabilities: | | | | | | | | | | | | | | | | | | | | |
Property, plant and equipment | | | (1,632 | ) | | | (1,321 | ) | | | (1,109 | ) | | | (311 | ) | | | (212 | ) |
Investments in equity-accounted investees | | | (21 | ) | | | (18 | ) | | | (15 | ) | | | (4 | ) | | | (3 | ) |
Long-term debt | | | (7 | ) | | | (29 | ) | | | (29 | ) | | | 22 | | | | – | |
Other liabilities | | | (8 | ) | | | (10 | ) | | | (14 | ) | | | 5 | | | | (4 | ) |
| | | $ | (1,033 | ) | | $ | (699 | ) | | $ | (612 | ) | | $ | (337 | ) | | $ | (177 | ) |
Reconciliation of net deferred income tax liabilities:
| | | | | | | | |
| | | 2011 | | | 2010 | |
January 1 | | $ | (699 | ) | | $ | (612 | ) |
Income tax charge recognized in the statements of income | | | (337 | ) | | | (177 | ) |
Income tax (charge) credit recognized in contributed surplus | | | (62 | ) | | | 27 | |
Income tax credit recognized in OCI | | | 70 | | | | 51 | |
Foreign exchange and other | | | (5 | ) | | | 12 | |
December 31 | | $ | (1,033 | ) | | $ | (699 | ) |
Amounts and expiry dates of unused tax losses and unused tax credits as at December 31, 2011 were:
| | | | | | | | |
| | | Amount | | | Expiry Date | |
Unused tax losses | | | | | | | | |
Operating | | $ | 203 | | | | None | |
Capital | | $ | 362 | | | | None | |
Unused tax credits | | | | | | | | |
Investment tax credits | | $ | 54 | | | | 2012-2019 | |
Alternative minimum tax | | $ | 14 | | | | None | |
The unused tax losses and credits with no expiry dates can be carried forward indefinitely.
Deferred tax assets are recognized for tax loss carryforwards to the extent that the realization of the related tax benefit through future taxable profits is probable. At December 31, 2011, the company had $343 of tax losses and deductible temporary differences for which it did not recognize deferred tax assets.
The company has determined that it is probable that all recognized deferred income tax assets will be realized through a combination of future reversals of temporary differences and taxable income.
The aggregate amount of temporary differences associated with investments in subsidiaries and equity-accounted investees, for which deferred tax liabilities have not been recognized, as at December 31, 2011 was $4,361 (December 31, 2010 – $5,098; January 1, 2010 –$3,776).
| | |
| PotashCorp 2011 Annual Report | | 123 |
| | |
| | | In millions of US dollars except as otherwise noted |
| | | | |
NOTE 22 | | | | NET INCOME PER SHARE |
| | | | | | | | |
| | | 2011 | | | 2010 | |
Basic net income per share1 | | | | | | | | |
Net income available to common shareholders | | $ | 3,081 | | | $ | 1,775 | |
Weighted average number of common shares | | | 855,677,000 | | | | 886,371,000 | |
Basic net income per share | | $ | 3.60 | | | $ | 2.00 | |
Diluted net income per share1 | | | | | | | | |
Net income available to common shareholders | | $ | 3,081 | | | $ | 1,775 | |
Weighted average number of common shares | | | 855,677,000 | | | | 886,371,000 | |
Dilutive effect of stock options | | | 20,960,000 | | | | 24,722,000 | |
Weighted average number of diluted common shares | | | 876,637,000 | | | | 911,093,000 | |
Diluted net income per share | | $ | 3.51 | | | $ | 1.95 | |
| 1 | Net income per share calculations are based on dollar and share amounts each rounded to the nearest thousand. |
Diluted net income per share is calculated based on the weighted average number of shares issued and outstanding during the year, incorporating the following adjustments. The denominator is: (1) increased by the total of the additional common shares that would have been issued assuming exercise of all stock options with exercise prices at or below the average market price for the year; and (2) decreased by the number of shares that the company could have repurchased if it had used the assumed proceeds from the exercise of stock options to repurchase them on the open market at the average share price for the year. For performance-based stock option plans, the number of contingently issuable common shares included in the calculation is based on the number of shares, if any, that would be issuable if the end of the reporting period were the end of the performance period and the effect were dilutive.
Excluded from the calculation of diluted net income per share were weighted average options outstanding of 2,519,300 relating to the 2011 and 2008 Performance Option Plans (2010 – 1,441,050 relating to the 2008 Performance Option Plan) as the options’ exercise prices were greater than the average market price of common shares for the year.
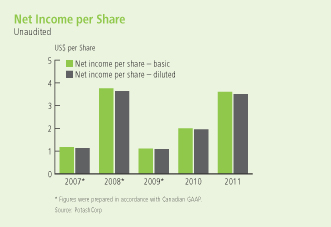
| | | | |
NOTE 23 | | | | SHARE-BASED COMPENSATION |
Accounting Policies
Grants under the company’s share-based compensation plans are accounted for in accordance with the fair value-based method of accounting. For stock option plans that will settle through the issuance of equity, the fair value of stock options is determined on their grant date using a valuation model and recorded as compensation expense over the period that the stock options vest, with a corresponding increase to contributed surplus. Forfeitures are estimated throughout the vesting period based on past experience and future expectations, and adjusted upon actual option vesting. When stock options are exercised, the proceeds, together with the amount recorded in contributed surplus, are recorded in share capital.
Share-based plans that are likely to settle in cash or other assets are accounted for as liabilities based on the fair value of the awards each period. The compensation expense is accrued over the vesting period of the award. Fluctuations in the fair value of the award will result in a change to the accrued compensation expense, which is recognized in the period in which the fluctuation occurs.
Accounting Estimates and Judgments
Determining the fair value of equity-settled share-based compensation awards at the grant date requires judgment, including estimating the expected term of stock options, the expected volatility of the company’s stock and expected
| | |
| 124 | | PotashCorp 2011 Annual Report |
| | |
| | | In millions of US dollars except as otherwise noted |
NOTE 23 Share-Based Compensation continued
dividends. In addition, judgment is required to estimate the number of share-based awards expected to be forfeited.
The company uses the Black-Scholes-Merton option-pricing model to estimate the fair value of options granted under its stock option plans as of each grant date. This pricing model requires judgment, which includes making assumptions about the expected dividends, volatility of the company’s stock price, estimate of risk-free interest rates and the expected life of the options. The expected dividend on the company’s stock was based on the annualized dividend rate as of the date of grant. Expected volatility was based on historical volatility of the company’s stock over a period commensurate with the expected life of the stock option. The risk-free interest rate for the expected life of the option was based, as applicable, on the implied yield available on zero-coupon government issues with an equivalent remaining term at the time of the grant. Historical data were used to estimate the expected life of the option.
The company uses a Monte Carlo simulation model to estimate the fair value of its cash-settled performance unit incentive plan liability at each reporting period within the performance period. This requires judgment, including making assumptions about the volatility of the company’s stock price and the DAXglobal Agribusiness Index with dividends, as well as the correlation between those two amounts, over the three-year plan cycle.
For those awards with performance conditions that determine the number of options or units to which its employees will be entitled, measurement of compensation cost is based on the company’s best estimate of the outcome of the performance conditions. If actual results differ significantly from these estimates, stock-based compensation expense and results of operations could be impacted.
Supporting Information
The company has 11 stock-based compensation plans (nine stock option plans, the deferred share unit plan and the performance unit incentive plan), which are described below. The total compensation cost charged against earnings for those plans in 2011 was $18 (2010 – $48).
Stock option plans
| | | | | | | | |
| Plan | | Options Outstanding | | | Vesting Period | | Settlement |
Directors Plan | | | 81,000 | | | 2 Years | | Shares |
Officers and Employees Plan | | | 6,736,638 | | | 2 Years | | Shares |
2005 Performance Option Plan | | | 5,539,810 | | | 3 Years | | Shares |
2006 Performance Option Plan | | | 5,421,400 | | | 3 Years | | Shares |
2007 Performance Option Plan | | | 4,167,776 | | | 3 Years | | Shares |
2008 Performance Option Plan | | | 1,384,200 | | | 3 Years | | Shares |
2009 Performance Option Plan | | | 1,875,450 | | | 3 Years | | Shares |
2010 Performance Option Plan | | | 1,307,700 | | | 3 Years | | Shares |
2011 Performance Option Plan | | | 1,135,100 | | | 3 Years | | Shares |
Under the terms of the plans, no additional options are issuable pursuant to the plans.
Under the stock option plans, the exercise price is not less than the quoted market closing price of the company’s common shares on the last trading day immediately preceding the date of the grant, and an option’s maximum term is 10 years. The key design difference between the Performance Option Plans and the Directors Plan and Officers and Employees Plan is the performance-based vesting feature. In general, options granted under the Performance Option Plans will vest, if at all, according to a schedule based on the three-year average excess of the company’s consolidated cash flow return on investment over the weighted average cost of capital. One-half of the options granted in a year under the Directors Plan and Officers and Employees Plan vested one year
from the date of the grant based on service, with the other half vesting the following year.
Prior to a Performance Option Plan award vesting, assumptions regarding vesting are made during the first three years based on the relevant actual and/or forecast financial results. Changes to vesting assumptions are reflected in earnings immediately. As of December 31, 2011, the 2009, 2010 and 2011 Performance Option Plans are expected to vest at 100 percent.
The company issues new common shares to satisfy stock option exercises. Options granted to Canadian participants are granted with an exercise price in Canadian dollars.
| | |
| PotashCorp 2011 Annual Report | | 125 |
| | |
| | | In millions of US dollars except as otherwise noted |
NOTE 23 Share-Based Compensation continued
A summary of the status of the plans as of December 31, 2011 and 2010 and changes during the years ending on those dates is presented as follows:
Number of shares subject to option
| | | | | | | | | | | | | | | | |
| | | Performance Option Plans | | | Officers, Employees and Directors Plans | |
| | | 2011 | | | 2010 | | | 2011 | | | 2010 | |
Outstanding, beginning of year | | | 21,472,080 | | | | 22,804,755 | | | | 10,649,229 | | | | 15,323,520 | |
Granted | | | 1,144,100 | | | | 1,334,100 | | | | – | | | | – | |
Exercised | | | (1,658,744 | ) | | | (2,664,825 | ) | | | (3,831,591 | ) | | | (4,674,291 | ) |
Forfeited | | | (126,000 | ) | | | (1,950 | ) | | | – | | | | – | |
Expired | | | – | | | | – | | | | – | | | | – | |
Outstanding, end of year | | | 20,831,436 | | | | 21,472,080 | | | | 6,817,638 | | | | 10,649,229 | |
Weighted average exercise price
| | | | | | | | | | | | | | | | |
| | | Performance Option Plans | | | Officers, Employees and Directors Plans | |
| | | 2011 | | | 2010 | | | 2011 | | | 2010 | |
Outstanding, beginning of year | | $ | 20.40 | | | $ | 18.52 | | | $ | 4.63 | | | $ | 4.41 | |
Granted | | | 52.26 | | | | 33.82 | | | | – | | | | – | |
Exercised | | | 12.61 | | | | 13.62 | | | | 4.56 | | | | 4.20 | |
Forfeited | | | 49.43 | | | | 64.62 | | | | – | | | | – | |
Expired | | | – | | | | – | | | | – | | | | – | |
Outstanding, end of year | | $ | 22.40 | | | $ | 20.40 | | | $ | 4.64 | | | $ | 4.63 | |
The aggregate grant-date fair value of all options granted during the year was $27 (2010 – $21). The average share price during the year was $53.02 per share (2010 – $40.12 per share).
The following table summarizes information about stock options outstanding at December 31, 2011:
| | | | | | | | | | | | | | | | | | |
| | | Options Outstanding | | | Options Exercisable | |
Range of
Exercise Prices | | Number | | | Weighted Average
Remaining Life in Years | | Weighted Average
Exercise Price | | | Number | | | Weighted Average
Exercise Price | |
Officers and Employees and Directors Plans | | | | | | | | | | | | |
$3.60 to $4.70 | | | 4,360,127 | | | 1 | | $ | 4.05 | | | | 4,360,127 | | | $ | 4.05 | |
$4.71 to $5.90 | | | 2,457,511 | | | 1 | | $ | 5.68 | | | | 2,457,511 | | | $ | 5.68 | |
| | | | 6,817,638 | | | 1 | | $ | 4.64 | | | | 6,817,638 | | | $ | 4.64 | |
Performance Option Plans | | | | | | | | | | | | | | | | | | |
$9.00 to $14.00 | | | 10,961,210 | | | 4 | | $ | 10.97 | | | | 10,961,210 | | | $ | 10.97 | |
$20.00 to $25.00 | | | 4,167,776 | | | 5 | | $ | 21.45 | | | | 4,167,776 | | | $ | 21.45 | |
$30.00 to $40.00 | | | 3,183,150 | | | 8 | | $ | 33.71 | | | | – | | | $ | – | |
$49.00 to $70.00 | | | 2,519,300 | | | 8 | | $ | 59.37 | | | | 1,384,200 | | | $ | 66.02 | |
| | | | 20,831,436 | | | 5 | | $ | 22.40 | | | | 16,513,186 | | | $ | 18.23 | |
| | | | 27,649,074 | | | 4 | | $ | 18.02 | | | | 23,330,824 | | | $ | 14.26 | |
The foregoing options have expiry dates ranging from November 2012 to May 2021.
| | |
| 126 | | PotashCorp 2011 Annual Report |
| | |
| | | In millions of US dollars except as otherwise noted |
NOTE 23 Share-Based Compensation continued
The following weighted average assumptions were used in arriving at the grant-date fair values associated with stock options for which compensation cost was recognized during 2011 and 2010:
| | | | | | | | | | | | | | | | |
| | | Year of Grant | |
| | | 2011 | | | 2010 | | | 2009 | | | 2008 | |
Exercise price | | $ | 52.26 | | | $ | 33.82 | | | $ | 31.96 | | | $ | 66.02 | |
Expected dividend per share | | $ | 0.28 | | | $ | 0.13 | | | $ | 0.13 | | | $ | 0.13 | |
Expected volatility | | | 52% | | | | 50% | | | | 48% | | | | 34% | |
Risk-free interest rate | | | 2.29% | | | | 2.61% | | | | 2.53% | | | | 3.30% | |
Expected life of options in years | | | 5.5 | | | | 5.9 | | | | 5.9 | | | | 5.8 | |
The compensation cost charged against income for the company’s stock option plans in 2011 was $24 (2010 – $24).
Other plans
The company offers a deferred share unit plan to non-employee directors, which allows each to choose to receive, in the form of deferred share units (“DSUs”), all or a percentage of the director’s fees, which would otherwise be payable in cash. The plan also provides for discretionary grants of additional DSUs by the Board, a practice the Board discontinued on January 24, 2007 in connection with an increase in the annual retainer. Each DSU fully vests upon award, but is distributed only when the director has ceased to be a member of the Board. Vested units are settled in cash based on the common share price at that time. As of December 31, 2011, the total number of DSUs held by participating directors was 594,030 (2010 – 573,260).
Further information and a summary of the status of outstanding DSUs is presented below:
| | | | | | | | | | | | |
| | | December 31,
2011 | | | December 31,
2010 | | | January 1,
2010 | |
Total (recovery) expense recognized | | $ | (5 | ) | | $ | 10 | | | $ | n/a | |
Cash used to settle DSUs | | | – | | | | – | | | | n/a | |
Fair value and intrinsic value of closing liability | | | 25 | | | | 30 | | | | 20 | |
The company offered a performance unit incentive plan to senior executives and other key employees. The performance objectives under the plan were designed to further align the interests of executives and key employees with those of shareholders by linking the vesting of awards to the total return to shareholders over the three-year performance period ending December 31,
2011. Total shareholder return measures the capital appreciation in the company’s common shares, including dividends paid over the performance period. Vesting of one-half of the awards was based on increases in the total shareholder return over the three-year performance period. Vesting of the remaining one-half of the awards was based on the extent to which the total shareholder return matched or exceeded that of the common shares of a pre-defined peer group index. Vested units were settled in cash based on the common share price generally at the end of the performance period. Compensation expense for this plan was recorded over the three-year performance cycle of the plan. The amount of compensation expense was adjusted each period over the cycle to reflect the current fair value of common shares and the number of shares estimated to vest in accordance with the vesting schedule based upon estimated total shareholder return, and such return compared to the company’s peer group.
Further information and a summary of the status of the performance unit incentive plan units are presented below:
| | | | | | | | | | | | |
| | | December 31,
2011 | | | December 31,
2010 | | | January 1,
2010 | |
Total (recovery) expense recognized | | $ | (1 | ) | | $ | 17 | | | $ | n/a | |
Cash used to settle units | | | 4 | | | | – | | | | n/a | |
Fair value of closing liability | | | 18 | | | | 22 | | | | 6 | |
Intrinsic value of closing liability | | | 18 | | | | 23 | | | | 9 | |
| | |
| PotashCorp 2011 Annual Report | | 127 |
| | |
| | | In millions of US dollars except as otherwise noted |
| | | | |
NOTE 24 | | | | FINANCIAL INSTRUMENTS AND RELATED RISK MANAGEMENT |
Accounting Policies
Financial assets and financial liabilities are recognized initially at fair value, normally being the transaction price plus directly attributable transaction costs. Transaction costs related to financial assets or financial liabilities at fair value through profit or loss are recognized immediately in net income. Regular way purchases and sales of financial assets are accounted for on the trade date.
Accounting Estimates and Judgments
All financial instruments (assets and liabilities) are recorded on the statements of financial position, some at fair value. Those recorded at fair value must be remeasured at each reporting date and changes in the fair value are recorded in either net income or OCI. Uncertainties, estimates and use of judgment inherent in applying the standards include valuation of financial instruments at fair value.
A number of the company’s financial instruments are recorded on the statements of financial position at fair value, as described in Notes 6 and 11. Fair value represents point-in-time estimates that may change in subsequent reporting periods due to market conditions or other factors. Estimated fair values are designed to approximate amounts at which the financial instruments could be exchanged in a current transaction between willing parties. Multiple methods exist by which fair value can be determined, which can cause values (or a range of reasonable values) to differ. There is no universal model that can be broadly applied to all items being valued. Further, assumptions underlying the valuations may require estimation of costs/prices over time, discount rates, inflation rates, defaults and other relevant variables.
IFRS require the use of a three-level hierarchy for disclosing fair values for instruments measured at fair value on a recurring basis. Judgment and estimation are required to determine in which category of the hierarchy items should be included. When the inputs used to measure fair value fall within more than one level of the hierarchy, the level within which the fair value measurement is categorized is based on the company’s assessment of the lowest level input that is the most significant to the fair value measurement.
Supporting Information
Financial risks
The company is exposed in varying degrees to a variety of financial risks from its use of financial instruments: credit risk, liquidity risk and market risk. The source of risk exposure and how each is managed are outlined below.
Credit risk
The company is exposed to credit risk on its cash and cash equivalents, receivables (excluding taxes) and derivative instrument assets. The exposure to credit risk is represented by the carrying amount of each class of financial assets, including derivative financial instruments, recorded in the consolidated statements of financial position.
The company manages its credit risk on cash and cash equivalents and derivative instrument assets through policies guiding:
| Ÿ | | Acceptable minimum counterparty credit ratings relating to the natural gas and foreign currency derivative instrument assets, and cash and cash equivalents; |
| Ÿ | | Daily counterparty settlement on natural gas derivative instruments based on prescribed credit thresholds; and |
| Ÿ | | Exposure thresholds by counterparty on cash and cash equivalents. |
Derivative instrument assets are comprised of natural gas hedging derivatives and foreign currency derivatives. At December 31, 2011, the company held no cash margin deposits as collateral relating to these derivative financial instruments. All of the counterparties to the contracts comprising the derivative financial instruments in an asset position are of investment grade quality.
The company seeks to manage the credit risk relating to its trade receivables through a credit management program. Credit approval policies and procedures are in place to guide the granting of credit to new customers as well as the continued extension of credit for existing customers. Existing customer accounts are reviewed every 12-18 months. Credit is extended to international customers based upon an evaluation of both customer and country risk. The company uses credit agency reports, where available, and an assessment of other relevant information such as current financial statements and/or credit references before assigning credit limits to customers. Those that fail to meet specified benchmark creditworthiness may transact with the company on a prepayment basis or provide another form of credit support that it approves.
| | |
| 128 | | PotashCorp 2011 Annual Report |
| | |
| | | In millions of US dollars except as otherwise noted |
NOTE 24 Financial Instruments and Related Risk Management continued
The company does not hold any collateral as security. If appropriate, it may request guarantees or standby letters of credit to mitigate credit risk on trade receivables. It also obtains export insurance from Export Development Canada (covering 90 percent of each balance) for international potash sales from its New Brunswick operation, and from the Foreign Credit Insurance Association (covering 90 percent of each balance) for international sales from the US and Trinidad. A total of $121 in receivables at December 31, 2011 was covered, representing 99 percent of offshore receivables, which was unchanged from January 1 and December 31, 2010. Canpotex also obtains export insurance from Export Development Canada for its receivables (covering nearly 100 percent of most balances).
The credit period on sales is generally 15 days for fertilizer customers, 30 days for industrial and feed customers and up to 180 days for select export sales customers. Interest at 1.5 percent per month is charged on balances remaining unpaid at the end of the sale terms. Historically, the company has experienced minimal customer defaults and, as a result, it considers the credit quality of the trade receivables at December 31, 2011 that are not past due to be high. There were no amounts past due or impaired relating to the non-trade receivables. There were no significant amounts impaired relating to the trade receivables. The aging of trade receivables that were past due but not impaired was as follows:
| | | | | | | | | | | | |
| | | December 31,
2011 | | | December 31,
2010 | | | January 1,
2010 | |
1-30 days | | $ | 43 | | | $ | 33 | | | $ | 20 | |
31-60 days | | | – | | | | 1 | | | | 1 | |
Greater than 60 days | | | 1 | | | | 1 | | | | 1 | |
| | | $ | 44 | | | $ | 35 | | | $ | 22 | |
Liquidity risk
Liquidity risk arises from the company’s general funding needs and in the management of its assets, liabilities and optimal capital structure. It manages its liquidity risk to maintain sufficient liquid financial resources to fund its operations and meet its commitments and obligations in a cost-effective manner. In managing its liquidity risk, the company has access to a range of funding options. It has established an external borrowing policy with the following objectives:
| Ÿ | | Maintain an optimal capital structure; |
| Ÿ | | Maintain a credit rating that provides ease of access to the debt capital and commercial paper markets; |
| Ÿ | | Maintain a sufficient short-term credit availability; and |
| Ÿ | | Maintain long-term relationships with lenders. |
The table below outlines the company’s available debt facilities as of December 31, 2011:
| | | | | | | | | | | | |
| | | Total
Amount | | | Amount
Outstanding
and Committed | | | Amount
Available | |
Credit facilities 1 | | $ | 3,500 | | | $ | 829 | | | $ | 2,671 | |
Line of credit | | | 75 | | | | 23 | 2 | | | 52 | |
| 1 | The amount available under the commercial paper program is limited to the availability of backup funds under the credit facilities. Included in the amount outstanding and committed is $829 of commercial paper. Per the terms of the agreements, the commercial paper outstanding and committed, as applicable, is based on the US dollar balance or equivalent thereof in lawful money of other currencies at the time of issue; therefore, subsequent changes in the exchange rate applicable to Canadian dollar-denominated commercial paper have no impact on this balance. |
| 2 | Letters of credit as discussed in Note 9. |
The company has an uncommitted $30 letter of credit facility. At December 31, 2011, $28 (2010 – $27) was outstanding under this facility.
Certain derivative instruments of the company contain provisions that require its debt to maintain specified credit ratings from two of the major credit rating agencies. If the debt were to fall below the specified ratings, the company would be in violation of these provisions, and the counterparties to the derivative instruments could request immediate payment or demand immediate and ongoing full overnight collateralization on derivative instruments in net liability positions. The aggregate fair value of all derivative instruments with credit risk-related contingent features that were in a liability position on December 31, 2011 was $269, for which the company has posted collateral of $188 in the normal course of business. If the credit risk-related contingent features underlying these agreements had been triggered on December 31, 2011, the company would have been required to post an additional $79 of collateral to its counterparties.
| | |
| PotashCorp 2011 Annual Report | | 129 |
| | |
| | | In millions of US dollars except as otherwise noted |
NOTE 24 Financial Instruments and Related Risk Management continued
The table below presents a maturity analysis of the company’s financial liabilities and gross settled derivative contracts based on the expected cash flows from the date of the consolidated statements of financial position to the contractual maturity date. The amounts are the contractual undiscounted cash flows.
| | | | | | | | | | | | | | | | | | | | | | | | |
| | | Carrying Amount
of Liability (Asset)
at December 31,
2011 | | | Contractual
Cash Flows | | | Within 1
Year | | | 1 to 3 Years | | | 3 to 5 Years | | | Over 5 Years | |
Short-term debt obligations1 | | $ | 829 | | | $ | 829 | | | $ | 829 | | | $ | – | | | $ | – | | | $ | – | |
Payables and accrued charges2 | | | 842 | | | | 842 | | | | 842 | | | | – | | | | – | | | | – | |
Long-term debt obligations1 | | | 3,757 | | | | 6,023 | | | | 198 | | | | 1,098 | | | | 781 | | | | 3,946 | |
Foreign currency derivatives | | | (4 | ) | | | | | | | | | | | | | | | | | | | | |
Outflow | | | | | | | 160 | | | | 160 | | | | – | | | | – | | | | – | |
Inflow | | | | | | | (164 | ) | | | (164 | ) | | | – | | | | – | | | | – | |
Natural gas derivatives3 | | | 265 | | | | 277 | | | | 66 | | | | 87 | | | | 77 | | | | 47 | |
| | | $ | 5,689 | | | $ | 7,967 | | | $ | 1,931 | | | $ | 1,185 | | | $ | 858 | | | $ | 3,993 | |
| 1 | Contractual cash flows include contractual interest payments related to debt obligations. Interest rates on variable rate debt are based on prevailing rates at December 31, 2011. |
| 2 | Excludes taxes, accrued interest, deferred revenues and current portions of asset retirement obligations and accrued environmental costs and pension and other post-retirement benefits. |
| 3 | Natural gas derivatives are subject to master netting agreements. Each counterparty has margin requirements that may require the company to post collateral against liability balances. |
Market risk
Market risk is the risk that financial instrument fair values will fluctuate due to changes in market prices. The market risks to which the company is exposed are foreign exchange risk, interest rate risk and price risk (related to commodity and equity securities).
Foreign exchange risk
The company is exposed to foreign exchange risk primarily relating to operating and capital expenditures, resource taxes, dividends and commercial paper denominated in currencies other than the US dollar, primarily the Canadian dollar. To manage foreign exchange risk related to these non-US dollar expenditures, the company may enter into foreign currency derivatives. Its treasury risk management policies allow such exposures to be hedged within certain prescribed limits for both forecast operating and approved capital expenditures. The foreign currency derivatives are not currently designated as hedging instruments for accounting purposes.
The company has certain available-for-sale investments listed on foreign stock exchanges and denominated in currencies other than the US dollar for which it is exposed to foreign exchange risk. These investments are held for long-term strategic purposes.
| | |
| 130 | | PotashCorp 2011 Annual Report |
| | |
| | | In millions of US dollars except as otherwise noted |
NOTE 24 Financial Instruments and Related Risk Management continued
The following table shows the company’s significant exposure to exchange risk and the pre-tax effects on income and OCI of reasonably possible changes in the relevant foreign currency. The company has no significant foreign currency exposure related to cash and cash equivalents and receivables. This analysis assumes that price decreases related to investments in ICL and Sinofert would not represent an impairment and all other variables remain constant.
| | | | | | | | | | | | | | | | | | | | |
| | | | | | Foreign Exchange Risk | |
| | | Carrying Amount of Asset (Liability) | | | 5% increase in US$ | | | 5% decrease in US$ | |
| | | | Income | | | OCI | | | Income | | | OCI | |
December 31, 2011 | | | | | | | | | | | | | | | | | | | | |
Available-for-sale investments | | | | | | | | | | | | | | | | | | | | |
ICL (New Israeli shekels) | | $ | 1,826 | | | $ | – | | | $ | (91 | ) | | $ | – | | | $ | 91 | |
Sinofert (Hong Kong dollars) | | | 439 | | | | – | | | | (22 | ) | | | – | | | | 22 | |
Payables (CDN) | | | (180 | ) | | | 9 | | | | – | | | | (9 | ) | | | – | |
Foreign currency derivatives | | | 4 | | | | (8 | ) | | | – | | | | 8 | | | | – | |
December 31, 2010 | | | | | | | | | | | | | | | | | | | | |
Available-for-sale investments | | | | | | | | | | | | | | | | | | | | |
ICL (New Israeli shekels) | | $ | 3,046 | | | $ | – | | | $ | (152 | ) | | $ | – | | | $ | 152 | |
Sinofert (Hong Kong dollars) | | | 796 | | | | – | | | | (40 | ) | | | – | | | | 40 | |
Short-term debt (CDN) | | | (69 | ) | | | 3 | | | | – | | | | (3 | ) | | | – | |
Payables (CDN) | | | (205 | ) | | | 10 | | | | – | | | | (10 | ) | | | – | |
Foreign currency derivatives | | | 5 | | | | (12 | ) | | | – | | | | 12 | | | | – | |
| | | | | |
January 1, 2010 | | | | | | | | | | | | | | | | | | | | |
Available-for-sale investments | | | | | | | | | | | | | | | | | | | | |
ICL (New Israeli shekels) | | $ | 1,896 | | | $ | – | | | $ | (95 | ) | | $ | – | | | $ | 95 | |
Sinofert (Hong Kong dollars) | | | 864 | | | | – | | | | (43 | ) | | | – | | | | 43 | |
Short-term debt (CDN) | | | (263 | ) | | | 13 | | | | – | | | | (13 | ) | | | – | |
Payables (CDN) | | | (167 | ) | | | 8 | | | | – | | | | (8 | ) | | | – | |
Foreign currency derivatives | | | 5 | | | | (20 | ) | | | – | | | | 20 | | | | – | |
Interest rate risk
Fluctuations in interest rates impact the future cash flows and fair values of various financial instruments. With respect to its debt portfolio, the company addresses interest rate risk by using a diversified portfolio of fixed and floating rate instruments. This exposure is also managed by aligning current and long-term assets with demand and fixed-term debt and by monitoring the effects of market changes in interest rates. Interest rate swaps can be and have been used by the company to further manage its interest rate exposure.
The company is also exposed to changes in interest rates related to its investments in marketable securities. These securities are included in cash and cash equivalents, and the company’s primary objective is to ensure the security of principal amounts invested and provide for an adequate degree of liquidity, while achieving a satisfactory return. Its treasury risk management policies specify various investment parameters, including eligible types of investment,
maximum maturity dates, maximum exposure by counterparty and minimum credit ratings.
The company had no significant exposure to interest rate risk at December 31, 2011, December 31, 2010 and January 1, 2010. The only financial assets bearing any variable interest rate exposure are cash and cash equivalents. As for financial liabilities, the company has only an insignificant exposure related to a long-term loan that is subject to variable rates. Short-term debt, related to commercial paper, is excluded from interest rate risk as the interest rates are fixed for the stated period of the debt. The company would only be exposed to variable interest rate risk on the issuance of new commercial paper. It does not measure any fixed-rate debt at fair value. Therefore, changes in interest rates will not affect income or OCI as there is no change in the carrying value of fixed-rate debt and interest payments are fixed. This analysis assumes all other variables remain constant.
| | |
| PotashCorp 2011 Annual Report | | 131 |
| | |
| | | In millions of US dollars except as otherwise noted |
NOTE 24 Financial Instruments and Related Risk Management continued
Price risk
The company is exposed to commodity price risk resulting from its natural gas requirements. Its natural gas strategy is based on diversification for its total gas requirements (which represent the forecast consumption of natural gas volumes by its manufacturing and mining facilities). Its objective is to acquire a reliable supply of natural gas feedstock and fuel on a location-adjusted, cost-competitive basis in a manner that minimizes volatility without undue risk. Its exchange-traded available-for-sale securities also expose the company to equity securities price risk.
The following table shows the company’s exposure to price risk and the pre-tax effects on net income and OCI of reasonably possible changes in the relevant commodity or securities prices. This analysis assumes that price decreases related to investments in ICL and Sinofert would not represent an impairment and all other variables remain constant.
| | | | | | | | | | | | | | | | | | | | | | | | | | | | | | | | | | | | |
| | | | | | Price Risk | |
| | | Carrying Amount of Asset (Liability) | | | Effect of 10% decrease in prices
on OCI | | | Effect of 10% increase in prices
on OCI | |
| | | Dec 31,
2011 | | | Dec 31,
2010 | | | Jan 1,
2010 | | | Dec 31,
2011 | | | Dec 31,
2010 | | | Jan 1,
2010 | | | Dec 31,
2011 | | | Dec 31,
2010 | | | Jan 1,
2010 | |
Natural gas derivatives | | $ | (265 | ) | | $ | (279 | ) | | $ | (171 | ) | | $ | (14 | ) | | $ | (50 | ) | | $ | (73 | ) | | $ | 15 | | | $ | 50 | | | $ | 73 | |
Investments in ICL and Sinofert | | | 2,265 | | | | 3,842 | | | | 2,760 | | | | (227 | ) | | | (384 | ) | | | (276 | ) | | | 227 | | | | 384 | | | | 276 | |
The sensitivity analyses included in the tables above should be used with caution as the changes are hypothetical and not predictive of future performance. The sensitivities are calculated with reference to period-end balances and will change due to fluctuations in the balances throughout the year. In addition, for the purpose of the sensitivity analyses, the effect of a variation in a particular assumption on the fair value of the financial instrument was calculated independently of any change in another assumption. Actual changes in one factor may contribute to changes in another factor, which may magnify or counteract the effect on the fair value of the financial instrument.
Fair value
Presented below is a comparison of the fair value of certain financial instruments to their carrying values.
| | | | | | | | | | | | | | | | | | | | | | | | |
| | | December 31, 2011 | | | December 31, 2010 | | | January 1, 2010 | |
| | | Carrying Amount
of Liability | | | Fair Value of
Liability | | | Carrying Amount
of Liability | | | Fair Value of
Liability | | | Carrying Amount
of Liability | | | Fair Value of
Liability | |
Long-term debt senior notes | | $ | 3,750 | | | $ | 4,271 | | | $ | 4,350 | | | $ | 4,525 | | | $ | 3,350 | | | $ | 3,506 | |
Due to their short-term nature, the fair value of cash and cash equivalents, receivables, short-term debt, and payables and accrued charges was assumed to approximate carrying value. The company’s derivative instruments and investments in ICL and Sinofert were carried at fair value. The fair value of the company’s senior notes at December 31, 2011 reflected the yield valuation based on observed market prices, which ranged from 1.14 percent to 4.44 percent (December 31, 2010 – 1.08 percent to 5.66 percent, January 1, 2010 – 1.73 percent to 5.83 percent). The fair value of the company’s other long-term debt instruments approximated carrying value.
Estimated fair values for financial instruments are designed to approximate amounts at which the instruments could be exchanged in a current arm’s-length transaction between knowledgeable willing parties. The fair value of derivative instruments traded in active markets (such as natural gas futures and
exchange-traded options) was based on the quoted market prices at the reporting date.
The fair value of derivative instruments that are not traded in an active market (such as natural gas swaps, over-the-counter option contracts and foreign currency derivatives) was determined by using valuation techniques. The company used a variety of methods and made assumptions that were based on market conditions existing at each reporting date. Natural gas swap valuations were based on a discounted cash flow model. The inputs used in the model included contractual cash flows based on prices for natural gas futures contracts, fixed prices and notional volumes specified by the swap contracts, the time value of money, liquidity risk, the company’s own credit risk (related to instruments in a liability position) and counterparty credit risk (related to instruments in an asset position). Certain of the futures contract prices were
| | |
| 132 | | PotashCorp 2011 Annual Report |
| | |
| | | In millions of US dollars except as otherwise noted |
NOTE 24 Financial Instruments and Related Risk Management continued
supported by prices quoted in an active market and others were not based on observable market data. Interest rates used to discount estimated cash flows in 2011 were between 0.62 percent and 5.21 percent (December 31, 2010 – between 0.47 percent and 4.31 percent, January 1, 2010 – between 0.23 percent and 4.67 percent) depending on the settlement date. Over-the-counter option contracts were valued based on quoted market prices for similar instruments where available or an option valuation model. The fair value of foreign currency derivatives was determined using quoted forward exchange rates at the statements of financial position dates.
Fair value of investments designated as available-for-sale was based on the closing bid price of the common shares as of the statements of financial position dates.
The company’s fair value hierarchy prioritizes the inputs to valuation techniques used to measure fair value. The three levels of the fair value hierarchy are:
| Level 1 | | Values based on unadjusted quoted prices in active markets that are accessible at the measurement date for identical assets or liabilities |
| Level 2 | | Values based on quoted prices in markets that are not active or model inputs that are observable either directly or indirectly for substantially the full term of the asset or liability |
| Level 3 | | Values based on prices or valuation techniques that require inputs which are both unobservable and significant to the overall fair value measurement. |
The following table presents the company’s fair value hierarchy for those financial assets and financial liabilities carried at fair value.
| | | | | | | | | | | | | | | | |
| | | | | | Fair Value Measurements at Reporting Date Using: | |
| Description | | Carrying Amount of
Asset (Liability) | | | Quoted Prices in
Active Markets for
Identical Assets
(Level 1) 1 | | | Significant Other
Observable Inputs
(Level 2) 1,2 | | | Significant
Unobservable
Inputs
(Level 3) 2 | |
December 31, 2011 | | | | | | | | | | | | | | | | |
Derivative instrument assets | | | | | | | | | | | | | | | | |
Natural gas derivatives | | $ | 6 | | | $ | – | | | $ | – | | | $ | 6 | |
Foreign currency derivatives | | | 4 | | | | – | | | | 4 | | | | – | |
Investments in ICL and Sinofert | | | 2,265 | | | | 2,265 | | | | – | | | | – | |
Derivative instrument liabilities | | | | | | | | | | | | | | | | |
Natural gas derivatives | | | (271 | ) | | | – | | | | (36 | ) | | | (235 | ) |
| | | | |
December 31, 2010 | | | | | | | | | | | | | | | | |
Derivative instrument assets | | | | | | | | | | | | | | | | |
Foreign currency derivatives | | $ | 5 | | | $ | – | | | $ | 5 | | | $ | – | |
Investments in ICL and Sinofert | | | 3,842 | | | | 3,842 | | | | – | | | | – | |
Derivative instrument liabilities | | | | | | | | | | | | | | | | |
Natural gas derivatives | | | (279 | ) | | | – | | | | (55 | ) | | | (224 | ) |
| | | | |
January 1, 2010 | | | | | | | | | | | | | | | | |
Derivative instrument assets | | | | | | | | | | | | | | | | |
Natural gas derivatives | | $ | 4 | | | $ | – | | | $ | 1 | | | $ | 3 | |
Foreign currency derivatives | | | 5 | | | | – | | | | 5 | | | | – | |
Investments in ICL and Sinofert | | | 2,760 | | | | 2,760 | | | | – | | | | – | |
Derivative instrument liabilities | | | | | | | | | | | | | | | | |
Natural gas derivatives | | | (175 | ) | | | – | | | | (53 | ) | | | (122 | ) |
| 1 | During 2011 and 2010, there were no transfers between Level 1 and Level 2. |
| 2 | During 2011 and 2010, there were no transfers into Level 3 and $(3) (2010 – $11) of (gains) losses was transferred out of Level 3 into Level 2 as (due to the passage of time) the terms of certain natural gas derivatives now mature within 36 months. Our policy is to recognize transfers at the end of the reporting period. |
| | |
| PotashCorp 2011 Annual Report | | 133 |
| | |
| | | In millions of US dollars except as otherwise noted |
NOTE 24 Financial Instruments and Related Risk Management continued
Fair value measurements using significant unobservable inputs (Level 3)
| | | | | | | | |
| | | Natural Gas Derivatives | |
| | | 2011 | | | 2010 | |
Balance, beginning of year | | $ | (224 | ) | | $ | (119 | ) |
Total losses (realized and unrealized) before income taxes | | | | | | | | |
Included in net income (cost of goods sold) | | | (25 | ) | | | (36 | ) |
Included in other comprehensive income | | | (13 | ) | | | (126 | ) |
Purchases | | | – | | | | – | |
Sales | | | – | | | | – | |
Issues | | | – | | | | – | |
Settlements | | | 36 | | | | 46 | |
Transfers of (gains) losses out of Level 3 | | | (3 | ) | | | 11 | |
Balance, end of year | | $ | (229 | ) | | $ | (224 | ) |
| | | | |
NOTE 25 | | | | CAPITAL MANAGEMENT |
The company’s objectives when managing its capital are to maintain financial flexibility while managing its cost of, and optimizing its access to, capital. In order to achieve these objectives, its strategy, which was unchanged from 2010, was to maintain its investment grade credit rating. The company monitors its capital structure and, based on changes in economic conditions, may adjust the structure by adjusting the amount of dividends paid to shareholders, repurchase of shares, issuance of new shares or issuance of new debt.
The company uses a combination of short-term and long-term debt to finance its operations. It typically pays floating rates of interest on short-term debt and credit facilities, and fixed rates on senior notes.
Net debt and adjusted shareholders’ equity are included as components of the company’s capital structure. The calculation of net debt, adjusted shareholders’ equity and adjusted capital is set out in the following table:
| | | | | | | | |
| | | 2011 | | | 2010 | |
Short-term debt obligations | | $ | 829 | | | $ | 1,274 | |
Current portion of long-term debt obligations | | | 7 | | | | 602 | |
Long-term debt obligations | | | 3,750 | | | | 3,755 | |
Deferred debt costs and swap gains | | | (49 | ) | | | (53 | ) |
Total debt | | | 4,537 | | | | 5,578 | |
Less: cash and cash equivalents | | | (430 | ) | | | (412 | ) |
Net debt | | | 4,107 | | | | 5,166 | |
Total shareholders’ equity | | | 7,847 | | | | 6,685 | |
Less: accumulated other comprehensive income | | | (816 | ) | | | (2,394 | ) |
Adjusted shareholders’ equity | | | 7,031 | | | | 4,291 | |
Adjusted capital1 | | $ | 11,138 | | | $ | 9,457 | |
| 1 | Adjusted capital = (total debt – cash and cash equivalents) + (total shareholders’ equity – accumulated other comprehensive income). |
The company monitors capital on the basis of a number of factors, including the ratios of: net income before finance costs, income taxes, depreciation and amortization and takeover response costs (“adjusted EBITDA”) to finance costs before unwinding of discount on asset retirement obligations and borrowing costs capitalized to property, plant and equipment (“adjusted finance costs”); net debt to adjusted EBITDA; net debt to adjusted capital; and fixed-rate debt obligations as a percentage of total debt obligations.
| | | | | | | | |
| | | 2011 | | | 2010 | |
Components of ratios | | | | | | | | |
Adjusted EBITDA | | $ | 4,797 | | | $ | 3,119 | |
Net debt | | $ | 4,107 | | | $ | 5,166 | |
Adjusted finance costs | | $ | 227 | | | $ | 217 | |
Adjusted capital | | $ | 11,138 | | | $ | 9,457 | |
Ratios | | | | | | | | |
Adjusted EBITDA to adjusted finance costs1 | | | 21.1 | | | | 14.4 | |
Net debt to adjusted EBITDA2 | | | 0.86 | | | | 1.66 | |
Net debt to adjusted capital3 | | | 36.9% | | | | 54.6% | |
Fixed-rate debt obligations as a percentage of total debt obligations 4 | | | 81.7% | | | | 77.2% | |
| 1 | Adjusted EBITDA to adjusted finance costs = adjusted EBITDA / adjusted finance costs. |
| 2 | Net debt to adjusted EBITDA = (total debt – cash and cash equivalents) / adjusted EBITDA. |
| 3 | Net debt to adjusted capital = (total debt – cash and cash equivalents) / (total debt – cash and cash equivalents + total shareholders’ equity – accumulated other comprehensive income). |
| 4 | Fixed-rate debt obligations as a percentage of total debt obligations is determined by dividing fixed-rate debt obligations by total debt obligations. |
| | |
| 134 | | PotashCorp 2011 Annual Report |
| | |
| | | In millions of US dollars except as otherwise noted |
NOTE 25 Capital Management continued
| | | | | | | | |
| | | 2011 | | | 2010 | |
Net income | | $ | 3,081 | | | $ | 1,775 | |
Finance costs | | | 159 | | | | 121 | |
Income taxes | | | 1,066 | | | | 701 | |
Depreciation and amortization | | | 489 | | | | 449 | |
Takeover response costs | | | 2 | | | | 73 | |
Adjusted EBITDA | | $ | 4,797 | | | $ | 3,119 | |
| | | | | | | | |
| | | 2011 | | | 2010 | |
Finance costs | | $ | 159 | | | $ | 121 | |
Unwinding of discount on asset retirement obligations | | | (16 | ) | | | (11 | ) |
Borrowing costs capitalized to property, plant and equipment | | | 84 | | | | 107 | |
Adjusted finance costs | | $ | 227 | | | $ | 217 | |
Accounting Policies
Leases entered into are classified as either finance or operating leases. Leases that transfer substantially all of the risks and rewards of ownership of property to the company are accounted for as finance leases. They are capitalized at the commencement of the lease at the lower of the fair value of the leased property and the present value of the minimum lease payments. Property acquired under a finance lease is depreciated over the shorter of the period of expected use on the same basis as other similar property, plant and equipment and the lease term.
Leases in which a significant portion of the risks and rewards of ownership are retained by the lessor are classified as operating leases. Rental payments under operating leases are expensed to net income on a straight-line basis over the period of the lease.
Accounting Estimates and Judgments
The company is party to various leases, including leases for railcars and vessels. Judgment is required in considering a number of factors to ensure that leases to which the company is party are classified appropriately as operating or financing. Such factors include whether the lease term is for the major part of the asset’s economic life and whether the present value of minimum lease payments amounts to substantially all of the fair value of the leased asset.
Substantially all of the leases to which the company is party have been classified as operating leases.
|
Supporting Information Lease commitments |
The company has various long-term operating lease agreements for land, buildings, port facilities, equipment, ocean-going transportation vessels and railcars, the latest of which expires in 2038. The majority of lease agreements
are renewable at the end of the lease period at market rates. Rental expenses for operating leases for the years ended December 31, 2011 and 2010 were$88, and $82, respectively.
Purchase commitments
The company has entered into long-term natural gas contracts with the National Gas Company of Trinidad and Tobago Limited, the latest of which expires in 2018. The contracts provide for prices that vary primarily with ammonia market prices, escalating floor prices and minimum purchase quantities. The commitments included in the table below are based on floor prices and minimum purchase quantities.
Agreements for the purchase of sulfur for use in the production of phosphoric acid provide for minimum purchase quantities, and certain prices are based on market rates at the time of delivery. The commitments included in the following table are based on expected contract prices.
Capital commitments
The company has various long-term contractual commitments related to the acquisition of property, plant and equipment, the latest of which expires in 2014. The commitments included in the following table are based on expected contract prices.
Other commitments
Other commitments consist principally of pipeline capacity, throughput and various rail and vessel freight contracts, the latest of which expires in 2018, and mineral lease commitments, the latest of which expires in 2032.
| | |
| PotashCorp 2011 Annual Report | | 135 |
| | |
| | | In millions of US dollars except as otherwise noted |
NOTE 26 Commitments continued
Minimum future commitments under these contractual arrangements are shown below.
| | | | | | | | | | | | | | | | | | | | |
| | | Operating
Leases | | | Purchase
Commitments | | | Capital
Commitments | | | Other
Commitments | | | Total | |
Within 1 year | | | $ 90 | | | | $ 426 | | | | $ 393 | | | | $ 29 | | | | $ 938 | |
1 to 3 years | | | 160 | | | | 226 | | | | 82 | | | | 26 | | | | 494 | |
3 to 5 years | | | 115 | | | | 98 | | | | – | | | | 8 | | | | 221 | |
Over 5 years | | | 143 | | | | 91 | | | | – | | | | 16 | | | | 250 | |
Total | | | $ 508 | | | | $ 841 | | | | $ 475 | | | | $ 79 | | | | $ 1,903 | |
| | | | |
NOTE 27 | | | | CONTINGENCIES AND OTHER MATTERS |
Accounting Estimates and Judgments
The company is exposed to possible losses and gains related to environmental matters and other various claims and lawsuits pending for and against it in the ordinary course of business. Prediction of the outcome of such uncertain events (i.e., being virtually certain, probable, remote or undeterminable), determination of whether recognition or disclosure in the consolidated financial statements is required and estimation of potential financial effects are matters for judgment. Where no amounts are recognized, such amounts are contingent and disclosure may be appropriate. While the amount disclosed in the consolidated financial statements may not be material, the potential for large liabilities exists and therefore these estimates could have a material impact on the company’s consolidated financial statements.
Supporting Information
PCS is a shareholder in Canpotex, which markets Saskatchewan potash offshore. Should any operating losses or other liabilities be incurred by Canpotex, the shareholders have contractually agreed to reimburse it in proportion to each shareholder’s productive capacity. Through December 31, 2011, there were no such operating losses or other liabilities.
Mining risk
As is typical with others in the industry, the company is unable to acquire insurance for underground assets.
Legal and other matters
Significant environmental site assessment and/or remediation matters of note include the following:
| Ÿ | | The company, along with other parties, has been notified by the US Environmental Protection Agency (“USEPA”) of potential liability under the US Comprehensive Environmental Response, Compensation and Liability Act |
| | | of 1980 (“CERCLA”) with respect to certain soil and groundwater conditions at a site in Lakeland, Florida that includes a former PCS Joint Venture fertilizer blending facility and certain surrounding properties. A Record of Decision (“ROD”) issued in September 2007 provides for a remedy that requires excavation of impacted soils and interim treatment of groundwater. The total remedy cost is estimated in the ROD to be $9. In September 2010, the USEPA approved the Remedial Design Report to address the soil contamination. While subject to final construction inspection by the USEPA, the soil remediation has been performed. Although PCS Joint Venture sold the Lakeland property in July 2006, PCS Joint Venture has retained the above-described remediation responsibilities and has indemnified the third-party purchaser for the costs of remediation and certain related items. |
| Ÿ | | The USEPA has identified PCS Nitrogen, Inc. (“PCS Nitrogen”) as a potentially responsible party with respect to a former fertilizer blending operation in Charleston, South Carolina known as the Planters Property or Columbia Nitrogen site, formerly owned by a company from which PCS Nitrogen acquired certain other assets. The USEPA has requested reimbursement of $3 of previously incurred response costs and the performance or financing of future site investigation and response activities from PCS Nitrogen and other named potentially responsible parties. The current owner of the Planters Property filed a complaint against PCS Nitrogen in the United States District Court for the District of South Carolina seeking environmental response costs. The district court allocated 30 percent of the liability for response costs at the site to PCS Nitrogen, as well as a proportional share of any costs that cannot be recovered from another responsible party. PCS Nitrogen has filed a notice of appeal to the United States Court of Appeals for the Fourth Circuit. The ultimate amount of liability for PCS Nitrogen, if any, depends upon the final outcome of the litigation, the amount needed for remedial activities, the ability of other parties to pay and the availability of insurance. |
| Ÿ | | PCS Phosphate has agreed to participate, on a non-joint and several basis, with parties to an Administrative Settlement Agreement with the USEPA |
| | |
| 136 | | PotashCorp 2011 Annual Report |
| | |
| | | In millions of US dollars except as otherwise noted |
NOTE 27 Contingencies and Other Matters continued
| | | (“Settling Parties”) in a removal action and the payment of certain other costs associated with PCB soil contamination at the Ward Superfund Site in Raleigh, North Carolina (“Site”), including reimbursement of past USEPA costs. The removal activities commenced in August 2007 and are estimated to cost $75. The Settling Parties have initiated CERCLA contribution litigation against PCS Phosphate and more than 100 other entities. PCS Phosphate filed crossclaims and counterclaims seeking cost recovery. In addition to the removal action at the Site, the USEPA has investigated sediments downstream in what is called “Operable Unit 1.” In September 2008, the USEPA issued a final remedy for Operable Unit 1, with an estimated cost of $6. The USEPA issued a Unilateral Administrative Order (“UAO”) dated September 29, 2011 to a number of entities, requiring them to implement the remedy for Operable Unit 1. PCS Phosphate did not receive the UAO. At this time, the company is unable to evaluate the extent of any exposure that it may have for the matters addressed in the UAO and contribution litigation. |
| Ÿ | | Pursuant to the 1996 Corrective Action Consent Order (the “Order”) executed between PCS Nitrogen Fertilizer, L.P., formerly known as Arcadian Fertilizer, L.P. (“PCS Nitrogen Fertilizer”) and the Georgia Department of Natural Resources, Environmental Protection Division (“GEPD”) in conjunction with PCS Nitrogen Fertilizer’s purchase of real property located in Augusta, Georgia from the entity from which PCS Nitrogen Fertilizer previously leased such property, PCS Nitrogen Fertilizer agreed to perform certain activities to investigate and, if necessary, implement corrective measures for substances in soil and groundwater. The investigation has proceeded and various corrective measures for substances in groundwater have been proposed to and, in part, approved by GEPD. PCS Nitrogen Fertilizer will implement the approved corrective measures for substances in groundwater, but until GEPD approves the investigation results and a final corrective action plan, PCS Nitrogen Fertilizer is unable to estimate with reasonable certainty the total cost of its corrective action obligations under the Order. |
| Ÿ | | In December 2009, during a routine inspection of a gypsum stack at the White Springs, Florida facility, a sinkhole was discovered that resulted in the loss of approximately 82 million gallons of water from the stack. The company is sampling production and monitoring wells on its property and drinking water wells on neighboring property to assess impacts. It incurred costs of $17 to address the sinkhole between the time of discovery through completion of remediation in July 2011. In December 2010, the company entered into a consent order with the Florida Department of Environmental Protection (“FDEP”) pursuant to which the company agreed to, among other things, remediate the sinkhole and perform additional monitoring of the groundwater quality and hydrogeologic conditions related to the sinkhole collapse. The company submitted, and FDEP is reviewing, the Remedial Summary Report for the sinkhole remediation. The company also entered into an order on consent with the USEPA. In May 2011, the USEPA and the company’s Board of Directors approved the company’s proposal to implement |
| | | certain mitigation measures to meet the goals of the USEPA order on consent. The company remeasured the ARO for the White Springs gypsum stacks to account for the measures identified in the proposal. This resulted in a $39 increase to the ARO, of which $33 was capitalized as an addition to the related long-lived asset and $6 was expensed in 2011. |
The company is also engaged in ongoing site assessment and/or remediation activities at several other facilities and sites, and anticipated costs associated with these matters are added to accrued environmental costs in the manner previously described in Note 14. Based on current information, the company does not believe that its future obligations with respect to these facilities and sites are reasonably likely to have a material adverse effect on its consolidated financial position or results of operations.
Other significant matters of note include the following:
| Ÿ | | The USEPA has an ongoing initiative to evaluate implementation within the phosphate industry of a particular exemption for mineral processing wastes under the hazardous waste program. In connection with this industry-wide initiative, the USEPA conducted inspections at numerous phosphate operations and notified the company of alleged violations of the US Resource Conservation and Recovery Act (“RCRA”) at its plants in Aurora, North Carolina; Geismar, Louisiana; and White Springs, Florida. The company has entered into RCRA 3013 Administrative Orders on Consent and has performed certain site assessment activities at all three plants. At this time, it does not know the scope of corrective action, if any, that may be required. The company continues to participate in settlement discussions with the USEPA but is uncertain if any resolution will be possible without litigation, or, if litigation occurs, what the outcome would be. At this time, it is unable to evaluate the extent of any exposure it may have in these matters. |
| Ÿ | | The USEPA has begun an initiative to evaluate compliance with the Clean Air Act at sulfuric acid and nitric acid plants. In connection with this industry-wide initiative, it has sent requests for information to numerous facilities, including the company’s plants in Augusta, Georgia; Aurora, North Carolina; Geismar, Louisiana; Lima, Ohio; and White Springs, Florida. The USEPA has notified the company of various alleged violations of the Clean Air Act at its Geismar, Louisiana plant. The government has demanded process changes and penalties that would cost approximately $34, but the company denies that it has any liability for the Geismar, Louisiana matter. Although it is proceeding with planning and permitting for the process changes demanded by the government, the company is uncertain if any resolution will be possible without litigation, or, if litigation occurs, what the outcome would be. In July 2010, without alleging any specific violation of the Clean Air Act, the USEPA requested that the company meet and demonstrate compliance with the Clean Air Act for specified projects undertaken at the White Springs, Florida sulfuric acid plants. The company participated in such meeting but, at this time, is unable to evaluate if it has any exposure. |
| | |
| PotashCorp 2011 Annual Report | | 137 |
| | |
| | | In millions of US dollars except as otherwise noted |
NOTE 27 Contingencies and Other Matters continued
| Ÿ | | Significant portions of the company’s phosphate reserves in Aurora, North Carolina are located in wetlands. Under the Clean Water Act, the company must obtain a permit from the US Army Corps of Engineers (the “Corps”) before mining in the wetlands. In January 2009, the Division of Water Quality of the North Carolina Department of Natural Resources issued a certification under Section 401 of the Clean Water Act that mining of phosphate in excess of 30 years from lands owned or controlled by the company, including some wetlands, would not degrade water quality. Thereafter, in June 2009, the Corps issued the company a permit that will allow it to mine the phosphate deposits identified in the Section 401 certification. USEPA decided not to seek additional review of the permit. In March 2009, four environmental organizations (Pamlico-Tar River Foundation, North Carolina Coastal Federation, Environmental Defense Fund and Sierra Club, collectively, the “petitioners”), filed a Petition for a Contested Case Hearing before the North Carolina Office of Administrative Hearings (“OAH”), challenging the Section 401 certification. The company has intervened in this proceeding. Cross motions for summary judgment by the petitioners and the company have been filed, briefed and argued. The OAH has not issued a decision on them. At this time, the company is unable to evaluate the extent of any exposure that it may have in this matter. |
| Ÿ | | There is no certainty as to the scope or timing of any final, effective requirements to control greenhouse gas emissions in the US or Canada. Canada has withdrawn from participation in the Kyoto Protocol, and the Canadian government previously announced its intention to coordinate greenhouse gas policies with the US. Although the US Congress has not passed any greenhouse gas emission control laws, the USEPA has adopted several rules to control such emissions using authority under existing environmental laws. In January 2011, the USEPA began phasing in requirements for projects that result in a significant increase in greenhouse gas emissions at the company’s plants to obtain permits incorporating the “best available control technology.” The company is not aware of any projects at its facilities that would be subject to these requirements. Some Canadian provinces and US states are considering the adoption of greenhouse gas emission control requirements. In Saskatchewan, provincial regulations pursuant to the Management and Reduction of Greenhouse Gases Act, which impose a type of carbon tax to achieve a goal of a 20 percent reduction in greenhouse gas emissions by 2020 compared to 2006 levels, may become effective in 2012. The company is monitoring these developments, and, except as indicated above, their effect on its operations cannot be determined with certainty at this time. |
| Ÿ | | In December 2010, the USEPA issued a final rule to restrict nutrient concentrations in surface waters in Florida to levels below those currently permitted at the company’s White Springs, Florida plant. While these revised nutrient criteria are to become part of Florida’s water quality standards on |
| | | March 6, 2012, USEPA has proposed to extend the effective date until June 4, 2012 to allow the State of Florida to develop its own rulemaking for numeric nutrient criteria. The State of Florida has adopted rules, subject to approval by USEPA, that could substitute for the federal rules. Projected capital costs resulting from the rule could be in excess of $100 for White Springs, and there is no guarantee that controls can be implemented that are capable of achieving compliance with the revised nutrient standards under all flow conditions. This estimate assumes that the rule survives court challenges and that none of the site-specific mechanisms for relief from the revised nutrient criteria are available to the plant. Various judicial challenges to both the state and federal rules have been filed, including one lawsuit against the federal rule by The Fertilizer Institute (“TFI”) and White Springs. In June 2011, TFI, White Springs and additional parties filed a Motion for Summary Judgment seeking, among other things, to vacate the USEPA rule. In September 2011, the USEPA filed its Motion for Summary Judgment seeking to uphold its rule. On February 18, 2012, the United States District Court for the Northern District of Florida (“District Court”) ruled on the summary judgment motions and upheld the USEPA numeric nutrient criteria for Florida’s lakes and springs but rejected the criteria for Florida’s streams and rivers as arbitrary and capricious. The company is evaluating the District Court’s decision and continues to monitor the administrative challenges to the state rule. The state rule has been submitted to USEPA for approval. The prospects for implementation of either the federal or the state rule and the availability of the site-specific relief mechanisms under either rule are uncertain. |
| Ÿ | | The company, having been unable to agree with Mosaic Potash Esterhazy Limited Partnership (“Mosaic”) on the remaining amount of potash that it is entitled to receive from Mosaic pursuant to the mining and processing agreement in respect of its rights at the Esterhazy mine, issued a Statement of Claim in the Saskatchewan Court of Queen’s Bench (“Court”) against Mosaic in May 2009 and the claim was amended in January 2010. In the Amended Statement of Claim, the company asserted that it has the right under the mining and processing agreement to receive potash from Mosaic until at least 2012 and potentially much later, and sought an order from the Court declaring the amount of potash which it has the right to receive. Mosaic, in its Statement of Defence, asserted that at a delivery rate of 1.24 million tons of product per year, the company’s entitlement to receive potash under the mining and processing agreement would terminate August 30, 2010. |
In addition, at the time of filing its Statement of Defence, Mosaic commenced a counterclaim against the company, asserting that it had breached the mining and processing agreement due to its refusal to take delivery of potash product under the agreement based on an event of force majeure.
| | |
| 138 | | PotashCorp 2011 Annual Report |
| | |
| | | In millions of US dollars except as otherwise noted |
NOTE 27 Contingencies and Other Matters continued
On December 7, 2011, the company and Mosaic entered into a settlement agreement to end the litigation. Under the settlement, Mosaic will deliver the balance of potash tonnes owed to the company for the 2011 and 2012 calendar years and the mining and processing agreement will terminate on December 31, 2012. As part of the settlement the company had the right to elect (and has elected) to receive 10 percent of the tonnes to be delivered in 2012 in the first quarter of 2013, and the parties also agreed that on December 31, 2012 the Canpotex Esterhazy productive capacity shall be reallocated from the company to Mosaic. Further, it was agreed that Mosaic’s counterclaim for damages arising from the company’s declaration of force majeure in April 2009 would be dismissed. By Consent Judgment issued December 16, 2011, the claim and counterclaim were dismissed with prejudice and without costs.
| Ÿ | | In September and October 2008, the company and PCS Sales (USA), Inc. were named as defendants in eight very similar antitrust complaints filed in federal courts. Other potash producers are also defendants in these cases. Each of the separate complaints alleges conspiracy to fix potash prices, to divide markets, to restrict supply and to fraudulently conceal the conspiracy, all in violation of Section 1 of the Sherman Act. |
Five of the eight complaints were brought by plaintiffs who claim to have purchased potash directly from at least one of the defendants during the period between July 1, 2003 and the present (collectively, the “Direct Purchaser Plaintiffs”). All five Direct Purchaser Plaintiffs purport to sue on behalf of a class of persons who purchased potash in the United States directly from a defendant. The Direct Purchaser Plaintiffs, seek unspecified treble damages, injunctive relief, attorneys’ fees, costs and pre- and post-judgment interest.
The other three complaints were brought by plaintiffs who claim to be indirect purchasers of potash (collectively, the “Indirect Purchaser Plaintiffs”). The Indirect Purchaser Plaintiffs, purport to sue on behalf of all persons who purchased potash indirectly in the United States. In addition to the Sherman Act claim described above, the Indirect Purchaser Plaintiffs also assert claims for violation of various state antitrust laws; violations of various state consumer protection statutes; and for unjust enrichment. The Indirect Purchaser Plaintiffs seek injunctive relief, unspecified damages, treble damages where allowed, costs, fees and pre- and post-judgment interest.
All eight lawsuits have been consolidated into a Multidistrict Litigation proceeding, or MDL, for coordinated pretrial proceedings in the United States District Court for the Northern District of Illinois (“District Court”). In June 2009, PCS, along with other defendants, filed a motion to dismiss the Indirect Purchaser Plaintiffs’ amended consolidated complaint and a motion to dismiss the Direct Purchaser Plaintiffs amended consolidated complaint. In November 2009, the District Court granted in part and denied in
part the defendants’ motion to dismiss the Indirect Purchasers’ amended
consolidated complaint. Specifically, the District Court dismissed the Indirect Purchasers Plaintiffs’ federal claim and all state law claims except those arising out of the state antitrust laws of Michigan and Kansas and the plaintiffs’ Iowa unjust enrichment claim. On that same day, the District Court denied, in its entirety, the defendants’ motion to dismiss the Direct Purchaser Plaintiffs’ amended consolidated complaint. The District Court certified the issues for interlocutory appeal and the US Court of Appeals for the Seventh Circuit (“Seventh Circuit”) accepted the defendants’ petition. In September 2011, a two-judge panel from the Seventh Circuit vacated the trial court’s order denying the defendants’ Motion to Dismiss and remanded the case to the trial court with instructions to dismiss the Plaintiffs’ Amended Complaint. In October 2011, the plaintiffs filed a Petition for Rehearing En Banc with the Seventh Circuit. In December 2011, the Seventh Circuit granted plaintiff’s Petition for Rehearing En Banc and vacated the panel’s opinion and judgment that were issued in September 2011. Oral argument before the full Seventh Circuit occurred on February 8, 2012 and the parties are awaiting a decision. The Seventh Circuit has stayed the District Court proceedings pending the appeal.
The company and PCS Sales (USA), Inc. believe each of these eight private antitrust lawsuits is without merit and intend to defend them vigorously.
In addition, various other claims and lawsuits are pending against the company in the ordinary course of business. While it is not possible to determine the ultimate outcome of such actions at this time, and inherent uncertainties exist in predicting such outcomes, the company believes that the ultimate resolution of such actions is not reasonably likely to have a material adverse effect on its consolidated financial position or results of operations.
The breadth of the company’s operations and the global complexity of tax regulations require assessments of uncertainties and judgments in estimating the taxes it will ultimately pay. The final taxes paid are dependent upon many factors, including negotiations with taxing authorities in various jurisdictions, outcomes of tax litigation and resolution of disputes arising from federal,
provincial, state and local tax audits. The resolution of these uncertainties and the associated final taxes may result in adjustments to the company’s tax assets and tax liabilities.
The company owns facilities that have been either permanently or indefinitely shut down. It expects to incur nominal annual expenditures for site security and other maintenance costs at some of these facilities. Should the facilities be dismantled, certain other shutdown-related costs may be incurred. Such costs are not expected to have a material adverse effect on the company’s consolidated financial position or results of operations and would be recognized and recorded in the period in which they are incurred.
| | |
| PotashCorp 2011 Annual Report | | 139 |
| | |
| | | In millions of US dollars except as otherwise noted |
In the normal course of operations, the company provides indemnifications, which are often standard contractual terms, to counterparties in transactions such as purchase and sale contracts, service agreements, director/officer contracts and leasing transactions. These indemnification agreements may require the company to compensate the counterparties for costs incurred as a result of various events, including environmental liabilities and changes in (or in the interpretation of) laws and regulations, or as a result of litigation claims or statutory sanctions that may be suffered by the counterparty as a consequence of the transaction. The terms of these indemnification agreements will vary based upon the contract, the nature of which prevents the company from making a reasonable estimate of the maximum potential amount that it could be required to pay to counterparties. Historically, the company has not made any significant payments under such indemnifications and no amounts have been accrued in the accompanying consolidated financial statements with respect to these indemnification guarantees (apart from any appropriate accruals relating to the underlying potential liabilities).
The company enters into agreements in the normal course of business that may contain features which meet the definition of a guarantee. Various debt obligations (such as overdrafts, lines of credit with counterparties for derivatives and back-to-back loan arrangements) and other commitments (such as railcar leases) related to certain subsidiaries and investees have been directly guaranteed by the company under such agreements with third parties. It would be required to perform on these guarantees in the event of default by the guaranteed parties. No material loss is anticipated by reason of such agreements and guarantees. At December 31, 2011, the maximum potential amount of future (undiscounted) payments under significant guarantees provided to third parties approximated $598. It is unlikely that these guarantees will be drawn upon and, since the maximum potential amount of future payments does not consider the possibility of recovery under recourse or collateral provisions, this amount is not indicative of future cash requirements or the company’s expected losses from these arrangements. At December 31, 2011, no subsidiary balances subject to guarantees were outstanding in connection with the company’s cash management facilities, and it had no liabilities recorded for other obligations other than subsidiary bank borrowings of approximately $6, which are reflected in other long-term debt in Note 12.
The company has guaranteed the gypsum stack capping, closure and post-closure obligations of White Springs and PCS Nitrogen in Florida and Louisiana, respectively, pursuant to the financial assurance regulatory requirements in
those states. It has guaranteed the performance of certain remediation obligations of PCS Joint Venture and PCS Nitrogen at the Lakeland, Florida and Augusta, Georgia sites, respectively. The USEPA has announced that it plans to adopt rules requiring financial assurance from a variety of mining operations, including phosphate rock mining. It is too early in the rulemaking process to determine what the impact, if any, on the company’s facilities will be when these rules are issued.
The environmental regulations of the Province of Saskatchewan require each potash mine to have decommissioning and reclamation plans, and financial assurances for these plans, approved by the responsible provincial minister. The Minister of the Environment for Saskatchewan (“MOE”) has approved the plans previously submitted by the company, which had provided a CDN $2 irrevocable letter of credit and a payment of CDN $3 into the agreed-upon trust fund. Under the regulations, the decommissioning and reclamation plans and financial assurances are to be reviewed at least once every five years, or as required by the MOE. The next scheduled review was to be completed by June 30, 2011. The company submitted its decommissioning and reclamation plans and its financial assurances proposal in May 2011 and is awaiting a response. The MOE has advised that it considers the company in compliance with the regulations until the review is finalized and a response is provided. The MOE had previously indicated that it would be seeking an increase of the amount paid into the trust fund by the company for this submission. Based on current information, the company does not believe that its financial assurance requirements or future obligations with respect to this matter are reasonably likely to have a material impact on its consolidated financial position or results of operations.
The company has met its financial assurance responsibilities as of December 31, 2011. Costs associated with the retirement of long-lived tangible assets have been accrued in the accompanying consolidated financial statements to the extent that a legal or constructive liability to retire such assets exists.
During the period, the company entered into various other commercial letters of credit in the normal course of operations. As at December 31, 2011, $51 of letters of credit were outstanding.
The company expects that it will be able to satisfy all applicable credit support requirements without disrupting normal business operations.
| | |
| 140 | | PotashCorp 2011 Annual Report |
| | |
| | | In millions of US dollars except as otherwise noted |
| | | | |
NOTE 29 | | | | RELATED PARTY TRANSACTIONS |
Accounting Policies
A person or entity is related to the company, and therefore considered a related party, if any of the following conditions exist: an entity is an associate or joint venture; a person is a member of key management personnel (and their families); a post-employment benefit plan is for the benefit of employees; or a person has significant influence.
Key management personnel are the company’s directors and executive officers as disclosed in its 2011 and 2010 Annual Reports on 10-K, as applicable.
Sale of goods
Goods were sold to the following related parties:
| | | | | | | | |
| | | 2011 | | | 2010 | |
Canpotex | | $ | 1,956 | | | $ | 1,273 | |
Key management personnel (and their families) | | | 34 | | | | 32 | |
| | | $ | 1,990 | | | $ | 1,305 | |
The company sells potash from its Saskatchewan mines for use outside Canada and the US exclusively to Canpotex. Sales to all related parties are at prevailing market prices and are settled on normal trade terms.
The receivables outstanding from related parties arise from sale transactions described above. They are unsecured in nature and bear no interest. There are no provisions held against receivables from related parties. Receivables from Canpotex are shown in Note 3.
Key management personnel compensation
| | | | | | | | |
| | | 2011 | | | 2010 | |
Salaries and other short-term benefits | | $ | 12 | | | $ | 11 | |
Share-based payments | | | 5 | | | | 16 | |
Post-employment benefits | | | 4 | | | | 5 | |
Termination benefits | | | 2 | | | | – | |
| | | $ | 23 | | | $ | 32 | |
Transactions with post-employment benefit plans
Disclosures related to the company’s post-employment benefit plans are shown in Note 13.
| | | | |
NOTE 30 | | | | TRANSITION TO IFRS |
The company adopted IFRS on January 1, 2011 with effect from January 1, 2010. Its financial statements for the year ending December 31, 2011 are the first annual consolidated financial statements that comply with IFRS.
Initial Elections Upon Adoption
Most adjustments required on transition to IFRS were made retrospectively against opening retained earnings as of the date of the first comparative statements of financial position presented (i.e., January 1, 2010). IFRS 1 provides entities adopting IFRS for the first time with a number of optional exemptions and mandatory exceptions, in certain areas, to the general requirement for full retrospective application of IFRS. The most significant IFRS 1 exemptions applied to the company upon adoption are summarized below.
IFRS 1 exemption options
Choice: The company may elect, on transition to IFRS, to either restate all past business combinations in accordance with IFRS 3, “Business Combinations,” or apply an elective exemption from applying IFRS 3 to past business combinations.
Policy selection: The company elected to apply the exemption such that transactions entered into prior to the transition date were not restated. Specific requirements, such as maintaining the classification of the acquirer and the acquiree, recognizing or derecognizing certain acquired assets or liabilities as required under IFRS and remeasuring certain assets and liabilities at fair value, were met.
Transition impact: None.
Expected future impact:None.
Property, Plant and Equipment
Choice: The company may elect to report items of property, plant and equipment in its opening statement of financial position on the transition date at a deemed cost instead of the actual cost that would be determined under IFRS. The deemed cost of an item may be either its fair value at the date of transition to IFRS or an amount determined by a previous revaluation under Canadian GAAP (as long as that amount was close to its fair value, cost or adjusted cost). The exemption can be applied on an asset-by-asset basis.
Policy selection: The company elected to use the fair values of a number of previously impaired items of property, plant and equipment (with a total
| | |
| PotashCorp 2011 Annual Report | | 141 |
| | |
| | | In millions of US dollars except as otherwise noted |
NOTE 30 Transition to IFRS continued
carrying amount of zero) as their deemed costs. The aggregate of the fair values for these particular assets was zero. Therefore, no adjustment resulted on transition to IFRS due to this election.
Transition impact:None.
Expected future impact: None.
Share-Based Payments
Choice: The company may elect not to apply IFRS 2, “Share-based Payment,” to equity instruments granted on or before November 7, 2002 or which vested before its date of transition to IFRS. It may also elect not to apply IFRS 2 to liabilities arising from share-based payment transactions which settled before the date of transition to IFRS.
Policy selection: The company elected not to apply IFRS 2 to equity instruments granted on or before November 7, 2002 or which vested before its date of transition to IFRS. It also elected not to apply IFRS 2 to liabilities arising from share-based payment transactions which settled before the date of transition to IFRS.
Transition impact: None.
Expected future impact: None.
Employee Benefits
Choice: The company may elect to recognize all cumulative actuarial gains and losses through opening retained earnings at the date of transition to IFRS. Actuarial gains and losses would have to be recalculated under IFRS from the inception of each defined benefit plan if the exemption is not taken. The company’s choice must be applied to all defined benefit plans consistently.
Policy selection: The company used this exemption. As it adopted an ongoing policy of recognizing all actuarial gains and losses immediately in OCI, all cumulative actuarial gains and losses were recognized at the date of transition to IFRS.
Transition impact: See Employee Benefits under “Changes in Accounting Policies.”
Expected future impact: See Employee Benefits under “Changes in Accounting Policies.”
Foreign Exchange
Choice: On transition, cumulative translation gains or losses in AOCI can be reclassified to retained earnings at the company’s election. If not elected, all cumulative translation differences must be recalculated under IFRS from inception.
Policy selection: The company elected to recalculate the cumulative foreign exchange translation gains or losses in AOCI under IFRS retrospectively.
Transition impact: None.
Expected future impact:None.
Decommissioning Liabilities
Choice: In accounting for changes in obligations to dismantle, remove and restore items of property, plant and equipment (asset retirement obligations), the guidance in IFRS requires changes in such obligations to be added to or deducted from the cost of the asset to which they relate. The adjusted depreciable amount of the asset is then depreciated prospectively over its remaining useful life. Rather than recalculating the effect of all such changes throughout the life of the obligation, the company may elect to measure the liability and the related depreciation effects at the date of transition to IFRS.
Policy selection: The company elected to measure asset retirement obligations and the related depreciation effects at the date of transition to IFRS.
Transition impact: See Provisions under “Changes in Accounting Policies.”
Expected future impact:See Provisions under “Changes in Accounting Policies.”
Oil and Gas Properties
Choice: For a first-time adopter that has previously employed the full cost method of accounting for oil and natural gas exploration and development expenditures, IFRS 1 provides an exemption which allows entities to measure those assets at the transition date at amounts determined under the entity’s previous GAAP.
Policy selection:The company elected to measure its oil and gas assets at their Canadian GAAP carrying value at the date of transition to IFRS.
Transition impact: None.
Expected future impact: None.
IFRS 1 mandatory exceptions
IFRS 1 prohibits retrospective application of some aspects of other IFRS. As a result, the following mandatory exceptions from full retrospective application of IFRS were applied and relevant on transition to IFRS:
| Ÿ | | The company’s estimates in accordance with IFRS at the date of transition to IFRS were consistent with estimates made for the same date in accordance with Canadian GAAP (after adjustments to reflect any difference in accounting policies). |
| Ÿ | | The company did not reflect in its opening IFRS statements of financial position a hedging relationship of a type that did not qualify for hedge accounting in accordance with IFRS. No transactions entered into before the date of transition to IFRS were retrospectively designated as hedges. |
| | |
| 142 | | PotashCorp 2011 Annual Report |
| | |
| | | In millions of US dollars except as otherwise noted |
NOTE 30 Transition to IFRS continued
Changes in Accounting Policies
The key areas where accounting policies differ or where accounting policy decisions were necessary that impact the company’s consolidated financial statements are set out in the following table. Note that this does not include transition policy choices made under IFRS 1, described above, although their impact is included below.
| | |
Accounting
Policy Area | | Impact of Policy Adoption |
(a) Impairment of Assets | | Choices: There are no policy choices available under IFRS. Differences from previous Canadian GAAP: IAS 36, “Impairment of Assets,” uses a one-step approach for both testing for and measurement of impairment, with asset carrying values compared directly with the higher of fair value less costs to sell and value in use (which uses discounted future cash flows). Canadian GAAP generally used a two-step approach to impairment testing, first comparing asset carrying values with undiscounted future cash flows to determine whether impairment exists, and then measuring any impairment by comparing asset carrying values with fair values. This difference may potentially result in more impairments where carrying values of assets were previously supported under Canadian GAAP on an undiscounted cash flow basis, but could not be supported on a discounted cash flow basis. In addition, IAS 36 requires the reversal of any previous impairment losses (to the amounts the assets would now be carried at had depreciation continued) where circumstances have changed such that the impairments have been reduced. Canadian GAAP prohibited reversal of impairment losses. Transition impact: The company identified certain assets for which impairment losses had been previously recognized, but which were no longer impaired. The previously recognized impairment losses were reversed on transition to IFRS, which resulted in an increase in the carrying amount of property, plant and equipment at December 31, 2010 of $9 (January 1, 2010 – $10). Net income for 2010 decreased by $1. The company also identified items which were regarded as impaired under IFRS, but not under Canadian GAAP. As a result, equity at December 31, 2010 decreased by $4 (January 1, 2010 – $2). Net income for 2010 decreased by $2. Expected future impact: Dependent upon future circumstances, as described above. |
(b) Employee Benefits | | Choices: Under IAS 19, “Employee Benefits,” actuarial gains and losses are permitted to be recognized directly in OCI rather than through net income. Policy selection: Actuarial gains and losses will be recognized in OCI. Differences from previous Canadian GAAP: IAS 19 requires the past service cost element of defined benefit plans to be expensed on an accelerated basis, with vested past service costs expensed immediately and unvested past service costs recognized on a straight-line basis until the benefits become vested. Under Canadian GAAP, past service costs were generally amortized on a straight-line basis over the average remaining service period of active employees expected under the plan. Under Canadian GAAP, certain gains and losses which were unrecognized at the time of adopting the current Canadian accounting standard were permitted to be amortized over a period under transitional provisions of the current standards. Those amounts must be recognized on transition to IFRS. Transition impact: Equity at December 31, 2010 was reduced by $365 (January 1, 2010 – $352). Net income for 2010 increased by $24. Expected future impact: The effect of actuarial gains and losses will no longer affect net income under the company’s accounting policy choice. Shareholders’ equity is expected to be subject to greater variability as the effects of actuarial gains and losses will be recognized immediately, rather than being deferred and amortized over a period of time. |
| | |
| PotashCorp 2011 Annual Report | | 143 |
| | |
| | | In millions of US dollars except as otherwise noted |
NOTE 30 Transition to IFRS continued
| | |
Accounting
Policy Area | | Impact of Policy Adoption |
(c) Share-Based Payments | | Choices: There are no policy choices available under IFRS. Differences from previous Canadian GAAP: IFRS 2, “Share-Based Payments,” requires that cash-settled share-based payments to employees be measured (both initially and at each reporting date) based on fair value of the awards. Canadian GAAP required that such payments be measured based on the intrinsic value of the awards. This difference impacted the accounting measurement of some of the company’s cash-settled employee incentive plans, such as its performance unit incentive plan. IFRS 2 requires an estimate of compensation cost to be recognized in relation to performance options for which service has commenced but which have not yet been granted. The compensation cost recognized is trued up once options have been granted. Under Canadian GAAP, compensation cost was first recognized when the options were granted. This will create a timing difference between IFRS and Canadian GAAP in terms of when compensation cost relating to employee service provided in the first quarter of the year is recognized. In relation to stock option costs in 2010, net income decreased in the first quarter and increased in the second quarter by $13. Net income and equity for annual periods are not affected. Transition impact: In relation to the company’s cash-settled share-based payments, equity at December 31, 2010 increased by $1 (January 1, 2010 – $3). Net income for 2010 decreased by $2. Expected future impact: Any future significant difference between the fair value and intrinsic value of outstanding units under the company’s performance unit incentive plan will result in different measurements under IFRS and Canadian GAAP in any particular year; however, this will be a timing difference only. The total future compensation expense relating to these awards will be the same under IFRS and Canadian GAAP over the duration of each incentive plan cycle. In relation to stock option cost, a timing difference will exist between IFRS and Canadian GAAP, whereby net income under IFRS will decrease in the first quarter and increase in the second quarter of each year by offsetting amounts. Net income and equity for annual periods will not be affected. |
(d) Provisions (including Asset Retirement Obligations) | | Choices: There are no policy choices available under IFRS. Differences from previous Canadian GAAP: IAS 37, “Provisions, Contingent Liabilities and Contingent Assets,” requires a provision to be recognized when: there is a present obligation (legal or constructive) as a result of a past transaction or event; it is probable that an outflow of resources will be required to settle the obligation; and a reliable estimate can be made of the obligation. “Probable” in this context means more likely than not. Under Canadian GAAP, constructive obligations were recognized only if required by a specific standard, and the criterion for recognition in the financial statements was “likely,” which is a higher threshold than “probable.” Therefore, there may be some contingent liabilities not recognized under Canadian GAAP which would require a provision under IFRS. Other differences between IFRS and Canadian GAAP exist in relation to the measurement of provisions, such as the methodology for determining the best estimate where there is a range of equally possible outcomes (IFRS uses the mid-point of the range whereas Canadian GAAP used the low end), and the requirement under IFRS for provisions to be discounted where material. In relation to asset retirement obligations, measurement under IFRS is based on management’s best estimate, while measurement under Canadian GAAP was based on the fair value of the obligation (which takes market assumptions into account). Under IFRS, the full asset retirement obligation is remeasured each period using the current discount rate. Under Canadian GAAP, cash flow estimates associated with asset retirement obligations were discounted using historical discount rates. Changes in the discount rate alone did not result in a remeasurement of the liability. Changes in estimates that decreased the liability were discounted using the discount rate applied upon initial recognition of the liability. When changes in estimates increased the liability, the additional liability was discounted using the current discount rate. IFRS require the company’s asset retirement obligations to be discounted using a risk-free rate. Under Canadian GAAP, asset retirement obligations were discounted using a credit-adjusted risk-free rate. |
| | |
| 144 | | PotashCorp 2011 Annual Report |
| | |
| | | In millions of US dollars except as otherwise noted |
NOTE 30 Transition to IFRS continued
| | |
Accounting
Policy Area | | Impact of Policy Adoption |
| | Under IFRS, the increase in the measurement of an asset retirement obligation due to the passage of time (unwinding of the discount) is classified as a finance expense. Under Canadian GAAP, this amount was classified as an operating expense. Transition impact: Equity at December 31, 2010 was reduced by $84 (January 1, 2010 – $68). Net income for 2010 decreased by $16. |
| |
| | | Expected future impact: Measurement of provisions may fluctuate more under IFRS and a change in the discount rate will have a more significant impact on the obligation as well as the company’s assets and expenses. As well, provisions may be recognized earlier under IFRS than under Canadian GAAP. |
(e) Income Taxes | | Choices: Where exchange rate differences on deferred income tax liabilities or assets are recognized in the statements of income, such differences may be classified as either foreign exchange gains/losses or deferred tax expense/income under IFRS. |
| |
| | Policy selection: Exchange rate differences on deferred income tax liabilities or assets will be classified as foreign exchange gains/losses. This is consistent with the company’s accounting policy under Canadian GAAP. |
| |
| | Differences from previous Canadian GAAP, transition impact and expected future impact of each:Under IFRS, the guidance in IAS 12, “Income Taxes,” was used to determine the benefit to be received in relation to uncertain tax positions. This differs from the methodology used under Canadian GAAP. Equity at December 31, 2010 was increased by $48 (January 1, 2010 – $36). Net income for 2010 increased by $12. Impacts in future periods will depend on the particular circumstances existing in those periods. |
| |
| | Under IFRS, deferred tax assets recognized in relation to share-based payment arrangements (for example, the company’s employee stock option plans in the US) are adjusted each period to reflect the amount of future tax deductions that the company expects to receive in excess of stock-based compensation recorded in the consolidated financial statements based on the current market price of the shares. The benefit of such amounts is recognized in contributed surplus and never impacts net income. Under the company’s Canadian GAAP policy, tax deductions for its employee stock option plan in the US were recognized as reductions to tax expense, within net income, in the period that the deduction was allowed. This difference resulted in a decrease to net income in 2010 of $45. Equity at December 31, 2010 increased by $143 (January 1, 2010 – $116). In future periods, current tax expense will be higher and the balance of the company’s deferred tax liability is expected to be more volatile under IFRS. |
| |
| | Under IFRS, deferred tax assets associated with share-based compensation that are recorded in the consolidated financial statements as an expense in the current or previous period should be reviewed at each statement of financial position date and amended to the extent that it is no longer probable that the related tax benefit will be realized. Under Canadian GAAP, this income tax benefit was calculated without estimating the income tax effects of anticipated share-based payment transactions. This difference resulted in an increase to net income of $1. Equity at December 31, 2010 decreased by $7 (January 1, 2010 – $8). In future periods, the balance in the company’s deferred tax liability is expected to be more volatile under IFRS. |
| |
| | Under IFRS, adjustments relating to a change in tax rates are recognized in the same category of comprehensive income in which the original amounts were recognized. Under Canadian GAAP, such adjustments were recognized in net income, regardless of the category in which the original amounts were recognized. In addition, adjustments to foreign exchange gains on deferred income tax liabilities originally recognized in OCI will be recorded in OCI under IFRS, but were recorded in net income under Canadian GAAP. In combination, these differences resulted in $150 related to an internal restructuring that occurred in 2009 being re-categorized at the date of transition to IFRS from retained earnings to AOCI. There will be no future impacts resulting from this item. |
| |
| | Under IFRS, deferred income taxes are classified as long-term. Under Canadian GAAP, future income taxes were separated between current and long-term on the statements of financial position. This resulted in a decrease in 2010 of $28 (January 1, 2010 – $18) in current assets and non-current liabilities on the statements of financial position. This classification difference will continue to exist in future periods; however, the size and direction of the difference will depend on circumstances existing in those periods. |
| | |
| PotashCorp 2011 Annual Report | | 145 |
| | |
| | | In millions of US dollars except as otherwise noted |
NOTE 30 Transition to IFRS continued
| | |
Accounting
Policy Area | | Impact of Policy Adoption |
| | | Under IFRS, unrealized profits resulting from intragroup transactions are eliminated from the carrying amount of assets, but no equivalent adjustment is made for tax purposes. The difference between the tax rates of the two entities will impact net income. This differs from Canadian GAAP, where the current tax payable in relation to such profits was recorded as a current asset until the transaction was realized by the group. As a result, equity at December 31, 2010 increased by $6 (January 1, 2010 – $20) and 2010 net income decreased by $14. In future periods, the tax impact of intragroup transactions will be recognized earlier under IFRS; however, the size and direction of the difference will depend on circumstances existing in those periods. |
(f) Consolidation | | Choices: There are no policy choices available under IFRS. |
| |
| | Differences from previous Canadian GAAP: The IFRS approach to consolidation is principles-based whereby consolidation is required for all entities which are controlled. Unlike the Canadian GAAP two-step model, which first required consideration as to whether an entity was a Variable Interest Entity, the IFRS guidance on consolidation is a single-step model – the control model. IFRS do bring in the concepts of risk and rewards where the existence of control is not apparent, although not in the same rules-based manner as under Canadian GAAP. |
| |
| | Transition impact: None. |
| |
| | | Expected future impact: None. |
(g) Property, Plant and Equipment | | Choices: Either a historical cost model or a revaluation model can be used to value property, plant and equipment. Policy selection: The company valued property, plant and equipment using the historical cost model. Differences from previous Canadian GAAP: Under IFRS, where part of an item of property, plant and equipment has a cost that is significant in relation to the cost of the item as a whole, it must be depreciated separately from the remainder of the item. Canadian GAAP was similar in this respect; however, the componentization concept was not often applied to the same extent due to practicality and/or materiality. |
| |
| | Under IFRS, the cost of major overhauls on items of property, plant and equipment is capitalized as a component of the related item of property, plant and equipment and depreciated over the period until the next major overhaul. Under Canadian GAAP, these costs were expensed in the year incurred. |
| |
| | Transition impact: Equity at December 31, 2010 increased by $52 (January 1, 2010 – $18). Net income for 2010 increased by $34. |
| |
| | | Expected future impact: The cost of future replacement of components of property, plant and equipment (including the cost of major overhauls) will be capitalized and depreciated over several years rather than being expensed in the year incurred. This will result in a difference in timing between IFRS and Canadian GAAP in terms of when such costs are recognized as expenses. |
(h) Inventories | | Choices: Either first-in, first-out (“FIFO”) or weighted average can be used to value inventories. |
| |
| | Policy selection: The weighted average method was used to value inventories. |
| |
| | Differences from previous Canadian GAAP: None, as it relates to annual periods. |
| |
| | Under IFRS, at interim periods, price, efficiency, spending and volume variances of a manufacturing entity are recognized in income to the same extent that those variances are recognized in income at financial year-end. Deferral of variances that are expected to be absorbed by year-end is not appropriate because it could result in reporting inventory at the interim date at more or less than its portion of the actual cost of manufacture. Under Canadian GAAP, variances that were planned and expected to be absorbed by the end of the year were ordinarily deferred at the end of an interim period. Net income and equity for annual periods are not affected. |
| | |
| 146 | | PotashCorp 2011 Annual Report |
| | |
| | | In millions of US dollars except as otherwise noted |
NOTE 30 Transition to IFRS continued
| | |
Accounting
Policy Area | | Impact of Policy Adoption |
| | Transition impact: None as it relates to annual periods. |
| |
| | | Expected future impact: None, as it relates to annual periods. Manufacturing cost variances that were deferred at interim periods will no longer be deferred. This will result in a difference in timing during the year between IFRS and Canadian GAAP in terms of when such costs are recognized as expenses. |
(i) Borrowing Costs | | Choices: There are no policy choices available under IFRS. Differences from previous Canadian GAAP: Under IFRS, borrowing costs are capitalized to assets which take a substantial time to develop or construct using a capitalization rate based on the weighted average interest rate on all of the company’s outstanding third-party debt. Under the company’s Canadian GAAP policy, the interest capitalization rate was based only on the weighted average interest rate on third-party long-term debt. Transition impact: Equity at December 31, 2010 was reduced by $25 (January 1, 2010 – $14). Net income for 2010 decreased by $11. Expected future impact: There will be an ongoing difference based on the difference in capitalization rates. |
(j) Financial Instruments | | Choices:Trade date or settlement date can be used. Policy selection: The company recognized regular-way purchases and sales of financial assets at the trade date. Differences from previous Canadian GAAP: None. Transition impact: None. Expected future impact: None. |
(k) Definition of a Derivative | | Choices: There are no policy choices available under IFRS. Differences from previous Canadian GAAP: Derivatives usually have a notional amount (i.e., an amount of currency, a number of shares or other number of units specified in the contract). Under IFRS, the definition of a derivative does not specifically require an instrument to have a notional amount, and the lack of a notional amount does not result in an exemption from treatment of the contract as a derivative. Under Canadian GAAP, when the quantity of a non-financial asset or liability to be purchased or sold was not specified and was not otherwise determinable (e.g., by reference to anticipated quantities to be used in the calculation of penalty amounts in the event of non-performance), the contract was not accounted for as a derivative since the standard setters concluded its fair value would not be reliably determinable. As a result, a notional amount was also required implicitly for such a contract to meet the definition of a derivative under Canadian GAAP. Whereas under Canadian GAAP such an instrument would not be accounted for as a derivative, under IFRS it is necessary to analyze all other features to determine whether the contract is a derivative. If so, it is necessary to determine a reasonable estimation of what a notional amount could be, and measure the instrument at fair value as a derivative or embedded derivative based on such. Transition impact: None. Expected future impact: More contracts may be categorized as derivatives (either assets or liabilities) than under Canadian GAAP. |
| | |
| PotashCorp 2011 Annual Report | | 147 |
| | |
| | | In millions of US dollars except as otherwise noted |
NOTE 30 Transition to IFRS continued
| | |
Accounting
Policy Area | | Impact of Policy Adoption |
(l) Embedded Derivatives | | Choices:There are no policy choices available under IFRS. Differences from previous Canadian GAAP: For transitional purposes under Canadian GAAP, the company elected to record embedded derivatives only for contracts entered into or substantively modified on or after January 1, 2003. This transitional option does not exist under IFRS and therefore additional potential embedded derivatives were considered within contracts previously not reviewed in this context to conclude whether bifurcation and recording will be necessary. Transition impact:None. Expected future impact: None. |
(m) Hedge
Accounting for Interest Rate Swaps | | Choices: There are no policy choices available under IFRS. Differences from previous Canadian GAAP: Under Canadian GAAP, a short-cut method for assessing hedge effectiveness was permitted if the critical terms of the hedged item and hedging instrument matched. This method is not permitted under IFRS. The company had certain deferred amounts related to the previous use of this method under Canadian GAAP pertaining to interest rate swaps. However, because the previously designated hedging relationship was of a type that would have qualified for hedge accounting under IFRS, the provisions of IFRS 1 allow the company to discontinue hedge accounting prospectively. Because hedge accounting had already been discontinued prospectively under Canadian GAAP, no adjustment was necessary as a result of adopting IFRS. Transition impact: None. Expected future impact: None. |
(n) Statements of
Cash Flow | | Choices: Either the direct or indirect method may be presented. Dividends paid, interest paid, interest received and dividends received can be presented as operating, investing or financing activities. Policy selection: The company used the indirect method. Dividends paid were presented as financing activities. Interest and dividends received were presented as operating activities. Interest paid was presented as operating activities except where it had been capitalized to property, plant and equipment, in which case it was presented as investing activities. Differences from previous Canadian GAAP: None. Transition impact: None. Expected future impact: None. |
(o) Investments | | Choices: Jointly controlled entities may be accounted for by using either proportionate consolidation or the equity method. Policy selection: The equity method was used to account for joint ventures. Differences from previous Canadian GAAP: Under Canadian GAAP, joint ventures were accounted for using proportionate consolidation. Certain of the company’s equity-accounted investees adopted IFRS earlier than PotashCorp, resulting in certain IFRS 1 elections being made, particularly related to use of fair value as deemed cost on certain items of property, plant and equipment and related to the use of the business combinations exemption. As a result, the company recognized its share of such elections as an adjustment to its opening retained earnings and its investments in equity-accounted investees. Transition impact: Equity at December 31, 2010 was reduced by $45 (January 1, 2010 – $45). Net income for 2010 was unaffected. Expected future impact: One joint venture will be accounted for using the equity method, rather than the proportionate consolidation method. The impact is expected to be minimal. |
| | |
| 148 | | PotashCorp 2011 Annual Report |
| | |
| | | In millions of US dollars except as otherwise noted |
NOTE 30 Transition to IFRS continued
Reconciliations from Canadian GAAP to IFRS
Reconciliation of Net Income
| | | | |
| | | 2010 | |
Net Income – Canadian GAAP | | $ | 1,806 | |
IFRS adjustments to net income: | | | | |
Policy choices | | | | |
Employee benefits – Actuarial gains and losses (b) | | | 26 | |
Other | | | | |
Provisions – Changes in asset retirement obligations (d) | | | (13 | ) |
Property, plant and equipment (g) | | | 34 | |
Borrowing costs (i) | | | (11 | ) |
Employee benefits – Past service costs (b) | | | (2 | ) |
Impairment of assets (a) | | | (3 | ) |
Constructive obligations (d) | | | (3 | ) |
Share-based payments (c) | | | (2 | ) |
Income taxes – Tax effect of above differences | | | (10 | ) |
Income tax-related differences (e) | | | (47 | ) |
Net Income – IFRS | | $ | 1,775 | |
References above relate to items described in the Changes in Accounting Policies table.
Reconciliation of Shareholders’ Equity
| | | | | | | | |
| | | December 31,
2010 | | | January 1,
2010 | |
Shareholders’ Equity – Canadian GAAP | | $ | 6,804 | | | $ | 6,440 | |
IFRS adjustments to shareholders’ equity: | | | | | | | | |
Policy choices | | | | | | | | |
Employee benefits – Actuarial gains and losses (b) | | | (375 | ) | | | (365 | ) |
Other | | | | | | | | |
Provisions – Changes in asset retirement obligations (d) | | | (79 | ) | | | (66 | ) |
Property, plant and equipment (g) | | | 52 | | | | 18 | |
Investments (o) | | | (45 | ) | | | (45 | ) |
Borrowing costs (i) | | | (25 | ) | | | (14 | ) |
Employee benefits – Past service costs and Canadian GAAP transition amounts (b) | | | 10 | | | | 13 | |
Impairment of assets (a) | | | 5 | | | | 8 | |
Constructive obligations (d) | | | (5 | ) | | | (2 | ) |
Share-based payments (c) | | | 1 | | | | 3 | |
Income taxes – Tax effect of above differences | | | 154 | | | | 152 | |
Income tax-related differences (e) | | | 188 | | | | 163 | |
Shareholders’ Equity – IFRS | | $ | 6,685 | | | $ | 6,305 | |
References above relate to items described in the Changes in Accounting Policies table.
| | |
| PotashCorp 2011 Annual Report | | 149 |
| | |
| | | In millions of US dollars except as otherwise noted |
NOTE 30 Transition to IFRS continued
Reconciliation of Comprehensive Income
| | | | |
| | | 2010 | |
Comprehensive Income – Canadian GAAP | | $ | 2,402 | |
IFRS adjustments to comprehensive income: | | | | |
Policy choices | | | | |
Employee benefits – Actuarial gains and losses (b) | | | (36 | ) |
Tax effect of employee benefits – Actuarial gains and losses | | | 11 | |
Other | | | | |
Differences in net income | | | (31 | ) |
Comprehensive Income – IFRS | | $ | 2,346 | |
References above relate to items described in the Changes in Accounting Policies table.
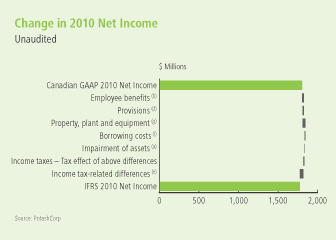
| | |
| 150 | | PotashCorp 2011 Annual Report |
| | |
| | | In millions of US dollars except as otherwise noted |
NOTE 30 Transition to IFRS continued
Adjusted Financial Statements
The following tables show the adjustments to the company’s consolidated statements of financial position and consolidated statements of income.
Adjustments to Consolidated Statement of Financial Position – as at December 31, 2010
| | | | | | | | | | | | | | | | | | | | |
| Canadian GAAP Accounts | | Canadian
GAAP | | | IFRS
Adjust-
ments | | | Ref-
erence | | IFRS
Reclass-
ifications | | | IFRS | | | IFRS Accounts |
Assets | | | | | | | | | | | | | | | | | | | | Assets |
Current assets | | | | | | | | | | | | | | | | | | | | Current assets |
Cash and cash equivalents | | $ | 412 | | | $ | – | | | | | $ | – | | | $ | 412 | | | Cash and cash equivalents |
Receivables | | | 1,044 | | | | 15 | | | (e) | | | – | | | | 1,059 | | | Receivables |
Inventories | | | 570 | | | | – | | | | | | – | | | | 570 | | | Inventories |
Prepaid expenses and other current assets | | | 114 | | | | (60 | ) | | (e) | | | – | | | | 54 | | | Prepaid expenses and other current assets |
| | | 2,140 | | | | (45 | ) | | | | | – | | | | 2,095 | | | |
| | | | | | | | | | | | | | | | | | | | Non-current assets |
Property, plant and equipment | | | 8,063 | | | | 78 | | | (a,d,g,i) | | | – | | | | 8,141 | | | Property, plant and equipment |
Investments | | | 4,938 | | | | (45 | ) | | (o) | | | (4,893 | ) | | | – | | | |
| | | – | | | | – | | | | | | 1,051 | | | | 1,051 | | | Investments in equity-accounted investees |
| | | – | | | | – | | | | | | 3,842 | | | | 3,842 | | | Available-for-sale investments |
Other assets | | | 363 | | | | (60 | ) | | (b,e) | | | – | | | | 303 | | | Other assets |
Intangible assets | | | 18 | | | | – | | | | | | 97 | | | | 115 | | | Intangible assets |
Goodwill | | | 97 | | | | – | | | | | | (97 | ) | | | – | | | |
| | | $ | 15,619 | | | $ | (72 | ) | | | | $ | – | | | $ | 15,547 | | | Total Assets |
Liabilities | | | | | | | | | | | | | | | | | | | | Liabilities |
Current liabilities | | | | | | | | | | | | | | | | | | | | Current liabilities |
Short-term debt and current portion of long-term debt | | $ | 1,871 | | | $ | – | | | | | $ | – | | | $ | 1,871 | | | Short-term debt and current portion of long-term debt |
Payables and accrued charges | | | 1,246 | | | | (48 | ) | | (c,d,e) | | | – | | | | 1,198 | | | Payables and accrued charges |
Current portion of derivative instrument liabilities | | | 75 | | | | – | | | | | | – | | | | 75 | | | Current portion of derivative instrument liabilities |
| | | 3,192 | | | | (48 | ) | | | | | – | | | | 3,144 | | | |
| | | | | | | | | | | | | | | | | | | | Non-current liabilities |
Long-term debt | | | 3,707 | | | | – | | | | | | – | | | | 3,707 | | | Long-term debt |
Derivative instrument liabilities | | | 204 | | | | – | | | | | | – | | | | 204 | | | Derivative instrument liabilities |
Future income tax liabilities | | | 1,078 | | | | (341 | ) | | (e) | | | – | | | | 737 | | | Deferred income tax liabilities |
Accrued pension and other post-retirement benefits | | | 299 | | | | 169 | | | (b) | | | – | | | | 468 | | | Pension and other post-retirement benefit liabilities |
Accrued environmental costs and asset retirement obligations | | | 330 | | | | 125 | | | (d) | | | – | | | | 455 | | | Asset retirement obligations and accrued environmental costs |
Other non-current liabilities and deferred credits | | | 5 | | | | 142 | | | (e) | | | – | | | | 147 | | | Other non-current liabilities and deferred credits |
| | | | 8,815 | | | | 47 | | | | | | – | | | | 8,862 | | | Total Liabilities |
Shareholders’ Equity | | | | | | | | | | | | | | | | | | | | Shareholders’ Equity |
Share capital | | | 1,431 | | | | – | | | | | | – | | | | 1,431 | | | Share capital |
Contributed surplus | | | 160 | | | | 148 | | | (e) | | | – | | | | 308 | | | Contributed surplus |
Accumulated other comprehensive income | | | 2,244 | | | | 150 | | | (e) | | | – | | | | 2,394 | | | Accumulated other comprehensive income |
Retained earnings | | | 2,969 | | | | (417 | ) | | | | | – | | | | 2,552 | | | Retained earnings |
| | | | 6,804 | | | | (119 | ) | | | | | – | | | | 6,685 | | | Total Shareholders’ Equity |
| | | $ | 15,619 | | | $ | (72 | ) | | | | $ | – | | | $ | 15,547 | | | Total Liabilities and Shareholders’ Equity |
References above relate to items described in the Changes in Accounting Policies table.
| | |
| PotashCorp 2011 Annual Report | | 151 |
| | |
| | | In millions of US dollars except as otherwise noted |
NOTE 30 Transition to IFRS continued
Adjustments to Consolidated Statement of Financial Position – as at January 1, 2010
| | | | | | | | | | | | | | | | | | | | |
| Canadian GAAP Accounts | | Canadian
GAAP | | | IFRS
Adjust-
ments | | | Ref-
erence | | IFRS
Reclass-
ifications | | | IFRS | | | IFRS Accounts |
Assets | | | | | | | | | | | | | | | | | | | | Assets |
Current assets | | | | | | | | | | | | | | | | | | | | Current assets |
Cash and cash equivalents | | $ | 385 | | | $ | – | | | | | $ | – | | | $ | 385 | | | Cash and cash equivalents |
Receivables | | | 1,138 | | | | 76 | | | (e) | | | – | | | | 1,214 | | | Receivables |
Inventories | | | 624 | | | | – | | | | | | – | | | | 624 | | | Inventories |
Prepaid expenses and other current assets | | | 125 | | | | (56 | ) | | (e) | | | – | | | | 69 | | | Prepaid expenses and other current assets |
| | | 2,272 | | | | 20 | | | | | | – | | | | 2,292 | | | |
| | | | | | | | | | | �� | | | | | | | | | Non-current assets |
Property, plant and equipment | | | 6,413 | | | | 31 | | | (a,d,g,i) | | | – | | | | 6,444 | | | Property, plant and equipment |
Investments | | | 3,760 | | | | (45 | ) | | (o) | | | (3,715 | ) | | | – | | | |
| | | | | | | | | | | | | 955 | | | | 955 | | | Investments in equity-accounted investees |
| | | – | | | | – | | | | | | 2,760 | | | | 2,760 | | | Available-for-sale investments |
Other assets | | | 360 | | | | (86 | ) | | (b,e) | | | – | | | | 274 | | | Other assets |
Intangible assets | | | 20 | | | | – | | | | | | 97 | | | | 117 | | | Intangible assets |
Goodwill | | | 97 | | | | – | | | | | | (97 | ) | | | – | | | |
| | | $ | 12,922 | | | $ | (80 | ) | | | | $ | – | | | $ | 12,842 | | | Total Assets |
Liabilities | | | | | | | | | | | | | | | | | | | | Liabilities |
Current liabilities | | | | | | | | | | | | | | | | | | | | Current liabilities |
Short-term debt and current portion of long-term debt | | $ | 729 | | | $ | – | | | | | $ | – | | | $ | 729 | | | Short-term debt and current portion of long-term debt |
Payables and accrued charges | | | 796 | | | | 21 | | | (c,d,e) | | | – | | | | 817 | | | Payables and accrued charges |
Current portion of derivative instrument liabilities | | | 52 | | | | – | | | | | | – | | | | 52 | | | Current portion of derivative instrument liabilities |
| | | 1,577 | | | | 21 | | | | | | – | | | | 1,598 | | | |
| | | | | | | | | | | | | | | | | | | | Non-current liabilities |
Long-term debt | | | 3,319 | | | | – | | | | | | – | | | | 3,319 | | | Long-term debt |
Derivative instrument liabilities | | | 123 | | | | – | | | | | | – | | | | 123 | | | Derivative instrument liabilities |
Future income tax liabilities | | | 963 | | | | (320 | ) | | (e) | | | – | | | | 643 | | | Deferred income tax liabilities |
Accrued pension and other post-retirement benefits | | | 281 | | | | 174 | | | (b) | | | – | | | | 455 | | | Pension and other post-retirement benefit liabilities |
Accrued environmental costs and asset retirement obligations | | | 215 | | | | 85 | | | (d) | | | – | | | | 300 | | | Asset retirement obligations and accrued environmental costs |
Other non-current liabilities and deferred credits | | | 4 | | | | 95 | | | (e) | | | – | | | | 99 | | | Other non-current liabilities and deferred credits |
| | | | 6,482 | | | | 55 | | | | | | – | | | | 6,537 | | | Total Liabilities |
Shareholders’ Equity | | | | | | | | | | | | | | | | | | | | Shareholders’ Equity |
Share capital | | | 1,430 | | | | – | | | | | | – | | | | 1,430 | | | Share capital |
Contributed surplus | | | 150 | | | | 123 | | | (e) | | | – | | | | 273 | | | Contributed surplus |
Accumulated other comprehensive income | | | 1,649 | | | | 149 | | | (e) | | | – | | | | 1,798 | | | Accumulated other comprehensive income |
Retained earnings | | | 3,211 | | | | (407 | ) | | | | | – | | | | 2,804 | | | Retained earnings |
| | | | 6,440 | | | | (135 | ) | | | | | – | | | | 6,305 | | | Total Shareholders’ Equity |
| | | $ | 12,922 | | | $ | (80 | ) | | | | $ | – | | | $ | 12,842 | | | Total Liabilities and Shareholders’ Equity |
References above relate to items described in the Changes in Accounting Policies table.
| | |
| 152 | | PotashCorp 2011 Annual Report |
| | |
| | | In millions of US dollars except as otherwise noted |
NOTE 30 Transition to IFRS continued
Adjustments to Consolidated Statement of Income – Year Ended December 31, 2010
| | | | | | | | | | | | | | | | | | | | |
| Canadian GAAP Accounts | | Canadian
GAAP | | | IFRS
Adjust- ments | | | Ref- erence | | IFRS
Reclass- ifications | | | IFRS | | | IFRS Accounts |
Sales | | $ | 6,539 | | | $ | – | | | | | $ | – | | | $ | 6,539 | | | Sales |
Freight | | | (336 | ) | | | – | | | | | | (152 | ) | | | (488 | ) | | Freight, transportation and distribution |
Transportation and distribution | | | (152 | ) | | | – | | | | | | 152 | | | | – | | | |
Cost of goods sold | | | (3,426 | ) | | | 65 | | | (a,b,c,d,g,i) | | | – | | | | (3,361 | ) | | Cost of goods sold |
Gross Margin | | | 2,625 | | | | 65 | | | | | | – | | | | 2,690 | | | Gross Margin |
Selling and administrative | | | (228 | ) | | | – | | | (b,c,d) | | | – | | | | (228 | ) | | Selling and administrative expenses |
Provincial mining and other taxes | | | (77 | ) | | | – | | | | | | – | | | | (77 | ) | | Provincial mining and other taxes |
Foreign exchange loss | | | (17 | ) | | | – | | | | | | 17 | | | | – | | | |
| | | – | | | | | | | | | | 174 | | | | 174 | | | Share of earnings of equity-accounted investees |
| | | – | | | | – | | | | | | 163 | | | | 163 | | | Dividend income |
Other income | | | 245 | | | | (16 | ) | | (a,g) | | | (354 | ) | | | (125 | ) | | Other expenses |
Operating Income | | | 2,548 | | | | 49 | | | | | | – | | | | 2,597 | | | Operating Income |
Interest Expense | | | (99 | ) | | | (22 | ) | | (d,i) | | | – | | | | (121 | ) | | Finance Costs |
Income Before Income Taxes | | | 2,449 | | | | 27 | | | | | | – | | | | 2,476 | | | Income Before Income Taxes |
Income Taxes | | | (643 | ) | | | (58 | ) | | (e) | | | – | | | | (701 | ) | | Income Taxes |
Net Income | | $ | 1,806 | | | $ | (31 | ) | | | | $ | – | | | $ | 1,775 | | | Net Income |
Net Income per Share | | | | | | | | | | | | | | | | | | | | Net Income per Share |
Basic | | $ | 2.04 | | | $ | (0.04 | ) | | | | $ | – | | | $ | 2.00 | | | Basic |
Diluted | | $ | 1.98 | | | $ | (0.03 | ) | | | | $ | – | | | $ | 1.95 | | | Diluted |
Dividends per Share | | $ | 0.13 | | | $ | – | | | | | $ | – | | | $ | 0.13 | | | Dividends Declared per Share |
References above relate to items described in the Changes in Accounting Policies table.
| | |
| PotashCorp 2011 Annual Report | | 153 |
Board of Directors

Top to bottom(l to r)
Christopher M. BurleyA,D
Calgary AB
William J. Doyle
Saskatoon SK
John W. EsteyB,C
Glenview IL
Gerald W. Grandey
Saskatoon SK
C. Steven HoffmanC,D
Lincolnshire IL
Dallas J. Howe (Chair)A
Calgary AB
Alice D. LabergeA,D
Vancouver BC
Keith G. MartellB,D
Saskatoon SK
Jeffrey J. McCaigB,D
Calgary AB
Mary MogfordA,B
Newcastle ON
Paul J. Schoenhals*B,C
Calgary AB
E. Robert Stromberg*C
Jackfish Lake SK
Elena Viyella De PalizaC
Dominican Republic
Committees:
(A) Corporate Governance and Nominating (B) Compensation (C) Safety, Health and Environment (D) Audit
| | |
| 154 | | PotashCorp 2011 Annual Report |
Senior Management
Top(l to r)
William J. Doyle
President and Chief Executive Officer
Wayne R. Brownlee
Executive Vice President and Chief Financial Officer
G. David Delaney
Executive Vice President and Chief Operating Officer
Stephen F. Dowdle
President, PCS Sales
Garth W. Moore
President, PCS Potash
Middle(l to r)
Brent E. Heimann
President, PCS Phosphate and PCS Nitrogen
Joseph A. Podwika
Senior Vice President, General Counsel and Secretary
Robert A. Jaspar
Senior Vice President, Information Technology
Denis A. Sirois
Vice President and Corporate Controller
Daphne J. Arnason
Vice President, Internal Audit
Bottom(l to r)
Denita C. Stann
Vice President, Investor and Public Relations
Lee M. Knafelc
Vice President, Human Resources and Administration
Mark F. Fracchia
Vice President, Safety, Health and Environment
Darryl S. Stann
Vice President, Procurement
| | |
| PotashCorp 2011 Annual Report | | 155 |
Shareholder Information
Annual meeting
The Annual Shareholders Meeting will be held at 10:30 a.m. Central Standard Time May 17, 2012 in the Grand Salon, TCU Place, 35 – 22nd Street East, Saskatoon, Saskatchewan.
It will be carried live on the company’s website, www.potashcorp.com.
Holders of common shares as of March 19, 2012 are entitled to vote at the meeting and are encouraged to participate.
Dividends
Dividend amounts paid to shareholders resident in Canada are adjusted by the exchange rate applicable on the dividend record date. Dividends are normally paid in February, May, August and November, with record dates normally set approximately three weeks in advance of the payment date. Future cash dividends will be paid out of, and are conditioned upon, the company’s available earnings. Shareholders who wish to have their dividends deposited directly to their bank accounts should contact the transfer agent and registrar, CIBC Mellon Trust Company.
Registered shareholders can have dividends reinvested in newly issued common shares of PotashCorp at prevailing market rates.
Ownership
On February 21, 2012, there were 1,563 holders of record of the company’s common shares.
Corporate headquarters
Suite 500, 122 – 1st Ave S
Saskatoon SK S7K 7G3
Canada
Phone: (306) 933-8500
Common share prices and volumes
This table sets forth the high and low prices, as well as the volumes, for the company’s common shares as traded on the Toronto Stock Exchange and the New York Stock Exchange (composite transactions) on a quarterly basis. Data are adjusted for the three-for-one-stock split in February 2011.
Potash Corporation of Saskatchewan Inc. is on the S&P/TSX 60 and the S&P/TSX Composite indices.
| | | | | | | | | | | | | | | | | | | | | | | | | | | | |
| | | | | | Toronto Stock Exchange1 | | | New York Stock Exchange | |
| |
| | | | | | High* | | | Low* | | | Volume | | | High* | | | Low* | | | Volume | |
| |
| 2009 | | | Q1 | | | | 38.80 | | | | 27.39 | | | | 118,600,823 | | | | 31.82 | | | | 21.22 | | | | 784,178,478 | |
| | | Q2 | | | | 45.00 | | | | 31.75 | | | | 78,997,282 | | | | 40.45 | | | | 25.71 | | | | 531,709,327 | |
| | | Q3 | | | | 38.17 | | | | 31.24 | | | | 64,778,808 | | | | 34.10 | | | | 26.95 | | | | 483,185,272 | |
| | | Q4 | | | | 43.33 | | | | 30.36 | | | | 65,168,682 | | | | 41.37 | | | | 27.92 | | | | 454,388,084 | |
| |
| Year | | | 2009 | | | | 45.00 | | | | 27.39 | | | | 327,545,595 | | | | 41.37 | | | | 21.22 | | | | 2,253,461,161 | |
| |
| 2010 | | | Q1 | | | | 43.56 | | | | 35.04 | | | | 59,846,960 | | | | 42.81 | | | | 32.76 | | | | 414,242,057 | |
| | | Q2 | | | | 40.49 | | | | 30.49 | | | | 63,124,967 | | | | 40.04 | | | | 28.63 | | | | 327,715,148 | |
| | | Q3 | | | | 53.55 | | | | 30.00 | | | | 79,895,445 | | | | 51.10 | | | | 27.95 | | | | 431,641,486 | |
| | | Q4 | | | | 51.67 | | | | 45.32 | | | | 55,814,374 | | | | 51.68 | | | | 44.22 | | | | 344,494,881 | |
| |
| Year | | | 2010 | | | | 53.55 | | | | 30.00 | | | | 258,681,746 | | | | 51.68 | | | | 27.95 | | | | 1,518,093,572 | |
| |
| 2011 | | | Q1 | | | | 63.19 | | | | 49.82 | | | | 151,070,874 | | | | 63.97 | | | | 50.25 | | | | 761,644,573 | |
| | | Q2 | | | | 59.67 | | | | 48.50 | | | | 124,736,638 | | | | 61.80 | | | | 50.09 | | | | 525,699,026 | |
| | | Q3 | | | | 59.45 | | | | 45.04 | | | | 154,444,294 | | | | 62.60 | | | | 43.06 | | | | 547,590,911 | |
| | | Q4 | | | | 51.60 | | | | 39.82 | | | | 156,271,939 | | | | 51.96 | | | | 38.44 | | | | 498,770,196 | |
| |
| Year | | | 2011 | | | | 63.19 | | | | 39.82 | | | | 586,523,745 | | | | 63.97 | | | | 38.44 | | | | 2,333,704,706 | |
| |
| | |
1 Trading prices are in CDN$ | | Source: Thomson Reuters |
NYSE corporate governance
Disclosure contemplated by 303A. 11 of the NYSE’s listed company manual is available on our website at www.potashcorp.com. The company has filed annual written affirmations/certifications pursuant to the NYSE listing company manual. The certifications required by Section 302 of the Sarbanes-Oxley Act of 2002 are filed as exhibits to our 2011 Annual Report on Form 10-K.
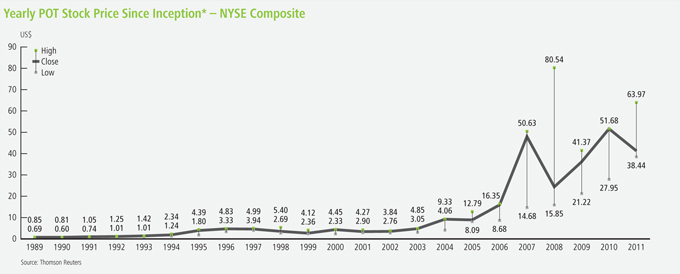
| * | Data are adjusted for a two-for-one stock split in August 2004, a three-for-one stock split in May 2007 and a three-for-one stock split in February 2011. |
| | |
| 156 | | PotashCorp 2011 Annual Report |
Appendix
Market and Industry Data Statement
Some of the market and industry data contained in this annual report and this Management’s Discussion & Analysis of Financial Condition and Results of Operations are based on internal surveys, market research, independent industry publications or other publicly available information. Although we believe that the independent sources used by us are reliable, we have not
independently verified and cannot guarantee the accuracy or completeness of this information. Similarly, we believe our internal research is reliable, but such research has not been verified by any independent sources.
Information in the preparation of this annual report is based on statistical data and other material available at February 21, 2012.
Abbreviated Company Names and Sources*
| | |
| Agrium | | Agrium Inc. (TSX and NYSE: AGU), Canada |
| AMEC | | AMEC Americas Limited, Canada |
| APC | | Arab Potash Company Ltd. (Amman: ARPT), Jordan |
| Belaruskali | | PA Belaruskali, Belarus |
| Bloomberg | | Bloomberg L.P., USA |
| Blue, Johnson | | Blue, Johnson & Associates, USA |
| Canpotex | | Canpotex Limited, Canada |
| CF Industries | | CF Industries, Inc. (NYSE: CF), USA |
| CP Rail | | Canadian Pacific Railway (TSX: CP), Canada |
| CRU | | CRU International Ltd, UK |
| DBRS | | Dominion Bond Rating Service, Canada |
| Doane | | Doane Advisory Services, USA |
| FAI | | Fertilizer Association of India, India |
| FAO | | Food and Agriculture Organization of the United Nations |
| Fertecon | | Fertecon Limited and Fertecon Research Centre Limited, UK |
| FMB | | FMB Group Limited, UK |
| ICL | | Israel Chemicals Ltd. (Tel Aviv: ICL), Israel |
| IFA | | International Fertilizer Industry Association, France |
| IMF | | International Monetary Fund, USA |
| Innophos | | Innophos Holdings, Inc. (NASDAQ: IPHS), USA |
| Intrepid | | Intrepid Potash (NYSE: IPI), USA |
| IPNI | | International Plant Nutrition Institute, USA |
| K+S | | K+S Group (Xetra: SDF), Germany |
| Koch | | Koch Industries, Inc., USA |
| | |
| Mississippi Phosphates | | Mississippi Phosphates Corporation, USA |
| Moody’s | | Moody’s Corporation (NYSE: MCO), USA |
| Mosaic | | The Mosaic Company (NYSE: MOS), USA |
| NYMEX | | New York Mercantile Exchange, USA |
| NYSE | | New York Stock Exchange, USA |
| OCP | | Office Cherifien des Phosphates, Morocco |
| OMS | | Overseas Marine Service, USA |
| PhosChem | | Phosphate Chemicals Export Association, Inc., USA |
| PNAS | | Proceedings of the National Academy of Sciences of the United States of America, USA |
| QSLI | | Qinghai Salt Lake Industry Co. Ltd., China |
| Rabobank | | Rabobank Group |
| SAFRAS | | Editora SAFRAS Ltda, Brazil |
| Simplot | | J.R. Simplot Company, USA |
| Sinofert | | Sinofert Holdings Limited (HKSE, 0297.HK), China |
| SQM | | Sociedad Quimica y Minera de Chile S.A. (Santiago Bolsa de Comercio Exchange, NYSE: SQM), Chile |
| Standard & Poor’s | | Standard & Poor’s Financial Services LLC, USA |
| TFI | | The Fertilizer Institute, USA |
| TSX | | Toronto Stock Exchange, Canada |
| Uralkali | | JSC Uralkali (LSE and RTS: URKA), Russia |
| USDA | | US Department of Agriculture, USA |
| USDOC | | US Department of Commerce, USA |
| Vale | | Companhia Vale do Rio Doce (Bovespa: Vale), Brazil |
| Yara | | Yara International (Oslo: YAR), Norway |
| * | Where PotashCorp is listed as a source in conjunction with external sources, we have supplemented the external data with internal analysis. |
| | |
| PotashCorp 2011 Annual Report | | 157 |
Terms and Measures
Glossary of terms
| | |
| 2011E | | 2011 Estimated |
| |
| 2012F | | 2012 Forecast |
| |
| Brownfield capacity | | Increase in operational capability at existing operation |
| |
| CAGR | | Compound Annual Growth Rate |
| |
| Canpotex | | An export company owned by all Saskatchewan producers of potash (PotashCorp, Mosaic and Agrium) |
| |
| Consumption vs demand | | Product applied vs product purchased |
| |
| EU | | European Union |
| |
| FOB | | Free on Board – cost of goods on board at point of shipment |
| |
| GDP | | Gross Domestic Product |
| |
| Greenfield capacity | | New operation built on undeveloped site |
| |
| Latin America | | South America, Central America, Caribbean and Mexico |
| |
| LNG | | Liquefied Natural Gas |
| |
| MMBtu | | Million British thermal units |
| |
| MT | | Metric tonne |
| |
| MMT | | Million tonnes |
| |
| North America | | The North American market includes Canada and the United States. |
| |
| Offshore | | Offshore markets include all markets except Canada and the US. |
| |
| Operational capability | | Estimated annual achievable production level. |
| |
| PhosChem | | An association formed under the Webb-Pomerene Act for US exports of phosphate fertilizer products. Members are PotashCorp and Mosaic. PCS Sales is responsible for export sales of liquid fertilizers for all PhosChem members while Mosaic is responsible for sales of solid fertilizers for members. |
| |
| PotashCorp | | Potash Corporation of Saskatchewan Inc. (PCS) and its direct or indirect subsidiaries, individually or in any combination, as applicable |
Scientific terms
| | | | |
| Nitrogen | | NH3 | | ammonia (anhydrous), 82.2% N |
| | HNO3 | | nitric acid, 22% N (liquid) |
| | UAN | | nitrogen solutions, 28-32% N (liquid) |
| | |
| Phosphate | | MGA | | merchant grade acid, 54% P2O5 (liquid) |
| | DAP | | diammonium phosphate, 46% P2O5 (solid) |
| | MAP | | monoammonium phosphate, 52% P2O5 (solid) |
| | SPA | | superphosphoric acid, 70% P2O5 (liquid) |
| | Monocal | | monocalcium phosphate, 48.1% P2O5 (solid) |
| | Dical | | dicalcium phosphate, 42.4% P2O5 (solid) |
| | DFP | | defluorinated phosphate, 41.2% P2O5 (solid) |
| | STF | | silicon tetrafluoride |
| | |
| Potash | | KCl | | potassium chloride, 60-63.2% K2O (solid) |
Fertilizer measures
| | |
| K2O tonne | | Measures the potassium content of fertilizers having different chemical analyses |
| |
| P2O5 tonne | | Measures the phosphorus content of fertilizers having different chemical analyses |
| |
| N tonne | | Measures the nitrogen content of fertilizers having different chemical analyses |
| |
| Product tonne | | Standard measure of the weights of all types of potash, phosphate and nitrogen products |
Currency abbreviations
| | |
| CDN | | Canadian dollar |
| |
| EUR | | Euro |
| |
| JOD | | Jordanian dinar |
| |
| NOK | | Norwegian krone |
| |
| RUB | | Russian ruble |
| |
| USD | | United States dollar |
| | |
| 158 | | PotashCorp 2011 Annual Report |

PotashCorp2011AR.com
| | |
 | | PotashCorp.com Visit us online |
| |
 | | Facebook.com/PotashCorp Find us on Facebook |
| |
 | | Twitter.com/PotashCorp Follow us on Twitter |