Food
Matters
2013 Annual Integrated Report

Table of Contents
Introduction
| | | | | | | | | | | | | | | | | | | | | | | | | | | | |
| | 2 | | | Value Reporting | | | 4 | | | Executive Letters | | | | | | | | | | | | | | | | | | |
| | | | | | | | | |
| | | | | | | | | | | | | | | | | | | | | | | | | | | | | |
|
| | Management’s Discussion & Analysis |
| | | | | | | | | |
| | 9 | | | An Overview of Our Nutrients | | | 12 | | | Comparison to Our Peers | | | 18 | | | Competitive Strengths | | | 24 | | | Global Risk Perspective | | | | | | |
| | | | | | | | | | | | | | | | | | | | | | | | | | | | |
| | 10 | | | Our Company and Operations | | | 14 | | | Operating Environment | | | 20 | | | Business Strategy | | | | | | | | | | | | |
| | | | | | | | | |
| | | | | | | | | | | | | | | | | | | | | | | | | | | | | |
|
| | Performance |
| | | | | | | | | |
| | 30 | | | Highlights | | | 34 | | | Year in Review | | | 36 | | | Business Outlook | | | 39 | | | Goals and Targets | | | | | | |
| | | | | | | | | |
| | | | | | | | | | | | | | | | | | | | | | | | | | | | | |
| | | | | | |
| | Nutrients | | | | | | | | | | | | Other | | | | | | |
| | | | | | |
| | Potash | | | Nitrogen | | | Phosphate | | | 79 | | | Other Expenses | | | 90 | | | Other Financial |
| | 52 | | | Snapshot | | | 63 | | | Snapshot | | | 71 | | | Snapshot | | | | | | and Income | | | | | | Information |
| | | | | | | | | | | | | | | | | | | | | | | | | | | | |
| | 53 | | | Industry | | | 64 | | | Industry | | | 72 | | | Industry | | | 81 | | | Quarterly | | | 91 | | | Governance and |
| | | | Overview | | | | | | Overview | | | | | | Overview | | | | | | Results | | | | | | Remuneration |
| | | | | | | | | | | | | | | | | | | | | | | | | | | | |
| | 54 | | | Our | | | 65 | | | Our | | | 73 | | | Our | | | 83 | | | Financial | | | 100 | | | Forward-Looking |
| | | | Business | | | | | | Business | | | | | | Business | | | | | | Condition Review | | | | | | Statements |
| | | | | | | | | | | | | | | | | | | | | | | | | | | | |
| | 56 | | | Alignment With | | | 65 | | | Alignment With | | | 74 | | | Alignment With | | | 84 | | | Liquidity and | | | 101 | | | Non-IFRS |
| | | | Our Goals | | | | | | Our Goals | | | | | | Our Goals | | | | | | Capital Resources | | | | | | Financial Measures |
| | | | | | | | | | | | | | | | | | | | | | | | | | | | |
| | 58 | | | Results and | | | 67 | | | Results and | | | 75 | | | Results and | | | 88 | | | Capital Structure and | | | | | | |
| | | | Performance | | | | | | Performance | | | | | | Performance | | | | | | Management | | | | | | |
| | | | | | | | | |
| | | | | | | | | | | | | | | | | | | | | | | | | | | | | |
| | | | | | | | | |
| | 102 | | | 11 Year Data | | | | | | | | | | | | | | | | | | | | | | | | |
| | | | | | | | | |
| | | | | | | | | | | | | | | | | | | | | | | | | | | | | |
|
| | Financials |
| | | | | | | | | |
| | 110 | | | Management’s Responsibility for Financial Reporting | | | 111 | | | Report of Independent Registered Public Accounting Firm | | | 113 | | | Consolidated Financial Statements | | | | | | | | | | | | |
| | | | | | | | | |
| | | | | | | | | | | | | | | | | | | | | | | | | | | | | |
| | | | | | | | | |
| | 167 | | | Board and Senior Management | | | 169 | | | Shareholder Information | | | 171 | | | Appendix | | | | | | | | | | | | |
| | | | | | | | | |
| | | | | | | | | | | | | | | | | | | | | | | | | | | | | |
Financial data in this report are stated in US dollars unless otherwise noted.

Three generations on a family farm, standing in a potato field.
Food matters
It matters because people with access to nutritious food raise healthier families, build productive communities and lead more fulfilling lives. It matters because, as the Nobel laureate Norman Borlaug once said, food is “a moral right of all who are born into this world.”
Yet securing food remains a daily struggle for many people; nearly one in seven go to bed hungry each night.
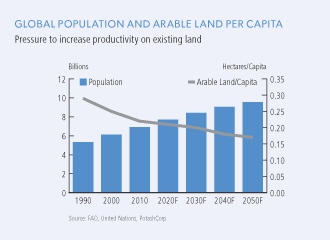
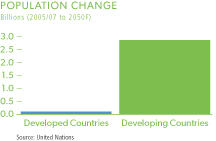
With the global population expected to surpass nine billion in the coming decades, and little new cropland available, farmers face increasing pressure to grow more food on every acre.
That’s why fertilizer matters. That’s why, as the world’s largest fertilizer company by capacity, we remain steadfast in our vision to play a key role in the global food
solution while building long-term value for our stakeholders.
This Annual Integrated Report (AIR) reflects our commitment and our accountability to report our progress towards building sustainable value for all those who depend on our success: investors, customers, employees, communities and other business partners.
As we strive to make clear the integrated nature of our value-focused process, this report shows how we stay rooted in what matters most.
| | |
| PotashCorp 2013 Annual Integrated Report | | 1 |
Value reporting
Reporting on what matters
DELIVERING VALUE FOR OUR STAKEHOLDERS
What you will see in this report – as well as in our online materials – is an integrated discussion of our strategies and performance.
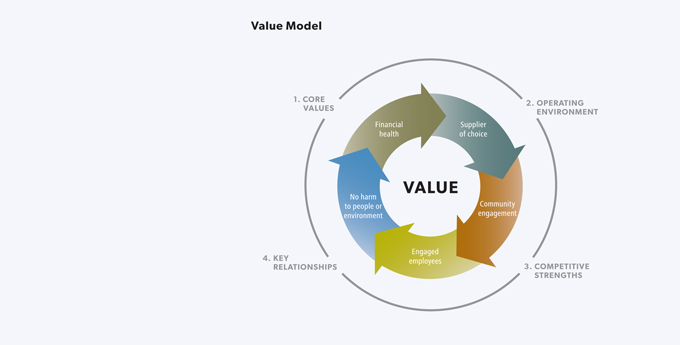
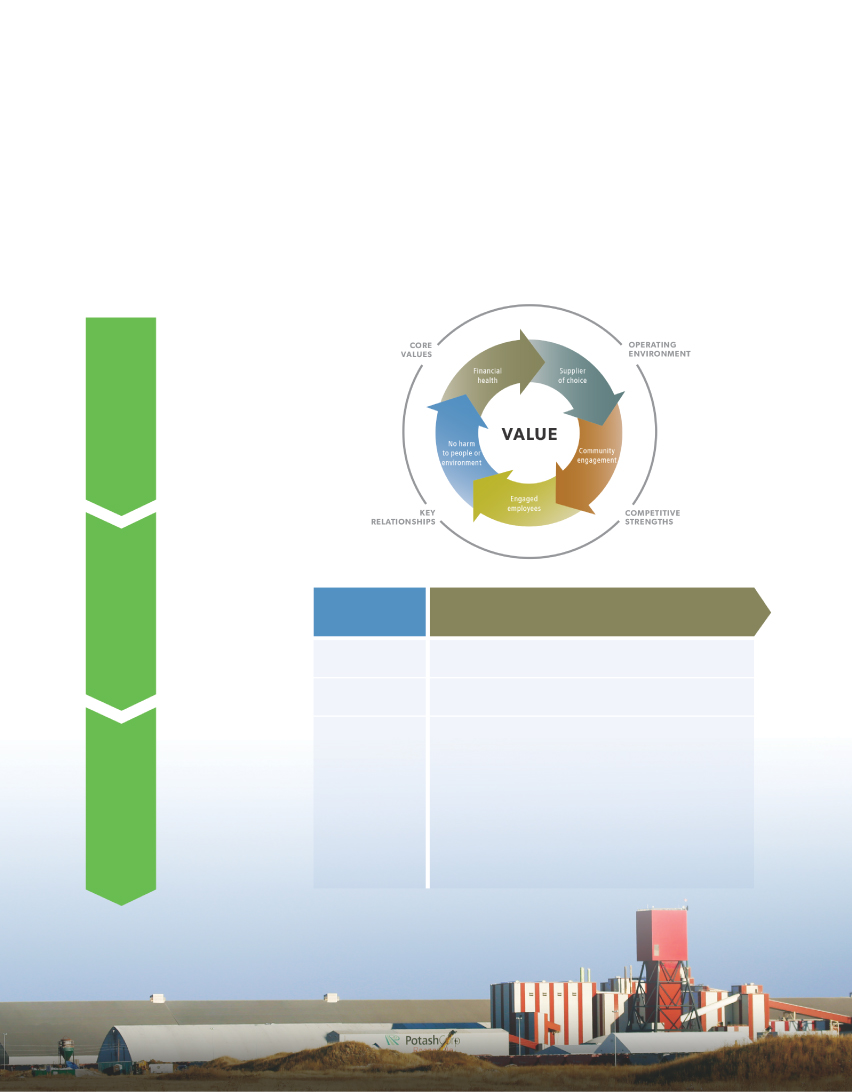
Our integrated reporting is informed by two important elements: our Value Model and our Priority Matrix. These tools help us focus and report on aspects of our business that are important to our company and stakeholders, and not just
from a financial standpoint. You will see how we use our Value Model – shown below – as a road map for developing our strategies, goals and targets, and to monitor and improve our performance.
Our Value Model and this report
At the heart of our company are our Core Values. You can learn more at potashcorp.com/values.
On Pages 9-17 we provide an overview of our company and discuss how the growing demand for food and fertilizer offers both opportunity and responsibility.
On Pages 18-19 we highlight PotashCorp’s unique strengths that help determine our strategy and enhance our ability to create value for stakeholders.
On Pages 20-23 we describe how our company goals are designed to consider the needs of our investors, customers, employees, communities and other business partners.

GOALS,STRATEGIES AND RISKS
On Pages 20-28 we introduce PotashCorp’s goals and the strategies we deploy to create long-term value for our stakeholders. We explain our risk management process and key considerations that could impact our success in achieving these goals.
| | |
| 2 | | PotashCorp 2013 Annual Integrated Report |
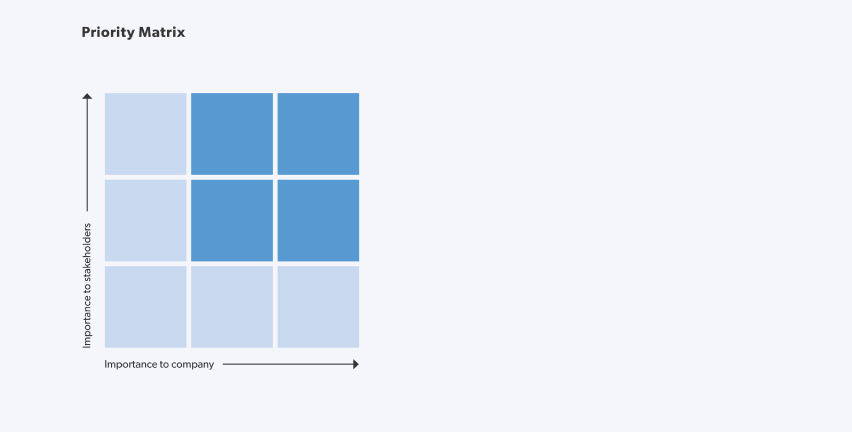
To stay focused and report on what matters most, we utilize a Priority Matrix.
Developed through in-depth discussions, stakeholder surveys and interviews, this tool – shown below – identifies and ranks areas that impact value creation from both a stakeholder (vertical axis) and a company (horizontal axis) perspective.
Higher-priority items for both PotashCorp and our stakeholders are highlighted in the upper right sections and are the primary focus of this report.
This tool helps ensure that we design our reporting to align with the long-term interests of our business and the people responsible for our success.

Top Section Items
Asset competitiveness
Community engagement
Compensation
Customer service
Emerging market growth
Employee engagement
Employee recruitment
Environmental performance
Ethical behavior
Financial performance
Global food security
Governance
Growth prospects
Innovation
Investment partners
Labor relations
Local spending
Marketing channels
Nutrient supply and demand
Operations reliability
Product stewardship
Project delivery
Regulatory compliance
Reputation
Reserves and asset management
Safety performance
Strategy and execution
Succession planning
Taxes
Transportation and distribution
Online reporting and its evolution
We are working to meet the needs of our stakeholders today, and in the years ahead. The evolution of our online reporting will continue with the launch of our “Reporting Hub.” This web tool will provide users with greater access to the information they require across all our public disclosure documents, eliminating the need to sort through multiple reports. Key features include:
| • | | Information filtering: tools to help find information in all public disclosure documents more efficiently |
| • | | Customization: ability to tailor reports to specific needs |
| • | | Additional information: performance against Global Reporting Initiatives (GRI) measures |
| | |
| PotashCorp 2013 Annual Integrated Report | | 3 |
Executive letters
Food and
fertilizer matter

William J. Doyle
We remain focused on
ensuring that our actions solidify the competitive position of your company today and in the years ahead.
– Bill Doyle

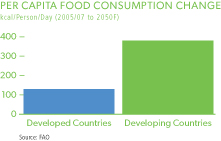
FAO’s estimated change in
global food consumption
between 2006 and 2050F
Dear Shareholders,
At PotashCorp, we manage with a long-term perspective. With every decision we make, we strive to better position your company to deliver on the potential – and the responsibility – that come from being able to help farmers grow more food for an ever-hungry world.
I’m sure those of you who have followed the company for a long time have often heard me speak about the challenge of producing enough food in the years and decades ahead. To understand the complexity of this undertaking, just ask any of the hundreds of millions of farmers around the world about the amount of time, resources and sweat equity they put into growing a crop – and the uncertainty around growing conditions that every season brings with it.
Today the world faces the challenge of producing enough food to feed more than seven billion people, with hundreds of millions added every decade. At the same time, the improving economic position for a large portion of that population means diets will continue to shift to more nutrient-intensive foods.
With limited additional arable land, it is clear that ensuring adequate global food production will continue to be a huge feat – one that we at PotashCorp think about every day.
What motivates us is that meeting future food production needs is not an insurmountable challenge. We can help overcome it by improving the productivity of every acre of farmland. While better practices and new technology are important parts of that equation, such advancements cannot replace the scientific need for essential nutrients in the soil.
This creates a growing need for our products. As the world’s largest fertilizer company by capacity, we are uniquely positioned to deliver.
STRATEGY MATTERS: PROTECTING AND BUILDING VALUE
The fundamental drivers that fuel our potential are compelling. Yet the inherent variability in agriculture – driven byoften-unpredictable growing conditions,
| | |
| 4 | | PotashCorp 2013 Annual Integrated Report |
changing farmer economics and evolving government policy – has caused fluctuations in an upward-sloping demand growth trend line for fertilizer.
This has been especially true in potash and there could be no better example than the last 10 years. After robust consumption growth in nearly every major market through 2007, global potash shipments have grown little.
With a future that is highly leveraged to global growth and the continued advancement of agronomic practices in the world’s developing regions, we expect bumps along the way. We have seen agronomic and economic conditions provide opportunities and challenges that highlight the variable nature of the potash business. In certain regions, such as Brazil, farmers have taken the steps necessary to improve crop production, and fertilizer consumption – including potash – is surpassing record levels. Yet in India, fiscal and political barriers continue to weigh on farmers’ ability to improve fertility practices and crop yields.
We began 2013 optimistic that potash markets would experience renewed growth. We saw it happen through the first six months as global shipments moved
at a record pace. However, a change in strategy announced by a competitor in late
July created significant market uncertainty, causing a sharp decline in shipments and prices in the second half of the year.
While we remain confident in our long-term outlook, we know that forecasting growth in a sometimes unpredictable environment can be difficult. Therefore, we remain focused on the things we can control and on ensuring that every action we take solidifies the competitive position of our company today and in the years ahead.
In late 2013, we took difficult but necessary steps to make operational changes and reduce our workforce by approximately 18 percent, with the biggest impact in our potash and phosphate segments. This was not an easy decision, and resulted in the loss of some great people. By taking these actions, however, we are helping to protect long-term value for all those who depend on our continued success.
For nearly 25 years as a publicly traded company, PotashCorp’s Board of Directors and management team have focused on building a company that is ready to respond to a rising need for fertilizer, while
remaining competitive and flexible enough to manage through challenging times.
We believe we are positioned to achieve both of these goals. We have developed the production capacity to drive our future growth, particularly in potash. This, coupled with a world-class distribution system, gives us the ability to respond efficiently to our customers’ needs. At the same time, we have plans that provide operational flexibility while improving the cost position of each of our three nutrients to protect the company’s long-term profitability. As demand grows, PotashCorp and our people are ready to deliver.
We work in a remarkable and critically important industry with a proud history and a bright future. After all, food matters – and matters a lot – and we are proud to play an instrumental role in the global solution while building long-term value for our stakeholders.

William J. Doyle
President and Chief Executive Officer
February 20, 2014
| | |
| PotashCorp 2013 Annual Integrated Report | | 5 |
Executive letters

Wayne R. Brownlee
FINANCIAL PERFORMANCE MATTERS
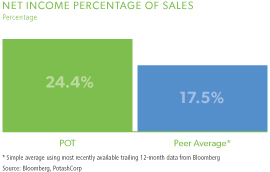
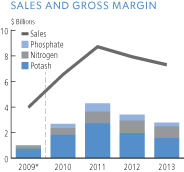
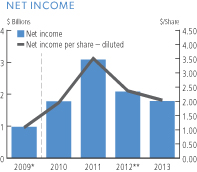
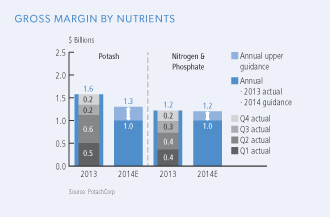
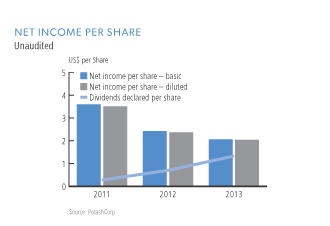
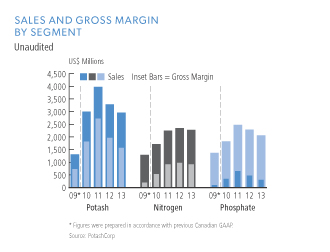
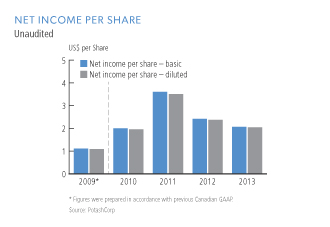
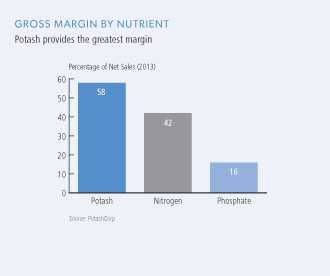
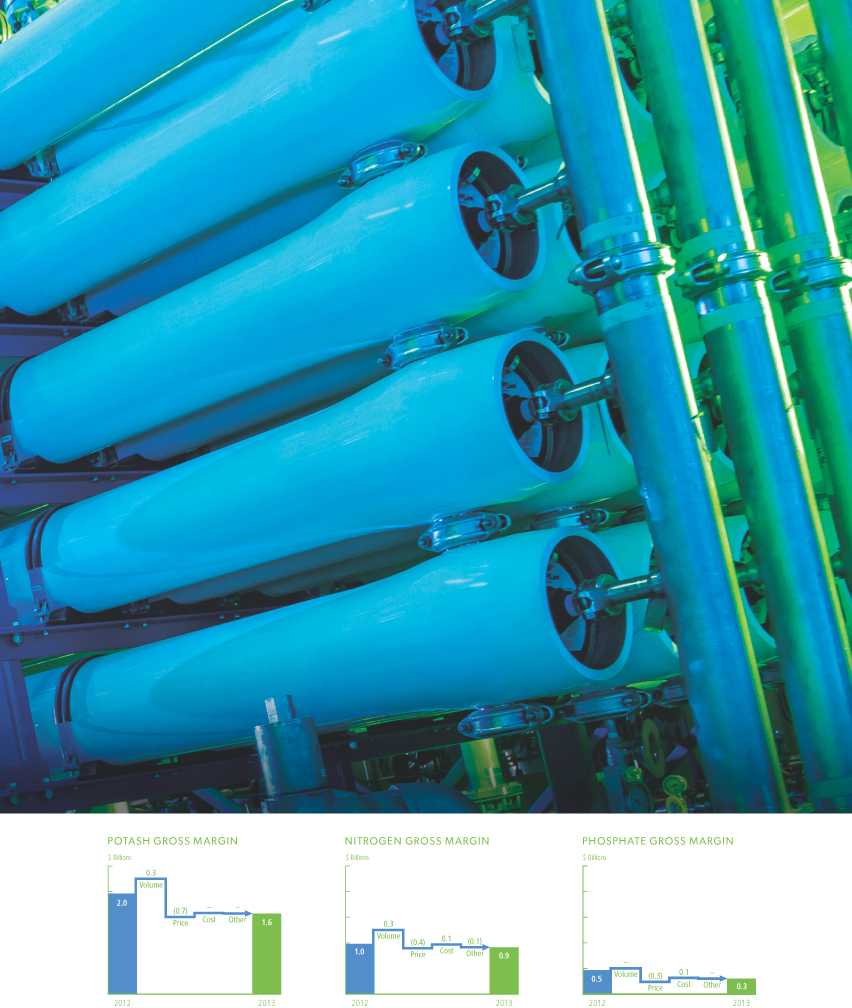
In 2013, PotashCorp delivered earnings of $2.04 per share, a result that trailed the previous year’s earnings of $2.37 per share. Through the first half of 2013, our results outpaced prior-year levels, primarily on the strength of global potash shipments. However, as the year unfolded, uncertainty in the global marketplace resulted in reduced sales volumes and lower prices. This led to gross margin of $1.6 billion in our potash segment, 20 percent less than our total last year.
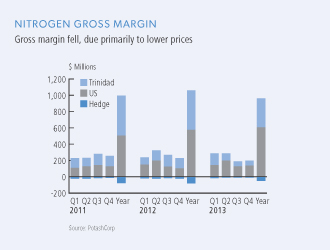
The advantaged position of our nitrogen assets helped generate $913 million in
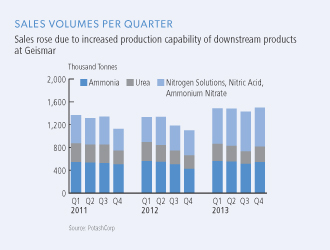
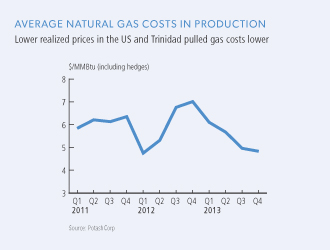
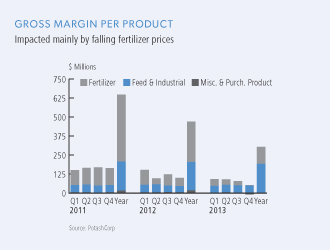
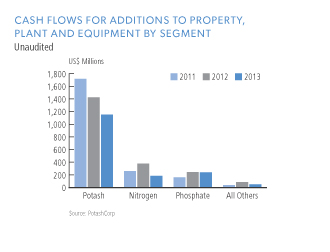
gross margin – 7 percent below our previous record. With the benefit of capacity expansions at Augusta and Geismar our nitrogen sales volumes increased by 19 percent, partially offsetting weaker prices. In phosphate, we generated $304 million in gross margin, with the stability of our industrial and feed products helping mitigate more volatile fertilizer markets.
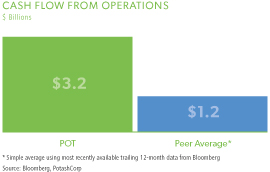
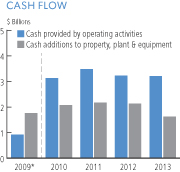
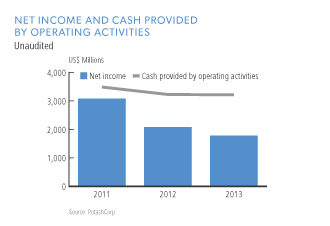
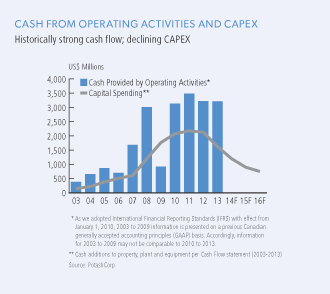
Even with earnings falling below our expectations at the beginning of the year, our ability to generate cash flow remained an area of strength. In 2013, cash flow from operating activities reached $3.2 billion, one of our highest totals on record. By the end of the year, spending on our multi-year potash expansion program was 93 percent complete, providing the potential for a significant lift to our free cash flow in the years ahead.
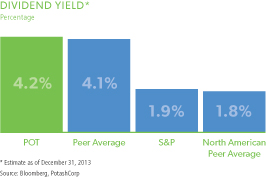
Fueled by belief in the long-term fundamentals and strength of our business model, we took important steps to help enhance shareholder returns. In 2013, we raised the dividend twice and remain confident in our ability to provide shareholders with a strong return on capital. We see dividend growth as one of our key tools to enhance shareholder value.
We also authorized a share repurchase program for up to 5 percent of outstanding common shares. By the end of the year, we had completed approximately 33 percent of the anticipated total share buyback at a cost of $445 million, or $31 per share.
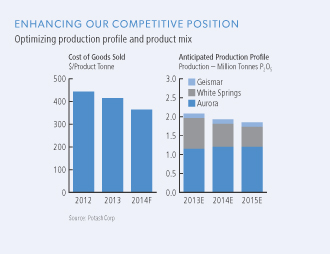
We took steps to improve our cost profile in all areas of our business. Most notably, we announced changes that are designed to optimize production at our lowest-cost potash operations, while retaining the ability to respond to anticipated demand levels and the product needs of our customers. This is expected to result in cash cost improvements from 2013 levels of $15-$20 per tonne in 2014 and $20-$30 per tonne by 2016.
At PotashCorp, we know performance matters. With a company that is well positioned to capture growth opportunities and generate strong cash flow, we believe we can create – and return – value for shareholders.

Wayne R. Brownlee
Executive Vice President and
Chief Financial Officer
February 20, 2014
| | | | |
 | | | | We remain confident in our ability to
provide shareholders with a strong
return on capital. – Wayne Brownlee 
Cash provided by operating activities in 2013 |
| | |
| 6 | | PotashCorp 2013 Annual Integrated Report |

G. David Delaney
OPERATIONAL EXCELLENCE MATTERS
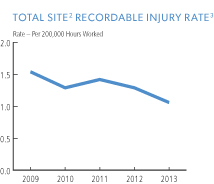
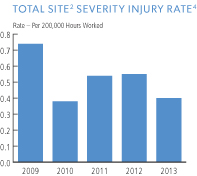
At PotashCorp, we operate with the view that our long-term financial success is a direct result of strong, consistent performance in all areas of our business. First and foremost is safety, and this year we made great strides toward realizing our goal of no harm to our people.
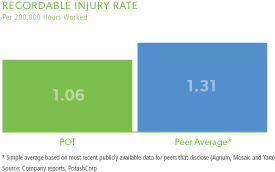
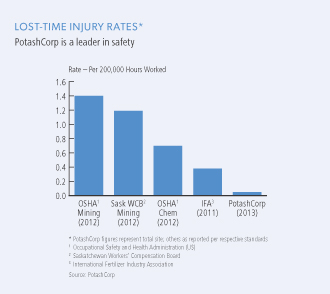
In 2013, we set an ambitious target to be one of the safest resource companies in the world within five years. To measure the company’s progress, we track our recordable injury rate and in 2013 we reduced it to 1.06 per 200,000 hours worked – a result that puts us on pace to meet our multi-year target. This result
represented an 18 percent improvement from the previous year and, while this was the best performance in PotashCorp’s history, we aim to reduce our recordable injury rate again in 2014.
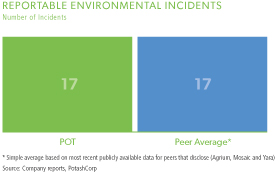
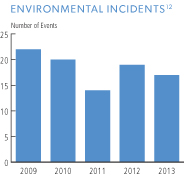
We are also committed to minimizing our environmental footprint. In 2013, we reduced reportable environmental incidents by 11 percent from the previous year, reflecting our increased focus in this essential area.
The operating changes and workforce reductions we announced in December were difficult, but will make us a more competitive company. We recognize that this decision was far-reaching, which is why our focus throughout the process was on ensuring we were respectful to our employees and why we remain committed to being a good neighbor in all the communities where we operate.
We made significant operational strides that are a testament to the efforts of our employees. In potash, the team at Cory completed a successful Canpotex allocation run during the first half of 2013. Our Allan operation is now preparing for its run during the first half of 2014, which is expected to play an important role in growing our offshore sales volumes.
Our multi-year potash capital expansion program moved closer to completion, with
only the Rocanville and Picadilly projects to be finished. Both of these expansions will help improve the competitive profile of our potash business.
After successfully and safely completing expansions at our Augusta and Geismar nitrogen facilities, we worked to advance our remaining project at Lima. That expansion will increase our ammonia and downstream product capacity, providing a stable source of lower-cost ammonia for our Aurora phosphate facility and allowing us to increase production of higher-margin nitrogen products.
In phosphate, we took steps to improve operational efficiencies across all facilities to protect the long-term value of our assets and ensure the business remains an important contributor to our future success.
Operating safely and efficiently matters and the entire PotashCorp team is committed – and able – to deliver best-in-class results for all our stakeholders.

G. David Delaney
Executive Vice President and
Chief Operating Officer
February 20, 2014
| | | | |
 | | | | We made significant operational strides
that are a testament to the efforts of
our employees. – David Delaney 
2013 reportable environmental incidents compared to 2012 |
| | |
| PotashCorp 2013 Annual Integrated Report | | 7 |

| | |
Management’s discussion & analysis of Financial Condition and Results of Operations (in US dollars) | | The following discussion and analysis is the responsibility of management and is as of February 20, 2014. The Board of Directors carries out its responsibility for review of this disclosure principally through its audit committee, comprised exclusively of independent directors. The audit committee reviews this disclosure and recommends its approval by the Board of Directors. The term “PCS” refers to Potash Corporation of Saskatchewan Inc. and the terms “we,” “us,” “our,” “PotashCorp” and “the company” refer to PCS and, as applicable, PCS and its direct and indirect subsidiaries as a group. Additional information relating to PotashCorp (which is not incorporated by reference herein) can be found in our regulatory filings on SEDAR at www.sedar.com and on EDGAR at www.sec.gov. All references to per-share amounts pertain to diluted net income per share (EPS) as described in Note 22 to the consolidated financial statements. |
A farmer and his son checking crops in the early morning.
An overview
of our nutrients

| | | | | | |
| | | |
| | | Potash (KCI) | | Nitrogen (NH3) | | Phosphate (P2O5) |
| How Used | | Fertilizer: | | Fertilizer: | | Fertilizer: |
| | Improves root strength and disease resistance; assists water retention; enhances taste, color and texture of food | | Builds proteins and enzymes; speeds plant growth | | Aids in photosynthesis; speeds crop maturity |
| | Feed: | | Feed: | | Feed: |
| | Aids in animal growth and milk production | | Essential to RNA, DNA and cell maturation | | Assists in muscle repair and skeletal development |
| | Industrial: | | Industrial: | | Industrial: |
| | | Used in soaps, water softeners, de-icers, drilling muds and food products | | Used in plastics, resins, adhesives and emission controls | | Used in soft drinks, food additives and metal treatments |
| How Produced | | Mined from evaporated sea deposits | | Synthesized from air using steam and natural gas or coal | | Mined from sea fossils |
| Number of Major Producing Countries | | 12 | | ~ 60 | | ~ 40 |
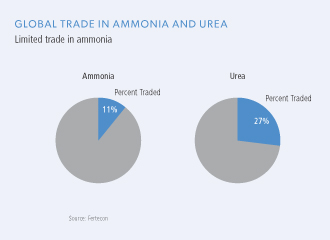
| Percentage of Global Production Traded | | 76% | | 11% | | 10% |
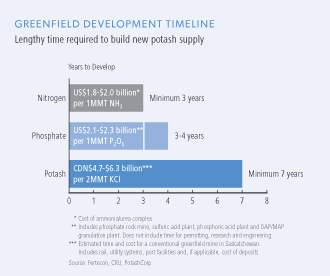
| Time for Greenfield(including ramp-up) | | Minimum 7 years1 | | Minimum 3 years | | 3-4 years2 |
| Cost of Greenfield(excluding infrastructure) | | CDN $4.2 billion1 2 million tonnes KCI | | $1.7 billion3 1 million tonnes NH3 | | $1.6 billion4 1 million tonnes P2O5 |
| Cost of Greenfield(including infrastructure) 5 | | CDN $4.7-$6.3 billion1 2 million tonnes KCI | | $1.8-$2.0 billion3 1 million tonnes NH3 | | $2.1-$2.3 billion4 1 million tonnes P2O5 |
| 1 | Estimated time and cost for a conventional greenfield mine in Saskatchewan |
| 2 | Does not include time for permitting, research and engineering |
| 4 | Phosphate rock mine, sulfuric acid plant, phosphoric acid plant and DAP/MAP granulation plant |
| 5 | Includes rail, utility systems, port facilities and, if applicable, cost of deposit |
| Source: | Fertecon, CRU, AMEC, PotashCorp |
| | |
| PotashCorp 2013 Annual Integrated Report | | 9 |
Our company
and operations
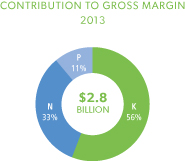
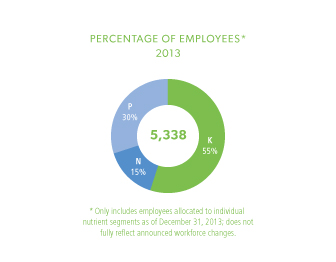
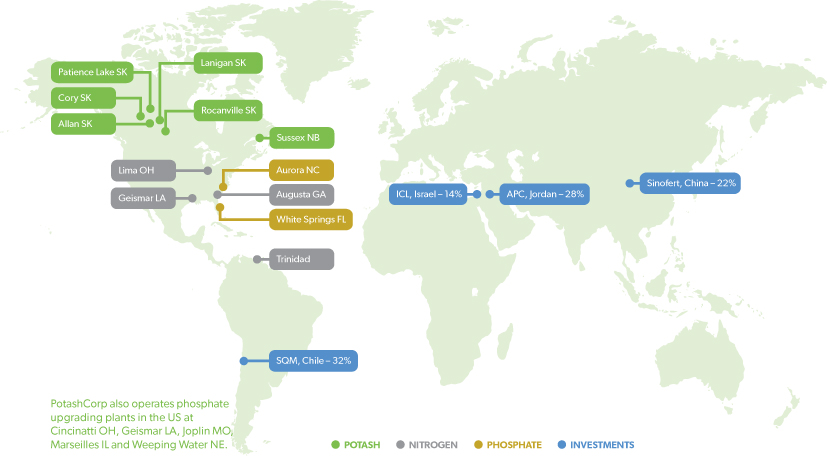
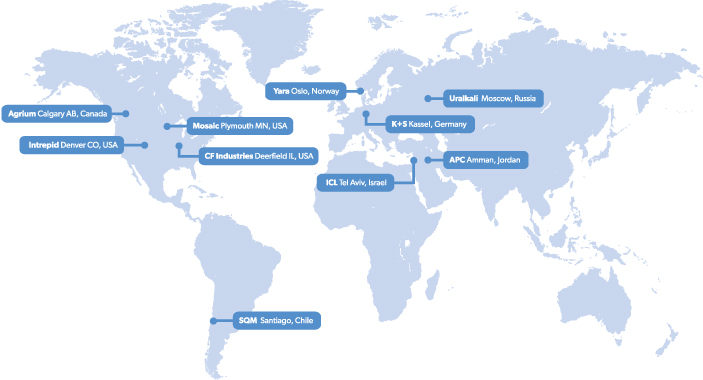
PotashCorp is the world’s largest fertilizer company by capacity, producing the three primary crop nutrients: potash (K), nitrogen (N) and phosphate (P).
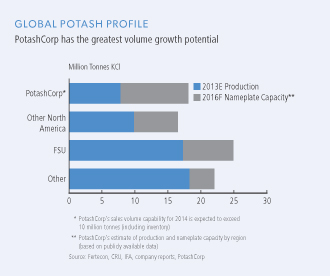
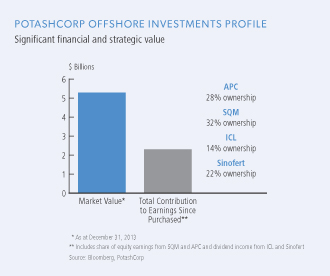
As the world’s largest potash producer by capacity, we are responsible for nearly one-fifth of global capacity through our Canadian operations. To enhance our global footprint, we have investments in four potash-related businesses in South America, the Middle East and Asia.
We are also one of the largest producers of nitrogen and phosphate, which provides earnings stability through our diverse product offerings.
With operations and business interests in seven countries, PotashCorp is an international enterprise and a key player in the growing challenge to feed the world.
| | |
| 10 | | PotashCorp 2013 Annual Integrated Report |
WHO WE ARE
OUR OPERATIONS AND COMMUNITIES
OUR BUSINESS SEGMENTS (2013)
| | | | | | | | | | | | |
| | | Global
Position 1 | | Share of
Gross Margin | | Sales Volumes by Product Category | | Sales Volumes by Region |
| | | | | |
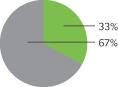
| Potash | | 19% of Global Capacity | | 56% | | 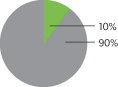
| | 
|
| | | | | |
| | | | | |
| Nitrogen | | 2% of Global Capacity | | 33% | | 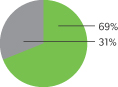
| | 
|
| | | | | |
| | | | | |
| Phosphate | | 4% of Global Capacity | | 11% | | 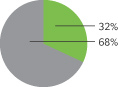
| |  |
| | | | | |
| | |  Fertilizer Fertilizer  Feed & Industrial North America Offshore Feed & Industrial North America Offshore
|
| | | Employees (total number 2) | | Safety
(total site 3 recordable injury rate 4) | | Environmental Incidents (total number 5) | | Community Investment 6
($ millions) |
| | | | | |
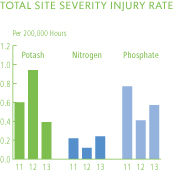
| Potash | | 2,912 | | 1.37 | | 13 | | 20 |
| | | | | |
| Nitrogen | | 789 | | 0.54 | | 1 | | 3 |
| | | | | |
| Phosphate | | 1,637 | | 1.07 | | 3 | | 3 |
| 1 | Based on nameplate capacity at year-end 2013, which may exceed operational capability (estimated annual achievable production level) |
| 2 | Only includes employees allocated to individual nutrient segments. The numbers are as at December 31, 2013 and do not fully reflect the announced workforce changes which, once finalized, will reduce the number of employees by approximately 1,045 by the end of 2014. |
| 3 | Total site includes PotashCorp employees, contractors and others on site |
| 4 | Site recordable injury rate is the total of recordable injuries for every 200,000 hours worked |
| 5 | Includes reportable quantity releases, permit excursions and provincial reportable spills |
| 6 | Excludes corporate contributions not allocated to nutrient segments |
| | |
| PotashCorp 2013 Annual Integrated Report | | 11 |
Comparability of Peer Information
This information is included for comparison only. All peer group financial information included in the performance summary was obtained from publicly available reports published by the respective companies. We have not independently verified and cannot guarantee the accuracy or completeness of such information.
Readers are cautioned that not all of the companies identified in this group prepare their financial statements (and accompanying notes) in accordance with International Financial Reporting Standards, as issued by the International Accounting Standards Board (IFRS). Accounting principles generally accepted in the jurisdictions in which these peers operate may vary in certain material respects from IFRS. Further, companies which do prepare their statements in accordance with IFRS may use varying interpretations of the standards. Such differences (if and as applicable) have not been identified or quantified for this performance summary. All financial information was based on the 12-month period comprising the most recent four fiscal quarters reported upon by such companies.
| | |
| 12 | | PotashCorp 2013 Annual Integrated Report |
| | |
| PotashCorp 2013 Annual Integrated Report | | 13 |

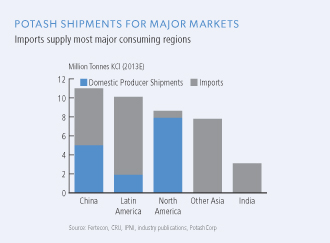
Operating environment
We are the world’s largest fertilizer company by capacity, and our ability to grow and make a difference is tied closely to the need for food.
As the global population increases and diets improve, the world faces a great challenge: to keep pace with the rising demand for food and sustainably improve productivity. Simply put, food matters.
While most commodities are important for global economic growth, our products play a pivotal role in sustaining production of humanity’s most basic need. Because we help the world grow more of the food it needs, we believe our opportunity is significant.
A Look Deeper
| | | | |
| | 
| |  |
| | ~70% FOOD DEMAND GROWTH attributed to population change | | ~30% FOOD DEMAND GROWTH attributed to diet change |
| | |
| 14 | | PotashCorp 2013 Annual Integrated Report |

Mother and daughter picking tea in Yangshuo, China.
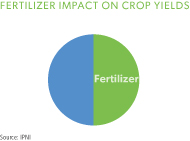
So how does the world meet this food production challenge? Given limited new arable land, fertilizer – potash, nitrogen and
phosphate – plays an essential role.
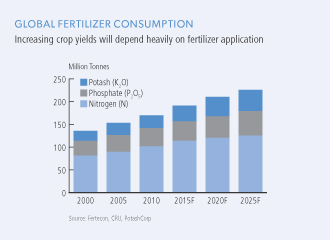
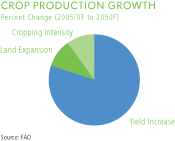
In fact, it is responsible for approximately half of all crop production on a global basis. To enhance yields, fertilizer use needs to both increase and be properly balanced to sufficiently replenish the vital nutrients that crops consume every year.
In developing countries, yields and fertilization practices significantly lag behind those of the developed world. It is why fertilizer matters – because it is the food that food needs.
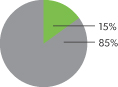
A Look Deeper
| | | | |
| | | | 
|
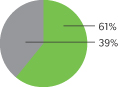
~80% FUTURE FOOD PRODUCTION expected to come from yields | | | | ~50% FOOD PRODUCTION attributed to fertilizer |
| | |
| PotashCorp 2013 Annual Integrated Report | | 15 |

Operating environment
While our fertilizer products help boost crop production around the world, PotashCorp’s vision of playing a key role in the global food solution extends well beyond the nutrients we produce.
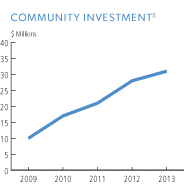
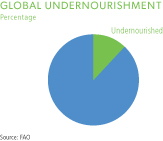
We strive to improve the well-being of the communities where we operate, and also support international regions where people still struggle to access adequate, nutritious food on a daily basis. With a focus on food security, our community investment efforts support our vision. Through sharing our agricultural knowledge and resources we have the ability to help others prosper.
A Look Deeper
| | | | |
| | | | 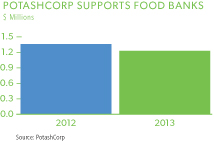 |
840million UNDERNOURISHED PEOPLE estimated globally | | | | $2.6million TOTAL INVESTMENT in local food banks over two years |
| | |
| 16 | | PotashCorp 2013 Annual Integrated Report |

We have a multi-pronged approach to food security issues: empowering farmers in developing countries to use sustainable agronomic practices, funding local community organizations such as food banks and supporting innovative agricultural research. Our commitment of $35 million to the Global Institute for Food Security addresses the increasing global demand for safe, reliable food through academic, government and corporate collaboration.
Driven by our vision and knowledge of food production, we continue to find ways to strengthen agriculture and food security initiatives – because future generations matter.
A Look Deeper
| | | | | | | | |
| | 
| | 
| | 
| | |
Corporate cash contributions to local and global food security initiatives in 20131 | | Informed about food security issues through speaking tours in 20132 | | In Kenya, India and China benefiting from agriculture and food security initiatives in 20133 | | In Trinidad attended agriculture training at PotashCorp’s Model Farm in 20134 | | |
1 Corporate level only; does not include employee matching gifts or site contributions
2 Through PotashCorp’s sponsorship of the international charity and education partner Free The Children
3 Through sponsorship of Free The Children and PotashCorp’s direct support of six communities on agriculture initiatives
4 Calculated by training course attendance
| | |
| PotashCorp 2013 Annual Integrated Report | | 17 |
Josanne Basanoo working with green pepper plants at our Model Farm in Trinidad.
Competitive
strengths
In a world where food matters – and the ability to produce more food is becoming increasingly important – we see PotashCorp’s role as one that also matters. As we develop and execute our strategies, and work towards achieving our goals, our competitive advantages allow us to capitalize on global opportunities, mitigate risk and create value for all our stakeholders.
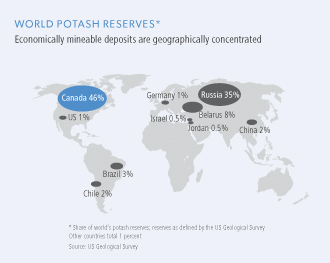
ACCESS TO LONG-LIVED, HIGH-QUALITY RESERVES
We have access to decades of high-quality potash and phosphate reserves with well-established infrastructure in politically stable regions of the world. As stewards of unique and valuable resources, we recognize the importance of managing our reserves with a long-term view.
How we enhance our advantage:
| • | | Develop long-term plans with the goal of ensuring that our reserves are mined in a sustainable, cost-effective manner. |
| • | | Manage mining risks such as ground collapses and flooding through the development and use of world-class technology and mining techniques. |
| • | | Implement projects to maximize ore production efficiency to minimize waste and increase recovery. |
INDUSTRY-LEADING POTASH POSITION
PotashCorp is the world’s largest potash producer by capacity, with access to five lower-cost production facilities in Saskatchewan and one in New Brunswick. We enhance our position with strategic investments in four globalpotash-focused companies that provide us with greater exposure to key growth markets and increase our company’slong-term potential.
How we enhance our advantage:
| • | | Optimize operations and distribution capability to maintain our competitivedelivered-cost advantage. |
| • | | Build on our potash position when value-adding opportunities arise. |
| • | | Maintain operational flexibility to meet growth potential. |
ADVANTAGED POSITIONS IN NITROGEN AND PHOSPHATE
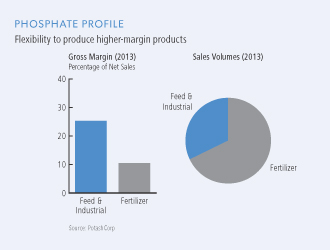
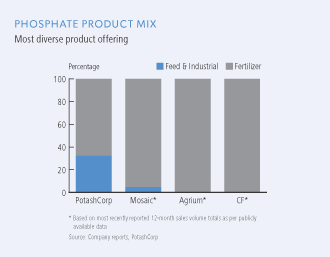
In nitrogen, access to lower-cost natural gas for our production facilities and the proximity of our plants to key markets provide a delivered-cost advantage compared to many suppliers. In phosphate, we produce the most diversified product offering relative to our peers. These positions have historically provided us with the ability to earn more stable margins.
How we enhance our advantage:
| • | | Deploy capital to maintain and expand existing assets, focusing on projects that improve efficiencies and provide quick financial paybacks. |
| • | | Develop and maintain strong relationships with key customers for specialized products. |
| • | | Leverage production flexibility to maximize gross margins. |
| | |
| 18 | | PotashCorp 2013 Annual Integrated Report |
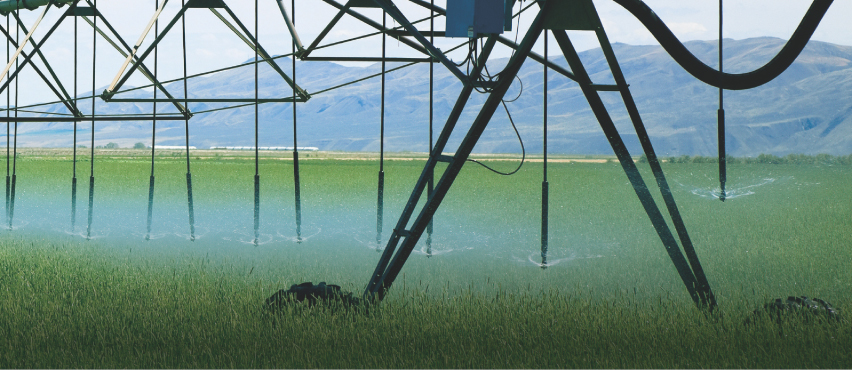
An irrigation system operating over a field.
ROBUST CASH FLOW AND FINANCIAL STRENGTH
Our business model has consistently generated positive cash flow. As our potash expansion program nears completion, our ability to generate free cash flow increases. This provides us with the opportunity to improve shareholders’ returns by investing in our business, and distributing cash through dividends and share repurchases.
How we enhance our advantage:
| • | | Evaluate potential uses of cash against a high internal required rate of return to ensure we fund only the most promising opportunities. |
| • | | Focus on maintaining an investment- grade debt rating to safeguard access to lower-cost credit in order to operate and grow our business. |
| • | | Optimize cost structure to protect and enhance long -term profitability. |
EXPERIENCED, ENGAGED MANAGEMENT TEAM AND WORKFORCE
With an established track record of success in conceiving, developing and executing value-enhancing strategies, PotashCorp’s leadership team is among the most experienced in the industry. Our workforce has a deep-rooted knowledge in all aspects of our operations, which leads to our strong performance in efficiency, safety and innovation.
How we enhance our advantage:
| • | | Strengthen our workforce by providing opportunities for professional growth and advancement. |
| • | | Structure our compensation and benefit programs so they reward performance and are highly competitive with our peers. |
| • | | Focus on leadership training across all key positions. |
STRONG CUSTOMER RELATIONSHIPS AND SUPPLY CHAIN
In North America, our experienced sales team, established relationships and extensive distribution network help us be the supplier of choice to our customers. Offshore, our partnership with Canpotex and our internal expertise in PCS Sales enable us to reliably meet the growing needs of a global customer base.
How we enhance our advantage:
| • | | Develop relationships with customers and seek to understand and meet their specific needs. |
| • | | Improve our global distribution network, focusing on opportunities to optimize our warehousing and distribution capabilities. |
| • | | Optimize our supply chain and procurement practices to achieve economies of scale. |
| | |
| PotashCorp 2013 Annual Integrated Report | | 19 |
Business strategy
HOW WE
CREATE VALUE
While all five goals are essential to sustained success, we believe that financial health is the cornerstone of enduring value for all our stakeholders.
Strong financial performance rewards our shareholders and, at the same time, allows us
to focus on our broader social and environmental responsibilities and contribute to the
long-term prosperity of our customers, employees and communities.
|
To play a role in the global food solution while building long-term value for our stakeholders. |
|
Our Value Model helps ensure we focus on building value for the many stakeholders who are important to our enduring success. Using this framework, our goals are shaped within a broader context – our operating environment, key relationships, competitive strengths and Core Values. |
|
We develop strategies that help ensure we can achieve our corporate goals. |
FINANCIAL
HEALTH
| | |
| |
Stakeholder | | Investors |
| |
Goal | | Create superior long-term shareholder value |
| |
Strategic
Approach | | • Prioritize future earnings growth and minimize volatility across all business segments: |
| | – Growth through potash first |
| | – Stability through diversified nitrogen and
phosphate businesses |
| | • Use capital to enhance shareholder returns through dividends,
share repurchases and improving our competitive advantages
primarily in potash. |
Our largest potash operation, located in Rocanville, Saskatchewan.

GROWTH THROUGH POTASH FIRST
| | |
Why we focus on it: | | |
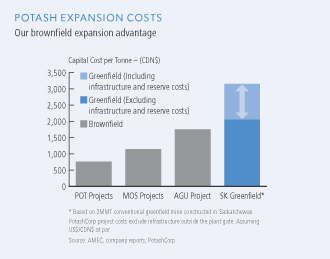
• High-margin business with few producers and significant potential for long-term demand growth | | • High costs and long timelines to build new capacity limit new entrants and enhance the value of existing production |
| |
| |  |
How we are positioned to deliver:
| | |
• Low-cost, scalable operations providing the greatest ability to increase sales volumes relative to peers | | • Strategic, offshore potash-focused investments enhance our exposure to key growth markets |
| |
| | 
|
Key approach:
| | |
• Grow sales volumes while protecting long-term value of the resource by matching our production to market demand | | • Improve our competitive position by optimizing cost structure and capitalizing on value-added growth opportunities |
| | |
| PotashCorp 2013 Annual Integrated Report | | 21 |
Business strategy
STABILITY THROUGH DIVERSIFIED NITROGEN AND PHOSPHATE BUSINESSES
| | |
Why we focus on them: | | |
• In nitrogen, our industrial focus and product mix historically generate more stable margins and less seasonal volatility | | • In phosphate, diverse product offering and production flexibility help minimize volatility in changing market conditions |
| |

| |  |
How we are positioned to deliver:
| | |
• Long-term relationships with industrial customers that value reliable supply | | • Access to high-quality phosphate rock and the industry’s most diverse production capabilities |
| |
| | 
|
Key approach:
| | |
• Protect position in nitrogen as lower delivered-cost supplier to the large US market by leveraging transportation advantages and improving operational efficiencies | | • Enhance competitive phosphate position by improving operational efficiencies, optimizing product mix portfolio and mining resources in a sustainable manner |
| | |
| 22 | | PotashCorp 2013 Annual Integrated Report |
| | |
A BROADER APPROACH TO VALUE CREATION | | At PotashCorp, we know that long-term success requires a commitment to building value and delivering results beyond our financial performance. |
| | By improving our customers’ opportunities for success, we strengthen our own ability to grow. By building mutually beneficial relationships with our employees and the communities where we operate, we are more likely to secure top talent and receive support for our business plans. And, by creating safe and environmentally sound operations, we benefit all our stakeholders. |
| | As a result, our goals and strategies focus on delivering strong performance to each of these stakeholder groups. |

NO HARM TO PEOPLE OR ENVIRONMENT
| | | | | | | | |
| Stakeholder | | Customers | | Communities | | Employees | | All |
| | | | |
| Goal | | Be the supplier of choice to the markets we serve | | Build strong relationships with and improve the socioeconomic well-being of our communities | | Attract and retain talented, motivated employees who are committed to ourlong-term goals | | Achieve no harm to people and no damage to the environment |
| | | | |
Strategic Approach | | • Understand customers’ needs and have the capability to meet expected future demand. • Establish standards for service and product quality that set us apart from our competition. | | • Contribute to local economic growth through employment, purchasing and taxes. • Invest in organizations and projects that contribute to the communities where we operate and help address global food security. | | • Offer competitive compensation and benefits; provide opportunities for development and advancement. • Communicate goals and expectations clearly, particularly related to our Core Values, workplace ethics, conduct and behavior. | | • Use best practicesand peer-to-peer behavioral-based processes to improve safety and environmental performance. • Meet or exceed all federal, state, provincial and local safety and environmental requirements. |
| | |
| PotashCorp 2013 Annual Integrated Report | | 23 |

Global risk
perspective
OVERVIEW OF OUR APPROACH
Successful execution of our corporate strategies and achievement of our business goals require that we continuously address the uncertainties within our global business environment. Our business is subject to constant and significant change that requires us to continuously assess our corporate strategies.
At PotashCorp, risk management is not a separate stand-alone program but, rather, an integrated discipline to support informed decision-making throughout the company. We recognize the pivotal role that risk management plays in balancing strategic planning with business execution and compliance. This facilitates informed decision-making and a conscious evaluation of both the upside opportunity and downside aspect of risk.
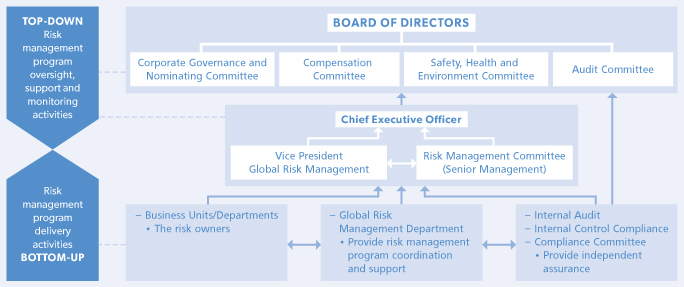
Our integrated approach to managing risk recognizes the need for clear and timely direction and support among the Board of Directors, senior management and our business unit management (‘top-down’ activities). Risk management is embedded into day-to-day decision-making and operational activities (‘bottom-up’ execution activities).
RISK MANAGEMENT AND RESPONSIBILITIES
The development of a risk-intelligent culture that recognizes responsibility for managing risk as a part of each employee’s daily activities is integral to our program.
Our risk management program and the related roles and responsibilities throughout the company are outlined in our risk management policy as approved by the Board of Directors. The policy also sets out our approach to risk management and aspects of our risk profile.
Risk management and oversight responsibilities are also outlined in the Board and committee charters.
Board of Directors:
| • | | Oversees and regularly reviews and evaluates the risk management program to ensure adequate policies, procedures and systems are in place to execute the strategy and manage related risk. This responsibility is primarily accomplished through committees that focus on risks within their areas of oversight. These committees are: |
| | – | | The safety, health and environment committee |
| | – | | The compensation committee |
| | – | | The corporate governance and nominating committee |
| • | | Annually, the Board dedicates a separate meeting to risk management with the risk management committee as described below. |
Chief Executive Officer:
The commitment and leadership from our CEO and the senior management team ensure that our risk management processes work effectively and responsibilities are appropriately assigned.
Risk Management Committee:
| • | | Maintains overall responsibility for risk management within and between the business units of the company. |
| • | | Comprised of cross-functional members of the senior management team, this committee monitors our overall risk factors associated with our business goals and targets. |
| | |
| 24 | | PotashCorp 2013 Annual Integrated Report |

David Murray and Anastasia Vander Most underground at our Allan mine.
| • | | Committee members act as the sponsors for risk management within their business units. |
| • | | Chaired by the Vice President, Global Risk Management, the committee meets quarterly or as required and reports to the CEO and the Board of Directors on all significant risks. |
Global Risk Management Department:
The Global Risk Management Department, under the leadership of the Vice President, Global Risk Management, reports directly to the CEO.
The department is the primary champion of the risk management program at all levels. It has overall responsibility for facilitating the risk management program.
Business Units/Departments:
Have day-to-day responsibility for managing risks which fall into their areas of responsibility. Operational risks arise from executing strategy at the business unit level. Business unit management is responsible to:
| • | | Consider risk exposures at all levels within their unit and also to consider the possible impact such risks may have on other areas. They should also consider the impact risks in other areas have on their unit. This responsibility is an essential aspect of integrated risk management. |
| • | | Communicate changes to existing or emerging risks to the Vice President, Global Risk Management and the appropriate senior management for evaluation and further consideration by the risk management committee. |
Risk Management
| | |
| PotashCorp 2013 Annual Integrated Report | | 25 |
Risk
| • | | Make sure each employee understands his/her responsibility for individual risks and has the ability to make intelligent, informed decisions that add value to the company. |
Internal Audit:
| • | | Provides independent and objective assurance and consulting services to evaluate and report to management and the audit committee on the effectiveness of governance, risk management and control processes. |
| • | | Focuses on auditing the risk management processes and activities across the company. |
| • | | Reports functionally to the audit committee and administratively to the CEO. |
Internal Control Compliance Team:
| • | | Ensures identification and management of risks related to internal controls over financial reporting by reviewing and testing such controls, and ensuring any issues identified are resolved. |
Compliance Committee:
| • | | Maintains overall responsibility for the administration of the company’s ethics and compliance program. |
| • | | Comprised of members of senior management, the committee reports to the audit committee. |
| • | | The compliance committee charter outlines the responsibilities of the committee, which include the evaluation of compliance risks. |
PROGRAM DEVELOPMENT
AND PRIORITIES
The Global Risk Management Department was established in 2013 to centralize coordination and enhance our risk management program. Priorities for 2014 are to:
| • | | Promote an enhanced risk-aware culture within the company. |
| • | | Ensure there is adequate education and training for the development of risk awareness by all business units. |
| • | | Improve internal processes and mechanisms for risk management. Ensure the risk roles within each business unit are clearly established. |
| • | | Coordinate enhanced regular reporting on risk to the company’s stakeholders, both internal and external. |
OUR RISK MANAGEMENT FRAMEWORK
The risk management committee is responsible for regular updates to our company-wide risk management framework. The framework
identifies risk events and applies the methodology outlined in the risk ranking matrix and guidelines as set out in our risk management policy. The framework focuses on the significant integrated strategic and business risk exposures that could keep us from achieving our goals and targets, which are monitored by the Board of Directors and various board committees. Information comes from a number of sources including our strategic planning process, our internal operations and external factors and events. Qualitative and quantitative factors are reviewed, which allows us to aggregate and evaluate our enterprise-level risk exposure and acceptance. Our corporate strategy is developed and monitored with reference to this framework.
Our risk profile provides a common understanding and basis for the discussion of risks impacting performance and for the development of risk mitigation strategies. Risk has many dimensions, and can be viewed or categorized from a number of perspectives. For example, risks arise from a variety of sources – external or internal to the company. Risks also must be addressed over a continuum of time horizons: short-, to medium-, to long-term. Risks that are external and have longer-term impact on our value model are sometimes referred to as strategic. Risks that have a shorter time frame and impact internal day-to-day activities are sometimes categorized as operational. We have established six categories of risks within our risk management framework: market/business, distribution, operational, financial, compliance and organizational.
Through the framework, we assess the likelihood/frequency of occurrence and severity of consequence of such potential events. We establish relative risk ranking levels from A through E to guide our mitigation activities. The mitigation response categories are: accept, control, share, transfer, diversify or avoid.
KEY BUSINESS RISKS AND UNCERTAINTIES
The risks that can threaten our business are often interrelated, and affect each other. As a result, we must fully understand the inherent risks within each category so we can design and implement mitigation activities that allow us to execute our strategies and meet our business goals within acceptable residual risk tolerances. We view damage to our reputation as the most severe risk consequence faced by PotashCorp, as it could impact the execution of our corporate strategy. We mitigate this risk consequence by acting ethically and with integrity while building value through our commitment to sustainability, transparency, effective communication and corporate governance best practices.
The PotashCorp risk management ranking methodology described on the next page is used to establish the key business risks specific to our company. Risks with A or B residual ranking or those for which we identify elevated changes within C, D or E residual ranking with long- or medium-term implications are monitored closely and are viewed as key business risks to our company.
| | |
| 26 | | PotashCorp 2013 Annual Integrated Report |
The key risks and uncertainties to our operations drive our operating strategies. These are discussed in the segment entitled “Our Nutrients” found on Pages 51-78. Potash, nitrogen and phosphate risks and mitigation activities are separately outlined.
For further discussion of significant risks we face, refer to Page 91 under Governance and Remuneration and the information under the section entitled “Risk Factors” in Item 1A of our Form 10-K for the fiscal year ended December 31, 2013.
KEY BUSINESS RISKS
Our key risks, in terms of severity of consequence and likelihood, are displayed as follows:
| | |
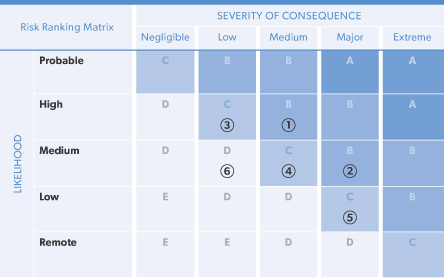
| | A Extreme: Initiate mitigation activities immediately to reduce risk. If such activities cannot sufficiently reduce risk level, consider discontinuation of the applicable business operation to avoid the risk. B Major: Initiate mitigation activities at next available opportunity to reduce risk. If such activities cannot sufficiently reduce the risk level, Board of Directors approval is required to confirm acceptance of this level of risk. C Medium: Level of risk is acceptable within tolerances of the risk management policy. Additional risk mitigation activities may be considered if benefits significantly exceed cost. D Low: Monitor risk according to risk management policy requirements, but no additional activities required. E Negligible: Consider discontinuing any related mitigation activities so resources can be directed to higher-value activities, provided such discontinuance does not adversely affect any other risk areas. |
Consistent with our integrated approach, the key risk mitigation activities are included in the related discussion within this Annual Integrated Report.
| | |

| | Global Potash Demand Insufficient to Consume PotashCorp Capacity |
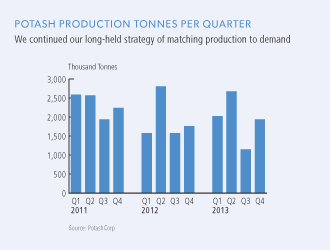
In preparation for an anticipated increase in world potash demand, we are investing in expansion and debottlenecking projects that we expect will be completed by 2015. If our estimates of future potash demand prove to be overstated, our return on this investment may be lower than expected due to lower earnings and the related opportunity cost of expending significant capital before the capacity was needed. We mitigate the risk of demand not meeting expectations by matching supply to demand and making the necessary operational changes to ensure we remain cost competitive.
| | |

| | Surplus Potash Supply Creates Market Imbalance |
Tight supply/demand fundamentals and strong gross margins have encouraged investment in new potash capacity. If supply rises faster than world consumption, prices could be depressed for a prolonged period, negatively affecting our financial performance. While we anticipate that long-term growth in potash consumption
will require increased supply, we know that fluctuations in demand are characteristic of this market. We attempt to mitigate this risk and protect our margins by producing potash to meet market demand.
| | |

| | Cyclicality in Phosphate |
Fluctuations in demand, changes in available supply and volatility in raw material costs have historically caused short-term cyclicality in phosphate markets. Volatility has often been exacerbated because of the significant involvement in the industry by governments, which typically follow operating philosophies that favor production over profitability.
Growth in world consumption may be outpaced over the next few years by increased competitive supply of solid fertilizer, potentially depressing prices and affecting our phosphate margins. We take action to mitigate this risk through our product diversification, leveraging our strengths in less cyclical industrial and feed products, and streamlining our operations and logistics to minimize costs.
| | |
| PotashCorp 2013 Annual Integrated Report | | 27 |
Risk
| | |

| | Price Cyclicality in Nitrogen |
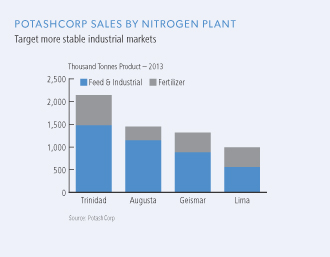
Price cyclicality can result when nitrogen supply is increased without consideration of demand, a situation that may occur in an industry that is highly fragmented and regional due to the extensive availability of natural gas. To mitigate this risk, we have longer-term gas contracts in Trinidad primarily indexed to ammonia prices and gas price hedging strategies for our US plants. We focus on supplying less cyclical industrial markets.
| | |

| | Underground Potash Mines Face Particular Risks |
Water-bearing strata that pose the risk of water inflow often exist in the vicinity of underground mines. We are successfully managing water inflows at our New Brunswick operation, while our other conventional mines currently have no significant water inflows.
| | |

| | Safety Performance |
Unsafe actions or conditions which can result in serious injury to our employees and contractors are areas of risk management that are a high priority. Exposures inherent to industrial sites, underground mines and construction projects exist at our operations. We have a dynamic program of mitigating activities to minimize the risks and protect employees and contractors at our sites. Our goal to achieve no harm to people is supported by company-wide safety systems and training to reinforce behavioral-based practices.
| | |
| 28 | | PotashCorp 2013 Annual Integrated Report |
Source: PotashCorp
Our
performance
A reverse osmosis system at our nitrogen operation in Augusta, Georgia.
Performance
Financial performance highlights
FINANCIAL POSITION(At December 31)
FINANCIAL RESULTS(For the years ended December 31)
| * | As we adopted IFRS with effect from January 1, 2010, our 2009 information is presented on a previous Canadian generally accepted accounting principles (GAAP) basis. Accordingly, information for 2009 may not be comparable to the years 2010-2013. |
| ** | Includes impairment loss related to our investment in Sinofert of $341 million or $0.39 per share – diluted. |
| | |
| 30 | | PotashCorp 2013 Annual Integrated Report |
EARNINGS PER SHARE
We report our results (including gross margin) in three business segments: potash, nitrogen and phosphate, as described in Note 16 to the consolidated financial statements. Our reporting structure reflects how we manage our business and how we classify our operations for planning and measuring performance. We include net sales in our segment disclosures in the consolidated financial statements pursuant to IFRS, which require segmentation based upon our internal organization and reporting of revenue and profit measures. As a component of gross margin, net sales (and the related per-tonne amounts) are the primary revenue measures we use and review in making decisions about operating matters on a business segment basis. These decisions include assessments about potash, nitrogen and phosphate performance and the resources to be allocated to these segments. We also use net sales (and the related per-tonne amounts) for business planning and monthly forecasting. Net sales are calculated as sales revenues less freight, transportation and distribution expenses. Realized prices refer to net sales prices. Certain of the prior years’ figures within the nitrogen segment have been reclassified to conform with the current year’s presentation.
2013 Earnings Compared to Guidance
Our initial midpoint estimate for 2013 EPS, based on the outlook and assumptions described in our 2012 Annual Integrated Report, was approximately $3.00. The final result was $2.04. The factors contributing to this decrease from our guidance midpoint were:
| | | | |
| Cause | | Effect on EPS | |
Potash offshore realized prices | | $ | (0.13 | ) |
Potash North America realized prices | | | (0.10 | ) |
Potash offshore sales volumes | | | (0.17 | ) |
Potash North America sales volumes | | | (0.06 | ) |
Decreased potash costs due to foreign exchange | | | 0.03 | |
Severance-related costs from workforce reduction | | | (0.03 | ) |
Increased other potash costs | | | (0.03 | ) |
Decreased provincial mining taxes | | | 0.05 | |
Subtotal potash | | | (0.44 | ) |
Nitrogen realized prices | | | (0.18 | ) |
Manufactured nitrogen sales volumes | | | (0.06 | ) |
Decreased cost of natural gas | | | 0.03 | |
Increased other nitrogen costs | | | (0.04 | ) |
Subtotal nitrogen | | | (0.25 | ) |
Phosphate realized prices | | | (0.08 | ) |
Phosphate sales volumes | | | (0.01 | ) |
Decreased sulfur input costs | | | 0.03 | |
Increased rock costs | | | (0.03 | ) |
Increased other phosphate costs | | | (0.03 | ) |
Subtotal phosphate | | | (0.12 | ) |
Decreased dividend income | | | (0.05 | ) |
Increased other expenses | | | (0.03 | ) |
Increased finance costs | | | (0.03 | ) |
Subtotal other | | | (0.11 | ) |
Subtotal of the above | | | (0.92 | ) |
Discrete items impacting income taxes and lower income tax rate on ordinary income | | | (0.05 | ) |
Reduction in weighted average number of shares outstanding | | | 0.01 | |
Total variance from 2013 EPS guidance | | $ | (0.96 | ) |
2013 Earnings Compared to 2012
Our EPS for 2012 was $2.37. The EPS for 2013 was $2.04. The factors contributing to this decrease from last year’s actual results were:
| | | | |
| Cause | | Effect on EPS | |
Potash offshore realized prices | | $ | (0.39 | ) |
Potash North America realized prices | | | (0.26 | ) |
Potash offshore sales volumes | | | 0.07 | |
Potash North America sales volumes | | | 0.20 | |
Decreased potash costs due to brine inflow | | | 0.08 | |
Decreased potash costs related to Esterhazy | | | 0.09 | |
Severance-related costs from workforce reduction | | | (0.03 | ) |
Increased provincial mining taxes and other potash costs | | | (0.10 | ) |
Subtotal potash | | | (0.34 | ) |
Nitrogen realized prices | | | (0.24 | ) |
Manufactured nitrogen sales volumes | | | 0.12 | |
Decreased cost of natural gas | | | 0.03 | |
Decreased other nitrogen costs | | | 0.04 | |
Subtotal nitrogen | | | (0.05 | ) |
Phosphate realized prices | | | (0.23 | ) |
Phosphate sales volumes | | | 0.03 | |
Decreased sulfur input costs | | | 0.07 | |
Increased other phosphate costs | | | (0.01 | ) |
Subtotal phosphate | | | (0.14 | ) |
Decreased share of earnings of equity-accounted investees | | | (0.07 | ) |
Decreased dividend income | | | (0.04 | ) |
Impairment of available-for-sale investment in 2012 | | | 0.39 | |
Decreased other expenses | | | 0.01 | |
Increased finance costs | | | (0.03 | ) |
Subtotal other | | | 0.26 | |
Subtotal of the above | | | (0.27 | ) |
Higher income tax rate on ordinary income | | | (0.03 | ) |
Discrete items impacting income taxes | | | (0.03 | ) |
Total variance from 2012 EPS | | $ | (0.33 | ) |
| | |
| PotashCorp 2013 Annual Integrated Report | | 31 |
Performance
Non-financial performance highlights
INVESTORS SAFETY
COMMUNITY
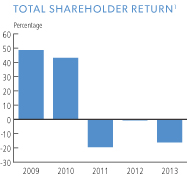
| 1 | Total shareholder return is calculated as the end-of-year closing share price less beginning-of-year opening share price plus dividends per share paid throughout the year(ex-dividend date) all divided by beginning-of-year opening share price. |
| 2 | Total site includes PotashCorp employees, contractors and others on site. |
| 3 | Total recordable injuries multiplied by 200,000 hours worked divided by the actual number of hours worked. |
| 4 | Total of lost-time injuries and modified work injuries for every 200,000 hours worked. |
| 5 | Represents cash disbursements, matching of employee gifts and in-kind contributions of equipment, goods, services and employee volunteerism (on corporate time). |
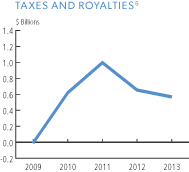
| 6 | Taxes and royalties = current income tax expense (which was already reduced by the realized excess tax benefit related to share-based compensation under previous Canadian GAAP) – investment tax credits – realized excess tax benefit related to share-based compensation (under IFRS) + potash production tax + resource surcharge + royalties + municipal taxes + other miscellaneous taxes; all amounts calculated on an accrual basis. |
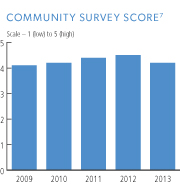
| 7 | The PotashCorp Survey of Community Opinion is conducted annually by an independent third party in the communities where we have significant operations; each community is generally surveyed every three years. Community leaders and representatives are interviewed by telephone and are asked to provide a ranking in three broad areas: perception of community involvement (value to the community, image and communication), business practices (market presence, safety performance and environmental performance) and economic issues (contribution to the local economy and support for expansion). A local option question may be developed to address a specific interest of each community. Each question is rated on a scale of 1 (low) to 5 (high) and results are determined by taking a simple average of the metrics described above. |
| | |
| 32 | | PotashCorp 2013 Annual Integrated Report |
ENVIRONMENT
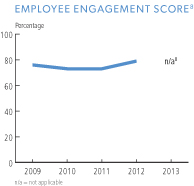
| 8 | A confidential external survey has been generally administered to every employee every second year to sites on a rotating basis, and was last administered in 2012. No survey was conducted in 2013 and the company will administer the next survey to all employees in 2014. The employee engagement score represents the proportion of employee responses of “Agree” or “Strongly Agree” to 10 employee engagement statements. |
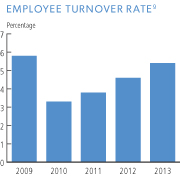
| 9 | The number of permanent employees who left the company (due to deaths, voluntary and involuntary terminations and excluding retirements), as a percentage of average total employees during the year. Retirements and terminations of temporary employees are excluded. Results in 2013 include a portion of the impact of our announced workforce reduction and the remaining impact will be reflected in 2014. |
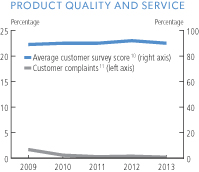
| 10 | The annual customer satisfaction survey is conducted online by an independent third party and includes a select group of top customers from each sales segment and region to form a Customer Advisory Council. Customers were asked to commit to participate in annual satisfaction surveys for five years, to ensure consistent measurement and reporting of customer satisfaction. Results are determined by taking a simple average of our individual product quality and customer service scores in fertilizer, feed, industrial nitrogen and purified phosphate. |
| 11 | Customer complaints are product tonnes involved in customer complaints as a percentage of manufactured product tonnes. A complaint occurs when our product does not meet our product specification sheet requirements, our chemical analysis requirements or our physical size specifications (for example, product is undersized, has too many lumps or has too much dust). |
| 12 | Includes reportable quantity releases, permit excursions and provincial reportable spills. |
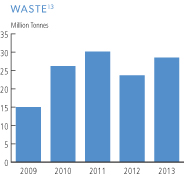
| 13 | Comprised of waste or byproducts from mining, including: coarse and fine tailings from potash mining, salt as brine to injection wells and gypsum. |
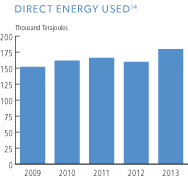
| 14 | Direct energy used is energy consumed by our operations in order to mine, mill and manufacture our products. Energy is used by burning fossil fuels, reforming natural gas and consuming electricity. |
| | |
| PotashCorp 2013 Annual Integrated Report | | 33 |
Performance
Year in review
FACTORS AFFECTING OUR 2013 PERFORMANCE
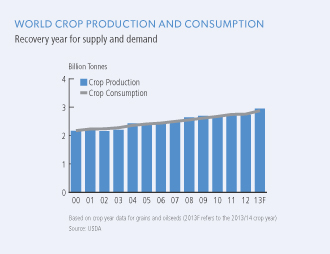
A volatile year in agriculture
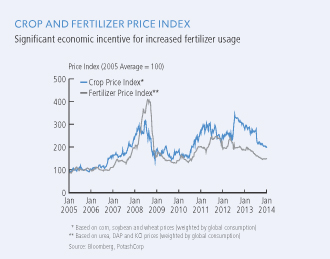
During the first half of 2013, grain and oilseed supply was extremely tight, supporting robust pricing for agricultural commodities. This led to record global plantings and efforts to increase yields, although difficult seeding and growing conditions in several major Northern Hemisphere regions created supply uncertainty.
As the growing season progressed, conditions in most major regions improved and were favorable for crop development. With the likelihood of a large global crop becoming increasingly evident, prices for many agricultural commodities weakened, stimulating a strong rebound in crop demand. This response, coupled with the expectation of healthy demand in 2014, helped mitigate further crop price declines and kept most above the 10-year average.
Market uncertainty and competitive pressures impacted potash pricing
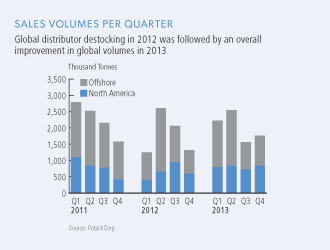
Potash market conditions – and the resulting impact on our performance – were especially volatile in 2013.
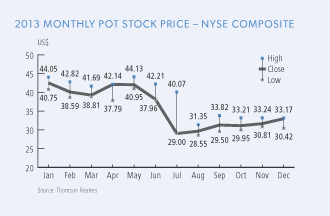
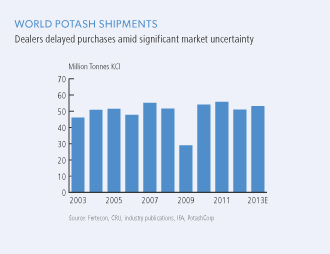
Early in the year, potash shipments were strong despite limited purchases by India, which continues to be negatively impacted by domestic subsidy issues. Although demand was relatively robust, buyers carefully managed their inventories. This cautious approach was further exacerbated by an announced change in marketing strategy by Uralkali, one of our large offshore competitors, in late July. Beyond the impact on shipments, prices weakened by approximately 30 percent in most major markets.
Key Asian markets delayed purchases or were reluctant to accept major tonnage against existing contracts. Latin America – particularly Brazil – remained a region of strength, purchasing and applying record volumes as farmers responded to supportive crop economics. In North America, a late harvest resulted in a shorter fall application window – especially in comparison to the early start in 2012. Despite this delay, demand re-emerged during the final quarter of the year as growers began addressing the nutrient requirements of their soils.
Given weak demand in most markets during the second half, we estimate that 2013 global potash shipments reached approximately 53 million tonnes, down from our initial estimate at the beginning of the year of 55-57 million tonnes.
| | |
 | | 
|
| | |
| 34 | | PotashCorp 2013 Annual Integrated Report |
Increased nitrogen supply more than offsets strong demand
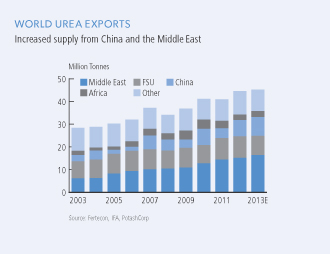
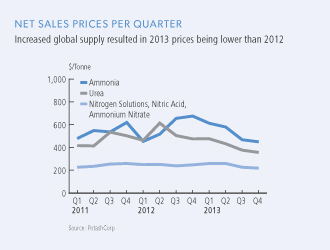
Global nitrogen consumption remained robust in 2013 but additional supply from major exporting regions contributed to a weaker pricing environment. For urea, robust global import requirements were more than offset by the combination of record exports from China and increased supply from Middle Eastern producers.
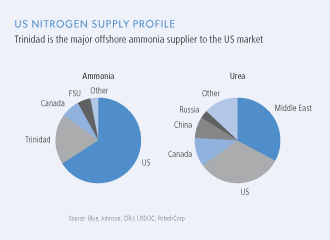
Ammonia supply issues in North Africa, Iran and Trinidad resulted in tighter supply fundamentals and provided some support for ammonia pricing relative to urea. However, weakened demand for ammonia in the phosphate sector (it is a key raw material in DAP and MAP production) and a shift by some producers to ammonia and away from other downstream products, put pressure on global markets.
Markets showed signs of improvement near the end of the year due to plant curtailments in higher-cost regions, export permit issues in North Africa and strong import demand from South Asian countries.
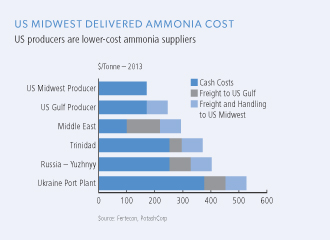
Nitrogen producers in the US benefited from relatively low natural gas prices and a delivered-cost advantage over most offshore suppliers. This supported a 5 percent increase in domestic ammonia production and continued interest in plant expansion and greenfield projects.
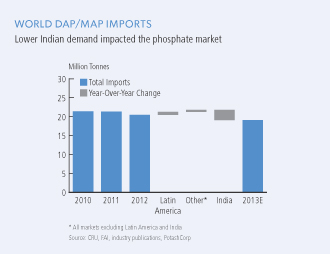
Lower Indian demand hindered phosphate market
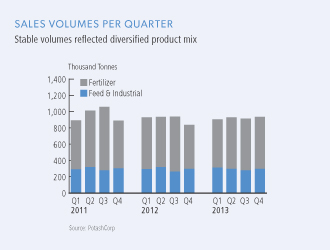
The lack of significant and sustained engagement by buyers from India resulted in challenging global phosphate markets throughout most of 2013. Strong demand for solid fertilizer products from Latin America was more than offset by weakness in India – the largest phosphate importer in the world. With Indian imports declining by more than 2.5 million tonnes from 2012 levels, global phosphate trade weakened.
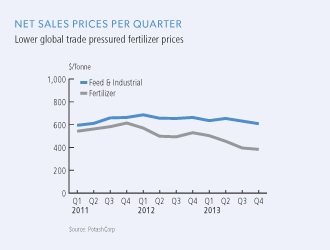
The reduction in global trade, combined with a modest increase in capacity, put downward pressure on pricing for most phosphate products, particularly solid fertilizers.
| | |
| PotashCorp 2013 Annual Integrated Report | | 35 |
Performance
Business outlook
FACTORS THAT COULD SHAPE OUR PERFORMANCE IN 2014
Global Agriculture
After multiple years of strong crop prices, 2014 begins with a more tempered outlook. Despite the expectation of increased demand for grain and oilseeds and the need for another record or near-record crop, more balanced global supplies have reduced near-term pressure on world commodity markets.
Even with the potential for a weaker environment, crop returns moving into the spring season remain supportive for farmers in key growing regions. With pullbacks in nutrient prices, fertilizer affordability remains high and we anticipate that global fertilizer consumption will continue to be strong. Record crop production in 2013 left behind a significant agronomic need to replenish soil nutrients. We expect farmers, especially those in more developed agricultural economies, will strive to enhance soil productivity to maximize returns from each acre. For those markets more influenced by government policies – specifically, India and China – we anticipate that rising support prices for grains will provide incentive to improve crop production.
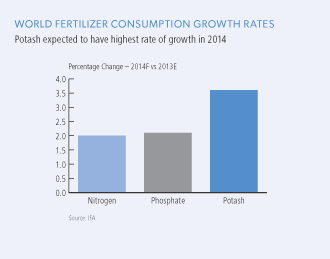
Potash
As we enter 2014, the uncertainty that persisted in the months following Uralkali’s announced strategy change appears to have
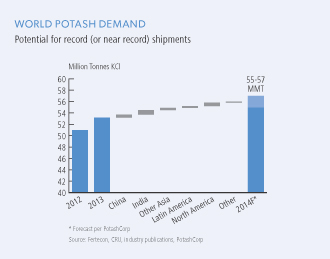
eased and customers are engaged again. While we anticipate global potash shipments could reach 55-57 million tonnes, the sharp decline in prices during the second half of 2013 is expected to result in weaker margins relative to those of recent years.
We anticipate that first-half shipments to all key markets will be robust given significant purchase deferrals through the last half of 2013. Recently signed contracts between China and major offshore suppliers – including Canpotex – are expected to provide a baseload of shipments through the end of June and encourage demand momentum in other markets. While we expect consumption in all key markets to rise in 2014, the extent of the rebound will largely depend on the continued engagement in the second half of the year and the commitment of key developing markets – particularly India – to address ongoing nutrient deficiencies.
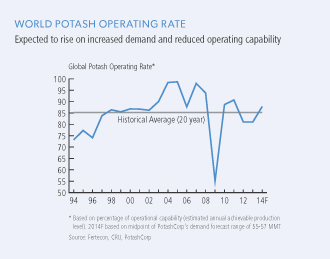
Based on our anticipation of increased demand in 2014 and lower global operational capability resulting largely from the workforce changes we announced in December, we believe industry operating rates could rise from previous-year levels and support more stable global markets.
| | |
 | | 
|
| | |
| 36 | | PotashCorp 2013 Annual Integrated Report |
Nitrogen
Global nitrogen consumption is expected to increase by approximately 2 percent in 2014, driven by supportive agricultural fundamentals and stable industrial demand. Although we anticipate relatively balanced supply/demand fundamentals in nitrogen, several factors are likely to influence the world market.
In ammonia, reduced gas costs in Ukraine – a key exporting country – are expected to improve its competitiveness and could result in more moderate prices compared to the elevated levels realized during the first half of 2013. An important factor will be exports from North African producers, where low-cost capacity has increased but issues related to gas supply and export approvals could affect the reliability of supply. In global urea markets, China is expected to remain a key factor given its significant excess capacity. We anticipate urea exports will remain relatively consistent with the record 8.3 million tonnes of 2013, although the relaxation of China’s export tax policy is expected to result in a more even distribution throughout the year.
US nitrogen producers should continue to benefit from a low-cost position relative to key export suppliers in China, Europe and
Ukraine. This is likely to result in the continued generation of strong margins for producers, although they are unlikely to sustain the levels achieved during the previous two years.
Phosphate
While we believe demand in both Latin America and North America will be strong in 2014, driven by agronomic need and supportive crop economics, the magnitude of demand recovery in India is central in determining the strength of global phosphate markets. India is expected to enter the year with significantly lower inventories than in 2013, which should support increased demand for imports from this major consuming country.
On the supply side, we anticipate that exports from Saudi Arabia and Morocco will increase, which could impact the level of exports required from the US. In China, revised export tax policies could make product more consistently available throughout the year, although we believe product available for trade is unlikely to rise significantly given the higher cost structure of many domestic producers.
| | |
| | 
|
| | |
| PotashCorp 2013 Annual Integrated Report | | 37 |
Performance
2014 EARNINGS PER SHARE AND RELATED SENSITIVITIES
The company’s estimate for 2014 EPS (as of January 29, 2014) ranged from $1.40 to $1.80 based on the outlook and assumptions as at that date described herein, which compared to the 2013 actual results of $2.04. The expected primary causes of this variance are presented in the accompanying graph.
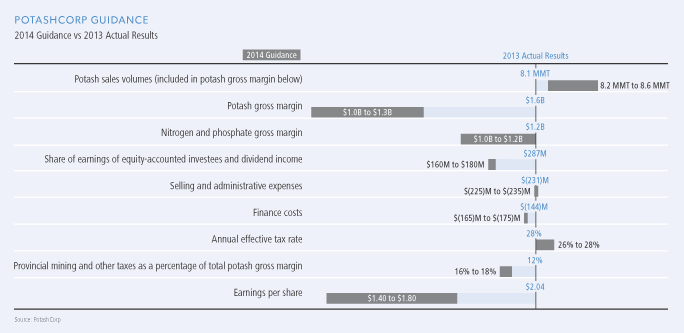
A number of factors affect the earnings of the company’s three nutrient segments. The tables below show the key factors and their approximate anticipated effect on EPS based on the assumptions used in estimating 2014 earnings guidance.
| | | | | | |
Input Cost Sensitivities | | Effect
on EPS | |
NYMEX gas price increases by $1/MMBtu | | Nitrogen | | | -0.06 | |
| | Potash | | | -0.01 | |
| Sulfur changes by $20/long ton | | Phosphate | | | ±0.03 | |
| Canadian to US dollar strengthens by $0.02 | | Canadian operating expenses net of provincial taxes and translation gain/loss | | | -0.02 | |
| Saskatchewan potash capital expenditures reduced by $200 million | | Provincial mining and other taxes | | | -0.05 | |
| | | | | | |
Price and Volume Sensitivities | | Effect
on EPS | |
Price | | Potash changes by $20/tonne | | | ±0.11 | |
| | DAP/MAP changes by $30/tonne | | | ±0.03 | |
| | Ammonia increases by $30/tonne | | | | |
| | Ÿ Nitrogen | | | +0.02 | |
| | Ÿ Phosphate | | | -0.01 | |
| | | Urea changes by $30/tonne | | | ±0.04 | |
Volume | | Potash changes by 100,000 tonnes | | | ±0.01 | |
| | Nitrogen changes by 50,000 N tonnes | | | ±0.01 | |
| | Phosphate changes by 50,000 P2O5 tonnes | | | ±0.01 | |
| | |
| 38 | | PotashCorp 2013 Annual Integrated Report |
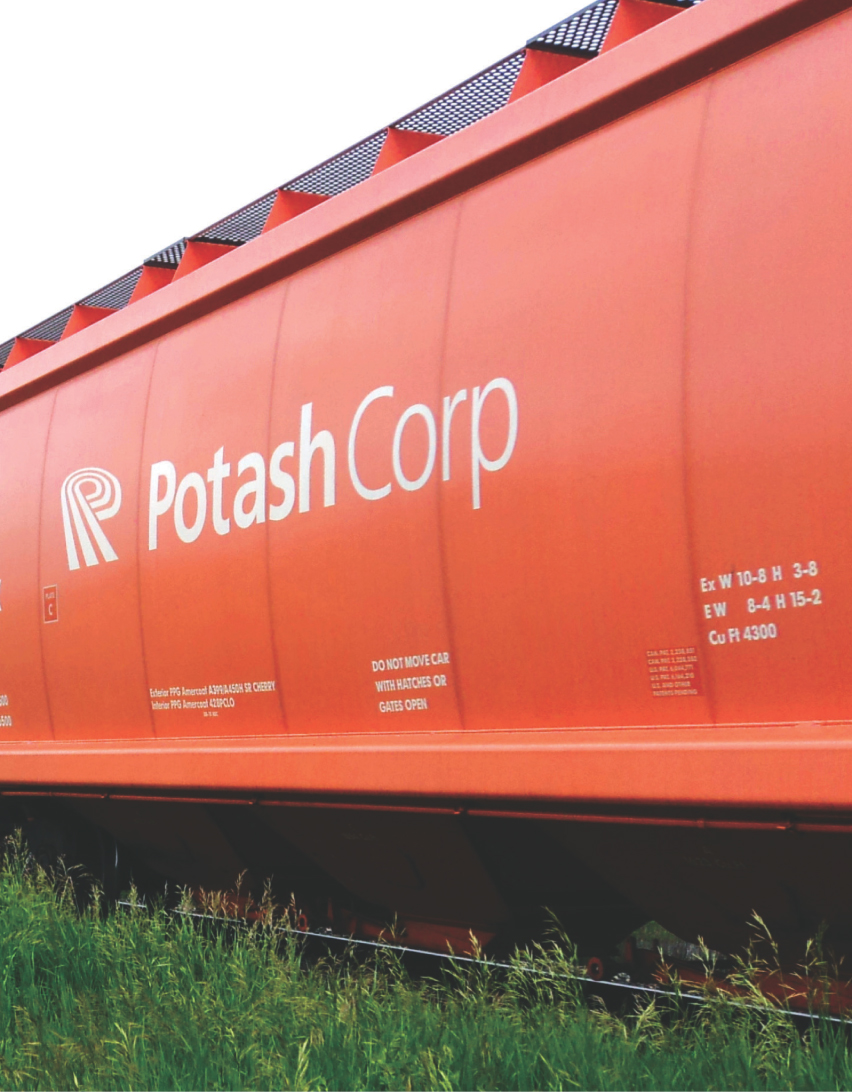
Goals and
targets

Performance
Create
superior
long-term shareholder
value
HISTORICAL PERFORMANCE
| | | | | | | | | | | | | | | | | | | | |
| | | 2013 | | | 2012 | | | 2011 | | | 2010 | | | 2009 | |
Total shareholder return | | | (16.1)% | | | | (0.1)% | | | | (19.5)% | | | | 43.1% | | | | 48.7% | |
Cash flow return* | | | 15.0% | | | | 19.2% | | | | 25.7% | | | | 18.8% | | | | 13.5% | |
Potash expansion program execution | | | × | | | | ü | | | | ü | | | | ü | | | | ü | |
| * | See reconciliation and description of certain non-IFRS measures on Page 101. |
2013 TARGETS SCORECARD
| | | | |
| Exceed total shareholder return (TSR) performance for our sector* and the DAXglobal Agribusiness Index (DXAG) | | Partially achieved | | • PotashCorp’s TSR of -16.1 percent exceeded the sector’s return of -18.4 percent although it trailed the DAXglobal Agribusiness Index return of 6.4 percent. • While earnings outpaced previous-year levels through the first half of 2013, potash markets – and equity valuations – declined through the last six months of the year amid significant uncertainty related to the marketing strategy changes announced by one of our large offshore competitors. |
| Exceed cash flow return (CFR) on investment for our sector* | | Achieved | | • Driven primarily by strong cash flow generation, our 2013 CFR of 15.0 percent exceeded both our weighted average cost of capital (9.8 percent)and the CFR of the sector. • We are working to improve cash flow return through cost-reduction initiatives, margin improvement opportunities and diligent management of capital expenditures. |
| Increase potash operational capability to 17.1 million tonnes by 2015 | | On track: capital execution timing Not achieved: ramp-up of operational capability | | • With our two remaining projects at Rocanville and New Brunswick nearly complete, our decade-long potash expansion program remains on time and we expect to have nameplate capacity of more than 18 million tonnes by the end of 2015. Our most recent estimate of $8.3 billion is approximately 20 percent above the amount anticipated when we originally announced these projects. • Our goal of 17.1 million tonnes of operational capability will not be met as we made workforce and operational changes in late 2013 to better align with near-term market conditions. Based on these adjustments, we now expect to have operational capability of approximately 13 million tonnes in 2016, but have the flexibility – with appropriate lead time – to raise it to 16.6 million tonnes by restaffing and restarting our idled operations. |
| * | Sector: Weighted average (based on market capitalization) for Agrium, APC, CF Industries, ICL, Intrepid, K+S, Mosaic, SQM, Uralkali and Yara for most recent four fiscal quarters available. |
| ** | See reconciliation and description of certain non-IFRS measures on Page 101. |
| | |
| 40 | | PotashCorp 2013 Annual Integrated Report |
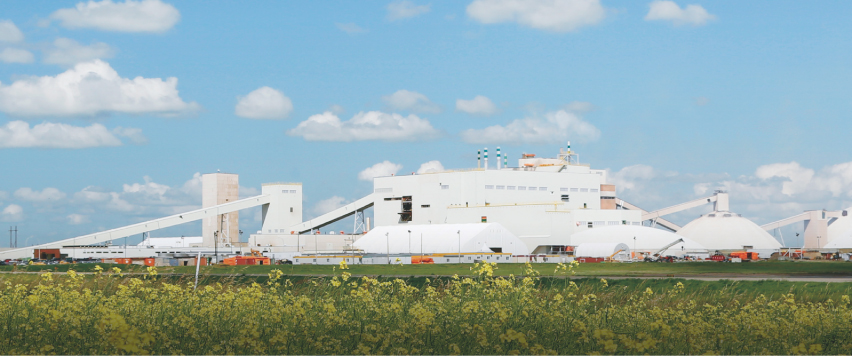
The exterior of our Allan potash facility in Saskatchewan.
FOCUSING ON WHAT MATTERS
We believe PotashCorp is in a unique position to generate long-term value for our shareholders, through periods of growth and challenging conditions.
We utilize our cash flow to fund initiatives designed to enhance shareholder returns. In 2013, we increased our dividend twice – a 67 percent increase from the beginning of the year and a 950 percent increase since January 2011. In addition, we announced a share buyback program in July to repurchase up to 5 percent of our outstanding shares and at year-end had completed 33 percent of the total authorization.
In potash, we have taken steps to enhance our competitive position while retaining the operational flexibility to significantly grow sales volumes. Through our Canadian operations – as well as our strategic potash investments – we believe we are one of the most competitively positioned suppliers to key potash markets around the globe. We are focused on improving our cost profile, as well as implementing market development and sales strategies to maximize long-term profitability for our investors.
Our nitrogen and phosphate businesses help provide diversity and stability to our earnings. We have completed expansions at two of our US nitrogen facilities, and have begun increasing the capability of another. These expansions enhance our sales volumes and increase our offerings of higher-growth, higher-margin nitrogen products. In phosphate, we have taken steps to improve our competitive position through cost reductions, efficiency initiatives and product mix optimization.
2014 TARGETS
| • | | Exceed total shareholder return (TSR) performance for our sector* and the DAXglobal Agribusiness Index (DXAG) |
| • | | Exceed cash flow return (CFR)** for our sector* |
| • | | Increase potash nameplate capacity to 18 million tonnes by 2015 |
| • | | Achieve potash cash cost savings of $15-$20 per tonne in 2014 and $20-$30 per tonne by 2016 from 2013 levels |
Value in action
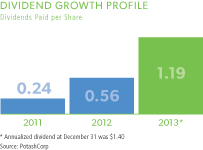
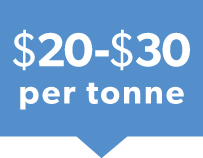
Potash cash cost reduction target by 2016 from 2013 levels
| | |
| PotashCorp 2013 Annual Integrated Report | | 41 |

Performance
Be the supplier of choice to the markets we serve
HISTORICAL PERFORMANCE
| | | | | | | | | | | | | | | | | | | | |
| | | 2013 | | | 2012 | | | 2011 | | | 2010 | | | 2009 | |
Average customer survey score | | | 90% | | | | 92% | | | | 90% | | | | 90% | | | | 89% | |
Net rail cycle time improvement | | | 5% | | | | 5% | | | | n/a | | | | n/a | | | | n/a | |
2013 TARGETS SCORECARD
| | | | |
Outperform competitor groups on quality and service, as measured by annual customer
surveys | | Achieved | | • We outperformed our competitors in all quality and service categories in 2013. Our average customer survey score was 90 percent compared to our peer average of 75 percent. • Our sales team continued to rank higher than competitors based on our knowledge of products, customers and the industry. |
| Reduce domestic rail cycle time through the Chicago corridor by 10 percent in 2014, compared to 2011 levels | | On track | | • With the completion of the first phase of our Hammond Regional Distribution Center, our domestic potash net rail cycle time through the Chicago corridor continued to improve. • Severe winter weather on the Canadian prairies resulted in challenging shipping conditions and lower rail cycle times through the first quarter of 2013, although under more normal operating conditions our performance was at (or above) our multi-year targeted level. For the year, including the negative weather impacts, domestic rail cycle times are tracking 5 percent below 2011 levels and we are on pace to reach our target. • We are also working closely with our rail carriers to identify bottlenecks and opportunities for additional efficiencies in logistics and distribution. |
| | |
| 42 | | PotashCorp 2013 Annual Integrated Report |

Trevor Roman at the opening of the new Canpotex railcar maintenance facility.
FOCUSING ON WHAT MATTERS
Being the supplier of choice requires more than just the capacity to produce; it means providing customers with the products and expertise they need in a timely, consistent and efficient manner.
In potash, our capacity expansions and logistical improvements give us the ability to grow with our customers. We believe this ability is unrivaled in our industry.
Our investments in infrastructure – from railcars to warehouses – mean that we can have the right product in the right place at the right time, something that matters to customers as they seek to manage their businesses with a just-in-time philosophy to minimize risk.
In nitrogen and phosphate, our product diversity allows us to provide customers with a variety of options to meet their needs. We offer some of the highest-quality feed products in our industry and are able to produce industrial products that many of our peers cannot. We believe this differentiates us from our competitors and offers customers flexibility and added value.
We will continue to forge long-term, mutually beneficial relationships with customers by providing market and product information to help manage and grow their businesses. With this in mind, we recently launched a website called eKonomics, to help customers and farmers make more informed soil fertility decisions. This site places powerful learning tools in the hands of those who can benefit from them the most. At PotashCorp, customers matter and we intend to continue developing new and innovative ways to meet their needs.
2014 TARGETS
| • | | Outperform competitor groups on quality, reliability and service as measured by customer surveys |
| Ÿ | | Reduce domestic potash rail net cycle time through the Chicago corridor by 10 percent in 2014, compared to 2011 levels |
Value in action


PotashCorp sales group relative to competitors as per customer surveys
| | |
| PotashCorp 2013 Annual Integrated Report | | 43 |

Performance
Build strong relationships with and improve the socioeconomic well-being of our communities
HISTORICAL PERFORMANCE
| | | | | | | | | | | | | | | | | | | | |
| | | 2013 | | | 2012 | | | 2011 | | | 2010 | | | 2009 | |
Community investment ($ millions) | | | 31 | | | | 28 | | | | 21 | | | | 17 | | | | 10 | |
Average community survey score (out of five) | | | 4.2 | | | | 4.5 | | | | 4.4 | | | | 4.2 | | | | 4.1 | |
Employee matching gift program | | | | | | | | | | | | | | | | | | | | |
Participation change | | | -1% | | | | 11% | | | | 12% | | | | 9% | | | | 10% | |
Total contributions ($ millions) | | | 2.7 | | | | 3.2 | | | | 2.9 | | | | 2.4 | | | | 2.0 | |
2013 TARGETS SCORECARD
| | | | |
| Invest 1 percent of consolidated income before income taxes (ona five-year rolling average) in community initiatives | | Achieved | | • We invested $31 million in community initiatives, representing 1 percent of consolidated income before income taxes. • Our community investment program provides support to numerous local and international projects and causes. Our community investment is designed around our six pillars: food security, health and wellness, community building, education and training, arts and culture and environmental stewardship. |
Achieve 4 (performing well) out of 5 on community leader
surveys | | Achieved | | • We achieved an average score of 4.2 out of 5 among surveyed communities. • The communities where we operate continue to positively acknowledge our safety performance and significant local investment. Ongoing communication remains an area for improvement, and in 2013 we increased our efforts through newsletters, community reports and other engagement activities. |
Achieve an increase in matching gift donations and in the number of employees participating in the program from 2012 levels | | Not achieved | | • The number of participants in the employee matching gift program declined by 1 percent and the donation amounts declined by 18 percent. Despite the decline, total contributions (employee and PotashCorp) reached $2.7 million. |
| | |
| 44 | | PotashCorp 2013 Annual Integrated Report |

Student participants at We Day Saskatchewan in February 2013.
FOCUSING ON WHAT MATTERS
At PotashCorp, we seek to foster an environment of trust and shared prosperity with the communities where we operate. We work hard to build strong relationships with community members and organizations to better align our efforts in the areas that matter most.
While we support many community-based initiatives, one of our focuses is improving food security – both locally and globally. We continue to partner with local food banks and other community organizations to help vulnerable people in our own communities have access to healthy, nutritious meals. We also continued our multi-year partnerships with the Global Institute for Food Security and Free The Children, which are committed to addressing food security issues.
Our efforts go beyond dollars. We believe that helping others prosper has a positive impact on the communities where we operate. In 2013, we brought We Day to Saskatchewan twice. Presented by Free The Children, We Day is a stadium-sized event empowering students from across Canada to create positive social change.
PotashCorp sponsored 25 young people, as well as 27 of our employees, to travel to Kenya with Free The Children (Me to We) in 2013 to assist with farming projects and learn about sustainable development. This trip inspired and educated the youth and employees, who shared their life-changing experiences with their communities when they returned. In 2014, as we continue to encourage the development of future leaders, we will sponsor another 25 students to volunteer in Free The Children communities in India.
2014 TARGETS
| Ÿ | | Achieve 4 (performing well) out of 5 on community surveys |
| Ÿ | | Achieve an increase in employee participation in our matching gift program from 2013 levels |
| Ÿ | | Invest 1 percent of consolidated income before income taxes (on a five-year rolling average) in community initiatives |
Value in action
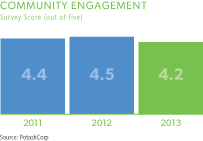
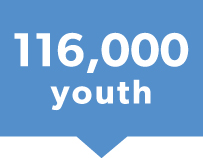
Attended We Day1 – an event designed to empower and inspire youth to make positive social change
| 1 | We Day events sponsored in part by PotashCorp. |
| | |
| PotashCorp 2013 Annual Integrated Report | | 45 |

Performance
Attract and retain talented, motivated and productive employees who are committed to our long-term goals
HISTORICAL PERFORMANCE
| | | | | | | | | | | | | | | | | | | | |
| | | 2013 | | | 2012 | | | 2011 | | | 2010 | | | 2009 | |
Average employee engagement score | | | n/a | 1 | | | 79% | | | | 73% | | | | 73% | | | | 76% | |
Percentage of senior staff positions filled internally | | | 79% | | | | 80% | | | | 92% | | | | 94% | | | | 89% | |
Average external acceptance rate2 | | | 92% | | | | 93% | | | | 93% | | | | 86% | | | | n/a | 3 |
Annual employee turnover rate4 | | | 5.4% | | | | 4.6% | | | | 3.8% | | | | 3.3% | | | | 5.8% | |
| 1 | Data not available. Survey will be administered every two years beginning in 2014. |
| 2 | Rate includes hourly employees for 2012 and 2013. |
| 3 | Not available as data had not been previously compiled consistent with current methodology |
| 4 | The number of permanent employees who left the company as a percentage of average total employees during the year. Retirements and terminations of temporary employees are excluded. |
2013 TARGETS SCORECARD
| | | | |
| Achieve an average employee engagement score of 75 percent on our annual survey | | n/a | | • Employee surveys were previously completed on a rotating basis by site. In 2014, we will begin surveying all employees every two years. As a result, no survey was conducted in 2013. • We encourage and seek feedback from our employees through formal and informal meetings, performance reviews, coaching and mentorship. |
| Fill 75 percent of senior staff openings with qualified internal candidates | | Achieved | | • Filled 79 percent of senior-level positions with qualified internal candidates, demonstrating that our development planning provides our employees with the skills, abilities and desire to move into leadership roles within PotashCorp. |
| Achieve an acceptance rate of 90 percent on all external employment offers made | | Achieved | | • In 2013, 92 percent of offers extended were accepted. A high acceptance rate demonstrates that we offer attractive job opportunities in addition to competitive wages and benefits. |
| Maintain an annual employee turnover rate (excluding retirements) of 5 percent or less | | Not achieved | | • Our employee turnover rate in 2013 was 5.4 percent. This result does not fully reflect the announced 18 percent reduction to our workforce. |
| | |
| 46 | | PotashCorp 2013 Annual Integrated Report |

April Glendenning, from our New Brunswick potash operation, volunteers in Kenya.
FOCUSING ON WHAT MATTERS
Developing and retaining talented employees is a priority for PotashCorp. Our efforts are focused on having an engaged and motivated workforce in place to deliver long-term value for all our stakeholders.
Although this is critical to our long-term success, challenging market conditions required us to take steps to improve our competitive position and balance the anticipated near-term production requirements of our facilities. This resulted in an announced reduction to our workforce (1,045 people), most significantly in potash and phosphate.
For those impacted by the reductions, we provided financial and transition resources that exceed those typical of the industry. Where possible, we also gave affected employees the opportunity to transfer to other PotashCorp facilities where positions were available. As we look ahead, the continued support and development of the more than 4,800 employees who remain part of our team will be a key priority.
One of the key initiatives that we focused on this past year – which will again be a priority in 2014 – is ensuring that the knowledge and experience gained by our workforce is passed on to our next generation of leaders. Leadership is an area of critical importance, and in 2013 we provided more than 500 employees with training in this core competency. We are developing programs which will focus on providing training, development tools, mentorship and coaching for high-potential employees to prepare them for key internal leadership positions.
2014 TARGETS
| Ÿ | | Achieve an average employee engagement score of 75 percent on the company-wide biennial survey |
| Ÿ | | Fill 75 percent of senior staff openings with qualified internal candidates |
| Ÿ | | Achieve an acceptance rate of 90 percent on all external employment offers made |
Value in action
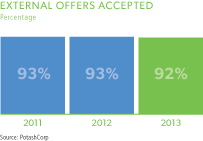

Recognized by The Globe and Mail two years in a row
| | |
| PotashCorp 2013 Annual Integrated Report | | 47 |

Performance
Achieve
no harm to
people and no damage to the environment
HISTORICAL PERFORMANCE
| | | | | | | | | | | | | | | | | | | | |
| | | 2013 | | | 2012 | | | 2011 | | | 2010 | | | 2009 | |
Safety Performance | | | | | | | | | | | | | | | | | | | | |
Life-altering injuries at our sites | | | 0 | | | | 1 | | | | 1 | | | | 0 | | | | 1 | |
Total site recordable injury rate1 | | | 1.06 | | | | 1.29 | | | | 1.42 | | | | 1.29 | | | | 1.54 | |
| 1 | Total recordable injuries multiplied by 200,000 hours worked divided by the actual number of hours worked. |
2013 SAFETY TARGETS SCORECARD
| | | | |
| Achieve zero life-altering injuries at our sites | | Achieved | | • The safety of our people is the top priority at PotashCorp. There were nolife-altering injuries in 2013. • We continue to foster a strong safety culture at all our sites and we strive to ensure our employees and contractors go home safely every day. |
| Reduce total site recordable injury rate to 1.25 (per 200,000 hours worked) or lower | | Achieved | | • We reduced our recordable injury rate to 1.06, representing the best performance in company history. • We continued to focus on leadership and engagement practices that demonstrate our commitment and regard for safety to our employees and contractors. |
Become one of the safest resource companies in the world within five years by achieving a recordable injury rate in the lowest quartile of a best-in-class peer group | | On track | | • We began working toward this company-wide objective in 2013. Specific targets and initiatives were put in place and all sites began to execute against identified areas of opportunity. • In 2013, we focused on defining and developing the essential components of ourfive-year safety plan, which is designed to help drive constant safety improvements throughout the company. |
| | |
| 48 | | PotashCorp 2013 Annual Integrated Report |
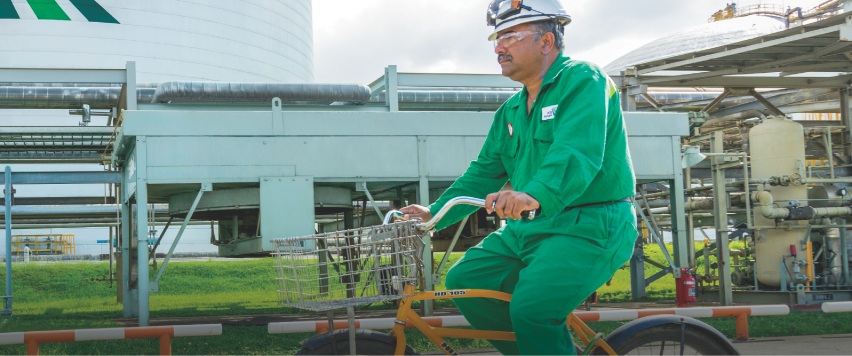
Sahid Tato traveling between plants at our large nitrogen operation in Trinidad.
HISTORICAL PERFORMANCE
| | | | | | | | | | | | | | | | | | | | |
| | | 2013 | | | 2012 | | | 2011 | | | 2010 | | | 2009 | |
Environmental Performance | | | | | | | | | | | | | | | | | | | | |
Greenhouse gas emissions (tonnes 1 per tonne of finished product) | | | 2.1 | | | | 2.0 | | | | 2.3 | | | | 2.3 | | | | 2.3 | |
Environmental incidents | | | 17 | | | | 19 | | | | 14 | | | | 20 | | | | 22 | |
| 1 | Measured as carbon dioxide (CO2) equivalent. |
2013 ENVIRONMENTAL TARGETS SCORECARD
| | | | |
| Reduce company-wide greenhouse gas (GHG) emissions per tonne of product from 2012 levels | | Not achieved | | • We did not achieve a reduction in GHG emissions due to the restart of our Geismar ammonia plant where we produce a greater proportion of more GHG intensive products. • At Geismar, we are continuing to improve efficiency at our ammonia plant as well as improve GHG emission controls on our largest nitric acid plant. |
| Reduce total reportable incidents (releases, permit excursions and spills) by 15 percent from 2012 levels | | Not achieved | | • In 2013, we reduced reportable incidents by 11 percent. • We continue to review all factors that contribute to reportable incidents and share best practices internally, and with our partners, to prevent future incidents. |
2014 TARGETS
| Ÿ | | Reduce total site recordable injury rate to 0.95 (per 200,000 hours worked) or lower |
| Ÿ | | Achieve zero life-altering injuries at our sites |
| Ÿ | | By 2018, become one of the safest resource companies in the world by achieving a recordable injury rate in the lowest quartileof a best-in-class peer group |
| Ÿ | | Reduce total reportable incidents (releases, permit excursions and spills) by 15 percent from 2013 levels |
| Ÿ | | Reduce GHG emissions per tonne of nitrogen product by 4 percent from 2013 levels |
| Ÿ | | Reduce water consumption per tonne of phosphate product by 4 percent from 2013 levels |
| | |
| PotashCorp 2013 Annual Integrated Report | | 49 |
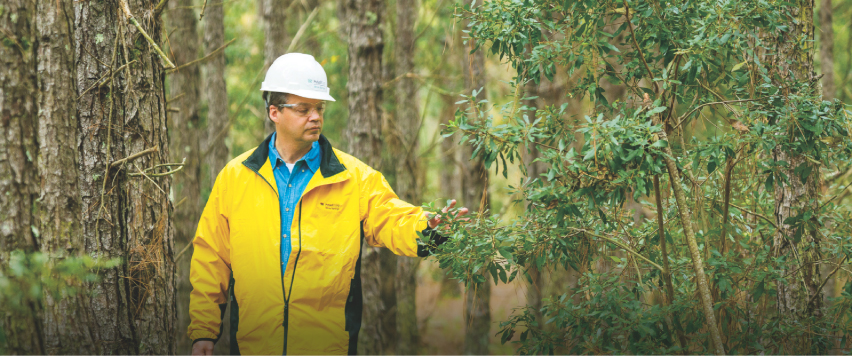
Performance
Don Dahlgren from our White Springs, Florida phosphate operation.
FOCUSING ON WHAT MATTERS
At PotashCorp, we believe that achieving excellence in our safety and environmental performance translates into success across all areas of our business. As a result, we continue to set aggressive short- and long-term targets in this area.
Last year we introduced a new five-year goal to become one of the safest resource companies in the world. Central to achieving this goal is implementing our five-year safety plan and in 2013 we made significant progress with this initiative. We identified four key work streams: safety management systems, training and capability building, metrics and data, and employee/contractor engagement. Our efforts in 2014 will focus on advancing each of these streams to drive improvement throughout PotashCorp.
Identifying best practices and standardizing key elements of our safety program work to improve our performance. Through sharing best practices, as well as allowing sites to customize to their specific requirements, we are well positioned to achieve our goals.
We encourage each PotashCorp employee to conduct peer-on-peer observations. This behavioral accident prevention process provides information on leading safety indicators and promotes an atmosphere in which employees feel empowered to approach each other and intervene, when necessary, without fearing reprisal.
Similar to our five-year safety plan, we will develop a long-term plan in 2014 to be a best-in-class company in environmental stewardship. We have begun evaluating stakeholder expectations and identifying risks, gaps and opportunities. This evaluation process assists in defining our environmental improvement initiatives and the steps to take going forward.
We continue to develop and refine key metrics to better support the measurement of our performance. We want every employee and contractor of our company to be committed, enthusiastic and engaged in our safety and environmental leadership roles. We believe this can be accomplished through ongoing communications and implementation of safety and environmental best practices.
| | |
| 50 | | PotashCorp 2013 Annual Integrated Report |
Value in action
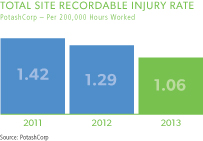
Reduction in GHG emissions compared to 2011 levels
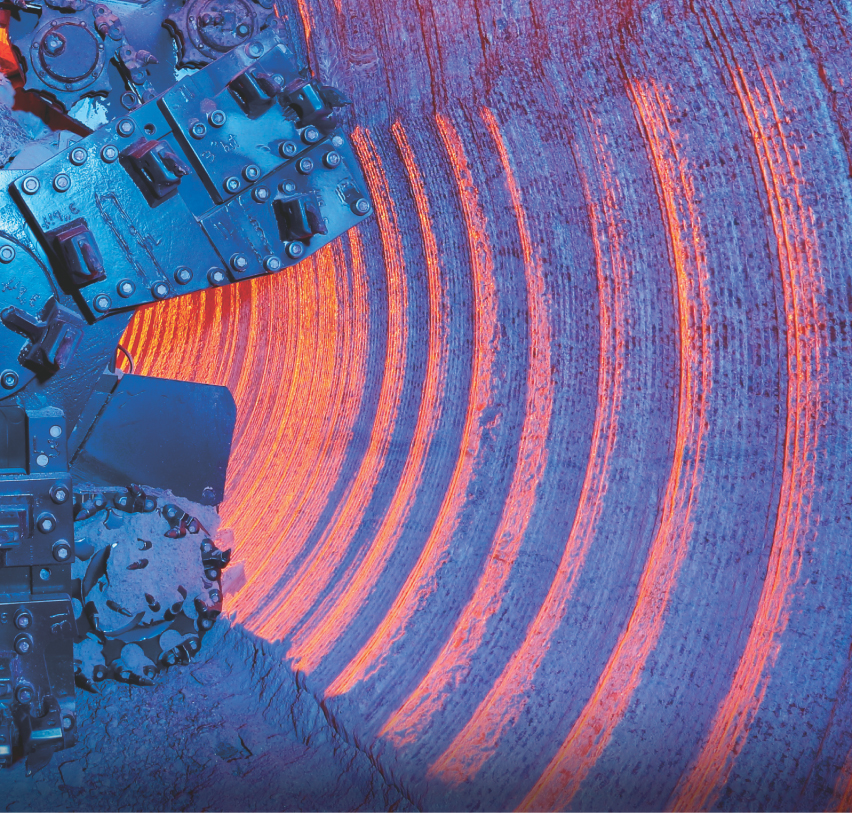
Our
nutrients
A mining borer underground at our Lanigan, Saskatchewan potash operation.
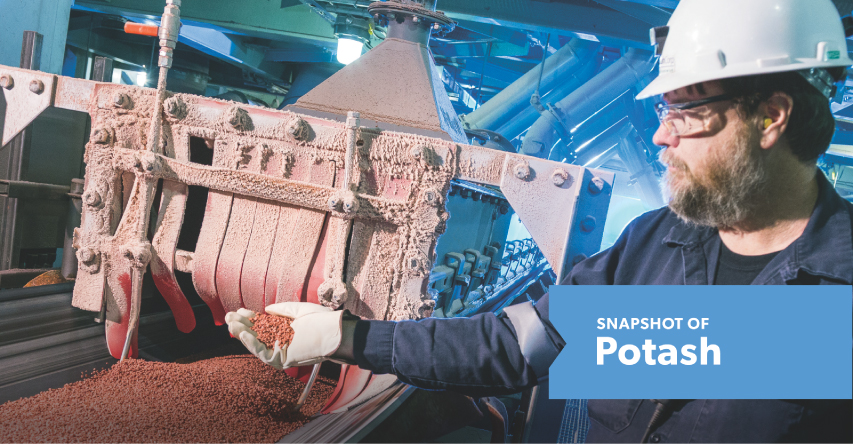
Ora Kilpatrick checking a potash sample at our New Brunswick facility.
| | | | | | |
| | | |
| Goal | | Key Strategies | | Risks | | Mitigation |
Financial Health | | Improve capability to respond to growth opportunities by ensuring appropriate operating flexibility Enhance earnings potential and global competitive position by improving efficiency and costs | | Inability to execute on
expansions or restart previously
idled operational capability Insufficient global demand
or new supply creates market imbalance | | Ensure resources are in place for execution of capital plans and idled operations are maintained to minimize restart efforts Match our supply to market demand to conserve the long-term value of our resource Optimize capacity at ourlowest-
cost operations |
Supplier of Choice | | Enhance transportation and distribution capability and
efficiency to serve customers | | No A, B level risk* |
| Community Engagement | | Contribute to local economic growth through employment, purchasing and taxes Invest in community organizations and projects that bring sustainable value | | No A, B level risk* |
Engaged Employees | | Provide opportunities for development and advancement | | No A, B level risk* |
No Harm to People or Environment | | Utilize industry and company best practices to improve safety
and environmental performance | | Exposures inherent to industrial sites, underground mines and construction projects mean that unsafe actions or conditions can result in serious injury | | Use advanced techniques to help predict problematic mining situations Enhance safety awareness and systems at all sites |
| * | As per risk ranking matrix on Pages 27-28 |
POTASH INDUSTRY OVERVIEW
Three factors are basic to understanding the potash business.
| 1. Economically | | mineable deposits are geographically concentrated |
Potash is found in significant quantity and quality in only 12 countries. Canada has almost half of known global reserves and approximately 36 percent of world capacity. The reserves PotashCorp mines in Canada are among the highest quality deposits known. While potash exists in areas other than the current producing nations, securing an economically mineable deposit in a country with both political stability and infrastructure availability can present significant challenges to building new capacity.
| 2. | | Consumption growth largely dependent on emerging markets |
Most growth in demand is expected to occur in offshore markets where potash has historically been under-applied and crop yields lag behind those of the developed world. Historically, the major consuming regions of Brazil, China, India and other Asian countries have accounted for approximately two-thirds of total potash consumption. With little or no indigenous production capability, these markets rely heavily on imports. While demand has increased significantly over time, economic conditions, government policies and affordability can create more variability in growth.
With any commitment to improving fertility practices, especially in these emerging countries, potash producers with the ability to increase their export capability have the potential to significantly raise their sales volumes.
| 3. New | | capacity requires significant investment of time and money |
Entry into the potash business is difficult because of the cost and time necessary to build new capacity. We estimate that upfront capital of CDN $4.2 billion would be required to build a conventional 2-million-tonne greenfield mine in Saskatchewan, and costs could rise beyond this level when considering deposit and infrastructure needs.
Beyond significant costs, the estimated time to develop and commission a greenfield mine could exceed seven years. While the estimated cost and time for new solution mines could be less, they still require significant construction and ramp-up and are more energy-intensive than conventional mines, which can increase production costs.
The majority of new capacity anticipated to come online over the next three to five years is expected to be through brownfield expansions by existing producers. New projects are facing significantly higher costs and longer completion times and, in certain cases, have been cancelled or deferred.
| | |
| PotashCorp 2013 Annual Integrated Report | | 53 |
Potash
OUR POTASH BUSINESS
Operations and Investments
Our potash business consists of five mines in Saskatchewan and one in New Brunswick. Since 2003, we have been enhancing our capability through expansion projects at each facility.
We also have strategic investments in other potash-related companies around the world, which helps provide access to key growth markets.
Market Overview
Potash is primarily used for fertilizer, which typically makes up approximately 90 percent of our annual potash sales volumes. While many different forms of product are produced for agricultural purposes, the two most common types are standard and granular-grade potash. Customers in Asia are the largest buyers of standard product, using it as a direct application fertilizer and to manufacture compound fertilizer products. The larger, more uniform granular product is the potash of choice in more advanced agricultural markets like North America and Brazil, where it is typically blended with other crop nutrients.
Industrial markets, where potash is used to make products such as soaps, water softeners, de-icers, drilling muds and food products, account for the remainder of our sales volumes.
Offshore
Offshore sales typically account for approximately two-thirds of PotashCorp’s volumes.
The largest consuming offshore markets are located in Asia and Latin America, where potash is applied on diverse crops such as grains, oilseeds, sugar cane, fruits and vegetables.
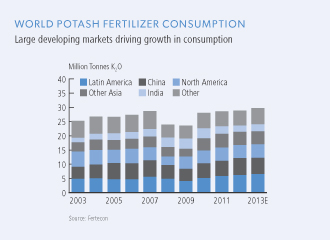
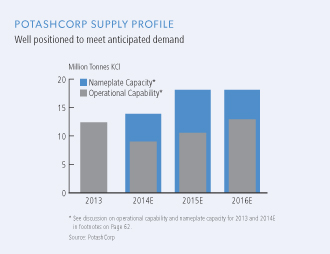
PotashCorp’s Strategic Investments
| | | | | | | | |
| | | | |
| | | SQM, Chile | | ICL, Israel | | APC, Jordan | | Sinofert, China |
| Potash capacity* | | 2.0 million tonnes KCI | | 6.0 million tonnes KCI | | 2.5 million tonnes KCI | | No primary potash capacity** |
| PotashCorp ownership | | 32 percent | | 14 percent | | 28 percent | | 22 percent |
| Board representation | | Right to designate three of eight board members | | No board members | | Right to designate three of 13 board members and the top four management positions | | Right to designate two of seven board members |
| Market value*** | | $2.7B | | $1.5B | | $0.9B | | $0.3B |
| * | Based on reported capacity on December 31, 2013. |
| ** | Sinofert owns approximately 9 percent of Qinghai Salt Lake Industry Company, China’s largest potash producer. |
| *** | Market value of PotashCorp investment as at December 31, 2013. |
Source: Fertecon, CRU, Bloomberg, public filings, PotashCorp
| | |
| 54 | | PotashCorp 2013 Annual Integrated Report |
We supply offshore customers through Canpotex (from our Saskatchewan facilities) and PCS Sales (from our New Brunswick operation). We compete against producers such as Belaruskali, ICL, K+S, SQM and Uralkali.
Canpotex
The majority of our offshore sales are made through Canpotex, which accounted for approximately 87 percent of our 2013 offshore sales volumes. Exporting from the West Coast of North America, Canpotex serves its customers through terminals in Vancouver, British Columbia and Portland, Oregon – which together can export more than 14 million tonnes annually. With approximately 5,000 leased railcars, long-term contracts with CP Rail and CN Rail, and a state-of-the-art railcar maintenance and staging facility, we believe Canpotex is well positioned to move potash efficiently from Saskatchewan mines to customers around the world.
While Canpotex supplies all major markets, Asia and Latin America accounted for approximately 94 percent of its sales in 2013.
In 2014, we expect our Canpotex allocation to be approximately 49 percent to begin the year and anticipate it will grow after successful entitlement runs at Allan (anticipated in early 2014) and Rocanville (2015).
PCS Sales
We also serve customers in Latin America from our New Brunswick facility through PCS Sales, which uses a nearby port at Saint John on Canada’s East Coast. The majority of New Brunswick tonnes are shipped to Brazil. As a shareholder in Perola S.A., PCS Sales uses its bulk fertilizer terminals at the Port of Santos in Brazil to help minimize long unloading wait times in this market.
North America
We sell to our North American customers primarily by rail from Saskatchewan, particularly from our Rocanville facility, which is just 150 km from the US border.
Our main customers are wholesalers, retailers and cooperatives that purchase in the spot market from PCS Sales. We have a strategic advantage in this market with more than 150 owned or leased US distribution points and a fleet of approximately 4,200 owned and leased railcars. We believe this is the most extensive domestic distribution network in the potash business.
Our main competitors in North America are Agrium, Intrepid Potash and Mosaic, as well as offshore imports into the US Gulf and East Coast, primarily from ICL, SQM and Uralkali.
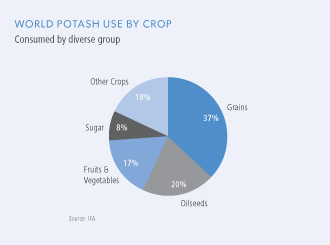
Primary Potash Market Profile
| | | | | | | | |
| Country/Region | | Annualized Consumption Growth Rate (2003-2013) | | | Main Purchasing Method | | Key Consuming Crops |
| China | | | 3.5% | | | Primarily contract | | Vegetables, rice, fruits, corn |
| India | | | 3.2% | | | Contract | | Rice, wheat, vegetables, sugar crops |
| Other Asia | | | 3.5% | | | Spot market & contracts | | Oil palm, rice, sugar crops, fruits, vegetables |
| Latin America | | | 3.1% | | | Spot market | | Soybeans, sugar crops, corn |
| North America | | | -0.8% | | | Spot market | | Corn, soybeans |
Source: Fertecon, IFA, PotashCorp
| | |
| PotashCorp 2013 Annual Integrated Report | | 55 |
Potash
ALIGNMENT WITH OUR GOALS
| | |

| | Create Superior Shareholder Value |
Enhance our global competitive position
Managing costs and improving efficiencies are key priorities as we strive to remain among the lowest delivered-cost suppliers to our key markets. In 2013, we took steps to further enhance our position on the global cost curve. We are optimizing production at our lowest-cost facilities – Rocanville and Allan – and have reduced near-term operational capability at Cory and Lanigan. At New Brunswick, we announced plans to close our higher-cost mine (Penobsquis) and accelerate development of our new, lower-cost Picadilly mine. We expect these changes, and other cost initiatives, to result in a$15-$20 per tonne improvement in our cost of production for 2014 (from 2013 levels) and are targeting cost improvement of $20-$30 per tonne by 2016.
We continue to pursue ways to grow our potash enterprise and help achieve our goal of being a low delivered-cost supplier to all markets that we serve. Our strategic investments enhance exposure to growth markets and provide significant financial value through dividends (ICL and Sinofert), earnings from equity-related positions (APC and SQM) and capital appreciation.
Improve capability to respond to future demand growth
In 2003, we initiated expansion and debottlenecking projects at all six of our potash mines. This program is anticipated to increase our capacity at a much lower cost than greenfield projects and many competitors’ brownfield expansions.
At the end of 2013, 93 percent of the total projected capital expenditures were complete. Our remaining projects are a new mine and expanded mill at New Brunswick and a mine and mill expansion at Rocanville, with construction expected to be largely complete in 2014. These two projects will provide additional lower-cost production flexibility to meet future customer needs.
While construction is expected to be finalized to support more than 18 million tonnes of nameplate capacity, operations will be staffed and ramped up each year according to anticipated market conditions.
In 2014, we expect to have approximately 9 million tonnes of operational capability. With the completion and ramp-up of our two remaining projects we believe this will grow to approximately 13 million tonnes in 2016 based on current staffing and capabilities, providing us with the flexibility to meet customer needs.
| | |
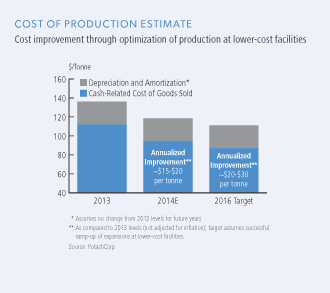 | | 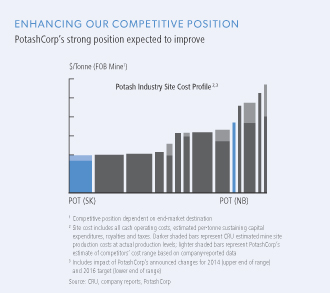
|
| | |
| 56 | | PotashCorp 2013 Annual Integrated Report |
| | |

| | Be the Supplier of Choice |
Enhance our transportation and distribution capability
In North America, we continue to optimize our rail and distribution system to better serve customers’ needs in an efficient and timely manner. In recent years, we have enhanced our rail fleet through the addition of 2,000 custom-built, high-capacity cars, which help increase volumes per trainload. We have also begun using components of our regional distribution center in Hammond, Indiana to reduce the time and cost to serve key markets in the US Midwest. Construction there is expected to be finished in 2015.
Canpotex has improved its world-class rail and ocean transportation and distribution infrastructure. It recently added a state-of-the-art railcar maintenance and staging facility to enhance its fleet performance and support efficiencies, and entered into long-term vessel arrangements for new bulk transport ocean carriers. These improvements are in addition to existing agreements. Canpotex is looking to build a new terminal in Prince Rupert, British Columbia to increase annual export capacity to approximately 25 million tonnes.
| | |

| | Build Strong Relationships with Our Communities |
Investing in our communities
Improving the quality of life in the communities where we operate is important to PotashCorp. In 2013, we invested approximately $20 million in the communities in and around our Saskatchewan and New Brunswick potash operations. In addition, our employees volunteered hours to local causes and organizations, including two We Day Saskatchewan events, at which hundreds of employees and their families participated from across our Saskatchewan sites.
We also worked to improve communications with our local communities, an area identified as an opportunity in our annual survey. This past year we launched our Report to the Community, a biannual publication aimed at providing local stakeholders with an update on our business and community investment activities. In 2013, we developed a series of videos that help people understand our overall potash production process from underground to surface.
| | |

| | Attract and Retain a Skilled and Committed Workforce |
Build a team for tomorrow
In 2013, we took difficult steps to balance the near-term operational and staffing needs of our business. As a significant employer in each of the communities where we operate, we recognize that a skilled labor force is essential for a sustainable future. PotashCorp invests in training programs and scholarships for its employees, as well as supporting trainee and internship programs, with our future labor force needs in mind.
We have been implementing a multi-faceted engagement strategy designed to make PotashCorp more accessible and attractive to potential Aboriginal employees. Since its adoption, we have shared information on careers and business opportunities with almost 14,000 prospects through attendance at more than 25 career fairs, community presentations and conferences. Part of our strategy is also a commitment to help improve Aboriginal education. In May 2013, the PotashCorp Student Success Centre at the Saskatchewan Indian Institute of Technologies was completed and students now use it to assist in their studies.
| | |

| | No Harm to People or Damage to the Environment |
Strive to improve safety performance
Within our potash division, we are focused on identifying and improving the areas where employees are at the greatest risk.
Standardized systems and processes are contributing factors to our success and in 2013 we worked to enhance our training and capability-building, identifying opportunities to standardize safety training across the company and developing metrics for measuring our progress. Engaging employees and developing safety leaders are essential parts of our approach to safety, as well as communicating and implementing safety best practices at all our potash facilities and across the company.
| | |
| PotashCorp 2013 Annual Integrated Report | | 57 |
Potash
Potash performance
POTASH FINANCIAL RESULTS
| | | | | | | | | | | | | | | | | | | | | | | | | | | | | | | | | | | | | | | | | | | | | | | | | | | | | | | | | | | | |
| | | Dollars (millions) | | | % Increase
(Decrease) | | | Tonnes (thousands) | | | % Increase
(Decrease) | | | Average per Tonne 1 | | | % Increase
(Decrease) | |
| | | 2013 | | | 2012 | | | 2011 | | | 2013 | | | 2012 | | | 2013 | | | 2012 | | | 2011 | | | 2013 | | | 2012 | | | 2013 | | | 2012 | | | 2011 | | | 2013 | | | 2012 | |
Manufactured product | | | | | | | | | | | | | | | | | | | | | | | | | | | | | | | | | | | | | | | | | | | | | | | | | | | | | | | | | | | | |
Net sales | | | | | | | | | | | | | | | | | | | | | | | | | | | | | | | | | | | | | | | | | | | | | | | | | | | | | | | | | | | | |
North America | | | $ 1,210 | | | | $ 1,231 | | | | $ 1,502 | | | | (2 | ) | | | (18 | ) | | | 3,185 | | | | 2,590 | | | | 3,114 | | | | 23 | | | | (17 | ) | | | $ 380 | | | | $ 475 | | | | $ 482 | | | | (20 | ) | | | (1 | ) |
Offshore | | | 1,482 | | | | 1,835 | | | | 2,223 | | | | (19 | ) | | | (17 | ) | | | 4,915 | | | | 4,640 | | | | 5,932 | | | | 6 | | | | (22 | ) | | | $ 302 | | | | $ 396 | | | | $ 375 | | | | (24 | ) | | | 6 | |
| | | 2,692 | | | | 3,066 | | | | 3,725 | | | | (12 | ) | | | (18 | ) | | | 8,100 | | | | 7,230 | | | | 9,046 | | | | 12 | | | | (20 | ) | | | $ 332 | | | | $ 424 | | | | $ 412 | | | | (22 | ) | | | 3 | |
Cost of goods sold | | | (1,108 | ) | | | (1,103 | ) | | | (1,007 | ) | | | – | | | | 10 | | | | | | | | | | | | | | | | | | | | | | | | $ (136 | ) | | | $ (152 | ) | | | $ (112 | ) | | | (11 | ) | | | 36 | |
Gross margin | | | 1,584 | | | | 1,963 | | | | 2,718 | | | | (19 | ) | | | (28 | ) | | | | | | | | | | | | | | | | | | | | | | | $ 196 | | | | $ 272 | | | | $ 300 | | | | (28 | ) | | | (9 | ) |
Other miscellaneous
and purchased product gross margin 2 | | | (11 | ) | | | – | | | | 4 | | | | n/m | | | | (100 | ) | | | | | | | | | | | | | | | | | | | | | | | | | | | | | | | | | | | | | | | | |
Gross Margin | | | $ 1,573 | | | | $ 1,963 | | | | $ 2,722 | | | | (20 | ) | | | (28 | ) | | | | | | | | | | | | | | | | | | | | | | | $ 194 | | | | $ 272 | | | | $ 301 | | | | (29 | ) | | | (10 | ) |
Note 16 to the consolidated financial statements provides information pertaining to our business segments.
| 1 | Rounding differences may occur due to the use of whole dollars in per-tonne calculations. |
| 2 | Comprised of net sales of $15 million (2012 – $13 million, 2011 – $14 million) less cost of goods sold of $26 million (2012 – $13 million, 2011 – $10 million). |
n/m = not meaningful
Potash gross margin variance was attributable to:
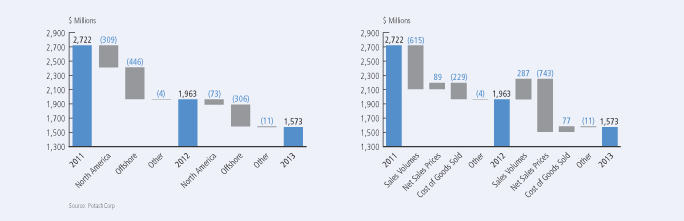
| | | | | | | | | | | | | | | | | | | | | | | | | | |
| | | | | | 2013 vs 2012 | | | | | | | | 2012 vs 2011 | | |
| | | | | | Change in Prices/Costs | | | | | | | | Change in Prices/Costs | | |
| Dollars (millions) | | Change in Sales Volumes | | | Net Sales | | | Cost of Goods Sold | | | Total | | | Change in Sales Volumes | | Net Sales | | | Cost of Goods Sold | | Total |
Manufactured product | | | | | | | | | | | | | | | | | | | | | | | | | | |
North America | | | $ 231 | | | $ | (304 | ) | | | $ – | | | | $ (73) | | | $ (216) | | $ | (19 | ) | | $ (74) | | $ (309) |
Offshore | | | 82 | | | | (462 | ) | | | 74 | | | | (306) | | | (387) | | | 97 | | | (156) | | (446) |
Change in market mix | | | (26 | ) | | | 23 | | | | 3 | | | | – | | | (12) | | | 11 | | | 1 | | – |
Total manufactured product | | | $ 287 | | | $ | (743 | ) | | | $ 77 | | | | $ (379) | | | $ (615) | | $ | 89 | | | $ (229) | | $ (755) |
Other miscellaneous and purchased product | | | | | | | | | | | | | | | (11) | | | | | | | | | | | (4) |
Total | | | | | | | | | | | | | | | $ (390) | | | | | | | | | | | $ (759) |
| | |
| 58 | | PotashCorp 2013 Annual Integrated Report |
Sales to major offshore markets were as follows:
| | | | | | | | | | | | | | | | | | | | | | | | | | | | | | | | | | | | | | | | | | | | | | |
| | | By Canpotex | | | | | From New Brunswick | |
| | | Percentage of Annual
Sales Volumes | | | | | % Increase (Decrease) | | | | | Percentage of Annual
Sales Volumes | | | | | % Increase (Decrease) | |
| | | 2013 | | | 2012 | | | 2011 | | | | | 2013 | | | 2012 | | | | | 2013 | | | 2012 | | | 2011 | | | | | 2013 | | | 2012 | |
China | | | 15 | | | | 12 | | | | 17 | | | | | | 25 | | | | (29 | ) | | | | | – | | | | – | | | | – | | | | | | – | | | | – | |
India | | | 10 | | | | 5 | | | | 9 | | | | | | 100 | | | | (44 | ) | | | | | – | | | | – | | | | – | | | | | | – | | | | – | |
Other Asian countries 1 | | | 41 | | | | 49 | | | | 43 | | | | | | (16 | ) | | | 14 | | | | | | – | | | | – | | | | – | | | | | | – | | | | – | |
Latin America | | | 28 | | | | 29 | | | | 26 | | | | | | (3 | ) | | | 12 | | | | | | 100 | | | | 100 | | | | 100 | | | | | | – | | | | – | |
| Other countries | | | 6 | | | | 5 | | | | 5 | | | | | | 20 | | | | – | | | | | | – | | | | – | | | | – | | | | | | – | | | | – | |
| | | | 100 | | | | 100 | | | | 100 | | | | | | | | | | | | | | | | 100 | | | | 100 | | | | 100 | | | | | | | | | | | |
1 All Asian countries except China and India.
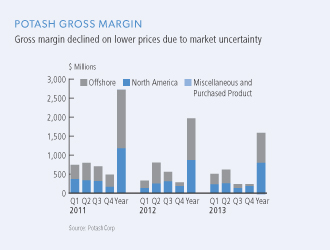
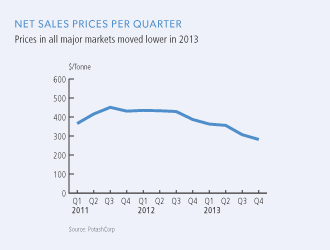
PERFORMANCE: 2013 VS 2012
The most significant contributors to the change in total gross margin were as follows (direction of arrows refers to impact on gross margin):
Net sales prices
| q | | Our average realized potash price declined on increased industry operational capability and weaker demand in the second half of 2013. |
Sales volumes
| p | | With limited dealer inventory carried into 2013 and strong agricultural fundamentals, North American sales volumes grew. Buyer destocking occurred in 2012. |
| p | | Record volumes shipped by Canpotex in the first half of 2013 (due to settlements with China and India occurring earlier than the previous year and less inventory being carried into 2013 in major offshore spot markets) were partly offset by declines in the second half of 2013 due to market uncertainty. |
Cost of goods sold
| p | | Brine management costs fell as our tolling agreement at Esterhazy expired at the end of 2012, and decreased depreciation was mainly due to costs associated with Esterhazy incurred in 2012. |
| p | | 42 shutdown weeks were incurred in 2013(77 shutdown weeks in 2012), primarily as a result of our strategy to match production to market demand. Also in 2013, we reduced operating rates for 52 weeks (none in 2012). |
| q | | Costs associated with our workforce reduction at Lanigan, Cory, New Brunswick and Patience Lake were incurred in 2013. |
| | |
| PotashCorp 2013 Annual Integrated Report | | 59 |
Potash
| p | | More product from our lower-cost mines went to offshore customers, resulting in a positive cost of goods sold variance. |
The change in market mix produced an unfavorable variance of $26 million related to sales volumes and a favorable variance of $23 million in sales prices, due primarily to more higher-priced granular product being sold to North America.
North America net sales prices are higher than offshore prices as North American customers prefer premium-priced granular product over standard product more typically consumed offshore.
PERFORMANCE: 2012 VS 2011
The most significant contributors to the change in total gross margin were as follows (direction of arrows refers to impact on gross margin):
Net sales prices
| p | | Although prices fell in the fourth quarter of 2012, our average realized offshore potash price was up for the year, reflecting an increase in all major markets during the first half of 2012 compared to the first half of 2011. |
Sales volumes
| q | | Canpotex shipments to India declined significantly due to India’s fertilizer subsidy changes and a weaker rupee, which led to higher retail prices and reduced demand. Volumes to China decreased as it had a second-half contract with Canpotex in 2011 but not in 2012. Demand from major offshore spot markets was down due to distributor destocking. |
| q | | In North America, our sales volumes were below 2011 largely because of buyer destocking during the first six months of 2012. |
Cost of goods sold
| q | | 77 shutdown weeks were incurred in 2012 (at our Lanigan, Rocanville, Allan and Patience Lake facilities) primarily to match production to market demand (24 shutdown weeks were taken in 2011 due to expansion-related activities and inventory adjustments). During part of this downtime in 2012, we opted to allocate resources to non-production activities rather than lay off employees, which resulted in higher shutdown costs. |
| q | | Depreciation costs increased due to higher asset levels associated with our mine expansion program. |
| q | | At Esterhazy, brine management costs, other operating costs and depreciation were higher. |
| | |
| 60 | | PotashCorp 2013 Annual Integrated Report |
POTASH NON-FINANCIAL RESULTS
| | | | | | | | | | | | | | | | | | | | | | | | |
| | | | | | | | | | | | | | | | % Increase (Decrease) | |
| | | | | 2013 | | | 2012 | | | 2011 | | | | | 2013 | | | 2012 | |
Production and Reserves | | KCl tonnes produced (thousands) | | | 7,792 | | | | 7,724 | | | | 9,343 | | | | | | 1 | | | | (17 | ) |
Safety | | Total site recordable injury rate | | | 1.37 | | | | 2.30 | | | | 2.13 | | | | | | (40 | ) | | | 8 | |
Employee | | Employee turnover percentage (excluding retirements) | | | 5.1% | | | | 4.2% | | | | 4.3% | | | | | | 21 | | | | (2 | ) |
Environmental | | Waste (million tonnes) | | | 17.5 | | | | 13.3 | | | | 18.6 | | | | | | 32 | | | | (28 | ) |
| | | Environmental incidents | | | 13 | | | | 8 | | | | 9 | | | | | | 63 | | | | (11 | ) |
PERFORMANCE: 2013 VS 2012
Production and Reserves
| Ÿ | | During the second quarter of 2013, we successfully completed a safe Canpotex entitlement run at Cory, which will allow us a greater proportion of Canpotex sales to offshore markets partly offsetting gains made by other Canpotex shareholders. |
| Ÿ | | While production included normal maintenance downtime in 2013 and 2012, tonnes produced were also affected by reduced operating rates (no reduced operating rates in 2012). |
Estimated recoverable ore (reserve tonnage only) as of December 31, 2013 is described in the table below. For a more complete discussion of important information related to our potash reserves, see “Potash Operations – Reserves” in our Form 10-K for the year ended December 31, 2013.
| | | | | | | | | | | | | | | | |
| | | Mineral Reserves (millions of tonnes recoverable ore) 1 | | | Years of Remaining Mine Life | |
| All potash locations 2 | | Proven | | | Probable | | | Total | | |
2013 | | | 552 | | | | 1,195 | | | | 1,747 | | | | 56-84 | |
| 1 | Average grade % K2O equivalent of 21.5-25.0. |
| 2 | Given the characteristics of the solution mining method at Patience Lake, those results are excluded from the above table as it is not possible to estimate reliably the recoverable ore reserve. |
Safety
| Ÿ | | Our total site recordable injury rate declined to a record low primarily due to the effort by the site teams on targeted safety improvement projects at Allan, Cory and Rocanville, as well as ongoing safety improvements at other sites. |
| Ÿ | | Ground-penetrating radar technology is being developed and implemented on our underground mining machines at Cory, Allan and Lanigan to identify hazards in the rock above mine workings. The mining machine operator then views the results in real time so any compromised safety conditions can be immediately recognized and addressed. |
Employee
| Ÿ | | During the fourth quarter of 2013, we announced a workforce reduction – affecting 545 people (none in 2012) – to respond to challenging market conditions and reduce costs to enhance our global competitive position. The full impact of our workforce reduction announced in 2013 will not be reflected until 2014 due to the timing of certain severance processes. |
| Ÿ | | Leadership training was received by 180 employees in 2013 (2012 – more than 300 employees),an expected decrease as a number of leaders have already taken the training. Leadership training consisted primarily of instructor-led courses designed to enhance key employee competencies regarding safety commitment, communication skills, resource management and business conduct. |
Environmental
| Ÿ | | Waste is comprised of byproducts, including coarse and fine tailings and salt as brine to injection wells. Waste increased due to higher mining waste per tonne (lower recovery and ore quality) combined with increased mining activity at certain sites. |
| Ÿ | | The rise in environmental incidents is due largely to several failures of refrigerant lines in new HVAC units installed at New Brunswick. |
Community
| Ÿ | | Continued career information efforts reached approximately 14,000 Saskatchewan First Nations and Métis prospects (2012 – more than 7,000), with more than 1,000 voluntary self-identified Aboriginal applicants (2012 – 750), resulting in 9 percent (2012 – 12 percent) of new employees being voluntaryself-identified Aboriginal applicants. |
| | |
| PotashCorp 2013 Annual Integrated Report | | 61 |
Potash
PERFORMANCE: 2012 VS 2011
Safety
| Ÿ | | A rise in work injuries at Allan, Cory and Rocanville caused the increase in the total site recordable injury rate for 2012. We retained an external consultant to help improve safety performance at the three sites with the highest number of injuries. |
| Ÿ | | LiDAR technology was used extensively during 2012 to map and monitor key underground mine areas, such as shafts, travelways and conveyor entries, resulting in improved safety and production efficiency. |
Employee
| Ÿ | | More than 300 employees received leadership training in 2012, an increase from 150 employees in 2011 due to a more concerted effort to provide formal training to leaders, especially |
| | | at the front-line supervisor level. Leadership training in 2012 consisted primarily of instructor-led courses designed to enhance key employee competencies regarding safety commitment, communication/personal skills, resource management and business conduct. |
Community
| Ÿ | | In addition to news releases, web postings, tweets and public announcements, a new Report to the Community was introduced during the year in which we provided an update on our business and community activities. |
| Ÿ | | Career information reached more than 7,000 Aboriginal prospects directly, attracting more than 750 self-identified applicants, resulting in 12 percent of new employees in entry level and trades positions. |
POTASH PRODUCTION
(million tonnes KCl)
| | | | | | | | | | | | | | | | | | | | | | | | | | |
| | | Nameplate
Capacity 1 | | Operational
Capability (2014) 2 | | | Operational
Capability (2013) 2 | | | Production | | | Employees 3 | |
| | | | | 2013 | | | 2012 | | | 2011 | | |
Lanigan SK 4 | | 3.8 | | | 1.7 | | | | 3.4 | | | | 2.24 | | | | 1.65 | | | | 3.04 | | | | 595 | |
Rocanville SK | | 3.0 | | | 2.6 | | | | 2.8 | | | | 1.99 | | | | 1.57 | | | | 2.43 | | | | 592 | |
Allan SK | | 3.0 | | | 2.5 | | | | 2.5 | | | | 1.18 | | | | 1.17 | | | | 1.02 | | | | 528 | |
Cory SK 4 | | 3.0 | | | 1.7 | | | | 2.6 | | | | 1.49 | | | | 1.29 | | | | 0.78 | | | | 568 | |
Patience Lake SK | | 0.3 | | | 0.3 | | | | 0.3 | | | | 0.27 | | | | 0.29 | | | | 0.39 | | | | 92 | |
New Brunswick NB 5 | | 0.8 | | | 0.2 | | | | 0.8 | | | | 0.62 | | | | 0.74 | | | | 0.74 | | | | 537 | |
Esterhazy SK 6 | | – | | | – | | | | – | | | | – | | | | 1.01 | | | | 0.94 | | | | – | |
TOTAL | | 13.9 | | | 9.0 | | | | 12.4 | | | | 7.79 | | | | 7.72 | | | | 9.34 | | | | 2,912 | |
| 1 | Represents estimates of capacity as of December 31, 2013. Estimates based on capacity as per design specifications for those projects constructed or Canpotex entitlement runs once complete. In the case of Patience Lake, estimate reflects current operational capability. Estimates for all other facilities do not necessarily represent operational capability. |
| 2 | Estimated annual achievable production level at current staffing and operational readiness (estimated at beginning of year). Estimate does not include inventory-related shutdowns and unplanned downtime. |
| 3 | Totals as at December 31, 2013 and do not reflect workforce changes announced in December 2013. |
| 4 | Operational capability significantly lower than prior year estimates (and nameplate capacity) due to operational and workforce changes announced in December 2013. Potential exists to reach 2013 estimated operational capability with increased staffing and operational ramp-up, although timing is uncertain. |
| 5 | Operational capability significantly lower than prior year estimates (and nameplate capacity) due to operational and workforce changes announced in December 2013. Potential exists to reach 2013 estimated operational capability upon completion and ramp-up of new mine (Picadilly). |
| 6 | Product tonnes received at Esterhazy were based on a mining and processing agreement with Mosaic and a related settlement agreement. Under the settlement agreement, the mining and processing agreement terminated on December 31, 2012. |
| | | | | | | | |
| Facility | | Actual and Expected
Investment 1
(CDN$ billions) | | Expected Remaining
Spending 2
(CDN$ billions) | | Expected
Construction
Completion 3 | | Nameplate Capacity
(post expansion) 4 |
| CONSTRUCTED PROJECTS COMPLETED (2005-2013) |
| Completed Projects | | $3.3 | | $ – | | | | 10.1 MMT |
| PROJECTS IN PROGRESS |
| New Brunswick 5 | | $2.2 | | $0.4 | | 2014 | | 2.0 MMT |
| Rocanville | | $2.8 | | $0.2 | | 2015 | | 6.0 MMT |
| TOTAL ALL PROJECTS | | $8.3 | | $0.6 | | | | 18.1 MMT |
| 1 | Amounts for projects with remaining spending are based on the most recent forecast amounts approved by the Board of Directors, and are subject to change based on project timelines and costs. |
| 2 | After December 31, 2013. |
| 3 | Construction completion does not include ramp-up time. |
| 4 | Total nameplate capacity based on estimates for completed projects: Allan (3.0 MMT); Cory (3.0 MMT); Lanigan (3.8 MMT); Patience Lake (0.3 MMT); and those projects in progress: New Brunswick (2.0 MMT); Rocanville (6.0 MMT). Potential operational capability upon completion and ramp-up of projects in progress and recently idled operational capability expected to be approximately 16.6 MMT. |
| 5 | Net nameplate capacity increase assuming closure of existing 0.8 million tonne mine. |
| | |
| 62 | | PotashCorp 2013 Annual Integrated Report |

Clinton Ramnarine completing checks at our Trinidad nitrogen facility.
| | | | | | |
| | | |
| Goal | | Key Strategies | | Risks | | Mitigation |
Financial Health | | Focus on industrial opportunities to improve earnings stability Enhance our global competitive position and earnings potential by optimizing our production portfolio | | Price cyclicality in an industry that is highly fragmented and regional | | Focus on supplying less-cyclical industrial and other niche markets Trinidad gas contracts primarily indexed to ammonia prices; consider gas price hedging strategies for our
US operations |
Supplier of Choice | | Enhance capability and efficiency
to serve industrial customers and key growth markets | | No A, B level risk* |
| Community Engagement | | Contribute to local economic growth through employment, purchasing and taxes Invest in organizations and projects that bring sustainable value | | No A, B level risk* |
Engaged Employees | | Provide opportunities for development and advancement | | No A, B level risk* |
No Harm to People or Environment | | Utilize industry and company best practices to improve safety
and environmental performance Focus on reducing GHG emissions and improving energy efficiency | | Unsafe actions or conditions can result in serious injury or industrial site accidents | | Enhance safety and security systems
at all sites |
| * | As per risk ranking matrix on Pages 27-28 |
Nitrogen
NITROGEN INDUSTRY OVERVIEW
In examining the nitrogen business, we believe it is important to understand three factors.
1. Lower-cost natural gas is essential to success
Natural gas is the basis of most of the world’s nitrogen production and can make up 70-85 percent of the cash cost of producing a tonne of ammonia, the feedstock for downstream nitrogen products. Long-term access to lower-priced natural gas is therefore essential to sustainable success in the nitrogen industry.
With their large supplies of lower-cost gas, Russia, North Africa and the Middle East are major nitrogen-exporting regions. Producers in Western Europe, Ukraine and China are higher-cost suppliers and therefore typically play a role in determining prices in the global marketplace. The US is in a favorable cost position because its increased shale gas supply has lowered prices for domestic natural gas. This favorable cost position has resulted in significant interest in new nitrogen capacity to displace higher-cost imports.
2. Proximity to end markets influences trade
Trade in both ammonia and nitrogen solutions has historically been limited compared to urea. Ammonia transportation requires expensive pressurized railcars and refrigerated rail and ocean vessels while nitrogen solutions – due to lower nitrogen concentration levels – are difficult to transport economically over long distances.
The US is the second-largest consumer of ammonia and the largest importer. Domestic producers have notable transportation advantages over offshore suppliers in accessing the sizable US market. Trinidad is less than a week’s sailing time from the US and has logistical advantages compared to most exporters in supplying this key market. It accounts for approximately 70 percent of US offshore ammonia supply. For nitrogen solutions, imports have historically accounted for less than 25 percent of US consumption.
3. Pricing volatility in nitrogen markets
With natural gas feedstock widely available, the nitrogen industry is highly fragmented and regionalized. The 10 largest ammonia producers account for 27 percent of world capacity, and only 11 percent of global ammonia production is traded. This market structure and the relatively short time necessary to build new capacity make nitrogen markets typically more volatile than other fertilizer markets.
This is especially true for urea where a much larger percentage of capacity is available for trade as it is easier and less costly to transport. In addition, the influence of China’s export policy on its domestic producers often impacts available supply and global trade fundamentals.
| | |
| 64 | | PotashCorp 2013 Annual Integrated Report |
OUR NITROGEN BUSINESS
Operations
We produce a broad range of nitrogen products in the US and Trinidad. Our three US facilities produce ammonia, urea and other nitrogen products such as nitric acid, ammonium nitrate and nitrogen solutions.
We have a large-scale production facility in Trinidad, with four ammonia plants. We produced 53 percent of our ammonia in Trinidad during 2013.
Market Overview
Although approximately 80 percent of world nitrogen production goes into fertilizers, we focus largely on industrial demand with sales to these customers making up approximately 70 percent of our total nitrogen sales volumes in 2013.
Logistical constraints and high transportation costs mean that sales, particularly of ammonia, are generally regional in nature. The majority of our products – approximately 85 percent of our sales volumes in 2013 – are sold in North America with the remainder destined for offshore markets, particularly in Latin America. Sales of our nitrogen products are handled by PCS Sales.
North America
Our US plants, which are located mainly in the country’s interior, benefit from geographic proximity to key customers.
Long-term leases of ammonia vessels at fixed prices enable us to manage transportation costs and provide economical delivery of our Trinidad product to the North American market. Additionally, we gain logistical strength and flexibility for these imports by owning facilities, or having major supply contracts, at six deepwater US ports.
We compete in the US market with Agrium, CF Industries and Koch, and with imported product from suppliers in the Middle East, North Africa, Trinidad, the former Soviet Union and China.
Offshore
Our offshore sales are limited and represented only 15 percent of our total sales volumes in 2013. The majority of our offshore sales volumes are sourced from our Trinidad facility, which is well positioned to meet demand from Latin America.
We compete in this region with a broad range of offshore and domestic producers.
ALIGNMENT WITH OUR GOALS
| | |
| | Create Superior Shareholder Value |
Optimize our existing US production facilities
We continue to pursue opportunities to increase our US nitrogen capacity. Due to the historical variability in nitrogen prices, we focus on projects that we believe have the shortest payback periods. In early 2013 we restarted approximately 0.5 million tonnes of ammonia capacity at our plant in Geismar. We also announced a brownfield expansion at our Lima facility, which will add approximately 100,000 tonnes of ammonia capacity and approximately 80,000 tonnes of urea capacity by 2015.
Focus on margin and cost opportunities
We look for opportunities to enhance the consistency of our gross margin profile. As part of our operating and workforce changes in late 2013, we identified opportunities in our nitrogen business to improve efficiencies. These changes are expected to result in approximately $10 million in annual savings, beginning in 2014.
| | |
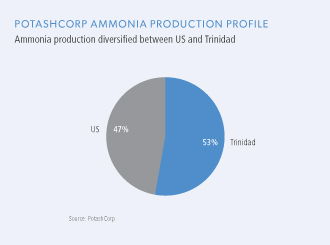
| | 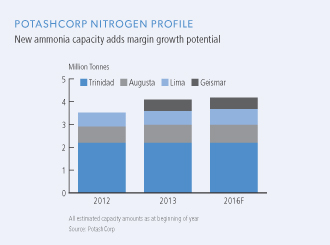 |
| | |
| PotashCorp 2013 Annual Integrated Report | | 65 |
Nitrogen
Resuming ammonia production at Geismar has allowed us to ramp up production of nitrogen solutions and nitric acid. In 2013, this facility added approximately $100 million in incremental gross margin relative to 2012 levels.
In Trinidad, we have long-term gas contracts primarily indexed to ammonia prices, which enhance gross margin stability. In 2013, we concluded negotiations for two of our plants with gas pricing indexed to ammonia prices. Our largest contract runs through to 2018, and our focus will be on establishing new agreements that protect the long-term value of our Trinidad operations.
| | |
| | Be the Supplier of Choice |
Maintain our position in industrial markets
Industrial markets traditionally provide more stable demand and better margins than fertilizer markets. Our industrial customers purchased 53 percent of the solid urea and 67 percent of the ammonia produced by our US plants in 2013.
To maintain our supply position to the industrial market, we strive to ensure that product can be reliably and competitively delivered to customers. This is achieved by delivering more than half of our US-produced ammonia sales volumes to industrial customers by pipeline, a safe, reliable method that lowers transportation and distribution costs.
We also look for opportunities to enter new market segments where we have a competitive advantage. We have been expanding in the diesel emission fluid (DEF) market, leveraging our ability to produce high-quality products in an area with strong demand. Our Lima expansion is expected to play a key role in our ability to serve the profitable and growing DEF market.
| | |
| | Build Strong Relationships with Our Communities |
Investing in our communities
In 2013, we invested approximately $3 million in the communities in and around our nitrogen operations. We supported these communities through corporate contributions and by matching employee donations. In addition, many employees contributed volunteer hours to local causes and organizations.
In Trinidad, we continue to expand our funding of key projects that help improve the quality of life for our employees and those in the local community. Consistent with the pillars of our community investment framework, we support important initiatives in Trinidad around food security, education and training, and health and wellness. In late 2013, we presented the Trinidad Ministry of Health with a new $4 million medical laboratory, which was funded by PotashCorp in consultation with the local Health Authority.
| | |
| | Attract and Retain a Skilled and Committed Workforce |
Providing opportunity for development
We are a significant employer in each of the communities where we operate, although as part of our effort to enhance our competitive position, we announced a small reduction to our total nitrogen workforce in December.
Our focus remains on training and motivating our workforce to deliver high-quality product in the safest and most efficient manner possible. We have a particular focus on leadership training, which more than 200 employees received in 2013.
| | |
| | No Harm to People or Damage to the Environment |
Push for safety excellence
Within our nitrogen division, we are focused on identifying and improving those areas where employees are at the greatest risk.
Standardized systems and processes are contributing factors to our success and in 2013 we worked to enhance our training and capability building, identifying opportunities to standardize safety training across the company and developing metrics for measuring our progress. Engaging employees and developing safety leaders are essential parts of our approach to safety, as well as communicating and implementing safety best practices at all our nitrogen facilities and across the company.
Focus on GHG emissions and energy improvements
Since our nitrogen plants are the largest contributor to company-wide GHG emissions and energy consumption on aper-tonne basis, we pay particular attention to improvements in these areas. Energy efficiency and environmental observation metrics are part of short-term incentive plans at each site, which better aligns our reward structure with environmental performance.
| | |
| 66 | | PotashCorp 2013 Annual Integrated Report |
Nitrogen performance
NITROGEN FINANCIAL RESULTS
| | | | | | | | | | | | | | | | | | | | | | | | | | | | | | | | | | | | | | | | | | | | | | | | | | | | | | | | | | | | |
| | | Dollars (millions) | | | % Increase
(Decrease) | | | Tonnes (thousands) | | | % Increase
(Decrease) | | | Average per Tonne 1 | | | % Increase
(Decrease) | |
| | | 2013 | | | 2012 | | | 2011 | | | 2013 | | | 2012 | | | 2013 | | | 2012 | | | 2011 | | | 2013 | | | 2012 | | | 2013 | | | 2012 | | | 2011 | | | 2013 | | | 2012 | |
Manufactured product 2 | | | | | | | | | | | | | | | | | | | | | | | | | | | | | | | | | | | | | | | | | | | | | | | | | | | | | | | | | | | | |
Net sales | | | | | | | | | | | | | | | | | | | | | | | | | | | | | | | | | | | | | | | | | | | | | | | | | | | | | | | | | | | | |
Ammonia | | | $ 1,143 | | | | $ 1,152 | | | | $ 1,140 | | | | (1 | ) | | | 1 | | | | 2,163 | | | | 2,033 | | | | 2,096 | | | | 6 | | | | (3 | ) | | | $ 529 | | | | $ 566 | | | | $ 544 | | | | (7 | ) | | | 4 | |
Urea | | | 443 | | | | 568 | | | | 564 | | | | (22 | ) | | | 1 | | | | 1,070 | | | | 1,105 | | | | 1,214 | | | | (3 | ) | | | (9 | ) | | | $ 414 | | | | $ 514 | | | | $ 464 | | | | (19 | ) | | | 11 | |
Solutions, Nitric acid, Ammonium nitrate | | | 638 | | | | 445 | | | | 445 | | | | 43 | | | | – | | | | 2,663 | | | | 1,808 | | | | 1,837 | | | | 47 | | | | (2 | ) | | | $ 240 | | | | $ 247 | | | | $ 242 | | | | (3 | ) | | | 2 | |
| | | 2,224 | | | | 2,165 | | | | 2,149 | | | | 3 | | | | 1 | | | | 5,896 | | | | 4,946 | | | | 5,147 | | | | 19 | | | | (4 | ) | | | $ 377 | | | | $ 438 | | | | $ 418 | | | | (14 | ) | | | 5 | |
Cost of goods sold | | | (1,325 | ) | | | (1,256 | ) | | | (1,281 | ) | | | 5 | | | | (2 | ) | | | | | | | | | | | | | | | | | | | | | | | $ (225 | ) | | | $ (254 | ) | | | $ (250 | ) | | | (11 | ) | | | 2 | |
Gross margin | | | 899 | | | | 909 | | | | 868 | | | | (1 | ) | | | 5 | | | | | | | | | | | | | | | | | | | | | | | | $ 152 | | | | $ 184 | | | | $ 168 | | | | (17 | ) | | | 10 | |
Other miscellaneous and purchased product gross margin 3 | | | 14 | | | | 69 | | | | 48 | | | | (80 | ) | | | 44 | | | | | | | | | | | | | | | | | | | | | | | | | | | | | | | | | | | | | | | | | |
Gross Margin | | | $ 913 | | | | $ 978 | | | | $ 916 | | | | (7 | ) | | | 7 | | | | | | | | | | | | | | | | | | | | | | | | $ 155 | | | | $ 198 | | | | $ 178 | | | | (22 | ) | | | 11 | |
| Note | 16 to the consolidated financial statements provides information pertaining to our business segments. |
| 1 | Rounding differences may occur due to the use of whole dollars in per-tonne calculations. |
| 2 | Includes inter-segment ammonia sales, comprised of: net sales $106 million, cost of goods sold $51 million and 184,000 sales tonnes (2012 – net sales $94 million, cost of goods sold $33 million and 139,000 sales tonnes, 2011 – net sales $88 million, cost of goods sold $34 million and 135,000 sales tonnes). Inter-segment profits are eliminated on consolidation. |
| 3 | Comprised of third-party and inter-segment sales, including: third-party net sales $56 million less cost of goods sold $42 million (2012 – net sales $182 million less cost of goods sold $118 million, 2011 – net sales $107 million less cost of goods sold $64 million) and inter-segment net sales $33 million less cost of goods sold $33 million (2012 – net sales $59 million less cost of goods sold $54 million, 2011 – net sales $91 million less cost of goods sold $86 million). Inter-segment profits are eliminated on consolidation. |
Nitrogen gross margin variance was attributable to:
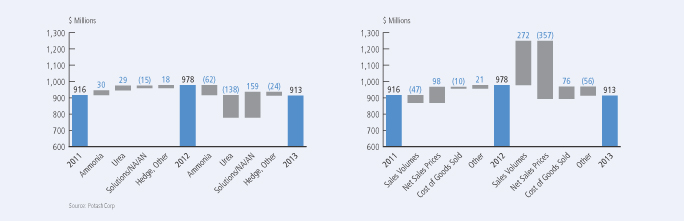
| | | | | | | | | | | | | | | | | | | | | | | | | | | | | | | | |
| | | | | | 2013 vs 2012 | | | | | | | | | 2012 vs 2011 | | | | |
| | | | | | Change in Prices/Costs | | | | | | | | | Change in Prices/Costs | | | | |
| Dollars (millions) | | Change in Sales Volumes | | | Net Sales | | | Cost of Goods Sold | | | Total | | | Change in Sales Volumes | | | Net Sales | | | Cost of Goods Sold | | | Total | |
Manufactured product | | | | | | | | | | | | | | | | | | | | | | | | | | | | | | | | |
Ammonia | | | $ 44 | | | | $ (82 | ) | | | $ (24 | ) | | | $ (62 | ) | | | $ (20 | ) | | | $ 46 | | | | $ 4 | | | | $ 30 | |
Urea | | | (10 | ) | | | (107 | ) | | | (21 | ) | | | (138 | ) | | | (34 | ) | | | 57 | | | | 6 | | | | 29 | |
Solutions, Nitric acid, Ammonium nitrate | | | 88 | | | | (19 | ) | | | 90 | | | | 159 | | | | (6 | ) | | | 8 | | | | (17 | ) | | | (15 | ) |
Hedge | | | – | | | | – | | | | 32 | | | | 32 | | | | – | | | | – | | | | (3 | ) | | | (3 | ) |
Change in product mix | | | 150 | | | | (149 | ) | | | (1 | ) | | | – | | | | 13 | | | | (13 | ) | | | – | | | | – | |
Total manufactured product | | | $ 272 | | | | $ (357 | ) | | | $ 76 | | | | $ (9 | ) | | | $ (47 | ) | | | $ 98 | | | | $ (10 | ) | | | $ 41 | |
Other miscellaneous and purchased product | | | | | | | | | | | | | | | (56 | ) | | | | | | | | | | | | | | | 21 | |
Total | | | | | | | | | | | | | | | $ (65 | ) | | | | | | | | | | | | | | | $ 62 | |
| | |
| PotashCorp 2013 Annual Integrated Report | | 67 |
Nitrogen
| | | | | | | | | | | | | | | | | | | | | | | | | | | | | | | | | | | | | | | | |
| | | Sales Tonnes (thousands) | | | % Increase (Decrease) | | | Average Net Sales Price per Tonne | | | % Increase (Decrease) | |
| | | 2013 | | | 2012 | | | 2011 | | | 2013 | | | 2012 | | | 2013 | | | 2012 | | | 2011 | | | 2013 | | | 2012 | |
Fertilizer | | | 1,833 | | | | 1,521 | | | | 1,688 | | | | 21 | | | | (10 | ) | | $ | 396 | | | $ | 485 | | | $ | 447 | | | | (18 | ) | | | 9 | |
Industrial and Feed | | | 4,063 | | | | 3,425 | | | | 3,459 | | | | 19 | | | | (1 | ) | | $ | 370 | | | $ | 417 | | | $ | 403 | | | | (11 | ) | | | 3 | |
| | | | 5,896 | | | | 4,946 | | | | 5,147 | | | | 19 | | | | (4 | ) | | $ | 377 | | | $ | 438 | | | $ | 418 | | | | (14 | ) | | | 5 | |
PERFORMANCE: 2013 VS 2012
The most significant contributors to the change in total gross margin were as follows (direction of arrows refers to impact on gross margin):
Net sales prices
| q | | Sales prices for ammonia fell throughout 2013 due to weak phosphate demand and additional supply. |
| q | | Urea prices fell due to increased global capacity and record urea exports from China. |
Sales volumes
| p | | Additional ammonia capacity at Geismar and Augusta led to an increase in saleable tonnes of downstream products. |
| q | | Urea volumes were down as gas interruptions in Trinidad led us to divert more production to higher-margin ammonia. |
Cost of goods sold
| p | | Average costs, including our hedge position, for natural gas used as feedstock in production fell 9 percent. Costs for natural gas used as feedstock in Trinidad production declined 9 percent, while our US spot costs for natural gas rose 25 percent. Including losses on our hedge position, US gas prices declined 5 percent. |
| p | | The cost of goods sold variance was positive for solutions, nitric acid, ammonium nitrate due to the impact of costs associated with Geismar in 2012 that did not repeat in 2013. |
| q | | The negative costs of goods sold variance for ammonia and urea primarily reflected increased natural gas costs used as feedstock in production in the US more than offsetting declines in Trinidad. |
The change in product mix produced a favorable variance of $150 million related to sales volumes and an unfavorable variance of $149 million in sales prices due to increased sales of solutions as a result of our expansion at Geismar in 2013.
| | |
| 68 | | PotashCorp 2013 Annual Integrated Report |
PERFORMANCE: 2012 VS 2011
The most significant contributors to the change in total gross margin were as follows (direction of arrows refers to impact on gross margin):
Net sales prices
| p | | Ammonia prices were impacted by outages in the Middle East and North Africa, natural gas curtailments in Trinidad and increased demand. |
| p | | Although the sharp increase in urea prices in the second quarter of 2012 did not last, prices remained elevated on tight market supplies. |
Sales volumes
| q | | Sales volumes were below the same period in 2011, largely as a result of a turnaround at Augusta and natural gas limitations at Trinidad impacting our production in 2012. |
Cost of goods sold
| p | | Average natural gas costs in production, including our hedge position, fell 4 percent. Natural gas costs in Trinidad production rose 4 percent while our US spot costs for natural gas used in production decreased 28 percent. Including losses on our hedge position, US gas prices declined 17 percent. |
NITROGEN NON-FINANCIAL RESULTS
| | | | | | | | | | | | | | | | | | | | | | | | |
| | | | | | | | | | | | | | | | % Increase (Decrease) | |
| | | | | 2013 | | | 2012 | | | 2011 | | | | | 2013 | | | 2012 | |
Production | | N tonnes produced (thousands) | | | 2,952 | | | | 2,602 | | | | 2,813 | | | | | | 13 | | | | (8 | ) |
Safety | | Total site recordable injury rate | | | 0.54 | | | | 0.44 | | | | 0.37 | | | | | | 23 | | | | 19 | |
Employee | | Employee turnover percentage | | | 6.5% | | | | 4.2% | | | | 4.5% | | | | | | 55 | | | | (7 | ) |
Environmental | | Greenhouse gas emissions
(CO2 equivalent tonnes/tonne of product) | | | 2.4 | | | | 2.3 | | | | 2.6 | | | | | | 4 | | | | (12 | ) |
| | | Environmental incidents | | | 1 | | | | 6 | | | | 3 | | | | | | (83 | ) | | | 100 | |
PERFORMANCE: 2013 VS 2012
Production
| Ÿ | | The increase in production was mainly due to the restart of ammonia production at Geismar in early 2013. |
Safety
| Ÿ | | The nitrogen total site recordable injury rate increased as fewer contractor hours were worked in 2013 (as more hours were incurred in 2012 to complete the ammonia restart at Geismar) offsetting the reduction in recordable injuries (16 in 2013 and 19 in 2012). |
Employee
| Ÿ | | During the fourth quarter of 2013, we announced a workforce reduction – 21 people were affected (none in 2012) – to respond to challenging market conditions and reduce costs to enhance |
| | | the global competitive position of the nitrogen segment. The full impact of our workforce reduction announced in 2013 will not be reflected until 2014 due to the timing of certain severance processes. |
| Ÿ | | More than 200 employees in 2013 (2012 – more than 170 employees) received leadership training, an increase that was partially due to a plant optimization and efficiency course for leaders at Trinidad. |
Environmental
| Ÿ | | Environmental incidents fell, due in part to improvement initiatives targeted to find ways of reducing the company’s environmental impact, including the implementation of Reportable Quantity (RQ) prevention teams at each facility. In comparison, 2012 included extreme weather events, equipment failures and human error that resulted in a higher number of incidents. |
| | |
| PotashCorp 2013 Annual Integrated Report | | 69 |
Nitrogen
PERFORMANCE: 2012 VS 2011
Safety
| Ÿ | | Total site recordable injury rate rose due to an increase in injuries at Lima and fewer hours worked at Trinidad. |
Employee
| Ÿ | | More than 170 employees in 2012 (2011 – more than 180 employees) received leadership training. |
Environmental
| Ÿ | | GHG emissions fell due to the installation of nitrous oxide controls at Geismar, our largest nitric acid plant. |
| Ÿ | | Environmental incidents were up due to an extreme weather event, equipment failures and human error, the latter two of which have been investigated and corrected to prevent a similar recurrence. |
NITROGEN PRODUCTION
(million tonnes)
| | | | | | | | | | | | | | | | | | | | | | | | | | | | | | | | | | | | | | | | | | | | | | | | |
| | | Ammonia 1 | | | Urea Solids | | | Nitrogen Solutions 2 | |
| | | Annual
Capacity | | | Production | | | Annual
Capacity | | | Production | | | Annual
Capacity | | | Production | |
| | | 2013 | | | 2012 | | | 2011 | | | | 2013 | | | 2012 | | | 2011 | | | | 2013 | | | 2012 | | | 2011 | |
| | | | | | | | | | | | | | | | | | | | | | | | | | | | | | | | | | | | | | | | | | | | | | | | | |
Trinidad | | | 2.2 | | | | 1.91 | | | | 1.97 | | | | 2.09 | | | | 0.7 | | | | 0.49 | | | | 0.57 | | | | 0.62 | | | | – | | | | – | | | | – | | | | – | |
Augusta GA | | | 0.8 | | | | 0.74 | | | | 0.63 | | | | 0.72 | | | | 0.5 | | | | 0.29 | | | | 0.26 | | | | 0.26 | | | | 0.6 | | | | 0.25 | | | | 0.25 | | | | 0.33 | |
Lima OH | | | 0.6 | | | | 0.58 | | | | 0.57 | | | | 0.61 | | | | 0.3 | | | | 0.34 | | | | 0.33 | | | | 0.34 | | | | 0.2 | | | | 0.08 | | | | 0.09 | | | | 0.09 | |
| Geismar LA | | | 0.5 | | | | 0.40 | | | | – | | | | – | | | | – | | | | – | | | | – | | | | – | | | | 1.0 | | | | 0.47 | | | | 0.09 | | | | 0.08 | |
| Total | | | 4.1 | | | | 3.63 | | | | 3.17 | | | | 3.42 | | | | 1.5 | | | | 1.12 | | | | 1.16 | | | | 1.22 | | | | 1.8 | | | | 0.80 | | | | 0.42 | | | | 0.50 | |
| | | |
| | | Nitric Acid 1,3 | | | Ammonium Nitrate Solids | | | | |
| | | Annual
Capacity | | | Production | | | Annual
Capacity | | | Production | | | | | | | |
| | | 2013 | | | 2012 | | | 2011 | | | | 2013 | | | 2012 | | | 2011 | | | Employees 4 | |
| | | | | | | | | | | | | | | | | | | | | | | | | | | | | | | | | | | | | | | | | | | | | | | | | |
Trinidad | | | – | | | | – | | | | – | | | | – | | | | – | | | | – | | | | – | | | | – | | | | 381 | |
Augusta GA | | | 0.6 | | | | 0.57 | | | | 0.57 | �� | | | 0.60 | | | | 0.6 | | | | 0.51 | | | | 0.51 | | | | 0.54 | | | | 132 | |
| Lima OH | | | 0.1 | | | | 0.11 | | | | 0.11 | | | | 0.11 | | | | – | | | | – | | | | – | | | | – | | | | 145 | |
| Geismar LA | | | 0.8 | | | | 0.71 | | | | 0.54 | | | | 0.50 | | | | – | | | | – | | | | – | | | | – | | | | 131 | |
| Total | | | 1.5 | | | | 1.39 | | | | 1.22 | | | | 1.21 | | | | 0.6 | | | | 0.51 | | | | 0.51 | | | | 0.54 | | | | 789 | |
| 1 | A substantial portion is upgraded to value-added products. |
| 4 | Totals as at December 31, 2013 and do not fully reflect announced workforce changes |
| | |
| 70 | | PotashCorp 2013 Annual Integrated Report |

J.P. Whitford supervising operations at our Aurora, North Carolina phosphate facility.
| | | | | | |
| | | |
| Goal | | Key Strategies | | Risks | | Mitigation |
Financial Health | | Optimize product mix to maximize gross margin and reduce volatility Enhance our global competitive position and earnings potential by improving efficiencies and costs | | Cyclicality in earnings due to fluctuations in demand, changes in available supply and volatility in raw material costs | | Leverage our product mixcapabilities to supply less-cyclical
feed and industrial markets Streamline our operations and
logistics to minimize costs |
Supplier of Choice | | Enhance diversification capability and efficiency to serve customers | | No A, B level risk* |
Community Engagement | | Contribute to local economic growth through employment, purchasing and taxes Invest in organizations and projects
that bring sustainable value | | No A, B level risk* |
Engaged Employees | | Provide opportunities for development and advancement | | No A, B level risk* |
No Harm to People or Environment | | Utilize industry and company best
practices to improve safety and environmental performance Focus on reducing our impact on land and water | | Unsafe actions or conditions can result in serious injury or industrial site accidents | | Enhance safety systems at all sites |
| * | As per risk ranking matrix on Pages 27-28 |
Phosphate
PHOSPHATE INDUSTRY OVERVIEW
When examining the phosphate business, we believe it is important to understand three key factors.
| 1. | | High-quality, lower-cost rock is critical tolong-term success |
Phosphate rock, the feedstock for all phosphate products, is geographically concentrated. China, the US and Morocco together produce 70 percent of the world’s supply, and Morocco alone typically accounts for approximately one-third of global exports. The US accounts for 14 percent of global rock production due to its sizable high-quality reserves, although rising environmental costs and the ability to permit new mines have proved challenging.
We believe access to lower-cost rock is the single most important contributor to a successful phosphate business. Nearly one-third of global producers are non-integrated and rely on purchased rock. With prices for traded rock well above most integrated producers’ mining costs, prices for downstream phosphate products tend to reflect higher-cost non-integrated producers’ costs of production.
| 2. | | Sulfur and ammonia market changes affect profitability |
Sulfur is required to manufacture all phosphate products, and ammonia is necessary to produce many fertilizers as well as certain industrial products. Changing prices for these raw material inputs, as well as the rising costs of freight, have historically resulted in production cost volatility for certain downstream phosphate products.
Along with purchased rock costs of non-integrated producers, phosphate prices have historically reflected changes in the costs of these inputs, although there can be a time lag between the purchase of raw materials and the sale of the finished product.
| 3. | | India drives phosphate trade |
India must rely heavily on imports to meet its need for solid phosphate fertilizers since its indigenous rock supply is limited. It imports either finished products or the raw materials (rock, ammonia and sulfur or phosphoric acid) required to make those products. Despite lower than normal demand due to reduced subsidies, India remains the largest buyer of phosphate products in the world. In 2013, it accounted for almost 20 percent of global trade in DAP and MAP and 45 percent of liquid fertilizer imports.
Major suppliers to India are Saudi Arabia and China, together accounting for three-quarters of its total imports in 2013. Saudi Arabia has expanded its presence as a major supplier to this region with the ramp-up of its Ma’aden project. China, while a major exporter of phosphate products to the Indian market, has typically seen its available supply fluctuate according to global prices and its own export tax policies.
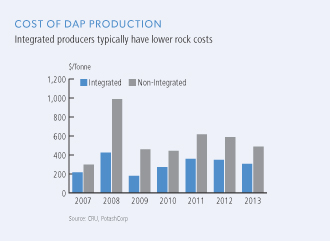
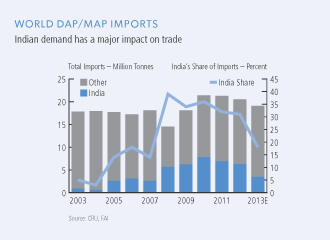
| | |
| 72 | | PotashCorp 2013 Annual Integrated Report |
OUR PHOSPHATE BUSINESS
Operations
Our phosphate operations are located in the US, with large integrated mining and processing operations in Aurora, North Carolina and White Springs, Florida, and smaller processing plants in five states. We mine 95 percent of the phosphate rock we use; only at Geismar do we import rock to meet certain customers’ product requirements.
At Aurora, we have long-term permits in place which allow approximately 27 years of mining. We have a life-of-mine permit at White Springs, which we currently expect to be 16 years.
Market Overview
Although almost 90 percent of the phosphoric acid produced globally goes into fertilizer, it makes up only 68 percent of our annual phosphate sales volumes. Sales are categorized into two segments: fertilizer, and feed and industrial. Within each segment we produce a number of products – resulting in the most diversified portfolio among our peers.
North America
We sell more than two-thirds of our phosphate products in North America, where our geographic proximity to customers means we typically benefit from reduced freight costs.
We compete in fertilizer markets with Agrium, CF Industries, Mosaic, Mississippi Phosphates, Simplot and offshore imports primarily from Morocco and Russia. For industrial sales, our primary competitors are Innophos, ICL and producers from China. In feed sales we compete with Mosaic, Simplot and producers from China and Russia.
Offshore
Most of our offshore sales are made to India and Latin America, which represented approximately 32 percent of our total sales volumes in 2013. Among our products, liquid phosphate has the most exposure to offshore markets where more than half our sales are made, in particular to India.
We compete primarily with Morocco’s OCP SA and producers from China, Russia and Saudi Arabia.
In 2013, our solid phosphate fertilizers were sold offshore by PhosChem, a US marketing association that includes Mosaic. Beginning in 2014, all sales of our fertilizer, feed and industrial products will be handled by PCS Sales.
| | |
| PotashCorp 2013 Annual Integrated Report | | 73 |
Phosphate
ALIGNMENT WITH OUR GOALS
| | |
| | Create Superior Shareholder Value |
Improve the global cost-competitiveness of our operations
The phosphate business is highly competitive and we focus constantly on improving the cost position of our assets. At Aurora, our largest facility, we have initiatives underway to help lower rock mining costs. Key to achieving this objective was implementing a coarse ore recovery project, which has been successful in improving production levels and lowering mine costs. Additionally, we have put initiatives in place at all of our phosphate facilities to reduce our reliance on contractors, and have taken steps to better balance our workforce requirements.
Beyond mining and efficiency opportunities, we are optimizing our production. In late 2013, we announced plans to close one of two chemical plants at White Springs in the second half of 2014. This change is expected to result in the loss of approximately 215,000 tonnes of P2O5 production on an annualized basis, but we anticipate it will result in improvement in per-tonne gross margin. As well, we set a multi-year target to reduce delivered sulfur and ammonia costs to our facilities, which is expected to further enhance our competitive position in this nutrient.
| | |
| | Be the Supplier of Choice |
Provide customers with quality and choice
In our customer surveys we continued to outperform competitors on quality, reliability and service. One of the primary reasons we believe we are well positioned to remain a leader in this area is our diversified product offering. We provide the widest range of products among our fertilizer peers, from specialized feed and industrial products to niche liquid fertilizers. We believe this diversity adds value not only for PotashCorp but also for customers.
| | |
| | Build Strong Relationships with Our Communities |
Investing in our communities
In 2013, we invested approximately $3 million in the communities in and around our phosphate operations. We support these communities through corporate contributions and by matching employee donations. In addition, many employees contributed volunteer hours to local causes and organizations.
A key focus for us is ensuring that we have strong ties to our communities. We do this by actively engaging with members of the community on a regular basis. We host town hall meetings with local community members, and provide guided tours at both Aurora and White Springs for people who wish to learn more about our operations.
| | |
| | Attract and Retain a Skilled and Committed Workforce |
Redefining structure and roles
In 2013, we had to take difficult steps to enhance our competitive position in phosphate. While we remain a significant employer in each of the communities where we operate, we announced reductions to our total phosphate workforce – with the majority at our White Springs operation.
As part of these changes, we implemented a new organizational structure within our phosphate business that allows growth opportunities for employees, but also provides for greater sharing and standardization of best practices across the business.
| | |
| | No Harm to People or Damage to the Environment |
Striving to improve safety performance
Although we continue to focus on building a culture of caring throughout our workforce, during 2013 our recordable injury rate in phosphate increased. By actively pursuing ways to enhance existing safety systems and implement industry and company best practices, we believe we can improve our safety record at each of our sites and become one of the safest resource companies in the world.
Focus on water and land conservation
Our phosphate facilities are the largest users of water among our operations. We continue to explore ways to improve water efficiency at our facilities in order to minimize usage. In 2013, we recycled approximately 95 percent of the water used. In addition, to minimize our impact on the land, we restore two acres of wetlands for every acre disturbed at Aurora and a minimum of one acre restored per acre mined at White Springs.
| | |
| 74 | | PotashCorp 2013 Annual Integrated Report |
Phosphate performance
PHOSPHATE FINANCIAL RESULTS
| | | | | | | | | | | | | | | | | | | | | | | | | | | | | | | | | | | | | | | | | | | | | | | | | | | | | | | | | | | | |
| | | Dollars (millions) | | | % Increase
(Decrease) | | | Tonnes (thousands) | | | % Increase
(Decrease) | | | Average per Tonne 1 | | | % Increase
(Decrease) | |
| | | 2013 | | | 2012 | | | 2011 | | | 2013 | | | 2012 | | | 2013 | | | 2012 | | | 2011 | | | 2013 | | | 2012 | | | 2013 | | | 2012 | | | 2011 | | | 2013 | | | 2012 | |
Manufactured product | | | | | | | | | | | | | | | | | | | | | | | | | | | | | | | | | | | | | | | | | | | | | | | | | | | | | | | | | | | | |
Net sales | | | | | | | | | | | | | | | | | | | | | | | | | | | | | | | | | | | | | | | | | | | | | | | | | | | | | | | | | | | | |
Fertilizer | | $ | 1,079 | | | $ | 1,291 | | | $ | 1,533 | | | | (16 | ) | | | (16 | ) | | | 2,496 | | | | 2,473 | | | | 2,666 | | | | 1 | | | | (7 | ) | | $ | 433 | | | $ | 522 | | | $ | 575 | | | | (17 | ) | | | (9 | ) |
Feed and Industrial | | | 749 | | | | 778 | | | | 750 | | | | (4 | ) | | | 4 | | | | 1,184 | | | | 1,170 | | | | 1,188 | | | | 1 | | | | (2 | ) | | $ | 632 | | | $ | 665 | | | $ | 631 | | | | (5 | ) | | | 5 | |
| | | 1,828 | | | | 2,069 | | | | 2,283 | | | | (12 | ) | | | (9 | ) | | | 3,680 | | | | 3,643 | | | | 3,854 | | | | 1 | | | | (5 | ) | | $ | 497 | | | $ | 568 | | | $ | 592 | | | | (13 | ) | | | (4 | ) |
Cost of goods sold | | | (1,527 | ) | | | (1,617 | ) | | | (1,650 | ) | | | (6 | ) | | | (2 | ) | | | | | | | | | | | | | | | | | | | | | | $ | (415 | ) | | $ | (444 | ) | | $ | (428 | ) | | | (7 | ) | | | 4 | |
Gross margin | | | 301 | | | | 452 | | | | 633 | | | | (33 | ) | | | (29 | ) | | | | | | | | | | | | | | | | | | | | | | $ | 82 | | | $ | 124 | | | $ | 164 | | | | (34 | ) | | | (24 | ) |
| Other miscellaneous and purchased product gross margin 2 | | | 3 | | | | 17 | | | | 15 | | | | (82 | ) | | | 13 | | | | | | | | | | | | | | | | | | | | | | | | | | | | | | | | | | | | | | | | | |
| Gross Margin | | $ | 304 | | | $ | 469 | | | $ | 648 | | | | (35 | ) | | | (28 | ) | | | | | | | | | | | | | | | | | | | | | | $ | 83 | | | $ | 129 | | | $ | 168 | | | | (36 | ) | | | (23 | ) |
| Note | 16 to the consolidated financial statements provides information pertaining to our business segments. |
| 1 | Rounding differences may occur due to the use of whole dollars in per-tonne calculations. |
| 2 | Comprised of net sales of $24 million (2012 – $32 million, 2011 – $29 million) less cost of goods sold of $21 million (2012 – $15 million, 2011 – $14 million). |
Phosphate gross margin variance was attributable to:
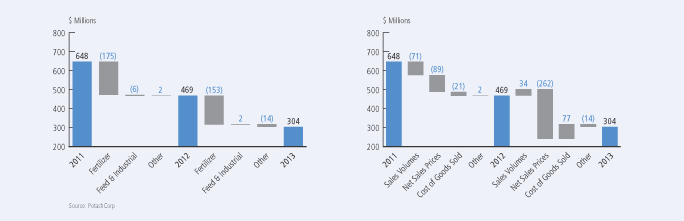
| | | | | | | | | | | | | | | | | | | | | | | | | | | | | | | | |
| | | | | | 2013 vs 2012 | | | | | | | | | 2012 vs 2011 | | | | |
| | | | | | Change in Prices/Costs | | | | | | | | | Change in Prices/Costs | | | | |
| Dollars (millions) | | Change in Sales Volumes | | | Net Sales | | | Cost of Goods Sold | | | Total | | | Change in Sales Volumes | | | Net Sales | | | Cost of Goods Sold | | | Total | |
Manufactured product | | | | | | | | | | | | | | | | | | | | | | | | | | | | | | | | |
Fertilizer | | | $ 27 | | | | $ (222 | ) | | | $ 42 | | | | $ (153 | ) | | | $ (58 | ) | | | $ (132 | ) | | | $ 15 | | | | $ (175 | ) |
Feed and Industrial | | | 6 | | | | (39 | ) | | | 35 | | | | 2 | | | | (13 | ) | | | 43 | | | | (36 | ) | | | (6 | ) |
Change in product mix | | | 1 | | | | (1 | ) | | | – | | | | – | | | | – | | | | – | | | | – | | | | – | |
Total manufactured product | | | $ 34 | | | | $ (262 | ) | | | $ 77 | | | | $ (151 | ) | | | $ (71 | ) | | | $ (89 | ) | | | $ (21 | ) | | | $ (181 | ) |
Other miscellaneous and purchased product | | | | | | | | | | | | | | | (14 | ) | | | | | | | | | | | | | | | 2 | |
Total | | | | | | | | | | | | | | | $ (165 | ) | | | | | | | | | | | | | | | $ (179 | ) |
| | |
| PotashCorp 2013 Annual Integrated Report | | 75 |
Phosphate
PERFORMANCE: 2013 VS 2012
The most significant contributors to the change in total gross margin were as follows (direction of arrows refers to impact on gross margin):
Net sales prices
| q | | Our average realized phosphate price was down as a result of reduced global fertilizer demand and start-up of new capacity. |
Cost of goods sold
| p | | Sulfur costs were lower (down 26 percent). |
| q | | Costs associated with our workforce reduction at Aurora, White Springs and our feed plants were incurred in 2013. In 2012, costs were associated with our Aurora workforce reduction. |
| p | | Solid fertilizer costs reflected lower ammonia costs (down 10 percent). |
PERFORMANCE: 2012 VS 2011
The most significant contributors to the change in total gross margin were as follows (direction of arrows refers to impact on gross margin):
Net sales prices
| q | | Our average realized phosphate price reflected lower prices for both solid and liquid fertilizers as a result of key benchmark prices resetting due to a slowdown in demand and new capacity. |
| p | | Industrial products benefited from a time lag on quarterly contract sales tied to trailing rock and sulfur costs. |
Sales volumes
| q | | Volumes were down due to weak offshore demand and limited phosphoric acid production caused by challenging mining conditions in a new portion of our Aurora mine, weather-related issues and plant turnarounds. |
Cost of goods sold
| p | | Sulfur costs were lower (down 6 percent). |
| q | | Solid fertilizer costs reflected higher ammonia costs (up 14 percent). |
| q | | Rock costs rose on challenging mining conditions in Aurora and increased prices of purchased rock at Geismar. |
| p | | Negative adjustments to our phosphate asset retirement obligations in 2011 did not occur in 2012. |
| q | | Costs associated with our Aurora workforce reduction were incurred during 2012. |
| | |
| 76 | | PotashCorp 2013 Annual Integrated Report |
PHOSPHATE NON-FINANCIAL RESULTS
| | | | | | | | | | | | | | | | | | | | | | | | |
| | | | | | | | | | | | | | | | % Increase (Decrease) | |
| | | | | 2013 | | | 2012 | | | 2011 | | | | | 2013 | | | 2012 | |
Production and Reserves | | P2O5 tonnes produced (thousands) | | | 2,058 | | | | 1,983 | | | | 2,204 | | | | | | 4 | | | | (10 | ) |
| | P2O5 operating rate percentage | | | 87% | | | | 84% | | | | 93% | | | | | | 4 | | | | (10 | ) |
Safety | | Total site recordable injury rate | | | 1.07 | | | | 0.59 | | | | 1.22 | | | | | | 81 | | | | (52 | ) |
Employee | | Employee turnover percentage | | | 5.6% | | | | 5.6% | | | | 2.9% | | | | | | – | | | | 93 | |
Environmental | | Water usage (million m3) per million tonnes of product | | | 26 | | | | 33 | | | | 33 | | | | | | (21 | ) | | | – | |
| | Recycled water used in operations (percentage) | | | 95% | | | | 94% | | | | 94% | | | | | | 1 | | | | – | |
| | | Environmental incidents | | | 3 | | | | 5 | | | | 2 | | | | | | (40 | ) | | | 150 | |
PERFORMANCE: 2013 VS 2012
Production and Reserves
Estimated proven and probable phosphate reserves as of December 31, 2013 are described in the table on this page. For a more complete discussion of important information related to our phosphate reserves, see “Phosphate Operations – Reserves” in our Form 10-K for the year ended December 31, 2013.
| | | | | | | | | | | | | | | | |
| | | Tonnes of Phosphate Rock Reserves (millions of tonnes) 1 | | | Average Estimated
Years of Remaining
Mine Life | |
| | | Proven | | | Probable | | | Total | | |
Aurora 2 | | | 98.8 | | | | 7.8 | | | | 106.6 | | | | 27 | |
White Springs 3 | | | 30.5 | | | | – | | | | 30.5 | | | | 11 | |
Total | | | 129.3 | | | | 7.8 | | | | 137.1 | 4 | | | | |
| 1 | Stated average grade30.66% P2O5. |
| 2 | The reserves set forth above for Aurora would permit mining to continue at annual production rates for about 27 years, based on an average annual production rate of approximately 3.99 million tonnes of 30.66% concentrate over the three-year period ended December 31, 2013. If mineral deposits covered by the permit at Aurora and now reclassified as resources are included, the mine life at Aurora would be about 45 years at such rate of production. Mineral resources that are not mineral reserves do not have demonstrated economic viability. |
| 3 | The reserves set forth above for White Springs would permit mining to continue at annual production rates for about 11 years, based on an average annual production rate of approximately 2.71 million tonnes of 30.66% concentrate over the three-year period ended December 31, 2013. After giving effect to the closure of the Suwanee River chemical plant, we forecast a mine life of approximately 16 years based on an average forecasted annual production rate of approximately 1.91 million tonnes of 30.66% concentrate. |
| 4 | Includes55.3 million proven reserves and6.8 million probable reserves to be permitted. |
Safety
| Ÿ | | We experienced increased recordable injury rates at Aurora and White Springs. Both sites have implemented steps intended to reduce the injury rates. |
Employee
| Ÿ | | During the fourth quarter of 2013, we announced a workforce reduction – 441 people at White Springs, Aurora and our feed plants were affected (132 people in 2012 at Aurora) – to respond |
| | | to challenging market conditions and to reduce costs to enhance the global competitive position of the company. The full impact of our workforce reduction announced in 2013 will not be reflected until 2014 due to the timing of certain severance processes. |
| Ÿ | | More than130 employees in 2013 (2012 – more than 230 employees) received leadership training. |
Environmental
| Ÿ | | Water usage in our phosphate operations decreased primarily due to more water recycling at White Springs (less rainwater to recycle in 2012) and efforts to conserve water. |
| Ÿ | | Environmental incidents fell year-over-year as 2012 included four incidents occurring during or immediately following extreme weather events. |
PERFORMANCE: 2012 VS 2011
Production and Reserves
| Ÿ | | Production monitors and cameras installed on draglines at Aurora improved phosphate mining efficiency during 2012. |
Safety
| Ÿ | | Safety improvement plans implemented in 2012 focused on improving employee and contractor safety, resulting in a reduced total site recordable injury rate. |
Employee
| Ÿ | | Employee turnover rate (excluding retirements) on an annualized basis was up due mainly to a workforce reduction at Aurora. |
| Ÿ | | More than 230 employees in 2012 (2011 – more than 190 employees) received leadership training. |
Environmental
| Ÿ | | The rise in environmental incidents was the result of four incidents that occurred during or immediately following extreme weather events in 2012. |
| | |
| PotashCorp 2013 Annual Integrated Report | | 77 |
Phosphate
PHOSPHATE PRODUCTION
(million tonnes product)
| | | | | | | | | | | | | | | | | | | | | | | | | | | | | | | | | | | | | | | | | | | | | | | | | | | | | | | | | | | | | | | | | | |
| | | Aurora | | | | | White Springs | | Geismar | | | |
| | Annual Capacity | | | | | | Production | | | | | Annual Capacity | | | | | | Production | | | | | Annual Capacity | | | | | | Production | | | |
| | | | 2013 | | | 2012 | | | 2011 | | | | | | | 2013 | | | 2012 | | | 2011 | | | | | | | | | 2013 | | | 2012 | | | 2011 | | | |
| | | | | | | | | | | | | | | | | | | | | | | | | | | | | | | | | | | | | | | | | | | | | | | | | | | | | | | | | | | | | | | | | | | |
Liquids: MGA 1 | | | 2.0 | | | | | | | | 1.96 | | | | 1.77 | | | | 1.96 | | | | | | 1.9 | | | | | | | | 0.01 | | | | 0.02 | | | | 0.00 | | | | | | 0.3 | | | | | | | | 0.20 | | | | 0.21 | | | | 0.23 | | | |
| SPA | | | 0.7 | | | | | | | | 0.23 | | | | 0.22 | | | | 0.26 | | | | | | 1.1 | | | | | | | | 0.74 | | | | 0.74 | | | | 0.80 | | | | | | 0.2 | | | | | | | | – | | | | – | | | | – | | | |
| | | | | | | | | | | | | | | | | | |
Solids (total) | | | 1.2 | | | | DAP | | | | 0.17 | | | | 0.21 | | | | 0.47 | | | | | | 0.7 | | | | DAP | | | | – | | | | – | | | | – | | | | | | – | | | | DAP | | | | – | | | | – | | | | – | | | |
| | | | | | | MAP | | | | 0.53 | | | | 0.44 | | | | 0.37 | | | | | | | | | | MAP | | | | 0.53 | | | | 0.55 | | | | 0.59 | | | | | | | | | | MAP | | | | – | | | | – | | | | – | | | |
DAP/MAP (total) | | | | | | | | | | | 0.70 | | | | 0.65 | | | | 0.84 | | | | | | | | | | | | | | 0.53 | | | | 0.55 | | | | 0.59 | | | | | | | | | | | | | | – | | | | – | | | | – | | | |
| 1 | A substantial portion is consumed internally in the production of downstream products. The balance is exported to phosphate fertilizer producers and sold domestically to dealers whocustom-mix liquid fertilizer. |
ROCK AND ACID PRODUCTION
| | | | | | | | | | | | | | | | | | | | | | | | | | | | | | | | | | | | |
| | | Phosphate Rock Production (million tonnes) | | | Phosphoric Acid(million tonnes P2O5) | | | | |
| | | Annual Capacity | | | | | | Production | | | | | | Annual Capacity | | | | | | Production | | | | | | | |
| | | 2013 | | | 2012 | | | 2011 | | | | 2013 | | | 2012 | | | 2011 | | | Employees 1 | |
| | | | | | | | | | | | | | | | | | | | | | | | | | | | | | | | | | | | | |
Aurora NC | | | 6.0 | | | | 4.90 | | | | 4.09 | | | | 4.62 | | | | 1.2 | | | | 1.13 | | | | 1.03 | | | | 1.18 | | | | 790 | |
White Springs FL | | | 3.6 | | | | 2.84 | | | | 2.73 | | | | 2.69 | | | | 1.0 | | | | 0.81 | | | | 0.83 | | | | 0.89 | | | | 701 | |
Geismar LA | | | – | | | | – | | | | – | | | | – | | | | 0.2 | | | | 0.12 | | | | 0.12 | | | | 0.14 | | | | 30 | |
Total | | | 9.6 | | | | 7.74 | | | | 6.82 | | | | 7.31 | | | | 2.4 | | | | 2.06 | | | | 1.98 | | | | 2.21 | | | | 1,521 | |
| 1 | Totals as at December 31, 2013 do not fully reflect announced workforce changes. |
PURIFIED ACID PRODUCTION
(million tonnes P2O5)
| | | | | | | | | | | | | | | | |
| | | Annual Capacity | | | Production | |
| | | 2013 | | | 2012 | | | 2011 | |
| | | | | | | | | | | | | | | | | |
Aurora NC | | | 0.3 | | | | 0.24 | | | | 0.24 | | | | 0.25 | |
Purified acid is a feedstock for production of downstream industrial products such as metal brighteners, cola drinks and pharmaceuticals.
PHOSPHATE PRODUCTS FOR FOOD
AND TECHNICAL APPLICATIONS
(tonnes P2O5)
| | | | | | | | | | | | |
Cincinnati OH | | | 2013 | | | | 2012 | | | | 2011 | |
Purified acid feedstock utilized | | | 7,714 | | | | 12,163 | | | | 10,911 | |
Product tonnes processed: | | | | | | | | | | | | |
Acid phosphates | | | 11,753 | | | | 14,624 | | | | 14,337 | |
Specialty phosphates | | | 3,526 | | | | 4,473 | | | | 5,635 | |
Employees 1 | | | 17 | | | | 20 | | | | 23 | |
| 1 | Totals as at December 31, 2013 do not fully reflect announced workforce changes. |
| One | phosphate employee is located in Newgulf TX. |
PHOSPHATE FEED PRODUCTION
(million tonnes)
| | | | | | | | | | | | | | | | | | |
| | | Annual Capacity | | Production | | | | |
| | | 2013 | | | 2012 | | | 2011 | | | Employees 2 | |
Marseilles IL | | 0.3 | | | 0.18 | | | | 0.20 | | | | 0.20 | | | | 29 | |
White Springs FL | | | | | | | | | | | | | | | | | | |
(Monocal) 1 | | 0.3 | | | – | | | | – | | | | – | | | | – | |
Weeping Water NE | | 0.2 | | | 0.07 | | | | 0.06 | | | | 0.08 | | | | 28 | |
Joplin MO | | 0.2 | | | 0.06 | | | | 0.05 | | | | 0.05 | | | | 22 | |
Aurora NC (DFP) | | 0.1 | | | 0.08 | | | | 0.06 | | | | 0.04 | | | | 19 | |
Total | | 1.1 | | | 0.39 | | | | 0.37 | | | | 0.37 | | | | 98 | |
| 1 | Ceased production January 1, 2009 |
| 2 | Totals as at December 31, 2013 do not fully reflect announced workforce changes. |
| | |
| 78 | | PotashCorp 2013 Annual Integrated Report |
Other expenses and income
| | | | | | | | | | | | | | | | | | | | | | |
Dollars (millions), except percentage amounts | | | | | | | | | | | | | | | | | |
| | | | | | | | | | | | | | % Increase (Decrease) | |
| | | 2013 | | | 2012 | | | 2011 | | | | | 2013 | | | 2012 | |
Selling and administrative expenses | | $ | (231 | ) | | $ | (219 | ) | | $ | (217 | ) | | | | | 5 | | | | 1 | |
Provincial mining and other taxes | | | (194 | ) | | | (180 | ) | | | (147 | ) | | | | | 8 | | | | 22 | |
Share of earnings of equity-accounted investees | | | 195 | | | | 278 | | | | 261 | | | | | | (30 | ) | | | 7 | |
Dividend income | | | 92 | | | | 144 | | | | 136 | | | | | | (36 | ) | | | 6 | |
Impairment of available-for-sale investment | | | – | | | | (341 | ) | | | – | | | | | | n/m | | | | n/m | |
Other expenses | | | (36 | ) | | | (73 | ) | | | (13 | ) | | | | | (51 | ) | | | 462 | |
Finance costs | | | (144 | ) | | | (114 | ) | | | (159 | ) | | | | | 26 | | | | (28 | ) |
Income taxes | | | (687 | ) | | | (826 | ) | | | (1,066 | ) | | | | | (17 | ) | | | (23 | ) |
2013 VS 2012
Provincial mining and other taxes are comprised mainly of the Saskatchewan potash production tax (PPT) and a resource surcharge. The PPT is comprised of a base tax per tonne of product sold and an additional tax based on mine profit, which is reduced by an amount based on potash capital expenditures. The resource surcharge is 3 percent of the value of the company’s Saskatchewan resource sales. The PPT expense increased due toreduced capital spending and a legislated tax increase partially offset by decreased potash sales revenue. The resource surcharge decreased as a result of lower potash sales revenue during 2013.
Our share of earnings of equity-accounted investees was lower than last year due to decreased earnings at SQM and APC. ICL paid lower dividends in 2013 than in 2012.
In 2012, we concluded there was objective evidence that our available-for-sale investment in Sinofert was impaired due to the significance by which fair value was below cost. As a result, we recognized a non-tax deductible impairment loss of $341 million in net income in 2012. No such losses were recognized in 2013.
Other expenses were lower due to a provision of $41 million for the settlement of eight antitrust lawsuits recorded in 2012. No significant legal provisions were recognized in 2013.
Finance costs were higher as a result of lower capitalized interest.
Weighted average debt obligations outstanding and the associated effective interest rates were as follows:
| | | | | | | | | | | | | | | | |
Dollars (millions), except percentage amounts | |
| Obligations | | Weighted Average | | | 2013 | | | 2012 | | | % Change | |
Long-term debt 1 | | | Outstanding | | | $ | 3,558 | | | $ | 3,757 | | | | (5 | ) |
| | | Interest rate | | | | 5.2% | | | | 5.2% | | | | – | |
Short-term debt | | | Outstanding | | | $ | 254 | | | $ | 533 | | | | (52 | ) |
| | | | Interest rate | | | | 0.3% | | | | 0.4% | | | | (25 | ) |
| 1 | Includes current portion |
Income taxes decreased due to lower income before taxes. Effective tax rates and discrete items were as follows:
| | | | | | | | |
| | | 2013 | | | 2012 | |
Actual effective tax rate on ordinary earnings | | | 26% | | | | 25% | |
Actual effective tax rate including discrete items | | | 28% | | | | 28% | |
Discrete tax adjustments that impacted the rate | | $ | (55 | ) | | $ | (27 | ) |
Significant items to note include the following:
| • | | In 2013, a tax expense of $8 million was recorded to adjust the 2012 income tax provision to the tax returns filed for that year (2012 – $17 million expense to adjust the 2011 income tax provision to the tax returns filed for that year). |
| • | | In 2013, a net tax expense of $13 million was recorded to adjust the deferred tax asset related to foreign tax loss carryforwards to the amount expected to be realized upon utilization. |
| • | | In 2013, a deferred tax expense of $11 million was recorded as a result of a Canadian income tax rate increase. |
| • | | In 2013, a deferred tax expense of $10 million was recorded as a result of a planned distribution of earnings from a foreign jurisdiction. |
| • | | In 2012, a non-tax deductible impairment of the company’s available-for-sale investment in Sinofert was recorded. This increased the 2012 actual effective tax rate including discrete items by 3 percent. |
In 2013, 50 percent of the effective tax rate on the current year’s ordinary earnings pertained to current income taxes and 50 percent related to deferred income taxes (2012 – 57 percent current and 43 percent deferred). The decrease in the current portion was largely due to decreased income before taxes.
Taxes and royalties (described in a graph on Page 32), fell primarily as a result ofdecreased current income taxes and royalties partially offset by increased potash production tax.
| | |
| PotashCorp 2013 Annual Integrated Report | | 79 |
Other expenses and income
2012 VS 2011
The PPT expense increased in 2012 compared to 2011 as a result of carryforwards used in 2011. The resource surcharge decreased as a result of lower potash sales revenue during 2012.
Our 2012 share of earnings of equity-accounted investees was higher than in 2011 due to increased earnings by SQM offsetting lower earnings from APC. ICL paid higher dividends in 2012 than in 2011.
During 2012, we concluded there was objective evidence that our available-for-sale investment in Sinofert was impaired due to the significance by which fair value was below cost. As a result, we recognized a non-tax deductible impairment loss of $341 million in net income in 2012. No such losses were recognized in 2011.
Other expenses were higher due to a provision of $41 million for the settlement of eight antitrust lawsuits, which occurred in early 2013.
Finance costs were lower as a result of higher capitalized interest and the repayment of 10-year senior notes in the second quarter of 2011. Weighted average debt obligations outstanding and the associated interest rates were as follows:
| | | | | | | | | | | | | | | | |
Dollars (millions), except percentage amounts | |
| | | | |
| Obligations | | Weighted Average | | | 2012 | | | 2011 | | | % Change | |
Long-term debt 1 | | | Outstanding | | | $ | 3,757 | | | $ | 4,032 | | | | (7 | ) |
| | | Interest rate | | | | 5.2% | | | | 5.3% | | | | (2 | ) |
Short-term debt | | | Outstanding | | | $ | 533 | | | $ | 950 | | | | (44 | ) |
| | | | Interest rate | | | | 0.4% | | | | 0.4% | | | | – | |
| 1 | Includes current portion |
Income taxes decreased due to lower income before taxes. Effective tax rates and discrete items were as follows:
| | | | | | | | |
| | | 2012 | | | 2011 | |
Actual effective tax rate on ordinary earnings | | | 25% | | | | 26% | |
Actual effective tax rate including discrete items | | | 28% | | | | 26% | |
Discrete tax adjustments that impacted the rate | | $ | (27 | ) | | $ | (1 | ) |
Significant items to note included the following:
| • | | In 2012, a current tax recovery of $28 million and a deferred tax expense of $45 million were recorded to adjust the 2011 income tax provision to the income tax returns filed during 2012. |
| • | | In 2012, a non-tax deductible impairment of the company’s available-for-sale investment in Sinofert was recorded. This increased the 2012 actual effective tax rate including discrete items by 3 percent. |
| • | | In 2011, a current tax recovery of $21 million was recorded for previously paid withholding taxes. |
| • | | In 2011, a current tax recovery of $14 million was recorded due to income tax losses in a foreign jurisdiction. |
| • | | In 2011, a deferred tax expense of $26 million was recorded to adjust amounts related to partnerships. |
For 2012, 57 percent of the effective tax rate on the current year’s ordinary earnings pertained to current income taxes and 43 percent related to deferred income taxes. The decrease in the current portion from 75 percent in 2011 was largely due to lower earnings and increased tax depreciation in Canada.
| | |
| 80 | | PotashCorp 2013 Annual Integrated Report |
Quarterly results
QUARTERLY RESULTS AND REVIEW OF FOURTH-QUARTER PERFORMANCE
| | | | | | | | | | | | | | | | | | | | | | | | | | | | | | | | | | | | | | | | |
(in millions of US dollars except as otherwise noted) | |
| | | 2013 | | | 2012 | |
| | | Q1 | | | Q2 | | | Q3 | | | Q4 | | | Total | | | Q1 | | | Q2 | | | Q3 | | | Q4 | | | Total | |
Financial Results | | | | | | | | | | | | | | | | | | | | | | | | | | | | | | | | | | | | | | | | |
Sales | | $ | 2,100 | | | $ | 2,144 | | | $ | 1,520 | | | $ | 1,541 | | | $ | 7,305 | | | $ | 1,746 | | | $ | 2,396 | | | $ | 2,143 | | | $ | 1,642 | | | $ | 7,927 | |
Less: Freight, transportation and distribution | | | (149 | ) | | | (147 | ) | | | (139 | ) | | | (137 | ) | | | (572 | ) | | | (104 | ) | | | (123 | ) | | | (154 | ) | | | (113 | ) | | | (494 | ) |
Cost of goods sold | | | (1,084 | ) | | | (1,018 | ) | | | (897 | ) | | | (944 | ) | | | (3,943 | ) | | | (944 | ) | | | (1,074 | ) | | | (1,062 | ) | | | (943 | ) | | | (4,023 | ) |
Gross margin | | | 867 | | | | 979 | | | | 484 | | | | 460 | | | | 2,790 | | | | 698 | | | | 1,199 | | | | 927 | | | | 586 | | | | 3,410 | |
Operating income | | | 817 | | | | 927 | | | | 505 | | | | 367 | | | | 2,616 | | | | 685 | | | | 857 | | | | 918 | | | | 559 | | | | 3,019 | |
Net income | | | 556 | | | | 643 | | | | 356 | | | | 230 | | | | 1,785 | | | | 491 | | | | 522 | | | | 645 | | | | 421 | | | | 2,079 | |
Other comprehensive income (loss) | | | 197 | | | | (500 | ) | | | (258 | ) | | | (1 | ) | | | (562 | ) | | | 110 | | | | 21 | | | | 313 | | | | 77 | | | | 521 | |
Net income per share 1 | | | 0.63 | | | | 0.73 | | | | 0.41 | | | | 0.26 | | | | 2.04 | | | | 0.56 | | | | 0.60 | | | | 0.74 | | | | 0.48 | | | | 2.37 | |
Cash provided by operating activities | | | 738 | | | | 1,202 | | | | 616 | | | | 656 | | | | 3,212 | | | | 372 | | | | 1,222 | | | | 759 | | | | 872 | | | | 3,225 | |
Non-Financial Results | | | | | | | | | | | | | | | | | | | | | | | | | | | | | | | | | | | | | | | | |
Production (KCl tonnes – thousands) | | | 2,025 | | | | 2,677 | | | | 1,150 | | | | 1,940 | | | | 7,792 | | | | 1,575 | | | | 2,807 | | | | 1,579 | | | | 1,763 | | | | 7,724 | |
Production (N tonnes – thousands) | | | 723 | | | | 726 | | | | 705 | | | | 798 | | | | 2,952 | | | | 681 | | | | 697 | | | | 651 | | | | 573 | | | | 2,602 | |
P2O5 operating rate percentage | | | 84 | | | | 88 | | | | 90 | | | | 85 | | | | 87 | | | | 82 | | | | 84 | | | | 83 | | | | 85 | | | | 84 | |
PotashCorp’s total shareholder return percentage | | | (3 | ) | | | (2 | ) | | | (17 | ) | | | 6 | | | | (16 | ) | | | 11 | | | | (4 | ) | | | – | | | | (6 | ) | | | – | |
Product tonnes involved in customer complaints (thousands) | | | 8 | | | | 4 | | | | 4 | | | | 27 | | | | 43 | | | | 15 | | | | 32 | | | | 7 | | | | 10 | | | | 64 | |
Taxes and royalties | | $ | 200 | | | $ | 201 | | | $ | 83 | | | $ | 84 | | | $ | 568 | | | $ | 88 | | | $ | 262 | | | $ | 171 | | | $ | 133 | | | $ | 654 | |
Annualized employee turnover rate percentage (excluding retirements) | | | 5 | | | | 4 | | | | 5 | | | | 7 | | | | 5 | | | | 4 | | | | 4 | | | | 8 | | | | 3 | | | | 5 | |
Total site recordable injury rate | | | 0.90 | | | | 1.10 | | | | 1.35 | | | | 0.86 | | | | 1.06 | | | | 1.20 | | | | 1.14 | | | | 1.58 | | | | 1.22 | | | | 1.29 | |
Environmental incidents | | | 7 | | | | 3 | | | | 3 | | | | 4 | | | | 17 | | | | 7 | | | | 5 | | | | 6 | | | | 1 | | | | 19 | |
| 1 | Net income per share for each quarter has been computed based on the weighted average number of shares issued and outstanding during the respective quarter; therefore, quarterly amounts may not add to the annual total. Per-share calculations are based on dollar and share amounts each rounded to the nearest thousand. |
Certain aspects of our business can be impacted by seasonal factors. Fertilizers are sold primarily for spring and fall application in both Northern and Southern Hemispheres. However, planting conditions and the timing of customer purchases will vary each year, and fertilizer sales can be expected to shift from one quarter to another. Most feed and industrial sales are by contract and are more evenly distributed throughout the year.
Highlights of our 2013 fourth quarter compared to the same quarter in 2012 include (direction of arrows refers to impact on comprehensive income):
| Ú | Competitive pressures weighed on all potash markets and led to lower average realized prices relative to 2012, resulting in lower gross margin. Sales volumes surpassed the trailing quarter and the comparative period of 2012. This rebound was most pronounced in North America, as our sales volumes outpaced 2012. Our offshore sales volumes were above the historically low 2012. The majority of Canpotex shipments were to Latin America (29 percent) and Other Asia (41 percent), with those to India (17 percent) and spot vessels to China (6 percent) accounting for a smaller percentage. At our company, the combination of 10 shutdown weeks (22 weeks in 2012) to primarily match production to reduced market demand, lower brine management costs (as our tolling agreement at Esterhazy |
| | expired at the end of 2012) and a weaker Canadian dollar all contributed todecreased potash cost of goods sold, which was partly offset by costs associated with our 2013 workforce reduction (no reductions in 2012). |
| Ú | Nitrogen gross margin was lower than in 2012 as the positive impact of increased sales volumes was more than offset by lower average realized prices. Sales volumes exceeded 2012 as we benefited from expanded capacity. Average realized prices were well below 2012 as prices for all three major product categories declined from the historically high levels of 2012. Our total average cost of natural gas used in production, including hedge, decreased 31 percent (Trinidad gas costs declined 32 percent while US spot prices, including losses on our hedge position,fell 26 percent), resulting in lower cost of goods sold. |
| | |
| PotashCorp 2013 Annual Integrated Report | | 81 |
Quarterly results
| Ú | Phosphate gross margin was produced almost entirely by our feed and industrial businesses. This result was well below 2012 as difficult global phosphate fertilizer market conditions persisted. Sales volumes were above 2012 when rock supply challenges constrained our capability. Our average realized price trailed 2012. Fertilizer products experienced the largest decline, while prices for our more stable feed and industrial products were also down. Cost of goods sold for the quarter decreased mainly due to lower sulfur costs (39 percent) and lower ammonia costs (30 percent), partly offset by costs associated with our 2013 workforce reduction andnegative adjustments to our phosphate asset retirement obligations in 2013 (relevant discount rates decreased) and a positive adjustment in 2012 (relevant discount rates increased). |
| Ú | Share of earnings of equity-accounted investees fell due to lower earnings of SQM and APC. |
| Ú | Dividend income was less as ICL paid lower dividends. |
| Ù | The actual effective tax rate, including discrete items, was 30 percent (2012 – 21 percent). The increase was due to a different income weighting between jurisdictions and higher discrete tax adjustments quarter-over-quarter ($18 million expense in 2013 compared to $10 million expense in 2012). |
| Ù | Other comprehensive loss in 2013 was mainly the result of a decrease in the fair value of our investments in ICL and Sinofert, partially offset by a net actuarial gain resulting from a remeasurement of our defined benefit plans. Other comprehensive income in 2012 was primarily affected by the reclassification to income of a $341 million unrealized loss on our investment in Sinofert, a remeasurement of our defined benefit plans and an increase in the fair value of our investment in ICL. |
| Ú | Costs of $60 million were incurred and 1,045 people were affected as a result of the announced workforce reduction. |
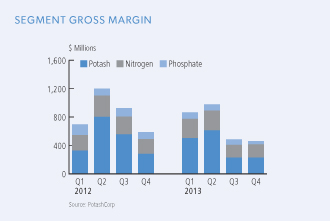
| | | | | | | | | | | | | | | | | | | | | | | | |
| | | Three Months Ended December 31 | |
| | | Sales Tonnes (thousands) | | | Average Net Sales Price per MT | |
| | | 2013 | | | 2012 | | | % Increase
(Decrease) | | | 2013 | | | 2012 | | | % Increase
(Decrease) | |
Potash | | | | | | | | | | | | | | | | | | | | | | | | |
Manufactured Product | | | | | | | | | | | | | | | | | | | | | | | | |
North America | | | 836 | | | | 588 | | | | 42 | | | $ | 343 | | | $ | 447 | | | | (23 | ) |
Offshore | | | 929 | | | | 729 | | | | 27 | | | $ | 227 | | | $ | 339 | | | | (33 | ) |
Manufactured Product | | | 1,765 | | | | 1,317 | | | | 34 | | | $ | 282 | | | $ | 387 | | | | (27 | ) |
Nitrogen | | | | | | | | | | | | | | | | | | | | | | | | |
Manufactured Product | | | | | | | | | | | | | | | | | | | | | | | | |
Ammonia | | | 543 | | | | 425 | | | | 28 | | | $ | 449 | | | $ | 675 | | | | (33 | ) |
Urea | | | 270 | | | | 235 | | | | 15 | | | $ | 356 | | | $ | 475 | | | | (25 | ) |
Solutions, nitric acid, ammonium nitrate | | | 685 | | | | 437 | | | | 57 | | | $ | 218 | | | $ | 247 | | | | (12 | ) |
Manufactured Product | | | 1,498 | | | | 1,097 | | | | 37 | | | $ | 326 | | | $ | 461 | | | | (29 | ) |
Phosphate | | | | | | | | | | | | | | | | | | | | | | | | |
Manufactured Product | | | | | | | | | | | | | | | | | | | | | | | | |
Fertilizer | | | 637 | | | | 541 | | | | 18 | | | $ | 383 | | | $ | 529 | | | | (28 | ) |
Feed and Industrial | | | 297 | | | | 297 | | | | – | | | $ | 608 | | | $ | 663 | | | | (8 | ) |
Manufactured Product | | | 934 | | | | 838 | | | | 11 | | | $ | 455 | | | $ | 577 | | | | (21 | ) |
| | |
| 82 | | PotashCorp 2013 Annual Integrated Report |
Financial condition review
BALANCE SHEET ANALYSIS
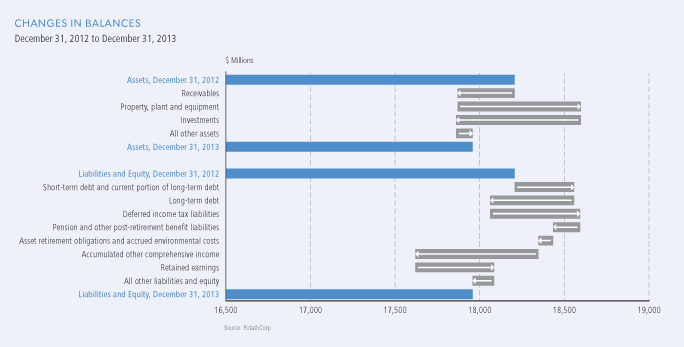
As of December 31, 2013, total assets decreased 1 percent while total liabilities were flat and total equity fell 3percent compared to December 31, 2012. The most significant contributors to the changes in our statements of financial position were as follows (direction of arrows refers to increase or decrease):
| | |
| Assets | | Liabilities |
Ú Receivables fell due to a reduction in trade, income tax and potash production tax receivables and lower hedge margin deposits. Ù Property, plant and equipment increased primarily due to our previously announced potash capacity expansions and other potash projects (71 percent of 2013 additions pertained to potash). Ú Available-for-sale investments were impacted by the lower fair value of our investments in ICL and Sinofert. | | Ù Short-term debt and current portion of long-term debt rose as a result of our senior notes due May 15, 2014 being classified as current during 2013, the repayment of our senior notes due March 1, 2013 and an increase in our outstanding commercial paper. Ú Long-term debt declined due to the reclassification of our senior notes discussed above. Ù Deferred income tax liabilities increased primarily due to tax depreciation exceeding accounting depreciation, the tax impact on the remeasurement of our defined benefit plans in 2013 and reduced deferred tax assets on unexercised stock options. Ú Pension and other post-retirement benefit liabilities were impacted by increased discount rates. Ú Asset retirement obligations and accrued environmental costs fell due to higher discount rates. |
| Equity |
Ù Equity was impacted by net income, other comprehensive loss (primarily affected by decreases in the fair value of our investments in ICL and Sinofert), dividends declared and common shares repurchased for cancellation (see Note 15 to the consolidated financial statements) during 2013. |
As at December 31, 2013, $480 million (2012 – $481 million) of our cash and cash equivalents were held in certain foreign subsidiaries. As there are plans to repatriate the majority of these funds in 2014, a deferred tax liability of $10 million was recorded at December 31, 2013.
| | |
| PotashCorp 2013 Annual Integrated Report | | 83 |
Liquidity and capital resources
The following section explains how we manage our cash and capital resources to carry out our strategy and deliver results.
Liquidity risk arises from our general funding needs and in the management of our assets, liabilities and capital structure. We manage liquidity risk to maintain sufficient liquid financial resources to fund our financial position and meet our commitments and obligations in a cost-effective manner.
CASH REQUIREMENTS
The following aggregated information about our contractual obligations and other commitments summarizes certain of our liquidity and capital resource requirements. The information presented in the table below does not include obligations that have original maturities of less than one year, planned (but not legally committed) capital expenditures or potential share repurchases.
Contractual Obligations and Other Commitments
| | | | | | | | | | | | | | | | | | | | |
| Dollars (millions) at December 31, 2013 | | | | | | | | | | | | | | | |
| | | Payments Due by Period | |
| | | Total | | | Within 1 Year | | | 1 to 3 Years | | | 3 to 5 Years | | | Over 5 Years | |
Long-term debt obligations | | $ | 3,506 | | | $ | 500 | | | $ | 500 | | | $ | 506 | | | $ | 2,000 | |
Estimated interest payments on long-term debt obligations | | | 1,903 | | | | 165 | | | | 284 | | | | 248 | | | | 1,206 | |
Operating leases | | | 430 | | | | 90 | | | | 140 | | | | 72 | | | | 128 | |
Purchase commitments | | | 535 | | | | 296 | | | | 128 | | | | 111 | | | | – | |
Capital commitments | | | 57 | | | | 51 | | | | 6 | | | | – | | | | – | |
Other commitments | | | 198 | | | | 43 | | | | 62 | | | | 45 | | | | 48 | |
Asset retirement obligations and environmental costs | | | 598 | | | | 36 | | | | 35 | | | | 63 | | | | 464 | |
Other long-term liabilities | | | 2,746 | | | | 63 | | | | 175 | | | | 151 | | | | 2,357 | |
Total | | $ | 9,973 | | | $ | 1,244 | | | $ | 1,330 | | | $ | 1,196 | | | $ | 6,203 | |
Long-term debt
As described in Note 12 to the consolidated financial statements, long-term debt consists of $3,500 million of senior notes that were issued under US shelf registration statements and a net of $6 million under back-to-back loan arrangements.
Our senior notes have no sinking fund requirements and are not subject to any financial covenants but are subject to certain customary covenants and events of default as described in Notes 9 and 12 to the consolidated financial statements. The company was in compliance with all such covenants as described on Page 88. Under certain conditions related to a change in control, the company is required to make an offer to purchase all, or any part, of the senior notes at 101 percent of the principal amount of the senior notes repurchased, plus accrued and unpaid interest.
The estimated interest payments on long-term debt in the above table include our cumulative scheduled interest payments on fixed and variable rate long-term debt. Interest on variable rate debt is based on interest rates prevailing at December 31, 2013.
Operating leases
We have long-term operating lease agreements for land, buildings, port facilities, equipment, ocean-going transportation vessels and railcars, the latest of which expires in 2038. The most significant operating leases consist of railcars (extending to approximately 2030), four vessels for transporting ammonia from Trinidad (one agreement runs until 2017 while the others terminate in 2016) and two barges for transporting phosphoric acid (expire in 2019 and 2022).
Purchase commitments
We have long-term natural gas contracts with the National Gas Company of Trinidad and Tobago Limited, the latest of which expires in 2018. The contracts provide for prices that vary primarily with ammonia market prices, escalating floor prices and minimum purchase quantities. The commitments included in the table above are based on floor prices and minimum purchase quantities.
We have agreements for the purchase of sulfur for use in the production of phosphoric acid, which provide for specified
| | |
| 84 | | PotashCorp 2013 Annual Integrated Report |
purchase quantities and prices based on market rates at the time of delivery. Purchase obligations and other commitments included in the table above are based on expected contract prices.
Capital commitments
The company has various long-term contracts related to capital projects, the latest of which expires in 2015. The commitments included in the table on Page 84 are based on expected contract prices.
Based on a forecasted exchange rate of 1.05 Canadian dollars per US dollar in 2014, we expect to incur capital expenditures, including capitalized interest, of approximately $540 million for opportunity capital and approximately $630 million to sustain operations at existing levels and for major repairs and maintenance (including plant turnarounds).
Other commitments
Other commitments consist principally of amounts relating to pipeline capacity, throughput and various rail and vessel freight contracts, the latest of which expires in 2026, and mineral lease commitments, the latest of which expires in 2034.
Asset retirement obligations and environmental costs
Commitments associated with our asset retirement obligations are expected to occur principally over the next 86 years for phosphate (with the majority taking place over the next 36 years) and over a longer period for potash. Environmental costs consist of restoration obligations, which are expected to occur through 2031.
Other long-term liabilities
Other long-term liabilities consist primarily of pension and other post-retirement benefits, derivative instruments, income taxes and deferred income taxes.
Deferred income tax liabilities may vary according to changes in tax laws, tax rates and the operating results of the company. Since it is impractical to determine whether there will be a cash impact in any particular year, all deferred income tax liabilities have been reflected as other long-term liabilities in the “Over 5 Years” category in the table on Page 84.
SOURCES AND USES OF CASH
The company’s cash flows from operating, investing and financing activities, as reflected in the Consolidated Statements of Cash Flow, are summarized in the following table:
| | | | | | | | | | | | | | | | | | | | | | |
Dollars (millions), except percentage amounts | | | | | | | | | | | | | % Increase (Decrease) | |
| | | | | | | | | | | | | |
| | | 2013 | | | 2012 | | | 2011 | | | | | 2013 | | | 2012 | |
Cash provided by operating activities | | $ | 3,212 | | | $ | 3,225 | | | $ | 3,485 | | | | | | – | | | | (7 | ) |
Cash used in investing activities | | | (1,624 | ) | | | (2,204 | ) | | | (2,251 | ) | | | | | (26 | ) | | | (2 | ) |
Cash used in financing activities | | | (1,522 | ) | | | (889 | ) | | | (1,216 | ) | | | | | 71 | | | | (27 | ) |
Increase in cash and cash equivalents | | $ | 66 | | | $ | 132 | | | $ | 18 | | | | | | (50 | ) | | | 633 | |
| | |
| PotashCorp 2013 Annual Integrated Report | | 85 |
Liquidity and capital resources
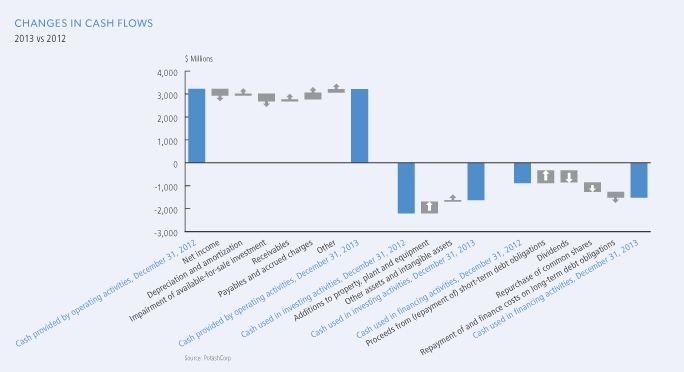
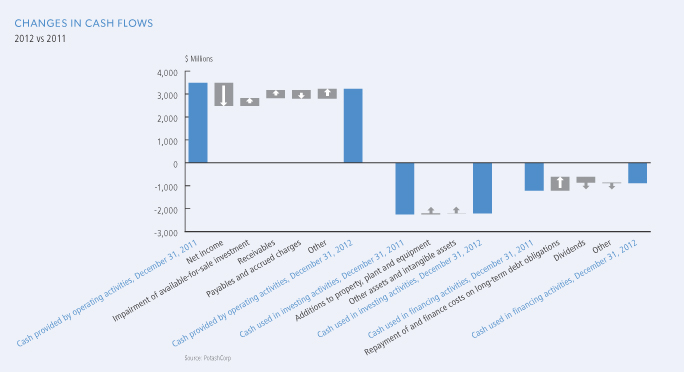
| | |
| 86 | | PotashCorp 2013 Annual Integrated Report |
| | | | | | | | | | | | |
Dollars (millions), except ratio and percentage amounts at December 31 | |
| | | |
| | | | | | | | | % Increase
(Decrease) | |
| | | 2013 | | | 2012 | | | 2013 | |
Current assets | | $ | 2,189 | | | $ | 2,496 | | | | (12 | ) |
Current liabilities | | | (2,113 | ) | | | (1,854 | ) | | | 14 | |
Working capital | | | 76 | | | | 642 | | | | (88 | ) |
Working capital ratio | | | 1.04 | | | | 1.35 | | | | (23 | ) |
Liquidity needs can be met through a variety of sources, including: cash generated from operations, drawdowns under our revolving credit facility, issuances of commercial paper and short-term borrowings under our line of credit. Our primary uses of funds are operational expenses, sustaining and opportunity capital spending, intercorporate investments, dividends, interest and principal payments on our debt securities and share repurchases.
2013 vs 2012
Cash provided by operating activitieswas impacted by:
| • | | Lower net income in 2013; |
| • | | A non-cash impairment charge in 2012 (none in 2013); |
| • | | Increased cash inflows from receivables; |
| • | | Decreased cash outflows associated with payables and accrued charges; and |
| • | | Increased depreciation in 2013. |
Cash used in investing activities was primarily for additions to property, plant and equipment, of which approximately 71 percent (2012 – 67 percent) related to the potash segment.
Cash used in financing activities increased in 2013, primarily reflecting the repayment of 10-year senior notes at maturity in 2013, net issuances of commercial paper in 2013 (net repayment in 2012), increased dividend payments and share repurchases in 2013. There were no repayments of notes or share repurchases in 2012.
We believe that internally generated cash flow, supplemented by available borrowings under our existing financing sources if necessary, will be sufficient to meet our anticipated capital expenditures and other cash requirements for at least the next
12 months, exclusive of any possible acquisitions. At this time we do not reasonably expect any presently known trend or uncertainty to affect our ability to access our historical sources of liquidity.
2012 vs 2011
Cash provided by operating activities fell year-over-year. The decline in cash provided by operating activities was primarily due to lower net income, partially offset by the add-back of a non-cash impairment charge, increased depreciation and amortization, higher provision for deferred income tax, lower undistributed earnings of equity-accounted investees and decreased pension contributions. The difference in adjustments for changes innon-cash operating working capital was impacted by increased receivables (down in 2011), a decrease in inventories in 2011 and lower payables and accrued charges (higher in 2011).
Cash used in investing activities was primarily for additions to property, plant and equipment, of which approximately 67 percent (2011 – 79 percent) related to the potash segment.
Cash used in financing activities in 2012 primarily reflected net repayment of outstanding commercial paper and dividends paid. In 2011, cash used in financing activities primarily reflected the net decrease in commercial paper, the repayment of 10-year senior notes at maturity and dividends paid.
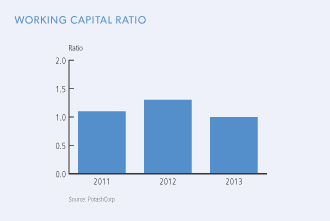
| | |
| PotashCorp 2013 Annual Integrated Report | | 87 |
Capital structure and management
CAPITAL STRUCTURE
See Note 25 to the consolidated financial statements for information pertaining to our capital structure.
PRINCIPAL DEBT INSTRUMENTS
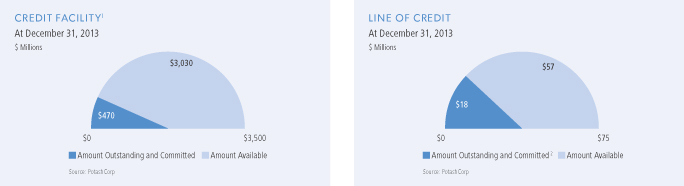
| 1 | The authorized aggregate amount under the company’s commercial paper programs in Canada and the US is $2,500 million. The amounts available under the commercial paper programs are limited to the availability of backup funds under the credit facility. Included in the amount outstanding and committed is $470 of commercial paper. |
| 2 | Letters of credit committed. We also have an uncommitted $100 million letter of credit facility against which $29 million was issued at December 31, 2013. |
We use a combination of short-term and long-term debt to finance our operations. We typically pay floating rates of interest on our short-term debt and credit facility, and fixed rates on our senior notes. As at December 31, 2013, interest rateswere approximately 0.3 percent on outstanding commercial paper.
During 2013, we increased our $2,750 million syndicated credit facility to $3,500 million and extended the maturity to May 31, 2018 (original maturity December 11, 2016), referred to hereafter as our credit facility, and our $750 million credit facility (maturity May 31, 2013) was terminated.
Our credit facility provides for unsecured advances up to the total facility amount less direct borrowings and amounts committed in respect of commercial paper outstanding. We also have a $75 million short-term line of credit that is available through August 2014 and an uncommitted letter of credit facility of $100 million (increased from $32 million in 2013) that is due on demand. Direct borrowings, outstanding commercial paper and outstanding letters of credit reduce the amounts available under the line of credit and the credit facility. The line of credit and credit facility have financial tests and other covenants (detailed in Note 9 to the consolidated financial statements) with which we must comply at each quarter-end. Non-compliance with any such covenants could result in accelerated payment of amounts borrowed and termination of lenders’ further funding obligations
under the credit facility and line of credit. We were in compliance with all covenants as at December 31, 2013 and at this time anticipate being in compliance with such covenants in 2014. The accompanying table summarizes the limits and results of certain covenants.
| | | | | | | | |
Debt covenants at December 31 Dollars (millions), except ratio amounts | | Limit | | | 2013 | |
Debt-to-capital ratio 1 | | | £ 0.60 | | | | 0.3 | |
Long-term debt-to-EBITDA ratio 2 | | | £ 3.5 | | | | 0.8 | |
Debt of subsidiaries | | | < $ 1,000 | | | | $ 6 | |
The following non-IFRS financial measures are requirements of our debt covenants and should not be considered as a substitute for, nor superior to, measures of financial performance prepared in accordance with IFRS:
| 1 | Debt-to-capital ratio = debt (short-term debt and current portion of long-term debt + long-term debt) / (debt + shareholders’ equity). |
| 2 | Long-term debt-to-EBITDA ratio = long-term debt / EBITDA. EBITDA is calculated according to the definition in Note 9 to the consolidated financial statements for the trailing 12 months. As compared to net income according to IFRS, EBITDA is limited in that periodic costs of certain capitalized tangible and intangible assets used in generating revenues are excluded. Long-term debt to net income for the trailing 12 months was 1.7. |
Our ability to access reasonably priced debt in the capital markets is dependent, in part, on the quality of our credit ratings. We continue to maintain investment-grade credit ratings for our long-term debt. A downgrade of the credit rating of our long-term debt would increase the interest rates applicable to borrowings under our credit facility and our line of credit.
| | |
| 88 | | PotashCorp 2013 Annual Integrated Report |
Commercial paper markets are normally a source of same-day cash for the company. Our access to the Canadian and US commercial paper markets primarily depends on maintaining our currentshort-term credit ratings as well as general conditions in the money markets.
| | | | | | | | | | | | | | | | | | |
Rating (outlook) at
December 31 | | Long-Term Debt | | | | | Short-Term Debt | |
| | 2013 | | | 2012 | | | | | 2013 | | | 2012 | |
Moody’s | | | A3 (stable) | | | | Baa1 (positive | ) | | | | | P-2 | | | | P-2 | |
Standard & Poor’s | | | A- (negative) | | | | A- (stable | ) | | | | | A-2 | 1 | | | A-2 | 1 |
DBRS | | | n/a | | | | n/a | | | | | | R-1 (low | ) | | | R-1 (low | ) |
| 1 | S&P assigned a global commercial paper rating of A-2, but rated our commercial paper A-1 (low) on a Canadian scale. |
A security rating is not a recommendation to buy, sell or hold securities. Such rating may be subject to revision or withdrawal at any time by the respective credit rating agency and each rating should be evaluated independently of any other rating.
Our $3,500 million of senior notes were issued under US shelf registration statements.
For 2013, our weighted average cost of capital was 9.8 percent (2012 – 9.1 percent), of which 90 percent represented the cost of equity (2012 – 89 percent).
OUTSTANDING SHARE DATA
Refer to Notes 15 and 22 to the consolidated financial statements for information pertaining to our outstanding shares and options.
OFF-BALANCE SHEET ARRANGEMENTS
In the normal course of operations, PotashCorp engages in a variety of transactions that, under IFRS, are either not recorded on
our Consolidated Statements of Financial Position or are recorded at amounts that differ from the full contract amounts. Principal off-balance sheet activities include operating leases, agreement to reimburse losses of Canpotex, issuance of guarantee contracts, certain derivative instruments and long-term contracts. We do not reasonably expect any presently known trend or uncertainty to affect our ability to continue using these arrangements, which are discussed below.
Contingencies
Refer to Note 27 to the consolidated financial statements for a contingency related to Canpotex.
Guarantee Contracts
Refer to Note 28 to the consolidated financial statements for information pertaining to our guarantees.
Derivative Instruments
We use derivative financial instruments to manage exposure to commodity price and exchange rate fluctuations. Refer to Note 11 to the consolidated financial statements for further information. Except for certain non-financial derivatives that have qualified for, and for which we have documented, a normal purchase or normal sale exception in accordance with accounting standards, derivatives are recorded on the Consolidated Statements of Financial Position at fair value and marked-to-market each reporting period regardless of whether they are designated as hedges for IFRS purposes.
Leases and Long-Term Contracts
Certain of our long-term raw materials agreements contain fixed price and/or volume components. Our significant agreements, and the related obligations under such agreements, are discussed in Cash Requirements on Pages 84 and 85.
| | |
| PotashCorp 2013 Annual Integrated Report | | 89 |
Other financial information
MARKET RISKS ASSOCIATED WITH FINANCIAL INSTRUMENTS
Market risk is the potential for loss from adverse changes in the market value of financial instruments. The level of market risk to which we are exposed varies depending on the composition of our derivative instrument portfolio, as well as current and expected market conditions. A discussion of enterprise-wide risk management can be found on Pages 24 to 28. A discussion of price risk, interest rate risk, foreign exchange risk, credit risk and liquidity risk, including relevant risk sensitivities, can be found in Note 24 to the consolidated financial statements.
RELATED PARTY TRANSACTIONS
Refer to Note 29 to the consolidated financial statements for information pertaining to transactions with related parties.
CRITICAL ACCOUNTING ESTIMATES
Our discussion and analysis of our financial condition and results of operations are based upon our consolidated financial statements, which have been prepared in accordance with IFRS.
Our significant accounting policies and accounting estimates are contained in the consolidated financial statements (see Note 2 for description of policies or references to notes where such policies are contained). Certain of these policies, such as principles of consolidation, derivative instruments, pension and other post-retirement benefits, impairments and provisions for asset retirement, environmental and other obligations, involve critical accounting estimates because they require us to make subjective or complex judgments about matters that are inherently uncertain and because of the likelihood that materially different amounts could be reported under different conditions or using different assumptions. We have discussed the development, selection and application of our key accounting policies, and the critical accounting estimates and assumptions they involve, with the audit committee of the Board of Directors.
RECENT ACCOUNTING CHANGES AND EFFECTIVE DATES
Refer to Note 2 to the consolidated financial statements for information pertaining to accounting changes effective in 2013, and for information on issued accounting pronouncements that will be effective in future years.
| | |
| 90 | | PotashCorp 2013 Annual Integrated Report |
Governance and remuneration

Dallas J. Howe
MESSAGE FROM THE CHAIR
One of the primary roles of PotashCorp’s Board is to provide oversight of strategy and execution, while maintaining the highest standards of corporate governance. In all decisions, we strive to protect and enhance long-term value for your company and the many stakeholders who count on our success.
Your Board is engaged and actively involved. Our approach is to guide with integrity, assess our strategies, determine the appropriateness of risks and optimize management’s performance. In a year
characterized by challenges – including sluggish potash demand growth and significant market uncertainty – it was important to understand the rapidly changing environment and ensure we had the right strategies to position your company for success.
Despite confidence in the long-term drivers of our business, recent challenges necessitated important decisions. With operational capabilities expected to exceed anticipated near-term demand, operating and workforce changes were undertaken to ensure your company maintains its state of readiness for future demand growth, while simultaneously managing costs. Although difficult, the reduction in workforce was carefully considered and a concerted effort was made to minimize the impact on our employees and communities.
As in prior years, one of our ongoing priorities was CEO and management succession planning, and we continued to discuss these plans and opportunities with the CEO. We have a talent pool identified for all key management positions – comprised of strong internal leaders and potential external candidates – that we are confident will provide continued leadership in developing and executing our corporate strategy.
From a governance perspective, we monitor regulatory developments in Canada, the US and other jurisdictions and benchmark our performance against best-in-class global peers. In 2013, we were again recognized by The Globe and Mail Board Games for our governance practices. Your company was also honored by three awards of Excellence from the Chartered Professional Accountants of Canada for reporting and disclosure. We believe this recognition means that we are following the right path in terms of continuous improvement and accountability to the stakeholders who depend on us.
Above all, your Board never loses sight of PotashCorp’s role in helping feed a growing world. This is a great mission and we understand the need to create real and enduring value for the people – our employees, investors, customers and community members – who make it possible. Your company’s integral role is what drives our commitment and decisions every day.

Dallas J. Howe
Board Chair
February 20, 2014
| | | | |
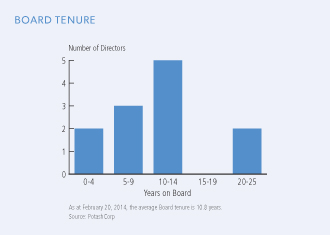 | | | | In all decisions, we strive to protect and enhance long-term value. – Dallas Howe 
Recognized by The Globe and Mail Board Games for high-quality governance practices |
| | |
| PotashCorp 2013 Annual Integrated Report | | 91 |
Governance and remuneration
ROLE OF THE BOARD
The Board is responsible for the stewardship and oversight of the management of PotashCorp and our global business. It has the authority and obligation to protect and enhance the assets of the company in the interest of all shareholders. The Board considers all our important relationships, including with shareholders, customers, the communities where we do business, employees, the environment and business suppliers – recognizing that all are essential to a successful business.
The involvement and commitment of directors are evidenced by regular Board and committee meeting attendance, preparation and active participation in setting goals and rigorous director education programs.
BOARD’S VIEW ON DIRECTORS
Each director must possess and exhibit the highest degree of integrity, professionalism and values, and must never be in a conflict of interest with the company. Directors and senior officers are bound by the PotashCorp Governance Principles and PotashCorp Core Values and Code of Conduct, which can be found together with other governance-related documents on our website.
The Board has also developed categorical independence standards to assist it in determining when individual directors are free from conflicts of interest and are exercising independent judgment in discharging their responsibilities. We comply with the independence requirements of all applicable regulators. As of the date of this annual integrated report, 10 of 12 of the company’s directors were independent.
All directors are elected by the shareholders each year at the annual meeting of shareholders. A nominee for a position on the Board must meet certain legal qualification standards and an appropriate mix of expertise and qualities outlined below. While the emphasis in filling Board vacancies is on finding the best qualified candidates given the needs and circumstances of the Board, a nominee’s diversity of gender, race, nationality or other attributes may be considered favorably in his or her assessment.
The corporate governance and nominating committee reviewed the director succession plan during 2013 and is actively pursuing a process for identifying duly qualified candidates for upcoming Board retirements. Prior to joining the Board, new directors are informed of the degree of energy and commitment the company expects of our directors.
DIRECTORS’ SKILLS AND EXPERTISE
To enhance value for the company, the Board draws on the following specific experience, attributes and qualifications, represented by one or multiple directors, when looking at issues being faced by PotashCorp.
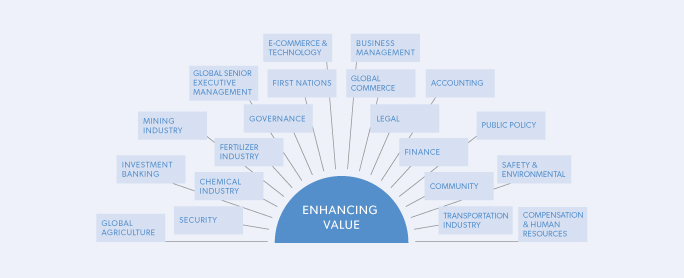
| | |
| 92 | | PotashCorp 2013 Annual Integrated Report |
The company has a robust process for director evaluation, director personal reviews and for making changes, if warranted. To assess the Board’s performance, the company follows a six-part effectiveness evaluation program (described more fully in Appendix A of the 2014 Proxy Circular) that includes an annual assessment of the Board, each committee, the Board Chair, each committee chair and each individual director. Further, as part of the Board’s continuing efforts to improve its performance, it periodically surveys those members of senior management who regularly interact with the Board and/or its committees to solicit
their input and perspective on the Board’s operation and how it might improve its effectiveness.
The Board has also placed controls on the number of boards a director can sit on at one time and has set this number at four public company boards in total, including ours.
More information on our Board (including each director’s experience, attendance and the value of at-risk holdings) and a new director nominee can be found on Pages 6 to 23 in our 2014 Proxy Circular.
KEY ACTIVITIES AND PRIORITIES
While the Board has many roles and responsibilities, the following key priorities and activities occurred in 2013.
| | |
| Priorities | | 2013 Activities |
• Oversee strategy and strategic planning process, taking into account available opportunities and related risks. • Make PotashCorp one of the safest companies in the world. • Continue to develop and consider CEO and senior executive officer succession plans. Encourage the development of future leaders to promote stability at all levels of senior management. • Review and oversee the company’s risk management policies and procedures. Actively monitor risk management, including legal compliance and anti-corruption, and review the company-wide risk matrix and risk mitigation efforts. • Evaluate and incentivize management performance. Perform comprehensive performance reviews of CEO and various members of senior management. • Ensure the company maintains active and ongoing stakeholder engagement. • Assess the Board’s needs matrix and ongoing makeup of
its membership. • Oversee financial reporting and audit processes and related internal controls. | | • The Board continued its process of holding separate dedicated meetings related to risk management and business strategy/strategic planning, and supported establishment of the Global Risk Management Department. • The corporate governance and nominating committee continued to review the Board’s needs matrix along with director and executive succession planning generally, including preparations for the expected retirements over the next few years. • At each meeting of the corporate governance and nominating committee, the corporate secretary and associate general counsel made presentations regarding certain governance topics of relevance, including board diversity and diversity in senior management. • At each meeting of the compensation committee, the independent compensation consultant provided an update on emerging and current compensation trends. • In addition to its usual annual review of takeover preparedness, the Board ran a simulation addressing shareholder activism. • The corporate governance and nominating committee continued its twice yearly process for ongoing review of the company’s Pledge to Saskatchewan introduced in 2010. • Consistent with a best practices approach from a procurement and governance perspective, the audit committee decided that it will conduct a competitive selection process for the company’s external audit services from 2016 forward on a periodic basis. |
| | |
| PotashCorp 2013 Annual Integrated Report | | 93 |
Governance and remuneration
COMMUNICATION WITH STAKEHOLDERS
Reaching out to stakeholders and listening to their opinions is a core value of PotashCorp. The Board values and is continually seeking new opportunities to engage in constructive dialogue with shareholders, who mainly reside in North America and are substantially institutional by nature, and other stakeholders on a wide range of topics including compensation, sustainability, safety, health and the environment and other important governance matters. Some specific initiatives included:
| • | | An annual investor survey in 2013, seeking input from our top shareholders and those who follow our company. |
| • | | Investor conferences and meetings. In addition, investors may contact our Investor Relations department on a continuing basis. |
| • | | The use of social media to enable engagement with a broader group of stakeholders on topics including news and updates on financial reporting and general corporate information, recruitment and career opportunities at PotashCorp and local Saskatchewan project and community investment news. |
EMPLOYEE COMPENSATION
The Board is ultimately responsible for company-wide compensation but particularly executive compensation, with support from the standing compensation committee, and together they are committed to getting it right, both for shareholders and for the company’s long-term success.
At PotashCorp, accountability is a core value. To that end, we annually set targets that reflect the interests of our stakeholders and measure our performance against these targets. We design our compensation plans to help drive achievement of our goals and objectives.
Compensation programs can help mitigate risk-taking, but risks cannot be managed solely by remote control through these programs. The Board believes that, among other factors, certain elements of our compensation programs, which are described in greater detail on Pages 39 to 56 in the Compensation Discussion and Analysis section of our 2014 Proxy Circular, help to discourage inappropriaterisk-taking by senior management.
In 2013, Towers Watson assessed the risks of our executive plans and concluded there would likely not be a material adverse effect on our company. The compensation committee agreed with the conclusions.
Annually, the Board reviews a comprehensive report on compensation for all salaried employees that is derived fromthird-party consultants and surveys specific to industry, country and community.
Our Executive Compensation Philosophy
We believe our executive compensation plan is simple and clear, so as to be easily communicated to and understood by participants, shareholders and other interested parties.
The plan is designed to:
| • | | Motivate our executives’ actions to be aligned with the long-term interests of our shareholders and other stakeholders; |
| • | | Create an “ownership mentality” in our management team; |
| • | | Provide an appropriate level of value sharing between our shareholders and executives; and |
| • | | Incent and reward performance in line with our corporate goals and shareholder experience. |
Plan components have different time horizons as do our corporate goals and components are complementary, not overlapping in metrics or objectives.
The majority of pay is at-risk based on individual and company performance with the at-risk portions designed to pay in proportion to performance. No reward will be given for performance short of the threshold.
The plan is designed to be competitive with other executive employment opportunities and is regularly monitored for competitiveness. Total direct cash compensation is targeted at the median of comparable companies, with above median compensation tied to above median performance and below median compensation tied to below median performance.
The plan is affordable and reasonable for the company to provide, with metrics, targets and maximum payouts that are designed for affordability and reasonableness in absolute terms and relative to the plans of an applicable comparator group.
We test the outcomes of our compensation packages to measure their reasonableness and our success in aligning pay and performance. The tests apply to all elements of compensation including pensions and perquisites.
The plan will not encourage executives to take unapproved or inappropriate risks or engage in other improper behavior.
| | |
| 94 | | PotashCorp 2013 Annual Integrated Report |
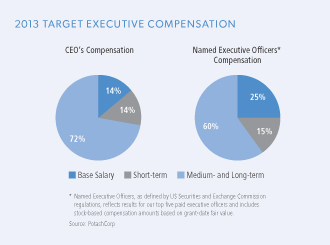
Our Compensation Structure
The program’s key elements are base salary, short-term incentives, performance units granted under a medium-term incentive plan (MTIP), performance stock options under a long-term incentive plan, retirement benefits and severance benefits.
Every employee’s compensation is tied to safety. Virtually all employees have a component of at-risk pay through the short-term incentive plan.
Compensation for hourly employees is based on a number of factors including local inflation, benchmarking (wages, benefits and percentage wage increases with industry peers, other mining companies and other companies specific to the communities where we operate) and collective bargaining, where applicable.
To emphasize performance-based compensation for salaried employees, we typically benchmark total cash compensation levels (salary and annual short-term incentive targets) to the median of a comparable group of companies and provide the opportunity to earn total compensation above the median through medium- and long-term incentive plans. Increases to salaries are based on:
| • | | The movement of the midpoint of an employee’s salary range (based on conditions in the marketplace); |
| • | | An additional board-approved component to help employees advance through their range, the extent of which, if any, is dependent on an employee’s performance and the pool of funding available to a department; and |
| • | | Executive approval for further increases, if applicable. |
In response to current business conditions, the Board has approved overall salary increases in 2014 at levels lower than 2013 on a percentage basis.
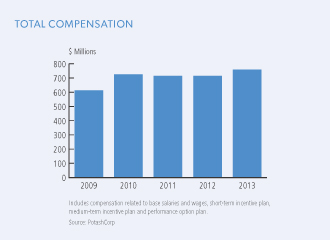
| | |
| PotashCorp 2013 Annual Integrated Report | | 95 |
Governance and remuneration
The following table describes our key compensation programs and the impact on current year results.
| | | | | | | | | | | | |
| Category | | Component | | Form | | 2013 Expense (Recovery) | | Eligibility1 | | Performance Period | | Determination |
| Base Salary and Wages | | Salary and Wages | | Cash | | $507 million | | All employees (5,787 people) | | Annual | | • The only fixed component of total direct compensation is typically set annually and at median of comparator data. |
| At-Risk Compensation | | Short-term incentive plan (STIP) | | Cash | | $37 million | | All executives, most salaried staff and hourly unionand non-union employees (5,674 people) | | 1 year | | • Based on achieving Board-established cash flow return metric; our corporate STIP program also requires achievement of certain safety targets and our operating sites’ STIP programs also require achievement of certain safety, environmental and operational targets. |
| | | | | | | • No payout for achieving less than 50 percent of target; maximum payout is capped at two times target regardless of cash flow return achieved. Individual payouts are subject to adjustment(+/-30 percent) based on individual performance for salaried staff as well as PotashCorp performance in relation to safety. |
| | Medium-term incentive plan (MTIP) | | Performance share units | | $(2) million | | All executives and senior management (80 people) | | 3 years (current MTIP began on January 1, 2012 and will end on December 31, 2014) | | • One-half of payout based on corporate TSR2 and half based on our TSR relative to peer group index 3. • No payout if minimum performance objectives are not achieved; maximum payout on each component is capped at 150 percent of target; maximum price escalation is capped at four times the starting price over the three years for the MTIP 4. |
| | Long-term incentives (Performance Option Plan) | | Performance options | | $27 million | | All executives, senior management and other selected management (289 people) | | 3 years (vesting) | | • Option vesting is based on the amount by which our cash flow return exceeds the weighted average cost of capital over the performance cycle. |
| | | | | | | • Value of options based on share price appreciation, if any, over 10-year option period. |
| | | | | | | • Submitted to shareholders every year, with options granted following the annual meeting of shareholders if approved by shareholders; nooff-cycle option grants during the year. |
| | | | | | | | | | | | |
| Category | | Component | | Form | | Obligation at
December 31,
2013 | | Eligibility | | Measurement
Period | | Determination |
Retirement
Plans | | Retirement benefits | | Cash | | $1,545 million | | All employees | | Pensionable service period, some to maximum of 35 years | | • Employees are eligible to participate in either defined benefit or defined contribution pension plans, some of which include a savings feature, a performance contribution feature or stock purchase plan. Supplemental plans are designed to deliver average benefits based on comparative compensation information. |
| | |
| 96 | | PotashCorp 2013 Annual Integrated Report |
| | | | | | | | | | | | |
| Category | | Component | | Form | | 2013 Expense | | Eligibility | | Measurement
Period | | Determination |
| Severance | | Severance benefits | | Cash, insurance or other benefits | | $60 million | | General benefits for all employees; change in control benefits for two employees | | Upon termination of employment | | • Two weeks of salary for each complete year of service, subject to a minimum of four weeks and a maximum of 52 weeks, are generally awarded in connection with termination without cause. • Our severance program was enhanced for our 2013 workforce reduction. |
| 2 | TSR is the total shareholder return on an investment in PotashCorp stock from the time the investment is made. It has two components: (1) growth in share price and (2) related dividend income on the shares. |
| 3 | DAXglobal Agribusiness Index with dividends. |
| 4 | As discussed in the Compensation Discussion and Analysis section of our 2014 Proxy Circular. |
AFFORDABILITY AND ALIGNMENT WITH COMPANY GOALS
It is important to us that compensation be affordable and properly aligned with the company’s performance. With the assistance of Towers Watson, the Board reviews compensation practices against these important requirements.
To measure affordability, our independent compensation consultant measures the realizable pay (as described on Page 37 in the 2014 Proxy Circular) earned by our five most-highly compensated officers as a percentage of PotashCorp’s net income. This percentage over the three years ended December 31, 2012 was the lowest among our comparator group (as described on Pages 47 and 48 in our 2014 Proxy Circular) at just 0.4 percent.
| | |
| Goal (see results on Pages 40 to 50) | | Discussion |
1. Create superior long-term shareholder value | | At-risk incentive compensation plans include short-term, medium-term and long-term cycles and are based on total shareholder return, share appreciation or a related measure. |
2.Be the supplier of choice to the markets we serve | | The STIP is based on annual Board-approved goals for sales, productivity, profitability and safety. Achieving them requires us to meet the needs of customers throughout the year. |
3.Build strong relationships with and improve the socioeconomic well-being of our communities | | Our target is to invest 1 percent of consolidated income before income taxes (on a five-year rolling average) in the communities where we operate and in other philanthropic programs. We actively encourage all employees, particularly executives, to participate in philanthropic programs in our communities and we offer gift-matching opportunities for our employees. To make what we believe is a meaningful investment in local communities, it is important to sustain earnings on a consistent basis. |
4.Attract and retain talented, motivated and productive employees who are committed to our long-term goals | | Target compensation is competitive with the industry average. Executives are motivated to achieve strong results through opportunities to earn above target based on company and individual performance. We believe the long-term performance of the company has been strong and the compensation plans have appropriately rewarded this performance. |
5.Achieve no harm to people and no damage to the environment | | At all plant locations, one-half of the annual STIP payout depends on performance in relation to local metrics, a significant portion of which relates to safety and environmental performance. At corporate offices, 5 percent of the annual STIP payout depends on the company’s overall safety performance. |
| | |
| PotashCorp 2013 Annual Integrated Report | | 97 |
Governance and remuneration
PotashCorp has different pre-defined corporate indicators for its various incentive plans, as follows:
| | | | | | | | | | |
| Program | | Internal Financial Success Metrics | | External Financial Success Metrics | | External
Perception Metrics | | Environmental Metrics | | Social Figures |
STIP | | ü CFR, controllable costs, reliability | | | | * NOTE 1 | | ü Environmental incidents | | ü Injury rate |
MTIP | | ü Total shareholder return | | ü TSR versus DXAG | | | | | | |
Performance Stock Options | | ü CFR versus weighted average cost of capital. | | ü Share price appreciation | | | | | | |
NOTE 1 External perception considerations and related metrics (such as customer, community and employee surveys) are incorporated judgmentally as part of individual STIP adjustments discussed on Page 96.
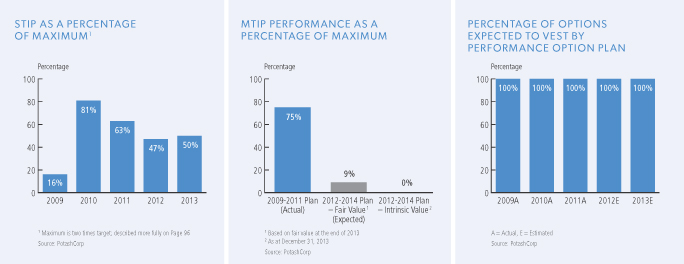
| | |
| 98 | | PotashCorp 2013 Annual Integrated Report |
BOARD COMPENSATION
We set director compensation after considering the advice of independent consultants, with a view to establishing compensation at the median of an applicable comparator group discussed on Pages 47 and 48 in our 2014 Proxy Circular. To align with interests of shareholders, directors are ultimately required to hold shares and/or deferred share units with a value at least five times the annual retainer paid to them. Further details regarding share ownership requirements can be located on Page 19 of our 2014 Proxy Circular.
| | | | | | | | |
| | | | | |
| Component | | Form | | 2013
Expense | | Participants1 | | Determination |
| Board Retainer | | Value paid in cash | | $2 million | | Available to all Board members (4 members elected this option) | | • Compensation is set after considering the advice of Towers Watson, with a view to establishing compensation at the median of the applicable comparator group2. Each outside director can defer, in the form of Deferred Share Units (DSU), up to 100 percent of the annual retainer payable to him or her. |
| Board Retainer | | Value paid in Deferred Share Units | | $1 million | | Available to all Board members (8 members elected this option for all or a portion of the retainer) | | • Within a specified period following retirement, a cash payment is made equal to a director’s DSUs multiplied by the applicable share price at the date of valuation. • The number of DSUs credited to the director’s account with respect to director retainer fees that the director elects to allocate to the DSU Plan is determined as of the last trading day of each calendar quarter and is equal to the quotient obtained by dividing (a) the aggregate amount of retainer fees allocated to the DSU Plan for the relevant calendar quarter by (b) the market value of a share on such last trading day. |
| 2 | As discussed in the Compensation Discussion and Analysis section of our 2014 Proxy Circular. |
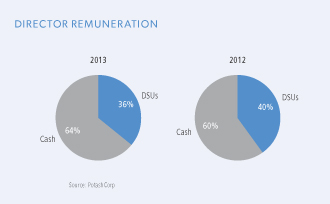
| | |
| PotashCorp 2013 Annual Integrated Report | | 99 |
Forward-looking statements
This 2013 Annual Integrated Report, including the Business Outlook section of Management’s Discussion & Analysis of Financial Condition and Results of Operations, contains forward-looking statements or forward-looking information (“forward-looking statements”). These statements can be identified by expressions of belief, expectation or intention, as well as those statements that are not historical fact. These statements often contain words such as “should,” “could,” “expect,” “may,” “anticipate,” “believe,” “intend,” “estimates,” “plans” and similar expressions. These statements are based on certain factors and assumptions as set forth in this 2013 Annual Integrated Report, including with respect to: foreign exchange rates, expected growth, results of operations, performance, business prospects and opportunities and effective tax rates. While the company considers these factors and assumptions to be reasonable based on information currently available, they may prove to be incorrect. Forward-looking statements are subject to risks and uncertainties that are difficult to predict. The results or events set forth in forward-looking statements may differ materially from actual results or events. Several factors could cause actual results or events to differ materially from those expressed in forward-looking statements including, but not limited to the following: variations from our assumptions with respect to foreign exchange rates, expected growth, results of operations, performance, business prospects and opportunities, and effective tax rates; risks and uncertainties related to operating and workforce changes made in response to our industry and the markets we serve; changes in competitive pressures, including pricing pressures; risks and uncertainties related to our international operations and assets; fluctuations in supply and demand in the fertilizer, sulfur,
transportation and petrochemical markets; costs and availability of transportation and distribution for our raw materials and products, including railcars and ocean freight; adverse or uncertain economic conditions and changes in credit and financial markets; the results of sales contract negotiations within major markets; unexpected geological or environmental conditions, including water inflows; economic and political uncertainty around the world; risks associated with natural gas and other hedging activities; changes in capital markets; unexpected or adverse weather conditions; changes in currency and exchange rates; imprecision in reserve estimates; adverse developments in new and pending legal proceedings or government investigations; acquisitions we may undertake; increases in the price or reduced availability of the raw materials that we use; strikes or other forms of work stoppage or slowdowns; timing and impact of capital expenditures; rates of return on, and the risks associated with, our investments and capital expenditures; changes in, and the effects of, government policies and regulations; security risks related to our information technology systems; risks related to reputational loss; and earnings, and the decisions of taxing authorities, which could affect our effective tax rates. Additional risks and uncertainties can be found in our Form 10-K for the fiscal year ended December 31, 2013 under the captions “Forward-Looking Statements” and “Item 1A – Risk Factors” and in our filings with the US Securities and Exchange Commission and the Canadian provincial securities commissions. Forward-looking statements are given only as at the date of this report and the company disclaims any obligation to update or revise any forward-looking statements, whether as a result of new information, future events or otherwise, except as required by law.
| | |
| 100 | | PotashCorp 2013 Annual Integrated Report |
Non-IFRS financial measures in MD&A
PotashCorp uses cash flow and cash flow return (both non-IFRS financial measures) as supplemental measures to evaluate the performance of the company’s assets in terms of the cash flow they have generated. Calculated on the total cost basis of the company’s assets rather than on the depreciated value, these measures reflect cash returned on the total investment outlay. The company believes these measures are valuable to assess shareholder value. As such, management believes this information to be useful to investors.
Generally, these measures are a numerical measure of a company’s performance, financial position or cash flows that either excludes or includes amounts that are not normally excluded or included in the most directly comparable measure calculated and presented in accordance with IFRS. Cash flow and cash flow return are not
measures of financial performance (nor do they have standardized meanings) under IFRS. In evaluating these measures, investors should consider that the methodology applied in calculating such measures may differ among companies and analysts.
The company uses both IFRS and certain non-IFRS measures to assess performance. Management believes the non-IFRS measures provide useful supplemental information to investors in order that they may evaluate PotashCorp’s financial performance using the same measures as management. Management believes that, as a result, the investor is afforded greater transparency in assessing the financial performance of the company. These non-IFRS financial measures should not be considered as a substitute for, nor superior to, measures of financial performance prepared in accordance with IFRS.
| | | | | | | | | | | | | | | | | | | | | | | | | | | | | | | | | | | | | | | | | | | | |
(in millions of US dollars except percentage amounts) | | | | | | | | | | | | | | | | | | | |
| | | 2013 | | | 2012 | | | 2011 | | | 2010 | | | 2009 1 | | | 2008 1 | | | 2007 1 | | | 2006 1 | | | 2005 1 | | | 2004 1 | | | 2003 1 | |
Net income (loss) | | | 1,785 | | | | 2,079 | | | | 3,081 | | | | 1,775 | | | | 981 | | | | 3,466 | | | | 1,104 | | | | 607 | | | | 543 | | | | 299 | | | | (84 | ) |
Total assets | | | 17,958 | | | | 18,206 | | | | 16,257 | | | | 15,547 | | | | 12,922 | | | | 10,249 | | | | 9,717 | | | | 6,217 | | | | 5,358 | | | | 5,127 | | | | 4,567 | |
Return on assets 2 | | | 9.9% | | | | 11.4% | | | | 19.0% | | | | 11.4% | | | | 7.6% | | | | 33.8% | | | | 11.4% | | | | 9.8% | | | | 10.1% | | | | 5.8% | | | | (1.8% | ) |
Net income (loss) | | | 1,785 | | | | 2,079 | | | | 3,081 | | | | 1,775 | | | | 981 | | | | 3,466 | | | | 1,104 | | | | 607 | | | | 543 | | | | 299 | | | | (84 | ) |
Income taxes | | | 687 | | | | 826 | | | | 1,066 | | | | 701 | | | | 79 | | | | 1,060 | | | | 417 | | | | 142 | | | | 267 | | | | 132 | | | | – | |
Change in unrealized loss (gain) on derivatives included in net income | | | 4 | | | | 3 | | | | 1 | | | | – | | | | (56 | ) | | | 69 | | | | (17 | ) | | | – | | | | – | | | | – | | | | – | |
Finance costs | | | 144 | | | | 114 | | | | 159 | | | | 121 | | | | 121 | | | | 63 | | | | 69 | | | | 86 | | | | 82 | | | | 84 | | | | 91 | |
Current income taxes 3 | | | (272 | ) | | | (404 | ) | | | (700 | ) | | | (479 | ) | | | 120 | | | | (995 | ) | | | (297 | ) | | | (108 | ) | | | (227 | ) | | | (105 | ) | | | – | |
Depreciation and amortization | | | 666 | | | | 578 | | | | 489 | | | | 449 | | | | 312 | | | | 328 | | | | 291 | | | | 242 | | | | 242 | | | | 240 | | | | 227 | |
Impairment of available-for-sale investment | | | – | | | | 341 | | | | – | | | | – | | | | – | | | | – | | | | – | | | | – | | | | – | | | | – | | | | – | |
Cash flow 4 | | | 3,014 | | | | 3,537 | | | | 4,096 | | | | 2,567 | | | | 1,557 | | | | 3,991 | | | | 1,567 | | | | 969 | | | | 907 | | | | 650 | | | | 234 | |
Total assets | | | 17,958 | | | | 18,206 | | | | 16,257 | | | | 15,547 | | | | 12,922 | | | | 10,249 | | | | 9,717 | | | | 6,217 | | | | 5,358 | | | | 5,127 | | | | 4,567 | |
Cash and cash equivalents | | | (628 | ) | | | (562 | ) | | | (430 | ) | | | (412 | ) | | | (385 | ) | | | (277 | ) | | | (720 | ) | | | (326 | ) | | | (94 | ) | | | (459 | ) | | | (5 | ) |
Fair value of derivative assets | | | (8 | ) | | | (10 | ) | | | (10 | ) | | | (5 | ) | | | (9 | ) | | | (18 | ) | | | (135 | ) | | | – | | | | – | | | | – | | | | – | |
Accumulated depreciation of property, plant and equipment | | | 4,668 | | | | 4,176 | | | | 3,653 | | | | 3,171 | | | | 2,712 | | | | 2,527 | | | | 2,281 | | | | 2,074 | | | | 1,928 | | | | 1,755 | | | | 1,576 | |
Net unrealized gain on available-for-sale investments | | | (439 | ) | | | (1,197 | ) | | | (982 | ) | | | (2,563 | ) | | | (1,900 | ) | | | (886 | ) | | | (2,284 | ) | | | – | | | | – | | | | – | | | | – | |
Accumulated amortization of other assets and intangible assets | | | 121 | | | | 104 | | | | 93 | | | | 76 | | | | 57 | | | | 81 | | | | 66 | | | | 80 | | | | 73 | | | | 72 | | | | 77 | |
Payables and accrued charges | | | (1,104 | ) | | | (1,188 | ) | | | (1,295 | ) | | | (1,198 | ) | | | (798 | ) | | | (1,191 | ) | | | (912 | ) | | | (545 | ) | | | (843 | ) | | | (600 | ) | | | (380 | ) |
Adjusted assets | | | 20,568 | | | | 19,529 | | | | 17,286 | | | | 14,616 | | | | 12,599 | | | | 10,485 | | | | 8,013 | | | | 7,500 | | | | 6,422 | | | | 5,895 | | | | 5,835 | |
Average adjusted assets | | | 20,049 | | | | 18,408 | | | | 15,951 | | | | 13,627 | 6 | | | 11,542 | | | | 9,249 | | | | 7,757 | | | | 6,961 | | | | 6,159 | | | | 5,865 | | | | 5,803 | |
Cash flow return 5 | | | 15.0% | | | | 19.2% | | | | 25.7% | | | | 18.8% | | | | 13.5% | | | | 43.2% | | | | 20.2% | | | | 13.9% | | | | 14.7% | | | | 11.1% | | | | 4.0% | |
| 1 | As we adopted IFRS with effect from January 1, 2010, our 2003 to 2009 information is presented on a previous Canadian GAAP basis and, to the extent such information constitutes Canadian non-GAAP measures, is reconciled to the most directly comparable measure calculated in accordance with previous Canadian GAAP. Accordingly, information for 2003 to 2009 may not be comparable to 2010 to 2013. |
| 2 | Return on assets = net income (loss) / total assets. |
| 3 | Current income taxes = current income tax expense (which was already reduced by the realized excess tax benefit related to share-based compensation under previous Canadian GAAP) – realized excess tax benefit related to share-based compensation (under IFRS). |
| 4 | Cash flow = net income (loss) + income taxes + change in unrealized loss (gain) on derivatives included in net income + finance costs – current income taxes + depreciation and amortization + impairment of available-for-sale investment. |
| 5 | Cash flow return = cash flow / average (total assets – cash and cash equivalents – fair value of derivative assets + accumulated depreciation and amortization – net unrealized gain on available-for-sale investments – payables and accrued charges). |
| 6 | Based on adjusted assets as of January 1, 2010 of $12,637, which was calculated similarly to 2009 under previous Canadian GAAP except the following IFRS amounts were used: total assets of $12,842, accumulated depreciation of property, plant and equipment of $2,850 and payables and accrued charges of $(817). |
| | |
| PotashCorp 2013 Annual Integrated Report | | 101 |
11 year data
SUMMARY FINANCIAL PERFORMANCE INDICATORS
| | | | | | | | | | | | | | | | | | | | | | | | | | | | | | | | | | | | | | | | | | | | |
(in millions of US dollars except per-share, percentage and as otherwise noted) | |
| | | 2013 | | | 2012 | | | 2011 | | | 2010 | | | 2009 1 | | | 2008 1 | | | 2007 1 | | | 2006 1 | | | 2005 1 | | | 2004 1 | | | 2003 1 | |
Net income (loss)2 | | | 1,785 | | | | 2,079 | | | | 3,081 | | | | 1,775 | | | | 981 | | | | 3,466 | | | | 1,104 | | | | 607 | | | | 543 | | | | 299 | | | | (84 | ) |
Net income (loss) per share – diluted | | | 2.04 | | | | 2.37 | | | | 3.51 | | | | 1.95 | | | | 1.08 | | | | 3.64 | | | | 1.13 | | | | 0.63 | | | | 0.54 | | | | 0.30 | | | | (0.09 | ) |
EBITDA3 | | | 3,282 | | | | 3,597 | | | | 4,795 | | | | 3,046 | | | | 1,493 | | | | 4,917 | | | | 1,881 | | | | 1,077 | | | | 1,134 | | | | 755 | | | | 234 | |
Net income (loss) as percentage of sales | | | 24.4% | | | | 26.2% | | | | 35.4% | | | | 27.1% | | | | 24.7% | | | | 36.7% | | | | 21.1% | | | | 16.1% | | | | 14.1% | | | | 9.2% | | | | (3.0% | ) |
Adjusted EBITDA margin4 | | | 49.6% | | | | 53.0% | | | | 58.3% | | | | 50.3% | | | | 40.8% | | | | 54.7% | | | | 39.5% | | | | 31.9% | | | | 32.6% | | | | 26.0% | | | | 9.5% | |
Cash flow prior to working capital changes 5 | | | 2,927 | | | | 3,358 | | | | 3,704 | | | | 2,509 | | | | 1,351 | | | | 3,781 | | | | 1,525 | | | | 941 | | | | 860 | | | | 538 | | | | 369 | |
Cash provided by operating activities | | | 3,212 | | | | 3,225 | | | | 3,485 | | | | 3,131 | | | | 924 | | | | 3,013 | | | | 1,689 | | | | 697 | | | | 865 | | | | 658 | | | | 386 | |
Free cash flow 6 | | | 1,303 | | | | 1,154 | | | | 1,456 | | | | 359 | | | | (467 | ) | | | 2,536 | | | | 926 | | | | 431 | | | | 483 | | | | 315 | | | | 185 | |
Return on assetssee Page 101 | | | 9.9% | | | | 11.4% | | | | 19.0% | | | | 11.4% | | | | 7.6% | | | | 33.8% | | | | 11.4% | | | | 9.8% | | | | 10.1% | | | | 5.8% | | | | (1.8% | ) |
Cash flow returnsee Page 101 | | | 15.0% | | | | 19.2% | | | | 25.7% | | | | 18.8% | | | | 13.5% | | | | 43.2% | | | | 20.2% | | | | 13.9% | | | | 14.7% | | | | 11.1% | | | | 4.0% | |
Weighted average cost of capital | | | 9.8% | | | | 9.1% | | | | 9.6% | | | | 10.2% | | | | 10.1% | | | | 12.0% | | | | 10.0% | | | | 8.8% | | | | 8.3% | | | | 8.4% | | | | 7.3% | |
Total shareholder return | | | (16.1% | ) | | | (0.1% | ) | | | (19.5% | ) | | | 43.1% | | | | 48.7% | | | | (48.9% | ) | | | 201.7% | | | | 79.6% | | | | (2.7% | ) | | | 93.5% | | | | 37.6% | |
Total debt to capital | | | 29.0% | | | | 29.2% | | | | 36.6% | | | | 45.5% | | | | 38.6% | | | | 40.3% | | | | 19.3% | | | | 41.0% | | | | 41.5% | | | | 36.4% | | | | 42.3% | |
Net debt to capital9 | | | 25.6% | | | | 26.2% | | | | 34.4% | | | | 43.6% | | | | 36.3% | | | | 38.1% | | | | 10.6% | | | | 36.6% | | | | 39.9% | | | | 27.5% | | | | 42.2% | |
Total debt to net income (loss) | | | 2.2 | | | | 2.0 | | | | 1.5 | | | | 3.1 | | | | 4.1 | | | | 0.9 | | | | 1.3 | | | | 3.2 | | | | 2.8 | | | | 4.6 | | | | (17.2 | ) |
Net debt to EBITDA10 | | | 1.0 | | | | 1.0 | | | | 0.9 | | | | 1.7 | | | | 2.5 | | | | 0.6 | | | | 0.4 | | | | 1.5 | | | | 1.2 | | | | 1.2 | | | | 6.2 | |
Total assets | | | 17,958 | | | | 18,206 | | | | 16,257 | | | | 15,547 | | | | 12,922 | | | | 10,249 | | | | 9,717 | | | | 6,217 | | | | 5,358 | | | | 5,127 | | | | 4,567 | |
Shareholders’ equity | | | 9,628 | | | | 9,912 | | | | 7,847 | | | | 6,685 | | | | 6,440 | | | | 4,535 | | | | 5,994 | | | | 2,755 | | | | 2,133 | | | | 2,386 | | | | 1,974 | |
FINANCIAL DATA, RECONCILIATIONS AND CALCULATIONS
| | | | | | | | | | | | | | | | | | | | | | | | | | | | | | | | | | | | | | | | | | | | |
(in millions of US dollars except share, per-share and tonnage amounts, and as otherwise noted) | |
| | | 2013 | | | 2012 | | | 2011 | | | 2010 | | | 2009 1 | | | 2008 1 | | | 2007 1 | | | 2006 1 | | | 2005 1 | | | 2004 1 | | | 2003 1 | |
Net income (loss)2 | | | 1,785 | | | | 2,079 | | | | 3,081 | | | | 1,775 | | | | 981 | | | | 3,466 | | | | 1,104 | | | | 607 | | | | 543 | | | | 299 | | | | (84 | ) |
Finance costs | | | 144 | | | | 114 | | | | 159 | | | | 121 | | | | 121 | | | | 63 | | | | 69 | | | | 86 | | | | 82 | | | | 84 | | | | 91 | |
Income taxes | | | 687 | | | | 826 | | | | 1,066 | | | | 701 | | | | 79 | | | | 1,060 | | | | 417 | | | | 142 | | | | 267 | | | | 132 | | | | – | |
Depreciation and amortization | | | 666 | | | | 578 | | | | 489 | | | | 449 | | | | 312 | | | | 328 | | | | 291 | | | | 242 | | | | 242 | | | | 240 | | | | 227 | |
EBITDA3 | | | 3,282 | | | | 3,597 | | | | 4,795 | | | | 3,046 | | | | 1,493 | | | | 4,917 | | | | 1,881 | | | | 1,077 | | | | 1,134 | | | | 755 | | | | 234 | |
Net income (loss) as percentage of sales | | | 24.4% | | | | 26.2% | | | | 35.4% | | | | 27.1% | | | | 24.7% | | | | 36.7% | | | | 21.1% | | | | 16.1% | | | | 14.1% | | | | 9.2% | | | | (3.0% | ) |
Adjusted EBITDA margin4 | | | 49.6% | | | | 53.0% | | | | 58.3% | | | | 50.3% | | | | 40.8% | | | | 54.7% | | | | 39.5% | | | | 31.9% | | | | 32.6% | | | | 26.0% | | | | 9.5% | |
Cash flow prior to working capital changes 5 | | | 2,927 | | | | 3,358 | | | | 3,704 | | | | 2,509 | | | | 1,351 | | | | 3,781 | | | | 1,525 | | | | 941 | | | | 860 | | | | 538 | | | | 369 | |
Receivables | | | 276 | | | | 188 | | | | (155 | ) | | | 256 | | | | 53 | | | | (594 | ) | | | (155 | ) | | | 11 | | | | (107 | ) | | | (52 | ) | | | (39 | ) |
Inventories | | | 28 | | | | (7 | ) | | | (146 | ) | | | 66 | | | | 88 | | | | (324 | ) | | | 61 | | | | 14 | | | | (120 | ) | | | (11 | ) | | | 12 | |
Prepaid expenses and other current assets | | | (1 | ) | | | (32 | ) | | | (1 | ) | | | (6 | ) | | | 21 | | | | (24 | ) | | | 7 | | | | – | | | | (6 | ) | | | (6 | ) | | | 11 | |
Payables and accrued charges | | | (18 | ) | | | (282 | ) | | | 83 | | | | 306 | | | | (589 | ) | | | 174 | | | | 251 | | | | (269 | ) | | | 238 | | | | 189 | | | | 33 | |
Changes in non-cash operating working capital | | | 285 | | | | (133 | ) | | | (219 | ) | | | 622 | | | | (427 | ) | | | (768 | ) | | | 164 | | | | (244 | ) | | | 5 | | | | 120 | | | | 17 | |
Cash provided by operating activities | | | 3,212 | | | | 3,225 | | | | 3,485 | | | | 3,131 | | | | 924 | | | | 3,013 | | | | 1,689 | | | | 697 | | | | 865 | | | | 658 | | | | 386 | |
Cash additions to property, plant and equipment | | | (1,624 | ) | | | (2,133 | ) | | | (2,176 | ) | | | (2,079 | ) | | | (1,764 | ) | | | (1,198 | ) | | | (607 | ) | | | (509 | ) | | | (383 | ) | | | (220 | ) | | | (151 | ) |
Other assets and intangible assets | | | – | | | | (71 | ) | | | (72 | ) | | | (71 | ) | | | (54 | ) | | | (47 | ) | | | 8 | | | | (1 | ) | | | 6 | | | | (3 | ) | | | (33 | ) |
Changes in non-cash operating working capital | | | (285 | ) | | | 133 | | | | 219 | | | | (622 | ) | | | 427 | | | | 768 | | | | (164 | ) | | | 244 | | | | (5 | ) | | | (120 | ) | | | (17 | ) |
Free cash flow 6 | | | 1,303 | | | | 1,154 | | | | 1,456 | | | | 359 | | | | (467 | ) | | | 2,536 | | | | 926 | | | | 431 | | | | 483 | | | | 315 | | | | 185 | |
Footnotes detailed on Pages 105-106
| | |
| 102 | | PotashCorp 2013 Annual Integrated Report |
| | | | | | | | | | | | | | | | | | | | | | | | | | | | | | | | | | | | | | | | | | | | |
| | | 2013 | | | 2012 | | | 2011 | | | 2010 | | | 2009 1 | | | 2008 1 | | | 2007 1 | | | 2006 1 | | | 2005 1 | | | 2004 1 | | | 2003 1 | |
Weighted average cost of capital | | | 9.8% | | | | 9.1% | | | | 9.6% | | | | 10.2% | | | | 10.1% | | | | 12.0% | | | | 10.0% | | | | 8.8% | | | | 8.3% | | | | 8.4% | | | | 7.3% | |
End of year closing price (dollars) | | | 32.96 | | | | 40.69 | | | | 41.28 | | | | 51.61 | | | | 36.17 | | | | 24.41 | | | | 47.99 | | | | 15.94 | | | | 8.91 | | | | 9.23 | | | | 4.80 | |
Beginning of year opening price (dollars) | | | 40.69 | | | | 41.28 | | | | 51.61 | | | | 36.17 | | | | 24.41 | | | | 47.99 | | | | 15.94 | | | | 8.91 | | | | 9.23 | | | | 4.80 | | | | 3.53 | |
Change in share price (dollars) | | | (7.73 | ) | | | (0.59 | ) | | | (10.33 | ) | | | 15.44 | | | | 11.76 | | | | (23.58 | ) | | | 32.05 | | | | 7.03 | | | | (0.32 | ) | | | 4.43 | | | | 1.27 | |
Dividends per share, ex-dividend date (dollars) | | | 1.19 | | | | 0.56 | | | | 0.24 | | | | 0.13 | | | | 0.13 | | | | 0.13 | | | | 0.10 | | | | 0.07 | | | | 0.07 | | | | 0.06 | | | | 0.06 | |
Total shareholder return | | | (16.1% | ) | | | (0.1% | ) | | | (19.5% | )7 | | | 43.1% | 7 | | | 48.7% | | | | (48.9% | ) | | | 201.7% | | | | 79.6% | 7 | | | (2.7% | ) | | | 93.5% | | | | 37.6% | 7 |
5-year cumulative shareholder return 8 | | | 44% | | | | | | | | | | | | | | | | | | | | | | | | | | | | | | | | | | | | | | | | | |
10-year cumulative shareholder return 8 | | | 644% | | | | | | | | | | | | | | | | | | | | | | | | | | | | | | | | | | | | | | | | | |
Short-term debt | | | 470 | | | | 369 | | | | 829 | | | | 1,274 | | | | 727 | | | | 1,324 | | | | 90 | | | | 158 | | | | 252 | | | | 94 | | | | 176 | |
Current portion of long-term debt | | | 497 | | | | 246 | | | | 3 | | | | 597 | | | | 2 | | | | – | | | | – | | | | 400 | | | | 1 | | | | 10 | | | | 1 | |
Long-term debt | | | 2,970 | | | | 3,466 | | | | 3,705 | | | | 3,707 | | | | 3,319 | | | | 1,740 | | | | 1,339 | | | | 1,357 | | | | 1,258 | | | | 1,259 | | | | 1,269 | |
Total debt | | | 3,937 | | | | 4,081 | | | | 4,537 | | | | 5,578 | | | | 4,048 | | | | 3,064 | | | | 1,429 | | | | 1,915 | | | | 1,511 | | | | 1,363 | | | | 1,446 | |
Cash and cash equivalents | | | (628 | ) | | | (562 | ) | | | (430 | ) | | | (412 | ) | | | (385 | ) | | | (277 | ) | | | (720 | ) | | | (326 | ) | | | (94 | ) | | | (459 | ) | | | (5 | ) |
Net debt 9 | | | 3,309 | | | | 3,519 | | | | 4,107 | | | | 5,166 | | | | 3,663 | | | | 2,787 | | | | 709 | | | | 1,589 | | | | 1,417 | | | | 904 | | | | 1,441 | |
Shareholders’ equity | | | 9,628 | | | | 9,912 | | | | 7,847 | | | | 6,685 | | | | 6,440 | | | | 4,535 | | | | 5,994 | | | | 2,755 | | | | 2,133 | | | | 2,386 | | | | 1,974 | |
Total debt to capital | | | 29.0% | | | | 29.2% | | | | 36.6% | | | | 45.5% | | | | 38.6% | | | | 40.3% | | | | 19.3% | | | | 41.0% | | | | 41.5% | | | | 36.4% | | | | 42.3% | |
Net debt to capital 9 | | | 25.6% | | | | 26.2% | | | | 34.4% | | | | 43.6% | | | | 36.3% | | | | 38.1% | | | | 10.6% | | | | 36.6% | | | | 39.9% | | | | 27.5% | | | | 42.2% | |
Total debt to net income (loss) | | | 2.2 | | | | 2.0 | | | | 1.5 | | | | 3.1 | | | | 4.1 | | | | 0.9 | | | | 1.3 | | | | 3.2 | | | | 2.8 | | | | 4.6 | | | | (17.2 | ) |
Net debt to EBITDA 10 | | | 1.0 | | | | 1.0 | | | | 0.9 | | | | 1.7 | | | | 2.5 | | | | 0.6 | | | | 0.4 | | | | 1.5 | | | | 1.2 | | | | 1.2 | | | | 6.2 | |
Current assets | | | 2,189 | | | | 2,496 | | | | 2,408 | | | | 2,095 | | | | 2,272 | | | | 2,267 | | | | 1,811 | | | | 1,310 | | | | 1,111 | | | | 1,244 | | | | 734 | |
Current liabilities | | | (2,113 | ) | | | (1,854 | ) | | | (2,194 | ) | | | (3,144 | ) | | | (1,577 | ) | | | (2,623 | ) | | | (1,002 | ) | | | (1,104 | ) | | | (1,096 | ) | | | (704 | ) | | | (558 | ) |
Working capital | | | 76 | | | | 642 | | | | 214 | | | | (1,049 | ) | | | 695 | | | | (356 | ) | | | 809 | | | | 206 | | | | 15 | | | | 540 | | | | 176 | |
Cash and cash equivalents | | | (628 | ) | | | (562 | ) | | | (430 | ) | | | (412 | ) | | | (385 | ) | | | (277 | ) | | | (720 | ) | | | (326 | ) | | | (94 | ) | | | (459 | ) | | | (5 | ) |
Short-term debt | | | 470 | | | | 369 | | | | 829 | | | | 1,274 | | | | 727 | | | | 1,324 | | | | 90 | | | | 158 | | | | 252 | | | | 94 | | | | 176 | |
Current portion of long-term debt | | | 497 | | | | 246 | | | | 3 | | | | 597 | | | | 2 | | | | – | | | | – | | | | 400 | | | | 1 | | | | 10 | | | | 1 | |
Non-cash operating working capital | | | 415 | | | | 695 | | | | 616 | | | | 410 | | | | 1,039 | | | | 691 | | | | 179 | | | | 438 | | | | 174 | | | | 185 | | | | 348 | |
Sales | | | | | | | | | | | | | | | | | | | | | | | | | | | | | | | | | | | | | | | | | | | | |
Potash | | | 2,963 | | | | 3,285 | | | | 3,983 | | | | 3,001 | | | | 1,316 | | | | 4,068 | | | | 1,797 | | | | 1,228 | | | | 1,341 | | | | 1,056 | | | | 759 | |
Nitrogen | | | 2,417 | | | | 2,503 | | | | 2,433 | | | | 1,835 | | | | 1,353 | | | | 2,672 | | | | 1,912 | | | | 1,395 | | | | 1,369 | | | | 1,210 | | | | 1,156 | |
Phosphate | | | 2,067 | | | | 2,292 | | | | 2,478 | | | | 1,822 | | | | 1,374 | | | | 2,881 | | | | 1,637 | | | | 1,255 | | | | 1,137 | | | | 978 | | | | 884 | |
Less inter-segment nitrogen | | | (142 | ) | | | (153 | ) | | | (179 | ) | | | (119 | ) | | | (66 | ) | | | (174 | ) | | | (112 | ) | | | (111 | ) | | | – | | | | – | | | | – | |
Total sales | | | 7,305 | | | | 7,927 | | | | 8,715 | | | | 6,539 | | | | 3,977 | | | | 9,447 | | | | 5,234 | | | | 3,767 | | | | 3,847 | | | | 3,244 | | | | 2,799 | |
Freight, transportation and distribution | | | (572 | ) | | | (494 | ) | | | (496 | ) | | | (488 | ) | | | (319 | ) | | | (458 | ) | | | (470 | ) | | | (390 | ) | | | (371 | ) | | | (343 | ) | | | (333 | ) |
Net sales11 | | | 6,733 | | | | 7,433 | | | | 8,219 | | | | 6,051 | | | | 3,658 | | | | 8,989 | | | | 4,764 | | | | 3,377 | | | | 3,476 | | | | 2,901 | | | | 2,466 | |
Potash net sales | | | | | | | | | | | | | | | | | | | | | | | | | | | | | | | | | | | | | | | | | | | | |
North America | | | 1,210 | | | | 1,231 | | | | 1,502 | | | | 1,222 | | | | 507 | | | | 1,308 | | | | 657 | | | | 471 | | | | 496 | | | | 348 | | | | 231 | |
Offshore | | | 1,482 | | | | 1,835 | | | | 2,223 | | | | 1,506 | | | | 699 | | | | 2,527 | | | | 910 | | | | 576 | | | | 668 | | | | 505 | | | | 336 | |
Miscellaneous and purchased product | | | 15 | | | | 13 | | | | 14 | | | | 14 | | | | 16 | | | | 24 | | | | 14 | | | | 12 | | | | 13 | | | | 43 | | | | 52 | |
Total potash net sales | | | 2,707 | | | | 3,079 | | | | 3,739 | | | | 2,742 | | | | 1,222 | | | | 3,859 | | | | 1,581 | | | | 1,059 | | | | 1,177 | | | | 896 | | | | 619 | |
Gross margin | | | | | | | | | | | | | | | | | | | | | | | | | | | | | | | | | | | | | | | | | | | | |
Potash | | | 1,573 | | | | 1,963 | | | | 2,722 | | | | 1,816 | | | | 731 | | | | 3,056 | | | | 912 | | | | 561 | | | | 707 | | | | 423 | | | | 204 | |
Nitrogen | | | 913 | | | | 978 | | | | 916 | | | | 528 | | | | 192 | | | | 737 | | | | 536 | | | | 316 | | | | 319 | | | | 243 | | | | 193 | |
Phosphate | | | 304 | | | | 469 | | | | 648 | | | | 346 | | | | 92 | | | | 1,068 | | | | 434 | | | | 84 | | | | 99 | | | | 15 | | | | (17 | ) |
Total gross margin | | | 2,790 | | | | 3,410 | | | | 4,286 | | | | 2,690 | | | | 1,015 | | | | 4,861 | | | | 1,882 | | | | 961 | | | | 1,125 | | | | 681 | | | | 380 | |
Footnotes detailed on Pages 105-106
| | |
| PotashCorp 2013 Annual Integrated Report | | 103 |
11 year data
| | | | | | | | | | | | | | | | | | | | | | | | | | | | | | | | | | | | | | | | | | | | |
| | | 2013 | | | 2012 | | | 2011 | | | 2010 | | | 2009 1 | | | 2008 1 | | | 2007 1 | | | 2006 1 | | | 2005 1 | | | 2004 1 | | | 2003 1 | |
Depreciation and amortization | | | | | | | | | | | | | | | | | | | | | | | | | | | | | | | | | | | | | | | | | | | | |
Potash | | | 196 | | | | 169 | | | | 142 | | | | 125 | | | | 40 | | | | 82 | | | | 72 | | | | 58 | | | | 65 | | | | 66 | | | | 52 | |
Nitrogen | | | 161 | | | | 138 | | | | 132 | | | | 119 | | | | 99 | | | | 97 | | | | 88 | | | | 77 | | | | 72 | | | | 80 | | | | 86 | |
Phosphate | | | 294 | | | | 261 | | | | 207 | | | | 197 | | | | 164 | | | | 141 | | | | 121 | | | | 95 | | | | 95 | | | | 84 | | | | 79 | |
Other | | | 15 | | | | 10 | | | | 8 | | | | 8 | | | | 9 | | | | 8 | | | | 10 | | | | 12 | | | | 10 | | | | 10 | | | | 10 | |
Total depreciation and amortization | | | 666 | | | | 578 | | | | 489 | | | | 449 | | | | 312 | | | | 328 | | | | 291 | | | | 242 | | | | 242 | | | | 240 | | | | 227 | |
Operating income | | | 2,616 | | | | 3,019 | | | | 4,306 | | | | 2,597 | | | | 1,181 | | | | 4,589 | | | | 1,589 | | | | 835 | | | | 893 | | | | 514 | | | | 7 | |
Net income (loss) per share – basic | | | 2.06 | | | | 2.42 | | | | 3.60 | | | | 2.00 | | | | 1.11 | | | | 3.76 | | | | 1.17 | | | | 0.65 | | | | 0.56 | | | | 0.31 | | | | (0.09 | ) |
Net income (loss) per share – diluted | | | 2.04 | | | | 2.37 | | | | 3.51 | | | | 1.95 | | | | 1.08 | | | | 3.64 | | | | 1.13 | | | | 0.63 | | | | 0.54 | | | | 0.30 | | | | (0.09 | ) |
Dividends declared per share | | | 1.33 | | | | 0.70 | | | | 0.28 | | | | 0.13 | | | | 0.13 | | | | 0.13 | | | | 0.12 | | | | 0.07 | | | | 0.07 | | | | 0.06 | | | | 0.06 | |
Capital spending | | | | | | | | | | | | | | | | | | | | | | | | | | | | | | | | | | | | | | | | | | | | |
Sustaining | | | 667 | | | | 651 | | | | 509 | | | | 523 | | | | 416 | | | | 303 | | | | 204 | | | | 154 | | | | 127 | | | | 125 | | | | 112 | |
Opportunity | | | 957 | | | | 1,482 | | | | 1,667 | | | | 1,556 | | | | 1,348 | | | | 895 | | | | 403 | | | | 355 | | | | 256 | | | | 95 | | | | 39 | |
Total cash additions to property, plant and equipment | | | 1,624 | | | | 2,133 | | | | 2,176 | | | | 2,079 | | | | 1,764 | | | | 1,198 | | | | 607 | | | | 509 | | | | 383 | | | | 220 | | | | 151 | |
Weighted average shares outstanding | | | | | | | | | | | | | | | | | | | | | | | | | | | | | | | | | | | | | | | | | | | | |
Basic (thousands) | | | 864,596 | | | | 860,033 | | | | 855,677 | | | | 886,371 | | | | 886,740 | | | | 922,439 | | | | 946,923 | | | | 935,640 | | | | 977,112 | | | | 971,703 | | | | 940,140 | |
Diluted (thousands) | | | 873,982 | | | | 875,907 | | | | 876,637 | | | | 911,093 | | | | 911,828 | | | | 952,313 | | | | 972,924 | | | | 956,067 | | | | 999,702 | | | | 996,651 | | | | 940,140 | |
Shares outstanding at the end of the year (thousands) 12 | | | 856,116 | | | | 864,901 | | | | 858,703 | | | | 853,123 | | | | 887,927 | | | | 885,603 | | | | 949,233 | | | | 943,209 | | | | 932,346 | | | | 995,679 | | | | 956,016 | |
NON-FINANCIAL DATA, OPERATING DATA AND CALCULATIONS
| | | | | | | | | | | | | | | | | | | | | | | | | | | | | | | | | | | | | | | | | | | | |
| | | 2013 | | | 2012 | | | 2011 | | | 2010 | | | 2009 | | | 2008 | | | 2007 | | | 2006 | | | 2005 | | | 2004 | | | 2003 | |
Customers | | | | | | | | | | | | | | | | | | | | | | | | | | | | | | | | | | | | | | | | | | | | |
Average customer survey score 13 | | | 90% | | | | 92% | | | | 90% | | | | 90% | | | | 89% | | | | 91% | | | | 90% | | | | n/a | | | | n/a | | | | n/a | | | | n/a | |
Number of product tonnes involved in customer complaints (000 tonnes) 14 | | | 43 | | | | 64 | | | | 59 | | | | 97 | | | | 190 | | | | 191 | | | | 152 | | | | 289 | | | | 166 | | | | n/a | | | | n/a | |
Community | | | | | | | | | | | | | | | | | | | | | | | | | | | | | | | | | | | | | | | | | | | | |
Community investment ($ millions) | | | 31 | | | | 28 | | | | 21 | | | | 17 | | | | 10 | | | | 7 | | | | 4 | | | | 4 | | | | 4 | | | | 4 | | | | 2 | |
Taxes and royalties ($ millions) | | | 568 | | | | 654 | | | | 997 | | | | 620 | | | | (8 | ) | | | 1,684 | | | | 507 | | | | 238 | | | | 430 | | | | 251 | | | | 102 | |
Average community survey score 15 | | | 4.2 | | | | 4.5 | | | | 4.4 | | | | 4.2 | | | | 4.1 | | | | 4.0 | | | | 4.1 | | | | 4.3 | | | | n/a | | | | n/a | | | | n/a | |
Employees | | | | | | | | | | | | | | | | | | | | | | | | | | | | | | | | | | | | | | | | | | | | |
Employees at year-end (actual) | | | 5,787 | 16 | | | 5,779 | | | | 5,703 | | | | 5,486 | | | | 5,136 | | | | 5,301 | | | | 5,003 | | | | 4,871 | | | | 4,879 | | | | 4,906 | | | | 4,904 | |
Average employee engagement score 17 | | | n/a | | | | 79% | | | | 73% | | | | 73% | | | | 76% | | | | 79% | | | | 69% | | | | 66% | | | | n/a | | | | n/a | | | | n/a | |
Annual employee turnover rate (excluding retirements) 18 | | | 5.4% | | | | 4.6% | | | | 3.8% | | | | 3.3% | | | | 5.8% | | | | 5.7% | | | | n/a | | | | n/a | | | | n/a | | | | n/a | | | | n/a | |
Gender diversity – proportion of females 19 | | | 8% | | | | 8% | | | | 8% | | | | 8% | | | | 9% | | | | 9% | | | | 9% | | | | 9% | | | | 9% | | | | 8% | | | | n/a | |
Safety | | | | | | | | | | | | | | | | | | | | | | | | | | | | | | | | | | | | | | | | | | | | |
Total site recordable injury rate | | | 1.06 | | | | 1.29 | | | | 1.42 | | | | 1.29 | | | | 1.54 | | | | 2.21 | | | | n/a | | | | n/a | | | | n/a | | | | n/a | | | | n/a | |
Total site severity injury rate (per 200,000 hours worked) | | | 0.40 | | | | 0.55 | | | | 0.54 | | | | 0.38 | | | | 0.74 | | | | 0.97 | | | | n/a | | | | n/a | | | | n/a | | | | n/a | | | | n/a | |
Environment | | | | | | | | | | | | | | | | | | | | | | | | | | | | | | | | | | | | | | | | | | | | |
Environmental incidents | | | 17 | | | | 19 | | | | 14 | | | | 20 | | | | 22 | | | | 19 | | | | 25 | | | | 26 | | | | n/a | | | | n/a | | | | n/a | |
Waste (million tonnes) 20 | | | 28.5 | | | | 23.7 | | | | 30.2 | | | | 26.2 | | | | 15.0 | | | | 26.3 | | | | 28.1 | | | | 24.4 | | | | n/a | | | | n/a | | | | n/a | |
Direct energy used (000 terajoules) 21 | | | 180 | | | | 160 | | | | 166 | | | | 162 | | | | 152 | | | | 154 | | | | 159 | | | | n/a | | | | n/a | | | | n/a | | | | n/a | |
| n/a | = not available as data had not been previously compiled consistent with current methodology |
Footnotes detailed on Pages 105-106
| | |
| 104 | | PotashCorp 2013 Annual Integrated Report |
| | | | | | | | | | | | | | | | | | | | | | | | | | | | | | | | | | | | | | | | | | | | |
| | | 2013 | | | 2012 | | | 2011 | | | 2010 | | | 2009 | | | 2008 | | | 2007 | | | 2006 | | | 2005 | | | 2004 | | | 2003 | |
Production (thousands) | | | | | | | | | | | | | | | | | | | | | | | | | | | | | | | | | | | | | | | | | | | | |
Potash production (KCI) tonnage | | | 7,792 | | | | 7,724 | | | | 9,343 | | | | 8,078 | | | | 3,405 | | | | 8,697 | | | | 9,159 | | | | 7,018 | | | | 8,816 | | | | 7,914 | | | | 7,094 | |
Nitrogen production (N) tonnage | | | 2,952 | | | | 2,602 | | | | 2,813 | | | | 2,767 | | | | 2,551 | | | | 2,780 | | | | 2,986 | | | | 2,579 | | | | 2,600 | | | | 2,558 | | | | 2,619 | |
Phosphate production (P2O5) tonnage | | | 2,058 | | | | 1,983 | | | | 2,204 | | | | 1,987 | | | | 1,505 | | | | 1,942 | | | | 2,164 | | | | 2,108 | | | | 2,097 | | | | 1,962 | | | | 1,861 | |
Sales (thousands) | | | | | | | | | | | | | | | | | | | | | | | | | | | | | | | | | | | | | | | | | | | | |
Potash sales – manufactured product tonnes | | | | | | | | | | | | | | | | | | | | | | | | | | | | | | | | | | | | | | | | | | | | |
North America | | | 3,185 | | | | 2,590 | | | | 3,114 | | | | 3,355 | | | | 1,093 | | | | 2,962 | | | | 3,471 | | | | 2,785 | | | | 3,144 | | | | 3,246 | | | | 2,870 | |
Offshore | | | 4,915 | | | | 4,640 | | | | 5,932 | | | | 5,289 | | | | 1,895 | | | | 5,585 | | | | 5,929 | | | | 4,411 | | | | 5,020 | | | | 5,030 | | | | 4,213 | |
Potash sales | | | 8,100 | | | | 7,230 | | | | 9,046 | | | | 8,644 | | | | 2,988 | | | | 8,547 | | | | 9,400 | | | | 7,196 | | | | 8,164 | | | | 8,276 | | | | 7,083 | |
Nitrogen sales – manufactured product tonnes | | | 5,896 | | | | 4,946 | | | | 5,147 | | | | 5,329 | | | | 5,086 | | | | 5,050 | | | | 5,756 | | | | 4,720 | | | | 4,843 | | | | 4,738 | | | | 5,370 | |
Phosphate sales – manufactured product tonnes | | | 3,680 | | | | 3,643 | | | | 3,854 | | | | 3,632 | | | | 3,055 | | | | 3,322 | | | | 4,151 | | | | 3,970 | | | | 3,860 | | | | 3,675 | | | | 3,560 | |
NON-IFRS FINANCIAL MEASURES AND FOOTNOTES TO RECONCILIATIONS AND CALCULATIONS
(in millions of US dollars except share and per-share amounts)
The company uses both IFRS and certain non-IFRS measures to assess performance as discussed on Page 101. EBITDA, adjusted EBITDA, adjusted EBITDA margin, cash flow prior to working capital changes, free cash flow, cash flow, cash flow return, net debt, net debt to capital, net debt to EBITDA and net sales are not measures of financial performance (nor do they have standardized meanings) under IFRS. In evaluating these measures, investors should consider that the methodology applied in calculating such measures may differ among companies and analysts.
| 1 | As we adopted IFRS with effect from January 1, 2010, our 2003 to 2009 annual information is presented on a previous Canadian GAAP basis and, to the extent such information constitutes Canadian non-GAAP measures, is reconciled to the most directly comparable measure calculated in accordance with previous Canadian GAAP. Accordingly, our information for 2003 to 2009 may not be comparable to the periods 2010 to 2013. |
| 2 | There were no discontinued operations in any of the accounting periods. After-tax effects of certain items affecting net income were as follows: |
| | | | | | | | | | | | | | | | | | | | | | | | | | | | | | | | | | | | |
| | | 2013 | | | 2012 | | | 2011 | | | 2010 | | | 2009 1 | | | 2008 1 | | | 2007 1 | | | 2006 1 | | | 2004 1 | |
Plant shutdown and closure and workforce reduction costs | | $ | 44 | | | $ | – | | | $ | – | | | $ | – | | | $ | – | | | $ | – | | | $ | – | | | $ | – | | | $ | 6 | |
Impairment of available-for-sale investment | | | – | | | | 341 | | | | – | | | | – | | | | – | | | | – | | | | – | | | | – | | | | – | |
Takeover response costs | | | – | | | | – | | | | 1 | | | | 56 | | | | – | | | | – | | | | – | | | | – | | | | – | |
Loss (gain) on sale of assets | | | – | | | | – | | | | – | | | | – | | | | 6 | | | | (16 | ) | | | – | | | | – | | | | (37 | ) |
(Recovery) impairment of auction rate securities | | | – | | | | – | | | | – | | | | – | | | | (91 | ) | | | 67 | | | | 19 | | | | – | | | | – | |
Impairment of property, plant and equipment | | | – | | | | – | | | | – | | | | – | | | | – | | | | – | | | | – | | | | 5 | | | | – | |
Total after-tax effects on net income | | $ | 44 | | | $ | 341 | | | $ | 1 | | | $ | 56 | | | $ | (85 | ) | | $ | 51 | | | $ | 19 | | | $ | 5 | | | $ | (31 | ) |
| 3 | PotashCorp uses EBITDA and adjusted EBITDA as supplemental financial measures of its operational performance. Management believes EBITDA and adjusted EBITDA to be important measures as they exclude the effects of items which primarily reflect the impact of long-term investment and financing decisions, rather than the performance of the company’s day-to-day operations. As compared to net income (loss) according to IFRS, these measures are limited in that they do not reflect the periodic costs of certain capitalized tangible and intangible assets used in generating revenues in the company’s business, or the charges associated with impairments, costs associated with takeover response and certain gains and losses on disposal of assets. Management evaluates such items through other financial measures such as capital expenditures and cash flow provided by operating activities. The company believes that these measurements are useful to measure a company’s ability to service debt and to meet other payment obligations or as a valuation measurement. |
| | EBITDA has not been adjusted for the effects of the following items: |
| | | | | | | | | | | | | | | | | | | | | | | | | | | | | | | | | | | | |
| | | 2013 | | | 2012 | | | 2011 | | | 2010 | | | 2009 1 | | | 2008 1 | | | 2007 1 | | | 2006 1 | | | 2004 1 | |
Plant shutdown and closure and workforce reductions | | $ | 60 | | | $ | – | | | $ | – | | | $ | – | | | $ | – | | | $ | – | | | $ | – | | | $ | – | | | $ | 6 | |
Impairment of available-for-sale investment | | | – | | | | 341 | | | | – | | | | – | | | | – | | | | – | | | | – | | | | – | | | | – | |
Takeover response costs | | | – | | | | – | | | | 2 | | | | 73 | | | | – | | | | – | | | | – | | | | – | | | | – | |
Loss (gain) on sale of assets | | | – | | | | – | | | | – | | | | – | | | | 8 | | | | (21 | ) | | | – | | | | – | | | | (37 | ) |
(Recovery) impairment of auction rate securities | | | – | | | | – | | | | – | | | | – | | | | (115 | ) | | | 89 | | | | 27 | | | | – | | | | – | |
Impairment of property, plant and equipment | | | – | | | | – | | | | – | | | | – | | | | – | | | | – | | | | – | | | | 6 | | | | – | |
Total items included in EBITDA | | | 60 | | | | 341 | | | | 2 | | | | 73 | | | | (107 | ) | | | 68 | | | | 27 | | | | 6 | | | | (31 | ) |
EBITDA | | | 3,282 | | | | 3,597 | | | | 4,795 | | | | 3,046 | | | | 1,493 | | | | 4,917 | | | | 1,881 | | | | 1,077 | | | | 755 | |
Adjusted EBITDA | | $ | 3,342 | | | $ | 3,938 | | | $ | 4,797 | | | $ | 3,119 | | | $ | 1,386 | | | $ | 4,985 | | | $ | 1,908 | | | $ | 1,083 | | | $ | 724 | |
| | |
| PotashCorp 2013 Annual Integrated Report | | 105 |
11 year data
| 4 | Management believes comparing EBITDA to net sales earned (net of costs to deliver product) is an important indicator of efficiency. In addition to the limitations given above in using adjusted EBITDA as compared to net income, adjusted EBITDA margin as compared to net income as a percentage of sales is also limited in that freight, transportation and distribution costs are incurred and valued independently of sales; adjusted EBITDA also includes earnings from equity investees whose sales are not included in consolidated sales. Management evaluates these items individually on the consolidated statements of income. |
| 5 | Management uses cash flow prior to working capital changes as a supplemental financial measure in its evaluation of liquidity. Management believes that adjusting principally for the swings in non-cash working capital items due to seasonality or other timing issues assists management in making long-term liquidity assessments. Management also believes that this measurement is useful as a measure of liquidity or as a valuation measurement. |
| 6 | The company uses free cash flow as a supplemental financial measure in its evaluation of liquidity and financial strength. Management believes that adjusting principally for the swings in non-cash operating working capital items due to seasonality or other timing issues, additions to property, plant and equipment, and changes to other assets assists management in the long-term assessment of liquidity and financial strength. Management also believes that this measurement is useful as an indicator of its ability to service its debt, meet other payment obligations and make strategic investments. Readers should be aware that free cash flow does not represent residual cash flow available for discretionary expenditures. |
| 7 | On a post-split basis, the dividend per share was $0.243 in 2011, $0.133 in 2010, $0.0667 in 2006 and $0.0556 in 2003. |
| 8 | Calculated as cumulative change in share price and dividends per share,ex-dividend date for the five- and 10- year period ended December 31, 2013 divided by the end-of-year price five and 10 years ago. |
| 9 | Management believes that net debt and net-debt-to-capital ratio are useful to investors because they are helpful in determining the company’s leverage. It also believes that, since the company has the ability to and may elect to use a portion of cash and cash equivalents to retire debt or to incur additional expenditures without increasing debt, it is appropriate to apply cash and cash equivalents to debt in calculating net debt and net debt to capital. PotashCorp believes that this measurement is useful as a financial leverage measure. |
| 10 | Net debt to EBITDA shows the maximum number of years it would take to retire the company’s net debt using the current year’s EBITDA and helps PotashCorp evaluate the appropriateness of current debt levels relative to earnings generated by operations. In addition to the limitation of using EBITDA discussed above, net debt to EBITDA is limited in that this measure assumes all earnings are used to repay principal and no interest payments or taxes. |
| 11 | Management includes net sales in its segment disclosures in the consolidated financial statements pursuant to IFRS, which requires segmentation based upon the company’s internal organization and reporting of revenue and profit measures derived from internal accounting methods. As a component of gross margin, net sales (and related per-tonne amounts and other ratios) are primary revenue measures it uses and reviews in making decisions about operating matters on a business segment basis. These decisions include assessments about potash, nitrogen and phosphate performance and the resources to be allocated to these segments. It also uses net sales (and related per-tonne amounts and other ratios) for business segment planning and monthly |
| | forecasting. Net sales are calculated as sales revenues less freight, transportation and distribution expenses. Net sales presented on a consolidated basis rather than by business segment is considered a non-IFRS financial measure. |
| 12 | Common shares were repurchased in 2013, 2010, 2008 and 2005 in the amounts of 14.145 million, 42.190 million, 68.547 million and 85.500 million, respectively. |
| 13 | The annual customer satisfaction survey is conducted online by an independent third party and includes a select group of top customers from each sales segment and region to form a Customer Advisory Council. Customers were asked to commit to participate in annual satisfaction surveys for five years, to ensure consistent measurement and reporting of customer satisfaction. Results are determined by taking a simple average of our individual product quality and customer service scores in fertilizer, feed, industrial nitrogen and purified phosphate. |
| 14 | A complaint occurs when our product does not meet our product specification sheet requirements, our chemical analysis requirements or our physical size specifications (for example, product is undersized, has too many lumps or has too much dust). |
| 15 | The PotashCorp Survey of Community Opinion is conducted annually by an independent third party in the communities where we have significant operations; each community is generally surveyed every three years. Community leaders and representatives are interviewed by telephone and are asked to provide a ranking in three broad areas: perception of community involvement (value to the community, image and communication), business practices (market presence, safety performance and environmental performance) and economic issues (contribution to the local economy and support for expansion). A local option question may be developed to address a specific interest of each community. Each question is rated on a scale of 1 (low) to 5 (high) and results are determined by taking a simple average of the metrics described above. |
| 16 | The full impact of our workforce reduction announced in 2013 will not be reflected until 2014 due to the timing of certain severance processes. |
| 17 | A confidential external survey has been generally administered to every employee every second year to sites on a rotating basis and was administered in 2012. No survey was conducted in 2013 and the company will administer the next survey to all employees in 2014. The employee engagement score represents the proportion of employee responses of “Agree” or “Strongly Agree” to 10 employee engagement statements. |
| 18 | The number of permanent employees who left the company (due to deaths and voluntary and involuntary terminations and excluding retirements) as a percentage of average total employees during the year. Retirements and terminations of temporary employees are excluded. Results in 2013 include a portion of the impact of our announced workforce reduction and the remaining impact will be reflected in 2014. |
| 19 | Based on permanent employees only and excludes employees on long-term disability. |
| 20 | Comprised of waste or byproducts from mining, including: coarse and fine tailings from potash mining, salt as brine to injection wells and gypsum. |
| 21 | Direct energy used is energy consumed by our operations in order to mine, mill and manufacture our products. Energy is used by burning fossil fuels, reforming natural gas and consuming electricity. |
| | |
| 106 | | PotashCorp 2013 Annual Integrated Report |
FINANCIAL TERMS
Adjusted EBITDA = EBITDA + takeover response costs + impairment charges/recoveries – loss (gain) on sale of assets + plant shutdown and closure and workforce reduction costs
Adjusted EBITDA margin = adjusted EBITDA / net sales
Average adjusted assets = simple average of the current year’s adjusted assets and the previous year’s adjusted assets, except when a material acquisition occurred, in which case the weighted average rather than the simple average is calculated; the last material acquisition was in 1997
Cash flow = net income or loss + income taxes + change in unrealized loss (gain) on derivatives included in net income + finance costs – current income taxes + depreciation and amortization + impairment of available-for-sale investment
Cash flow return = cash flow / average (total assets – cash and cash equivalents – fair value of derivative assets + accumulated depreciation and amortization – net unrealized gain on available-for-sale investments – payables and accrued charges)
Current income taxes = current income tax expense (which was already reduced by the realized excess tax benefit related to share-based compensation under previous Canadian GAAP) – realized excess tax benefit related to share-based compensation (under IFRS)
EBITDA = earnings (net income or loss) before finance costs, income taxes, depreciation and amortization
Free cash flow = cash provided by operating activities – additions to property, plant and equipment – other assets and intangible assets – changes in non-cash operating working capital
Market value of total capital = market value of total debt – cash and cash equivalents + market value of equity
Net debt to capital = (total debt – cash and cash equivalents) /(total debt – cash and cash equivalents + total shareholders’ equity)
Net debt to EBITDA = (total debt – cash and cash equivalents) /EBITDA
Net sales = sales – freight, transportation and distribution
Return on assets = net income or loss / total assets
Taxes and royalties = current income tax expense (which was already reduced by the realized excess tax benefit related to share-based compensation under previous Canadian GAAP) – investment tax credits– realized excess tax benefit related to share-based compensation (under IFRS) + potash production tax + resource surcharge + royalties + municipal taxes + other miscellaneous taxes; all amounts calculated on an accrual basis
Total debt to capital = total debt / (total debt + total shareholders’ equity)
Total debt to net income or loss = total debt / net income or loss
Total shareholder return = (end-of-year closing share price less beginning-of-year opening share price + dividends per share paid throughout the year, ex-dividend date) / beginning-of-year opening share price
Weighted average cost of capital = simple monthly average of ((market value of total debt – cash and cash equivalents) / market value of total capital x after-tax cost of debt + market value of equity / market value of total capital x cost of equity)
NON-FINANCIAL TERMS
Community investment = cash disbursements + matching of employee gifts + in-kind contributions of equipment, goods, services and employee volunteerism (on corporate time).
Environmental incidents = reportable quantity releases (a release whose quantity equals or exceeds the US Environmental Protection Agency’s notification level and is reportable to the National Response Center (NRC)) + permit excursions (an exceedance of a federal, state, provincial or local permit condition or regulatory limit) + provincial reportable spills (an unconfined spill or release into the environment).
Total site recordable injury rate = total recordable injuries (fatality, lost-time injury, modified work injury or medical injury) multiplied by 200,000 hours worked divided by the actual number of hours worked. Total site includes PotashCorp employees, contractors and others on site.
Total site severity injury rate = total of lost-time injuries (a lost-time injury occurs when the injured person is unable to return to work on his/her next scheduled workday after the injury) + modified work injuries (a work-related injury where a licensed health care professional or the employer recommends that the employee not perform one or more of the routine functions of the job or not work the full workday that he/she would have otherwise worked) for every 200,000 hours worked. Total site includes PotashCorp employees, contractors and others on site.
| | |
| PotashCorp 2013 Annual Integrated Report | | 107 |

Financials
2013 Consolidated Financial
Statements and Notes
Table of Contents
| 110 | Management’s
Responsibility for
Financial Reporting |
| 111 | Report of Independent
Registered Public
Accounting Firm |
Consolidated Financial Statements
| 113 | Consolidated
Statements of
Financial Position |
| 114 | Consolidated
Statements
of Income |
| 115 | Consolidated
Statements of
Comprehensive
Income |
| 116 | Consolidated
Statements of
Cash Flow |
| 117 | Consolidated
Statements of
Changes in Equity |
Notes to the Consolidated Financial Statements
| 118 | Note 1
Description
of Business |
| 118 | Note 2
Basis of
Presentation |
| 123 | Note 5
Property, Plant
and Equipment |
| 129 | Note 8
Intangible Assets |
| 131 | Note 10
Payables and
Accrued Charges |
| 131 | Note 11
Derivative
Instruments |
| 134 | Note 13
Pension and Other
Post-Retirement
Benefits |
| 140 | Note 14
Provisions for
Asset Retirement,
Environmental and
Other Obligations |
| 144 | Note 16
Segment
Information |
| 147 | Note 17
Nature of Expenses |
| 147 | Note 18
Provincial Mining
and Other Taxes |
| 151 | Note 22
Net Income
per Share |
| 152 | Note 23
Share-Based
Compensation |
| 155 | Note 24
Financial Instruments
and Related Risk
Management |
| 160 | Note 25
Capital
Management |
| 162 | Note 27
Contingencies
and Other Matters |
| 166 | Note 29
Related Party
Transactions |
| 166 | Note 30
Comparative
Figures |
| | |
| PotashCorp 2013 Annual Integrated Report | | 109 |
Management’s Responsibility
MANAGEMENT’S RESPONSIBILITY FOR FINANCIAL REPORTING
Management’s Report on Financial Statements
The accompanying consolidated financial statements and related financial information are the responsibility of PotashCorp management. They have been prepared in accordance with International Financial Reporting Standards as issued by the International Accounting Standards Board and include amounts based on estimates and judgments. Financial information included elsewhere in this report is consistent with the consolidated financial statements.
Our independent registered public accounting firm, Deloitte LLP, provide an audit of the consolidated financial statements, as reflected in their report for 2013 included on Page 112.
The consolidated financial statements are approved by the Board of Directors on the recommendation of the audit committee.
The audit committee of the Board of Directors is composed entirely of independent directors. PotashCorp’s interim condensed consolidated financial statements and MD&A are discussed and analyzed by the audit committee with management and the independent registered public accounting firm before such information is approved by the committee and submitted to securities commissions or other regulatory authorities. The annual consolidated financial statements and MD&A are also analyzed by the audit committee together with management and the independent registered public accounting firm and are approved by the Board of Directors.
In addition, the audit committee has the duty to review critical accounting policies and significant estimates and judgments underlying the consolidated financial statements as presented by management, and to approve the fees of the independent registered public accounting firm.
Deloitte LLP have full and independent access to the audit committee to discuss their audit and related matters.
|
Management’s Report on Internal Control Over Financial Reporting Management is responsible for establishing and maintaining an adequate system of internal control over financial reporting. During the past year, we have directed efforts to improve our internal control over financial reporting. Internal control over financial reporting is a process designed to provide reasonable assurance regarding the reliability of financial reporting and the preparation of consolidated financial statements for external reporting purposes in accordance with International Financial Reporting Standards as issued by the International Accounting Standards Board. Because of its inherent limitations, internal control over financial reporting may not prevent or detect misstatements. Management has assessed the effectiveness of the company’s internal control over financial reporting based on the framework in Internal Control – Integrated Framework (1992) issued by the Committee of Sponsoring Organizations of the Treadway Commission (COSO) and concluded that the company’s internal control over financial reporting was effective as of December 31, 2013. The effectiveness of the company’s internal control over financial reporting as of December 31, 2013 has been audited by Deloitte LLP, as reflected in their report for 2013 included on Page 111. |
| | |

W. Doyle President and Chief Executive Officer February 20, 2014 | | 
W. Brownlee Executive Vice President and Chief Financial Officer |
| | |
| 110 | | PotashCorp 2013 Annual Integrated Report |
Report of Independent Registered
Public Accounting Firm
To the Board of Directors and Shareholders of Potash Corporation of Saskatchewan Inc.
We have audited the internal control over financial reporting of Potash Corporation of Saskatchewan Inc. and subsidiaries (the “Company”)as of December 31, 2013, based on the criteria established in Internal Control – Integrated Framework (1992)issued by the Committee of Sponsoring Organizations of the Treadway Commission. The Company’s management is responsible for maintaining effective internal control over financial reporting and for its assessment of the effectiveness of internal control over financial reporting, included in the accompanying Management’s Report on Internal Control Over Financial Reporting. Our responsibility is to express an opinion on the Company’s internal control over financial reporting based on our audit.
We conducted our audit in accordance with the standards of the Public Company Accounting Oversight Board (United States). Those standards require that we plan and perform the audit to obtain reasonable assurance about whether effective internal control over financial reporting was maintained in all material respects. Our audit included obtaining an understanding of internal control over financial reporting, assessing the risk that a material weakness exists, testing and evaluating the design and operating effectiveness of internal control based on the assessed risk, and performing such other procedures as we considered necessary in the circumstances. We believe that our audit provides a reasonable basis for our opinion.
A company’s internal control over financial reporting is a process designed by, or under the supervision of, the company’s principal executive and principal financial officers, or persons performing similar functions, and effected by the company’s board of directors, management, and other personnel to provide reasonable assurance regarding the reliability of financial reporting and the preparation of financial statements for external purposes in accordance with generally accepted accounting principles. A company’s internal control over financial reporting includes those policies and procedures that (1) pertain to the maintenance of records that, in reasonable detail, accurately and fairly reflect the transactions and dispositions of the assets of the company; (2) provide reasonable assurance that transactions are recorded as necessary to permit preparation of financial statements in accordance with generally accepted accounting principles, and that receipts and expenditures of the company are being made only in accordance with authorizations of management and directors of the company; and (3) provide reasonable assurance regarding prevention or timely detection of unauthorized acquisition, use, or disposition of the company’s assets that could have a material effect on the financial statements.
Because of the inherent limitations of internal control over financial reporting, including the possibility of collusion or improper management override of controls, material misstatements due to error or fraud may not be prevented or detected on a timely basis. Also, projections of any evaluation of the effectiveness of the internal control over financial reporting to future periods are subject to the risk that the controls may become inadequate because of changes in conditions, or that the degree of compliance with the policies or procedures may deteriorate.
In our opinion, the Company maintained, in all material respects, effective internal control over financial reporting as of December 31, 2013, based on the criteria established inInternal Control – Integrated Framework(1992)issued by the Committee of Sponsoring Organizations of the Treadway Commission.
We have also audited, in accordance with the standards of the Public Company Accounting Oversight Board (United States), the consolidated financial statements as of and for the year ended December 31,2013 of the Company and our report dated February 20, 2014 expressed an unqualified opinion on those consolidated financial statements.

Chartered Accountants
Saskatoon, Canada
February 20, 2014
| | |
| PotashCorp 2013 Annual Integrated Report | | 111 |
Report of Independent Registered
Public Accounting Firm
To the Board of Directors and Shareholders of Potash Corporation of Saskatchewan Inc.
We have audited the accompanying consolidated statements of financial position of Potash Corporation of Saskatchewan Inc. and subsidiaries (the “Company”) as of December 31, 2013 and 2012, and the related consolidated statements of income, comprehensive income, cash flow, and changes in equity for each of the three years in the period ended December 31, 2013. These financial statements are the responsibility of the Company’s management. Our responsibility is to express an opinion on these financial statements based on our audits.
We conducted our audits in accordance with the standards of the Public Company Accounting Oversight Board (United States). Those standards require that we plan and perform the audit to obtain reasonable assurance about whether the financial statements are free of material misstatement. An audit includes examining, on a test basis, evidence supporting the amounts and disclosures in the financial statements. An audit also includes assessing the accounting principles used and significant estimates made by management, as well as evaluating the overall financial statement presentation. We believe that our audits provide a reasonable basis for our opinion.
In our opinion, such consolidated financial statements present fairly, in all material respects, the financial position of Potash Corporation of Saskatchewan Inc. and subsidiaries as of December 31, 2013 and 2012, and the results of their operations and their cash flows for each of the three years in the period ended December 31, 2013, in conformity with International Financial Reporting Standards, as issued by the International Accounting Standards Board.
We have also audited, in accordance with the standards of the Public Company Accounting Oversight Board (United States), the Company’s internal control over financial reporting as of December 31, 2013, based on the criteria established inInternal Control – Integrated Framework(1992) issued by the Committee of Sponsoring Organizations of the Treadway Commission and our report dated February 20, 2014 expressed an unqualified opinion on the Company’s internal control over financial reporting.

Chartered Accountants
Saskatoon, Canada
February 20, 2014
| | |
| 112 | | PotashCorp 2013 Annual Integrated Report |
Consolidated Financial Statements
CONSOLIDATED STATEMENTS OF FINANCIAL POSITION
| | | | | | | | | | |
| As at December 31 | | In millions of US dollars | |
| Notes | | | | 2013 | | | 2012 | |
| | Assets | | | | | | | | |
| | Current assets | | | | | | | | |
| | Cash and cash equivalents | | $ | 628 | | | $ | 562 | |
| Note 3 | | Receivables | | | 752 | | | | 1,089 | |
| Note 4 | | Inventories | | | 728 | | | | 762 | |
| | | Prepaid expenses and other current assets | | | 81 | | | | 83 | |
| | | | | 2,189 | | | | 2,496 | |
| | Non-current assets | | | | | | | | |
Note 5 | | Property, plant and equipment | | | 12,233 | | | | 11,505 | |
Note 6 | | Investments in equity-accounted investees | | | 1,276 | | | | 1,254 | |
Note 6 | | Available-for-sale investments | | | 1,722 | | | | 2,481 | |
Note 7 | | Other assets | | | 401 | | | | 344 | |
Note 8 | | Intangible assets | | | 137 | | | | 126 | |
| | | Total Assets | | $ | 17,958 | | | $ | 18,206 | |
| | Liabilities | | | | | | | | |
| | Current liabilities | | | | | | | | |
| Note 9, 12 | | Short-term debt and current portion of long-term debt | | $ | 967 | | | $ | 615 | |
| Note 10 | | Payables and accrued charges | | | 1,104 | | | | 1,188 | |
| Note 11 | | Current portion of derivative instrument liabilities | | | 42 | | | | 51 | |
| | | | | 2,113 | | | | 1,854 | |
| | Non-current liabilities | | | | | | | | |
| Note 12 | | Long-term debt | | | 2,970 | | | | 3,466 | |
| Note 11 | | Derivative instrument liabilities | | | 129 | | | | 167 | |
| Note 21 | | Deferred income tax liabilities | | | 2,013 | | | | 1,482 | |
| Note 13 | | Pension and other post-retirement benefit liabilities | | | 410 | | | | 569 | |
| Note 14 | | Asset retirement obligations and accrued environmental costs | | | 557 | | | | 645 | |
| | | Other non-current liabilities and deferred credits | | | 138 | | | | 111 | |
| | | Total Liabilities | | | 8,330 | | | | 8,294 | |
| | Shareholders’ Equity | | | | | | | | |
Note 15 | | Share capital | | | 1,600 | | | | 1,543 | |
| | Contributed surplus | | | 219 | | | | 299 | |
| | Accumulated other comprehensive income | | | 673 | | | | 1,399 | |
| | | Retained earnings | | | 7,136 | | | | 6,671 | |
| | | Total Shareholders’ Equity | | | 9,628 | | | | 9,912 | |
| | | Total Liabilities and Shareholders’ Equity | | $ | 17,958 | | | $ | 18,206 | |
(See Notes to the Consolidated Financial Statements)
Approved by the Board of Directors,
| | |

| | 
|
| |
| Director | | Director |
| |
| | |
| | |
| PotashCorp 2013 Annual Integrated Report | | 113 |
CONSOLIDATED STATEMENTS OF INCOME
| | | | | | | | | | | | | | |
| For the years ended December 31 | | In millions of US dollars except per-share amounts | |
| Notes | | | | 2013 | | | 2012 | | | 2011 | |
| Note 16 | | Sales | | $ | 7,305 | | | $ | 7,927 | | | $ | 8,715 | |
| | Freight, transportation and distribution | | | (572 | ) | | | (494 | ) | | | (496 | ) |
| Note 17 | | Cost of goods sold | | | (3,943 | ) | | | (4,023 | ) | | | (3,933 | ) |
| | Gross Margin | | | 2,790 | | | | 3,410 | | | | 4,286 | |
| | | | |
| Note 17 | | Selling and administrative expenses | | | (231 | ) | | | (219 | ) | | | (217 | ) |
| Note 18 | | Provincial mining and other taxes | | | (194 | ) | | | (180 | ) | | | (147 | ) |
| | Share of earnings of equity-accounted investees | | | 195 | | | | 278 | | | | 261 | |
| | Dividend income | | | 92 | | | | 144 | | | | 136 | |
| Note 6 | | Impairment of available-for-sale investment | | | – | | | | (341 | ) | | | – | |
| Note 19 | | Other expenses | | | (36 | ) | | | (73 | ) | | | (13 | ) |
| | | | |
| | Operating Income | | | 2,616 | | | | 3,019 | | | | 4,306 | |
| Note 20 | | Finance costs | | | (144 | ) | | | (114 | ) | | | (159 | ) |
| | | | |
| | Income Before Income Taxes | | | 2,472 | | | | 2,905 | | | | 4,147 | |
| Note 21 | | Income taxes | | | (687 | ) | | | (826 | ) | | | (1,066 | ) |
| | | | |
| | | Net Income | | $ | 1,785 | | | $ | 2,079 | | | $ | 3,081 | |
| | | | |
| Note 22 | | Net Income per Share – Basic | | $ | 2.06 | | | $ | 2.42 | | | $ | 3.60 | |
| | | | |
| Note 22 | | Net Income per Share – Diluted | | $ | 2.04 | | | $ | 2.37 | | | $ | 3.51 | |
| | | | |
| | | Dividends Declared per Share | | $ | 1.33 | | | $ | 0.70 | | | $ | 0.28 | |
(See Notes to the Consolidated Financial Statements)
| | |
| 114 | | PotashCorp 2013 Annual Integrated Report |
CONSOLIDATED STATEMENTS OF COMPREHENSIVE INCOME
| | | | | | | | | | | | |
| For the years ended December 31 | | In millions of US dollars | |
| (Net of related income taxes) | | 2013 | | | 2012 | | | 2011 | |
| Net Income | | $ | 1,785 | | | $ | 2,079 | | | $ | 3,081 | |
Other comprehensive (loss) income | | | | | | | | | | | | |
Items that will not be reclassified to net income: | | | | | | | | | | | | |
Net actuarial gain (loss) on defined benefit plans1 | | | 164 | | | | (62 | ) | | | (136 | ) |
Items that may be reclassified subsequently to net income: | | | | | | | | | | | | |
Available-for-sale investments2 | | | | | | | | | | | | |
Net fair value (loss) gain during the year | | | (759 | ) | | | 216 | | | | (1,581 | ) |
Reclassification to income of unrealized loss on impaired investment (Note 6) | | | – | | | | 341 | | | | – | |
Cash flow hedges | | | | | | | | | | | | |
Net fair value loss during the year3 | | | – | | | | (20 | ) | | | (38 | ) |
Reclassification to income of net loss4 | | | 33 | | | | 50 | | | | 47 | |
Other | | | – | | | | (4 | ) | | | (6 | ) |
| Other Comprehensive (Loss) Income | | | (562 | ) | | | 521 | | | | (1,714 | ) |
| Comprehensive Income | | $ | 1,223 | | | $ | 2,600 | | | $ | 1,367 | |
| 1 | Net of income taxes of $(92) (2012 – $31, 2011 – $75). |
| 2 | Available-for-sale investments are comprised of shares in Israel Chemicals Ltd. and Sinofert Holdings Limited. |
| 3 | Cash flow hedges are comprised of natural gas derivative instruments and were net of income taxes of $NIL (2012 – $7, 2011 – $24). |
| 4 | Net of income taxes of $(18) (2012 – $(32), 2011 – $(29)). |
(See Notes to the Consolidated Financial Statements)
| | |
| PotashCorp 2013 Annual Integrated Report | | 115 |
CONSOLIDATED STATEMENTS OF CASH FLOW
| | | | | | | | | | | | | | | | | | | | | | | | |
| For the years ended December 31 | | | | | In millions of US dollars | |
| | | | | | 2013 | | | | | | 2012 | | | | | | 2011 | |
Operating Activities | | | | | | | | | | | | | | | | | | | | | | | | |
Net income | | | | | | $ | 1,785 | | | | | | | $ | 2,079 | | | | | | | $ | 3,081 | |
| Adjustments to reconcile net income to cash provided by operating activities | | | | | | | | | | | | | | | | | | | | | | | | |
Depreciation and amortization | | | 666 | | | | | | | | 578 | | | | | | | | 489 | | | | | |
Share-based compensation | | | 27 | | | | | | | | 24 | | | | | | | | 24 | | | | | |
Net undistributed earnings of equity-accounted investees | | | (15 | ) | | | | | | | (67 | ) | | | | | | | (133 | ) | | | | |
Impairment of available-for-sale investment (Note 6) | | | – | | | | | | | | 341 | | | | | | | | – | | | | | |
Realized excess tax benefit related to share-based compensation | | | 18 | | | | | | | | 30 | | | | | | | | 29 | | | | | |
Provision for deferred income tax | | | 397 | | | | | | | | 392 | | | | | | | | 337 | | | | | |
Pension and other post-retirement benefits | | | (16 | ) | | | | | | | (68 | ) | | | | | | | (122 | ) | | | | |
Asset retirement obligations and accrued environmental costs | | | (2 | ) | | | | | | | (2 | ) | | | | | | | 39 | | | | | |
Other long-term liabilities and miscellaneous | | | 67 | | | | | | | | 51 | | | | | | | | (40 | ) | | | | |
| | | | | | | | | | | | | | | | | | | | | | | | |
Subtotal of adjustments | | | | | | | 1,142 | | | | | | | | 1,279 | | | | | | | | 623 | |
Changes in non-cash operating working capital | | | | | | | | | | | | | | | | | | | | | | | | |
Receivables | | | 276 | | | | | | | | 188 | | | | | | | | (155 | ) | | | | |
Inventories | | | 28 | | | | | | | | (7 | ) | | | | | | | (146 | ) | | | | |
Prepaid expenses and other current assets | | | (1 | ) | | | | | | | (32 | ) | | | | | | | (1 | ) | | | | |
Payables and accrued charges | | | (18 | ) | | | | | | | (282 | ) | | | | | | | 83 | | | | | |
| | | | | | | | | | | | | | | | | | | | | | | | |
Subtotal of changes in non-cash operating working capital | | | | | | | 285 | | | | | | | | (133 | ) | | | | | | | (219 | ) |
Cash provided by operating activities | | | | | | | 3,212 | | | | | | | | 3,225 | | | | | | | | 3,485 | |
Investing Activities | | | | | | | | | | | | | | | | | | | | | | | | |
Additions to property, plant and equipment | | | | | | | (1,624 | ) | | | | | | | (2,133 | ) | | | | | | | (2,176 | ) |
Other assets and intangible assets | | | | | | | – | | | | | | | | (71 | ) | | | | | | | (75 | ) |
Cash used in investing activities | | | | | | | (1,624 | ) | | | | | | | (2,204 | ) | | | | | | | (2,251 | ) |
Financing Activities | | | | | | | | | | | | | | | | | | | | | | | | |
Repayment of and finance costs on long-term debt obligations | | | | | | | (254 | ) | | | | | | | (2 | ) | | | | | | | (607 | ) |
Proceeds from (repayment of) short-term debt obligations | | | | | | | 101 | | | | | | | | (460 | ) | | | | | | | (445 | ) |
Dividends | | | | | | | (997 | ) | | | | | | | (467 | ) | | | | | | | (208 | ) |
Repurchase of common shares | | | | | | | (411 | ) | | | | | | | – | | | | | | | | – | |
Issuance of common shares | | | | | | | 39 | | | | | | | | 40 | | | | | | | | 44 | |
Cash used in financing activities | | | | | | | (1,522 | ) | | | | | | | (889 | ) | | | | | | | (1,216 | ) |
Increase in Cash and Cash Equivalents | | | | | | | 66 | | | | | | | | 132 | | | | | | | | 18 | |
Cash and Cash Equivalents, Beginning of Year | | | | | | | 562 | | | | | | | | 430 | | | | | | | | 412 | |
| Cash and Cash Equivalents, End of Year | | | | | | $ | 628 | | | | | | | $ | 562 | | | | | | | $ | 430 | |
Cash and cash equivalents comprised of: | | | | | | | | | | | | | | | | | | | | | | | | |
Cash | | | | | | $ | 129 | | | | | | | $ | 64 | | | | | | | $ | 46 | |
Short-term investments | | | | | | | 499 | | | | | | | | 498 | | | | | | | | 384 | |
| | | | | | | $ | 628 | | | | | | | $ | 562 | | | | | | | $ | 430 | |
Supplemental cash flow disclosure | | | | | | | | | | | | | | | | | | | | | | | | |
Interest paid | | | | | | $ | 191 | | | | | | | $ | 209 | | | | | | | $ | 233 | |
Income taxes paid | | | | | | $ | 189 | | | | | | | $ | 676 | | | | | | | $ | 623 | |
(See Notes to the Consolidated Financial Statements)
| | |
| 116 | | PotashCorp 2013 Annual Integrated Report |
CONSOLIDATED STATEMENTS OF CHANGES IN EQUITY
| | | | | | | | | | | | | | | | | | | | | | | | | | | | | | | | | | | | |
| In millions of US dollars | |
| | | Equity Attributable to Common Shareholders 1 | |
| | | | | | | | | Accumulated Other Comprehensive Income | | | | | | | |
| | | Share
Capital | | | Contributed
Surplus | | | Net
unrealized
gain on
available- for-sale
investments | | | Net
loss on
derivatives
designated as
cash flow
hedges | | | Net
actuarial
(loss) gain on
defined
benefit
plans | | | Other | | | Total
Accumulated
Other
Comprehensive
Income | | | Retained
Earnings | | | Total
Equity | |
Balance – December 31, 2010 | | $ | 1,431 | | | $ | 308 | | | $ | 2,563 | | | $ | (177 | ) | | $ | – | 2 | | $ | 8 | | | $ | 2,394 | | | $ | 2,552 | | | $ | 6,685 | |
Net income | | | – | | | | – | | | | – | | | | – | | | | – | | | | – | | | | – | | | | 3,081 | | | | 3,081 | |
Other comprehensive (loss) income | | | – | | | | – | | | | (1,581 | ) | | | 9 | | | | (136 | ) | | | (6 | ) | | | (1,714 | ) | | | – | | | | (1,714 | ) |
Dividends declared | | | – | | | | – | | | | – | | | | – | | | | – | | | | – | | | | – | | | | (240 | ) | | | (240 | ) |
Effect of share-based compensation including issuance of common shares | | | 48 | | | | (17 | ) | | | – | | | | – | | | | – | | | | – | | | | – | | | | – | | | | 31 | |
Shares issued for dividend reinvestment plan | | | 4 | | | | – | | | | – | | | | – | | | | – | | | | – | | | | – | | | | – | | | | 4 | |
Transfer of net actuarial loss on defined benefit plans | | | – | | | | – | | | | – | | | | – | | | | 136 | | | | – | | | | 136 | | | | (136 | ) | | | – | |
Balance – December 31, 2011 | | $ | 1,483 | | | $ | 291 | | | $ | 982 | | | $ | (168 | ) | | $ | – | 2 | | $ | 2 | | | $ | 816 | | | $ | 5,257 | | | $ | 7,847 | |
Net income | | | – | | | | – | | | | – | | | | – | | | | – | | | | – | | | | – | | | | 2,079 | | | | 2,079 | |
Other comprehensive income (loss) | | | – | | | | – | | | | 557 | | | | 30 | | | | (62 | ) | | | (4 | ) | | | 521 | | | | – | | | | 521 | |
Dividends declared | | | – | | | | – | | | | – | | | | – | | | | – | | | | – | | | | – | | | | (603 | ) | | | (603 | ) |
Effect of share-based compensation including issuance of common shares | | | 47 | | | | 8 | | | | – | | | | – | | | | – | | | | – | | | | – | | | | – | | | | 55 | |
Shares issued for dividend reinvestment plan | | | 13 | | | | – | | | | – | | | | – | | | | – | | | | – | | | | – | | | | – | | | | 13 | |
Transfer of net actuarial loss on defined benefit plans | | | – | | | | – | | | | – | | | | – | | | | 62 | | | | – | | | | 62 | | | | (62 | ) | | | – | |
Balance – December 31, 2012 | | $ | 1,543 | | | $ | 299 | | | $ | 1,539 | | | $ | (138 | ) | | $ | – | 2 | | $ | (2 | ) | | $ | 1,399 | | | $ | 6,671 | | | $ | 9,912 | |
Net income | | | – | | | | – | | | | – | | | | – | | | | – | | | | – | | | | – | | | | 1,785 | | | | 1,785 | |
Other comprehensive (loss) income | | | – | | | | – | | | | (759 | ) | | | 33 | | | | 164 | | | | – | | | | (562 | ) | | | – | | | | (562 | ) |
Share repurchase (Note 15) | | | (25 | ) | | | (82 | ) | | | – | | | | – | | | | – | | | | – | | | | – | | | | (338 | ) | | | (445 | ) |
Dividends declared | | | – | | | | – | | | | – | | | | – | | | | – | | | | – | | | | – | | | | (1,146 | ) | | | (1,146 | ) |
Effect of share-based compensation including issuance of common shares | | | 52 | | | | 2 | | | | – | | | | – | | | | – | | | | – | | | | – | | | | – | | | | 54 | |
Shares issued for dividend reinvestment plan | | | 30 | | | | – | | | | – | | | | – | | | | – | | | | – | | | | – | | | | – | | | | 30 | |
Transfer of net actuarial gain on defined benefit plans | | | – | | | | – | | | | – | | | | – | | | | (164 | ) | | | – | | | | (164 | ) | | | 164 | | | | – | |
| Balance – December 31, 2013 | | $ | 1,600 | | | $ | 219 | | | $ | 780 | | | $ | (105 | ) | | $ | – | 2 | | $ | (2 | ) | | $ | 673 | | | $ | 7,136 | | | $ | 9,628 | |
| 1 | All equity transactions were attributable to common shareholders. |
| 2 | Any amounts incurred during a period were closed out to retained earnings at each period-end. Therefore, no balance exists at the beginning or end of period. |
(See Notes to the Consolidated Financial Statements)
| | |
| PotashCorp 2013 Annual Integrated Report | | 117 |
| | |
| Notes to the consolidated financial statements | | In millions of US dollars except as otherwise noted |
| NOTE 1 | DESCRIPTION OF BUSINESS |
With its subsidiaries, Potash Corporation of Saskatchewan Inc. (“PCS”) – together known as “PotashCorp” or “the company” except to the extent the context otherwise requires – forms an integrated fertilizer and related industrial and feed products company. At December 31, 2013, the company had producing assets as follows:
| | – | | five mines and mills in the province of Saskatchewan |
| | – | | one mine and mill in the province of New Brunswick |
| | – | | three plants, one located in each of the states of Georgia, Louisiana and Ohio |
| | – | | large-scale operations in Trinidad |
| | – | | a mine and processing plants in the state of North Carolina |
| | – | | a mine and two processing plants in the state of Florida |
| | – | | a processing plant in the state of Louisiana |
| | – | | phosphate feed plants in the states of Nebraska, Illinois, Missouri, North Carolina and Florida |
| | – | | an industrial phosphoric acid plant in the state of Ohio |
Previously, the company also had an agreement regarding mining rights to potash reserves at a sixth location in Saskatchewan that expired December 31, 2012.
In North America, the company leased or owned 236 terminal and warehouse facilities at December 31, 2013, some of which have multi-product capability, for a total of 317 distribution points, and serviced customers with a fleet of approximately 9,922 railcars. In the offshore market, it leased one warehouse in China and one in Malaysia and had ownership in a joint venture which leases a dry bulk fertilizer port terminal in Brazil.
PotashCorp sells potash from its Saskatchewan mines for use outside North America exclusively to Canpotex Limited (“Canpotex”). A potash export, sales and marketing company owned in equal shares by the three producers in Saskatchewan (including the company), Canpotex resells potash to offshore customers. PCS Sales (Canada) Inc. and PCS Sales (USA), Inc., wholly owned subsidiaries of PCS, execute marketing and sales for the company’s potash, nitrogen and phosphate products in North America and offshore marketing and sales for the company’s New Brunswick potash. Phosphate Chemicals Export Association, Inc. (“PhosChem”), a phosphate export association established under US law, was the principal vehicle through which the company executed offshore marketing and sales for its solid phosphate fertilizers. Membership with PhosChem was terminated effective December 31, 2013. PCS Sales (USA), Inc. generally handled offshore marketing and sales for the company’s nitrogen products, feed phosphate and liquid phosphate fertilizers in 2013, and will also handle the company’s solid phosphate fertilizers commencing in 2014.
| NOTE 2 | BASIS OF PRESENTATION |
These consolidated financial statements have been prepared in accordance with International Financial Reporting Standards, as issued by the International Accounting Standards Board (“IFRS”). The company has consistently applied the same accounting policies throughout all periods presented, as if these policies had always been in effect.
The company is a foreign private issuer in the US that voluntarily files its consolidated financial statements with the Securities and Exchange Commission (the “SEC”) on US domestic filer forms. In addition, the company is permitted to file with the SEC its audited consolidated financial statements under IFRS without a reconciliation to US generally accepted accounting principles (“US GAAP”). As a result, the company does not prepare a reconciliation of its results to US GAAP. It is possible that certain of the company’s accounting policies could be different from US GAAP.
These consolidated financial statements were authorized by the Board of Directors for issue on February 20, 2014.
These consolidated financial statements were prepared under the historical cost convention, except for certain items not carried at historical cost as discussed in the applicable accounting policies.
ACCOUNTING POLICIES
Principles of consolidation
These consolidated financial statements include the accounts of the company and entities controlled by it (its subsidiaries). Control is achieved by having each of: power over the investee via existing rights that give the company the current ability to direct the relevant activities of the investee; exposure, or rights, to variable returns from involvement with the investee; and the ability for the company to use its power over the investee to affect the amount of the company’s returns. The existence and effect of potential voting rights that are currently exercisable or convertible are considered when assessing whether the company controls another entity.
Subsidiaries are fully consolidated from the date on which control is transferred to the company. They are deconsolidated from the date that control ceases. Principal (wholly owned) operating subsidiaries are:
| • | | PCS Sales (Canada) Inc. |
| | – | | PCS Joint Venture, Ltd. (“PCS Joint Venture”) |
| • | | PCS Phosphate Company, Inc. (“PCS Phosphate”) |
| | – | | PCS Purified Phosphates |
| • | | White Springs Agricultural Chemicals, Inc. (“White Springs”) |
| | |
| 118 | | PotashCorp 2013 Annual Integrated Report |
| | |
| Notes to the consolidated financial statements | | In millions of US dollars except as otherwise noted |
| Note 2 | Basis of presentationcontinued |
| • | | PCS Nitrogen Fertilizer, L.P. |
| • | | PCS Nitrogen Ohio, L.P. |
| • | | PCS Nitrogen Trinidad Limited |
| • | | PCS Cassidy Lake Company |
Intercompany balances and transactions are eliminated on consolidation.
Fair value measurements
Fair value is the price that would be received to sell an asset or paid to transfer a liability in an orderly transaction between market participants at the measurement date, regardless of whether that price is directly observable or estimated using another valuation technique. For financial reporting purposes, fair value measurements are categorized into Level 1, 2 or 3 based on the degree to which the inputs to the fair value measurement are observable and the significance of the inputs. The company’s fair value hierarchy prioritizes the inputs to valuation techniques used to measure fair value.
The three levels of the fair value hierarchy are:
| Level 1 | | Values based on unadjusted quoted prices in active markets that are accessible at the measurement date for identical assets or liabilities. |
| Level 2 | | Values based on quoted prices in markets that are not active or model inputs that are observable either directly or indirectly for substantially the full term of the asset or liability. |
| Level 3 | | Values based on prices or valuation techniques that require inputs which are both unobservable and significant to the overall fair value measurement. |
Foreign currency transactions
Items included in the consolidated financial statements of the company and each of its subsidiaries are measured using the currency of the primary economic environment in which the individual entity operates (“the functional currency”). The consolidated financial statements are presented in United States dollars (“US dollars”), which is the functional currency of the company and the majority of its subsidiaries.
Foreign currency transactions, including Canadian, Trinidadian and Chilean currency operating transactions, are generally translated to US dollars at the average exchange rate for the previous month. Monetary assets and liabilities are translated at period-end exchange rates. Foreign exchange gains and losses resulting from the settlement of such transactions, and from the translation at period-end exchange rates of monetary assets and liabilities denominated in foreign currencies, are recognized in net income in the period in which they arise. Foreign exchange gains and losses are presented in the statements of income within other income or other expenses as applicable.
Translation differences on non-monetary assets and liabilities carried at fair value are recognized as part of changes in fair value. Translation differences on non-monetary financial assets such as investments in equity securities classified as available-for-sale are included in other comprehensive income (“OCI”).
Cash equivalents
Highly liquid investments with a maturity of three months or less from the date of purchase are considered to be cash equivalents.
Prepaid expenses
The company has classified freight and other transportation and distribution costs incurred relating to product inventory stored at warehouse and terminal facilities as prepaid expenses.
Long-lived asset impairment
Assets that have an indefinite useful life (i.e., goodwill) are not subject to amortization and are tested at least annually for impairment (typically in the second quarter), or more frequently if events or circumstances indicate there may be an impairment. At the end of each reporting period, the company reviews the carrying amounts of both its long-lived assets to be held and used and its identifiable intangible assets with finite lives to determine whether there is any indication that they have suffered an impairment loss. For assessing impairment, assets are grouped at the smallest levels for which there are separately identifiable cash inflows which are largely independent of the cash inflows from other assets or groups of assets (this can be at the asset or cash-generating unit (“CGU”) level). If an indication of impairment exists, the recoverable amount of the asset or CGU is estimated in order to determine the extent of the impairment loss (if any). An impairment loss is recognized as the amount by which the asset’s or CGU’s carrying amount exceeds its recoverable amount. If the recoverable amount of the CGU is less than its carrying amount, the impairment loss is allocated first to reduce the carrying amount of any goodwill allocated to the CGU and then to the other assets of the CGU pro rata on the basis of the carrying amount of each asset in the unit. The recoverable amount is the higher of an asset’s or CGU’s fair value less costs to sell and value in use. In assessing value in use, the estimated future cash flows are discounted to their present value using a pre-tax discount rate that reflects current market assessments of the time value of money and the risks specific to the asset or CGU for which the estimates of future cash flows have not been adjusted. Non-financial assets, other than goodwill, that previously suffered an impairment loss are reviewed for possible reversal of the impairment at each reporting date.
ACCOUNTING ESTIMATES AND JUDGMENTS
Certain of the company’s policies involve accounting estimates and judgments because they require the company to make subjective or complex judgments about matters that are inherently uncertain and because of the likelihood that materially different amounts could be reported under different conditions or using different assumptions.
The following section discusses the accounting estimates, judgments and assumptions that the company has made and how they affect the amounts reported in the consolidated financial statements.
| | |
| PotashCorp 2013 Annual Integrated Report | | 119 |
| | |
| Notes to the consolidated financial statements | | In millions of US dollars except as otherwise noted |
| Note 2 | Basis of presentationcontinued |
Principles of consolidation
Assessing whether the company controls certain investees involves determining if the company has the power to direct the relevant activities of the investee. Determining the relevant activities and which party controls them, if any, involves judgment. In making judgments and assessing the substance of the relationship, consideration is given to voting rights, the relative size and dispersion of the voting rights held by other shareholders, the extent of participation by those shareholders in appointing key management personnel or board members, the right to direct the investee to enter into transactions for the company’s benefit and the exposure, or rights, to variability of returns from the company’s involvement with the investee.
Long-lived asset impairment
The impairment process begins with the identification of the appropriate asset or CGU for purposes of impairment testing. Identification and measurement of any impairment are based on the asset’s recoverable amount, which is the higher of its fair value less costs to sell and its value in use. Value in use is generally based on an estimate of discounted future cash flows. Judgment is required in determining the appropriate discount rate. Assumptions must also be made about future sales, margins and market conditions over the long-term life of the assets or CGUs.
The company cannot predict if an event that triggers impairment will occur, when it will occur or how it will affect reported asset amounts. The company makes estimates which are subject to significant uncertainties and judgments.
As a result, it is reasonably possible that the amounts reported for asset impairments could be different if different assumptions were used or if market and other conditions change. The changes could result in non-cash charges that could materially affect the company’s consolidated financial statements.
Fair value measurements
Fair value represents point-in-time estimates that may change in subsequent reporting periods due to market conditions or other factors. Multiple methods exist by which fair value can be determined, which can cause values (or a range of reasonable values) to differ. Further, assumptions underlying the valuations may require estimation of costs/prices over time, discount rates, inflation rates, defaults and other relevant variables.
Judgment and estimation are required to determine in which category of the three-level hierarchy items should be included. Categorization is based on the company’s assessment of the lowest-level input that is the most significant to the fair value measurement.
Restructuring charges
Plant shutdowns, sales of business units or other corporate restructurings may trigger incremental costs to the company such as expenses for employee termination, contract termination and other exit costs. Because such activities are complex processes that can take several months to complete, they involve making and reassessing estimates.
ADDITIONAL ACCOUNTING POLICIES, ESTIMATES AND JUDGMENTS
To facilitate a better understanding of the company’s consolidated financial statements, significant accounting policies, estimates and judgments (with the exception of those identified in this Note 2) are disclosed throughout the following notes, with the related financial disclosures by major caption:
| | | | | | | | |
| Note | | Topic | | Accounting
Policies | | Accounting Estimates
and Judgments | | Page |
| 3 | | Receivables | | X | | | | 122 |
| 4 | | Inventories | | X | | | | 123 |
| 5 | | Property, plant and equipment | | X | | X | | 123 |
| 6 | | Investments | | X | | X | | 126 |
| 7 | | Other assets | | | | X | | 128 |
| 8 | | Intangible assets | | X | | X | | 129 |
| 11 | | Derivative instruments | | X | | X | | 131 |
| 12 | | Long-term debt | | X | | | | 133 |
| 13 | | Pension and other post-retirement benefits | | X | | X | | 134 |
| 14 | | Provisions for asset retirement, environmental and other obligations | | X | | X | | 140 |
| 16 | | Revenue recognition | | X | | X | | 144 |
| 17 | | Cost of goods sold | | X | | | | 147 |
| 17 | | Selling and administrative expenses | | X | | | | 147 |
| 21 | | Income taxes | | X | | X | | 148 |
| 23 | | Share-based compensation | | X | | X | | 152 |
| 24 | | Fair value of financial instruments | | X | | | | 155 |
| 26 | | Commitments | | X | | X | | 161 |
| 27 | | Contingencies | | X | | X | | 162 |
| 28 | | Guarantees | | X | | | | 165 |
| 29 | | Related party transactions | | X | | | | 166 |
| | |
| 120 | | PotashCorp 2013 Annual Integrated Report |
| | |
| Notes to the consolidated financial statements | | In millions of US dollars except as otherwise noted |
| Note 2 | Basis of presentationcontinued |
STANDARDS, AMENDMENTS AND INTERPRETATIONS EFFECTIVE AND APPLIED
The International Accounting Standards Board (“IASB”) and International Financial Reporting Interpretations Committee (“IFRIC”) have issued the following standards and amendments or interpretations to existing standards that were effective and applied by the company.
| | | | |
| Standard | | Description | | Impact |
Amendments to IAS 1, Presentation of Financial Statements | | Amendments require items within other comprehensive income (“OCI”) that may be reclassified to the profit or loss section of the income statement to be grouped together. | | Adopted retrospectively effective January 1, 2013. The format of the company’s consolidated statements of comprehensive income has changed. Prior periods’ figures have been reclassified to conform with the current period’s presentation. |
| Amendments to IFRS 7, Financial Instruments: Disclosures | | Issued as part of its offsetting project, addresses common disclosure requirements related to financial instruments. | | Adopted retrospectively effective January 1, 2013. Applicable disclosures are included in Notes 12 and 24 to these consolidated financial statements. |
| IFRS 10, Consolidated Financial Statements | | Builds on existing principles by identifying the concept of control as the determining factor in whether an entity should be included within the consolidated financial statements of the parent company. | | Adopted retrospectively effective January 1, 2013 with no change to these consolidated financial statements. |
| IFRS 11, Joint Arrangements | | Removes a choice in accounting method and requires equity accounting for participants in joint ventures. Also focuses on the rights and obligations of an arrangement rather than its legal form. | | Adopted prospectively effective January 1, 2013 with no change to these consolidated financial statements. |
| IFRS 12, Disclosure of Interests in Other Entities | | Establishes a new and comprehensive standard on disclosure requirements for all forms of interest in other entities, including subsidiaries, joint arrangements, associates and unconsolidated structured entities. | | Adopted prospectively effective January 1, 2013. Applicable disclosures are included in Notes 2 and 6 to these consolidated financial statements. |
| IFRS 13, Fair Value Measurement | | Establishes a single framework for measuring fair value and introduces consistent disclosure requirements on fair value measurements. | | Adopted prospectively effective January 1, 2013. Applicable disclosures are included in Notes 2, 6, 11 and 24 to these consolidated financial statements. |
| Amendments to IAS 19, Employee Benefits | | Introduces changes relating to the recognition, measurement, presentation and disclosure of post-employment benefits. The amendment also changes the accounting for termination benefits and short-term employment benefits, along with other minor clarifications. | | Adopted prospectively effective January 1, 2013. The amendments resulted in changes in accounting policy. Previously, the company calculated interest costs on the defined benefit obligation and the expected return on plan assets, and included such amounts within employee costs in cost of goods sold or selling and administrative expenses, as applicable. The net interest cost is now calculated on the net funded status and included in finance costs. Previously, vested past service cost was recognized immediately and unvested past service cost was amortized on a straight-line basis over the average period until the benefits became vested. All past service cost is now recognized immediately. Actuarial gains and losses will continue to be recognized in OCI, and closed out to retained earnings each period. Applicable disclosures are included in Note 13 to these consolidated financial statements. |
| IFRIC 20, Stripping Costs in the Production Phase of a Surface Mine | | Clarifies the requirements for accounting for stripping costs in the production phase of a surface mine. | | Adopted retrospectively effective January 1, 2013 with no change to these consolidated financial statements. |
| | |
| PotashCorp 2013 Annual Integrated Report | | 121 |
| | |
| Notes to the consolidated financial statements | | In millions of US dollars except as otherwise noted |
| Note 2 | Basis of presentationcontinued |
STANDARDS, AMENDMENTS AND INTERPRETATIONS NOT YET EFFECTIVE AND NOT APPLIED
The IASB and IFRIC have issued the following standards and amendments or interpretations to existing standards that were not yet effective and not applied at December 31, 2013. The company does not anticipate early adoption of these standards at this time.
| | | | | | |
| Standard | | Description | | Impact | | Effective Date 1 |
| Amendments to IAS 32, Offsetting Financial Assets and Financial Liabilities | | Issued as part of IASB’s offsetting project, amendments clarify certain items regarding offsetting financial assets and financial liabilities. | | The company is reviewing the standard to determine the potential impact, if any; however, no significant impact is anticipated. | | January 1, 2014, applied retrospectively. |
| Amendments to IAS 36, Recoverable Amount Disclosures for Non-Financial Assets | | Amendments were issued that clarify disclosure requirements for the recoverable amount of an asset or CGU. | | The company is reviewing the standard to determine the potential impact, if any; however, no significant impact is anticipated. | | January 1, 2014, applied retrospectively. |
| IFRIC 21, Levies | | Provides guidance on when to recognize a liability for a levy imposed by a government. | | The company is reviewing the interpretation to determine the potential impact, if any. | | January 1, 2014, applied retrospectively. |
| Amendments to IAS 19, Employee Benefits | | Issued to simplify the accounting for employee or third-party contributions to defined benefit plans that are independent of the number of years of employee service. | | The company is reviewing the standard to determine the potential impact, if any. | | July 1, 2014, applied retrospectively. |
| IFRS 9, Financial Instruments | | Initially issued guidance on the classification and measurement of financial assets. Additional guidance was issued on the classification and measurement of financial liabilities. Additional amendments were issued which introduce a new hedge accounting model and modify the requirements for transition from IAS 39 to IFRS 9. The IASB tentatively decided to defer the mandatory effective date (announced as part of the Limited Amendments to IFRS 9 project) pending the finalization of the impairment and classification and measurement requirements. | | The company is reviewing the standard to determine the potential impact, if any. | | Pending IASB decision. |
| 1 | Effective date for annual periods beginning on or after the stated date. |
ACCOUNTING POLICIES
Trade receivables are recognized initially at fair value and subsequently measured at amortized cost less provision for impairment of trade accounts receivable. Such a provision is established when there is reasonable expectation that the company will not be able to collect all amounts due. Any increase in the provision is recognized in the consolidated statements of income. When a trade receivable is uncollectible, it is written off against the provision for impairment account for trade accounts receivable. Subsequent recoveries of amounts previously written off are credited to the consolidated statements of income.
SUPPORTING INFORMATION
| | | | | | | | |
| | | | 2013 | | | | 2012 | |
Trade accounts – Canpotex (Note 29) | | $ | 166 | | | $ | 251 | |
– Other | | | 341 | | | | 473 | |
Less provision for impairment of trade accounts receivable | | | (7 | ) | | | (8 | ) |
| | | 500 | | | | 716 | |
Margin deposits on derivative instruments (Note 24) | | | 114 | | | | 150 | |
Income taxes receivable (Note 21) | | | 90 | | | | 124 | |
GST and VAT receivable | | | 17 | | | | 28 | |
Provincial mining and other taxes receivable | | | – | | | | 23 | |
Other non-trade accounts | | | 31 | | | | 48 | |
| | | $ | 752 | | | $ | 1,089 | |
| | |
| 122 | | PotashCorp 2013 Annual Integrated Report |
| | |
| Notes to the consolidated financial statements | | In millions of US dollars except as otherwise noted |
ACCOUNTING POLICIES
Inventories are valued at the lower of cost and net realizable value. Costs, allocated to inventory using the weighted average cost method, include direct acquisition costs, direct costs related to the units of production and a systematic allocation of fixed and variable production overhead, as applicable. Net realizable value for finished products, intermediate products and raw materials is generally considered to be the selling price of the finished product in the ordinary course of business less the estimated costs of completion and estimated costs to make the sale. In certain circumstances, particularly pertaining to the company’s materials and supplies inventories, replacement cost is considered to be the best available measure of net realizable value. Inventory is reviewed monthly to ensure the carrying value does not exceed net realizable value. If so, a writedown is recognized. The writedown may be reversed if the circumstances which caused it no longer exist.
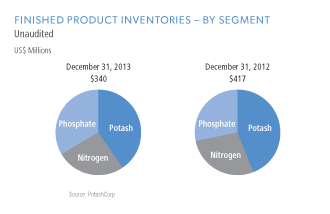
SUPPORTING INFORMATION
Inventories at December 31 were comprised of:
| | | | | | | | |
| | | 2013 | | | 2012 | |
Finished products | | $ | 340 | | | $ | 417 | |
Intermediate products | | | 85 | | | | 82 | |
Raw materials | | | 101 | | | | 91 | |
Materials and supplies | | | 202 | | | | 172 | |
| | | $ | 728 | | | $ | 762 | |
The following items affected cost of goods sold during the year:
| | | | | | | | | | | | |
| | | 2013 | | | 2012 | | | 2011 | |
Expensed inventories | | $ | 3,700 | | | $ | 3,659 | | | $ | 3,653 | |
Reserves, reversals and writedowns of inventories | | | 7 | | | | 8 | | | | 8 | |
| | | $ | 3,707 | | | $ | 3,667 | | | $ | 3,661 | |
The carrying amount of inventory recorded at net realizable value was $2 at December 31, 2013 (2012 – $23), with the remaining inventory recorded at cost.
| NOTE 5 | PROPERTY, PLANT AND EQUIPMENT |
ACCOUNTING POLICIES
Property, plant and equipment (which include certain mine development costs, pre-stripping costs and assets under construction) are carried at cost (which includes all expenditures directly attributable to bringing the asset to the location and installing it in working condition for its intended use) less accumulated depreciation and any recognized impairment loss. Income or expenses derived from the necessity to bring an asset under construction to the location and condition necessary to be capable of operating in the manner intended is recognized as part of the cost of the asset. The cost of property, plant and equipment is reduced by the amount of related investment tax credits to which the company is entitled. Costs of additions, betterments,
renewals and borrowings during construction are capitalized. Borrowing costs directly attributable to the acquisition, construction or production of assets that necessarily take a substantial period of time to ready for their intended use are added to the cost of those assets, until such time as the assets are substantially ready for their intended use. The capitalization rate is based on the weighted average interest rate on all of the company’s outstanding third-party debt. All other borrowing costs are charged through finance costs in the period in which they are incurred. Each component of an item of property, plant and equipment with a cost that is significant in relation to the item’s total cost is depreciated separately. When the cost of replacing part of an item
| | |
| PotashCorp 2013 Annual Integrated Report | | 123 |
| | |
| Notes to the consolidated financial statements | | In millions of US dollars except as otherwise noted |
| Note 5 | Property, plant and equipmentcontinued |
of property, plant and equipment is capitalized, the carrying amount of the replaced part is derecognized. The cost of major inspections and overhauls is capitalized and depreciated over the period until the next major inspection or overhaul. Maintenance and repair expenditures that do not improve or extend productive life are expensed in the period incurred.
Any gain or loss arising on the disposal or retirement of an item of property, plant and equipment is determined as the difference between the sale proceeds and the carrying amount of the asset, and is recognized in operating income.
ACCOUNTING ESTIMATES AND JUDGMENTS
Determination of which costs are directly attributable (e.g., labor, overhead) and when income or expenses derived from an asset under construction is recognized as part of the cost of the asset are matters of judgment. Capitalization of costs ceases when an item is substantially complete and in the location and condition necessary for it to be capable of operating in the manner intended by management. Determining when an asset, or a portion thereof, meets these criteria requires consideration of the circumstances and the industry in which it is to be operated, normally predetermined by management with reference to such factors as productive capacity. This determination is a matter of judgment that can be complex and subject to differing interpretations. When an item of property, plant and equipment comprises individual components for which different depreciation methods or rates are appropriate, judgment is used in determining the appropriate level of componentization. Distinguishing major inspections and overhauls from repairs and maintenance, and determining the appropriate life over which such costs should be amortized are matters of judgment.
Certain mining and milling assets are depreciated using the units-of-production method based on the shorter of estimates of reserves or service lives. Pre-stripping costs are depreciated on a units-of-production basis over the ore mined from the mineable acreage stripped. Land is not depreciated.
Other asset classes are depreciated on a straight-line basis. The following estimated useful lives have been applied to the majority of property, plant and equipment assets at December 31, 2013:
| | | | | | | | |
| | | Useful Life
Range (years) | | | Weighted Average
Useful Life (years) 2 | |
Land improvements | | | 8 to 60 | | | | 34 | |
Buildings and improvements | | | 10 to 60 | | | | 41 | |
Machinery and equipment 1 | | | 3 to 60 | | | | 23 | |
| 1 | Comprised primarily of plant equipment. |
| 2 | Weighted by carrying amount at December 31, 2013. |
Depreciation of assets under construction commences when the assets are ready for their intended use and is subject to management judgment. Their residual values and useful lives are reviewed, and adjusted if appropriate, at the end of each reporting period. Changes in the expected useful life or the expected pattern of consumption of future economic benefits embodied in the asset are accounted for by changing the depreciation period or method, as appropriate, and are treated as changes in accounting estimates.
The company assesses its existing assets and depreciable lives in connection with the review of mine and plant operating plans at the end of each reporting period. When it is determined that assigned asset lives do not reflect the expected remaining period of benefit, prospective changes are made to their depreciable lives. Uncertainties are inherent in estimating reserve quantities, particularly as they relate to assumptions regarding future prices, the geology of the company’s mines, the mining methods used and the related costs incurred to develop and mine its reserves. Changes in these assumptions could result in material adjustments to reserve estimates, which could result in changes to depreciation expense in future periods, particularly if reserve estimates are reduced.
| | |
| 124 | | PotashCorp 2013 Annual Integrated Report |
| | |
| Notes to the consolidated financial statements | | In millions of US dollars except as otherwise noted |
| Note 5 | Property, plant and equipmentcontinued |
SUPPORTING INFORMATION
| | | | | | | | | | | | | | | | | | | | | | | | |
| | | Land and
Improvements | | | Buildings and
Improvements | | | Machinery
and
Equipment | | | Mine
Development
Costs | | | Assets Under
Construction | | | Total | |
Carrying amount – December 31, 2012 | | $ | 476 | | | $ | 3,269 | | | $ | 4,951 | | | $ | 610 | | | $ | 2,199 | | | $ | 11,505 | |
Additions | | | – | | | | 48 | | | | 13 | | | | 57 | | | | 1,372 | | | | 1,490 | |
Change in investment tax credits | | | – | | | | – | | | | 9 | | | | – | | | | (10 | ) | | | (1 | ) |
Disposals | | | – | | | | (4 | ) | | | (16 | ) | | | – | | | | – | | | | (20 | ) |
Transfers | | | 69 | | | | 312 | | | | 1,962 | | | | 56 | | | | (2,399 | ) | | | – | |
Change in asset retirement costs | | | – | | | | – | | | | – | | | | (75 | ) | | | – | | | | (75 | ) |
Depreciation | | | (20 | ) | | | (68 | ) | | | (460 | ) | | | (118 | ) | | | – | | | | (666 | ) |
Carrying amount – December 31, 2013 | | $ | 525 | | | $ | 3,557 | | | $ | 6,459 | | | $ | 530 | | | $ | 1,162 | | | $ | 12,233 | |
Balance at December 31, 2013 comprised of: | | | | | | | | | | | | | | | | | | | | | | | | |
Cost | | $ | 651 | | | $ | 3,972 | | | $ | 9,988 | | | $ | 1,128 | | | $ | 1,162 | | | $ | 16,901 | |
Accumulated depreciation | | | (126 | ) | | | (415 | ) | | | (3,529 | ) | | | (598 | ) | | | – | | | | (4,668 | ) |
Carrying amount | | $ | 525 | | | $ | 3,557 | | | $ | 6,459 | | | $ | 530 | | | $ | 1,162 | | | $ | 12,233 | |
Carrying amount – December 31, 2011 | | $ | 402 | | | $ | 2,039 | | | $ | 4,779 | | | $ | 455 | | | $ | 2,247 | | | $ | 9,922 | |
Additions | | | 1 | | | | 13 | | | | 18 | | | | 54 | | | | 2,122 | | | | 2,208 | |
Change in investment tax credits | | | – | | | | – | | | | (9 | ) | | | – | | | | (15 | ) | | | (24 | ) |
Disposals | | | – | | | | (3 | ) | | | (15 | ) | | | – | | | | – | | | | (18 | ) |
Transfers | | | 83 | | | | 1,282 | | | | 617 | | | | 173 | | | | (2,155 | ) | | | – | |
Change in asset retirement costs | | | – | | | | – | | | | – | | | | 36 | | | | – | | | | 36 | |
Depreciation | | | (10 | ) | | | (62 | ) | | | (439 | ) | | | (108 | ) | | | – | | | | (619 | ) |
Carrying amount – December 31, 2012 | | $ | 476 | | | $ | 3,269 | | | $ | 4,951 | | | $ | 610 | | | $ | 2,199 | | | $ | 11,505 | |
Balance at December 31, 2012 comprised of: | | | | | | | | | | | | | | | | | | | | | | | | |
Cost | | $ | 583 | | | $ | 3,633 | | | $ | 8,176 | | | $ | 1,090 | | | $ | 2,199 | | | $ | 15,681 | |
Accumulated depreciation | | | (107 | ) | | | (364 | ) | | | (3,225 | ) | | | (480 | ) | | | – | | | | (4,176 | ) |
Carrying amount | | $ | 476 | | | $ | 3,269 | | | $ | 4,951 | | | $ | 610 | | | $ | 2,199 | | | $ | 11,505 | |
Depreciation of property, plant and equipment was included in the following:
| | | | | | | | | | | | |
| | | 2013 | | | 2012 | | | 2011 | |
Cost of goods sold and selling and administrative expenses | | $ | 652 | | | $ | 570 | | | $ | 478 | |
Cost of property, plant and equipment and inventory | | | 14 | | | | 49 | | | | 42 | |
| | | $ | 666 | | | $ | 619 | | | $ | 520 | |
Acquiring or constructing property, plant and equipment by incurring a liability does not result in a cash outflow for the company until the liability is paid. In the period the related liability is incurred, the change in operating accounts payable on the consolidated statements of cash flow is typically reduced by such amount. In the period the liability is paid, the amount is reflected as a cash outflow for investing activities. The applicable net change in accounts payable that was reclassified (to) from investing activities (from) to operating activities on the consolidated statements of cash flow in 2013 was $(155) (2012 – $29, 2011 – $(3)).
| | |
| PotashCorp 2013 Annual Integrated Report | | 125 |
| | |
| Notes to the consolidated financial statements | | In millions of US dollars except as otherwise noted |
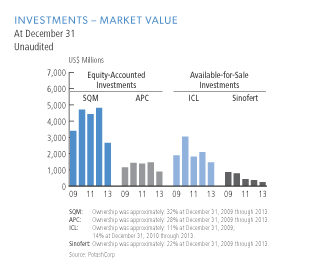
INVESTMENTS IN EQUITY-ACCOUNTED INVESTEES
Investments in which the company exercises significant influence (but does not control) are accounted for using the equity method. Such investees that are not jointly controlled entities are referred to as associates. Investees over which the company has joint control are considered joint arrangements. All
of the company’s joint arrangements are classified and accounted for as joint ventures which are also accounted for using the equity method.
These associates and joint ventures follow similar accounting principles and policies to PotashCorp. The proportionate share of any net income or losses from investments accounted for using the equity method, and any gain or loss on disposal, are recorded in net income. The company’s share of its associates’ post-acquisition movements in OCI is recognized in the company’s OCI. The cumulative post-acquisition movements in net income and in OCI are adjusted against the carrying amount of the investment. Dividends received from associates reduce the value of the company’s investment. An impairment test is performed when there is objective evidence of impairment, such as significant adverse changes in the environment in which the equity-accounted investee operates or a significant or prolonged decline in the fair value of the investment below its carrying value. An impairment loss is recorded when the recoverable amount becomes lower than the carrying amount, recoverable amount being the higher of value in use and fair value less costs to sell. Impairment losses are reversed if the recoverable amount subsequently exceeds the carrying amount.
ACCOUNTING ESTIMATES AND JUDGMENTS
Significant influence is the power to participate in the financial and operating policy decisions of the investee but is not control or joint control over those policies. Judgment is necessary in determining when significant influence exists.
SUPPORTING INFORMATION
Associates and joint ventures at December 31 were comprised of:
| | | | | | | | | | | | | | | | | | | | | | | | | | | | | | |
| Name | | Principal Activity | | Principal Place of
Business and
Incorporation | | | | Proportion of Ownership
Interest and Voting Rights Held | | | Quoted Fair Value 1 | | | Carrying Amount | |
| | | | | 2013 | | | 2012 | | | 2013 | | | 2012 | | | 2013 | | | 2012 | |
Sociedad Quimica y Minera de Chile S.A. (“SQM”) | | Chemicals & Mining | | Chile | | | | | 32% | 2 | | | 32% | 2 | | $ | 2,664 | | | $ | 4,819 | | | $ | 865 | | | $ | 813 | |
Arab Potash Company (“APC”) | | Mining | | Jordan | | | | | 28% | | | | 28% | | | | 895 | | | | 1,462 | | | | 385 | | | | 414 | |
Canpotex | | Marketing & Logistics | | Canada | | | | | 33% | | | | 33% | | | | n/a | 3 | | | n/a | 3 | | | – | | | | – | |
Other associates | | | | | | | | | | | | | | | | | | | | | | | | | 2 | | | | 2 | |
Total associates | | | | | | | | | | | | | | | | | | | | | | | | | 1,252 | | | | 1,229 | |
Joint ventures | | | | | | | | | | | | | | | | | | | | | | | | | 24 | | | | 25 | |
Total equity-accounted investees | | | | | | | | | | | | | | | | | | | | | | | | | 1,276 | | | | 1,254 | |
| 1 | The quoted market value (fair value) was based on unadjusted quoted prices in active markets (Level 1). |
| 2 | Due to provisions in SQM’s bylaws, the company holds proportional voting rights of 28 percent. |
| 3 | Canpotex is a private company and there is no quoted market price available for the shares. |
Aggregated financial information of the company’s proportionate interest in associates for the year ended December 31 was as follows:
| | | | | | | | | | | | |
| | | 2013 | | | 2012 | | | 2011 | |
Income from continuing operations and net income | | $ | 204 | | | $ | 289 | | | $ | 296 | |
Other comprehensive loss | | | (1 | ) | | | (1 | ) | | | (2 | ) |
Total comprehensive income | | | 203 | | | | 288 | | | | 294 | |
| | |
| 126 | | PotashCorp 2013 Annual Integrated Report |
| | |
| Notes to the consolidated financial statements | | In millions of US dollars except as otherwise noted |
| Note 6 | Investmentscontinued |
Aggregated financial information of the company’s proportionate interests in joint ventures for the year ended December 31 was as follows:
| | | | | | | | | | | | |
| | | 2013 | | | 2012 | | | 2011 | |
Income from continuing operations and net income | | $ | 10 | | | $ | 12 | | | $ | 5 | |
Other comprehensive income | | | – | | | | – | | | | – | |
Total comprehensive income | | | 10 | | | | 12 | | | | 5 | |
Additional aggregated financial information of all the company’s equity-accounted investees is set out below. The financial information below represents an aggregation of full amounts shown in each associate’s and joint venture’s financial statements prepared in accordance with IFRS.
| | | | | | | | |
| | | 2013 | | | 2012 | |
Current assets | | $ | 3,706 | | | $ | 3,675 | |
Non-current assets | | | 3,194 | | | | 3,060 | |
Current liabilities | | | 1,389 | | | | 1,476 | |
Non-current liabilities | | | 1,785 | | | | 1,661 | |
Non-controlling interest | | | 56 | | | | 55 | |
| | | | | | | | | | | | |
| | | 2013 | | | 2012 | | | 2011 | |
Sales | | $ | 6,381 | | | $ | 6,815 | | | $ | 7,609 | |
Gross profit | | | 1,028 | | | | 1,502 | | | | 1,458 | |
Income from continuing operations and net income | | | 679 | | | | 961 | | | | 989 | |
Dividends received from these equity-accounted investments in 2013 were $180 (2012 – $211, 2011 – $128).
AVAILABLE-FOR-SALE INVESTMENTS
ACCOUNTING POLICIES
The fair value of investments designated as available-for-sale is recorded in the consolidated statements of financial position, with unrealized gains and losses, net of related income taxes, recorded in accumulated other comprehensive income (“AOCI”). The cost of investments sold is based on the weighted average method. Realized gains and losses on these investments are removed from AOCI and recorded in net income. The company assesses at the end of each reporting period whether there is objective evidence of impairment. A significant or prolonged decline in the fair value of the investment below its cost would be evidence that the asset is impaired. If objective evidence of impairment exists, the impaired amount (i.e., the unrealized loss) is recognized in net income; any subsequent reversals would be recognized in OCI and would not flow back into net income. Any subsequent decline in the fair value below the carrying amount at the impairment date would represent a further impairment to be recognized in net income. See Note 24 for a description of how the company determines fair value for its investments.
ACCOUNTING ESTIMATES AND JUDGMENTS
The company’s 22 percent ownership of Sinofert Holdings Limited (“Sinofert”) does not constitute significant influence and its investment is therefore accounted for as available-for-sale.
The determination of when an investment is impaired requires significant judgment. In making this judgment, the company evaluates, among other factors, the duration and extent to which the fair value of the investment is less than its cost at each reporting period-end.
During 2012, the company concluded its investment in Sinofert was impaired due to the significance by which fair value was below cost. As a result, an impairment loss of $341 was recognized in net income during 2012. There were no such impairments in 2013 or 2011. The recoverable amount was based on fair value less costs to sell which was determined through the market value of Sinofert shares on the Hong Kong Stock Exchange. Increases in fair value subsequent to this time were recognized in OCI.
| | |
| PotashCorp 2013 Annual Integrated Report | | 127 |
| | |
| Notes to the consolidated financial statements | | In millions of US dollars except as otherwise noted |
| Note 6 | Investmentscontinued |
SUPPORTING INFORMATION
Available-for-sale investments at December 31 were as follows:
| | | | | | | | | | | | | | | | | | | | | | |
| Name of Investment | | Principal Activity | | Principal Place of Business
and Incorporation | | | | Proportion of Ownership
Interest and Voting Rights Held | | | Fair Value and
Carrying Amount | |
| | | | | 2013 | | | 2012 | | | 2013 | | | 2012 | |
Israel Chemicals Ltd. (“ICL”) | | Fertilizer & Specialty Chemicals | | Israel | | | | | 14% | | | | 14% | | | $ | 1,468 | | | $ | 2,104 | |
Sinofert | | Fertilizer Supplier & Distributor | | China /Bermuda | | | | | 22% | | | | 22% | | | | 254 | | | | 377 | |
| | | | | | | | | | | | | | | | | $ | 1,722 | | | $ | 2,481 | |
At December 31, 2013, the net unrealized gain on these investments was $439 (2012 – $1,197).
Changes in fair value, and related accounting, for the company’s investment in Sinofert since December 31, 2011 were as follows:
| | | | | | | | | | | | | | | | |
| | | | | | | | | Impact of Unrealized Loss on: | |
| | | Fair Value | | | Unrealized Loss | | | OCI and AOCI | | | Net Income and
Retained Earnings | |
Balance – December 31, 2011 | | $ | 439 | | | $ | (140 | ) | | $ | (140 | ) | | $ | – | |
Decrease in fair value prior to recognition of impairment | | | (201 | ) | | | (201 | ) | | | (201 | ) | | | – | |
Recognition of impairment | | | – | | | | – | | | | 341 | | | | (341 | ) |
Increase in fair value subsequent to recognition of impairment | | | 139 | | | | 139 | | | | 139 | | | | – | |
Balance – December 31, 2012 | | $ | 377 | | | $ | (202 | ) | | $ | 139 | | | $ | (341 | ) |
Decrease in fair value during the year | | | (123 | ) | | | (123 | ) | | | (123 | ) | | | – | |
Balance – December 31, 2013 | | $ | 254 | | | $ | (325 | ) | | $ | 16 | | | $ | (341 | ) |
ACCOUNTING ESTIMATES AND JUDGMENTS
The costs of certain ammonia catalysts are capitalized to other assets and are amortized, net of residual value, on a straight-line basis over their estimated useful lives of 3 to 12 years.
Upfront lease costs are capitalized to other assets and amortized over the life of the leases on a straight-line basis, the latest of which extends through 2037.
SUPPORTING INFORMATION
Other assets at December 31 were comprised of:
| | | | | | | | |
| | | 2013 | | | 2012 | |
Accrued pension benefit asset (Note 13) | | $ | 129 | | | $ | 16 | |
Long-term income taxes receivable (Note 21) | | | 126 | | | | 130 | |
Ammonia catalysts – net of accumulated amortization of $44 (2012 – $33) | | | 37 | | | | 46 | |
Investment tax credits receivable | | | 35 | | | | 57 | |
Deferred income tax assets (Note 21) | | | 21 | | | | 30 | |
Upfront lease costs – net of accumulated amortization of $9 (2012 – $8) | | | 18 | | | | 19 | |
Derivative instrument assets (Note 11) | | | 6 | | | | 6 | |
Other – net of accumulated amortization of $19 (2012 – $17) | | | 29 | | | | 40 | |
| | | $ | 401 | | | $ | 344 | |
Amortization of other assets included in cost of goods sold and in selling and administrative expenses for 2013 was $11 (2012 – $6, 2011 – $9).
| | |
| 128 | | PotashCorp 2013 Annual Integrated Report |
| | |
| Notes to the consolidated financial statements | | In millions of US dollars except as otherwise noted |
ACCOUNTING POLICIES
An intangible asset is defined as being identifiable, able to bring future economic benefits to the company and controlled by it. An asset meets the identifiability criterion when it is separable or arises from contractual rights.
Intangible assets are recorded initially at cost and relate primarily to production and technology rights, contractual customer relationships, computer software and goodwill. Internally generated intangible assets relate to computer software and other developed projects. An intangible asset is recognized when it is probable that the expected future economic benefits attributable to the asset will flow to the company and the cost of the asset can be measured reliably.
Costs associated with maintaining computer software programs are recognized as an expense as incurred. Development costs are recognized as intangible assets when the following criteria are met:
| • | | It is technically feasible to complete the asset so it will be available for use; |
| • | | Management intends to complete the asset and use or sell it; |
| • | | The asset can be used or sold; |
| • | | It can be demonstrated how the asset will generate probable future economic benefits; |
| • | | Adequate technical, financial and other resources to complete the development and to use or sell the asset are available; and |
| • | | The expenditure attributable to the asset during its development can be reliably measured. |
Directly attributable costs that are capitalized as part of the asset include applicable employee costs. Development costs previously recognized as an expense are not recognized as an asset in a subsequent period.
Amortization expense is recognized in net income in the expense category consistent with the function of the intangible asset. The useful lives are reviewed, and adjusted if appropriate, at the end of each reporting period.
Changes in the expected useful life or the expected pattern of consumption of future economic benefits embodied in the asset are accounted for by changing the amortization period or method, as appropriate, and are treated as changes in accounting estimates.
All business combinations are accounted for using the acquisition method. Identifiable intangible assets are recognized separately from goodwill. Goodwill is carried at cost, is no longer amortized and represents the excess of the cost of an acquisition over the fair value of the company’s share of the net identifiable assets of the acquired subsidiary or equity method investee at the date of acquisition. Separately recognized goodwill is carried at cost less accumulated amortization and impairment losses. Gains and losses on the disposal of an entity include the carrying amount of goodwill relating to the entity sold.
ACCOUNTING ESTIMATES AND JUDGMENTS
Judgment is necessary to determine whether expenditures made by the company on non-tangible items represent intangible assets eligible for capitalization. Finite-lived intangible assets are accounted for at cost and are amortized on a straight-line basis over their estimated useful lives.
Goodwill is allocated to CGUs or groups of CGUs for the purpose of impairment testing based on the level at which it is monitored by management, and not at a level higher than an operating segment. The allocation is made to those CGUs or groups of CGUs that are expected to benefit from the business combination in which the goodwill arose.
| | |
| PotashCorp 2013 Annual Integrated Report | | 129 |
| | |
| Notes to the consolidated financial statements | | In millions of US dollars except as otherwise noted |
| Note 8 | Intangible assetscontinued |
SUPPORTING INFORMATION
Goodwill is the only intangible asset with an indefinite useful life recognized by the company. All other intangible assets have finite useful lives. Following is a reconciliation of intangible assets:
| | | | | | | | | | | | |
| | | Goodwill 1 | | | Other | | | Total | |
Carrying amount – December 31, 2012 | | $ | 97 | | | $ | 29 | | | $ | 126 | |
Additions | | | – | | | | 14 | | | | 14 | |
Amortization | | | – | | | | (3 | ) | | | (3 | ) |
Carrying amount – December 31, 2013 | | $ | 97 | | | $ | 40 | | | $ | 137 | |
Balance at December 31, 2013 comprised of: | | | | | | | | | | | | |
Cost | | $ | 104 | | | $ | 82 | | | $ | 186 | |
Accumulated amortization | | | (7 | ) | | | (42 | ) | | | (49 | ) |
Carrying amount | | $ | 97 | | | $ | 40 | | | $ | 137 | |
Carrying amount – December 31, 2011 | | $ | 97 | | | $ | 18 | | | $ | 115 | |
Additions | | | – | | | | 13 | | | | 13 | |
Amortization | | | – | | | | (2 | ) | | | (2 | ) |
Carrying amount – December 31, 2012 | | $ | 97 | | | $ | 29 | | | $ | 126 | |
Balance at December 31, 2012 comprised of: | | | | | | | | | | | | |
Cost | | $ | 104 | | | $ | 68 | | | $ | 172 | |
Accumulated amortization | | | (7 | ) | | | (39 | ) | | | (46 | ) |
Carrying amount | | $ | 97 | | | $ | 29 | | | $ | 126 | |
| 1 | The company’s aggregate carrying amount of goodwill was $97 (2012 – $97), representing 1.0 percent of shareholders’ equity at December 31, 2013 (2012 – 1.0 percent). Substantially all of the company’s recorded goodwill relates to the nitrogen segment. |
Short-term debt at December 31 was comprised of:
| | | | | | | | |
| | | 2013 | | | 2012 | |
Commercial paper | | $ | 470 | | | $ | 369 | |
The amount available under the commercial paper program is limited to the availability of backup funds under the credit facility. At December 31, 2013, the company was authorized to issue commercial paper up to $2,500 (2012 – $1,500).
The company has a $75 unsecured line of credit available for short-term financing. Net of letters of credit of $18 and direct borrowings of $NIL, $57 was available at December 31, 2013 (2012 – $56). The line of credit is available through August 2014.
The line of credit is subject to financial tests and other covenants. Principal covenants and events of default are as follows: debt-to-capital ratio of less than or equal to 0.60:1, a long-term-debt-to-EBITDA (as defined in the agreement to be earnings before interest, income taxes, provincial mining and other taxes, depreciation, amortization and other non-cash expenses, and unrealized gains and losses in respect of hedging instruments) ratio of less than or equal to 3.5:1, debt of subsidiaries not to exceed $1,000 and a $300 permitted lien basket. The line of credit is subject to other customary covenants and events of default, including an event of default for non-payment of other debt in excess of CDN $100. Non-compliance with such covenants could result in accelerated payment of amounts due under the line of credit, and its termination. The company was in compliance with the above-mentioned covenants at December 31, 2013.
| | |
| 130 | | PotashCorp 2013 Annual Integrated Report |
| | |
| Notes to the consolidated financial statements | | In millions of US dollars except as otherwise noted |
| NOTE 10 | PAYABLES AND ACCRUED CHARGES |
Payables and accrued charges at December 31 were comprised of:
| | | | | | | | |
| | | 2013 | | | 2012 | |
Trade accounts | | $ | 450 | | | $ | 623 | |
Dividends | | | 301 | | | | 183 | |
Accrued compensation | | | 91 | | | | 89 | |
Deferred revenue | | | 60 | | | | 85 | |
Termination benefits | | | 56 | | | | – | |
Current portion of asset retirement obligations and accrued environmental costs(Note 14) | | | 41 | | | | 30 | |
Accrued interest | | | 36 | | | | 42 | |
Accrued deferred share units | | | 19 | | | | 23 | |
Current portion of pension and other post-retirement benefits(Note 13) | | | 12 | | | | 12 | |
Other taxes | | | 9 | | | | 8 | |
Income taxes(Note 21) | | | 3 | | | | 2 | |
Other payables and other accrued charges | | | 26 | | | | 91 | |
| | | $ | 1,104 | | | $ | 1,188 | |
| NOTE 11 | DERIVATIVE INSTRUMENTS |
ACCOUNTING POLICIES
Derivative financial instruments are used by the company to manage its exposure to commodity price and exchange rate fluctuations. Contracts to buy or sell a non-financial item that can be settled net in cash or another financial instrument, or by exchanging financial instruments, as if the contracts were financial instruments (except contracts that were entered into and continue to be held for the purpose of the receipt or delivery of a non-financial item in accordance with expected purchase, sale or usage requirements), are accounted for as derivative financial instruments. The company recognizes its derivative instruments at fair value on the consolidated statements of financial position where appropriate.
The accounting for changes in the fair value (i.e., gains or losses) of a derivative instrument depends on whether it has been designated and qualifies as part of a hedging relationship. For instruments designated as fair value hedges, the effective portion of the change in the fair value of the derivative is offset in net income against the change in fair value, attributed to the risk being hedged, of the underlying hedged asset, liability or firm commitment. For cash flow hedges, the effective portion of the change in the fair value of the derivative is accumulated in OCI until the variability in cash flows being hedged is recognized in net income in future accounting periods. Ineffective portions of hedges are recorded in net income in the current period. The change in fair value of derivative instruments not designated as hedges is recorded in net income in the current period.
The company’s policy is not to use derivative instruments for trading or speculative purposes, although it may choose not to designate an economic hedging relationship as an accounting hedge. The company formally documents all relationships between hedging instruments and hedged items, as well as its risk management objective and strategy for undertaking the hedge transaction. This process includes linking derivatives to specific assets and liabilities or to specific firm commitments or forecast transactions. The company also assesses, both at the hedge’s inception and on an ongoing basis, whether the derivatives used in hedging transactions are expected to be or were, as appropriate, highly effective in offsetting changes in fair values of hedged items. Hedge effectiveness related to the company’s natural gas hedges is assessed on a prospective and retrospective basis using regression analyses.
A hedging relationship may be terminated because the hedge ceases to be effective, the underlying asset or liability being hedged is derecognized, or the derivative instrument is no longer designated as a hedging instrument. In such instances, the difference between the fair value and the accrued value of the hedging derivatives upon termination is deferred and recognized in net income on the same basis that gains, losses, revenue and expenses of the previously hedged item are recognized. If a cash flow hedging relationship is terminated because it is no longer probable that the anticipated transaction will occur, then the net gain or loss accumulated in OCI is recognized in current period net income.
| | |
| PotashCorp 2013 Annual Integrated Report | | 131 |
| | |
| Notes to the consolidated financial statements | | In millions of US dollars except as otherwise noted |
| Note 11 | Derivative instrumentscontinued |
ACCOUNTING ESTIMATES AND JUDGMENTS
Uncertainties, estimates and use of judgment include the assessment of contracts as derivative instruments and for embedded derivatives, application of hedge accounting and valuation of derivatives at fair value (discussed further inNote 24).
In determining whether a contract represents a derivative or contains an embedded derivative, the most significant area where judgment has been applied pertains to the determination as to whether the contract can be settled net, one of the criteria in determining whether a contract for anon-financial asset is considered a derivative and accounted for as such. Judgment is also applied in determining whether an embedded derivative is closely related to the host contract, in which case bifurcation and separate accounting are not necessary.
To obtain and maintain hedge accounting for its natural gas derivative instruments, the company must be able to establish that the hedging instrument is effective at offsetting the risk of the hedged item both retrospectively and prospectively, and ensure documentation meets stringent requirements. The process to test effectiveness requires the application of judgment and estimation.
SUPPORTING INFORMATION
Significant recent derivatives included the following:
| • | | Natural gas futures and swap agreements to manage the cost of natural gas, generally designated as cash flow hedges of anticipated transactions. |
| • | | Foreign currency forward contracts for the primary purpose of limiting exposure to exchange rate fluctuations relating to expenditures denominated in currencies other than the US dollar, not designated as hedging instruments for accounting purposes. |
Derivatives at December 31 were comprised of:
| | | | | | | | | | | | |
| | | Assets | | | Liabilities | | | Net | |
2013 | | | | | | | | | | | | |
Natural gas hedging derivatives | | $ | 8 | | | $ | 170 | | | $ | (162 | ) |
Foreign currency derivatives | | | – | | | | 1 | | | | (1 | ) |
Total | | | 8 | | | | 171 | | | | (163 | ) |
Less current portion | | | (2 | ) | | | (42 | ) | | | 40 | |
Long-term portion | | $ | 6 | | | $ | 129 | | | $ | (123 | ) |
2012 | | | | | | | | | | | | |
Natural gas hedging derivatives | | $ | 9 | | | $ | 218 | | | $ | (209 | ) |
Foreign currency derivatives | | | 1 | | | | – | | | | 1 | |
Total | | | 10 | | | | 218 | | | | (208 | ) |
Less current portion | | | (4 | ) | | | (51 | ) | | | 47 | |
Long-term portion | | $ | 6 | | | $ | 167 | | | $ | (161 | ) |
As at December 31, 2013, the company’s net exposure to natural gas derivatives in the form of swaps qualifying for hedge accounting was NIL (2012 – NIL).
For the year ended December 31, 2013, losses before taxes of $NIL were recognized in OCI (2012 – $27, 2011 – $62). For the year ended December 31, 2013, losses before taxes of $51 (2012 – $82, 2011 – $76) were reclassified from AOCI and recognized in cost of goods sold excluding ineffectiveness, which changed these losses by $NIL in all years. Of the losses before taxes at December 31, 2013, approximately $40 (2012 – $50, 2011 – $68) will be reclassified to cost of goods sold within the next 12 months.
As at December 31, 2013, the company had entered into foreign currency forward contracts to sell US dollars and receive Canadian dollars in the notional amount of $148 (2012 – $300) at an average exchange rate of 1.0569 (2012 – 0.9982) per US dollar with maturities in 2014 (2012 – maturities in 2013).
| | |
| 132 | | PotashCorp 2013 Annual Integrated Report |
| | |
| Notes to the consolidated financial statements | | In millions of US dollars except as otherwise noted |
ACCOUNTING POLICY
Issue costs of long-term debt obligations are capitalized to long-term obligations and are amortized to expense over the term of the related liability using the effective interest method.
SUPPORTING INFORMATION
Long-term debt at December 31 was comprised of:
| | | | | | | | |
| | | 2013 | | | 2012 | |
Senior notes1 | | | | | | | | |
4.875% notes due and paid March 1, 2013 | | $ | – | | | $ | 250 | |
5.250% notes due May 15, 2014 | | | 500 | | | | 500 | |
3.750% notes due September 30, 2015 | | | 500 | | | | 500 | |
3.250% notes due December 1, 2017 | | | 500 | | | | 500 | |
6.500% notes due May 15, 2019 | | | 500 | | | | 500 | |
4.875% notes due March 30, 2020 | | | 500 | | | | 500 | |
5.875% notes due December 1, 2036 | | | 500 | | | | 500 | |
5.625% notes due December 1, 2040 | | | 500 | | | | 500 | |
Other | | | 6 | | | | 6 | |
| | | 3,506 | | | | 3,756 | |
Less net unamortized debt issue costs | | | (39 | ) | | | (44 | ) |
| | | 3,467 | | | | 3,712 | |
Less current maturities | | | (500 | ) | | | (250 | ) |
Add current portion of amortization | | | 3 | | | | 4 | |
| | | $ | 2,970 | | | $ | 3,466 | |
| 1 | Each series of senior notes is unsecured and has no sinking fund requirements prior to maturity. Each series is redeemable, in whole or in part, at the company’s option, at any time prior to maturity for a price not less than the principal amount of the notes to be redeemed, plus accrued and unpaid interest. Under certain conditions related to a change in control, the company is required to make an offer to purchase all, or any part, of the senior notes at 101 percent of the principal amount of the notes repurchased, plus accrued and unpaid interest. |
The company has a long-term revolving credit facility that provides for unsecured borrowings and also backstops its commercial paper program. The availability of borrowings is reduced by the amount of commercial paper outstanding. Details of the company’s credit facilities were as follows:
| | | | |
| | | 2013 1 | | 2012 |
Facilities at December 31 | | $3,500 – maturity
May 31, 2018 | | $750 – maturity May 31, 2013
$2,750 – maturity December 11, 2016 |
Borrowings outstanding at December 31 | | $NIL | | $NIL |
Commercial paper outstanding, backstopped by the credit facilities, at December 31 (Note 9) | | $470 | | $369 |
Amounts borrowed and repaid during the year ended December 31 | | $NIL | | $NIL |
| 1 | During 2013, the company terminated its $750 revolving term credit facility and its $2,750 revolving term credit facility was amended, increasing it to $3,500 and extending the maturity. |
Other long-term debt in the above table includes a net financial liability of $6 (2012 – $6) pursuant to back-to-back loan arrangements involving certain financial assets and financial liabilities. At December 31, 2013, the company presented financial assets of $455 and financial liabilities of $461 on a net basis related to these arrangements because a legal right to set-off exists, and it intends to settle with the same party on a net basis (2012 – financial assets of $505 and financial liabilities of $511).
The senior notes are not subject to any financial test covenants but are subject to certain customary covenants (including limitations on liens and on sale and leaseback transactions) and events of default, including an event of default for acceleration of other debt in excess of $50. Principal covenants and events of default under the credit facility are the same as those under the line of credit described in Note 9. Non-compliance with such covenants could result in accelerated payment of amounts due under the credit facility, and its termination. The back-to-back loan arrangements are not subject to any financial test covenants but are subject to certain customary covenants and events of default, including, for other long-term debt, an event of default for non-payment of other debt in excess of $25. Non-compliance with such covenants could result in accelerated payment of the related debt. The company was in compliance with the above-mentioned covenants at December 31, 2013.
| | |
| PotashCorp 2013 Annual Integrated Report | | 133 |
| | |
| Notes to the consolidated financial statements | | In millions of US dollars except as otherwise noted |
| Note 12 | Long-term debtcontinued |
Long-term debt obligations at December 31, 2013 will mature as follows:
| | | | |
2014 | | $ | 500 | |
2015 | | | 500 | |
2016 | | | – | |
2017 | | | 506 | |
2018 | | | – | |
Subsequent years | | | 2,000 | |
| | | $ | 3,506 | |
| NOTE 13 | PENSION AND OTHER POST-RETIREMENT BENEFITS |
The company offers a number of benefit plans that provide pension and other post-retirement benefits to qualified employees: defined benefit pension plans; defined contribution pension plans; and health, disability, dental and life insurance (referred to as other defined benefit) plans. The company sponsors defined benefit pension plans in the US, Canada and Trinidad. Substantially all employees are participants in at least one of these plans.
DEFINED BENEFIT PLANS
ACCOUNTING POLICIES
The company accrues its obligations under employee benefit plans and the related costs, net of plan assets. The cost of pensions and other retirement benefits earned by employees generally is actuarially determined using the projected unit credit method and management’s best estimate of salary escalation, retirement ages of employees and expected health care costs. Actuaries perform valuations on a regular basis to determine the actuarial present value of the accrued pension and other post-employment benefits. Net interest is calculated by applying the discount rate used to measure the defined benefit obligation at the beginning of the annual period to the net defined benefit liability or asset. Past service cost is recognized in net income at the earlier of when a plan amendment or curtailment occurs or when related restructuring costs or termination benefits are recognized. Defined benefit cost includes, as applicable, service cost, past service cost, gains and losses on curtailments and settlements, net interest and remeasurements. The company presents net interest within finance costs in the consolidated statements of income. The other components of defined benefit cost are presented within cost of goods sold or selling and administrative expenses, as applicable, in the consolidated statements of income.
Remeasurements arising from defined benefit plans comprise actuarial gains and losses, the return on plan assets (excluding amounts included in net interest) and the effect of the asset ceiling (if applicable). The company recognizes remeasurements immediately in OCI in the period they occur.
When a plan amendment occurs before a settlement, the company recognizes past service cost before any gain or loss on settlement.
ACCOUNTING ESTIMATES AND JUDGMENTS
The calculation of employee benefit plan expenses and obligations depends on assumptions such as discount rates, health care cost trend rates, projected salary increases, retirement age, longevity and termination rates. These assumptions are determined by management and are reviewed annually by the company’s independent actuaries.
The company’s discount rate assumption reflects the weighted average interest rate at which the pension and other post-retirement liabilities could be effectively settled at the measurement date. The rate varies by country. The company determines the discount rate using a yield curve approach. Based on the respective plans’ demographics, expected future pension benefits and medical claims, payments are measured and discounted to determine the present value of the expected future cash flows. The cash flows are discounted using yields on high-quality AA-rated non-callable bonds with cash flows of similar timing where there is a deep market for such bonds. Where the company does not believe there is a deep market for such bonds (such as for terms in excess of 10 years in Canada), the cash flows are discounted using a yield curve derived from yields on provincial bonds rated AA or better to which a spread adjustment is added to reflect the additional risk of corporate bonds. For Trinidad plans, the cash flows are discounted using yields on local market government bonds with cash flows of similar timing. The resulting rates are used by the company to determine the final discount rate.
| | |
| 134 | | PotashCorp 2013 Annual Integrated Report |
| | |
| Notes to the consolidated financial statements | | In millions of US dollars except as otherwise noted |
| Note 13 | Pension and other post-retirement benefitscontinued |
The significant assumptions used to determine the benefit obligation and expense for the company’s significant plans were as follows as of December 31:
| | | | | | | | | | | | | | | | | | | | | | | | |
| | | Pension | | | Other | |
| | | 2013 | | | 2012 | | | 2011 | | | 2013 | | | 2012 | | | 2011 | |
Discount rate – obligation, % | | | 4.80 | | | | 3.85 | | | | 4.60 | | | | 4.80 | | | | 3.85 | | | | 4.60 | |
Rate of increase in compensation levels, % | | | 5.00 | | | | 4.00 | | | | 4.00 | | | | n/a | | | | n/a | | | | n/a | |
Medical cost trend rate – assumed, % | | | n/a | | | | n/a | | | | n/a | | | | 7.00-4.50 | 1 | | | 7.00-4.50 | 1 | | | 6.00 | |
Medical cost trend rate – year reaches ultimate trend rate | | | n/a | | | | n/a | | | | n/a | | | | 2027 | | | | 2027 | | | | 2011 | |
Average longevity at retirement age – years 2 | | | 20-25 | | | | 20-25 | | | | 20-25 | | | | 20-25 | | | | 20-25 | | | | 20-25 | |
| 1 | The company assumed a graded medical cost trend rate starting at 7.00 percent in 2013 moving to 4.50 percent by 2027. |
| 2 | Range for current retirees and current employees (future retirees) both male and female. |
| | | | | | | | | | | | | | | | |
| | | Pension | | | Other | |
| | | 2013 | | | 2012 | | | 2013 | | | 2012 | |
Average remaining service period of active employees (years) | | | 11.3 | | |
| 11.9
|
| | | 12.1 | | | | 11.4 | |
Average duration of the defined benefit obligation 1 (years) | | | 14.6 | | | | 14.6 | | | | 17.6 | | | | 17.3 | |
| 1 | Weighted average length of the underlying cash flows. |
Assumptions regarding future mortality experience are set based on actuarial advice in accordance with published statistics and experience in each country.
SENSITIVITY OF ASSUMPTIONS
Sensitivity to changes in key assumptions for the company’s pension and other post-retirement benefit plans was as follows:
| | | | | | | | | | | | | | | | | | | | |
| | | | | | 2013 | | | 2012 | |
| | | Change in Assumption | | | Benefit Obligation | | | Expense in Income Before
Income Taxes | | | Benefit Obligation | | | Expense in Income Before
Income Taxes | |
As reported | | | | | | $ | 1,545 | | | $ | 39 | | | $ | 1,612 | | | $ | 51 | |
Discount rate | | | 1.0 percentage point | q | | | 276 | | | | 13 | | | | 270 | | | | 7 | |
| | | | 1.0 percentage point | p | | | (216 | ) | | | (14 | ) | | | (235 | ) | | | (6 | ) |
Rate of compensation increase | | | 1.0 percentage point | q | | | (33 | ) | | | (4 | ) | | | (35 | ) | | | (3 | ) |
| | | | 1.0 percentage point | p | | | 37 | | | | 4 | | | | 38 | | | | 4 | |
Medical cost trend rate | | | 1.0 percentage point | q | | | (49 | ) | | | (4 | ) | | | (53 | ) | | | (3 | ) |
| | | | 1.0 percentage point | p | | | 55 | | | | 5 | | | | 58 | | | | 1 | |
Longevity at retirement age | | | 1.0 year | q | | | (36 | ) | | | (2 | ) | | | (36 | ) | | | (2 | ) |
| | | | 1.0 year | p | | | 36 | | | | 2 | | | | 36 | | | | 2 | |
The above sensitivities are hypothetical and should be used with caution. Changes in amounts based on a 1.0 percentage point or 1.0 year variation in assumptions generally cannot be extrapolated because the relationship of the change in assumption to the change in amounts may not be linear. The sensitivities have been calculated independently of changes in other key variables. Changes in one factor may result in changes in another, which could amplify or reduce certain sensitivities.
| | |
| PotashCorp 2013 Annual Integrated Report | | 135 |
| | |
| Notes to the consolidated financial statements | | In millions of US dollars except as otherwise noted |
| Note 13 | Pension and other post-retirement benefitscontinued |
SUPPORTING INFORMATION
Description of defined benefit pension plans
The company’s defined benefit pension plans in the US and Canada arenon-contributory plans which provide benefits to members in the form of a guaranteed level of annual pension payments for life. The level of benefits provided depends on the members’ years of service and compensation level in the final years leading up to normal retirement age of 65. Early retirement benefits are available starting at age 55 at a reduced rate. These plans provide for pensionable salary and maximum annual benefit limits. Contributions to the US plans are made to meet or exceed minimum funding requirements of the Employee Retirement Income Security Act of 1974 (“ERISA”) and associated Internal Revenue Service regulations and procedures. Contributions to the Canadian plans are made to meet or exceed minimum funding requirements based on provincial statutory requirements and associated federal taxation rules.
The company’s defined benefit pension plan in Trinidad is a contributory plan which provides benefits to members in the form of a guaranteed level of annual pension payments for life. Members generally contribute between 3 percent and 5 percent of their salary depending on the plan year. Members can elect to make additional voluntary contributions but are subject to maximum annual limits. The level of benefits provided depends on the member’s years of service, compensation level in the final years leading up to normal retirement age of 60 and if any additional voluntary contributions were made. Early retirement benefits with at least five years of pensionable service are available starting at age 50 at a reduced rate. The plan provides for pensionable salary and maximum annual benefit limits. Contributions to the Trinidad plans are made to meet or exceed minimum funding requirements based on local statutory requirements. In particular, any company contributions must meet or exceed any required employee contributions.
The company’s defined benefit pension plans discussed above are administered as separate funds that are legally separated from the company through an employee benefits or management committee in each country which is composed of employees of the company. The employee benefits committee is required by law to act in the best interest of the plan participants and in the US and Canada is responsible for the governance of the plans, including setting certain policies (e.g. investment and contribution) of the funds. In Trinidad, the plan’s trustee has these responsibilities and the management committee assists that trustee to administer the plan. The current investment policy for each country’s plans does not include any asset/liability matching strategies or currency hedging strategies. Plan assets held in trusts are governed by local regulations and practice in each country, as is the nature of the relationship between the company and the trustees and their composition.
The company has also established supplemental defined benefit retirement income plans in the US and Canada for senior management that are unfunded, non-contributory and provide supplementary pension benefits. They are provided for by charges to earnings sufficient to meet the projected benefit obligation.
The defined benefit pension plans expose the company to broadly similar actuarial risks. The most significant risks as discussed below include: investment risk, interest rate risk, longevity risk and salary risk. These plans are not exposed to any other significant, unusual or specific risks.
Investment risk
The present value of the defined benefit obligation was calculated using a discount rate determined by reference to high-quality corporate bond yields in the US and Canada and to government bond yields in Trinidad. If plan assets underperform this yield, a deficit will be created. The company employs a total return on investment approach whereby a mix of equities and fixed income investments is used to maximize the long-term return of plan assets for a prudent level of risk. Risk tolerance is established through careful consideration of plan liabilities, plan funded status and corporate financial condition. The investment portfolio contains a diversified mix of equity and fixed income investments.
For plans in the US and Canada, equity investments are diversified across US and non-US stocks, as well as growth, value and small and large capitalization investments. US equities are also diversified across actively managed and passively invested portfolios. Other assets such as private equity, real estate and hedge funds are not used at this time. Investment risk is measured and monitored on an ongoing basis through quarterly investment portfolio reviews, annual liability measurements and periodic asset/liability studies.
The investment strategy in Trinidad is largely dictated by local investment restrictions (maximum of 50 percent in equities and 20 percent in assets originating from outside of Trinidad) and asset availability since the local equity market is small and there is little secondary market activity in debt securities.
Interest rate risk
A decrease in bond interest rates will increase the pension liability; however, this is generally expected to be partially offset by an increase in the return on the plan’s debt investments.
Longevity risk
The present value of the defined benefit obligation was calculated by reference to the best estimate of the longevity of plan participants both during and after their employment. An increase in life expectancy of plan participants will increase the plan’s liability.
Salary risk
The present value of the defined benefit obligation was calculated by reference to the future salaries of plan participants. An increase in the salary of the plan’s participants will increase the plan’s liability.
At December 31, 2013, the company’s US, Canadian and Trinidad defined benefit pension plans were in a surplus position (2012 and 2011 – Trinidad defined benefit pension plan). The company has determined that, in accordance with the terms and conditions of the plans and statutory requirements (such as minimum funding requirements) of the respective
| | |
| 136 | | PotashCorp 2013 Annual Integrated Report |
| | |
| Notes to the consolidated financial statements | | In millions of US dollars except as otherwise noted |
| Note 13 | Pension and other post-retirement benefitscontinued |
jurisdictions, the present value of refunds or reductions in future contributions was higher than the surpluses. This determination was made on a plan-by-plan basis. Therefore, no reduction in the defined benefit asset was required at December 31, 2013 (2012 and 2011 – $NIL).
As a result of operating and workforce changes in 2013, a curtailment occurred in the company’s US plan due to a significant reduction in plan participants. A curtailment gain of $6 was included in past service cost for 2013. There were no significant plan amendments, settlements or other curtailments during 2013.
Description of other post-retirement plans
The company provides contributory health care plans for certain eligible retired employees in the US, Canada and Trinidad. Eligibility for these benefits is generally based on a combination of age and years of service at retirement. Benefits are coordinated with government provided medical insurance in each country. These plans contain certain cost-sharing features such as coinsurance, deductibles and co-payments, and are unfunded, with benefits subject to change. The US plan also provides for maximum lifetime benefits. At retirement, the employee’s spouse and certain dependent children may be eligible for coverage. These benefits are self-insured and are administered through third-party providers. Canadian and Trinidad retirees currently pay 25 percent of the annual cost while US retirees share a larger portion of the
cost, based on inflation. The company’s share of annual inflation is limited to 75 percent of the first 6 percent of total inflation for recent and future eligible retirees. Any cost increases in excess of this amount are funded by retiree contributions. The company currently funds approximately 70 percent of US retiree medical costs while the retirees are responsible for the balance.
The company provides non-contributory life insurance plans for certain US, Canadian and Trinidad retired employees who meet specific age and service eligibility requirements. Retiree life insurance coverage is generally salary- related, which decreases over retirement years according to varying schedules. These benefits are funded through term insurance premiums with local insurance companies in each country.
The company’s other post-retirement plans expose it to similar risks as discussed above related to the defined benefit plans. These plans are not exposed to any other unusual or specific risks.
As a result of operating and workforce changes in 2013, a curtailment occurred in the company’s US plan due to a significant reduction in plan participants. A curtailment gain of $5 was included in past service cost for 2013. There were no significant plan amendments, settlements or other curtailments during 2013.
Financial information
The components of defined benefit expense recognized in the consolidated statements of income for the company’s defined benefit pension and other post-retirement benefit plans, computed actuarially, were as follows:
| | | | | | | | | | | | | | | | | | | | | | | | | | | | | | | | | | | | |
| | | Pension | | | Other | | | Total | |
| | | 2013 | | | 2012 | | | 2011 | | | 2013 | | | 2012 | | | 2011 | | | 2013 | | | 2012 | | | 2011 | |
Current service cost for benefits earned during the year | | $ | 32 | | | $ | 30 | | | $ | 24 | | | $ | 10 | | | $ | 11 | | | $ | 8 | | | $ | 42 | | | $ | 41 | | | $ | 32 | |
Net interest expense (income) | | | 2 | | | | (8 | ) | | | (4 | ) | | | 15 | | | | 17 | | | | 16 | | | | 17 | | | | 9 | | | | 12 | |
Past service cost, including curtailmentgains | | | 1 | | | | – | | | | 4 | | | | (15 | ) | | | (2 | ) | | | (1 | ) | | | (14 | ) | | | (2 | ) | | | 3 | |
Foreign exchange rate changes and other | | | (3 | ) | | | 2 | | | | (1 | ) | | | (3 | ) | | | 1 | | | | (1 | ) | | | (6 | ) | | | 3 | | | | (2 | ) |
Components of defined benefit expense recognized in net income | | $ | 32 | | | $ | 24 | | | $ | 23 | | | $ | 7 | | | $ | 27 | | | $ | 22 | | | $ | 39 | | | $ | 51 | | | $ | 45 | |
Expense included in: | | | | | | | | | | | | | | | | | | | | | | | | | | | | | | | | | | | | |
Cost of goods sold | | | | | | | | | | | | | | | | | | | | | | | | | | $ | 17 | | | $ | 38 | | | $ | 38 | |
Selling and administrative expenses | | | | | | | | | | | | | | | | | | | | | | | | | | | 13 | | | | 10 | | | | 9 | |
Finance costs 1 (Note 20) | | | | | | | | | | | | | | | | | | | | | | | | | | | 17 | | | | – | | | | – | |
Other expenses | | | | | | | | | | | | | | | | | | | | | | | | | | | (8 | ) | | | 3 | | | | (2 | ) |
| 1 | As described in Note 2, the company prospectively adopted amendments to IAS 19, Employee Benefits. |
| | |
| PotashCorp 2013 Annual Integrated Report | | 137 |
| | |
| Notes to the consolidated financial statements | | In millions of US dollars except as otherwise noted |
| Note 13 | Pension and other post-retirement benefitscontinued |
Remeasurements of the net defined benefit liability relating to the company’s pension and other post-retirement benefit plans recognized in OCI in the consolidated statements of comprehensive income were as follows:
| | | | | | | | | | | | | | | | | | | | | | | | | | | | | | | | | | | | |
| | | Pension | | | Other | | | Total | |
| | | 2013 | | | 2012 | | | 2011 | | | 2013 | | | 2012 | | | 2011 | | | 2013 | | | 2012 | | | 2011 | |
Actuarial (gain) loss arising from changes in financial assumptions | | $ | (150 | ) | | $ | 126 | | | $ | 115 | | | $ | (77 | ) | | $ | 1 | | | $ | 47 | | | $ | (227 | ) | | $ | 127 | | | $ | 162 | |
Actuarial loss (gain) arising from changes in demographic assumptions | | | 104 | | | | 4 | | | | 1 | | | | 21 | | | | (3 | ) | | | 6 | | | | 125 | | | | 1 | | | | 7 | |
(Return) loss on plan assets (excluding amounts included in net interest) | | | (154 | ) | | | (35 | ) | | | 42 | | | | – | | | | – | | | | – | | | | (154 | ) | | | (35 | ) | | | 42 | |
Components of defined benefit expense recognized in OCI1 | | $ | (200 | ) | | $ | 95 | | | $ | 158 | | | $ | (56 | ) | | $ | (2 | ) | | $ | 53 | | | $ | (256 | ) | | $ | 93 | | | $ | 211 | |
| 1 | Total net of income taxes was $(164) (2012 – $62, 2011 – $136). |
The change in benefit obligations and the change in plan assets for the above defined benefit pension and other post-retirement benefit plans were as follows at December 31:
| | | | | | | | | | | | | | | | | | | | | | | | |
| | | Pension | | | Other | | | Total | |
| | | 2013 | | | 2012 | | | 2013 | | | 2012 | | | 2013 | | | 2012 | |
Change in benefit obligations | | | | | | | | | | | | | | | | | | | | | | | | |
Balance, beginning of year | | $ | 1,224 | | | $ | 1,051 | | | $ | 388 | | | $ | 366 | | | $ | 1,612 | | | $ | 1,417 | |
Current service cost | | | 32 | | | | 30 | | | | 10 | | | | 11 | | | | 42 | | | | 41 | |
Interest expense | | | 49 | | | | 49 | | | | 15 | | | | 17 | | | | 64 | | | | 66 | |
Actuarial (gain) loss arising from changes in financial assumptions | | | (150 | ) | | | 126 | | | | (77 | ) | | | 1 | | | | (227 | ) | | | 127 | |
Actuarial loss (gain) arising from changes in demographic assumptions | | | 104 | | | | 4 | | | | 21 | | | | (3 | ) | | | 125 | | | | 1 | |
Foreign exchange rate changes | | | (9 | ) | | | 3 | | | | (3 | ) | | | 1 | | | | (12 | ) | | | 4 | |
Contributions by plan participants | | | – | | | | – | | | | 5 | | | | 5 | | | | 5 | | | | 5 | |
Benefits paid | | | (44 | ) | | | (42 | ) | | | (11 | ) | | | (10 | ) | | | (55 | ) | | | (52 | ) |
Past service cost, including curtailment gains | | | (4 | ) | | | 3 | | | | (5 | ) | | | – | | | | (9 | ) | | | 3 | |
Balance, end of year | | | 1,202 | | | | 1,224 | | | | 343 | | | | 388 | | | | 1,545 | | | | 1,612 | |
Change in plan assets | | | | | | | | | | | | | | | | | | | | | | | | |
Fair value, beginning of year | | | 1,052 | | | | 887 | | | | – | | | | – | | | | 1,052 | | | | 887 | |
Interest included in net income | | | 47 | | | | 57 | | | | – | | | | – | | | | 47 | | | | 57 | |
Return on plan assets (excluding amounts included in net interest) | | | 154 | | | | 35 | | | | – | | | | – | | | | 154 | | | | 35 | |
Foreign exchange rate changes and other | | | (6 | ) | | | 1 | | | | – | | | | – | | | | (6 | ) | | | 1 | |
Contributions by plan participants | | | – | | | | – | | | | 5 | | | | 5 | | | | 5 | | | | 5 | |
Employer contributions | | | 49 | | | | 114 | | | | 6 | | | | 5 | | | | 55 | | | | 119 | |
Benefits paid | | | (44 | ) | | | (42 | ) | | | (11 | ) | | | (10 | ) | | | (55 | ) | | | (52 | ) |
Fair value, end of year | | | 1,252 | | | | 1,052 | | | | – | | | | – | | | | 1,252 | | | | 1,052 | |
Funded status | | | 50 | | | | (172 | ) | | | (343 | ) | | | (388 | ) | | | (293 | ) | | | (560 | ) |
Unvested past service cost not recognized in statements of financial position 1 | | | – | | | | 5 | | | | – | | | | (10 | ) | | | – | | | | (5 | ) |
Pension and other post-retirement benefit assets (liabilities) | | $ | 50 | | | $ | (167 | ) | | $ | (343 | ) | | $ | (398 | ) | | $ | (293 | ) | | $ | (565 | ) |
Balance comprised of: | | | | | | | | | | | | | | | | | | | | | | | | |
Non-current assets | | | | | | | | | | | | | | | | | | | | | | | | |
Other assets (Note 7) | | $ | 129 | | | $ | 16 | | | $ | – | | | $ | – | | | $ | 129 | | | $ | 16 | |
Current liabilities | | | | | | | | | | | | | | | | | | | | | | | | |
Payables and accrued charges (Note 10) | | | (3 | ) | | | (3 | ) | | | (9 | ) | | | (9 | ) | | | (12 | ) | | | (12 | ) |
Non-current liabilities | | | | | | | | | | | | | | | | | | | | | | | | |
Pension and other post-retirement benefit liabilities | | | (76 | ) | | | (180 | ) | | | (334 | ) | | | (389 | ) | | | (410 | ) | | | (569 | ) |
Pension and other post-retirement benefit assets (liabilities) | | $ | 50 | | | $ | (167 | ) | | $ | (343 | ) | | $ | (398 | ) | | $ | (293 | ) | | $ | (565 | ) |
| 1 | As described in Note 2, the company prospectively adopted amendments to IAS 19, Employee Benefits. Unvested past service cost was recognized in the company’s consolidated financial statements on January 1, 2013. |
| | |
| 138 | | PotashCorp 2013 Annual Integrated Report |
| | |
| Notes to the consolidated financial statements | | In millions of US dollars except as otherwise noted |
| Note 13 | Pension and other post-retirement benefitscontinued |
Plan assets
The fair value of plan assets of the company’s defined benefit pension plans, by asset category, was as follows at December 31:
| | | | | | | | | | | | | | | | | | | | |
| | | 2013 | | | 2012 | |
| | | Quoted Prices in
Active Markets for
Identical Assets (Level 1) | | Other (Levels 2 & 3) | | | Total | | | Quoted Prices in
Active Markets for
Identical Assets (Level 1) | | Other (Levels 2 & 3) | | | Total | |
Cash and cash equivalents | | $ 5 | | $ | 20 | | | $ | 25 | | | $ 8 | | $ | 36 | | | $ | 44 | |
Equity securities | | | | | | | | | | | | | | | | | | | | |
US | | 180 | | | – | | | | 180 | | | 132 | | | – | | | | 132 | |
International | | 22 | | | 35 | | | | 57 | | | 15 | | | 28 | | | | 43 | |
Mutual/commingled funds | | 360 | | | 397 | | | | 757 | | | 276 | | | 350 | | | | 626 | |
Debt securities | | | | | | | | | | | | | | | | | | | | |
US corporate debt instruments | | – | | | 53 | | | | 53 | | | – | | | 48 | | | | 48 | |
International corporate debt instruments | | – | | | 27 | | | | 27 | | | – | | | 26 | | | | 26 | |
US government and agency securities | | – | | | 84 | | | | 84 | | | – | | | 91 | | | | 91 | |
International government and agency securities | | – | | | 49 | | | | 49 | | | – | | | 42 | | | | 42 | |
Mortgage-backed securities | | – | | | 27 | | | | 27 | | | – | | | 23 | | | | 23 | |
Other | | (16) | | | 9 | | | | (7 | ) | | (24) | | | 1 | | | | (23 | ) |
Total pension plan assets | | $ 551 | | $ | 701 | | | $ | 1,252 | | | $ 407 | | $ | 645 | | | $ | 1,052 | |
Letters of credit secured certain of the Canadian unfunded defined benefit plan liabilities as at December 31, 2013 and 2012.
DEFINED CONTRIBUTION PLANS
ACCOUNTING POLICIES
Defined contribution plan costs are recognized in net income for services rendered by employees during the period.
SUPPORTING INFORMATION
All of the company’s US employees may participate in defined contribution savings plans, which are subject to US federal tax limitations and provide for voluntary employee salary deduction contributions. The company contribution provides a minimum of 0 percent (to a maximum of 6 percent) of salary depending on employee contributions and company performance.
All of the company’s Canadian salaried employees and certain hourly employees participate in the PCS Inc. Savings Plan and may make voluntary contributions. The company contribution provides a minimum of 3 percent (to a maximum of 6 percent) of salary based on company performance. Certain of the company’s Canadian employees participate in the contributory PCS Inc.
Pension Plan. The member contributes to the plan at the rate of 5.5 percent of his/her earnings, or such other percentage amount as may be established by a collective agreement, and the company contributes for each member at the same rate. The member may also elect to make voluntary additional contributions.
Certain of the company’s Trinidad employees participate in a defined contribution plan. The company contributes to the plan at the rate of 4 percent of the earnings of a participating employee.
The company’s contributions, and the amounts recognized as an expense, to its defined contribution plans were as follows:
| | | | | | | | | | | | |
| | | 2013 | | | 2012 | | | 2011 | |
US savings plan | | $ | 9 | | | $ | 9 | | | $ | 8 | |
Canadian pension plan | | | 12 | | | | 12 | | | | 11 | |
Canadian savings plan | | | 10 | | | | 9 | | | | 8 | |
Trinidad pension plan | | | 1 | | | | 1 | | | | 1 | |
| | | $ | 32 | | | $ | 31 | | | $ | 28 | |
| | |
| PotashCorp 2013 Annual Integrated Report | | 139 |
| | |
| Notes to the consolidated financial statements | | In millions of US dollars except as otherwise noted |
| Note 13 | Pension and other post-retirement benefitscontinued |
CASH PAYMENTS TO ALL PLANS
Total cash payments for pensions and other post-retirement benefits for 2013, consisting of cash contributed by the company to its funded defined benefit pension plans, cash payments directly to beneficiaries for its unfunded other benefit plans and cash contributed to its defined contribution plans, were $87 (2012 – $150, 2011 – $195).
As described above, the company funds its defined benefit pension plans based on local actuarial valuations and makes funding decisions that meet minimum local regulatory requirements. There are no additional funding arrangements that would significantly affect projected future contributions at the end of the reporting period.
The company expects to contribute approximately the following to all pension and post-retirement plans during 2014:
| | | | |
Defined benefit pension plans | | $ | 11 | |
Defined benefit other post-retirement plans | | | 9 | |
Defined contribution plans | | | 33 | |
Total | | $ | 53 | |
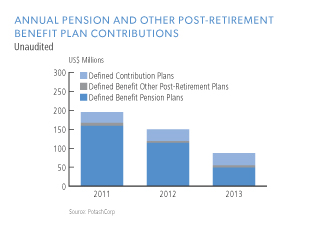
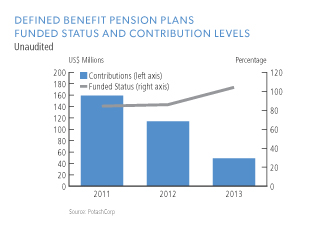
| NOTE 14 | PROVISIONS FOR ASSET RETIREMENT, ENVIRONMENTAL AND OTHER OBLIGATIONS |
ACCOUNTING POLICIES
Provisions are recognized when: the company has a present legal or constructive obligation as a result of past events; it is probable that an outflow of resources will be required to settle the obligation; and the amount has been reliably estimated. Provisions are not recognized for costs that need to be incurred to operate in the future or expected future operating losses.
The company recognizes provisions for termination benefits at the earlier of when the company can no longer withdraw the offer of the termination benefits and when the company recognizes any related restructuring costs.
Provisions are measured at the present value of the expenditures expected to be required to settle the obligation, using a pre-tax risk-free discount rate that reflects current market assessments of the time value of money and the risks specific to the obligation.
Environmental costs that relate to current operations are expensed or capitalized, as appropriate. Environmental costs may be capitalized if they extend the life of the property, increase its capacity, mitigate or prevent contamination from future operations, or relate to legal or constructive asset retirement obligations. Costs that relate to existing conditions caused by past operations and that do not contribute to current or future revenue generation are expensed. Provisions for estimated costs are recorded when environmental remedial efforts are likely and the costs can be reasonably estimated. In determining the provisions, the company uses the most current information available, including similar past experiences, available technology, regulations in effect, the timing of remediation and cost-sharing arrangements.
The company recognizes provisions for decommissioning obligations (also known as asset retirement obligations) primarily related to mining and mineral activities. The major categories of asset retirement obligations are reclamation
| | |
| 140 | | PotashCorp 2013 Annual Integrated Report |
| | |
| Notes to the consolidated financial statements | | In millions of US dollars except as otherwise noted |
| Note 14 | Provisions for asset retirement, environmental and other obligationscontinued |
and restoration costs at its potash and phosphate mining operations, including management of materials generated by mining and mineral processing, such as various mine tailings and gypsum; land reclamation and revegetation programs; decommissioning of underground and surface operating facilities; general cleanup activities aimed at returning the areas to an environmentally acceptable condition; and post-closure care and maintenance.
The present value of a liability for a decommissioning obligation is recognized in the period in which it is incurred if a reasonable estimate of present value can be made. The associated costs are: capitalized as part of the carrying amount of any related long-lived asset and then amortized over its estimated remaining useful life; capitalized as part of inventory; or expensed in the period. The best estimate of the amount required to settle the obligation is reviewed at the end of each reporting period and updated to reflect changes in the discount and foreign exchange rates and the amount or timing of the underlying cash flows. When there is a change in the best estimate, an adjustment is recorded against the carrying value of the provision and any related asset, and the effect is then recognized in net income over the remaining life of the asset. The increase in the provision due to the passage of time is recognized as a finance cost. A gain or loss may be incurred upon settlement of the liability.
Other environmental obligations generally relate to regulatory compliance, environmental management practices associated with ongoing operations other than mining, site assessment and remediation of environmental contamination related to the activities of the company and its predecessors, including waste disposal practices and ownership and operation of real property and facilities.
ACCOUNTING ESTIMATES AND JUDGMENTS
The company has recorded provisions relating to asset retirement obligations, and environmental and other matters. Most of these costs will not be settled for a number of years, therefore requiring it to make estimates over a long period. Environmental laws and regulations and interpretations by regulatory authorities could change or circumstances affecting the company’s operations could change, either of which could result in significant changes to its current plans. The recorded provisions are based on its best estimate of costs required to settle the obligations, taking into account the nature, extent and timing of current and proposed reclamation and closure techniques in view of present environmental laws and regulations. It is reasonably possible that the ultimate costs could change in the future and that changes to these estimates could have a material effect on the company’s consolidated financial statements.
The estimation of asset retirement obligation costs depends on the development of environmentally acceptable closure and post-closure plans. In some cases, this may require significant research and development to identify preferred methods for such plans that are economically sound and that, in most cases, may not be implemented for several decades. The company uses appropriate technical resources, including outside consultants, to develop specific site closure and post-closure plans in accordance with the requirements of the various jurisdictions in which it operates. Other than certain land reclamation programs, settlement of the obligations is typically correlated with mine life estimates. Cash flow payments are expected to occur principally over the next 86 years for the company’s phosphate obligations with the majority taking place over the next 36 years. Payments relating to most potash obligations are not expected to begin until after that time.
Employee termination activities are complex processes that can take months to complete and involve making and reassessing estimates.
SENSITIVITY OF ASSUMPTIONS
Sensitivity of asset retirement obligations to changes in the discount rate and inflation rate on the recorded liability as at December 31, 2013 is as follows:
| | | | | | | | | | | | | | | | | | | | | | | | |
| | | Undiscounted
Cash Flows | | | Discounted Cash Flows | | | Discount Rate | | | Inflation Rate | |
| | | | +0.5% | | | -0.5% | | | +0.5% | | | -0.5% | |
Potash obligation1 | | $ | 655 | 2 | | $ | 40 | | | $ | (5) | | | $ | 7 | | | $ | 9 | | | $ | (6) | |
Nitrogen obligation | | | 62 | | | | 2 | | | | (1) | | | | 1 | | | | 1 | | | | (1) | |
Phosphate obligation | | | 1,044 | | | | 529 | | | | (35) | | | | 40 | | | | 41 | | | | (36) | |
| 1 | Stated in Canadian dollars. |
| 2 | Represents total undiscounted cash flows in the first year of decommissioning. Excludes subsequent years of tailings dissolution and final decommissioning, which is estimated to take an additional53-279 years. |
| | |
| PotashCorp 2013 Annual Integrated Report | | 141 |
| | |
| Notes to the consolidated financial statements | | In millions of US dollars except as otherwise noted |
| Note 14 | Provisions for asset retirement, environmental and other obligationscontinued |
SUPPORTING INFORMATION
Following is a reconciliation of asset retirement, environmental restoration and other obligations:
| | | | | | | | | | | | | | | | | | | | |
| | | Asset Retirement Obligations | | | Environmental Restoration Obligations | | | Subtotal | | | Other
Obligations | | | Total | |
Balance – December 31, 2012 | | $ | 647 | | | $ | 28 | | | $ | 675 | | | $ | 53 | | | $ | 728 | |
Charged (credited) to income | | | | | | | | | | | | | | | | | | | | |
New obligations | | | 3 | | | | 2 | | | | 5 | | | | 60 | | | | 65 | |
Change in discount rate | | | (31 | ) | | | – | | | | (31 | ) | | | – | | | | (31 | ) |
Change in other estimates | | | 39 | | | | 7 | | | | 46 | | | | – | | | | 46 | |
Unwinding of discount | | | 13 | | | | – | | | | 13 | | | | – | | | | 13 | |
Capitalized to property, plant and equipment | | | | | | | | | | | | | | | | | | | | |
Change in discount rate | | | (54 | ) | | | – | | | | (54 | ) | | | – | | | | (54 | ) |
Change in other estimates | | | (21 | ) | | | – | | | | (21 | ) | | | – | | | | (21 | ) |
Settled during period | | | (25 | ) | | | (8 | ) | | | (33 | ) | | | (52 | ) | | | (85 | ) |
Exchange differences | | | (2 | ) | | | – | | | | (2 | ) | | | – | | | | (2 | ) |
Balance – December 31, 2013 | | $ | 569 | | | $ | 29 | | | $ | 598 | | | $ | 61 | | | $ | 659 | |
Balance at December 31, 2013 comprised of: | | | | | | | | | | | | | | | | | | | | |
Current liabilities | | | | | | | | | | | | | | | | | | | | |
Payables and accrued charges (Note 10) | | $ | 36 | | | $ | 5 | | | $ | 41 | | | $ | 61 | | | $ | 102 | |
Non-current liabilities | | | | | | | | | | | | | | | | | | | | |
Asset retirement obligations and accrued environmental costs | | | 533 | | | | 24 | | | | 557 | | | | – | | | | 557 | |
| | | $ | 569 | | | $ | 29 | | | $ | 598 | | | $ | 61 | | | $ | 659 | |
Balance – December 31, 2011 | | $ | 617 | | | $ | 24 | | | $ | 641 | | | $ | 13 | | | $ | 654 | |
Charged (credited) to income | | | | | | | | | | | | | | | | | | | | |
New obligations | | | 3 | | | | – | | | | 3 | | | | 44 | | | | 47 | |
Change in discount rate | | | (4 | ) | | | – | | | | (4 | ) | | | – | | | | (4 | ) |
Change in other estimates | | | – | | | | 6 | | | | 6 | | | | – | | | | 6 | |
Unwinding of discount | | | 12 | | | | – | | | | 12 | | | | – | | | | 12 | |
Capitalized to property, plant and equipment | | | | | | | | | | | | | | | | | | | | |
Change in discount rate | | | (11 | ) | | | – | | | | (11 | ) | | | – | | | | (11 | ) |
Change in other estimates | | | 47 | | | | – | | | | 47 | | | | – | | | | 47 | |
Settled during period | | | (17 | ) | | | (2 | ) | | | (19 | ) | | | (4 | ) | | | (23 | ) |
Balance – December 31, 2012 | | $ | 647 | | | $ | 28 | | | $ | 675 | | | $ | 53 | | | $ | 728 | |
Balance at December 31, 2012 comprised of: | | | | | | | | | | | | | | | | | | | | |
Current liabilities | | | | | | | | | | | | | | | | | | | | |
Payables and accrued charges (Note 10) | | $ | 24 | | | $ | 6 | | | $ | 30 | | | $ | 53 | | | $ | 83 | |
Non-current liabilities | | | | | | | | | | | | | | | | | | | | |
Asset retirement obligations and accrued environmental costs | | | 623 | | | | 22 | | | | 645 | | | | – | | | | 645 | |
| | | $ | 647 | | | $ | 28 | | | $ | 675 | | | $ | 53 | | | $ | 728 | |
Asset retirement obligations
The estimated cash flows required to settle the asset retirement obligations have been discounted at a risk-free rate, specific to the timing of cash flows and the jurisdiction of the obligation. The rate for phosphate operations ranged from 1.72 percent to 3.94 percent at December 31, 2013 (2012 – 0.93 percent to 2.94 percent). The rate for potash operations primarily was 6 percent at December 31, 2013 (2012 – 6 percent).
Environmental operating and capital expenditures
The company’s operations are subject to numerous environmental requirements under federal, provincial, state and local laws and regulations of Canada, the US, and Trinidad and Tobago. These laws and regulations govern matters such as air emissions, wastewater discharges, land use and reclamation, and solid and hazardous waste management. Many of these laws, regulations and permit requirements are becoming increasingly stringent, and the cost of compliance can be expected to rise over time.
| | |
| 142 | | PotashCorp 2013 Annual Integrated Report |
| | |
| Notes to the consolidated financial statements | | In millions of US dollars except as otherwise noted |
| Note 14 | Provisions for asset retirement, environmental and other obligationscontinued |
The company’s operating expenses, other than costs associated with asset retirement obligations, relating to compliance with environmental laws and regulations governing ongoing operations for 2013 were $135 (2012 – $153, 2011 – $131).
The company routinely undertakes environmental capital projects. In 2013, capital expenditures of $83 (2012 – $81, 2011 – $69) were incurred to meet pollution prevention and control as well as other environmental objectives.
Other obligations
Other obligations are comprised of provisions for employee termination benefits, litigation claims and community investment. At December 31, 2013, other obligations included a provision of $56 for termination benefits related to operating and workforce changes in the US, Canada and Trinidad, which are expected to be settled in 2014.
Authorized
The company is authorized to issue an unlimited number of common shares without par value and an unlimited number of first preferred shares. The common shares are not redeemable or convertible. The first preferred shares may be issued in one or more series with rights and conditions to be determined by the Board of Directors. No first preferred shares have been issued.
Issued
| | | | | | | | |
| | | Number of Common Shares | | | Consideration | |
Balance, December 31, 2010 | | | 853,122,693 | | | $ | 1,431 | |
Issued under option plans | | | 5,490,335 | | | | 48 | |
Issued for dividend reinvestment plan | | | 89,963 | | | | 4 | |
Balance, December 31, 2011 | | | 858,702,991 | | | $ | 1,483 | |
Issued under option plans | | | 5,895,730 | | | | 47 | |
Issued for dividend reinvestment plan | | | 301,792 | | | | 13 | |
Balance, December 31, 2012 | | | 864,900,513 | | | $ | 1,543 | |
Issued under option plans | | | 4,492,409 | | | | 52 | |
Issued for dividend reinvestment plan | | | 868,503 | | | | 30 | |
Repurchased | | | (14,145,100 | ) | | | (25 | ) |
Balance, December 31, 2013 | | | 856,116,325 | | | $ | 1,600 | |
Share repurchase program
On July 24, 2013, the company’s Board of Directors authorized a share repurchase program of up to 5 percent of PotashCorp’s outstanding common shares (up to $2,000 of its outstanding common shares) through a normal course issuer bid. Shares may be repurchased from time to time on the open market commencing August 2, 2013 through August 1, 2014 at prevailing market prices. The timing and amount of purchases under the program are dependent upon the availability and alternative uses of capital, market conditions, applicable US and Canadian regulations and other factors.
Under this program, the company repurchased for cancellation 14,145,100 common shares during 2013, at a cost of $445 and an average price per share
of $31.46. The repurchase resulted in a reduction of share capital of $25, and the excess of net cost over the average book value of the shares was recorded as a reduction of contributed surplus of $82 and a reduction of retained earnings of $338.
Dividends declared
On January 29, 2014, the company’s Board of Directors declared a quarterly dividend of $0.35 per share payable to shareholders on May 1, 2014. The declared dividend is payable to all shareholders of record on April 10, 2014. The total estimated dividend to be paid is $293. The payment of this dividend will not have any tax consequences for the company.
| | |
| PotashCorp 2013 Annual Integrated Report | | 143 |
| | |
| Notes to the consolidated financial statements | | In millions of US dollars except as otherwise noted |
| NOTE 16 | SEGMENT INFORMATION |
The company has three reportable operating segments: potash, nitrogen and phosphate. These reportable operating segments are differentiated by the chemical nutrient contained in the product that each produces.
ACCOUNTING POLICIES
Inter-segment sales are made under terms that approximate market value. The accounting policies of the segments are the same as those described in Note 2 and other relevant notes and are measured in a manner consistent with that of the financial statements.
Sales revenue is recognized when the product is shipped, the sales price and costs incurred or to be incurred can be measured reliably, and collectibility is
probable. Revenue is recorded based on the FOB mine, plant, warehouse or terminal price, except for certain vessel sales or specific product sales that are shipped on a delivered basis. Transportation costs are recovered from the customer through sales pricing. Revenue is measured at the fair value of the consideration received or receivable, taking into account the amount of any trade discounts and volume rebates allowed.
ACCOUNTING ESTIMATES AND JUDGMENTS
The company’s operating segments have been determined based on reports reviewed by the Chief Executive Officer, its chief operating decision-maker, that are used to make strategic decisions.
SUPPORTING INFORMATION
Financial information on each of these segments is summarized in the following tables:
| | | | | | | | | | | | | | | | | | | | |
| 2013 | | | | | | | | | | | | | | | |
| | | Potash | | | Nitrogen | | | Phosphate | | | All Others | | | Consolidated | |
Sales – third party | | $ | 2,963 | | | $ | 2,275 | | | $ | 2,067 | | | $ | – | | | $ | 7,305 | |
Freight, transportation and distribution – third party | | | (256 | ) | | | (101 | ) | | | (215 | ) | | | – | | | | (572 | ) |
Net sales – third party | | | 2,707 | | | | 2,174 | | | | 1,852 | | | | – | | | | | |
Cost of goods sold – third party | | | (1,134 | ) | | | (1,316 | ) | | | (1,493 | ) | | | – | | | | (3,943 | ) |
Margin (cost) on inter-segment sales 1 | | | – | | | | 55 | | | | (55 | ) | | | – | | | | – | |
Gross margin | | | 1,573 | | | | 913 | | | | 304 | | | | – | | | | 2,790 | |
Depreciation and amortization | | | (196 | ) | | | (161 | ) | | | (294 | ) | | | (15 | ) | | | (666 | ) |
Assets | | | 9,262 | | | | 2,215 | | | | 2,468 | | | | 4,013 | | | | 17,958 | |
Cash flows for additions to property, plant and equipment | | | 1,151 | | | | 184 | | | | 238 | | | | 51 | | | | 1,624 | |
1 Inter-segment net sales were $139. | | | | | | | | | | | | | | | | | | | | |
| | | | | |
| 2012 | | | | | | | | | | | | | | | |
| | | Potash | | | Nitrogen | | | Phosphate | | | All Others | | | Consolidated | |
Sales – third party | | $ | 3,285 | | | $ | 2,350 | | | $ | 2,292 | | | $ | – | | | $ | 7,927 | |
Freight, transportation and distribution – third party | | | (206 | ) | | | (97 | ) | | | (191 | ) | | | – | | | | (494 | ) |
Net sales – third party | | | 3,079 | | | | 2,253 | | | | 2,101 | | | | – | | | | | |
Cost of goods sold – third party | | | (1,116 | ) | | | (1,341 | ) | | | (1,566 | ) | | | – | | | | (4,023 | ) |
Margin (cost) on inter-segment sales 1 | | | – | | | | 66 | | | | (66 | ) | | | – | | | | – | |
Gross margin | | | 1,963 | | | | 978 | | | | 469 | | | | – | | | | 3,410 | |
Depreciation and amortization | | | (169 | ) | | | (138 | ) | | | (261 | ) | | | (10 | ) | | | (578 | ) |
Assets | | | 8,597 | | | | 2,262 | | | | 2,562 | | | | 4,785 | | | | 18,206 | |
Cash flows for additions to property, plant and equipment | | | 1,424 | | | | 379 | | | | 245 | | | | 85 | | | | 2,133 | |
1 Inter-segment net sales were $153. | | | | | | | | | | | | | | | | | | | | |
| | | | | |
| 2011 | | | | | | | | | | | | | | | |
| | | Potash | | | Nitrogen | | | Phosphate | | | All Others | | | Consolidated | |
Sales – third party | | $ | 3,983 | | | $ | 2,254 | | | $ | 2,478 | | | $ | – | | | $ | 8,715 | |
Freight, transportation and distribution – third party | | | (244 | ) | | | (86 | ) | | | (166 | ) | | | – | | | | (496 | ) |
Net sales – third party | | | 3,739 | | | | 2,168 | | | | 2,312 | | | | – | | | | | |
Cost of goods sold – third party | | | (1,017 | ) | | | (1,311) | | | | (1,605) | | | | – | | | | (3,933 | ) |
Margin (cost) on inter-segment sales 1 | | | – | | | | 59 | | | | (59 | ) | | | – | | | | – | |
Gross margin | | | 2,722 | | | | 916 | | | | 648 | | | | – | | | | 4,286 | |
Depreciation and amortization | | | (142 | ) | | | (132 | ) | | | (207 | ) | | | (8 | ) | | | (489 | ) |
Assets | | | 7,444 | | | | 2,005 | | | | 2,754 | | | | 4,054 | | | | 16,257 | |
Cash flows for additions to property, plant and equipment | | | 1,717 | | | | 260 | | | | 159 | | | | 40 | | | | 2,176 | |
| 1 | Inter-segment net sales were $179. |
Termination benefit costs of $60 related to operating and workforce changes were recognized during 2013 in the company’s operating segments as follows: potash $32; nitrogen $1; phosphate $17 and all others $10.
| | |
| 144 | | PotashCorp 2013 Annual Integrated Report |
| | |
| Notes to the consolidated financial statements | | In millions of US dollars except as otherwise noted |
| Note 16 | Segment informationcontinued |
As described in Note 1, Canpotex and PhosChem executed offshore marketing, sales and distribution functions for certain of the company’s products. Financial information by geographic area is summarized in the following tables:
| | | | | | | | | | | | | | | | | | | | |
| 2013 | | Country of Origin | |
| | | Canada | | | United States | | | Trinidad | | | Other | | | Consolidated | |
Sales to customers outside the company | | | | | | | | | | | | | | | | | | | | |
Canada | | $ | 165 | | | $ | 200 | | | $ | – | | | $ | – | | | $ | 365 | |
United States | | | 1,285 | | | | 2,580 | | | | 611 | | | | – | | | | 4,476 | |
Canpotex (Canpotex’s 2013 sales volumes were made to: Latin America 28%, China 15%, India 10%, other Asian countries 41%, other countries 6%) | | | 1,253 | | | | – | | | | – | | | | – | | | | 1,253 | |
PhosChem (PhosChem’s 2013 sales volumes were made to:
Latin America 55%, India 14%, China NIL%, other Asian countries 16%, other countries 15%) | | | – | | | | 97 | | | | – | | | | – | | | | 97 | |
Mexico | | | 6 | | | | 106 | | | | – | | | | – | | | | 112 | |
Trinidad | | | – | | | | – | | | | 285 | | | | – | | | | 285 | |
Brazil | | | 168 | | | | 41 | | | | – | | | | – | | | | 209 | |
Colombia | | | 30 | | | | 10 | | | | 58 | | | | – | | | | 98 | |
Other Latin America | | | 56 | | | | 38 | | | | 62 | | | | – | | | | 156 | |
India | | | – | | | | 224 | | | | – | | | | – | | | | 224 | |
Other | | | – | | | | 21 | | | | 9 | | | | – | | | | 30 | |
| | | $ | 2,963 | | | $ | 3,317 | | | $ | 1,025 | | | $ | – | | | $ | 7,305 | |
Non-current assets 1 | | $ | 8,844 | | | $ | 3,116 | | | $ | 637 | | | $ | 18 | | | $ | 12,615 | |
| 1 | Includes non-current assets other than financial instruments, equity-accounted investees, deferred tax assets and post-employment benefit assets. |
| | |
| PotashCorp 2013 Annual Integrated Report | | 145 |
| | |
| Notes to the consolidated financial statements | | In millions of US dollars except as otherwise noted |
| Note 16 | Segment informationcontinued |
| | | | | | | | | | | | | | | | | | | | |
| 2012 | | Country of Origin | |
| | | Canada | | | United States | | | Trinidad | | | Other | | | Consolidated | |
Sales to customers outside the company | | | | | | | | | | | | | | | | | | | | |
Canada | | $ | 200 | | | $ | 188 | | | $ | – | | | $ | – | | | $ | 388 | |
United States | | | 1,287 | | | | 2,648 | | | | 710 | | | | – | | | | 4,645 | |
Canpotex (Canpotex’s 2012 sales volumes were made to: Latin America 29%, China 12%, India 5%, other Asian countries 49%, other countries 5%) | | | 1,492 | | | | – | | | | – | | | | – | | | | 1,492 | |
PhosChem (PhosChem’s 2012 sales volumes were made to: Latin America 40%, India 28%, China NIL%, other countries 19%, other Asian countries 13%) | | | – | | | | 248 | | | | – | | | | – | | | | 248 | |
Mexico | | | 13 | | | | 110 | | | | 5 | | | | – | | | | 128 | |
Trinidad | | | – | | | | – | | | | 286 | | | | – | | | | 286 | |
Brazil | | | 195 | | | | 45 | | | | – | | | | – | | | | 240 | |
Colombia | | | 39 | | | | 17 | | | | 83 | | | | – | | | | 139 | |
Other Latin America | | | 59 | | | | 42 | | | | 73 | | | | – | | | | 174 | |
India | | | – | | | | 143 | | | | – | | | | – | | | | 143 | |
Other | | | – | | | | 35 | | | | 9 | | | | – | | | | 44 | |
| | | $ | 3,285 | | | $ | 3,476 | | | $ | 1,166 | | | $ | – | | | $ | 7,927 | |
Non-current assets 1 | | $ | 8,084 | | | $ | 3,168 | | | $ | 651 | | | $ | 20 | | | $ | 11,923 | |
| 1 | Includes non-current assets other than financial instruments, equity-accounted investees, deferred tax assets and post-employment benefit assets. |
| | | | | | | | | | | | | | | | | | | | |
| 2011 | | Country of Origin | |
| | | Canada | | | United States | | | Trinidad | | | Other | | | Consolidated | |
Sales to customers outside the company | | | | | | | | | | | | | | | | | | | | |
Canada | | $ | 142 | | | $ | 183 | | | $ | – | | | $ | – | | | $ | 325 | |
United States | | | 1,580 | | | | 2,576 | | | | 819 | | | | – | | | | 4,975 | |
Canpotex (Canpotex’s 2011 sales volumes were made to: Latin America 26%, China 17%, India 9%, other Asian countries 43%, other countries 5%) | | | 1,956 | | | | – | | | | – | | | | – | | | | 1,956 | |
PhosChem (PhosChem’s 2011 sales volumes were made to: India 54%, Latin America 27%, China NIL%, other countries 11%, other Asian countries 8%) | | | – | | | | 563 | | | | – | | | | – | | | | 563 | |
Mexico | | | 19 | | | | 114 | | | | 14 | | | | – | | | | 147 | |
Trinidad | | | – | | | | – | | | | 174 | | | | – | | | | 174 | |
Brazil | | | 160 | | | | 50 | | | | 9 | | | | – | | | | 219 | |
Colombia | | | 42 | | | | 8 | | | | 80 | | | | – | | | | 130 | |
Other Latin America | | | 84 | | | | 42 | | | | 68 | | | | – | | | | 194 | |
Other | | | – | | | | 23 | | | | 9 | | | | – | | | | 32 | |
| | | $ | 3,983 | | | $ | 3,559 | | | $ | 1,173 | | | $ | – | | | $ | 8,715 | |
Non-current assets 1 | | $ | 6,783 | | | $ | 2,775 | | | $ | 660 | | | $ | 23 | | | $ | 10,241 | |
| 1 | Includes non-current assets other than financial instruments, equity-accounted investees, deferred tax assets and post-employment benefit assets. |
| | |
| 146 | | PotashCorp 2013 Annual Integrated Report |
| | |
| Notes to the consolidated financial statements | | In millions of US dollars except as otherwise noted |
| NOTE 17 | NATURE OF EXPENSES |
ACCOUNTING POLICIES
Cost of goods sold are costs primarily incurred at, and charged to, an active producing facility and primary components include: labor, employee benefits, services, raw materials (including inbound freight and purchasing and receiving costs), operating supplies, energy costs, on-site warehouse costs, royalties, property and miscellaneous taxes, and depreciation and amortization.
The primary components of selling and administrative expenses are compensation, other employee benefits, supplies, communications, travel, professional services, and depreciation and amortization.
SUPPORTING INFORMATION
Expenses by nature were comprised of:
| | | | | | | | | | | | | | | | |
| | | Cost of Goods Sold | | | | | Selling and
Administrative
Expenses | | | | | Total | |
2013 | | | | | | | | | | | | | | | | |
Employee costs1 | | $ | 703 | | | | | $ | 102 | | | | | $ | 805 | |
Depreciation and amortization | | | 658 | | | | | | 8 | | | | | | 666 | |
Other | | | 2,582 | | | | | | 121 | | | | | | 2,703 | |
| | | $ | 3,943 | | | | | $ | 231 | | | | | $ | 4,174 | |
2012 | | | | | | | | | | | | | | | | |
Employee costs1 | | $ | 617 | | | | | $ | 99 | | | | | $ | 716 | |
Depreciation and amortization | | | 572 | | | | | | 6 | | | | | | 578 | |
Other | | | 2,834 | | | | | | 114 | | | | | | 2,948 | |
| | | $ | 4,023 | | | | | $ | 219 | | | | | $ | 4,242 | |
2011 | | | | | | | | | | | | | | | | |
Employee costs1 | | $ | 611 | | | | | $ | 98 | | | | | $ | 709 | |
Depreciation and amortization | | | 483 | | | | | | 6 | | | | | | 489 | |
Other | | | 2,839 | | | | | | 113 | | | | | | 2,952 | |
| | | $ | 3,933 | | | | | $ | 217 | | | | | $ | 4,150 | |
| 1 | Includes employee benefits and share-based compensation. |
| NOTE 18 | PROVINCIAL MINING AND OTHER TAXES |
| | | | | | | | | | | | | | | | |
| | | 2013 | | | | | 2012 | | | | | 2011 | |
Potash production tax | | $ | 113 | | | | | $ | 92 | | | | | $ | 39 | |
Saskatchewan resource surcharge and other | | | 81 | | | | | | 88 | | | | | | 108 | |
| | | $ | 194 | | | | | $ | 180 | | | | | $ | 147 | |
| | | | | | | | | | | | | | | | |
| | | 2013 | | | | | 2012 | | | | | 2011 | |
Legal matters | | $ | 3 | | | | | $ | 43 | | | | | $ | – | |
Foreign exchange gain | | | (18 | ) | | | | | (7 | ) | | | | | (7 | ) |
Takeover response costs | | | – | | | | | | – | | | | | | 2 | |
Other | | | 51 | | | | | | 37 | | | | | | 18 | |
| | | $ | 36 | | | | | $ | 73 | | | | | $ | 13 | |
| | |
| PotashCorp 2013 Annual Integrated Report | | 147 |
| | |
| Notes to the consolidated financial statements | | In millions of US dollars except as otherwise noted |
| | | | | | | | | | | | |
| | | 2013 | | | 2012 | | | 2011 | |
Interest expense on | | | | | | | | | | | | |
Short-term debt | | $ | 4 | | | $ | 5 | | | $ | 8 | |
Long-term debt | | | 192 | | | | 203 | | | | 227 | |
Interest on net defined benefit pension and other post-retirement plan obligations (Note 13) | | | 17 | | | | – | | | | – | |
Unwinding of discount on asset retirement obligations (Note 14) | | | 13 | | | | 12 | | | | 16 | |
Borrowing costs capitalized to property, plant and equipment | | | (79 | ) | | | (102 | ) | | | (84 | ) |
Interest income | | | (3 | ) | | | (4 | ) | | | (8 | ) |
| | | $ | 144 | | | $ | 114 | | | $ | 159 | |
Borrowing costs capitalized to property, plant and equipment during 2013 were calculated by applying an average capitalization rate of 4.9 percent (2012 – 4.6 percent, 2011 – 4.4 percent) to expenditures on qualifying assets.
ACCOUNTING POLICIES
Taxation on earnings comprises current and deferred income tax. Taxation is recognized in the statements of income except to the extent that it relates to items recognized in OCI or contributed surplus, in which case the tax is recognized in OCI or contributed surplus as applicable.
Current income tax is generally the expected tax payable on the taxable income for the year calculated using rates enacted or substantively enacted at the consolidated statements of financial position date in the countries where the company’s subsidiaries and equity-accounted investees operate and generate taxable income. It includes any adjustment to income tax payable or recoverable in respect of previous years. The realized and unrealized excess tax benefit from share-based payment arrangements is recognized in contributed surplus as current and deferred tax, respectively.
Uncertain income tax positions are accounted for using the standards applicable to current income tax liabilities and assets; i.e., both liabilities and assets are recorded when probable and measured at the amount expected to be paid to (recovered from) the taxation authorities using the company’s best estimate of the amount.
Deferred income tax is recognized using the liability method, based on temporary differences between consolidated financial statements carrying amounts of assets and liabilities and their respective income tax bases. Deferred income tax is determined using tax rates that have been enacted or substantively enacted by the statements of financial position date and are expected to apply when the related deferred income tax asset is realized or the deferred income tax liability is settled. The tax effect of certain temporary differences is not recognized, principally with respect to temporary differences relating to investments in subsidiaries and equity-accounted investees where
the company is able to control the reversal of the temporary difference and that difference is not expected to reverse in the foreseeable future. Deferred income tax is not accounted for if it arises from initial recognition of an asset or liability in a transaction other than a business combination that at the time of the transaction affects neither accounting nor taxable profit or loss. The amount of deferred income tax recognized is based on the expected manner and timing of realization or settlement of the carrying amount of assets and liabilities. Deferred income tax assets are recognized only to the extent that it is probable that future taxable profit will be available against which the temporary differences can be utilized. Deferred income tax assets are reviewed at each statements of financial position date and amended to the extent that it is no longer probable that the related tax benefit will be realized.
Current income tax assets and liabilities are offset when the company has a legally enforceable right to offset the recognized amounts and intends either to settle on a net basis, or to realize the asset and settle the liability simultaneously. Normally, the company would only have a legally enforceable right to set off a current tax asset against a current tax liability when they relate to income taxes levied by the same taxation authority and the authority permits the company to make or receive a single net payment. Deferred income tax assets and liabilities are offset when the company has a legally enforceable right to set off current tax assets against current tax liabilities and the deferred tax assets and liabilities relate to income taxes levied by the same taxation authority on either: (1) the same taxable entity; or (2) different taxable entities which intend either to settle current tax liabilities and assets on a net basis, or to realize the assets and settle the liabilities simultaneously in each future period in which significant amounts of deferred tax liabilities or assets are expected to be settled or recovered.
| | |
| 148 | | PotashCorp 2013 Annual Integrated Report |
| | |
| Notes to the consolidated financial statements | | In millions of US dollars except as otherwise noted |
| Note 21 | Income taxescontinued |
ACCOUNTING ESTIMATES AND JUDGMENTS
The company operates in a specialized industry and in several tax jurisdictions. As a result, its income is subject to various rates of taxation. The breadth of its operations and the global complexity of tax regulations require assessments of uncertainties and judgments in estimating the taxes the company will ultimately pay. The final taxes paid are dependent upon many factors, including negotiations with taxing authorities in various jurisdictions, outcomes of tax litigation and resolution of disputes arising from federal, provincial, state and local tax audits. The resolution of these uncertainties and the associated final taxes may result in adjustments to the company’s tax assets and tax liabilities.
The company estimates deferred income taxes based upon temporary differences between the assets and liabilities that it reports in its consolidated financial statements and the tax bases of its assets and liabilities as determined under applicable tax laws. The amount of deferred tax assets recognized is generally limited to the extent that it is probable that taxable profit will be available against which the related deductible temporary differences can be utilized. Therefore, the amount of the deferred income tax asset recognized and considered realizable could be reduced if projected income is not achieved.
SUPPORTING INFORMATION
|
Income taxes in net income The provision for income taxes differs from the amount that would have resulted from applying the Canadian statutory income tax rates to income before income taxes as follows: |
| | | | | | | | | | | | |
| | | 2013 | | | 2012 | | | 2011 | |
Income before income taxes | | | | | | | | | | | | |
Canada | | | $ 1,097 | | | | $ 1,514 | | | | $ 2,355 | |
United States | | | 784 | | | | 860 | | | | 957 | |
Trinidad | | | 310 | | | | 433 | | | | 430 | |
Other | | | 281 | | | | 98 | | | | 405 | |
| | | | $ 2,472 | | | | $ 2,905 | | | | $ 4,147 | |
Canadian federal and provincial statutory income tax rate | | | 26.88% | | | | 26.75% | | | | 28.31% | |
Income tax at statutory rates | | | $ 664 | | | | $ 777 | | | | $ 1,174 | |
Adjusted for the effect of: | | | | | | | | | | | | |
Non-taxable income | | | (66 | ) | | | (103 | ) | | | (106 | ) |
Production-related deductions | | | (54 | ) | | | (57 | ) | | | (68 | ) |
Additional tax deductions | | | (9 | ) | | | (11 | ) | | | (12 | ) |
Impact of foreign tax rates | | | 81 | | | | 97 | | | | 82 | |
Share-based compensation | | | 14 | | | | 7 | | | | 11 | |
Adjustment to foreign tax loss carryforward | | | 13 | | | | – | | | | – | |
Planned distribution of foreign earnings | | | 10 | | | | – | | | | – | |
Prior-year provision to income tax returns filed | | | 8 | | | | 17 | | | | 1 | |
Withholding taxes | | | 7 | | | | 14 | | | | 2 | |
Non-deductible impairment of available-for-sale investment | | | – | | | | 91 | | | | – | |
Tax rate differential on temporary differences | | | – | | | | – | | | | (20 | ) |
Income tax recoveries in a foreign jurisdiction | | | – | | | | – | | | | (14 | ) |
Adjustment to prior years’ deferred taxes | | | – | | | | – | | | | 26 | |
Other | | | 19 | | | | (6 | ) | | | (10 | ) |
Income tax expense included in net income | | | $ 687 | | | | $ 826 | | | | $ 1,066 | |
The increase in the Canadian federal and provincial statutory income tax rate from 2012 to 2013 was the result of a legislated increase in New Brunswick income tax rates. The decrease in the Canadian federal and provincial statutory income tax rate from 2011 to 2012 was the result of a legislated decrease in federal income tax rates.
| | |
| PotashCorp 2013 Annual Integrated Report | | 149 |
| | |
| Notes to the consolidated financial statements | | In millions of US dollars except as otherwise noted |
| Note 21 | Income taxescontinued |
Total income tax expense, included in net income, was comprised of the following:
| | | | | | | | | | | | |
| | | 2013 | | | 2012 | | | 2011 | |
Current income tax | | | | | | | | | | | | |
Tax expense for current year | | $ | 287 | | | $ | 453 | | | $ | 794 | |
Adjustments in respect of prior years | | | 3 | | | | (19 | ) | | | (65 | ) |
Total current income tax expense | | | 290 | | | | 434 | | | | 729 | |
Deferred income tax | | | | | | | | | | | | |
Origination and reversal of temporary differences | | | 355 | | | | 346 | | | | 271 | |
Adjustments in respect of prior years | | | 25 | | | | 46 | | | | 52 | |
Impact of tax rate changes | | | 6 | | | | (2 | ) | | | 7 | |
Impact of a writedown of a deferred tax asset | | | 11 | | | | 2 | | | | 7 | |
Total deferred income tax expense | | | 397 | | | | 392 | | | | 337 | |
Income tax expense included in net income | | $ | 687 | | | $ | 826 | | | $ | 1,066 | |
Income taxes in contributed surplus
Income taxes charged (credited) to contributed surplus were:
| | | | | | | | | | | | |
| | | 2013 | | | 2012 | | | 2011 | |
Share-based compensation excess tax benefit | | | | | | | | | | | | |
Current income tax | | $ | (18 | ) | | $ | (30 | ) | | $ | (29 | ) |
Deferred income tax | | | 30 | | | | 37 | | | | 62 | |
Total income tax charged to contributed surplus | | $ | 12 | | | $ | 7 | | | $ | 33 | |
Income tax balances
Income tax balances within the consolidated statements of financial position at December 31 were comprised of the following:
| | | | | | | | | | |
| Income Tax Assets (Liabilities) | | Statements of Financial Position Location | | 2013 | | | 2012 | |
Current income tax assets | | | | | | | | | | |
Current | | Receivables (Note 3) | | $ | 90 | | | $ | 124 | |
Non-current | | Other assets (Note 7) | | | 126 | | | | 130 | |
Deferred income tax assets | | Other assets (Note 7) | | | 21 | | | | 30 | |
Total income tax assets | | | | $ | 237 | | | $ | 284 | |
Current income tax liabilities | | | | | | | | | | |
Current | | Payables and accrued charges (Note 10) | | $ | (3 | ) | | $ | (2 | ) |
Non-current | | Other non-current liabilities and deferred credits | | | (135 | ) | | | (110 | ) |
Deferred income tax liabilities | | Deferred income tax liabilities | | | (2,013 | ) | | | (1,482 | ) |
Total income tax liabilities | | | | $ | (2,151 | ) | | $ | (1,594 | ) |
Deferred income taxes
In respect of each type of temporary difference, unused tax loss and unused tax credit, the amounts of deferred tax assets and liabilities recognized in the consolidated statements of financial position at December 31 and the amount of the deferred tax recovery or expense recognized in net income were:
| | | | | | | | | | | | | | | | | | | | |
| | | Deferred Income Tax Assets
(Liabilities) | | | Deferred Income Tax Recovery (Expense)
Recognized in Net Income | |
| | | 2013 | | | 2012 | | | 2013 | | | 2012 | | | 2011 | |
Deferred income tax assets | | | | | | | | | | | | | | | | | | | | |
Tax loss and other carryforwards | | $ | 4 | | | $ | 54 | | | $ | (47 | ) | | $ | (7 | ) | | $ | (35 | ) |
Asset retirement obligations and accrued environmental costs | | | 134 | | | | 136 | | | | (2 | ) | | | 12 | | | | 29 | |
Derivative instrument liabilities | | | 59 | | | | 76 | | | | – | | | | – | | | | – | |
Inventories | | | 54 | | | | 67 | | | | (13 | ) | | | 10 | | | | 18 | |
Post-retirement benefits and share-based compensation | | | 123 | | | | 250 | | | | (4 | ) | | | (19 | ) | | | (53 | ) |
Other assets | | | 39 | | | | 39 | | | | – | | | | 19 | | | | (8 | ) |
Deferred income tax liabilities | | | | | | | | | | | | | | | | | | | | |
Property, plant and equipment | | | (2,352 | ) | | | (2,027 | ) | | | (325 | ) | | | (395 | ) | | | (311 | ) |
Investments in equity-accounted investees | | | (42 | ) | | | (30 | ) | | | (12 | ) | | | (10 | ) | | | (4 | ) |
Long-term debt | | | – | | | | (7 | ) | | | 7 | | | | – | | | | 22 | |
Other liabilities | | | (11 | ) | | | (10 | ) | | | (1 | ) | | | (2 | ) | | | 5 | |
| | | $ | (1,992 | ) | | $ | (1,452 | ) | | $ | (397 | ) | | $ | (392 | ) | | $ | (337 | ) |
| | |
| 150 | | PotashCorp 2013 Annual Integrated Report |
| | |
| Notes to the consolidated financial statements | | In millions of US dollars except as otherwise noted |
| Note 21 | Income taxescontinued |
Reconciliation of net deferred income tax liabilities:
| | | | | | | | |
| | | 2013 | | | 2012 | |
Balance, beginning of year | | $ | (1,452 | ) | | $ | (1,033 | ) |
Income tax charge recognized in the statements of income | | | (397 | ) | | | (392 | ) |
Income tax charge recognized in contributed surplus | | | (30 | ) | | | (37 | ) |
Income tax (charge) credit recognized in OCI | | | (110 | ) | | | 6 | |
Foreign exchange | | | (3 | ) | | | 4 | |
Balance, end of year | | $ | (1,992 | ) | | $ | (1,452 | ) |
Amounts and expiry dates of unused tax losses and unused tax credits as at December 31, 2013 were:
| | | | | | | | |
| | | Amount | | | Expiry Date | |
Unused tax losses | | | | | | | | |
Operating | | $ | 8 | | | | None | |
Capital | | $ | 303 | | | | None | |
Unused investment tax credits | | $ | 59 | | | | 2014-2023 | |
The unused tax losses can be carried forward indefinitely.
Deferred tax assets are recognized for tax loss carryforwards to the extent that the realization of the related tax benefit through future taxable profits is probable. At December 31, 2013, the company had $342 of tax losses and deductible temporary differences for which it did not recognize deferred tax assets.
The company has determined that it is probable that all recognized deferred income tax assets will be realized through a combination of future reversals of temporary differences and taxable income.
The aggregate amount of temporary differences associated with investments in subsidiaries and equity-accounted investees, for which deferred tax liabilities have not been recognized, as at December 31, 2013 was $5,932 (2012 – $6,285).
| NOTE 22 | NET INCOME PER SHARE |
| | | | | | | | | | | | |
| | | 2013 | | | 2012 | | | 2011 | |
Basic net income per share1 | | | | | | | | | | | | |
Net income available to common shareholders | | $ | 1,785 | | | $ | 2,079 | | | $ | 3,081 | |
Weighted average number of common shares | | | 864,596,000 | | | | 860,033,000 | | | | 855,677,000 | |
Basic net income per share | | $ | 2.06 | | | $ | 2.42 | | | $ | 3.60 | |
Diluted net income per share1 | | | | | | | | | | | | |
Net income available to common shareholders | | $ | 1,785 | | | $ | 2,079 | | | $ | 3,081 | |
Weighted average number of common shares | | | 864,596,000 | | | | 860,033,000 | | | | 855,677,000 | |
Dilutive effect of stock options | | | 9,386,000 | | | | 15,874,000 | | | | 20,960,000 | |
Weighted average number of diluted common shares | | | 873,982,000 | | | | 875,907,000 | | | | 876,637,000 | |
Diluted net income per share | | $ | 2.04 | | | $ | 2.37 | | | $ | 3.51 | |
| 1 | Net income per share calculations are based on dollar and share amounts each rounded to the nearest thousand. |
Diluted net income per share was calculated based on the weighted average number of shares issued and outstanding during the year, incorporating the following adjustments. The denominator was: (1) increased by the total of the additional common shares that would have been issued assuming exercise of all stock options with exercise prices at or below the average market price for the year; and (2) decreased by the number of shares that the company could
have repurchased if it had used the assumed proceeds from the exercise of stock options to repurchase them on the open market at the average share price for the year. For performance-based stock option plans, the number of contingently issuable common shares included in the calculation was based on the number of shares, if any, that would be issuable if the end of the reporting period were the end of the performance period and the effect were dilutive.
| | |
| PotashCorp 2013 Annual Integrated Report | | 151 |
| | |
| Notes to the consolidated financial statements | | In millions of US dollars except as otherwise noted |
| Note 22 | Net income per sharecontinued |
Options excluded from the calculation of diluted net income per share due to the options’ exercise prices being greater than the average market price of common shares were as follows:
| | | | | | | | | | | | |
| | | 2013 | | | 2012 | | | 2011 | |
Weighted average number of options | | | 3,516,753 | | | | 2,465,450 | | | | 2,519,300 | |
Performance Option Plan years excluded | |
| 2008, 2011
and 2012 |
| |
| 2008
and 2011 |
| |
| 2008
and 2011 |
|
| NOTE 23 | SHARE-BASED COMPENSATION |
ACCOUNTING POLICIES
Grants under the company’s share-based compensation plans are accounted for in accordance with the fair value-based method of accounting. For stock option plans that will settle through the issuance of equity, the fair value of stock options is determined on their grant date using a valuation model and recorded as compensation expense over the period that the stock options vest, with a corresponding increase to contributed surplus. Forfeitures are estimated throughout the vesting period based on past experience and future expectations, and adjusted upon actual option vesting. When stock options are exercised, the proceeds, together with the amount recorded in contributed surplus, are recorded in share capital.
Share-based plans that are likely to settle in cash or other assets are accounted for as liabilities based on the fair value of the awards each period. The compensation expense is accrued over the vesting period of the award. Fluctuations in the fair value of the award will result in a change to the accrued compensation expense, which is recognized in the period in which the fluctuation occurs.
ACCOUNTING ESTIMATES AND JUDGMENTS
Determining the fair value of share-based compensation awards at the grant date requires judgment.
The company uses the Black-Scholes-Merton option-pricing model to estimate the fair value of options granted under its equity-settled stock option plans as of each grant date. This pricing model requires judgment, which includes
making assumptions about the expected dividends, volatility of the company’s stock price, risk-free interest rates and the expected life of the options. The expected dividend on the company’s stock is based on the annualized dividend rate as of the date of grant. Expected volatility is based on historical volatility of the company’s stock over a period commensurate with the expected life of the stock option. The risk-free interest rate for the expected life of the option is based on the implied yield available on zero-coupon government issues with an equivalent remaining term at the time of the grant. Historical data is used to estimate the expected life of the option. In addition, judgment is required to estimate the number of awards expected to be forfeited.
The company uses a Monte Carlo simulation model to estimate the fair value of its cash-settled performance unit incentive plan liability at each reporting period within the performance period. This requires judgment, including making assumptions about the volatility of the company’s stock price and the DAXglobal Agribusiness Index with dividends, as well as the correlation between those two amounts, over the three-year plan cycle.
For those awards with performance conditions that determine the number of options or units to which employees will be entitled, measurement of compensation cost is based on the company’s best estimate of the outcome of the performance conditions. If actual results differ significantly from these estimates, stock-based compensation expense and results of operations could be impacted.
| | |
| 152 | | PotashCorp 2013 Annual Integrated Report |
| | |
| Notes to the consolidated financial statements | | In millions of US dollars except as otherwise noted |
| Note 23 | Share-based compensationcontinued |
SUPPORTING INFORMATION
At December 31, 2013, the company had 11 share-based compensation plans (nine stock option plans, the deferred share unit plan and the performance unit incentive plan), which are described below (2012 – 11 plans, 2011 – 11 plans). The total compensation cost charged (recovered) against earnings for those plans was comprised of:
| | | | | | | | | | | | |
| | | 2013 | | | 2012 | | | 2011 | |
Stock option plans | | | $ 27 | | | | $ 23 | | | | $ 24 | |
Deferred share unit plan | | | (2 | ) | | | 1 | | | | (5 | ) |
Performance unit incentive plan | | | (2 | ) | | | 4 | | | | (1 | ) |
| | | | $ 23 | | | | $ 28 | | | | $ 18 | |
Stock option plans
At December 31, 2013, options were outstanding under the following plans:
| | | | | | |
| Plan | | Options Outstanding | | Vesting Period | | Settlement |
2005 Performance Option Plan | | 4,216,910 | | 3 Years | | Shares |
2006 Performance Option Plan | | 3,955,275 | | 3 Years | | Shares |
2007 Performance Option Plan | | 3,493,025 | | 3 Years | | Shares |
2008 Performance Option Plan | | 1,257,750 | | 3 Years | | Shares |
2009 Performance Option Plan | | 1,689,375 | | 3 Years | | Shares |
2010 Performance Option Plan | | 1,206,900 | | 3 Years | | Shares |
2011 Performance Option Plan | | 1,103,600 | | 3 Years | | Shares |
2012 Performance Option Plan | | 1,471,100 | | 3 Years | | Shares |
2013 Performance Option Plan | | 1,938,400 | | 3 Years | | Shares |
In previous years the company granted options under an Officers and Employees Plan (the last grant under which expired in 2013) and a Directors Plan (the last grant under which expired in 2012).
Under the terms of the plans, no additional options are issuable pursuant to the plans.
The exercise price is not less than the quoted market closing price of the company’s common shares on the last trading day immediately preceding the date of the grant, and an option’s maximum term is 10 years. In general, options granted under the Performance Option Plans will vest, if at all, according to a schedule based on the three-year average excess of the company’s consolidated cash flow return on investment over the weighted average cost of capital. One-half of the options granted in a year under the Officers and Employees Plan and the Directors Plan vested one year from the date of the grant based on service, with the other half vesting the following year.
Prior to a Performance Option Plan award vesting, assumptions regarding vesting are made during the first three years based on the relevant actual and/or forecast financial results. Changes to vesting assumptions are reflected in earnings immediately. As of December 31, 2013, the 2011, 2012 and 2013 Performance Option Plans were expected to vest at 100 percent.
The company issues new common shares to satisfy stock option exercises. Options granted to Canadian participants had an exercise price in Canadian dollars.
A summary of the status of the stock option plans as of December 31, 2013, 2012 and 2011 and changes during the years ending on those dates is presented as follows:
| | | | | | | | | | | | | | | | | | | | | | | | | | |
| | | Number of shares subject to option | | | | | Weighted average exercise price | |
| | | 2013 | | | 2012 | | | 2011 | | | | | 2013 | | | 2012 | | | 2011 | |
Outstanding, beginning of year | | | 23,164,444 | | | | 27,649,074 | | | | 32,121,309 | | | | | | $ 22.32 | | | | $ 18.02 | | | | $ 15.17 | |
Granted | | | 1,952,000 | | | | 1,499,300 | | | | 1,144,100 | | | | | | 43.80 | | | | 39.36 | | | | 52.26 | |
Exercised | | | (4,492,409 | ) | | | (5,895,730 | ) | | | (5,490,335 | ) | | | | | (8.71 | ) | | | (6.76 | ) | | | (6.99 | ) |
Forfeited or cancelled | | | (291,700 | ) | | | (88,200 | ) | | | (126,000 | ) | | | | | (45.33 | ) | | | (50.26 | ) | | | (49.43 | ) |
Expired | | | – | | | | – | | | | – | | | | | | – | | | | – | | | | – | |
Outstanding, end of year | | | 20,332,335 | | | | 23,164,444 | | | | 27,649,074 | | | | | | $ 26.45 | | | | $ 22.32 | | | | $ 18.02 | |
| | |
| PotashCorp 2013 Annual Integrated Report | | 153 |
| | |
| Notes to the consolidated financial statements | | In millions of US dollars except as otherwise noted |
| Note 23 | Share-based compensationcontinued |
The aggregate grant-date fair value of all options granted during 2013 was $30 (2012 – $24, 2011 – $27). The average share price during 2013 was $36.69 per share (2012 – $42.54 per share, 2011 – $53.02 per share).
The following table summarizes information about stock options outstanding at December 31, 2013:
| | | | | | | | | | | | | | | | | | | | |
| | | Options Outstanding | | | Options Exercisable | |
Range of Exercise Prices | | Number | | | Weighted Average
Remaining Life in Years | | | Weighted Average
Exercise Price | | | Number | | | Weighted Average
Exercise Price | |
$9.00 to $13.00 | | | 8,172,185 | | | | 2 | | | $ | 10.90 | | | | 8,172,185 | | | $ | 10.90 | |
$20.00 to $24.00 | | | 3,493,025 | | | | 3 | | | $ | 21.20 | | | | 3,493,025 | | | $ | 21.20 | |
$30.00 to $45.00 | | | 6,305,775 | | | | 7 | | | $ | 37.59 | | | | 2,896,275 | | | $ | 33.29 | |
$46.00 to $68.00 | | | 2,361,350 | | | | 6 | | | $ | 58.26 | | | | 1,257,750 | | | $ | 65.10 | |
| | | | 20,332,335 | | | | 4 | | | $ | 26.45 | | | | 15,819,235 | | | $ | 21.58 | |
The foregoing options have expiry dates ranging from May 2015 to May 2023.
The following weighted average assumptions were used in arriving at the grant-date fair values associated with stock options for which compensation cost was recognized during 2013, 2012 and 2011:
| | | | | | | | | | | | | | | | | | | | |
| | | Year of Grant | |
| | | 2013 | | | 2012 | | | 2011 | | | 2010 | | | 2009 | |
Exercise price per option | | $ | 43.80 | | | $ | 39.36 | | | $ | 52.26 | | | $ | 33.82 | | | $ | 31.96 | |
Expected annual dividend per share | | $ | 1.40 | | | $ | 0.56 | | | $ | 0.28 | | | $ | 0.13 | | | $ | 0.13 | |
Expected volatility | | | 50% | | | | 53% | | | | 52% | | | | 50% | | | | 48% | |
Risk-free interest rate | | | 1.06% | | | | 1.06% | | | | 2.29% | | | | 2.61% | | | | 2.53% | |
Expected life of options in years | | | 5.5 | | | | 5.5 | | | | 5.5 | | | | 5.9 | | | | 5.9 | |
Other plans
The company offers a performance unit incentive plan (“MTIP”) to senior executives and other key employees. The performance objectives under the plan are designed to further align the interests of executives and key employees with those of shareholders by linking the vesting of awards to the total return to shareholders over the three-year performance period ending December 31, 2014. Total shareholder return measures the capital appreciation in the company’s common shares, including dividends paid over the performance period. Vesting of one-half of the awards is based on increases in the total shareholder return over the three-year performance period. Vesting of the remaining one-half of the awards is based on the extent to which the total shareholder return matches or exceeds that of the common shares of a pre-defined peer group index. Vested units will be settled in cash based on the common share price generally at the end of the performance period. Compensation expense for this plan is recorded over the three-year performance cycle of the plan. The amount of compensation expense will be adjusted each period over the cycle to reflect the current fair value of common shares and the number of shares estimated to vest. The company offered a similar plan over thethree-year performance period ended December 31, 2011.
Further information and a summary of the status of the performance unit incentive plan units at December 31 are presented below:
| | | | | | | | | | | | |
| | | 2013 | | | 2012 | | | 2011 | |
Cash used to settle units during the year | | | $ – | | | | $ 17 | | | $ | 4 | |
Fair value of closing liability | | | 1 | | | | 4 | | | | 18 | |
Intrinsic value of closing liability | | | – | | | | – | | | | 18 | |
The company offers a deferred share unit plan to non-employee directors, which allows each to choose to receive, in the form of deferred share units (“DSUs”), all or a percentage of the director’s fees, which would otherwise be payable in cash. The plan also provides for discretionary grants of additional DSUs by the Board, a practice the Board discontinued on January 24, 2007 in connection with an increase in the annual retainer. Each DSU fully vests upon award, but is distributed only when the director has ceased to be a member of the Board. Vested units are settled in cash based on the common share price at that time. As of December 31, 2013, the total number of DSUs held by participating directors was 562,720 (2012 – 573,472, 2011 – 594,030).
Further information and a summary of the status of outstanding DSUs at December 31 is presented below:
| | | | | | | | | | | | |
| | | 2013 | | | 2012 | | | 2011 | |
Cash used to settle DSUs during the year | | $ | 3 | | | $ | 2 | | | $ | – | |
Fair value and intrinsic value of closing liability | | | 19 | | | | 23 | | | | 25 | |
| | |
| 154 | | PotashCorp 2013 Annual Integrated Report |
| | |
| Notes to the consolidated financial statements | | In millions of US dollars except as otherwise noted |
| NOTE 24 | FINANCIAL INSTRUMENTS AND RELATED RISK MANAGEMENT |
ACCOUNTING POLICIES
Financial assets and financial liabilities are recognized initially in the consolidated statements of financial position at fair value (normally the transaction price) adjusted for transaction costs. Transaction costs related to financial assets or financial liabilities at fair value through profit or loss are recognized immediately in net income. Regular way purchases and sales of financial assets are accounted for on the trade date. Financial instruments recorded at fair value on an ongoing basis are remeasured at each reporting date and changes in the fair value are recorded in either net income or OCI.
SUPPORTING INFORMATION
Financial risks
The company is exposed in varying degrees to a variety of financial risks from its use of financial instruments: credit risk, liquidity risk and market risk. The source of risk exposure and how each is managed are outlined below.
Credit risk
The company is exposed to credit risk on its cash and cash equivalents, receivables (excluding taxes) and derivative instrument assets. The exposure to credit risk is represented by the carrying amount of each class of financial assets, including derivative financial instruments, recorded in the consolidated statements of financial position.
The company manages its credit risk on cash and cash equivalents and derivative instrument assets through policies guiding:
| • | | Acceptable minimum counterparty credit ratings relating to the natural gas and foreign currency derivative instrument assets and cash and cash equivalents; |
| • | | Daily counterparty settlement on natural gas derivative instruments based on prescribed credit thresholds; and |
| • | | Exposure thresholds by counterparty on cash and cash equivalents. |
Derivative instrument assets are comprised of natural gas hedging derivatives and foreign currency derivatives. All of the counterparties to the contracts comprising the derivative financial instruments in an asset position are of investment-grade quality.
The company seeks to manage the credit risk relating to its trade receivables through a credit management program. Credit approval policies and procedures are in place to guide the granting of credit to new customers as well as its continued extension to existing customers. Existing customer accounts are reviewed every 12-18 months. Credit is extended to international customers based upon an evaluation of both customer and country risk. The company uses credit agency reports, where available, and an assessment of other relevant information such as current financial statements and/or credit references before assigning credit limits to customers. Those that fail to meet specified benchmark creditworthiness may transact with the company on a prepayment basis or provide another form of credit support that it approves.
The company does not hold any collateral as security on trade receivables. If appropriate, it may request guarantees or standby letters of credit to mitigate credit risk. It also obtains export insurance from Export Development Canada (covering 90 percent of each balance) for international potash sales from its New Brunswick operation, and from the Foreign Credit Insurance Association (covering 90 percent of each balance) for international sales from the US and Trinidad. A total of $68 in receivables at December 31, 2013 was covered, representing 86 percent of offshore receivables (2012 – 96 percent). Canpotex also obtains export insurance from Export Development Canada for its trade receivables (covering 90 percent of each balance).
The credit period on sales is generally 15 days for fertilizer customers, 30 days for industrial and feed customers and up to 180 days for select export sales customers. Interest at 1.5 percent per month is charged on balances remaining unpaid at the end of the sale terms. Historically, the company has experienced minimal customer defaults and, as a result, it considers the credit quality of the trade receivables at December 31, 2013 that are not past due to be high. There were no amounts past due or impaired relating to the non-trade receivables. There were no significant amounts impaired relating to the trade receivables. The aging of trade receivables that were past due but not impaired at December 31 was as follows:
| | | | | | | | |
| | | 2013 | | | 2012 | |
1-30 days | | $ | 38 | | | $ | 89 | |
31-60 days | | | – | | | | – | |
Greater than 60 days | | | 1 | | | | – | |
| | | $ | 39 | | | $ | 89 | |
| | |
| PotashCorp 2013 Annual Integrated Report | | 155 |
| | |
| Notes to the consolidated financial statements | | In millions of US dollars except as otherwise noted |
| Note 24 | Financial instruments and related risk managementcontinued |
Liquidity risk
Liquidity risk arises from the company’s general funding needs and in the management of its assets, liabilities and optimal capital structure. It manages its liquidity risk to maintain sufficient liquid financial resources to fund its operations and meet its commitments and obligations in a cost-effective manner. In managing its liquidity risk, the company has access to a range of funding options. It has established an external borrowing policy with the following objectives:
| • | | Maintain an optimal capital structure; |
| • | | Maintain investment-grade credit ratings that provide ease of access to the debt capital and commercial paper markets; |
| • | | Maintain sufficient short-term credit availability; and |
| • | | Maintain long-term relationships with a sufficient number of high-quality and diverse lenders. |
The table below outlines the company’s available debt facilities as of December 31, 2013:
| | | | | | | | | | | | |
| | | Total
Amount | | | Amount Outstanding
and Committed | | | Amount
Available | |
Credit facility 1 | | $ | 3,500 | | | $ | 470 | | | $ | 3,030 | |
Line of credit | | | 75 | | | | 18 | 2 | | | 57 | |
| 1 | Included in the amount outstanding and committed was $470 of commercial paper. The amount available under the commercial paper program is limited to the availability of backup funds under the credit facility. |
| 2 | Letters of credit as discussed in Note 9. |
The company has an uncommittedletter of credit facility which was increased from $32 to $100 during the year. At December 31, 2013, $29 (2012 – $28) was outstanding under this facility.
Certain of the company’s derivative instruments contain provisions that require its debt to maintain specified credit ratings from two of the major credit rating agencies. If the debt were to fall below the specified ratings, the company would be in violation of these provisions, and the counterparties to the derivative instruments could request immediate payment or demand immediate and ongoing full overnight collateralization on derivative instruments in net liability positions. The aggregate fair value of all derivative instruments with credit risk-related contingent features that were in a liability position on December 31, 2013 was $169, for which the company had posted collateral of $114 in the normal course of business. If the credit risk-related contingent features underlying these agreements had been triggered on December 31, 2013, the company would have been required to post an additional $55 of collateral to its counterparties.
The table below presents a maturity analysis of the company’s financial liabilities and gross settled derivative contracts (for which the cash flows are settled simultaneously) based on the expected cash flows from the date of the consolidated statements of financial position to the contractual maturity date. The amounts are the contractual undiscounted cash flows.
| | | | | | | | | | | | | | | | | | | | | | | | |
| | | Carrying Amount of
Liability at
December 31, 2013 | | | Contractual Cash Flows | | | Within 1 Year | | | 1 to 3 Years | | | 3 to 5 Years | | | Over 5 Years | |
Short-term debt obligations1 | | $ | 470 | | | $ | 470 | | | $ | 470 | | | $ | – | | | $ | – | | | $ | – | |
Payables and accrued charges2 | | | 937 | | | | 937 | | | | 937 | | | | – | | | | – | | | | – | |
Long-term debt obligations1 | | | 3,506 | | | | 5,409 | | | | 665 | | | | 784 | | | | 754 | | | | 3,206 | |
Foreign currency derivatives | | | 1 | | | | | | | | | | | | | | | | | | | | | |
Outflow | | | | | | | 148 | | | | 148 | | | | – | | | | – | | | | – | |
Inflow | | | | | | | (147 | ) | | | (147 | ) | | | – | | | | – | | | | – | |
Natural gas derivatives | | | 170 | | | | 173 | | | | 41 | | | | 81 | | | | 47 | | | | 4 | |
| | | $ | 5,084 | | | $ | 6,990 | | | $ | 2,114 | | | $ | 865 | | | $ | 801 | | | $ | 3,210 | |
| 1 | Contractual cash flows include contractual interest payments related to debt obligations. Interest rates on variable rate debt are based on prevailing rates at December 31, 2013. Disclosures regarding offsetting of certain debt obligations are provided in Note 12. |
| 2 | Excludes taxes, accrued interest, deferred revenues and current portions of asset retirement obligations and accrued environmental costs and pension and other post-retirement benefits. |
| | |
| 156 | | PotashCorp 2013 Annual Integrated Report |
| | |
| Notes to the consolidated financial statements | | In millions of US dollars except as otherwise noted |
| Note 24 | Financial instruments and related risk managementcontinued |
Market risk
Market risk is the risk that financial instrument fair values will fluctuate due to changes in market prices. The market risks to which the company is exposed on its financial instruments are foreign exchange risk, interest rate risk and price risk (related to commodity and equity securities).
Foreign exchange risk
The company is exposed to foreign exchange risk primarily relating to operating and capital expenditures, resource taxes and dividends. To manage foreign exchange risk related to these non-US dollar expenditures, the company may enter into foreign currency derivatives. Its treasury risk management policies allow such exposures to be hedged within certain prescribed limits for both forecast operating and capital expenditures. The foreign currency derivatives are not currently designated as hedging instruments for accounting purposes.
The company has certain available-for-sale investments listed on foreign stock exchanges and denominated in currencies other than the US dollar for which it is exposed to foreign exchange risk. These investments are held for long-term strategic purposes.
The following table shows the company’s significant exposure to foreign exchange risk on its financial instruments and the pre-tax effects on income and OCI of reasonably possible changes in the relevant foreign currency. The company has no significant foreign currency exposure related to cash and cash equivalents and receivables. This analysis assumed that price decreases related to the company’s investment in ICL would not represent an impairment, price decreases related to its investment in Sinofert below the carrying amount at the impairment date ($238) would represent an impairment, and all other variables remain constant.
| | | | | | | | | | | | | | | | | | | | |
| | | Carrying Amount of Asset (Liability)
at December 31 | | | Foreign Exchange Risk | |
| | | 5% decrease in US$ | | | 5% increase in US$ | |
| | | Income | | | OCI | | | Income | | | OCI | |
2013 | | | | | | | | | | | | | | | | | | | | |
Available-for-sale investments | | | | | | | | | | | | | | | | | | | | |
ICL (New Israeli shekels) | | $ | 1,468 | | | $ | – | | | $ | 73 | | | $ | – | | | $ | (73 | ) |
Sinofert (Hong Kong dollars) | | | 254 | | | | – | | | | 13 | | | | – | | | | (13 | ) |
Payables (CDN) | | | (164 | ) | | | (8 | ) | | | – | | | | 8 | | | | – | |
Foreign currency derivatives | | | (1 | ) | | | (7 | ) | | | – | | | | 7 | | | | – | |
2012 | | | | | | | | | | | | | | | | | | | | |
Available-for-sale investments | | | | | | | | | | | | | | | | | | | | |
ICL (New Israeli shekels) | | $ | 2,104 | | | $ | – | | | $ | 105 | | | $ | – | | | $ | (105 | ) |
Sinofert (Hong Kong dollars) | | | 377 | | | | – | | | | 19 | | | | – | | | | (19 | ) |
Payables (CDN) | | | (251 | ) | | | (13 | ) | | | – | | | | 13 | | | | – | |
Foreign currency derivatives | | | 1 | | | | 15 | | | | – | | | | (15 | ) | | | – | |
Interest rate risk
Fluctuations in interest rates impact the future cash flows and fair values of various financial instruments. With respect to its debt portfolio, the company addresses interest rate risk by using a diversified portfolio of fixed and floating rate instruments. This exposure is also managed by aligning current and long-term assets with demand and fixed-term debt and by monitoring the effects of market changes in interest rates. Interest rate swaps can be and have been used by the company to further manage its interest rate exposure.
The company is also exposed to changes in interest rates related to its investments in marketable securities. These securities are included in cash and cash equivalents, and the company’s primary objective is to ensure the security of principal amounts invested and provide for an adequate degree of liquidity, while achieving a satisfactory return. Its treasury risk management policies specify various investment parameters, including eligible types of investment, maximum maturity dates, maximum exposure by counterparty and minimum credit ratings.
| | |
| PotashCorp 2013 Annual Integrated Report | | 157 |
| | |
| Notes to the consolidated financial statements | | In millions of US dollars except as otherwise noted |
| Note 24 | Financial instruments and related risk managementcontinued |
The company had no significant exposure to interest rate risk on its financial instruments at December 31, 2013 and December 31, 2012. The only financial assets bearing any variable interest rate exposure are cash and cash equivalents. As for financial liabilities, the company has only an insignificant exposure related to a long-term loan that is subject to variable rates. Short-term debt, related to commercial paper, is excluded from interest rate risk as the interest rates are fixed for the stated period of the debt. The company would only be exposed to variable interest rate risk on the issuance of new commercial paper. It does not measure any fixed-rate debt at fair value. Therefore, changes in interest rates will not affect income or OCI as there is no change in the carrying value of fixed-rate debt and interest payments are fixed. This analysis assumes all other variables remain constant.
Price risk
The company is exposed to commodity price risk on its financial instruments resulting from its natural gas requirements. Its natural gas strategy is based on diversification for its total gas requirements (which represent the forecast consumption of natural gas volumes by its manufacturing and mining facilities). Its objective is to acquire a reliable supply of natural gas feedstock and fuel on a location-adjusted, cost-competitive basis. Its exchange-traded available-for-sale securities also expose the company to equity securities price risk.
The following table shows the company’s exposure to price risk and the pre-tax effects on net income and OCI of reasonably possible changes in the relevant commodity or securities prices. This analysis assumed that price decreases related to the company’s investment in ICL would not represent an impairment, price decreases related to its investment in Sinofert below the carrying amount at the impairment date ($238) would represent an impairment, and all other variables remain constant.
| | | | | | | | | | | | | | | | | | | | |
| | | Carrying Amount of Asset (Liability) at December 31 | | | Price Risk | |
| | | | Effect of 10% decrease in prices | | | Effect of 10% increase in prices | |
| | | | Income | | | OCI | | | Income | | | OCI | |
2013 | | | | | | | | | | | | | | | | | | | | |
Available-for-sale investments | | | | | | | | | | | | | | | | | | | | |
ICL | | $ | 1,468 | | | $ | – | | | $ | (147 | ) | | $ | – | | | $ | 147 | |
Sinofert | | | 254 | | | | (9 | ) | | | (16 | ) | | | – | | | | 25 | |
Natural gas derivatives | | | (162 | ) | | | – | | | | – | | | | – | | | | – | |
2012 | | | | | | | | | | | | | | | | | | | | |
Available-for-sale investments | | | | | | | | | | | | | | | | | | | | |
ICL | | $ | 2,104 | | | $ | – | | | $ | (210 | ) | | $ | – | | | $ | 210 | |
Sinofert | | | 377 | | | | – | | | | (38 | ) | | | – | | | | 38 | |
Natural gas derivatives | | | (209 | ) | | | – | | | | – | | | | – | | | | – | |
The sensitivity analyses included in the tables above should be used with caution as the changes are hypothetical and not predictive of future performance. The sensitivities are calculated with reference to period-end balances and will change due to fluctuations in the balances throughout the year. In addition, for the purpose of the sensitivity analyses, the effect of a variation in a particular assumption on the fair value of the financial instrument was calculated independently of any change in another assumption. Actual changes in one factor may contribute to changes in another factor, which may magnify or counteract the effect on the fair value of the financial instrument.
Fair value
The valuation policies and procedures for financial reporting purposes are determined by the company’s finance department.
Due to their short-term nature, the fair value of cash and cash equivalents, receivables, short-term debt, and payables and accrued charges was assumed to approximate carrying value. The company’s derivative instruments and investments in ICL and Sinofert were carried at fair value. The fair value of derivative instruments that are not traded in an active market (such as natural gas swaps and foreign currency derivatives) was determined using valuation techniques. The company used a variety of methods and made assumptions that were based on market conditions existing at each reporting date.
The fair value of foreign currency derivatives was determined using quoted forward exchange rates (Level 2) at the statements of financial position dates.
Natural gas swap valuations were based on a discounted cash flow model. The inputs used in the model included contractual cash flows based on prices for natural gas futures contracts, fixed prices and notional volumes specified by the swap contracts, the time value of money, liquidity risk, the company’s own
| | |
| 158 | | PotashCorp 2013 Annual Integrated Report |
| | |
| Notes to the consolidated financial statements | | In millions of US dollars except as otherwise noted |
| Note 24 | Financial instruments and related risk managementcontinued |
credit risk (related to instruments in a liability position) and counterparty credit risk (related to instruments in an asset position). Certain of the futures contract prices used as inputs in the model were supported by prices quoted in an active market and others were not based on observable market data.
For valuations that included both observable and unobservable data, if the unobservable input was determined to be significant to the overall inputs, the entire valuation was categorized in Level 3. For natural gas swaps, the primary input into the valuation model was natural gas futures prices, which were based on delivery at the Henry Hub and were observable only for up to three years in the future. The unobservable futures price range at December 31, 2013 was $4.00 to $4.54 per MMBtu (December 31, 2012 – $4.58 to $5.48 per MMBtu). Changes in the unobservable natural gas futures prices would not result in significantly higher or lower fair values as any price change would
be counterbalanced by offsetting derivative positions. Interest rates used to discount estimated cash flows in 2013 were between 0.17 percent and 3.59 percent (2012 – between 0.21 percent and 3.26 percent) depending on the settlement date.
Fair value of investments designated as available-for-sale was based on the closing bid price of the common shares (Level 1) as of the statements of financial position dates.
The fair value of the company’s senior notes at December 31, 2013 reflected the yield valuation based on observed market prices (Level 1), which ranged from 0.50 percent to 5.25 percent (2012 – 0.40 percent to 4.35 percent). The fair value of the company’s other long-term debt instruments approximated carrying value. Presented below is a comparison of the fair value of the company’s senior notes to their carrying values at December 31.
| | | | | | | | | | | | | | | | |
| | | 2013 | | | 2012 | |
| | | Carrying Amount of Liability | | | Fair Value of Liability | | | Carrying Amount of Liability | | | Fair Value of
Liability | |
Long-term debt senior notes | | $ | 3,500 | | | $ | 3,791 | | | $ | 3,750 | | | $ | 4,284 | |
The following table presents the company’s fair value hierarchy for financial assets and financial liabilities carried at fair value on a recurring basis.
| | | | | | | | | | | | | | | | |
| | | | | | Fair Value Measurements at Reporting Dates Using: | |
| | | Carrying Amount of
Asset (Liability) at December 31 | | | Quoted Prices in
Active Markets for
Identical Assets
(Level 1) 1 | | | Significant Other
Observable Inputs
(Level 2) 1,2 | | | Significant
Unobservable
Inputs (Level 3) 2 | |
2013 | | | | | | | | | | | | | | | | |
Derivative instrument assets | | | | | | | | | | | | | | | | |
Natural gas derivatives | | $ | 8 | 3 | | $ | – | | | $ | – | | | $ | 8 | |
Investments in ICL and Sinofert | | | 1,722 | | | | 1,722 | | | | – | | | | – | |
Derivative instrument liabilities | | | | | | | | | | | | | | | | |
Natural gas derivatives | | | (170 | ) 4 | | | – | | | | (21 | ) | | | (149 | ) |
Foreign currency derivatives | | | (1 | ) | | | – | | | | (1 | ) | | | – | |
2012 | | | | | | | | | | | | | | | | |
Derivative instrument assets | | | | | | | | | | | | | | | | |
Natural gas derivatives | | $ | 9 | 3 | | $ | – | | | $ | – | | | $ | 9 | |
Foreign currency derivatives | | | 1 | | | | – | | | | 1 | | | | – | |
Investments in ICL and Sinofert | | | 2,481 | | | | 2,481 | | | | – | | | | – | |
Derivative instrument liabilities | | | | | | | | | | | | | | | | |
Natural gas derivatives | | | (218 | ) 4 | | | – | | | | (18 | ) | | | (200 | ) |
| 1 | During 2013 and 2012, there were no transfers between Level 1 and Level 2. |
| 2 | During 2013 and 2012, there were no transfers into Level 3 and $14 (2012 – $10) of losses was transferred out of Level 3 into Level 2 as (due to the passage of time) the terms of certain natural gas derivatives now mature within 36 months. The company’s policy is to recognize transfers at the end of the reporting period. |
| 3 | Comprised of gross amounts, before offsetting, of assets of $9 (2012 – $10) and liabilities of $(1) (2012 – $(1)). Cash margin deposits held related to legally enforceable master netting arrangements for natural gas derivatives that were not offset were $(3) (2012 – $(4)). |
| 4 | Comprised of gross amounts, before offsetting, of liabilities of $(238) (2012 – $(307)) and assets of $68 (2012 – $89). Cash margin deposits placed with counterparties related to legally enforceable master netting arrangements for natural gas derivatives that were not offset were $114 (2012 – $150) (Note 3). |
| | |
| PotashCorp 2013 Annual Integrated Report | | 159 |
| | |
| Notes to the consolidated financial statements | | In millions of US dollars except as otherwise noted |
| Note 24 | Financial instruments and related risk managementcontinued |
The following table presents a reconciliation of the beginning and ending balances of the company’s fair value measurements using significant unobservable inputs (Level 3):
| | | | | | | | |
| | | Natural Gas Derivatives | |
| | | 2013 | | | 2012 | |
Balance, beginning of year | | $ | (191 | ) | | $ | (229 | ) |
Total (losses) gains (realized and unrealized) before income taxes | | | | | | | | |
Included in net income (cost of goods sold) | | | (27 | ) | | | (27 | ) |
Included in other comprehensive income | | | 27 | | | | 16 | |
Purchases | | | – | | | | – | |
Sales | | | – | | | | – | |
Issues | | | – | | | | – | |
Settlements | | | 36 | | | | 39 | |
Transfers of losses out of Level 3 | | | 14 | | | | 10 | |
Balance, end of year | | $ | (141 | ) | | $ | (191 | ) |
Gains (losses) for the year included in net income (cost of goods sold) were: | | | | | | | | |
Change in unrealized gains (losses) relating to instruments still held at the reporting date | | $ | – | | | $ | – | |
Total losses (realized and unrealized) | | | (27 | ) | | | (27 | ) |
| NOTE 25 | CAPITAL MANAGEMENT |
The company’s objectives in capital management are to maintain financial flexibility while managing its cost of, and optimizing its access to, capital. To achieve these objectives, its strategy, which was unchanged from 2012, was to maintain its investment-grade credit rating. The company monitors its capital structure and, based on changes in economic conditions, may adjust the structure by adjusting the amount of dividends paid to shareholders, repurchasing shares, issuing new shares, issuing new debt or retiring existing debt.
The company uses a combination of short-term and long-term debt to finance its operations. It typically pays floating rates of interest on short-term debt and credit facilities, and fixed rates on senior notes.
Net debt and adjusted shareholders’ equity are included as components of the company’s capital structure. The calculation of net debt, adjusted shareholders’ equity and adjusted capital is set out in the following table:
| | | | | | | | |
| | | 2013 | | | 2012 | |
Short-term debt obligations | | $ | 470 | | | $ | 369 | |
Current portion of long-term debt obligations | | | 500 | | | | 250 | |
Long-term debt obligations | | | 3,006 | | | | 3,506 | |
Deferred debt costs | | | (39 | ) | | | (44 | ) |
Total debt | | | 3,937 | | | | 4,081 | |
Less: cash and cash equivalents | | | (628 | ) | | | (562 | ) |
Net debt | | | 3,309 | | | | 3,519 | |
Total shareholders’ equity | | | 9,628 | | | | 9,912 | |
Less: accumulated other comprehensive income | | | (673 | ) | | | (1,399 | ) |
Adjusted shareholders’ equity | | | 8,955 | | | | 8,513 | |
Adjusted capital1 | | $ | 12,264 | | | $ | 12,032 | |
| 1 | Adjusted capital = (total debt – cash and cash equivalents) + (total shareholders’ equity – accumulated other comprehensive income). |
The company monitors capital on the basis of a number of factors, including the ratios of: net income before finance costs, income taxes, depreciation and amortization, termination benefit costs and certain impairment charges (“adjusted EBITDA”) to finance costs before unwinding of discount on asset retirement obligations and borrowing costs capitalized to property, plant and equipment (“adjusted finance costs”); net debt to adjusted EBITDA; net debt to adjusted capital; and fixed-rate debt obligations as a percentage of total debt obligations.
| | | | | | | | |
| | | 2013 | | | 2012 | |
Components of ratios | | | | | | | | |
Adjusted EBITDA | | $ | 3,282 | | | $ | 3,938 | |
Net debt | | $ | 3,309 | | | $ | 3,519 | |
Adjusted finance costs | | $ | 193 | | | $ | 204 | |
Adjusted capital | | $ | 12,264 | | | $ | 12,032 | |
Ratios | | | | | | | | |
Adjusted EBITDA to adjusted finance costs1 | | | 17.0 | | | | 19.3 | |
Net debt to adjusted EBITDA2 | | | 1.01 | | | | 0.89 | |
Net debt to adjusted capital3 | | | 27.0% | | | | 29.2% | |
Fixed-rate debt obligations as a percentage of total debt obligations 4 | | | 88.0% | | | | 90.9% | |
| 1 | Adjusted EBITDA to adjusted finance costs = adjusted EBITDA / adjusted finance costs. |
| 2 | Net debt to adjusted EBITDA = (total debt – cash and cash equivalents) / adjusted EBITDA. |
| 3 | Net debt to adjusted capital = (total debt – cash and cash equivalents) / (total debt – cash and cash equivalents + total shareholders’ equity – accumulated other comprehensive income). |
| 4 | Fixed-rate debt obligations as a percentage of total debt obligations is determined by dividing fixed-rate debt obligations by total debt obligations. |
| | |
| 160 | | PotashCorp 2013 Annual Integrated Report |
| | |
| Notes to the consolidated financial statements | | In millions of US dollars except as otherwise noted |
| Note 25 | Capital managementcontinued |
| | | | | | | | |
| | | 2013 | | | 2012 | |
Net income | | $ | 1,785 | | | $ | 2,079 | |
Finance costs | | | 144 | | | | 114 | |
Income taxes | | | 687 | | | | 826 | |
Depreciation and amortization | | | 666 | | | | 578 | |
Impairment of available-for-sale investment | | | – | | | | 341 | |
Adjusted EBITDA | | $ | 3,282 | | | $ | 3,938 | |
| | | | | | | | |
| | | 2013 | | | 2012 | |
Finance costs | | $ | 144 | | | $ | 114 | |
Unwinding of discount on asset retirement obligations | | | (13 | ) | | | (12 | ) |
Borrowing costs capitalized to property, plant and equipment | | | 79 | | | | 102 | |
Interest on net defined benefit pension and other post-retirement plan obligations | | | (17 | ) | | | – | |
Adjusted finance costs | | $ | 193 | | | $ | 204 | |
ACCOUNTING POLICIES
Leases entered into are classified as either finance or operating leases. Leases that transfer substantially all of the risks and rewards of ownership of property to the company are accounted for as finance leases. They are capitalized at the commencement of the lease at the lower of the fair value of the leased property and the present value of the minimum lease payments. Property acquired under a finance lease is depreciated over the shorter of the period of expected use on the same basis as other similar property, plant and equipment and the lease term.
Leases in which a significant portion of the risks and rewards of ownership are retained by the lessor are classified as operating leases. Rental payments under operating leases are expensed in net income on a straight-line basis over the period of the lease.
ACCOUNTING ESTIMATES AND JUDGMENTS
The company is party to various leases, including leases for railcars and vessels. Judgment is required in considering a number of factors to ensure that leases to which the company is party are classified appropriately as operating or financing. Such factors include whether the lease term is for the major part of the asset’s economic life and whether the present value of minimum lease payments amounts to substantially all of the fair value of the leased asset.
Substantially all of the leases to which the company is party have been classified as operating leases.
SUPPORTING INFORMATION
Lease commitments
The company has various long-term operating lease agreements for land, buildings, port facilities, equipment, ocean-going transportation vessels and
railcars, the latest of which expires in 2038. The majority of lease agreements are renewable at the end of the lease period at market rates. Rental expenses for operating leases for the year ended December 31, 2013 were $90 (2012 – $90, 2011 – $88).
Purchase commitments
The company has entered into long-term natural gas contracts with the National Gas Company of Trinidad and Tobago Limited, the latest of which expires in 2018. The contracts provide for prices that vary primarily with ammonia market prices, escalating floor prices and minimum purchase quantities. The commitments included in the table below are based on floor prices and minimum purchase quantities.
Agreements for the purchase of sulfur for use in the production of phosphoric acid provide for specified purchase quantities, and prices are based on market rates at the time of delivery. The commitments included in the following table are based on expected contract prices.
Capital commitments
The company has various long-term contractual commitments related to the acquisition of property, plant and equipment, the latest of which expires in 2015. The commitments included in the following table are based on expected contract prices.
Other commitments
Other commitments consist principally of pipeline capacity, throughput and various rail and vessel freight contracts, the latest of which expires in 2026, and mineral lease commitments, the latest of which expires in 2034.
| | |
| PotashCorp 2013 Annual Integrated Report | | 161 |
| | |
| Notes to the consolidated financial statements | | In millions of US dollars except as otherwise noted |
| Note 26 | Commitmentscontinued |
Minimum future commitments under these contractual arrangements are shown below:
| | | | | | | | | | | | | | | | | | |
| | | Operating
Leases | | | Purchase
Commitments | | | Capital
Commitments | | | Other
Commitments | | Total | |
Within 1 year | | | $ 90 | | | | $ 296 | | | | $ 51 | | | $ 43 | | | $ 480 | |
1 to 3 years | | | 140 | | | | 128 | | | | 6 | | | 62 | | | 336 | |
3 to 5 years | | | 72 | | | | 111 | | | | – | | | 45 | | | 228 | |
Over 5 years | | | 128 | | | | – | | | | – | | | 48 | | | 176 | |
Total | | | $ 430 | | | | $ 535 | | | | $ 57 | | | $ 198 | | | $ 1,220 | |
| NOTE 27 | CONTINGENCIES AND OTHER MATTERS |
ACCOUNTING POLICIES
Generally a contingent liability is a possible obligation that arises from past events and whose existence will be confirmed only by the occurrence or non-occurrence of one or more uncertain future events not wholly within the control of the company. A contingent liability may also be a present obligation that arises from past events but is not recognized because it is not probable that an outflow of resources embodying economic benefits will be required to settle the obligation, or the amount of the obligation cannot be measured with sufficient reliability. Contingent liabilities are not recognized in the financial statements but are disclosed unless the possibility of an outflow of resources embodying economic benefits is remote. Where the company is jointly and severally liable for an obligation, the part of the obligation that is expected to be met by other parties is treated as a contingent liability.
A contingent asset is a possible asset that arises from past events and whose existence will be confirmed only by the occurrence or non-occurrence of one or more uncertain future events not wholly within the control of the company. Contingent assets are not recognized in the financial statements and are only disclosed where an inflow of economic benefits is probable.
ACCOUNTING ESTIMATES AND JUDGMENTS
The company is exposed to possible losses and gains related to environmental matters and other various claims and lawsuits pending for and against it in the ordinary course of business. Prediction of the outcome of such uncertain events (i.e., being virtually certain, probable, remote or undeterminable), determination of whether recognition or disclosure in the consolidated financial statements is required and estimation of potential financial effects are matters for judgment. Where no amounts are recognized, such amounts are contingent and disclosure may be appropriate. While the amount disclosed in the consolidated financial statements may not be material, the potential for large liabilities exists and therefore these estimates could have a material impact on the company’s consolidated financial statements.
SUPPORTING INFORMATION
Canpotex
PCS is a shareholder in Canpotex, which markets Saskatchewan potash offshore. Should any operating losses or other liabilities be incurred by Canpotex, the shareholders have contractually agreed to reimburse it for such losses or liabilities in proportion to each shareholder’s productive capacity.Through December 31, 2013, there were no such operating losses or other liabilities.
Mining risk
The risk of underground water inflows, as with other underground risks, is currently not insured.
Legal and other matters
Significant environmental site assessment and/or remediation matters include the following:
Nitrogen and phosphate
| • | | The US Environmental Protection Agency (“USEPA”) has identified PCS Nitrogen, Inc. (“PCS Nitrogen”) as a potentially responsible party at the Planters Property or Columbia Nitrogen site in Charleston, South Carolina. The site includes a former fertilizer blending operation, formerly owned by a company from which PCS Nitrogen acquired certain other assets. The USEPA has requested the performance or financing of future site investigation and response activities from PCS Nitrogen and other named potentially responsible parties. The current owner of the Planters Property filed a complaint against PCS Nitrogen in the US District Court for the District of South Carolina seeking environmental response costs. The district court allocated 30 percent of the liability for response costs at the site to PCS Nitrogen, as well as a proportional share of any costs that cannot be recovered from another responsible party. The district court’s judgment is now final as all appeals have been exhausted. In December 2013, the USEPA issued an order to PCS Nitrogen and four other respondents requiring them |
| | |
| 162 | | PotashCorp 2013 Annual Integrated Report |
| | |
| Notes to the consolidated financial statements | | In millions of US dollars except as otherwise noted |
| Note 27 | Contingencies and other matterscontinued |
| | | jointly and severally to conduct certain cleanup work at the site and reimburse USEPA’s costs for overseeing that work. The USEPA also has requested reimbursement of $4 of previously incurred response costs. The ultimate amount of liability for PCS Nitrogen depends upon the final outcome of litigation to impose liability on additional parties, the amount needed for remedial activities, the ability of other parties to pay and the availability of insurance. |
| • | | PCS Phosphate has agreed to participate, on a non-joint and several basis, with parties to an Administrative Settlement Agreement with the USEPA (“Settling Parties”) in a removal action and the payment of certain other costs associated with PCB soil contamination at the Ward Superfund Site in Raleigh, North Carolina (“Site”), including reimbursement of past USEPA costs. The removal activities commenced in August 2007 and are estimated to cost a total of $75. PCS Phosphate is a party to ongoing Comprehensive Environmental Response, Compensation and Liability Act (“CERCLA”) contribution and cost recovery litigation for the recovery of costs of the removal activities. In September 2013, PCS Phosphate and other parties entered into an Administrative Order on Consent with the USEPA, pursuant to which a remedial investigation and focused feasibility study will be performed on that portion of the Site that was subject to the removal action. The USEPA has also issued an order to a number of entities requiring remediation downstream of the area subject to the removal action (“Operable Unit 1”). PCS Phosphate did not receive this order. At this time, the company is unable to evaluate the extent of any exposure that it may have for the matters addressed in the CERCLA litigation or for Operable Unit 1. |
| • | | In 1996, PCS Nitrogen Fertilizer, L.P. (“PCS Nitrogen Fertilizer”), then known as Arcadian Fertilizer, L.P., entered into a Consent Order (the “Order”) with the Georgia Environmental Protection Division (“GEPD”) in conjunction with PCS Nitrogen Fertilizer’s acquisition of real property in Augusta, Georgia.Under the Order, PCS Nitrogen Fertilizer is required to perform certain activities to investigate and, if necessary, implement corrective measures for substances in soil and groundwater. The investigation has proceeded and the results have been presented to GEPD. Two interim corrective measuresfor substances in groundwater have been proposed by PCS Nitrogen Fertilizer and approved by GEPD. PCS Nitrogen Fertilizer is implementing the approved interim corrective measures but it is unable to estimate with reasonable certainty the total cost of its corrective action obligations under the Order at this time. |
The company is also engaged in ongoing site assessment and/or remediation activities at a number of other facilities and sites, and anticipated costs associated with these matters are added to accrued environmental costs in the manner previously described in Note 14.This includes matters related to investigation of potential brine migration at certain of the potash sites. Based on current information, the company does not believe that its future obligations with respect to these facilities and sites are reasonably likely to have a material adverse effect on its consolidated financial position or results of operations.
Other significant legal matters include the following:
Potash
| • | | Between September and October 2008, the company and PCS Sales (USA), Inc. were named as defendants in eight similar antitrust complaints filed in US federal courts. Other potash producers were also defendants in these cases. Each of the separate complaints alleged conspiracy to fix potash prices, to divide markets, to restrict supply and to fraudulently conceal the conspiracy, all in violation of Section 1 of the Sherman Act and/or certain states’ laws. In January 2013, the company and PCS Sales (USA), Inc. settled the eight private antitrust lawsuits for a total of $44. The US District Court for the Northern District of Illinois issued an order granting final approval of the settlements with the plaintiffs in June 2013. The company and PCS Sales (USA), Inc. expressly deny any wrongdoing but decided to settle after weighing the multi-year financial cost and resources that would be required to defend these meritless allegations. The other potash producers who were defendants in these cases also have settled with the plaintiffs. |
Nitrogen and phosphate
| • | | The USEPA has an ongoing initiative to evaluate implementation within the phosphate industry of a particular exemption for mineral processing wastes under the hazardous waste program. In connection with this industry-wide initiative, the USEPA conducted inspections at numerous phosphate operations and notified the company of alleged violations of the US Resource Conservation and Recovery Act (“RCRA”) at its plants in Aurora, North Carolina; Geismar, Louisiana; and White Springs, Florida; and one alleged Clean Air Act (“CAA”) violation at its Geismar, Louisiana plant. The company has entered into RCRA 3013 Administrative Orders on Consent and has performed certain site assessment activities at all three plants. At this time, the company does not know the scope of action, if any, that may be required. As to the alleged RCRA violations, the company continues to participate in settlement discussions with the USEPA but is uncertain if any resolution will be possible without litigation, or, if litigation occurs, what the outcome would be. At this time, it is unable to evaluate the extent of any exposure it may have in these matters. As to the alleged CAA violation, the company and the USEPA negotiated a consent decree, pursuant to which PCS paid a penalty of $0.2 to resolve this matter. |
| • | | The USEPA has pursued an initiative to evaluate compliance with the CAA at sulfuric acid and nitric acid plants. In connection with this industry-wide initiative, it has sent requests for information to numerous facilities, including the company’s plants in Augusta, Georgia; Aurora, North Carolina; Geismar, Louisiana; Lima, Ohio; and White Springs, Florida. The USEPA and the Louisiana Department of Environmental Quality have notified the company of various alleged violations of the CAA at its Geismar, Louisiana plant. In May 2012, the USEPA issued to the company’s White Springs, Florida plant a Notice of Violation alleging that certain |
| | |
| PotashCorp 2013 Annual Integrated Report | | 163 |
| | |
| Notes to the consolidated financial statements | | In millions of US dollars except as otherwise noted |
| Note 27 | Contingencies and other matterscontinued |
| | | specified projects at the sulfuric acid plants were undertaken in violation of the CAA. While the company disputes the alleged violations, in May 2013, the company reached a tentative agreement to resolve the alleged violations without admitting any liability. The tentative agreement is subject to a variety of conditions, including the approval of the company’s Board of Directors and the negotiation of acceptable final agreements. The tentative agreement involves capital improvements, process changes and penalties for the company’s sulfuric acid plants in Aurora, North Carolina; Geismar, Louisiana; and White Springs, Florida that are currently estimated to cost at least $85, but the company is uncertain if a final agreement can be concluded. If a final agreement cannot be concluded and litigation subsequently occurs, the company is uncertain what the outcome would be. |
| • | | In December 2010, the USEPA issued a final rule to restrict nutrient concentrations in surface waters in Florida to levels below those currently permitted to be discharged from the company’s White Springs, Florida plant. Projected capital costs resulting from the USEPA rule, if it becomes effective, could be in excess of $100 for White Springs, and there is no guarantee that controls can be implemented which are capable of achieving compliance with the revised nutrient standards under all flow conditions. Various judicial challenges to the federal rules have been filed, including one lawsuit against the federal rule by The Fertilizer Institute and White Springs. In February 2012, the US District Court for the Northern District of Florida (“District Court”) ruled on summary judgment motions filed by the parties seeking to either vacate or uphold the USEPA rule. The District Court upheld the USEPA numeric nutrient criteria for Florida’s lakes and springs but rejected the criteria for Florida’s streams and rivers as arbitrary and capricious. In November 2012, the USEPA approved numeric nutrient criteria rules in their entirety which had been adopted by the State of Florida and filed with the USEPA in June 2012. These state rules, which have been upheld on appeal, could ultimately substitute for the federal rules. In March 2013, the USEPA and the State of Florida announced an Agreement in Principle and Path Forward with the goal being to make the promulgation of federal water quality standards no longer necessary in Florida. In May 2013, the Florida Legislature enacted legislation that would facilitate the USEPA’s withdrawal of its federal rules, thereby allowing the State of Florida to fully implement the adopted state rules. In January 2014, the District Court judge approved the USEPA’s request to modify the previous District Court consent decree to make its provisions consistent with these recent developments. The USEPA is now expected to take steps to repeal its rule on numeric nutrient criteria which would allow the adopted and approved state rule to take legal effect. In the meantime, the company continues to monitor and evaluate actions related to both the federal and state rules. Due to the possibility of additional legal challenges, the prospects for implementation of either the federal or the state rules and the availability of the site-specific relief mechanisms under either rule remain uncertain. However, if the state rules become the governing |
| | | rules, the company believes White Springs meets the criteria for site-specific relief and expects to apply for relief that would, if granted by the state, obviate the need for the expenditure of some or all of the capital costs previously projected for controls under the USEPA rule. |
General
| • | | There is no certainty as to the scope or timing of any final, effective requirements to control greenhouse gas emissions in the US or Canada. Canada has withdrawn from participation in the Kyoto Protocol, and the Canadian government has announced its intention to coordinate greenhouse gas policies with the US. Although the US Congress has not passed any greenhouse gas emission control laws, the USEPA has adopted several rules to control such emissions using authority under existing environmental laws. Some Canadian provinces and US states are considering the adoption of greenhouse gas emission control requirements. In Saskatchewan, provincial regulations pursuant to the Management and Reduction of Greenhouse Gases Act, which impose a type of carbon tax to achieve a goal of a 20 percent reduction in greenhouse gas emissions by 2020 compared to 2006 levels, may become effective in 2014. None of these regulations has resulted in material limitations on greenhouse gas emissions at the company’s facilities. The company is monitoring these developments and their future effect on its operations cannot be determined with certainty at this time. |
In addition, various other claims and lawsuits are pending against the company in the ordinary course of business. While it is not possible to determine the ultimate outcome of such actions at this time, and inherent uncertainties exist in predicting such outcomes, it is the company’s belief that the ultimate resolution of such actions is not reasonably likely to have a material adverse effect on its consolidated financial position or results of operations.
The breadth of the company’s operations and the global complexity of tax regulations require assessments of uncertainties and judgments in estimating the taxes it will ultimately pay. The final taxes paid are dependent upon many factors, including negotiations with taxing authorities in various jurisdictions, outcomes of tax litigation and resolution of disputes arising from federal, provincial, state and local tax audits. The resolution of these uncertainties and the associated final taxes may result in adjustments to the company’s tax assets and tax liabilities.
The company owns facilities that have been either permanently or indefinitely shut down. It expects to incur nominal annual expenditures for site security and other maintenance costs at certain of these facilities. Should the facilities be dismantled, certain other shutdown-related costs may be incurred. Such costs are not expected to have a material adverse effect on the company’s consolidated financial position or results of operations and would be recognized and recorded in the period in which they are incurred.
| | |
| 164 | | PotashCorp 2013 Annual Integrated Report |
| | |
| Notes to the consolidated financial statements | | In millions of US dollars except as otherwise noted |
ACCOUNTING POLICIES
General guarantees include contracts or indemnifications that contingently require the guarantor to make payments based on changes in an underlying; contracts that contingently require payments to a guaranteed party based on another entity’s failure to perform under an agreement; and indirect guarantee of the indebtedness of another party. General guarantees are not recognized in the consolidated statements of financial position but are disclosed.
A financial guarantee contract requires the issuer to make payments to reimburse the holder for a loss it incurs because a debtor fails to make payment when due. A financial guarantee contract is recognized as a financial instrument in the consolidated statements of financial position when the company becomes party to the contract.
SUPPORTING INFORMATION
In the normal course of operations, the company provides indemnifications, which are often standard contractual terms, to counterparties in transactions such as purchase and sale contracts, service agreements, director/officer contracts and leasing transactions. These indemnification agreements may require the company to compensate the counterparties for costs incurred as a result of various events, including environmental liabilities and changes in (or in the interpretation of) laws and regulations, or as a result of litigation claims or statutory sanctions that may be suffered by the counterparty as a consequence of the transaction. The terms of these indemnification agreements will vary based upon the contract, the nature of which prevents the company from making a reasonable estimate of the maximum potential amount that it could be required to pay to counterparties. Historically, the company has not made any significant payments under such indemnifications and no amounts have been accrued in the accompanying consolidated financial statements with respect to these indemnification guarantees (apart from any appropriate accruals relating to the underlying potential liabilities).
The company enters into agreements in the normal course of business that may contain features which meet the definition of a guarantee. Various debt obligations (such as overdrafts, lines of credit with counterparties for derivatives and back-to-back loan arrangements) and other commitments (such as railcar leases) related to certain subsidiaries and investees have been directly guaranteed by the company under such agreements with third parties. It would be required to perform on these guarantees in the event of default by the guaranteed parties. No material loss is anticipated by reason of such agreements and guarantees. At December 31, 2013, the maximum potential amount of future (undiscounted) payments under significant guarantees
provided to third parties approximated $562. It is unlikely that these guarantees will be drawn upon and, since the maximum potential amount of future payments does not consider the possibility of recovery under recourse or collateral provisions, this amount is not indicative of future cash requirements or the company’s expected losses from these arrangements. At December 31, 2013, no subsidiary balances subject to guarantees were outstanding in connection with the company’s cash management facilities, and it had no liabilities recorded for other guarantee obligations other than subsidiary bank borrowings of approximately $6, which are reflected in other long-term debt in Note 12.
The company has guaranteed the gypsum stack capping, closure and post-closure obligations of White Springs and PCS Nitrogen in Florida and Louisiana, respectively, pursuant to the financial assurance regulatory requirements in those states. It has guaranteed the performance of certain remediation obligations of PCS Joint Venture at the Lakeland, Florida and Moultrie, Georgia sites. The USEPA has announced that it plans to adopt rules requiring financial assurance from a variety of mining operations, including phosphate rock mining. It is too early in the rule-making process to determine what the impact, if any, on the company’s facilities will be when these rules are issued.
The environmental regulations of the Province of Saskatchewan require each potash mine to have decommissioning and reclamation plans, and financial assurances for these plans, approved by the responsible provincial minister. The Minister of the Environment for Saskatchewan (“MOE”) has approved the plans and the increase of the previously established CDN $3 trust fund to CDN $25 to be funded by the company in equal annual payments from 2014 through 2021. The next scheduled review of these plans and financial assurances is to be completed by June 30, 2016.
The company has met its financial assurance responsibilities as of December 31, 2013. Costs associated with the retirement of long-lived tangible assets have been accrued in the accompanying consolidated financial statements to the extent that a legal or constructive liability to retire such assets exists.
During the period, the company entered into various other commercial letters of credit in the normal course of operations. As at December 31, 2013, $47 of letters of credit were outstanding.
The company expects that it will be able to satisfy all applicable credit support requirements without disrupting normal business operations.
| | |
| PotashCorp 2013 Annual Integrated Report | | 165 |
| | |
| Notes to the consolidated financial statements | | In millions of US dollars except as otherwise noted |
| NOTE 29 | RELATED PARTY TRANSACTIONS |
ACCOUNTING POLICIES
A person or entity is related to the company, and therefore considered a related party, if any of the following conditions exist: an entity is an associate or joint venture; a person is a member of key management personnel (and their families); a post-employment benefit plan is for the benefit of employees; or a person has significant influence.
Key management personnel are the company’s directors and executive officers as disclosed in its 2013, 2012 and 2011 Annual Reports onForm 10-K, as applicable.
Sale of goods
The company sells potash from its Saskatchewan mines for use outside Canada and the US exclusively to Canpotex. Sales are at prevailing market prices and are settled on normal trade terms. Sales to Canpotex for the year ended December 31, 2013 were $1,253 (2012 – $1,492, 2011 – $1,956).
The receivable outstanding from Canpotex is shown in Note 3, and arose from sale transactions described above. It is unsecured in nature and bears no interest. There are no provisions held against this receivable.
Key management personnel compensation
Compensation to key management personnel was comprised of:
| | | | | | | | | | | | |
| | | 2013 | | | 2012 | | | 2011 | |
Salaries and other short-term benefits | | $ | 11 | | | $ | 11 | | | $ | 12 | |
Share-based payments | | | 6 | | | | 12 | | | | 5 | |
Post-employment benefits | | | 5 | | | | 5 | | | | 4 | |
Termination benefits | | | – | | | | – | | | | 2 | |
| | | $ | 22 | | | $ | 28 | | | $ | 23 | |
Transactions with post-employment benefit plans
Disclosures related to the company’s post-employment benefit plans are shown in Note 13.
| NOTE 30 | COMPARATIVE FIGURES |
As described in Note 2, as a result of the retrospective adoption of amendments to IAS 1 effective January 1, 2013, prior periods’ figures within the consolidated statements of comprehensive income have been reclassified to conform with the current period’s presentation.
Prior periods’ figures within Note 16 have been reclassified to disclose the impact of the margin (cost) on inter-segment sales separate from third-party transactions. Previously, these amounts were included as additions or
reductions to cost of goods sold in each segment. There was no change in gross margin, by segment or in total. The company believes these reclassifications provide more succinct information. Additionally, comparative figures related to nitrogen inter-segment sales in Note 16 have been reduced by $94 in 2012 and $8 in 2011 to exclude sales within the same operating segment. These adjustments had no effect on any other amounts within the consolidated financial statements.
| | |
| 166 | | PotashCorp 2013 Annual Integrated Report |
| | | | |
| | PotashCorp 2013 Annual Integrated Report | | 167 |
Learn more at www.PotashCorp2013AIR.com/bios
| | | | |
| 168 | | PotashCorp 2013 Annual Integrated Report | | |
Annual Meeting
The Annual Shareholders Meeting will be held at 10:30 a.m. Central Standard Time May 15, 2014 in the Grand Salon, TCU Place, 35 – 22nd Street East, Saskatoon SK.
It will be carried live on the company’s website: www.potashcorp.com.
Holders of common shares as ofMarch 17, 2014 are entitled to vote at the meeting and are encouraged to participate.
Dividends
Dividend amounts paid to shareholders resident in Canada are adjusted by the exchange rate applicable on the dividend record date. Dividends are normally paid in February, May, August and November, with record dates normally set approximately three weeks in advance of the payment date. Future cash dividends will be paid out of, and are conditioned upon, the company’s
available earnings. Shareholders who wish to have their dividends deposited directly to their bank accounts should contact the transfer agent and registrar, CST Trust Company.
Registered shareholders can have dividends reinvested in newly issued common shares of PotashCorp at prevailing market rates.
Ownership
On February 20, 2014, there were 1500 holders of record of the company’s common shares.
Corporate Headquarters
Suite 500, 122 – 1st Ave South
Saskatoon SK S7K 7G3 Canada
Phone:(306) 933-8500
Common Share Prices and Volumes
This table sets forth the high and low prices, as well as the volumes, for the company’s common shares as traded on the Toronto Stock Exchange and the New York Stock Exchange (composite transactions) on a quarterly basis.
Potash Corporation of Saskatchewan Inc. is on the S&P/TSX 60 and the S&P/TSX Composite indices.
| | | | | | | | | | | | | | | | | | | | | | | | |
| | | Toronto Stock Exchange1 | | | New York Stock Exchange | |
| | | High | | | Low | | | Volume | | | High | | | Low | | | Volume | |
2011 Q1 | | | 63.19 | | | | 49.82 | | | | 151,070,874 | | | | 63.97 | | | | 50.25 | | | | 761,644,573 | |
Q2 | | | 59.67 | | | | 48.50 | | | | 124,736,638 | | | | 61.80 | | | | 50.09 | | | | 525,699,026 | |
Q3 | | | 59.45 | | | | 45.04 | | | | 154,444,294 | | | | 62.60 | | | | 43.06 | | | | 547,590,911 | |
| Q4 | | | 51.60 | | | | 39.82 | | | | 156,271,939 | | | | 51.96 | | | | 38.44 | | | | 498,770,196 | |
Year 2011 | | | 63.19 | | | | 39.82 | | | | 586,523,745 | | | | 63.97 | | | | 38.44 | | | | 2,333,704,706 | |
2012 Q1 | | | 47.94 | | | | 41.80 | | | | 157,060,825 | | | | 48.00 | | | | 41.19 | | | | 489,674,156 | |
Q2 | | | 46.96 | | | | 38.31 | | | | 115,340,965 | | | | 47.42 | | | | 36.73 | | | | 352,261,284 | |
Q3 | | | 46.70 | | | | 39.75 | | | | 120,853,844 | | | | 46.16 | | | | 40.03 | | | | 369,272,966 | |
| Q4 | | | 43.44 | | | | 37.02 | | | | 87,667,531 | | | | 44.30 | | | | 36.94 | | | | 237,138,762 | |
Year 2012 | | | 47.94 | | | | 37.02 | | | | 480,923,165 | | | | 48.00 | | | | 36.73 | | | | 1,448,347,168 | |
2013 Q1 | | | 44.47 | | | | 39.50 | | | | 93,245,368 | | | | 44.05 | | | | 38.59 | | | | 248,737,914 | |
Q2 | | | 45.13 | | | | 38.82 | | | | 116,077,268 | | | | 44.13 | | | | 37.79 | | | | 279,719,497 | |
Q3 | | | 41.66 | | | | 29.67 | | | | 244,373,190 | | | | 40.07 | | | | 28.55 | | | | 893,342,013 | |
| Q4 | | | 35.45 | | | | 31.23 | | | | 120,831,002 | | | | 33.24 | | | | 29.95 | | | | 412,480,509 | |
Year 2013 | | | 45.13 | | | | 29.67 | | | | 574,526,828 | | | | 44.13 | | | | 28.55 | | | | 1,834,279,933 | |
| 1 | Trading prices are in CDN$ | Source: Thomson Reuters |
| | | | |
| | PotashCorp 2013 Annual Integrated Report | | 169 |
NYSE Corporate Governance
Disclosure contemplated by 303A.11 of the NYSE’s listed company manual is available on our website at www.potashcorp.com. The certifications required by Section 302 of the Sarbanes-Oxley Act of 2002 are filed as exhibits to our 2013 Annual Report on Form10-K.
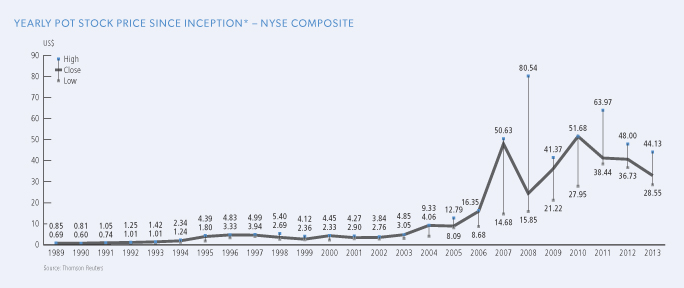
* Data are adjusted for a two-for-one stock split in August 2004, a three-for-one stock split in May 2007 and a three-for-one stock split in February 2011.
Transfer Agent
You can contact CST Trust Company, the corporation’s transfer agent, as follows:
By Telephone:
1-800-387-0825 (toll-free within Canada and the United States), or1-416-682-3860 (from any country other than Canada and the United States)
By Fax:
1-514-985-8843 (all countries)
By Mail:
P.O. Box 700
Station B
Montreal, Quebec, Canada H3B 3K3
Through the Internet:
www.canstockta.com
| | |
| 170 | | PotashCorp 2013 Annual Integrated Report |
Market and Industry Data Statement
Some of the market and industry data contained in this Annual Report and this Management’s Discussion & Analysis of Financial Condition and Results of Operations are based on internal surveys, market research, independent industry publications or other publicly available information. Although we believe that the independent sources used by us are reliable, we have not independently verified and cannot guarantee the accuracy or completeness of this information. Similarly, we believe our internal research is reliable, but such research has not been verified by any independent sources.
Information in the preparation of this Annual Report is based on statistical data and other material available at February 20, 2014.
Abbreviated Company Names And Sources*
| | |
Agrium | | Agrium Inc. (TSX and NYSE: AGU), Canada |
AMEC | | AMEC Americas Limited, Canada |
APC | | Arab Potash Company (Amman: ARPT), Jordan |
Belaruskali | | PA Belaruskali, Belarus |
Bloomberg | | Bloomberg L.P., USA |
Blue, Johnson | | Blue, Johnson & Associates, USA |
Canpotex | | Canpotex Limited, Canada |
CF Industries | | CF Industries Holdings, Inc. (NYSE: CF), USA |
CN Rail | | Canadian National Railway Co. (TSX: CNR and NYSE: CNI), Canada |
CP Rail | | Canadian Pacific Railway Ltd. (TSX and NYSE: CP), Canada |
CRU | | CRU International Ltd, UK |
DBRS | | Dominion Bond Rating Service, Canada |
FAI | | Fertilizer Association of India, India |
FAO | | Food and Agriculture Organization of the |
| | United Nations |
Fertecon | | Fertecon Limited, UK |
ICL | | Israel Chemicals Ltd. (Tel Aviv: ICL), Israel |
IFA | | International Fertilizer Industry Association, France |
Innophos | | Innophos Holdings, Inc. (NASDAQ: IPHS), USA |
| | |
Intrepid | | Intrepid Potash, Inc. (NYSE: IPI), USA |
IPNI | | International Plant Nutrition Institute, USA |
K+S | | K+S Group (Xetra: SDF), Germany |
Koch | | Koch Industries, Inc., USA |
| Mississippi Phosphates | | Mississippi Phosphates Corporation, USA |
| Moody’s | | Moody’s Corporation (NYSE: MCO), USA |
| Mosaic | | The Mosaic Company (NYSE: MOS), USA |
| NYMEX | | New York Mercantile Exchange, USA |
| NYSE | | New York Stock Exchange, USA |
| PhosChem | | Phosphate Chemicals Export Association, Inc., USA |
| Simplot | | J.R. Simplot Company, USA |
| Sinofert | | Sinofert Holdings Limited (HKSE: 0297.HK), China |
| SQM | | Sociedad Química y Minera de Chile S.A. (Santiago Bolsa de Comercio Exchange, NYSE: SQM), Chile |
| S&P | | Standard & Poor’s Financial Services LLC, USA |
Thomson Reuters | | Thomson Reuters Corporation (TSX and NYSE: TRI), USA |
| TSX | | Toronto Stock Exchange, Canada |
| Uralkali | | JSC Uralkali (LSE and RTS: URKA), Russia |
| USDA | | US Department of Agriculture, USA |
| USDOC | | US Department of Commerce, USA |
| Yara | | Yara International ASA (Oslo: YAR), Norway |
* Where PotashCorp is listed as a source in conjunction with external sources, we have supplemented the external data with internal analysis.
| | |
| PotashCorp 2013 Annual Integrated Report | | 171 |
Glossary of Terms
| | |
| 2013E | | 2013 Estimated |
| 2014F | | 2014 Forecast |
| Brownfield capacity | | Increase in operational capability at existing operation |
| CAGR | | Compound Annual Growth Rate |
| CAPEX | | Capital expenditure |
| Canpotex | | An export company owned by all Saskatchewan producers of potash (PotashCorp, Mosaic and Agrium) |
| Consumption vs demand | | Product applied vs product purchased |
| EU | | European Union |
| FOB | | Free on Board – cost of goods on board at point of shipment |
| FSU | | Former Soviet Union |
| GDP | | Gross Domestic Product |
| Greenfield capacity | | New operation built on undeveloped site |
| Latin America | | South America, Central America, Caribbean and Mexico |
| LNG | | Liquefied Natural Gas |
| MMBtu | | Million British thermal units |
| MT | | Metric tonne |
| MMT | | Million tonnes |
| North America | | The North American market includes Canada and the United States. |
| Offshore | | Offshore markets include all markets except Canada and the US. |
| Operational capability | | Estimated annual achievable production level |
| PhosChem | | Was an association formed under theWebb-Pomerene Act for US exports of phosphate fertilizer products. Members are PotashCorp and Mosaic. As of December 31, 2013, PhosChem no longer conducted export sales of solid phosphate products for PotashCorp and Mosaic. |
| PotashCorp | | Potash Corporation of Saskatchewan Inc. (PCS) and its direct or indirect subsidiaries, individually or in any combination, as applicable |
| Yuzhnyy | | A port situated in Ukraine |
Scientific Terms
| | | | |
| Nitrogen | | NH3 | | ammonia (anhydrous), 82.2% N |
| | HNO3 | | nitric acid, 22% N (liquid) |
| | UAN | | nitrogen solutions, 28-32% N (liquid) |
| | |
| Phosphate | | MGA | | merchant grade acid, 54% P2O5 (liquid) |
| | DAP | | diammonium phosphate, 46% P2O5 (solid) |
| | MAP | | monoammonium phosphate, 52% P2O5 (solid) |
| | SPA | | superphosphoric acid, 70% P2O5 (liquid) |
| | Monocal | | monocalcium phosphate, 48.1% P2O5 (solid) |
| | Dical | | dicalcium phosphate, 42.4% P2O5 (solid) |
| | DFP | | defluorinated phosphate, 41.2% P2O5(solid) |
| | STF | | silicon tetrafluoride |
| | |
| Potash | | KCl | | potassium chloride, 60-63.2% K2O (solid) |
|
| Fertilizer Measures |
| K2O tonne | | Measures the potassium content of fertilizers having different chemical analyses |
| P2O5 tonne | | Measures the phosphorus content of fertilizers having different chemical analyses |
| N tonne | | Measures the nitrogen content of fertilizers having different chemical analyses |
| Product tonne | | Standard measure of the weights of all types of potash, phosphate and nitrogen products |
|
| Currency Abbreviations |
| CDN | | Canadian dollar |
| EUR | | Euro |
| JOD | | Jordanian dinar |
| NOK | | Norwegian krone |
| RUB | | Russian ruble |
| USD | | United States dollar |
|
| Exchange Rates |
| CDN per USD at December 31, 2013 – 1.0636 |
| | |
| 172 | | PotashCorp 2013 Annual Integrated Report |

| | |

| | PotashCorp is a founding partner of the Global Institute for Food Security (GIFS). This unique public-private partnership enables innovative, multi-disciplinary research, training, and technological development to improve sustainable crop production, enhance human and animal nutrition, and help address the growing global demand for safe, reliable food. |