Nourishing Potential
2014 Annual Integrated Report

To learn more online, watch for the following icon:
 POTASHCORP.COM
Financial data in this report are stated in US dollars unless otherwise noted.


Nourishing Potential
Our drivers are simple, yet profound. More people. Improving diets. Growing food requires fertilizer. And PotashCorp can respond.
As the world’s population continues to increase and diets improve, we know this presents challenges for global food production. We also know that fertilizer is vitally important, accounting for approximately 50 percent of the world’s food production.
This situation provides an opportunity for companies that can respond – like PotashCorp. The potash, nitrogen and phosphate fertilizer products we produce help farmers nourish the potential of their soil. They also create potential for our investors to earn superior returns, our customers to grow their businesses, our employees to build their careers and our communities to thrive.
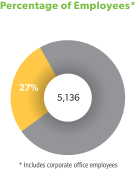
As we pursue long-term value, our path is defined by our goals and strategies and marked by accountability for our performance. This report reflects the focus of our people – from our Board of Directors and management team to our more than 5,000 employees – as we seek to nourish the potential of this company and positively impact our stakeholders.
Highlights
| | | | | | | | | | | | | | | | | | | | |
| Year ended December 31 | | 2014 | | | 2013 | | | 2012 | | | 2011 | | | 2010 | |
Financial ($ millions) | | | | | | | | | | | | | | | | | | | | |
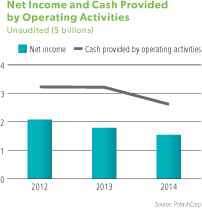
Net income | | | 1,536 | | | | 1,785 | | | | 2,079 | | | | 3,081 | | | | 1,775 | |
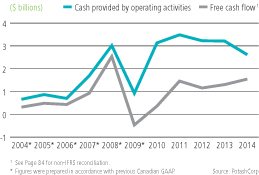
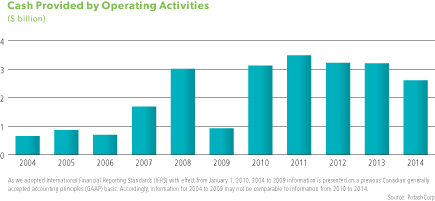
Cash provided by operating activities | | | 2,614 | | | | 3,212 | | | | 3,225 | | | | 3,485 | | | | 3,131 | |
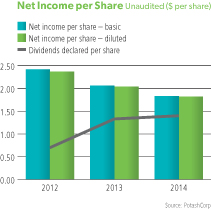
Dividends paid | | | 1,141 | | | | 997 | | | | 467 | | | | 208 | | | | 119 | |
| | | | | |
Customers | | | | | | | | | | | | | | | | | | | | |
Customer survey score | | | 89% | | | | 90% | | | | 92% | | | | 90% | | | | 90% | |
| | | | | |
Community | | | | | | | | | | | | | | | | | | | | |
Community survey score (out of 5) | | | 4.4 | | | | 4.2 | | | | 4.5 | | | | 4.4 | | | | 4.2 | |
| | | | | |
Employees | | | | | | | | | | | | | | | | | | | | |
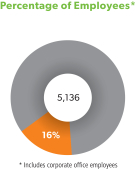
Employee engagement score* | | | 67% | | | | n/a | | | | 79% | | | | 73% | | | | 73% | |
| | | | | |
Safety and Environment | | | | | | | | | | | | | | | | | | | | |
Life-altering injuries | | | 1 | | | | 0 | | | | 1 | | | | 1 | | | | 0 | |
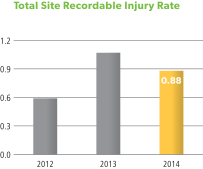
Total site recordable injury rate | | | 1.01 | | | | 1.06 | | | | 1.29 | | | | 1.42 | | | | 1.29 | |
Environmental incidents | | | 24 | | | | 17 | | | | 19 | | | | 14 | | | | 20 | |
| * | No survey was conducted in 2013. Engagement survey completed annually by half of employees prior to 2013; beginning in 2014, survey conducted biennially with all employees. |
| | |
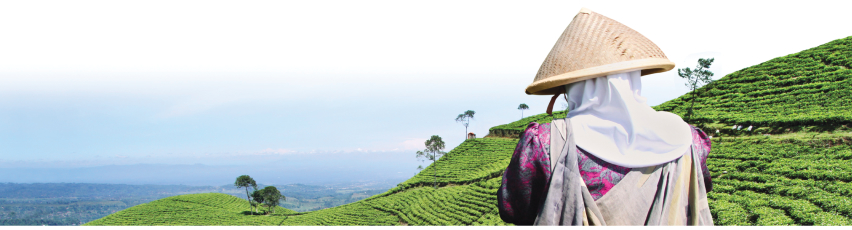
 | | Cover image:Selina Kabusia of Kenya learned new approaches to food production as part of Free The Children’s outreach, specifically through the Agriculture and Food Security pillar established with PotashCorp’s support. With her training, Selina is able to nourish her family as well as raise healthy hens, selling the eggs to help send her daughter, Naserian, to school. Read more about Selina at potashcorp.com/selinas_story |
| | |
| PotashCorp 2014 Annual Integrated Report | | 1 |
CEO Letter


Jochen Tilk
President and Chief Executive Officer
Dear Shareholders,
In many respects, 2014 was a year of transition for PotashCorp that will help define our future direction. If I were to describe the year simply: We moved to a more tempered, but supportive, environment.
Certainly this was the case for the broader economy in 2014. Despite a strong US recovery, concerns regarding weakening growth in China and other key regions weighed on the global outlook for most commodities.
This was apparent in global agriculture as the backdrop shifted from exceptionally tight crop supplies to healthier levels. Crop prices fell amid this transition, but we believe today’s levels remain supportive for both farmer economics and our business.
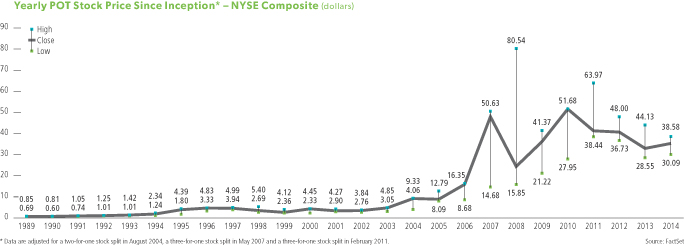
In the global potash market, after a period of significant uncertainty, customers re-engaged early in the year and pricing stabilized. Underpinned by agronomic need and affordability, strong consumption and replenishment of distributor inventories
raised global demand to an all-time record. This situation not only tested the industry’s supply capability, it renewed confidence in long-term growth.
From PotashCorp’s standpoint, 2014 provided greater definition of our path forward. With our decade-long potash expansion program nearing completion, our focus shifted to optimization. We aligned our operational capability with market expectations to improve our competitive position while maintaining operating flexibility. We also returned cash to our shareholders through the completion of our share repurchase program and payment of a strong dividend.
It was a year of change – in both our business and our industry – but the steps we are taking are designed to create value not only for today, but for tomorrow.
Our Results
We cannot speak to our performance without it being overshadowed by two fatalities at our operations during the past 12 months. Sadly, workplace accidents resulted in the loss of an employee at our Cory potash facility in February 2014 and another at our White Springs phosphate operation in early 2015. Such losses are unacceptable and something we are working tirelessly to address. It highlights that our pursuit of no harm is never complete, and that our commitment to improve preventive safety measures must always be at the forefront.
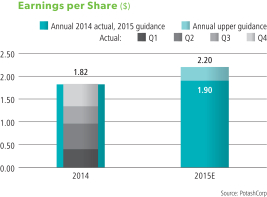
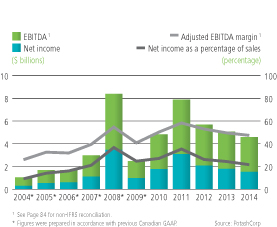
When we look back at the year from a financial perspective, what unfolded in 2014 was more positive than initially expected. We began the year anticipating a challenging earnings environment as nutrient prices had declined through the second half of 2013, most notably in potash. Our earnings of $1.82 per share did fall short of the $2.04 per share earned in 2013, but exceeded our initial estimates.
In potash, market conditions improved throughout the year, so did our results. Record global shipments – estimated at more than 61 million tonnes – propelled our sales volumes and supported higher realizations in major spot markets relative to the beginning
Nourishing Potential
| | | | | | | | |
$2.2 billion Cash returned to shareholders in 2014* | | | | $26 million Invested in community initiatives in 2014 | | | | 20 percent Reduction in number of safety incidents in 2014* |
* Includes dividends paid of $1.1B and share repurchases of $1.1B | | | | | | | | * Measured by total site recordable injuries compared to 2013 |
| | |
| 2 | | PotashCorp 2014 Annual Integrated Report |

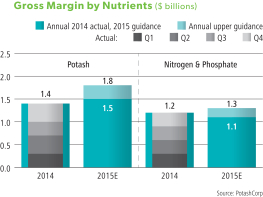
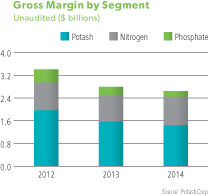
of the year. Achieving the first milestone of our 2016 target, potash cash operating costs moved approximately $17 per tonne lower – excluding the positive impact of foreign exchange and royalties – as we benefited from operational savings and higher production levels. Despite these improving conditions, our full-year gross margin of $1.4 billion did not match the 2013 total.
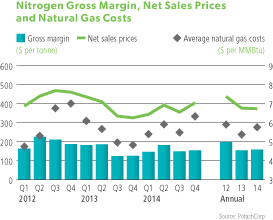
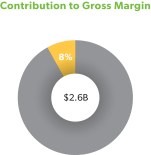
Our nitrogen business again contributed meaningfully to our bottom line and highlighted the value of our advantaged position and recent brownfield expansions. We delivered a record gross margin year, surpassing $1 billion for the first time. In phosphate, gross margin of approximately $200 million declined from 2013 levels as our costs rose due to shutdown-related expenses and operational reliability issues.
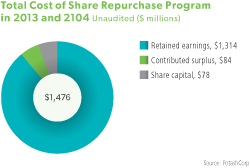
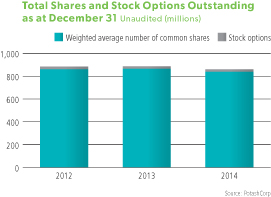
We took steps to further enhance shareholder value by completing the share repurchase program initiated in 2013. In 2014, we bought back 29 million shares at an average price of $35 per share with the entire program reducing our outstanding share count by approximately 5 percent. We also returned approximately $1.1 billion to investors through quarterly dividends, an important element of our capital allocation strategy.
Operationally, our efforts to improve the competitiveness of our assets and achieve best-in-class performance continued.
We safely and successfully advanced our expansion efforts. In potash, our remaining projects at Rocanville and New Brunswick are now in early ramp-up stage with capital spending largely complete. These projects represent the final pieces of an unprecedented potash expansion program that will raise our nameplate capacity to approximately 19 million tonnes, improve our overall cost structure and help us respond to market growth.
In nitrogen, we completed the first phase of our Lima expansion project. Lima is now readying for the final phase in late 2015, which will enhance product diversity and increase our lower-cost, US-based ammonia production.
From an environmental standpoint, our performance fell short on certain improvement targets we set for 2014. It is evident to me that a commitment to fulfilling our environmental responsibilities is
deeply rooted throughout the company and one of my objectives is to continually seek ways to reduce our environmental footprint.
A Broader View of Performance
Beyond financial and operational performance, we understand that our ability to impact value extends to our customers, employees and communities.
For our customers, 2014 brought some unique challenges. Production and logistical constraints were evident through much of the year with availability of supply at the forefront. We worked with our operating teams and logistical partners to do everything possible to meet our customers’ needs and set a standard that differentiated us. We continued to invest in building on this competitive advantage, including the development of our distribution platform and the addition of railcars to our fleet.
We have an extremely talented and motivated group of people at PotashCorp. Even as we worked through staffing reductions, our people remained focused and committed to building a safer and stronger company. We continue to set targets and track performance in a number of areas to ensure that we attract, retain, develop and engage a world-class workforce. Results from our biennial engagement survey suggest we are doing many things right. At the same time, we are working on action plans where we can continue to improve.
As a new member of the PotashCorp team, I find it especially rewarding to see first-hand the company’s impact on our communities. In 2014, we invested $26 million in initiatives that improve quality of life for those locally and in certain regions around the globe. By providing both time and capital, we strive to create shared prosperity in our communities and forge strong relationships with organizations that share our vision. Through important partnerships, a significant portion of our investment was directed to helping address local and global food security. It is a priority of our community investment program because we know our company can contribute solutions to this vital area beyond the products we produce.
| | | | | | | | |
40,402 youth Informed about food security issues through speaking tours* | | | | 32 percent Decrease in severe food insecurity in six communities* | | | | 4,798 people In Trinidad attended training* at PotashCorp’s Model Farm |
* Through PotashCorp’s sponsorship of the international charity and education partner, Free The Children, in 2013 and 2014 | | | | * Through sponsorship of Free The Children and PotashCorp’s direct support of six communities on agricultural initiatives | | | | * Calculated by training course attendance from 2010 to 2014 |
| | |
| PotashCorp 2014 Annual Integrated Report | | 3 |
Outlook for 2015
As we begin a new year, we believe we are well positioned to respond effectively to any market scenario. We enter 2015 with supportive market conditions, particularly in potash. Although our global shipment expectation of 58-60 million tonnes in 2015 trails the record 2014 level, lower producer inventories and potential supply constraints in certain producing regions are expected to keep operating rates elevated. With higher realized prices in virtually every key market and our position as one of the few producers expected to have incremental operational capability, we believe PotashCorp has an opportunity to capture improved gross margin.
This – along with our expectations of relatively flat contributions from our nitrogen and phosphate businesses – is expected to generate earnings of $1.90-$2.20 per share in 2015.
What We’re Working On
Our leadership team has been – and will continue to be – focused on reviewing and evolving the company’s strategic objectives, including a comprehensive assessment of opportunities and risks associated with our asset portfolio and growth opportunities. In 2014, we initiated and completed a thorough review of our potash and nitrogen businesses.
In potash, we are in an enviable position. We currently represent nearly 20 percent of global capacity and account for close to 40 percent of the estimated new operational capability being built in the industry over the next five years. Our emphasis is on protecting – and growing – the value of our enterprise.
When we considered our path ahead, we began with an objective view of the potash market. We arrived at an expectation that global operating rates should remain supportive and that demand growth will largely offset new capacity over the coming five years. This past year was a reminder that markets can be tighter than expected when demand is stronger or operational disruptions occur. But, as we have also seen in the past, there are scenarios in which market conditions could prove more challenging.
The exercise reaffirmed two points – to be successful over the long term, we must ensure that we have the ability to capture growth opportunities and are positioned for success in any market conditions. Through our increased focus on managing our operational flexibility and enhanced cost-competitiveness, we believe we are prepared for both.
Beyond this, we are challenging ourselves to pursue innovative ways to maximize long-term profitability, including plans to review our investments and market development strategies.
Based on our assessment of the nitrogen business, we expect the US will remain in a favorable cost position over the coming years, and this nutrient will continue to be a key contributor to our earnings. Our focus is on maximizing the reliability of our operations, successfully bringing our Lima expansion online and working to reduce the impact from natural gas-related curtailments in Trinidad. Additionally, our team continues to explore other lower-cost, quick-payback US brownfield opportunities that can deliver high rates of return for our shareholders.
Similar to our other nutrients, we will complete a strategic review of our phosphate business in 2015. We have great assets but after a challenging year we know we can improve our performance. We are working on a number of initiatives designed to increase reliability and enhance margins and expect to deliver better results in 2015.
Our potential to grow earnings – coupled with diminishing expansion spending – makes it important that we have a sound capital allocation strategy in place. Our management team and Board of Directors remain focused on better defining our priorities in 2015 and look forward to providing greater clarity as we move ahead.
Finally, in conjunction with the Board, we will re-examine our performance evaluation process and compensation program to ensure we have the right programs to monitor, measure and hold ourselves accountable to the priorities that drive value for both the company and our stakeholders.
Nourishing Tomorrow
I am extremely proud to call myself an employee of PotashCorp, and am excited by the opportunity to lead this great company forward. I would like to thank Bill Doyle for his tremendous leadership and contributions to the company and the fertilizer industry. Under Bill’s tenure as CEO, significant shareholder value was created. Moreover, he helped PotashCorp become a supplier of choice, a company at which employees are safe and proud to work and a great community member.
I would also like to thank our Board and all our employees. PotashCorp has an excellent foundation for growth that would not have been possible without the dedication and contributions made by each and everyone.
Along with the entire management team, I am committed to building on our past successes, delivering on our full potential and nourishing long-term value for all our stakeholders.

Jochen Tilk
President and Chief Executive Officer
February 20, 2015
| | |
| 4 | | PotashCorp 2014 Annual Integrated Report |

Management’s Discussion & Analysis
of Financial Condition and Results of Operations (in US dollars)
To learn more, watch for the following icons:
| | | | | | | | | | | | | | | | | | |
 | | POTASHCORP.COM* | |  | | ANNUAL INTEGRATED REPORT | |  | | FORM 10-K | |  | | PROXY CIRCULAR | |  | | FINANCIAL STATEMENTS |
The following discussion and analysis is the responsibility of management and is as of February 20, 2015. The Board of Directors carries out its responsibility for review of this disclosure principally through its audit committee, comprised exclusively of independent directors. The audit committee reviews this disclosure and recommends its approval by the Board of Directors. The term “PCS” refers to Potash Corporation of Saskatchewan Inc. and the terms “we,” “us,” “our,” “PotashCorp” and “the company” refer to PCS and, as applicable, PCS and its direct and indirect subsidiaries as a group. Additional information relating to PotashCorp (which is not incorporated by reference herein) can be found in our regulatory filings on SEDAR at www.sedar.com and on EDGAR at www.sec.gov.
All references to per-share amounts pertain to diluted net income per share (EPS) as described in Note 9 to the consolidated financial statements.
| * | The information contained on or accessible from our website or any other website is not incorporated by reference into this “Management’s Discussion & Analysis of Financial Conditions and Results of Operations” or any other report or document we file with or furnish to the US Securities and Exchange Commission or Canadian securities regulatory authorities. |
| | |
| PotashCorp 2014 Annual Integrated Report | | 5 |
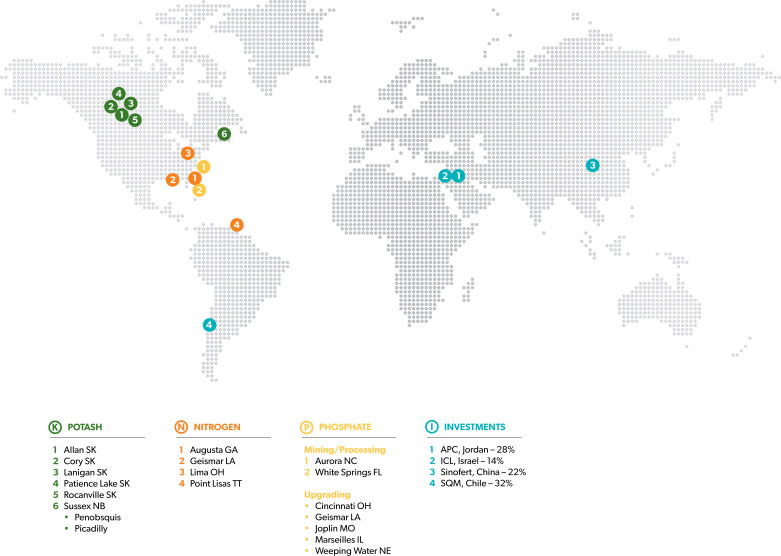
Company Overview
Who We Are
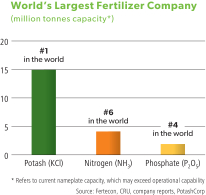
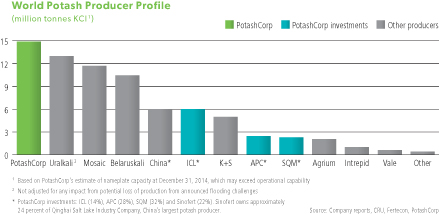
PotashCorp is the world’s largest fertilizer company by capacity, producing the three primary crop nutrients: potash (K), nitrogen (N) and phosphate (P).
We are the world’s leading potash producer by capacity and our Canadian operations represent one-fifth of global capacity 1.
To enhance our global footprint, we also have investments in four potash-related businesses in South America, the Middle East and Asia.
With operations and business interests in seven countries, PotashCorp is an international enterprise and plays an important role in helping the world grow the food it needs.
Our Operations
| | |
| 6 | | PotashCorp 2014 Annual Integrated Report |
Company and Strategy
| | | | | | | | | | | | | | | | | | |
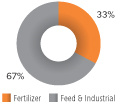
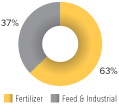
| Our Business Segments (2014) | | |  | | | POTASH | | |  | | | NITROGEN | | |  | | | PHOSPHATE |
| | | | | | | | | | |
| | |  | | | |  | | | |  |
| | | | | |
Share of Global Capacity1 | | 20% | | | | 2% | | | | 3% |
| | | | | |
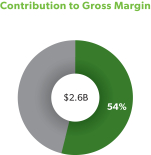
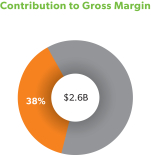
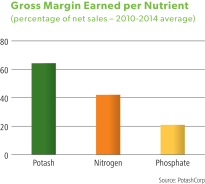
| Contribution to Gross Margin | | 54% | | | | 38% | | | | 8% |
| Sales Volumes by Product Category | | 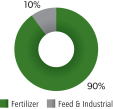
| | | | 
| | | | 
|
Sales Volumes by Region | | 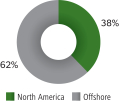
| | | | 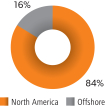
| | | | 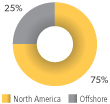
|
| | | | | | | | | | |
Community Survey Score2 | | 4.1 | | | | 4.8 | | | | 4.5 |
| | | | | | | | | | |
| | | | | |
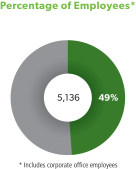
Employees3 | | 2,534 | | | | 802 | | | | 1,385 |
| | | | | |
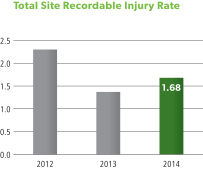
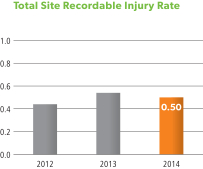
Total Site Recordable Injury Rate | | 1.68 | | | | 0.50 | | | | 0.88 |
| | | | | | | | | | |
Environmental Incidents | | 14 | | | | 6 | | | | 4 |
| | | | | | | | | | |
| | | | | |
| | Page 44 | | | | Page 54 | | | | Page 62 |
| |
| | 1 Based on nameplate capacity at December 31, 2014, which may exceed operational capability 2 Scores (out of 5) based on 2014 survey results for: Potash – Allan and Lanigan; Nitrogen – Lima; Phosphate – Marseilles and White Springs 3 Only includes employees within individual nutrient segments as at December 31, 2014 |
| | |
| PotashCorp 2014 Annual Integrated Report | | 7 |
A Roadmap for Our Report

OUR VISION
To play a key role in the global food
solution while building long-term value
for all stakeholders.
Our Reporting Approach
As a publicly traded company, we are in business to be profitable for our shareholders and build sustainable value over the long term. We know this cannot be accomplished without understanding the needs of our many stakeholders that contribute to PotashCorp’s success. When we help our customers, employees and communities prosper – and keep our people and environment free from harm – our investors and everyone associated with our business can thrive.
This is how we run our business, and our aim in integrated reporting is to discuss financial and non-financial elements in a way that explains how we create value for our stakeholders, and makes their interdependence clear.
How We Determine What We Report
In a complex operating and reporting environment, we believe good disclosure means having a relevant and transparent discussion about what has the greatest potential impact on value creation. To achieve this, we consider what matters most to both our company and our key stakeholders.
Informed by our Priority Matrix – which includes input gathered from interviews within PotashCorp and from our stakeholder surveys – this report provides the information considered to be of most importance to our investors. For other stakeholders who wish to explore in greater depth the areas of our business of most interest to them, we provide relevant references throughout the report to our online Integrated Reporting Center.
| | |
| | potashcorp.com/toppriorities |
| | |
| 8 | | PotashCorp 2014 Annual Integrated Report |
Company and Strategy

| | |
 | | KEY FACTORS |
| | Core Values |
| | On Page 10, we highlight the principles that guide our day-to-day actions and interactions with our stakeholders. |
| | Key Relationships |
| | On Page 10, we explain the key relationships and expectations that we consider as we strive to create mutually beneficial outcomes. |
| | Operating Environment |
| | On Pages 12-13, we discuss the opportunities and challenges we face in each nutrient. |
| | Competitive Advantages |
| | On Pages 14-15, we detail the unique characteristics on which we base our value-enhancing strategies. |
| |
 | | GOALS AND STRATEGIES |
| | How We Create Value |
| | On Pages 16-19, we explore how we use our Value Model to set goals and develop strategies designed to create long-term, sustainable value for all our stakeholders. |
| |
 | | RISK AND GOVERNANCE |
| | How We Approach Risk |
| | On Pages 21-25, we highlight the key risks to our company and the way we identify, assess, monitor and seek to mitigate them on an ongoing basis. |
| | Governance and Remuneration |
| | On Pages 26-29, we detail how our Board of Directors strives to ensure that the company is managed in a way that builds and protects value for all stakeholders. |
| |
 | | VALUE |
| | Our Performance |
| | On Pages 31-41, we discuss our performance against our targets and highlight the priorities for achieving shared success. |
| | |
| PotashCorp 2014 Annual Integrated Report | | 9 |
Key Factors
As we develop, review and refine our strategies, we continually assess the main factors that influence our ability to create value for our stakeholders. Guided by our Core Values and understanding what is most important in our key relationships, we consider the ever-changing operating environment and how we can best leverage our competitive advantages.

The basic principles that guide how we operate
| | | | | | | | | | | | | | | | | | | | |

| | | |  | | | |  | | | |  | | | |  | | | |  |
| | | | | | | | | | |
We Operate With Integrity | | | | Our Overriding Concern Is the Safety of People and the Environment | | | | We Listen to All PotashCorp Stakeholders | | | | We Seek Continuous Improvement | | | | We Share What We Learn | | | | We Are Accessible, Accountable and Transparent |
potashcorp.com/corevalues

Understanding what is most important to our stakeholders
| | | | | | |
| Investors | | Customers | | Communities | | Employees |
| | | | | | |
| | | | |
 | |  | |  | |  |
| | | | | | |
• Earnings and cash flow growth with reduced volatility • Strategic use of capital to enhance shareholder returns • Management of major business and operational risks | | • Product quality and competitive pricing • Customer service, including reliability and sales representatives’ knowledge | | • Economic and social
contributions, including jobs,
local procurement, taxes and
community investment • Safe operations with
minimal environmental
impact | | • Safe work environment • Career growth and
development opportunities • Competitive compensation |
potashcorp.com/keyrelationships
| | |
| 10 | | PotashCorp 2014 Annual Integrated Report |
Company and Strategy

A world that requires more food and more fertilizer
We believe PotashCorp’s long-term opportunity is simple: As demand for food increases, so does the need for fertilizer. Our products play an essential role in helping farmers increase crop yields to sustainably meet the world’s growing need for food.
| | | | | | | | | | | | | | | | |
2.4B
| | | | 11%
| | | | 50%
| | | | 80%
| | 
| | 
|
Increase in number of
people to feedby 2050 | | | | Increase in per capita
caloric consumption by 2050 | | | | Estimated impact of
fertilizer oncrop yields | | | | Increase in crop
production expected
from yield improvements | | | |
| Source: United Nations (as compared to 2014) | | | | Source: FAO (as compared to 2005/07) | | | | Source: IPNI
| | | | Source: FAO (as compared to 2005/07) | | | | |
Page 12

What makes us unique
We believe PotashCorp has significant potential to create long-term value by sustainably leveraging our advantages.
Our strategies are built on our unique strengths to drive our success.
| | | | | | | | | | | | | | | | | | | | |
| | | |
| | | |
| | | |
| | | |
| | | |
|
| Access to Long-Lived, High-Quality Reserves | | | | Industry-Leading Potash Position | | | | Advantaged Positions in Nitrogen and Phosphate | | | | Strong Marketing Position | | | | Robust Cash Flow and Financial Strength | | | | Experienced and Engaged Workforce |
Page 14
| | |
| PotashCorp 2014 Annual Integrated Report | | 11 |
Operating Environment
We monitor the market opportunities and challenges in each nutrient to determine how best to position the company for long-term success. While we produce products for fertilizer, feed and industrial purposes, our growth is closely tied to the important role crop nutrients play in helping feed a growing world.
| | | | | | | | | | |
| | Nutrient | | | Global Use as Fertilizer | | Industry Highlights |
| | | | | | | | | | | |
| | | | | |  | | | ~90% | | • Number of major producing countries: 12 • Global production traded (KCl): 76% • Barriers to entry: High |
| | | | | | | | | | |
| | | | | | | | | | | |
| | | | | |  | | | ~80% | | • Number of major producing countries: ~60 • Global production traded (NH3): 11% • Barriers to entry: Low-Moderate |
| | | | | | | | | | | |
| | | | | | | | | | | |
| | | | | |  | | | ~90% | | • Number of major producing countries: ~40 • Global production traded (P2O5): 10% • Barriers to entry: Moderate |
| | | | | | | | | | | |
Page 42

| | | | | | |
| Market Opportunities | | Market Challenges | | | | |
| | | | | | |
• Improvement in global soil fertility practices is expected to increase demand for the under-applied nutrients, especially potash. • Producers that can increase their operational and export capabilities have the potential to raise sales volumes as demand grows. | | • In recent years, changes in economic conditions, government policies and potash affordability have heightened variability in demand growth. • Attractive long-term growth prospects and historically high margins have attracted investment in new capacity. | | 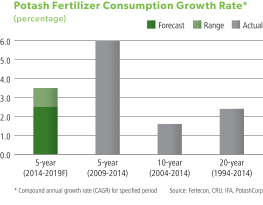 |
| | | |
| | | | | | |
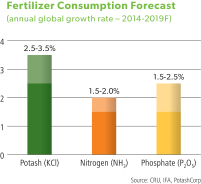
| | | | 2.5-3.5% | | Estimated five-year annual growth rate |
| | | | | | |
| | |
| 12 | | PotashCorp 2014 Annual Integrated Report |
Company and Strategy

| | | | | | |
| Market Opportunities | | Market Challenges | | | | |
| | | | | | |
•Lower natural gas prices due to increased US shale gas supply have improved the cost position of domestic nitrogen producers. •Trinidad is less than a week’s sailing time from the US and has logistical advantages compared to most exporters supplying that market. | | •Favorable natural gas costs and strong demand in the US have resulted in development of new nitrogen capacity. •Significant excess urea export capacity in China and the Middle East can result in price volatility. | | 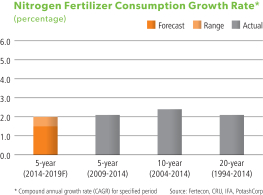
|
| | | |
| | | |
| | | |
| | | |
| | |
| | | | | |
| | | | 1.5-2.0% | | Estimated five-year annual growth rate |
| | | | | | |

| | | | | | |
| Market Opportunities | | Market Challenges | | | | |
| | | | | | |
•Producers with their own phosphate rock supply have the potential to earn higher margins as their mining costs are typically lower than the prices non-integrated competitors must pay for traded rock. •Only producers with access to higher-quality rock can make feed, industrial and certain liquid fertilizer products, which are in increasing demand and typically generate higher margins. | | •Rising capacity from offshore suppliers (largely China, Morocco and Saudi Arabia) can impact global trade and market fundamentals. •In India, changing fertilizer subsidies have affected demand. Given India’s influence on global phosphate trade, its fluctuating demand can cause variability in both shipments and world prices. | | 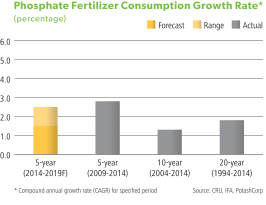 |
| | | |
| | | | | | |
| | | 1.5-2.5% | | Estimated five-year annual growth rate |
| | | |
| | | | | | |
| | |
| PotashCorp 2014 Annual Integrated Report | | 13 |
Competitive Advantages
| | |
| 14 | | PotashCorp 2014 Annual Integrated Report |
PotashCorp’s unique strengths provide us with competitive advantages that let us capitalize on global opportunities and create long-term value for all our stakeholders. We leverage these advantages and seek to enhance what differentiates us from our peers.
| | | | | | | | | | | | | | | | | | |
 | | | | | |  | | | | | |  |
| | | | | | |

| | | | | | 
| | | | | | 
|
| | | | | | |
We have access to decades ofhigh-quality permitted potash and phosphate reserves withwell-established infrastructure in politically stable regions
of the world. | | | | | | We are the largest potash producer by capacity, with fivelower-cost operations in Saskatchewan and one in New Brunswick. We also have strategic investments in four global potash-related companies with exposure to important growth markets. | | | | | | We have nitrogen assets with accessto lower-cost natural gas and proximity to key markets, and a phosphate portfolio with the most diversified product offering in the industry, which has historically provided more stable returns. |
| | | | | | | | | | | | | | | | | | |
| | | | | | | | | | | | | | | | | | | |
54-89 years | | Estimated remaining mine life at our potash operations | | | | | | 20% | | Percentage of global potash nameplate capacity | | | | | | $1.2 billion | | Nitrogen and phosphate gross margin in 2014 |
| | | | | | | | | | | | | | | | | | | |
Page 4 – Potash Operations – Reserves 
|
 |
Company and Strategy
| | | | | | |
| | | |  | | |
| | | | | | | | | | | | | | | | | | |
 | | | | | |  | | | | | |  |
| | | | | | |

| | | | | | 
| | | | | |  |
| | | | | | |
We have long-term customer relationships, extensive distribution networks and experienced sales teams through both PCS Sales and Canpotex. These networks allow us to reliably and efficiently meet the needs of a global customer base. | | | | | | Our business model and asset portfolio have consistently generated positive cash flows, even through volatile market conditions. As our potash expansion program nears completion, our ability to generate free cash flow increases, enabling us to improve shareholder returns. | | | | | | Our people have deep-rooted knowledge in all aspects of our industry and operations, along with significant skills and experience. This helps us set sound strategies and improve efficiency, innovation and safety performance. |
| | | | | | | | | | | | | | | | | | |
| | | | | | | | | | | | | | | | | | | |
17 MMT | | Anticipated export terminal capacity for Canpotex* | | | | | | $2.6 billion | | Cash provided by operating activities in 2014 | | | | | | 13.4 years | | Average workforce experience |
| | | | | | | | | | | | | | | | | | | |
* Assumes completion of existing expansion project. Does not reflect PotashCorp’s export capability. | | | | | | | | | | | | | | | | |
 |
 |
| | |
| PotashCorp 2014 Annual Integrated Report | | 15 |

How We Create Value
|
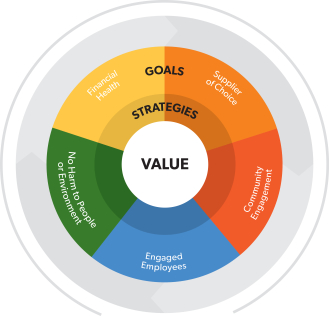 Our Value Model informs the goals and
strategies we put in place to create value for all
stakeholders. It is designed to ensure that we
consider the needs of all the stakeholders that
contribute to PotashCorp’s long-term success. |
|
|
|
|
|
|
|
| | |
| | | Goals |
| |
| | | |
| |

| | Financial Health Create superior long-term shareholder value |
| |
| |

| | Supplier of Choice Attract and retain customers through superior quality, reliability and service |
| |

| | Community Engagement Build strong relationships with and improve thesocioeconomic well-being of our communities |
| |

| | Engaged Employees Attract, retain, develop and engage employees to achieve our long-term goals |
| |

| | No Harm to People
or Environment Achieve no harm to people or damage to the environment |
| | |
| 16 | | PotashCorp 2014 Annual Integrated Report |
Company and Strategy
| | | | | | |
| | | Top Priorities | | Target Metrics (2014) | | Risk Considerations |
| | | |
| | | | | Page 31 | | Page 22 |
| | | |
| | | • Deliver earnings and cash flow growth • Minimize earnings volatility • Return capital to shareholders Page 18 | | • Total shareholder return • Cash flow return • Potash expansion project execution • Potash cost reduction | | Items that could impact PotashCorp’s financial performance or ability to execute on our business strategies. Given its significance in our portfolio, risks pertaining to our potash business tend to have the greatest potential effect. |
| | | |
| | | • Customer service • Market development • Transportation and distribution potashcorp.com/supplierofchoice | | • Product quality and service scores • Domestic rail cycle times | | Factors that may affect our ability to deliver product safely and reliably to our customers, impair our customer relationships or impact our reputation. |
| | | |
| | | • Reputation and trust • Economic and social impact potashcorp.com/communities | | • Community investment • Community survey scores • Employee matching gift participation | | Items that could impair our reputation or negatively affect our social license to operate in our communities and investment locales. |
| | | |
| | | • Talent and organizational development • Competitive compensation • Workforce engagement • Diversity and inclusion potashcorp.com/employees | | • Employee engagement scores • Internal promotions for senior staff positions • External employment acceptance rates | | Factors that may impact our ability to attract, retain, develop and engage qualified employees who can deliver on our business plans. |
| | | |
| | • Safety performance • Environmental performance potashcorp.com/safetyandenvironment | | • Life-altering injuries and site severity injury rates • Safety performance ranking againstbest-in-class peer group • Greenhouse gas (GHG) emissions • Reportable environmental incidents • Water usage per product tonne | | Items that could result in harm to our people or the environment. Risks considered include events that have both direct financial impacts and indirect consequences, including damage to our reputation. |
| | |
| PotashCorp 2014 Annual Integrated Report | | 17 |

Business Strategies
| | |
We believe strong financial performance is the cornerstone of PotashCorp’s value creation. It rewards our shareholders while allowing us to fulfill our broader social and environmental responsibilities. It begins by using our capital strategically, allocating it towards the opportunities that we believe generate the greatest return for our shareholders. Our objective is to achieve earnings and cash flow growth while minimizing volatility. We believe the strategies we deploy enhance our cash flow, which can then be reinvested in our business or returned to our shareholders. When it comes to our nutrients, we target disciplined growth opportunities while building competitive positions with operations flexible enough to adapt to changing market conditions. | | 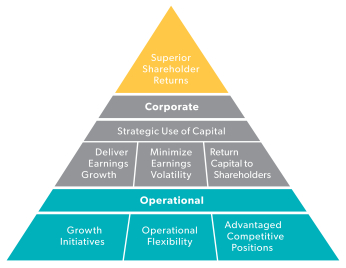
|
| |
| |
Corporate
| | | | | | | | |
Deliver Earnings Growth • Maximize long-term growth potential and value by prioritizing opportunities, particularly in potash. • Create sustainable competitive positions in each nutrient by optimizing cost structure and investing in high-return opportunities that exceed our weighted average cost of capital (WACC). | | | | Minimize Earnings Volatility • Manage potash capacity responsibly to maximize long-term profitability. • Enhance stability through diversified nitrogen and phosphate businesses. • Focus on maintaining an investment-grade debt rating to safeguard access to lower-cost credit in order to operate and grow our business. | | | | Return Capital to Shareholders • Focus on dividends as an important element of our capital allocation strategy. • Optimize our capital structure through strategic share repurchase programs. |
| | | | | | |
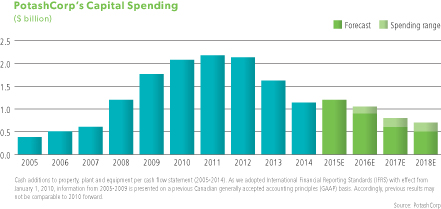
| | | | Investing in Potential (2005-2014) |
| | | | | | |
| | | | $13.6
billion | | Amount invested in opportunity and sustaining capital projects |
| | | | | | |
| | | | | | |
| | | | $11.1
billion | | Amount returned to shareholders through dividends and share repurchases |
| | | | | | |
| | | | | | |
| | |
| 18 | | PotashCorp 2014 Annual Integrated Report |
Company and Strategy
Operational
| | | | | | | | |
| | | | |
| | | | | | | | |
| | | | |
| Growth Initiatives | | | | Growth Initiatives | | | | Growth Initiatives |
| | | | |
• Improve ability to respond to future growth in demand by completing brownfield projects. • Enhance transportation and distribution capabilities to new and existing markets. | | | | • Enhance production facilities by pursuing quick-payback, cost-advantaged US brownfield projects. | | | | • Develop partnerships and invest in quick-payback opportunities that leverage existing capacity. |
| | | | |
| Operational Flexibility | | | | Operational Flexibility | | | | Operational Flexibility |
| | | | |
• Match operational capability to anticipated market demand while maintaining ability to restart idled operations. | | | | • Optimize product mix, focusing on more stable, higher-margin industrial markets. | | | | • Target production toward less-volatile, higher-margin products. |
| | | | |
| Advantaged Competitive Positions | | | | Advantaged Competitive Positions | | | | Advantaged Competitive Positions |
| | | | |
• Mine reserves in a sustainable, cost-effective manner. • Protect low-cost position through operational and logistical efficiencies. • Improve safety and environmental performance. | | | | • Improve cost position by enhancing reliability and efficiencies. • Improve safety and environmental performance with a specific focus on reducing GHG emissions. | | | | • Mine reserves in a sustainable, cost-effective manner. • Optimize portfolio and pursue operational reliability and efficiencies. • Improve safety and environmental performance, focusing specifically on land and water use. |
| | | | | | | | | | | | | | |
| | | | | | | | | | | | | | | |
17.2 MMT | | Anticipated operational capability* available upon completion of projects | | | | $225 million | | Estimated 2014 incremental* gross margin from expansions | | | | 77% per ton | | PotashCorp’s margin premium in 2014 from non-fertilizer products* |
| | | | | | | | | | | | | | | |
* Post-expansion; assumes fully staffed and ramped-up operations | | | | * Contributions based on 2014 per-tonne margins for incremental production for Aurora and gross margin charge for Geismar which also includes the benefit of displaced purchased ammonia. | | | | * Based on 2010-2014 gross margin per short ton of P2O5 |
| | |
| PotashCorp 2014 Annual Integrated Report | | 19 |
Risk and Governance
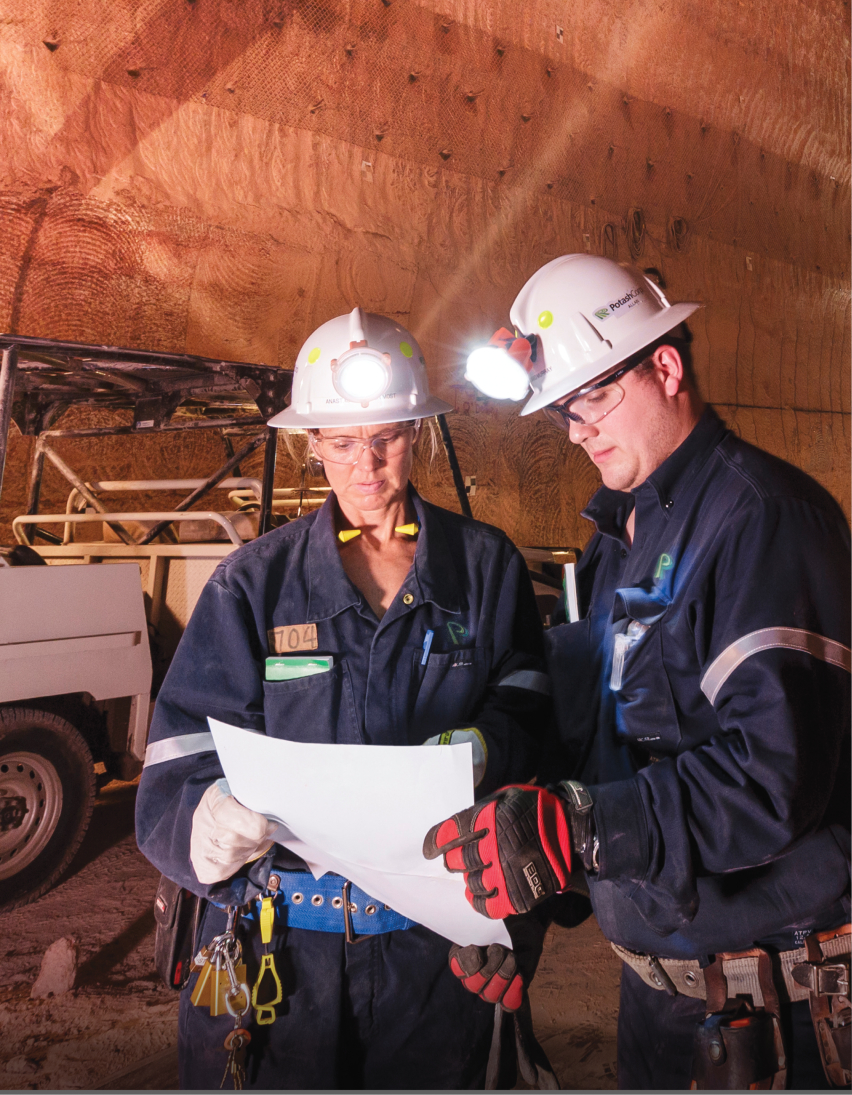
Chief Mine Geologist Anastasia Vander Most and Mine Engineer David Murray underground at our Allan, Saskatchewan potash mine.
Risk and Governance
| | | | |
How We Approach Risk Successful execution of our corporate strategies and achievement of our business goals require that we regularly address the uncertainties in our global business environment. | | 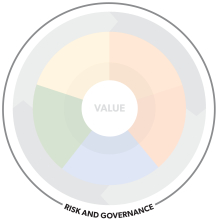 | | |
Overview of Our Approach
Our business is subject to constant and significant change that requires us to regularly assess our corporate strategies. At PotashCorp, risk management is an integrated discipline that supports informed decision-making throughout the company. We recognize the pivotal role it plays in balancing strategic planning with business execution and compliance. This facilitates informed decision-making and a conscious evaluation of the upside opportunity and downside aspect of risk.
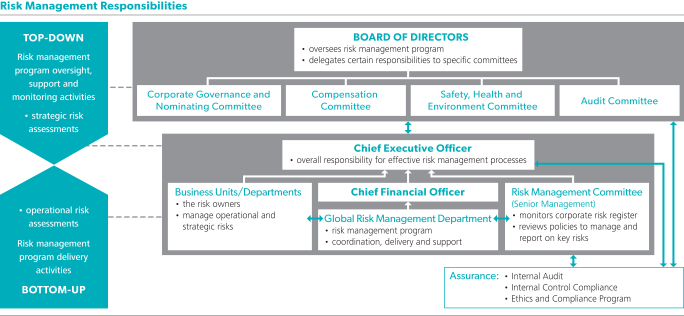
Our integrated approach to managing risk recognizes the need for clear, timely direction and support from the Board of Directors, senior management and our business unit management(top-down activities). Risk management is embedded into day-to-day decision-making and operational activities (bottom-up activities).
Our starting point for managing risk is our strategic planning process, from which relevant external and internalthreats and opportunities are derived and key risks are identified. Risks and opportunities are identified by observing, analyzing and anticipating trends along with macroeconomic, industry-specific, regional and local developments.
Senior management assesses the risks to achieving our strategic objectives, and incorporates measures into corporate and operating plans to mitigate these risks if they exceed our appetite and tolerance. We intentionally accept certain risks we believe are manageable and appropriate in relation to expected opportunities. These risks and opportunities are regularly monitored for changes, and further action taken, if necessary.
| | |
| PotashCorp 2014 Annual Integrated Report | | 21 |
Program Priorities
Global risk management priorities are to:
| • | | Promote and develop a risk-aware culture within the company. Staging risk workshops with focus groups of employees makes management aware of the risk-based activities that are part of employees’ daily responsibilities. |
| • | | Ensure there is adequate education and training for the development of risk awareness by all business units. |
| • | | Improve internal processes and mechanisms for risk management. Ensure the risk roles within each business unit are clearly established. Risk registers that align with the corporate risk register and identify responsibilities are being developed within business units. |
| • | | Coordinate comprehensive regular reporting on risk to the company’s stakeholders. All such external reporting is reviewed and approved by the risk management committee at regularly convened meetings. |
Risk Profile and Key Risks
PotashCorp uses a risk management ranking methodology to assess the key risks specific to our company. Risks with A or B residual ranking, or those for which we identify elevated changes within C, D or E residual ranking with long- or medium-term implications that could cause a deviation from the desired strategic results of our Value Model, are monitored closely and viewed as key risks. The external factors that affect our business environment are constantly changing and, as a result, our business strategy setting is a dynamic process. In addition, there are key overriding internal factors which
drive our operating strategies. We place a high priority on preserving and maintaining our reputation. Further, sustaining and growing our business greatly depend on our employees. Therefore, we place significant emphasis on attracting, retaining, developing and engaging our PotashCorp team members. Potential damage to our reputation and inability to deliver on our talent needs are important consequences we consider in our mitigation responses to our key business and strategic risks listed on Pages 23 to 25.
 Page 18 –Risk Factors
| | | | | | | | | | | | | | | | |
Our key risks, in terms of severity of consequence and likelihood, are displayed as follows: |
Risk Ranking Matrix | | Severity of Consequence | | | | AExtreme: Initiate mitigation activities immediately to reduce risk. If such activities cannot sufficiently reduce risk level, consider discontinuation of the applicable business operation to avoid the risk. B Major: Initiate mitigation activities at next available opportunity to reduce risk. If such activities cannot sufficiently reduce risk level, Board of Directors approval is required to confirm acceptance of this level of risk. C Medium: Level of risk is acceptable within tolerances of the risk management policy. Additional risk mitigation activities may be considered if benefits significantly exceed cost. DLow: Monitor risk according to risk management policy requirements, but no additional activities required. E Negligible: Consider discontinuing any related mitigation activities so resources can be directed tohigher-value activities, provided such discontinuance does not adversely affect any other risk areas. |
| | Negligible | | Low | | Medium | | Major | | Extreme | | |
Likelihood | | Probable | | C | | B | | B | | A | | A | | |
| | High | | D
| | C 
| | B | | B 
| | A | | |
| | Medium | | D | | D | | C 
| | B 
| | B | | |
| | Low | | E | | D | | D | | C 
| | B | | |
| | Remote | | E
| | E
| | D
| | D | | C | | |
| | | | | | | | | | | | | | | | | | |
| B | | | | C |
| | | Global potash demand | | | | | | Potash operating capability | | | | | | Product transportation mishaps | | | | Trinidad natural gas supply |
| | | Competitive potash supply | | | | | | Safety, health, environmental and security | | | | | | Sustaining growth opportunities | | | | Cyber security |
| | | Offshore potash sales and distribution | | | | | | | | | Transportation and
| | | | |
| | | | | | | International operations | | | | | | distribution infrastructure | | | | |
| | |
| 22 | | PotashCorp 2014 Annual Integrated Report |
Risk and Governance
| | | | | | | | | | |
 No change to risk No change to risk  Increased risk Increased risk  Decreased risk Decreased risk  Risk has materialized in part Risk has materialized in part |
| Risk | | Risk
Level | | Description and Context | | Status | | Risk Management Approach | | Link to Business Strategies  Pages 18-19 Pages 18-19
|
| Global potash demand | | B | | Our capital investment in major potash expansion and debottlenecking projects is expected to be completed by the end of 2015, with ramp-up planned in 2015 and 2016. If our estimates of future potash demand prove to be overstated due to variable market, governmental, seasonal, economic or other conditions, our return on this investment and our ability to meet our growth expectations in a timely manner may be lower than anticipated. | | 

| | We engage in market development, education, training and government relations initiatives. We also strive to make necessary operational changes to maintain optimal operating flexibility and maximize long-term profitability. | |  |
| Competitive potash supply | | B | | Investment in new competitive potash capacity (in response to market conditions or otherwise) may result in product supply that outpaces growth in consumption. Potash prices could be depressed for a prolonged period, negatively affecting our financial performance and reputation. | |
| | We produce potash to meet market demand, strive to be a low-cost producer (on a delivered basis) in the key markets we serve, develop and leverage logistic advantages, maintain operational flexibility and offer a diversified product line. | | |
Offshore
potash sales and distribution | | B | | We rely heavily on Canpotex, our offshore marketing, transportation and distribution company, to deliver our Saskatchewan product to customers around the world. If Canpotex were to dissolve, or its ability to operate became impaired – due to unexpected changes in laws or regulations, market or economic conditions, our (or our venture partners’) businesses, or otherwise – a trusted potash brand would be lost and our access to key offshore markets could be impacted. This could result in a less efficient logistics system and might lead to decreased market share, higher costs and/or lower net earnings from offshore sales. We increased the ranking of this risk since 2013 as the strategic importance of being a low-cost producer on a delivered basis to key markets continues to rise. | |  | | We engage directly with international customers to foster relationships with them, develop internal capacity to market and distribute products offshore and preserve access to Canpotex distribution facilities. | | |
| Potash operating capability | | C | | Unexpected surges in potash demand can negatively impact our ability to operationally respond in a timely manner, adversely affecting our financial performance and reputation. We increased the ranking of this risk since 2013. While global potash production rose sharply during 2014, it did not keep pace with the increase in demand. Logistical issues, planned downtime and unplanned outages affected global supply capability, including PotashCorp’s. | |
| | We have developed an integrated, robust distribution and storage system and a flexible potash operating strategy to meet a variety of demand scenarios. | |  |
| | |
| PotashCorp 2014 Annual Integrated Report | | 23 |
| | | | | | | | | | |
| No change to risk Increased risk Decreased risk Risk has materialized in part |
| Risk | | Risk
Level | | Description and Context | | Status | | Risk Management Approach | | Link to Business Strategies Pages 18-19 |
| Safety, health, environmental and security | | C | | Our operations are subject to various safety, health, environmental and security laws and regulations, and we engage in mining and industrial activities that can result in serious accidents causing injuries or fatalities to our people or impact to the environment. Failure to adhere to these laws and regulations or failure to prevent or respond to a major safety, environmental or security incident could adversely impact our employees, operations, financial performance and reputation. | |
| | Safety of our people and the environment are fundamental values to us. Structured incident prevention and response systems are in place to protect our employees, and leading indicators help us proactively monitor effectiveness. Environmental monitoring and control systems exist to limit the impact to the natural environment. Crisis communication protocols and emergency response programs and personnel are in place. We have also formed partnerships for mutual aid with local area community emergency response organizations. | |  |
| International operations | | C | | We operate and invest in countries outside of Canada and the US. Differences in political and economic conditions, culture and laws may result in higher business risk in these jurisdictions, potentially impacting earnings growth and volatility. | |
| | We are guided by a strong set of Core Values and supporting internal policies. We have government relations programs and engage in a positive and supportive way with governmental and non-governmental organizations wherever we operate. | |  |
| Product transportation mishaps | | C | | A mishap occurring during transport could have serious impact on people, property and/or the environment. | | | | We maintain relations with reputable carriers and employ effective risk transfer through contract terms and insurance coverage. | | |
| Sustaining growth opportunities | | C | | Our opportunities to strategically reinvest available capital may be limited for geopolitical, market or other reasons, negatively affecting our growth. | | | | We regularly evaluate all strategic opportunities, including investments in diversified and downstream areas, to ensure our capital generates returns that exceed our cost of capital on a risk-adjusted basis. | |  |
Transportation and
distribution infrastructure | | C | | Reliability of supply is an important factor in sales of product to our customers worldwide. Our (or the third parties upon which we rely) inability to provide cost-effective, timely and secure transportation and storage of product – due to labor disputes, adverse operating, economic or weather conditions, system failures, accidents or delays, demand swings for our or others’ products, or otherwise – could result in customer dissatisfaction and inhibit earnings and market share growth. | |
| | We have established a strategic storage and distribution network, backed by a comprehensive and reliable transportation fleet, to support our customers. | | |
| | |
| 24 | | PotashCorp 2014 Annual Integrated Report |
Risk and Governance
| | | | | | | | | | |
| No change to risk Increased risk Decreased risk Risk has materialized in part |
| Risk | | Risk
Level | | Description and Context | | Status | | Risk Management Approach | | Link to Business Strategies Pages 18-19 |
Trinidad
natural gas supply | | C | | Natural gas is a key raw material for the manufacture of our nitrogen products. We have experienced significant natural gas curtailments at our Trinidad facility over the last several years due to decreased industry investment in exploration and development activity and major supplier maintenance activities. While recent changes in government policy in Trinidad are intended to lead to an increase in natural gas exploration and development activity, we continue to expect curtailments of natural gas supply. Prolonged interruption of our natural gas supply could result in loss of nitrogen production, adversely affecting our financial performance and reputation. | |
| | Operational flexibility is maintained at our other plants, and we are working actively with the Government of Trinidad & Tobago to address reliability issues and security of long-term natural gas supply. | | |
| Cyber security | | C | | Our business processes rely on IT systems, including internal and external communications, ordering and managing shipments of materials for our operations, coordinating transportation of our products and reporting our results. Targeted attacks on our systems (or third parties that we rely on), failure of a key IT system or a breach in security measures designed to protect our IT systems could result in financial or reputational loss. | |
| | We have implemented – and test – system controls, disaster recovery and business continuity arrangements for critical IT systems and activities. As the threat landscape is ever-changing, our primary focuses include: risk-prioritized controls to protect against known and emerging threats and comply with standards and regulations; situational risk and threat awareness across our company to detect incidents and anomalies; and, the ability to handle critical incidents, quickly return to normal operations, and repair damage to the business and our brand. | | |
| | |
| PotashCorp 2014 Annual Integrated Report | | 25 |
Governance and Remuneration
Good governance begins at the top. Our Board provides guidance and oversight to ensure the company has the right strategies and risk processes to create sustainable value for all stakeholders. The Board continually monitors performance to make sure the necessary steps are taken to protect and enhance our assets and that our compensation plans appropriately motivate employees to achieve the company’s goals.
Building Blocks of Good Governance
Board Composition
PotashCorp believes having a diverse group of individuals with the relevant skills and experience is necessary to strategically nourish the company’s future. Our Board is comprised of members with wide-ranging skill sets, varying tenure and diversity. As a result of the expected retirements of two directors, including the Board Chair, the Board is actively undergoing a director identification process in an effort to identify the highest-quality Board candidates. The Board also has in place a process for the identification and appointment of a new Board Chair.
Board Skills
Each Board member brings different perspectives with complementary skill sets, which help them better identify areas of potential stakeholder value creation or diminution.
Board Tenure
We believe the Board demonstrates a good balance of continuity of company knowledge and fresh perspectives from newer members. A subcommittee of the Board has been tasked with review of term limits, tenure and retirement age.
Diversity and Independence
PotashCorp meets all independence requirements and has formal processes for director succession and recruitment that expressly encourage the promotion of diversity. Under the Board’s oversight, the company is developing a diversity policy.
| | |
| | | |
| 27% | | Percentage of women represented on PotashCorp’s Board 1 |
| | | |
| | |
| | | |
| 82% | | Percentage of PotashCorp Board 1 who are independent directors |
| | | |
1 – As nominees at our upcoming annual general meeting
| | |
| |

| | Pages 9-14 – Board profiles |
| | Page 30 – Board skills matrix |
| | |
| | Page 17 – Director independence |
| | Page 18 – Board Interlocks |
| | Page 31 – Diversity |
| | |
| | |
| 26 | | PotashCorp 2014 Annual Integrated Report |
Risk and Governance
| | | | |
| | | | |
Oversight
To enhance value, the company’s goals and strategies need to take into consideration the objectives of our key stakeholders. Of utmost importance is the Board’s oversight of the company’s strategy and risk management approaches. This is achieved by actively engaging with management and challenging their assumptions, monitoring stakeholder feedback and independently assessing strategic execution. The Board dedicated two offsite meetings in 2014 to integrated discussions of risk and strategy.
The Board also dedicated significant resources in 2013 and 2014 to the succession planning process for the company’s President and Chief Executive Officer. An ad hoc succession planning committee comprised of the Board Chair and each committee chair held 23 meetings and identified and met with potential candidates. Throughout the process, the succession planning committee provided regular updates to, and received input from, the Board. Jochen Tilk took over from Bill Doyle effective July 1, 2014.
| | |
| | | |
34 | | Number of Board and committee meetings held by directors in 2014 |
| | | |
| | | | |
| | Page 25 – | | Letter from and report of the audit committee |
| | Page 29 – | | Letter from and report of the corporate governance and nominating committee |
| | Page 34 – | | Letter from and report of the safety, health and environment committee |
| | Page 36 – | | Letter from and report of the compensation committee |
Stakeholder Engagement
The Board encourages stakeholders to engage with appropriate company representatives on relevant matters and actively monitors stakeholder feedback. Under its oversight, the company has an active stakeholder outreach program.
| | | | |
| | Page 32 – | | How to engage with the Board |
| | | | |
| |

| | potashcorp.com/stakeholderengagement |
Board Evaluation
Good governance includes a regular evaluation of processes and results to ensure value creation is occurring at the company. Our Board adopted a six-part effectiveness evaluation for review of the Board, committees and directors.
Page 19 – Board, committee and director assessment
Board Continuing Education
Board education is important to ensure directors have the latest information to help minimize risks and maximize opportunities. Through its new director orientation procedures, new directors are provided a baseline of knowledge about the company. On an ongoing basis, an appropriate mix of internal and external educational opportunities is provided.
Page 32 – Director education activities
PotashCorp’s 2013 AIR and Related Reporting
| | | | | | | | | | | | |
Ranked #5 in the world | | | | Ranked Top10 for governance | | | | AWARD OF EXCELLENCE Overall in 2014 | | | | MINING WINNER since 2003 |
| First in North America by reportwatch.net | | | | Globe and Mail Board Games since 2006 | | | | at the Chartered Professional Accountants of Canada Corporate Reporting Awards |
| | |
| PotashCorp 2014 Annual Integrated Report | | 27 |
Remuneration
Director Remuneration
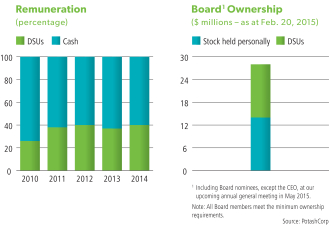
Directors are compensated for their significant contributions and commitment to the company. To ensure their interests are aligned with those of shareholders, a director must, within five years of starting on the Board, own shares and/or deferred share units (DSUs) with a value equal to at least five times the annual retainer paid to directors.
In 2014, three directors elected to receive their Board retainer in cash, while nine members elected to receive deferred share units for all or a portion of the retainer.
| | |
| | Page 21 – Director compensation |
Employee Remuneration
Our compensation program is designed to be competitive with our peers to attract, retain, develop and engage employees able to establish and execute value-building strategies. Just as our corporate goals have different time horizons, so do the components of our compensation program. We believe the design, structure and implementation of our executive compensation program should not encourage executives to take unnecessary or inappropriate risks or engage in other improper behavior.
Page 36 – Letter from and report of the compensation committee
In addition, PotashCorp’s compensation plans are designed to:
| • | | Motivate actions to align with the long-term interests of our shareholders and other stakeholders; |
| • | | Create an ‘ownership mentality’ in our management team; |
| • | | Provide an appropriate level of value sharing between our shareholders and executives; and |
| • | | Incent and reward performance in line with our corporate goals and shareholder experience. |
Key Employee Remuneration Components
| | | | | | | | |
| Category | | Component | | 2014 Impact | | Design | | |
| Base Salaries | | Salary and wages (5,136 people) | | $472 million expense | | • The only fixed component of total direct compensation. • Typically set annually and at the median of comparative compensation information. | | Page 48 |
| At-Risk Compensation | | Short-Term Incentive Plan (STIP) (5,028 people) | | $48 million expense | | • Annual cash bonus – one-year performance period with payout based on achieving a Board-established cash flow return (CFR) metric and achievement of certain safety, environmental, sales and operational targets. | | Page 48 |
| | Medium-Term Incentive Plan (MTIP) (77 people) | | $(1) million expense | | • Three-year performance period (MTIP began on January 1, 2012 and ended on December 31, 2014). • One-half of payout was based on corporate total shareholder returns (TSR) and the other half on TSR relative to the DAXglobal Agribusiness Index (DXAG). There were no payouts under the plan. • Our incentive compensation programs are under review and instead of starting a new MTIP program during the review, the company granted eligible employees additional performance options under the 2014 POP. | | Page 49 |
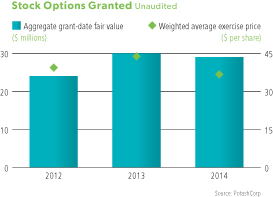
| | Performance Option Plan (POP) (291 people) | | $27 million expense | | • Option vesting is based on the amount by which our cash flow return on investment exceeds the weighted average cost of capital over a three-year performance period. Value of options is based on share price appreciation, if any. • The POP is submitted to shareholders every year. | | Page 50 |
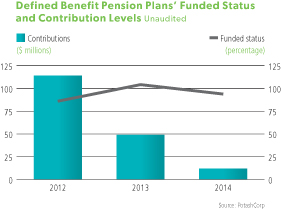
Retirement Plans | | Retirement benefits | | $1,806 million obligation | | • Employees are eligible to participate in either defined benefit or defined contribution pension plans, some of which include a savings feature, a performance contribution feature or stock purchase plan. Supplemental plans are designed to deliver average benefits based on comparative compensation information. | | Page 47 |
| | | | | | |
| | | |
| | Page 60 – Summary named executive officer compensation table | | Pages 44-45 – Compensation consultant and comparative compensation information | | |
| | Pages 43-57 – Compensation discussion and analysis | | Page 52 – Chief Executive Officer compensation | | |
| | |
| 28 | | PotashCorp 2014 Annual Integrated Report |
Risk and Governance
Key Employee Remuneration Results
How Financial Performance Metrics Are Considered

How Non-Financial Performance Metrics Are Considered

| | |
| Be the supplier of choice to the markets we serve | | Our STIP considers Board-approved annual goals for sales and productivity. The only way to achieve target or higher STIP payments is to meet those goals, which requires meeting the needs of customers throughout the year. |
| Build strong relationships with and improve the socioeconomic well-being of our communities | | We actively encourage all employees to participate in philanthropic programs in our communities and offer significant gift-matching opportunities. To encourage investments in our communities, it is important to sustain earnings and provide opportunities for meaningful compensation on a consistent basis. |
| Attract, retain, develop and engage employees to achieve our long-term goals | | Target compensation is competitive within our industry and employees are motivated to achieve strong results through opportunities to earn above-target compensation for above-target company and individual performance and are provided opportunities for growth and promotion. Employees are provided opportunities for growth and promotion through professional development and/or experience in other areas of the company. |
| Achieve no harm to people and no damage to the environment | | At plant locations, one-half of the annual STIP payout depends on performance in relation to local metrics, a significant portion of which relates to safety and environmental performance. At corporate offices, 5 percent of the annual STIP payout depends on PotashCorp’s overall safety performance. |
| | |
|
| |
| | Pages 52-54 – Chief Executive Officer compensation |
| | |
| PotashCorp 2014 Annual Integrated Report | | 29 |

Our Performance
Volunteers Nirvaan Soogrim (a Chemical Engineer from our Trinidad operation) and Drayden Ollivier (son of Rocanville employees Chantelle and Trent Ollivier) help to reinforce the mud walls of a home in a Free The Children community in India.
Performance
| | | | | | | | | | | | | | | | | | | | | | | | | | |
| Metric | | Target* | | | Historical Performance | | | 
|
| | | | | | 2014 | | | 2013 | | | 2012 | | | 2011 | | | 2010 | | | |
Financial Health | | | | | | | | | | | | | | | | | | | | | | | | | | |
Total shareholder return (TSR) | | | 
| | | | 11.6% | | | | (16.4)% | | | | (0.2)% | | | | (19.7)% | | | | 43.2% | | | Page 36
|
Cash flow return (CFR)1 | | | | | | | 13.0% | | | | 15.0% | | | | 19.2% | | | | 25.7% | | | | 18.8% | | |
Potash nameplate capacity | | | 
| | | | | | | | 
| | | | n/a | | | | n/a | | | | n/a | | |
Potash per-tonne cash cost savings | | | | | | | | | | | n/a | | | | n/a | | | | n/a | | | | n/a | | |
Supplier of Choice |
Customer survey score | | | | | | | 89% | | | | 90% | | | | 92% | | | | 90% | | | | 90% | | | Page 37 |
Net rail cycle time improvement (compared to 2011) | | | | | | | (19)% | | | | 5% | | | | 9% | | | | n/a | | | | n/a | | |
Community Engagement |
Community investment | | | | | | | $26M | | | | $31M | | | | $28M | | | | $21M | | | | $17M | | | Page 38 |
Community survey score (out of 5) | | | | | | | 4.4 | | | | 4.2 | | | | 4.5 | | | | 4.4 | | | | 4.2 | | |
Employee matching gift participation change | | | | | | | (7)% | | | | (1)% | | | | 11% | | | | 12% | | | | 9% | | |
Engaged Employees |
Employee engagement score | | | | | | | 67% | | | | n/a | | | | 79% | | | | 73% | | | | 73% | | | Page 39
|
Percentage of senior staff positions filled internally | | | | | | | 78% | | | | 79% | | | | 80% | | | | 92% | | | | 94% | | |
Average external acceptance rate | | | | | | | 95% | | | | 92% | | | | 93% | | | | 93% | | | | 86% | | |
No Harm to People or Environment |
Life-altering injuries at our sites | | | | | | | 1 | | | | 0 | | | | 1 | | | | 1 | | | | 0 | | | Page 40 |
Total site recordable injury rate | | | | | | | 1.01 | | | | 1.06 | | | | 1.29 | | | | 1.42 | | | | 1.29 | | |
Become one of the safest resource companies | | | | | | | | | | | n/a | | | | n/a | | | | n/a | | | | n/a | | |
Greenhouse gas emissions (CO2 equivalent per tonne of nitrogen product) | | | | | | | 2.3MT | | | | 2.4MT | | | | 2.3MT | | | | 2.6MT | | | | 2.6MT | | | Page 41 |
Environmental incidents | | | | | | | 24 | | | | 17 | | | | 19 | | | | 14 | | | | 20 | | |
Water consumption per tonne of phosphate product | | | | | | | 26m3 | | | | 26m3 | | | | 33m3 | | | | 33m3 | | | | 29m3 | | |
| * | Relative to 2014 stated target |
| n/a | = not a stated target in noted year |
| 1 | See reconciliation and description of certain non-IFRS measures on Page 82. |
| | |
| PotashCorp 2014 Annual Integrated Report | | 31 |
Year in Review
Factors Affecting Our 2014 Performance
 Record Global Shipments
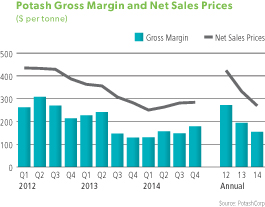
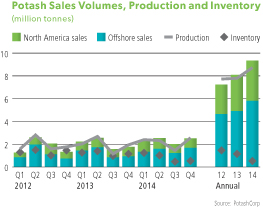
Potash markets rebounded in 2014 after an especially volatile demand and pricing environment in the second half of 2013. Stronger and more consistent buying activity re-emerged early in the year as pricing stabilized and dealers looked to replenish low inventories. Demand in all key markets strengthened and raised global shipments for the year to an all-time record of more than 61 million tonnes.
The strength in demand was most apparent in granular potash markets such as Brazil and North America as farmers worked to address nutrient requirements and capitalize on supportive crop economics. Significant product needs – in addition to logistical constraints in North America early in the year – further tightened granular fundamentals and kept dealers focused on supply availability. China and India remained engaged throughout the year as buyers worked to meet growing consumption needs, particularly for compound fertilizers, and procured tonnage under contracts signed in early 2014. In the Other Asia region, agronomic need and supportive grower economics resulted in robust demand.
This environment tested supply and logistical capacity. Even as most producers reportedly operated at, or above, historical levels, shipments outpaced global production and resulted in a substantial inventory drawdown at the producer level.
Given improved market fundamentals, potash prices stabilized early in the year and rose modestly from those levels. Increases were most evident in granular markets, although prices in standard grade spot markets improved on tighter supply/demand conditions through the second half of 2014.
 Supply Challenges Remain a Factor
Ammonia market fundamentals were supportive throughout most of 2014, given supply interruptions in key exporting regions due to
geopolitical events and natural gas availability. Prices remained elevated for much of the year before declining late in the fourth quarter as supply challenges began to abate and demand seasonally weakened – including in regions of the US where early winter conditions limited fall applications.
In urea, record Chinese exports and increased production in the Middle East weighed on market fundamentals. This environment resulted in lower global prices although strong demand in the US and supply constraints early in 2014 kept North American prices above those in international markets.
Access to lower-cost natural gas continued to provide US producers with a delivered-cost advantage relative to offshore importers, leading to robust margins. During 2014, this environment resulted in increased production from US producers – and fewer ammonia imports – in addition to continued advancement of and interest in North American plant expansions and greenfield projects.
 Strong Demand Outside of India
Strong agronomic needs and supportive grower economics pushed phosphate demand in Latin America to a record level and increased shipments to other significant markets such as North America and Southeast Asia. This strength helped support market fundamentals despite subdued purchasing activity from India – the world’s largest importer of phosphate products – given a delayed monsoon and weak importer margins.
Supply dynamics were largely influenced by increased shipments of solid fertilizer products from China, Morocco and Saudi Arabia. Exports from Russia and the US declined due largely to mining challenges and capacity curtailments as a result of higher input costs for sulfur and ammonia.
Although prices lifted in most markets through the first half, they remained seasonally volatile throughout the year, responding to periods of peak and off-season demand.
Market Change (2014 vs 2013)
| | | | | | |
| | | | |
| Nutrient1 | | Global Demand | | Global Production | | Average Price2 |

| | +16% | | +13% | | -22% |

| | +2% | | +2% | | +0% |

| | +3% | | +3% | | +2% |
| 1 | Data represent: KCl – potash (K); NH3 – nitrogen (N); P2O5 – phosphate (P) |
| 2 | Reference pricing based on: K – Vancouver MOP; N – Tampa Ammonia; P – Central Florida DAP |
| Source: | Company reports, CRU, Fertecon, PotashCorp |
| | |
| 32 | | PotashCorp 2014 Annual Integrated Report |
Performance
Earnings per Share
We report our results (including gross margin) in three business segments: potash, nitrogen and phosphate. Our reporting structure reflects how we manage our business and how we classify our operations for planning and measuring performance. We include net sales in our segment disclosures in the consolidated financial statements in accordance with International Financial Reporting Standards, as issued by the International Accounting Standards Board (IFRS), which require segmentation based upon our internal organization and reporting of revenue and profit measures. As a component of gross margin, net sales (and the related per-tonne amounts) are the primary revenue measures we use and review in making decisions about operating matters on a business segment basis. These decisions include assessments about potash, nitrogen and phosphate performance and the resources to be allocated to these segments. We also use net sales (and the related per-tonne amounts) for business planning and monthly forecasting. Net sales are calculated as sales revenues less freight, transportation and distribution expenses. Realized prices refer to net sales prices. The direction of the arrows in the tables below refers to effect on earnings per share.
 Note 3for our operating segments
| | | | | | | | |
| 2014 Earnings Compared to Guidance | | | | | Effect on EPS | |
Initial midpoint estimate for 2014 EPS1 | | | | | | $ | 1.60 | |
Potash offshore realized prices | | | | | | | 0.09 | |
Potash North America realized prices | | | | | | | 0.07 | |
Potash offshore sales volumes | | | | | | | 0.07 | |
Potash North America sales volumes | | | | | | | 0.07 | |
Potash costs due to foreign exchange | | | | | | | 0.03 | |
Provincial mining taxes | | | | | | | (0.06) | |
Other potash costs | | | | | | | (0.03) | |
Subtotal potash | | p | | | | | 0.24 | |
Nitrogen realized prices | | | | | | | 0.26 | |
Manufactured nitrogen sales volumes | | | | | | | (0.02) | |
Natural gas costs | | | | | | | (0.12) | |
Other nitrogen costs | | | | | | | 0.02 | |
Subtotal nitrogen | | p | | | | | 0.14 | |
Phosphate realized prices | | | | | | | 0.16 | |
Phosphate sales volumes | | | | | | | (0.05) | |
Sulfur input costs | | | | | | | (0.03) | |
Ammonia input costs | | | | | | | (0.02) | |
Rock costs | | | | | | | (0.06) | |
Asset retirement obligation costs | | | | | | | (0.03) | |
Other phosphate costs | | | | | | | (0.08) | |
Subtotal phosphate | | q | | | | | (0.11) | |
Dividend income | | | | | | | 0.03 | |
Impairment of available-for-sale investment in 2014 | | | | | | | (0.05) | |
Other income (expenses) | | | | | | | 0.03 | |
Finance costs | | | | | | | (0.01) | |
Subtotal other | | | | | | | – | |
Subtotal of the above | | | | | | | 0.27 | |
Income tax rate on ordinary income | | | | | | | (0.03) | |
Discrete items impacting income taxes | | | | | | | (0.02) | |
Total variance from 2014 EPS guidance | | p | | | | | 0.22 | |
EPS for 2014 | | | | | | $ | 1.82 | |
| 1 | Based on outlook and assumptions described in our 2013 Annual Integrated Report |
| | | | | | | | |
| 2014 Earnings Compared to 2013 | | | | | Effect on EPS | |
EPS for 2013 | | | | | | $ | 2.04 | |
Potash offshore realized prices | | | | | | | (0.34) | |
Potash North America realized prices | | | | | | | (0.16) | |
Potash offshore sales volumes | | | | | | | 0.16 | |
Potash North America sales volumes | | | | | | | 0.09 | |
Severance-related workforce reduction costs | | | | | | | 0.03 | |
Potash costs due to foreign exchange | | | | | | | 0.05 | |
Provincial mining taxes | | | | | | | (0.05) | |
Other potash costs | | | | | | | 0.05 | |
Subtotal potash | | q | | | | | (0.17) | |
Nitrogen realized prices | | | | | | | (0.02) | |
Manufactured nitrogen sales volumes | | | | | | | 0.10 | |
Natural gas costs | | | | | | | (0.06) | |
Other nitrogen costs | | | | | | | 0.06 | |
Subtotal nitrogen | | p | | | | | 0.08 | |
Phosphate realized prices | | | | | | | 0.03 | |
Phosphate sales volumes | | | | | | | (0.05) | |
Accelerated depreciation | | | | | | | (0.03) | |
Asset retirement obligation costs | | | | | | | (0.03) | |
Other phosphate costs | | | | | | | (0.01) | |
Subtotal phosphate | | q | | | | | (0.09) | |
Share of earnings of equity-accounted investees | | | | | | | (0.08) | |
Dividend income | | | | | | | 0.02 | |
Impairment of available-for-sale investment in 2014 | | | | | | | (0.04) | |
Other income (expenses) | | | | | | | 0.04 | |
Finance costs | | | | | | | (0.03) | |
Subtotal other | | q | | | | | (0.09) | |
Subtotal of the above | | | | | | | (0.27) | |
Income tax rate on ordinary income | | | | | | | (0.05) | |
Discrete items impacting income taxes | | | | | | | 0.04 | |
Weighted average number of shares outstanding | | | | | | | 0.06 | |
Total variance from 2013 EPS | | q | | | | | (0.22) | |
EPS for 2014 | | | | | | $ | 1.82 | |
| | |
| PotashCorp 2014 Annual Integrated Report | | 33 |
Financial Outlook
Factors That Could Shape Our Performance in 2015
Market Fundamentals Expected to Remain Strong
Despite a strong US recovery, weakening growth in other regions continues to temper the global outlook. Amid this environment, currencies have generally fallen relative to the US dollar and commodities remain subdued. While we closely monitor these factors, we enter 2015 with a positive – albeit moderated – view for our business.
Global potash shipments are anticipated to remain at historically high levels in 2015, ranging between 58 million and 60 million tonnes. Following an especially robust year, we expect deliveries to decline modestly, given improved distributor inventory positions and slightly weaker crop economics.
Demand in market-driven regions like Latin America and North America may pull back with fewer planted acres, but positive consumption trends in China and India are expected to partially offset this decline. In other Asian countries, agronomic needs and supportive grower economics are likely to keep demand relatively flat with 2014 levels.
We expect global operational capability to be slightly higher in 2015, although lower producer inventories and potential supply constraints – most significantly, the impact of water inflow at one of Uralkali’s mines – are expected to keep operating rates at elevated levels. We believe producers with the ability to increase operational capability, most notably those in North America, are well positioned to capitalize on potential sales opportunities.
Healthy market fundamentals and an improved pricing environment are expected to result in stronger margins for producers than in 2014.
Potash Demand By Market
| | |
| | |
| Market | | 2015F (MMT) |
| |
China | | 12.5-13.0 |
| |
India | | 4.5-4.8 |
| |
Latin America | | 10.8-11.3 |
| |
North America | | 9.5-10.0 |
| |
Other Asia | | 8.3-8.7 |
| |
Other | | 12.5-13.0 |
| |
TOTAL | | 58-60 |
US Producers Anticipated to Remain Advantaged
A supportive agricultural and industrial backdrop is anticipated to lead to modest growth in global nitrogen consumption in 2015.
We believe ammonia markets will remain relatively robust, although the potential for fewer supply interruptions in key producing regions and lower natural gas prices could result in prices declining from 2014’s historically strong level.
In urea, we see fundamentals relatively in line with 2014. Global markets are expected to be largely influenced by Chinese exports and new supply availability, although the US market should be a region of relative strength due to its advantaged position relative to offshore imports.
We anticipate lower-cost natural gas supply will be supportive for US nitrogen producers, although margins could trail those of 2014.
Improved Indian Demand Expected
Following fertilizer subsidy changes and consecutive years of reduced imports, lower-than-normal inventories in India could incent stronger purchasing activity there and help improve global market fundamentals. Exports from China are expected to remain at elevated levels and we believe incremental growth in demand will be largely met by additional supply from Morocco and Saudi Arabia.
We anticipate a healthy spring season in North America with some phosphate demand deferred from the fall. Higher prices for fertilizer products to begin the year should support margins at levels slightly above those in 2014.
Industrial and feed markets are expected to remain strong, given the relative strength of the US economy and especially robust returns for livestock producers.
Market Change (2015 vs 2014)
| | |
| | |
| Nutrient | | Global Demand1 |
| |
| | -4% |
| |
| | +2% |
| |
| | +3% |
| 1 | Data represent: KCl – potash (K); NH3 – nitrogen (N); P2O5 – phosphate (P). Based on midpoint of PotashCorp’s estimates. |
| | |
| 34 | | PotashCorp 2014 Annual Integrated Report |
Performance
2015 Earnings per Share and Related Sensitivities
Estimate for 2015 EPS (as of January 29, 2015) was $1.90 to $2.20, based on outlook and assumptions as at that date described herein. 2014 actual results were $1.82. Expected primary causes of variance are presented in the following graph:
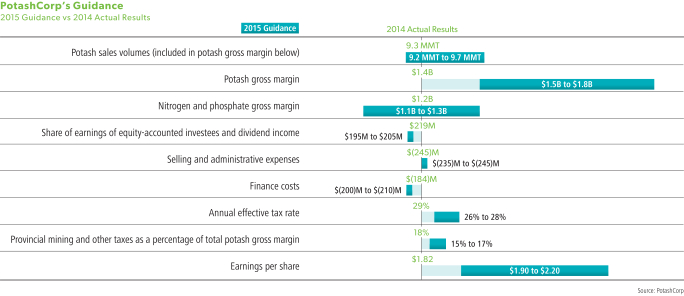
Key factors affecting earnings of the company’s three nutrient segments and the approximate anticipated effect on EPS, based on assumptions used in estimating 2015 earnings guidance, are as follows:
| | | | |
| Input Cost Sensitivities | | Effect
on EPS |
| NYMEX gas price increases by $1/MMBtu | | Nitrogen | | –0.06 |
| | Potash | | –0.01 |
| Sulfur changes by $20/long ton | | Phosphate | | ±0.03 |
| Canadian to US dollar strengthens by $0.02 | | Canadian operating expenses net of provincial taxes and translation gain/loss | | –0.01 |
| | | | | | |
| Price and Volume Sensitivities | | Effect
on EPS | |
| Price | | Potash changes by $20/tonne | | ± | 0.13 | |
| | DAP/MAP changes by $30/tonne | | ± | 0.02 | |
| | Ammonia changes by $30/tonne | | ± | 0.03 | |
| Volume | | Potash changes by 100,000 tonnes | | ± | 0.02 | |
| | Nitrogen changes by 50,000 N tonnes | | ± | 0.01 | |
| | Phosphate changes by 50,000 P2 O5 tonnes | | ± | 0.01 | |
| | |
| PotashCorp 2014 Annual Integrated Report | | 35 |
| | | | | | |
Goals and Targets 
| | | | 
| | |
| | |
Our Performance 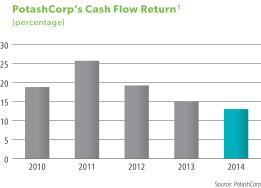
| | Our External Benchmark 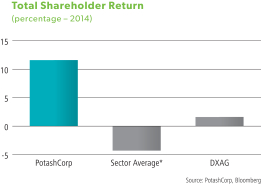
|
| | | | | | |
| Target | | Progress | | Discussion |
| Exceed total shareholder return (TSR) performance for our sector* and the DAXglobal Agribusiness Index (DXAG) | |
| | • PotashCorp’s TSR of 11.6 percent exceeded the sector’s return of -4.3 percent and the DXAG return of 1.6 percent. • Record global potash demand and an improving price environment – combined with robust nitrogen fundamentals – supported a more favorable earnings environment. Given our significant exposure to potash, an improved outlook in this nutrient resulted in our TSR outperforming our benchmarks. |
| Exceed cash flow return (CFR) on investment for our sector | |
| | • Driven primarily by strong cash flow generation, our 2014 CFR1 of 13 percent exceeded both our weighted average cost of capital of 9.2 percent and the CFR of the sector. |
| Increase potash nameplate capacity to 18 million tonnes by the beginning of 2015 | |
| | • With our two remaining projects at Rocanville and New Brunswick nearly complete, we expect to have nameplate capacity of approximately 19 million tonnes by the end of 2015. We are staffed to have 10.9 million tonnes of operational capability in 2015. |
| Achieve potash cash cost savings of$15-$20 per tonne in 2014 and $20-$30 per tonne by 2016 from 2013 levels | | 
| | • We reduced our total cash cost of goods sold by approximately $17 per tonne in 2014, excluding the impacts of foreign exchange and royalties. The primary drivers of this decrease were improved operational efficiencies following our workforce realignment and higher production levels. |
| * | Sector: Weighted average (based on market capitalization) for Agrium, CF Industries, ICL, Intrepid, K+S, Mosaic, SQM, Uralkali and Yara for most recent four fiscal quarters available. |
| 1 | See reconciliation and description of certain non-IFRS measures on Page 82. |
|
| 2015 Targets |
|
• Exceed total shareholder return (TSR) performance for our sector and the DXAG • Exceed cash flow return (CFR) for our sector • Achieve potash cash cost savings of $20-$30 per tonne from 2013 levels by 2016 |
|
|
| | |
| 36 | | PotashCorp 2014 Annual Integrated Report |
Performance
| | |
Our Performance 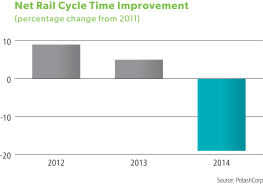
| | Our External Benchmark 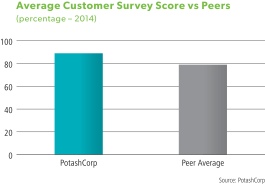
|
| | | | |
| Target | | Progress | | Discussion |
| Outperform competitor groups on quality, reliability and service as measured by customer surveys | |
| | • Outperformed our competitors in all quality, reliability and service categories in 2014. Our average customer survey score was 89 percent compared to our peer average of 79 percent. • Our sales team continued to rank higher than competitors based on its knowledge of products, customers and the industry. |
Reduce domestic rail cycle time through the Chicago corridor by 10 percent in 2014, compared to 2011 levels | | | | • The average domestic potash net rail cycle time through the Chicago corridor during 2014 increased by 19 percent compared to the benchmark 2011 level. Although each quarter during 2014 showed improvement over the prior quarter, the combination of severe winter weather and heavy shipment demands for our carriers during the full year caused our net rail cycle time to increase in comparison to previous years. We are working with our partners to identify bottlenecks and opportunities for additional efficiencies in logistics and distribution. Additionally, we continue to invest in our system, including our Hammond Regional Distribution Center and adding new high-efficiency railcars to our fleet. • In 2014, we worked closely with our customers to help mitigate product delays. Our interactions with customers – and our survey results – indicate that we continue to outperform our peers when it comes to reliability of supply. |
|
| 2015 Targets |
|
• Outperform competitor groups on quality, reliability and service as measured by customer surveys • Support development of existing and new markets with initiatives in education, sales and supply chain enhancements |
|
|
| | |
| PotashCorp 2014 Annual Integrated Report | | 37 |
| | |
Our Performance 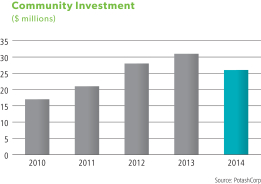
| | Our External Benchmark 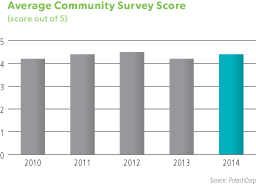
|
| | | | |
| Target | | Progress | | Discussion |
| Invest 1 percent of consolidated income before income taxes (on a five-year rolling average) in community initiatives | | | | • We invested $26 million in community initiatives, representing 1 percent of consolidated income before income taxes. • Our community investment program continued to evolve in 2014. We introduced an online grant program to make it easier for our potential partners to apply for funding. |
| Achieve 4 (performing well) out of 5 on community surveys | | | | • We achieved an average score of 4.4 out of 5 among surveyed communities. • The communities where we operate continue to positively acknowledge our safety performance and significant local investment. Ongoing communication remains an area for improvement, and in 2014 we increased our efforts through newsletters, community reports and other engagement activities. |
| Achieve an increase in employee participation in our matching gift program from 2013 levels | | | | • Participationrate decreased by 7 percent as approximately 48 percent of employees participated in the program (down from 55 percent in 2013). Total dollars matched increased by 9 percent. • We implemented an internal online system for company matching gifts to make it easier for our employees to give to the causes that matter most to them. |
|
| 2015 Targets |
|
• Invest 1 percent of consolidated income before income taxes (on a five-year rolling average) in community initiatives • Achieve 4 (performing well) out of 5 on community surveys • Achieve an increase in employee participation in our matching gift program from 2014 levels |
|
|
| | |
| 38 | | PotashCorp 2014 Annual Integrated Report |
Performance
| | |
Our Performance | | Our External Benchmark |
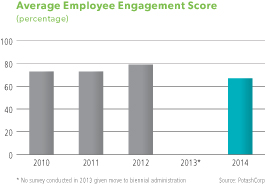
| | 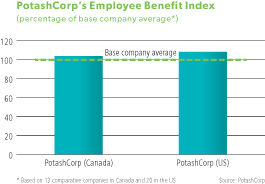 |
| | | | |
| Target | | Progress | | Discussion |
| Achieve an average employee engagement score of 75 percent on the company-wide biennial survey | | | | • We experienced a decline in our employee engagement survey with a company-wide score of 67 percent, compared to 79 percent in 2012. • As we analyze results, we are developing action plans with all our sites and corporate offices to improve in this area. |
| Fill 75 percent of senior staff openings with qualified internal candidates | | | | • Filled 78 percent of senior-level positions with qualified internal candidates, demonstrating that our development planning provides our employees with the skills, abilities and desire to move into leadership roles within PotashCorp. • We also recognize the value in bringing in candidates with new skills and experiences. As we assess our needs as a company, we have looked externally to fill certain vacancies, including that of CEO. |
| Achieve an acceptance rate of 90 percent on all external employment offers made | | | | • External offers accepted reached 95 percent of those extended. • A high acceptance rate demonstrates that we offer attractive job opportunities, in addition to competitive wages and benefits. |
|
| 2015 Targets |
|
• Achieve an average employee engagement score of 75 percent on the 2016 company-wide biennial survey • Fill 75 percent of senior staff openings with qualified internal candidates • Develop a diversity and inclusion policy which is appropriate for our business and the communities where we operate |
|
|
| | |
| PotashCorp 2014 Annual Integrated Report | | 39 |
| | |
Our Performance 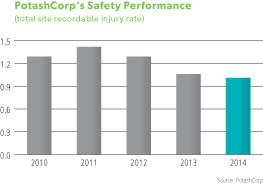
| | Our External Benchmark 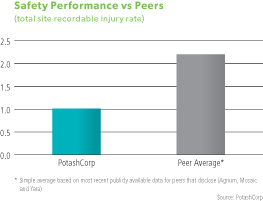
|
| | | | |
| Target | | Progress | | Discussion |
| Achieve zero life-altering injuries at our sites | |  | | • We experienced a fatality in 2014 at our Cory potash facility and, in early 2015 at our White Springs phosphate operation. In addition to our own thorough assessment of these accidents, we participate fully in all safety investigations and implement all recommendations as quickly and efficiently as possible. |
| Reduce total site recordable injury rate to 0.95 (per 200,000 hours worked) or lower | | | | • Our total site recordable injury rate was1.01in 2014. Although this result did not meet our target, it represents our best performance on record. • We are focused on improving leadership and engagement practices – including better use of leading safety indicators – to make the workplace safer for our employees and contractors. |
| By 2018, become one of the safest resource companies in the world by achieving a recordable injury rate in the lowest quartile of a best-in-class peer group* | |  | | • We continued working toward this company-wide objective in 2014. Specific targets and initiatives were put in place and all sites began to execute against identified areas of opportunity. • In 2014, we concentrated on executing the essential components of our five-year safety plan. In particular we focused on enhancing the quality of safety field interactions between front-line supervisors and workers to improve hazard identification and mitigation efforts. |
| * | Includes approximately 18 leading global resource companies |
|
| 2015 Targets |
|
• Achieve zero life-altering injuries at our sites • Reduce total site recordable injury rate to 0.95 (or lower) and total lost-time injury rate to 0.10 (or lower) • By 2018, become one of the safest resource companies in the world by achieving recordable injury and lost-time injury rates in the lowest quartile* of a best-in-class peer group |
|
|
| * | Current estimate of rates is 0.55 and 0.06, respectively. |
| | |
| 40 | | PotashCorp 2014 Annual Integrated Report |
Performance
| | |
Our Performance 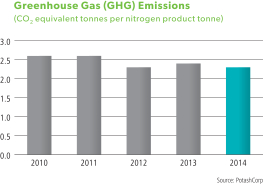
| | Our External Benchmark 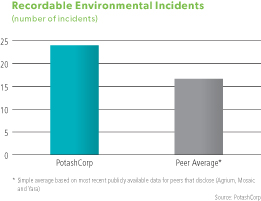
|
| | | | |
| Target | | Progress | | Discussion |
Reduce GHG emissions per tonne of nitrogen product by
4 percent from 2013 levels | | | | • We lowered GHG emissions by 4 percent in 2014. Efficiency improvements at our Geismar nitrogen facility were the major contributing factor in this reduction. • In 2015, we introduced a longer-term target to drive continued improvement in this area. |
Reduce total reportable incidents (releases, permit excursions and spills) by
15 percent from 2013 levels | | | | • In 2014, we had 24 reportable incidents compared to 17 in 2013. The largest increase was in nitrogen (up five relative to 2013), which primarily related to releases occurring during ammonia and urea plant restarts. • We continue to review all factors that contribute to reportable incidents and share best practices internally, and with our partners, to prevent future incidents. To this end, we have set longer-term reduction targets across all three nutrient segments. |
Reduce water consumption per tonne of phosphate product by 4 percent from 2013 levels | | | | • In 2014, our water usage per tonne of phosphate product was unchanged from the previous year. • We are evaluating water efficiency opportunities at each of our phosphate operations and have set a longer-term target to achieve more substantial reductions in water usage. |
|
| 2015 Targets |
|
• By 2018, reduce GHG emissions per tonne of nitrogen product by 5 percent from 2014 levels • By 2018, reduce total reportable incidents (releases, permit excursions and spills) by 40 percent from 2014 levels • By 2018, reduce water consumption per tonne of phosphate product by 10 percent from 2014 levels |
|
|
| | |
| PotashCorp 2014 Annual Integrated Report | | 41 |
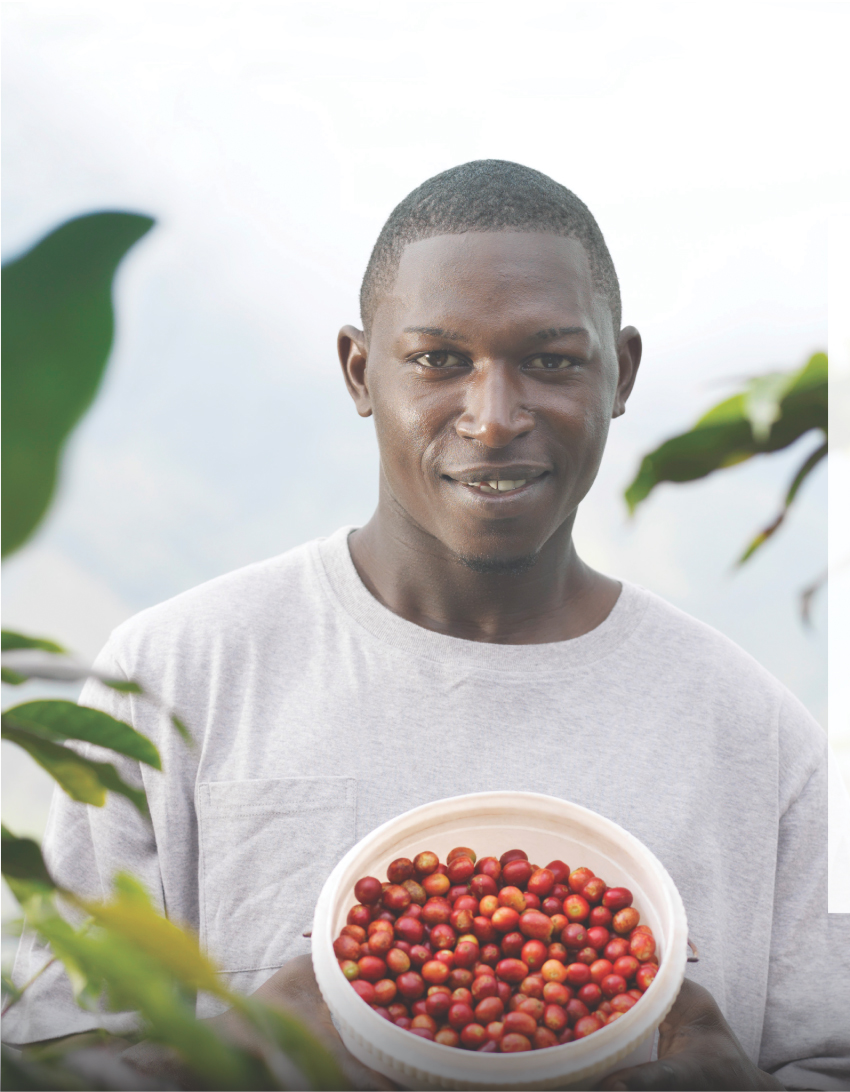
Our Nutrients
A Jamaican farmer presents his bounty of coffee beans.

| | |
| PotashCorp 2014 Annual Integrated Report | | 43 |
| | | | | | | | | | | | |
| | | | | 
| | | | 
| | | | 
|
Used for Fertilizer | | | | Improves root strength and disease resistance; assists water retention; enhances taste, color and texture of food | | | | Builds proteins and enzymes; speeds plant growth | | | | Aids in photosynthesis; speeds crop maturity |
Feed | | | | Aids in animal growth and milk production | | | | Plays a key role in animal growth and development | | | | Assists in muscle repair and skeletal development |
Industrial | | | | Used in soaps, water softeners, de-icers, drilling muds and food products | | | | Used in plastics, resins, adhesives and emission controls | | | | Used in soft drinks, food additives and metal treatments |
How Produced | | | | Mined from evaporated sea deposits | | | | Synthesized from air using steam and natural gas or coal | | | | Mined from sea deposits |
Barriers to Entry | | | | High | | | | Low-Moderate | | | | Moderate |
Timeline for Greenfield (including ramp-up) | | | | Minimum 7 years1 | | | | Minimum 3 years2 | | | | Minimum 3-4 years3, 4 |
Cost of Greenfield (excluding infrastructure) | | | | CDN $4.6 billion1 | | | | $1.7 billion2 | | | | $4.1 billion4 |
Cost of Greenfield (including infrastructure) 5 | | | | CDN $5.1-$6.7 billion 1 | | | | $1.8-$2.0 billion2 | | | | $5.1 billion4 |
Number of Major Producing Countries | | | | 12 | | | | ~60 | | | | ~40 |
Global Production Traded | | | | 76% (KCl) | | | | 11% (NH3) | | | | 10% (P2O5) |
| 1 | Estimate for a conventional 2 million tonne mine in Saskatchewan |
| 2 | Estimate for a 1 million tonne NH3 ammonia/urea complex |
| 3 | Does not include time for permitting, research and engineering |
| 4 | Estimate for a 1 million tonne P2O5 operation including phosphate rock mine and beneficiation, sulfuric acid, phosphate acid and DAP/MAP granulation plants |
| 5 | Includes rail, utility systems, port facilities and, if applicable, cost of deposit |

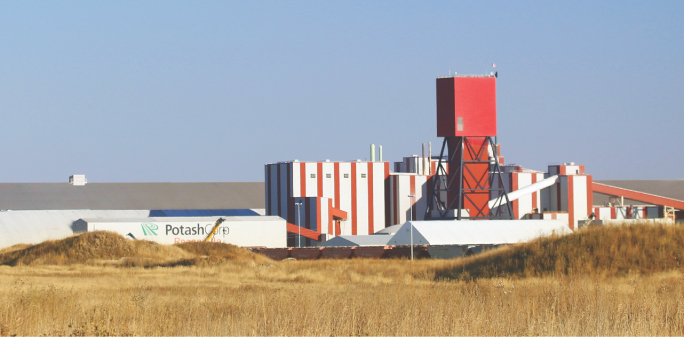
Rocanville, Saskatchewan
Summary Overview

| | | | | | | | |
| | | | |
Growth Initiatives • Improve ability to respond to future growth in demand by completing brownfield projects. • Enhance transportation and distribution capability to help develop new and existing markets. | | | | Operational Flexibility • Match operational capability to anticipated market demand while maintaining ability to restart idled operations. | | | | Advantaged Competitive Positions • Mine reserves in a sustainable, cost-effective manner. • Protect low-cost position through operational and logistical efficiencies. • Improve safety and environmental performance. |
| | |
| 44 | | PotashCorp 2014 Annual Integrated Report |
Nutrients
Key Industry Highlights
| | |
 | | Economically mineable deposits are geographically concentrated |
Potash is produced in significant quantity in only 12 countries, with Canada home to almost half of known global reserves. While potash exists in areas other than the current producing nations, securing an economically mineable deposit in a country with both political stability and available infrastructure can present significant challenges to building new capacity. The result is that capacity is highly concentrated globally, with producers in North America and the FSU accounting for approximately 39 percent and 31 percent, respectively.
| | |
 | | Demand growth largely dependent on
emerging markets |
Most growth in demand is expected to occur in offshore markets where potash has historically been under-applied and crop yields lag behind those of the developed world. Historically, the major consuming regions of Brazil, China, India and other Asian countries have accounted for approximately two-thirds of total potash consumption. With little or no indigenous production capability, these markets rely heavily on imports. While demand has increased significantly over time, economic conditions, government policies and affordability can create more variability in growth.
| | |
 | | New capacity requires significant investment
of time and money |
Entry into the potash business is difficult because of the cost and time necessary to build new capacity. This means building new capacity at current economics provides minimal capital return. Brownfield projects, especially those which have already been completed, have a significant per-tonne capital cost advantage over greenfield projects.
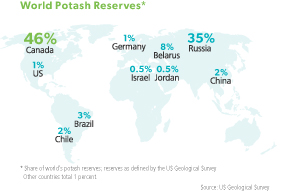
| | |
| | | |
89% | | Share of estimated global reserves found in Canada, Russia and Belarus, making mineable deposits geographically concentrated |
| | | |
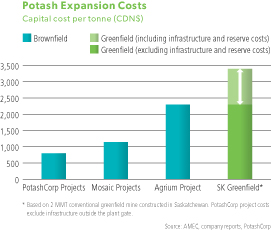
| | |
| | | |
25% | | Estimated average per-tonne cost of PotashCorp’s brownfield expansion projects compared to greenfield costs |
| | | |
Primary Potash Market Profile
| | | | | | | | |
Country/Region | | Growth Rate 1 | | Offshore Imports 2 (MMT – 2014) | | Domestic Producer Sales (MMT – 2014) | | Main Consuming Crops |
China | | 3.7% | | 7.7 | | 6.0 | | Vegetables, rice, fruits, corn |
India | | 1.5% | | 4.4 | | – | | Rice, wheat, vegetables, sugar crops |
Other Asia | | 3.1% | | 8.8 | | – | | Oil palm, rice, sugar crops, fruits, vegetables |
Latin America | | 3.0% | | 9.6 | | 1.9 | | Soybeans, sugar crops, corn |
North America | | -0.3% | | 1.3 | | 9.4 | | Corn, soybeans |
| 1 | 10-year CAGR for consumption (2004-2014E) |
| 2 | Net imports; does not include product for re-export |
Source: Fertecon, IFA, PotashCorp
| | |
| PotashCorp 2014 Annual Integrated Report | | 45 |
Segment Overview
Operations and Investments
Our potash business consists of five operations in Saskatchewan and one in New Brunswick. Since 2003, we have been enhancing our capability through expansion projects at each facility.
We also have strategic investments in other potash-related companies around the world.
Markets
Fertilizer sales typically make up approximately 90 percent of our annual potash sales volumes. While many different forms of product are produced for agricultural purposes, the most common types are standard and granular grade potash.
Customers in Asia are the largest buyers of standard product, using it as a direct application fertilizer and to manufacture compound fertilizer products. The larger, more uniform granular product is the potash of choice in more advanced agricultural markets like Brazil and North America, where it is typically blended with other crop nutrients. However, the demand for bulk blended fertilizer in Asia has grown significantly, as has the use of granular product, which now accounts for approximately 45 percent of global potash fertilizer consumption. Most product is sold on a spot basis, although certain markets – primarily China and India – purchase under annual or six-month contracts.
In addition to fertilizer markets, we sell approximately 10 percent of our sales volumes to feed and industrial customers – who use potash to make products such as soaps, water softeners, de-icers, drilling muds and food products.
Offshore
Offshore sales typically account for approximately two-thirds of PotashCorp’s sales volumes. The majority of our offshore sales are
made through Canpotex, which accounted for approximately 93 percent of our 2014 offshore sales volumes. Exporting from the West Coast of North America, Canpotex serves its customers through terminals in Vancouver, British Columbia and Portland, Oregon. In 2015, we expect our Canpotex allocation to be approximately 52.2 percent. We anticipate this to change as Canpotex members complete entitlement runs, including our Rocanville run, currently planned for 2016.
We serve customers from our New Brunswick facility through PCS Sales, which uses a nearby port at Saint John on Canada’s East Coast. The majority of New Brunswick tonnes are shipped to Latin America and the US. As a shareholder in Perola S.A., PCS Sales uses its bulk fertilizer terminals at the Port of Santos in Brazil to help minimize long unloading wait times in this market.
We compete against producers such as Belaruskali, ICL, K+S, SQM and Uralkali.
North America
We sell to our North American customers primarily by rail from Saskatchewan, particularly from our Rocanville facility, which is just 150 km from the US border.
Our main customers are wholesalers, retailers and cooperatives that purchase in the spot market from PCS Sales. We have a strategic advantage in this market with more than 150 owned or leased US distribution points and a fleet of approximately 4,200 owned and leased railcars. We believe this is the most extensive domestic distribution network in the potash business.
Our main competitors in North America are Agrium, Intrepid Potash and Mosaic, as well as offshore imports into the US Gulf and East Coast, primarily from ICL, SQM and Uralkali.
PotashCorp’s Strategic Investments
| | | | | | | | |
| | | SQM, Chile | | ICL, Israel | | APC, Jordan | | Sinofert, China |
Potash Capacity 1 | | 2.3 million tonnes KCl | | 6.0 million tonnes KCl | | 2.5 million tonnes KCl | | No primary potash capacity 2 |
PotashCorp Ownership | | 32 percent | | 14 percent | | 28 percent | | 22 percent |
Board Representation | | Right to designate three of eight board members | | No board members | | Right to designate three of 13 board members and the top four management positions | | Right to designate two of seven board members |
Market Value 3 | | $2.2 billion | | $1.3 billion | | $0.6 billion | | $0.3 billion |
| 1 | Based on reported capacity on December 31, 2014 |
| 2 | Sinofert owns approximately 24 percent of Qinghai Salt Lake Industry Company, China’s largest potash producer. |
| 3 | Market value of PotashCorp investment as at December 31, 2014 |
| Source: | Fertecon, CRU, Bloomberg, public filings, PotashCorp |
| | |
| 46 | | PotashCorp 2014 Annual Integrated Report |
Nutrients
How We Are Positioned

Improve ability to respond to future demand growth
In 2003, we initiated expansion and debottlenecking projects at all six of our potash operations. This program is anticipated to increase our nameplate capacity to approximately 19 million tonnes at a much lower cost than greenfield projects and many competitors’ brownfield expansions.
At the end of 2014, 94 percent of the total projected capital expenditures were complete. Our remaining projects are a larger mine and expanded mill at New Brunswick and a mine and mill expansion at Rocanville. These two projects are in early ramp-up stage with capital spending largely complete. They will provide additional lower-cost production flexibility to meet future customer needs.
In 2015, we expect to have 10.9 million tonnes of operational capability. With the completion and ramp-up of our two remaining projects, we have the potential to increase our capability in the years ahead. We also have the potential to restart idled capacity if market conditions warrant.
We believe we are well positioned to meet anticipated growth in global demand.
Enhance transportation and distribution capability
In North America, we continue to optimize our rail and distribution system to better serve customers’ needs in an efficient and timely manner. In recent years, we have enhanced our rail fleet through the addition of 2,000 custom-built high-capacity cars – and in 2014 ordered another 1,000 – which increases volumes per trainload. We are using components of our regional distribution center in Hammond, Indiana to reduce the time and cost to serve key markets in the US Midwest. We are working on the second phase, which includes the construction of a large storage facility expected to be finished in late 2015.
Canpotex is continually working to improve its world-class rail and ocean transportation and distribution infrastructure. It currently has export capability of more than 14 million tonnes annually, and in late 2014 initiated an expansion at its Portland terminal that is expected to increase total export capability to 17 million tonnes. Canpotex continues to evaluate building a new terminal in Prince Rupert, British Columbia to further increase annual export capacity.
Beyond its export capabilities, Canpotex has approximately 5,000 leased railcars, long-term contracts with CP Rail and CN Rail and a state-of-the-art railcar maintenance and staging facility. We believe these make Canpotex one of the most efficient suppliers of potash in the world.
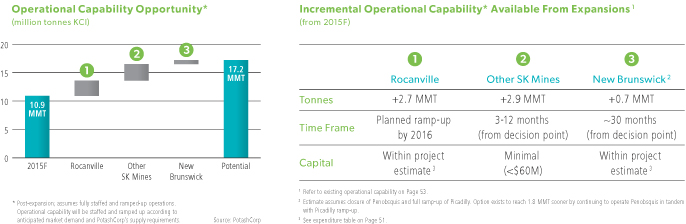
| | |
| | | |
6.3 MMT | | Future additional tonnes available for production from all PotashCorp facilities if projects completed, ramped-up and fully staffed (as compared to 2015F) |
| | | |
| | |
| PotashCorp 2014 Annual Integrated Report | | 47 |

Match operational capability to anticipated market demand
In late 2013, we took steps to better match our near-term operational capability with our anticipated production requirements. This resulted in the reduction of our workforce and operational capability at a number of mines, most significantly at Cory and Lanigan.
We suspended production at one of our two mills at Lanigan while our Cory operation was adjusted to focus primarily on white industrial production. Each idled operation is kept in a care-and-maintenance mode to allow the flexibility to restart operations as market conditions warrant, with adequate rehiring and operational ramp-up time.

Mine reserves in a sustainable, cost-effective manner
With access to decades of high-quality potash reserves, we ensure our mining practices are designed to maximize the value of the asset and protect our competitively-advantaged position.
We develop long-term plans with the goal of ensuring that our reserves are mined in a sustainable manner. We seek to manage mining risks such as ground collapses and flooding through the
development and use of world-class technology and mining techniques. Additionally, we implement projects that maximize efficient ore production while minimizing waste and increasing recovery.
Protect lower-cost global competitive position
Managing costs and improving efficiencies are priorities as we strive to remain among the lowest delivered-cost suppliers to our key markets. We are optimizing production at our lowest-cost facilities and accelerating development of our new Picadilly mine at our site in New Brunswick. These changes, along with other cost initiatives, resulted in us achieving our targeted $15-$20 per tonne improvement in our cash cost of production in 2014 (from 2013 levels). We have plans to further improve these costs, targeting total reductions of$20-$30 per tonne (from 2013 levels) in 2016.
Improve safety and environmental performance
Within our potash division, we are focused on identifying and improving the areas where employees or the environment are at greatest risk.
Standardized systems and processes are contributing to our success and in 2014 we worked to strengthen our training, identifying opportunities to standardize across the company and developing metrics for measuring our progress. Engaging employees and developing leaders are essential parts of our approach, as well as communicating and implementing best practices at all our potash facilities and across the company.
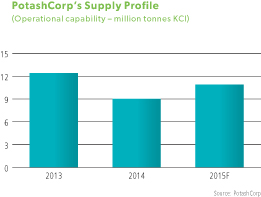
| | |
| | | |
10.9 MMT | | Anticipated operational capability available in 2015 |
| | | |
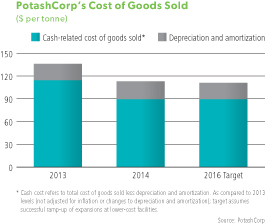
| | |
| | | |
$20-30 per tonne | | Targeted improvement by 2016 (from 2013) through optimization |
| | | |
| | |
| 48 | | PotashCorp 2014 Annual Integrated Report |
Nutrients
| | |
| | Potash Performance |
Financial Performance
| | | | | | | | | | | | | | | | | | | | | | | | | | | | | | | | | | | | | | | | | | | | | | | | | | | | | | | | | | | | |
| | | | | | | |
| | | Dollars (millions) | | | % Change | | | Tonnes (thousands) | | | % Change | | | Average per Tonne1 | | | % Change | |
| | | 2014 | | | 2013 | | | 2012 | | | 2014 | | | 2013 | | | 2014 | | | 2013 | | | 2012 | | | 2014 | | | 2013 | | | 2014 | | | 2013 | | | 2012 | | | 2014 | | | 2013 | |
Manufactured product | | | | | | | | | | | | | | | | | | | | | | | | | | | | | | | | | | | | | | | | | | | | | | | | | | | | | | | | | | | | |
Net sales | | | | | | | | | | | | | | | | | | | | | | | | | | | | | | | | | | | | | | | | | | | | | | | | | | | | | | | | | | | | |
North America | | $ | 1,162 | | | $ | 1,210 | | | $ | 1,231 | | | | (4 | ) | | | (2 | ) | | | 3,549 | | | | 3,185 | | | | 2,590 | | | | 11 | | | | 23 | | | $ | 328 | | | $ | 380 | | | $ | 475 | | | | (14 | ) | | | (20 | ) |
Offshore | | | 1,354 | | | | 1,482 | | | | 1,835 | | | | (9 | ) | | | (19 | ) | | | 5,797 | | | | 4,915 | | | | 4,640 | | | | 18 | | | | 6 | | | $ | 234 | | | $ | 302 | | | $ | 396 | | | | (23 | ) | | | (24 | ) |
| | | | | | | | | | | | | | | | | | | | | | | | | | | | | | | | | | | | | | | | | | | | | | | | | | | | | | | | | | | | | |
| | | 2,516 | | | | 2,692 | | | | 3,066 | | | | (7 | ) | | | (12 | ) | | | 9,346 | | | | 8,100 | | | | 7,230 | | | | 15 | | | | 12 | | | $ | 269 | | | $ | 332 | | | $ | 424 | | | | (19 | ) | | | (22 | ) |
Cost of goods sold | | | (1,060 | ) | | | (1,108 | ) | | | (1,103 | ) | | | (4 | ) | | | – | | | | | | | | | | | | | | | | | | | | | | | $ | (113 | ) | | $ | (136 | ) | | $ | (152 | ) | | | (17 | ) | | | (11 | ) |
| | | | | | | | | | | | | | | | | | | | | | | | | | | | | | | | | | | | | | | | | | | | | | | | | | | | | | | | | | | | | |
Gross margin | | | 1,456 | | | | 1,584 | | | | 1,963 | | | | (8 | ) | | | (19 | ) | | | | | | | | | | | | | | | | | | | | | | $ | 156 | | | $ | 196 | | | $ | 272 | | | | (20 | ) | | | (28 | ) |
| Other miscellaneous and purchased product gross margin 2 | | | (21 | ) | | | (11 | ) | | | – | | | | 91 | | | | n/m | | | | | | | | | | | | | | | | | | | | | | | | | | | | | | | | | | | | | | | | | |
| | | | | | | | | | | | | | | | | | | | | | | | | | | | | | | | | | | | | | | | | | | | | | | | | | | | | | | | | | | | | |
Gross Margin | | $ | 1,435 | | | $ | 1,573 | | | $ | 1,963 | | | | (9 | ) | | | (20 | ) | | | | | | | | | | | | | | | | | | | | | | $ | 154 | | | $ | 194 | | | $ | 272 | | | | (21 | ) | | | (29 | ) |
| | | | | | | | | | | | | | | | | | | | | | | | | | | | | | | | | | | | | | | | | | | | | | | | | | | | | | | | | | | | | |
| 1 | Rounding differences may occur due to the use of whole dollars in per-tonne calculations. |
| 2 | Comprised of net sales of $21 million (2013 – $15 million, 2012 – $13 million) less cost of goods sold of $42 million (2013 – $26 million, 2012 – $13 million) |
 Note 3 Note 3 | |
Potash gross margin variance was attributable to:
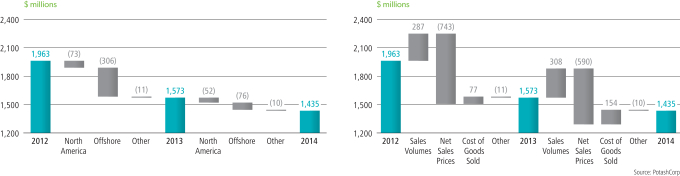
| | | | | | | | | | | | | | | | | | | | | | | | | | | | | | | | |
| | | 2014 vs 2013 | | | 2013 vs 2012 | |
| | | | | | Change in Prices/Costs | | | | | | | | | Change in Prices/Costs | | | | |
| Dollars (millions) | | Change in
Sales Volumes | | | Net
Sales | | | Cost of
Goods Sold | | | Total | | | Change in
Sales Volumes | | | Net
Sales | | | Cost of
Goods Sold | | | Total | |
Manufactured product | | | | | | | | | | | | | | | | | | | | | | | | | | | | | | | | |
North America | | $ | 108 | | | $ | (186 | ) | | $ | 26 | | | $ | (52 | ) | | $ | 231 | | | $ | (304 | ) | | $ | – | | | $ | (73 | ) |
Offshore | | | 189 | | | | (393 | ) | | | 128 | | | | (76 | ) | | | 82 | | | | (462 | ) | | | 74 | | | | (306 | ) |
Change in market mix | | | 11 | | | | (11 | ) | | | – | | | | – | | | | (26 | ) | | | 23 | | | | 3 | | | | – | |
| | | | | | | | | | | | | | | | | | | | | | | | | | | | | | | | | |
Total manufactured product | | $ | 308 | | | $ | (590 | ) | | $ | 154 | | | $ | (128 | ) | | $ | 287 | | | $ | (743 | ) | | $ | 77 | | | $ | (379 | ) |
| Other miscellaneous and purchased product | | | | | | | | | | | | | | | (10 | ) | | | | | | | | | | | | | | | (11 | ) |
| | | | | | | | | | | | | | | | | | | | | | | | | | | | | | | | | |
Total | | | | | | | | | | | | | | $ | (138 | ) | | | | | | | | | | | | | | $ | (390 | ) |
| | | | | | | | | | | | | | | | | | | | | | | | | | | | | | | | | |
| | |
| PotashCorp 2014 Annual Integrated Report | | 49 |
Sales to major offshore markets were as follows:
| | | | | | | | | | | | | | | | | | | | | | | | | | | | | | | | | | | | | | | | | | |
| | | By Canpotex | | | | | From New Brunswick | |
| | | Percentage of Annual Sales Volumes | | | % Change | | | | | Percentage of Annual Sales Volumes | | | % Change | |
| | | 2014 | | | 2013 | | | 2012 | | | 2014 | | | 2013 | | | | | 2014 | | | 2013 | | | 2012 | | | 2014 | | | 2013 | |
China | | | 16 | | | | 15 | | | | 12 | | | | 7 | | | | 25 | | | | | | – | | | | – | | | | – | | | | – | | | | – | |
India | | | 10 | | | | 10 | | | | 5 | | | | – | | | | 100 | | | | | | – | | | | – | | | | – | | | | – | | | | – | |
Other Asian countries 1 | | | 41 | | | | 41 | | | | 49 | | | | – | | | | (16 | ) | | | | | – | | | | – | | | | – | | | | – | | | | – | |
Latin America | | | 26 | | | | 28 | | | | 29 | | | | (7 | ) | | | (3 | ) | | | | | 100 | | | | 100 | | | | 100 | | | | – | | | | – | |
Other countries | | | 7 | | | | 6 | | | | 5 | | | | 17 | | | | 20 | | | | | | – | | | | – | | | | – | | | | – | | | | – | |
| | | | | | | | | | | | | | | | | | | | | | | | | | | | | | | | | | | | | | | | | | | |
| | | 100 | | | | 100 | | | | 100 | | | | | | | | | | | | | | 100 | | | | 100 | | | | 100 | | | | | | | | | |
| | | | | | | | | | | | | | | | | | | | | | | | | | | | | | | | | | | | | | | | | | | |
| 1 | All Asian countries except China and India |
The most significant contributors to the change in total gross margin were as follows (direction of arrows refers to impact on gross margin):
| | | | | | |
| | | Net Sales Prices | | Sales Volumes | | Cost of Goods Sold |
2014 vs 2013 | | q Potash prices were lower as the sharp decline during the second half of 2013 weighed on realizations in 2014, partially offset by rising prices throughout the year due to record global demand and tighter supplies. | | p North American volumes were up due to low distributor inventories at the start of the year, higher acreage and application rates and improved second-half customer engagement. p Offshore sales volumes rose due to record global demand in 2014. | | p The Canadian dollar weakened relative to the US dollar, reducing cost of goods sold. p Costs were lower due to our workforce reduction and operational changes announced in 2013. p Shutdown weeks were lower in 2014 (18 weeks) compared to 2013 (42 weeks), primarily as a result of improved demand. p More product from our lower-cost mines went to offshore customers, resulting in a greater positive cost of goods sold variance. |
| | | |
2013 vs 2012 | | q Our average realized potash price declined on increased industry operational capability and weaker demand in the second half of 2013. | | p With limited dealer inventory carried into 2013 and strong agricultural fundamentals, North American sales volumes grew. Buyer destocking occurred in 2012. p Record volumes shipped by Canpotex in the first half of 2013 (due to settlements with China and India occurring earlier than in 2012 and less inventory being carried into 2013 in major offshore spot markets) were partly offset by declines in the second half of 2013 due to market uncertainty. | | p Brine management costs fell as our tolling agreement at Esterhazy expired at the end of 2012, and decreased depreciation was mainly due to costs associated with Esterhazy incurred in 2012. p 42 shutdown weeks were incurred in 2013 (77 shutdown weeks in 2012), primarily as a result of our strategy to match production to market demand. Also in 2013, we reduced operating rates for 52 weeks (none in 2012). q Costs associated with our workforce reduction at Cory, Lanigan, New Brunswick and Patience Lake were incurred in 2013. p More product from our lower-cost mines went to offshore customers, resulting in a positive cost of goods sold variance. |
| | | The change in market mix produced an unfavorable variance of $26 million related to sales volumes and a favorable variance of $23 million in sales prices, due primarily to more higher-priced granular product being sold to North America. | |
| | |
| 50 | | PotashCorp 2014 Annual Integrated Report |
Nutrients
North America net sales prices are higher than offshore prices as North American customers prefer premium-priced granular product over standard product more typically consumed offshore.
Capital Expenditures
| | | | | | | | |
| | | | |
| Facility | | Actual and Expected
Investment 1 (CDN$ billions) | | Expected Remaining
Spending2 (CDN$ billions) | | Construction
Completion 3 | | Nameplate
Capacity
(post-expansion) 4 |
Constructed Projects Completed (2005-2014) | | | | | | | | |
Completed Projects | | $3.3 | | $ – | | | | 11.1 MMT |
Projects in Progress | | | | | | | | |
New Brunswick5 | | $2.2 | | $0.3 | | 2014 | | 2.0 MMT |
Rocanville | | $2.9 | | $0.2 | | 2015 | | 6.0 MMT |
Total All Projects | | $8.4 | | $0.5 | | | | 19.1 MMT |
| 1 | Amounts for projects with remaining spending are based on the most recent forecasts approved by the Board of Directors, and are subject to change based on project timelines and costs. |
| 2 | After December 31, 2014. In the case of New Brunswick, remaining expenditures relate to port and other site infrastructure required for ramp-up. |
| 3 | Construction completion does not include ramp-up time. |
| 4 | Total nameplate capacity based on estimates for completed projects: Allan (4.0 MMT); Cory (3.0 MMT); Lanigan (3.8 MMT); Patience Lake (0.3 MMT); and those projects in progress: New Brunswick (2.0 MMT); Rocanville (6.0 MMT). Potential operational capability upon completion and ramp-up of projects in progress and recently idled operational capability expected to be approximately 17.2 MMT. |
| 5 | Nameplate capacity assuming closure of existing Penobsquis mine (0.8 MMT) |
| | |
| PotashCorp 2014 Annual Integrated Report | | 51 |
Non-Financial Performance
| | | | | | | | | | | | | | | | | | | | | | |
| | | | | |
| | | | | | | | | | | | | | % Change | |
| | | | | 2014 | | | 2013 | | | 2012 | | | 2014 | | | 2013 | |
Production and reserves | | KCl tonnes produced (thousands) | | | 8,726 | | | | 7,792 | | | | 7,724 | | | | 12 | | | | 1 | |
Safety | | Total site recordable injury rate | | | 1.68 | | | | 1.37 | | | | 2.30 | | | | 23 | | | | (40 | ) |
| | Life-altering injuries | | | 1 | | | | – | | | | 1 | | | | n/m | | | | (100 | ) |
Employee | | Percentage of senior staff positions filled internally | | | 100% | | | | 100% | | | | 88% | | | | – | | | | 14 | |
Environmental | | Waste (million tonnes) | | | 17.9 | | | | 17.5 | | | | 13.3 | | | | 2 | | | | 32 | |
| | | Environmental incidents | | | 14 | | | | 13 | | | | 8 | | | | 8 | | | | 63 | |
The most significant contributors to the change in non-financial results were as follows:
| | | | |
| | | 2014 vs 2013 | | 2013 vs 2012 |
Production | | During the first half of 2014, we successfully completed a safe Canpotex entitlement run at Allan, which increased our proportion of Canpotex sales to offshore markets. Potash production rose due to fewer shutdown weeks in 2014 compared to 2013 and strong sales demand for our products in response to record global shipments. | | During the second quarter of 2013, we successfully completed a safe Canpotex entitlement run at Cory, which allows us a greater proportion of Canpotex sales to offshore markets, partly offsetting gains made by other Canpotex shareholders. While production included normal maintenance downtime in 2013 and 2012, tonnes produced were also affected by reduced operating rates (no reduced operating rates in 2012). |
Safety | | Tragically, we had a fatality at our Cory potash facility during the first quarter of 2014. Total site recordable injury rate increased mainly due to non-nested contractors. Although fewer recordable injuries were experienced in this group, significantly fewer hours were worked during the year. | | Our total site recordable injury rate declined to a record low in 2013, primarily due to the effort by the site teams on targeted safety improvement projects at Allan, Cory and Rocanville, as well as ongoing safety improvements at other sites. Ground-penetrating radar technology was developed and implemented on our underground mining machines at Cory, Allan and Lanigan to identify hazards in the rock above mine workings. The mining machine operator can view the results in real time so any compromised safety conditions can be immediately recognized and addressed. |
Employee | | Due to improved fundamentals in the granular potash market, we rescinded previously announced layoff notices at our Penobsquis, New Brunswick facility (affecting 57 employees) and recalled 47 permanent employees at Lanigan and 38 at Cory. Leadership training was received by more than 200 employees in 2014 (2013 – 180 employees). Training consisted primarily of instructor-led courses designed to enhance the PotashCorp leadership core competencies. New in-house training was offered at most sites, which focused on coaching for safety engagement. | | During the fourth quarter of 2013, we announced a workforce reduction – affecting 545 people (none in 2012) – to respond to challenging market conditions and reduce costs to enhance our global competitive position. The full impact of our workforce reduction announced in 2013 was not reflected until 2014 due to the timing of certain severance processes. Leadership training was received by 180 employees in 2013 (2012 – more than 300 employees), an expected decrease as many leaders have already taken the training. Leadership training consisted primarily of instructor-led courses designed to enhance key employee competencies regarding safety commitment, communication skills, resource management and business conduct. |
| | |
| 52 | | PotashCorp 2014 Annual Integrated Report |
Nutrients
| | | | |
| | | 2014 vs 2013 | | 2013 vs 2012 |
Environmental | | There were no significant changes. | | Waste increased due to higher mining waste per tonne (lower recovery and ore quality) combined with increased mining activity at certain sites. The rise in environmental incidents was due largely to several failures of refrigerant lines in new HVAC units installed at New Brunswick. |
Community | | In 2014, our continued career information efforts reached more than 10,000 Aboriginal youth (2013 – approximately 14,000). In 2014, 4 percent (2013 – 9 percent) of new employees wereself-identified Aboriginal applicants. The decline from 2013 was partially attributed to workforce reductions that occurred in late 2013 which caused there to be less opportunities available in 2014. | | Continued career information efforts reached approximately 14,000 Saskatchewan First Nations and Métis prospects (2012 – more than 7,000), with more than 1,000 self-identified Aboriginal applicants (2012 – 750), resulting in 9 percent (2012 – 12 percent) of new employees being voluntary self-identified Aboriginal applicants. |
Mineral Reserves1
(millions of tonnes of estimated recoverable ore)2
| | | | | | | | | | |
| All potash locations3 | | Proven | | Probable | | Total | | | | Years of Remaining Mine Life |
As of December 31, 2014 | | 633 | | 1,088 | | 1,721 | | | | 54-89 |
| 1 | For a more complete discussion of important information related to our potash reserves, see “Potash Operations – Reserves” in ourForm 10-K for the year ended December 31, 2014. |
| 2 | Average grade % K2O equivalent of 20.4-25.0. |
| 3 | Given the characteristics of the solution mining method at Patience Lake, those results are excluded from the above table as it is not possible to estimate reliably the recoverable ore reserve. |
 | Page 4 – Potash Operations – Reserves |
Potash Production
(million tonnes KCl)
| | | | | | | | | | | | | | | | | | | | | | | | | | | | |
| | | Nameplate Capacity 1 | | | Operational
Capability (2015) 2 | | | Operational Capability (2014) 2 | | | Production | | | Employees | |
| | | | | | 2014 | | | 2013 | | | 2012 | | |
Lanigan SK3 | | | 3.8 | | | | 2.2 | | | | 1.7 | | | | 1.68 | | | | 2.24 | | | | 1.65 | | | | 392 | |
Rocanville SK | | | 3.0 | | | | 2.7 | | | | 2.6 | | | | 2.49 | | | | 1.99 | | | | 1.57 | | | | 607 | |
Allan SK | | | 4.0 | | | | 3.2 | | | | 2.5 | | | | 2.47 | | | | 1.18 | | | | 1.17 | | | | 547 | |
Cory SK3 | | | 3.0 | | | | 1.4 | | | | 1.7 | | | | 1.18 | | | | 1.49 | | | | 1.29 | | | | 443 | |
Patience Lake SK | | | 0.3 | | | | 0.3 | | | | 0.3 | | | | 0.30 | | | | 0.27 | | | | 0.29 | | | | 80 | |
New Brunswick NB | | | 0.8 | | | | 1.1 | | | | 0.2 | | | | 0.61 | | | | 0.62 | | | | 0.74 | | | | 465 | |
Esterhazy SK4 | | | – | | | | – | | | | – | | | | – | | | | – | | | | 1.01 | | | | – | |
TOTAL | | | 14.9 | | | | 10.9 | | | | 9.0 | | | | 8.73 | | | | 7.79 | | | | 7.72 | | | | 2,534 | |
| 1 | Represents estimates of capacity as of December 31, 2014. Estimates based on capacity as per design specifications for those projects constructed or Canpotex entitlement runs once complete. In the case of Allan, the Canpotex entitlement run achieved significantly better results than design specifications, resulting in nameplate capacity of 4.0 compared with 3.0 disclosed in the prior year. In the case of New Brunswick, nameplate capacity represents the Penobsquis mine, and will be updated following ramp-up of the Picadilly mine. In the case of Patience Lake, estimate reflects current operational capability. Estimates for all other facilities do not necessarily represent operational capability. |
| 2 | Estimated annual achievable production level at current staffing and operational readiness (estimated at beginning of year). Estimate does not include inventory-related shutdowns and unplanned downtime. In 2014, production exceeded operational capability at New Brunswick due to adjustments made during the year. |
| 3 | Operational capability significantly lower than nameplate capacity due to operational and workforce changes announced in December 2013. Potential exists to reach previous operational capability with increased staffing and operational ramp-up, although timing is uncertain. |
| 4 | Product tonnes received at Esterhazy were based on a mining and processing agreement with Mosaic and a related settlement agreement. Under the settlement agreement, the mining and processing agreement terminated on December 31, 2012. |
| | |
| PotashCorp 2014 Annual Integrated Report | | 53 |

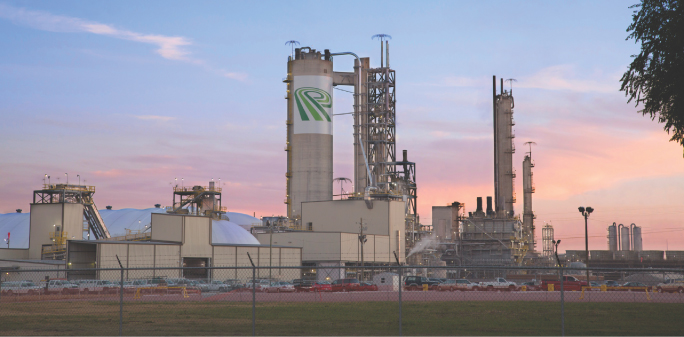
Augusta, Georgia
Summary Overview

| | | | | | | | |
Growth Initiatives • Enhance existing production facilities by pursuing quick-payback, cost-advantaged US brownfield projects. | | | | Operational Flexibility • Optimize product mix with a focus on more stable, higher-margin industrial markets. | | | | Advantaged Competitive Positions • Improve cost position by enhancing efficiencies and reliability. • Improve safety and environmental performance with a specific focus on reducing GHG emissions. |
| | |
| 54 | | PotashCorp 2014 Annual Integrated Report |
Nutrients
Key Industry Highlights
| | |

| | Lower-Cost Natural Gas Is Essential to Success |
Natural gas is the basis of most of the world’s nitrogen production and can make up 70-85 percent of the cash cost of producing a tonne of ammonia, the feedstock for downstream nitrogen products. With large supplies of lower-cost natural gas, the US, Russia, North Africa and the Middle East are major nitrogen-producing regions. Producers in China, Ukraine and Western Europe are higher-cost suppliers and typically have played a significant role in determining global nitrogen prices.
| | |

| | Proximity to End Markets Influences Trade |
Expensive specialized ammonia transportation vessels and the lower nitrogen concentration levels of nitrogen solutions are obstacles to economically transporting these products over long distances. As a result, their trade has historically been limited compared to urea. Since the US is among the largest consumers of nitrogen products, domestic producers have notable transportation advantages over offshore suppliers in accessing this market.
| | |

| | Pricing Volatility in Nitrogen Markets |
With natural gas feedstock widely available, the nitrogen industry is highly fragmented and regionalized. In addition, geopolitical events and the influence of China’s export tax policy can impact available supply and global trade. This market structure, and the relatively short time necessary to build new capacity, makes nitrogen markets typically more volatile than other fertilizer markets.
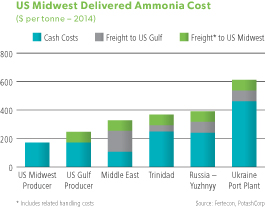
| | |
| | | |
$170 per tonne | | Estimated average freight advantage that US Midwest producers have over offshore imports |
| | | |

| | |
| | | |
11% | | Ammonia tonnes traded globally make it a largely regional business |
| | | |
US Nitrogen Market Profile
| | | | | | | | | | |
| Product | | Fertilizer Use* | | Non-Fertilizer Use | | Production**
(MMT – 2014) | | Imports
(MMT – 2014) | | Key Supplying
Countries/Regions |
Ammonia | | 70% | | 30% | | 11.6 | | 5.1 | | Canada, Russia, Trinidad |
Urea | | 77% | | 23% | | 6.5 | | 7.5 | | Canada, China, Middle East |
UAN | | 99% | | 1% | | 10.3 | | 3.1 | | Egypt, Russia, Trinidad |
| * | Includes production upgraded into other fertilizer products |
| ** | Includes urea liquor used to produce nitrogen solutions and diesel emission fluid (DEF) |
Source: USDOC; Blue Johnson Associates; PotashCorp
| | |
| PotashCorp 2014 Annual Integrated Report | | 55 |
Segment Overview
Operations
We produce a broad range of nitrogen products in the US and Trinidad. Our three US facilities produce ammonia, urea and other products such as nitric acid, ammonium nitrate and nitrogen solutions.
We have a large-scale production facility in Trinidad, with four ammonia plants and one urea plant.
Markets
Although approximately 80 percent of world nitrogen production goes into fertilizers, we focus largely on industrial demand with sales to these customers making up two-thirds of our total nitrogen sales volumes in 2014.
Logistical constraints and high transportation costs mean that sales, particularly of ammonia, are generally regional in nature. The majority of our products – approximately 83 percent of our sales volumes in 2014 – are sold in North America with the remainder destined for offshore markets, particularly in Latin America. Sales of our nitrogen products are handled by PCS Sales.
North America
Our US plants, which are located mainly in the country’s interior, benefit from proximity to key customers.
Long-term leases of ammonia vessels at fixed prices enable us to manage transportation costs and provide economical delivery of our Trinidad product to the North American market. Additionally, we gain logistical strength and flexibility for these imports by owning facilities, or having major supply contracts, at six deepwater US ports.
We compete in the US market with Agrium, CF Industries and Koch, and with imported product from suppliers in the Middle East, North Africa, Trinidad, the former Soviet Union and China.
Offshore
Our offshore sales are limited and represented only 16 percent of our total sales volumes in 2014. The majority of our offshore sales volumes are sourced from our Trinidad facility, which is well positioned to meet demand from Latin America.
We compete in this region with a broad range of offshore and domestic producers.
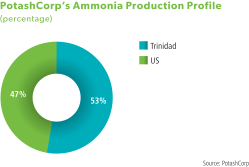
| | |
| | | |
47% | | PotashCorp’s ammonia production from lower-cost US facilities |
| | | |
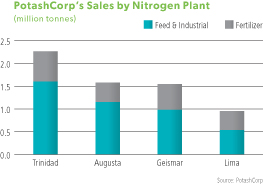
| | |
| | | |
67% | | Total nitrogen sales volumes sold in 2014 to industrial markets |
| | | |
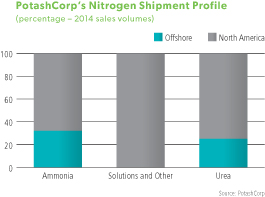
| | |
| | | |
84% | | Total nitrogen sales volumes sold to the North American market |
| | | |
| | |
| 56 | | PotashCorp 2014 Annual Integrated Report |
Nutrients
How We Are Positioned

Enhance our existing production facilities
Given our access to lower-cost natural gas, we continue to pursue opportunities to increase our US nitrogen capacity. We have completed two expansions at our US facilities, adding approximately 70,000 tonnes of ammonia at Augusta in late 2012 and restarting approximately 0.5 million tonnes of ammonia capacity at Geismar in early 2013. A brownfield expansion at our Lima facility is currently underway, which will add approximately 100,000 tonnes of ammonia capacity and approximately 73,000 tonnes of urea capacity by late 2015 at an estimated cost of approximately $210 million.
Our Trinidad gas contracts, which run through 2018, are primarily indexed to ammonia prices, enhancing gross margin stability. Natural gas curtailments at our Trinidad operations have impacted our production, with approximately 230,000 tonnes of ammonia production lost in 2014. We are working with the Trinidadian government to improve the reliability of gas supply to enhance our future production capability.

Optimize product mix
Industrial markets traditionally provide more stable demand and better margins than fertilizer markets. To maintain our industrial customer base, we strive to ensure that product can be reliably and competitively delivered. This is achieved by delivering more than half of our US-produced third-party ammonia sales volumes to industrial customers by pipeline; a safe, reliable method that lowers transportation and distribution costs.
We also look for opportunities to enter new market segments where we have a competitive advantage. We have been expanding in the diesel emission fluid (DEF) market, leveraging our ability to produce high-quality products in an area with strong demand. We expect our Lima expansion – which is anticipated to be fully online in late 2015 – will further enhance our ability to serve the profitable and growing DEF market.

Improve cost position
We look for opportunities to enhance the consistency of our gross margin profile. A key focus is on improving our cost position by achieving energy and labor efficiency through innovation, process improvements and procurement initiatives.
Additionally, we are working to better share and standardize maintenance processes across our sites to strengthen the reliability of our operations.
Improve safety and environmental performance
In 2014, we enhanced our training, identifying opportunities to standardize safety training across the company and developing metrics for measuring our progress. Engaging employees and developing leaders are essential parts of our approach to improve safety and environmental performance, as well as communicating and implementing best practices at all our nitrogen facilities and across the company.
Since our nitrogen plants are the largest contributor to company-wide GHG emissions and energy consumption on a per-tonne basis, we pay particular attention to improvements in these areas. Energy efficiency and environmental observation metrics are part of short-term incentive plans at each site, which better aligns our reward structure with environmental performance.
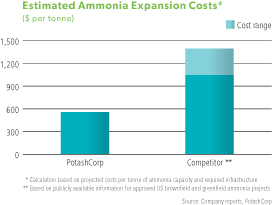
| | |
| | | |
| 60% | | Estimated average per-tonne cost advantage of PotashCorp’s projects compared to competitors |
| | | |
| | |
| PotashCorp 2014 Annual Integrated Report | | 57 |
| | |
| | Nitrogen Performance |
Financial Performance
| | | | | | | | | | | | | | | | | | | | | | | | | | | | | | | | | | | | | | | | | | | | | | | | | | | | | | | | | | | | |
| | | | | | | |
| | | Dollars (millions) | | | % Change | | | Tonnes (thousands) | | | % Change | | | Average per Tonne1 | | | % Change | |
| | | 2014 | | | 2013 | | | 2012 | | | 2014 | | | 2013 | | | 2014 | | | 2013 | | | 2012 | | | 2014 | | | 2013 | | | 2014 | | | 2013 | | | 2012 | | | 2014 | | | 2013 | |
Manufactured product2 | | | | | | | | | | | | | | | | | | | | | | | | | | | | | | | | | | | | | | | | | | | | | | | | | | | | | | | | | | | | |
Net sales | | | | | | | | | | | | | | | | | | | | | | | | | | | | | | | | | | | | | | | | | | | | | | | | | | | | | | | | | | | | |
Ammonia | | $ | 1,260 | | | $ | 1,143 | | | $ | 1,152 | | | | 10 | | | | (1 | ) | | | 2,428 | | | | 2,163 | | | | 2,033 | | | | 12 | | | | 6 | | | $ | 519 | | | $ | 529 | | | $ | 566 | | | | (2 | ) | | | (7 | ) |
Urea | | | 439 | | | | 443 | | | | 568 | | | | (1 | ) | | | (22 | ) | | | 1,049 | | | | 1,070 | | | | 1,105 | | | | (2 | ) | | | (3 | ) | | $ | 418 | | | $ | 414 | | | $ | 514 | | | | 1 | | | | (19 | ) |
Solutions, nitric acid, | | | | | | | | | | | | | | | | | | | | | | | | | | | | | | | | | | | | | | | | | | | | | | | | | | | | | | | | | | | | |
ammonium nitrate | | | 679 | | | | 638 | | | | 445 | | | | 6 | | | | 43 | | | | 2,875 | | | | 2,663 | | | | 1,808 | | | | 8 | | | | 47 | | | $ | 236 | | | $ | 240 | | | $ | 247 | | | | (2 | ) | | | (3 | ) |
| | | 2,378 | | | | 2,224 | | | | 2,165 | | | | 7 | | | | 3 | | | | 6,352 | | | | 5,896 | | | | 4,946 | | | | 8 | | | | 19 | | | $ | 374 | | | $ | 377 | | | $ | 438 | | | | (1 | ) | | | (14 | ) |
Cost of goods sold | | | (1,383 | ) | | | (1,325 | ) | | | (1,256 | ) | | | 4 | | | | 5 | | | | | | | | | | | | | | | | | | | | | | | $ | (218 | ) | | $ | (225 | ) | | $ | (254 | ) | | | (3 | ) | | | (11 | ) |
Gross margin | | | 995 | | | | 899 | | | | 909 | | | | 11 | | | | (1 | ) | | | | | | | | | | | | | | | | | | | | | | $ | 156 | | | $ | 152 | | | $ | 184 | | | | 3 | | | | (17 | ) |
| Other miscellaneous and purchased product gross margin 3 | | | 15 | | | | 14 | | | | 69 | | | | 7 | | | | (80 | ) | | | | | | | | | | | | | | | | | | | | | | | | | | | | | | | | | | | | | | | | |
Gross Margin | | $ | 1,010 | | | $ | 913 | | | $ | 978 | | | | 11 | | | | (7 | ) | | | | | | | | | | | | | | | | | | | | | | $ | 159 | | | $ | 155 | | | $ | 198 | | | | 3 | | | | (22 | ) |
| 1 | Rounding differences may occur due to the use of whole dollars in per-tonne calculations. |
| 2 | Includes inter-segment ammonia sales, comprised of: net sales $101 million, cost of goods sold $42 million and 170,000 sales tonnes (2013 – net sales $106 million, cost of goods sold $51 million and 184,000 sales tonnes, 2012 – net sales $94 million, cost of goods sold $33 million and 139,000 sales tonnes). Inter-segment profits are eliminated on consolidation. |
| 3 | Comprised of third-party and inter-segment sales, including: third-party net sales $31 million less cost of goods sold $16 million (2013 – net sales $56 million less cost of goods sold $42 million, 2012 – net sales $182 million less cost of goods sold $118 million) and inter-segment net sales $6 million less cost of goods sold $6 million (2013 – net sales $33 million less cost of goods sold $33 million, 2012 – net sales $59 million less cost of goods sold $54 million). Inter-segment profits are eliminated on consolidation. |
| Note 3 | |
Nitrogen gross margin variance was attributable to:
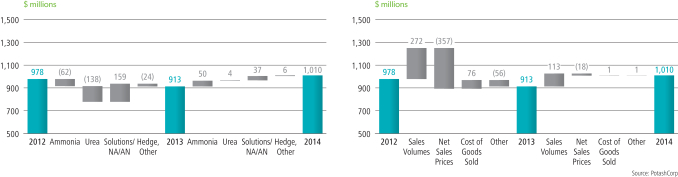
| | |
| 58 | | PotashCorp 2014 Annual Integrated Report |
Nutrients
| | | | | | | | | | | | | | | | | | | | | | | | | | | | | | | | |
| | | 2014 vs 2013 | | | 2013 vs 2012 | |
| | | | | | Change in Prices/Costs | | | | | | | | | Change in Prices/Costs | | | | |
| Dollars (millions) | | Change in
Sales Volumes | | | Net
Sales | | | Cost of
Goods Sold | | | Total | | | Change in
Sales Volumes | | | Net
Sales | | | Cost of
Goods Sold | | | Total | |
Manufactured product | | | | | | | | | | | | | | | | | | | | | | | | | | | | | | | | |
Ammonia | | $ | 93 | | | $ | (24 | ) | | $ | (19 | ) | | $ | 50 | | | $ | 44 | | | $ | (82 | ) | | $ | (24 | ) | | $ | (62 | ) |
Urea | | | (5 | ) | | | 5 | | | | 4 | | | | 4 | | | | (10 | ) | | | (107 | ) | | | (21 | ) | | | (138 | ) |
Solutions, nitric acid, ammonium nitrate | | | 35 | | | | (9 | ) | | | 11 | | | | 37 | | | | 88 | | | | (19 | ) | | | 90 | | | | 159 | |
Hedge | | | – | | | | – | | | | 5 | | | | 5 | | | | – | | | | – | | | | 32 | | | | 32 | |
Change in product mix | | | (10 | ) | | | 10 | | | | – | | | | – | | | | 150 | | | | (149 | ) | | | (1 | ) | | | – | |
Total manufactured product | | $ | 113 | | | $ | (18 | ) | | $ | 1 | | | $ | 96 | | | $ | 272 | | | $ | (357 | ) | | $ | 76 | | | $ | (9 | ) |
Other miscellaneous and purchased product | | | | | | | | | | | | | | | 1 | | | | | | | | | | | | | | | | (56 | ) |
Total | | | | | | | | | | | | | | $ | 97 | | | | | | | | | | | | | | | $ | (65 | ) |
| | | | | | | | | | | | | | | | | | | | | | | | | | | | | | | | | | | | | | | | |
| | | Sales Tonnes (thousands) | | | % Change | | | Average Net Sales Price per Tonne | | | % Change | |
| | | 2014 | | | 2013 | | | 2012 | | | 2014 | | | 2013 | | | 2014 | | | 2013 | | | 2012 | | | 2014 | | | 2013 | |
Fertilizer | | | 2,079 | | | | 1,833 | | | | 1,521 | | | | 13 | | | | 21 | | | $ | 374 | | | $ | 396 | | | $ | 485 | | | | (6 | ) | | | (18 | ) |
Industrial and Feed | | | 4,273 | | | | 4,063 | | | | 3,425 | | | | 5 | | | | 19 | | | $ | 374 | | | $ | 370 | | | $ | 417 | | | | 1 | | | | (11 | ) |
| | | | | | | | | | | | | | | | | | | | | | | | | | | | | | | | | | | | | | | | | |
| | | 6,352 | | | | 5,896 | | | | 4,946 | | | | 8 | | | | 19 | | | $ | 374 | | | $ | 377 | | | $ | 438 | | | | (1 | ) | | | (14 | ) |
| | | | | | | | | | | | | | | | | | | | | | | | | | | | | | | | | | | | | | | | | |
The most significant contributors to the change in total gross margin were as follows (direction of arrows refers to impact on gross margin):
| | | | | | |
| | | Net Sales Prices | | Sales Volumes | | Cost of Goods Sold |
2014 vs 2013 | | q Ammonia prices fell as weaker fundamentals towards the end of 2013 and beginning of 2014 were only partially offset by tighter fundamentals towards the end of 2014. | | p Ammonia volumes were up due to the availability of production at Augusta and Geismar in 2014 (both projects began producing part-way through the first half of 2013), which also led to an increase in saleable downstream products. | | q Average costs, including our hedge position, for natural gas used as feedstock in production increased 7 percent. Costs for natural gas used as feedstock in Trinidad production rose 3 percent (contract price indexed in part to Tampa ammonia prices) while our US spot costs for natural gas increased 19 percent. Including losses on our hedge position, US gas prices rose 14 percent. p The cost of goods sold variance was positive for urea and solutions, nitric acid and ammonium nitrate due mainly to the impact of costs associated with Geismar in 2013 that did not repeat in 2014. |
| | | | |
2013 vs 2012 | | q Sales prices for ammonia fell throughout 2013 due to weak phosphate demand and additional supply. q Urea prices fell due to increased global capacity and record urea exports from China. | | p Additional ammonia capacity at Augusta and Geismar led to an increase in saleable tonnes of downstream products. q Urea volumes were down as gas interruptions in Trinidad led us to divert more production to higher-margin ammonia. | | p Average costs, including our hedge position, for natural gas used as feedstock in production fell 9 percent. Costs for natural gas used as feedstock in Trinidad production declined 9 percent, while our US spot costs for natural gas rose 25 percent. Including losses on our hedge position, US gas prices declined 5 percent. p The cost of goods sold variance was positive for solutions, nitric acid and ammonium nitrate due to the impact of costs associated with Geismar in 2012 that did not repeat in 2013. q The negative costs of goods sold variance for ammonia and urea primarily reflected increased natural gas costs used as feedstock in production in the US more than offsetting declines in Trinidad. |
| | | The change in product mix produced a favorable variance of $150 million related to sales volumes and an unfavorable variance of $149 million in sales prices due to increased sales of solutions as a result of our expansion at Geismar in 2013. | |
| | |
| PotashCorp 2014 Annual Integrated Report | | 59 |
Non-Financial Performance
| | | | | | | | | | | | | | | | | | | | | | |
| | | | | |
| | | | | | | | | | | | | | % Change | |
| | | | | 2014 | | | 2013 | | | 2012 | | | 2014 | | | 2013 | |
Production | | N tonnes produced (thousands) | | | 3,170 | | | | 2,952 | | | | 2,602 | | | | 7 | | | | 13 | |
Safety | | Total site recordable injury rate | | | 0.50 | | | | 0.54 | | | | 0.44 | | | | (7 | ) | | | 23 | |
Employee | | Percentage of senior staff positions filled internally | | | 100% | | | | 100% | | | | 86% | | | | – | | | | 16 | |
Environmental | | Greenhouse gas emissions (CO2 equivalent tonnes/tonne of product) | | | 2.3 | | | | 2.4 | | | | 2.3 | | | | (4 | ) | | | 4 | |
| | | Environmental incidents | | | 6 | | | | 1 | | | | 6 | | | | 500 | | | | (83 | ) |
The most significant contributors to the change in non-financial results were as follows:
| | | | |
| | | 2014 vs 2013 | | 2013 vs 2012 |
Production | | Production was up mainly due to the availability of production at Augusta and Geismar in 2014 (both projects began producing at full ratespart-way through the first half of 2013), and improved reliability at our operations. | | The increase in production was mainly due to the restart of ammonia production at Geismar in early 2013. |
Safety | | There were no significant changes. | | The nitrogen total site recordable injury rate increased as fewer contractor hours were worked in 2013 (more hours were incurred in 2012 to complete the ammonia restart at Geismar), offsetting the reduction in recordable injuries (16 in 2013 and 19 in 2012). |
Employee | | More than 200 employees in 2014 (2013 – more than 200 employees) received leadership training. Training consisted primarily of instructor-led courses designed to enhance the PotashCorp leadership core competencies. New in-house training was offered at all sites, which focused on coaching for safety engagement. | | During the fourth quarter of 2013, we announced a workforce reduction – 21 people were affected (none in 2012) – to respond to challenging market conditions and reduce costs to enhance the global competitive position of the nitrogen segment. The full impact of our workforce reduction announced in 2013 was not reflected until 2014 due to the timing of certain severance processes. More than 200 employees in 2013 (2012 – more than 170 employees) received leadership training, an increase that was partially due to a plant optimization and efficiency course for leaders at Trinidad. |
| | |
| 60 | | PotashCorp 2014 Annual Integrated Report |
Nutrients
| | | | |
| | | 2014 vs 2013 | | 2013 vs 2012 |
Environmental | | Environmental incidents increased in 2014 mainly due to an increase in releases occurring during ammonia and urea plant start-ups. | | Environmental incidents fell, due in part to improvement initiatives targeted to find ways of reducing the company’s environmental impact, including the implementation of Reportable Quantity (RQ) prevention teams at each facility. In comparison, 2012 included extreme weather events, equipment failures and human error that resulted in a higher number of incidents. |
Nitrogen Production
(million tonnes product)
| | | | | | | | | | | | | | | | | | | | | | | | | | | | | | | | | | | | | | | | | | | | | | | | | | | | |
| | | Ammonia | | | Urea | | | Solutions, Nitric Acid, Ammonium Nitrate | | | | |
| | | Annual
Capacity | | | Production | | | Annual
Capacity | | | Production | | | Annual
Capacity | | | Production | | | | |
| | | 2014 | | | 2013 | | | 2012 | | | | 2014 | | | 2013 | | | 2012 | | | | 2014 | | | 2013 | | | 2012 | | | Employees | |
Trinidad | | | 2.2 | | | | 2.03 | | | | 1.91 | | | | 1.97 | | | | 0.7 | | | | 0.44 | | | | 0.49 | | | | 0.57 | | | | – | | | | – | | | | – | | | | – | | | | 380 | |
Augusta GA | | | 0.8 | | | | 0.80 | | | | 0.74 | | | | 0.63 | | | | 0.5 | | | | 0.32 | | | | 0.29 | | | | 0.26 | | | | 3.1 | | | | 2.42 | | | | 2.42 | | | | 2.37 | | | | 138 | |
Lima OH | | | 0.6 | | | | 0.50 | | | | 0.58 | | | | 0.57 | | | | 0.3 | | | | 0.28 | | | | 0.34 | | | | 0.33 | | | | 0.9 | | | | 0.64 | | | | 0.69 | | | | 0.69 | | | | 148 | |
Geismar LA | | | 0.5 | | | | 0.53 | | | | 0.40 | | | | – | | | | – | | | | – | | | | – | | | | – | | | | 2.4 | | | | 1.71 | | | | 1.56 | | | | 0.70 | | | | 136 | |
| | | | | | | | | | | | | | | | | | | | | | | | | | | | | | | | | | | | | | | | | | | | | | | | | | | | | |
Total | | | 4.1 | | | | 3.86 | | | | 3.63 | | | | 3.17 | | | | 1.5 | | | | 1.04 | | | | 1.12 | | | | 1.16 | | | | 6.4 | | | | 4.77 | | | | 4.67 | | | | 3.76 | | | | 802 | |
| | | | | | | | | | | | | | | | | | | | | | | | | | | | | | | | | | | | | | | | | | | | | | | | | | | | | |
Our nitrogen products can be sold as-is or upgraded to value-added products as illustrated below:

| | |
| PotashCorp 2014 Annual Integrated Report | | 61 |

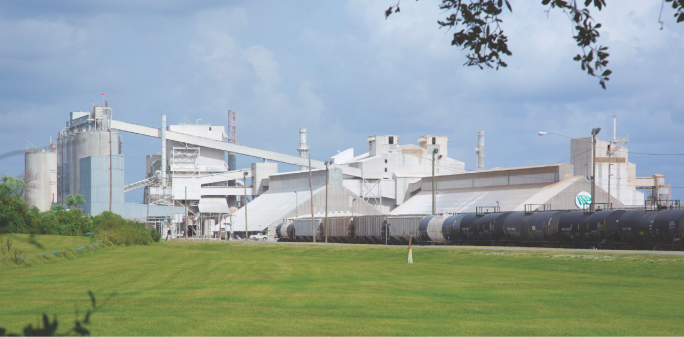
White Springs, Florida
Summary Overview

| | | | | | | | |
| | | | |
Growth Initiatives • Develop partnerships and invest in quick-payback opportunities that leverage existing capacity. | | | | Operational Flexibility • Target production toward less-volatile, higher-margin products. | | | | Advantaged Competitive Positions • Mine reserves in a sustainable, cost-effective manner. • Optimize portfolio and pursue operational reliability and efficiencies. • Improve safety and environmental performance, focusing specifically on land and water use. |
| | |
| 62 | | PotashCorp 2014 Annual Integrated Report |
Nutrients
Key Industry Highlights
| | |
 | | High-Quality, Lower-Cost Rock Is Critical to Long-Term Success |
Phosphate rock, the feedstock for all phosphate products, is geographically concentrated as China, Morocco and the US together produce 70 percent of the world’s supply. Morocco alone typically accounts for approximatelyone-third of global exports. With approximately one-third of global producers beingnon-integrated and relying on purchased rock, producers with direct access to a high-quality, lower-cost supply have a significant competitive advantage.
| | |
 | | Sulfur and Ammonia Markets Affect Profitability |
Changing prices for the raw material inputs of sulfur and ammonia, as well as the rising costs of freight, have historically resulted in production cost volatility for certain downstream phosphate products. Along with purchased rock costs ofnon-integrated producers, phosphate prices have historically reflected changes in the costs of these inputs, although there can be a time lag between the purchase of raw materials and the sale of the finished product.
| | |
 | | Changes in Global Trade Dynamics |
Increased export supply from Morocco, Saudi Arabia and China has lowered US exports of solid fertilizer products. In recent years, US producers have increased their reliance on trade with Latin America and production of specialty products.
India relies heavily on imports to meet its need for solid phosphate fertilizers since its indigenous rock supply is limited. As the largest buyer of phosphate in the world, India imports either finished products or the raw materials required to make those products. Major suppliers of solid phosphate fertilizers to India are China, Morocco and Saudi Arabia, together accounting for 80 percent of India’s total imports in 2014.
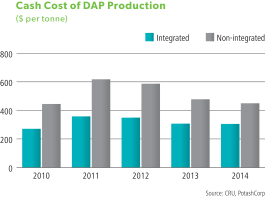
| | | | |
~33% | | | | Share of global phosphoric acid production based on purchased rock |
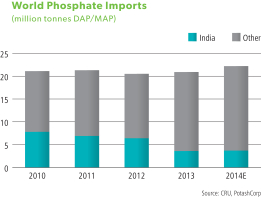
| | | | |
18% | | | | India’s percentage of total DAP/MAP trade in 2014 |
Key Phosphate Market Profile
| | | | | | | | |
Country/Region | | Growth Rate* | | DAP/MAP Production (MMT – 2014) | | DAP/MAP Imports (MMT – 2014) | | Main Crop |
China | | 1.6% | | 30.0 | | 0.3 | | Vegetables, corn, wheat |
India | | 2.6% | | 3.3 | | 3.8 | | Rice, wheat, oilseeds |
Other Asia | | 1.3% | | 1.1 | | 3.8 | | Rice, wheat, oil palm |
Latin America | | 2.2% | | 1.7 | | 6.3 | | Soybeans, corn, sugar crops |
North America | | 1.0% | | 10.0 | | 1.4 | | Corn, wheat, soybeans |
| * | 10-year CAGR for consumption (2004-2014E) |
Source: CRU, IFA, PotashCorp
| | |
| PotashCorp 2014 Annual Integrated Report | | 63 |
Segment Overview
Operations
Our phosphate operations are located in the US, with large integrated mining and processing operations in Aurora, North Carolina and White Springs, Florida and smaller processing plants in five states.
We mine substantially all of the phosphate rock we use; only at Geismar do we import rock to meet certain customers’ product requirements.
At Aurora, we have long-term permits in place which allow for decades of mining. We have a life-of-mine permit at White Springs.
Markets
Although 88 percent of the phosphoric acid produced globally goes into fertilizer, it makes up only 63 percent of our annual phosphate sales volumes.
Our sales are categorized into two categories: fertilizer, and feed and industrial. Within each category we produce a number of products, resulting in the most diversified portfolio among our peers.
North America
We sell 75 percent of our phosphate products in North America, where our proximity to customers means we typically benefit from reduced freight costs.
We compete in fertilizer markets with Agrium, Mosaic, Simplot and offshore imports primarily from China, Morocco and Russia. For industrial sales, our primary competitors are ICL, Innophos and producers from China. In feed sales we compete with Mosaic, Simplot and producers from China and Russia.
Offshore
Most of our offshore sales are made to India and Latin America. Our liquid phosphate has the most exposure to offshore markets, particularly India.
We compete primarily with Morocco’s OCP S.A. and producers from China, Russia and Saudi Arabia.
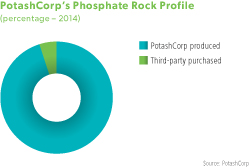
| | |
| | | |
| 95% | | PotashCorp-mined phosphate rock used in 2014 P2O5 production |
| | | |
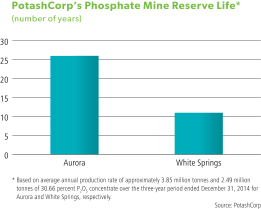
| | |
| | | |
26 years | | Current reserve life of our phosphate rock mine in Aurora |
| | | |
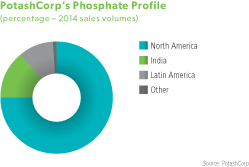
| | |
| | | |
| 75% | | Share of sales volumes sold to
North American market in 2014 |
| | | |
| | |
| 64 | | PotashCorp 2014 Annual Integrated Report |
Nutrients
How We Are Positioned

Develop partnerships and invest in quick-payback opportunities
Given the weaker margins in phosphate relative to our other businesses, we have not allocated significant capital to pursue large growth initiatives in recent years. Our focus has been on pursuing opportunities that strengthen our ability to meet our customers’ needs and generate better returns for our shareholders. In 2014, we entered into an agreement with OCP S.A. that allows us to purchase a range of dry finished phosphate products to help fulfill our North American customers’ requirements.

Target production towards less-volatile, higher-margin products
In our customer surveys, we continued to outperform competitors on quality, reliability and service. One of the main reasons we are well positioned to remain a leader in this area is our diversified product offering. We provide the widest range of products among our fertilizer peers, from specialized feed and industrial products to niche liquid fertilizers. We believe this diversity adds value not only for PotashCorp but for our customers.
Given our ability to produce such a diverse range, we strive to allocate our P2O5production towards the combination of products that provides the greatest gross margin.

Optimize P2O5 production portfolio and pursue operational efficiencies
In mid-2014, we completed the closure of one of two chemical plants at White Springs. While this change is expected to result in the reduction of approximately 215,000 tonnes of P2O5production on an annualized basis, we anticipate it will also result in improvement inper-tonne gross margin.
The phosphate business is highly competitive and we focus constantly on improving the cost position of our assets. At Aurora, our largest facility, we have initiatives underway to help lower rock mining costs by refining our mining and recovery techniques. We set a multi-year target to reduce delivered sulfur and ammonia costs to our facilities, which is expected to further enhance our competitive position in this nutrient.
Improve safety and environmental performance
We are actively pursuing ways to enhance existing safety systems and implement industry and company best practices, to improve the safety record at each of our sites and become one of the safest resource companies in the world.
When it comes to the environment, we have a particular focus on water and land at our phosphate facilities. In 2014, recycled water accounted for approximately 94 percent of the total water used and we continue to explore ways to improve water efficiency. To minimize our impact on the land, we restore two acres of wetlands for every acre disturbed at Aurora and a minimum of one acre restored per acre mined at White Springs.
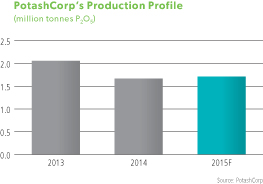
| | |
| | | |
~60% | | Capability in 2015 from our lower-cost Aurora facility |
| | | |
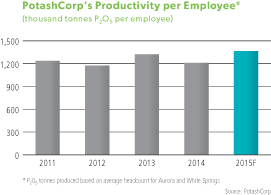
| | |
| | | |
13% | | Estimated improvement in P2O5 production per employee from 2014 |
| | | |
| | |
| PotashCorp 2014 Annual Integrated Report | | 65 |
| | |
| | Phosphate Performance |
Financial Performance
| | | | | | | | | | | | | | | | | | | | | | | | | | | | | | | | | | | | | | | | | | | | | | | | | | | | | | | | | | | | |
| | | | | | | |
| | | Dollars (millions) | | | % Change | | | Tonnes (thousands) | | | % Change | | | Average per Tonne1 | | | % Change | |
| | | 2014 | | | 2013 | | | 2012 | | | 2014 | | | 2013 | | | 2014 | | | 2013 | | | 2012 | | | 2014 | | | 2013 | | | 2014 | | | 2013 | | | 2012 | | | 2014 | | | 2013 | |
Manufactured product | | | | | | | | | | | | | | | | | | | | | | | | | | | | | | | | | | | | | | | | | | | | | | | | | | | | | | | | | | | | |
Net sales | | | | | | | | | | | | | | | | | | | | | | | | | | | | | | | | | | | | | | | | | | | | | | | | | | | | | | | | | | | | |
Fertilizer | | $ | 889 | | | $ | 1,079 | | | $ | 1,291 | | | | (18 | ) | | | (16 | ) | | | 1,987 | | | | 2,496 | | | | 2,473 | | | | (20 | ) | | | 1 | | | $ | 447 | | | $ | 433 | | | $ | 522 | | | | 3 | | | | (17 | ) |
Feed and Industrial | | | 713 | | | | 749 | | | | 778 | | | | (5 | ) | | | (4 | ) | | | 1,155 | | | | 1,184 | | | | 1,170 | | | | (2 | ) | | | 1 | | | $ | 617 | | | $ | 632 | | | $ | 665 | | | | (2 | ) | | | (5 | ) |
| | | | | | | | | | | | | | | | | | | | | | | | | | | | | | | | | | | | | | | | | | | | | | | | | | | | | | | | | | | | | |
| | | 1,602 | | | | 1,828 | | | | 2,069 | | | | (12 | ) | | | (12 | ) | | | 3,142 | | | | 3,680 | | | | 3,643 | | | | (15 | ) | | | 1 | | | $ | 510 | | | $ | 497 | | | $ | 568 | | | | 3 | | | | (13 | ) |
Cost of goods sold | | | (1,409 | ) | | | (1,527 | ) | | | (1,617 | ) | | | (8 | ) | | | (6 | ) | | | | | | | | | | | | | | | | | | | | | | $ | (448 | ) | | $ | (415 | ) | | $ | (444 | ) | | | 8 | | | | (7 | ) |
| | | | | | | | | | | | | | | | | | | | | | | | | | | | | | | | | | | | | | | | | | | | | | | | | | | | | | | | | | | | | |
Gross margin | | | 193 | | | | 301 | | | | 452 | | | | (36 | ) | | | (33 | ) | | | | | | | | | | | | | | | | | | | | | | $ | 62 | | | $ | 82 | | | $ | 124 | | | | (24 | ) | | | (34 | ) |
| Other miscellaneous and purchased product gross margin 2 | | | 9 | | | | 3 | | | | 17 | | | | 200 | | | | (82 | ) | | | | | | | | | | | | | | | | | | | | | | | | | | | | | | | | | | | | | | | | |
| | | | | | | | | | | | | | | | | | | | | | | | | | | | | | | | | | | | | | | | | | | | | | | | | | | | | | | | | | | | | |
Gross Margin | | $ | 202 | | | $ | 304 | | | $ | 469 | | | | (34 | ) | | | (35 | ) | | | | | | | | | | | | | | | | | | | | | | $ | 64 | | | $ | 83 | | | $ | 129 | | | | (23 | ) | | | (36 | ) |
| | | | | | | | | | | | | | | | | | | | | | | | | | | | | | | | | | | | | | | | | | | | | | | | | | | | | | | | | | | | | |
| 1 | Rounding differences may occur due to the use of whole dollars in per-tonne calculations. |
| 2 | Comprised of net sales of $59 million (2013 – $24 million, 2012 – $32 million) less cost of goods sold of $50 million (2013 – $21 million, 2012 – $15 million). |
| Note 3 |
Phosphate gross margin variance was attributable to:
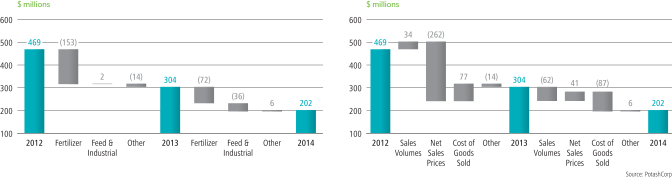
| | | | | | | | | | | | | | | | | | | | | | | | | | | | | | | | |
| | | 2014 vs 2013 | | | 2013 vs 2012 | |
| | | | | | Change in Prices/Costs | | | | | | | | | Change in Prices/Costs | | | | |
| Dollars (millions) | | Change in
Sales Volumes | | | Net
Sales | | | Cost of
Goods Sold | | | Total | | | Change in
Sales Volumes | | | Net
Sales | | | Cost of
Goods Sold | | | Total | |
Manufactured product | | | | | | | | | | | | | | | | | | | | | | | | | | | | | | | | |
Fertilizer | | $ | (30 | ) | | $ | 31 | | | $ | (73 | ) | | $ | (72 | ) | | $ | 27 | | | $ | (222 | ) | | $ | 42 | | | $ | (153 | ) |
Feed and Industrial | | | (4 | ) | | | (18 | ) | | | (14 | ) | | | (36 | ) | | | 6 | | | | (39 | ) | | | 35 | | | | 2 | |
Change in product mix | | | (28 | ) | | | 28 | | | | – | | | | – | | | | 1 | | | | (1 | ) | | | – | | | | – | |
Total manufactured product | | $ | (62 | ) | | $ | 41 | | | $ | (87 | ) | | $ | (108 | ) | | $ | 34 | | | $ | (262 | ) | | $ | 77 | | | $ | (151 | ) |
Other miscellaneous and purchased product | | | | | | | | | | | | | | | 6 | | | | | | | | | | | | | | | | (14 | ) |
Total | | | | | | | | | | | | | | $ | (102 | ) | | | | | | | | | | | | | | $ | (165 | ) |
| | |
| 66 | | PotashCorp 2014 Annual Integrated Report |
Nutrients
The most significant contributors to the change in total gross margin were as follows (direction of arrows refers to impact on gross margin):
| | | | | | |
| | | Net Sales Prices | | Sales Volumes | | Cost of Goods Sold |
2014 vs 2013 | | p Fertilizer prices increased primarily as a result of improved global demand and supply disruptions in 2014. q Industrial prices were down due to certain contracts being tied to input costs on a lagging basis. | | q Volumes were limited as weather-related production issues, logistical issues and the closure of Suwannee River chemical facility in 2014 reduced production across all
our facilities. | | q Depreciation was higher due to accelerated depreciation related to fertilizer resulting from operational changes announced in late 2013. q Unfavorable adjustments to our asset retirement obligations occurred in 2014 (due to a decrease in the relevant discount rates) while favorable adjustments occurred in 2013 (due to an increase in the relevant discount rates). p Sulfur costs were down 13 percent, reducing our cost of goods sold. q Rock costs were higher as a result of certain mining conditions in Aurora. |
| | | The change in product mix produced an unfavorable variance of $28 million related to sales volumes and a favorable variance of $28 million in sales prices
due to sales volume declines in fertilizer, for which prices are lower than feed
and industrial. | |
2013 vs 2012 | | q Our average realized phosphate price was down as a result of reduced global fertilizer demand and start-up of new capacity. | | There were no significant changes. | | p Sulfur costs were lower (down 26 percent). q Costs associated with our workforce reduction at Aurora, White Springs and our feed plants were incurred in 2013. In 2012, costs were associated with our Aurora workforce reduction. p Solid fertilizer costs reflected lower ammonia costs (down 10 percent). |
| | | | | | |
| | |
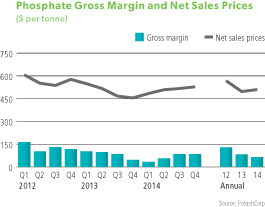 | | 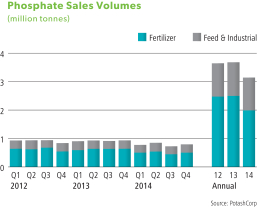
|
| | |
| PotashCorp 2014 Annual Integrated Report | | 67 |
Non-Financial Performance
| | | | | | | | | | | | | | | | | | | | | | |
| | | | | | | | | | | | | | % Change | |
| | | | | 2014 | | | 2013 | | | 2012 | | | 2014 | | | 2013 | |
Production and reserves | | P2O5 tonnes produced (thousands) | | | 1,671 | | | | 2,058 | | | | 1,983 | | | | (19 | ) | | | 4 | |
| | P2O5 operating rate percentage | | | 76% | | | | 87% | | | | 84% | | | | (13 | ) | | | 4 | |
Safety | | Total site recordable injury rate | | | 0.88 | | | | 1.07 | | | | 0.59 | | | | (18 | ) | | | 81 | |
Employee | | Percentage of senior staff positions filled internally | | | 81% | | | | 83% | | | | 63% | | | | (2 | ) | | | 32 | |
Environmental | | Water usage (m3 per tonne of product ) | | | 26 | | | | 26 | | | | 33 | | | | – | | | | (21 | ) |
| | Recycled water used in operations (percentage) | | | 95% | | | | 95% | | | | 94% | | | | – | | | | 1 | |
| | Environmental incidents | | | 4 | | | | 3 | | | | 5 | | | | 33 | | | | (40 | ) |
| | | | | | | | | | | | | | | | | | | | | | | |
The most significant contributors to the change in non-financial results were as follows:
| | | | |
| | | 2014 vs 2013 | | 2013 vs 2012 |
Production | | Phosphate production fell due to the closure of Suwannee River chemical facility in 2014. As well, production was limited early in 2014 due to weather-related production issues. | | There were no significant changes. |
Safety | | Total site recordable injury rate decreased mainly due to lower recordable injury rates for employees. We experienced significantly fewer recordable injuries in 2014, although this was partially offset by fewer hours worked. | | We experienced increased recordable injury rates at Aurora and White Springs. Both sites implemented steps intended to reduce the rates. |
Employee | | More than 180 employees in 2014 (2013 – more than 130 employees) received leadership training. Training consisted primarily of instructor-led courses designed to enhance the PotashCorp leadership core competencies. New in-house training was offered at most sites, focusing on coaching for safety engagement. | | During the fourth quarter of 2013, we announced a workforce reduction – 441 people at White Springs, Aurora and our feed plants were affected (132 people in 2012 at Aurora) – to respond to challenging market conditions and to reduce costs to enhance the company’s global competitive position. The full impact of this workforce reduction was not reflected until 2014 due to the timing of certain severance processes. More than 130 employees in 2013 (2012 – more than 230 employees) received leadership training. |
Environmental | | Environmental incidents increased by one release in 2014; two of the four were due to process design issues. | | Water usage in our phosphate operations decreased, primarily due to more water recycling at White Springs (less rainwater to recycle in 2012) and efforts to conserve water. Environmental incidents fell year-over-year as 2012 included four incidents occurring during or immediately following extreme weather events. |
| | |
| 68 | | PotashCorp 2014 Annual Integrated Report |
Nutrients
Phosphate Rock Reserves1
(millions of estimated tonnes – stated average grade 30.66% P2O5)
| | | | | | | | | | | | | | |
| As of December 31, 2014 | | Proven | | | Probable | | | Total | | | Average Estimated Years
of Remaining Mine Life |
Aurora2 | | | 91.3 | | | | 7.8 | | | | 99.1 | | | 26 |
White Springs 3 | | | 27.9 | | | | – | | | | 27.9 | | | 11 |
| | | | | | | | | | | | | | | |
Total | | | 119.2 | | | | 7.8 | | | | 127.0 | 4 | | |
| | | | | | | | | | | | | | | |
| 1 | For a more complete discussion of important information related to our phosphate reserves, see “Phosphate Operations – Reserves” in ourForm 10-K for the year ended December 31, 2014. |
| 2 | The reserves set forth above for Aurora would permit mining to continue at annual production rates for about 26 years, based on an average annual production rate of approximately 3.85 million tonnes of 30.66% concentrate over the three-year period ended December 31, 2014. If mineral deposits covered by the permit at Aurora, and now reclassified as resources, are included, the mine life at Aurora would be about 44 years at such rate of production. Mineral resources that are not mineral reserves do not have demonstrated economic viability. |
| 3 | The reserves set forth above for White Springs would have permitted mining to continue at annual production rates for about 11 years, based on an average annual production rate of approximately 2.49 million tonnes of 30.66% concentrate over the three-year period ended December 31, 2014. With the closure of the Suwannee River chemical plant, we forecast a mine life of approximately 15 years based on an average forecasted annual production rate of approximately 1.86 million tonnes of 30.66% concentrate. |
| 4 | Includes 55.4 million tonnes proven reserves and 6.8 million tonnes probable reserves to be permitted. |
| | Page 9 – Phosphate Operations – Reserves |
Phosphate Production
(million tonnes product)
| | | | | | | | | | | | | | | | | | | | | | | | | | | | | | | | | | | | | | | | | | | | | | | | | | | | |
| | | Aurora | | | | | White Springs | | | | | Geismar | |
| | | Annual Capacity | | | Production | | Annual Capacity | | | Production | | Annual Capacity | | | Production | |
| | | | 2014 | | | 2013 | | | 2012 | | | | | | 2014 | | | 2013 | | | 2012 | | | | | | 2014 | | | 2013 | | | 2012 | |
Liquids | | | 2.7 | | | | 1.97 | | | | 2.19 | | | | 1.99 | | | | | | 0.7 | 1 | | | 0.61 | | | | 0.75 | | | | 0.76 | | | | | | 0.3 | | | | 0.20 | | | | 0.20 | | | | 0.21 | |
Solids | | | 1.2 | | | | 0.67 | | | | 0.70 | | | | 0.65 | | | | | | – | | | | 0.21 | | | | 0.53 | | | | 0.55 | | | | | | – | | | | – | | | | – | | | | – | |
| | | | | | | | | | | | | | | | | | | | | | | | | | | | | | | | | | | | | | | | | | | | | | | | | | | | | |
| 1 | Represents annual superphosphoric acid capacity. |
Rock and Acid Production
(million tonnes)
| | | | | | | | | | | | | | | | | | | | | | | | | | | | | | | | | | | | | | | | |
| | | Phosphate Rock | | | | | Phosphoric Acid (P2O5) | | | | | | |
| | | Annual
Capacity | | | Production | | Annual Capacity | | | Production | | | |
| | | | 2014 | | | 2013 | | | 2012 | | | | | | 2014 | | | 2013 | | | 2012 | | | | | Employees | |
Aurora NC | | | 6.0 | | | | 4.35 | | | | 4.90 | | | | 4.09 | | | | | | 1.2 | | | | 1.00 | | | | 1.13 | | | | 1.03 | | | | | | 786 | |
White Springs FL | | | 3.6 | | | | 2.00 | | | | 2.84 | | | | 2.73 | | | | | | 0.5 | | | | 0.55 | | | | 0.81 | | | | 0.83 | | | | | | 451 | |
Geismar LA | | | – | | | | – | | | | – | | | | – | | | | | | 0.2 | | | | 0.12 | | | | 0.12 | | | | 0.12 | | | | | | 32 | |
| | | | | | | | | | | | | | | | | | | | | | | | | | | | | | | | | | | | | | | | | |
Total | | | 9.6 | | | | 6.35 | | | | 7.74 | | | | 6.82 | | | | | | 1.9 | | | | 1.67 | | | | 2.06 | | | | 1.98 | | | | | | 1,269 | |
| | | | | | | | | | | | | | | | | | | | | | | | | | | | | | | | | | | | | | | | | |
Purified Acid and Phosphate Feed Production
(million tonnes)
| | | | | | | | | | | | | | | | | | | | | | | | |
| | | Annual Capacity | | | | | Production | | Employees | |
| | | | | | 2014 | | | 2013 | | | 2012 | | | | |
Purified acid (P2O5) | | | 0.3 | | | | | | 0.24 | | | | 0.24 | | | | 0.24 | | | | | | – | |
Phosphate feed production | | | 0.8 | | | | | | 0.38 | | | | 0.39 | | | | 0.37 | | | | | | 99 | 1 |
| | | | | | | | | | | | | | | | | | | | | | | | | |
| 1 | 19 of these employees are located at Aurora NC. |
In addition to the above employees, there were 16 employees located at Cincinnati OH and one employee located at Newgulf TX.
| | |
| PotashCorp 2014 Annual Integrated Report | | 69 |
Other Expenses and Income
| | | | | | | | | | | | | | | | | | | | |
| | | | | | | | | | | | % Change | |
| Dollars (millions), except percentage amounts | | 2014 | | | 2013 | | | 2012 | | | 2014 | | | 2013 | |
Selling and administrative expenses | | $ | (245 | ) | | $ | (231 | ) | | $ | (219 | ) | | | 6 | | | | 5 | |
Provincial mining and other taxes | | | (257 | ) | | | (194 | ) | | | (180 | ) | | | 32 | | | | 8 | |
Share of earnings of equity-accounted investees | | | 102 | | | | 195 | | | | 278 | | | | (48 | ) | | | (30 | ) |
Dividend income | | | 117 | | | | 92 | | | | 144 | | | | 27 | | | | (36 | ) |
Impairment of available-for-sale investment | | | (38 | ) | | | – | | | | (341 | ) | | | n/m | | | | n/m | |
Other income (expenses) | | | 22 | | | | (36 | ) | | | (73 | ) | | | n/m | | | | (51 | ) |
Finance costs | | | (184 | ) | | | (144 | ) | | | (114 | ) | | | 28 | | | | 26 | |
Income taxes | | | (628 | ) | | | (687 | ) | | | (826 | ) | | | (9 | ) | | | (17 | ) |
| | | | | | | | | | | | | | | | | | | | | |
Performance
The most significant contributors to the change in other expenses and income results were as follows:
| | | | |
| | | 2014 vs 2013 | | 2013 vs 2012 |
| Provincial Mining and Other Taxes | | Under Saskatchewan provincial legislation, the company is subject to resource taxes including the potash production tax and the resource surcharge. Provincial mining and other taxes are comprised mainly of these two resource taxes. The potash production tax expense increased primarily due to reduced capital spending, which is deductible in computing the tax due. | | The potash production tax expense increased due to reduced capital spending and a legislated tax increase partially offset by decreased potash sales revenue. The resource surcharge decreased as a result of lower potash sales revenue during 2013. |
| Earnings ofEquity-Accounted Investees | | Share of earnings of equity-accounted investees pertains primarily to SQM and APC. Lower earnings were mainly due to lower earnings for SQM (part of which is due to a Chilean income tax rate increase) and APC over that period. | | Our share of earnings of equity-accounted investees was lower in 2013 due to decreased earnings at SQM and APC. |
| Dividend Income | | Dividend income was up in 2014 as we received a special dividend of $69 million from ICL (none in 2013), although ordinary dividends from ICL were lower. | | ICL paid lower dividends in 2013 than in 2012. |
| Available-for-Sale Investment | | A non-tax deductible impairment loss of $38 million was recorded in net income on our investment in Sinofert during 2014. No such losses were recognized in 2013.  Note 14 Note 14
| | In 2012, we concluded there was objective evidence that our available-for-sale investment in Sinofert was impaired due to the significance by which fair value was below cost. As a result, we recognized a non-tax deductible impairment loss of $341 million in net income in 2012. No such losses were recognized in 2013. |
| | |
| 70 | | PotashCorp 2014 Annual Integrated Report |
Financial Overview
| | | | |
| | | 2014 vs 2013 | | 2013 vs 2012 |
| Finance Costs | | Finance costs were higher as a result of lower capitalized interest due to reduced capital spending as our potash expansion program nears completion. | | Finance costs were higher as a result of lower capitalized interest. |
| | |
| | | 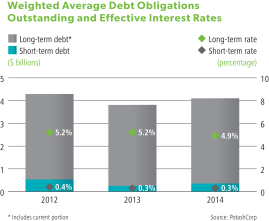
|
Income Taxes | | Income taxes decreased due primarily to lower income before taxes and discrete tax adjustments partially offset by an increase in the actual effective tax rate on ordinary earnings. Effective tax rates and discrete items are shown in the table on the following page. Significant items to note include the following: • The actual effective tax rate on ordinary earnings for 2014 increased compared to the same period last year due to different income weightings between jurisdictions. • In 2014, a deferred tax expense of $11 million was recorded as a result of a Chilean income tax rate increase. • In 2013, a tax expense of $8 million was recorded to adjust the 2012 income tax provision to the tax returns filed for that year. • In 2013, a net tax expense of $13 million was recorded to adjust the deferred tax asset related to foreign tax loss carryforwards to the amount expected to be realized upon utilization. • In 2013, a deferred tax expense of $11 million was recorded as a result of a Canadian income tax rate increase. • In 2013, a deferred tax expense of $10 million was recorded as a result of a planned distribution of earnings from a foreign jurisdiction. | | Income taxes decreased due to lower income before taxes. Effective tax rates and discrete items are shown in the table on the following page. Significant items to note include the following: • In 2013, a tax expense of $8 million was recorded to adjust the 2012 income tax provision to the tax returns filed for that year. • In 2013, a net tax expense of $13 million was recorded to adjust the deferred tax asset related to foreign tax loss carryforwards to the amount expected to be realized upon utilization. • In 2013, a deferred tax expense of $11 million was recorded as a result of a Canadian income tax rate increase. • In 2013, a deferred tax expense of $10 million was recorded as a result of a planned distribution of earnings from a foreign jurisdiction. • In 2012, a tax expense of $17 million was recorded to adjust the 2011 income tax provision to the tax returns filed for that year. • In 2012, a non-tax deductible impairment of the company’s available-for-sale investment in Sinofert was recorded. This increased the 2012 actual effective tax rate, including discrete items, by 3 percent. |
| | |
| PotashCorp 2014 Annual Integrated Report | | 71 |
| | | | |
| | | 2014 vs 2013 | | 2013 vs 2012 |
| Income Taxes continued | | In 2014, 58 percent of the effective tax rate on the year’s ordinary earnings pertained to current income taxes and 42 percent related to deferred income taxes (2013 – 50 percent current and 50 percent deferred). The increase in the current portion was largely due to lower tax depreciation. | | In 2013, 50 percent of the effective tax rate on the year’s ordinary earnings pertained to current income taxes and 50 percent related to deferred income taxes (2012 – 57 percent current and 43 percent deferred). The decrease in the current portion was largely due to decreased income before taxes. |
| | | | | | | | | | | | | | | | |
| | Effective Tax Rates and Discrete Items Dollars (millions), except percentage amounts | | | | | | | | | | | | |
| | | | | 2014 | | | 2013 | | | 2012 | |
| | Actual effective tax rate on ordinary earnings | | | 28% | | | | 26% | | | | 25% | |
| | Actual effective tax rate including discrete items | | | 29% | | | | 28% | | | | 28% | |
| | | Discrete tax adjustments that impacted the rate | | $ | (20 | ) | | $ | (55 | ) | | $ | (27 | ) |
Impact of Foreign Exchange
We incur costs and expenses in foreign currencies other than the US dollar, which vary from year-to-year. In Canada, our revenue is earned and received in US dollars while the cost base for our potash operations is predominantly in Canadian dollars. We are also affected by the period-end change in foreign exchange rate on the translation of our monetary net assets and liabilities, and on treasury activities.
Impact on Net Income
Dollars (millions), except per-share amounts
| | | | | | | | |
| | | Increase in Net Income | |
| | | 2014 | | | 2013 | |
Foreign exchange impact on operating costs before income taxes 1 | | $ | 46 | | | $ | 41 | |
Foreign exchange impact on conversion of balance sheet and treasury activities before income taxes | | | 8 | | | | 18 | |
Net income increase after income taxes | | | 39 | | | | 44 | |
Diluted net income per share increase after income taxes | | | 0.04 | | | | 0.05 | |
| | | | | | | | | |
| 1 | Assumes the 2014 exchange rate had remained at the 2013 year-end rate of 1.0636 (compared to 1.1601 at December 31, 2014), and the 2013 exchange rate had remained at the 2012 year-end rate of 0.9949. |
| | |
| 72 | | PotashCorp 2014 Annual Integrated Report |
Financial Overview
Quarterly Results
Quarterly Results and Review of Fourth-Quarter Performance
(in millions of US dollars except as otherwise noted)
| | | | | | | | | | | | | | | | | | | | | | | | | | | | | | | | | | | | | | | | |
| | | 2014 | | | 2013 | |
| | | Q1 | | | Q2 | | | Q3 | | | Q4 | | | Total | | | Q1 | | | Q2 | | | Q3 | | | Q4 | | | Total | |
Financial Results | | | | | | | | | | | | | | | | | | | | | | | | | | | | | | | | | | | | | | | | |
Sales | | $ | 1,680 | | | $ | 1,892 | | | $ | 1,641 | | | $ | 1,902 | | | $ | 7,115 | | | $ | 2,100 | | | $ | 2,144 | | | $ | 1,520 | | | $ | 1,541 | | | $ | 7,305 | |
Less: Freight, transportation and distribution | | | (166 | ) | | | (158 | ) | | | (141 | ) | | | (144 | ) | | | (609 | ) | | | (149 | ) | | | (147 | ) | | | (139 | ) | | | (137 | ) | | | (572 | ) |
Cost of goods sold | | | (949 | ) | | | (987 | ) | | | (911 | ) | | | (1,012 | ) | | | (3,859 | ) | | | (1,084 | ) | | | (1,018 | ) | | | (897 | ) | | | (944 | ) | | | (3,943 | ) |
Gross margin | | | 565 | | | | 747 | | | | 589 | | | | 746 | | | | 2,647 | | | | 867 | | | | 979 | | | | 484 | | | | 460 | | | | 2,790 | |
Operating income | | | 531 | | | | 686 | | | | 520 | | | | 611 | | | | 2,348 | | | | 817 | | | | 927 | | | | 505 | | | | 367 | | | | 2,616 | |
Net income | | | 340 | | | | 472 | | | | 317 | | | | 407 | | | | 1,536 | | | | 556 | | | | 643 | | | | 356 | | | | 230 | | | | 1,785 | |
Other comprehensive income (loss) | | | 57 | | | | (6 | ) | | | (229 | ) | | | (101 | ) | | | (279 | ) | | | 197 | | | | (500 | ) | | | (258 | ) | | | (1 | ) | | | (562 | ) |
Net income per share 1 | | | 0.40 | | | | 0.56 | | | | 0.38 | | | | 0.49 | | | | 1.82 | | | | 0.63 | | | | 0.73 | | | | 0.41 | | | | 0.26 | | | | 2.04 | |
Cash provided by operating activities | | | 539 | | | | 788 | | | | 574 | | | | 713 | | | | 2,614 | | | | 738 | | | | 1,202 | | | | 616 | | | | 656 | | | | 3,212 | |
Non-Financial Results | | | | | | | | | | | | | | | | | | | | | | | | | | | | | | | | | | | | | | | | |
Production (KCl tonnes – thousands) | | | 2,395 | | | | 2,321 | | | | 1,453 | | | | 2,557 | | | | 8,726 | | | | 2,025 | | | | 2,677 | | | | 1,150 | | | | 1,940 | | | | 7,792 | |
Production (N tonnes – thousands) | | | 833 | | | | 830 | | | | 787 | | | | 720 | | | | 3,170 | | | | 723 | | | | 726 | | | | 705 | | | | 798 | | | | 2,952 | |
Production (P2O5 tonnes – thousands) | | | 369 | | | | 459 | | | | 431 | | | | 412 | | | | 1,671 | | | | 499 | | | | 521 | | | | 533 | | | | 505 | | | | 2,058 | |
PotashCorp’s total shareholder return percentage | | | 11 | | | | 6 | | | | (8 | ) | | | 3 | | | | 12 | | | | (3 | ) | | | (2 | ) | | | (17 | ) | | | 6 | | | | (16 | ) |
Product tonnes involved in customer
complaints (thousands) | | | 13 | | | | 2 | | | | 9 | | | | 39 | | | | 63 | | | | 8 | | | | 4 | | | | 4 | | | | 27 | | | | 43 | |
Taxes and royalties | | $ | 170 | | | $ | 199 | | | $ | 190 | | | $ | 156 | | | $ | 715 | | | $ | 200 | | | $ | 201 | | | $ | 83 | | | $ | 84 | | | $ | 568 | |
Percentage of senior staff positions filled internally | | | 100 | | | | 77 | | | | 73 | | | | 38 | | | | 78 | | | | 73 | | | | 58 | | | | 84 | | | | 90 | | | | 79 | |
Total site recordable injury rate | | | 1.06 | | | | 1.27 | | | | 1.32 | | | | 0.66 | | | | 1.01 | | | | 0.90 | | | | 1.10 | | | | 1.35 | | | | 0.86 | | | | 1.06 | |
Environmental incidents | | | 5 | | | | 6 | | | | 8 | | | | 5 | | | | 24 | | | | 7 | | | | 3 | | | | 3 | | | | 4 | | | | 17 | |
| | | | | | | | | | | | | | | | | | | | | | | | | | | | | | | | | | | | | | | | | |
| 1 | Net income per share for each quarter has been computed based on the weighted average number of shares issued and outstanding during the respective quarter; therefore, quarterly amounts may not add to the annual total. Per-share calculations are based on dollar and share amounts each rounded to the nearest thousand. |
Certain aspects of our business can be impacted by seasonal factors. Fertilizers are sold primarily for spring and fall application in both Northern and Southern Hemispheres. However, planting conditions and the timing of customer purchases will vary each year, and fertilizer sales can be expected to shift from one quarter to another. Most feed and industrial sales are by contract and are more evenly distributed throughout the year.
Highlights of our 2014 fourth quarter compared to the same quarter in 2013 include (direction of arrows refers to impact on comprehensive income):
| p | | The combination of increased sales volumes, lower costs and slightly higher prices raised our 2014 potash gross margin. North American and offshore price improvements realized were largely offset by a greater proportion of sales to lower-priced markets resulting in our average realized price staying relatively flat with 2013. 2014 sales volumes reached a record with offshore sales volumes representing the largest increase compared to 2013 on improved demand across all key markets. The majority of Canpotex shipments in 2014 were to Other Asian countries (38 percent) and China (24 percent), while Latin America and India accounted for 19 percent and 12 percent, respectively. In North America, the need to secure product to meet healthy fall demand resulted in historically strong fourth-quarter sales volumes, consistent with levels in 2013 when a similar dynamic took hold. Efficiencies from our operational and workforce realignment and a weaker Canadian dollar contributed to significantly lower cost of goods sold in 2014 although 2013 results included severance-related costs which did not recur in 2014. |
| p | | In nitrogen, higher prices helped raise gross margin for the quarter well above the same period in 2013. With strong market fundamentals supporting key benchmark prices at higher levels, our average realized price for the fourth quarter was up relative to the same period in 2013. The most significant contributor was the price of ammonia. Sales volumes were relatively flat compared with 2013 as an extended maintenance turnaround at our Lima facility and greater natural gas-related curtailments in Trinidad limited our ability to sell more tonnes. Downtime at Lima and higher natural gas costs were the main drivers of higher cost of goods sold for 2014. |
| p | | In phosphate, gross margin surpassed 2013 due mainly to our higher average realized phosphate price. The primary drivers were improved pricing for liquid fertilizers and the allocation of a greater proportion of our production to higher-netback products. With fewer tonnes of production available, our sales volumes trailed 2013. Cost of goods sold exceeded 2013, largely due to reduced production and increased input costs for ammonia and sulfur. Totals in 2013 included severance-related costs. |
| | |
| PotashCorp 2014 Annual Integrated Report | | 73 |
| p | | The actual effective tax rate, including discrete items, was 29 percent (2013 – 30 percent). The decrease was due to lower discrete tax adjustments quarter-over-quarter ($1 million recovery in 2014 compared to $18 million expense in 2013) partially offset by a different income weighting between jurisdictions. |
| q | | Other comprehensive loss in 2014 was mainly the result of a net actuarial loss resulting from a remeasurement of our defined benefit plans, partially offset by an increase in the fair value of our investments in ICL and Sinofert. Other comprehensive loss in 2013 was mainly the result of a decrease in the fair value of our investments in ICL and Sinofert, partially offset by a net actuarial gain resulting from a remeasurement of our defined benefit plans. |
| p | | Costs of $60 million were incurred in 2013 as a result of the announced workforce reduction. No such costs were incurred in 2014. |
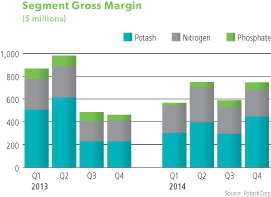
| | | | | | | | | | | | | | | | | | | | | | | | |
| | | Three Months Ended December 31 | |
| | | Sales Tonnes (thousands) | | | Average Net Sales Price per MT | |
| | | 2014 | | | 2013 | | | % Change | | | 2014 | | | 2013 | | | % Change | |
Potash | | | | | | | | | | | | | | | | | | | | | | | | |
Manufactured Product | | | | | | | | | | | | | | | | | | | | | | | | |
North America | | | 829 | | | | 836 | | | | (1 | ) | | $ | 358 | | | $ | 343 | | | | 4 | |
Offshore | | | 1,671 | | | | 929 | | | | 80 | | | $ | 246 | | | $ | 227 | | | | 8 | |
| | | | | | | | | | | | | | | | | | | | | | | | | |
Manufactured Product | | | 2,500 | | | | 1,765 | | | | 42 | | | $ | 284 | | | $ | 282 | | | | 1 | |
| | | | | | | | | | | | | | | | | | | | | | | | | |
Nitrogen | | | | | | | | | | | | | | | | | | | | | | | | |
Manufactured Product | | | | | | | | | | | | | | | | | | | | | | | | |
Ammonia | | | 652 | | | | 543 | | | | 20 | | | $ | 590 | | | $ | 449 | | | | 31 | |
Urea | | | 195 | | | | 270 | | | | (28 | ) | | $ | 384 | | | $ | 356 | | | | 8 | |
Solutions, nitric acid, ammonium nitrate | | | 664 | | | | 685 | | | | (3 | ) | | $ | 231 | | | $ | 218 | | | | 6 | |
| | | | | | | | | | | | | | | | | | | | | | | | | |
Manufactured Product | | | 1,511 | | | | 1,498 | | | | 1 | | | $ | 405 | | | $ | 326 | | | | 24 | |
| | | | | | | | | | | | | | | | | | | | | | | | | |
Phosphate | | | | | | | | | | | | | | | | | | | | | | | | |
Manufactured Product | | | | | | | | | | | | | | | | | | | | | | | | |
Fertilizer | | | 501 | | | | 637 | | | | (21 | ) | | $ | 465 | | | $ | 383 | | | | 21 | |
Feed and Industrial | | | 293 | | | | 297 | | | | (1 | ) | | $ | 636 | | | $ | 608 | | | | 5 | |
| | | | | | | | | | | | | | | | | | | | | | | | | |
Manufactured Product | | | 794 | | | | 934 | | | | (15 | ) | | $ | 528 | | | $ | 455 | | | | 16 | |
| | | | | | | | | | | | | | | | | | | | | | | | | |
| | |
| 74 | | PotashCorp 2014 Annual Integrated Report |
Financial Overview
Financial Condition Review
Statement of Financial Position Analysis
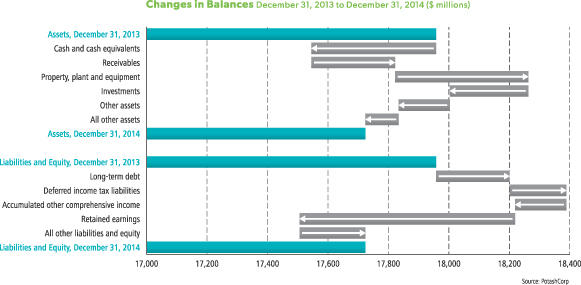
As of December 31, 2014, total assets decreased 1 percent while total liabilities increased 7 percent and total equity fell 9 percent compared to December 31, 2013. The most significant contributors to the changes in our statements of financial position were as follows (direction of arrows refers to increase or decrease):
| | |
| Assets | | Liabilities |
p Property, plant and equipment increased primarily due to our previously announced potash and nitrogen capacity expansions. p Receivables increased mainly due to an increase in trade accounts related to higher sales in the fourth quarter of 2014 compared to 2013. q Available-for-sale investments were mainly impacted by the lower fair value of our investment in ICL. | | p Long-term debt was higher as a result of the issuance of $750 million in senior notes in the first quarter of 2014, partially offset by the redemption of $500 million of our senior notes in the second quarter of 2014. |
| Equity | | |
| | |
q Equity was mainly impacted by net income, dividends declared, common shares repurchased for cancellation during 2014 and other comprehensive loss. Statements of Changes in Equity | | |
As at December 31, 2014, $127 million (2013 – $480 million) of our cash and cash equivalents was held in certain foreign subsidiaries. There are no current plans to repatriate the funds at December 31, 2014 in a taxable manner. A net repatriation of funds totaling $454 million was completed in 2014.
| | |
| PotashCorp 2014 Annual Integrated Report | | 75 |
Liquidity and Capital Resources
The following section explains how we manage our cash and capital resources to carry out our strategy and deliver results.
Liquidity risk arises from our general funding needs and in the management of our assets, liabilities and capital structure. We manage liquidity risk to maintain sufficient liquid financial resources to fund our financial position and meet our commitments and obligations in a cost-effective manner. Liquidity needs can be met through a variety of sources, including cash generated from operations, drawdowns under our revolving credit facility, issuances of commercial paper and short-term borrowings under our line of credit. Our primary uses of funds are operational expenses, sustaining and opportunity capital spending, intercorporate investments, dividends, interest and principal payments on our debt securities and share repurchases.
Cash Requirements
| | |
The following aggregated information about our contractual obligations and other commitments summarizes certain of our liquidity and capital resource requirements. The information presented in the table below does not include obligations that have original maturities of less than one year or planned (but not legally committed) capital expenditures. | | 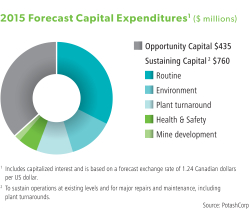 |
Contractual Obligations and Other Commitments
Dollars (millions) at December 31, 2014
| | | | | | | | | | | | | | | | | | | | | | |
| | | | | Payments Due by Period | |
| | | | | Total | | | Within 1 Year | | | 1 to 3 Years | | | 3 to 5 Years | | | Over 5 Years | |
Long-term debt obligations 1 | | Note 20 | | $ | 3,756 | | | $ | 500 | | | $ | 506 | | | $ | 500 | | | $ | 2,250 | |
Estimated interest payments on long-term debt obligations | | | | | 1,997 | | | | 179 | | | | 320 | | | | 269 | | | | 1,229 | |
Operating leases | | Note 27 | | | 452 | | | | 90 | | | | 121 | | | | 78 | | | | 163 | |
Purchase commitments | | Note 27 | | | 955 | | | | 436 | | | | 425 | | | | 94 | | | | – | |
Capital commitments | | Note 27 | | | 30 | | | | 30 | | | | – | | | | – | | | | – | |
Other commitments | | Note 27 | | | 173 | | | | 43 | | | | 64 | | | | 28 | | | | 38 | |
Asset retirement obligations and environmental costs 2 | | Note 22 | | | 641 | | | | 52 | | | | 118 | | | | 127 | | | | 344 | |
Other long-term liabilities 3 | | Notes 8, 19, 21 | | | 3,024 | | | | 97 | | | | 177 | | | | 96 | | | | 2,654 | |
| | | | | | | | | | | | | | | | | | | | | | | |
Total | | | | $ | 11,028 | | | $ | 1,427 | | | $ | 1,731 | | | $ | 1,192 | | | $ | 6,678 | |
| | | | | | | | | | | | | | | | | | | | | | | |
| 1 | Long-term debt consists of $3,750 million of senior notes that were issued under US shelf registration statements and a net of $6 million under back-to-back loan arrangements. The estimated interest payments on long-term debt in the above table include our cumulative scheduled interest payments on fixed and variable rate long-term debt. Interest on variable rate debt is based on interest rates prevailing at December 31, 2014. |
| 2 | Commitments associated with our asset retirement obligations are expected to occur principally over the next 85 years for phosphate (with the majority taking place over the next 35 years) and over a longer period for potash. Environmental costs consist of restoration obligations, which are expected to occur through 2031. |
| 3 | Other long-term liabilities consist primarily of pension and other post-retirement benefits, derivative instruments, income taxes and deferred income taxes. Deferred income tax liabilities may vary according to changes in tax laws, tax rates and the operating results of the company. Since it is impractical to determine whether there will be a cash impact in any particular year, all deferred income tax liabilities have been reflected as other long-term liabilities in the Over 5 Years category. |
| | |
| 76 | | PotashCorp 2014 Annual Integrated Report |
Financial Overview
Sources and Uses of Cash
The company’s cash flows from operating, investing and financing activities are summarized in the following table:
| | | | | | | | | | | | | | | | | | | | |
| | | | | | | | | | | | % Change | |
| Dollars (millions), except percentage amounts | | 2014 | | | 2013 | | | 2012 | | | 2014 | | | 2013 | |
Cash provided by operating activities | | $ | 2,614 | | | $ | 3,212 | | | $ | 3,225 | | | | (19 | ) | | | – | |
Cash used in investing activities | | | (1,160 | ) | | | (1,624 | ) | | | (2,204 | ) | | | (29 | ) | | | (26 | ) |
Cash used in financing activities | | | (1,867 | ) | | | (1,522 | ) | | | (889 | ) | | | 23 | | | | 71 | |
| | | | | | | | | | | | | | | | | | | | | |
(Decrease) increase in cash and cash equivalents | | $ | (413 | ) | | $ | 66 | | | $ | 132 | | | | n/m | | | | (50 | ) |
| | | | | | | | | | | | | | | | | | | | | |
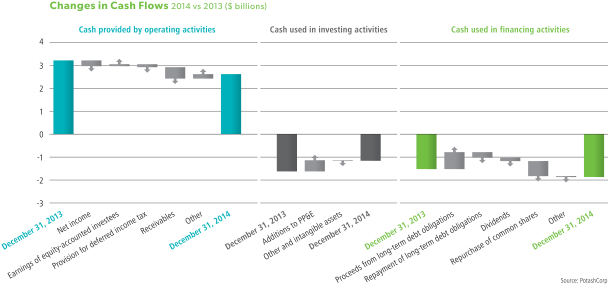
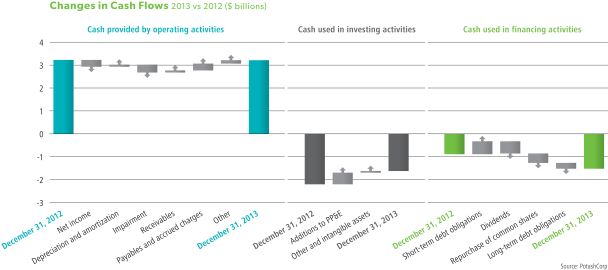
| | |
| PotashCorp 2014 Annual Integrated Report | | 77 |
The most significant contributors to the changes in cash flows were as follows:
| | | | |
| | | 2014 vs 2013 | | 2013 vs 2012 |
| Cash Provided by Operating Activities | | Cash provided by operating activities was impacted by: • Lower net income in 2014; • Cash outflows from receivables in 2014 compared to cash inflows in 2013; and • A lower non-cash provision for deferred income taxes. | | Cash provided by operating activities was impacted by: • Lower net income in 2013; • A non-cash impairment charge in 2012 (none in 2013); • Increased cash inflows from receivables; • Decreased cash outflows associated with payables and accrued charges; and • Increased depreciation in 2013. |
| Cash Used in Investing Activities | | Cash used in investing activities was primarily for additions to property, plant and equipment, which decreased from 2013 mainly due to our potash capacity expansion projects nearing completion. | | Cash used in investing activities was primarily for additions to property, plant and equipment, of which approximately 71 percent (2012 – 67 percent) related to the potash segment. |
| Cash Used in Financing Activities | | Cash used in financing activities rose due to increased share repurchases, repayment of senior notes and dividend payments, partially offset by the issuance of senior notes in 2014 (none in 2013). | | Cash used in financing activities increased in 2013, primarily reflecting the repayment of 10-year senior notes at maturity in 2013, net issuances of commercial paper in 2013 (net repayment in 2012), increased dividend payments and share repurchases in 2013. There were no repayments of notes or share repurchases in 2012. |
We believe that internally generated cash flow, supplemented by available borrowings under our existing financing sources if necessary, will be sufficient to meet our anticipated capital expenditures and other cash requirements for at least the next 12 months, exclusive of any possible acquisitions. At this time, we do not reasonably expect any presently known trend or uncertainty to affect our ability to access our historical sources of liquidity.
| | |
| 78 | | PotashCorp 2014 Annual Integrated Report |
Financial Overview
Capital Structure and Management
Principal Debt Instruments
We use a combination of short-term and long-term debt to finance our operations. We typically pay floating rates of interest on our short-term debt and credit facility, and fixed rates on our senior notes. As at December 31, 2014, interest rates on outstanding commercial paper ranged from 0.3 percent to 0.5 percent.
During 2014, we extended the maturity on $3.4 billion of our syndicated credit facility to May 31, 2019 (original maturity May 31, 2018). The maturity on the remaining $100 million remained unchanged.
Our credit facility provides for unsecured advances up to the total facility amount less direct borrowings and amounts committed in respect of commercial paper outstanding. We also have a $75 million short-term line of credit that is available through August 2015 and an uncommitted letter of credit facility of $100 million that is due on demand. Direct borrowings, outstanding commercial paper and outstanding letters of credit reduce the amounts available under the line of credit and the credit facility. The line of credit and credit facility have financial tests and other covenants with which we must comply at each quarter-end. Non-compliance with any such covenants could result in accelerated payment of amounts borrowed and termination of lenders’ further funding obligations under the credit facility and line of credit. We were in compliance with all covenants as at December 31, 2014 and at this time anticipate being in compliance with such covenants in 2015.
Note 17
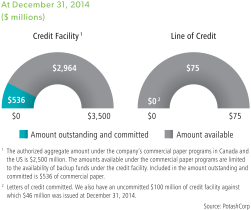
For additional information on our capital structure and management:
Note 26for capital structure
Notes 9 and 23for outstanding share data
The accompanying table summarizes the limits and results of certain covenants.
| | | | | | | | |
Debt covenants at December 31 Dollars (millions), except ratio amounts | | Limit | | | 2014 | |
Debt-to-capital ratio 1 | | £ | 0.6 | | | | 0.3 | |
Long-term debt-to-EBITDA ratio 2 | | £ | 3.5 | | | | 1.0 | |
Debt of subsidiaries | | < $ | 1,000 | | | $ | 6 | |
The following non-IFRS financial measures are requirements of our debt covenants and should not be considered as a substitute for, nor superior to, measures of financial performance prepared in accordance with IFRS:
| 1 | Debt-to-capital ratio = debt (short-term debt and current portion of long-term debt + long-term debt) / (debt + shareholders’ equity). |
| 2 | Long-term debt-to-EBITDA ratio = long-term debt / EBITDA. EBITDA is calculated according to the definition in Note 17 to the consolidated financial statements for the trailing 12 months. As compared to net income according to IFRS, EBITDA is limited in that periodic costs of certain capitalized tangible and intangible assets used in generating revenues are excluded. Long-term debt to net income for the trailing 12 months was 2.1. |
Our ability to access reasonably priced debt in the capital markets is dependent, in part, on the quality of our credit ratings. We continue to maintain investment-grade credit ratings for our long-term debt. A downgrade of the credit rating of our long-term debt would increase the interest rates applicable to borrowings under our credit facility and our line of credit.
Commercial paper markets are normally a source of same-day cash for the company. Our access to the Canadian and US commercial paper markets primarily depends on maintaining our current short-term credit ratings as well as general conditions in the money markets.
| | | | | | | | | | | | | | | | |
At December 31 | | Long-Term Debt | | | Short-Term Debt | |
| | Rating (Outlook) | | | Rating | |
| | 2014 | | | 2013 | | | 2014 | | | 2013 | |
Moody’s | | | A3 (stable) | | | | A3 (stable) | | | | P-2 | | | | P-2 | |
Standard & Poor’s | | | A- (stable) | | | | A- (negative) | | | | A-2 | 1 | | | A-2 | 1 |
DBRS | | | n/a | | | | n/a | | | | R-1 (low | ) | | | R-1 (low | ) |
| 1 | S&P assigned a global commercial paper rating of A-2, but rated our commercial paper A-1 (low) on a Canadian scale. |
n/a = not applicable
A security rating is not a recommendation to buy, sell or hold securities. Such rating may be subject to revision or withdrawal at any time by the respective credit rating agency and each rating should be evaluated independently of any other rating.
Our $3,750 million of senior notes were issued under US shelf registration statements.
For 2014, our weighted average cost of capital was 9.2 percent (2013 – 9.8 percent), of which 87 percent represented the cost of equity (2013 – 90 percent).
| | |
| PotashCorp 2014 Annual Integrated Report | | 79 |
Off-Balance Sheet Arrangements
In the normal course of operations, PotashCorp engages in a variety of transactions that, under IFRS, are either not recorded on our Consolidated Statements of Financial Position or are recorded at amounts that differ from the full contract amounts. Principal off-balance sheet activities include operating leases, agreement to reimburse losses of Canpotex, issuance of guarantee contracts, certain derivative instruments and long-term contracts. We do not reasonably expect any presently known trend or uncertainty to affect our ability to continue using these arrangements, which are discussed below.
Derivative Instruments
We use derivative financial instruments to manage exposure to commodity price and exchange rate fluctuations. Except for certain non-financial derivatives that were entered into and continued to be held for the purpose of the receipt or delivery of a non-financial item in accordance with expected purchase, sale or usage requirements, derivatives are recorded on the Consolidated Statements of Financial Position at fair value and marked-to-market each reporting period regardless of whether they are designated as hedges for IFRS purposes.
Note 19
Leases and Long-Term Contracts
Certain of our long-term raw materials agreements contain fixed price and/or volume components. Our significant agreements, and the related obligations under such agreements, are discussed in Cash Requirements on Page 76.
Additional information about our off-balance sheet arrangements:
Note 28 for contingencies related to Canpotex
Note 29for guarantee contracts
Other Financial Information
Market Risks Associated With Financial Instruments
Market risk is the potential for loss from adverse changes in the market value of financial instruments. The level of market risk to which we are exposed varies depending on the composition of our derivative instrument portfolio, as well as current and expected market conditions. A discussion of enterprise-wide risk management can be found on Pages 21 to 25.
Note 25 for financial risks, including relevant risk sensitivities
Critical Accounting Estimates
Our discussion and analysis of our financial condition and results of operations are based upon our consolidated financial statements, which have been prepared in accordance with IFRS.
Our significant accounting policies and accounting estimates are contained in the consolidated financial statements. Certain of these policies, such as, derivative instruments, provisions and contingencies for asset retirement, environmental and other obligations and capitalization and depreciation of property, plant and equipment, involve critical accounting estimates because they require us to make subjective or complex judgments about matters that are inherently uncertain and because of the likelihood that materially different amounts could be reported under different conditions or using different assumptions. We have discussed the development, selection and application of our key accounting policies, and the critical accounting estimates and assumptions they involve, with the audit committee of the Board.
| | |
Note 2 for accounting policies, estimates and judgments | | |
Additional financial information:
Note 2for recent accounting changes and effective dates
Note 30for related party transactions
| | |
| 80 | | PotashCorp 2014 Annual Integrated Report |
Financial Overview
Other Non-Financial Information
| | | | | | | | | | | | | | | | | | | | |
| | | | | | | | | | | | % Change | |
| Dollars (millions), except percentage amounts | | 2014 | | | 2013 | | | 2012 | | | 2014 | | | 2013 | |
Taxes and royalties (Refer to Page 157 for definition) | | | (715 | ) | | | (568) | | | | (654) | | | | 26 | | | | (13 | ) |
| | | | | | | | | | | | | | | | | | | | | |
| | | | |
| | | 2014 vs 2013 | | 2013 vs 2012 |
| Taxes and Royalties | | Taxes and royalties increased as a result of increased current income taxes and potash production tax. | | Taxes and royalties fell primarily as a result of decreased current income taxes and royalties partially offset by increased potash production tax. |
Forward-Looking Statements
This 2014 Annual Integrated Report, including the Business Outlook section of Management’s Discussion & Analysis of Financial Condition and Results of Operations, contains forward-looking statements or forward-looking information (“forward-looking statements”). These statements can be identified by expressions of belief, expectation or intention, as well as those statements that are not historical fact. These statements often contain words such as “should,” “could,” “expect,” “may,” “anticipate,” “believe,” “intend,” “estimates,” “plans” and similar expressions. These statements are based on certain factors and assumptions as set forth in this 2014 Annual Integrated Report, including with respect to: foreign exchange rates, expected growth, results of operations, performance, business prospects and opportunities, and effective tax rates. While the company considers these factors and assumptions to be reasonable based on information currently available, they may prove to be incorrect. Forward-looking statements are subject to risks and uncertainties that are difficult to predict. The results or events set forth in forward-looking statements may differ materially from actual results or events. Several factors could cause actual results or events to differ materially from those expressed in forward-looking statements including, but not limited to, the following: variations from our assumptions with respect to foreign exchange rates, expected growth, results of operations, performance, business prospects and opportunities, and effective tax rates; fluctuations in supply and demand in the fertilizer, sulfur, transportation and petrochemical markets; changes in competitive pressures, including pricing pressures; costs and availability of transportation and distribution of our raw materials and products, including railcars and ocean freight; risks and uncertainties related to operating and workforce changes made in response to our industry and the markets we serve; risks and uncertainties related to our international operations and assets; failure to prevent or respond
to a major safety incident; adverse or uncertain economic conditions and changes in credit and financial markets; the results of sales contract negotiations within major markets; economic and political uncertainty around the world; risks associated with natural gas and other hedging activities; changes in capital markets; unexpected or adverse weather conditions; catastrophic events or malicious acts, including terrorism; changes in currency and exchange rates; imprecision in reserve estimates; adverse developments in new and pending legal proceedings or government investigations; our prospects to reinvest capital in strategic opportunities and acquisitions; our ownership of non-controlling equity interests in other companies; the impact of further technological innovation; increases in the price or reduced availability of the raw materials that we use; security risks related to our information technology systems; strikes or other forms of work stoppage or slowdowns; timing and impact of capital expenditures; rates of return on, and the risks associated with, our investments and capital expenditures; changes in, and the effects of, government policies and regulations; certain complications that may arise in our mining process, including water inflows; our ability to attract, retain, develop and engage skilled employees; risks related to reputational loss; and earnings and the decisions of taxing authorities, which could affect our effective tax rates. Additional risks and uncertainties can be found in our Form 10-K for the fiscal year ended December 31, 2014 under the captions “Forward-Looking Statements” and “Item 1A – Risk Factors” and in our filings with the US Securities and Exchange Commission and the Canadian provincial securities commissions. Forward-looking statements are given only as at the date of this report and the company disclaims any obligation to update or revise any forward-looking statements, whether as a result of new information, future events or otherwise, except as required by law.
| | |
| PotashCorp 2014 Annual Integrated Report | | 81 |
Non-IFRS Financial Measures in MD&A
PotashCorp uses cash flow and cash flow return (both non-IFRS financial measures) as supplemental measures to evaluate the performance of the company’s assets in terms of the cash flow they have generated. Calculated on the total cost basis of the company’s assets rather than on the depreciated value, these measures reflect cash returned on the total investment outlay. The company believes these measures are valuable to assess shareholder value. As such, management believes this information to be useful to investors.
Generally, these measures are a numerical measure of a company’s performance, financial position or cash flows that either excludes or includes amounts that are not normally excluded or included in the most directly comparable measure calculated and presented in accordance with IFRS. Cash flow and cash flow return are not
measures of financial performance (nor do they have standardized meanings) under IFRS. In evaluating these measures, investors should consider that the methodology applied in calculating such measures may differ among companies and analysts.
The company uses both IFRS and certain non-IFRS measures to assess performance. Management believes the non-IFRS measures provide useful supplemental information to investors in order that they may evaluate PotashCorp’s financial performance using the same measures as management. Management believes that, as a result, the investor is afforded greater transparency in assessing the financial performance of the company. These non-IFRS financial measures should not be considered as a substitute for, nor superior to, measures of financial performance prepared in accordance with IFRS.
| | | | | | | | | | | | | | | | | | | | | | | | | | | | | | | | | | | | | | | | | | | | | | |
| | | IFRS | | | | | Previous Canadian GAAP | |
| (in millions of US dollars except percentage amounts) | | 2014 | | | 2013 | | | 2012 | | | 2011 | | | 2010 | | | | | 2009 | | | 2008 | | | 2007 | | | 2006 | | | 2005 | | | 2004 | |
Net income | | | 1,536 | | | | 1,785 | | | | 2,079 | | | | 3,081 | | | | 1,775 | | | | | | 981 | | | | 3,466 | | | | 1,104 | | | | 607 | | | | 543 | | | | 299 | |
Total assets | | | 17,724 | | | | 17,958 | | | | 18,206 | | | | 16,257 | | | | 15,547 | | | | | | 12,922 | | | | 10,249 | | | | 9,717 | | | | 6,217 | | | | 5,358 | | | | 5,127 | |
| | | | | | | | | | | | | | | | | | | | | | | | | | | | | | | | | | | | | | | | | | | | | | | |
Return on assets 1 | | | 8.7% | | | | 9.9% | | | | 11.4% | | | | 19.0% | | | | 11.4% | | | | | | 7.6% | | | | 33.8% | | | | 11.4% | | | | 9.8% | | | | 10.1% | | | | 5.8% | |
| | | | | | | | | | | | | | | | | | | | | | | | | | | | | | | | | | | | | | | | | | | | | | | |
Net income | | | 1,536 | | | | 1,785 | | | | 2,079 | | | | 3,081 | | | | 1,775 | | | | | | 981 | | | | 3,466 | | | | 1,104 | | | | 607 | | | | 543 | | | | 299 | |
Income taxes | | | 628 | | | | 687 | | | | 826 | | | | 1,066 | | | | 701 | | | | | | 79 | | | | 1,060 | | | | 417 | | | | 142 | | | | 267 | | | | 132 | |
Change in unrealized loss (gain) on derivatives included in net income | | | 5 | | | | 4 | | | | 3 | | | | 1 | | | | – | | | | | | (56 | ) | | | 69 | | | | (17 | ) | | | – | | | | – | | | | – | |
Finance costs | | | 184 | | | | 144 | | | | 114 | | | | 159 | | | | 121 | | | | | | 121 | | | | 63 | | | | 69 | | | | 86 | | | | 82 | | | | 84 | |
Current income taxes 2 | | | (356 | ) | | | (272 | ) | | | (404 | ) | | | (700 | ) | | | (479 | ) | | | | | 120 | | | | (995 | ) | | | (297 | ) | | | (108 | ) | | | (227 | ) | | | (105 | ) |
Depreciation and amortization | | | 701 | | | | 666 | | | | 578 | | | | 489 | | | | 449 | | | | | | 312 | | | | 328 | | | | 291 | | | | 242 | | | | 242 | | | | 240 | |
Impairment of available-for-sale investment | | | 38 | | | | – | | | | 341 | | | | – | | | | – | | | | | | – | | | | – | | | | – | | | | – | | | | – | | | | – | |
| | | | | | | | | | | | | | | | | | | | | | | | | | | | | | | | | | | | | | | | | | | | | | | |
Cash flow 3 | | | 2,736 | | | | 3,014 | | | | 3,537 | | | | 4,096 | | | | 2,567 | | | | | | 1,557 | | | | 3,991 | | | | 1,567 | | | | 969 | | | | 907 | | | | 650 | |
| | | | | | | | | | | | | | | | | | | | | | | | | | | | | | | | | | | | | | | | | | | | | | | |
Total assets | | | 17,724 | | | | 17,958 | | | | 18,206 | | | | 16,257 | | | | 15,547 | | | | | | 12,922 | | | | 10,249 | | | | 9,717 | | | | 6,217 | | | | 5,358 | | | | 5,127 | |
Cash and cash equivalents | | | (215 | ) | | | (628 | ) | | | (562 | ) | | | (430 | ) | | | (412 | ) | | | | | (385 | ) | | | (277 | ) | | | (720 | ) | | | (326 | ) | | | (94 | ) | | | (459 | ) |
Fair value of derivative assets | | | (7 | ) | | | (8 | ) | | | (10 | ) | | | (10 | ) | | | (5 | ) | | | | | (9 | ) | | | (18 | ) | | | (135 | ) | | | – | | | | – | | | | – | |
Accumulated depreciation of property, plant and equipment | | | 5,276 | | | | 4,668 | | | | 4,176 | | | | 3,653 | | | | 3,171 | | | | | | 2,712 | | | | 2,527 | | | | 2,281 | | | | 2,074 | | | | 1,928 | | | | 1,755 | |
Net unrealized gain on available-for-sale investments | | | (244 | ) | | | (439 | ) | | | (1,197 | ) | | | (982 | ) | | | (2,563 | ) | | | | | (1,900 | ) | | | (886 | ) | | | (2,284 | ) | | | – | | | | – | | | | – | |
Accumulated amortization of other assets and intangible assets | | | 129 | | | | 121 | | | | 104 | | | | 93 | | | | 76 | | | | | | 57 | | | | 81 | | | | 66 | | | | 80 | | | | 73 | | | | 72 | |
Payables and accrued charges | | | (1,086 | ) | | | (1,104 | ) | | | (1,188 | ) | | | (1,295 | ) | | | (1,198 | ) | | | | | (798 | ) | | | (1,191 | ) | | | (912 | ) | | | (545 | ) | | | (843 | ) | | | (600 | ) |
| | | | | | | | | | | | | | | | | | | | | | | | | | | | | | | | | | | | | | | | | | | | | | | |
Adjusted assets | | | 21,577 | | | | 20,568 | | | | 19,529 | | | | 17,286 | | | | 14,616 | | | | | | 12,599 | | | | 10,485 | | | | 8,013 | | | | 7,500 | | | | 6,422 | | | | 5,895 | |
| | | | | | | | | | | | | | | | | | | | | | | | | | | | | | | | | | | | | | | | | | | | | | | |
Average adjusted assets | | | 21,073 | | | | 20,049 | | | | 18,408 | | | | 15,951 | | | | 13,627 | 5 | | | | | 11,542 | | | | 9,249 | | | | 7,757 | | | | 6,961 | | | | 6,159 | | | | 5,865 | |
| | | | | | | | | | | | | | | | | | | | | | | | | | | | | | | | | | | | | | | | | | | | | | | |
Cash flow return 4 | | | 13.0% | | | | 15.0% | | | | 19.2% | | | | 25.7% | | | | 18.8% | | | | | | 13.5% | | | | 43.2% | | | | 20.2% | | | | 13.9% | | | | 14.7% | | | | 11.1% | |
| | | | | | | | | | | | | | | | | | | | | | | | | | | | | | | | | | | | | | | | | | | | | | | |
| 1 | Return on assets = net income / total assets. |
| 2 | Current income taxes = current income tax expense (which was already reduced by the realized excess tax benefit related to share-based compensation under previous Canadian GAAP) – realized excess tax benefit related to share-based compensation (under IFRS). |
| 3 | Cash flow = net income + income taxes + change in unrealized loss (gain) on derivatives included in net income + finance costs – current income taxes + depreciation and amortization + impairment of available-for-sale investment. |
| 4 | Cash flow return = cash flow / average (total assets – cash and cash equivalents – fair value of derivative assets + accumulated depreciation and amortization – net unrealized gain on available-for-sale investments – payables and accrued charges). |
| 5 | Based on adjusted assets as of January 1, 2010 of $12,637, which was calculated similarly to 2009 under previous Canadian GAAP except the following IFRS amounts were used: total assets of $12,842, accumulated depreciation of property, plant and equipment of $2,850 and payables and accrued charges of $(817). |
| | |
| 82 | | PotashCorp 2014 Annual Integrated Report |
11 Year Data
11 Year Data
In millions of US dollars except share, per-share, percentage and tonnage amounts, and as otherwise noted
Summary Financial Performance Indicators
| | | | | | | | | | | | | | | | | | | | | | | | | | | | | | | | | | | | | | | | | | | | | | |
| | | IFRS | | | | | Previous Canadian GAAP | |
| | | 2014 | | | 2013 | | | 2012 | | | 2011 | | | 2010 | | | | | 2009 | | | 2008 | | | 2007 | | | 2006 | | | 2005 | | | 2004 | |
Net income | | | 1,536 | | | | 1,785 | | | | 2,079 | | | | 3,081 | | | | 1,775 | | | | | | 981 | | | | 3,466 | | | | 1,104 | | | | 607 | | | | 543 | | | | 299 | |
Net income per share – diluted | | | 1.82 | | | | 2.04 | | | | 2.37 | | | | 3.51 | | | | 1.95 | | | | | | 1.08 | | | | 3.64 | | | | 1.13 | | | | 0.63 | | | | 0.54 | | | | 0.30 | |
EBITDA | | | 3,049 | | | | 3,282 | | | | 3,597 | | | | 4,795 | | | | 3,046 | | | | | | 1,493 | | | | 4,917 | | | | 1,881 | | | | 1,077 | | | | 1,134 | | | | 755 | |
Net income as percentage of sales | | | 21.6% | | | | 24.4% | | | | 26.2% | | | | 35.4% | | | | 27.1% | | | | | | 24.7% | | | | 36.7% | | | | 21.1% | | | | 16.1% | | | | 14.1% | | | | 9.2% | |
Adjusted EBITDA margin | | | 47.4% | | | | 49.6% | | | | 53.0% | | | | 58.3% | | | | 50.3% | | | | | | 40.8% | | | | 54.7% | | | | 39.5% | | | | 31.9% | | | | 32.6% | | | | 26.0% | |
Cash flow prior to working capital changes | | | 2,704 | | | | 2,927 | | | | 3,358 | | | | 3,704 | | | | 2,509 | | | | | | 1,351 | | | | 3,781 | | | | 1,525 | | | | 941 | | | | 860 | | | | 538 | |
Cash provided by operating activities | | | 2,614 | | | | 3,212 | | | | 3,225 | | | | 3,485 | | | | 3,131 | | | | | | 924 | | | | 3,013 | | | | 1,689 | | | | 697 | | | | 865 | | | | 658 | |
Free cash flow | | | 1,544 | | | | 1,303 | | | | 1,154 | | | | 1,456 | | | | 359 | | | | | | (467 | ) | | | 2,536 | | | | 926 | | | | 431 | | | | 483 | | | | 315 | |
Return on assetssee Page 82 | | | 8.7% | | | | 9.9% | | | | 11.4% | | | | 19.0% | | | | 11.4% | | | | | | 7.6% | | | | 33.8% | | | | 11.4% | | | | 9.8% | | | | 10.1% | | | | 5.8% | |
Cash flow returnsee Page 82 | | | 13.0% | | | | 15.0% | | | | 19.2% | | | | 25.7% | | | | 18.8% | | | | | | 13.5% | | | | 43.2% | | | | 20.2% | | | | 13.9% | | | | 14.7% | | | | 11.1% | |
Weighted average cost of capital | | | 9.2% | | | | 9.8% | | | | 9.1% | | | | 9.6% | | | | 10.2% | | | | | | 10.1% | | | | 12.0% | | | | 10.0% | | | | 8.8% | | | | 8.3% | | | | 8.4% | |
Total shareholder return 1 | | | 11.6% | | | | (16.4% | ) | | | (0.2% | ) | | | (19.7% | ) | | | 43.2% | | | | | | 48.9% | | | | (49.0% | ) | | | 202.2% | | �� | | 80.0% | | | | (2.7% | ) | | | 94.2% | |
Total debt to capital | | | 32.6% | | | | 29.0% | | | | 29.2% | | | | 36.6% | | | | 45.5% | | | | | | 38.6% | | | | 40.3% | | | | 19.3% | | | | 41.0% | | | | 41.5% | | | | 36.4% | |
Net debt to capital | | | 31.4% | | | | 25.6% | | | | 26.2% | | | | 34.4% | | | | 43.6% | | | | | | 36.3% | | | | 38.1% | | | | 10.6% | | | | 36.6% | | | | 39.9% | | | | 27.5% | |
Total debt to net income | | | 2.8 | | | | 2.2 | | | | 2.0 | | | | 1.5 | | | | 3.1 | | | | | | 4.1 | | | | 0.9 | | | | 1.3 | | | | 3.2 | | | | 2.8 | | | | 4.6 | |
Net debt to EBITDA | | | 1.3 | | | | 1.0 | | | | 1.0 | | | | 0.9 | | | | 1.7 | | | | | | 2.5 | | | | 0.6 | | | | 0.4 | | | | 1.5 | | | | 1.2 | | | | 1.2 | |
Total assets | | | 17,724 | | | | 17,958 | | | | 18,206 | | | | 16,257 | | | | 15,547 | | | | | | 12,922 | | | | 10,249 | | | | 9,717 | | | | 6,217 | | | | 5,358 | | | | 5,127 | |
Shareholders’ equity | | | 8,792 | | | | 9,628 | | | | 9,912 | | | | 7,847 | | | | 6,685 | | | | | | 6,440 | | | | 4,535 | | | | 5,994 | | | | 2,755 | | | | 2,133 | | | | 2,386 | |
| 1 | The company changed the way total shareholder return is calculated. Previously, the calculation did not assume reinvestment of the dividend, whereas the new calculation assumes reinvested dividends. Prior periods’ figures have been adjusted to reflect the new calculation. |
Share Information and Calculations
| | | | | | | | | | | | | | | | | | | | | | | | | | | | | | | | | | | | | | | | | | | | | | |
| | | IFRS | | | | | Previous Canadian GAAP | |
| | | 2014 | | | 2013 | | | 2012 | | | 2011 | | | 2010 | | | | | 2009 | | | 2008 | | | 2007 | | | 2006 | | | 2005 | | | 2004 | |
End of year closing price (dollars) | | | 35.32 | | | | 32.96 | | | | 40.69 | | | | 41.28 | | | | 51.61 | | | | | | 36.17 | | | | 24.41 | | | | 47.99 | | | | 15.94 | | | | 8.91 | | | | 9.23 | |
Dividends per share, ex-dividend date (dollars) | | | 1.40 | | | | 1.19 | | | | 0.56 | | | | 0.24 | | | | 0.13 | | | | | | 0.13 | | | | 0.13 | | | | 0.10 | | | | 0.07 | | | | 0.07 | | | | 0.06 | |
Total shareholder return | | | 11.6% | | | | (16.4% | ) | | | (0.2% | ) | | | (19.7% | ) | | | 43.2% | | | | | | 48.9% | | | | (49.0% | ) | | | 202.2% | | | | 80.0% | | | | (2.7% | ) | | | 94.2% | |
| | | | 5-year cumulative shareholder return 1: 7% | | | | | | 10-year cumulative shareholder return 1: 331% | | | | | |
Weighted average shares outstanding | | | | | | | | | | | | | | | | | | | | | | | | | | | | | | | | | | | | | | | | | | | | | | |
Basic (thousands) | | | 838,101 | | | | 864,596 | | | | 860,033 | | | | 855,677 | | | | 886,371 | | | | | | 886,740 | | | | 922,439 | | | | 946,923 | | | | 935,640 | | | | 977,112 | | | | 971,703 | |
Diluted (thousands) | | | 844,544 | | | | 873,982 | | | | 875,907 | | | | 876,637 | | | | 911,093 | | | | | | 911,828 | | | | 952,313 | | | | 972,924 | | | | 956,067 | | | | 999,702 | | | | 996,651 | |
Shares outstanding, end of year (thousands) 2 | | | 830,243 | | | | 856,116 | | | | 864,901 | | | | 858,703 | | | | 853,123 | | | | | | 887,927 | | | | 885,603 | | | | 949,233 | | | | 943,209 | | | | 932,346 | | | | 995,679 | |
| 1 | Calculated as cumulative change in total shareholder return assuming reinvested dividends for the respective period. |
| 2 | Common shares were repurchased in 2014, 2013, 2010, 2008 and 2005 in the amounts of 29.201 million, 14.145 million, 42.190 million, 68.547 million and 85.500 million, respectively. |
| | |
| PotashCorp 2014 Annual Integrated Report | | 83 |
Financial Data, Reconciliations and Calculations
| | | | | | | | | | | | | | | | | | | | | | | | | | | | | | | | | | | | | | | | | | | | | | |
| | | IFRS | | | | | Previous Canadian GAAP | |
| | | 2014 | | | 2013 | | | 2012 | | | 2011 | | | 2010 | | | | | 2009 | | | 2008 | | | 2007 | | | 2006 | | | 2005 | | | 2004 | |
Net income1 | | | 1,536 | | | | 1,785 | | | | 2,079 | | | | 3,081 | | | | 1,775 | | | | | | 981 | | | | 3,466 | | | | 1,104 | | | | 607 | | | | 543 | | | | 299 | |
Finance costs | | | 184 | | | | 144 | | | | 114 | | | | 159 | | | | 121 | | | | | | 121 | | | | 63 | | | | 69 | | | | 86 | | | | 82 | | | | 84 | |
Income taxes | | | 628 | | | | 687 | | | | 826 | | | | 1,066 | | | | 701 | | | | | | 79 | | | | 1,060 | | | | 417 | | | | 142 | | | | 267 | | | | 132 | |
Depreciation and amortization | | | 701 | | | | 666 | | | | 578 | | | | 489 | | | | 449 | | | | | | 312 | | | | 328 | | | | 291 | | | | 242 | | | | 242 | | | | 240 | |
EBITDA2 | | | 3,049 | | | | 3,282 | | | | 3,597 | | | | 4,795 | | | | 3,046 | | | | | | 1,493 | | | | 4,917 | | | | 1,881 | | | | 1,077 | | | | 1,134 | | | | 755 | |
Net income as percentage of sales | | | 21.6% | | | | 24.4% | | | | 26.2% | | | | 35.4% | | | | 27.1% | | | | | | 24.7% | | | | 36.7% | | | | 21.1% | | | | 16.1% | | | | 14.1% | | | | 9.2% | |
Adjusted EBITDA margin3 | | | 47.4% | | | | 49.6% | | | | 53.0% | | | | 58.3% | | | | 50.3% | | | | | | 40.8% | | | | 54.7% | | | | 39.5% | | | | 31.9% | | | | 32.6% | | | | 26.0% | |
Cash flow prior to working capital changes 4 | | | 2,704 | | | | 2,927 | | | | 3,358 | | | | 3,704 | | | | 2,509 | | | | | | 1,351 | | | | 3,781 | | | | 1,525 | | | | 941 | | | | 860 | | | | 538 | |
Receivables | | | (220 | ) | | | 276 | | | | 188 | | | | (155 | ) | | | 256 | | | | | | 53 | | | | (594 | ) | | | (155 | ) | | | 11 | | | | (107 | ) | | | (52 | ) |
Inventories | | | 70 | | | | 28 | | | | (7 | ) | | | (146 | ) | | | 66 | | | | | | 88 | | | | (324 | ) | | | 61 | | | | 14 | | | | (120 | ) | | | (11 | ) |
Prepaid expenses and other current assets | | | 29 | | | | (1 | ) | | | (32 | ) | | | (1 | ) | | | (6 | ) | | | | | 21 | | | | (24 | ) | | | 7 | | | | – | | | | (6 | ) | | | (6 | ) |
Payables and accrued charges | | | 31 | | | | (18 | ) | | | (282 | ) | | | 83 | | | | 306 | | | | | | (589 | ) | | | 174 | | | | 251 | | | | (269 | ) | | | 238 | | | | 189 | |
Changes in non-cash operating working capital | | | (90 | ) | | | 285 | | | | (133 | ) | | | (219 | ) | | | 622 | | | | | | (427 | ) | | | (768 | ) | | | 164 | | | | (244 | ) | | | 5 | | | | 120 | |
Cash provided by operating activities | | | 2,614 | | | | 3,212 | | | | 3,225 | | | | 3,485 | | | | 3,131 | | | | | | 924 | | | | 3,013 | | | | 1,689 | | | | 697 | | | | 865 | | | | 658 | |
Cash additions to property, plant and equipment | | | (1,138 | ) | | | (1,624 | ) | | | (2,133 | ) | | | (2,176 | ) | | | (2,079 | ) | | | | | (1,764 | ) | | | (1,198 | ) | | | (607 | ) | | | (509 | ) | | | (383 | ) | | | (220 | ) |
Other assets and intangible assets | | | (22 | ) | | | – | | | | (71 | ) | | | (72 | ) | | | (71 | ) | | | | | (54 | ) | | | (47 | ) | | | 8 | | | | (1 | ) | | | 6 | | | | (3 | ) |
Changes in non-cash operating working capital | | | 90 | | | | (285 | ) | | | 133 | | | | 219 | | | | (622 | ) | | | | | 427 | | | | 768 | | | | (164 | ) | | | 244 | | | | (5 | ) | | | (120 | ) |
Free cash flow 5 | | | 1,544 | | | | 1,303 | | | | 1,154 | | | | 1,456 | | | | 359 | | | | | | (467 | ) | | | 2,536 | | | | 926 | | | | 431 | | | | 483 | | | | 315 | |
Short-term debt | | | 536 | | | | 470 | | | | 369 | | | | 829 | | | | 1,274 | | | | | | 727 | | | | 1,324 | | | | 90 | | | | 158 | | | | 252 | | | | 94 | |
Current portion of long-term debt | | | 496 | | | | 497 | | | | 246 | | | | 3 | | | | 597 | | | | | | 2 | | | | – | | | | – | | | | 400 | | | | 1 | | | | 10 | |
Long-term debt | | | 3,213 | | | | 2,970 | | | | 3,466 | | | | 3,705 | | | | 3,707 | | | | | | 3,319 | | | | 1,740 | | | | 1,339 | | | | 1,357 | | | | 1,258 | | | | 1,259 | |
Total debt | | | 4,245 | | | | 3,937 | | | | 4,081 | | | | 4,537 | | | | 5,578 | | | | | | 4,048 | | | | 3,064 | | | | 1,429 | | | | 1,915 | | | | 1,511 | | | | 1,363 | |
Cash and cash equivalents | | | (215 | ) | | | (628 | ) | | | (562 | ) | | | (430 | ) | | | (412 | ) | | | | | (385 | ) | | | (277 | ) | | | (720 | ) | | | (326 | ) | | | (94 | ) | | | (459 | ) |
Net debt 6 | | | 4,030 | | | | 3,309 | | | | 3,519 | | | | 4,107 | | | | 5,166 | | | | | | 3,663 | | | | 2,787 | | | | 709 | | | | 1,589 | | | | 1,417 | | | | 904 | |
Total shareholders’ equity | | | 8,792 | | | | 9,628 | | | | 9,912 | | | | 7,847 | | | | 6,685 | | | | | | 6,440 | | | | 4,535 | | | | 5,994 | | | | 2,755 | | | | 2,133 | | | | 2,386 | |
Total debt to capital | | | 32.6% | | | | 29.0% | | | | 29.2% | | | | 36.6% | | | | 45.5% | | | | | | 38.6% | | | | 40.3% | | | | 19.3% | | | | 41.0% | | | | 41.5% | | | | 36.4% | |
Net debt to capital 6 | | | 31.4% | | | | 25.6% | | | | 26.2% | | | | 34.4% | | | | 43.6% | | | | | | 36.3% | | | | 38.1% | | | | 10.6% | | | | 36.6% | | | | 39.9% | | | | 27.5% | |
Total debt to net income | | | 2.8 | | | | 2.2 | | | | 2.0 | | | | 1.5 | | | | 3.1 | | | | | | 4.1 | | | | 0.9 | | | | 1.3 | | | | 3.2 | | | | 2.8 | | | | 4.6 | |
Net debt to EBITDA 7 | | | 1.3 | | | | 1.0 | | | | 1.0 | | | | 0.9 | | | | 1.7 | | | | | | 2.5 | | | | 0.6 | | | | 0.4 | | | | 1.5 | | | | 1.2 | | | | 1.2 | |
Current assets | | | 1,938 | | | | 2,189 | | | | 2,496 | | | | 2,408 | | | | 2,095 | | | | | | 2,272 | | | | 2,267 | | | | 1,811 | | | | 1,310 | | | | 1,111 | | | | 1,244 | |
Current liabilities | | | (2,198 | ) | | | (2,113 | ) | | | (1,854 | ) | | | (2,194 | ) | | | (3,144 | ) | | | | | (1,577 | ) | | | (2,623 | ) | | | (1,002 | ) | | | (1,104 | ) | | | (1,096 | ) | | | (704 | ) |
Working capital | | | (260 | ) | | | 76 | | | | 642 | | | | 214 | | | | (1,049 | ) | | | | | 695 | | | | (356 | ) | | | 809 | | | | 206 | | | | 15 | | | | 540 | |
Cash and cash equivalents | | | (215 | ) | | | (628 | ) | | | (562 | ) | | | (430 | ) | | | (412 | ) | | | | | (385 | ) | | | (277 | ) | | | (720 | ) | | | (326 | ) | | | (94 | ) | | | (459 | ) |
Short-term debt | | | 536 | | | | 470 | | | | 369 | | | | 829 | | | | 1,274 | | | | | | 727 | | | | 1,324 | | | | 90 | | | | 158 | | | | 252 | | | | 94 | |
Current portion of long-term debt | | | 496 | | | | 497 | | | | 246 | | | | 3 | | | | 597 | | | | | | 2 | | | | – | | | | – | | | | 400 | | | | 1 | | | | 10 | |
Non-cash operating working capital | | | 557 | | | | 415 | | | | 695 | | | | 616 | | | | 410 | | | | | | 1,039 | | | | 691 | | | | 179 | | | | 438 | | | | 174 | | | | 185 | |
| | |
| 84 | | PotashCorp 2014 Annual Integrated Report |
11 Year Data
| 1 | There were no discontinued operations in any of the accounting periods. After-tax effects of certain items affecting net income were as follows: |
| | | | | | | | | | | | | | | | | | | | | | | | | | | | | | | | | | | | | | | | | | |
| | | IFRS | | | | | Previous Canadian GAAP | |
| | | 2014 | | | 2013 | | | 2012 | | | 2011 | | | 2010 | | | | | 2009 | | | 2008 | | | 2007 | | | 2006 | | | 2004 | |
Impairment of available-for-sale investment | | $ | 38 | | | $ | – | | | $ | 341 | | | $ | – | | | $ | – | | | | | $ | – | | | $ | – | | | $ | – | | | $ | – | | | $ | – | |
Plant shutdown and closure and workforce reduction costs | | | – | | | | 44 | | | | – | | | | – | | | | – | | | | | | – | | | | – | | | | – | | | | – | | | | 6 | |
Takeover response costs | | | – | | | | – | | | | – | | | | 1 | | | | 56 | | | | | | – | | | | – | | | | – | | | | – | | | | – | |
Loss (gain) on sale of assets | | | – | | | | – | | | | – | | | | – | | | | – | | | | | | 6 | | | | (16 | ) | | | – | | | | – | | | | (37 | ) |
(Recovery) impairment of auction rate securities | | | – | | | | – | | | | – | | | | – | | | | – | | | | | | (91 | ) | | | 67 | | | | 19 | | | | – | | | | – | |
Impairment of property, plant and equipment | | | – | | | | – | | | | – | | | | – | | | | – | | | | | | – | | | | – | | | | – | | | | 5 | | | | – | |
Total after-tax effects on net income | | $ | 38 | | | $ | 44 | | | $ | 341 | | | $ | 1 | | | $ | 56 | | | | | $ | (85 | ) | | $ | 51 | | | $ | 19 | | | $ | 5 | | | $ | (31 | ) |
| 2 | PotashCorp uses EBITDA and adjusted EBITDA as supplemental financial measures of its operational performance. Management believes EBITDA and adjusted EBITDA to be important measures as they exclude the effects of items which primarily reflect the impact of long-term investment and financing decisions, rather than the performance of the company’s day-to-day operations. As compared to net income according to IFRS, these measures are limited in that they do not reflect the periodic costs of certain capitalized tangible and intangible assets used in generating revenues in the company’s business, or the charges associated with impairments, costs associated with takeover response and certain gains and losses on disposal of assets. Management evaluates such items through other financial measures such as capital expenditures and cash flow provided by operating activities. The company believes that these measurements are useful to measure a company’s ability to service debt and to meet other payment obligations or as a valuation measurement. |
EBITDA has not been adjusted for the effects of the following items:
| | | | | | | | | | | | | | | | | | | | | | | | | | | | | | | | | | | | | | | | | | |
| | | IFRS | | | | | Previous Canadian GAAP | |
| | | 2014 | | | 2013 | | | 2012 | | | 2011 | | | 2010 | | | | | 2009 | | | 2008 | | | 2007 | | | 2006 | | | 2004 | |
Impairment of available-for-sale investment | | $ | 38 | | | $ | – | | | $ | 341 | | | $ | – | | | $ | – | | | | | $ | – | | | $ | – | | | $ | – | | | $ | – | | | $ | – | |
Plant shutdown and closure and workforce reduction costs | | | – | | | | 60 | | | | – | | | | – | | | | – | | | | | | – | | | | – | | | | – | | | | – | | | | 6 | |
Takeover response costs | | | – | | | | – | | | | – | | | | 2 | | | | 73 | | | | | | – | | | | – | | | | – | | | | – | | | | – | |
Loss (gain) on sale of assets | | | – | | | | – | | | | – | | | | – | | | | – | | | | | | 8 | | | | (21 | ) | | | – | | | | – | | | | (37 | ) |
(Recovery) impairment of auction rate securities | | | – | | | | – | | | | – | | | | – | | | | – | | | | | | (115 | ) | | | 89 | | | | 27 | | | | – | | | | – | |
Impairment of property, plant and equipment | | | – | | | | – | | | | – | | | | – | | | | – | | | | | | – | | | | – | | | | – | | | | 6 | | | | – | |
Total items included in EBITDA | | | 38 | | | | 60 | | | | 341 | | | | 2 | | | | 73 | | | | | | (107 | ) | | | 68 | | | | 27 | | | | 6 | | | | (31 | ) |
EBITDA | | | 3,049 | | | | 3,282 | | | | 3,597 | | | | 4,795 | | | | 3,046 | | | | | | 1,493 | | | | 4,917 | | | | 1,881 | | | | 1,077 | | | | 755 | |
Adjusted EBITDA | | $ | 3,087 | | | $ | 3,342 | | | $ | 3,938 | | | $ | 4,797 | | | $ | 3,119 | | | | | $ | 1,386 | | | $ | 4,985 | | | $ | 1,908 | | | $ | 1,083 | | | $ | 724 | |
| 3 | Management believes comparing EBITDA to net sales earned (net of costs to deliver product) is an important indicator of efficiency. In addition to the limitations given above in using adjusted EBITDA as compared to net income, adjusted EBITDA margin as compared to net income as a percentage of sales is also limited in that freight, transportation and distribution costs are incurred and valued independently of sales; adjusted EBITDA also includes earnings from equity investees whose sales are not included in consolidated sales. Management evaluates these items individually on the consolidated statements of income. |
| 4 | Management uses cash flow prior to working capital changes as a supplemental financial measure in its evaluation of liquidity. Management believes that adjusting principally for the swings in non-cash working capital items due to seasonality or other timing issues assists management in making long-term liquidity assessments. Management also believes that this measurement is useful as a measure of liquidity or as a valuation measurement. |
| 5 | The company uses free cash flow as a supplemental financial measure in its evaluation of liquidity and financial strength. Management believes that adjusting principally for the swings in non-cash operating working capital items due to seasonality or other timing issues, additions to property, plant and equipment, and changes to other assets assists management in the long-term assessment of liquidity and financial strength. Management also believes that this measurement is useful as an indicator of the company’s ability to service its debt, meet other payment obligations and make strategic investments. Readers should be aware that free cash flow does not represent residual cash flow available for discretionary expenditures. |
| 6 | Management believes that net debt and the net-debt-to-capital ratio are useful to investors because they are helpful in determining the company’s leverage. It also believes that, since the company has the ability to and may elect to use a portion of cash and cash equivalents to retire debt or to incur additional expenditures without increasing debt, it is appropriate to apply cash and cash equivalents to debt in calculating net debt and net debt to capital. PotashCorp believes that this measurement is useful as a financial leverage measure. |
| 7 | Net debt to EBITDA shows the maximum number of years it would take to retire the company’s net debt using the current year’s EBITDA and helps PotashCorp evaluate the appropriateness of current debt levels relative to earnings generated by operations. In addition to the limitation of using EBITDA discussed above, net debt to EBITDA is limited in that this measure assumes all earnings are used to repay principal and no interest payments or taxes. |
| | |
| PotashCorp 2014 Annual Integrated Report | | 85 |
Other Financial Information
| | | | | | | | | | | | | | | | | | | | | | | | | | | | | | | | | | | | | | | | | | | | | | |
| | | IFRS | | | | | Previous Canadian GAAP | |
| | | 2014 | | | 2013 | | | 2012 | | | 2011 | | | 2010 | | | | | 2009 | | | 2008 | | | 2007 | | | 2006 | | | 2005 | | | 2004 | |
Sales | | | | | | | | | | | | | | | | | | | | | | | | | | | | | | | | | | | | | | | | | | | | | | |
Potash | | | 2,828 | | | | 2,963 | | | | 3,285 | | | | 3,983 | | | | 3,001 | | | | | | 1,316 | | | | 4,068 | | | | 1,797 | | | | 1,228 | | | | 1,341 | | | | 1,056 | |
Nitrogen | | | 2,532 | | | | 2,417 | | | | 2,503 | | | | 2,433 | | | | 1,835 | | | | | | 1,353 | | | | 2,672 | | | | 1,912 | | | | 1,395 | | | | 1,369 | | | | 1,210 | |
Phosphate | | | 1,862 | | | | 2,067 | | | | 2,292 | | | | 2,478 | | | | 1,822 | | | | | | 1,374 | | | | 2,881 | | | | 1,637 | | | | 1,255 | | | | 1,137 | | | | 978 | |
Less inter-segment nitrogen | | | (107 | ) | | | (142 | ) | | | (153 | ) | | | (179 | ) | | | (119 | ) | | | | | (66 | ) | | | (174 | ) | | | (112 | ) | | | (111 | ) | | | – | | | | – | |
Total sales | | | 7,115 | | | | 7,305 | | | | 7,927 | | | | 8,715 | | | | 6,539 | | | | | | 3,977 | | | | 9,447 | | | | 5,234 | | | | 3,767 | | | | 3,847 | | | | 3,244 | |
Freight, transportation and distribution | | | (609 | ) | | | (572 | ) | | | (494 | ) | | | (496 | ) | | | (488 | ) | | | | | (319 | ) | | | (458 | ) | | | (470 | ) | | | (390 | ) | | | (371 | ) | | | (343 | ) |
Net sales1 | | | 6,506 | | | | 6,733 | | | | 7,433 | | | | 8,219 | | | | 6,051 | | | | | | 3,658 | | | | 8,989 | | | | 4,764 | | | | 3,377 | | | | 3,476 | | | | 2,901 | |
Potash net sales | | | | | | | | | | | | | | | | | | | | | | | | | | | | | | | | | | | | | | | | | | | | | | |
North America | | | 1,162 | | | | 1,210 | | | | 1,231 | | | | 1,502 | | | | 1,222 | | | | | | 507 | | | | 1,308 | | | | 657 | | | | 471 | | | | 496 | | | | 348 | |
Offshore | | | 1,354 | | | | 1,482 | | | | 1,835 | | | | 2,223 | | | | 1,506 | | | | | | 699 | | | | 2,527 | | | | 910 | | | | 576 | | | | 668 | | | | 505 | |
Miscellaneous and purchased product | | | 21 | | | | 15 | | | | 13 | | | | 14 | | | | 14 | | | | | | 16 | | | | 24 | | | | 14 | | | | 12 | | | | 13 | | | | 43 | |
Total potash net sales | | | 2,537 | | | | 2,707 | | | | 3,079 | | | | 3,739 | | | | 2,742 | | | | | | 1,222 | | | | 3,859 | | | | 1,581 | | | | 1,059 | | | | 1,177 | | | | 896 | |
Gross margin | | | | | | | | | | | | | | | | | | | | | | | | | | | | | | | | | | | | | | | | | | | | | | |
Potash | | | 1,435 | | | | 1,573 | | | | 1,963 | | | | 2,722 | | | | 1,816 | | | | | | 731 | | | | 3,056 | | | | 912 | | | | 561 | | | | 707 | | | | 423 | |
Nitrogen | | | 1,010 | | | | 913 | | | | 978 | | | | 916 | | | | 528 | | | | | | 192 | | | | 737 | | | | 536 | | | | 316 | | | | 319 | | | | 243 | |
Phosphate | | | 202 | | | | 304 | | | | 469 | | | | 648 | | | | 346 | | | | | | 92 | | | | 1,068 | | | | 434 | | | | 84 | | | | 99 | | | | 15 | |
Total gross margin | | | 2,647 | | | | 2,790 | | | | 3,410 | | | | 4,286 | | | | 2,690 | | | | | | 1,015 | | | | 4,861 | | | | 1,882 | | | | 961 | | | | 1,125 | | | | 681 | |
Depreciation and amortization | | | | | | | | | | | | | | | | | | | | | | | | | | | | | | | | | | | | | | | | | | | | | | |
Potash2 | | | 224 | | | | 176 | | | | 158 | | | | 142 | | | | 121 | | | | | | 40 | | | | 82 | | | | 72 | | | | 58 | | | | 65 | | | | 66 | |
Nitrogen | | | 173 | | | | 161 | | | | 138 | | | | 132 | | | | 119 | | | | | | 99 | | | | 97 | | | | 88 | | | | 77 | | | | 72 | | | | 80 | |
Phosphate | | | 297 | | | | 294 | | | | 261 | | | | 207 | | | | 197 | | | | | | 164 | | | | 141 | | | | 121 | | | | 95 | | | | 95 | | | | 84 | |
Other 2 | | | 7 | | | | 35 | | | | 21 | | | | 8 | | | | 12 | | | | | | 9 | | | | 8 | | | | 10 | | | | 12 | | | | 10 | | | | 10 | |
Total depreciation and amortization | | | 701 | | | | 666 | | | | 578 | | | | 489 | | | | 449 | | | | | | 312 | | | | 328 | | | | 291 | | | | 242 | | | | 242 | | | | 240 | |
Operating income | | | 2,348 | | | | 2,616 | | | | 3,019 | | | | 4,306 | | | | 2,597 | | | | | | 1,181 | | | | 4,589 | | | | 1,589 | | | | 835 | | | | 893 | | | | 514 | |
Net income per share – basic | | | 1.83 | | | | 2.06 | | | | 2.42 | | | | 3.60 | | | | 2.00 | | | | | | 1.11 | | | | 3.76 | | | | 1.17 | | | | 0.65 | | | | 0.56 | | | | 0.31 | |
Net income per share – diluted | | | 1.82 | | | | 2.04 | | | | 2.37 | | | | 3.51 | | | | 1.95 | | | | | | 1.08 | | | | 3.64 | | | | 1.13 | | | | 0.63 | | | | 0.54 | | | | 0.30 | |
Dividends declared per share | | | 1.40 | | | | 1.33 | | | | 0.70 | | | | 0.28 | | | | 0.13 | | | | | | 0.13 | | | | 0.13 | | | | 0.12 | | | | 0.07 | | | | 0.07 | | | | 0.06 | |
Capital spending | | | | | | | | | | | | | | | | | | | | | | | | | | | | | | | | | | | | | | | | | | | | | | |
Sustaining | | | 601 | | | | 667 | | | | 651 | | | | 509 | | | | 523 | | | | | | 416 | | | | 303 | | | | 204 | | | | 154 | | | | 127 | | | | 125 | |
Opportunity | | | 537 | | | | 957 | | | | 1,482 | | | | 1,667 | | | | 1,556 | | | | | | 1,348 | | | | 895 | | | | 403 | | | | 355 | | | | 256 | | | | 95 | |
Total cash additions to property, plant and equipment | | | 1,138 | | | | 1,624 | | | | 2,133 | | | | 2,176 | | | | 2,079 | | | | | | 1,764 | | | | 1,198 | | | | 607 | | | | 509 | | | | 383 | | | | 220 | |
| 1 | Management includes net sales in its segment disclosures in the consolidated financial statements pursuant to IFRS, which requires segmentation based upon the company’s internal organization and reporting of revenue and profit measures derived from internal accounting methods. As a component of gross margin, net sales (and related per-tonne amounts and other ratios) are primary revenue measures it uses and reviews in making decisions about operating matters on a business segment basis. These decisions include assessments about potash, nitrogen and phosphate performance and the resources to be allocated to these segments. It also uses net sales (and related per-tonne amounts and other ratios) for business segment planning and monthly forecasting. Net sales are calculated as sales revenues less freight, transportation and distribution expenses. Net sales presented on a consolidated basis rather than by business segment is considered a non-IFRS financial measure. |
| 2 | Prior periods’ figures have been adjusted to reflect depreciation and amortization only within cost of goods sold in the Potash category. There was no change in total depreciation and amortization. |
| | |
| 86 | | PotashCorp 2014 Annual Integrated Report |
11 Year Data
Non-Financial Data
| | | | | | | | | | | | | | | | | | | | | | | | | | | | | | | | | | | | | | | | | | | | |
| | | 2014 | | | 2013 | | | 2012 | | | 2011 | | | 2010 | | | 2009 | | | 2008 | | | 2007 | | | 2006 | | | 2005 | | | 2004 | |
Customers | | | | | | | | | | | | | | | | | | | | | | | | | | | | | | | | | | | | | | | | | | | | |
Customer survey score | | | 89% | | | | 90% | | | | 92% | | | | 90% | | | | 90% | | | | 89% | | | | 91% | | | | 90% | | | | n/a | | | | n/a | | | | n/a | |
Product tonnes involved in customer
complaints (thousands) 1 | | | 63 | | | | 43 | | | | 64 | | | | 59 | | | | 97 | | | | 190 | | | | 191 | | | | 152 | | | | 289 | | | | 166 | | | | n/a | |
Community | | | | | | | | | | | | | | | | | | | | | | | | | | | | | | | | | | | | | | | | | | | | |
Community investment ($ millions) | | | 26 | | | | 31 | | | | 28 | | | | 21 | | | | 17 | | | | 10 | | | | 7 | | | | 4 | | | | 4 | | | | 4 | | | | 4 | |
Taxes and royalties ($ millions) | | | 715 | | | | 568 | | | | 654 | | | | 997 | | | | 620 | | | | (8 | ) | | | 1,684 | | | | 507 | | | | 238 | | | | 430 | | | | 251 | |
Community survey score(out of 5) | | | 4.4 | | | | 4.2 | | | | 4.5 | | | | 4.4 | | | | 4.2 | | | | 4.1 | | | | 4.0 | | | | 4.1 | | | | 4.3 | | | | n/a | | | | n/a | |
Employees | | | | | | | | | | | | | | | | | | | | | | | | | | | | | | | | | | | | | | | | | | | | |
Employees at year-end | | | 5,136 | | | | 5,787 | | | | 5,779 | | | | 5,703 | | | | 5,486 | | | | 5,136 | | | | 5,301 | | | | 5,003 | | | | 4,871 | | | | 4,879 | | | | 4,906 | |
Employee engagement score | | | 67% | | | | n/a | 2 | | | 79% | | | | 73% | | | | 73% | | | | 76% | | | | 79% | | | | 69% | | | | 66% | | | | n/a | | | | n/a | |
Annual employee turnover rate (excluding retirements) 3 | | | 12% | | | | 5% | | | | 5% | | | | 4% | | | | 3% | | | | 6% | | | | 6% | | | | n/a | | | | n/a | | | | n/a | | | | n/a | |
Gender diversity – proportion of females | | | 8% | | | | 8% | | | | 8% | | | | 8% | | | | 8% | | | | 9% | | | | 9% | | | | 9% | | | | 9% | | | | 9% | | | | 8% | |
Safety | | | | | | | | | | | | | | | | | | | | | | | | | | | | | | | | | | | | | | | | | | | | |
Total site recordable injury rate | | | 1.01 | | | | 1.06 | | | | 1.29 | | | | 1.42 | | | | 1.29 | | | | 1.54 | | | | 2.21 | | | | n/a | | | | n/a | | | | n/a | | | | n/a | |
Total site severity injury rate | | | 0.46 | | | | 0.40 | | | | 0.55 | | | | 0.54 | | | | 0.38 | | | | 0.74 | | | | 0.97 | | | | n/a | | | | n/a | | | | n/a | | | | n/a | |
Environment | | | | | | | | | | | | | | | | | | | | | | | | | | | | | | | | | | | | | | | | | | | | |
Environmental incidents | | | 24 | | | | 17 | | | | 19 | | | | 14 | | | | 20 | | | | 22 | | | | 19 | | | | 25 | | | | 26 | | | | n/a | | | | n/a | |
Waste (million tonnes) | | | 28 | | | | 29 | | | | 24 | | | | 30 | | | | 26 | | | | 15 | | | | 26 | | | | 28 | | | | 24 | | | | n/a | | | | n/a | |
Direct energy used (thousand terajoules) 4 | | | 186 | | | | 180 | | | | 160 | | | | 166 | | | | 162 | | | | 152 | | | | 154 | | | | 159 | | | | n/a | | | | n/a | | | | n/a | |
n/a = not available as data had not been previously compiled consistent with current methodology
| 1 | A complaint occurs when our product does not meet our product specification sheet requirements, our chemical analysis requirements or our physical size specifications (for example, product is undersized, has too many lumps or has too much dust). |
| 2 | No survey was conducted in 2013. Engagement survey completed annually for half of employees prior to 2013; beginning in 2014, survey conducted biennially for all employees. |
| 3 | The number of permanent employees who left the company (due to deaths and voluntary and involuntary terminations and excluding retirements) as a percentage of average total employees during the year. Retirements and terminations of temporary employees are excluded. Results in 2013 include a portion of the impact of our announced workforce reduction and the remaining impact was largely reflected in 2014. |
| 4 | Direct energy used is energy consumed by our operations in order to mine, mill and manufacture our products. Energy is used by burning fossil fuels, reforming natural gas and consuming electricity. |
Production and Sales Volumes Information
| | | | | | | | | | | | | | | | | | | | | | | | | | | | | | | | | | | | | | | | | | | | |
| | | 2014 | | | 2013 | | | 2012 | | | 2011 | | | 2010 | | | 2009 | | | 2008 | | | 2007 | | | 2006 | | | 2005 | | | 2004 | |
Production (thousands) | | | | | | | | | | | | | | | | | | | | | | | | | | | | | | | | | | | | | | | | | | | | |
Potash production (KCI) tonnage | | | 8,726 | | | | 7,792 | | | | 7,724 | | | | 9,343 | | | | 8,078 | | | | 3,405 | | | | 8,697 | | | | 9,159 | | | | 7,018 | | | | 8,816 | | | | 7,914 | |
Nitrogen production (N) tonnage | | | 3,170 | | | | 2,952 | | | | 2,602 | | | | 2,813 | | | | 2,767 | | | | 2,551 | | | | 2,780 | | | | 2,986 | | | | 2,579 | | | | 2,600 | | | | 2,558 | |
Phosphate production (P2O5) tonnage | | | 1,671 | | | | 2,058 | | | | 1,983 | | | | 2,204 | | | | 1,987 | | | | 1,505 | | | | 1,942 | | | | 2,164 | | | | 2,108 | | | | 2,097 | | | | 1,962 | |
Sales (thousands) | | | | | | | | | | | | | | | | | | | | | | | | | | | | | | | | | | | | | | | | | | | | |
Potash sales – manufactured product tonnes | | | | | | | | | | | | | | | | | | | | | | | | | | | | | | | | | | | | | | | | | | | | |
North America | | | 3,549 | | | | 3,185 | | | | 2,590 | | | | 3,114 | | | | 3,355 | | | | 1,093 | | | | 2,962 | | | | 3,471 | | | | 2,785 | | | | 3,144 | | | | 3,246 | |
Offshore | | | 5,797 | | | | 4,915 | | | | 4,640 | | | | 5,932 | | | | 5,289 | | | | 1,895 | | | | 5,585 | | | | 5,929 | | | | 4,411 | | | | 5,020 | | | | 5,030 | |
Total potash sales – manufactured product tonnes | | | 9,346 | | | | 8,100 | | | | 7,230 | | | | 9,046 | | | | 8,644 | | | | 2,988 | | | | 8,547 | | | | 9,400 | | | | 7,196 | | | | 8,164 | | | | 8,276 | |
Nitrogen sales – manufactured product tonnes | | | 6,352 | | | | 5,896 | | | | 4,946 | | | | 5,147 | | | | 5,329 | | | | 5,086 | | | | 5,050 | | | | 5,756 | | | | 4,720 | | | | 4,843 | | | | 4,738 | |
Phosphate sales – manufactured product tonnes | | | 3,142 | | | | 3,680 | | | | 3,643 | | | | 3,854 | | | | 3,632 | | | | 3,055 | | | | 3,322 | | | | 4,151 | | | | 3,970 | | | | 3,860 | | | | 3,675 | |
| | |
| PotashCorp 2014 Annual Integrated Report | | 87 |
| | |
| Financial Terms | | Definition |
Adjusted EBITDA | | EBITDA + impairment charges/recoveries + takeover response costs – loss (gain) on sale of assets + plant shutdown and closure and workforce reduction costs |
Adjusted EBITDA margin | | Adjusted EBITDA / net sales |
Average adjusted assets | | Simple average of the current year’s adjusted assets and the previous year’s adjusted assets, except when a material acquisition occurred, in which case the weighted average rather than the simple average is calculated; the last material acquisition was in 1997 |
Cash flow | | Net income + income taxes + change in unrealized loss (gain) on derivatives included in net income + finance costs – current income taxes + depreciation and amortization + impairment of available-for-sale investment |
Cash flow return | | Cash flow / average (total assets – cash and cash equivalents – fair value of derivative assets + accumulated depreciation and amortization – net unrealized gain on available-for-sale investments – payables and accrued charges) |
Current income taxes | | Current income tax expense (which was already reduced by the realized excess tax benefit related to share-based compensation under previous Canadian GAAP) – realized excess tax benefit related to share-based compensation (under IFRS) |
EBITDA | | Earnings (net income) before finance costs, income taxes, depreciation and amortization |
Free cash flow | | Cash provided by operating activities – additions to property, plant and equipment – other assets and intangible assets – changes in non-cash operating working capital |
Market value of total capital | | Market value of total debt – cash and cash equivalents + market value of equity |
Net debt to capital | | (Total debt – cash and cash equivalents) / (total debt – cash and cash equivalents + total shareholders’ equity) |
Net debt to EBITDA | | (Total debt – cash and cash equivalents) / EBITDA |
Net sales | | Sales – freight, transportation and distribution |
Previous Canadian GAAP | | As we adopted IFRS with effect from January 1, 2010, our 2004 to 2009 annual information is presented on a previous Canadian GAAP basis and, to the extent such information constitutes Canadian non-GAAP measures, is reconciled to the most directly comparable measure calculated in accordance with previous Canadian GAAP. Accordingly, our information for 2004 to 2009 may not be comparable to the periods 2010 to 2014. |
Return on assets | | Net income / total assets |
Total debt to capital | | Total debt / (total debt + total shareholders’ equity) |
Total debt to net income | | Total debt / net income |
Total shareholder return | | Return on investment in PotashCorp stock from the time the investment is made based on two components: (1) growth in share price and (2) return from reinvested dividend income on the shares. |
Weighted average cost of capital | | Simple monthly average of ((market value of total debt – cash and cash equivalents) / market value of total capital x after-tax cost of debt + market value of equity / market value of total capital x cost of equity) |
| | |
| Non-Financial Terms | | Definition |
Total site severity injury rate | | Total of lost-time injuries (a lost-time injury occurs when the injured person is unable to return to work on his/her next scheduled workday after the injury) + modified work injuries (a work-related injury where a licensed health care professional or the employer recommends that the employee not perform one or more of the routine functions of the job or not work the full workday that he/she would have otherwise worked) for every 200,000 hours worked. Total site includes PotashCorp employees, contractors and others on site. |
Community investment | | Refer to Page 157 for definitions of these non-financial terms |
Community survey score | |
Customer survey score | |
Employee engagement score | |
Environmental incidents | |
Taxes and royalties | |
Total site recordable injury rate | |
Waste | |
| | |
| 88 | | PotashCorp 2014 Annual Integrated Report |

Our Financials
Mine Training Coordinator Dave Esslinger underground at our Rocanville, Saskatchewan potash mine.

| | |
| 90 | | PotashCorp 2014 Annual Integrated Report |
Financials and Notes
Management’s Responsibility
Management’s Responsibility for Financial Reporting
Management’s Report on Financial Statements
The accompanying consolidated financial statements and related financial information are the responsibility of PotashCorp management. They have been prepared in accordance with International Financial Reporting Standards as issued by the International Accounting Standards Board and include amounts based on estimates and judgments. Financial information included elsewhere in this report is consistent with the consolidated financial statements.
The consolidated financial statements are approved by the Board of Directors on the recommendation of the audit committee. The audit committee of the Board of Directors is composed entirely of independent directors. PotashCorp’s interim condensed consolidated financial statements and MD&A are discussed and analyzed by the audit committee with management before such information is approved by the committee and submitted to securities commissions or other regulatory authorities. The annual consolidated financial statements and MD&A are also analyzed by the audit committee and management and are approved by the Board of Directors.
In addition, the audit committee has the duty to review critical accounting policies and significant estimates and judgments underlying the consolidated financial statements as presented by management, and to approve the fees of our independent registered public accounting firm.
Our independent registered public accounting firm, Deloitte LLP, performs an audit of the consolidated financial statements, the results of which are reflected in their report for 2014 included on Page 93. In addition, Deloitte LLP reviews our interim condensed consolidated financial statements. Deloitte LLP have full and independent access to the audit committee to discuss their audit and related matters.
Management’s Report on Internal Control Over Financial Reporting
Management is responsible for establishing and maintaining an adequate system of internal control over financial reporting as defined in Rules 13a-15(f) and 15d-15(f) under the Securities Exchange Act of 1934, as amended. Internal control over financial reporting includes maintaining records that accurately and fairly reflect our transactions, providing reasonable assurance that: transactions are recorded for preparation of consolidated financial statements in accordance with International Financial Reporting Standards as issued by the International Accounting Standards Board; receipts and expenditures of company assets are made in accordance with management authorization; and unauthorized acquisition, use or disposition of company assets that could have a material effect on our financial statements would be prevented or detected on a timely basis. Due to its inherent limitation, internal control over financial reporting may not prevent or detect misstatements. Also, projections of any evaluation of effectiveness to future periods are subject to the risk that controls may become inadequate because of changes in conditions, or that the degree of compliance with the policies or procedures may deteriorate.
Management has assessed the effectiveness of the company’s internal control over financial reporting based on the framework in Internal Control – Integrated Framework (2013) issued by the Committee of Sponsoring Organizations of the Treadway Commission (COSO) and concluded that the company’s internal control over financial reporting was effective as at December 31, 2014. The effectiveness of the company’s internal control over financial reporting as at December 31, 2014 has been audited by Deloitte LLP, as reflected in their report for 2014 included on Page 92.
| | |
J. Tilk President and Chief Executive Officer February 20, 2015 | | W. Brownlee Executive Vice President and Chief Financial Officer |
| | |
| PotashCorp 2014 Annual Integrated Report | | 91 |
Report of Independent Registered
Public Accounting Firm
To the Board of Directors and Shareholders of Potash Corporation of Saskatchewan Inc.
We have audited the internal control over financial reporting of Potash Corporation of Saskatchewan Inc. and subsidiaries (the “Company”)as of December 31, 2014, based on the criteria established inInternal Control – Integrated Framework (2013) issued by the Committee of Sponsoring Organizations of the Treadway Commission. The Company’s management is responsible for maintaining effective internal control over financial reporting and for its assessment of the effectiveness of internal control over financial reporting, included in the accompanying Management’s Report on Internal Control Over Financial Reporting. Our responsibility is to express an opinion on the Company’s internal control over financial reporting based on our audit.
We conducted our audit in accordance with the standards of the Public Company Accounting Oversight Board (United States). Those standards require that we plan and perform the audit to obtain reasonable assurance about whether effective internal control over financial reporting was maintained in all material respects. Our audit included obtaining an understanding of internal control over financial reporting, assessing the risk that a material weakness exists, testing and evaluating the design and operating effectiveness of internal control based on the assessed risk, and performing such other procedures as we considered necessary in the circumstances. We believe that our audit provides a reasonable basis for our opinion.
A company’s internal control over financial reporting is a process designed by, or under the supervision of, the company’s principal executive and principal financial officers, or persons performing similar functions, and effected by the company’s board of directors, management, and other personnel to provide reasonable assurance regarding the reliability of financial reporting and the preparation of financial statements for external purposes in accordance with International Financial Reporting Standards as issued by the International Accounting Standards Board. A company’s internal control over financial reporting includes those policies and procedures that (1) pertain to the maintenance of records that, in reasonable detail, accurately and fairly reflect the transactions and dispositions of the assets of the company; (2) provide reasonable assurance that transactions are recorded as necessary to permit preparation of financial statements in accordance with International Financial Reporting Standards as issued by the International Accounting Standards Board, and that receipts and expenditures of the company are being made only in accordance with authorizations of management and directors of the company; and (3) provide reasonable assurance regarding prevention or timely detection of unauthorized acquisition, use, or disposition of the company’s assets that could have a material effect on the financial statements.
Because of the inherent limitations of internal control over financial reporting, including the possibility of collusion or improper management override of controls, material misstatements due to error or fraud may not be prevented or detected on a timely basis. Also, projections of any evaluation of the effectiveness of the internal control over financial reporting to future periods are subject to the risk that the controls may become inadequate because of changes in conditions, or that the degree of compliance with the policies or procedures may deteriorate.
In our opinion, the Company maintained, in all material respects, effective internal control over financial reporting as of December 31, 2014, based on the criteria established inInternal Control – Integrated Framework (2013) issued by the Committee of Sponsoring Organizations of the Treadway Commission.
We have also audited, in accordance with the standards of the Public Company Accounting Oversight Board (United States), the consolidated financial statements as of and for the year ended December 31, 2014 of the Company and our report dated February 20, 2015 expressed an unqualified opinion on those financial statements.

Chartered Professional Accountants
Saskatoon, Canada
February 20, 2015
| | |
| 92 | | PotashCorp 2014 Annual Integrated Report |
Financials and Notes
Report of Independent Registered
Public Accounting Firm
To the Board of Directors and Shareholders of Potash Corporation of Saskatchewan Inc.
We have audited the accompanying consolidated statements of financial position of Potash Corporation of Saskatchewan Inc.and subsidiaries (the “Company”) as of December 31, 2014 and 2013, and the related consolidated statements of income, comprehensive income, cash flow, and changes in equity for each of the years in the three-year period ended December 31, 2014. These financial statements are the responsibility of the Company’s management. Our responsibility is to express an opinion on these financial statements based on our audits.
We conducted our audits in accordance with the standards of the Public Company Accounting Oversight Board (United States). Those standards require that we plan and perform the audit to obtain reasonable assurance about whether the financial statements are free of material misstatement. An audit includes examining, on a test basis, evidence supporting the amounts and disclosures in the financial statements. An audit also includes assessing the accounting principles used and significant estimates made by management, as well as evaluating the overall financial statement presentation. We believe that our audits provide a reasonable basis for our opinion.
In our opinion, the consolidated financial statements present fairly, in all material respects, the financial position of Potash Corporation of Saskatchewan Inc.and subsidiaries as of December 31, 2014 and 2013, and the results of their operations and their cash flows for each of the years in the three-year period ended December 31, 2014, in conformity with International Financial Reporting Standards as issued by the International Accounting Standards Board.
We have also audited, in accordance with the standards of the Public Company Accounting Oversight Board (United States), the Company’s internal control over financial reporting as of December 31, 2014, based on the criteria established inInternal Control – Integrated Framework(2013)issued by the Committee of Sponsoring Organizations of the Treadway Commission and our report dated February 20, 2015, expressed an unqualified opinion on the Company’s internal control over financial reporting.

Chartered Professional Accountants
Saskatoon, Canada
February 20, 2015
| | |
| PotashCorp 2014 Annual Integrated Report | | 93 |
Consolidated Financial Statements
Consolidated Statements of Income
For the years ended December 31 | In millions of US dollars except as otherwise noted |
The consolidated statements of income provide a summary of the earnings for the year.
| | | | | | | | | | | | | | |
| Notes | | | | 2014 | | | 2013 | | | 2012 | |
Note 3 | | Sales | | $ | 7,115 | | | $ | 7,305 | | | $ | 7,927 | |
Note 4 | | Freight, transportation and distribution | | | (609 | ) | | | (572 | ) | | | (494 | ) |
Note 4 | | Cost of goods sold | | | (3,859 | ) | | | (3,943 | ) | | | (4,023 | ) |
| | | | | | | | | | | | | | | |
| | Gross Margin | | | 2,647 | | | | 2,790 | | | | 3,410 | |
| | | | |
Note 4 | | Selling and administrative expenses | | | (245 | ) | | | (231 | ) | | | (219 | ) |
Note 5 | | Provincial mining and other taxes | | | (257 | ) | | | (194 | ) | | | (180 | ) |
| | Share of earnings of equity-accounted investees | | | 102 | | | | 195 | | | | 278 | |
| | Dividend income | | | 117 | | | | 92 | | | | 144 | |
Note 14 | | Impairment of available-for-sale investment | | | (38 | ) | | | – | | | | (341 | ) |
Note 6 | | Other income (expenses) | | | 22 | | | | (36 | ) | | | (73 | ) |
| | | | | | | | | | | | | | | |
| | Operating Income | | | 2,348 | | | | 2,616 | | | | 3,019 | |
| | | | |
Note 7 | | Finance costs | | | (184 | ) | | | (144 | ) | | | (114 | ) |
| | | | | | | | | | | | | | | |
| | Income Before Income Taxes | | | 2,164 | | | | 2,472 | | | | 2,905 | |
| | | | |
Note 8 | | Income taxes | | | (628 | ) | | | (687 | ) | | | (826 | ) |
| | | | | | | | | | | | | | | |
| | Net Income | | $ | 1,536 | | | $ | 1,785 | | | $ | 2,079 | |
| | | | | | | | | | | | | | | |
Note 9 | | Net Income per Share | | | | | | | | | | | | |
| | Basic | | $ | 1.83 | | | $ | 2.06 | | | $ | 2.42 | |
| | Diluted | | $ | 1.82 | | | $ | 2.04 | | | $ | 2.37 | |
| | | | | | | | | | | | | | | |
Note 9 | | Weighted Average Shares Outstanding | | | | | | | | | | | | |
| | Basic | | | 838,101,000 | | | | 864,596,000 | | | | 860,033,000 | |
| | Diluted | | | 844,544,000 | | | | 873,982,000 | | | | 875,907,000 | |
| | | | | | | | | | | | | | | |
| (See | Notes to the Consolidated Financial Statements) |
| | |
| 94 | | PotashCorp 2014 Annual Integrated Report |
Financials and Notes
Consolidated Statements of Comprehensive Income
For the years ended December 31 | In millions of US dollars except as otherwise noted |
The consolidated statements of comprehensive income indicate changes in net assets during the year which were subsequently reclassified or did not pass through net income.
| | | | | | | | | | | | |
| (Net of related income taxes) | | 2014 | | | 2013 | | | 2012 | |
Net Income | | $ | 1,536 | | | $ | 1,785 | | | $ | 2,079 | |
| | | | | | | | | | | | | |
Other comprehensive (loss) income | | | | | | | | | | | | |
Items that will not be reclassified to net income: | | | | | | | | | | | | |
Net actuarial (loss) gain on defined benefit plans1 | | | (109 | ) | | | 164 | | | | (62 | ) |
Items that have been or may be subsequently reclassified to net income: | | | | | | | | | | | | |
Available-for-sale investments2 | | | | | | | | | | | | |
Net fair value (loss) gain during the year | | | (157 | ) | | | (759 | ) | | | 216 | |
Reclassification to income of unrealized loss on impaired investment (Note 14) | | | – | | | | – | | | | 341 | |
Cash flow hedges | | | | | | | | | | | | |
Net fair value loss during the year3 | | | (40 | ) | | | – | | | | (20 | ) |
Reclassification to income of net loss4 | | | 26 | | | | 33 | | | | 50 | |
Other | | | 1 | | | | – | | | | (4 | ) |
| | | | | | | | | | | | | |
Other Comprehensive (Loss) Income | | | (279 | ) | | | (562 | ) | | | 521 | |
| | | | | | | | | | | | | |
Comprehensive Income | | $ | 1,257 | | | $ | 1,223 | | | $ | 2,600 | |
| | | | | | | | | | | | | |
| 1 | Net of income taxes of $60 (2013 – $(92), 2012 – $31). |
| 2 | Available-for-sale investments are comprised of shares in Israel Chemicals Ltd. and Sinofert Holdings Limited. |
| 3 | Cash flow hedges are comprised of natural gas derivative instruments and were net of income taxes of $22 (2013 – $NIL, 2012 – $7). |
| 4 | Net of income taxes of $(14) (2013 – $(18), 2012 – $(32)). |
| (See | Notes to the Consolidated Financial Statements) |
2014 Highlights(Unaudited)
| • | | 54 percent of 2014gross marginwas earned in the potash segment; nitrogen earned 38 percent and phosphate earned 8 percent. |
| • | | Whilenet income decreased by 14 percent, the company declared dividends per shareof $1.40, the highest annual total in company history. The dividend payout ratio (calculated as dividends declared / net income) for 2014 was 76 percent. |
| • | | An impairment of the company’s available-for-sale investment in Sinofert Holdings Limited (“Sinofert”) was recognized in net income in 2014 as the fair value further declined below the carrying amount. The increase in fair value of $52 subsequent to recognition of the impairment was recorded in other comprehensive income. |
| • | | An actuarial loss on defined benefit planswas recognized in other comprehensive income mainly as a result of the change in the discount rate and actual return on plan assets during the year. This amount was closed out to retained earnings. |
| | | | | | |
| | |
 | | Pages 49-51 – Potash Performance | | Pages 66-67 – Phosphate Performance |
| | Pages 58-60 – Nitrogen Performance | | Pages 70-72 – Other Expenses and Income |
| | |
| PotashCorp 2014 Annual Integrated Report | | 95 |
Consolidated Statements of Cash Flow
For the years ended December 31 | In millions of US dollars except as otherwise noted |
The consolidated statements of cash flow start with net income adjusted for non-cash items affecting net income to arrive at cash flow from operating activities, and present investing and financing activities.
| | | | | | | | | | | | | | |
| Notes | | | | 2014 | | | 2013 | | | 2012 | |
| | Operating Activities | | | | | | | | | | | | |
| | Net income | | $ | 1,536 | | | $ | 1,785 | | | $ | 2,079 | |
Note 10 | | Adjustments to reconcile net income to cash provided by operating activities | | | 1,168 | | | | 1,142 | | | | 1,279 | |
Note 10 | | Changes in non-cash operating working capital | | | (90 | ) | | | 285 | | | | (133 | ) |
| | | | | | | | | | | | | | | |
| | Cash provided by operating activities | | | 2,614 | | | | 3,212 | | | | 3,225 | |
| | | | | | | | | | | | | | | |
| | Investing Activities | | | | | | | | | | | | |
| | Additions to property, plant and equipment | | | (1,138 | ) | | | (1,624 | ) | | | (2,133 | ) |
| | Other assets and intangible assets | | | (22 | ) | | | – | | | | (71 | ) |
| | | | | | | | | | | | | | | |
| | Cash used in investing activities | | | (1,160 | ) | | | (1,624 | ) | | | (2,204 | ) |
| | | | | | | | | | | | | | | |
| | Financing Activities | | | | | | | | | | | | |
| | Proceeds from long-term debt obligations | | | 737 | | | | – | | | | – | |
| | Repayment of, and finance costs on, long-term debt obligations | | | (500 | ) | | | (254 | ) | | | (2 | ) |
| | Proceeds from (repayment of) short-term debt obligations | | | 66 | | | | 101 | | | | (460 | ) |
| | Dividends | | | (1,141 | ) | | | (997 | ) | | | (467 | ) |
| | Repurchase of common shares | | | (1,065 | ) | | | (411 | ) | | | – | |
| | Issuance of common shares | | | 36 | | | | 39 | | | | 40 | |
| | | | | | | | | | | | | | | |
| | Cash used in financing activities | | | (1,867 | ) | | | (1,522 | ) | | | (889 | ) |
| | | | | | | | | | | | | | | |
| | (Decrease) Increase in Cash and Cash Equivalents | | | (413 | ) | | | 66 | | | | 132 | |
| | Cash and Cash Equivalents, Beginning of Year | | | 628 | | | | 562 | | | | 430 | |
| | | | | | | | | | | | | | | |
| | Cash and Cash Equivalents, End of Year | | $ | 215 | | | $ | 628 | | | $ | 562 | |
| | | | | | | | | | | | | | | |
| | Cash and cash equivalents comprised of: | | | | | | | | | | | | |
| | Cash | | $ | 89 | | | $ | 129 | | | $ | 64 | |
| | Short-term investments | | | 126 | | | | 499 | | | | 498 | |
| | | | | | | | | | | | | | | |
| | | | $ | 215 | | | $ | 628 | | | $ | 562 | |
| | | | | | | | | | | | | | | |
| (See | Notes to the Consolidated Financial Statements) |
| | |
2014 Highlights(Unaudited) • The decline incash provided by operating activities from 2013 was driven primarily by lower net income and changes in non-cash operating working capital. • Additions to property, plant and equipmentdecreased as the company’s potash capital expenditures near completion. During 2014, 46 percent of additions pertained to the potash segment. Since 2005, the company has spent CDN $7.9 billion on potash capital expenditures, which will bring nameplate potash capacity to 19.1 million tonnes, with CDN $0.5 billion remaining to be spent in aggregate during 2015 and 2016. • The company completed ashare repurchase program resulting in a cash outflow of $1,065 for the year. • The company completed the issuance of $750 of 3.625 percent senior notes and redeemed $500 of 5.250 percent senior notes during 2014, decreasing a portion ofcash used in financing activities. • Dividend paymentshave increased year-over-year. When dividends are declared, a liability is recorded and equity is reduced. Amounts flow through the statements of cash flow when the amounts are paid to shareholders, normally in the following quarter. | | 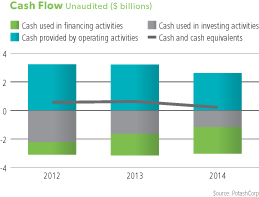
Pages 77-78– Sources and Uses of Cash |
| | |
| 96 | | PotashCorp 2014 Annual Integrated Report |
Financials and Notes
Consolidated Statements of Changes in Equity
In millions of US dollars
The consolidated statements of changes in equity show the movements in shareholders’ equity.
| | | | | | | | | | | | | | | | | | | | | | | | | | | | | | | | | | | | |
| | | | | | | | | Accumulated Other Comprehensive Income | | | | | | | |
| | | Share
Capital | | | Contributed
Surplus | | | Net
unrealized
gain on
available- for-sale
investments | | | Net loss on
derivatives
designated as
cash flow
hedges | | | Net actuarial
(loss) gain on
defined
benefit plans | | | Other | | | Total
Accumulated
Other
Comprehensive
Income | | | Retained
Earnings | | | Total Equity 1 | |
Balance – December 31, 2011 | | $ | 1,483 | | | $ | 291 | | | $ | 982 | | | $ | (168 | ) | | $ | – | 2 | | $ | 2 | | | $ | 816 | | | $ | 5,257 | | | $ | 7,847 | |
Net income | | | – | | | | – | | | | – | | | | – | | | | – | | | | – | | | | – | | | | 2,079 | | | | 2,079 | |
Other comprehensive income (loss) | | | – | | | | – | | | | 557 | | | | 30 | | | | (62 | ) | | | (4 | ) | | | 521 | | | | – | | | | 521 | |
Dividends declared | | | – | | | | – | | | | – | | | | – | | | | – | | | | – | | | | – | | | | (603 | ) | | | (603 | ) |
Effect of share-based compensation including issuance of common shares | | | 47 | | | | 8 | | | | – | | | | – | | | | – | | | | – | | | | – | | | | – | | | | 55 | |
Shares issued for dividend reinvestment plan | | | 13 | | | | – | | | | – | | | | – | | | | – | | | | – | | | | – | | | | – | | | | 13 | |
Transfer of net actuarial loss on defined benefit plans | | | – | | | | – | | | | – | | | | – | | | | 62 | | | | – | | | | 62 | | | | (62 | ) | | | – | |
| | | | | | | | | | | | | | | | | | | | | | | | | | | | | | | | | | | | | |
Balance – December 31, 2012 | | $ | 1,543 | | | $ | 299 | | | $ | 1,539 | | | $ | (138 | ) | | $ | – | 2 | | $ | (2 | ) | | $ | 1,399 | | | $ | 6,671 | | | $ | 9,912 | |
Net income | | | – | | | | – | | | | – | | | | – | | | | – | | | | – | | | | – | | | | 1,785 | | | | 1,785 | |
Other comprehensive (loss) income | | | – | | | | – | | | | (759 | ) | | | 33 | | | | 164 | | | | – | | | | (562 | ) | | | – | | | | (562 | ) |
Share repurchase (Note 23) | | | (25 | ) | | | (82 | ) | | | – | | | | – | | | | – | | | | – | | | | – | | | | (338 | ) | | | (445 | ) |
Dividends declared | | | – | | | | – | | | | – | | | | – | | | | – | | | | – | | | | – | | | | (1,146 | ) | | | (1,146 | ) |
Effect of share-based compensation including issuance of common shares | | | 52 | | | | 2 | | | | – | | | | – | | | | – | | | | – | | | | – | | | | – | | | | 54 | |
Shares issued for dividend reinvestment plan | | | 30 | | | | – | | | | – | | | | – | | | | – | | | | – | | | | – | | | | – | | | | 30 | |
Transfer of net actuarial gain on defined benefit plans | | | – | | | | – | | | | – | | | | – | | | | (164 | ) | | | – | | | | (164 | ) | | | 164 | | | | – | |
| | | | | | | | | | | | | | | | | | | | | | | | | | | | | | | | | | | | | |
Balance – December 31, 2013 | | $ | 1,600 | | | $ | 219 | | | $ | 780 | | | $ | (105 | ) | | $ | – | 2 | | $ | (2 | ) | | $ | 673 | | | $ | 7,136 | | | $ | 9,628 | |
Net income | | | – | | | | – | | | | – | | | | – | | | | – | | | | – | | | | – | | | | 1,536 | | | | 1,536 | |
Other comprehensive (loss) income | | | – | | | | – | | | | (157 | ) | | | (14 | ) | | | (109 | ) | | | 1 | | | | (279 | ) | | | – | | | | (279 | ) |
Share repurchase (Note 23) | | | (53 | ) | | | (2 | ) | | | – | | | | – | | | | – | | | | – | | | | – | | | | (976 | ) | | | (1,031 | ) |
Dividends declared | | | – | | | | – | | | | – | | | | – | | | | – | | | | – | | | | – | | | | (1,164 | ) | | | (1,164 | ) |
Effect of share-based compensation including issuance of common shares | | | 49 | | | | 17 | | | | – | | | | – | | | | – | | | | – | | | | – | | | | – | | | | 66 | |
Shares issued for dividend reinvestment plan | | | 36 | | | | – | | | | – | | | | – | | | | – | | | | – | | | | – | | | | – | | | | 36 | |
Transfer of net actuarial loss on defined benefit plans | | | – | | | | – | | | | – | | | | – | | | | 109 | | | | – | | | | 109 | | | | (109 | ) | | | – | |
| | | | | | | | | | | | | | | | | | | | | | | | | | | | | | | | | | | | | |
Balance – December 31, 2014 | | $ | 1,632 | | | $ | 234 | | | $ | 623 | | | $ | (119 | ) | | $ | – | 2 | | $ | (1 | ) | | $ | 503 | | | $ | 6,423 | | | $ | 8,792 | |
| | | | | | | | | | | | | | | | | | | | | | | | | | | | | | | | | | | | | |
| 1 | All equity transactions were attributable to common shareholders. |
| 2 | Any amounts incurred during a period were closed out to retained earnings at each period-end. Therefore, no balance exists at the beginning or end of period. |
(See Notes to the Consolidated Financial Statements)
| | |
| PotashCorp 2014 Annual Integrated Report | | 97 |
Consolidated Statements of Financial Position
As at December 31 | In millions of US dollars |
The consolidated statements of financial position show assets, liabilities and equity.
| | | | | | | | | | |
| Notes | | | | 2014 | | | 2013 | |
| | Assets | | | | | | | | |
| | Current assets | | | | | | | | |
| | Cash and cash equivalents | | $ | 215 | | | $ | 628 | |
Note 11 | | Receivables | | | 1,029 | | | | 752 | |
Note 12 | | Inventories | | | 646 | | | | 728 | |
| | Prepaid expenses and other current assets | | | 48 | | | | 81 | |
| | | | | | | | | | | |
| | | | | 1,938 | | | | 2,189 | |
| | Non-current assets | | | | | | | | |
Note 13 | | Property, plant and equipment | | | 12,674 | | | | 12,233 | |
Note 14 | | Investments in equity-accounted investees | | | 1,211 | | | | 1,276 | |
Note 14 | | Available-for-sale investments | | | 1,527 | | | | 1,722 | |
Note 15 | | Other assets | | | 232 | | | | 401 | |
Note 16 | | Intangible assets | | | 142 | | | | 137 | |
| | | | | | | | | | | |
| | Total Assets | | $ | 17,724 | | | $ | 17,958 | |
| | | | | | | | | | | |
| | Liabilities | | | | | | | | |
| | Current liabilities | | | | | | | | |
Note 17, 20 | | Short-term debt and current portion of long-term debt | | $ | 1,032 | | | $ | 967 | |
Note 18 | | Payables and accrued charges | | | 1,086 | | | | 1,104 | |
Note 19 | | Current portion of derivative instrument liabilities | | | 80 | | | | 42 | |
| | | | | | | | | | | |
| | | | | 2,198 | | | | 2,113 | |
| | Non-current liabilities | | | | | | | | |
Note 20 | | Long-term debt | | | 3,213 | | | | 2,970 | |
Note 19 | | Derivative instrument liabilities | | | 115 | | | | 129 | |
Note 8 | | Deferred income tax liabilities | | | 2,201 | | | | 2,013 | |
Note 21 | | Pension and other post-retirement benefit liabilities | | | 503 | | | | 410 | |
Note 22 | | Asset retirement obligations and accrued environmental costs | | | 589 | | | | 557 | |
| | Other non-current liabilities and deferred credits | | | 113 | | | | 138 | |
| | | | | | | | | | | |
| | Total Liabilities | | | 8,932 | | | | 8,330 | |
| | | | | | | | | | | |
| | Shareholders’ Equity | | | | | | | | |
Note 23 | | Share capital | | | 1,632 | | | | 1,600 | |
| | Contributed surplus | | | 234 | | | | 219 | |
| | Accumulated other comprehensive income | | | 503 | | | | 673 | |
| | Retained earnings | | | 6,423 | | | | 7,136 | |
| | | | | | | | | | | |
| | Total Shareholders’ Equity | | | 8,792 | | | | 9,628 | |
| | | | | | | | | | | |
| | Total Liabilities and Shareholders’ Equity | | $ | 17,724 | | | $ | 17,958 | |
| | | | | | | | | | | |
| (See | Notes to the Consolidated Financial Statements) |
Approved by the Board of Directors,
| | |

| | 
|
| Director | | Director |
| |
| | |
| | |
| 98 | | PotashCorp 2014 Annual Integrated Report |
Financials and Notes
In millions of US dollars except as otherwise noted
2014 Highlights(Unaudited)
| • | | Thecurrent ratio1 was 0.88 as at December 31, 2014 (2013 – 1.04). |
| • | | A net repatriation ofcash and cash equivalents held in certain foreign subsidiaries totaling $454 was completed in 2014. |
| • | | Property, plant and equipment increased by 4 percent to $12,674 primarily as a result of the potash capital expenditures ongoing in New Brunswick and Rocanville, and nitrogen capacity expansions. |
| • | | Available-for-sale investmentsdecreased due to reductions in the fair value of our investments in Sinofert and Israel Chemicals Ltd. (“ICL”). |
| • | | Long-term debt, including long-term and current portions, increased during 2014 as the issuance of $750 of 3.625 percent senior notes more than offset the redemption of $500 of 5.250 percent senior notes. The next maturity of long-term debt is the $500 of 3.750 percent senior notes due September 30, 2015. Including short-term debt, thetotal debt-to-capital ratio2 was 33 percent as at December 31, 2014. |
| • | | As at December 31, 2014, the company’sdefined benefit pensionplans were 94 percent funded (2013 – 104 percent). The company’s other defined benefit plans are non-funded. |
| • | | Total equity highlights are outlined in the consolidated statements of changes in equity. |
| • | | The company completed ashare repurchase program, executed between August 2013 and June 2014, resulting in a program total of 43,345,992 common shares being repurchased for cancellation at a cost of $1,476 and an average price per share of $34.05. Since 1999, the company has repurchased a total of 288,183,612 common shares at a cost of $7,818 and an average price per share of $27.13. |
| • | | There was an increase in quarterlydividends declared by the company of 150 percent since the beginning of 2012 and 25 percent since the beginning of 2013. |
Page 75– Financial Condition Review
Pages 79-80– Capital Structure and Management
| 1 | Current assets / current liabilities. |
| 2 | Total debt / (total debt + total shareholders’ equity). |
| | |
| PotashCorp 2014 Annual Integrated Report | | 99 |
In millions of US dollars except as otherwise noted

Potash Corporation of Saskatchewan Inc. (“PCS”) – together known as “PotashCorp” or “the company” except to the extent the context otherwise requires – aspires for the highest standards of financial reporting and as such, it strives to improve the structure and content of its financial reports for understandability and transparency. The main changes compared to the financial statements included in PotashCorp’s 2013 Annual Integrated Report are as follows:
| • | | The consolidated financial statements, and related notes, have been reordered. |
| • | | The details of items within the consolidated statements of cash flow reconciling net income to cash provided by operating activities and changes in non-cash operating working capital have been moved to Note 10. |
| • | | The weighted average number of shares used in the computation of basic and diluted earnings per share has been added to the consolidated statements of income. Previously, amounts were disclosed in the earnings per share note only. |
| • | | Various unaudited commentary and graphs have been presented alongside the audited financial statements and notes and accordingly do not form part of the audited financial statements upon which the independent registered public accounting firm provide their audit opinion. |

PotashCorp is a crop nutrient company and plays an integral role in global food production. The company produces the three essential nutrients – potash, nitrogen and phosphate – required to help farmers grow healthier, more abundant crops.
With its subsidiaries, PotashCorp forms an integrated fertilizer and related industrial and feed products company. As at December 31, 2014, the company had producing assets as follows:
POTASH
| | – | five operations in the province of Saskatchewan |
| | – | one operation in the province of New Brunswick |
NITROGEN
| | – | three plants, one located in each of the states of Georgia, Louisiana and Ohio |
| | – | large-scale operations in Trinidad |
PHOSPHATE
| | – | a mine and processing plants in the state of North Carolina |
| | – | a mine and processing plants in the state of Florida |
| | – | a processing plant in the state of Louisiana |
| | – | phosphate feed plants in the states of Illinois, Missouri, Nebraska and North Carolina |
| | – | an industrial phosphoric acid plant in the state of Ohio |
Previously, the company also had an agreement regarding mining rights to potash reserves at a sixth location in Saskatchewan, which expired December 31, 2012.
In North America, the company leased or owned 263 terminal and warehouse facilities as at December 31, 2014, some of which have multi-product capability, for a total of 352 distribution points, and serviced customers with a fleet of approximately 9,720 railcars. In the offshore market, it leased one warehouse in China and one in Malaysia and had ownership in a joint venture which leases a dry bulk fertilizer port terminal in Brazil.
PotashCorp sells potash from its Saskatchewan mines for use outside North America exclusively to Canpotex Limited (“Canpotex”). A potash export, sales and marketing company owned in equal shares by the three producers in Saskatchewan (including the company), Canpotex resells potash to offshore customers. PCS Sales (Canada) Inc. and PCS Sales (USA), Inc., wholly owned subsidiaries of PCS, execute marketing and sales for the company’s potash, nitrogen and phosphate products in North America and offshore marketing and sales for the company’s New Brunswick potash, along with all nitrogen and phosphate products. Until December 31, 2013, Phosphate Chemicals Export Association, Inc. (“PhosChem”), a phosphate export association established under US law, was the principal vehicle through which the company executed offshore marketing and sales for its solid phosphate fertilizers; products which are now sold by PCS Sales (USA), Inc.
| | |
| 100 | | PotashCorp 2014 Annual Integrated Report |
Financials and Notes
In millions of US dollars except as otherwise noted
Certain of the company’s accounting policies that relate to the financial statements as a whole, as well as estimates and judgments it has made and how they affect the amounts reported in the consolidated financial statements, are incorporated in this section. Where an accounting policy is applicable to a specific note to the accounts, the policy is described within that note. This note also describes new standards, amendments or interpretations that were either effective and applied by the company during 2014 or that were not yet effective.
These consolidated financial statements have been prepared in accordance with International Financial Reporting Standards, as issued by the International Accounting Standards Board (“IFRS”). The company has consistently applied the same accounting policies throughout all periods presented, as if these policies had always been in effect.
The company is a foreign private issuer in the US that voluntarily files its consolidated financial statements with the Securities and Exchange Commission (the “SEC”) on US domestic filer forms. In addition, the company is permitted to file with the SEC its audited consolidated financial statements under IFRS without a reconciliation to US generally accepted accounting principles (“US GAAP”). As a result, the company does not prepare a reconciliation of its results to US GAAP. It is possible that certain of its accounting policies could be different from US GAAP.
These consolidated financial statements were authorized by the audit committee of the Board of Directors for issue on February 20, 2015.
These consolidated financial statements were prepared under the historical cost convention, except for certain items not carried at historical cost as discussed in the applicable accounting policies.
Accounting Policies, Estimates and Judgments
The following table discusses the accounting policies, estimates, judgments and assumptions that the company has adopted and made and how they affect the amounts reported in the consolidated financial statements.
| | | | |
| Topic | | Accounting Policies | | Accounting Estimates and Judgments 1 |
| Principles of Consolidation | | These consolidated financial statements include the accounts of the company and entities controlled by it (its subsidiaries). Control is achieved by having each of: • power over the investee via existing rights that give the company the current ability to direct the relevant activities of the investee; • exposure, or rights, to variable returns from involvement with the investee; and • the ability for the company to use its power over the investee to affect the amount of the company’s returns. The existence and effect of potential voting rights that are currently exercisable or convertible are considered when assessing whether the company controls another entity. Subsidiaries are fully consolidated from the date on which control is transferred to the company. They are deconsolidated from the date that control ceases. Principal (wholly owned) operating subsidiaries are: • PCS Sales (Canada) Inc. – PCS Joint Venture, Ltd. (“PCS Joint Venture”) • PCS Sales (USA), Inc. • PCS Phosphate Company, Inc. (“PCS Phosphate”) – PCS Purified Phosphates • White Springs Agricultural Chemicals, Inc. (“White Springs”) • PCS Nitrogen Fertilizer, L.P. • PCS Nitrogen Ohio, L.P. • PCS Nitrogen Trinidad Limited • PCS Cassidy Lake Company Intercompany balances and transactions are eliminated on consolidation. | | Assessing whether the company controls certain investees involves determining if it has the power to direct the relevant activities of the investee. Determining the relevant activities and which party controls them, if any, involves judgment. In making judgments and assessing the substance of the relationship, consideration is given to voting rights, the relative size and dispersion of the voting rights held by other shareholders, the extent of participation by those shareholders in appointing key management personnel or board members, the right to direct the investee to enter into transactions for the company’s benefit and the exposure, or rights, to variability of returns from the company’s involvement with the investee. |
| | |
| PotashCorp 2014 Annual Integrated Report | | 101 |
In millions of US dollars except as otherwise noted
Note 2 Basis of Presentation continued
| | | | |
| Topic | | Accounting Policies | | Accounting Estimates and Judgments 1 |
| Long-Lived Asset Impairment | | Assets that have an indefinite useful life (i.e., goodwill) are not subject to amortization and are tested at least annually for impairment (typically in the second quarter), or more frequently if events or circumstances indicate there may be an impairment. At the end of each reporting period, the company reviews the carrying amounts of both its long-lived assets to be held and used and its identifiable intangible assets with finite lives to determine whether there is any indication that they have suffered an impairment loss. For assessing impairment, assets are grouped at the smallest levels for which there are separately identifiable cash inflows that are largely independent of the cash inflows from other assets or groups of assets (this can be at the asset or cash-generating unit (“CGU”) level). If an indication of impairment exists, the recoverable amount of the asset or CGU is estimated in order to determine the extent of the impairment loss (if any). An impairment loss is recognized as the amount by which the asset’s or CGU’s carrying amount exceeds its recoverable amount. If the recoverable amount of the CGU is less than its carrying amount, the impairment loss is allocated first to reduce the carrying amount of any goodwill allocated to the CGU and then to the other assets of the CGU pro rata on the basis of the carrying amount of each asset in the unit. The recoverable amount is the higher of an asset’s or CGU’s fair value less costs to sell and value in use. In assessing value in use, the estimated future cash flows are discounted to their present value using a pre-tax discount rate that reflects current market assessments of the time value of money and the risks specific to the asset or CGU for which the estimates of future cash flows have not been adjusted. Non-financial assets, other than goodwill, that previously suffered an impairment loss are reviewed at each reporting date for possible reversal of the impairment. | | The impairment process begins with the identification of the appropriate asset or CGU for purposes of impairment testing. Identification and measurement of any impairment are based on the asset’s or CGU’s recoverable amount, which is the higher of its fair value less costs to sell and its value in use. Value in use is generally based on an estimate of discounted future cash flows. Judgment is required in determining the appropriate discount rate. Assumptions must also be made about future sales, margins and market conditions over the long-term life of the assets or CGUs. The company cannot predict if an event that triggers impairment will occur, when it will occur or how it will affect reported asset amounts. The company makes estimates which are subject to significant uncertainties and judgments. As a result, it is reasonably possible that the amounts reported for asset impairments could be different if different assumptions were used or if market and other conditions change. The changes could result in non-cash charges that could materially affect the company’s consolidated financial statements. |
| Fair Value Measurements | | Fair value is the price that would be received to sell an asset or paid to transfer a liability in an orderly transaction between market participants at the measurement date, regardless of whether that price is directly observable or estimated using another valuation technique. For financial reporting purposes, fair value measurements are categorized into Level 1, 2 or 3 based on the degree to which the inputs to the fair value measurement are observable and the significance of the inputs. The company’s fair value hierarchy prioritizes the inputs to valuation techniques used to measure fair value. The three levels of the fair value hierarchy are: Level 1 Values based on unadjusted quoted prices in active markets that are accessible at the measurement date for identical assets or liabilities. Level 2 Values based on quoted prices in markets that are not active or model inputs that are observable either directly or indirectly for substantially the full term of the asset or liability. Level 3 Values based on prices or valuation techniques that require inputs which are both unobservable and significant to the overall fair value measurement. | | Fair value represents point-in-time estimates that may change in subsequent reporting periods due to market conditions or other factors. Multiple methods exist by which fair value can be determined, which can cause values (or a range of reasonable values) to differ. Further, assumptions underlying the valuations may require estimation of costs/prices over time, discount rates, inflation rates, defaults and other relevant variables. Judgment and estimation are required to determine in which category of the three-level hierarchy items should be included. Categorization is based on the company’s assessment of the lowest level input that is significant to the fair value measurement. |
| Prepaid Expenses | | The company has classified freight and other transportation and distribution costs incurred relating to product inventory stored at warehouse and terminal facilities as prepaid expenses. | | Not applicable |
| | |
| 102 | | PotashCorp 2014 Annual Integrated Report |
Financials and Notes
In millions of US dollars except as otherwise noted
Note 2 Basis of Presentation continued
| | | | |
| Topic | | Accounting Policies | | Accounting Estimates and Judgments 1 |
| Restructuring Charges | | Plant shutdowns, sales of business units or other corporate restructurings may trigger incremental costs to the company such as expenses for employee termination, contract termination and other exit costs. The company recognizes restructuring costs as a liability and an expense when it has demonstrably committed to a detailed formal plan for the restructuring and it is without realistic possibility of withdrawal. In addition, it must be possible to make a reliable estimate of the amounts. | | Because such restructuring activities are complex processes that can take several months to complete, they involve making and reassessing estimates. |
| Foreign Currency Transactions | | Items included in the consolidated financial statements of the company and each of its subsidiaries are measured using the currency of the primary economic environment in which the individual entity operates (“the functional currency”). Foreign currency transactions, including Canadian, Trinidadian and Chilean currency operating transactions, are generally translated to US dollars at the average exchange rate for the previous month. Monetary assets and liabilities are translated at period-end exchange rates. Foreign exchange gains and losses resulting from the settlement of such transactions, and from the translation at period-end exchange rates of monetary assets and liabilities denominated in foreign currencies, are recognized in net income in the period in which they arise. Foreign exchange gains and losses are presented in the statements of income within other income (expenses) as applicable. Non-monetary assets and liabilities carried at fair value are translated using the exchange rate at the date when the fair value is determined and translation differences are recognized as part of changes in fair value. Translation differences onnon-monetary financial assets such as investments in equity securities classified as available-for-sale are included in other comprehensive income (“OCI”). Non-monetary assets measured at historical cost are translated at the average monthly exchange rate prevailing at the time of the transaction, unless the exchange rate in effect on the date that the transaction occurred is available and it is apparent that such rate is a more suitable measurement. | | The consolidated financial statements are presented in United States dollars (“US dollars”), which was determined to be the functional currency of the company and the majority of its subsidiaries. |
| 1 | Certain of the company’s policies involve accounting estimates and judgments because they require the company to make subjective or complex judgments about matters that are inherently uncertain and because of the likelihood that materially different amounts could be reported under different conditions or using different assumptions. |
To facilitate a better understanding of the company’s consolidated financial statements, additional significant accounting policies, estimates and judgments (with the exception of those identified in this Note 2) are disclosed throughout the following notes, with the related financial disclosures by major caption:
| | | | | | | | | | | | | | |
| Note | | Topic | | Accounting Policies | | | Accounting
Estimates and
Judgments | | | Page | |
| 3 | | Revenue recognition | | | X | | | | X | | | | 105 | |
| 4 | | Cost of goods sold | | | X | | | | | | | | 107 | |
| 4 | | Selling and administrative expenses | | | X | | | | | | | | 107 | |
| 8 | | Income taxes | | | X | | | | X | | | | 109 | |
| 10 | | Cash equivalents | | | X | | | | | | | | 114 | |
| 11 | | Receivables | | | X | | | | X | | | | 114 | |
| 12 | | Inventories | | | X | | | | X | | | | 115 | |
| 13 | | Property, plant and equipment | | | X | | | | X | | | | 116 | |
| 14 | | Investments | | | X | | | | X | | | | 118 | |
| 15 | | Other assets | | | | | | | X | | | | 120 | |
| 16 | | Intangible assets | | | X | | | | X | | | | 121 | |
| 19 | | Derivative instruments | | | X | | | | X | | | | 123 | |
| 20 | | Long-term debt | | | X | | | | | | | | 125 | |
| | | | | | | | | | | | | | |
| Note | | Topic | | Accounting Policies | | | Accounting
Estimates and
Judgments | | | Page | |
| 21 | | Pension and other post-retirement benefits | | | X | | | | X | | | | 126 | |
| 22 | | Provisions for asset
retirement, environmental and other obligations | | | X | | | | X | | | | 133 | |
| 24 | | Share-based compensation | | | X | | | | X | | | | 137 | |
| 25 | | Fair value and offsetting of financial instruments | | | X | | | | X | | | | 140 | |
| 27 | | Commitments | | | X | | | | X | | | | 147 | |
| 28 | | Contingencies | | | X | | | | X | | | | 148 | |
| 29 | | Guarantees | | | X | | | | | | | | 150 | |
| 30 | | Related party transactions | | | X | | | | | | | | 152 | |
| | |
| PotashCorp 2014 Annual Integrated Report | | 103 |
In millions of US dollars except as otherwise noted
Note 2 Basis of Presentation continued
Standards, Amendments and Interpretations Effective and Applied
The International Accounting Standards Board (“IASB”) and International Financial Reporting Interpretations Committee (“IFRIC”) have issued the following standards and amendments or interpretations to existing standards that were effective and applied by the company.
| | | | |
| Standard | | Description | | Impact |
| Amendments to IAS 32, Offsetting Financial Assets and Financial Liabilities | | Issued as part of IASB’s offsetting project, amendments clarify certain items regarding offsetting financial assets and financial liabilities. | | Adopted retrospectively effective January 1, 2014 with no change to these consolidated financial statements. |
| Amendments to IAS 36, Recoverable Amount Disclosures for Non-Financial Assets | | Amendments were issued that clarify disclosure requirements for the recoverable amount of an asset or CGU. | | Adopted retrospectively effective January 1, 2014 with no change to these consolidated financial statements. |
| IFRIC 21, Levies | | Provides guidance on when to recognize a liability for a levy imposed by a government. | | Adopted retrospectively effective January 1, 2014 with no change to these consolidated financial statements. |
| Amendments to IAS 19, Employee Benefits | | Issued to simplify the accounting for employee or third-party contributions to defined benefit plans that are independent of the number of years of employee service. | | Adopted retrospectively effective July 1, 2014 with no change to these consolidated financial statements. |
Standards, Amendments and Interpretations not yet Effective and not Applied
The IASB and IFRIC have issued the following standards and amendments or interpretations to existing standards that were not yet effective and not applied as at December 31, 2014. The company does not anticipate early adoption of these standards at this time.
| | | | | | |
| Standard | | Description | | Impact | | Effective Date 1 |
| Amendments to IAS 1, Presentation of Financial Statements | | Issued to improve the effectiveness of presentation and disclosure in financial reports, with the objective of reducing immaterial note disclosures. | | The company is reviewing the standard to determine the potential impact, if any. | | January 1, 2016, applied prospectively. |
| Amendments to IAS 16, Property, Plant and Equipment and IAS 38, Intangible Assets | | Issued to clarify acceptable methods of depreciation and amortization. | | The company is reviewing the standard to determine the potential impact, if any; however, no significant impact is anticipated. | | January 1, 2016, applied prospectively. |
| Amendments to IFRS 11, Joint Arrangements | | Issued to provide additional guidance on accounting for the acquisition of an interest in a joint operation. | | The company is reviewing the standard to determine the potential impact, if any; however, no significant impact is anticipated. | | January 1, 2016, applied prospectively. |
| IFRS 15, Revenue From Contracts With Customers | | Issued to provide guidance on the recognition of revenue from contracts with customers, including multiple-element arrangements and transactions not previously addressed comprehensively, and to enhance disclosures about revenue. | | The company is reviewing the standard to determine the potential impact, if any. | | January 1, 2017, applied retrospectively with certain limitations. |
| IFRS 9, Financial Instruments | | Issued to replace IAS 39, providing guidance on the classification, measurement and disclosure of financial instruments and introducing a new hedge accounting model. | | The company is reviewing the standard to determine the potential impact, if any. | | January 1, 2018, applied retrospectively with certain exceptions. |
| 1 | Effective date for annual periods beginning on or after the stated date. |
| | |
| 104 | | PotashCorp 2014 Annual Integrated Report |
Financials and Notes
In millions of US dollars except as otherwise noted

The company has three reportable operating segments: potash, nitrogen and phosphate. These segments are differentiated by the chemical nutrient contained in the products that each produces.
| | |
Accounting Policies | | Accounting Estimates and Judgments |
The accounting policies of the segments are the same as those described in Note 2 and other relevant notes and are measured in a manner consistent with that of the financial statements. Inter-segment sales are made under terms that approximate market value. Sales revenue is recognized when the product is shipped, the sales price and costs incurred or to be incurred can be measured reliably, and collectibility is probable. Revenue is recorded based on the FOB mine, plant, warehouse or terminal price, except for certain vessel sales or specific product sales that are shipped and recorded on a delivered basis. Transportation costs are recovered from the customer through sales pricing. Revenue is measured at the fair value of the consideration received or receivable, taking into account the amount of any trade discounts and volume rebates allowed. | | The company’s operating segments have been determined based on reports reviewed by the Chief Executive Officer, assessed to be the company’s chief operating decision-maker, that are used to make strategic decisions. |
Supporting Information
Financial information on each of these segments is summarized in the following tables:
| | | | | | | | | | | | | | | | | | | | |
| 2014 | | | | | | | | | | | | | | | |
| | | Potash | | | Nitrogen | | | Phosphate | | | All Others | | | Consolidated | |
Sales – third party | | $ | 2,828 | | | $ | 2,425 | | | $ | 1,862 | | | $ | – | | | $ | 7,115 | |
Freight, transportation and distribution – third party | | | (291 | ) | | | (117 | ) | | | (201 | ) | | | – | | | | (609 | ) |
Net sales – third party | | | 2,537 | | | | 2,308 | | | | 1,661 | | | | – | | | | | |
Cost of goods sold – third party | | | (1,102 | ) | | | (1,357 | ) | | | (1,400 | ) | | | – | | | | (3,859 | ) |
Margin (cost) on inter-segment sales 1 | | | – | | | | 59 | | | | (59 | ) | | | – | | | | – | |
Gross margin | | | 1,435 | | | | 1,010 | | | | 202 | | | | – | | | | 2,647 | |
Depreciation and amortization | | | (224 | ) | | | (173 | ) | | | (297 | ) | | | (7 | ) | | | (701 | ) |
Assets | | | 9,615 | | | | 2,444 | | | | 2,344 | | | | 3,321 | | | | 17,724 | |
Cash outflows for additions to property, plant and equipment | | | 521 | | | | 388 | | | | 203 | | | | 26 | | | | 1,138 | |
| | | | | | | | | | | | | | | | | | | | | |
| 1 | Inter-segment net sales were $107. |
| | | | | | | | | | | | | | | | | | | | |
| 2013 | | | | | | | | | | | | | | | |
| | | Potash | | | Nitrogen | | | Phosphate | | | All Others | | | Consolidated | |
Sales – third party | | $ | 2,963 | | | $ | 2,275 | | | $ | 2,067 | | | $ | – | | | $ | 7,305 | |
Freight, transportation and distribution – third party | | | (256 | ) | | | (101 | ) | | | (215 | ) | | | – | | | | (572 | ) |
Net sales – third party | | | 2,707 | | | | 2,174 | | | | 1,852 | | | | – | | | | | |
Cost of goods sold – third party | | | (1,134 | ) | | | (1,316 | ) | | | (1,493 | ) | | | – | | | | (3,943 | ) |
Margin (cost) on inter-segment sales 1 | | | – | | | | 55 | | | | (55 | ) | | | – | | | | – | |
Gross margin | | | 1,573 | | | | 913 | | | | 304 | | | | – | | | | 2,790 | |
Depreciation and amortization | | | (176 | ) | | | (161 | ) | | | (294 | ) | | | (35 | ) | | | (666 | ) |
Assets | | | 9,262 | | | | 2,215 | | | | 2,468 | | | | 4,013 | | | | 17,958 | |
Cash outflows for additions to property, plant and equipment | | | 1,151 | | | | 184 | | | | 238 | | | | 51 | | | | 1,624 | |
| | | | | | | | | | | | | | | | | | | | | |
| 1 | Inter-segment net sales were $139. |
| | |
| PotashCorp 2014 Annual Integrated Report | | 105 |
In millions of US dollars except as otherwise noted
Note 3 Segment Information continued
| | | | | | | | | | | | | | | | | | | | |
| 2012 | | | | | | | | | | | | | | | |
| | | Potash | | | Nitrogen | | | Phosphate | | | All Others | | | Consolidated | |
Sales – third party | | $ | 3,285 | | | $ | 2,350 | | | $ | 2,292 | | | $ | – | | | $ | 7,927 | |
Freight, transportation and distribution – third party | | | (206 | ) | | | (97 | ) | | | (191 | ) | | | – | | | | (494 | ) |
Net sales – third party | | | 3,079 | | | | 2,253 | | | | 2,101 | | | | – | | | | | |
Cost of goods sold – third party | | | (1,116 | ) | | | (1,341 | ) | | | (1,566 | ) | | | – | | | | (4,023 | ) |
Margin (cost) on inter-segment sales 1 | | | – | | | | 66 | | | | (66 | ) | | | – | | | | – | |
Gross margin | | | 1,963 | | | | 978 | | | | 469 | | | | – | | | | 3,410 | |
Depreciation and amortization | | | (158 | ) | | | (138 | ) | | | (261 | ) | | | (21 | ) | | | (578 | ) |
Assets | | | 8,597 | | | | 2,262 | | | | 2,562 | | | | 4,785 | | | | 18,206 | |
Cash outflows for additions to property, plant and equipment | | | 1,424 | | | | 379 | | | | 245 | | | | 85 | | | | 2,133 | |
| | | | | | | | | | | | | | | | | | | | | |
| 1 | Inter-segment net sales were $153. |
Termination costs of $60 related to operating and workforce changes were recognized during 2013 in the company’s operating segments as follows: potash $32; nitrogen $1; phosphate $17 and all others $10. There were no similar costs in 2014 or 2012.
As described in Note 1, Canpotex and PhosChem executed offshore marketing, sales and distribution functions for certain of the company’s products. Financial information by geographic area is summarized in the following tables:
| | | | | | | | | | | | | | | | | | | | |
| 2014 | | Country of Origin | |
| | | Canada | | | United States | | | Trinidad | | | Other | | | Consolidated | |
Sales to customers outside the company | | | | | | | | | | | | | | | | | | | | |
Canada | | $ | 153 | | | $ | 179 | | | $ | – | | | $ | – | | | $ | 332 | |
United States | | | 1,295 | | | | 2,623 | | | | 603 | | | | – | | | | 4,521 | |
Canpotex1 | | | 1,233 | | | | – | | | | – | | | | – | | | | 1,233 | |
Mexico | | | 8 | | | | 102 | | | | – | | | | – | | | | 110 | |
Trinidad | | | – | | | | – | | | | 364 | | | | – | | | | 364 | |
Brazil | | | 22 | | | | 30 | | | | – | | | | – | | | | 52 | |
Colombia | | | 39 | | | | 16 | | | | 48 | | | | – | | | | 103 | |
Other Latin America | | | 78 | | | | 38 | | | | 66 | | | | – | | | | 182 | |
India | | | – | | | | 169 | | | | – | | | | – | | | | 169 | |
Other | | | – | | | | 17 | | | | 32 | | | | – | | | | 49 | |
| | | | | | | | | | | | | | | | | | | | | |
| | $ | 2,828 | | | $ | 3,174 | | | $ | 1,113 | | | $ | – | | | $ | 7,115 | |
| | | | | | | | | | | | | | | | | | | | | |
Non-current assets 2 | | $ | 9,127 | | | $ | 3,230 | | | $ | 632 | | | $ | 17 | | | $ | 13,006 | |
| | | | | | | | | | | | | | | | | | | | | |
| 1 | Canpotex’s 2014 sales volumes were made to: Latin America 26%, China 16%, India 10%, other Asian countries 41%, other countries 7% (Note 30). |
| 2 | Includes non-current assets other than financial instruments, equity-accounted investees, deferred tax assets and post-employment benefit assets. |
| | |
| 106 | | PotashCorp 2014 Annual Integrated Report |
Financials and Notes
In millions of US dollars except as otherwise noted
Note 3 Segment Information continued
| | | | | | | | | | | | | | | | | | | | |
| 2013 | | Country of Origin | |
| | | Canada | | | United States | | | Trinidad | | | Other | | | Consolidated | |
Sales to customers outside the company | | | | | | | | | | | | | | | | | | | | |
Canada | | $ | 165 | | | $ | 200 | | | $ | – | | | $ | – | | | $ | 365 | |
United States | | | 1,285 | | | | 2,580 | | | | 611 | | | | – | | | | 4,476 | |
Canpotex1 | | | 1,253 | | | | – | | | | – | | | | – | | | | 1,253 | |
PhosChem2 | | | – | | | | 97 | | | | – | | | | – | | | | 97 | |
Mexico | | | 6 | | | | 106 | | | | – | | | | – | | | | 112 | |
Trinidad | | | – | | | | – | | | | 285 | | | | – | | | | 285 | |
Brazil | | | 168 | | | | 41 | | | | – | | | | – | | | | 209 | |
Colombia | | | 30 | | | | 10 | | | | 58 | | | | – | | | | 98 | |
Other Latin America | | | 56 | | | | 38 | | | | 62 | | | | – | | | | 156 | |
India | | | – | | | | 224 | | | | – | | | | – | | | | 224 | |
Other | | | – | | | | 21 | | | | 9 | | | | – | | | | 30 | |
| | | | | | | | | | | | | | | | | | | | | |
| | $ | 2,963 | | | $ | 3,317 | | | $ | 1,025 | | | $ | – | | | $ | 7,305 | |
| | | | | | | | | | | | | | | | | | | | | |
Non-current assets 3 | | $ | 8,844 | | | $ | 3,116 | | | $ | 637 | | | $ | 18 | | | $ | 12,615 | |
| | | | | | | | | | | | | | | | | | | | | |
| 1 | Canpotex’s 2013 sales volumes were made to: Latin America 28%, China 15%, India 10%, other Asian countries 41%, other countries 6% (Note 30). |
| 2 | PhosChem’s 2013 sales volumes were made to: Latin America 55%, India 14%, China NIL%, other Asian countries 16%, other countries 15%. |
| 3 | Includes non-current assets other than financial instruments, equity-accounted investees, deferred tax assets and post-employment benefit assets. |
| | | | | | | | | | | | | | | | | | | | |
| 2012 | | Country of Origin | |
| | | Canada | | | United States | | | Trinidad | | | Other | | | Consolidated | |
Sales to customers outside the company | | | | | | | | | | | | | | | | | | | | |
Canada | | $ | 200 | | | $ | 188 | | | $ | – | | | $ | – | | | $ | 388 | |
United States | | | 1,287 | | | | 2,648 | | | | 710 | | | | – | | | | 4,645 | |
Canpotex1 | | | 1,492 | | | | – | | | | – | | | | – | | | | 1,492 | |
PhosChem2 | | | – | | | | 248 | | | | – | | | | – | | | | 248 | |
Mexico | | | 13 | | | | 110 | | | | 5 | | | | – | | | | 128 | |
Trinidad | | | – | | | | – | | | | 286 | | | | – | | | | 286 | |
Brazil | | | 195 | | | | 45 | | | | – | | | | – | | | | 240 | |
Colombia | | | 39 | | | | 17 | | | | 83 | | | | – | | | | 139 | |
Other Latin America | | | 59 | | | | 42 | | | | 73 | | | | – | | | | 174 | |
India | | | – | | | | 143 | | | | – | | | | – | | | | 143 | |
Other | | | – | | | | 35 | | | | 9 | | | | – | | | | 44 | |
| | | | | | | | | | | | | | | | | | | | | |
| | $ | 3,285 | | | $ | 3,476 | | | $ | 1,166 | | | $ | – | | | $ | 7,927 | |
| | | | | | | | | | | | | | | | | | | | | |
Non-current assets 3 | | $ | 8,084 | | | $ | 3,168 | | | $ | 651 | | | $ | 20 | | | $ | 11,923 | |
| | | | | | | | | | | | | | | | | | | | | |
| 1 | Canpotex’s 2012 sales volumes were made to: Latin America 29%, China 12%, India 5%, other Asian countries 49%, other countries 5% (Note 30). |
| 2 | PhosChem’s 2012 sales volumes were made to: Latin America 40%, India 28%, China NIL%, other countries 19%, other Asian countries 13%. |
| 3 | Includes non-current assets other than financial instruments, equity-accounted investees, deferred tax assets and post-employment benefit assets. |

Accounting Policies
|
Cost of goods sold is costs primarily incurred at, and charged to, an active producing facility and primary components include: labor, employee benefits, services, raw materials (including inbound freight and purchasing and receiving costs), operating supplies, energy costs, on-site warehouse costs, royalties, property and miscellaneous taxes, and depreciation and amortization. The primary components of selling and administrative expenses are compensation, other employee benefits, supplies, communications, travel, professional services and depreciation and amortization. |
| | |
| PotashCorp 2014 Annual Integrated Report | | 107 |
In millions of US dollars except as otherwise noted
Note 4 Nature of Expenses continued
Supporting Information
Expenses by nature were comprised of:
| | | | | | | | | | | | | | | | | | | | | | | | | | | | | | | | | | | | |
| | | Cost of Goods Sold | | | Other | | | Total | |
| | | 2014 | | | 2013 | | | 2012 | | | 2014 | | | 2013 | | | 2012 | | | 2014 | | | 2013 | | | 2012 | |
Raw materials | | $ | 1,368 | | | $ | 1,451 | | | $ | 1,524 | | | $ | – | | | $ | – | | | $ | – | | | $ | 1,368 | | | $ | 1,451 | | | $ | 1,524 | |
Employee costs1 | | | 615 | | | | 703 | | | | 617 | | | | 111 | | | | 103 | | | | 100 | | | | 726 | | | | 806 | | | | 717 | |
Depreciation and amortization | | | 694 | | | | 631 | | | | 557 | | | | 7 | | | | 35 | | | | 21 | | | | 701 | | | | 666 | | | | 578 | |
Freight | | | – | | | | – | | | | – | | | | 445 | | | | 420 | | | | 355 | | | | 445 | | | | 420 | | | | 355 | |
Energy | | | 197 | | | | 177 | | | | 154 | | | | – | | | | – | | | | – | | | | 197 | | | | 177 | | | | 154 | |
Railcar and vessel costs | | | – | | | | – | | | | – | | | | 93 | | | | 90 | | | | 87 | | | | 93 | | | | 90 | | | | 87 | |
Off-site warehouse costs | | | – | | | | – | | | | – | | | | 60 | | | | 52 | | | | 45 | | | | 60 | | | | 52 | | | | 45 | |
Products purchased for resale | | | 56 | | | | 67 | | | | 194 | | | | – | | | | – | | | | – | | | | 56 | | | | 67 | | | | 194 | |
Other | | | 929 | | | | 914 | | | | 977 | | | | 116 | | | | 139 | | | | 178 | | | | 1,045 | | | | 1,053 | | | | 1,155 | |
| | | | | | | | | | | | | | | | | | | | | | | | | | | | | | | | | | | | | |
Total | | $ | 3,859 | | | $ | 3,943 | | | $ | 4,023 | | | $ | 832 | | | $ | 839 | | | $ | 786 | | | $ | 4,691 | | | $ | 4,782 | | | $ | 4,809 | |
| | | | | | | | | | | | | | | | | | | | | | | | | | | | | | | | | | | | | |
| | | | | | | | | | | | |
Expenses included in: | | | | | | | | | | | | |
Freight, transportation and distribution | | $ | 609 | | | $ | 572 | | | $ | 494 | |
Cost of goods sold | | | 3,859 | | | | 3,943 | | | | 4,023 | |
Selling and administrative expenses | | | 245 | | | | 231 | | | | 219 | |
Other (income) expenses | | | (22 | ) | | | 36 | | | | 73 | |
| | | | | | | | | | | | | |
| 1 | Includes employee benefits and share-based compensation. |

Under Saskatchewan provincial legislation, the company is subject to resource taxes including the potash production tax and the resource surcharge.
| | | | | | | | | | | | |
| | | 2014 | | | 2013 | | | 2012 | |
Potash production tax | | $ | 181 | | | $ | 113 | | | $ | 92 | |
Saskatchewan resource surcharge and other | | | 76 | | | | 81 | | | | 88 | |
| | | | | | | | | | | | | |
| | $ | 257 | | | $ | 194 | | | $ | 180 | |
| | | | | | | | | | | | | |

| | | | | | | | | | | | |
| | | 2014 | | | 2013 | | | 2012 | |
Foreign exchange gain | | $ | 8 | | | $ | 18 | | | $ | 7 | |
Legal settlements (expenses) | | | 17 | | | | (3 | ) | | | (43 | ) |
Other | | | (3 | ) | | | (51 | ) | | | (37 | ) |
| | | | | | | | | | | | | |
| | $ | 22 | | | $ | (36 | ) | | $ | (73 | ) |
| | | | | | | | | | | | | |
| | |
| 108 | | PotashCorp 2014 Annual Integrated Report |
Financials and Notes
In millions of US dollars except as otherwise noted

Finance costs mainly arise from interest expense on long-term senior notes.
| | | | | | | | | | | | |
| | | 2014 | | | 2013 | | | 2012 | |
Interest expense on | | | | | | | | | | | | |
Short-term debt | | $ | 1 | | | $ | 4 | | | $ | 5 | |
Long-term debt | | | 197 | | | | 192 | | | | 203 | |
Unwinding of discount on asset retirement obligations (Note 22) | | | 15 | | | | 13 | | | | 12 | |
Interest on net defined benefit pension and other post-retirement plan obligations (Note 21) | | | 13 | | | | 17 | | | | – | |
Borrowing costs capitalized to property, plant and equipment | | | (41 | ) | | | (79 | ) | | | (102 | ) |
Interest income | | | (1 | ) | | | (3 | ) | | | (4 | ) |
| | | | | | | | | | | | | |
| | $ | 184 | | | $ | 144 | | | $ | 114 | |
| | | | | | | | | | | | | |
Borrowing costs capitalized to property, plant and equipment during 2014 were calculated by applying an average capitalization rate of 4.5 percent (2013 – 4.9 percent, 2012 – 4.6 percent) to expenditures on qualifying assets.
This note explains the company’s income tax expense and tax-related balances within the consolidated financial statements. The deferred tax section provides information on expected future tax payments.
| | |
Accounting Policies | | Accounting Estimates
and Judgments |
Taxation on earnings comprises current and deferred income tax. Taxation is recognized in the statements of income except to the extent that it relates to items recognized in OCI or contributed surplus, in which case the tax is recognized in OCI or contributed surplus as applicable. Current income tax is generally the expected tax payable on the taxable income for the year, calculated using rates enacted or substantively enacted at the consolidated statements of financial position date in the countries where the company’s subsidiaries and equity-accounted investees operate and generate taxable income. It includes any adjustment to income tax payable or recoverable in respect of previous years. The realized and unrealized excess tax benefit from share-based payment arrangements is recognized in contributed surplus as current and deferred tax, respectively. Uncertain income tax positions are accounted for using the standards applicable to current income tax liabilities and assets; i.e., both liabilities and assets are recorded when probable and measured at the amount expected to be paid to (recovered from) the taxation authorities using the company’s best estimate of the amount. Deferred income tax is recognized using the liability method, based on temporary differences between financial statements’ carrying amounts of assets and liabilities and their respective income tax bases. Deferred income tax is determined using tax rates that have been enacted or substantively enacted by the statements of financial position date and are expected to apply when the related deferred income tax asset is realized or the deferred income tax liability is settled. The tax effect of certain temporary differences is not recognized, principally with respect to temporary differences relating to investments in subsidiaries and equity-accounted investees where the company is able to control the reversal of the temporary difference and that difference is not expected to reverse in the | | The company operates in a specialized industry and in several tax jurisdictions. As a result, its income is subject to various rates of taxation. The breadth of its operations and the global complexity of tax regulations require assessments of uncertainties and judgments in estimating the taxes the company will ultimately pay. The final taxes paid are dependent upon many factors, including negotiations with taxing authorities in various jurisdictions, outcomes of tax litigation and resolution of disputes arising from federal, provincial, state and local tax audits. The resolution of these uncertainties and the associated final taxes may result in adjustments to the company’s tax assets and tax liabilities. |
| | |
| PotashCorp 2014 Annual Integrated Report | | 109 |
In millions of US dollars except as otherwise noted
Note 8 Income Taxes continued
| | |
Accounting Policies continued | | Accounting Estimates
and Judgments continued |
foreseeable future. Deferred income tax is not accounted for if it arises from initial recognition of an asset or liability in a transaction other than a business combination that at the time of the transaction affects neither accounting nor taxable profit or loss. The amount of deferred income tax recognized is based on the expected manner and timing of realization or settlement of the carrying amount of assets and liabilities. Deferred income tax assets are recognized only to the extent that it is probable that future taxable profit will be available against which the temporary differences can be utilized. Deferred income tax assets are reviewed at each statements of financial position date and amended to the extent that it is no longer probable that the related tax benefit will be realized. Current income tax assets and liabilities are offset when the company has a legally enforceable right to offset the recognized amounts and intends either to settle on a net basis, or to realize the asset and settle the liability simultaneously. Normally, the company would only have a legally enforceable right to set off a current tax asset against a current tax liability when they relate to income taxes levied by the same taxation authority and the authority permits the company to make or receive a single net payment. Deferred income tax assets and liabilities are offset when the company has a legally enforceable right to set off current tax assets against current tax liabilities and the deferred tax assets and liabilities relate to income taxes levied by the same taxation authority on either: (1) the same taxable entity; or (2) different taxable entities which intend either to settle current tax liabilities and assets on a net basis, or to realize the assets and settle the liabilities simultaneously in each future period in which significant amounts of deferred tax liabilities or assets are expected to be settled or recovered. | | The company estimates deferred income taxes based upon temporary differences between the assets and liabilities that it reports in its financial statements and the tax bases of its assets and liabilities as determined under applicable tax laws. The amount of deferred tax assets recognized is generally limited to the extent that it is probable that taxable profit will be available against which the related deductible temporary differences can be utilized. Therefore, the amount of the deferred income tax asset recognized and considered realizable could be reduced if projected income is not achieved. |
Supporting Information
Income taxes in net income
The provision for income taxes differs from the amount that would have resulted from applying the Canadian statutory income tax rates to income before income taxes as follows:
| | | | | | | | | | | | |
| | | 2014 | | | 2013 | | | 2012 | |
Income before income taxes | | | | | | | | | | | | |
Canada | | $ | 911 | | | $ | 1,097 | | | $ | 1,514 | |
United States | | | 717 | | | | 784 | | | | 860 | |
Trinidad | | | 355 | | | | 310 | | | | 433 | |
Other | | | 181 | | | | 281 | | | | 98 | |
| | | | | | | | | | | | | |
| | $ | 2,164 | | | $ | 2,472 | | | $ | 2,905 | |
| | | | | | | | | | | | | |
Canadian federal and provincial statutory income tax rate | | | 27.00% | | | | 26.88% | | | | 26.75% | |
| | | | | | | | | | | | | |
Income tax at statutory rates | | $ | 584 | | | $ | 664 | | | $ | 777 | |
Adjusted for the effect of: | | | | | | | | | | | | |
Non-taxable income | | | (60 | ) | | | (66 | ) | | | (103 | ) |
Production-related deductions | | | (38 | ) | | | (54 | ) | | | (57 | ) |
Additional tax deductions | | | (5 | ) | | | (9 | ) | | | (11 | ) |
Impact of foreign tax rates | | | 91 | | | | 81 | | | | 97 | |
Withholding taxes | | | 17 | | | | 7 | | | | 14 | |
Impact of tax rate changes | | | 11 | | | | 6 | | | | (2 | ) |
Non-deductible impairment of available-for-sale investment | | | 10 | | | | – | | | | 91 | |
Prior-year provision to income tax returns filed | | | 9 | | | | 8 | | | | 17 | |
Share-based compensation | | | 7 | | | | 14 | | | | 7 | |
Adjustment to foreign tax loss carryforward | | | – | | | | 13 | | | | – | |
Planned distribution of foreign earnings | | | – | | | | 10 | | | | – | |
Other | | | 2 | | | | 13 | | | | (4 | ) |
| | | | | | | | | | | | | |
Income tax expense included in net income | | $ | 628 | | | $ | 687 | | | $ | 826 | |
| | | | | | | | | | | | | |
| | |
| 110 | | PotashCorp 2014 Annual Integrated Report |
Financials and Notes
In millions of US dollars except as otherwise noted
Note 8 Income Taxes continued
The increase in the Canadian federal and provincial statutory income tax rate from 2013 to 2014 and from 2012 to 2013 was the result of a legislated increase in New Brunswick income tax rates.
Total income tax expense, included in net income, was comprised of the following:
| | | | | | | | | | | | |
| | | 2014 | | | 2013 | | | 2012 | |
Current income tax | | | | | | | | | | | | |
Tax expense for current year | | $ | 351 | | | $ | 287 | | | $ | 453 | |
Adjustments in respect of prior years | | | 9 | | | | 3 | | | | (19 | ) |
| | | | | | | | | | | | | |
Total current income tax expense | | | 360 | | | | 290 | | | | 434 | |
| | | | | | | | | | | | | |
Deferred income tax | | | | | | | | | | | | |
Origination and reversal of temporary differences | | | 257 | | | | 355 | | | | 346 | |
Adjustments in respect of prior years | | | (3 | ) | | | 25 | | | | 46 | |
Impact of tax rate changes | | | 11 | | | | 6 | | | | (2 | ) |
Impact of a writedown of a deferred tax asset | | | 3 | | | | 11 | | | | 2 | |
| | | | | | | | | | | | | |
Total deferred income tax expense | | | 268 | | | | 397 | | | | 392 | |
| | | | | | | | | | | | | |
Income tax expense included in net income | | $ | 628 | | | $ | 687 | | | $ | 826 | |
| | | | | | | | | | | | | |
Income taxes in contributed surplus
Income taxes (credited) charged to contributed surplus were:
| | | | | | | | | | | | |
| | | 2014 | | | 2013 | | | 2012 | |
Share-based compensation excess tax benefit | | | | | | | | | | | | |
Current income tax | | $ | (4 | ) | | $ | (18 | ) | | $ | (30 | ) |
Deferred income tax | | | 2 | | | | 30 | | | | 37 | |
| | | | | | | | | | | | | |
Total income tax (credited) charged directly to contributed surplus | | $ | (2 | ) | | $ | 12 | | | $ | 7 | |
| | | | | | | | | | | | | |
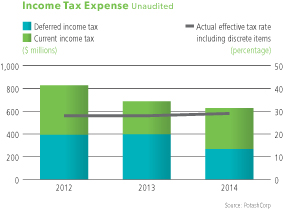
| | |
| PotashCorp 2014 Annual Integrated Report | | 111 |
In millions of US dollars except as otherwise noted
Note 8 Income Taxes continued
Income tax balances
Income tax balances within the consolidated statements of financial position as at December 31 were comprised of the following:
| | | | | | | | | | |
| Income Tax Assets (Liabilities) | | Statements of Financial Position Location | | 2014 | | | 2013 | |
Current income tax assets | | | | | | | | | | |
Current | | Receivables (Note 11) | | $ | 145 | | | $ | 90 | |
Non-current | | Other assets (Note 15) | | | 83 | | | | 126 | |
Deferred income tax assets | | Other assets (Note 15) | | | 10 | | | | 21 | |
| | | | | | | | | | | |
Total income tax assets | | | | $ | 238 | | | $ | 237 | |
| | | | | | | | | | | |
Current income tax liabilities | | | | | | | | | | |
Current | | Payables and accrued charges (Note 18) | | $ | (5 | ) | | $ | (3 | ) |
Non-current | | Other non-current liabilities and deferred credits | | | (109 | ) | | | (135 | ) |
Deferred income tax liabilities | | Deferred income tax liabilities | | | (2,201 | ) | | | (2,013 | ) |
| | | | | | | | | | | |
Total income tax liabilities | | | | $ | (2,315 | ) | | $ | (2,151 | ) |
| | | | | | | | | | | |
Deferred income taxes
In respect of each type of temporary difference, unused tax loss and unused tax credit, the amounts of deferred tax assets and liabilities recognized in the consolidated statements of financial position as at December 31 and the amount of the deferred tax recovery or expense recognized in net income were:
| | | | | | | | | | | | | | | | | | | | |
| | | Deferred Income Tax Assets
(Liabilities) | | | Deferred Income Tax (Expense) Recovery
Recognized in Net Income | |
| | | 2014 | | | 2013 | | | 2014 | | | 2013 | | | 2012 | |
Deferred income tax assets | | | | | | | | | | | | | | | | | | | | |
Tax loss and other carryforwards | | $ | 3 | | | $ | 4 | | | $ | (1 | ) | | $ | (47 | ) | | $ | (7 | ) |
Asset retirement obligations and accrued environmental costs | | | 174 | | | | 134 | | | | 40 | | | | (2 | ) | | | 12 | |
Derivative instrument liabilities | | | 67 | | | | 59 | | | | – | | | | – | | | | – | |
Inventories | | | 22 | | | | 54 | | | | (32 | ) | | | (13 | ) | | | 10 | |
Post-retirement benefits and share-based compensation | | | 194 | | | | 123 | | | | 11 | | | | (4 | ) | | | (19 | ) |
Other assets | | | 24 | | | | 39 | | | | (15 | ) | | | – | | | | 19 | |
Deferred income tax liabilities | | | | | | | | | | | | | | | | | | | | |
Property, plant and equipment | | | (2,625 | ) | | | (2,352 | ) | | | (273 | ) | | | (325 | ) | | | (395 | ) |
Investments in equity-accounted investees | | | (38 | ) | | | (42 | ) | | | 3 | | | | (12 | ) | | | (10 | ) |
Long-term debt | | | – | | | | – | | | | – | | | | 7 | | | | – | |
Other liabilities | | | (12 | ) | | | (11 | ) | | | (1 | ) | | | (1 | ) | | | (2 | ) |
| | | | | | | | | | | | | | | | | | | | | |
| | $ | (2,191 | ) | | $ | (1,992 | ) | | $ | (268 | ) | | $ | (397 | ) | | $ | (392 | ) |
| | | | | | | | | | | | | | | | | | | | | |
Reconciliation of net deferred income tax liabilities:
| | | | | | | | |
| | | 2014 | | | 2013 | |
Balance, beginning of year | | $ | (1,992 | ) | | $ | (1,452 | ) |
Income tax charge recognized in the statements of income | | | (268 | ) | | | (397 | ) |
Income tax charge recognized in contributed surplus | | | (2 | ) | | | (30 | ) |
Income tax credit (charge) recognized in OCI | | | 68 | | | | (110 | ) |
Foreign exchange | | | 3 | | | | (3 | ) |
| | | | | | | | | |
Balance, end of year | | $ | (2,191 | ) | | $ | (1,992 | ) |
| | | | | | | | | |
Amounts and expiry dates of unused tax losses and unused tax credits as at December 31, 2014 were:
| | | | | | |
| | | Amount | | | Expiry Date |
Unused tax losses | | | | | | |
Operating | | $ | 9 | | | 2028 - Indefinite |
Capital | | $ | 289 | | | None |
Unused investment tax credits | | $ | 51 | | | 2015 - 2024 |
| | | | | | | |
| | |
| 112 | | PotashCorp 2014 Annual Integrated Report |
Financials and Notes
In millions of US dollars except as otherwise noted
Note 8 Income Taxes continued
As at December 31, 2014, the company had $336 of tax losses and deductible temporary differences for which it did not recognize deferred tax assets.
The company has determined that it is probable that all recognized deferred tax assets will be realized through a combination of future reversals of temporary differences and taxable income.
The aggregate amount of temporary differences associated with investments in subsidiaries and equity-accounted investees, for which deferred tax liabilities have not been recognized, as at December 31, 2014 was $6,431 (2013 – $5,932).

Basic net income per share is the net income available to common shareholders divided by the weighted average number of common shares outstanding during the year. Diluted net income per share adjusts basic net income per share for the effects of all dilutive potential common shares.
| | | | | | | | | | | | |
| | | 2014 | | | 2013 | | | 2012 | |
Basic net income per share1 | | | | | | | | | | | | |
Net income available to common shareholders | | $ | 1,536 | | | $ | 1,785 | | | $ | 2,079 | |
| | | | | | | | | | | | | |
Weighted average number of common shares | | | 838,101,000 | | | | 864,596,000 | | | | 860,033,000 | |
| | | | | | | | | | | | | |
Basic net income per share | | $ | 1.83 | | | $ | 2.06 | | | $ | 2.42 | |
| | | | | | | | | | | | | |
Diluted net income per share1 | | | | | | | | | | | | |
Net income available to common shareholders | | $ | 1,536 | | | $ | 1,785 | | | $ | 2,079 | |
| | | | | | | | | | | | | |
Weighted average number of common shares | | | 838,101,000 | | | | 864,596,000 | | | | 860,033,000 | |
Dilutive effect of stock options | | | 6,443,000 | | | | 9,386,000 | | | | 15,874,000 | |
| | | | | | | | | | | | | |
Weighted average number of diluted common shares | | | 844,544,000 | | | | 873,982,000 | | | | 875,907,000 | |
| | | | | | | | | | | | | |
Diluted net income per share | | $ | 1.82 | | | $ | 2.04 | | | $ | 2.37 | |
| | | | | | | | | | | | | |
| 1 | Net income per share calculations are based on dollar and share amounts each rounded to the nearest thousand. |
Net income per share = net income available to common shareholders / weighted average number of common shares issued and outstanding during the year. Diluted net income per share incorporated the following adjustments. The denominator was:
| • | | increased by the total of the additional common shares that would have been issued assuming exercise of all stock options with exercise prices at or below the average market price for the year; and |
| • | | decreased by the number of shares that the company could have repurchased if it had used the assumed proceeds from the exercise of stock options to repurchase them on the open market at the average share price for the year. |
For performance-based stock option plans, the number of contingently issuable common shares included in the calculation was based on the number of shares, if any, that would be issuable if the end of the reporting period were the end of the performance period and the effect were dilutive.
Options excluded from the calculation of diluted net income per share due to the option exercise prices being greater than the average market price of common shares were as follows:
| | | | | | | | | | | | |
| | | 2014 | | | 2013 | | | 2012 | |
Weighted average number of options | | | 4,454,863 | | | | 3,516,753 | | | | 2,465,450 | |
Performance Option Plan years excluded | |
| 2008, 2011,
2012 and 2013 |
| |
| 2008, 2011
and 2012 |
| |
| 2008
and 2011 |
|
| | | | | | | | | | | | | |
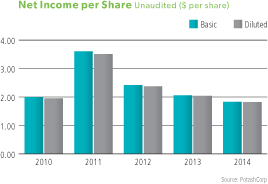
| | |
| PotashCorp 2014 Annual Integrated Report | | 113 |
In millions of US dollars except as otherwise noted

Accounting Policy
|
Highly liquid investments with a maturity of three months or less from the date of purchase are considered to be cash equivalents. |
| | | | | | | | | | | | | | | | | | | | | | | | | | | | |
| For the years ended December 31 | | | | | | | | |
| | | | | | | | 2014 | | | | | | | | 2013 | | | | | | 2012 | |
Reconciliation of cash provided by operating activities | | | | | | | | | | | | | | | | | | | | | | | | | | | | |
Net income | | | | | | | | $ | 1,536 | | | | | | | | | $ | 1,785 | | | | | | | $ | 2,079 | |
| Adjustments to reconcile net income to cash provided by operating activities | | | | | | | | | | | | | | | | | | | | | | | | | | | | |
Depreciation and amortization | | | | | 701 | | | | | | | | | | 666 | | | | | | | | 578 | | | | | |
Share-based compensation | | | | | 28 | | | | | | | | | | 27 | | | | | | | | 24 | | | | | |
Net distributed (undistributed) earnings of equity-accounted investees | | | | | 68 | | | | | | | | | | (15 | ) | | | | | | | (67 | ) | | | | |
Impairment of available-for-sale investment (Note 14) | | | | | 38 | | | | | | | | | | – | | | | | | | | 341 | | | | | |
Provision for deferred income tax | | | | | 268 | | | | | | | | | | 397 | | | | | | | | 392 | | | | | |
Pension and other post-retirement benefits | | | | | 28 | | | | | | | | | | (16 | ) | | | | | | | (68 | ) | | | | |
Asset retirement obligations and accrued environmental costs | | | | | 18 | | | | | | | | | | (2 | ) | | | | | | | (2 | ) | | | | |
Other long-term liabilities and miscellaneous | | | | | 19 | | | | | | | | | | 85 | | | | | | | | 81 | | | | | |
Subtotal of adjustments | | | | | | | | | 1,168 | | | | | | | | | | 1,142 | | | | | | | | 1,279 | |
Changes in non-cash operating working capital | | | | | | | | | | | | | | | | | | | | | | | | | | | | |
Receivables | | | | | (220 | ) | | | | | | | | | 276 | | | | | | | | 188 | | | | | |
Inventories | | | | | 70 | | | | | | | | | | 28 | | | | | | | | (7 | ) | | | | |
Prepaid expenses and other current assets | | | | | 29 | | | | | | | | | | (1 | ) | | | | | | | (32 | ) | | | | |
Payables and accrued charges | | | | | 31 | | | | | | | | | | (18 | ) | | | | | | | (282 | ) | | | | |
Subtotal of changes in non-cash operating working capital | | | | | | | | | (90 | ) | | | | | | | | | 285 | | | | | | | | (133 | ) |
| | | | | | | | | | | | | | | | | | | | | | | | | | | | | |
Cash provided by operating activities | | | | | | | | $ | 2,614 | | | | | | | | | $ | 3,212 | | | | | | | $ | 3,225 | |
| | | | | | | | | | | | | | | | | | | | | | | | | | | | | |
Supplemental cash flow disclosure | | | | | | | | | | | | | | | | | | | | | | | | | | | | |
Interest paid | | | | | | | | $ | 187 | | | | | | | | | $ | 191 | | | | | | | $ | 209 | |
Income taxes paid | | | | | | | | $ | 405 | | | | | | | | | $ | 189 | | | | | | | $ | 676 | |
| | | | | | | | | | | | | | | | | | | | | | | | | | | | | |

Receivables represent amounts the company expects to collect from other parties. Trade receivables consist mainly of amounts owed to PotashCorp by its customers, the largest individual customer being the related party, Canpotex.
| | |
| Accounting Policies | | Accounting Estimates
and Judgments |
Trade receivables are recognized initially at fair value and subsequently measured at amortized cost less provision for impairment of trade accounts receivable. Such a provision is established when there is reasonable expectation that the company will not be able to collect all amounts due. Any increase in the provision is recognized in the consolidated statements of income. When a trade receivable is uncollectible, it is written off against the provision for impairment account for trade accounts receivable. Subsequent recoveries of amounts previously written off are credited to the consolidated statements of income. | | Determining when there is reasonable expectation that the company will not be able to collect all amounts due requires judgment. |
| | |
| 114 | | PotashCorp 2014 Annual Integrated Report |
Financials and Notes
In millions of US dollars except as otherwise noted
Note 11 Receivables continued
Supporting Information
| | | | | | | | |
| | | 2014 | | | 2013 | |
Trade accounts – Canpotex (Note 30) | | $ | 216 | | | $ | 166 | |
– Other | | | 499 | | | | 341 | |
Less provision for impairment of trade accounts receivable | | | (7 | ) | | | (7 | ) |
| | | | | | | | | |
| | | 708 | | | | 500 | |
Income taxes receivable (Note 8) | | | 145 | | | | 90 | |
Margin deposits on derivative instruments | | | 119 | | | | 114 | |
GST and VAT receivable | | | 16 | | | | 17 | |
Other non-trade accounts | | | 41 | | | | 31 | |
| | | | | | | | | |
| | $ | 1,029 | | | $ | 752 | |
| | | | | | | | | |

Inventories consist primarily of product of the company’s three segments – potash, nitrogen and phosphate – in varying stages of the production process, and are presented at the lower of cost and net realizable value.
| | |
| Accounting Policies | | Accounting Estimates and Judgments |
Inventories are valued at the lower of cost and net realizable value. Costs, allocated to inventory using the weighted average cost method, include direct acquisition costs, direct costs related to the units of production and a systematic allocation of fixed and variable production overhead, as applicable. Net realizable value for finished products, intermediate products and raw materials is generally considered to be the selling price of the finished product in the ordinary course of business less the estimated costs of completion and estimated costs to make the sale. In certain circumstances, particularly pertaining to the company’s materials and supplies inventories, replacement cost is considered to be the best available measure of net realizable value. Product inventory is reviewed monthly to ensure the carrying value does not exceed net realizable value. If so, a writedown is recognized. The writedown may be reversed if the circumstances which caused it no longer exist. | | Determining what is the appropriate measure of net realizable value requires judgment. Judgment is also used in determining the allocation of fixed and variable production overhead that is directly attributable to inventories. |
Supporting Information
Inventories as at December 31 were comprised of:
| | | | | | | | |
| | | 2014 | | | 2013 | |
Finished products | | $ | 267 | | | $ | 340 | |
Intermediate products | | | 85 | | | | 85 | |
Raw materials | | | 78 | | | | 101 | |
Materials and supplies | | | 216 | | | | 202 | |
| | | | | | | | | |
| | $ | 646 | | | $ | 728 | |
| | | | | | | | | |
| | |
| PotashCorp 2014 Annual Integrated Report | | 115 |
In millions of US dollars except as otherwise noted
Note 12 Inventories continued
The following items affected cost of goods sold during the year:
| | | | | | | | | | | | |
| | | 2014 | | | 2013 | | | 2012 | |
Expensed inventories before the following items | | $ | 3,587 | | | $ | 3,700 | | | $ | 3,659 | |
Reserves, reversals and writedowns of inventories | | | 8 | | | | 7 | | | | 8 | |
| | | | | | | | | | | | | |
| | $ | 3,595 | | | $ | 3,707 | | | $ | 3,667 | |
| | | | | | | | | | | | | |
The carrying amount of inventory recorded at net realizable value was $39 as at December 31, 2014 (2013 – $2), with the remaining inventory recorded at cost.

The majority of the company’s tangible assets are the buildings, machinery and equipment used to produce its three nutrients. These assets are depreciated over their estimated useful lives.
| | | | | | | | |
| Accounting Policies | | | | Accounting Estimates and Judgments |
| Property, plant and equipment (which include certain mine development costs, pre-stripping costs and assets under construction) are carried at cost (which includes all expenditures directly attributable to bringing the asset to the location and installing it in working condition for its intended use) less accumulated depreciation and any recognized impairment loss. Income or expenses derived from the necessity to bring an asset under construction to the location and condition necessary to be capable of operating in the manner intended is recognized as part of the cost of the asset. The cost of property, plant and equipment is reduced by the amount of related investment tax credits to which the company is entitled. Costs of additions, betterments, renewals and borrowings during construction are capitalized. Borrowing costs directly attributable to the acquisition, construction or production of assets that necessarily take a substantial | | | | Determination of which costs are directly attributable (e.g., labor, overhead) and when income or expenses derived from an asset under construction is recognized as part of the cost of the asset are matters of judgment. Capitalization of costs ceases when an item is substantially complete and in the location and condition necessary for it to be capable of operating in the manner intended by management. Determining when an asset, or a portion thereof, meets these criteria requires consideration of the circumstances and the industry in which it is to be operated, normally predetermined by management with reference to such factors as productive capacity. This determination is a matter of judgment that can be complex and subject to differing interpretations. When an item of property, plant and equipment comprises individual components for which different depreciation methods or rates are appropriate, judgment is used in determining the appropriate level of componentization. Distinguishing major inspections and overhauls from repairs and maintenance, and determining the appropriate life over which such costs should be amortized, are matters of judgment. Certain mining and milling assets are depreciated using the units-of-production method based on the shorter of estimates of reserves or service lives. Pre-stripping costs are depreciated on a units-of-production basis over the ore mined from the mineable acreage stripped. Land is not depreciated. Other asset classes are depreciated on a straight-line basis. |
| | | | | | | | |
| period of time to ready for their intended use are added to the cost of those assets, until such time as the assets are substantially ready for their intended use. The capitalization rate is based on the weighted average interest rate on all of the company’s outstanding third-party debt. All other borrowing costs are charged through finance costs in the period in which they are incurred. Each component of an item of property, plant and equipment with a cost that is significant in relation to the item’s total cost is depreciated separately. When the cost of replacing part of an item of property, plant and equipment is capitalized, the carrying amount of the replaced part is | | | | The following estimated useful lives have been applied to the majority of property, plant and equipment assets as at December 31, 2014: |
| | | | | | Useful Life
Range (years) | | Weighted Average
Useful Life (years) 2 |
| | | | Land improvements | | 8 to 60 | | 37 |
| | | | Buildings and improvements | | 11 to 60 | | 41 |
| | | | Machinery and equipment 1 | | 3 to 60 | | 22 |
| | | | 1 Comprised primarily of plant equipment. 2 Weighted by carrying amount as at December 31, 2014. |
| | | | Depreciation of assets under construction commences when the assets are ready for their intended use and is subject to management judgment. Their residual values and useful lives are reviewed, and adjusted if appropriate, at the end of each reporting period. Changes in the expected useful life or |
| | |
| 116 | | PotashCorp 2014 Annual Integrated Report |
Financials and Notes
In millions of US dollars except as otherwise noted
Note 13 Property, Plant and Equipment continued
| | | | | | | | |
| Accounting Policies continued | | | | Accounting Estimates and Judgments continued |
derecognized. The cost of major inspections and overhauls is capitalized and depreciated over the period until the next major inspection or overhaul. Maintenance and repair expenditures that do not improve or extend productive life are expensed in the period incurred. Any gain or loss arising on the disposal or retirement of an item of property, plant and equipment is determined as the difference between the sale proceeds and the carrying amount of the asset, and is recognized in operating income. | | | | the expected pattern of consumption of future economic benefits embodied in the asset are accounted for by changing the depreciation period or method, as appropriate, and are treated as changes in accounting estimates. The company assesses its existing assets and depreciable lives in connection with the review of mine and plant operating plans at the end of each reporting period. When it is determined that assigned asset lives do not reflect the expected remaining period of benefit, prospective changes are made to their depreciable lives. Uncertainties are inherent in estimating reserve quantities, particularly as they relate to assumptions regarding future prices, the geology of the company’s mines, the mining methods used and the related costs incurred to develop and mine its reserves. Changes in these assumptions could result in material adjustments to reserve estimates, which could result in impairments or changes to depreciation expense in future periods, particularly if reserve estimates are reduced. |
Supporting Information
| | | | | | | | | | | | | | | | | | | | | | | | |
| | | Land and
Improvements | | | Buildings and
Improvements | | | Machinery
and
Equipment | | | Mine
Development
Costs | | | Assets Under
Construction | | | Total | |
Carrying amount – December 31, 2013 | | $ | 525 | | | $ | 3,557 | | | $ | 6,459 | | | $ | 530 | | | $ | 1,162 | | | $ | 12,233 | |
Additions | | | – | | | | – | | | | 19 | | | | 55 | | | | 1,043 | | | | 1,117 | |
Change in investment tax credits | | | – | | | | – | | | | (4 | ) | | | – | | | | 4 | | | | – | |
Disposals | | | – | | | | (1 | ) | | | (2 | ) | | | – | | | | – | | | | (3 | ) |
Transfers | | | 46 | | | | 135 | | | | 742 | | | | 93 | | | | (1,016 | ) | | | – | |
Change in asset retirement costs | | | – | | | | – | | | | – | | | | 25 | | | | – | | | | 25 | |
Depreciation | | | (25 | ) | | | (76 | ) | | | (475 | ) | | | (122 | ) | | | – | | | | (698 | ) |
| | | | | | | | | | | | | | | | | | | | | | | | | |
Carrying amount – December 31, 2014 | | $ | 546 | | | $ | 3,615 | | | $ | 6,739 | | | $ | 581 | | | $ | 1,193 | | | $ | 12,674 | |
| | | | | | | | | | | | | | | | | | | | | | | | | |
Balance as at December 31, 2014 comprised of: | | | | | | | | | | | | | | | | | | | | | | | | |
Cost | | $ | 697 | | | $ | 4,099 | | | $ | 10,660 | | | $ | 1,301 | | | $ | 1,193 | | | $ | 17,950 | |
Accumulated depreciation | | | (151 | ) | | | (484 | ) | | | (3,921 | ) | | | (720 | ) | | | – | | | | (5,276 | ) |
| | | | | | | | | | | | | | | | | | | | | | | | | |
Carrying amount | | $ | 546 | | | $ | 3,615 | | | $ | 6,739 | | | $ | 581 | | | $ | 1,193 | | | $ | 12,674 | |
| | | | | | | | | | | | | | | | | | | | | | | | | |
Carrying amount – December 31, 2012 | | $ | 476 | | | $ | 3,269 | | | $ | 4,951 | | | $ | 610 | | | $ | 2,199 | | | $ | 11,505 | |
Additions | | | – | | | | 48 | | | | 13 | | | | 57 | | | | 1,372 | | | | 1,490 | |
Change in investment tax credits | | | – | | | | – | | | | 9 | | | | – | | | | (10 | ) | | | (1 | ) |
Disposals | | | – | | | | (4 | ) | | | (16 | ) | | | – | | | | – | | | | (20 | ) |
Transfers | | | 69 | | | | 312 | | | | 1,962 | | | | 56 | | | | (2,399 | ) | | | – | |
Change in asset retirement costs | | | – | | | | – | | | | – | | | | (75 | ) | | | – | | | | (75 | ) |
Depreciation | | | (20 | ) | | | (68 | ) | | | (460 | ) | | | (118 | ) | | | – | | | | (666 | ) |
| | | | | | | | | | | | | | | | | | | | | | | | | |
Carrying amount – December 31, 2013 | | $ | 525 | | | $ | 3,557 | | | $ | 6,459 | | | $ | 530 | | | $ | 1,162 | | | $ | 12,233 | |
| | | | | | | | | | | | | | | | | | | | | | | | | |
Balance as at December 31, 2013 comprised of: | | | | | | | | | | | | | | | | | | | | | | | | |
Cost | | $ | 651 | | | $ | 3,972 | | | $ | 9,988 | | | $ | 1,128 | | | $ | 1,162 | | | $ | 16,901 | |
Accumulated depreciation | | | (126 | ) | | | (415 | ) | | | (3,529 | ) | | | (598 | ) | | | – | | | | (4,668 | ) |
| | | | | | | | | | | | | | | | | | | | | | | | | |
Carrying amount | | $ | 525 | | | $ | 3,557 | | | $ | 6,459 | | | $ | 530 | | | $ | 1,162 | | | $ | 12,233 | |
| | | | | | | | | | | | | | | | | | | | | | | | | |
Depreciation of property, plant and equipment was included in the following:
| | | | | | | | | | | | |
| | | 2014 | | | 2013 | | | 2012 | |
Cost of goods sold and selling and administrative expenses | | $ | 685 | | | $ | 652 | | | $ | 570 | |
Cost of property, plant and equipment and inventory | | | 13 | | | | 14 | | | | 49 | |
| | | | | | | | | | | | | |
| | $ | 698 | | | $ | 666 | | | $ | 619 | |
| | | | | | | | | | | | | |
Acquiring or constructing property, plant and equipment by incurring a liability does not result in a cash outflow for the company until the liability is paid. In the period the related liability is incurred, the change in operating accounts payable on the consolidated statements of cash flow is typically reduced by such amount. In the period the liability is paid, the amount is reflected as a cash outflow for investing activities. The applicable net change in accounts payable that was reclassified (to) from investing activities (from) to operating activities on the consolidated statements of cash flow in 2014 was $(43) (2013 – $(155), 2012 – $29).
| | |
| PotashCorp 2014 Annual Integrated Report | | 117 |
In millions of US dollars except as otherwise noted
Note 13 Property, Plant and Equipment continued

PotashCorp holds interests in associates and joint ventures, the most significant being Sociedad Quimica y Minera de Chile S.A. (“SQM”) at 32 percent, Arab Potash Company (“APC”) at 28 percent and Canpotex at 33 percent. The company also holds investments in ICL and Sinofert which are accounted for as available-for-sale.
Investments in Equity-Accounted Investees
| | |
Accounting Policies | | Accounting Estimates and Judgments |
Investments in which the company exercises significant influence (but does not control) are accounted for using the equity method. Such investees that are not jointly controlled are referred to as associates. All investees over which the company has joint control are classified and accounted for as joint ventures, which are also accounted for using the equity method. These associates and joint ventures follow similar accounting principles and policies to PotashCorp. The proportionate share of any net income or losses from investments accounted for using the equity method, and any gain or loss on disposal, are recorded in net income. The company’s share of its associates’ post-acquisition movements in OCI is recognized in the company’s OCI. The cumulative post-acquisition movements in net income and in OCI are adjusted against the carrying amount of the investment. Dividends received from associates reduce the value of the company’s investment. An impairment test is performed when there is objective evidence of impairment, such as significant adverse changes in the environment in which the equity-accounted investee operates or a significant or prolonged decline in the fair value of the investment below its carrying value. An impairment loss is recorded when the recoverable amount becomes lower than the carrying amount, recoverable amount being the higher of value in use and fair value less costs to sell. Impairment losses are reversed if the recoverable amount subsequently exceeds the carrying amount. | | Significant influence is the power to participate in the financial and operating policy decisions of the investee but is not control or joint control over those policies. Judgment is necessary in determining when significant influence exists. In assessing impairment, judgment is used in determining if objective evidence of impairment exists and if so, the amount of impairment. |
| | | |
| | |
| 118 | | PotashCorp 2014 Annual Integrated Report |
Financials and Notes
In millions of US dollars except as otherwise noted
Note 14 Investments continued
Supporting Information
Equity-accounted investees as at December 31 were comprised of:
| | | | | | | | | | | | | | | | | | | | | | | | | | | | | | |
| | | | | Principal Activity | | Principal Place of
Business and
Incorporation | | Proportion of Ownership
Interest and Voting Rights Held | | | Quoted Fair Value 1 | | | Carrying Amount | |
| Name | | | | | | 2014 | | | 2013 | | | 2014 | | | 2013 | | | 2014 | | | 2013 | |
SQM | | | | Chemicals & Mining | | Chile | | | 32% | 2 | | | 32% | 2 | | $ | 2,169 | | | $ | 2,664 | | | $ | 818 | | | $ | 865 | |
APC | | | | Mining | | Jordan | | | 28% | | | | 28% | | | | 634 | | | | 895 | | | | 364 | | | | 385 | |
Canpotex | | | | Marketing & Logistics | | Canada | | | 33% | | | | 33% | | | | n/a | 3 | | | n/a | 3 | | | – | | | | – | |
Other associates | | | | | | | | | | | | | | | | | | | | | | | | | 2 | | | | 2 | |
| | | | | | | | | | | | | | | | | | | | | | | | | | | | | | | |
Total associates | | | | | | | | | | | | | | | | | | | | | | | | | 1,184 | | | | 1,252 | |
Joint ventures | | | | | | | | | | | | | | | | | | | | | | | | | 27 | | | | 24 | |
| | | | | | | | | | | | | | | | | | | | | | | | | | | | | | | |
Total equity-accounted investees | | | | | | | | | | | | | | | | | | | | | | | | $ | 1,211 | | | $ | 1,276 | |
| | | | | | | | | | | | | | | | | | | | | | | | | | | | | | | |
| 1 | The quoted market value (fair value) was based on unadjusted quoted prices in active markets (Level 1). |
| 2 | Due to provisions in SQM’s bylaws, the company holds proportional voting rights of 28 percent. |
| 3 | Canpotex is a private company and there is no quoted market price available for the shares. |
Aggregated financial information of the company’s proportionate interest in equity-accounted investees for the year ended December 31 was as follows:
| | | | | | | | | | | | | | | | | | | | | | | | |
| | | Associates | | | Joint Ventures | |
| | | 2014 | | | 2013 | | | 2012 | | | 2014 | | | 2013 | | | 2012 | |
Income from continuing operations and net income | | $ | 137 | | | $ | 204 | | | $ | 289 | | | $ | 10 | | | $ | 10 | | | $ | 12 | |
Other comprehensive (loss) income | | | 3 | | | | (1 | ) | | | (1 | ) | | | – | | | | – | | | | – | |
Total comprehensive income | | | 140 | | | | 203 | | | | 288 | | | | 10 | | | | 10 | | | | 12 | |
| | | | | | | | | | | | | | | | | | | | | | | | | |
Additional aggregated financial information of all the company’s equity-accounted investees is set out below. The financial information represents an aggregation of full amounts shown in each associate’s and joint venture’s financial statements prepared in accordance with IFRS as at and for the year ended December 31, as applicable.
| | | | | | | | |
| | | 2014 | | | 2013 | |
Current assets | | $ | 3,801 | | | $ | 3,706 | |
Non-current assets | | | 3,038 | | | | 3,194 | |
Current liabilities | | | 1,276 | | | | 1,389 | |
Non-current liabilities | | | 1,990 | | | | 1,785 | |
Non-controlling interest | | | 60 | | | | 56 | |
| | | | | | | | | |
| | | | | | | | | | | | |
| | | 2014 | | | 2013 | | | 2012 | |
Sales | | $ | 6,019 | | | $ | 6,381 | | | $ | 6,815 | |
Gross profit | | | 819 | | | | 1,028 | | | | 1,502 | |
Income from continuing operations and net income | | | 464 | | | | 679 | | | | 961 | |
| | | | | | | | | | | | | |
Dividends received from these equity-accounted investments in 2014 were $172 (2013 – $180, 2012 – $211).
Available-for-Sale Investments
| | |
Accounting Policies | | Accounting Estimates and Judgments |
| The fair value of investments designated as available-for-sale is recorded in the consolidated statements of financial position, with unrealized gains and losses, net of related income taxes, recorded in accumulated other comprehensive income (“AOCI”). The cost of investments sold is based on the weighted average method. Realized gains and losses on these investments are removed from AOCI and recorded in net income. The company assesses at the end of each reporting period whether there | | The company’s 22 percent ownership of Sinofert does not constitute significant influence and its investment is therefore accounted for as available-for-sale. The determination of when an investment is impaired requires significant judgment. In making this judgment, the company evaluates, among other factors, the duration and extent to which the fair value of the investment is less than its cost at each reporting period-end. |
| | |
| PotashCorp 2014 Annual Integrated Report | | 119 |
In millions of US dollars except as otherwise noted
Note 14 Investments continued
| | |
Accounting Policies continued | | Accounting Estimates and Judgments continued |
| is objective evidence of impairment. A significant or prolonged decline in the fair value of the investment below its cost would be evidence that the asset is impaired. If objective evidence of impairment exists, the impaired amount (i.e., the unrealized loss) is recognized in net income; any subsequent reversals would be recognized in OCI and would not flow back into net income. Any subsequent decline in the fair value below the carrying amount at the impairment date would represent a further impairment to be recognized in net income. See Note 25 for a description of how the company determines fair value for its investments. | | During 2012, the company concluded its investment in Sinofert was impaired due to the significance by which fair value was below cost. As a result, an impairment loss of $341 was recognized in net income during 2012. There were no such impairments in 2013. At March 31, 2014, the company concluded its investment in Sinofert was further impaired due to the fair value declining below the carrying amount of $238 at the previous impairment date. As a result, an additional impairment loss of $38 was recognized in net income during 2014. Increases in fair value subsequent to this time were recognized in OCI. The fair value was determined through the market value of Sinofert shares on the Hong Kong Stock Exchange. |
| | | |
Supporting Information
Available-for-sale investments as at December 31 were as follows:
| | | | | | | | | | | | | | | | | | | | |
| | | Principal Activity | | Principal Place of Business
and Incorporation | | Proportion of Ownership
Interest and Voting Rights Held | | | Fair Value and
Carrying Amount | |
| Name | | | | 2014 | | | 2013 | | | 2014 | | | 2013 | |
ICL | | Fertilizer & Specialty Chemicals | | Israel | | | 14% | | | | 14% | | | $ | 1,275 | | | $ | 1,468 | |
Sinofert | | Fertilizer Supplier & Distributor | | China/Bermuda | | | 22% | | | | 22% | | | | 252 | | | | 254 | |
| | | | | | | | | | | | | | | | | | | | | |
| | | | | | | | | | | | | | $ | 1,527 | | | $ | 1,722 | |
| | | | | | | | | | | | | | | | | | | | | |
As at December 31, 2014, the net unrealized gain on these investments was $244 (2013 – $439).
Changes in fair value, and related accounting, for the company’s investment in Sinofert since December 31, 2011 were as follows:
| | | | | | | | | | | | | | | | |
| | | | | | | | | Impact of Unrealized Loss on: | |
| | | Fair Value | | | Unrealized Loss | | | OCI and AOCI | | | Net Income and
Retained Earnings | |
Balance – December 31, 2011 | | $ | 439 | | | $ | (140 | ) | | $ | (140 | ) | | $ | – | |
Decrease in fair value prior to recognition of impairment | | | (201 | ) | | | (201 | ) | | | (201 | ) | | | – | |
Recognition of impairment | | | – | | | | – | | | | 341 | | | | (341 | ) |
Increase in fair value subsequent to recognition of impairment | | | 139 | | | | 139 | | | | 139 | | | | – | |
| | | | | | | | | | | | | | | | | |
Balance – December 31, 2012 | | $ | 377 | | | $ | (202 | ) | | $ | 139 | | | $ | (341 | ) |
Decrease in fair value during the year | | | (123 | ) | | | (123 | ) | | | (123 | ) | | | – | |
| | | | | | | | | | | | | | | | | |
Balance – December 31, 2013 | | $ | 254 | | | $ | (325 | ) | | $ | 16 | | | $ | (341 | ) |
Decrease in fair value and recognition of impairment | | | (54 | ) | | | (54 | ) | | | (16 | ) | | | (38 | ) |
Increase in fair value subsequent to recognition of impairment | | | 52 | | | | 52 | | | | 52 | | | | – | |
| | | | | | | | | | | | | | | | | |
Balance – December 31, 2014 | | $ | 252 | | | $ | (327 | ) | | $ | 52 | | | $ | (379 | ) |
| | | | | | | | | | | | | | | | | |

Accounting Estimates and Judgments
|
The costs of certain ammonia catalysts are capitalized to other assets and are amortized, net of residual value, on a straight-line basis over their estimated useful lives of three to 12 years. Upfront lease costs are capitalized to other assets and amortized over the life of the leases on a straight-line basis, the latest of which extends through 2037. |
| | |
| 120 | | PotashCorp 2014 Annual Integrated Report |
Financials and Notes
In millions of US dollars except as otherwise noted
Note 15 Other Assets continued
Supporting Information
Other assets as at December 31 were comprised of:
| | | | | | | | |
| | | 2014 | | | 2013 | |
Long-term income taxes receivable (Note 8) | | $ | 83 | | | $ | 126 | |
Ammonia catalysts – net of accumulated amortization of $46 (2013 – $44) | | | 30 | | | | 37 | |
Investment tax credits receivable | | | 27 | | | | 35 | |
Accrued pension benefit asset (Note 21) | | | 25 | | | | 129 | |
Upfront lease costs – net of accumulated amortization of $10 (2013 – $9) | | | 17 | | | | 18 | |
Deferred income tax assets (Note 8) | | | 10 | | | | 21 | |
Derivative instrument assets (Note 19) | | | 7 | | | | 6 | |
Other – net of accumulated amortization of $21 (2013 – $19) | | | 33 | | | | 29 | |
| | | | | | | | | |
| | $ | 232 | | | $ | 401 | |
| | | | | | | | | |
Amortization of other assets included in cost of goods sold and in selling and administrative expenses for 2014 was $12 (2013 – $11, 2012 – $6).

Intangible assets including goodwill, are identifiable, represent future economic benefits and are controlled by the company. Goodwill is not amortized but is subject to annual impairment reviews.
| | |
Accounting Policies | | Accounting Estimates
and Judgments |
An intangible asset is defined as being identifiable, able to bring future economic benefits to the company and controlled by it. An asset meets the identifiability criterion when it is separable or arises from contractual rights. Intangible assets are recorded initially at cost and relate primarily to production and technology rights, contractual customer relationships, computer software and goodwill. Internally generated intangible assets relate to computer software and other developed projects. An intangible asset is recognized when it is probable that the expected future economic benefits attributable to the asset will flow to the company and the cost of the asset can be measured reliably. Costs associated with maintaining computer software programs are recognized as an expense as incurred. Development costs are recognized as intangible assets when the following criteria are met: • It is technically feasible to complete the asset so it will be available for use; • Management intends to complete the asset and use or sell it; | | Judgment is necessary to determine whether expenditures made by the company on non-tangible items represent intangible assets eligible for capitalization. Finite-lived intangible assets are accounted for at cost and are amortized on a straight-line basis over their estimated useful lives, the determination of which involves estimation. Goodwill is allocated to CGUs or groups of CGUs for the purpose of impairment testing based on the level at which it is monitored by management, and not at a level higher than an operating segment. The allocation is made to those CGUs or groups of CGUs that are expected to benefit from the business combination in which the goodwill arose. |
• The asset can be used or sold; • It can be demonstrated how the asset will generate probable future economic benefits; • Adequate technical, financial and other resources to complete the development and to use or sell the asset are available; and • The expenditure attributable to the asset during its development can be reliably measured. Directly attributable costs that are capitalized as part of the asset include applicable employee costs. Development costs previously recognized as an expense are not recognized as an asset in a subsequent period. | |
| | |
| PotashCorp 2014 Annual Integrated Report | | 121 |
In millions of US dollars except as otherwise noted
Note 16 Intangible Assets continued
| | |
Accounting Policies continued | | Accounting Estimates
and Judgments continued |
Amortization expense is recognized in net income in the expense category consistent with the function of the intangible asset. The useful lives are reviewed, and adjusted if appropriate, at the end of each reporting period. Changes in the expected useful life or the expected pattern of consumption of future economic benefits embodied in the asset are accounted for by changing the amortization period or method, as appropriate, and are treated as changes in accounting estimates. All business combinations are accounted for using the acquisition method. Identifiable intangible assets are recognized separately from goodwill. Goodwill is carried at cost, is no longer amortized and represents the excess of the cost of an acquisition over the fair value of the company’s share of the net identifiable assets of the acquired subsidiary or equity method investee at the date of acquisition. Separately recognized goodwill is carried at cost less accumulated amortization (recognized prior to 2002) and impairment losses. Gains and losses on the disposal of an entity include the carrying amount of goodwill relating to the entity sold. | | |
| | | |
Supporting Information
Goodwill is the only intangible asset with an indefinite useful life recognized by the company. All other intangible assets have finite useful lives. Following is a reconciliation of intangible assets:
| | | | | | | | | | | | | | | | | | | | | | | | |
| | | Goodwill 1 | | | Other | | | Total | |
| | | 2014 | | | 2013 | | | 2014 | | | 2013 | | | 2014 | | | 2013 | |
Carrying amount, beginning of year | | $ | 97 | | | $ | 97 | | | $ | 40 | | | $ | 29 | | | $ | 137 | | | $ | 126 | |
Additions | | | – | | | | – | | | | 9 | | | | 14 | | | | 9 | | | | 14 | |
Amortization | | | – | | | | – | | | | (4 | ) | | | (3 | ) | | | (4 | ) | | | (3 | ) |
| | | | | | | | | | | | | | | | | | | | | | | | | |
Carrying amount, end of year | | $ | 97 | | | $ | 97 | | | $ | 45 | | | $ | 40 | | | $ | 142 | | | $ | 137 | |
| | | | | | | | | | | | | | | | | | | | | | | | | |
Balance as at December 31 comprised of: | | | | | | | | | | | | | | | | | | | | | | | | |
Cost | | $ | 104 | | | $ | 104 | | | $ | 91 | | | $ | 82 | | | $ | 195 | | | $ | 186 | |
Accumulated amortization | | | (7 | ) | | | (7 | ) | | | (46 | ) | | | (42 | ) | | | (53 | ) | | | (49 | ) |
| | | | | | | | | | | | | | | | | | | | | | | | | |
Carrying amount | | $ | 97 | | | $ | 97 | | | $ | 45 | | | $ | 40 | | | $ | 142 | | | $ | 137 | |
| | | | | | | | | | | | | | | | | | | | | | | | | |
| 1 | The company’s aggregate carrying amount of goodwill was $97 (2013 – $97), representing 1.1 percent of shareholders’ equity as at December 31, 2014 (2013 – 1.0 percent). Substantially all of the company’s recorded goodwill relates to the nitrogen segment. |

The company uses its $2.5 billion commercial paper program for its short-term cash requirements. The commercial paper program is backstopped by a long-term credit facility.
Short-term debt as at December 31 was comprised of:
| | | | | | | | |
| | | 2014 | | | 2013 | |
Commercial paper | | $ | 536 | | | $ | 470 | |
| | | | | | | | | |
The amount available under the commercial paper program is limited to the availability of backup funds under the credit facility. As at December 31, 2014, the company was authorized to issue commercial paper up to $2,500 (2013 – $2,500).
The company has a $75 unsecured line of credit available for short-term financing. Net of letters of credit of $NIL and direct borrowings of $NIL, $75 was available as at December 31, 2014 (2013 – $57). The line of credit is available through August 2015.
| | |
| 122 | | PotashCorp 2014 Annual Integrated Report |
Financials and Notes
In millions of US dollars except as otherwise noted
Note 17 Short-Term Debt continued
The line of credit is subject to financial tests and other covenants. Principal covenants and events of default are as follows: debt-to-capital ratio of less than or equal to 0.60:1, a long-term-debt-to-EBITDA (as defined in the agreement to be earnings before interest, income taxes, provincial mining and other taxes, depreciation, amortization and other non-cash expenses, and unrealized gains and losses in respect of hedging instruments) ratio of less than or equal to 3.5:1, net book value of disposed assets not to exceed 25 percent of the prior-year end’s total assets, debt of subsidiaries not to exceed $1,000 and a $300 permitted lien basket. The line of credit is subject to other customary covenants and events of default, including an event of default for non-payment of other debt in excess of $100. Non-compliance with such covenants could result in accelerated payment of amounts due under the line of credit, and its termination. The company was in compliance with the above-mentioned covenants as at December 31, 2014.

Trade and other payables and accrued charges mainly consist of amounts owed to suppliers, contractors, employees and shareholders that have been invoiced or accrued.
Payables and accrued charges as at December 31 were comprised of:
| | | | | | | | |
| | | 2014 | | | 2013 | |
Trade accounts | | $ | 457 | | | $ | 450 | |
Dividends | | | 291 | | | | 301 | |
Accrued compensation | | | 101 | | | | 91 | |
Deferred revenue | | | 81 | | | | 60 | |
Current portion of asset retirement obligations and accrued environmental costs (Note 22) | | | 52 | | | | 41 | |
Accrued interest | | | 36 | | | | 36 | |
Accrued deferred share units | | | 22 | | | | 19 | |
Current portion of pension and other post-retirement benefits (Note 21) | | | 12 | | | | 12 | |
Income taxes (Note 8) | | | 5 | | | | 3 | |
Termination benefits | | | – | | | | 56 | |
Other payables and other accrued charges | | | 29 | | | | 35 | |
| | | | | | | | | |
| | $ | 1,086 | | | $ | 1,104 | |
| | | | | | | | | |

PotashCorp enters into contracts with other parties to fix the price of natural gas used as feedstock in production and the exchange rate for Canadian dollar transactions.
| | |
Accounting Policies | | Accounting Estimates
and Judgments |
| Derivative financial instruments are used by the company to manage its exposure to commodity price and exchange rate fluctuations. Contracts to buy or sell a non-financial item that can be settled net in cash or another financial instrument, or by exchanging financial instruments, as if the contracts were financial instruments (except contracts that were entered into and continue to be held for the purpose of the receipt or delivery of a non-financial item in accordance with expected purchase, sale or usage requirements), are accounted for as derivative financial instruments. The company recognizes its derivative instruments at fair value on the consolidated statements of financial position where appropriate. | | Uncertainties, estimates and use of judgment include the assessment of contracts as derivative instruments and for embedded derivatives, application of hedge accounting and valuation of derivatives at fair value (discussed further in Note 25). |
| | |
| PotashCorp 2014 Annual Integrated Report | | 123 |
In millions of US dollars except as otherwise noted
Note 19 Derivative Instruments continued
| | |
Accounting Policies continued | | Accounting Estimates
and Judgments continued |
The accounting for changes in the fair value (i.e., gains or losses) of a derivative instrument depends on whether it has been designated and qualifies as part of a hedging relationship. For instruments designated as fair value hedges, the effective portion of the change in the fair value of the derivative is offset in net income against the change in fair value, attributed to the risk being hedged, of the underlying hedged asset, liability or firm commitment. For cash flow hedges, the effective portion of the change in the fair value of the derivative is accumulated in OCI until the variability in cash flows being hedged is recognized in net income in future accounting periods. Ineffective portions of hedges are recorded in net income in the current period. The change in fair value of derivative instruments not designated as hedges is recorded in net income in the current period. The company’s policy is not to use derivative instruments for trading or speculative purposes, although it may choose not to designate an economic hedging relationship as an accounting hedge. The company formally documents all relationships between hedging instruments and hedged items, as well as its risk management objective and strategy for undertaking the hedge transaction. This process includes linking derivatives to specific assets and liabilities or to specific firm commitments or forecast transactions. The company also assesses, both at the hedge’s inception and on an ongoing basis, whether the derivatives used in hedging transactions are expected to be or were, as appropriate, highly effective in offsetting changes in fair values of hedged items. Hedge effectiveness related to the company’s natural gas hedges is assessed on a prospective and retrospective basis using regression analyses. A hedging relationship may be terminated because the hedge ceases to be effective, the underlying asset or liability being hedged is derecognized, or the derivative instrument is no longer designated as a hedging instrument. In such instances, the difference between the fair value and the accrued value of the hedging derivatives upon termination is deferred and recognized in net income on the same basis that gains, losses, revenue and expenses of the previously hedged item are recognized. If a cash flow hedging relationship is terminated because it is no longer probable that the anticipated transaction will occur, then the net gain or loss accumulated in OCI is recognized in current period net income. | | In determining whether a contract represents a derivative or contains an embedded derivative, the most significant area where judgment has been applied pertains to the determination as to whether the contract can be settled net, one of the criteria in determining whether a contract for a non-financial asset is considered a derivative and accounted for as such. Judgment is also applied in determining whether an embedded derivative is closely related to the host contract, in which case bifurcation and separate accounting are not necessary. To obtain and maintain hedge accounting for its natural gas derivative instruments, the company must be able to establish that the hedging instrument is effective at offsetting the risk of the hedged item both retrospectively and prospectively, and ensure documentation meets stringent requirements. The process to test effectiveness requires the application of judgment and estimation. |
Supporting Information
Significant recent derivatives included the following:
| • | | Natural gas futures and swap agreements to manage the cost of natural gas, generally designated as cash flow hedges of anticipated transactions. |
| • | | Foreign currency forward contracts for the primary purpose of limiting exposure to exchange rate fluctuations relating to expenditures denominated in currencies other than the US dollar, not designated as hedging instruments for accounting purposes. |
Derivatives as at December 31 were comprised of:
| | | | | | | | | | | | | | | | | | | | | | | | |
| | | 2014 | | | 2013 | |
| | | Assets | | | Liabilities | | | Net | | | Assets | | | Liabilities | | | Net | |
Natural gas derivatives – designated cash flow hedges | | $ | 7 | | | $ | 190 | | | $ | (183 | ) | | $ | 8 | | | $ | 170 | | | $ | (162 | ) |
Natural gas derivatives | | | – | | | | 3 | | | | (3 | ) | | | – | | | | – | | | | – | |
Foreign currency derivatives | | | – | | | | 2 | | | | (2 | ) | | | – | | | | 1 | | | | (1 | ) |
| | | | | | | | | | | | | | | | | | | | | | | | | |
Total | | | 7 | | | | 195 | | | | (188 | ) | | | 8 | | | | 171 | | | | (163 | ) |
Less current portion | | | – | | | | (80 | ) | | | 80 | | | | (2 | ) | | | (42 | ) | | | 40 | |
| | | | | | | | | | | | | | | | | | | | | | | | | |
Long-term portion | | $ | 7 | | | $ | 115 | | | $ | (108 | ) | | $ | 6 | | | $ | 129 | | | $ | (123 | ) |
| | | | | | | | | | | | | | | | | | | | | | | | | |
As at December 31, 2014, the company’s net exposure to natural gas derivatives in the form of swaps and futures was a notional amount of 101 million MMBtu with maturities in 2015 through 2022 (2013 – NIL).
For the year ended December 31, 2014, losses before taxes of $62 were recognized in OCI (2013 – $NIL, 2012 – $27). For the year ended December 31, 2014, losses before taxes of $40 (2013 – $51, 2012 – $82) were reclassified from AOCI and recognized in cost of goods sold excluding ineffectiveness, which changed these losses by $1 (2013 – $NIL, 2012 – $NIL). Of the losses before taxes at December 31, 2014, approximately $74 (2013 – $40, 2012 – $50) will be reclassified to cost of goods sold within the next 12 months.
As at December 31, 2014, the company had entered into foreign currency forward contracts to sell US dollars and receive Canadian dollars in the notional amount of $140 (2013 – $148) at an average exchange rate of 1.1403 (2013 – 1.0569) per US dollar with maturities in 2015 (2013 – maturities in 2014).
| | |
| 124 | | PotashCorp 2014 Annual Integrated Report |
Financials and Notes
In millions of US dollars except as otherwise noted

The company’s sources of borrowing for funding and liquidity purposes are primarily senior notes and a long-term credit facility that provides for unsecured borrowings and backstops its commercial paper program.
Accounting Policy
|
Issue costs of long-term debt obligations are capitalized to long-term obligations and are amortized to expense over the term of the related liability using the effective interest method. |
Supporting Information
Long-term debt as at December 31 was comprised of:
| | | | | | | | | | | | | | |
| | | Rate of Interest | | | Maturity | | 2014 | | | 2013 | |
Senior notes1 | | | | | | | | | | | | | | |
Notes issued 2009 and redeemed April 7, 2014 | | | 5.250% | | | May 15, 2014 | | $ | – | | | $ | 500 | |
Notes issued 2009 | | | 3.750% | | | September 30, 2015 | | | 500 | | | | 500 | |
Notes issued 2010 | | | 3.250% | | | December 1, 2017 | | | 500 | | | | 500 | |
Notes issued 2009 | | | 6.500% | | | May 15, 2019 | | | 500 | | | | 500 | |
Notes issued 2009 | | | 4.875% | | | March 30, 2020 | | | 500 | | | | 500 | |
Notes issued 2014 | | | 3.625% | | | March 15, 2024 | | | 750 | | | | – | |
Notes issued 2006 | | | 5.875% | | | December 1, 2036 | | | 500 | | | | 500 | |
Notes issued 2010 | | | 5.625% | | | December 1, 2040 | | | 500 | | | | 500 | |
Other | | | | | | | | | 6 | | | | 6 | |
| | | | | | | | | | | | | | | |
| | | | | | | | | 3,756 | | | | 3,506 | |
Less net unamortized debt issue costs | | | | | | | | | (47 | ) | | | (39 | ) |
| | | | | | | | | | | | | | | |
| | | | | | | | | 3,709 | | | | 3,467 | |
Less current maturities | | | | | | | | | (500 | ) | | | (500 | ) |
Add current portion of amortization | | | | | | | | | 4 | | | | 3 | |
| | | | | | | | | | | | | | | |
| | | | | | | | $ | 3,213 | | | $ | 2,970 | |
| | | | | | | | | | | | | | | |
| 1 | Each series of senior notes is unsecured and has no sinking fund requirements prior to maturity. Each series is redeemable, in whole or in part, at the company’s option, at any time prior to maturity for a price equal to the greater of the principal amount of the notes to be redeemed and the present value of the remaining scheduled payments of principal and interest based on a predetermined computation of the discount rate, plus accrued and unpaid interest. The series of senior notes issued in 2014 is redeemable, in whole or in part, at the company’s option, at any time three months before maturity for a price equal to 100 percent of the principal amount of the notes to be redeemed, plus accrued and unpaid interest. Under certain conditions related to a change in control, the company is required to make an offer to purchase all, or any part, of the senior notes at 101 percent of the principal amount of the notes to be repurchased, plus accrued and unpaid interest. |
The company has a long-term revolving credit facility that provides for unsecured borrowings and also backstops its commercial paper program. The availability of borrowings is reduced by the amount of commercial paper outstanding. Details of the company’s credit facilities were as follows:
| | | | |
| | | 2014 1 | | 2013 |
Facility as at December 31 | | $3,400 – maturity May 31, 2019 | | $3,500 – maturity May 31, 2018 |
| | $100 – maturity May 31, 2018 | | |
| | | | | |
Borrowings outstanding as at December 31 | | $NIL | | $NIL |
| | | | | |
Commercial paper outstanding, backstopped by the credit facility, as at December 31 (Note 17) | | $536 | | $470 |
| | | | | |
Amounts borrowed and repaid during the year ended December 31 | | $NIL | | $NIL |
| | | | | |
| 1 | During 2014, the company extended its revolving term credit facility by one year with the exception of one bank that did not extend, resulting in a split maturity. |
| | |
| PotashCorp 2014 Annual Integrated Report | | 125 |
In millions of US dollars except as otherwise noted
Note 20 Long-Term Debt continued
Other long-term debt in the above table includes a net financial liability of $6 (2013 – $6) pursuant to back-to-back loan arrangements that have a legally enforceable right to offset and that the company intends to settle with the same party on a net basis (Note 25).
The senior notes are not subject to any financial test covenants but are subject to certain customary covenants (including limitations on liens and on sale and leaseback transactions) and events of default, including an event of default for acceleration of other debt in excess of $50. Principal covenants and events of default under the credit facility are the same as those under the line of credit described in Note 17. Non-compliance with such covenants could result in accelerated payment of amounts due under the credit facility, and its termination. The back-to-back loan arrangements are not subject to any financial test covenants but are subject to certain customary covenants and events of default, including, for other long-term debt, an event of default for non-payment of other debt in excess of $25. Non-compliance with such covenants could result in accelerated payment of the related debt. The company was in compliance with the above-mentioned covenants as at December 31, 2014.
Long-term debt obligations as at December 31, 2014 will mature as follows:
| | | | |
2015 | | $ | 500 | |
2016 | | | – | |
2017 | | | 506 | |
2018 | | | – | |
2019 | | | 500 | |
Subsequent years | | | 2,250 | |
| | | | | |
| | $ | 3,756 | |
| | | | | |

The company offers a number of benefit plans that provide pension and other post-retirement benefits to qualified employees: defined benefit pension plans; defined contribution pension plans; and health, disability, dental and life insurance (referred to as other defined benefit) plans. Substantially all employees are participants in at least one of these plans.
Defined Benefit Plans
| | |
| Accounting Policies | | Accounting Estimates and Judgments |
| The company accrues its obligations under employee benefit plans and the related costs, net of plan assets. The cost of pensions and other retirement benefits earned by employees generally is actuarially determined using the projected unit credit method and management’s best estimate of salary escalation, retirement ages of employees and expected health care costs. Actuaries perform valuations on a regular basis to determine the actuarial present value of the accrued pension and other post-employment benefits. Net interest is calculated by applying the discount rate used to measure the defined benefit obligation at the beginning of the annual period to the net defined benefit liability or asset. Past service cost is recognized in net income at the earlier of when a plan amendment or curtailment occurs or when related restructuring costs or termination benefits are recognized. Defined benefit cost includes, as applicable, service cost, past service cost, gains and losses on curtailments and settlements, net interest and remeasurements. | | The calculation of employee benefit plan expenses and obligations depends on assumptions such as discount rates, health care cost trend rates, projected salary increases, retirement age, longevity and termination rates. These assumptions are determined by management and are reviewed annually by the company’s independent actuaries. The company’s discount rate assumption reflects the weighted average interest rate at which the pension and other post-retirement liabilities could be effectively settled at the measurement date. The rate varies by country. The company determines the discount rate using a yield curve approach. Based on the respective plans’ demographics, expected future pension benefits and medical claims, payments are measured and discounted to determine the present value of the expected future cash flows. The cash flows are discounted using yields on high-quality AA-rated non-callable |
| | |
| 126 | | PotashCorp 2014 Annual Integrated Report |
Financials and Notes
In millions of US dollars except as otherwise noted
Note 21 Pension and Other Post-Retirement Benefits continued
| | |
| Accounting Policies continued | | Accounting Estimates and Judgments continued |
The company presents net interest within finance costs in the consolidated statements of income. The other components of defined benefit cost are presented within cost of goods sold or selling and administrative expenses, as applicable, in the consolidated statements of income. Remeasurements arising from defined benefit plans comprise actuarial gains and losses, the return on plan assets (excluding amounts included in net interest) and the effect of the asset ceiling (if applicable). The company recognizes remeasurements immediately in OCI in the period they occur. When a plan amendment occurs before a settlement, the company recognizes past service cost before any gain or loss on settlement. | | bonds with cash flows of similar timing where there is a deep market for such bonds. Where the company does not believe there is a deep market for such bonds (such as for terms in excess of 10 years in Canada), the cash flows are discounted using a yield curve derived from yields on provincial bonds rated AA or better to which a spread adjustment is added to reflect the additional risk of corporate bonds. For Trinidad plans, the cash flows are discounted using yields on local market government bonds with cash flows of similar timing. The resulting rates are used by the company to determine the final discount rate. |
The significant assumptions used to determine the benefit obligation and expense for the company’s significant plans were as follows:
| | | | | | | | | | | | | | | | | | | | | | | | |
| | | Pension | | | Other | |
| | | 2014 | | | 2013 | | | 2012 | | | 2014 | | | 2013 | | | 2012 | |
Assumptions used to determine benefit obligation as at December 31 | | | | | | | | | | | | | | | | | | | | | | | | |
Discount rate, % | | | 4.00 | | | | 4.80 | | | | 3.85 | | | | 4.00 | | | | 4.80 | | | | 3.85 | |
Rate of increase in compensation levels, % | | | 5.00 | | | | 5.00 | | | | 4.00 | | | | n/a | | | | n/a | | | | n/a | |
Medical cost trend rate – assumed, % | | | n/a | | | | n/a | | | | n/a | | | | 6.90-4.50 | 1 | | | 7.00-4.50 | 1 | | | 7.00-4.50 | 1 |
Medical cost trend rate – year reaches ultimate trend rate | | | n/a | | | | n/a | | | | n/a | | | | 2027 | | | | 2027 | | | | 2027 | |
| | | | | | | | | | | | | | | | | | | | | | | | | |
Assumptions used to determine benefit expense for the year | | | | | | | | | | | | | | | | | | | | | | | | |
Discount rate, % | | | 4.80 | | | | 3.85 | | | | 4.60 | | | | 4.80 | | | | 3.85 | | | | 4.60 | |
Rate of increase in compensation levels, % | | | 5.00 | | | | 4.00 | | | | 4.00 | | | | n/a | | | | n/a | | | | n/a | |
Medical cost trend rate – assumed, % | | | n/a | | | | n/a | | | | n/a | | | | 7.00-4.50 | 1 | | | 7.00-4.50 | 1 | | | 6.00 | |
Medical cost trend rate – year reaches ultimate trend rate | | | n/a | | | | n/a | | | | n/a | | | | 2027 | | | | 2027 | | | | 2011 | |
| | | | | | | | | | | | | | | | | | | | | | | | | |
| 1 | The company assumed a graded medical cost trend rate starting at 6.90 percent in 2014 moving to 4.50 percent by 2027 (7.00 percent in 2012 and 2013 moving to 4.50 percent by 2027). |
Mortality assumptions are a significant factor in measuring the company’s obligations under its defined benefit plans and are set based on actuarial advice in accordance with the latest available published tables adjusted where appropriate to reflect future longevity improvements for each country. The mortality assumptions used to determine the benefit obligation and expense for the company’s significant plans were as follows as at December 31:
| | | | | | | | | | | | | | | | | | | | | | | | |
| | | Pension | | | Other | |
| | | 2014 | | | 2013 | | | 2012 | | | 2014 | | | 2013 | | | 2012 | |
Life expectancy at 65 for a male member currently at age 65 | | | 21.6 | | | | 20.5 | | | | 19.2 | | | | 21.6 | | | | 20.5 | | | | 19.2 | |
Life expectancy at 65 for a male member currently at age 45 | | | 23.3 | | | | 22.7 | | | | 19.2 | | | | 23.3 | | | | 22.7 | | | | 19.2 | |
Life expectancy at 65 for a female member currently at age 65 | | | 23.8 | | | | 22.8 | | | | 21.0 | | | | 23.8 | | | | 22.8 | | | | 21.0 | |
Life expectancy at 65 for a female member currently at age 45 | | | 25.5 | | | | 24.6 | | | | 21.0 | | | | 25.5 | | | | 24.6 | | | | 21.0 | |
| | | | | | | | | | | | | | | | | | | | | | | | | |
| | | | | | | | | | | | | | | | |
| | | Pension | | | Other | |
| | | 2014 | | | 2013 | | | 2014 | | | 2013 | |
Average remaining service period of active employees (years) | | | 11.6 | | | | 11.3 | | | | 11.6 | | | | 12.1 | |
Average duration of the defined benefit obligation 1 (years) | | | 15.8 | | | | 14.6 | | | | 19.4 | | | | 17.6 | |
| | | | | | | | | | | | | | | | | |
| 1 | Weighted average length of the underlying cash flows. |
| | |
| PotashCorp 2014 Annual Integrated Report | | 127 |
In millions of US dollars except as otherwise noted
Note 21 Pension and Other Post-Retirement Benefits continued
Sensitivity to changes in key assumptions for the company’s pension and other post-retirement benefit plans was as follows:
| | | | | | | | | | | | | | | | | | | | |
| | | | | | 2014 | | | 2013 | |
| | | Change in Assumption | | | Benefit Obligation | | | Expense in Income
Before Income Taxes | | | Benefit Obligation | | | Expense in Income
Before Income Taxes | |
As reported | | | | | | $ | 1,806 | | | $ | 47 | | | $ | 1,545 | | | $ | 39 | |
| | | | | | | | | | | | | | | | | | | | | |
Discount rate | | | 1.0 percentage point | q | | | 346 | | | | 18 | | | | 276 | | | | 13 | |
| | | 1.0 percentage point | p | | | (266 | ) | | | (17 | ) | | | (216 | ) | | | (14 | ) |
| | | | | | | | | | | | | | | | | | | | | |
Rate of compensation increase | | | 1.0 percentage point | q | | | (40 | ) | | | (4 | ) | | | (33 | ) | | | (4 | ) |
| | | 1.0 percentage point | p | | | 45 | | | | 5 | | | | 37 | | | | 4 | |
| | | | | | | | | | | | | | | | | | | | | |
Medical cost trend rate | | | 1.0 percentage point | q | | | (62 | ) | | | (4 | ) | | | (49 | ) | | | (4 | ) |
| | | 1.0 percentage point | p | | | 72 | | | | 5 | | | | 55 | | | | 5 | |
| | | | | | | | | | | | | | | | | | | | | |
Longevity at retirement age | | | 1.0 year | q | | | (46 | ) | | | (3 | ) | | | (36 | ) | | | (2 | ) |
| | | 1.0 year | p | | | 45 | | | | 3 | | | | 36 | | | | 2 | |
| | | | | | | | | | | | | | | | | | | | | |
The above sensitivities are hypothetical and should be used with caution. Changes in amounts based on a 1.0 percentage point change in assumptions or 1.0 year variation in longevity generally cannot be extrapolated because the relationship of the change in assumption to the change in amounts may not be linear. The sensitivities have been calculated independently of changes in other key variables. Changes in one factor may result in changes in another, which could amplify or reduce certain sensitivities.
Supporting Information
Description of defined benefit pension plans
The company sponsors defined benefit pension plans in the US, Canada and Trinidad. Plan types and contributions are as follows:
| | | | |
| | | Plan Type | | Contributions |
| United States | | Non-contributory. Plans provide benefits to members in the form of a guaranteed level of annual pension payments for life. The level of benefits provided generally depends on the member’s years of service and compensation level in the final years leading up to normal retirement age of 65. Early retirement benefits are available starting at age 55 at a reduced rate. These plans provide for maximum pensionable salary and maximum annual benefit limits. | | Contributions are made to meet or exceed minimum funding requirements of the Employee Retirement Income Security Act of 1974 (“ERISA”) and associated Internal Revenue Service regulations and procedures. |
| Canada | | | Contributions are made to meet or exceed minimum funding requirements based on provincial statutory requirements and associated federal taxation rules. |
| Trinidad | | Contributory. The plan provides benefits to members in the form of a guaranteed level of annual pension payments for life. Members generally contribute between 3 percent and 6 percent of their salary depending on the plan year. Members can elect to make additional voluntary contributions but are subject to maximum annual limits. The level of benefits provided depends on the member’s years of service, compensation level in the final years leading up to normal retirement age of 60 and if any additional voluntary contributions were made. Early retirement benefits with at least five years of pensionable service are available starting at age 50 at a reduced rate. The plan provides for pensionable salary and maximum annual benefit limits. | | Contributions are made to meet or exceed minimum funding requirements based on local statutory requirements. In particular, any company contributions must meet or exceed any required employee contributions. |
| Supplemental Plans in US and Canada for Senior Management | | Non-contributory, unfunded. Plans provide supplementary pension benefits. | | Provided for by charges to earnings sufficient to meet the projected benefit obligation. Payments to the plans are made as plan payments to retirees occur. |
| | |
| 128 | | PotashCorp 2014 Annual Integrated Report |
Financials and Notes
In millions of US dollars except as otherwise noted
Note 21 Pension and Other Post-Retirement Benefits continued
The company’s defined benefit pension plans discussed above are funded with separate funds that are legally separated from the company and administered through an employee benefits or management committee in each country, which is composed of employees of the company. The employee benefits or management committee is required by law to act in the best interests of the plan participants and in the US and Canada is responsible for the governance of the plans, including setting certain policies (e.g., investment and contribution) of the funds. In Trinidad, the plan’s trustee has these responsibilities and the management committee assists the trustee to administer the plan. The current investment policy for each country’s plans does not include any asset/liability matching strategies or currency hedging strategies. Plan assets held in trusts are governed by local regulations and practice in each country, as is the nature of the relationship between the company and the trustees and their composition.
The defined benefit pension plans expose the company to broadly similar actuarial risks. The most significant risks as discussed below include: investment risk, interest rate risk, longevity risk and salary risk. These plans are not exposed to any other significant, unusual or specific risks.
Investment risk
The present value of the defined benefit obligation was calculated using a discount rate determined by reference to high-quality corporate bond yields in the US and Canada and to government bond yields in Trinidad. If plan assets underperform this yield, a deficit will be created. The company employs a total return on investment approach whereby a mix of equities and fixed income investments is used to maximize the long-term return of plan assets for a prudent level of risk. Risk tolerance is established through careful consideration of plan liabilities, plan funded status and corporate financial condition. The investment portfolio contains a diversified mix of equity and fixed income investments.
For plans in the US and Canada, equity investments are diversified across US and non-US stocks, as well as growth, value and small and large capitalization investments. US equities are also diversified across actively managed and passively invested portfolios. Other assets such as private equity, real estate and hedge funds are not used at this time. Investment risk is measured and monitored on an ongoing basis through quarterly investment portfolio reviews, annual liability measurements and periodic asset/liability studies.
The investment strategy in Trinidad is largely dictated by local investment restrictions (maximum of 50 percent in equities and 20 percent in assets originating from outside of Trinidad) and asset availability since the local equity market is small and there is little secondary market activity in debt securities.
Interest rate risk
A decrease in bond interest rates will increase the pension liability; however, this is generally expected to be partially offset by an increase in the return on the plan’s debt investments.
Longevity risk
The present value of the defined benefit obligation was calculated by reference to the current best estimate of the longevity of plan participants both during and after their employment. An increase in life expectancy of plan participants will increase the plan’s liability.
Salary risk
The present value of the defined benefit obligation was calculated by reference to the future salaries of plan participants. An increase in the salary of the plan’s participants will increase the plan’s liability.
As at December 31, 2014, the company’s Canadian and Trinidad defined benefit pension plans were in a surplus position (2013 – US, Canadian and Trinidad defined benefit pension plans). The company has determined that, in accordance with the terms and conditions of the plans and statutory requirements (such as minimum funding requirements) of the respective jurisdictions, the present value of refunds or reductions in future contributions was higher than the surpluses. This determination was made on a plan-by-plan basis. Therefore, no reduction in the defined benefit asset was required as at December 31, 2014 (2013 – $NIL).
There were no significant plan amendments, settlements or curtailments during 2013 or 2014.
Description of other post-retirement plans
The company provides contributory health care plans for certain eligible retired employees in the US, Canada and Trinidad. Eligibility for these benefits is generally based on a combination of age and years of service at retirement. Benefits are coordinated with government-provided medical insurance in each country. These plans contain certain cost-sharing features such as coinsurance, deductibles and co-payments, and are unfunded, with benefits subject to change. The US plan also provides for maximum lifetime benefits. At retirement, the employee’s spouse and certain dependent children may be eligible for coverage. These benefits are self-insured and are administered through third-party providers. Canadian and Trinidad retirees currently pay 25 percent of the annual cost while US retirees share a larger portion of the cost, based on inflation. The company’s share of annual inflation is limited to 75 percent of the first 6 percent of total inflation for recent and future eligible retirees. Any cost increases in excess of this amount are funded by retiree contributions. The company currently funds approximately 70 percent of US retiree medical costs while the retirees are responsible for the balance.
| | |
| PotashCorp 2014 Annual Integrated Report | | 129 |
In millions of US dollars except as otherwise noted
Note 21 Pension and Other Post-Retirement Benefits continued
The company provides non-contributory life insurance plans for certain US, Canadian and Trinidad retired employees who meet specific age and service eligibility requirements. Retiree life insurance coverage is generally salary-related, which decreases over retirement years according to varying schedules. These benefits are funded through term insurance premiums with local insurance companies in each country.
The company’s other post-retirement plans expose it to similar risks as discussed above related to the defined benefit plans. These plans are not exposed to any other unusual or specific risks.
There were no significant plan amendments, settlements or curtailments during 2013 or 2014.
Financial information
Components of defined benefit expense recognized in the consolidated statements of income
| | | | | | | | | | | | | | | | | | | | | | | | | | | | | | | | | | | | |
| | | Pension | | | Other | | | Total | |
| | | 2014 | | | 2013 | | | 2012 | | | 2014 | | | 2013 | | | 2012 | | | 2014 | | | 2013 | | | 2012 | |
Current service cost for benefits earned during the year | | $ | 30 | | | $ | 32 | | | $ | 30 | | | $ | 9 | | | $ | 10 | | | $ | 11 | | | $ | 39 | | | $ | 42 | | | $ | 41 | |
Net interest (income) expense | | | (3 | ) | | | 2 | | | | (8 | ) | | | 16 | | | | 15 | | | | 17 | | | | 13 | | | | 17 | | | | 9 | |
Past service cost, including curtailment gains | | | 3 | | | | 1 | | | | – | | | | – | | | | (15 | ) | | | (2 | ) | | | 3 | | | | (14 | ) | | | (2 | ) |
Foreign exchange rate changes and other | | | (4 | ) | | | (3 | ) | | | 2 | | | | (4 | ) | | | (3 | ) | | | 1 | | | | (8 | ) | | | (6 | ) | | | 3 | |
| | | | | | | | | | | | | | | | | | | | | | | | | | | | | | | | | | | | | |
Components of defined benefit expense recognized in net income | | $ | 26 | | | $ | 32 | | | $ | 24 | | | $ | 21 | | | $ | 7 | | | $ | 27 | | | $ | 47 | | | $ | 39 | | | $ | 51 | |
| | | | | | | | | | | | | | | | | | | | | | | | | | | | | | | | | | | | | |
Expense included in: | | | | | | | | | | | | | | | | | | | | | | | | | | | | | | | | | | | | |
Cost of goods sold | | | | | | | | | | | | | | | | | | | | | | | | | | $ | 35 | | | $ | 17 | | | $ | 38 | |
Selling and administrative expenses | | | | | | | | | | | | | | | | | | | | | | | | | | | 8 | | | | 13 | | | | 10 | |
Finance costs (Note 7) | | | | | | | | | | | | | | | | | | | | | | | | | | | 13 | | | | 17 | | | | – | |
Other expenses | | | | | | | | | | | | | | | | | | | | | | | | | | | (9 | ) | | | (8 | ) | | | 3 | |
| | | | | | | | | | | | | | | | | | | | | | | | | | | | | | | | | | | | | |
Remeasurements of the net defined benefit liability recognized in the consolidated statements of comprehensive income
| | | | | | | | | | | | | | | | | | | | | | | | | | | | | | | | | | | | |
| | | Pension | | | Other | | | Total | |
| | | 2014 | | | 2013 | | | 2012 | | | 2014 | | | 2013 | | | 2012 | | | 2014 | | | 2013 | | | 2012 | |
Actuarial loss (gain) arising from changes in financial assumptions | | $ | 145 | | | $ | (150 | ) | | $ | 126 | | | $ | 34 | | | $ | (77 | ) | | $ | 1 | | | $ | 179 | | | $ | (227 | ) | | $ | 127 | |
Actuarial loss (gain) arising from changes in demographic assumptions | | | 14 | | | | 104 | | | | 4 | | | | 12 | | | | 21 | | | | (3 | ) | | | 26 | | | | 125 | | | | 1 | |
(Return) loss on plan assets (excluding amounts included in net interest) | | | (36 | ) | | | (154 | ) | | | (35 | ) | | | – | | | | – | | | | – | | | | (36 | ) | | | (154 | ) | | | (35 | ) |
| | | | | | | | | | | | | | | | | | | | | | | | | | | | | | | | | | | | | |
Components of defined benefit expense recognized in OCI1 | | $ | 123 | | | $ | (200 | ) | | $ | 95 | | | $ | 46 | | | $ | (56 | ) | | $ | (2 | ) | | $ | 169 | | | $ | (256 | ) | | $ | 93 | |
| | | | | | | | | | | | | | | | | | | | | | | | | | | | | | | | | | | | | |
| 1 | Total net of income taxes was $109 (2013 – $(164), 2012 – $62). |
| | |
| 130 | | PotashCorp 2014 Annual Integrated Report |
Financials and Notes
In millions of US dollars except as otherwise noted
Note 21 Pension and Other Post-Retirement Benefits continued
Movements in the pension and other post-retirement benefit assets (liabilities) as at and for the years ended December 31
| | | | | | | | | | | | | | | | | | | | | | | | |
| | | Pension | | | Other | | | Total | |
| | | 2014 | | | 2013 | | | 2014 | | | 2013 | | | 2014 | | | 2013 | |
Change in benefit obligations | | | | | | | | | | | | | | | | | | | | | | | | |
Balance, beginning of year | | $ | 1,202 | | | $ | 1,224 | | | $ | 343 | | | $ | 388 | | | $ | 1,545 | | | $ | 1,612 | |
Current service cost | | | 30 | | | | 32 | | | | 9 | | | | 10 | | | | 39 | | | | 42 | |
Interest expense | | | 56 | | | | 49 | | | | 16 | | | | 15 | | | | 72 | | | | 64 | |
Actuarial loss (gain) arising from changes in financial assumptions | | | 145 | | | | (150 | ) | | | 34 | | | | (77 | ) | | | 179 | | | | (227 | ) |
Actuarial loss arising from changes in demographic assumptions | | | 14 | | | | 104 | | | | 12 | | | | 21 | | | | 26 | | | | 125 | |
Foreign exchange rate changes | | | 1 | | | | (9 | ) | | | (4 | ) | | | (3 | ) | | | (3 | ) | | | (12 | ) |
Contributions by plan participants | | | 1 | | | | – | | | | 5 | | | | 5 | | | | 6 | | | | 5 | |
Benefits paid | | | (49 | ) | | | (44 | ) | | | (12 | ) | | | (11 | ) | | | (61 | ) | | | (55 | ) |
Past service cost, including curtailment gains | | | 3 | | | | (4 | ) | | | – | | | | (5 | ) | | | 3 | | | | (9 | ) |
| | | | | | | | | | | | | | | | | | | | | | | | | |
Balance, end of year | | | 1,403 | | | | 1,202 | | | | 403 | | | | 343 | | | | 1,806 | | | | 1,545 | |
| | | | | | | | | | | | | | | | | | | | | | | | | |
Change in plan assets | | | | | | | | | | | | | | | | | | | | | | | | |
Fair value, beginning of year | | | 1,252 | | | | 1,052 | | | | – | | | | – | | | | 1,252 | | | | 1,052 | |
Interest included in net income | | | 59 | | | | 47 | | | | – | | | | – | | | | 59 | | | | 47 | |
Return on plan assets (excluding amounts included in net interest) | | | 36 | | | | 154 | | | | – | | | | – | | | | 36 | | | | 154 | |
Foreign exchange rate changes and other | | | 5 | | | | (6 | ) | | | – | | | | – | | | | 5 | | | | (6 | ) |
Contributions by plan participants | | | 1 | | | | – | | | | 5 | | | | 5 | | | | 6 | | | | 5 | |
Employer contributions | | | 12 | | | | 49 | | | | 7 | | | | 6 | | | | 19 | | | | 55 | |
Benefits paid | | | (49 | ) | | | (44 | ) | | | (12 | ) | | | (11 | ) | | | (61 | ) | | | (55 | ) |
| | | | | | | | | | | | | | | | | | | | | | | | | |
Fair value, end of year | | | 1,316 | | | | 1,252 | | | | – | | | | – | | | | 1,316 | | | | 1,252 | |
| | | | | | | | | | | | | | | | | | | | | | | | | |
Funded status | | $ | (87 | ) | | $ | 50 | | | $ | (403 | ) | | $ | (343 | ) | | $ | (490 | ) | | $ | (293 | ) |
| | | | | | | | | | | | | | | | | | | | | | | | | |
Balance comprised of: | | | | | | | | | | | | | | | | | | | | | | | | |
Non-current assets | | | | | | | | | | | | | | | | | | | | | | | | |
Other assets (Note 15) | | $ | 25 | | | $ | 129 | | | $ | – | ������ | | $ | – | | | $ | 25 | | | $ | 129 | |
Current liabilities | | | | | | | | | | | | | | | | | | | | | | | | |
Payables and accrued charges (Note 18) | | | (3 | ) | | | (3 | ) | | | (9 | ) | | | (9 | ) | | | (12 | ) | | | (12 | ) |
Non-current liabilities | | | | | | | | | | | | | | | | | | | | | | | | |
Pension and other post-retirement benefit liabilities | | | (109 | ) | | | (76 | ) | | | (394 | ) | | | (334 | ) | | | (503 | ) | | | (410 | ) |
| | | | | | | | | | | | | | | | | | | | | | | | | |
Pension and other post-retirement benefit (liabilities) assets | | $ | (87 | ) | | $ | 50 | | | $ | (403 | ) | | $ | (343 | ) | | $ | (490 | ) | | $ | (293 | ) |
| | | | | | | | | | | | | | | | | | | | | | | | | |
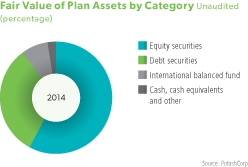
| | |
| | | |
94% | | Funded percentage for the defined benefit pension plans as at December 31, 2014 (2013 – 104 percent). |
| | | |
| | |
| PotashCorp 2014 Annual Integrated Report | | 131 |
In millions of US dollars except as otherwise noted
Note 21 Pension and Other Post-Retirement Benefits continued
Plan assets
The fair value of plan assets of the company’s defined benefit pension plans, by asset category, was as follows as at December 31:
| | | | | | | | | | | | | | | | | | | | | | | | |
| | | 2014 | | | 2013 | |
| | | Quoted Prices in
Active Markets for
Identical Assets (Level 1) | | | Other (Levels 2 & 3) | | | Total | | | Quoted Prices in
Active Markets for
Identical Assets (Level 1) | | | Other (Levels 2 & 3) | | | Total | |
Cash and cash equivalents | | $ | 5 | | | $ | 32 | | | $ | 37 | | | $ | 5 | | | $ | 20 | | | $ | 25 | |
Equity securities | | | | | | | | | | | | | | | | | | | | | | | | |
US | | | 223 | | | | – | | | | 223 | | | | 180 | | | | – | | | | 180 | |
International | | | 3 | | | | 35 | | | | 38 | | | | 22 | | | | 35 | | | | 57 | |
US mutual/commingled funds | | | 123 | | | | 380 | | | | 503 | | | | 131 | | | | 385 | | | | 516 | |
Debt securities | | | | | | | | | | | | | | | | | | | | | | | | |
US corporate debt instruments | | | – | | | | 48 | | | | 48 | | | | – | | | | 53 | | | | 53 | |
International corporate debt instruments | | | – | | | | 25 | | | | 25 | | | | – | | | | 27 | | | | 27 | |
US government and agency securities | | | – | | | | 28 | | | | 28 | | | | – | | | | 84 | | | | 84 | |
International government and agency securities | | | – | | | | 55 | | | | 55 | | | | – | | | | 49 | | | | 49 | |
Mortgage-backed securities | | | – | | | | 88 | | | | 88 | | | | – | | | | 27 | | | | 27 | |
US mutual/commingled funds | | | 164 | | | | 12 | | | | 176 | | | | 146 | | | | 12 | | | | 158 | |
International balanced fund | | | 102 | | | | – | | | | 102 | | | | 83 | | | | – | | | | 83 | |
Other | | | (17 | ) | | | 10 | | | | (7 | ) | | | (16 | ) | | | 9 | | | | (7 | ) |
| | | | | | | | | | | | | | | | | | | | | | | | | |
Total pension plan assets | | $ | 603 | | | $ | 713 | | | $ | 1,316 | | | $ | 551 | | | $ | 701 | | | $ | 1,252 | |
| | | | | | | | | | | | | | | | | | | | | | | | | |
Letters of credit secured certain of the Canadian unfunded defined benefit plan liabilities as at December 31, 2014 and 2013.
Defined Contribution Plans
Accounting Policy
|
| Defined contribution plan costs are recognized in net income for services rendered by employees during the period. |
Supporting Information
| | | | | | |
| | | Description of defined contribution plans | | Contribution details | | Company contributions
recognized as an expense |
| United States | | All employees may participate in defined contribution savings plans, which are subject to US federal tax limitations and provide for voluntary employee salary deduction contributions. | | The company contribution provides a minimum of 0 percent to a maximum of 6 percent of salary, depending on employee contributions and company performance. | | 2014 – $9
(2013 – $9; 2012 – $9) |
| | | | | | | |
| Canada | | All salaried employees and certain hourly employees participate in the PCS Inc. Savings Plan and may make voluntary contributions. Certain employees participate in the contributory PCS Inc. Pension Plan. | | The company contribution provides a minimum of 3 percent to a maximum of 6 percent of salary, based on company performance. The member contributes to the plan at the rate of 5.5 percent of his/her earnings, or such other percentage amount as may be established by a collective agreement, and the company contributes for each member at the same rate. The member may also elect to make voluntary additional contributions. | | 2014 – $9
(2013 – $10; 2012 – $9) 2014 – $11
(2013 – $12; 2012 – $12) |
| | | | | | | |
| Trinidad | | Certain employees participate in a defined contribution plan. | | The company contributes to the plan at the rate of 4 percent of the earnings of a participating employee. | | 2014 – $1
(2013 – $1; 2012 – $1) |
| | | | | | | |
| | |
| 132 | | PotashCorp 2014 Annual Integrated Report |
Financials and Notes
In millions of US dollars except as otherwise noted
Note 21 Pension and Other Post-Retirement Benefits continued
Cash Payments to All Plans
Total cash payments for pensions and other post-retirement benefits for 2014, consisting of cash contributed by the company to its funded defined benefit pension plans, cash payments directly to beneficiaries for its unfunded other benefit plans and cash contributed to its defined contribution plans, were $49 (2013 – $87, 2012 – $150).
As described above, the company funds its defined benefit pension plans based on local actuarial valuations and makes funding decisions that meet minimum and maximum local regulatory requirements. There are no additional funding arrangements that would significantly affect projected future contributions at the end of the reporting period.
The company expects to contribute approximately the following to all pension and post-retirement plans during 2015:
| | | | |
Defined benefit pension plans | | $ | 10 | |
Defined benefit other post-retirement plans | | | 8 | |
Defined contribution plans | | | 31 | |
| | | | | |
Total | | $ | 49 | |
| | | | | |

A provision is a liability recorded in the consolidated statements of financial position where there is uncertainty over the timing or amount that will be paid, and it is therefore estimated. The company’s significant provisions relate to asset retirement and environmental restoration obligations which involve costs associated with restoring sites to their original, or another specified, condition and are primarily associated with the company’s potash and phosphate segments.
| | |
Accounting Policies | | Accounting Estimates and Judgments |
Provisions are recognized when: the company has a present legal or constructive obligation as a result of past events; it is probable that an outflow of resources will be required to settle the obligation; and the amount has been reliably estimated. Provisions are not recognized for costs that need to be incurred to operate in the future or expected future operating losses. The company recognizes provisions for termination benefits at the earlier of when it can no longer withdraw the offer of the termination benefits and when it recognizes any related restructuring costs. Provisions are measured at the present value of the cash flow expected to be required to settle the obligation, using a pre-tax risk-free discount rate that reflects current market assessments of the time value of money and the risks specific to the timing and jurisdiction of the obligation. Environmental costs that relate to current operations are expensed or capitalized, as appropriate. Environmental costs may be capitalized if they extend the life of the property, increase its | | The company has recorded provisions relating to asset retirement obligations, and environmental and other matters. Most provisions will not be settled for a number of years, therefore requiring estimates to be made over a long period. Environmental laws and regulations and interpretations by regulatory authorities could change or circumstances affecting the company’s operations could change, either of which could result in significant changes to its current plans. The recorded provisions are based on its best estimate of costs required to settle the obligations, taking into account the nature, extent and timing of current and proposed reclamation and closure techniques in view of present environmental laws and regulations. It is |
| | |
| PotashCorp 2014 Annual Integrated Report | | 133 |
In millions of US dollars except as otherwise noted
Note 22 Provisions for Asset Retirement, Environmental and Other Obligations continued
| | |
| Accounting Policies continued | | Accounting Estimates and Judgments continued |
capacity, mitigate or prevent contamination from future operations, or relate to legal or constructive asset retirement obligations. Costs that relate to existing conditions caused by past operations and that do not contribute to current or future revenue generation are expensed. Provisions for estimated costs are recorded when environmental remedial efforts are likely and the costs can be reasonably estimated. In determining the provisions, the company uses the most current information available, including similar past experiences, available technology, regulations in effect, the timing of remediation and cost-sharing arrangements. The company recognizes provisions for decommissioning obligations (also known as asset retirement obligations) primarily related to mining and mineral activities. The major categories of asset retirement obligations are reclamation and restoration costs at its potash and phosphate mining operations, including management of materials generated by mining and mineral processing, such as various mine tailings and gypsum; land reclamation and revegetation programs; decommissioning of underground and surface operating facilities; general cleanup activities aimed at returning the areas to an environmentally acceptable condition; and post-closure care and maintenance. The present value of a liability for a decommissioning obligation is recognized in the period in which it is incurred if a reasonable estimate of present value can be made. The associated costs are: capitalized as part of the carrying amount of any related long-lived asset and then amortized over its estimated remaining useful life; capitalized as part of inventory; or expensed in the period. The best estimate of the amount required to settle the obligation is reviewed at the end of each reporting period and updated to reflect changes in the discount and foreign exchange rates and the amount or timing of the underlying cash flows. When there is a change in the best estimate, an adjustment is recorded against the carrying value of the provision and any related asset, and the effect is then recognized in net income over the remaining life of the asset. The increase in the provision due to the passage of time is recognized as a finance cost. A gain or loss may be incurred upon settlement of the liability. Other environmental obligations generally relate to regulatory compliance, environmental management practices associated with ongoing operations other than mining, site assessment and remediation of environmental contamination related to the activities of the company and its predecessors, including waste disposal practices and ownership and operation of real property and facilities. | | reasonably possible that the ultimate costs could change in the future and that changes to these estimates could have a material effect on the company’s consolidated financial statements. The estimation of asset retirement obligation costs depends on the development of environmentally acceptable closure and post-closure plans. In some cases, this may require significant research and development to identify preferred methods for such plans that are economically sound and that, in most cases, may not be implemented for several decades. The company uses appropriate technical resources, including outside consultants, to develop specific site closure and post-closure plans in accordance with the requirements of the various jurisdictions in which it operates. Other than certain land reclamation programs, settlement of the obligations is typically correlated with mine life estimates. Cash flow payments are expected to occur principally over the next 85 years for the company’s phosphate obligations, with the majority taking place over the next 35 years. Payments relating to most potash obligations are not expected to begin until after that time. The risk-free rate for phosphate asset retirement obligations ranged from 1.58 percent to 2.81 percent as at December 31, 2014 (2013 – 1.72 percent to 3.94 percent). The risk-free rate for potash asset retirement obligations primarily was 6 percent as at December 31, 2014 (2013 – 6 percent). Employee termination activities are complex processes that can take months to complete and involve making and reassessing estimates. |
| | | |
Sensitivity of asset retirement obligations to changes in the discount rate and inflation rate on the recorded liability as at December 31, 2014 is as follows:
| | | | | | | | | | | | | | | | | | | | | | | | |
| | | Undiscounted
Cash Flows | | | Discounted Cash Flows | | | Discount Rate | | | Inflation Rate | |
| | | | +0.5% | | | -0.5% | | | +0.5% | | | -0.5% | |
Potash obligation1 | | $ | 824 | 2 | | $ | 45 | | | $ | (6 | ) | | $ | 9 | | | $ | 12 | | | $ | (8 | ) |
Nitrogen obligation | | | 62 | | | | 2 | | | | (1 | ) | | | 1 | | | | 1 | | | | (1 | ) |
Phosphate obligation | | | 894 | | | | 568 | | | | (37 | ) | | | 43 | | | | 41 | | | | (36 | ) |
| | | | | | | | | | | | | | | | | | | | | | | | | |
| 1 | Stated in Canadian dollars. |
| 2 | Represents total undiscounted cash flows in the first year of decommissioning. Excludes subsequent years of tailings dissolution and final decommissioning, which are estimated to take an additional52-288 years. |
| | |
| 134 | | PotashCorp 2014 Annual Integrated Report |
Financials and Notes
In millions of US dollars except as otherwise noted
Note 22 Provisions for Asset Retirement, Environmental and Other Obligations continued
Supporting Information
Following is a reconciliation of asset retirement, environmental restoration and other obligations:
| | | | | | | | | | | | | | | | | | | | |
| | | Asset Retirement Obligations | | | Environmental Restoration Obligations | | | Subtotal | | | Other
Obligations | | | Total | |
Balance – December 31, 2013 | | $ | 569 | | | $ | 29 | | | $ | 598 | | | $ | 61 | | | $ | 659 | |
Charged to income | | | | | | | | | | | | | | | | | | | | |
New obligations | | | 5 | | | | 4 | | | | 9 | | | | – | | | | 9 | |
Change in discount rate | | | 10 | | | | 1 | | | | 11 | | | | – | | | | 11 | |
Change in other estimates | | | 10 | | | | 1 | | | | 11 | | | | – | | | | 11 | |
Unwinding of discount | | | 15 | | | | – | | | | 15 | | | | – | | | | 15 | |
Capitalized to property, plant and equipment | | | | | | | | | | | | | | | | | | | | |
Change in discount rate | | | 25 | | | | – | | | | 25 | | | | – | | | | 25 | |
Settled during period | | | (22 | ) | | | (3 | ) | | | (25 | ) | | | (59 | ) | | | (84 | ) |
Exchange differences | | | (3 | ) | | | – | | | | (3 | ) | | | – | | | | (3 | ) |
| | | | | | | | | | | | | | | | | | | | | |
Balance – December 31, 2014 | | $ | 609 | | | $ | 32 | | | $ | 641 | | | $ | 2 | | | $ | 643 | |
| | | | | | | | | | | | | | | | | | | | | |
Balance as at December 31, 2014 comprised of: | | | | | | | | | | | | | | | | | | | | |
Current liabilities | | | | | | | | | | | | | | | | | | | | |
Payables and accrued charges (Note 18) | | $ | 48 | | | $ | 4 | | | $ | 52 | | | $ | 2 | | | $ | 54 | |
Non-current liabilities | | | | | | | | | | | | | | | | | | | | |
Asset retirement obligations and accrued environmental costs | | | 561 | | | | 28 | | | | 589 | | | | – | | | | 589 | |
| | | | | | | | | | | | | | | | | | | | | |
| | $ | 609 | | | $ | 32 | | | $ | 641 | | | $ | 2 | | | $ | 643 | |
| | | | | | | | | | | | | | | | | | | | | |
Balance – December 31, 2012 | | $ | 647 | | | $ | 28 | | | $ | 675 | | | $ | 53 | | | $ | 728 | |
Charged (credited) to income | | | | | | | | | | | | | | | | | | | | |
New obligations | | | 3 | | | | 2 | | | | 5 | | | | 60 | | | | 65 | |
Change in discount rate | | | (31 | ) | | | – | | | | (31 | ) | | | – | | | | (31 | ) |
Change in other estimates | | | 39 | | | | 7 | | | | 46 | | | | – | | | | 46 | |
Unwinding of discount | | | 13 | | | | – | | | | 13 | | | | – | | | | 13 | |
Capitalized to property, plant and equipment | | | | | | | | | | | | | | | | | | | | |
Change in discount rate | | | (54 | ) | | | – | | | | (54 | ) | | | – | | | | (54 | ) |
Change in other estimates | | | (21 | ) | | | – | | | | (21 | ) | | | – | | | | (21 | ) |
Settled during period | | | (25 | ) | | | (8 | ) | | | (33 | ) | | | (52 | ) | | | (85 | ) |
Exchange differences | | | (2 | ) | | | – | | | | (2 | ) | | | – | | | | (2 | ) |
| | | | | | | | | | | | | | | | | | | | | |
Balance – December 31, 2013 | | $ | 569 | | | $ | 29 | | | $ | 598 | | | $ | 61 | | | $ | 659 | |
| | | | | | | | | | | | | | | | | | | | | |
Balance as at December 31, 2013 comprised of: | | | | | | | | | | | | | | | | | | | | |
Current liabilities | | | | | | | | | | | | | | | | | | | | |
Payables and accrued charges (Note 18) | | $ | 36 | | | $ | 5 | | | $ | 41 | | | $ | 61 | | | $ | 102 | |
Non-current liabilities | | | | | | | | | | | | | | | | | | | | |
Asset retirement obligations and accrued environmental costs | | | 533 | | | | 24 | | | | 557 | | | | – | | | | 557 | |
| | | | | | | | | | | | | | | | | | | | | |
| | $ | 569 | | | $ | 29 | | | $ | 598 | | | $ | 61 | | | $ | 659 | |
| | | | | | | | | | | | | | | | | | | | | |
Environmental operating and capital expenditures
The company’s operations are subject to numerous environmental requirements under federal, provincial, state and local laws and regulations of Canada, the US, and Trinidad and Tobago. These laws and regulations govern matters such as air emissions, wastewater discharges, land use and reclamation, and solid and hazardous waste management. Many of these laws, regulations and permit requirements are becoming increasingly
stringent, and the cost of compliance can be expected to rise over time. The company’s operating expenses, other than costs associated with asset retirement obligations, relating to compliance with environmental laws and regulations governing ongoing operations for 2014 were $129 (2013 – $135, 2012 – $153).
| | |
| PotashCorp 2014 Annual Integrated Report | | 135 |
In millions of US dollars except as otherwise noted
Note 22 Provisions for Asset Retirement, Environmental and Other Obligations continued
The company routinely undertakes environmental capital projects. In 2014, capital expenditures of $151 (2013 – $83, 2012 – $81) were incurred to meet pollution prevention and control as well as other environmental objectives.
Other obligations
Other obligations are comprised of provisions for employee termination benefits, litigation claims and community investment. As at December 31, 2013, other obligations included a provision of $56 for termination benefits related to operating and workforce changes in the US, Canada and Trinidad, which were settled in 2014.

Share capital represents amounts associated with the issuance of common shares. The company completed a share repurchase program during 2014 under which it repurchased 5 percent of its outstanding common shares through the second half of 2013 and the first half of 2014.
Authorized
The company is authorized to issue an unlimited number of common shares without par value and an unlimited number of first preferred shares. The common shares are not redeemable or convertible. The first preferred shares may be issued in one or more series with rights and conditions to be determined by the Board of Directors. No first preferred shares have been issued.
Issued
| | | | | | | | |
| | | Number of Common Shares | | | Consideration | |
Balance, December 31, 2011 | | | 858,702,991 | | | $ | 1,483 | |
Issued under option plans | | | 5,895,730 | | | | 47 | |
Issued for dividend reinvestment plan | | | 301,792 | | | | 13 | |
| | | | | | | | | |
Balance, December 31, 2012 | | | 864,900,513 | | | $ | 1,543 | |
Issued under option plans | | | 4,492,409 | | | | 52 | |
Issued for dividend reinvestment plan | | | 868,503 | | | | 30 | |
Repurchased | | | (14,145,100 | ) | | | (25 | ) |
| | | | | | | | | |
Balance, December 31, 2013 | | | 856,116,325 | | | $ | 1,600 | |
Issued under option plans | | | 2,285,450 | | | | 49 | |
Issued for dividend reinvestment plan | | | 1,041,691 | | | | 36 | |
Repurchased | | | (29,200,892 | ) | | | (53 | ) |
| | | | | | | | | |
Balance, December 31, 2014 | | | 830,242,574 | | | $ | 1,632 | |
| | | | | | | | | |
Share repurchase program
On July 24, 2013, the company’s Board of Directors authorized a share repurchase program of up to 5 percent of PotashCorp’s outstanding common shares (up to $2,000 of its outstanding common shares) through a normal course issuer bid. Shares could be repurchased from time to time on the open market commencing August 2, 2013 through August 1, 2014 at prevailing market prices. The timing and amount of purchases under the program were
dependent upon the availability and alternative uses of capital, market conditions, applicable US and Canadian regulations and other factors. The company completed the repurchase program by June 30, 2014.
| | | | | | | | |
| | | 2014 | | | 2013 | |
Common shares repurchased for cancellation | | | 29,200,892 | | | | 14,145,100 | |
Average price per share | | $ | 35.31 | | | $ | 31.46 | |
Repurchase resulted in a reduction of: | | | | | | | | |
Share capital | | $ | 53 | | | $ | 25 | |
Contributed surplus 1 | | | 2 | | | | 82 | |
Retained earnings 1 | | | 976 | | | | 338 | |
| | | | | | | | | |
Total cost | | $ | 1,031 | | | $ | 445 | |
| | | | | | | | | |
| 1 | The excess of net cost over the average book value of the shares. |

| | |
| | | |
$0.07 per share | | Impact of total share repurchase program on 2014 diluted EPS. |
| | | |
| | |
| 136 | | PotashCorp 2014 Annual Integrated Report |
Financials and Notes
In millions of US dollars except as otherwise noted
Note 23 Share Capital continued
Dividends declared
On January 28, 2015, the company’s Board of Directors declared a quarterly dividend of $0.38 per share payable to shareholders on May 4, 2015. The declared dividend is payable to all shareholders of record on April 13, 2015. The total estimated dividend to be paid is $316. The payment of this dividend will not have any tax consequences for the company. Following is a summary of dividends declared by quarter:
| | | | | | | | | | | | | | | | | | | | | | | | | | | | | | | | | | | | |
| | | 2014 | | | 2013 | | | 2012 | |
| | | Declared | | | | | | | | Declared | | | | | | | | Declared | | | | | | |
| | | Date
Announced | | Per Share | | | Date Paid | | Total | | | Date Announced | | Per Share | | | Date Paid | | Total | | | Date Announced | | Per Share | | | Date Paid | | Total | |
Quarter 1 dividend | | Jan 29, 2014 | | $ | 0.35 | | | May 1, 2014 | | $ | 299 | | | Jan 30, 2013 | | $ | 0.28 | | | May 2, 2013 | | $ | 242 | | | Jan 25, 2012 | | $ | 0.14 | | | May 3, 2012 | | $ | 120 | |
Quarter 2 dividend | | May 14, 2014 | | | 0.35 | | | Aug 1, 2014 | | | 288 | | | May 15, 2013 | | | 0.35 | | | Aug 2, 2013 | | | 302 | | | May 16, 2012 | | | 0.14 | | | Aug 3, 2012 | | | 121 | |
Quarter 3 dividend | | Sep 11, 2014 | | | 0.35 | | | Nov 4, 2014 | | | 286 | | | Sep 12, 2013 | | | 0.35 | | | Nov 5, 2013 | | | 302 | | | Sep 13, 2012 | | | 0.21 | | | Nov 5, 2012 | | | 182 | |
Quarter 4 dividend | | Nov 12, 2014 | | | 0.35 | | | Feb 5, 2015 | | | 291 | | | Nov 13, 2013 | | | 0.35 | | | Feb 6, 2014 | | | 300 | | | Nov 14, 2012 | | | 0.21 | | | Feb 7, 2013 | | | 180 | |
| | | | | | | | | | | | | | | | | | | | | | | | | | | | | | | | | | | | | |
| | | | $ | 1.40 | | | | | $ | 1,164 | | | | | $ | 1.33 | | | | | $ | 1,146 | | | | | $ | 0.70 | | | | | $ | 603 | |
| | | | | | | | | | | | | | | | | | | | | | | | | | | | | | | | | | | | | |

The company had share-based compensation plans for certain employees and directors as part of their remuneration package, including 10 stock option plans, the performance unit incentive plan and the deferred share unit plan.
| | |
Accounting Policies | | Accounting Estimates and Judgments |
Grants under the company’s share-based compensation plans are accounted for in accordance with the fair value-based method of accounting. For stock option plans that will settle through the issuance of equity, the fair value of stock options is determined on their grant date using a valuation model and recorded as compensation expense over the period that the stock options vest, with a corresponding increase to contributed surplus. Forfeitures are estimated throughout the vesting period based on past experience and future expectations, and adjusted upon actual option vesting. When stock options are exercised, the proceeds, together with the amount recorded in contributed surplus, are recorded in share capital. Share-based plans that are likely to settle in cash or other assets are accounted for as liabilities based on the fair value of the awards each period. The compensation expense is accrued over the vesting period of the award. Fluctuations in the fair value of the award will result in a change to the accrued compensation expense, which is recognized in the period in which the fluctuation occurs. | | Determining the fair value of share-based compensation awards at the grant date requires judgment. The company uses the Black-Scholes-Merton option-pricing model to estimate the fair value of options granted under its equity-settled stock option plans as of each grant date. This pricing model requires judgment, which includes the items discussed in the weighted average assumptions table below and an estimate of the number of awards expected to be forfeited. The company used a Monte Carlo simulation model to estimate the fair value of its cash-settled performance unit incentive plan liability at each reporting period within the performance period. This required judgment, including making assumptions about the volatility of the company’s stock price and the DAXglobal Agribusiness Index with dividends, as well as the correlation between those two amounts, over the three-year plan cycle. For those awards with performance conditions that determine the number of options or units to which employees will be entitled, measurement of compensation cost is based on the company’s best estimate of the outcome of the performance conditions. If actual results differ significantly from these estimates, stock-based compensation expense and results of operations could be impacted. Prior to a Performance Option Plan award vesting, assumptions regarding vesting are made during the first three years based on the relevant actual and/or forecast financial results. Changes to vesting assumptions are reflected in earnings immediately. As at December 31, 2014, the 2012, 2013 and 2014 Performance Option Plans were expected to vest at 100 percent. |
| | | |
| | |
| PotashCorp 2014 Annual Integrated Report | | 137 |
In millions of US dollars except as otherwise noted
Note 24 Share-Based Compensation continued
The following weighted average assumptions were used in arriving at the grant-date fair values associated with stock options for which compensation cost was recognized during 2014, 2013 and 2012:
| | | | | | | | | | | | | | | | | | | | | | |
| | | Year of Grant | |
| Assumption | | Based On | | 2014 | | | 2013 | | | 2012 | | | 2011 | | | 2010 | |
Exercise price per option | | Quoted market closing price of common shares on the last trading day immediately preceding the date of the grant | | $ | 36.73 | | | $ | 43.80 | | | $ | 39.36 | | | $ | 52.26 | | | $ | 33.82 | |
Expected annual dividend per share | | Annualized dividend rate as of the date of grant | | $ | 1.40 | | | $ | 1.40 | | | $ | 0.56 | | | $ | 0.28 | | | $ | 0.13 | |
Expected volatility | | Historical volatility of the company’s stock over a period commensurate with the expected life of the option | | | 39% | | | | 50% | | | | 53% | | | | 52% | | | | 50% | |
Risk-free interest rate | | Implied yield available on zero-coupon government issues with equivalent remaining term at the time of the grant | | | 1.66% | | | | 1.06% | | | | 1.06% | | | | 2.29% | | | | 2.61% | |
Expected life of options in years | | Historical experience | | | 5.5 | | | | 5.5 | | | | 5.5 | | | | 5.5 | | | | 5.9 | |
| | | | | | | | | | | | | | | | | | | | | | | |
Supporting Information
As at December 31, 2014, the company had 12 share-based compensation plans (10 stock option plans, the deferred share unit plan and the performance unit incentive plan), which are described below (2013 – 11 plans, 2012 – 11 plans). The total compensation cost charged (recovered) against earnings for those plans was comprised of:
| | | | | | | | | | | | |
| | | 2014 | | | 2013 | | | 2012 | |
Stock option plans | | $ | 28 | | | $ | 27 | | | $ | 23 | |
Deferred share unit plan | | | 3 | | | | (2 | ) | | | 1 | |
Performance unit incentive plan | | | (1 | ) | | | (2 | ) | | | 4 | |
| | | | | | | | | | | | | |
| | $ | 30 | | | $ | 23 | | | $ | 28 | |
| | | | | | | | | | | | | |
Stock option plans
As at December 31, 2014, the outstanding number of performance options per plan that vest over three years and settle in shares were as follows:
| | | | | | | | | | | | | | | | | | | | | | | | | | | | | | | | | | | | | | |
| 2014 | | | 2013 | | | 2012 | | | 2011 | | | 2010 | | | 2009 | | | 2008 | | | 2007 | | | 2006 | | | 2005 | |
| | 3,144,600 | | | | 1,899,000 | | | | 1,444,100 | | | | 1,073,600 | | | | 1,069,500 | | | | 1,488,675 | | | | 1,128,750 | | | | 2,983,600 | | | | 3,433,050 | | | | 3,244,960 | |
In previous years, the company granted options under an Officers and Employees Plan (the last grant under which expired in 2013) and a Directors Plan (the last grant under which expired in 2012).
Under the terms of the plans, no additional options are issuable pursuant to the plans.
The exercise price is not less than the quoted market closing price of the company’s common shares on the last trading day immediately preceding the date of the grant, and an option’s maximum term is 10 years. In general, options granted under the Performance Option Plans will vest, if at all, according to a schedule based on the three-year average excess of the company’s consolidated cash flow return on investment over the weighted average cost of capital.
The company issues new common shares to satisfy stock option exercises. Options granted to Canadian participants had an exercise price in Canadian dollars.
| | |
| 138 | | PotashCorp 2014 Annual Integrated Report |
Financials and Notes
In millions of US dollars except as otherwise noted
Note 24 Share-Based Compensation continued
A summary of the status of the stock option plans as at December 31, 2014, 2013 and 2012 and changes during the years ending on those dates is as follows:
| | | | | | | | | | | | | | | | | | | | |
| | | Number of shares subject to option | | Weighted average exercise price | |
| | | 2014 | | | 2013 | | 2012 | | 2014 | | | 2013 | | | 2012 | |
Outstanding, beginning of year | | | 20,332,335 | | | 23,164,444 | | 27,649,074 | | $ | 26.45 | | | $ | 22.32 | | | $ | 18.02 | |
Granted | | | 3,157,800 | | | 1,952,000 | | 1,499,300 | | | 36.73 | | | | 43.80 | | | | 39.36 | |
Exercised | | | (2,285,450 | ) | | (4,492,409) | | (5,895,730) | | | (15.91 | ) | | | (8.71 | ) | | | (6.76 | ) |
Forfeited or cancelled | | | (294,850 | ) | | (291,700) | | (88,200) | | | (50.94 | ) | | | (45.33 | ) | | | (50.26 | ) |
Expired | | | – | | | – | | – | | | – | | | | – | | | | – | |
| | | | | | | | | | | | | | | | | | | | | |
Outstanding, end of year | | | 20,909,835 | | | 20,332,335 | | 23,164,444 | | $ | 28.01 | | | $ | 26.45 | | | $ | 22.32 | |
| | | | | | | | | | | | | | | | | | | | | |
The aggregate grant-date fair value of all options granted during 2014 was $29 (2013 – $30, 2012 – $24). The average share price during 2014 was $34.81 per share (2013 – $36.69 per share, 2012 – $42.54 per share).
The following table summarizes information about stock options outstanding as at December 31, 2014:
| | | | | | | | | | | | | | | | | | |
| | | Options Outstanding | | | Options Exercisable | |
| Range of Exercise Prices | | Number | | | Weighted Average
Remaining Life in Years | | Weighted Average
Exercise Price | | | Number | | | Weighted Average
Exercise Price | |
$9.00 to $13.00 | | | 6,678,010 | | | 1 | | $ | 10.53 | | | | 6,678,010 | | | $ | 10.53 | |
$19.00 to $21.00 | | | 2,983,600 | | | 2 | | | 20.61 | | | | 2,983,600 | | | | 20.61 | |
$30.00 to $45.00 | | | 9,432,375 | | | 8 | | | 36.74 | | | | 2,944,675 | | | | 33.78 | |
$52.00 to $67.00 | | | 1,815,850 | | | 4 | | | 59.14 | | | | 1,815,850 | | | | 59.14 | |
| | | | | | | | | | | | | | | | | | | |
| | | 20,909,835 | | | 4 | | $ | 28.01 | | | | 14,422,135 | | | $ | 23.48 | |
| | | | | | | | | | | | | | | | | | | |
The foregoing options have expiry dates ranging from May 2015 to December 2024.
Other plans
The company offered a performance unit incentive plan (“MTIP”) to senior executives and other key employees. The performance objectives under the plan were designed to further align the interests of executives and key employees with those of shareholders by linking the vesting of awards to the total return to shareholders over the three-year performance period ended December 31, 2014. Total shareholder return measures the capital appreciation in the company’s common shares, including dividends paid over the performance period. Vesting of one-half of the awards was based on increases in the total shareholder return over the three-year performance period. Vesting of the remaining one-half of the awards was based on the
extent to which the total shareholder return matched or exceeded that of the common shares of a pre-defined peer group index. None of the performance share units vested based on PotashCorp’s performance during the three-year performance period ended December 31, 2014, and therefore no such units settled in cash at the end of such performance period. Compensation expense for this plan was recorded over the three-year performance cycle of the plan. The amount of compensation expense was adjusted each period over the cycle to reflect the current fair value of common shares and the number of shares estimated to vest.
| | |
| PotashCorp 2014 Annual Integrated Report | | 139 |
In millions of US dollars except as otherwise noted
Note 24 Share-Based Compensation continued
The company offers a deferred share unit plan to non-employee directors, which allows each to choose to receive, in the form of deferred share units (“DSUs”), all or a percentage of the director’s fees, which would otherwise be payable in cash. The plan also provides for discretionary grants of additional DSUs by the Board, a practice it discontinued on January 24, 2007 in
connection with an increase in the annual retainer. Each DSU fully vests upon award, but is distributed only when the director has ceased to be a member of the Board. Vested units are settled in cash based on the common share price at that time. As at December 31, 2014, the total number of DSUs held by participating directors was 620,091 (2013 – 562,720, 2012 – 573,472).
Further information and a summary of the status of the MTIP units and outstanding DSUs as at December 31 are presented below:
| | | | | | | | | | | | | | | | | | | | | | | | |
| | | MTIP | | | DSUs | |
| | | 2014 | | | 2013 | | | 2012 | | | 2014 | | | 2013 | | | 2012 | |
Cash used to settle units during the year | | $ | – | | | $ | – | | | $ | 17 | | | $ | – | | | $ | 3 | | | $ | 2 | |
Fair value of closing liability | | | – | | | | 1 | | | | 4 | | | | 22 | | | | 19 | | | | 23 | |
Intrinsic value of closing liability | | | – | | | | – | | | | – | | | | 22 | | | | 19 | | | | 23 | |
| | | | | | | | | | | | | | | | | | | | | | | | | |

Outlined below are the company’s financial instruments and related risk management objectives, its policies and its exposure, sensitivity and monitoring strategies to financial risks.
| | |
| Accounting Policies | | Accounting Estimates and Judgments |
Financial assets and financial liabilities are recognized initially in the consolidated statements of financial position at fair value (normally the transaction price) adjusted for transaction costs. Transaction costs related to financial assets or financial liabilities at fair value through profit or loss are recognized immediately in net income. Regular way purchases and sales of financial assets are accounted for on the trade date. Financial instruments recorded at fair value on an ongoing basis are remeasured at each reporting date and changes in the fair value are recorded in either net income or OCI. The company’s financial assets and financial liabilities shall be offset and the net amount presented in the statements of financial position when the company currently has a legally enforceable right to offset the recognized amounts and intends either to settle on a net basis, or to realize the assets and settle the liabilities simultaneously. | | Judgment is required to determine whether the right to offset is legally enforceable. |
See Note 2 for discussion related to the policies, estimates and judgments for fair value measurements.
Supporting Information
Financial risks
The company is exposed in varying degrees to a variety of financial risks from its use of financial instruments: credit risk, liquidity risk and market risk. The source of risk exposure and how each is managed are outlined below.
Credit risk
The company is exposed to credit risk on its cash and cash equivalents, receivables (excluding taxes) and derivative instrument assets. The exposure to credit risk is represented by the carrying amount of each class of financial assets, including derivative financial instruments, recorded in the consolidated statements of financial position.
The company manages its credit risk on cash and cash equivalents and derivative instrument assets through policies guiding:
| • | | Acceptable minimum counterparty credit ratings relating to the natural gas and foreign currency derivative instrument assets and cash and cash equivalents; |
| • | | Daily counterparty settlement on natural gas derivative instruments based on prescribed credit thresholds; and |
| • | | Exposure thresholds by counterparty on cash and cash equivalents. |
| | |
| 140 | | PotashCorp 2014 Annual Integrated Report |
Financials and Notes
In millions of US dollars except as otherwise noted
Note 25 Financial Instruments and Related Risk Management continued
Derivative instrument assets are comprised of natural gas hedging derivatives. All of the counterparties to the contracts comprising the derivative financial instruments in an asset position are of investment-grade quality.
The company seeks to manage the credit risk relating to its trade receivables through a credit management program. Credit approval policies and procedures are in place to guide the granting of credit to new customers as well as its continued extension to existing customers. Existing customer accounts are reviewed every12-18 months. Credit is extended to international customers based upon an evaluation of both customer and country risk. The company uses credit agency reports, where available, and an assessment of other relevant information such as current financial statements and/or credit references before assigning credit limits to customers. Those that fail to meet specified benchmark creditworthiness may transact with the company on a prepayment basis or provide another form of credit support that the company approves.
The company does not hold any collateral as security on trade receivables. If appropriate, it may request guarantees or standby letters of credit to mitigate credit risk. It also obtains export insurance from Export Development Canada (covering 90 percent of each balance) for international potash sales from its New Brunswick operation, and from the Foreign Credit Insurance Association (covering 90 percent of each balance) for international sales from the US and Trinidad. A total of $84 in receivables as at December 31, 2014 was covered, representing 99 percent of offshore receivables (2013 – 86 percent). Canpotex also obtains export insurance from Export Development Canada for its trade receivables (covering 98 percent of Canpotex’s receivables).
The credit period on sales is generally 15 days for fertilizer customers, 30 days for industrial and feed customers and up to 180 days for select export sales customers. Interest at 1.5 percent per month is charged on balances remaining unpaid at the end of the sale terms. Historically, the company has experienced minimal customer defaults and, as a result, it considers the credit quality of the trade receivables as at December 31, 2014 that are not past due to be high. There were no amounts past due or impaired relating to the non-trade receivables. There were no significant amounts impaired relating to the trade receivables. The aging of trade receivables that were past due but not impaired as at December 31 was as follows:
| | | | | | | | |
| | | 2014 | | | 2013 | |
1-30 days | | $ | 58 | | | $ | 38 | |
31-60 days | | | 2 | | | | – | |
Greater than 60 days | | | – | | | | 1 | |
| | | | | | | | | |
| | $ | 60 | | | $ | 39 | |
| | | | | | | | | |
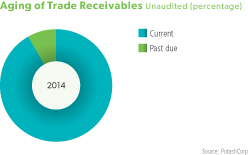
Liquidity risk
Liquidity risk arises from the company’s general funding needs and in the management of its assets, liabilities and optimal capital structure. It manages its liquidity risk to maintain sufficient liquid financial resources to fund its operations and meet its commitments and obligations in a cost-effective manner. In managing its liquidity risk, the company has access to a range of funding options. It has established an external borrowing policy with the following objectives:
| • | | Maintain an optimal capital structure; |
| • | | Maintain investment-grade credit ratings that provide ease of access to the debt capital and commercial paper markets; |
| • | | Maintain sufficient short-term credit availability; and |
| • | | Maintain long-term relationships with a sufficient number of high-quality and diverse lenders. |
The table below outlines the company’s available debt facilities as at December 31, 2014:
| | | | | | | | | | | | |
| | | Total
Amount | | | Amount Outstanding
and Committed | | | Amount
Available | |
Credit facility 1 | | $ | 3,500 | | | $ | 536 | | | $ | 2,964 | |
Line of credit | | | 75 | | | | – | 2 | | | 75 | |
| | | | | | | | | | | | | |
| 1 | Included in the amount outstanding and committed was $536 of commercial paper. The amount available under the commercial paper program is limited to the availability of backup funds under the credit facility. |
| 2 | Letters of credit as discussed in Note 17. |
The company has an uncommitted letter of credit facility of $100. As at December 31, 2014, $46 (2013 – $29) was outstanding under this facility.
Certain of the company’s derivative instruments contain provisions that require its debt to maintain specified credit ratings from two of the major credit rating agencies. If the debt were to fall below the specified ratings, the company would be in violation of these provisions, and the counterparties to the derivative instruments could request immediate payment or demand immediate and ongoing full overnight collateralization on derivative instruments in net liability positions. The aggregate fair value of all derivative instruments with credit risk-related contingent features that were in a liability position on December 31, 2014 was $189, for which the company had posted collateral of $115 in the normal course of business. If the credit risk-related contingent features underlying these agreements had been triggered on December 31, 2014, the company would have been required to post an additional $70 of collateral to its counterparties.
| | |
| PotashCorp 2014 Annual Integrated Report | | 141 |
In millions of US dollars except as otherwise noted
Note 25 Financial Instruments and Related Risk Management continued
The table below presents a maturity analysis of the company’s financial liabilities and gross settled derivative contracts (for which the cash flows are settled simultaneously) based on the expected cash flows from the date of the consolidated statements of financial position to the contractual maturity date. The amounts are the contractual undiscounted cash flows.
| | | | | | | | | | | | | | | | | | | | | | | | |
| | | Carrying Amount of
Liability as at
December 31, 2014 | | | Contractual Cash Flows | | | Within 1 Year | | | 1 to 3 Years | | | 3 to 5 Years | | | Over 5 Years | |
Short-term debt obligations1 | | $ | 536 | | | $ | 536 | | | $ | 536 | | | $ | – | | | $ | – | | | $ | – | |
Payables and accrued charges2 | | | 883 | | | | 883 | | | | 883 | | | | – | | | | – | | | | – | |
Long-term debt obligations1 | | | 3,756 | | | | 5,753 | | | | 679 | | | | 826 | | | | 769 | | | | 3,479 | |
Foreign currency derivatives | | | 2 | | | | | | | | | | | | | | | | | | | | | |
Outflow | | | | | | | 140 | | | | 140 | | | | – | | | | – | | | | – | |
Inflow | | | | | | | (138 | ) | | | (138 | ) | | | – | | | | – | | | | – | |
Natural gas derivatives | | | 193 | | | | 196 | | | | 78 | | | | 89 | | | | 28 | | | | 1 | |
| | | | | | | | | | | | | | | | | | | | | | | | | |
| | $ | 5,370 | | | $ | 7,370 | | | $ | 2,178 | | | $ | 915 | | | $ | 797 | | | $ | 3,480 | |
| | | | | | | | | | | | | | | | | | | | | | | | | |
| 1 | Contractual cash flows include contractual interest payments related to debt obligations. Interest rates on variable rate debt are based on prevailing rates as at December 31, 2014. Disclosures regarding offsetting of certain debt obligations are provided in Note 20. |
| 2 | Excludes taxes, accrued interest, deferred revenues and current portions of asset retirement obligations and accrued environmental costs and pension and other post-retirement benefits. |
Market risk
Market risk is the risk that financial instrument fair values will fluctuate due to changes in market prices. The market risks to which the company is exposed on its financial instruments are foreign exchange risk, interest rate risk and price risk (related to commodity and equity securities).
Foreign exchange risk
The company is exposed to foreign exchange risk primarily relating to Canadian operating and capital expenditures, taxes and dividends. To manage foreign exchange risk related to these non-US dollar expenditures, the company may enter into foreign currency derivatives. Its treasury risk management policies allow such exposures to be hedged within certain prescribed limits for both forecast operating and capital expenditures. The foreign currency derivatives are not currently designated as hedging instruments for accounting purposes.
The company has certain available-for-sale investments listed on foreign stock exchanges and denominated in currencies other than the US dollar for which it is exposed to foreign exchange risk. These investments are held for long-term strategic purposes.
The following table shows the company’s significant exposure to foreign exchange risk on its financial instruments and the pre-tax effects on net income and OCI of reasonably possible changes in the relevant foreign currency. The company has no significant foreign currency exposure related to cash and cash equivalents and receivables. This analysis assumed that a value decrease related to the company’s investment in ICL would not represent an impairment. Due to impairments recorded for Sinofert, this analysis assumed that any value decrease below the carrying amount at the last impairment date would represent an impairment with such decreases being recorded through net income. The carrying amount of Sinofert for purposes of this analysis was $200 as at December 31, 2014 (December 31, 2013 – $238). All other variables were assumed to remain constant.
| | | | | | | | | | | | | | | | | | | | |
| | | Carrying Amount
of Asset (Liability)
as at December 31 | | | Foreign Exchange Risk | |
| | | | 5% decrease in US$ | | | 5% increase in US$ | |
| | | | Net Income | | | OCI | | | Net Income | | | OCI | |
2014 | | | | | | | | | | | | | | | | | | | | |
Available-for-sale investments | | | | | | | | | | | | | | | | | | | | |
ICL (New Israeli shekels) | | $ | 1,275 | | | $ | – | | | $ | 64 | | | $ | – | | | $ | (64 | ) |
Sinofert (Hong Kong dollars) | | | 252 | | | | – | | | | 13 | | | | – | | | | (13 | ) |
Payables (CDN) | | | (90 | ) | | | (5 | ) | | | – | | | | 5 | | | | – | |
Foreign currency derivatives | | | (2 | ) | | | (7 | ) | | | – | | | | 7 | | | | – | |
| �� | | | | | | | | | | | | | | | | | | | | |
2013 | | | | | | | | | | | | | | | | | | | | |
Available-for-sale investments | | | | | | | | | | | | | | | | | | | | |
ICL (New Israeli shekels) | | $ | 1,468 | | | $ | – | | | $ | 73 | | | $ | – | | | $ | (73 | ) |
Sinofert (Hong Kong dollars) | | | 254 | | | | – | | | | 13 | | | | – | | | | (13 | ) |
Payables (CDN) | | | (164 | ) | | | (8 | ) | | | – | | | | 8 | | | | – | |
Foreign currency derivatives | | | (1 | ) | | | (7 | ) | | | – | | | | 7 | | | | – | |
| | | | | | | | | | | | | | | | | | | | | |
| | |
| 142 | | PotashCorp 2014 Annual Integrated Report |
Financials and Notes
In millions of US dollars except as otherwise noted
Note 25 Financial Instruments and Related Risk Management continued
Interest rate risk
Fluctuations in interest rates impact the future cash flows and fair values of various financial instruments. With respect to its debt portfolio, the company addresses interest rate risk by using a portfolio of fixed and floating rate instruments. This exposure is also managed by aligning current and long-term assets with demand and fixed-term debt and by monitoring the effects of market changes in interest rates. Interest rate swaps can be used by the company to further manage its interest rate exposure.
The company is also exposed to changes in interest rates related to its investments in marketable securities. These securities are included in cash and cash equivalents, and the company’s primary objective is to ensure the security of principal amounts invested and provide for an adequate degree of liquidity, while achieving a satisfactory return. Its treasury risk management policies specify various investment parameters, including eligible types of investment, maximum maturity dates, maximum exposure by counterparty and minimum credit ratings.
The company had no significant exposure to interest rate risk on its financial instruments as at December 31, 2014 and December 31, 2013. The only financial assets bearing any variable interest rate exposure are cash and cash equivalents. As for financial liabilities, the company has only an insignificant exposure related to a long-term loan that is subject to variable rates. Short-term debt, related to commercial paper, is excluded from interest rate risk as the interest rates are fixed for the stated period of the debt. The company would only be exposed to variable interest rate risk on the issuance of new commercial paper. It does not measure any fixed-rate debt at fair value. Therefore, changes in interest rates will not affect income or OCI as there is no change in the carrying value of fixed-rate debt and interest payments are fixed. This analysis assumed all other variables remain constant.
Price risk
The company is exposed to commodity price risk on its financial instruments resulting from its natural gas requirements. Its natural gas strategy is based on diversification for its total gas requirements (which represent the forecast consumption of natural gas volumes by its manufacturing and mining facilities). Its objective is to acquire a reliable supply of natural gas feedstock and fuel on a location-adjusted, cost-competitive basis. Its exchange-traded available-for-sale securities also expose the company to equity securities price risk.
The following table shows the company’s exposure to price risk and the pre-tax effects on net income and OCI of reasonably possible changes in the relevant commodity or securities prices. This analysis assumed that a price decrease related to the company’s investment in ICL would not represent an impairment. Due to impairments recorded for Sinofert, this analysis assumed that any price decrease below the carrying amount at the last impairment date would represent an impairment with such decreases being recorded through net income. The carrying amount of Sinofert for purposes of this analysis was $200 as at December 31, 2014 (December 31, 2013 – $238). All other variables were assumed to remain constant.
| | | | | | | | | | | | | | | | | | | | |
| | | Carrying Amount of Asset (Liability) as at December 31 | | | Price Risk | |
| | | | Effect of 10% decrease in prices | | | Effect of 10% increase in prices | |
| | | | Net Income | | | OCI | | | Net Income | | | OCI | |
2014 | | | | | | | | | | | | | | | | | | | | |
Available-for-sale investments | | | | | | | | | | | | | | | | | | | | |
ICL | | $ | 1,275 | | | $ | – | | | $ | (128 | ) | | $ | – | | | $ | 128 | |
Sinofert | | | 252 | | | | – | | | | (25 | ) | | | – | | | | 25 | |
Natural gas derivatives | | | (186 | ) | | | (4 | ) | | | (29 | ) | | | 4 | | | | 29 | |
| | | | | | | | | | | | | | | | | | | | | |
2013 | | | | | | | | | | | | | | | | | | | | |
Available-for-sale investments | | | | | | | | | | | | | | | | | | | | |
ICL | | $ | 1,468 | | | $ | – | | | $ | (147 | ) | | $ | – | | | $ | 147 | |
Sinofert | | | 254 | | | | (9 | ) | | | (16 | ) | | | – | | | | 25 | |
Natural gas derivatives | | | (162 | ) | | �� | – | | | | – | | | | – | | | | – | |
| | | | | | | | | | | | | | | | | | | | | |
The sensitivity analyses included in the tables above should be used with caution as the changes are hypothetical and not predictive of future performance. The sensitivities are calculated with reference to period-end balances and will change due to fluctuations in the balances throughout the year. In addition, for the purpose of the sensitivity analyses, the effect of a variation in a particular assumption on the fair value of the financial instrument was calculated independently of any change in another assumption. Actual changes in one factor may contribute to changes in another factor, which may magnify or counteract the effect on the fair value of the financial instrument.
| | |
| PotashCorp 2014 Annual Integrated Report | | 143 |
In millions of US dollars except as otherwise noted
Note 25 Financial Instruments and Related Risk Management continued
Fair value
Estimated fair values for financial instruments are designed to approximate amounts for which the instruments could be exchanged in a current arm’s-length transaction between knowledgeable willing parties. The valuation policies and procedures for financial reporting purposes are determined by the company’s finance department.
Financial instruments included in the consolidated statements of financial position are measured either at fair value or amortized cost. The tables below explain the valuation methods used to determine the fair value of each financial instrument and its associated level in the fair value hierarchy.
| | |
| Financial Instruments Measured at Fair Value | | Fair Value Method |
| Cash and cash equivalents | | Approximated carrying value. |
| Investments in ICL and Sinofert designated as available-for-sale | | Based on the closing bid price of the common shares (Level 1) as at the statements of financial position dates. |
| Foreign currency derivatives not traded in an active market | | Determined using quoted forward exchange rates (Level 2) as at the statements of financial position dates. |
| Natural gas swaps not traded in an active market | | Based on a discounted cash flow model. The inputs used in the model included contractual cash flows based on prices for natural gas futures contracts, fixed prices and notional volumes specified by the swap contracts, the time value of money, liquidity risk, the company’s own credit risk (related to instruments in a liability position) and counterparty credit risk (related to instruments in an asset position). Certain of the futures contract prices used as inputs in the model were supported by prices quoted in an active market (Level 2) and others were not based on observable market data (Level 3). For valuations that included both observable and unobservable data, if the unobservable input was determined to be significant to the overall inputs, the entire valuation was categorized in Level 3. |
| Natural gas futures | | Based on closing prices provided by the exchange (NYMEX) (Level 1) as at the statements of financial position dates. |
For natural gas swaps, the primary input into the valuation model was natural gas futures prices, which were based on delivery at the Henry Hub and were observable only for up to three years in the future. The unobservable futures price range as at December 31, 2014 was $3.82 to $4.74 per MMBtu (December 31, 2013 – $4.00 to $4.54 per MMBtu). Changes in the unobservable natural gas futures prices would not result in significantly higher or lower fair values as any price change would be counterbalanced by offsetting derivative positions for the majority of the company’s derivatives. Interest rates used to discount estimated cash flows as at December 31, 2014 were between 0.17 percent and 3.48 percent (December 31, 2013 – between 0.17 percent and 3.59 percent) depending on the settlement date.
| | |
| Financial Instruments Measured at Amortized Cost | | Fair Value Method |
| Receivables, short-term debt and payables and accrued charges | | Assumed to approximate carrying value due to their short-term nature. |
| Long-term debt senior notes | | Quoted market prices (Level 1 or 2 depending on the market liquidity of the debt). |
| Other long-term debt instruments | | Assumed to approximate carrying value. |
Presented below is a comparison of the fair value of the company’s senior notes to their carrying values as at December 31.
| | | | | | | | | | | | | | | | |
| | | 2014 | | | 2013 | |
| | | Carrying Amount of Liability | | | Fair Value of Liability | | | Carrying Amount of Liability | | | Fair Value of
Liability | |
Long-term debt senior notes | | $ | 3,750 | | | $ | 4,182 | | | $ | 3,500 | | | $ | 3,791 | |
| | | | | | | | | | | | | | | | | |
| | |
| 144 | | PotashCorp 2014 Annual Integrated Report |
Financials and Notes
In millions of US dollars except as otherwise noted
Note 25 Financial Instruments and Related Risk Management continued
The following table presents the company’s fair value hierarchy for financial assets and financial liabilities carried at fair value on a recurring basis.
| | | | | | | | | | | | | | | | |
| | | | | | Fair Value Measurements at Reporting Dates Using: | |
| | | Carrying Amount of
Asset (Liability) as at December 31 | | | Quoted Prices in
Active Markets for
Identical Assets
(Level 1) 1 | | | Significant Other
Observable Inputs
(Level 2) 1,2 | | | Significant
Unobservable
Inputs (Level 3) 2 | |
2014 | | | | | | | | | | | | | | | | |
Derivative instrument assets | | | | | | | | | | | | | | | | |
Natural gas derivatives | | $ | 7 | | | $ | – | | | $ | (13 | ) | | $ | 20 | |
Investments in ICL and Sinofert | | | 1,527 | | | | 1,527 | | | | – | | | | – | |
Derivative instrument liabilities | | | | | | | | | | | | | | | | |
Natural gas derivatives | | | (193 | ) | | | (4 | ) | | | (58 | ) | | | (131 | ) |
Foreign currency derivatives | | | (2 | ) | | | – | | | | (2 | ) | | | – | |
| | | | | | | | | | | | | | | | | |
2013 | | | | | | | | | | | | | | | | |
Derivative instrument assets | | | | | | | | | | | | | | | | |
Natural gas derivatives | | $ | 8 | | | $ | – | | | $ | – | | | $ | 8 | |
Investments in ICL and Sinofert | | | 1,722 | | | | 1,722 | | | | – | | | | – | |
Derivative instrument liabilities | | | | | | | | | | | | | | | | |
Natural gas derivatives | | | (170 | ) | | | – | | | | (21 | ) | | | (149 | ) |
Foreign currency derivatives | | | (1 | ) | | | – | | | | (1 | ) | | | – | |
| | | | | | | | | | | | | | | | | |
| 1 | During 2014 and 2013, there were no transfers between Level 1 and Level 2. |
| 2 | During 2014 and 2013, there were no transfers into Level 3 and $50 (2013 – $14) of losses was transferred out of Level 3 into Level 2 as (due to the passage of time) the terms of certain natural gas derivatives now matured within 36 months. The company’s policy is to recognize transfers at the end of the reporting period. |
The following table presents the company’s recognized financial instruments that are offset, or subject to enforceable master netting arrangements:
| | | | | | | | | | | | | | | | | | | | |
| Financial assets and liabilities | | Gross Assets (Liabilities) | | | Amounts Offset | | | Net Amounts
Presented | | | Amounts Not Offset
Related To Cash Margin
Deposits (Held) Placed | | | Net | |
December 31, 2014 | | | | | | | | | | | | | | | | | | | | |
Derivative instrument assets | | | | | | | | | | | | | | | | | | | | |
Natural gas derivatives | | $ | 13 | | | $ | (6 | ) | | $ | 7 | | | $ | – | 1 | | $ | 7 | |
Derivative instrument liabilities | | | | | | | | | | | | | | | | | | | | |
Natural gas derivatives | | | (263 | ) | | | 74 | | | | (189 | ) | | | 115 | 2 | | | (74 | ) |
Other long-term debt instruments 3 | | | (461 | ) | | | 455 | | | | (6 | ) | | | – | | | | (6 | ) |
| | | | | | | | | | | | | | | | | | | | | |
| | $ | (711 | ) | | $ | 523 | | | $ | (188 | ) | | $ | 115 | | | $ | (73 | ) |
| | | | | | | | | | | | | | | | | | | | | |
December 31, 2013 | | | | | | | | | | | | | | | | | | | | |
Derivative instrument assets | | | | | | | | | | | | | | | | | | | | |
Natural gas derivatives | | $ | 9 | | | $ | (1 | ) | | $ | 8 | | | $ | (3 | ) 1 | | $ | 5 | |
Derivative instrument liabilities | | | | | | | | | | | | | | | | | | | | |
Natural gas derivatives | | | (238 | ) | | | 68 | | | | (170 | ) | | | 114 | 2 | | | (56 | ) |
Other long-term debt instruments 3 | | | (461 | ) | | | 455 | | | | (6 | ) | | | – | | | | (6 | ) |
| | | | | | | | | | | | | | | | | | | | �� | |
| | $ | (690 | ) | | $ | 522 | | | $ | (168 | ) | | $ | 111 | | | $ | (57 | ) |
| | | | | | | | | | | | | | | | | | | | | |
| 1 | Cash margin deposits held related to legally enforceable master netting arrangements for natural gas derivatives. |
| 2 | Cash margin deposits placed with counterparties related to legally enforceable master netting arrangements for natural gas derivatives. |
| 3 | Back-to-back loan arrangements (Note 20). |
| | |
| PotashCorp 2014 Annual Integrated Report | | 145 |
In millions of US dollars except as otherwise noted
Note 25 Financial Instruments and Related Risk Management continued
The following table presents a reconciliation of the beginning and ending balances of the company’s fair value measurements using significant unobservable inputs (Level 3):
| | | | | | | | |
| | | Natural Gas Derivatives | |
| | | 2014 | | | 2013 | |
Balance, beginning of year | | $ | (141 | ) | | $ | (191 | ) |
Total (losses) gains (realized and unrealized) before income taxes | | | | | | | | |
Included in net income, within cost of goods sold | | | (19 | ) | | | (27 | ) |
Included in other comprehensive income | | | (30 | ) | | | 27 | |
Purchases | | | – | | | | – | |
Sales | | | – | | | | – | |
Issues | | | – | | | | – | |
Settlements | | | 29 | | | | 36 | |
Transfers of losses out of Level 3 | | | 50 | | | | 14 | |
| | | | | | | | | |
Balance, end of year | | $ | (111 | ) | | $ | (141 | ) |
| | | | | | | | | |
Losses for the year included in net income, within cost of goods sold, were: | | | | | | | | |
Change in unrealized losses relating to instruments still held at the reporting date | | $ | (1 | ) | | $ | – | |
Total losses, realized and unrealized | | | (19 | ) | | | (27 | ) |
| | | | | | | | | |

The company’s objectives in capital management are to maintain financial flexibility while managing its cost of, and optimizing its access to, capital. To achieve these objectives, its strategy, which was unchanged from 2013, was to maintain its investment-grade credit rating.
The company monitors its capital structure and, based on changes in economic conditions, may adjust the structure by adjusting the amount of dividends paid to shareholders, repurchasing shares, issuing new shares, issuing new debt or retiring existing debt.
The company uses a combination of short-term and long-term debt to finance its operations. It typically pays floating rates of interest on short-term debt and credit facilities, and fixed rates on senior notes.
Net debt and adjusted shareholders’ equity are included as components of the company’s capital structure. The calculation of net debt, adjusted shareholders’ equity and adjusted capital is set out in the following table:
| | | | | | | | |
| | | 2014 | | | 2013 | |
Short-term debt obligations | | $ | 536 | | | $ | 470 | |
Current portion of long-term debt obligations | | | 500 | | | | 500 | |
Long-term debt obligations | | | 3,256 | | | | 3,006 | |
Net unamortized debt issue costs | | | (47 | ) | | | (39 | ) |
| | | | | | | | | |
Total debt | | | 4,245 | | | | 3,937 | |
Less: cash and cash equivalents | | | (215 | ) | | | (628 | ) |
| | | | | | | | | |
Net debt | | | 4,030 | | | | 3,309 | |
| | | | | | | | | |
Total shareholders’ equity | | | 8,792 | | | | 9,628 | |
Less: accumulated other comprehensive income | | | (503 | ) | | | (673 | ) |
| | | | | | | | | |
Adjusted shareholders’ equity | | | 8,289 | | | | 8,955 | |
| | | | | | | | | |
Adjusted capital1 | | $ | 12,319 | | | $ | 12,264 | |
| | | | | | | | | |
| 1 | Adjusted capital = (total debt – cash and cash equivalents) + (total shareholders’ equity – accumulated other comprehensive income). |
| | |
| 146 | | PotashCorp 2014 Annual Integrated Report |
Financials and Notes
In millions of US dollars except as otherwise noted
Note 26 Capital Management continued
The company monitors capital on the basis of a number of factors, including the ratios of: net debt to net income before finance costs, income taxes, depreciation and amortization and certain impairment charges (“adjusted EBITDA”); adjusted EBITDA to finance costs before unwinding of discount on asset retirement obligations, borrowing costs capitalized to property, plant and equipment and interest on net defined benefit pension and other post-retirement plan obligations (“adjusted finance costs”); net debt to adjusted capital; and fixed-rate debt obligations as a percentage of total debt obligations.
| | | | | | | | |
| | | 2014 | | | 2013 | |
Components of ratios | | | | | | | | |
Adjusted EBITDA | | $ | 3,087 | | | $ | 3,282 | |
Net debt | | $ | 4,030 | | | $ | 3,309 | |
Adjusted finance costs | | $ | 197 | | | $ | 193 | |
Adjusted capital | | $ | 12,319 | | | $ | 12,264 | |
Ratios | | | | | | | | |
Net debt to adjusted EBITDA1 | | | 1.31 | | | | 1.01 | |
Adjusted EBITDA to adjusted finance costs2 | | | 15.7 | | | | 17.0 | |
Net debt to adjusted capital3 | | | 32.7% | | | | 27.0% | |
Fixed-rate debt obligations as a percentage of total debt obligations 4 | | | 87.0% | | | | 88.0% | |
| | | | | | | | | |
| 1 | Net debt to adjusted EBITDA = (total debt – cash and cash equivalents) / adjusted EBITDA. |
| 2 | Adjusted EBITDA to adjusted finance costs = adjusted EBITDA / adjusted finance costs. |
| 3 | Net debt to adjusted capital = (total debt – cash and cash equivalents) / (total debt – cash and cash equivalents + total shareholders’ equity – accumulated other comprehensive income). |
| 4 | Fixed-rate debt obligations as a percentage of total debt obligations is determined by dividing fixed-rate debt obligations by total debt obligations. |
| | | | | | | | |
| | | 2014 | | | 2013 | |
Net income | | $ | 1,536 | | | $ | 1,785 | |
Finance costs | | | 184 | | | | 144 | |
Income taxes | | | 628 | | | | 687 | |
Depreciation and amortization | | | 701 | | | | 666 | |
Impairment of available-for-sale investment | | | 38 | | | | – | |
| | | | | | | | | |
Adjusted EBITDA | | $ | 3,087 | | | $ | 3,282 | |
| | | | | | | | | |
| | | | | | | | |
| | | 2014 | | | 2013 | |
Finance costs | | $ | 184 | | | $ | 144 | |
Unwinding of discount on asset retirement obligations | | | (15 | ) | | | (13 | ) |
Borrowing costs capitalized to property, plant and equipment | | | 41 | | | | 79 | |
Interest on net defined benefit pension and other post-retirement plan obligations | | | (13 | ) | | | (17 | ) |
| | | | | | | | | |
Adjusted finance costs | | $ | 197 | | | $ | 193 | |
| | | | | | | | | |

A commitment is an agreement that is enforceable and legally binding to make a payment in the future for the purchase of goods or services. These amounts are not recorded in the consolidated statements of financial position since the company has not yet received the goods or services from the supplier. The amounts below are what the company is committed to pay based on current expected contract prices.
| | |
| Accounting Policies | | Accounting Estimates and Judgments |
Leases entered into are classified as either finance or operating leases. Leases that transfer substantially all of the risks and rewards of ownership of property to the company are accounted for as finance leases. They are capitalized at the commencement of the lease at the lower of the fair value of the leased property and the present value of the minimum lease payments. Property acquired under a finance lease is depreciated over the shorter of the period of expected use on the same basis as other similar property, plant and equipment and the lease term. Leases in which a significant portion of the risks and rewards of ownership are retained by the lessor are classified as operating leases. Rental payments under operating leases are expensed in net income on a straight-line basis over the period of the lease. | | The company is party to various leases, including leases for railcars and vessels. Judgment is required in considering a number of factors to ensure that leases to which the company is party are classified appropriately as operating or financing. Such factors include whether the lease term is for the major part of the asset’s economic life and whether the present value of minimum lease payments amounts to substantially all of the fair value of the leased asset. Substantially all of the leases to which the company is party have been classified as operating leases. |
| | | |
| | |
| PotashCorp 2014 Annual Integrated Report | | 147 |
In millions of US dollars except as otherwise noted
Note 27 Commitments continued
Supporting Information
Lease commitments
The company has various long-term operating lease agreements for land, buildings, port facilities, equipment, ocean-going transportation vessels and railcars, the latest of which expires in 2038. The majority of lease agreements are renewable at the end of the lease period at market rates. Rental expenses for operating leases for the year ended December 31, 2014 were $90 (2013 –$90, 2012 – $90).
Purchase commitments
The company has entered into long-term natural gas contracts with the National Gas Company of Trinidad and Tobago Limited, the latest of which expires in 2018. The contracts provide for prices that vary primarily with ammonia market prices, escalating floor prices and minimum purchase quantities. The commitments included in the table below are based on floor prices and minimum purchase quantities.
The company has entered into an agreement for certain phosphate products with OCP S.A. for specified purchase quantities and prices based on market
rates at the time of delivery. The commitment included in the following table is based on expected contract prices and expires in 2016.
Agreements for the purchase of sulfur for use in the production of phosphoric acid provide for specified purchase quantities, and prices are based on market rates at the time of delivery. The commitments included in the following table are based on expected contract prices.
Capital commitments
The company has various long-term contractual commitments related to the acquisition of property, plant and equipment, the latest of which expires in 2015. The commitments included in the following table are based on expected contract prices.
Other commitments
Other commitments consist principally of pipeline capacity, throughput and various rail and vessel freight contracts, the latest of which expires in 2026, and mineral lease commitments, the latest of which expires in 2034.
Minimum future commitments under these contractual arrangements are shown below:
| | | | | | | | | | | | | | | | | | | | |
| | | Operating
Leases | | | Purchase
Commitments | | | Capital
Commitments | | | Other
Commitments | | | Total | |
Within 1 year | | $ | 90 | | | $ | 436 | | | $ | 30 | | | $ | 43 | | | $ | 599 | |
1 to 3 years | | | 121 | | | | 425 | | | | – | | | | 64 | | | | 610 | |
3 to 5 years | | | 78 | | | | 94 | | | | – | | | | 28 | | | | 200 | |
Over 5 years | | | 163 | | | | – | | | | – | | | | 38 | | | | 201 | |
| | | | | | | | | | | | | | | | | | | | | |
Total | | $ | 452 | | | $ | 955 | | | $ | 30 | | | $ | 173 | | | $ | 1,610 | |
| | | | | | | | | | | | | | | | | | | | | |

Contingent liabilities are either possible obligations arising from past events and whose existence can only be confirmed by the occurrence or non-occurrence of one or more uncertain future events not wholly within the control of the company, or present obligations arising from past events but not recognized because an outflow of resources is not probable or the amount cannot be measured with sufficient reliability.
| | |
| Accounting Policies | | Accounting Estimates and Judgments |
| Generally a contingent liability is a possible obligation that arises from past events and whose existence will be confirmed only by the occurrence or non-occurrence of one or more uncertain future events not wholly within the control of the company. A contingent liability may also be a present obligation that arises from past events but is not recognized because it is not probable that an outflow of resources embodying economic benefits will be required to settle the obligation, or the amount of the obligation cannot be measured with sufficient reliability. Contingent liabilities are not recognized in the financial statements but are disclosed unless the | | The company is exposed to possible losses and gains related to environmental matters and other various claims and lawsuits pending for and against it in the ordinary course of business. Prediction of the outcome of such uncertain events (i.e., being virtually certain, probable, remote or undeterminable), determination of whether recognition or disclosure in the consolidated financial |
| | |
| 148 | | PotashCorp 2014 Annual Integrated Report |
Financials and Notes
In millions of US dollars except as otherwise noted
Note 28 Contingencies and Other Matters continued
| | |
| Accounting Policies continued | | Accounting Estimates and Judgments continued |
possibility of an outflow of resources embodying economic benefits is remote. Where the company is jointly and severally liable for an obligation, the part of the obligation that is expected to be met by other parties is treated as a contingent liability. A contingent asset is a possible asset that arises from past events and whose existence will be confirmed only by the occurrence or non-occurrence of one or more uncertain future events not wholly within the control of the company. Contingent assets are not recognized in the financial statements and are only disclosed where an inflow of economic benefits is probable. | | statements is required and estimation of potential financial effects are matters for judgment. Where no amounts are recognized, such amounts are contingent and disclosure may be appropriate. While the amount disclosed in the consolidated financial statements may not be material, the potential for large liabilities exists and therefore these estimates could have a material impact on the company’s consolidated financial statements. |
| | | |
Supporting Information
Canpotex
PCS is a shareholder in Canpotex, which markets Saskatchewan potash offshore. Should any operating losses or other liabilities be incurred by Canpotex, the shareholders have contractually agreed to reimburse it for such losses or liabilities in proportion to each shareholder’s productive capacity. Through December 31, 2014, there were no such operating losses or other liabilities.
Mining risk
The risk of underground water inflows, as with other underground risks, is currently not insured.
Legal and other matters
The company is engaged in ongoing site assessment and/or remediation activities at a number of facilities and sites, and anticipated costs associated with these matters are added to accrued environmental costs in the manner described in Note 22. This includes matters related to investigation of potential brine migration at certain of the potash sites. The following environmental site assessment and/or remediation matters have uncertainties that may not be fully reflected in the amounts accrued for those matters:
Nitrogen and phosphate
| • | | The US Environmental Protection Agency (“USEPA”) has identified PCS Nitrogen, Inc. (“PCS Nitrogen”) as a potentially responsible party at the Planters Property or Columbia Nitrogen site in Charleston, South Carolina. PCS Nitrogen is subject to a final judgment by the US District Court for the District of South Carolina allocating 30 percent of the liability for response costs at the site to PCS Nitrogen, as well as a proportional share of any costs that cannot be recovered from another responsible party. In December 2013, the USEPA issued an order to PCS Nitrogen and four other respondents requiring them jointly and severally to conduct certain cleanup work at the site and reimburse the USEPA’s costs for overseeing that work. PCS Nitrogen is currently performing the work required by the USEPA order. The USEPA also has requested reimbursement of $4 of previously incurred response costs. The ultimate amount of liability for PCS Nitrogen depends upon the final outcome of litigation to impose liability on additional parties, the amount needed for remedial activities, the ability of other parties to pay and the availability of insurance. |
| • | | PCS Phosphate has agreed to participate, on a non-joint and several basis, with parties to an Administrative Settlement Agreement with the USEPA (“Settling Parties”) in a removal action and the payment of certain other costs associated with PCB soil contamination at the Ward Transformer Superfund Site in Raleigh, North Carolina (“Site”), including reimbursement of past USEPA costs. The removal activities commenced in August 2007 and are believed to be nearly complete. In September 2013, PCS Phosphate and other parties entered into an Administrative Order on Consent with the USEPA, pursuant to which a supplemental remedial investigation and focused feasibility study will be performed on the portion of the Site that was subject to the removal action. The completed and anticipated work on the Site is estimated to cost a total of $80. PCS Phosphate is a party to ongoing Comprehensive Environmental Response, Compensation and Liability Act (“CERCLA”) contribution and cost recovery litigation for the recovery of costs of the removal activities. The USEPA has also issued an order to a number of entities requiring remediation downstream of the area subject to the removal action (“Operable Unit 1”). PCS Phosphate did not receive this order. At this time, the company is unable to evaluate the extent of any exposure that it may have for the matters addressed in the CERCLA litigation or for Operable Unit 1. |
| • | | In 1996, PCS Nitrogen Fertilizer, L.P. (“PCS Nitrogen Fertilizer”), then known as Arcadian Fertilizer, L.P., entered into a Consent Order (the “Order”) with the Georgia Environmental Protection Division (“GEPD”) in conjunction with PCS Nitrogen Fertilizer’s acquisition of real property in Augusta, Georgia. Under the Order, PCS Nitrogen Fertilizer is required to perform certain activities to investigate and, if necessary, implement corrective measures for substances in soil and groundwater. The investigation has proceeded and the results have been presented to GEPD. Two interim corrective measures for substances in groundwater have been proposed by PCS Nitrogen Fertilizer and approved by GEPD. PCS Nitrogen Fertilizer is implementing the approved interim corrective measures, which may be modified by PCS Nitrogen Fertilizer from time to time, but it is unable to estimate with reasonable certainty the total cost of its corrective action obligations under the Order at this time. |
Based on current information and except for the uncertainties described in the preceding paragraphs, the company does not believe that its future obligations with respect to these facilities and sites are reasonably likely to have a material adverse effect on its consolidated financial position or results of operations.
| | |
| PotashCorp 2014 Annual Integrated Report | | 149 |
In millions of US dollars except as otherwise noted
Note 28 Contingencies and Other Matters continued
Other legal matters with significant uncertainties include the following:
Nitrogen and phosphate
| • | | The USEPA has an ongoing initiative to evaluate implementation within the phosphate industry of a particular exemption for mineral processing wastes under the hazardous waste program. In connection with this industry-wide initiative, the USEPA conducted inspections at numerous phosphate operations and notified the company of alleged violations of the US Resource Conservation and Recovery Act (“RCRA”) at its plants in Aurora, North Carolina; Geismar, Louisiana; and White Springs, Florida; and one alleged Clean Air Act (“CAA”) violation at its Geismar, Louisiana plant. The company has entered into RCRA 3013 Administrative Orders on Consent and has performed certain site assessment activities at all of these plants. At this time, the company does not know the scope of action, if any, that may be required. As to the alleged RCRA violations, the company continues to participate in settlement discussions with the USEPA but is uncertain if any resolution will be possible without litigation, or, if litigation occurs, what the outcome would be. |
| • | | The USEPA has pursued an initiative to evaluate compliance with the CAA at sulfuric acid and nitric acid plants. In connection with this industry-wide initiative, the company, without admitting liability, reached a “global settlement” with the USEPA in September 2014, which covers the sulfuric acid plants at the Aurora, North Carolina; Geismar, Louisiana; and White Springs, Florida facilities. The consent decree to implement the settlement is expected to take effect in early 2015. The total estimated costs for complying with the consent decree are expected to be at least $51 over a compliance period that extends into 2020. |
General
| • | | The scope or timing of any final, effective requirements to control the company’s greenhouse gas emissions in the US or Canada is uncertain. Canada has withdrawn from participation in the Kyoto Protocol, and the Canadian government has announced its intention to coordinate greenhouse gas policies with the US. Although the US Congress has not passed any greenhouse gas emission control laws, the USEPA has adopted |
| | several rules to control such emissions using authority under existing environmental laws. Some Canadian provinces and US states are considering the adoption of greenhouse gas emission control requirements. In Saskatchewan, provincial regulations pursuant to the Management and Reduction of Greenhouse Gases Act, which impose a type of carbon tax to achieve a goal of a 20 percent reduction in greenhouse gas emissions by 2020 compared to 2006 levels, may become effective in 2015. None of these regulations has resulted in material limitations on greenhouse gas emissions at the company’s facilities. The company is monitoring these developments and their future effect on its operations cannot be determined with certainty at this time. |
In addition, various other claims and lawsuits are pending against the company in the ordinary course of business. While it is not possible to determine the ultimate outcome of such actions at this time, and inherent uncertainties exist in predicting such outcomes, it is the company’s belief that the ultimate resolution of such actions is not reasonably likely to have a material adverse effect on its consolidated financial position or results of operations.
The breadth of the company’s operations and the global complexity of tax regulations require assessments of uncertainties and judgments in estimating the taxes it will ultimately pay. The final taxes paid are dependent upon many factors, including negotiations with taxing authorities in various jurisdictions, outcomes of tax litigation and resolution of disputes arising from federal, provincial, state and local tax audits. The resolution of these uncertainties and the associated final taxes may result in adjustments to the company’s tax assets and tax liabilities.
The company owns facilities that have been either permanently or indefinitely shut down. It expects to incur nominal annual expenditures for site security and other maintenance costs at certain of these facilities. Should the facilities be dismantled, certain other shutdown-related costs may be incurred. Such costs are not expected to have a material adverse effect on the company’s consolidated financial position or results of operations and would be recognized and recorded in the period in which they are incurred.

General guarantees are not recognized in the consolidated statements of financial position but are disclosed.
|
| Accounting Policies |
General guarantees include contracts or indemnifications that contingently require the guarantor to make payments based on changes in an underlying, contracts that contingently require payments to a guaranteed party based on another entity’s failure to perform under an agreement, and indirect guarantee of the indebtedness of another party. General guarantees are not recognized in the consolidated statements of financial position but are disclosed. A financial guarantee contract requires the issuer to make payments to reimburse the holder for a loss it incurs because a debtor fails to make payment when due. A financial guarantee contract is recognized as a financial instrument in the consolidated statements of financial position when the company becomes party to the contract. |
| | |
| 150 | | PotashCorp 2014 Annual Integrated Report |
Financials and Notes
In millions of US dollars except as otherwise noted
Note 29 Guarantees continued
Supporting Information
In the normal course of operations, the company provides indemnifications, which are often standard contractual terms, to counterparties in transactions such as purchase and sale contracts, service agreements, director/officer contracts and leasing transactions. These indemnification agreements may require the company to compensate the counterparties for costs incurred as a result of various events, including environmental liabilities and changes in (or in the interpretation of) laws and regulations, or as a result of litigation claims or statutory sanctions that may be suffered by the counterparty as a consequence of the transaction. The terms of these indemnification agreements will vary based upon the contract, the nature of which prevents the company from making a reasonable estimate of the maximum potential amount that it could be required to pay to counterparties. Historically, the company has not made any significant payments under such indemnifications and no amounts have been accrued in the accompanying consolidated financial statements with respect to these indemnification guarantees (apart from any appropriate accruals relating to the underlying potential liabilities).
The company enters into agreements in the normal course of business that may contain features which meet the definition of a guarantee. Various debt obligations (such as overdrafts, lines of credit with counterparties for derivatives and back-to-back loan arrangements) and other commitments (such as railcar leases) related to certain subsidiaries and investees have been directly guaranteed by the company under such agreements with third parties. It would be required to perform on these guarantees in the event of default by the guaranteed parties. No material loss is anticipated by reason of such agreements and guarantees. As at December 31, 2014, the maximum potential amount of future (undiscounted) payments under significant guarantees provided to third parties approximated $545. It is unlikely that these guarantees will be drawn upon and, since the maximum potential amount of future payments does not consider the possibility of recovery under recourse or collateral provisions, this amount is not indicative of future cash requirements or the company’s expected losses from these arrangements.
As at December 31, 2014, no subsidiary balances subject to guarantees were outstanding in connection with the company’s cash management facilities, and it had no liabilities recorded for other guarantee obligations other than subsidiary bank borrowings of approximately $6, which are reflected in other long-term debt in Note 20.
The company has guaranteed the gypsum stack capping, closure and post-closure obligations of White Springs and PCS Nitrogen in Florida and Louisiana, respectively, pursuant to the financial assurance regulatory requirements in those states. It has guaranteed the performance of certain remediation obligations of PCS Joint Venture at the Lakeland, Florida and Moultrie, Georgia sites. The USEPA has announced that it plans to adopt rules requiring financial assurance from a variety of mining operations, including phosphate rock mining. It is too early in the rule-making process to determine what the impact, if any, on the company’s facilities will be when these rules are issued.
The environmental regulations of the Province of Saskatchewan require each potash mine to have decommissioning and reclamation plans, and financial assurances for these plans, approved by the responsible provincial minister. The Minister of the Environment for Saskatchewan (“MOE”) has approved the plans and the increase of the previously established CDN $3 trust fund to CDN $25 to be funded by the company in equal annual payments from 2014 through 2021. The next scheduled review of these plans and financial assurances is to be completed by June 30, 2016.
The company has met its financial assurance responsibilities as at December 31, 2014. Costs associated with the retirement of long-lived tangible assets have been accrued in the accompanying consolidated financial statements to the extent that a legal or constructive liability to retire such assets exists.
During the period, the company entered into various other commercial letters of credit in the normal course of operations. As at December 31, 2014, $41 of letters of credit were outstanding.
The company expects that it will be able to satisfy all applicable credit support requirements without disrupting normal business operations.
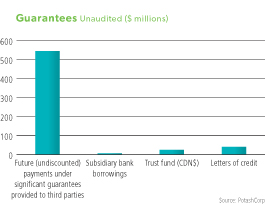
| | |
| PotashCorp 2014 Annual Integrated Report | | 151 |
In millions of US dollars except as otherwise noted
Note 29 Guarantees continued

The company has a number of related parties with the most significant being Canpotex, key management personnel and post-employment benefit plans.
Accounting Policies
|
A person or entity is related to the company, and therefore considered a related party, if any of the following conditions exist: an entity is an associate or joint venture; a person is a member of key management personnel (and their families); a post-employment benefit plan is for the benefit of employees; or a person has significant influence. Key management personnel are the company’s directors and executive officers as disclosed in its 2014, 2013 and 2012 Annual Reports onForm 10-K, as applicable. |
Supporting Information
Sale of goods
The company sells potash from its Saskatchewan mines for use outside Canada and the US exclusively to Canpotex. Sales are at prevailing market prices and are settled on normal trade terms. Sales to Canpotex for the year ended December 31, 2014 were $1,233 (2013 – $1,253, 2012 – $1,492). Canpotex’s proportionate sales volumes by geographic area are shown in Note 3.
The receivable outstanding from Canpotex is shown in Note 11, and arose from sale transactions described above. It is unsecured in nature and bears no interest. There are no provisions held against this receivable.
Key management personnel compensation
Compensation to key management personnel was comprised of:
| | | | | | | | | | | | |
| | | 2014 | | | 2013 | | | 2012 | |
Salaries and other short-term benefits | | $ | 12 | | | $ | 11 | | | $ | 11 | |
Share-based payments | | | 14 | | | | 6 | | | | 12 | |
Post-employment benefits | | | 6 | | | | 5 | | | | 5 | |
| | | | | | �� | | | | | | | |
| | $ | 32 | | | $ | 22 | | | $ | 28 | |
| | | | | | | | | | | | | |
Transactions with post-employment benefit plans
Disclosures related to the company’s post-employment benefit plans are shown in Note 21.

Prior periods’ depreciation and amortization figures within Note 3 have been reclassified from the potash segment to the all others segment to more accurately reflect amounts that affect gross margin in potash (2013 – $20, 2012 – $11). Total gross margin did not change, and the company believes this provides more relevant information. Prior period immaterial disclosure errors were identified in Note 4 relating to classification of depreciation and amortization amounts. Depreciation and amortization amounts were corrected from cost of goods sold to other (2013 – $27, 2012 – $15). Also added to prior period figures in Note 4 were the nature of expenses included in freight, transportation and distribution and other (income) expenses. These adjustments had no effect on any other amounts within the consolidated financial statements.
| | |
| 152 | | PotashCorp 2014 Annual Integrated Report |
Other Information
Board of Directors
| | | | | | | | | | | | |
 | |  | |  | |  | |  | |  | |  |
| | | | | | |
| Christopher BurleyA,D | | Donald ChynowethC,D | | John EsteyA,B | | Gerald GrandeyB,C | | C. Steven Hoffman B,C | | Dallas Howe (Chair) A | | Alice LabergeA,D |
| Calgary AB | | Calgary AB | | Glenview IL | | Saskatoon SK | | Tampa FL | | Calgary AB | | Vancouver BC |
| | | | | | | | | | |
 | |  | |  | |  | |  | |  |
| | | | | |
| Consuelo MadereC,D | | Keith MartellB,D | | Jeffrey McCaig B,C | | Mary MogfordA,B | | Jochen Tilk | | Elena Viyella De Paliza C |
| Destin FL | | Saskatoon SK | | Calgary AB | | Newcastle ON | | Saskatoon SK | | Dominican Republic |
| | |
| Committees: (A) Corporate governance and nominating (B) Compensation (C) Safety, health and environment (D) Audit |
Senior Management
| | | | | | | | | | | | |
| |  | |  | |  | |  | | 
| |  |
| | | | | | |
| Jochen Tilk | | Wayne Brownlee | | G. David Delaney | | Stephen Dowdle | | Joseph Podwika | | Darryl Stann | | Mark Fracchia |
President and Chief Executive Officer | | Executive Vice President and Chief Financial Officer | | Executive Vice President and Chief Operating Officer | | President, PCS Sales | | Senior Vice President, General Counsel and Secretary | | Senior Vice President, Finance and Chief Risk Officer | | President, PCS Potash |
| | | | | | |
 | | 
| |  | |  |
| | | |
Raef Sully | | Paul DeKok | | Denita Stann | | Lee Knafelc |
President, PCS Nitrogen | | President, PCS Phosphate | | Vice President, Investor and Public Relations | | Vice President, Human Resources and Administration |
| | | | | | |
| |  potashcorp.com/board-and-management potashcorp.com/board-and-management |
| | |
| PotashCorp 2014 Annual Integrated Report | | 153 |
Shareholder Information
Annual Meeting
The Annual Shareholders Meeting will be held at 3:30 p.m. Central Standard Time on May 12, 2015 in the Radisson Hotel, 405 – 20th Street East, Saskatoon SK.
It will be carried live on the company’s website: www.potashcorp.com.
Holders of common shares as of March 16, 2015 are entitled to vote at the meeting and are encouraged to participate.
Dividends
Dividend amounts paid to shareholders resident in Canada are adjusted by the exchange rate applicable on the dividend record date. Dividends are normally paid in February, May, August and November, with record dates normally set approximately three weeks in advance of the payment date. Future cash dividends will be paid out of, and are conditioned upon, the company’s available earnings. Shareholders who wish to have their dividends deposited directly to their bank accounts should contact the transfer agent and registrar, CST Trust Company.
Registered shareholders can have dividends reinvested in newly issued common shares of PotashCorp at prevailing market rates.
Ownership
On February 20, 2015, there were 1,465 holders of record of the company’s common shares.
Common Share Prices
The company’s common shares are traded on the Toronto Stock Exchange and the New York Stock Exchange (composite transactions) on a quarterly basis. Potash Corporation of Saskatchewan Inc. is on the S&P/TSX 60 and the S&P/TSX Composite indices.
| | |
Corporate Headquarters | | Investors Contact |
| Suite 500, 122 – 1st Ave South | | Investor Relations Department |
| Saskatoon SK S7K 7G3 Canada | | Email: potashcorp.ir@potashcorp.com |
| Phone: (306) 933-8500 | | Phone: (306) 933-8637 |
Transfer Agent
You can contact CST Trust Company, the corporation’s transfer agent,
as follows:
| | |
| By Telephone: | | 1-800-387-0825 |
| | (toll-free within Canada and the US), or 1-416-682-3860 (from any country other than Canada and the US) |
| |
| By Fax: | | 1-514-985-8843 (all countries) |
| |
| By Mail: | | P.O. Box 700 |
| | Station B Montreal QC H3B 3K3 Canada |
| |
Through the Internet: | | www.canstockta.com |
NYSE Corporate Governance
Disclosure contemplated by 303A.11 of the NYSE’s listed company manual is available on our website at www.potashcorp.com. The certifications required by Section 302 of the Sarbanes-Oxley Act of 2002 are filed as exhibits to our 2014 Annual Integrated Report on Form 10-K.
| | |
| 154 | | PotashCorp 2014 Annual Integrated Report |
Other Information
Appendix
Market and Industry Data Statement
Some of the market and industry data contained in this Annual Integrated Report and this Management’s Discussion & Analysis of Financial Condition and Results of Operations are based on internal surveys, market research, independent industry publications or other publicly available information. Although we believe that the independent sources used by us are reliable, we have not independently verified and cannot guarantee the accuracy or completeness of this information. Similarly, we believe our internal research is reliable, but such research has not been verified by any independent sources.
Information in the preparation of this Annual Integrated Report is based on statistical data and other material available at February 20, 2015.
Abbreviated Company Names and Sources*
| | |
| Name | | Source |
Agrium | | Agrium Inc. (TSX and NYSE: AGU), Canada |
AMEC | | AMEC Americas Limited, Canada |
APC | | Arab Potash Company (Amman: ARPT), Jordan |
Belaruskali | | PA Belaruskali, Belarus |
Bloomberg | | Bloomberg L.P., USA |
Canpotex | | Canpotex Limited, Canada |
CF Industries | | CF Industries Holdings, Inc. (NYSE: CF), USA |
CN Rail | | Canadian National Railway Co. (TSX: CNR and
NYSE: CNI), Canada |
CP Rail | | Canadian Pacific Railway Ltd. (TSX and NYSE: CP),
Canada |
CRU | | CRU International Limited, UK |
DBRS | | Dominion Bond Rating Service, Canada |
FactSet | | FactSet Research Systems Inc., USA |
FAO | | Food and Agriculture Organization of the
United Nations |
Fertecon | | Fertecon Limited, UK |
ICL | | Israel Chemicals Ltd. (Tel Aviv: ICL), Israel |
IFA | | International Fertilizer Industry Association, France |
Innophos | | Innophos Holdings, Inc. (NASDAQ: IPHS), USA |
Intrepid | | Intrepid Potash, Inc. (NYSE: IPI), USA |
| | |
| Name | | Source |
IPNI | | International Plant Nutrition Institute, USA |
K+S | | K+S Group (Xetra: SDF), Germany |
Koch | | Koch Industries, Inc., USA |
Moody’s | | Moody’s Corporation (NYSE: MCO), USA |
Mosaic | | The Mosaic Company (NYSE: MOS), USA |
NYMEX | | New York Mercantile Exchange, USA |
NYSE | | New York Stock Exchange, USA |
PhosChem | | Phosphate Chemicals Export Association, Inc., USA |
Simplot | | J.R. Simplot Company, USA |
Sinofert | | Sinofert Holdings Limited (HKSE: 0297.HK), China |
SQM | | Sociedad Química y Minera de Chile S.A. (Santiago Bolsa de Comercio Exchange, NYSE: SQM), Chile |
S&P | | Standard & Poor’s Financial Services LLC, USA |
TSX | | Toronto Stock Exchange, Canada |
Uralkali | | JSC Uralkali (LSE and RTS: URKA), Russia |
USDOC | | US Department of Commerce, USA |
Vale | | Vale S.A. (NYSE: VALE), Brazil |
Yara | | Yara International ASA (Oslo: YAR), Norway |
| * | Where PotashCorp is listed as a source in conjunction with external sources, we have supplemented the external data with internal analysis. |
| | |
| PotashCorp 2014 Annual Integrated Report | | 155 |
Terms and Measures
Glossary of Terms
Scientific Terms
| | | | |
Nitrogen | | NH3 | | ammonia (anhydrous), 82.2% N |
| | | HNO3 | | nitric acid, 22% N (liquid) |
| | | UAN | | nitrogen solutions, 28-32% N (liquid) |
Phosphate | | MGA | | merchant grade acid, 54% P2O5(liquid) |
| | | DAP | | diammonium phosphate, 46% P2O5(solid) |
| | | MAP | | monoammonium phosphate, 52% P2O5(solid) |
| | | SPA | | superphosphoric acid, 70% P2O5(liquid) |
| | | Monocal | | monocalcium phosphate, 48.1% P2O5(solid) |
| | | Dical | | dicalcium phosphate, 42.4% P2O5(solid) |
| | | DFP | | defluorinated phosphate, 41.2% P2O5(solid) |
| | | STF | | silicon tetrafluoride |
Potash | | KCI | | potassium chloride, 60-63.2% K2O (solid) |
Product Measures
| | |
K2O tonne | | Measures the potassium content of products having
different chemical analyses |
N tonne | | Measures the nitrogen content of products having different chemical analyses |
P2O5tonne | | Measures the phosphorus content of products having different chemical analyses |
Product tonne | | Standard measure of the weights of all types of potash, nitrogen and phosphate products |
Currency Abbreviations
| | |
CDN | | Canadian dollar |
USD | | United States dollar |
Exchange Rates
CDN per USD at December 31, 2014 – 1.1601
General Terms
| | |
| 2014E | | 2014 estimated |
| 2015F | | 2015 forecast |
| Brownfield capacity | | Increase in operational capability
at existing operation |
| CAGR | | Compound annual growth rate |
| CAPEX | | Capital expenditure |
| Canpotex | | An export company owned by all Saskatchewan
producers of potash (PotashCorp, Mosaic and Agrium) |
| Consumption vs demand | | Product applied vs product purchased |
| FOB | | Free on Board – cost of goods on board at point
of shipment |
| FSU | | Former Soviet Union |
| GDP | | Gross Domestic Product |
| Greenfield capacity | | New operation built on undeveloped site |
| Latin America | | South America, Central America, Caribbean and Mexico |
| LNG | | Liquefied natural gas |
| MMBtu | | Million British thermal units |
| MMT | | Million metric tonnes |
| Nameplate capacity | | Estimated theoretical capacity based on design specifications |
| North America | | The North American market includes Canada
and the US |
| Offshore | | Offshore markets include all markets except Canada
and the US |
| Operational capability | | Estimated annual achievable production level |
| PotashCorp | | Potash Corporation of Saskatchewan Inc. (PCS) and its direct or indirect subsidiaries, individually
or in any combination, as applicable |
| Yuzhnyy | | A port situated in Ukraine |
| | |
| 156 | | PotashCorp 2014 Annual Integrated Report |
Other Information
Defined Terms
Definitions
| | |
| Community investment | | Represents cash disbursements, matching of employee gifts and in-kind contributions of equipment, goods, services and employee volunteerism (on corporate time). |
| Community survey score | | Survey conducted annually by an independent third party in the communities where we have significant operations; each community is generally surveyed every three years. Community leaders and representatives are asked to provide a ranking in three broad areas: perception of community involvement, business practices and economic issues. A local option question may be developed to address a specific interest of each community. Each question is rated on a scale of 1 (low) to 5 (high) and results are determined by taking a simple average of the metrics described above. |
| Customer survey score | | Online survey conducted by an independent third party and includes a select group of top customers from each sales segment and region to form a Customer Advisory Council. Customers were asked to commit to participate in annual satisfaction surveys for five years to ensure consistent measurement and reporting. Results are determined by taking a simple average of our individual product quality and customer service scores in fertilizer, feed, industrial nitrogen and purified phosphate. |
| Employee engagement score | | Represents the proportion of employee responses of “Agree” or “Strongly Agree” to 10 employee engagement statements. |
| Environmental incidents | | Number of incidents, includes reportable quantity releases, permit excursions and provincial reportable spills. Calculated as: reportable quantity releases (a release whose quantity equals or exceeds the US Environmental Protection Agency’s notification level and is reportable to the National Response Center (NRC)) + permit excursions (an exceedance of a federal, state, provincial or local permit condition or regulatory limit) + provincial reportable spills (an unconfined spill or release into the environment). |
| GHG emissions | | Based on 2007 United Nations International Panel on Climate Change Fourth Assessment Report (UN IPCC Fourth AR). |
| Lost-time injury rate | | Total lost-time injuries for every 200,000 hours worked for all PotashCorp employees, contractors and others on site. Calculated as the total lost-time injuries and modified work injuries multiplied by 200,000 hours worked divided by the actual number of hours worked. |
| Taxes and royalties | | Includes tax and royalty amounts on an accrual basis calculated as: current income tax expense (which was already reduced by the realized excess tax benefit related to share-based compensation under previous Canadian GAAP) less investment tax credits and realized excess tax benefit related to share-based compensation (under IFRS) plus potash production tax, resource surcharge, royalties, municipal taxes and other miscellaneous taxes. |
| Total shareholder return (TSR) | | Return on investment in PotashCorp stock from the time the investment is made based on two components: (1) growth in share price and (2) return from reinvested dividend income on the shares. |
| Total site recordable injury rate | | Total recordable injuries for every 200,000 hours worked for all PotashCorp employees, contractors and others on site. Calculated as the total recordable injuries multiplied by 200,000 hours worked divided by the actual number of hours worked. |
Waste | | Comprised of waste or byproducts from mining, including: coarse and fine tailings from potash mining, salt as brine to injection wells and gypsum (related to phosphate operations). |
| | |
| PotashCorp 2014 Annual Integrated Report | | 157 |

PotashCorp2014AIR.com
| | | | | | | | | | |

| | PotashCorp.com Visit us online | |  | | Facebook.com/PotashCorp Find us on Facebook | |  | | Twitter.com/PotashCorp Follow us on Twitter |
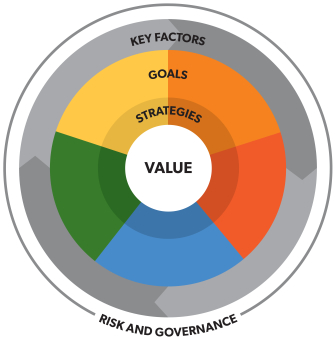
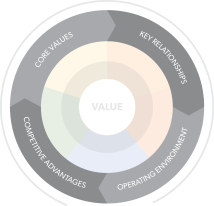
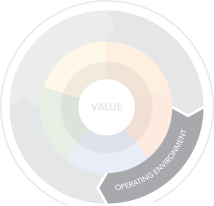
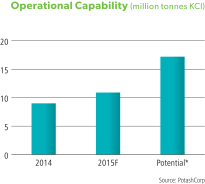
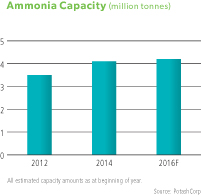
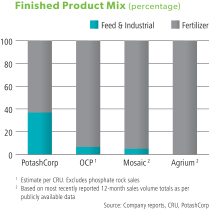
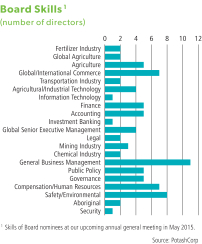
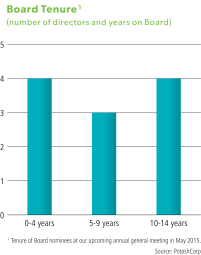
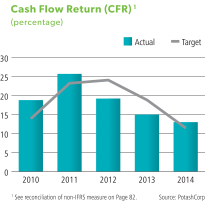
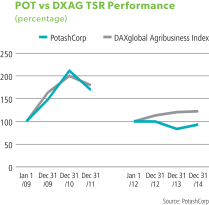
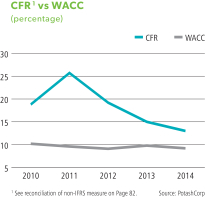
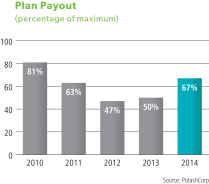
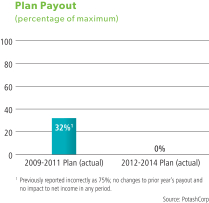
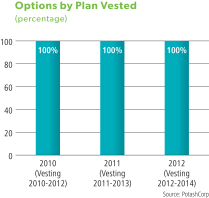
 Achieved
 In progress
 Not achieved