UNITED STATES
SECURITIES AND EXCHANGE COMMISSION
Washington, D.C. 20549
FORM N-CSR
CERTIFIED SHAREHOLDER REPORT OF REGISTERED MANAGEMENT INVESTMENT COMPANIES
Investment Company Act file number_811-05878
__Franklin Value Investors Trust
(Exact name of registrant as specified in charter)
One Franklin Parkway, San Mateo, CA 94403-1906
(Address of principal executive offices) (Zip code)
Craig S. Tyle, One Franklin Parkway, San Mateo, CA 94403-1906
(Name and address of agent for service)
Registrant's telephone number, including area code:_650 312-2000
Date of fiscal year end: 10/31
Date of reporting period:_10/31/10
Item 1. Reports to Stockholders.

SPECIALIZED EXPERTISE
TRUE DIVERSIFICATION
RELIABILITY YOU CAN TRUST
MUTUAL FUNDS |
Franklin Templeton Investments
Gain From Our Perspective®
Franklin Templeton’s distinct multi-manager structure combines the specialized expertise of three world-class investment management groups—Franklin, Templeton and Mutual Series.
Each of our portfolio management groups operates autonomously, relying on its own research and staying true to the unique investment disciplines that underlie its success.
Franklin. Founded in 1947, Franklin is a recognized leader in fixed income investing and also brings expertise in growth- and value-style U.S. equity investing.
Templeton. Founded in 1940, Templeton pioneered international investing and, in 1954, launched what has become the industry’s oldest global fund. Today, with offices in over 25 countries, Templeton offers investors a truly global perspective.
Mutual Series. Founded in 1949, Mutual Series is dedicated to a unique style of value investing, searching aggressively for opportunity among what it believes are undervalued stocks, as well as arbitrage situations and distressed securities.
Because our management groups work independently and adhere to different investment approaches, Franklin, Templeton and Mutual Series funds typically have distinct portfolios. That’s why our funds can be used to build truly diversified allocation plans covering every major asset class.
At Franklin Templeton Investments, we seek to consistently provide investors with exceptional risk-adjusted returns over the long term, as well as the reliable, accurate and personal service that has helped us become one of the most trusted names in financial services.
RETIREMENT PLANS | 529 COLLEGE SAVINGS PLANS | SEPARATE ACCOUNTS

| Not part of the annual report |
Economic and Market Overview
During the 12-month period ended October 31, 2010, the U.S. economy recovered gradually from the recession, supported by a combination of fundamental business improvement and government intervention. Economic activity as measured by gross domestic product (GDP) expanded at a 5.0% annualized rate in 2009’s fourth quarter. As the effects of temporary stimulus measures faded, construction, industrial production and exports cooled somewhat. As a result, GDP growth slowed to an annualized 3.7% pace in 2010’s first quarter, and then downshifted further to 1.7% annualized in the second quarter and an annualized 2.5% pace in the third quarter.
Challenges such as mixed economic data, increased debt concerns surrounding the U.S. budget deficit and a lack of job prospects for the unemployed also hindered consumer confidence and the economy’s advance. During much of the period, home prices rose in many regions due to low interest rates, a first-time homebuyer tax credit program, and prices dipping to levels that lured buyers. Later in the period, home sales stalled as the homebuyer tax credit program ended, foreclosures mounted and the housing sector remained weak.
Amid signs of a demand-led recovery, crude oil prices rose from $77 per barrel at the end of October 2009 to a 17-month high of $87 in early April. But as doubts surfaced about the recovery’s sustainability, oil prices dipped to $66 in late May. Despite an abundant oil supply, prices rebounded to $81 per barrel by the end of October largely due to a falling U.S. dollar and speculative buying. The October 2010 inflation rate was an annualized 1.2%.1 Core inflation, which excludes volatile food and energy costs, rose at a 0.6% annualized rate, the smallest 12-month increase in more than 50 years.1 Job gains were disappointing until October 2010 w hen businesses added more jobs than expected. The unemployment rate fell from 10.1% in October 2009 to 9.6% at period-end with some of the decline attributable to a shrinking labor force as some unemployed workers stopped looking for jobs.1
Given few inflationary pressures and uncertainty surrounding the economic recovery, the Federal Open Market Committee (FOMC) made no major changes to its monetary policy for most of the period. It repeatedly stated it will keep the federal funds target rate in the exceptionally low 0% to 0.25% range “for an extended period” and eventually shifted its focus to its outlook
| | 1. Source: Bureau of Labor Statistics. |
Annual Report | 3
and the status of its current holdings. In September, the FOMC revealed concerns about the subdued recovery and said inflation was below the pace “consistent with its mandate.” Having already lowered interest rates effectively to zero, the FOMC appeared ready to purchase government securities to stimulate the economy and promote a low level of inflation consistent with healthy economic growth.
Investor confidence shifted with each release of encouraging or discouraging economic, regulatory or political news, stoking considerable volatility among equities. Ultimately, stock market gains made in the first half of the fiscal year gave way to a directionless, nearly flat trend midway through the period before rallying in the fiscal year’s final few months. Overall, the blue-chip stocks of the Dow Jones Industrial Average delivered a +17.62% total return, while the broader Standard & Poor’s 500 Index (S&P 500) posted a +16.52% total return and the technology-heavy NASDAQ Composite Index produced a +23.72% total return.2 Performance among the major sectors varied widely, with consumer discretionary, industrials and telecommunication services making the largest gains, while financials, energy and health care underperformed.
The foregoing information reflects our analysis and opinions as of October 31, 2010. The information is not a complete analysis of every aspect of any market, country, industry, security or fund. Statements of fact are from sources considered reliable.
2. Source: © 2010 Morningstar. All Rights Reserved. The information contained herein: (1) is proprietary to Morningstar and/or its content providers; (2) may not be copied or distributed; and (3) is not warranted to be accurate, complete or timely. Neither Morningstar nor its content providers are responsible for any damages or losses arising from any use of this information. Past performance is no guarantee of future results. The Dow Jones Industrial Average is price weighted based on the average market price of 30 blue-chip stocks that are generally industry leaders. The S&P 500 is a market capitalization-weighted index of 500 stocks designed to measure total U.S. equity market performance. STANDARD & POOR’S®, S&P® and S&P 500® are registered trademarks of Standard & Poor’s Financial Services LLC. Standard & Poor’s does not sponsor, endorse, sell or promote any S&P index-based product. The NASDAQ Composite Index is a broad-based market capitalization-weighted index designed to measure all NASDAQ domestic and international based common type stocks listed on The NASDAQ Stock Market.
4 | Annual Report

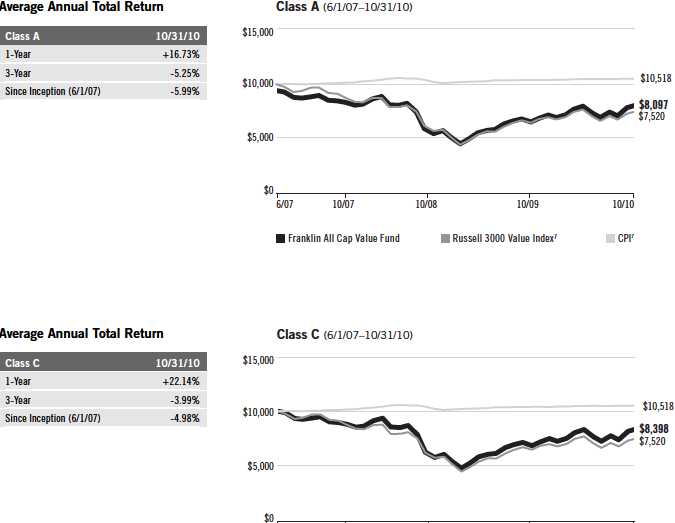
Performance Summary as of 10/31/10
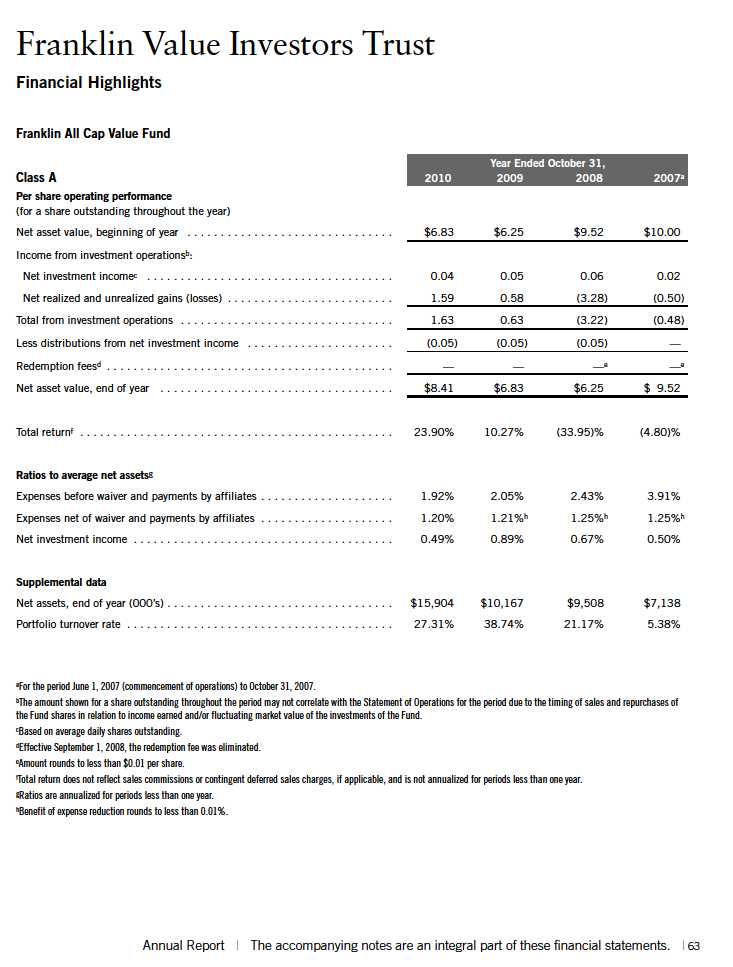
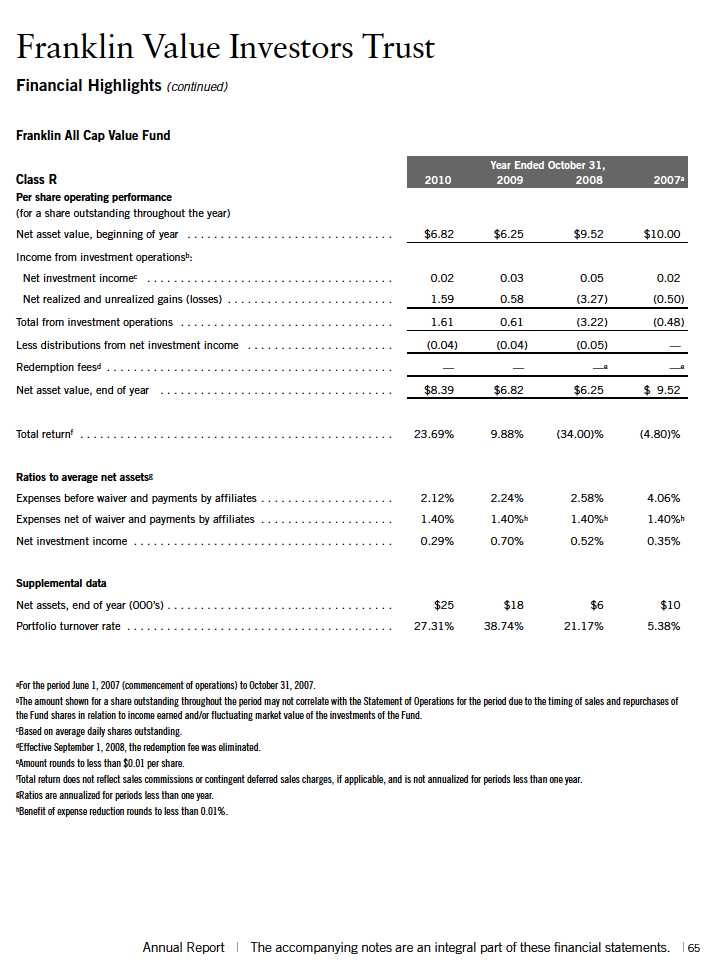
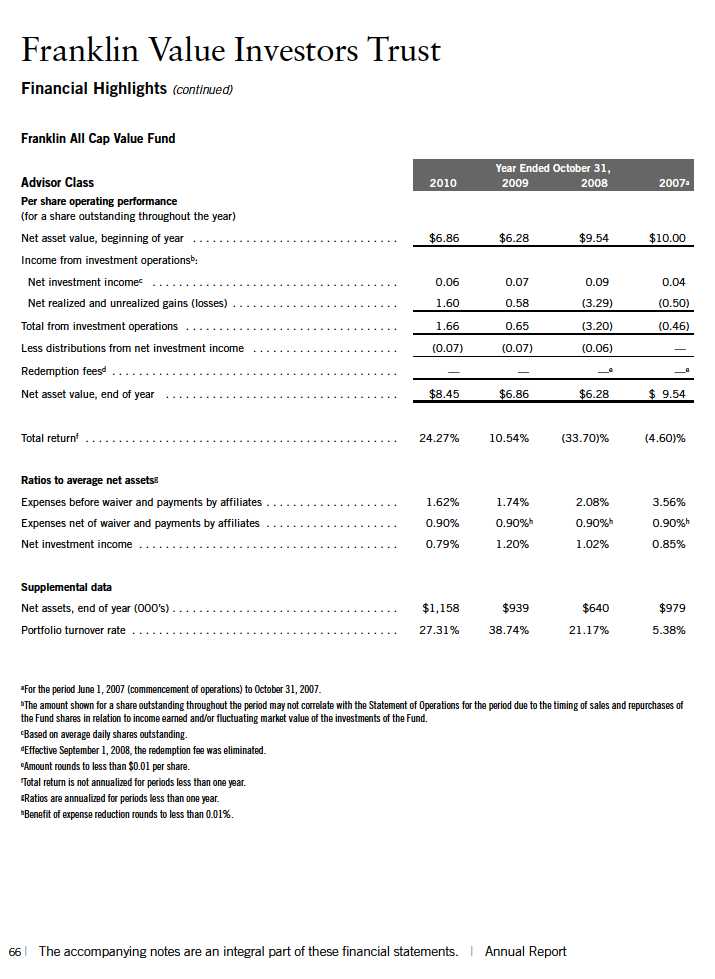
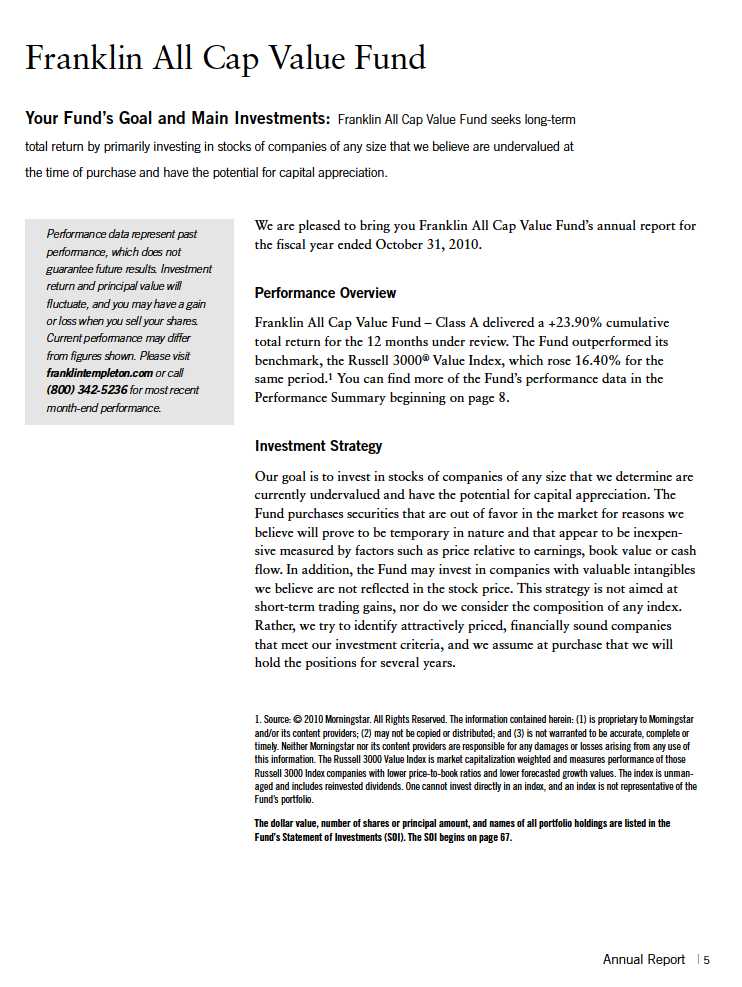
Franklin All Cap Value Fund
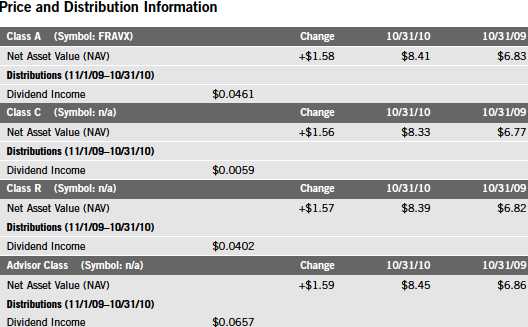
Your dividend income will vary depending on dividends or interest paid by securities in the Fund’s portfolio, adjusted for operating expenses of each class. Capital gain distributions are net profits realized from the sale of portfolio securities. The performance table and graphs do not reflect any taxes that a shareholder would pay on Fund dividends, capital gain distributions, if any, or any realized gains on the sale of Fund shares. Total return reflects reinvestment of the Fund’s dividends and capital gain distributions, if any, and any unrealized gains or losses.
8 | Annual Report
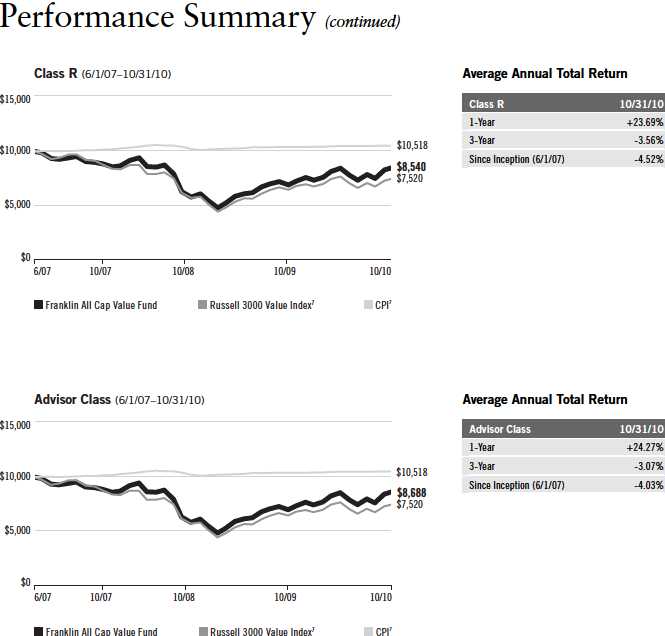
Performance Summary (continued)
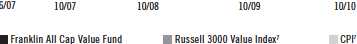
Total Return Index Comparison for a Hypothetical $10,000 Investment1
Total return represents the change in value of an investment over the periods shown. It includes any applicable maximum sales charge, Fund expenses, account fees and reinvested distributions. The unmanaged index includes reinvestment of any income or distributions. It differs from the Fund in composition and does not pay management fees or expenses. One cannot invest directly in an index.
10 | Annual Report
Annual Report | 11
Performance Summary (continued)
Endnotes
Value securities may not increase in price as anticipated or may decline further in value. While smaller and midsize companies may offer substantial opportunities for capital growth, they also involve heightened risks and should be considered speculative. Historically, smaller and midsize company securities have been more volatile in price than larger company securities, especially over the short term. The Fund may invest up to 25% of its total assets in foreign securities, which may involve special risks, including currency fluctuations and economic and political uncertainty. The Fund’s prospectus also includes a description of the main investment risks.
| |
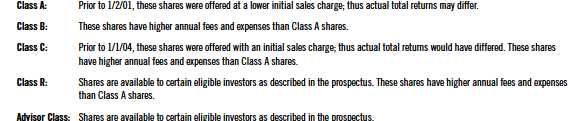
Class C: Class R: | These shares have higher annual fees and expenses than Class A shares. Shares are available to certain eligible investors as described in the prospectus. These shares have higher annual fees and expenses than Class A shares. |
Advisor Class: | Shares are available to certain eligible investors as described in the prospectus. |
1. If the manager and administrator had not waived fees, the Fund’s total returns would have been lower. 2. Cumulative total return represents the change in value of an investment over the periods indicated.
3. Average annual total return represents the average annual change in value of an investment over the periods indicated. 4. These figures represent the value of a hypothetical $10,000 investment in the Fund over the periods indicated.
5. In accordance with SEC rules, we provide standardized average annual total return information through the latest calendar quarter.
6. Figures are as stated in the Fund’s prospectus current as of the date of this report. In periods of market volatility, assets may decline significantly, causing total annual Fund operating expenses to become higher than the figures shown.
7. Source: © 2010 Morningstar. The Russell 3000 Value Index is market capitalization weighted and measures performance of those Russell 3000 Index companies with lower price-to-book ratios and lower forecasted growth values. The Consumer Price Index (CPI), calculated by the U.S. Bureau of Labor Statistics, is a commonly used measure of the inflation rate.
12 | Annual Report

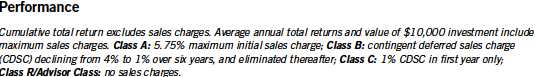
Performance Summary as of 10/31/10
Franklin Balance Sheet Investment Fund
Your dividend income will vary depending on dividends or interest paid by securities in the Fund’s portfolio, adjusted for operating expenses of each class. Capital gain distributions are net profits realized from the sale of portfolio securities. The performance table and graphs do not reflect any taxes that a shareholder would pay on Fund dividends, capital gain distributions, if any, or any realized gains on the sale of Fund shares. Total return reflects reinvestment of the Fund’s dividends and capital gain distributions, if any, and any unrealized gains or losses.
18 | Annual Report
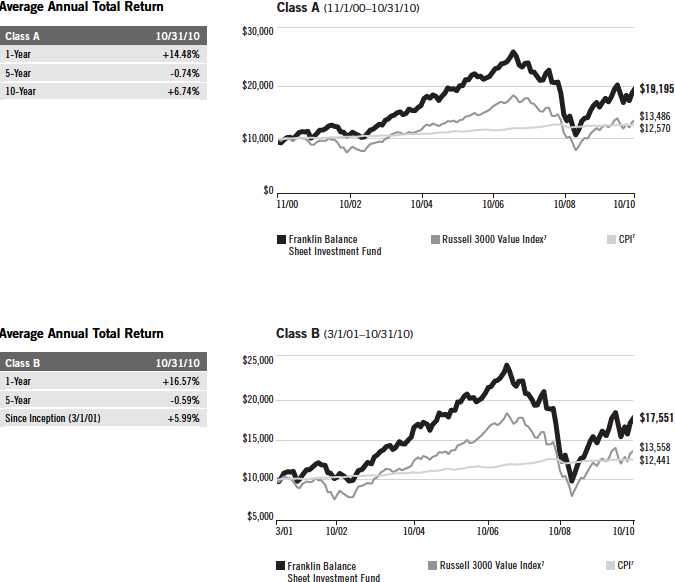
Performance Summary (continued)


Annual Report | 19
Performance Summary (continued)
Total Return Index Comparison for a Hypothetical $10,000 Investment
Total return represents the change in value of an investment over the periods shown. It includes any current, applicable, maximum sales charge, Fund expenses, account fees and reinvested distributions. The unmanaged index includes reinvestment of any income or distributions. It differs from the Fund in composition and does not pay management fees or expenses. One cannot invest directly in an index.
20 | Annual Report

Annual Report | 21
Performance Summary (continued)
Endnotes
Value securities may not increase in price as anticipated or may decline further in value. While smaller and midsize companies may offer substantial opportunities for capital growth, they also involve heightened risks and should be considered speculative. Historically, smaller and midsize company securities have been more volatile in price than larger company securities, especially over the short term. The Fund may invest up to 25% of its total assets in foreign securities, which may involve special risks, including currency fluctuations and economic and political uncertainty. The Fund’s prospectus also includes a description of the main investment risks.
1. Cumulative total return represents the change in value of an investment over the periods indicated.
2. Average annual total return represents the average annual change in value of an investment over the periods indicated.
3. These figures represent the value of a hypothetical $10,000 investment in the Fund over the periods indicated.
4. In accordance with SEC rules, we provide standardized average annual total return information through the latest calendar quarter.
5. Figures are as stated in the Fund’s prospectus current as of the date of this report. In periods of market volatility, assets may decline significantly, causing total annual Fund operating expenses to become higher than the figures shown.
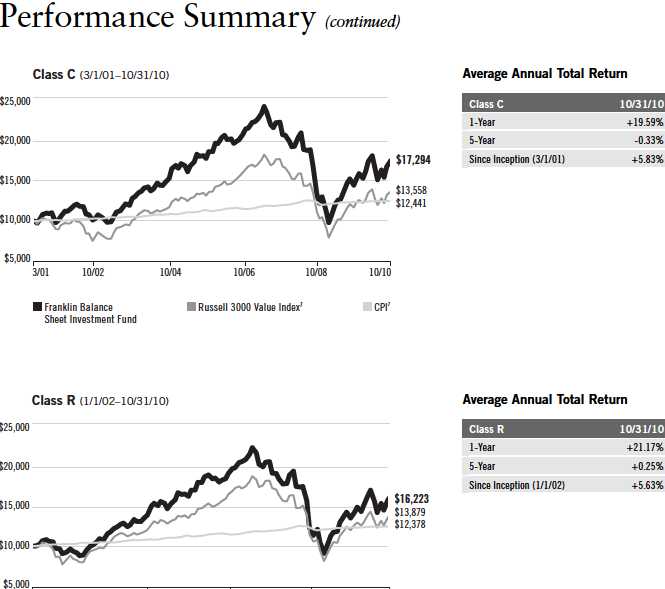
6. Effective 3/1/01, the Fund began offering Advisor Class shares, which do not have sales charges or a Rule 12b-1 plan. Performance quotations for this class reflect the following methods of calculation: (a) For periods prior to 3/1/01, a restated figure is used based upon the Fund’s Class A performance, excluding the effect of Class A’s maximum initial sales charge, but reflecting the effect of the Class A Rule 12b-1 fees; and (b) for periods after 2/28/01, actual Advisor Class performance is used reflecting all charges and fees applicable to that class. Since 3/1/01 (commencement of sales), the cumulative and average annual total returns of Advisor Class shares were +93.20% and +7.05%.
7. Source: © 2010 Morningstar. The Russell 3000 Value Index is market capitalization weighted and measures performance of those Russell 3000 Index companies with lower price-to-book ratios and lower forecasted growth values. The Consumer Price Index (CPI), calculated by the U.S. Bureau of Labor Statistics, is a commonly used measure of the inflation rate.
22 | Annual Report
Your Fund’s Expenses
Franklin Balance Sheet Investment Fund
As a Fund shareholder, you can incur two types of costs:
Transaction costs, including sales charges (loads) on Fund purchases; and
Ongoing Fund costs, including management fees, distribution and service (12b-1) fees, and other Fund expenses. All mutual funds have ongoing costs, sometimes referred to as operating expenses.
The following table shows ongoing costs of investing in the Fund and can help you understand these costs and compare them with those of other mutual funds. The table assumes a $1,000 investment held for the six months indicated.
Actual Fund Expenses
The first line (Actual) for each share class listed in the table provides actual account values and expenses. The “Ending Account Value” is derived from the Fund’s actual return, which includes the effect of Fund expenses.
You can estimate the expenses you paid during the period by following these steps. Of course, your account value and expenses will differ from those in this illustration:
| 1. | Divide your account value by $1,000. |
| | If an account had an $8,600 value, then $8,600 ÷ $1,000 = 8.6. |
| 2. | Multiply the result by the number under the heading “Expenses Paid During Period.” |
| | If Expenses Paid During Period were $7.50, then 8.6 x $7.50 = $64.50. |
In this illustration, the estimated expenses paid this period are $64.50.
Hypothetical Example for Comparison with Other Funds
Information in the second line (Hypothetical) for each class in the table can help you compare ongoing costs of investing in the Fund with those of other mutual funds. This information may not be used to estimate the actual ending account balance or expenses you paid during the period. The hypothetical “Ending Account Value” is based on the actual expense ratio for each class and an assumed 5% annual rate of return before expenses, which does not represent the Fund’s actual return. The figure under the heading “Expenses Paid During Period” shows the hypothetical expenses your account would have incurred under this scenario. You can compare this figure with the 5% hypothetical examples that appear in shareholder reports of other funds.
Annual Report | 23
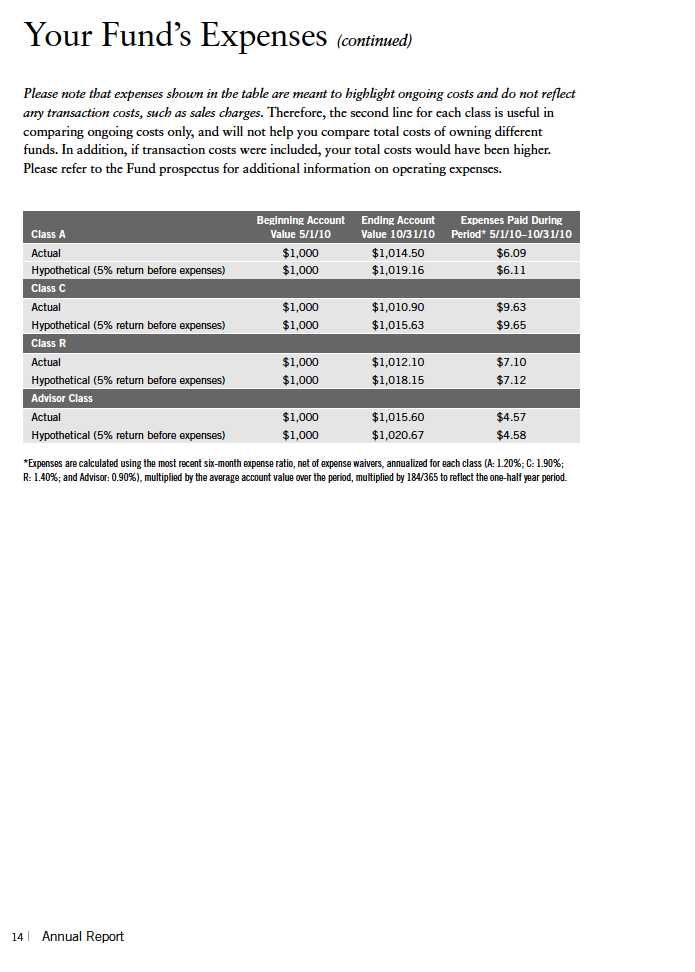
Your Fund’s Expenses (continued)
Please note that expenses shown in the table are meant to highlight ongoing costs and do not reflect any transaction costs, such as sales charges. Therefore, the second line for each class is useful in comparing ongoing costs only, and will not help you compare total costs of owning different funds. In addition, if transaction costs were included, your total costs would have been higher. Please refer to the Fund prospectus for additional information on operating expenses.

*Expenses are calculated using the most recent six-month expense ratio, annualized for each class (A: 0.95%; B: 1.70%; C: 1.70%; R: 1.20%; and Advisor: 0.70%), multiplied by the average account value over the period, multiplied by 184/365 to reflect the one-half year period.
24 | Annual Report

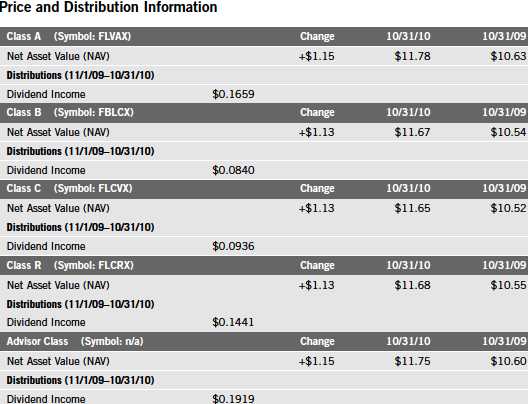
Performance Summary as of 10/31/10
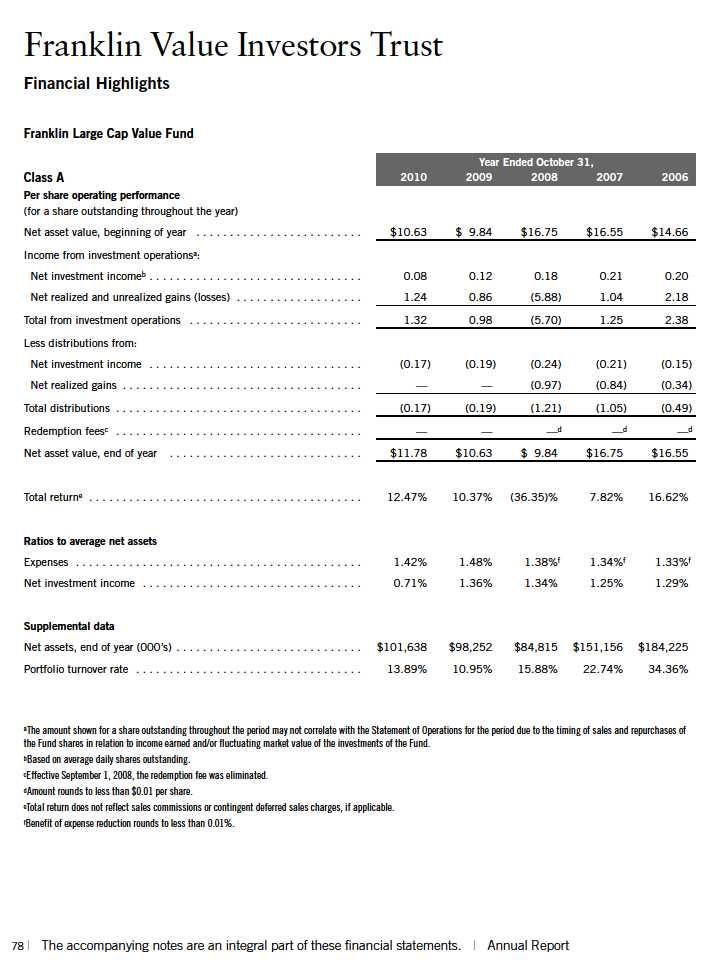
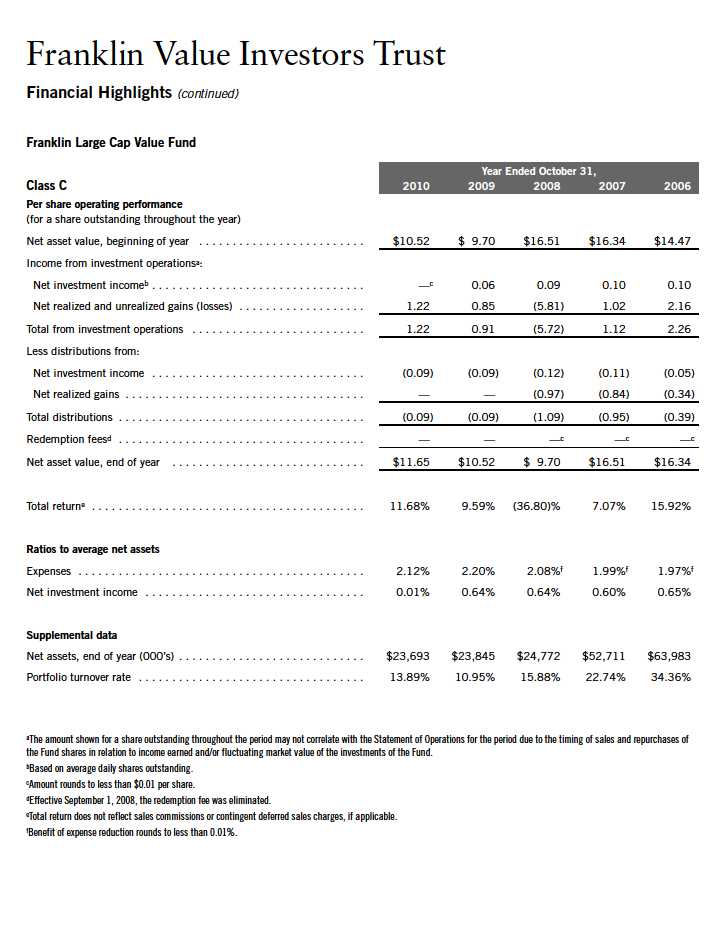
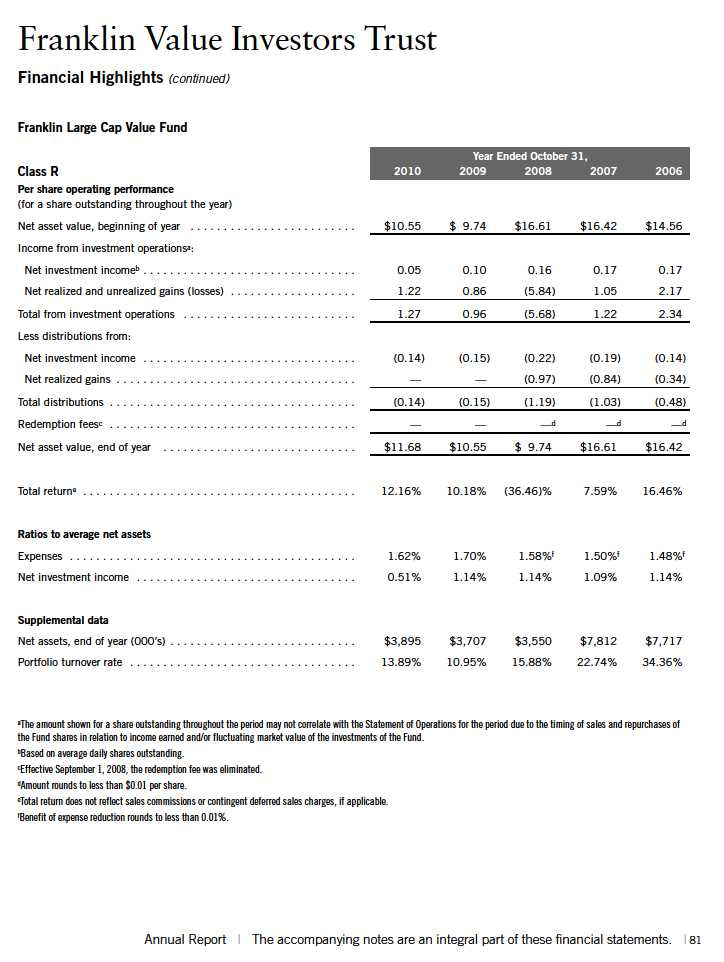
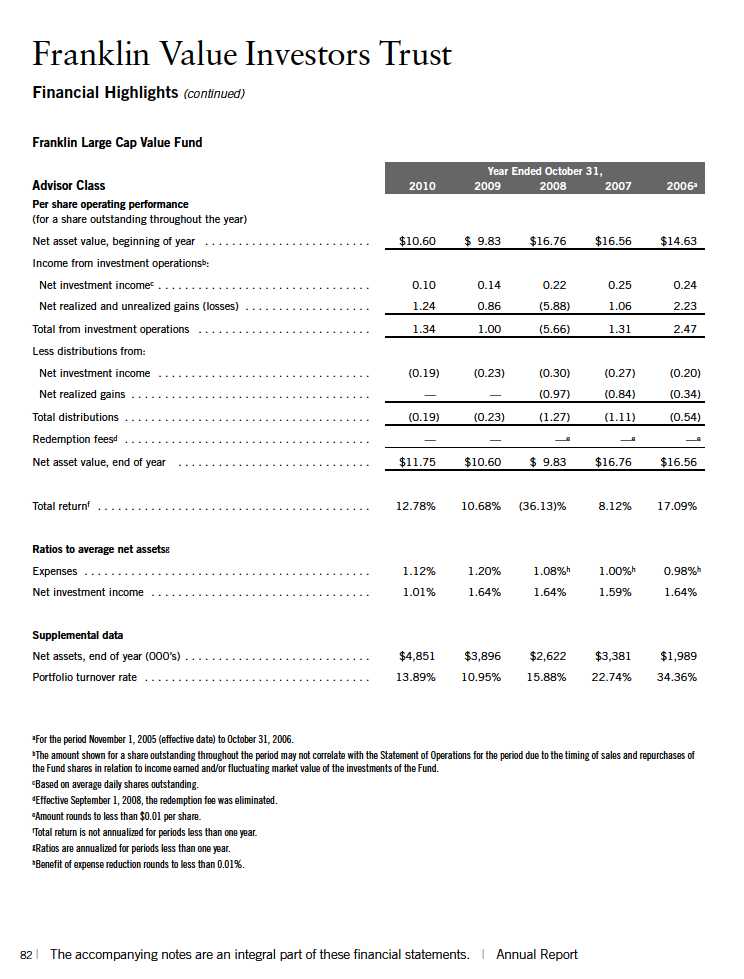
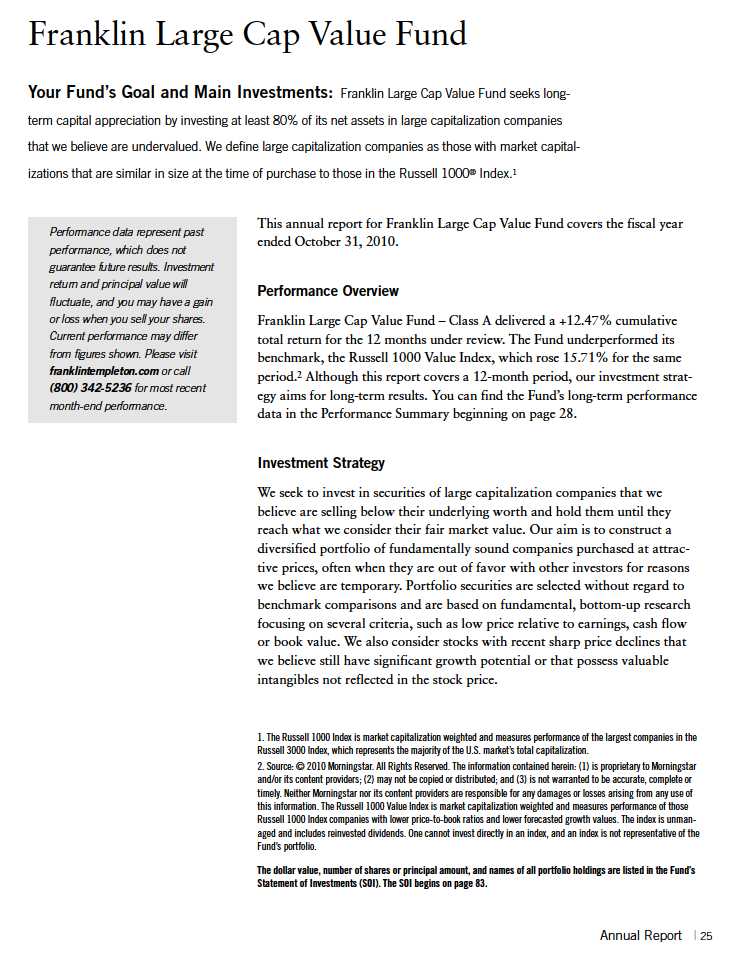
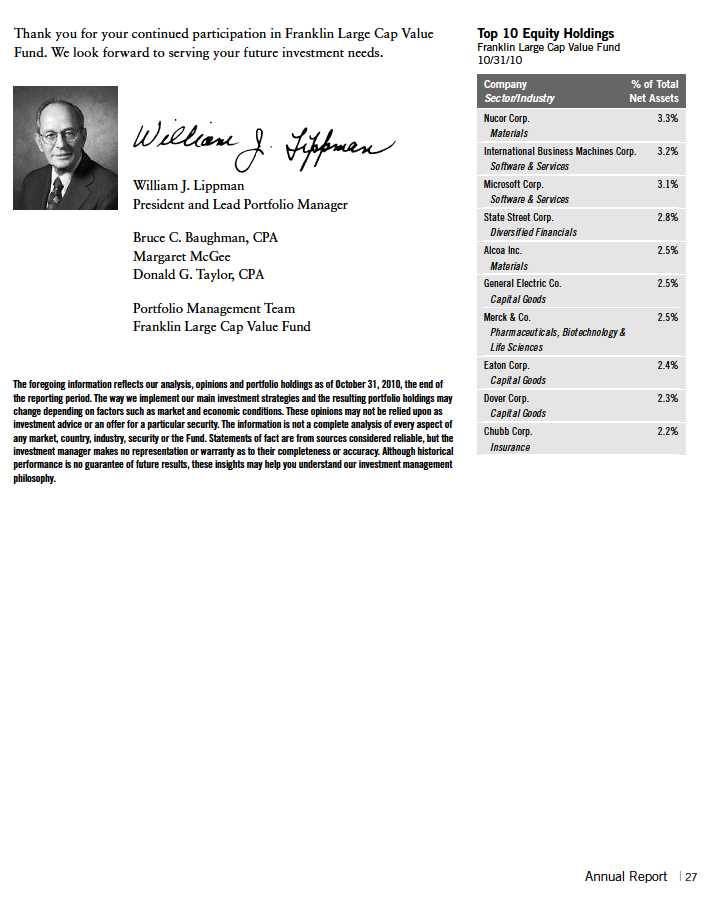
Franklin Large Cap Value Fund
Your dividend income will vary depending on dividends or interest paid by securities in the Fund’s portfolio, adjusted for operating expenses of each class. Capital gain distributions are net profits realized from the sale of portfolio securities. The performance table and graphs do not reflect any taxes that a shareholder would pay on Fund dividends, capital gain distributions, if any, or any realized gains on the sale of Fund shares. Total return reflects reinvestment of the Fund’s dividends and capital gain distributions, if any, and any unrealized gains or losses.
28 | Annual Report
Performance Summary (continued)
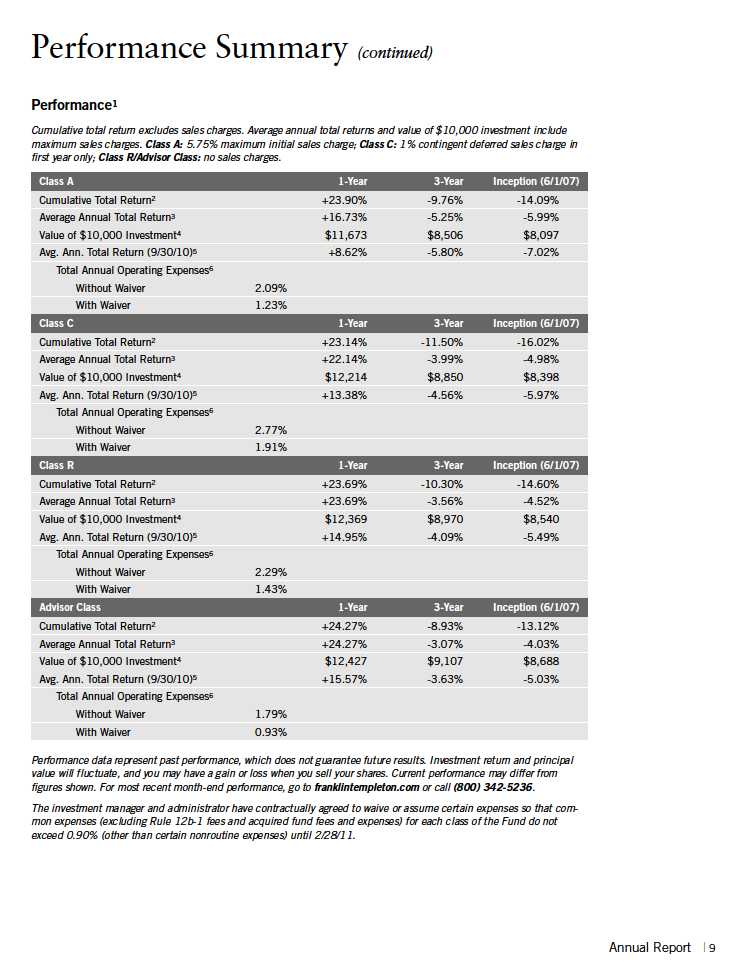
Performance1
Cumulative total return excludes sales charges. Average annual total returns and value of $10,000 investment include maximum sales charges. Class A: 5.75% maximum initial sales charge; Class B: contingent deferred sales charge (CDSC) declining from 4% to 1% over six years, and eliminated thereafter; Class C: 1% CDSC in first year only;
Class R/Advisor Class: no sales charges.
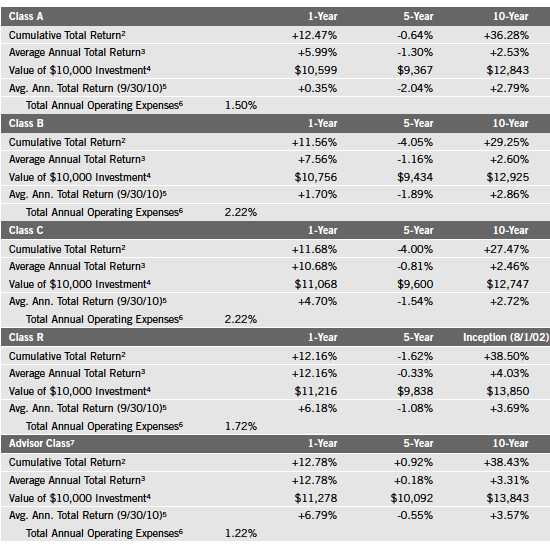
Performance data represent past performance, which does not guarantee f uture results. Investment return and principal value will fluctuate, and you may have a gain or loss when you sell your shares. Current performance may differ from figures shown. For most recent month-end performance, go to franklintempleton.com or call (800) 342-5236.
Annual Report | 29
Performance Summary (continued)
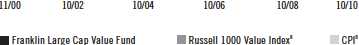
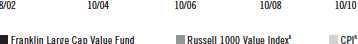
Total Return Index Comparison for a Hypothetical $10,000 Investment1
Total return represents the change in value of an investment over the periods shown. It includes any current, applicable, maximum sales charge, Fund expenses, account fees and reinvested distributions. The unmanaged index includes reinvestment of any income or distributions. It differs from the Fund in composition and does not pay management fees or expenses. One cannot invest directly in an index.

30 | Annual Report

Annual Report | 31

Your Fund’s Expenses
Franklin Large Cap Value Fund
As a Fund shareholder, you can incur two types of costs:
Transaction costs, including sales charges (loads) on Fund purchases; and
Ongoing Fund costs, including management fees, distribution and service (12b-1) fees, and other Fund expenses. All mutual funds have ongoing costs, sometimes referred to as operating expenses.
The following table shows ongoing costs of investing in the Fund and can help you understand these costs and compare them with those of other mutual funds. The table assumes a $1,000 investment held for the six months indicated.
Actual Fund Expenses
The first line (Actual) for each share class listed in the table provides actual account values and expenses. The “Ending Account Value” is derived from the Fund’s actual return, which includes the effect of Fund expenses.
You can estimate the expenses you paid during the period by following these steps. Of course, your account value and expenses will differ from those in this illustration:
| 1. | Divide your account value by $1,000. |
| | If an account had an $8,600 value, then $8,600 ÷ $1,000 = 8.6. |
| 2. | Multiply the result by the number under the heading “Expenses Paid During Period.” |
| | If Expenses Paid During Period were $7.50, then 8.6 x $7.50 = $64.50. |
In this illustration, the estimated expenses paid this period are $64.50.
Hypothetical Example for Comparison with Other Funds
Information in the second line (Hypothetical) for each class in the table can help you compare ongoing costs of investing in the Fund with those of other mutual funds. This information may not be used to estimate the actual ending account balance or expenses you paid during the period. The hypothetical “Ending Account Value” is based on the actual expense ratio for each class and an assumed 5% annual rate of return before expenses, which does not represent the Fund’s actual return. The figure under the heading “Expenses Paid During Period” shows the hypothetical expenses your account would have incurred under this scenario. You can compare this figure with the 5% hypothetical examples that appear in shareholder reports of other funds.
Annual Report | 33
Your Fund’s Expenses (continued)
Please note that expenses shown in the table are meant to highlight ongoing costs and do not reflect any transaction costs, such as sales charges. Therefore, the second line for each class is useful in comparing ongoing costs only, and will not help you compare total costs of owning different funds. In addition, if transaction costs were included, your total costs would have been higher. Please refer to the Fund prospectus for additional information on operating expenses.
*Expenses are calculated using the most recent six-month expense ratio, annualized for each class (A: 1.41%; B: 2.10%; C: 2.10%; R: 1.60%; and Advisor: 1.10%), multiplied by the average account value over the period, multiplied by 184/365 to reflect the one-half year period.
34 | Annual Report
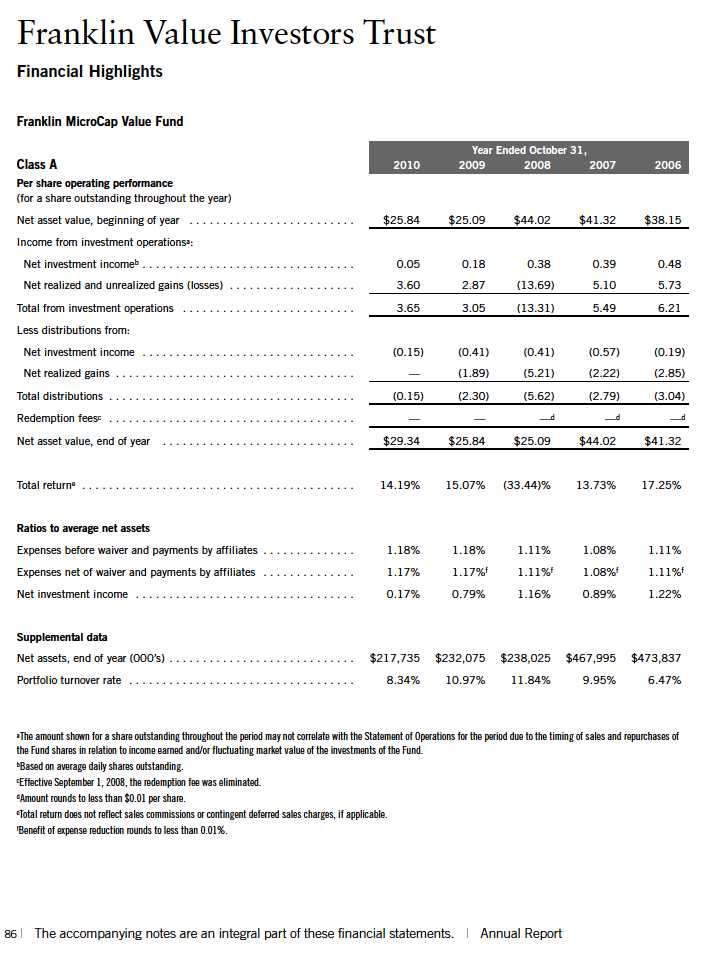
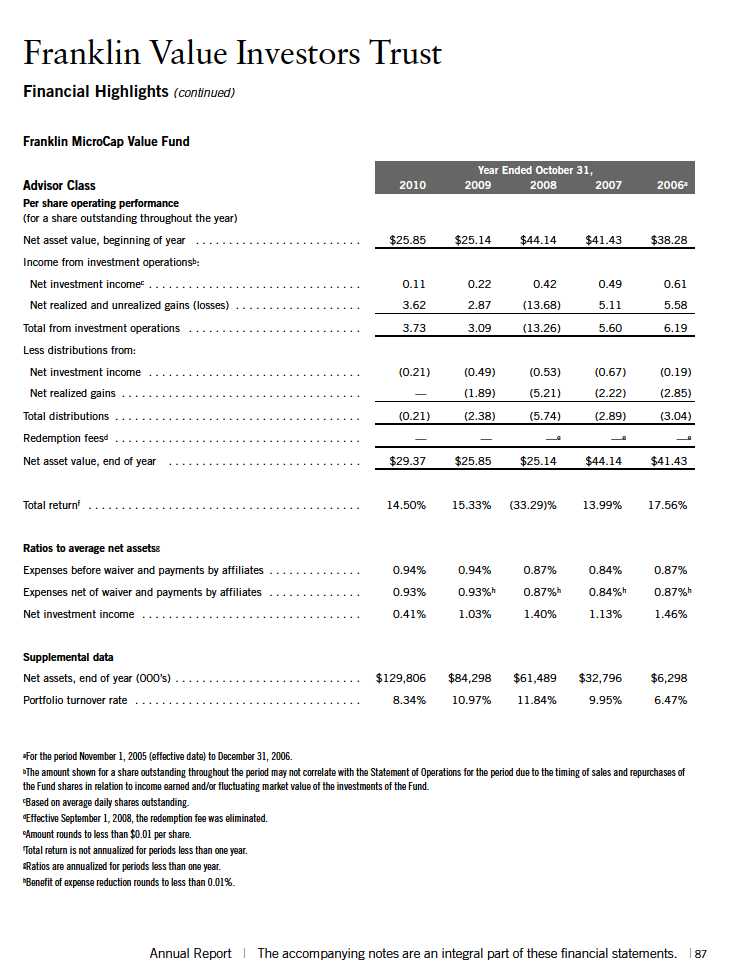
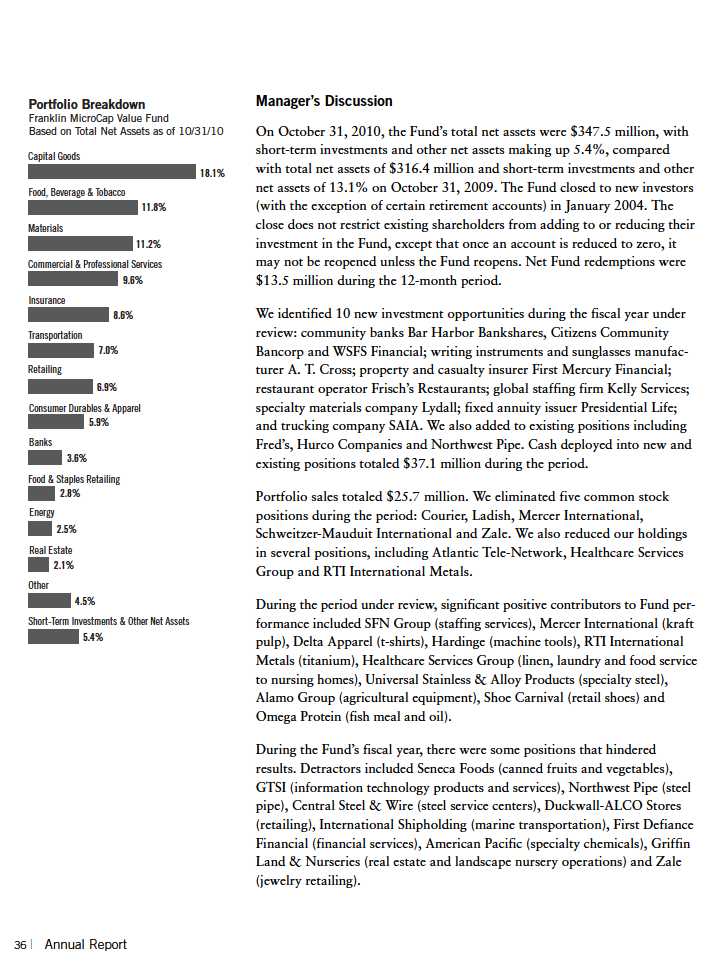
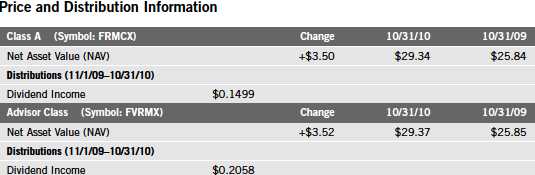
Franklin MicroCap Value Fund
Your Fund’s Goal and Main Investments: Franklin MicroCap Value Fund seeks high total return, of which capital appreciation and income are components, by investing at least 80% of its net assets in securities of companies with market capitalizations under $400 million at the time of purchase, which we believe are undervalued in the marketplace.
Performance data represent past performance, which does not guarantee future results. Investment return and principal value will fluctuate, and you may have a gain or loss when you sell your shares. Current performance may differ from figures shown. Please visit franklintempleton.com or call (800) 342-5236 for most recent month-end performance.
This annual report for Franklin MicroCap Value Fund covers the fiscal year ended October 31, 2010.
Performance Overview
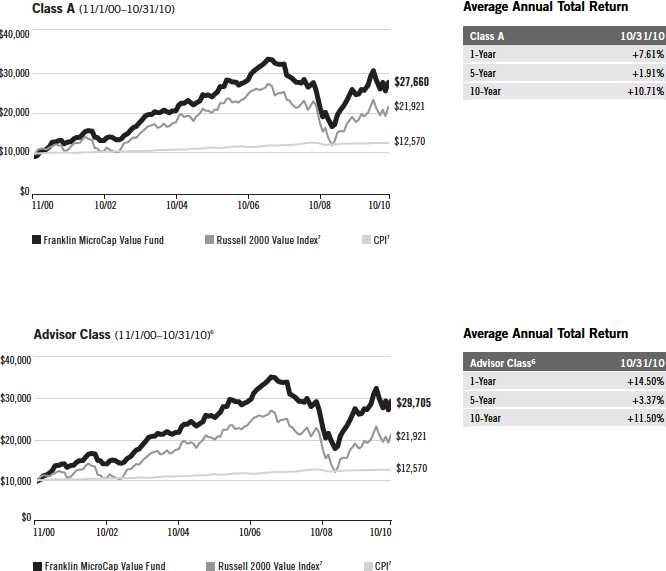
Franklin MicroCap Value Fund – Class A delivered a +14.19% cumulative total return for the 12 months under review. The Fund underperformed its benchmark, the Russell 2000® Value Index, which rose 24.43% for the same period.1 Although this report covers a 12-month period, our investment strategy aims for long-term results. You can find the Fund’s long-term performance data in the Performance Summary beginning on page 38.
Investment Strategy
Our strategy is to buy shares of financially sound, well-established companies at a low price-to-book value, where we have reasonable confidence that book value will increase over several years. We limit purchases to companies with market capitalizations of less than $400 million, which we define as “microcap.” Book value per share is a company’s net worth or shareholders’ equity on an accounting or “book” basis, divided by shares outstanding. This strategy is not aimed at short-term trading gains, nor do we consider the composition of any index. Rather, we try to identify individual companies that meet our investment criteria, and we assume at purchase that we will hold the positions for several years.
1. Source: © 2010 Morningstar. All Rights Reserved. The information contained herein: (1) is proprietary to Morningstar and/or its content providers; (2) may not be copied or distributed; and (3) is not warranted to be accurate, complete or timely. Neither Morningstar nor its content providers are responsible for any damages or losses arising from any use of this information. The Russell 2000 Value Index is a market-capitalization weighted index that measures the performance of those Russell 2000 Index companies with lower price-to-book ratios and lower forecasted growth values. The index is unmanaged and includes reinvested dividends. One cannot invest directly in an index, and an index is not representative of the Fund’s portfolio.
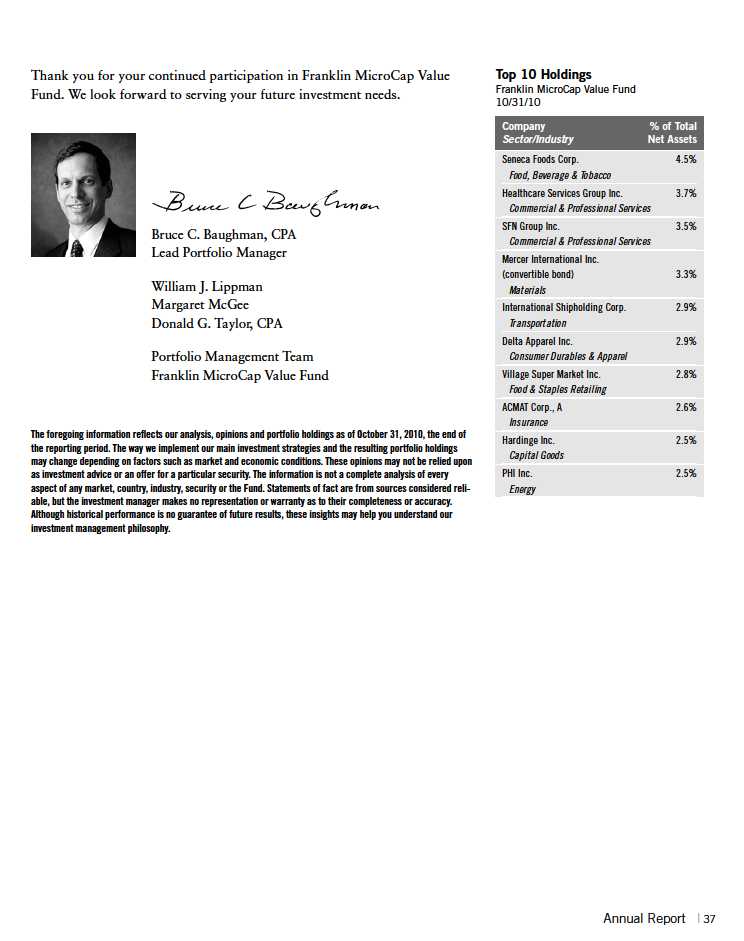
The dollar value, number of shares or principal amount, and names of all portfolio holdings are listed in the Fund’s Statement of Investments (SOI). The SOI begins on page 88.
Annual Report | 35
Performance Summary as of 10/31/10
Franklin MicroCap Value Fund
Your dividend income will vary depending on dividends or interest paid by securities in the Fund’s portfolio, adjusted for operating expenses of each class. Capital gain distributions are net profits realized from the sale of portfolio securities. The performance table and graphs do not reflect any taxes that a shareholder would pay on Fund dividends, capital gain distributions, if any, or any realized gains on the sale of Fund shares. Total return reflects reinvestment of the Fund’s dividends and capital gain distributions, if any, and any unrealized gains or losses.
Performance
Cumulative total return excludes sales charges. Average annual total returns and value of $10,000 investment include maximum sales charges. Class A: 5.75% maximum initial sales charge; Advisor Class: no sales charges.

Performance data represent past performance, which does not guarantee f uture results. Investment return and principal value will fluctuate, and you may have a gain or loss when you sell your shares. Current performance may differ from figures shown. For most recent month-end performance, go to franklintempleton.com or call (800) 342-5236.
38 | Annual Report
Performance Summary (continued)
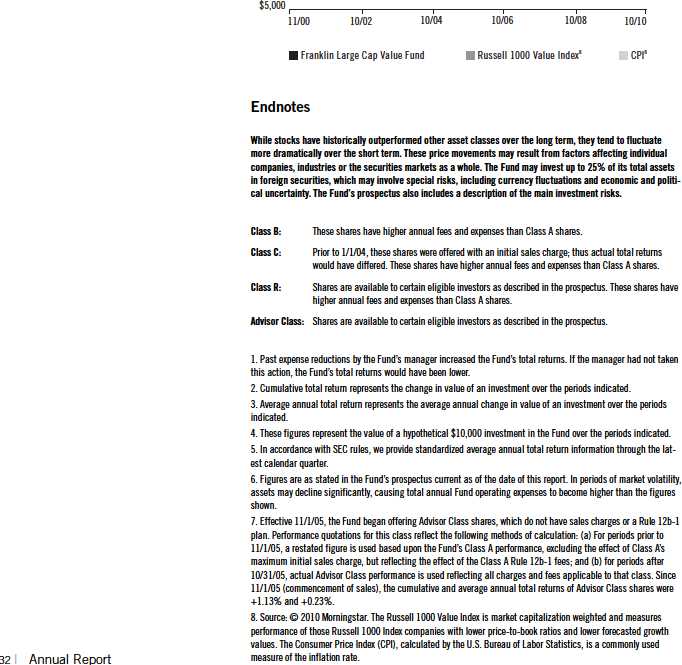
Total Return Index Comparison for a Hypothetical $10,000 Investment
Total return represents the change in value of an investment over the periods shown. It includes any applicable maximum sales charge, Fund expenses, account fees and reinvested distributions. The unmanaged index includes reinvestment of any income or distributions. It differs from the Fund in composition and does not pay management fees or expenses. One cannot invest directly in an index.
Annual Report | 39
Performance Summary (continued)
Endnotes
The Fund’s ability to invest in smaller company securities that may have limited liquidity involves additional risks, such as relatively small revenues, limited product lines and small market share. Historically, these stocks have exhibited greater price volatility than larger company stocks, especially over the short term. In addition, the Fund may invest up to 25% of its total assets in foreign securities, which involve special risks, including currency fluctuations and economic and political uncertainty. The Fund’s prospectus also includes a description of the main investment risks.
Advisor Class: Shares are available to certain eligible investors as described in the prospectus.
1. Cumulative total return represents the change in value of an investment over the periods indicated.
2. Average annual total return represents the average annual change in value of an investment over the periods indicated. 3. These figures represent the value of a hypothetical $10,000 investment in the Fund over the periods indicated.
4. In accordance with SEC rules, we provide standardized average annual total return information through the latest calendar quarter.
5. Figures are as stated in the Fund’s prospectus current as of the date of this report. In periods of market volatility, assets may decline significantly, causing total annual Fund operating expenses to become higher than the figures shown.
6. Effective 11/1/05, the Fund began offering Advisor Class shares, which do not have sales charges or a Rule 12b-1 plan. Performance quotations for this class reflect the following methods of calculation: (a) For periods prior to 11/1/05, a restated figure is used based upon the Fund’s Class A performance, excluding the effect of Class A’s maximum initial sales charge, but reflecting the effect of the Class A Rule 12b-1 fees; and (b) for periods after 10/31/05, actual Advisor Class performance is used reflecting all charges and fees applicable to that class. Since 11/1/05 (commencement of sales), the cumulative and average annual total returns of Advisor Class shares were +17.65% and +3.31%.
7. Source: © 2010 Morningstar. The Russell 2000 Value Index is market capitalization weighted and measures performance of those Russell 2000 Index companies with lower price-to-book ratios and lower forecasted growth values. The Consumer Price Index (CPI), calculated by the U.S. Bureau of Labor Statistics, is a commonly used measure of the inflation rate.
40 | Annual Report
Your Fund’s Expenses
Franklin MicroCap Value Fund
As a Fund shareholder, you can incur two types of costs:
Transaction costs, including sales charges (loads) on Fund purchases; and
Ongoing Fund costs, including management fees, distribution and service (12b-1) fees, and other Fund expenses. All mutual funds have ongoing costs, sometimes referred to as operating expenses.
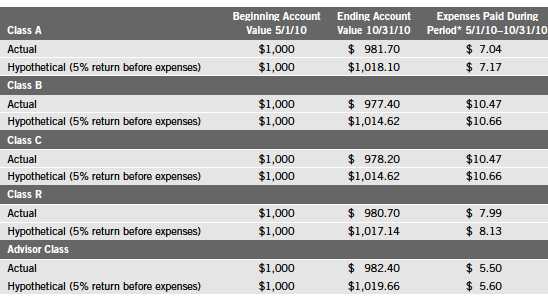
The following table shows ongoing costs of investing in the Fund and can help you understand these costs and compare them with those of other mutual funds. The table assumes a $1,000 investment held for the six months indicated.
Actual Fund Expenses
The first line (Actual) for each share class listed in the table provides actual account values and expenses. The “Ending Account Value” is derived from the Fund’s actual return, which includes the effect of Fund expenses.
You can estimate the expenses you paid during the period by following these steps. Of course, your account value and expenses will differ from those in this illustration:
| 1. | Divide your account value by $1,000. |
| | If an account had an $8,600 value, then $8,600 ÷ $1,000 = 8.6. |
| 2. | Multiply the result by the number under the heading “Expenses Paid During Period.” |
| | If Expenses Paid During Period were $7.50, then 8.6 x $7.50 = $64.50. |
In this illustration, the estimated expenses paid this period are $64.50.
Hypothetical Example for Comparison with Other Funds
Information in the second line (Hypothetical) for each class in the table can help you compare ongoing costs of investing in the Fund with those of other mutual funds. This information may not be used to estimate the actual ending account balance or expenses you paid during the period. The hypothetical “Ending Account Value” is based on the actual expense ratio for each class and an assumed 5% annual rate of return before expenses, which does not represent the Fund’s actual return. The figure under the heading “Expenses Paid During Period” shows the hypothetical expenses your account would have incurred under this scenario. You can compare this figure with the 5% hypothetical examples that appear in shareholder reports of other funds.
Annual Report | 41
Your Fund’s Expenses (continued)
Please note that expenses shown in the table are meant to highlight ongoing costs and do not reflect any transaction costs, such as sales charges. Therefore, the second line for each class is useful in comparing ongoing costs only, and will not help you compare total costs of owning different funds. In addition, if transaction costs were included, your total costs would have been higher. Please refer to the Fund prospectus for additional information on operating expenses.
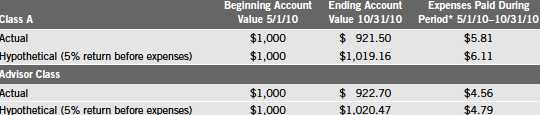
*Expenses are calculated using the most recent six-month expense ratio, net of expense waivers, annualized for each class (A: 1.20% and Advisor: 0.94%), multiplied by the average account value over the period, multiplied by 184/365 to reflect the one-half year period.
42 | Annual Report

Performance Summary as of 10/31/10
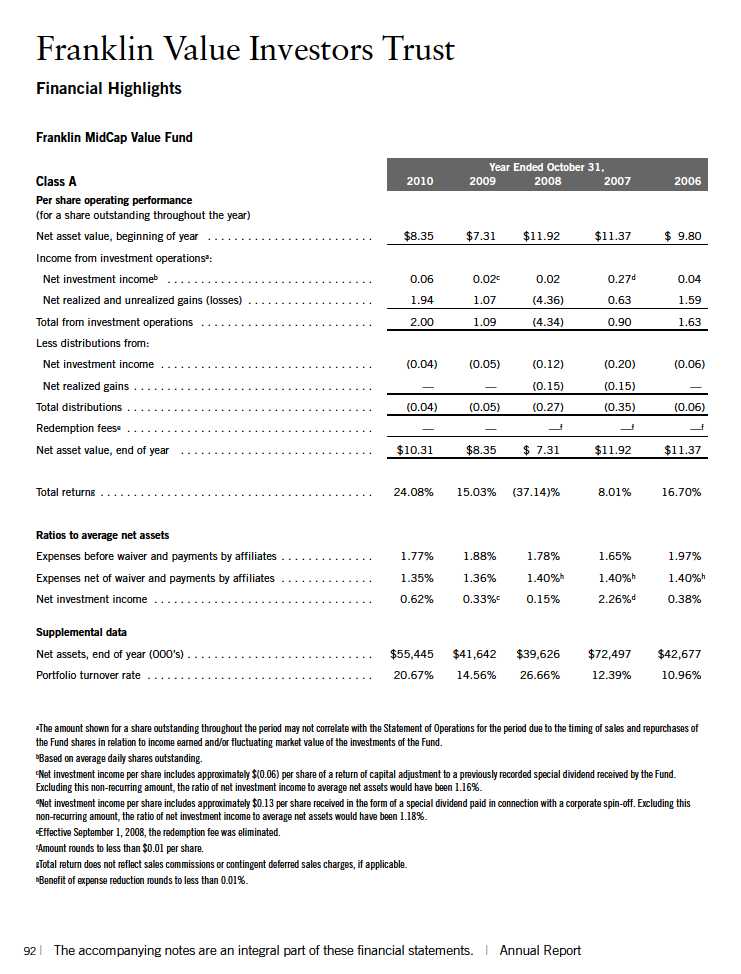
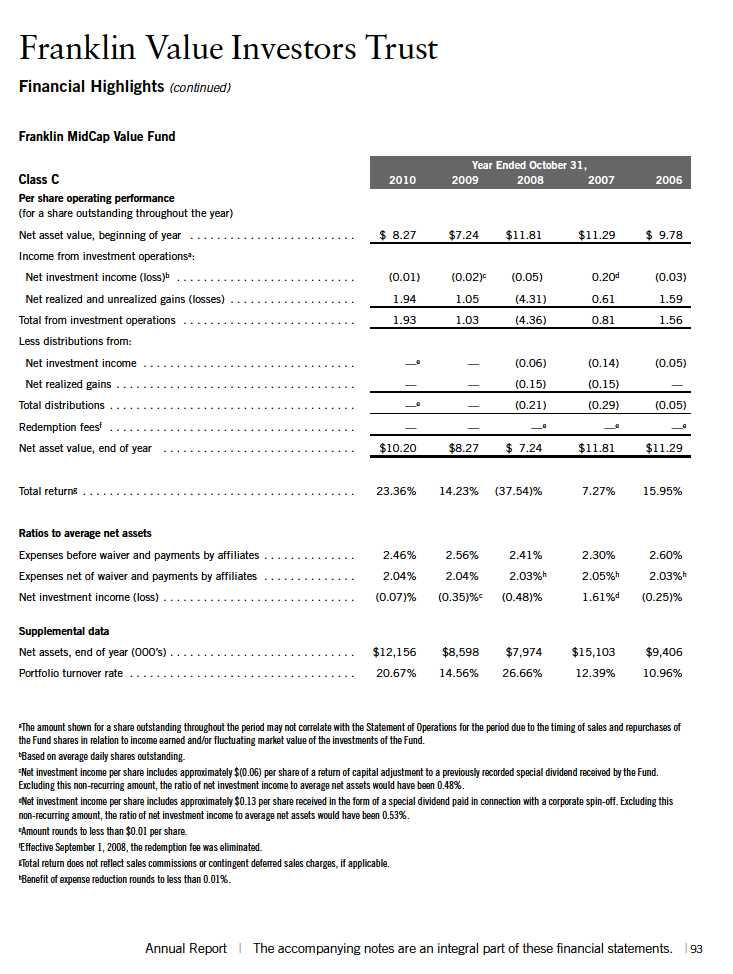
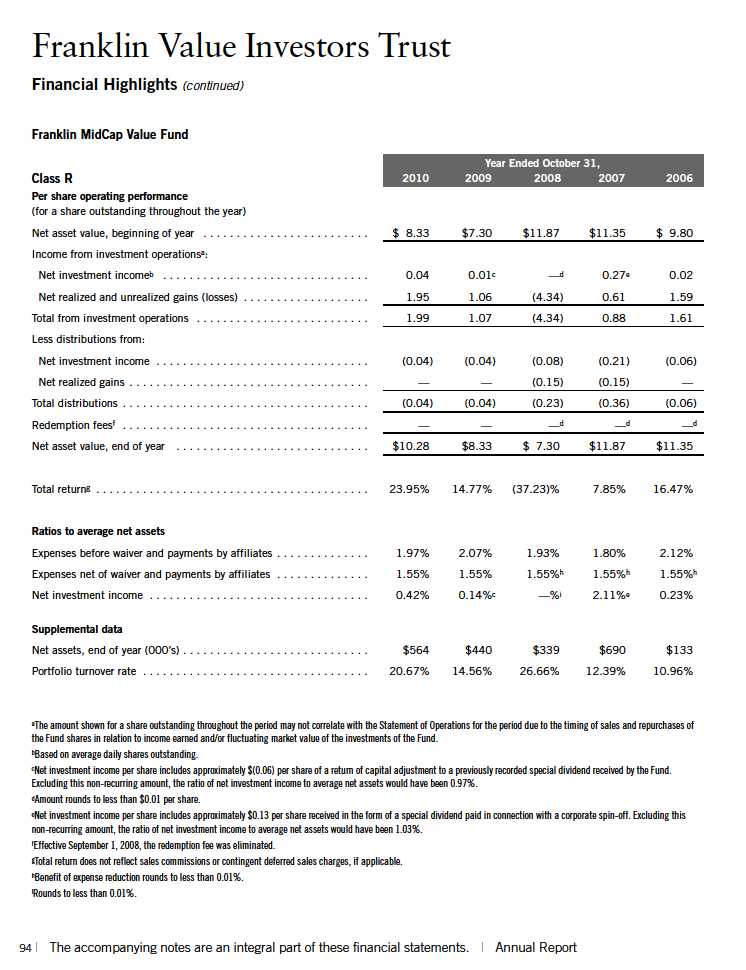
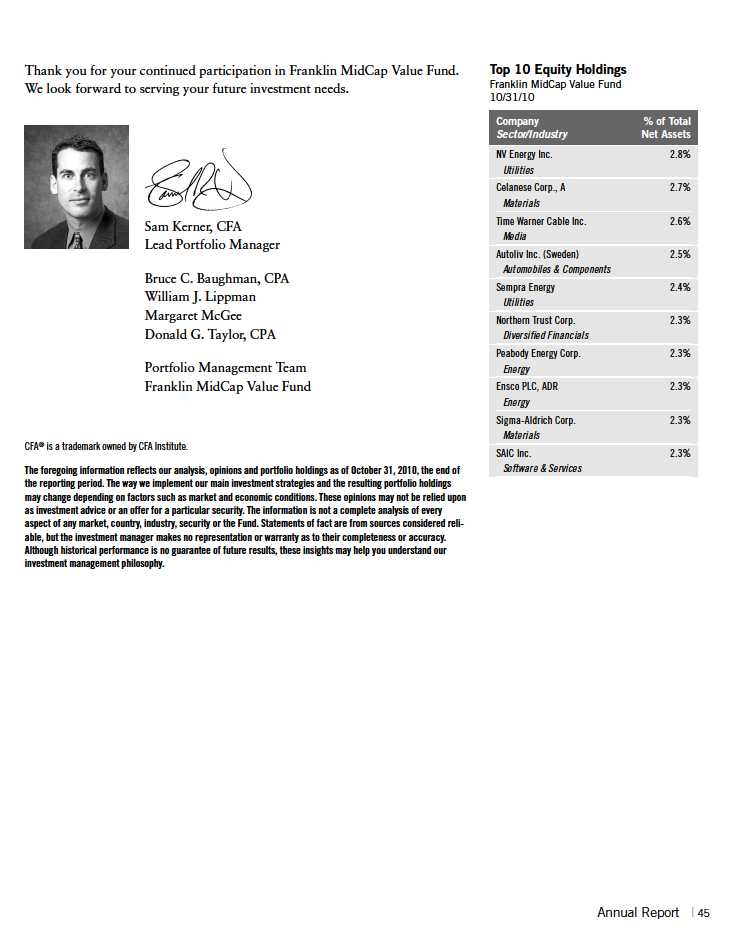
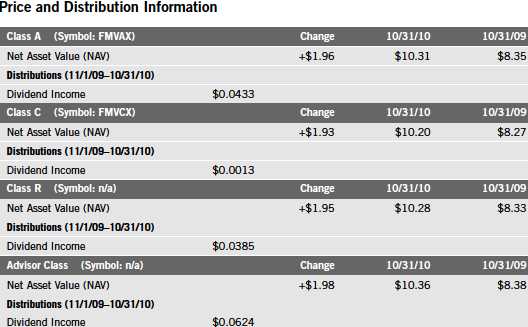
Franklin MidCap Value Fund
Your dividend income will vary depending on dividends or interest paid by securities in the Fund’s portfolio, adjusted for operating expenses of each class. Capital gain distributions are net profits realized from the sale of portfolio securities. The performance table and graphs do not reflect any taxes that a shareholder would pay on Fund dividends, capital gain distributions, if any, or any realized gains on the sale of Fund shares. Total return reflects reinvestment of the Fund’s dividends and capital gain distributions, if any, and any unrealized gains or losses.
46 | Annual Report
Performance Summary (continued)
Performance1
Cumulative total return excludes sales charges. Average annual total returns and value of $10,000 investment include maximum sales charges. Class A: 5.75% maximum initial sales charge; Class C: 1% co ntingent deferred sales charge in first year only; Class R/Advisor Class: no sales charges.
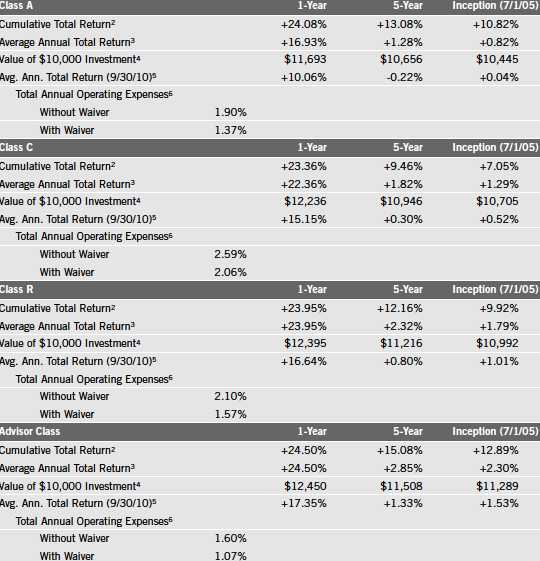
Performance data represent past performance, which does not guarantee f uture results. Investment return and principal value will fluctuate, and you may have a gain or loss when you sell your shares. Current performance may differ from figures shown. For most recent month-end performance, go to franklintempleton.com or call (800) 342-5236.
The investment manager and administrator have contractually agreed to waive or assume certain expenses so that common expenses (excluding Rule 12b-1 fees and acquired fund fees and expenses) for each class of the Fund do not exceed 1.05% (other than certain nonroutine expenses) until 2/28/11.
Annual Report | 47
Performance Summary (continued)
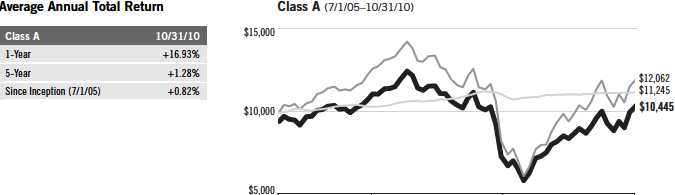
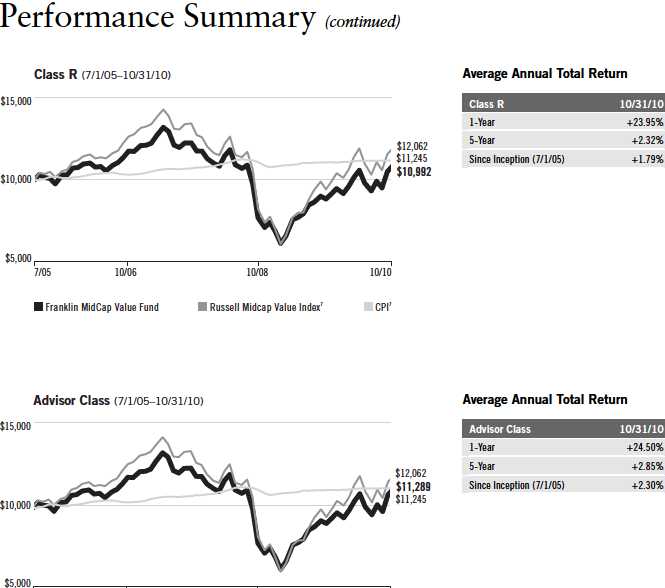
Total Return Index Comparison for a Hypothetical $10,000 Investment1
Total return represents the change in value of an investment over the periods shown. It includes any applicable maximum sales charge, Fund expenses, account fees and reinvested distributions. The unmanaged index includes reinvestment of any income or distributions. It differs from the Fund in composition and does not pay management fees or expenses. One cannot invest directly in an index.

48 | Annual Report
Annual Report | 49
Performance Summary (continued)
Endnotes
While stocks have historically outperformed other asset classes over the long term, they tend to fluctuate more dramatically over the short term. Historically, midsize company securities have been more volatile in price than larger company securities, especially over the short term. Midsize companies may be more susceptible to particular economic events or competitive factors than are larger, more broadly diversified companies. In addition, the Fund may invest up to 25% of its total assets in foreign securities, which involve special risks, including currency fluctuations and economic and political uncertainty. The Fund’s prospectus also includes a description of the main investment risks.
| |
Class C: Class R: | These shares have higher annual fees and expenses than Class A shares. Shares are available to certain eligible investors as described in the prospectus. These shares have higher annual fees and expenses than Class A shares. |
Advisor Class: | Shares are available to certain eligible investors as described in the prospectus. |
1. If the manager and administrator had not waived fees, the Fund’s total returns would have been lower. 2. Cumulative total return represents the change in value of an investment over the periods indicated.
3. Average annual total return represents the average annual change in value of an investment over the periods indicated. 4. These figures represent the value of a hypothetical $10,000 investment in the Fund over the periods indicated.
5. In accordance with SEC rules, we provide standardized average annual total return information through the latest calendar quarter.
6. Figures are as stated in the Fund’s prospectus current as of the date of this report. In periods of market volatility, assets may decline significantly, causing total annual Fund operating expenses to become higher than the figures shown.
7. Source: © 2010 Morningstar. The Russell Midcap Value Index is market capitalization weighted and measures performance of those Russell Midcap Index companies with lower price-to-book ratios and lower forecasted growth values. The Consumer Price Index (CPI), calculated by the U.S. Bureau of Labor Statistics, is a commonly used measure of the inflation rate.
50 | Annual Report
Your Fund’s Expenses
Franklin MidCap Value Fund
As a Fund shareholder, you can incur two types of costs:
Transaction costs, including sales charges (loads) on Fund purchases; and
Ongoing Fund costs, including management fees, distribution and service (12b-1) fees, and other Fund expenses. All mutual funds have ongoing costs, sometimes referred to as operating expenses.
The following table shows ongoing costs of investing in the Fund and can help you understand these costs and compare them with those of other mutual funds. The table assumes a $1,000 investment held for the six months indicated.
Actual Fund Expenses
The first line (Actual) for each share class listed in the table provides actual account values and expenses. The “Ending Account Value” is derived from the Fund’s actual return, which includes the effect of Fund expenses.
You can estimate the expenses you paid during the period by following these steps. Of course, your account value and expenses will differ from those in this illustration:
| 1. | Divide your account value by $1,000. |
| | If an account had an $8,600 value, then $8,600 ÷ $1,000 = 8.6. |
| 2. | Multiply the result by the number under the heading “Expenses Paid During Period.” |
| | If Expenses Paid During Period were $7.50, then 8.6 x $7.50 = $64.50. |
In this illustration, the estimated expenses paid this period are $64.50.
Hypothetical Example for Comparison with Other Funds
Information in the second line (Hypothetical) for each class in the table can help you compare ongoing costs of investing in the Fund with those of other mutual funds. This information may not be used to estimate the actual ending account balance or expenses you paid during the period. The hypothetical “Ending Account Value” is based on the actual expense ratio for each class and an assumed 5% annual rate of return before expenses, which does not represent the Fund’s actual return. The figure under the heading “Expenses Paid During Period” shows the hypothetical expenses your account would have incurred under this scenario. You can compare this figure with the 5% hypothetical examples that appear in shareholder reports of other funds.
Annual Report | 51
Your Fund’s Expenses (continued)
Please note that expenses shown in the table are meant to highlight ongoing costs and do not reflect any transaction costs, such as sales charges. Therefore, the second line for each class is useful in comparing ongoing costs only, and will not help you compare total costs of owning different funds. In addition, if transaction costs were included, your total costs would have been higher. Please refer to the Fund prospectus for additional information on operating expenses.

*Expenses are calculated using the most recent six-month expense ratio, net of expense waivers, annualized for each class (A: 1.35%; C: 2.05%; R: 1.55%; and Advisor: 1.05%), multiplied by the average account value over the period, multiplied by 184/365 to reflect the one-half year period.
52 | Annual Report
Performance Summary as of 10/31/10
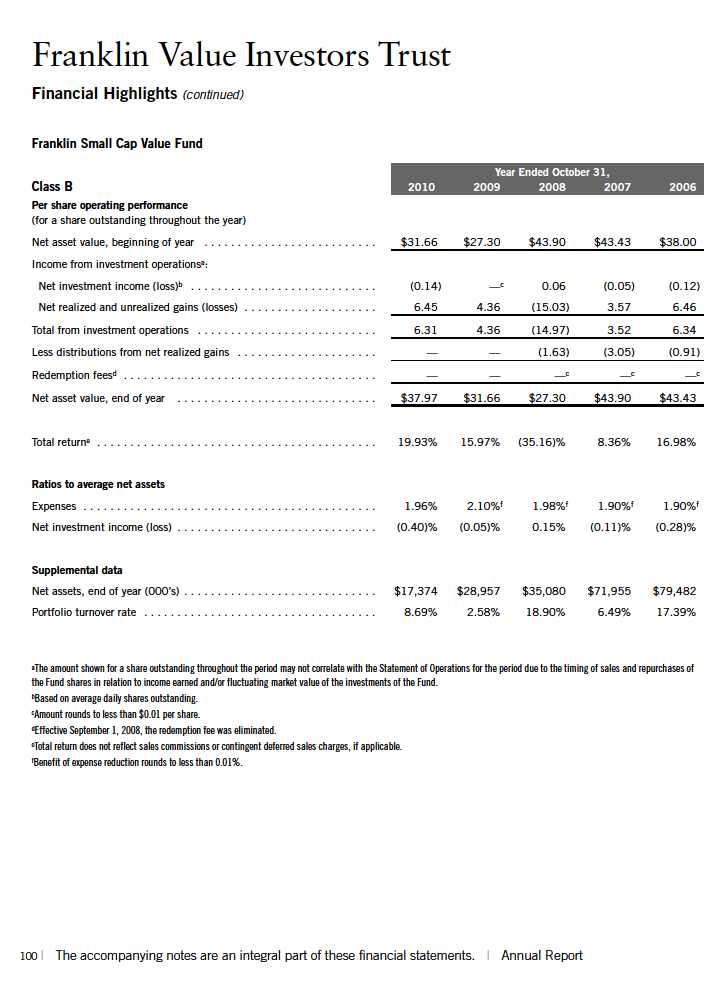
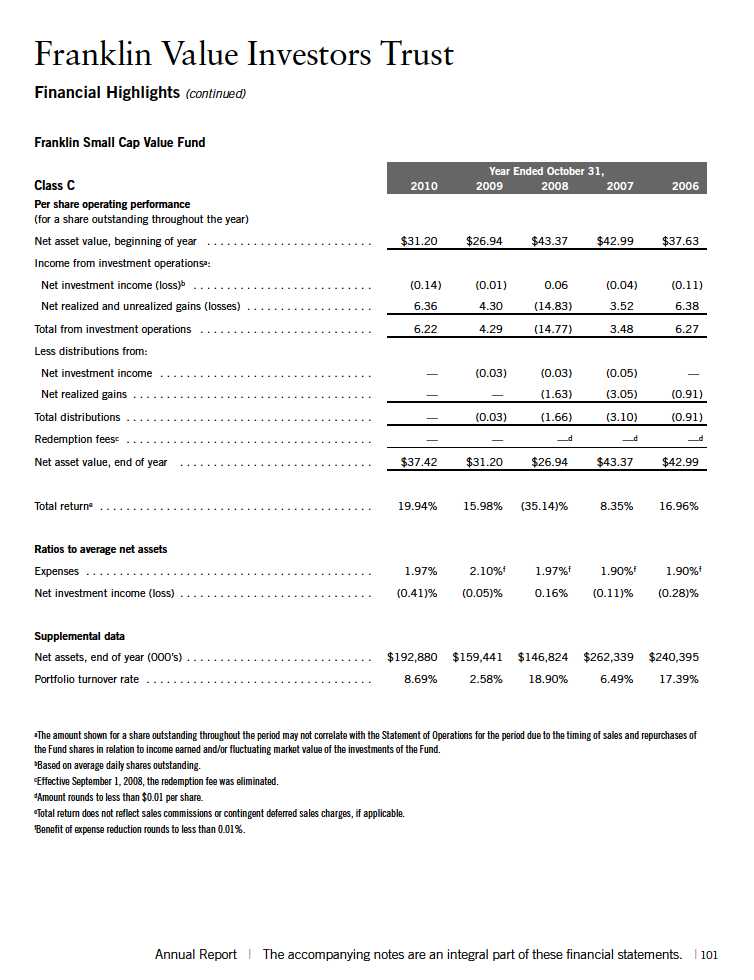
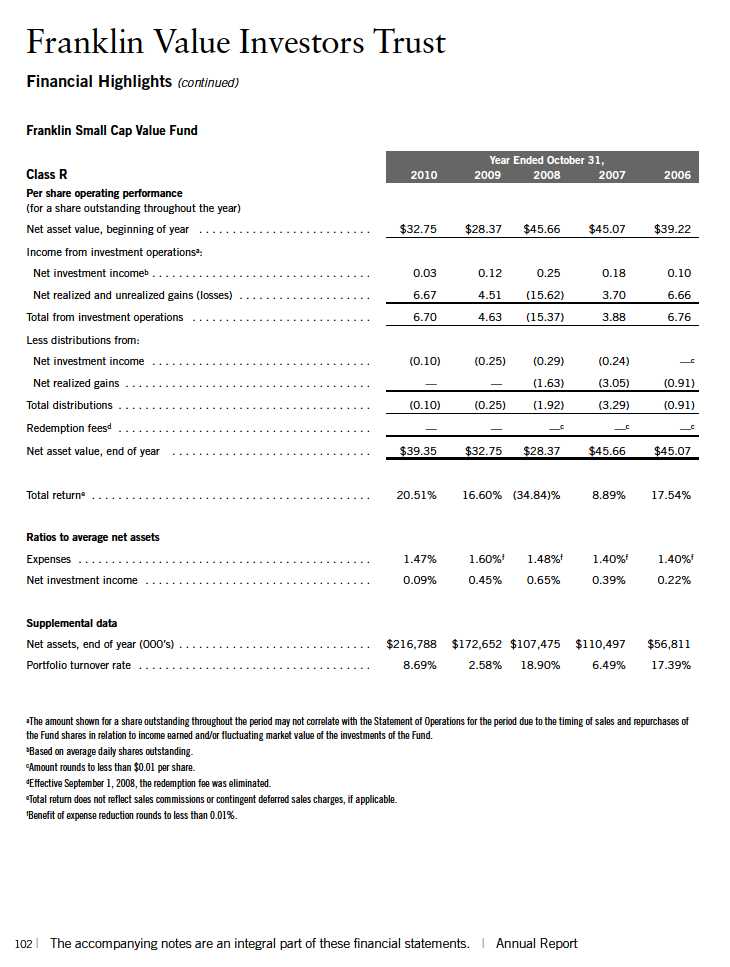
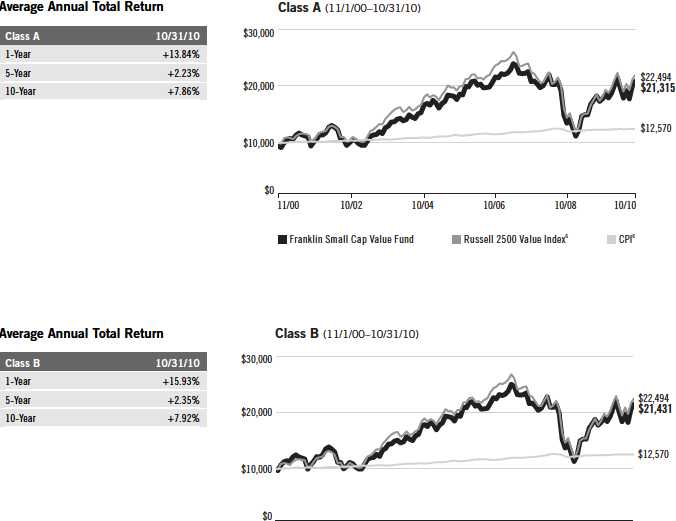
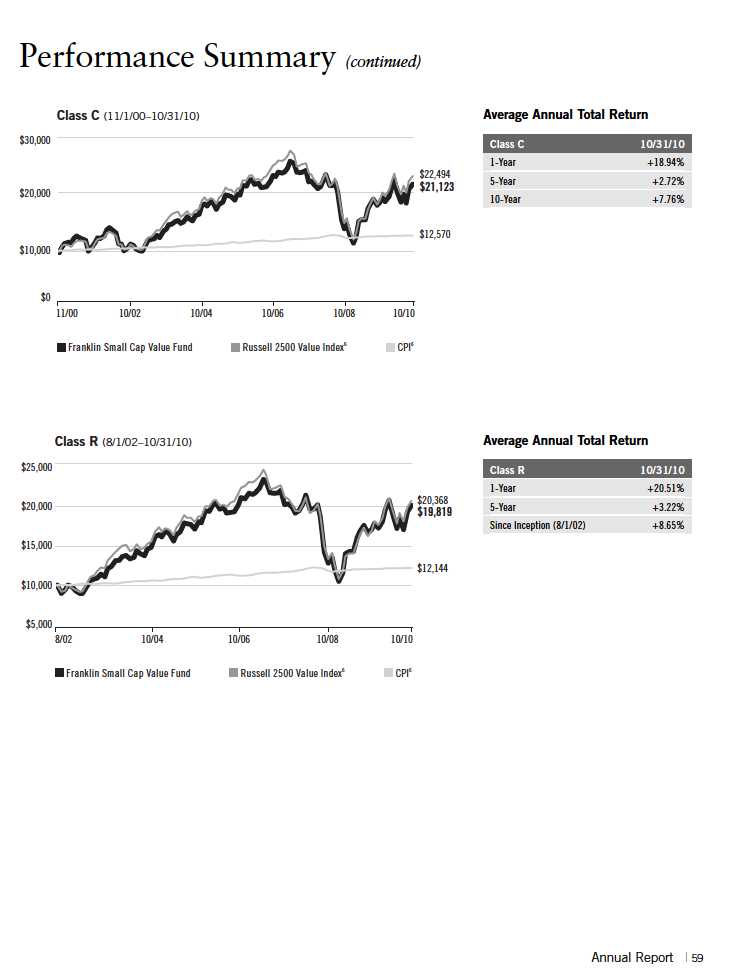
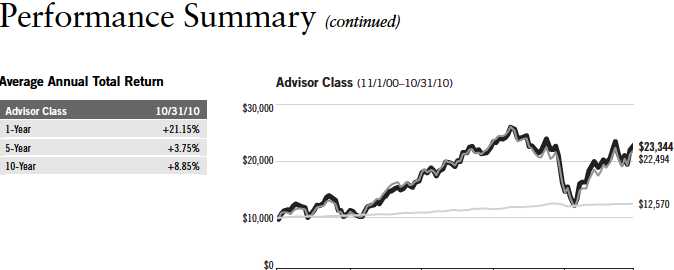
Franklin Small Cap Value Fund
Your dividend income will vary depending on dividends or interest paid by securities in the Fund’s portfolio, adjusted for operating expenses of each class. Capital gain distributions are net profits realized from the sale of portfolio securities. The performance table and graphs do not reflect any taxes that a shareholder would pay on Fund dividends, capital gain distributions, if any, or any realized gains on the sale of Fund shares. Total return reflects reinvestment of the Fund’s dividends and capital gain distributions, if any, and any unrealized gains or losses.
56 | Annual Report
Performance Summary (continued)
Performance
Cumulative total return excludes sales charges. Average annual total returns and value of $10,000 investment include maximum sales charges. Class A: 5.75% maximum initial sales charge; Class B: contingent deferred sales charge (CDSC) declining from 4% to 1% over six years, and eliminated thereafter; Class C: 1% CDSC in first year only;
Class R/Advisor Class: no sales charges.

Performance data represent past performance, which does not guarantee f uture results. Investment return and principal value will fluctuate, and you may have a gain or loss when you sell your shares. Current performance may differ from figures shown. For most recent month-end performance, go to franklintempleton.com or call (800) 342-5236.
Annual Report | 57
Performance Summary (continued)
Total Return Index Comparison for a Hypothetical $10,000 Investment
Total return represents the change in value of an investment over the periods shown. It includes any current, applicable, maximum sales charge, Fund expenses, account fees and reinvested distributions. The unmanaged index includes reinvestment of any income or distributions. It differs from the Fund in composition and does not pay management fees or expenses. One cannot invest directly in an index.

58 | Annual Report
Endnotes
The Fund’s investments in smaller company stocks carry special risks as such stocks have historically exhibited greater price volatility than larger company stocks, particularly over the short term. Additionally, smaller companies often have relatively small revenues, limited product lines and small market share. In addition, the Fund may invest up to 25% of its total assets in foreign securities, which involve special risks, including currency fluctuations and economic and political uncertainty. The Fund’s prospectus also includes a description of the main investment risks.
| | |
| | Class B: | These shares have higher annual fees and expenses than Class A shares. |
| | Class C: | Prior to 1/1/04, these shares were offered with an initial sales charge; thus actual total returns |
| | | would have differed. These shares have higher annual fees and expenses than Class A shares. |
| | Class R: | Shares are available to certain eligible investors as described in the prospectus. These shares have |
| | | higher annual fees and expenses than Class A shares. |
| | Advisor Class: | Shares are available to certain eligible investors as described in the prospectus. |
1. Cumulative total return represents the change in value of an investment over the periods indicated.
2. Average annual total return represents the average annual change in value of an investment over the periods indicated.
3. These figures represent the value of a hypothetical $10,000 investment in the Fund over the periods indicated.
4. In accordance with SEC rules, we provide standardized average annual total return information through the latest calendar quarter.
5. Figures are as stated in the Fund’s prospectus current as of the date of this report. In periods of market volatility, assets may decline significantly, causing total annual Fund operating expenses to become higher than the figures shown.
6. Source: © 2010 Morningstar. The Russell 2500 Value Index is market capitalization weighted and measures performance of those Russell 2500 Index companies with lower price-to-book ratios and lower forecasted growth values. The Consumer Price Index (CPI), calculated by the U.S. Bureau of Labor Statistics, is a commonly used measure of the inflation rate.
60 | Annual Report
Your Fund’s Expenses
Franklin Small Cap Value Fund
As a Fund shareholder, you can incur two types of costs:
Transaction costs, including sales charges (loads) on Fund purchases; and
Ongoing Fund costs, including management fees, distribution and service (12b-1) fees, and other Fund expenses. All mutual funds have ongoing costs, sometimes referred to as operating expenses.
The following table shows ongoing costs of investing in the Fund and can help you understand these costs and compare them with those of other mutual funds. The table assumes a $1,000 investment held for the six months indicated.
Actual Fund Expenses
The first line (Actual) for each share class listed in the table provides actual account values and expenses. The “Ending Account Value” is derived from the Fund’s actual return, which includes the effect of Fund expenses.
You can estimate the expenses you paid during the period by following these steps. Of course, your account value and expenses will differ from those in this illustration:
| 1. | Divide your account value by $1,000. |
| | If an account had an $8,600 value, then $8,600 ÷ $1,000 = 8.6. |
| 2. | Multiply the result by the number under the heading “Expenses Paid During Period.” |
| | If Expenses Paid During Period were $7.50, then 8.6 x $7.50 = $64.50. |
In this illustration, the estimated expenses paid this period are $64.50.
Hypothetical Example for Comparison with Other Funds
Information in the second line (Hypothetical) for each class in the table can help you compare ongoing costs of investing in the Fund with those of other mutual funds. This information may not be used to estimate the actual ending account balance or expenses you paid during the period. The hypothetical “Ending Account Value” is based on the actual expense ratio for each class and an assumed 5% annual rate of return before expenses, which does not represent the Fund’s actual return. The figure under the heading “Expenses Paid During Period” shows the hypothetical expenses your account would have incurred under this scenario. You can compare this figure with the 5% hypothetical examples that appear in shareholder reports of other funds.
Annual Report | 61
Your Fund’s Expenses (continued)
Please note that expenses shown in the table are meant to highlight ongoing costs and do not reflect any transaction costs, such as sales charges. Therefore, the second line for each class is useful in comparing ongoing costs only, and will not help you compare total costs of owning different funds. In addition, if transaction costs were included, your total costs would have been higher. Please refer to the Fund prospectus for additional information on operating expenses.

*Expenses are calculated using the most recent six-month expense ratio, annualized for each class (A: 1.27%; B: 1.96%; C: 1.96%; R: 1.46%; and Advisor: 0.96%), multiplied by the average account value over the period, multiplied by 184/365 to reflect the one-half year period.
62 | Annual Report
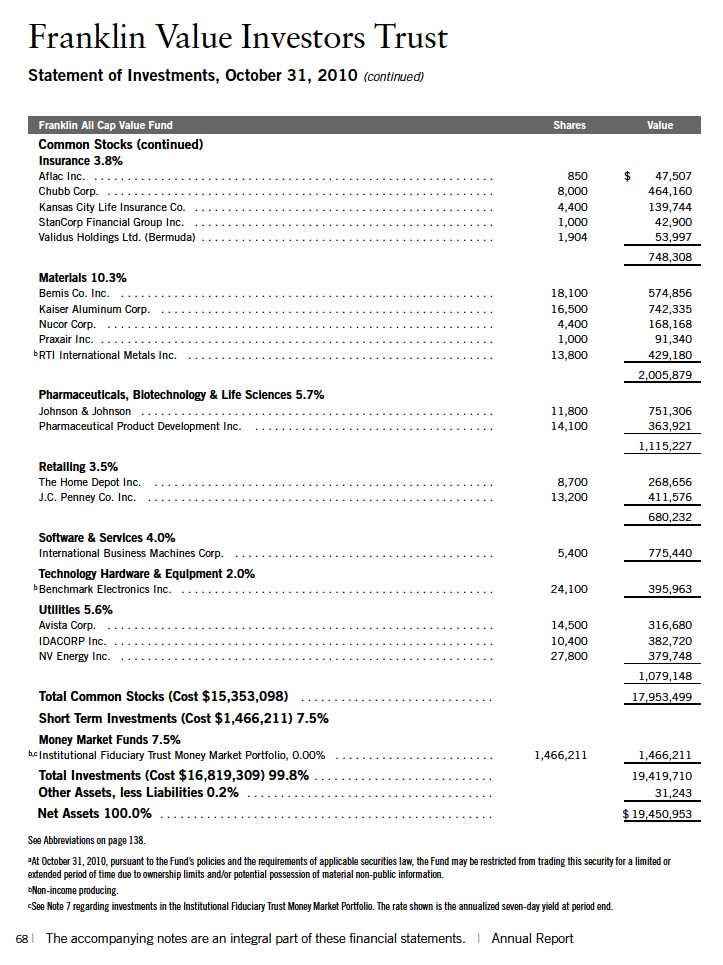
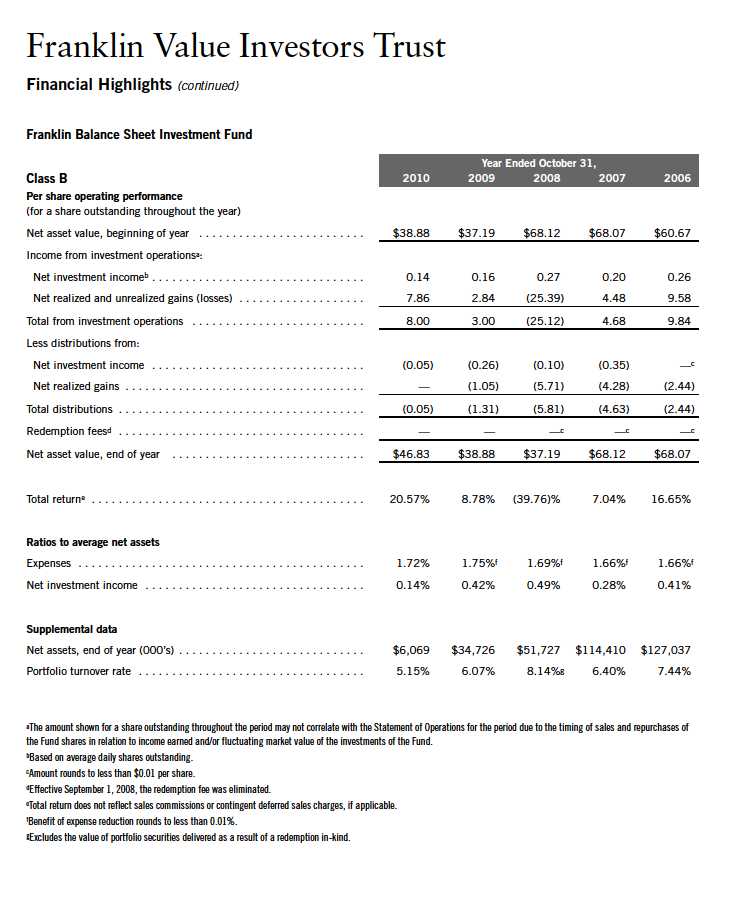
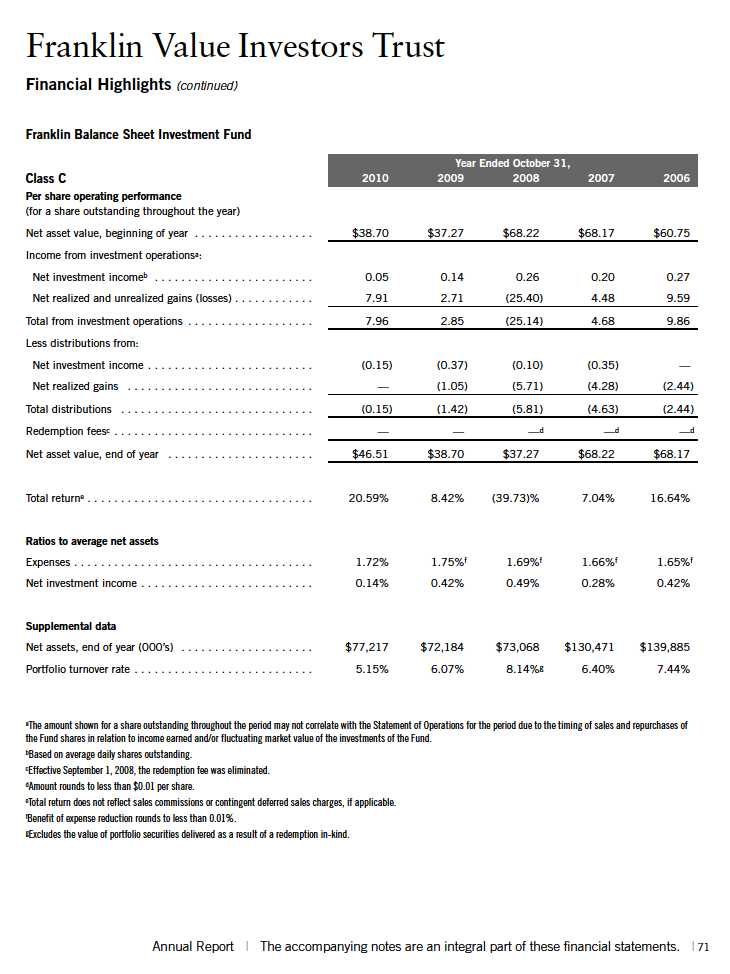
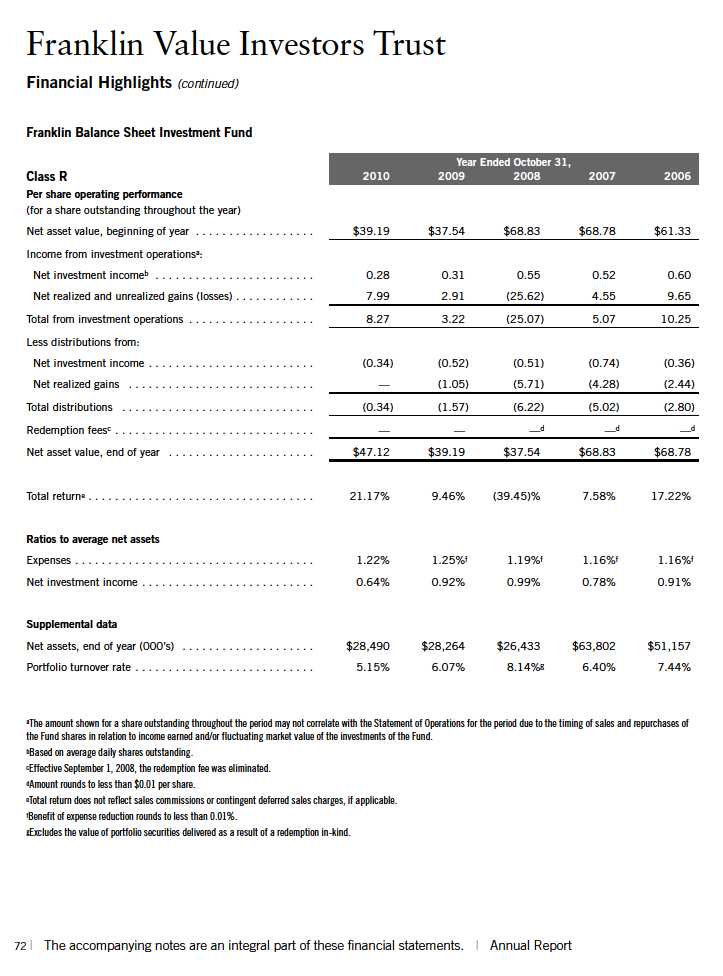
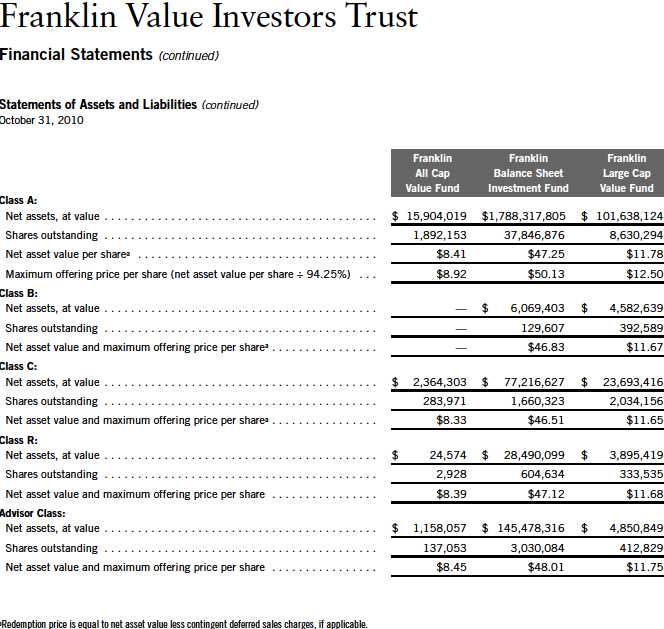
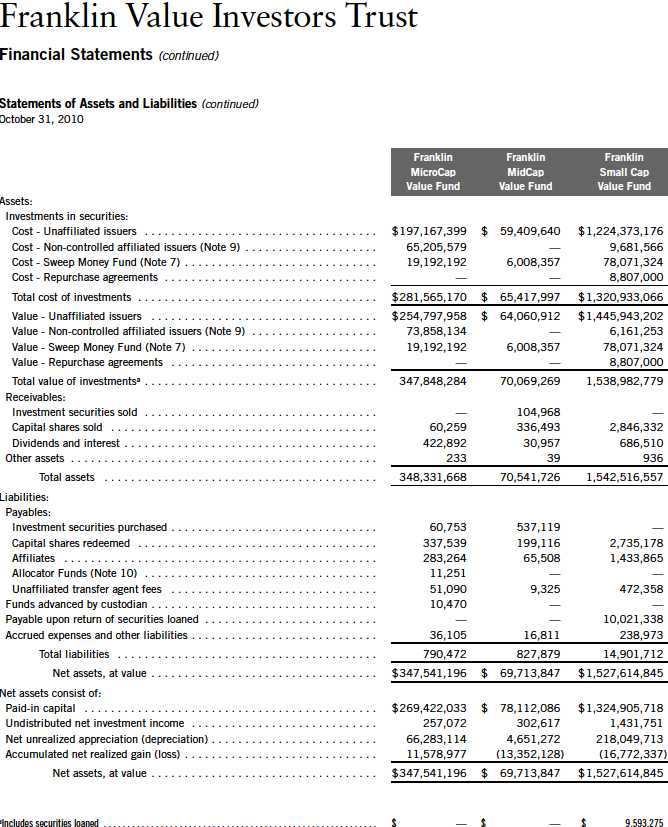
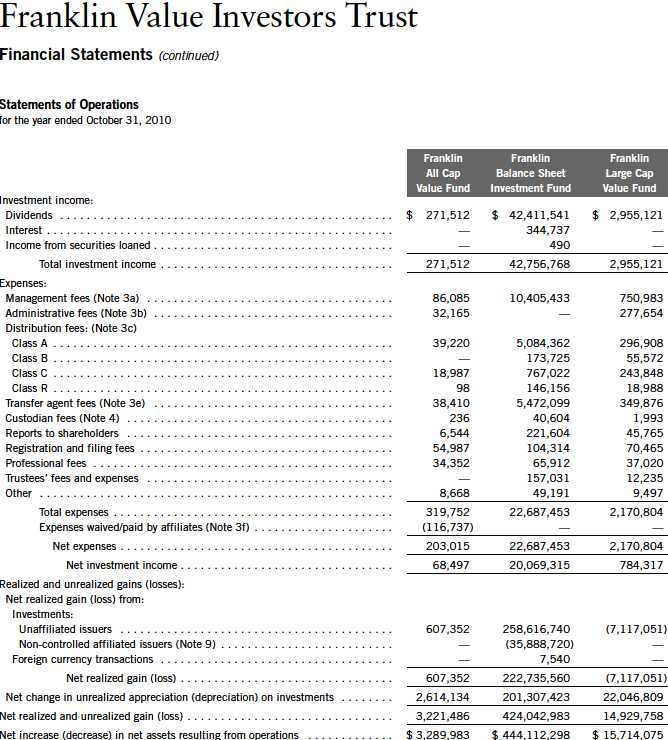
Franklin Value Investors Trust
Statement of Investments, October 31, 2010
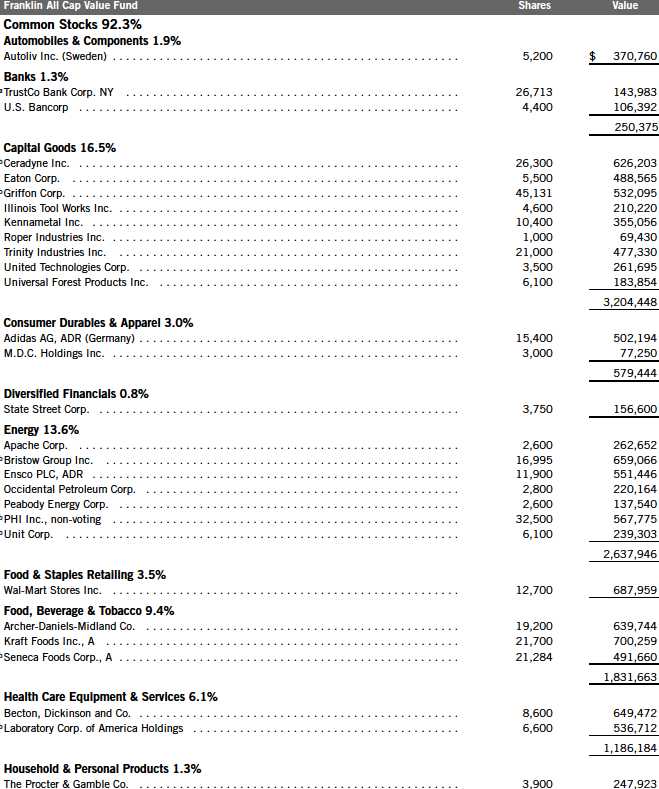
Annual Report | 67

74 | Annual Report
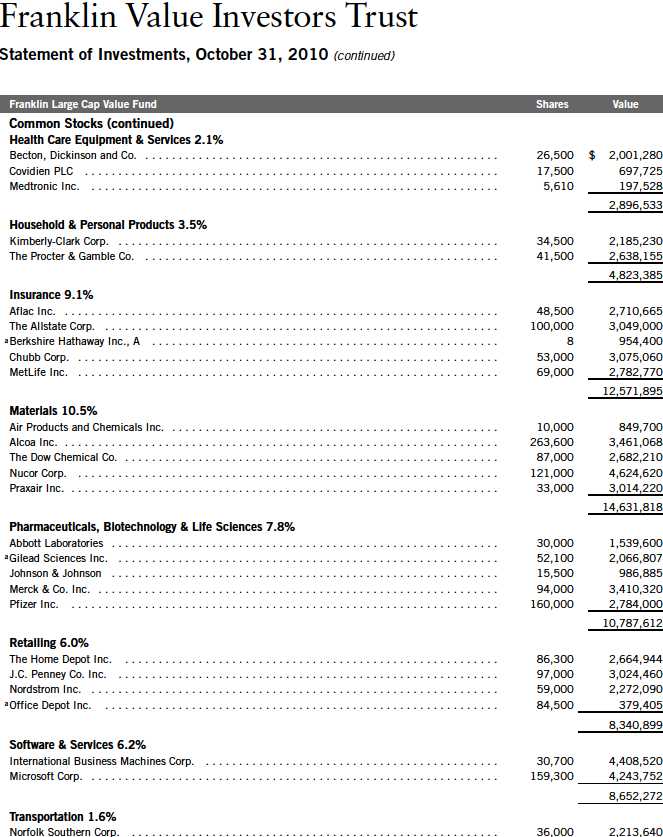
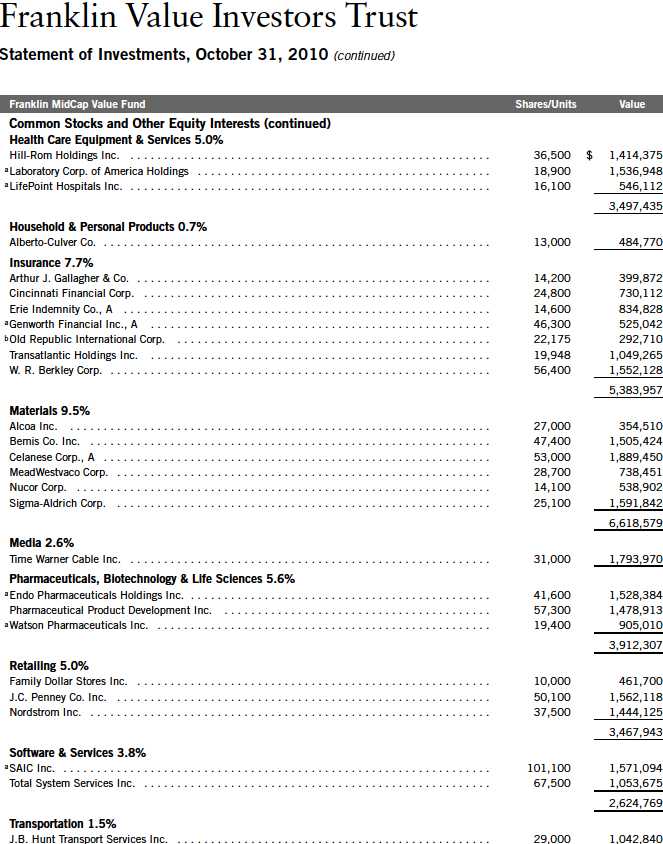
Franklin Value Investors Trust
Statement of Investments, October 31, 2010 (continued)
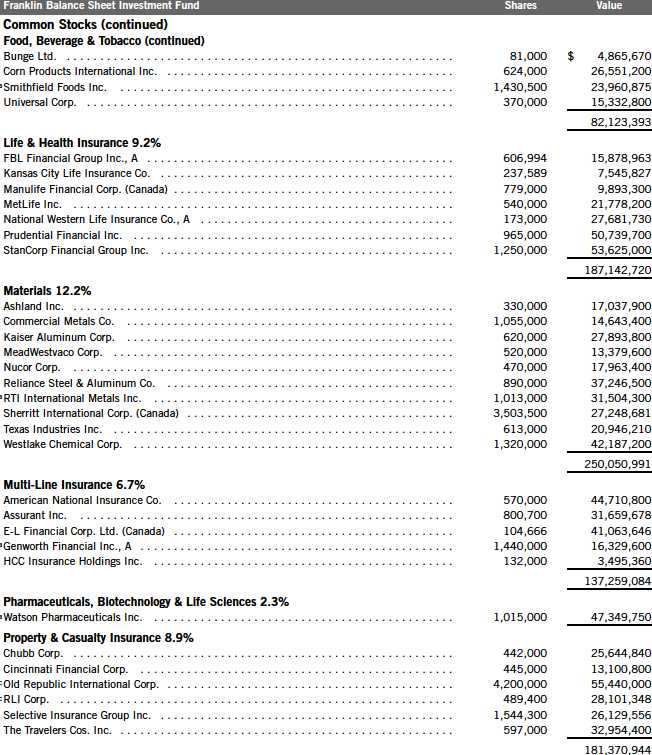
Annual Report | 75
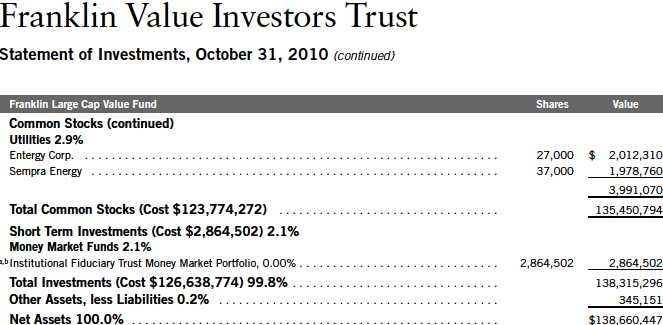
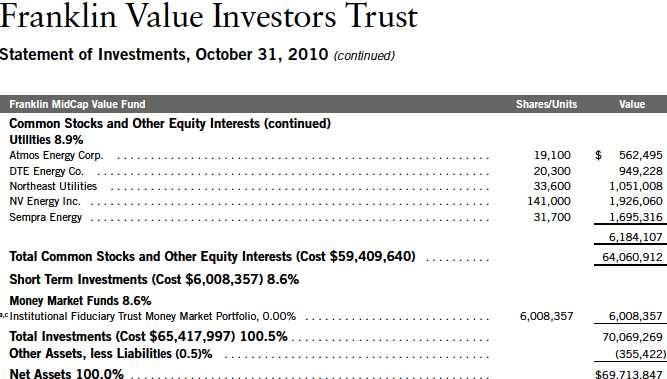
Franklin Value Investors Trust
Statement of Investments, October 31, 2010 (continued)
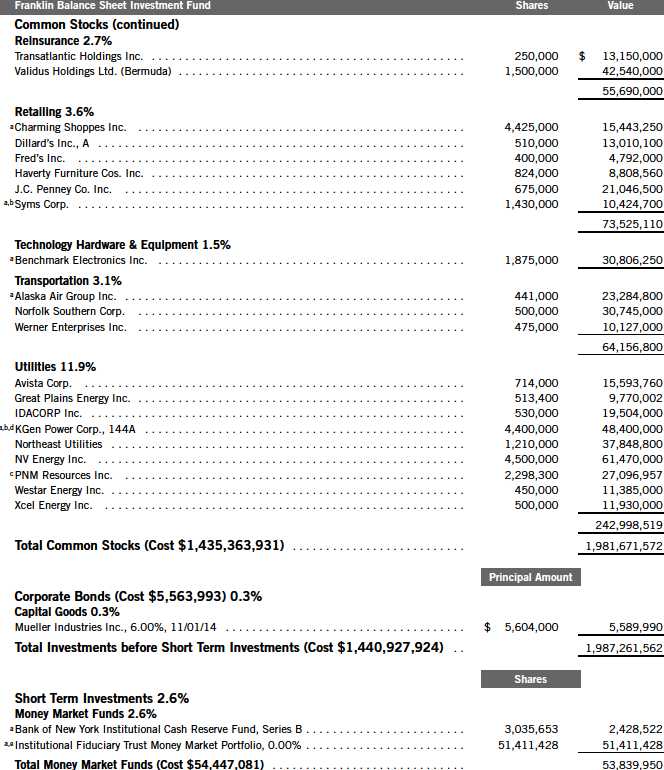
76 | Annual Report
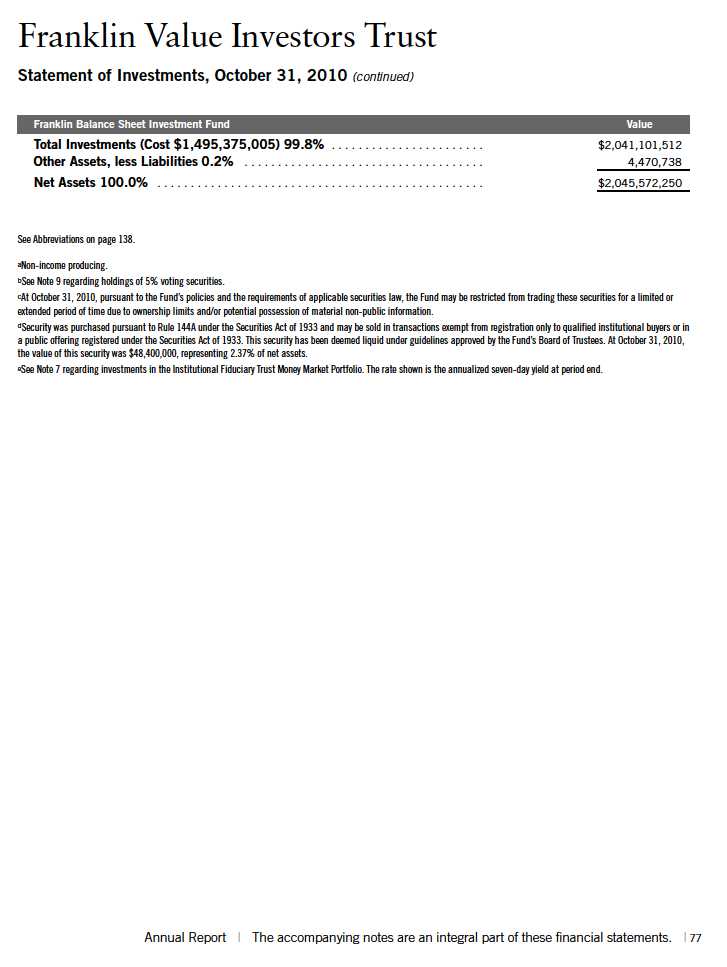
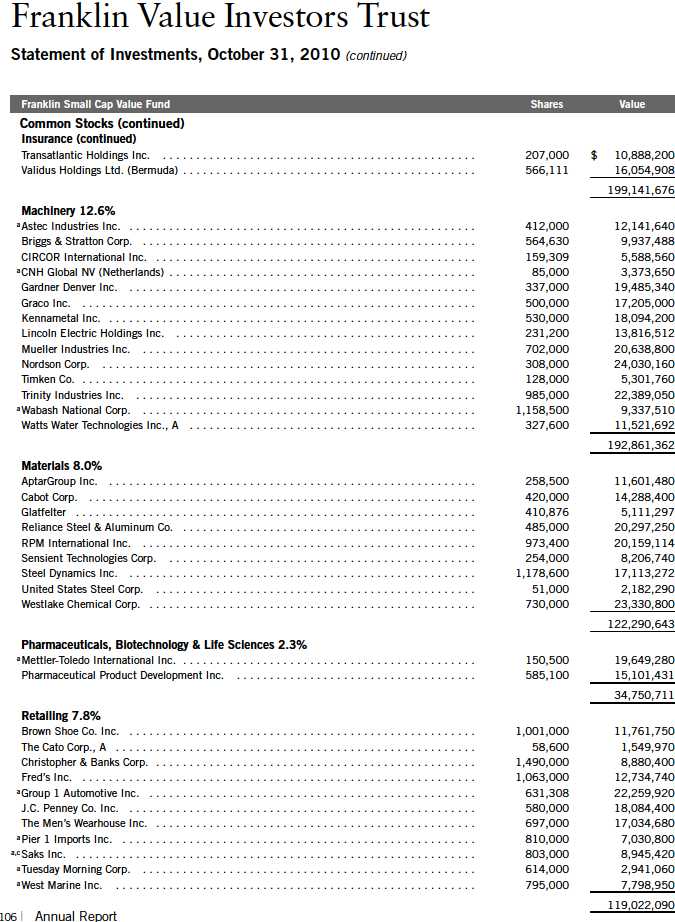
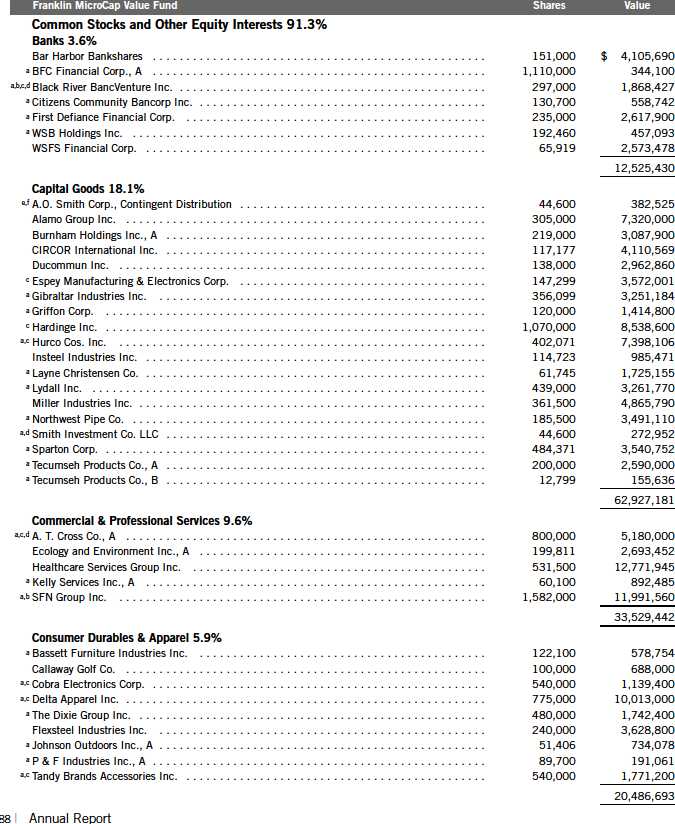
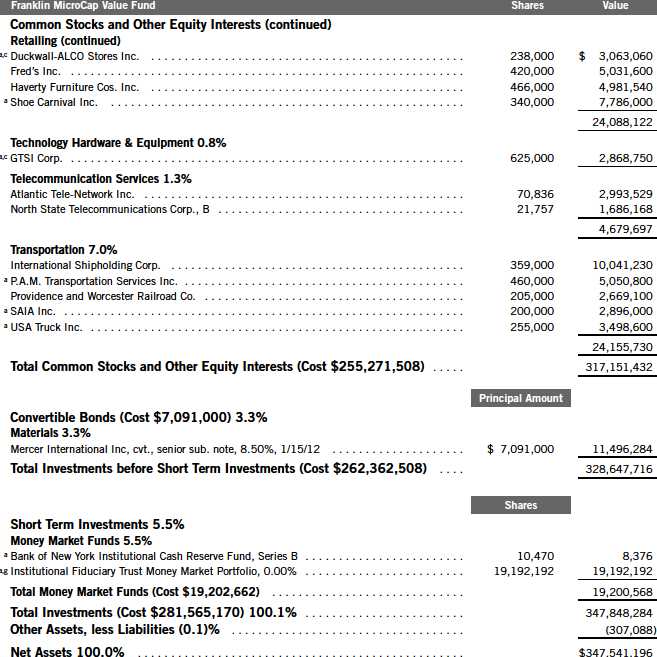
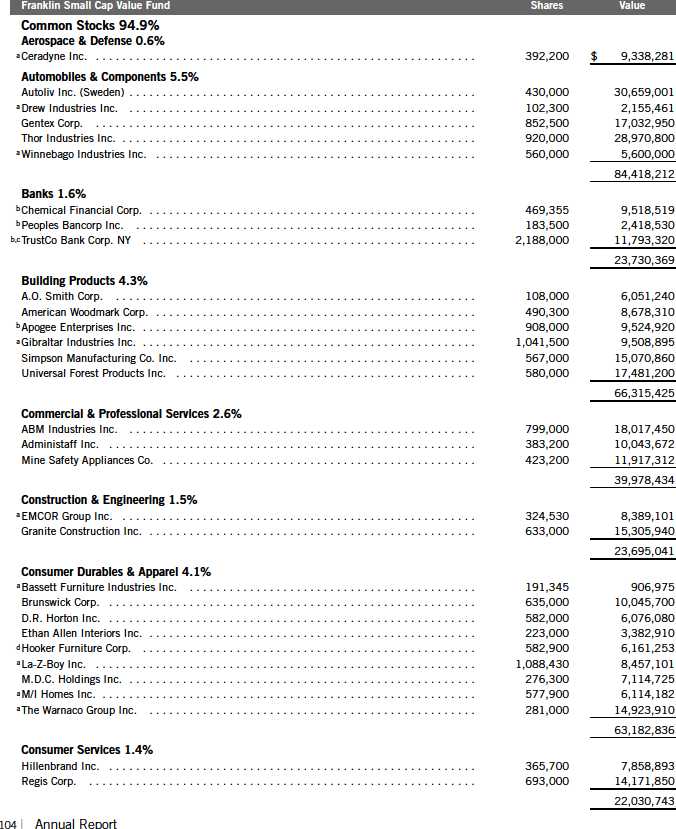
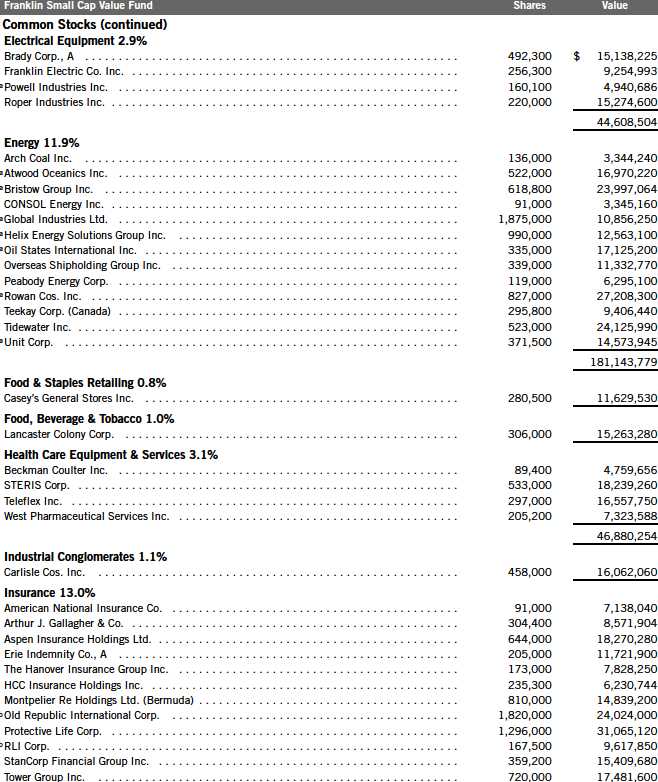
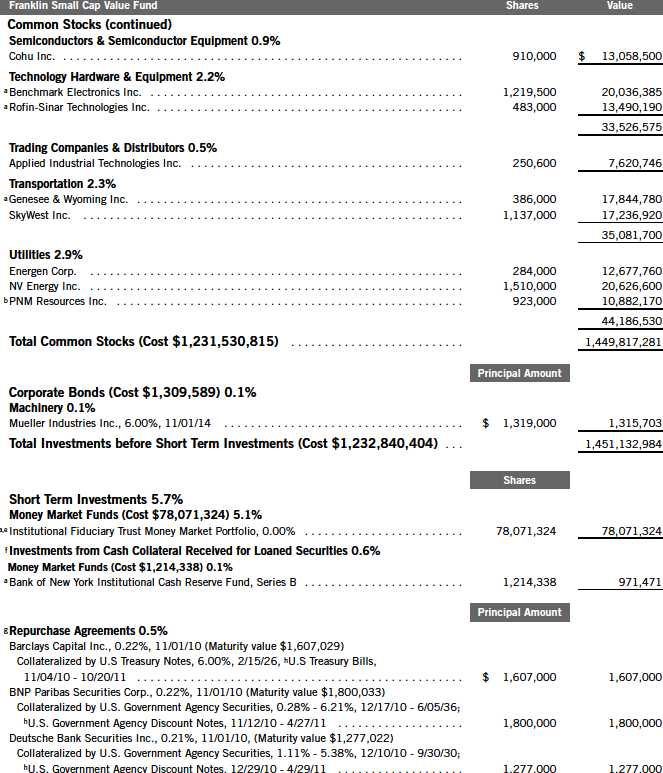
Franklin Value Investors Trust
Statement of Investments, October 31, 2010
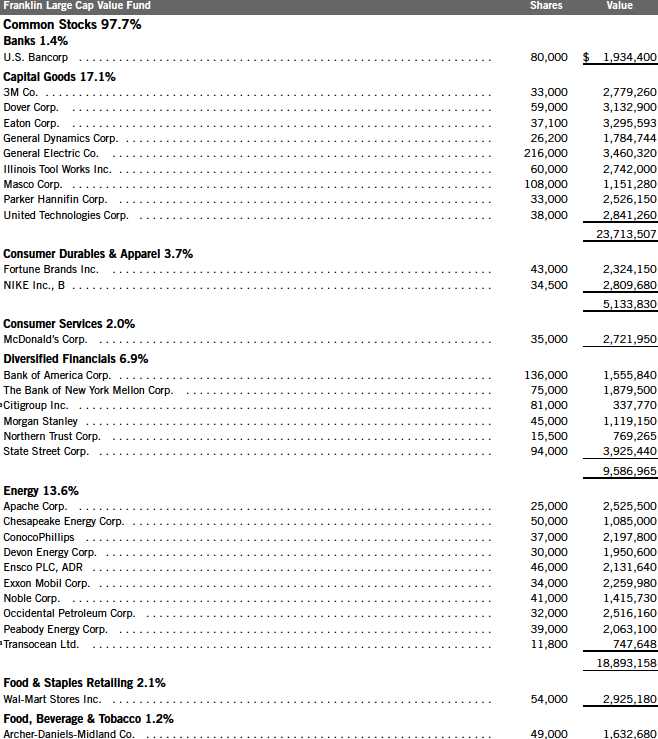
Annual Report | 83
84 | Annual Report
See Abbreviations on page 138.
aNon-income producing.
bSee Note 7 regarding investments in the Institutional Fiduciary Trust Money Market Portfolio. The rate shown is the annualized seven-day yield at period end.
Annual Report | The accompanying notes are an integral part of these financial statements. | 85
Franklin Value Investors Trust
Statement of Investments, October 31, 2010
Franklin Value Investors Trust
Statement of Investments, October 31, 2010 (continued)

Franklin Value Investors Trust
Statement of Investments, October 31, 2010 (continued)
90 | Annual Report
Franklin Value Investors Trust
Statement of Investments, October 31, 2010

Annual Report | 97
See Abbreviations on page 138.
aNon-income producing. |
bAt October 31, 2010, pursuant to the Fund’s policies and the requirements of applicable securities law, the Fund may be restricted from trading this security for a limited or extended period of time due to ownership limits and/or potential possession of material non-public information.
cSee Note 7 regarding investments in the Institutional Fiduciary Trust Money Market Portfolio. The rate shown is the annualized seven-day yield at period end.
98 | The accompanying notes are an integral part of these financial statements. | Annual Report
Franklin Value Investors Trust
Statement of Investments, October 31, 2010
Franklin Value Investors Trust
Statement of Investments, October 31, 2010 (continued)
Annual Report | 105
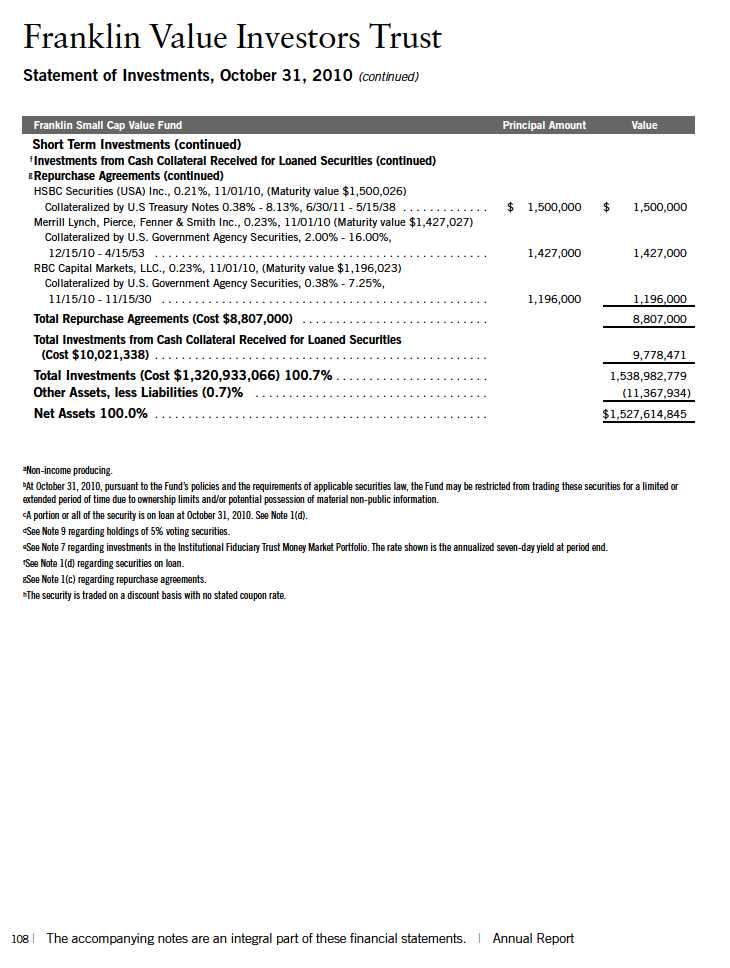
Franklin Value Investors Trust
Statement of Investments, October 31, 2010 (continued)
Annual Report | 107

Annual Report | The accompanying notes are an integral part of these financial statements. | 109
110 | The accompanying notes are an integral part of these financial statements. | Annual Report
Annual Report | The accompanying notes are an integral part of these financial statements. | 111

112 | The accompanying notes are an integral part of these financial statements. | Annual Report
Annual Report | The accompanying notes are an integral part of these financial statements. | 113
114 | The accompanying notes are an integral part of these financial statements. | Annual Report
Annual Report | The accompanying notes are an integral part of these financial statements. | 115
116 | The accompanying notes are an integral part of these financial statements. | Annual Report
Annual Report | The accompanying notes are an integral part of these financial statements. | 117
Franklin Value Investors Trust
Notes to Financial Statements
1. ORGANIZATION AND SIGNIFICANT ACCOUNTING POLICIES
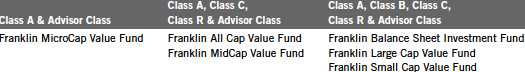
Franklin Value Investors Trust (Trust) is registered under the Investment Company Act of 1940, as amended, (1940 Act) as an open-end investment company, consisting of six funds (Funds). The classes of shares offered within each of the Funds are indicated below. Each class of shares differs by its initial sales load, contingent deferred sales charges, distribution fees, voting rights on matters affecting a single class and its exchange privilege.
The following summarizes the Funds’ significant accounting policies.
a. Financial Instrument Valuation
The Funds value their investments in securities and other assets and liabilities carried at fair value daily. Fair value is the price that would be received to sell an asset or paid to transfer a liability in an orderly transaction between market participants on the measurement date. Under procedures approved by the Funds’ Board of Trustees, the Funds may utilize independent pricing services, quotations from securities and financial instrument dealers, and other market sources to determine fair value.
Equity securities listed on an exchange or on the NASDAQ National Market System are valued at the last quoted sale price or the official closing price of the day, respectively. Foreign equity securities are valued as of the close of trading on the foreign stock exchange on which the security is primarily traded, or the NYSE, whichever is earlier. The value is then converted into its U.S. dollar equivalent at the foreign exchange rate in effect at the close of the NYSE on the day that the value of the security is determined. Over-the-counter securities are valued within the range of the most recent quoted bid and ask prices. Securities that trade in multiple markets or on multiple exchanges are valued according to the broadest and most representative market. Certain equity securities are valued based upon fundamental characteristics or relationships to similar securities. Investments in open-end mutual funds are valued at the closing net asset value.
Debt securities generally trade in the over-the-counter market rather than on a securities exchange. The Funds’ pricing services use multiple valuation techniques to determine fair value. In instances where sufficient market activity exists, the pricing services may utilize a market-based approach through which quotes from market makers are used to determine fair value. In instances where sufficient market activity may not exist or is limited, the pricing services also utilize proprietary valuation models which may consider market characteristics such as benchmark yield curves, option adjusted spreads, credit spreads, estimated default rates, coupon rates, anticipated timing of principal repayments, underlying collateral, and other unique security features in order to estimate the relevant cash flows, which are then discounted to calculate the fair value. Repurchase agreements are valued at cost, which approximates market value.
118 | Annual Report
Franklin Value Investors Trust
Notes to Financial Statements (continued)
| 1. | ORGANIZATION AND SIGNIFICANT ACCOUNTING POLICIES (continued) |
| a. | Financial Instrument Valuation (continued) |
The Funds have procedures to determine the fair value of securities and other financial instruments for which market prices are not readily available or which may not be reliably priced. Under these procedures, the Funds primarily employ a market-based approach which may use related or comparable assets or liabilities, recent transactions, market multiples, book values, and other relevant information for the investment to determine the fair value of the investment. The Funds may also use an income-based valuation approach in which the anticipated future cash flows of the investment are discounted to calculate fair value. Discounts may also be applied due to the nature or duration of any restrictions on the disposition of the investments. Due to the inherent uncertainty of valuations of such investments, the fair values may differ significantly from the values that would have been used had an active market existed.
Trading in securities on foreign exchanges and over-the-counter markets may be completed before the daily close of business on the NYSE. Occasionally, events occur between the time at which trading in a foreign security is completed and the close of the NYSE that might call into question the reliability of the value of a portfolio security held by the fund. As a result, differences may arise between the value of the Funds’ portfolio securities as determined at the foreign market close and the latest indications of value at the close of the NYSE. In order to minimize the potential for these differences, the investment manager monitors price movements following the close of trading in foreign stock markets through a series of country specific market proxies (such as baskets of American Depository Receipts, futures contracts and exchange traded funds). These price movements are measured against established trigger thresholds for each specific mark et proxy to assist in determining if an event has occurred that may call into question the reliability of the values of the foreign securities held by the Funds. If such an event occurs, the securities may be valued using fair value procedures, which may include the use of independent pricing services.
b. Foreign Currency Translation
Portfolio securities and other assets and liabilities denominated in foreign currencies are translated into U.S. dollars based on the exchange rate of such currencies against U.S. dollars on the date of valuation. The Funds may enter into foreign currency exchange contracts to facilitate transactions denominated in a foreign currency. Purchases and sales of securities, income and expense items denominated in foreign currencies are translated into U.S. dollars at the exchange rate in effect on the transaction date. Portfolio securities and assets and liabilities denominated in foreign currencies contain risks that those currencies will decline in value relative to the U.S. dollar. Occasionally, events may impact the availability or reliability of foreign exchange rates used to convert the U.S. dollar equivalent value. If such an event occurs, the foreign exchange rate will be valued at fair value using procedures established and approved by the Funds ’ Board of Trustees.
Annual Report | 119
Franklin Value Investors Trust
Notes to Financial Statements (continued)
| 1. | ORGANIZATION AND SIGNIFICANT ACCOUNTING POLICIES (continued) |
| b. | Foreign Currency Translation (continued) |
The Funds do not separately report the effect of changes in foreign exchange rates from changes in market prices on securities held. Such changes are included in net realized and unrealized gain or loss from investments on the Statement of Operations.
Realized foreign exchange gains or losses arise from sales of foreign currencies, currency gains or losses realized between the trade and settlement dates on securities transactions and the difference between the recorded amounts of dividends, interest, and foreign withholding taxes and the U.S. dollar equivalent of the amounts actually received or paid. Net unrealized foreign exchange gains and losses arise from changes in foreign exchange rates on foreign denominated assets and liabilities other than investments in securities held at the end of the reporting period.
c. Repurchase Agreements
The Funds may enter into repurchase agreements, which are accounted for as a loan by the fund to the seller, collateralized by securities which are delivered to the fund’s custodian. The market value, including accrued interest, of the initial collateralization is required to be at least 102% of the dollar amount invested by the fund, with the value of the underlying securities marked to market daily to maintain coverage of at least 100%. All repurchase agreements held by the Funds at year end had been entered into on October 29, 2010.
d. Securities Lending
Certain funds participate in a principal based security lending program. The fund receives cash collateral against the loaned securities in an amount equal to at least 102% of the market value of the loaned securities. Collateral is maintained over the life of the loan in an amount not less than 100% of the market value of loaned securities, as determined at the close of fund business each day; any additional collateral required due to changes in security values is delivered to the fund on the next business day. The collateral is invested in repurchase agreements or in a non-registered money fund managed by the fund’s custodian on the fund’s behalf. The fund receives income from the investment of cash collateral, in addition to lending fees and rebates paid by the borrower. The fund bears the market risk with respect to the collateral investment, securities loaned, and the risk that the principal may default on its obligations to the fund.
e. Income Taxes
It is each Fund’s policy to qualify as a regulated investment company under the Internal Revenue Code and to distribute to shareholders substantially all of its taxable income and net realized gains. As a result, no provision for U.S. federal income taxes is required. The Funds file U.S. income tax returns as well as tax returns in certain other jurisdictions. The Funds recognize in their financial statements the effects including penalties and interest, if any, of a tax position taken on a tax return (or expected to be taken) when it’s more likely than not (a greater than 50% probability), based on the technical merits, that the tax position will be sustained upon examination by the
120 | Annual Report
Franklin Value Investors Trust
Notes to Financial Statements (continued)
| 1. | ORGANIZATION AND SIGNIFICANT ACCOUNTING POLICIES (continued) |
| e. | Income Taxes (continued) |
tax authorities. As of October 31, 2010, and for all open tax years, the Funds have determined that no provision for income tax is required in the Funds’ financial statements. Open tax years are those that remain subject to examination and are based on each tax jurisdiction statute of limitation. The Funds are not aware of any tax position for which it is reasonably possible that the total amounts of unrecognized tax effects will significantly change in the next twelve months.
f. Security Transactions, Investment Income, Expenses and Distributions
Security transactions are accounted for on trade date. Realized gains and losses on security transactions are determined on a specific identification basis. Interest income and estimated expenses are accrued daily. Dividend income is recorded on the ex-dividend date except that certain dividends from foreign securities are recognized as soon as the Funds are notified of the ex-dividend date. Distributions to shareholders are recorded on the ex-dividend date and are determined according to income tax regulations (tax basis). Distributable earnings determined on a tax basis may differ from earnings recorded in accordance with accounting principles generally accepted in the United States of America. These differences may be permanent or temporary. Permanent differences are reclassified among capital accounts to reflect their tax character. These reclassifications have no impact on net assets or the results of operations. Temporary differences are not r eclassified, as they may reverse in subsequent periods.
Common expenses incurred by the Trust are allocated among the Funds based on the ratio of net assets of each fund to the combined net assets of the Trust. Fund specific expenses are charged directly to the fund that incurred the expense.
Realized and unrealized gains and losses and net investment income, not including class specific expenses, are allocated daily to each class of shares based upon the relative proportion of net assets of each class. Differences in per share distributions, by class, are generally due to differences in class specific expenses.
Distributions received by the Fund from certain securities may be a return of capital (ROC). Such distributions reduce the cost basis of the securities, and any distributions in excess of the cost basis are recognized as capital gains.
g. Accounting Estimates
The preparation of financial statements in accordance with accounting principles generally accepted in the United States of America requires management to make estimates and assumptions that affect the reported amounts of assets and liabilities at the date of the financial statements and the amounts of income and expenses during the reporting period. Actual results could differ from those estimates.
Annual Report | 121
Franklin Value Investors Trust
Notes to Financial Statements (continued)
| 1. | ORGANIZATION AND SIGNIFICANT ACCOUNTING POLICIES (continued) |
| h. | Guarantees and Indemnifications |
Under the Trust’s organizational documents, its officers and trustees are indemnified by the Trust against certain liabilities arising out of the performance of their duties to the Trust. Additionally, in the normal course of business, the Trust, on behalf of the Funds, enters into contracts with service providers that contain general indemnification clauses. The Trust’s maximum exposure under these arrangements is unknown as this would involve future claims that may be made against the Trust that have not yet occurred. Currently, the Trust expects the risk of loss to be remote.
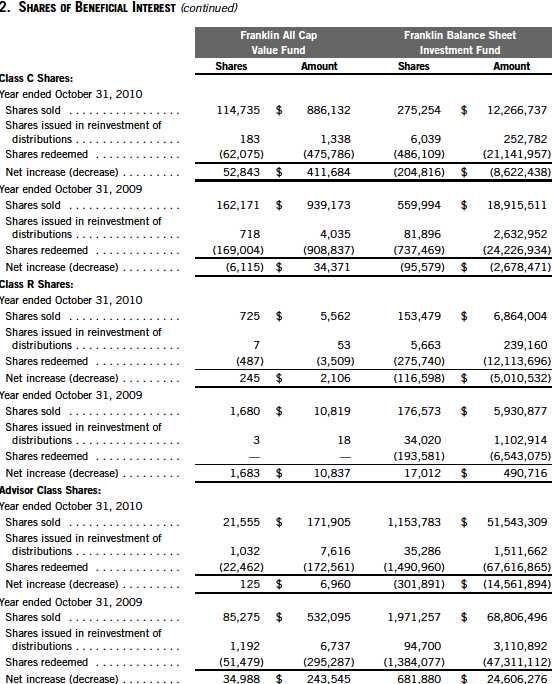
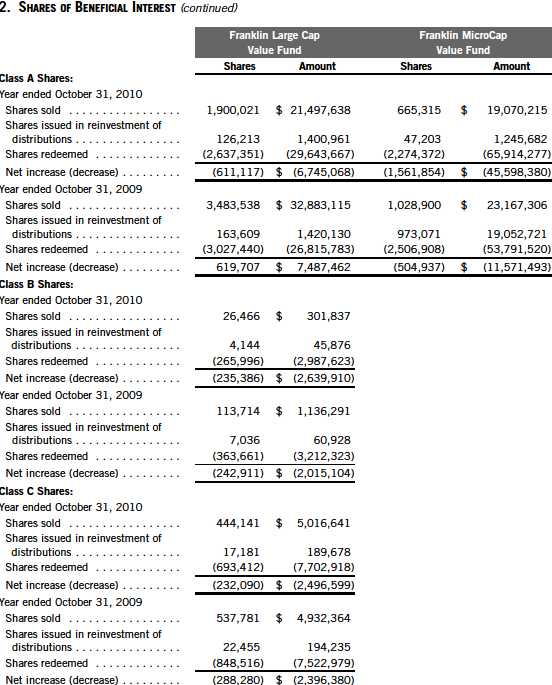
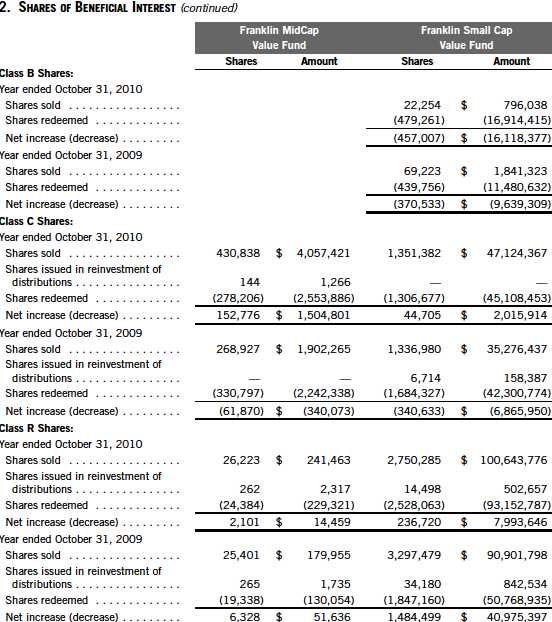
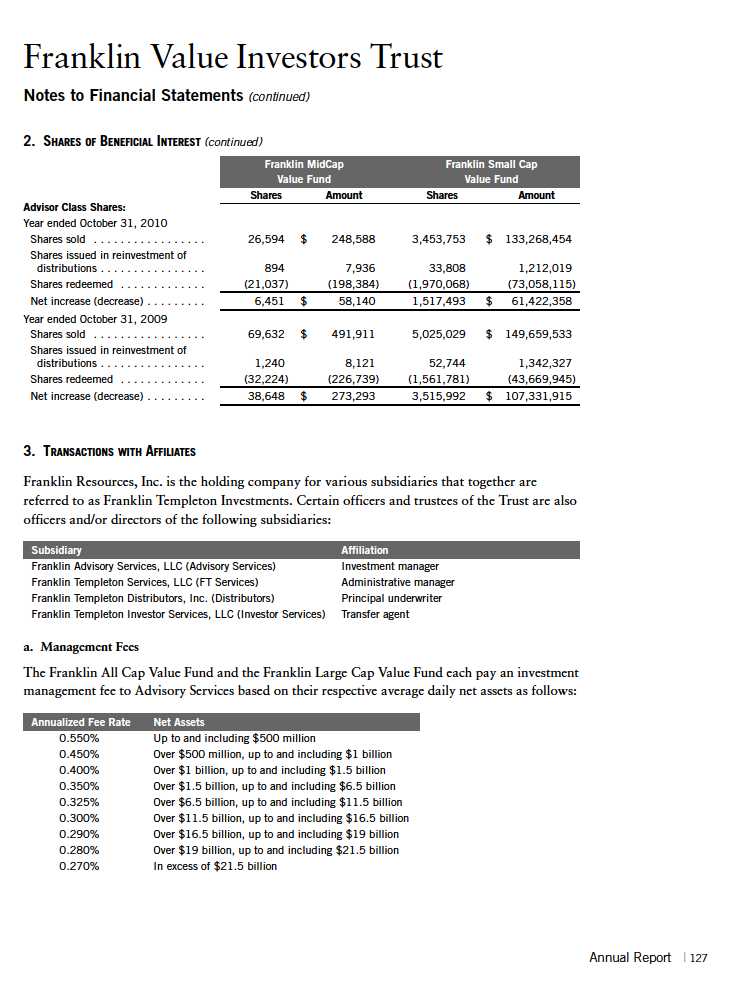
2. SHARES OF BENEFICIAL INTEREST
At October 31, 2010, there were an unlimited number of shares authorized ($0.01 par value).
Transactions in the Funds’ shares were as follows:

122 | Annual Report
Franklin Value Investors Trust
Notes to Financial Statements (continued)
Annual Report | 123
Franklin Value Investors Trust
Notes to Financial Statements (continued)
124 | Annual Report
Franklin Value Investors Trust
Notes to Financial Statements (continued)

Annual Report | 125
Franklin Value Investors Trust
Notes to Financial Statements (continued)
126 | Annual Report
Franklin Value Investors Trust
Notes to Financial Statements (continued)
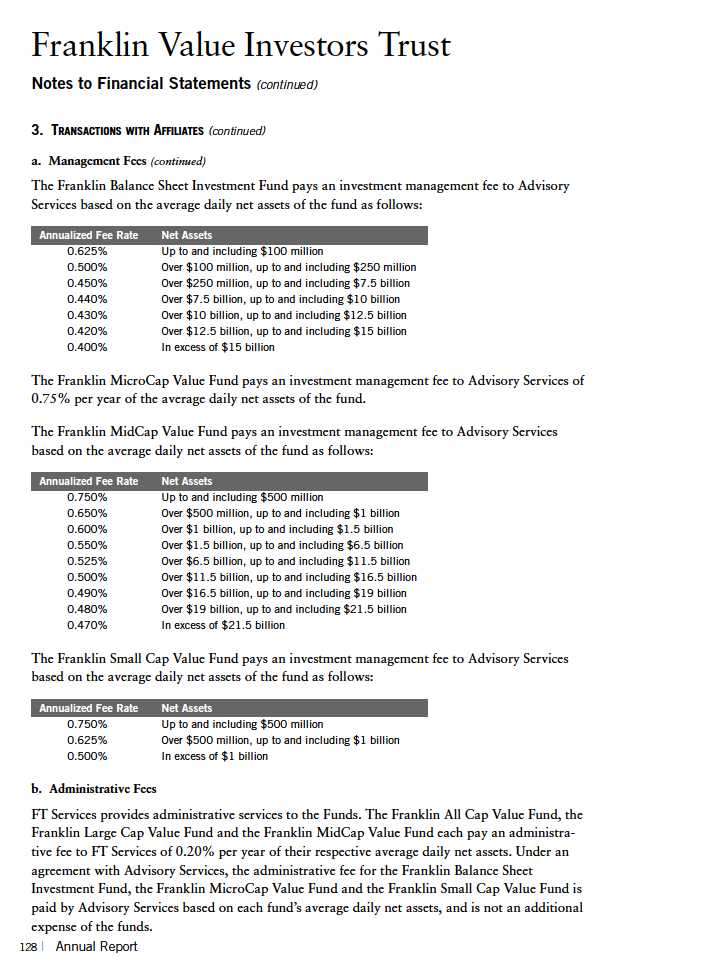
| 3. | TRANSACTIONS WITH AFFILIATES (continued) |
| c. | Distribution Fees |
The Trust’s Board of Trustees has adopted distribution plans for each share class, with the exception of Advisor Class shares, pursuant to Rule 12b-1 under the 1940 Act. Under the Funds’ Class A reimbursement distribution plans, the Funds reimburse Distributors for costs incurred in connection with the servicing, sale and distribution of each fund’s shares up to the maximum annual plan rate. Under the Class A reimbursement distribution plans, costs exceeding the maximum for the current plan year cannot be reimbursed in subsequent periods.
In addition, under the Funds’ Class B, C and R compensation distribution plans, the Funds pay Distributors for costs incurred in connection with the servicing, sale and distribution of each fund’s shares up to the maximum annual plan rate for each class.
The maximum annual plan rates, based on the average daily net assets, for each class, are as follows:
The Board of Trustees has set the current rate at 0.30% per year for Class A shares for the Franklin All Cap Value Fund, the Franklin Large Cap Value Fund, the Franklin MidCap Value Fund, and the Franklin Small Cap Value Fund until further notice and approval by the Board.
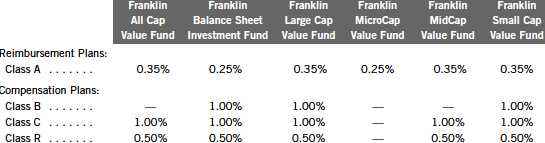
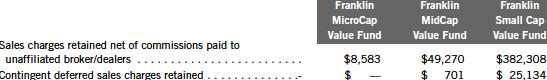
d. Sales Charges/Underwriting Agreements
Distributors has advised the Funds of the following commission transactions related to the sales and redemptions of the Funds’ shares for the year:
Annual Report | 129
Franklin Value Investors Trust
Notes to Financial Statements (continued)
| 3. | TRANSACTIONS WITH AFFILIATES (continued) |
| d. | Sales Charges/Underwriting Agreements (continued) |
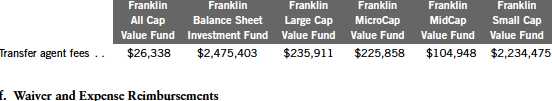
e. Transfer Agent Fees
For the year ended October 31, 2010, the Funds paid transfer agent fees as noted in the Statements of Operations of which the following amounts were retained by Investor Services:
Advisory Services and FT Services have contractually agreed in advance to waive or limit their respective fees and to assume as their own expense certain expenses otherwise payable by the Franklin All Cap Value Fund and the Franklin MidCap Value Fund so that the common expenses (i.e. a combination of management fees, administrative fees, and other expenses, but excluding distribution fees and acquired fund fees and expenses ) for each class of the funds do not exceed 0.90% and 1.05%, respectively (other than certain non-routine expenses or costs, including those relating to litigation, indemnification, reorganizations, and liquidations) until February 28, 2011.
For the Franklin MicroCap Value Fund, Advisory Services has voluntarily agreed to limit the increase in the Fund’s net annual operating expense ratio that results from the implementation of the Special Servicing Agreement (SSA) to 0.02% through April 30, 2010. See Note 10 regarding the SSA.
4. EXPENSE OFFSET ARRANGEMENT
The Funds have entered into an arrangement with their custodian whereby credits realized as a result of uninvested cash balances are used to reduce a portion of the Funds’ custodian expenses. During the year ended October 31, 2010, there were no credits earned.
130 | Annual Report
Franklin Value Investors Trust
Notes to Financial Statements (continued)
5. INCOME TAXES
For tax purposes, capital losses may be carried over to offset future capital gains, if any. At October 31, 2010, the capital loss carryforwards were as follows:

During the year the Funds utilized capital loss carryforwards as follows:

The tax character of distributions paid during the years ended October 31, 2010 and 2009, was as follows:

Annual Report | 131
Franklin Value Investors Trust
Notes to Financial Statements (continued)
5. INCOME TAXES (continued)
At October 31, 2010, the cost of investments, net unrealized appreciation (depreciation), undistributed ordinary income and undistributed long term term capital gains for income tax purposes were as follows:

Net investment income differs for financial statement and tax purposes primarily due to differing treatments of foreign currency transactions, bond discounts and premiums, pass-through entity income and certain corporate action adjustments.
Net realized gains (losses) differ for financial statement and tax purposes primarily due to differing treatments of wash sales, foreign currency transactions and certain corporate action adjustments.
The Franklin Balance Sheet Investment Fund utilized a tax accounting practice to treat a portion of the proceeds from capital shares redeemed as a distribution from realized capital gains.
132 | Annual Report
Franklin Value Investors Trust
Notes to Financial Statements (continued)
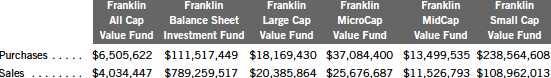
6. INVESTMENT TRANSACTIONS
Purchases and sales (excluding short term securities) for the year ended October 31, 2010, were as follows:
7. INVESTMENTS IN INSTITUTIONAL FIDUCIARY TRUST MONEY MARKET PORTFOLIO
The Funds may invest in the Institutional Fiduciary Trust Money Market Portfolio (Sweep Money Fund), an open-end investment company managed by Franklin Advisers, Inc. (an affiliate of the investment manager). Management fees paid by the Funds are reduced on assets invested in the Sweep Money Fund, in an amount not to exceed the management and administrative fees paid by the Sweep Money Fund.
8. RESTRICTED SECURITIES
The Funds may invest in securities that are restricted under the Securities Act of 1933 (1933 Act) or which are subject to legal, contractual, or other agreed upon restrictions on resale. Restricted securities are often purchased in private placement transactions, and cannot be sold without prior registration unless the sale is pursuant to an exemption under the 1933 Act. Disposal of these securities may require greater effort and expense, and prompt sale at an acceptable price may be difficult. The Funds may have registration rights for restricted securities. The issuer generally incurs all registration costs.
At October 31, 2010, the Franklin MicroCap Value Fund held investments in restricted securities, excluding certain securities exempt from registration under the 1933 Act deemed to be liquid, as follows:

aThe Fund also invests in unrestricted securities or other investments in the issuer, valued at $382,525 as of October 31, 2010.
Annual Report | 133
Franklin Value Investors Trust
Notes to Financial Statements (continued)
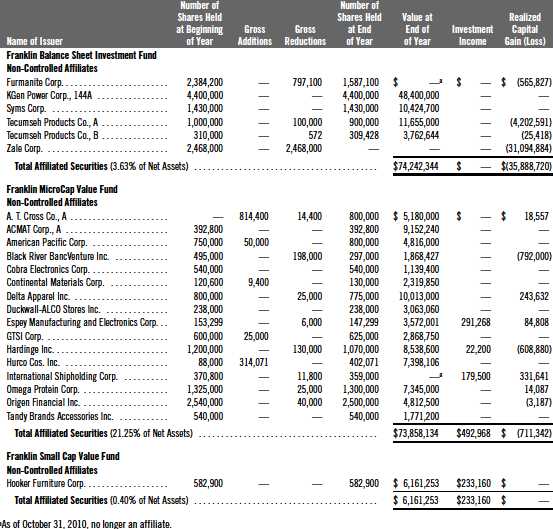
9. HOLDINGS OF 5% VOTING SECURITIES OF PORTFOLIO COMPANIES
The 1940 Act defines “affiliated companies” to include investments in portfolio companies in which a fund owns 5% or more of the outstanding voting securities. Investments in “affiliated companies” for the Franklin Balance Sheet Investment Fund, the Franklin MicroCap Value Fund and the Franklin Small Cap Value Fund for the year ended October 31, 2010, were as shown below.
134 | Annual Report
Franklin Value Investors Trust
Notes to Financial Statements (continued)
10. SPECIAL SERVICING AGREEMENT
The Franklin MicroCap Value Fund, which is an eligible underlying investment of one or more of the Franklin Templeton Fund Allocator Series Funds (Allocator Funds), participates in a SSA with the Allocator Funds and certain service providers of the fund and the Allocator Funds. Under the SSA, the fund may pay a portion of the Allocator Funds’ expenses (other than any asset allocation, administrative and distribution fees), to the extent such payments are less than the amount of the benefits realized or expected to be realized by the fund (e.g., due to reduced costs associated with servicing accounts) from the investment in the fund by the Allocator Funds. The Allocator Funds are either managed by Franklin Advisers, Inc. or administered by FT Services, affiliates of Advisory Services. For the year ended October 31, 2010, the fund was held by one or more of the Allocator Funds and the amount of expenses borne by the fund is noted in the Statement s of Operations. At October 31, 2010, 25.44% of the fund’s outstanding shares was held by one or more of the Allocator Funds.
11. CREDIT FACILITY
The Funds, together with other U.S. registered and foreign investment funds (collectively “Borrowers”), managed by Franklin Templeton Investments, are borrowers in a joint syndicated senior unsecured credit facility totaling $750 million (Global Credit Facility) which matures on January 21, 2011. This Global Credit Facility provides a source of funds to the Borrowers for temporary and emergency purposes, including the ability to meet future unanticipated or unusually large redemption requests.
Under the terms of the Global Credit Facility, the Funds shall, in addition to interest charged on any borrowings made by the Funds and other costs incurred by the Funds, pay their share of fees and expenses incurred in connection with the implementation and maintenance of the Global Credit Facility, based upon their relative share of the aggregate net assets of all of the Borrowers, including an annual commitment fee of 0.10% based upon the unused portion of the Global Credit Facility, which is reflected in other expenses on the Statements of Operations. During the year ended October 31, 2010, the Funds did not utilize the Global Credit Facility.
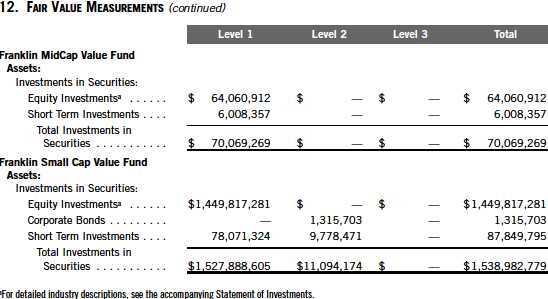
12. FAIR VALUE MEASUREMENTS
The Funds follow a fair value hierarchy that distinguishes between market data obtained from independent sources (observable inputs) and the Funds’ own market assumptions (unobservable inputs). These inputs are used in determining the value of the Funds’ investments and are summarized in the following fair value hierarchy:
Level 1 – quoted prices in active markets for identical securities
Level 2 – other significant observable inputs (including quoted prices for similar securities, interest rates, prepayment speed, credit risk, etc.)
Level 3 – significant unobservable inputs (including the funds’ own assumptions in deter- mining the fair value of investments)
Franklin Value Investors Trust
Notes to Financial Statements (continued)
12. FAIR VALUE MEASUREMENTS (continued)
The inputs or methodology used for valuing securities are not an indication of the risk associated with investing in those securities.
For movements between the levels within the fair value hierarchy, the Funds have adopted a policy of recognizing the transfers as of the date of the underlying event which caused the movement.
The following is a summary of the inputs used as of October 31, 2010, in valuing the Funds’ assets carried at fair value:

Franklin Value Investors Trust
Notes to Financial Statements (continued)
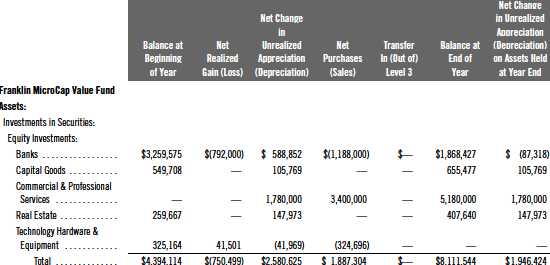
At October 31, 2010, the reconciliation of assets in which significant unobservable inputs (Level 3) were used in determining the Franklin MicroCap Value Fund’s fair value, is as follows:
13. SUBSEQUENT EVENTS
The Funds have evaluated subsequent events through the issuance of the financial statements and determined that no events have occurred that require disclosure.
Annual Report | 137
Franklin Value Investors Trust
Notes to Financial Statements (continued)
Abbreviations
Selected Portfolio
ADR - American Depository Receipt |
138 | Annual Report
Franklin Value Investors Trust
Report of Independent Registered Public Accounting Firm
To the Board of Trustees and Shareholders of Franklin Value Investors Trust
In our opinion, the accompanying statements of assets and liabilities, including the statements of investments, and the related statements of operations and of changes in net assets and the financial highlights present fairly, in all material respects, the financial position of Franklin All Cap Value Fund, Franklin Balance Sheet Investment Fund, Franklin Large Cap Value Fund, Franklin MicroCap Value Fund, Franklin MidCap Value Fund and Franklin Small Cap Value Fund (separate portfolios of Franklin Value Investors Trust, hereafter referred to as the “Funds”) at October 31, 2010, the results of each of their operations for the year then ended, the changes in each of their net assets for each of the two years in the period then ended and the financial highlights for each of the periods presented, in conformity with accounting principles generally accepted in the United States of America. These financial statements and financial highlights (he reafter referred to as “financial statements”) are the responsibility of the Funds’ management. Our responsibility is to express an opinion on these financial statements based on our audits. We conducted our audits of these financial statements in accordance with the standards of the Public Company Accounting Oversight Board (United States). Those standards require that we plan and perform the audit to obtain reasonable assurance about whether the financial statements are free of material misstatement. An audit includes examining, on a test basis, evidence supporting the amounts and disclosures in the financial statements, assessing the accounting principles used and significant estimates made by management, and evaluating the overall financial statement presentation. We believe that our audits, which included confirmation of securities at October 31, 2010 by correspondence with the custodian and brokers, provide a reasonable basis for our opinion.
PricewaterhouseCoopers LLP
San Francisco, California
December 17, 2010 |
Annual Report | 139
Franklin Value Investors Trust
Tax Designation (unaudited)
Under Section 852(b)(3)(C) of the Internal Revenue Code (Code), the Funds designate the maximum amount allowable but no less than the following amounts as long term capital gain dividends for the fiscal year ended October 31, 2010:

Under Section 854(b)(2) of the Code, the Funds designate the following percentage amounts of the ordinary income dividends as income qualifying for the dividends received deduction for the fiscal year ended October 31, 2010:

Under Section 854(b)(2) of the Code, the Funds designate the maximum amount allowable but no less than the following amounts as qualified dividends for purposes of the maximum rate under Section 1(h)(11) of the Code for the fiscal year ended October 31, 2010:
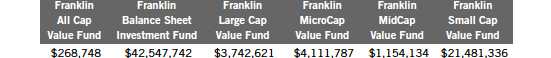
Distributions, including qualified dividend income, paid during calendar year 2010 will be reported to shareholders on Form 1099—DIV in January 2011. Shareholders are advised to check with their tax advisors for information on the treatment of these amounts on their individual income tax returns.
140 | Annual Report
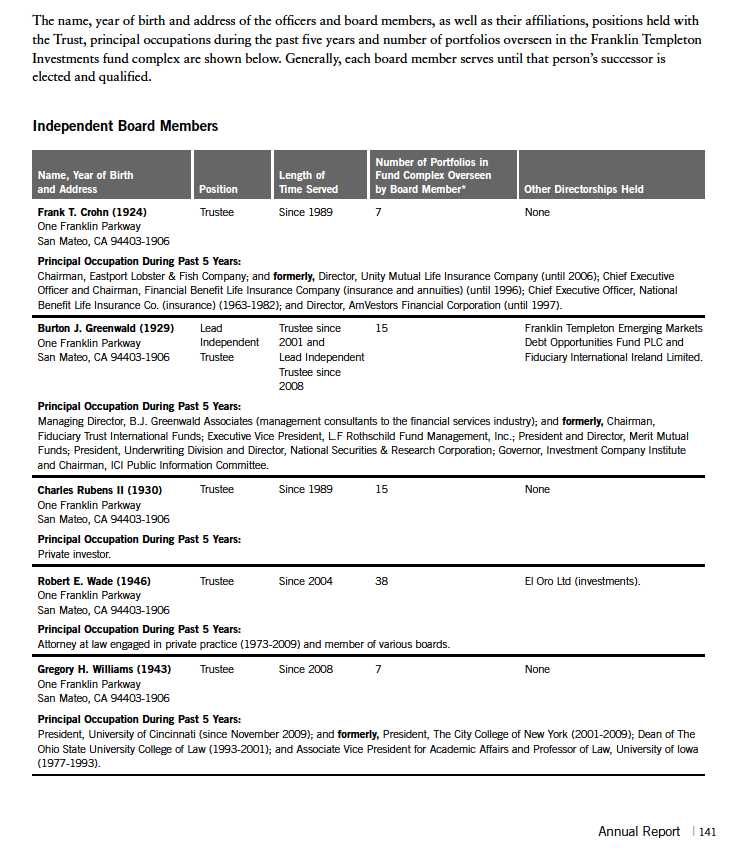
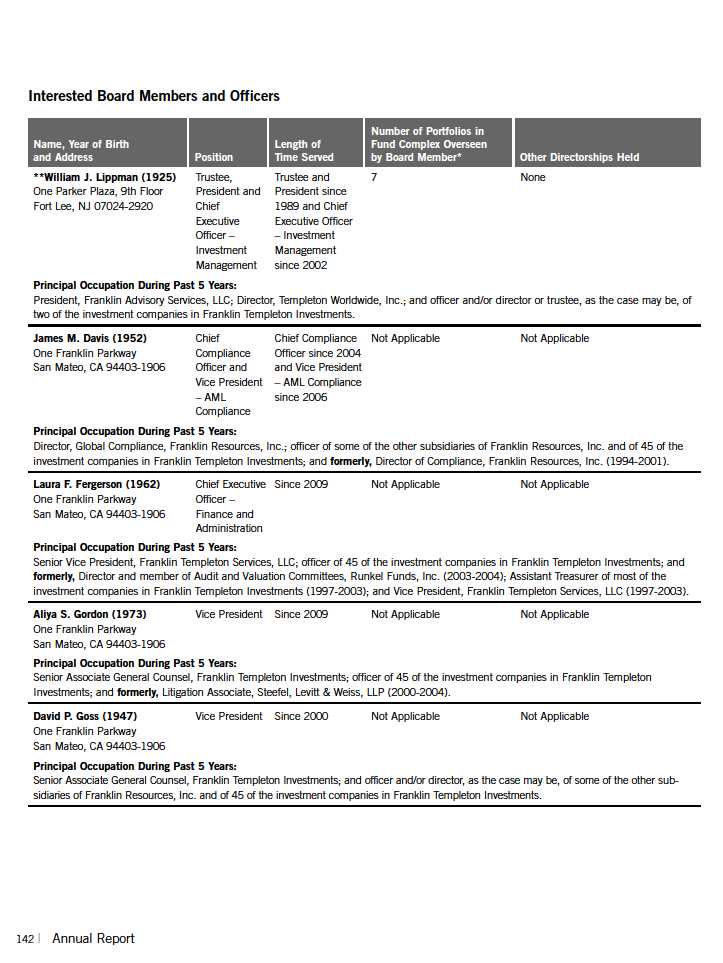

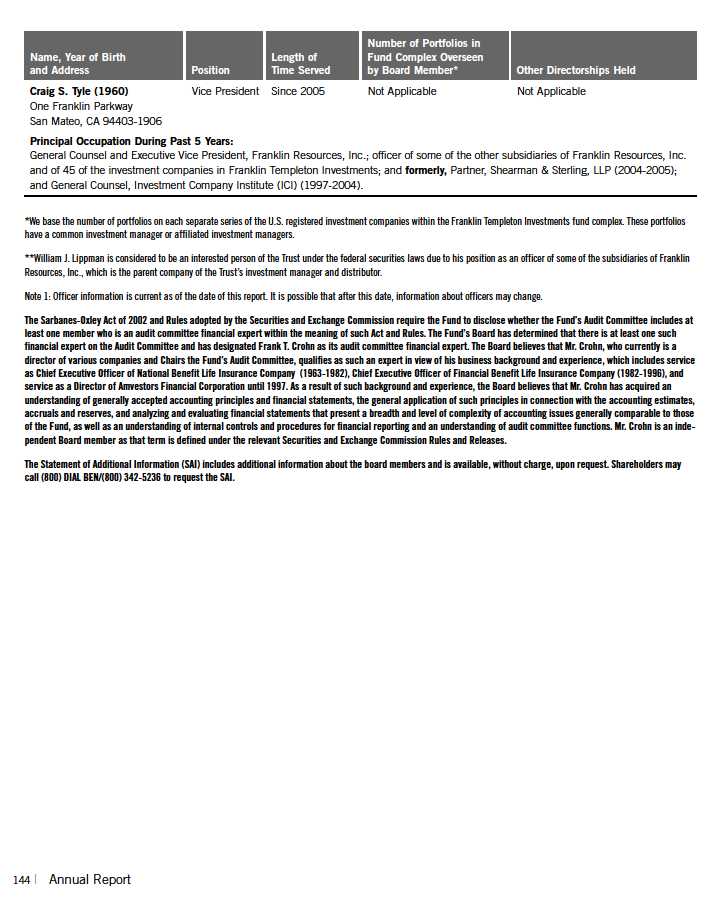
Franklin Value Investors Trust
Shareholder Information
Proxy Voting Policies and Procedures
The Trust’s investment manager has established Proxy Voting Policies and Procedures (Policies) that the Trust uses to determine how to vote proxies relating to portfolio securities. Shareholders may view the Trust’s complete Policies online at franklintempleton.com. Alternatively, shareholders may request copies of the Policies free of charge by calling the Proxy Group collect at (954) 527-7678 or by sending a written request to: Franklin Templeton Companies, LLC, 500 East Broward Boulevard, Suite 1500, Fort Lauderdale, FL 33394, Attention: Proxy Group. Copies of the Trust’s proxy voting records are also made available online at franklintempleton.com and posted on the U.S. Securities and Exchange Commission’s website at sec.gov and reflect the most recent 12-month period ended June 30.
Quarterly Statement of Investments
The Trust files a complete statement of investments with the U.S. Securities and Exchange Commission for the first and third quarters for each fiscal year on Form N-Q. Shareholders may view the filed Form N-Q by visiting the Commission’s website at sec.gov. The filed form may also be viewed and copied at the Commission’s Public Reference Room in Washington, DC. Information regarding the operations of the Public Reference Room may be obtained by calling (800) SEC-0330.
Householding of Reports and Prospectuses
You will receive each Fund’s financial reports every six months as well as an annual updated summary prospectus (prospectus available upon request). To reduce Fund expenses, we try to identify related shareholders in a household and send only one copy of the financial reports and summary prospectus. This process, called “householding,” will continue indefinitely unless you instruct us otherwise. If you prefer not to have these documents householded, please call us at (800) 632-2301. At any time you may view current prospectuses/summary prospectuses and financial reports on our website. If you choose, you may receive these documents through electronic delivery.
Annual Report | 145
This page intentionally left blank.
This page intentionally left blank.
This page intentionally left blank.

| | Sign up for electronic delivery
on franklintempleton. com |
Annual Report and Shareholder Letter
FRANKLIN VALUE INVESTOR S TRUST
| | Investment Manager
Franklin Advisory Services, LLC
Distributor
Franklin Templeton Distributors, Inc.
(800) DIAL BEN®
franklintempleton. com
Shareholder Services
(800) 632-2301 |
Authorized for distribution only when accompanied or preceded by a summary prospectus and/or prospectus. Investors should carefully consider a fund’s investment goals, risks, charges and expenses before investing. A prospectus contains this and other information; please read it carefully before investing.
To ensure the highest quality of service, telephone calls to or from our service departments may be monitored, recorded and accessed. These calls can be identifie d by the presence of a regular beeping tone.
© 2010 Franklin Templeton Investments. All rights reserved.
FVIT A 12/10
Item 2. Code of Ethics.
(a) The Registrant has adopted a code of ethics that applies to its principal executive officers and principal financial and accounting officer.
(c) N/A
(d) N/A
(f) Pursuant to Item 12(a)(1), the Registrant is attaching as an exhibit a copy of its code of ethics that applies to its principal executive officers and principal financial and accounting officer.
Item 3. Audit Committee Financial Expert.
(a)(1) The Registrant has an audit committee financial expert serving on its audit committee.
(2) The audit committee financial expert is Frank T. Crohn and he is "independent" as defined under the relevant Securities and Exchange Commission Rules and Releases.
Item 4. Principal Accountant Fees and Services.
(a) Audit Fees
The aggregate fees paid to the principal accountant for professional services rendered by the principal accountant for the audit of the registrant’s annual financial statements or for services that are normally provided by the principal accountant in connection with statutory and regulatory filings or engagements were $170,410 for the fiscal year ended October 31, 2010 and $172,674 for the fiscal year ended October 31, 2009.
(b) Audit-Related Fees
The aggregate fees paid to the principal accountant for assurance and related services rendered by the principal accountant to the registrant that are reasonably related to the performance of the audit of the registrant's financial statements and are not reported under paragraph (a) of Item 4 were $2,769 for the fiscal year ended October 31, 2010 and $2,650 for the fiscal year ended October 31, 2009. The services for which these fees were paid included attestation services.
There were no fees paid to the principal accountant for assurance and related services rendered by the principal accountant to the registrant's investment adviser and any entity controlling, controlled by or under common control with the investment adviser that provides ongoing services to the registrant that are reasonably related to the performance of the audit of their financial statements.
(c) Tax Fees
There were no fees paid to the principal accountant for professional services rendered by the principal accountant to the registrant for tax compliance, tax advice and tax planning.
The aggregate fees paid to the principal accountant for professional services rendered by the principal accountant to the registrant’s investment adviser and any entity controlling, controlled by or under common control with the investment adviser that provides ongoing services to the registrant for tax compliance, tax advice and tax planning were $35,000 for the fiscal year ended October 31, 2010 and $2,000 for the fiscal year ended October 31, 2009. The services for which these fees were paid included technical tax consultation for capital gain tax reporting to foreign governments and derivative instruments.
(d) All Other Fees
The aggregate fees paid to the principal accountant for products and services rendered by the principal accountant to the registrant not reported in paragraphs (a)-(c) of Item 4 were $1,529 for the fiscal year ended October 31, 2010 and $0 for the fiscal year ended October 31, 2009. The services for which these fees were paid include review of materials provided to the fund Board in connection with the investment management contract renewal process.
The aggregate fees paid to the principal accountant for products and services rendered by the principal accountant to the registrant’s investment adviser and any entity controlling, controlled by or under common control with the investment adviser that provides ongoing services to the registrant not reported in paragraphs (a)-(c) of Item 4 were $143,271 for the fiscal year ended October 31, 2010 and $0 for the fiscal year ended October 31, 2009. The services for which these fees were paid include review of materials provided to the fund Board in connection with the investment management contract renewal process.
(e) (1) The registrant’s audit committee is directly responsible for approving the services to be provided by the auditors, including:
(i) pre-approval of all audit and audit related services;
(ii) pre-approval of all non-audit related services to be provided to the Fund by the auditors;
(iii) pre-approval of all non-audit related services to be provided to the registrant by the auditors to the registrant’s investment adviser or to any entity that controls, is controlled by or is under common control with the registrant’s investment adviser and that provides ongoing services to the registrant where the non-audit services relate directly to the operations or financial reporting of the registrant; and
(iv) establishment by the audit committee, if deemed necessary or appropriate, as an alternative to committee pre-approval of services to be provided by the auditors, as required by paragraphs (ii) and (iii) above, of policies and procedures to permit such services to be pre-approved by other means, such as through establishment of guidelines or by action of a designated member or members of the committee; provided the policies and procedures are detailed as to the particular service and the committee is informed of each service and such policies and procedures do not include delegation of audit committee responsibilities, as contemplated under the Securities Exchange Act of 1934, to management; subject, in the case of (ii) through (iv), to any waivers, exceptions or exemptions that may be available under applicable law or rules.
(e) (2) None of the services provided to the registrant described in paragraphs (b)-(d) of Item 4 were approved by the audit committee pursuant to paragraph (c)(7)(i)(C) of Rule 2-01 of regulation S-X.
(f) No disclosures are required by this Item 4(f).
(g) The aggregate non-audit fees paid to the principal accountant for services rendered by the principal accountant to the registrant and the registrant’s investment adviser and any entity controlling, controlled by or under common control with the investment adviser that provides ongoing services to the registrant were $182,569 for the fiscal year ended October 31, 2010 and $4,650 for the fiscal year ended October 31, 2009.
(h) The registrant’s audit committee of the board has considered whether the provision of non-audit services that were rendered to the registrant’s investment adviser (not including any sub-adviser whose role is primarily portfolio management and is subcontracted with or overseen by another investment adviser), and any entity controlling, controlled by, or under common control with the investment adviser that provides ongoing services to the registrant that were not pre-approved pursuant to paragraph (c)(7)(ii) of Rule 2-01 of Regulation S-X is compatible with maintaining the principal accountant’s independence.
Item 5. Audit Committee of Listed Registrants. N/A
Item 6. Schedule of Investments. N/A
Item 7. Disclosure of Proxy Voting Policies and Procedures for Closed-End Management Investment Companies. N/A
Item 8. Portfolio Managers of Closed-End Management Investment Companies. N/A
Item 9. Purchases of Equity Securities by Closed-End Management Investment Company and Affiliated Purchasers. N/A
Item 10. Submission of Matters to a Vote of Security Holders.
There have been no changes to the procedures by which shareholders may recommend nominees to the Registrant's Board of Trustees that would require disclosure herein.
Item 11. Controls and Procedures.
(a) Evaluation of Disclosure Controls and Procedures. The Registrant maintains disclosure controls and procedures that are designed to ensure that information required to be disclosed in the Registrant’s filings under the Securities Exchange Act of 1934 and the Investment Company Act of 1940 is recorded, processed, summarized and reported within the periods specified in the rules and forms of the Securities and Exchange Commission. Such information is accumulated and communicated to the Registrant’s management, including its principal executive officer and principal financial officer, as appropriate, to allow timely decisions regarding required disclosure. The Registrant’s management, including the principal executive officer and the principal financial officer, recognizes that any set of controls and procedures, no matter how well designed and operated, can provide only reasonable assurance of achieving the desired control objectives.
Within 90 days prior to the filing date of this Shareholder Report on Form N-CSR, the Registrant had carried out an evaluation, under the supervision and with the participation of the Registrant’s management, including the Registrant’s principal executive officer and the Registrant’s principal financial officer, of the effectiveness of the design and operation of the Registrant’s disclosure controls and procedures. Based on such evaluation, the Registrant’s principal executive officer and principal financial officer concluded that the Registrant’s disclosure controls and procedures are effective.
(b) Changes in Internal Controls. There have been no significant changes in the Registrant’s internal controls or in other factors that could significantly affect the internal controls subsequent to the date of their evaluation in connection with the preparation of this Shareholder Report on Form N-CSR.
Item 12. Exhibits.
(a) (1) Code of Ethics
(a) (2) Certifications pursuant to Section 302 of the Sarbanes-Oxley Act of 2002 of Laura F. Fergerson, Chief Executive Officer - Finance and Administration, and Matthew T. Hinkle, Chief Financial Officer and Chief Accounting Officer
(b) Certifications pursuant to Section 906 of the Sarbanes-Oxley Act of 2002 of Laura F. Fergerson, Chief Executive Officer - Finance and Administration, and Matthew T. Hinkle, Chief Financial Officer and Chief Accounting Officer
SIGNATURES
Pursuant to the requirements of the Securities Exchange Act of 1934 and the Investment Company Act of 1940, the registrant has duly caused this report to be signed on its behalf by the undersigned, thereunto duly authorized.
FRANKLIN VALUE INVESTORS TRUST
By /s/ LAURA F. FERGERSON
Laura F. Fergerson
Chief Executive Officer -
Finance and Administration
Date December 28, 2010
Pursuant to the requirements of the Securities Exchange Act of 1934 and the Investment Company Act of 1940, this report has been signed below by the following persons on behalf of the registrant and in the capacities and on the dates indicated.
By /s/ LAURA F. FERGERSON
Laura F. Fergerson
Chief Executive Officer -
Finance and Administration
Date December 28, 2010
By /s/ MATTHEW T. HINKLE
Matthew T. Hinkle
Chief Financial Officer and
Chief Accounting Officer
Date December 28, 2010