Annual Report
Economic and Market Overview
The U.S. economy grew moderately during the 12-month period ended October 31, 2013. Despite a large decline in federal government spending during the fourth quarter of 2012, economic growth improved in 2013, supported by business investment, consumer spending, inventory gains, exports, and state and local government spending. Solid new and existing home sales accompanied historically low mortgage rates, rising but affordable housing prices, low inventories and multi-year lows in new foreclosures. Manufacturing, a mainstay of economic productivity, expanded for most of the period, and the unemployment rate fell to 7.3% in October 2013 from 7.9% a year earlier.1
In the fourth quarter of 2012, financial markets reflected uncertainty surrounding the outcome of the national election and whether Congress would avert automatic federal budget cuts and income tax increases scheduled for the beginning of 2013. Congress passed a budget bill on January 1, 2013, that preserved lower income tax rates for most U.S. households, but Washington’s lack of consensus on proposed expenditure reductions resulted in further across-the-board federal spending cuts starting in March. Federal Reserve Board (Fed) Chairman Ben Bernanke indicated in May that the Fed might reduce monthly purchases of mortgage-backed securities and Treasuries, assuming ongoing U.S. recovery. However, in September, he announced that any tapering of Fed purchases would be postponed until U.S. economic growth strengthened. Because of partisan disagreement about a new health care law, Congress did not authorize some routine federal funding, resulting in a temporary shutdown of non-essential U.S. government services beginning on October 1. On October 17, the partial shutdown ended after Congress agreed to fund the government until January 15, 2014, and raise the debt limit through February 7. Near period-end, the Fed left its monetary policy unchanged as it awaited more evidence of a sustainable economic expansion. The Fed noted that although the government’s fiscal policy may have restrained growth, the economy maintained its underlying strength.
1. Source: Bureau of Labor Statistics.
Annual Report | 3
Rising corporate profits and generally favorable economic data bolstered investor confidence, helping markets overcome brief periods of sell-offs in reaction to Fed statements and to Washington’s fiscal negotiations. U.S. stocks generated strong 12-month returns as the Standard & Poor’s 500 Index (S&P 500®) and Dow Jones Industrial Average (DJIA) reached all-time highs during the period. Additionally, small- and mid-capitalization stocks, as measured by the Russell 2000® Index and the Russell Midcap® Index, reached record highs during the 12-month period and outperformed the S&P 500 and DJIA.2
The foregoing information reflects our analysis and opinions as of October 31, 2013. The information is not a complete analysis of every aspect of any market, country, industry, security or fund. Statements of fact are from sources considered reliable.
2. RUSSELL® is a trademark of the Frank Russell Company.
4 | Annual Report
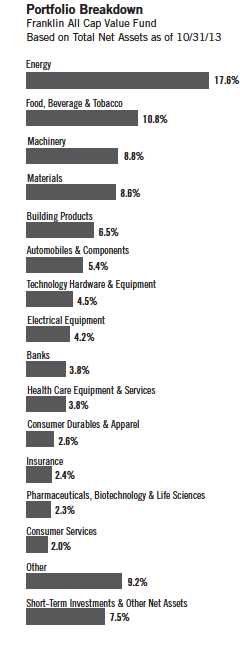
Franklin All Cap Value Fund
Your Fund’s Goal and Main Investments: Franklin All Cap Value Fund seeks long-term total return by primarily investing in stocks of companies of any size that we believe are undervalued at the time of purchase and have the potential for capital appreciation.
We are pleased to bring you Franklin All Cap Value Fund’s annual report for the fiscal year ended October 31, 2013.
Performance Overview
Franklin All Cap Value Fund – Class A delivered a +33.69% cumulative total return for the 12 months under review. In comparison, the Russell 3000® Value Index, which measures performance of those Russell 3000® Index companies with lower price-to-book ratios and lower forecasted growth values, generated a +28.64% total return.1 Although this report covers a 12-month period, our investment strategy aims for long-term results. You can find the Fund’s long-term performance data in the Performance Summary beginning on page 9.
Investment Strategy
Our goal is to invest in stocks of companies of any size that we determine are currently undervalued and have the potential for capital appreciation. The Fund purchases securities that are out of favor in the market for reasons we believe will prove to be temporary, or that appear to be inexpensive measured by factors such as price relative to earnings, book value or cash flow. In addition, the Fund may invest in companies with valuable intangibles we believe are not reflected in the stock price. This strategy is not aimed at short-term trading gains, nor do we consider the composition of any index. Rather, we try to identify attractively priced, financially sound companies that meet our investment criteria, and we assume at purchase that we will hold the positions for several years.
1. Source: © 2013 Morningstar. All Rights Reserved. The information contained herein: (1) is proprietary to Morningstar and/or its content providers; (2) may not be copied or distributed; and (3) is not warranted to be accurate, complete or timely. Neither Morningstar nor its content providers are responsible for any damages or losses arising from any use of this information. The index is unmanaged and includes reinvested dividends. One cannot invest directly in an index, and an index is not representative of the Fund’s portfolio.
The dollar value, number of shares or principal amount, and names of all portfolio holdings are listed in the Fund’s Statement of Investments (SOI). The SOI begins on page 69.
Annual Report | 5
Manager’s Discussion
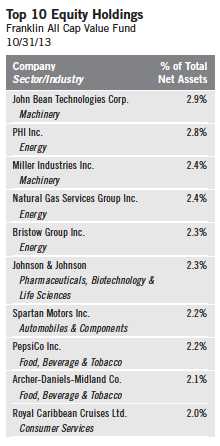
During the 12 months under review, contributors to absolute performance encompassed several of the Fund’s largest holdings. These included food processing equipment manufacturer John Bean Technologies, energy equipment manufacturer Natural Gas Services Group, offshore energy helicopter transportation provider Bristow Group and agribusiness services provider Archer-Daniels-Midland. Automotive systems and building efficiency products manufacturer Johnson Controls also helped performance. John Bean Technologies hired a new chief executive officer, and Natural Gas Services Group reported multiple quarters of double-digit earnings-per-share growth as well as increased utilization and gross margins. Bristow Group experienced strong earnings-per-share growth driven by increased demand for aircraft to support deep water drilling and the award of a major search and rescue contract for the U.K. government. Archer-Daniels-Midland benefited from increased focus on capital allocation, improved asset utilization and a favorable outlook for major crop supplies in 2014. Johnson Controls reported higher third-quarter earnings resulting from its stabilizing automotive business in Europe as well as increased auto sales in Asia and the U.S. Although demand for the company’s building products softened, the company benefited from its strong service business as well as pricing and cost reduction efforts. Johnson Controls also announced an agreement to divest its automotive electronics business.
Most positions contributed to absolute performance, but detractors included fish meal and oil products producer Omega Protein, global software and services provider Microsoft, global information technology software and services provider International Business Machines (IBM) and outdoor power equipment manufacturer Briggs & Stratton. Shares of Omega Protein declined, resulting from news of a subpar start to the commercial fishing season. Microsoft faced a challenging outlook given increased competition for personal computers from alternative devices such as smartphones and tablets.
IBM’s shares underperformed as the company, as well as some of its competitors, reported poor sales growth. In particular, revenue from IBM’s services and hardware segments declined. Briggs & Stratton suffered from an extremely slow start to the spring lawn and garden season and retailers’ cautious approach to managing inventories.
During the Fund’s fiscal year, we initiated positions in 19 new holdings. Some of the largest new purchases were Miller Industries, a manufacturer of vehicle towing and recovery equipment; Baker Hughes, a diversified oil services company; QUALCOMM, a digital communications products and services manufacturer; KeyCorp, a bank holding company; Xylem, a fluid technology and equipment provider; Alcoa, an aluminum producer; Regal-Beloit, an electric motor manufacturer; Universal Stainless & Alloy Products, a specialty steel products manufacturer and marketer; and Omega Protein. We also added to several existing positions including Spartan Motors, a vehicle chassis manufacturer; Bunge, a global agribusiness and food company; U.S. Bancorp, a bank holding company; and Royal Caribbean Cruises, a cruise ship operator, among others. We liquidated our positions in 13 companies including Microsoft, Xerox, Rocky Brands, Nexans and Time Warner Cable. We also reduced several positions, including IDACORP, Kaiser Aluminum, IBM, Natural Gas Services Group and Avista.
There were three all cash takeover announcements during the period: Gardner Denver was acquired by KKR, Maidenform Brands was acquired by HanesBrands, and NV Energy, which was sold during the period, agreed to be acquired by Berkshire Hathaway, with the closing expected in early 2014.
Annual Report | 7

8 | Annual Report
Performance Summary as of 10/31/13
Franklin All Cap Value Fund
Your dividend income will vary depending on dividends or interest paid by securities in the Fund’s portfolio, adjusted for operating expenses of each class. Capital gain distributions are net profits realized from the sale of portfolio securities. The performance table and graphs do not reflect any taxes that a shareholder would pay on Fund dividends, capital gain distributions, if any, or any realized gains on the sale of Fund shares. Total return reflects reinvestment of the Fund’s dividends and capital gain distributions, if any, and any unrealized gains or losses.

Annual Report | 9
Performance Summary (continued)
Performance1
Cumulative total return excludes sales charges. Average annual total returns and value of $10,000 investment include maximum sales charges. Class A: 5.75% maximum initial sales charge; Class C: 1% contingent deferred sales charge in first year only; Class R/Advisor Class: no sales charges.

Performance data represent past performance, which does not guarantee future results. Investment return and principal value will fluctuate, and you may have a gain or loss when you sell your shares. Current performance may differ from figures shown. For most recent month-end performance, go to franklintempleton.com or call (800) 342-5236.
10 | Annual Report

Annual Report | 11

12 | Annual Report
Performance Summary (continued)
Endnotes
All investments involve risks, including possible loss of principal. Value securities may not increase in price as anticipated or may decline further in value. While smaller and midsize companies may offer substantial opportunities for capital growth, they also involve heightened risks and should be considered speculative. Historically, smaller and midsize company securities have been more volatile in price than larger company securities, especially over the short term. The Fund may invest up to 25% of its total assets in foreign securities, which may involve special risks, including currency fluctuations and economic and political uncertainty. The Fund is actively managed but there is no guarantee that the manager’s investment decisions will produce the desired results. The Fund’s prospectus also includes a description of the main investment risks.
| |
Class C: Class R: | These shares have higher annual fees and expenses than Class A shares. Shares are available to certain eligible investors as described in the prospectus. These shares have higher annual fees and expenses than Class A shares. |
Advisor Class: | Shares are available to certain eligible investors as described in the prospectus. |
1. The Fund has an expense reduction contractually guaranteed through at least 2/28/14 and a fee waiver associated with its investments in a Franklin Templeton money fund, contractually guaranteed through at least its current fiscal year end. Fund investment results reflect the expense reduction and fee waiver, to the extent applicable; without these reductions, the results would have been lower.
2. Cumulative total return represents the change in value of an investment over the periods indicated.
3. Average annual total return represents the average annual change in value of an investment over the periods indicated. 4. These figures represent the value of a hypothetical $10,000 investment in the Fund over the periods indicated.
5. In accordance with SEC rules, we provide standardized average annual total return information through the latest calendar quarter.
6. Figures are as stated in the Fund’s current prospectus. In periods of market volatility, assets may decline significantly, causing total annual Fund operating expenses to become higher than the figures shown.
7. Source: © 2013 Morningstar. The Russell 3000® Value Index is market capitalization weighted and measures performance of those Russell 3000® Index companies with lower price-to-book ratios and lower forecasted growth values. The Consumer Price Index (CPI), calculated by the Bureau of Labor Statistics, is a commonly used measure of the inflation rate.
Annual Report | 13
Your Fund’s Expenses
Franklin All Cap Value Fund
As a Fund shareholder, you can incur two types of costs:
- Transaction costs, including sales charges (loads) on Fund purchases; and
- Ongoing Fund costs, including management fees, distribution and service (12b-1) fees, and other Fund expenses. All mutual funds have ongoing costs, sometimes referred to as operating expenses.
The following table shows ongoing costs of investing in the Fund and can help you understand these costs and compare them with those of other mutual funds. The table assumes a $1,000 investment held for the six months indicated.
Actual Fund Expenses
The first line (Actual) for each share class listed in the table provides actual account values and expenses. The “Ending Account Value” is derived from the Fund’s actual return, which includes the effect of Fund expenses.
You can estimate the expenses you paid during the period by following these steps. Of course, your account value and expenses will differ from those in this illustration:
| 1. | Divide your account value by $1,000. |
| | If an account had an $8,600 value, then $8,600 ÷ $1,000 = 8.6. |
| 2. | Multiply the result by the number under the heading “Expenses Paid During Period.” |
| | If Expenses Paid During Period were $7.50, then 8.6 x $7.50 = $64.50. |
In this illustration, the estimated expenses paid this period are $64.50.
Hypothetical Example for Comparison with Other Funds
Information in the second line (Hypothetical) for each class in the table can help you compare ongoing costs of investing in the Fund with those of other mutual funds. This information may not be used to estimate the actual ending account balance or expenses you paid during the period. The hypothetical “Ending Account Value” is based on the actual expense ratio for each class and an assumed 5% annual rate of return before expenses, which does not represent the Fund’s actual return. The figure under the heading “Expenses Paid During Period” shows the hypothetical expenses your account would have incurred under this scenario. You can compare this figure with the 5% hypothetical examples that appear in shareholder reports of other funds.
14 | Annual Report
Your Fund’s Expenses (continued)
Please note that expenses shown in the table are meant to highlight ongoing costs and do not reflect any transaction costs, such as sales charges. Therefore, the second line for each class is useful in comparing ongoing costs only, and will not help you compare total costs of owning different funds. In addition, if transaction costs were included, your total costs would have been higher. Please refer to the Fund prospectus for additional information on operating expenses.

*Expenses are calculated using the most recent six-month expense ratio, net of expense waivers, annualized for each class (A: 1.23%; C: 1.93%;
R: 1.43%; and Advisor: 0.93%), multiplied by the average account value over the period, multiplied by 184/365 to reflect the one-half year period.
Annual Report | 15
Franklin Balance Sheet Investment Fund
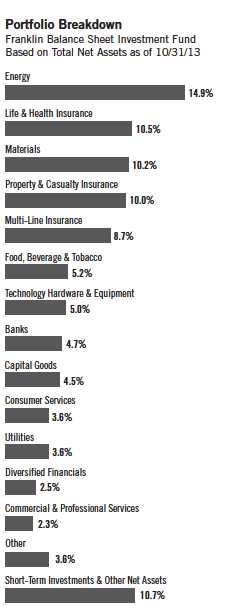
Your Fund’s Goal and Main Investments: Franklin Balance Sheet Investment Fund seeks high total return, of which capital appreciation and income are components, by investing most of its assets in equity securities of companies of any size that we believe are undervalued in the marketplace at the time of purchase but have the potential for capital appreciation.
Performance data represent past performance, which does not guarantee future results. Investment return and principal value will fluctuate, and you may have a gain or loss when you sell your shares. Current performance may differ from figures shown. Please visit franklintempleton.com or call (800) 342-5236 for most recent month-end performance.
We are pleased to bring you Franklin Balance Sheet Investment Fund’s annual report for the fiscal year ended October 31, 2013.
Performance Overview
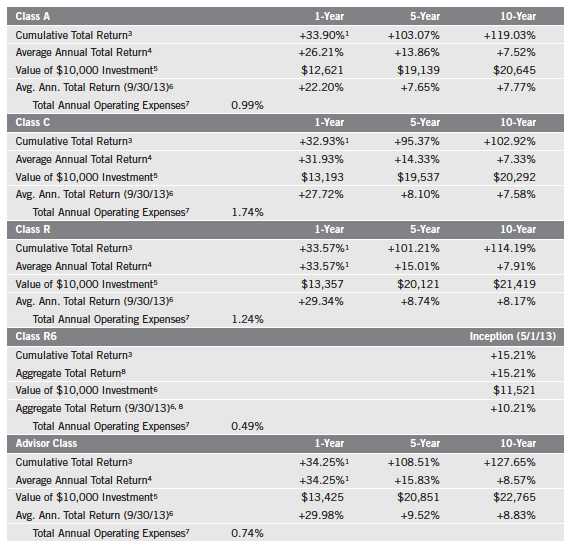
Franklin Balance Sheet Investment Fund – Class A delivered a +33.90% cumulative total return for the 12 months under review. In comparison, the Russell 3000® Value Index, which measures performance of those Russell 3000® Index companies with lower price-to-book ratios and lower forecasted growth values, generated a +28.64% total return.1 Although this report covers a 12-month period, our investment strategy aims for long-term results. You can find the Fund’s long-term performance data in the Performance Summary beginning on page 19.
Investment Strategy
Our strategy is to buy shares of financially sound, well-established companies at a low price-to-book value when we have reasonable confidence that book value will increase over several years. Book value per share is a company’s net worth or shareholders’ equity on an accounting or “book” basis, divided by shares outstanding. We generally define “low price-to-book value” as the lower two deciles (20%) of our investable universe, which we derive from a proprietary database for screening purposes. This strategy is not aimed at short-term trading gains, nor do we consider the composition of any index. Rather, we try to identify individual companies that meet our investment criteria, and we assume at purchase that we will hold the positions for several years.
1. Source: © 2013 Morningstar. All Rights Reserved. The information contained herein: (1) is proprietary to Morningstar and/or its content providers; (2) may not be copied or distributed; and (3) is not warranted to be accurate, complete or timely. Neither Morningstar nor its content providers are responsible for any damages or losses arising from any use of this information. The index is unmanaged and includes reinvested dividends. One cannot invest directly in an index, and an index is not representative of the Fund’s portfolio.
The dollar value, number of shares or principal amount, and names of all portfolio holdings are listed in the Fund’s Statement of Investments (SOI). The SOI begins on page 77.
16 | Annual Report
Manager’s Discussion
On October 31, 2013, the Fund’s total net assets were $1.48 billion, with short-term investments and other net assets making up 10.7%, compared with total net assets of $1.3 billion and short-term investments and other net assets of 2.4% on October 31, 2012.
During the Fund’s fiscal year, contributors to absolute Fund performance included several financials sector holdings, notably insurers StanCorp Financial Group, Old Republic International, E-L Financial, Assurant and Prudential Financial.2 StanCorp Financial Group benefited as fundamentals in group underwriting continued to improve, reversing a negative outlook for the stock. Old Republic International saw positive trends in its key insurance lines, and announced a plan to recapitalize and spin off its mortgage insurance business. Assurant negotiated with regulators to achieve favorable policy changes in its property business, while Prudential Financial and E-L Financial were expected, along with other life insurers, to benefit from an eventual increase in interest rates. E-L Financial also sold its property casualty business to Travelers.
Detractors from Fund performance included Ruby Tuesday (casual dining restaurant operator), McDermott International (oil and gas subsea construction), Sherritt International (oils, metals, coal) and ESCO Technologies (engineered products and systems). Ruby Tuesday reported poor first-quarter operating results and lowered its guidance for the remainder of its fiscal year 2014. McDermott International, a recent addition to the portfolio, sought to improve execution on several large construction contracts. Sherritt International’s poorly timed investment in new nickel production left it with a weak balance sheet in a depressed environment for nickel prices. ESCO Technologies put its troubled water metering business up for sale, leaving the company’s near-term earnings power in doubt.
During the reporting period, we identified five new investment opportunities: Devon Energy and Apache, oil and natural gas exploration and production companies; Alcoa, an aluminum producer; and the aforementioned Ruby Tuesday and McDermott International. We also added to existing positions in Bunge, a global agribusiness and food company; Royal Caribbean Cruises, a cruise ship operator; Corning, a specialty glass and ceramics manufacturer; Comerica, a bank holding company; and Valero Energy, an independent petroleum refining and marketing company, among others. Cash deployed into new or existing positions totaled $145 million.
2. The financials sector comprises banks, diversified financials, life and health insurance, multi-line insurance, property and casualty insurance, and reinsurance in the SOI.
Annual Report | 17

18 | Annual Report
Performance Summary as of 10/31/13
Franklin Balance Sheet Investment Fund
Your dividend income will vary depending on dividends or interest paid by securities in the Fund’s portfolio, adjusted for operating expenses of each class. Capital gain distributions are net profits realized from the sale of portfolio securities. The performance table and graphs do not reflect any taxes that a shareholder would pay on Fund dividends, capital gain distributions, if any, or any realized gains on the sale of Fund shares. Total return reflects reinvestment of the Fund’s dividends and capital gain distributions, if any, and any unrealized gains or losses.
Annual Report | 19
Performance Summary (continued)
Performance2
Cumulative total return excludes sales charges. Aggregate and average annual total returns and value of $10,000 invest-ment include maximum sales charges. Class A: 5.75% maximum initial sales charge; Class C: 1% contingent deferred sales charge in first year only; Class R/R6/Advisor Class: no sales charges.
Performance data represent past performance, which does not guarantee future results. Investment return and principal value will fluctuate, and you may have a gain or loss when you sell your shares. Current performance may differ from figures shown. For most recent month-end performance, go to franklintempleton.com or call (800) 342-5236.
20 | Annual Report
Performance Summary (continued)
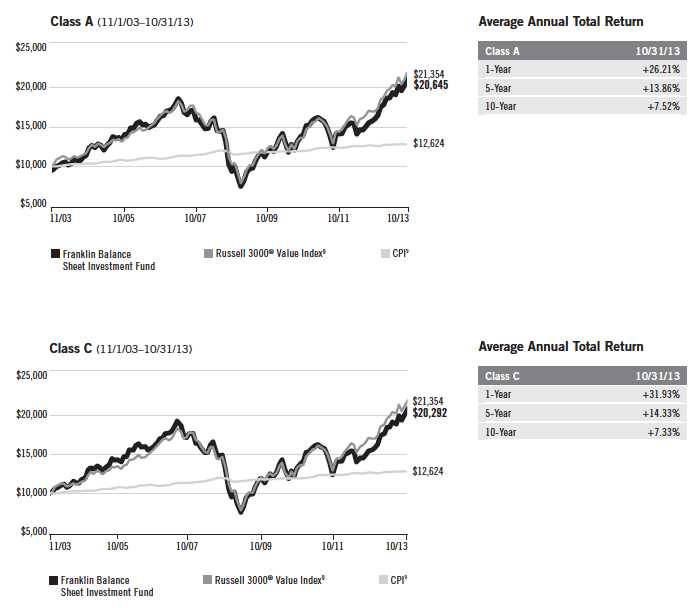
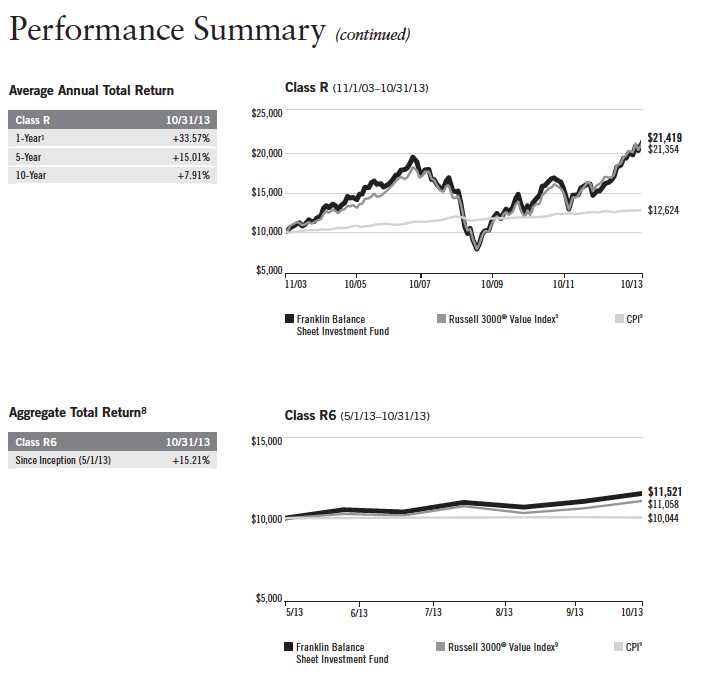
Total Return Index Comparison for a Hypothetical $10,000 Investment2
Total return represents the change in value of an investment over the periods shown. It includes any current, applicable, maximum sales charge, Fund expenses, account fees and reinvested distributions. The unmanaged index includes reinvestment of any income or distributions. It differs from the Fund in composition and does not pay management fees or expenses. One cannot invest directly in an index.
Annual Report | 21
22 | Annual Report

Endnotes
All investments involve risks, including possible loss of principal. Value securities may not increase in price as anticipated or may decline further in value. While smaller and midsize companies may offer substantial opportunities for capital growth, they also involve heightened risks and should be considered speculative. Historically, smaller and midsize company securities have been more volatile in price than larger company securities, especially over the short term. The Fund may invest up to 25% of its total assets in foreign securities, which may involve special risks, including currency fluctuations and economic and political uncertainty. The Fund is actively managed but there is no guarantee that the manager’s investment decisions will produce the desired results. The Fund’s prospectus also includes a description of the main investment risks.
| |
Class C: | Prior to 1/1/04, these shares were offered with an initial sales charge; thus actual total returns would have differed. These shares have higher annual fees and expenses than Class A shares. |
Class R: | Shares are available to certain eligible investors as described in the prospectus. These shares have higher annual fees and expenses than Class A shares. |
Class R6: Advisor Class: | Shares are available to certain eligible investors as described in the prospectus. Shares are available to certain eligible investors as described in the prospectus. |
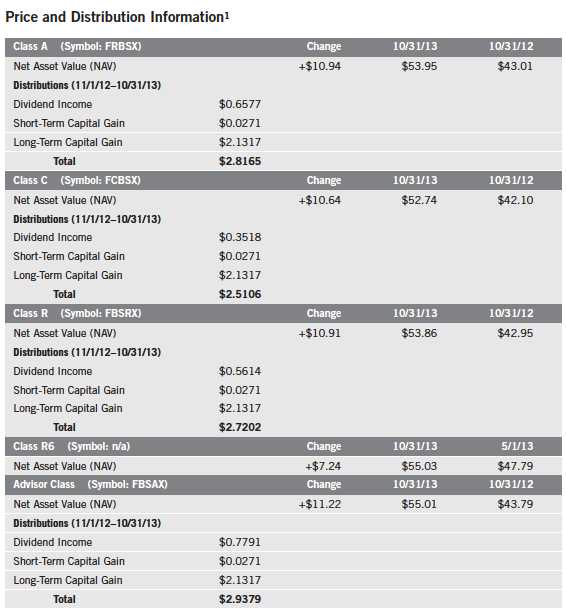
1. Price and total return information is based on net asset values calculated for shareholder transactions. Certain adjustments were made to the net assets of the Fund at 10/31/13 for financial reporting purposes, and as a result, the net asset values for shareholder transactions and the total returns based on those net asset values differ from the adjusted net asset values and total returns reported in the Financial Highlights.
2. The Fund has a fee waiver associated with its investments in a Franklin Templeton money fund, contractually guaranteed through at least its current fiscal year end. Fund investment results reflect the fee waiver, to the extent applicable; without this reduction, the results would have been lower.
3. Cumulative total return represents the change in value of an investment over the periods indicated.
4. Average annual total return represents the average annual change in value of an investment over the periods indicated. 5. These figures represent the value of a hypothetical $10,000 investment in the Fund over the periods indicated.
6. In accordance with SEC rules, we provide standardized average annual total return information through the latest calendar quarter.
7. Figures are as stated in the Fund’s current prospectus. In periods of market volatility, assets may decline significantly, causing total annual Fund operating expenses to become higher than the figures shown.
8. Aggregate total return represents the change in value of an investment for the period indicated. Since Class R6 shares have existed for less than one year, average annual total return is not available.
9. Source: © 2013 Morningstar. The Russell 3000® Value Index is market capitalization weighted and measures performance of those Russell 3000® Index companies with lower price-to-book ratios and lower forecasted growth values. The Consumer Price Index (CPI), calculated by the Bureau of Labor Statistics, is a commonly used measure of the inflation rate.
Annual Report | 23
Your Fund’s Expenses
Franklin Balance Sheet Investment Fund
As a Fund shareholder, you can incur two types of costs:
- Transaction costs, including sales charges (loads) on Fund purchases; and
- Ongoing Fund costs, including management fees, distribution and service (12b-1) fees, and other Fund expenses. All mutual funds have ongoing costs, sometimes referred to as operating expenses.
The following table shows ongoing costs of investing in the Fund and can help you understand these costs and compare them with those of other mutual funds. The table assumes a $1,000 investment held for the six months indicated.
Actual Fund Expenses
The first line (Actual) for each share class listed in the table provides actual account values and expenses. The “Ending Account Value” is derived from the Fund’s actual return, which includes the effect of Fund expenses.
You can estimate the expenses you paid during the period by following these steps. Of course, your account value and expenses will differ from those in this illustration:
| 1. | Divide your account value by $1,000. |
| | If an account had an $8,600 value, then $8,600 ÷ $1,000 = 8.6. |
| 2. | Multiply the result by the number under the heading “Expenses Paid During Period.” |
| | If Expenses Paid During Period were $7.50, then 8.6 x $7.50 = $64.50. |
In this illustration, the estimated expenses paid this period are $64.50.
Hypothetical Example for Comparison with Other Funds
Information in the second line (Hypothetical) for each class in the table can help you compare ongoing costs of investing in the Fund with those of other mutual funds. This information may not be used to estimate the actual ending account balance or expenses you paid during the period. The hypothetical “Ending Account Value” is based on the actual expense ratio for each class and an assumed 5% annual rate of return before expenses, which does not represent the Fund’s actual return. The figure under the heading “Expenses Paid During Period” shows the hypothetical expenses your account would have incurred under this scenario. You can compare this figure with the 5% hypothetical examples that appear in shareholder reports of other funds.
24 | Annual Report
Your Fund’s Expenses (continued)
Please note that expenses shown in the table are meant to highlight ongoing costs and do not reflect any transaction costs, such as sales charges. Therefore, the second line for each class is useful in comparing ongoing costs only, and will not help you compare total costs of owning different funds. In addition, if transaction costs were included, your total costs would have been higher. Please refer to the Fund prospectus for additional information on operating expenses.
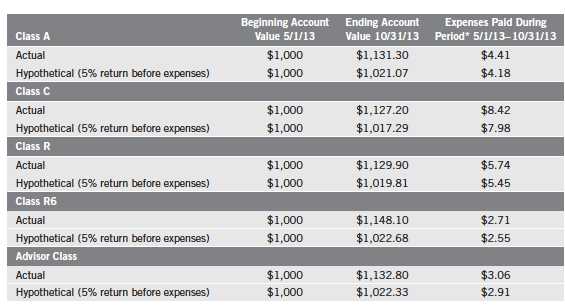
*Expenses are calculated using the most recent six-month expense ratio, annualized for each class (A: 0.82%; C: 1.57%; R: 1.07%; R6: 0.51% (net of expense waivers); and Advisor: 0.57%), multiplied by the average account value over the period, multiplied by 184/365 to reflect the one-half year period.
Annual Report | 25
Franklin Large Cap Value Fund
Your Fund’s Goal and Main Investments: Franklin Large Cap Value Fund seeks long-term capital appreciation by investing at least 80% of its net assets in large capitalization companies that we believe are undervalued. We define large capitalization companies as those with market capitalizations that are similar in size at the time of purchase to those in the Russell 1000® Index.1
We are pleased to bring you Franklin Large Cap Value Fund’s annual report for the fiscal year ended October 31, 2013.
Performance Overview
Franklin Large Cap Value Fund – Class A delivered a +30.53% cumulative total return for the 12 months under review. In comparison, the Russell 1000® Value Index, which measures performance of those Russell 1000® Index companies with lower price-to-book ratios and lower forecasted growth values, generated a +28.29% total return.2 Although this report covers a 12-month period, our investment strategy aims for long-term results. You can find the Fund’s long-term performance data in the Performance Summary beginning on page 29.
Investment Strategy
We seek to invest in securities of large capitalization companies that we believe are selling below their underlying worth and hold them until they reach what we consider their fair market value. Our aim is to construct a diversified portfolio of fundamentally sound companies purchased at attractive prices, often when they are out of favor with other investors for reasons we believe are temporary. Portfolio securities are selected without regard to benchmark comparisons and are based on fundamental, bottom-up research focusing on several criteria, such as low price relative to earnings, cash flow or book value. We also consider stocks with recent sharp price declines that we believe still have significant growth potential or that possess valuable intangibles not reflected in the stock price.
1. The Russell 1000® Index is market capitalization weighted and measures performance of the largest companies in the Russell 3000® Index, which represents the majority of the U.S. market’s total market capitalization.
2. Source: © 2013 Morningstar. All Rights Reserved. The information contained herein: (1) is proprietary to Morningstar and/or its content providers; (2) may not be copied or distributed; and (3) is not warranted to be accurate, complete or timely. Neither Morningstar nor its content providers are responsible for any damages or losses arising from any use of this information. The index is unmanaged and includes reinvested dividends. One cannot invest directly in an index, and an index is not representative of the Fund’s portfolio.
The dollar value, number of shares or principal amount, and names of all portfolio holdings are listed in the Fund’s Statement of Investments (SOI). The SOI begins on page 85.
26 | Annual Report
Manager’s Discussion
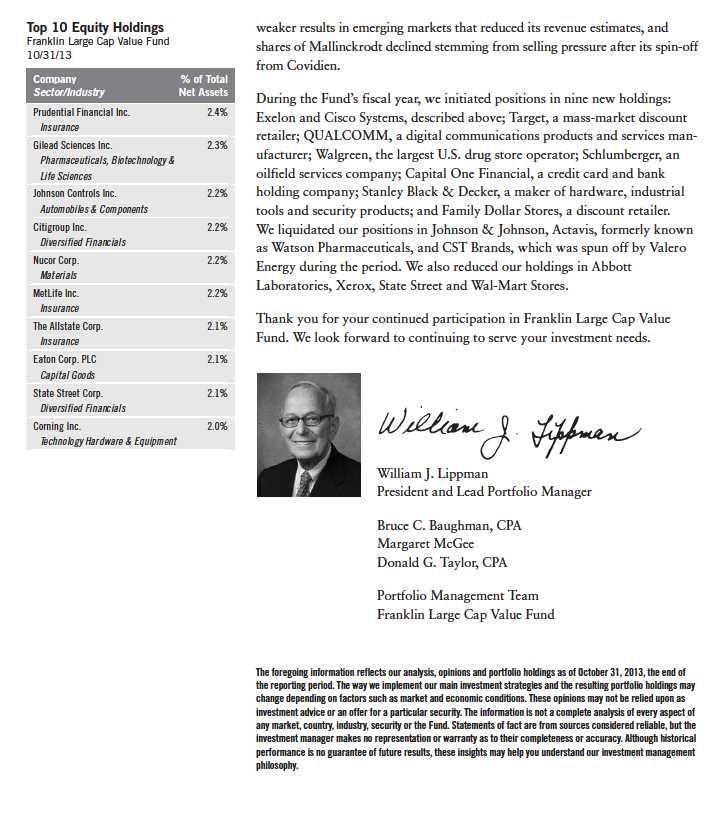
During the 12 months under review, financials sector holdings contributed to absolute Fund performance, most notably financial services providers Prudential Financial and State Street.3 Industrials and consumer discretionary sector holdings also contributed to results, especially automotive systems and building efficiency products manufacturer Johnson Controls and industrial products and equipment manufacturer Dover.4 The Fund’s health care sector holdings also aided performance, led by biopharmaceutical firm Gilead Sciences.5 Prudential Financial and State Street were expected to benefit from an eventual increase in interest rates. Johnson Controls reported higher third-quarter earnings resulting from its stabilizing automotive business in Europe as well as increased auto sales in Asia and the U.S. Although demand for the company’s building products softened, the company benefited from its strong service business as well as pricing and cost reduction efforts. Johnson Controls also announced an agreement to divest its struggling automotive electronics business. Dover experienced strength in its businesses serving the consumer electronics and refrigeration markets that led to stronger-than-expected sales and earnings growth. The company also announced its intention to spin off several businesses in its communication technologies segment. Gilead Sciences announced favorable trial results for a potential hepatitis C drug, and optimism continued to surround its new HIV drug, Stribild.
Most investment sectors and positions held by the Fund contributed to absolute performance, but some detractors included electric utility Exelon, drug maker Teva Pharmaceutical Industries, global information technology software and services provider International Business Machines (IBM), data networking equipment and software supplier Cisco Systems and specialty drug and diagnostic imaging equipment manufacturer Mallinckrodt. Lower energy prices and weak electricity demand contributed to falling quarterly profits for electric utility Exelon, the largest owner of U.S. nuclear power plants. Teva Pharmaceutical Industries suffered from management transition, weakness in its core generics business in the U.S. and Europe, and concerns about a major drug coming off patent in 2015. IBM reported increased net income and earnings in the fourth quarter of 2012. In subsequent quarters, however, IBM’s shares underperformed as the company, as well as some of its competitors, reported poor sales growth. In particular, revenue from IBM’s services and hardware segments declined. Shares of Cisco Systems faltered because of
3. The financials sector comprises banks, diversified financials and insurance in the SOI.
4. The industrials sector comprises capital goods and transportation in the SOI. The consumer discretionary sector comprises consumer durables and apparel, consumer services and retailing in the SOI.
5. The health care sector comprises health care equipment and services; and pharmaceuticals, biotechnology and life sciences in the SOI.
Annual Report | 27
28 | Annual Report
Performance Summary as of 10/31/13
Franklin Large Cap Value Fund
Your dividend income will vary depending on dividends or interest paid by securities in the Fund’s portfolio, adjusted for operating expenses of each class. Capital gain distributions are net profits realized from the sale of portfolio securities. The performance table and graphs do not reflect any taxes that a shareholder would pay on Fund dividends, capital gain distributions, if any, or any realized gains on the sale of Fund shares. Total return reflects reinvestment of the Fund’s dividends and capital gain distributions, if any, and any unrealized gains or losses.
Annual Report | 29
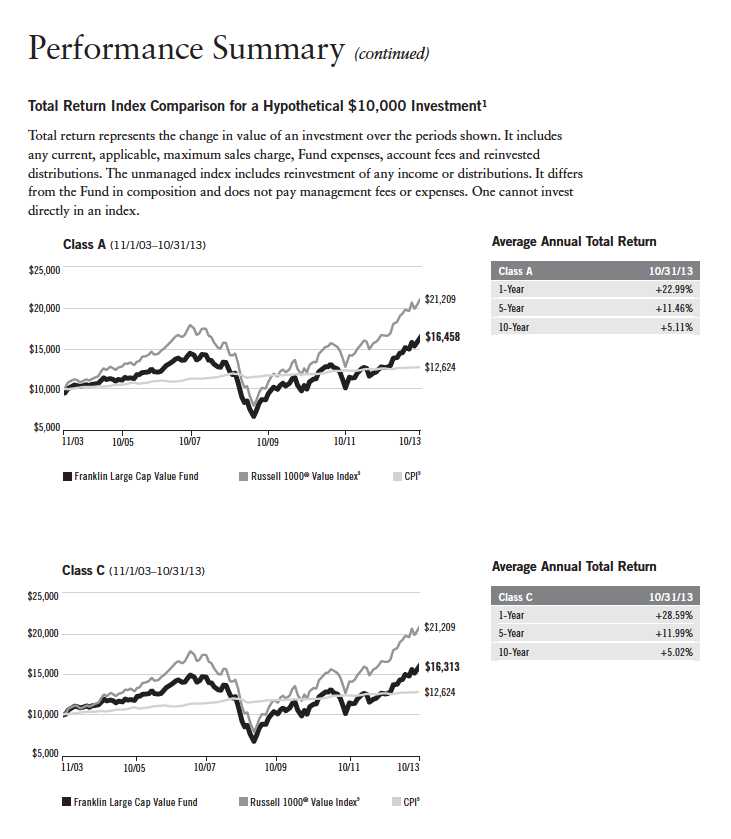
Performance Summary (continued)
Performance1
Cumulative total return excludes sales charges. Aggregate and average annual total returns and value of $10,000 invest-ment include maximum sales charges. Class A: 5.75% maximum initial sales charge; Class C: 1% contingent deferred sales charge in first year only; Class R/R6/Advisor Class: no sales charges.
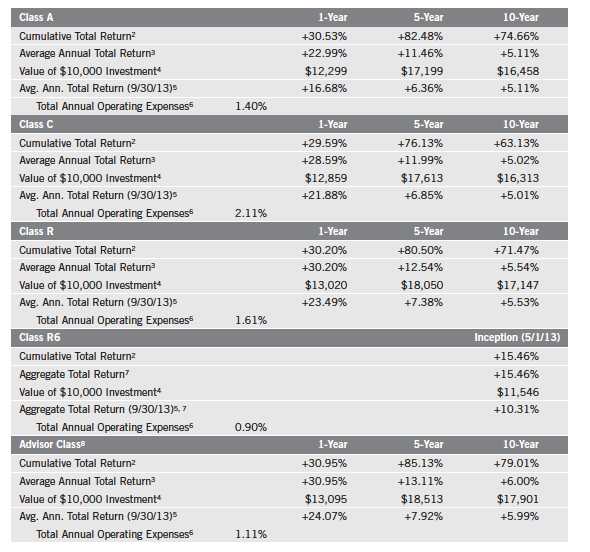
Performance data represent past performance, which does not guarantee future results. Investment return and principal value will fluctuate, and you may have a gain or loss when you sell your shares. Current performance may differ from figures shown. For most recent month-end performance, go to franklintempleton.com or call (800) 342-5236.
30 | Annual Report
Annual Report | 31

32 | Annual Report

Endnotes
All investments involve risks, including possible loss of principal. Stock prices fluctuate, sometimes rapidly and dramatically, due to factors affecting individual companies, particular industries or sectors, or general market conditions. These price movements may result from factors affecting individual companies, industries or the securities market as a whole. The Fund may invest up to 25% of its total assets in foreign securities, which may involve special risks, including currency fluctuations and economic and political uncertainty. The Fund is actively managed but there is no guarantee that the manager’s investment decisions will produce the desired results. The Fund’s prospectus also includes a description of the main investment risks.
| |
Class C: | Prior to 1/1/04, these shares were offered with an initial sales charge; thus actual total returns would have differed. These shares have higher annual fees and expenses than Class A shares. |
Class R: | Shares are available to certain eligible investors as described in the prospectus. These shares have higher annual fees and expenses than Class A shares. |
Class R6: Advisor Class: | Shares are available to certain eligible investors as described in the prospectus. Shares are available to certain eligible investors as described in the prospectus. |
1. The Fund has a fee waiver associated with its investments in a Franklin Templeton money fund, contractually guaranteed through at least its current fiscal year end. Fund investment results reflect the fee waiver, to the extent applicable; without this reduction, the results would have been lower.
2. Cumulative total return represents the change in value of an investment over the periods indicated.
3. Average annual total return represents the average annual change in value of an investment over the periods indicated. 4. These figures represent the value of a hypothetical $10,000 investment in the Fund over the periods indicated.
5. In accordance with SEC rules, we provide standardized average annual total return information through the latest calendar quarter.
6. Figures are as stated in the Fund’s current prospectus. In periods of market volatility, assets may decline significantly, causing total annual Fund operating expenses to become higher than the figures shown.
7. Aggregate total return represents the change in value of an investment for the period indicated. Since Class R6 shares have existed for less than one year, average annual total return is not available.
8. Effective 11/1/05, the Fund began offering Advisor Class shares, which do not have sales charges or a Rule 12b-1 plan. Performance quotations for this class reflect the following methods of calculation: (a) For periods prior to 11/1/05, a restated figure is used based upon the Fund’s Class A performance, excluding the effect of Class A’s maximum initial sales charge, but reflecting the effect of the Class A Rule 12b-1 fees; and (b) for periods after 11/1/05, actual Advisor Class performance is used reflecting all charges and fees applicable to that class. Since 11/1/05 (commencement of sales), the cumulative and average annual total returns of Advisor Class shares were +49.99% and +5.20%.
9. Source: © 2013 Morningstar. The Russell 1000® Value Index is market capitalization weighted and measures performance of those Russell 1000® Index companies with lower price-to-book ratios and lower forecasted growth values. The Consumer Price Index (CPI), calculated by the Bureau of Labor Statistics, is a commonly used measure of the inflation rate.
Annual Report | 33
Your Fund’s Expenses
Franklin Large Cap Value Fund
As a Fund shareholder, you can incur two types of costs:
- Transaction costs, including sales charges (loads) on Fund purchases; and
- Ongoing Fund costs, including management fees, distribution and service (12b-1) fees, and other Fund expenses. All mutual funds have ongoing costs, sometimes referred to as operating expenses.
The following table shows ongoing costs of investing in the Fund and can help you understand these costs and compare them with those of other mutual funds. The table assumes a $1,000 investment held for the six months indicated.
Actual Fund Expenses
The first line (Actual) for each share class listed in the table provides actual account values and expenses. The “Ending Account Value” is derived from the Fund’s actual return, which includes the effect of Fund expenses.
You can estimate the expenses you paid during the period by following these steps. Of course, your account value and expenses will differ from those in this illustration:
| 1. | Divide your account value by $1,000. |
| | If an account had an $8,600 value, then $8,600 ÷ $1,000 = 8.6. |
| 2. | Multiply the result by the number under the heading “Expenses Paid During Period.” |
| | If Expenses Paid During Period were $7.50, then 8.6 x $7.50 = $64.50. |
In this illustration, the estimated expenses paid this period are $64.50.
Hypothetical Example for Comparison with Other Funds
Information in the second line (Hypothetical) for each class in the table can help you compare ongoing costs of investing in the Fund with those of other mutual funds. This information may not be used to estimate the actual ending account balance or expenses you paid during the period. The hypothetical “Ending Account Value” is based on the actual expense ratio for each class and an assumed 5% annual rate of return before expenses, which does not represent the Fund’s actual return. The figure under the heading “Expenses Paid During Period” shows the hypothetical expenses your account would have incurred under this scenario. You can compare this figure with the 5% hypothetical examples that appear in shareholder reports of other funds.
34 | Annual Report
Your Fund’s Expenses (continued)
Please note that expenses shown in the table are meant to highlight ongoing costs and do not reflect any transaction costs, such as sales charges. Therefore, the second line for each class is useful in comparing ongoing costs only, and will not help you compare total costs of owning different funds. In addition, if transaction costs were included, your total costs would have been higher. Please refer to the Fund prospectus for additional information on operating expenses.

*Expenses are calculated using the most recent six-month expense ratio, annualized for each class (A: 1.33%; C: 2.05%; R: 1.55%; R6: 0.87% (net of expense waivers); and Advisor: 1.05%), multiplied by the average account value over the period, multiplied by 184/365 to reflect the one-half year period.
Annual Report | 35
Franklin MicroCap Value Fund
Your Fund’s Goal and Main Investments: Franklin MicroCap Value Fund seeks high total return, of which capital appreciation and income are components, by investing at least 80% of its net assets in securities of companies with market capitalizations under $500 million at the time of purchase that we believe are undervalued in the marketplace.1

We are pleased to bring you Franklin MicroCap Value Fund’s annual report for the fiscal year ended October 31, 2013.
Performance Overview
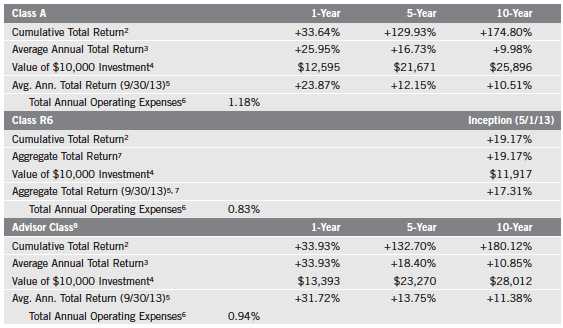
Franklin MicroCap Value Fund – Class A delivered a +33.64% cumulative total return for the 12 months under review. In comparison, the Russell 2000® Value Index, which measures performance of those Russell 2000® Index companies with lower price-to-book ratios and lower forecasted growth values, generated a +32.83% total return.2 Although this report covers a 12-month period, our investment strategy aims for long-term results. You can find the Fund’s long-term performance data in the Performance Summary beginning on page 39.
Investment Strategy
Our strategy is to buy shares of financially sound, well-established companies at a low price-to-book value, where we have reasonable confidence that book value will increase over several years. We limit purchases to companies with market capitalizations of less than $500 million, which we define as “microcap.”1 Book value per share is a company’s net worth or shareholders’ equity on an accounting or “book” basis, divided by shares outstanding. This strategy is not aimed at short-term trading gains, nor do we consider the composition of any index. Rather, we try to identify individual companies that meet our investment criteria, and we assume at purchase that we will hold the positions for several years.
1. Effective 12/10/12, the maximum market capitalization for each investment that the Fund can invest in increased from $400 million at time of purchase to $500 million.
2. Source: © 2013 Morningstar. All Rights Reserved. The information contained herein: (1) is proprietary to Morningstar and/or its content providers; (2) may not be copied or distributed; and (3) is not warranted to be accurate, complete or timely. Neither Morningstar nor its content providers are responsible for any damages or losses arising from any use of this information. The index is unmanaged and includes reinvested dividends. One cannot invest directly in an index, and an index is not representative of the Fund’s portfolio.
The dollar value, number of shares or principal amount, and names of all portfolio holdings are listed in the Fund’s Statement of Investments (SOI). The SOI begins on page 91.
36 | Annual Report
Manager’s Discussion
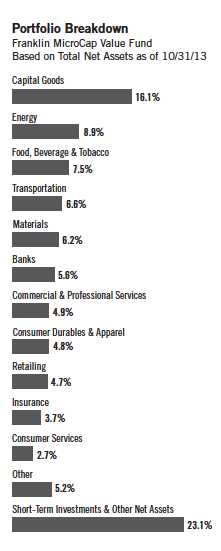
On October 31, 2013, the Fund’s total net assets were $546.7 million, with short-term investments and other net assets making up 23.1%, compared with total net assets of $367.9 million and short-term investments and other net assets of 9.3% on October 31, 2012. The Fund closed to new investors (with the exception of certain retirement accounts) in January 2004 and has remained closed except for two days in mid-February 2013. We opened the Fund on a limited basis so that we might increase the number of shareholders and broaden our investor base. The Fund’s being closed does not restrict existing shareholders from adding to or reducing their investments in the Fund, except that once an account is reduced to zero, it may not be reopened unless the Fund reopens.
During the 12 months under review, contributors to absolute Fund performance included a number of industrials sector holdings, such as USA Truck and SAIA (trucking), Costa, formerly known as A.T. Cross (sunglasses) and Sparton (electromechanical devices).3 American Pacific (specialty chemicals) was also a notable contributor. USA Truck, which made belated progress in turning around its operations, also became the object of a hostile takeover bid from Knight Transportation. Costa divested its legacy A.T. Cross accessories business for $60 million to focus on its rapidly growing Costa and Native sunglass brands. Sparton reported better-than-expected earnings, helped by recent acquisitions. American Pacific, whose financial results were stellar during the period, was also rumored to be in takeover talks.
All investment sectors and most positions held by the Fund benefited performance, but detractors included Ruby Tuesday (casual dining restaurant chain), Cobra Electronics (mobile communication products), Full House Resorts (gaming), Tandy Brands Accessories (leather belts and gift accessories) and Universal Stainless & Alloy Products (specialty steel products manufacturer and marketer). Cobra Electronics is a small player in the hyper-competitive consumer electronics realm. It struggled to gain traction with new products, and contended with expensive “patent troll” litigation. Tandy Brands Accessories, which was sold, was unable to turn around its operations. Ruby Tuesday and Full House Resorts were relatively new positions. Ruby Tuesday has been trying to rebrand its ailing casual dining offering. Full House Resorts’ Rising Star Casino in Indiana faced new competition from Ohio. Universal Stainless & Alloy Products encountered cyclical headwinds in the form of supply chain reductions in the aerospace industry.
We identified eight new investment opportunities during the period under review: Ruby Tuesday and Full House Resorts, described above; Cal Dive International, an offshore oil and gas construction contractor; Tesco, an oil and gas drilling equipment provider; Sterling Construction, a heavy civil
3. The industrials sector comprises capital goods and commercial and professional services in the SOI.
Annual Report | 37

38 | Annual Report
Performance Summary as of 10/31/13
Franklin MicroCap Value Fund
Your dividend income will vary depending on dividends or interest paid by securities in the Fund’s portfolio, adjusted for operating expenses of each class. Capital gain distributions are net profits realized from the sale of portfolio securities. The performance table and graphs do not reflect any taxes that a shareholder would pay on Fund dividends, capital gain distributions, if any, or any realized gains on the sale of Fund shares. Total return reflects reinvestment of the Fund’s dividends and capital gain distributions, if any, and any unrealized gains or losses.
Annual Report | 39
Performance Summary (continued)
Performance1
Cumulative total return excludes sales charges. Aggregate and average annual total returns and value of $10,000 investment include maximum sales charges. Class A: 5.75% maximum initial sales charge; Class R6/Advisor Class: no sales charges.
Performance data represent past performance, which does not guarantee future results. Investment return and principal value will fluctuate, and you may have a gain or loss when you sell your shares. Current performance may differ from figures shown. For most recent month-end performance, go to franklintempleton.com or call (800) 342-5236.
40 | Annual Report
Performance Summary (continued)
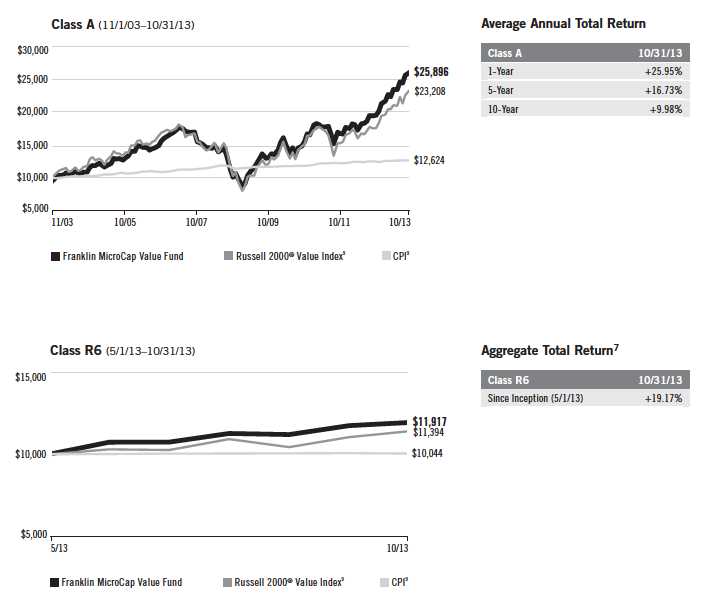
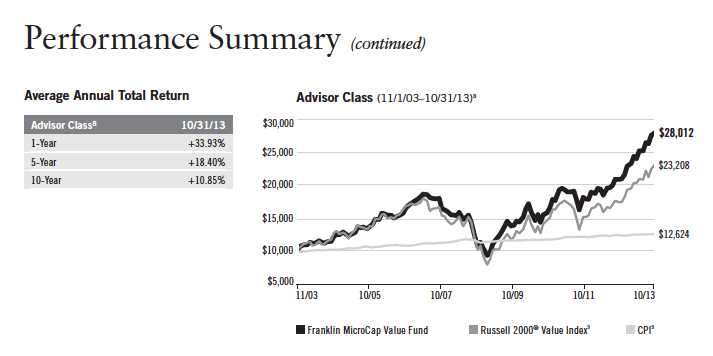
Total Return Index Comparison for a Hypothetical $10,000 Investment1
Total return represents the change in value of an investment over the periods shown. It includes any applicable maximum sales charge, Fund expenses, account fees and reinvested distributions. The unmanaged index includes reinvestment of any income or distributions. It differs from the Fund in composition and does not pay management fees or expenses. One cannot invest directly in an index.
Annual Report | 41
Endnotes
All investments involve risks, including possible loss of principal. The Fund’s ability to invest in smaller company securities that may have limited liquidity involves additional risks, such as relatively small revenues, limited product lines and small market share. Historically, these stocks have exhibited greater price volatility than larger company stocks, especially over the short term. In addition, the Fund may invest up to 25% of its total assets in foreign securities, which involve special risks, including currency fluctuations and economic and political uncertainty. The Fund is actively managed but there is no guarantee that the manager’s investment decisions will produce the desired results. The Fund’s prospectus also includes a description of the main investment risks.
| | |
| | Class R6: | Shares are available to certain eligible investors as described in the prospectus. |
| | Advisor Class: | Shares are available to certain eligible investors as described in the prospectus. |
1. The Fund has a fee waiver associated with its investments in a Franklin Templeton money fund, contractually guaranteed through at least its current fiscal year end. Fund investment results reflect the fee waiver, to the extent applicable; without this reduction, the results would have been lower.
2. Cumulative total return represents the change in value of an investment over the periods indicated.
3. Average annual total return represents the average annual change in value of an investment over the periods indicated. 4. These figures represent the value of a hypothetical $10,000 investment in the Fund over the periods indicated.
5. In accordance with SEC rules, we provide standardized average annual total return information through the latest calendar quarter.
6. Figures are as stated in the Fund’s current prospectus. In periods of market volatility, assets may decline significantly, causing total annual Fund operating expenses to become higher than the figures shown.
7. Aggregate total return represents the change in value of an investment for the period indicated. Since Class R6 shares have existed for less than one year, average annual total return is not available.
8. Effective 11/1/05, the Fund began offering Advisor Class shares, which do not have sales charges or a Rule 12b-1 plan. Performance quotations for this class reflect the following methods of calculation: (a) For periods prior to 11/1/05, a restated figure is used based upon the Fund’s Class A performance, excluding the effect of Class A’s maximum initial sales charge, but reflecting the effect of the Class A Rule 12b-1 fees; and (b) for periods after 11/1/05, actual Advisor Class performance is used reflecting all charges and fees applicable to that class. Since 11/1/05 (commencement of sales), the cumulative and average annual total returns of Advisor Class shares were +107.30% and +9.54%.
9. Source: © 2013 Morningstar. The Russell 2000® Value Index is market capitalization weighted and measures performance of those Russell 2000® Index companies with lower price-to-book ratios and lower forecasted growth values. The Consumer Price Index (CPI), calculated by the Bureau of Labor Statistics, is a commonly used measure of the inflation rate.
42 | Annual Report
Your Fund’s Expenses
Franklin MicroCap Value Fund
As a Fund shareholder, you can incur two types of costs:
- Transaction costs, including sales charges (loads) on Fund purchases; and
- Ongoing Fund costs, including management fees, distribution and service (12b-1) fees, and other Fund expenses. All mutual funds have ongoing costs, sometimes referred to as operating expenses.
The following table shows ongoing costs of investing in the Fund and can help you understand these costs and compare them with those of other mutual funds. The table assumes a $1,000 investment held for the six months indicated.
Actual Fund Expenses
The first line (Actual) for each share class listed in the table provides actual account values and expenses. The “Ending Account Value” is derived from the Fund’s actual return, which includes the effect of Fund expenses.
You can estimate the expenses you paid during the period by following these steps. Of course, your account value and expenses will differ from those in this illustration:
| 1. | Divide your account value by $1,000. |
| | If an account had an $8,600 value, then $8,600 ÷ $1,000 = 8.6. |
| 2. | Multiply the result by the number under the heading “Expenses Paid During Period.” |
| | If Expenses Paid During Period were $7.50, then 8.6 x $7.50 = $64.50. |
In this illustration, the estimated expenses paid this period are $64.50.
Hypothetical Example for Comparison with Other Funds
Information in the second line (Hypothetical) for each class in the table can help you compare ongoing costs of investing in the Fund with those of other mutual funds. This information may not be used to estimate the actual ending account balance or expenses you paid during the period. The hypothetical “Ending Account Value” is based on the actual expense ratio for each class and an assumed 5% annual rate of return before expenses, which does not represent the Fund’s actual return. The figure under the heading “Expenses Paid During Period” shows the hypothetical expenses your account would have incurred under this scenario. You can compare this figure with the 5% hypothetical examples that appear in shareholder reports of other funds.
Annual Report | 43
Your Fund’s Expenses (continued)
Please note that expenses shown in the table are meant to highlight ongoing costs and do not reflect any transaction costs, such as sales charges. Therefore, the second line for each class is useful in comparing ongoing costs only, and will not help you compare total costs of owning different funds. In addition, if transaction costs were included, your total costs would have been higher. Please refer to the Fund prospectus for additional information on operating expenses.
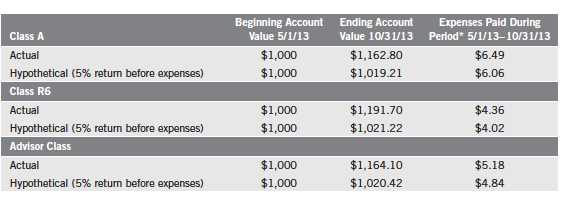
*Expenses are calculated using the most recent six-month expense ratio, annualized for each class (A: 1.19%; R6: 0.79%; and Advisor: 0.95%), multiplied by the average account value over the period, multiplied by 184/365 to reflect the one-half year period.
44 | Annual Report
Franklin MidCap Value Fund
Your Fund’s Goal and Main Investments: Franklin MidCap Value Fund seeks long-term total return by investing at least 80% of net assets in securities of mid-capitalization companies that we believe are undervalued. We define mid-capitalization companies as those with market capitalizations that are similar in size at the time of purchase to those in the Russell Midcap® Index.1
This annual report for Franklin MidCap Value Fund covers the fiscal year ended October 31, 2013.
Performance Overview
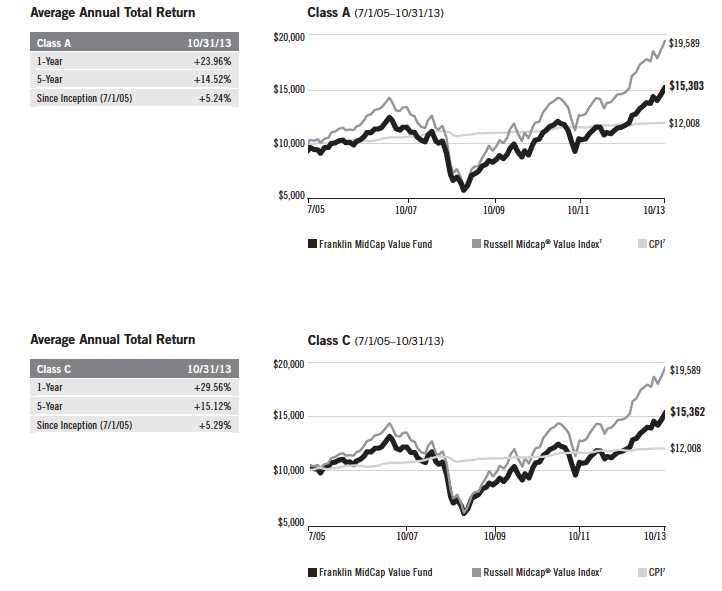
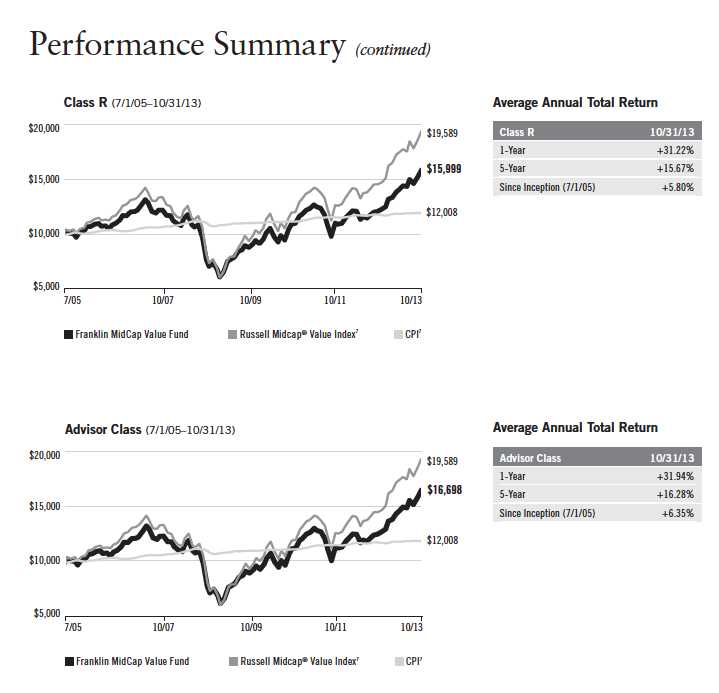
Franklin MidCap Value Fund – Class A delivered a +31.47% cumulative total return for the 12 months under review. In comparison, the Russell Midcap® Value Index, which measures performance of those Russell Midcap® Index companies with lower price-to-book ratios and lower forecasted growth values, generated a +33.45% total return.2 Although this report covers a 12-month period, our investment strategy aims for long-term results. You can find the Fund’s long-term performance data in the Performance Summary beginning on page 48.
Investment Strategy
Our goal is to invest in mid-capitalization companies that we determine are currently undervalued and have the potential for capital appreciation. The Fund purchases stocks that are out of favor in the market for reasons we believe will prove to be temporary. In addition, the Fund may invest in companies with valuable intangibles we believe are not reflected in the stock price. This strategy is not aimed at short-term trading gains, nor do we consider the composition of any index. Rather, we try to identify attractively priced, financially sound companies that meet our investment criteria, and we assume at purchase that we will hold the positions for several years.
1. The Russell Midcap® Index is market capitalization weighted and measures performance of the smallest companies in the Russell 1000® Index, which represent a modest amount of the Russell 1000® Index’s total market capitalization.
2. Source: © 2013 Morningstar. All Rights Reserved. The information contained herein: (1) is proprietary to Morningstar and/or its content providers; (2) may not be copied or distributed; and (3) is not warranted to be accurate, complete or timely. Neither Morningstar nor its content providers are responsible for any damages or losses arising from any use of this information. The index is unmanaged and includes reinvested dividends. One cannot invest directly in an index, and an index is not representative of the Fund’s portfolio.
The dollar value, number of shares or principal amount, and names of all portfolio holdings are listed in the Fund’s Statement of Investments (SOI). The SOI begins on page 99.
Annual Report | 45
Manager’s Discussion
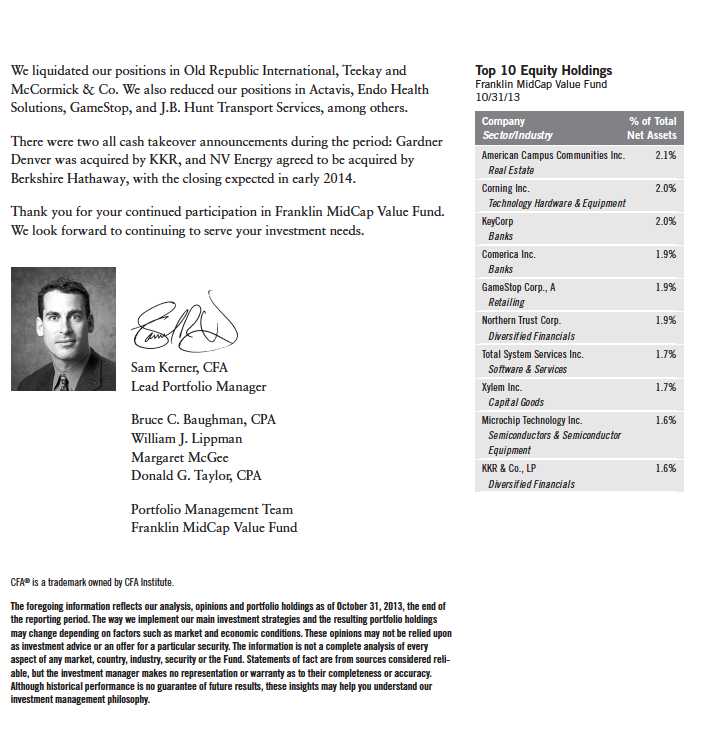
During the 12 months under review, contributors to absolute Fund performance included video game retailer GameStop, private equity investment group KKR, auto components supplier Gentex, business outsourcing provider Xerox and securities services provider Leidos Holdings, which was a spin-off of Science Applications International Corp. (formerly SAIC). Shares of GameStop rallied based on management’s optimistic guidance regarding robust same-store sales for the upcoming holiday season and was anticipated to profit from the introduction of new video game consoles from Microsoft and Sony. KKR benefited from a steady flow of private equity deals and capitalized on strong market conditions aiding capital formation and portfolio harvesting. Shares of Gentex rose resulting from a consistent trend of higher-than-expected profit margins as the company continued to dramatically grow sales of auto-dimming exterior car mirrors. Results from Xerox improved based on better execution in its services segment. Leidos Holdings, formerly a division of Science Applications International, was spun out to existing shareholders. Doing so allowed both entities to compete for government contracts previously unavailable.
Most of the Fund’s positions benefited performance, but detractors included coal producer Peabody Energy and student housing operator American Campus Communities. Peabody Energy encountered falling prices for high margin metallurgical coal used to fire steel furnaces, and American Campus Communities suffered amid investor concerns regarding slower preleasing and student housing oversupply.
During the reporting period, the Fund initiated nine new positions, including the aforementioned American Campus Communities; Corning, a specialty glass and ceramics manufacturer; PetSmart, a pet products and services provider; KLA-Tencor, a semiconductor manufacturing services provider; Maxim Integrated Products, an integrated circuit manufacturer; Raymond James Financial, a diversified financial services holding company; Stanley Black & Decker, a maker of hardware, industrial tools and security products; Community Health Systems, a hospital and clinic operator; and iShares Russell Mid-Cap Value ETF, an exchange-traded fund. By investing in the ETF, we sought to put some of the Fund’s cash to work more efficiently, while retaining liquidity as we searched for new investment opportunities. We viewed the ETF investment as an interim solution for cash that resulted from strong inflows to the Fund. The ETF was designed to be similar to the benchmark index in composition and performance.
Consistent with our value strategy, we added to existing positions in Nucor, a steel manufacturer; Peabody Energy, described above, Valero Energy, a petroleum refiner and marketer; and Bunge, a global agribusiness and food company, among others.
46 | Annual Report
Annual Report | 47
Performance Summary as of 10/31/13
Franklin MidCap Value Fund
Your dividend income will vary depending on dividends or interest paid by securities in the Fund’s portfolio, adjusted for operating expenses of each class. Capital gain distributions are net profits realized from the sale of portfolio securities. The performance table and graphs do not reflect any taxes that a shareholder would pay on Fund dividends, capital gain distributions, if any, or any realized gains on the sale of Fund shares. Total return reflects reinvestment of the Fund’s dividends and capital gain distributions, if any, and any unrealized gains or losses.

48 | Annual Report
Performance Summary (continued)
Performance1
Cumulative total return excludes sales charges. Average annual total returns and value of $10,000 investment include maximum sales charges. Class A: 5.75% maximum initial sales charge; Class C: 1% contingent deferred sales charge in first year only; Class R/Advisor Class: no sales charges.
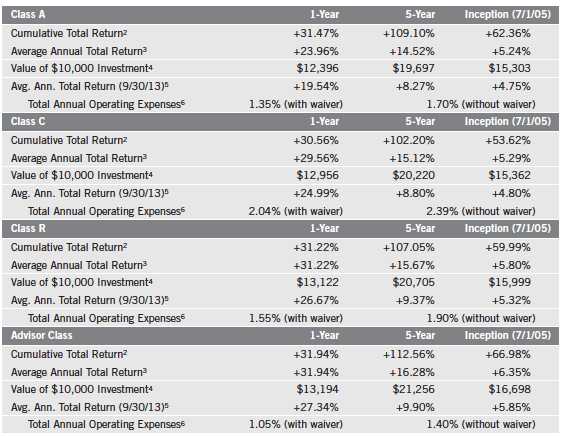
Performance data represent past performance, which does not guarantee future results. Investment return and principal value will fluctuate, and you may have a gain or loss when you sell your shares. Current performance may differ from figures shown. For most recent month-end performance, go to franklintempleton.com or call (800) 342-5236.
Annual Report | 49
Performance Summary (continued)
Total Return Index Comparison for a Hypothetical $10,000 Investment1
Total return represents the change in value of an investment over the periods shown. It includes any applicable maximum sales charge, Fund expenses, account fees and reinvested distributions. The unmanaged index includes reinvestment of any income or distributions. It differs from the Fund in composition and does not pay management fees or expenses. One cannot invest directly in an index.
50 | Annual Report
Annual Report | 51
Performance Summary (continued)
Endnotes
All investments involve risks, including possible loss of principal. Stock prices fluctuate, sometimes rapidly and dramatically, due to factors affecting individual companies, particular industries or sectors, or general market conditions. Historically, midsize company securities have been more volatile in price than larger company securities, especially over the short term. Midsize companies may be more susceptible to particular economic events or competitive factors than are larger, more broadly diversified companies. In addition, the Fund may invest up to 25% of its total assets in foreign securities, which involve special risks, including currency fluctuations and economic and political uncertainty. The Fund is actively managed but there is no guarantee that the manager’s investment decisions will produce the desired results. The Fund’s prospectus also includes a description of the main investment risks.
| |
Class C: Class R: | These shares have higher annual fees and expenses than Class A shares. Shares are available to certain eligible investors as described in the prospectus. These shares have higher annual fees and expenses than Class A shares. |
Advisor Class: | Shares are available to certain eligible investors as described in the prospectus. |
1. The Fund has an expense reduction contractually guaranteed through at least 2/28/14 and a fee waiver associated with its investments in a Franklin Templeton money fund, contractually guaranteed through at least its current fiscal year end. Fund investment results reflect the expense reduction and fee waiver, to the extent applicable; without these reductions, the results would have been lower.
2. Cumulative total return represents the change in value of an investment over the periods indicated.
3. Average annual total return represents the average annual change in value of an investment over the periods indicated. 4. These figures represent the value of a hypothetical $10,000 investment in the Fund over the periods indicated.
5. In accordance with SEC rules, we provide standardized average annual total return information through the latest calendar quarter.
6. Figures are as stated in the Fund’s current prospectus. In periods of market volatility, assets may decline significantly, causing total annual Fund operating expenses to become higher than the figures shown.
7. Source: © 2013 Morningstar. The Russell Midcap® Value Index is market capitalization weighted and measures performance of those Russell Midcap® Index companies with lower price-to-book ratios and lower forecasted growth values. The Consumer Price Index (CPI), calculated by the Bureau of Labor Statistics, is a commonly used measure of the inflation rate.
52 | Annual Report
Your Fund’s Expenses
Franklin MidCap Value Fund
As a Fund shareholder, you can incur two types of costs:
- Transaction costs, including sales charges (loads) on Fund purchases; and
- Ongoing Fund costs, including management fees, distribution and service (12b-1) fees, and other Fund expenses. All mutual funds have ongoing costs, sometimes referred to as operating expenses.
The following table shows ongoing costs of investing in the Fund and can help you understand these costs and compare them with those of other mutual funds. The table assumes a $1,000 investment held for the six months indicated.
Actual Fund Expenses
The first line (Actual) for each share class listed in the table provides actual account values and expenses. The “Ending Account Value” is derived from the Fund’s actual return, which includes the effect of Fund expenses.
You can estimate the expenses you paid during the period by following these steps. Of course, your account value and expenses will differ from those in this illustration:
| 1. | Divide your account value by $1,000. |
| | If an account had an $8,600 value, then $8,600 ÷ $1,000 = 8.6. |
| 2. | Multiply the result by the number under the heading “Expenses Paid During Period.” |
| | If Expenses Paid During Period were $7.50, then 8.6 x $7.50 = $64.50. |
In this illustration, the estimated expenses paid this period are $64.50.
Hypothetical Example for Comparison with Other Funds
Information in the second line (Hypothetical) for each class in the table can help you compare ongoing costs of investing in the Fund with those of other mutual funds. This information may not be used to estimate the actual ending account balance or expenses you paid during the period. The hypothetical “Ending Account Value” is based on the actual expense ratio for each class and an assumed 5% annual rate of return before expenses, which does not represent the Fund’s actual return. The figure under the heading “Expenses Paid During Period” shows the hypothetical expenses your account would have incurred under this scenario. You can compare this figure with the 5% hypothetical examples that appear in shareholder reports of other funds.
Annual Report | 53
Your Fund’s Expenses (continued)
Please note that expenses shown in the table are meant to highlight ongoing costs and do not reflect any transaction costs, such as sales charges. Therefore, the second line for each class is useful in comparing ongoing costs only, and will not help you compare total costs of owning different funds. In addition, if transaction costs were included, your total costs would have been higher. Please refer to the Fund prospectus for additional information on operating expenses.
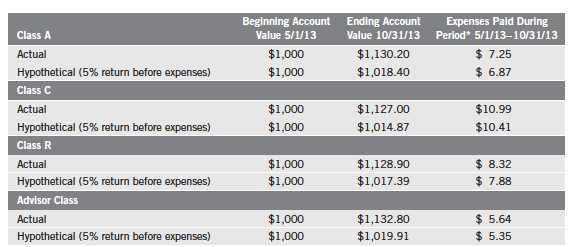
*Expenses are calculated using the most recent six-month expense ratio, net of expense waivers, annualized for each class (A: 1.35%; C: 2.05%; R: 1.55%; and Advisor: 1.05%), multiplied by the average account value over the period, multiplied by 184/365 to reflect the one-half year period.
54 | Annual Report
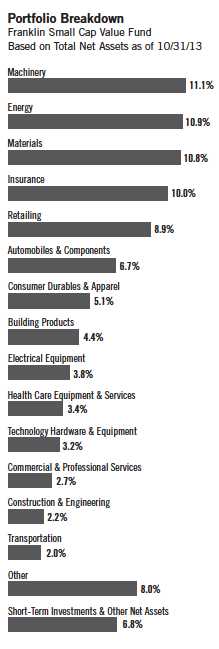
Franklin Small Cap Value Fund
Your Fund’s Goal and Main Investments: Franklin Small Cap Value Fund seeks long-term total return by investing at least 80% of net assets in securities of small-capitalization companies that we believe are undervalued. We define small-capitalization companies as those with market capitalizations less than $3.5 billion at the time of purchase.
We are pleased to bring you Franklin Small Cap Value Fund’s annual report for the fiscal year ended October 31, 2013.
Performance Overview
Franklin Small Cap Value Fund – Class A delivered a +38.15% cumulative total return for the 12 months under review. In comparison, the Russell 2500™ Value Index, which measures performance of those Russell 2500™ Index companies with lower price-to-book ratios and lower forecasted growth values, generated a +33.35% total return.1 Although this report covers a 12-month period, our investment strategy aims for long-term results. You can find the Fund’s long-term performance data in the Performance Summary beginning on page 58.
Investment Strategy
We seek to invest in small-capitalization companies that we believe are selling below their underlying worth and hold them until they reach what we consider their fair market value. We seek a diversified portfolio of fundamentally sound companies purchased at attractive prices, often when they are out of favor with other investors. Portfolio securities are selected without regard to benchmark comparisons and are based on fundamental, bottom-up research focusing on several criteria, such as low price relative to earnings, book value or cash flow. We also consider stocks with recent sharp price declines that we believe still have significant growth potential or that possess valuable intangibles not reflected in the stock price.
1. Source: © 2013 Morningstar. All Rights Reserved. The information contained herein: (1) is proprietary to Morningstar and/or its content providers; (2) may not be copied or distributed; and (3) is not warranted to be accurate, complete or timely. Neither Morningstar nor its content providers are responsible for any damages or losses arising from any use of this information. The index is unmanaged and includes reinvested dividends. One cannot invest directly in an index, and an index is not representative of the Fund’s portfolio.
The dollar value, number of shares or principal amount, and names of all portfolio holdings are listed in the Fund’s Statement of Investments (SOI). The SOI begins on page 107.
Annual Report | 55
Manager’s Discussion
During the 12 months under review, contributors to absolute Fund performance included video game retailer GameStop, insurer Protective Life, recreational vehicle manufacturer Thor Industries, aircraft-related aftermarket services provider AAR and railcar manufacturer Trinity Industries. GameStop benefited from management’s optimistic guidance regarding robust same-store sales for the upcoming holiday season and was anticipated to profit from the introduction of new video game consoles from Microsoft and Sony. Shares of Protective Life rallied based on solid earnings growth driven by its annuities business, a potential benefit from acquisitions and the prospect for higher interest rates. Thor Industries appreciated owing to strong demand for towable recreational vehicles and growing sales of motorized vehicles. AAR’s share price rose because of increased demand for spare parts and maintenance services to the improving commercial aviation sector along with the company’s solid free cash flow generation. Trinity Industries posted record earnings and backlog resulting from increased demand for rail cars to support the domestic energy boom.
Most positions in the Fund benefited performance, but detractors included flexible circuit materials manufacturer Multi-Fineline Electronix, single-family home builders M.D.C. Holdings and M/I Homes, hair care salon operator Regis and outdoor power equipment manufacturer Briggs & Stratton. Weaker-than-expected demand led to disappointing earnings for Multi-Fineline Electronix. M.D.C. Holdings and M/I Homes suffered from an uncertain outlook for new housing demand as a result of higher interest rates. Regis posted lower-than-expected revenue and earnings as its effort to implement a major restructuring had not yet gained traction. Briggs & Stratton struggled with an extremely slow start to the spring lawn and garden season and retailers’ cautious approach to managing inventories.
During the reporting period, the Fund initiated positions in nine new holdings, including Regal-Beloit, an electric motor manufacturer; Carpenter Technology, a high performance metals manufacturer; Pep Boys – Manny, Moe & Jack, an auto service and retail chain; Jos. A. Bank Clothiers, a men’s clothing designer and retailer; Harman International Industries, an audio and infotainment manufacturer; and Genesco, a specialty retailer, among others. We also added to our positions in Cabot, a specialty chemicals and materials company; Unit Corp., a diversified energy company; and STERIS, a health care sterilization technology provider, among others. We liquidated positions in 17 companies including Graco, American Woodmark, Lancaster Colony, CIRCOR International and West Pharmaceutical Services. We reduced our positions in several securities including Protective Life, GameStop, Pier 1 Imports, Nordson and Benchmark Electronics, among others.
56 | Annual Report

Annual Report | 57
Performance Summary as of 10/31/13
Franklin Small Cap Value Fund
Your dividend income will vary depending on dividends or interest paid by securities in the Fund’s portfolio, adjusted for operating expenses of each class. Capital gain distributions are net profits realized from the sale of portfolio securities. The performance table and graphs do not reflect any taxes that a shareholder would pay on Fund dividends, capital gain distributions, if any, or any realized gains on the sale of Fund shares. Total return reflects reinvestment of the Fund’s dividends and capital gain distributions, if any, and any unrealized gains or losses.
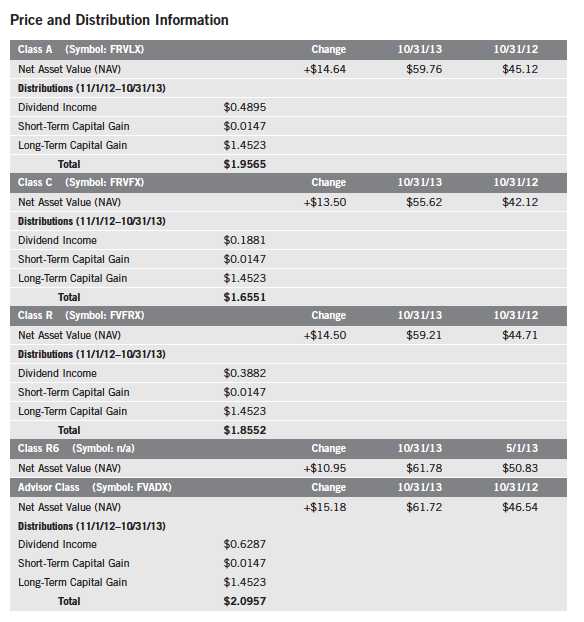
58 | Annual Report
Performance Summary (continued)
Performance1
Cumulative total return excludes sales charges. Aggregate and average annual total returns and value of $10,000 invest-ment include maximum sales charges. Class A: 5.75% maximum initial sales charge; Class C: 1% contingent deferred sales charge in first year only; Class R/R6/Advisor Class: no sales charges.

Performance data represent past performance, which does not guarantee future results. Investment return and principal value will fluctuate, and you may have a gain or loss when you sell your shares. Current performance may differ from figures shown. For most recent month-end performance, go to franklintempleton.com or call (800) 342-5236.
Annual Report | 59
Performance Summary (continued)
Total Return Index Comparison for a Hypothetical $10,000 Investment1
Total return represents the change in value of an investment over the periods shown. It includes any current, applicable, maximum sales charge, Fund expenses, account fees and reinvested distributions. The unmanaged index includes reinvestment of any income or distributions. It differs from the Fund in composition and does not pay management fees or expenses. One cannot invest directly in an index.

60 | Annual Report
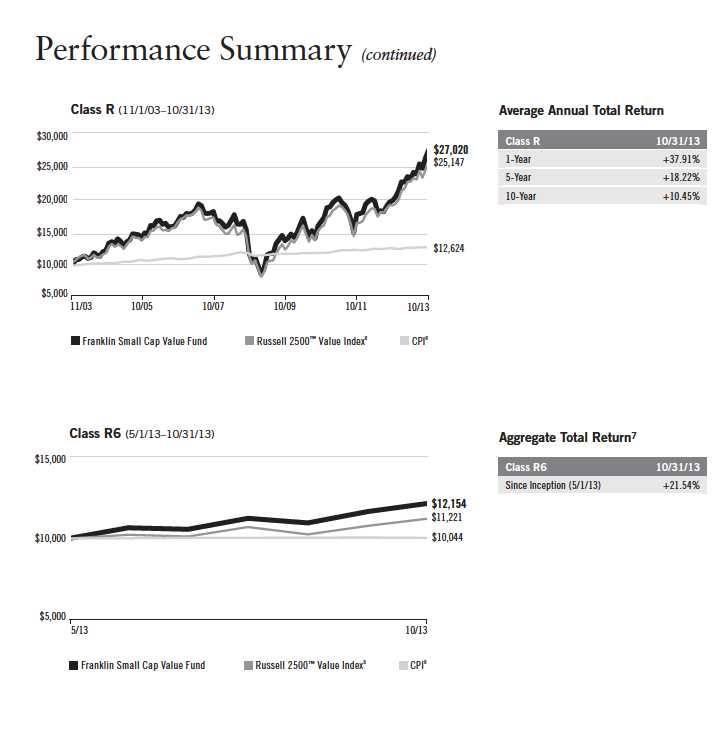
Annual Report | 61

Endnotes
All investments involve risks, including possible loss of principal. The Fund’s investments in smaller company stocks carry special risks as such stocks have historically exhibited greater price volatility than larger company stocks, particularly over the short term. Additionally, smaller companies often have relatively small revenues, limited product lines and small market share. In addition, the Fund may invest up to 25% of its total assets in foreign securities, which involve special risks, including currency fluctuations and economic and political uncertainty. The Fund is actively managed but there is no guarantee that the manager’s investment decisions will produce the desired results. The Fund’s prospectus also includes a description of the main investment risks.
| | |
| | Class C: | Prior to 1/1/04, these shares were offered with an initial sales charge; thus actual total returns would |
| | | have differed. These shares have higher annual fees and expenses than Class A shares. |
| | Class R: | Shares are available to certain eligible investors as described in the prospectus. These shares have |
| | | higher annual fees and expenses than Class A shares. |
| | Class R6: | Shares are available to certain eligible investors as described in the prospectus. |
| | Advisor Class: | Shares are available to certain eligible investors as described in the prospectus. |
1. The Fund has a fee waiver associated with its investments in a Franklin Templeton money fund, contractually guaranteed through at least its current fiscal year end. Fund investment results reflect the fee waiver, to the extent applicable; without this reduction, the results would have been lower.
2. Cumulative total return represents the change in value of an investment over the periods indicated.
3. Average annual total return represents the average annual change in value of an investment over the periods indicated.
4. These figures represent the value of a hypothetical $10,000 investment in the Fund over the periods indicated.
5. In accordance with SEC rules, we provide standardized average annual total return information through the latest calendar quarter.
6. Figures are as stated in the Fund’s current prospectus. In periods of market volatility, assets may decline significantly, causing total annual Fund operating expenses to become higher than the figures shown.
7. Aggregate total return represents the change in value of an investment for the period indicated. Since Class R6 shares have existed for less than one year, average annual total return is not available.
8. Source: © 2013 Morningstar. The Russell 2500™ Value Index is market capitalization weighted and measures performance of those Russell 2500™ Index companies with lower price-to-book ratios and lower forecasted growth values. The Consumer Price Index (CPI), calculated by the Bureau of Labor Statistics, is a commonly used measure of the inflation rate.
62 | Annual Report
Your Fund’s Expenses
Franklin Small Cap Value Fund
As a Fund shareholder, you can incur two types of costs:
- Transaction costs, including sales charges (loads) on Fund purchases; and
- Ongoing Fund costs, including management fees, distribution and service (12b-1) fees, and other Fund expenses. All mutual funds have ongoing costs, sometimes referred to as operating expenses.
The following table shows ongoing costs of investing in the Fund and can help you understand these costs and compare them with those of other mutual funds. The table assumes a $1,000 investment held for the six months indicated.
Actual Fund Expenses
The first line (Actual) for each share class listed in the table provides actual account values and expenses. The “Ending Account Value” is derived from the Fund’s actual return, which includes the effect of Fund expenses.
You can estimate the expenses you paid during the period by following these steps. Of course, your account value and expenses will differ from those in this illustration:
| 1. | Divide your account value by $1,000. |
| | If an account had an $8,600 value, then $8,600 ÷ $1,000 = 8.6. |
| 2. | Multiply the result by the number under the heading “Expenses Paid During Period.” |
| | If Expenses Paid During Period were $7.50, then 8.6 x $7.50 = $64.50. |
In this illustration, the estimated expenses paid this period are $64.50.
Hypothetical Example for Comparison with Other Funds
Information in the second line (Hypothetical) for each class in the table can help you compare ongoing costs of investing in the Fund with those of other mutual funds. This information may not be used to estimate the actual ending account balance or expenses you paid during the period. The hypothetical “Ending Account Value” is based on the actual expense ratio for each class and an assumed 5% annual rate of return before expenses, which does not represent the Fund’s actual return. The figure under the heading “Expenses Paid During Period” shows the hypothetical expenses your account would have incurred under this scenario. You can compare this figure with the 5% hypothetical examples that appear in shareholder reports of other funds.
Annual Report | 63
Your Fund’s Expenses (continued)
Please note that expenses shown in the table are meant to highlight ongoing costs and do not reflect any transaction costs, such as sales charges. Therefore, the second line for each class is useful in comparing ongoing costs only, and will not help you compare total costs of owning different funds. In addition, if transaction costs were included, your total costs would have been higher. Please refer to the Fund prospectus for additional information on operating expenses.
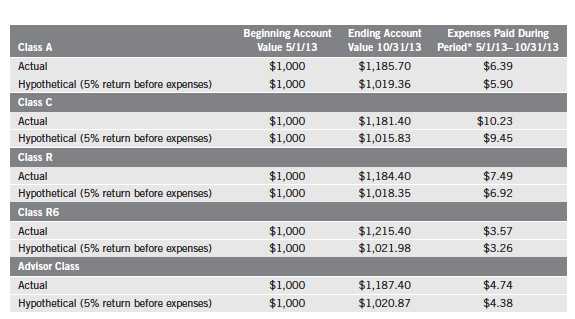
*Expenses are calculated using the most recent six-month expense ratio, annualized for each class (A: 1.16%; C: 1.86%; R: 1.36%; R6: 0.64% (net of expense waivers); and Advisor: 0.86%), multiplied by the average account value over the period, multiplied by 184/365 to reflect the one-half year period.
64 | Annual Report

aThe amount shown for a share outstanding throughout the period may not correlate with the Statement of Operations for the period due to the timing of sales and repurchases of
the Fund shares in relation to income earned and/or fluctuating market value of the investments of the Fund.
bBased on average daily shares outstanding.
cTotal return does not reflect sales commissions or contingent deferred sales charges, if applicable.
dBenefit of expense reduction rounds to less than 0.01%.
Annual Report | The accompanying notes are an integral part of these financial statements. | 65
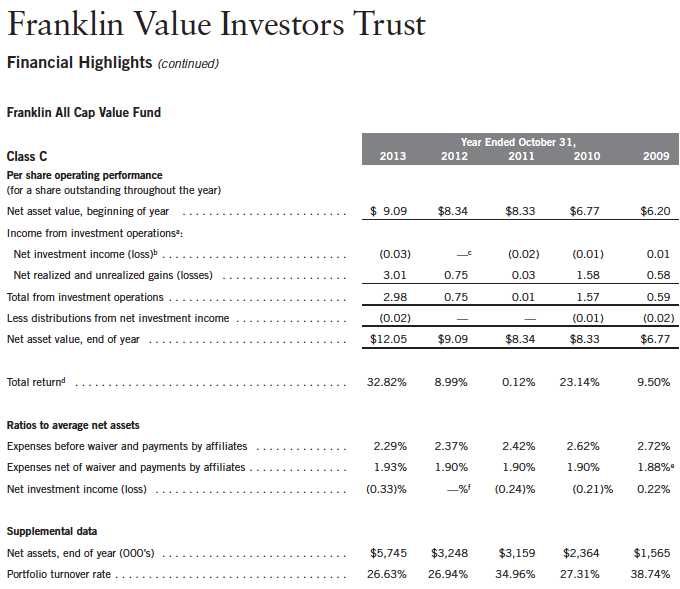
aThe amount shown for a share outstanding throughout the period may not correlate with the Statement of Operations for the period due to the timing of sales and repurchases of
the Fund shares in relation to income earned and/or fluctuating market value of the investments of the Fund.
bBased on average daily shares outstanding.
cAmount rounds to less than $0.01 per share.
dTotal return does not reflect sales commissions or contingent deferred sales charges, if applicable.
eBenefit of expense reduction rounds to less than 0.01%.
fRounds to less than 0.01%.
66 | The accompanying notes are an integral part of these financial statements. | Annual Report
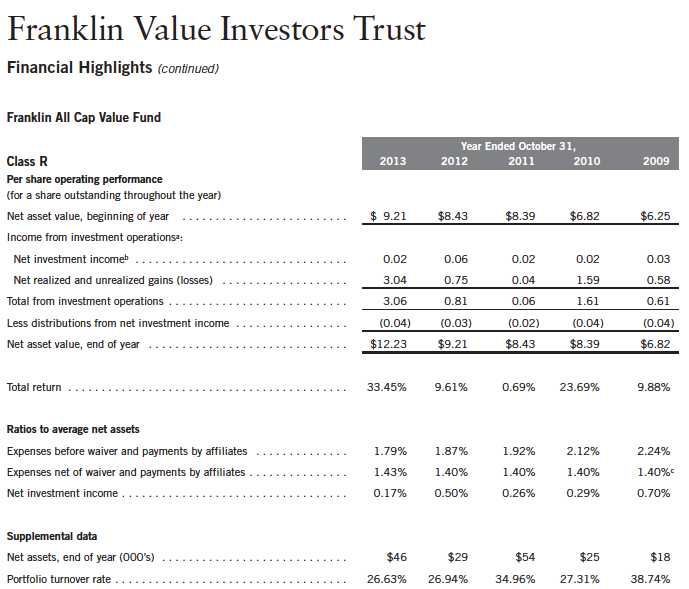
aThe amount shown for a share outstanding throughout the period may not correlate with the Statement of Operations for the period due to the timing of sales and repurchases of
the Fund shares in relation to income earned and/or fluctuating market value of the investments of the Fund.
bBased on average daily shares outstanding.
cBenefit of expense reduction rounds to less than 0.01%.
Annual Report | The accompanying notes are an integral part of these financial statements. | 67
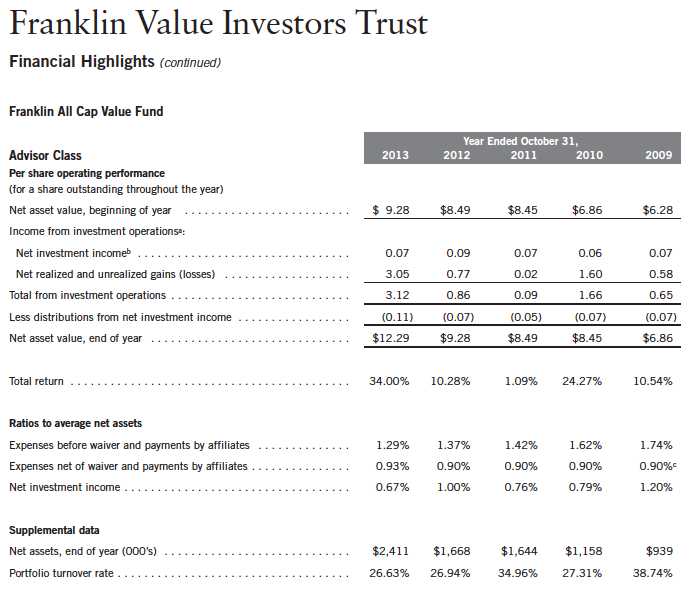
aThe amount shown for a share outstanding throughout the period may not correlate with the Statement of Operations for the period due to the timing of sales and repurchases of
the Fund shares in relation to income earned and/or fluctuating market value of the investments of the Fund.
bBased on average daily shares outstanding.
cBenefit of expense reduction rounds to less than 0.01%.
68 | The accompanying notes are an integral part of these financial statements. | Annual Report
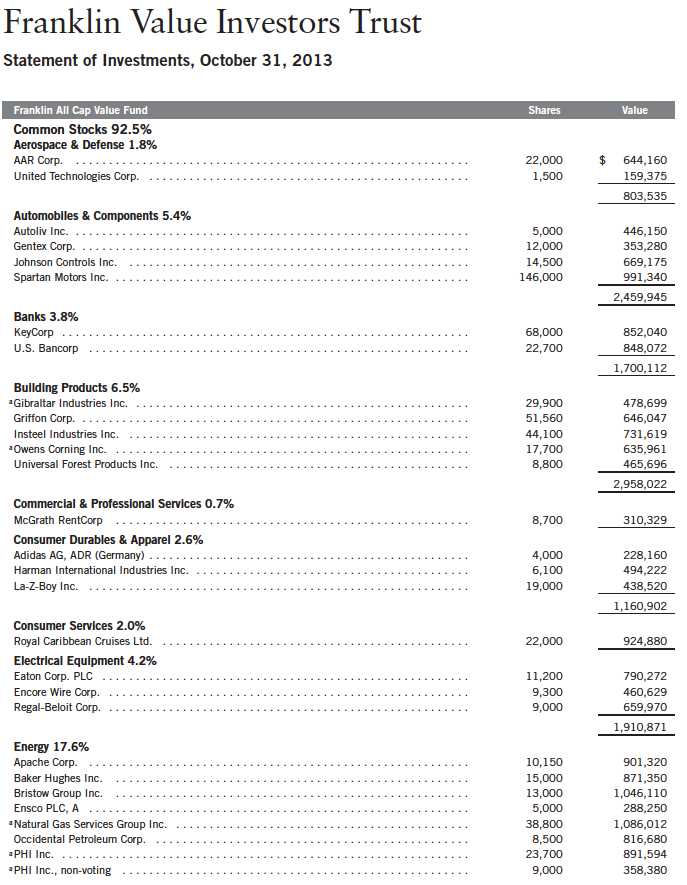
Annual Report | 69
Franklin Value Investors Trust
Statement of Investments, October 31, 2013 (continued)

70 | Annual Report
Franklin Value Investors Trust
Statement of Investments, October 31, 2013 (continued)
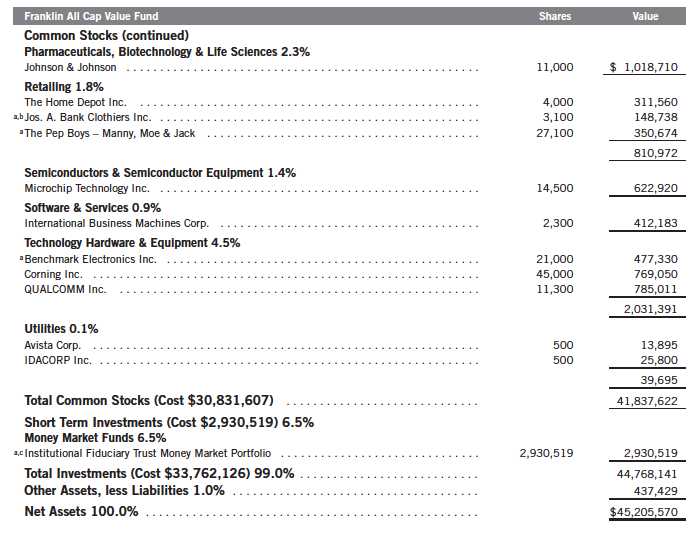
See Abbreviations on page 142.
aNon-income producing.
bAt October 31, 2013, pursuant to the Fund’s policies and the requirements of applicable securities law, the Fund may be restricted from trading this security for a limited or
extended period of time due to ownership limits and/or potential possession of material non-public information.
cSee Note 7 regarding investments in the Institutional Fiduciary Trust Money Market Portfolio.
Annual Report | The accompanying notes are an integral part of these financial statements. | 71
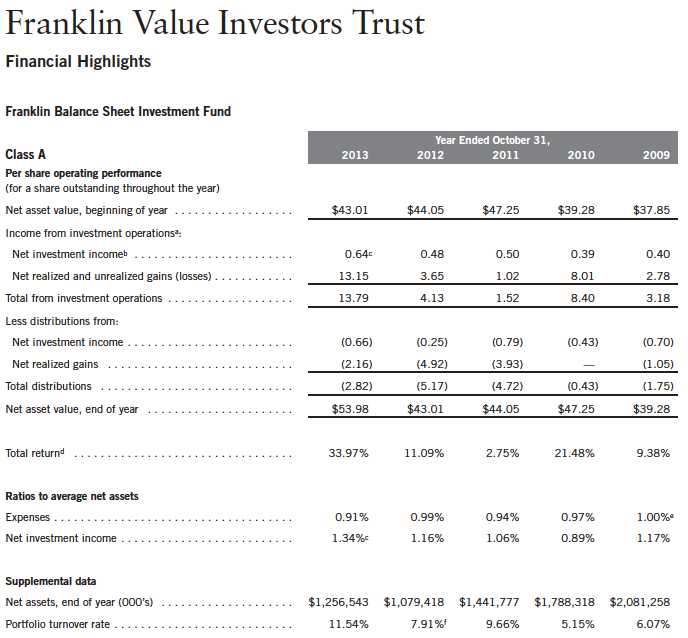
aThe amount shown for a share outstanding throughout the period may not correlate with the Statement of Operations for the period due to the timing of sales and repurchases of
the Fund shares in relation to income earned and/or fluctuating market value of the investments of the Fund.
bBased on average daily shares outstanding.
cNet investment income per share includes approximately $0.15 per share received in the form of special dividends. Excluding these amounts, the ratio of net investment income to
average net assets would have been 1.02%.
dTotal return does not reflect sales commissions or contingent deferred sales charges, if applicable.
eBenefit of expense reduction rounds to less than 0.01%.
fExcludes the value of portfolio securities delivered as a result of a redemption in-kind.
72 | The accompanying notes are an integral part of these financial statements. | Annual Report

aThe amount shown for a share outstanding throughout the period may not correlate with the Statement of Operations for the period due to the timing of sales and repurchases of
the Fund shares in relation to income earned and/or fluctuating market value of the investments of the Fund.
bBased on average daily shares outstanding.
cNet investment income per share includes approximately $0.15 per share received in the form of special dividends. Excluding these amounts, the ratio of net investment income to
average net assets would have been 0.27%.
dTotal return does not reflect sales commissions or contingent deferred sales charges, if applicable.
eBenefit of expense reduction rounds to less than 0.01%.
fExcludes the value of portfolio securities delivered as a result of a redemption in-kind.
Annual Report | The accompanying notes are an integral part of these financial statements. | 73

aThe amount shown for a share outstanding throughout the period may not correlate with the Statement of Operations for the period due to the timing of sales and repurchases of
the Fund shares in relation to income earned and/or fluctuating market value of the investments of the Fund.
bBased on average daily shares outstanding.
cNet investment income per share includes approximately $0.15 per share received in the form of special dividends. Excluding these amounts, the ratio of net investment income to
average net assets would have been 0.77%.
dBenefit of expense reduction rounds to less than 0.01%.
eExcludes the value of portfolio securities delivered as a result of a redemption in-kind.
74 | The accompanying notes are an integral part of these financial statements. | Annual Report
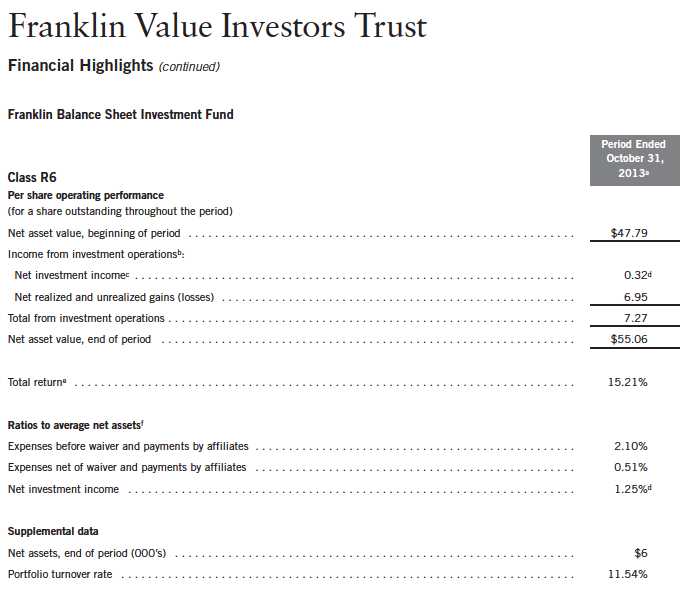
aFor the period May 1, 2013 (effective date) to October 31, 2013.
bThe amount shown for a share outstanding throughout the period may not correlate with the Statement of Operations for the period due to the timing of sales and repurchases of
the Fund shares in relation to income earned and/or fluctuating market value of the investments of the Fund.
cBased on average daily shares outstanding.
dNet investment income per share includes approximately $0.07 per share received in the form of a special dividends. Excluding these amounts, the ratio of net investment income
to average net assets would have been 1.00%.
eTotal return is not annualized for periods less than one year.
fRatios are annualized for periods less than one year.
Annual Report | The accompanying notes are an integral part of these financial statements. | 75

aThe amount shown for a share outstanding throughout the period may not correlate with the Statement of Operations for the period due to the timing of sales and repurchases of
the Fund shares in relation to income earned and/or fluctuating market value of the investments of the Fund.
bBased on average daily shares outstanding.
cNet investment income per share includes approximately $0.15 per share received in the form of special dividends. Excluding these amounts, the ratio of net investment income to
average net assets would have been 1.27%.
dBenefit of expense reduction rounds to less than 0.01%.
eExcludes the value of portfolio securities delivered as a result of a redemption in-kind.
76 | The accompanying notes are an integral part of these financial statements. | Annual Report
Franklin Value Investors Trust
Statement of Investments, October 31, 2013

Annual Report | 77
Franklin Value Investors Trust
Statement of Investments, October 31, 2013 (continued)
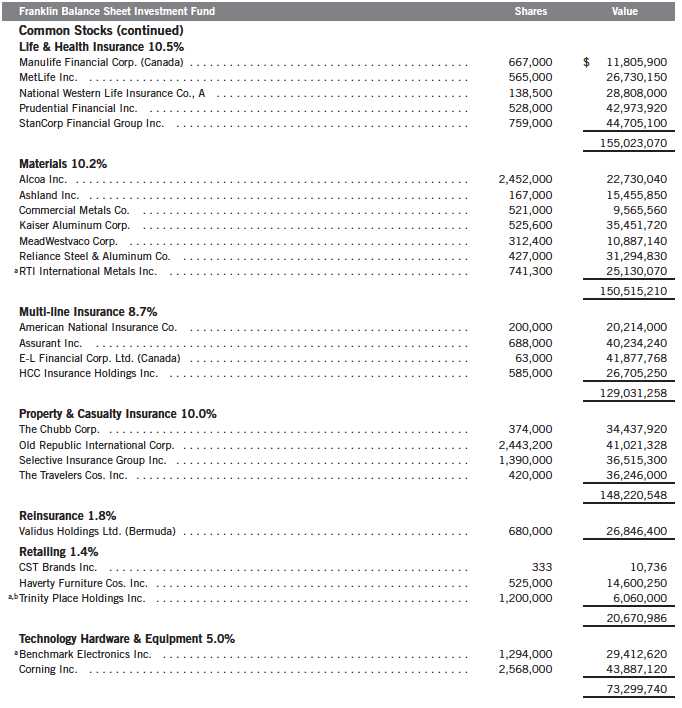
78 | Annual Report
Franklin Value Investors Trust
Statement of Investments, October 31, 2013 (continued)
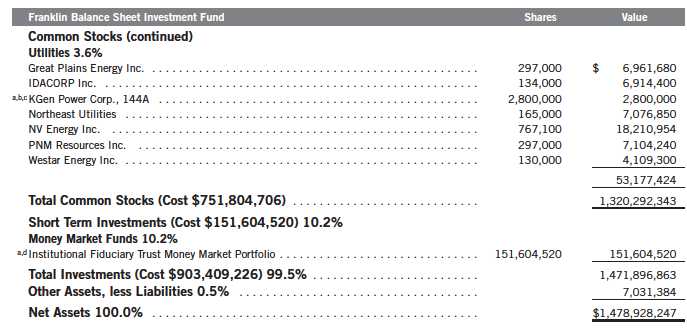
aNon-income producing.
bSee Note 9 regarding holdings of 5% voting securities.
cSecurity was purchased pursuant to Rule 144A under the Securities Act of 1933 and may be sold in transactions exempt from registration only to qualified institutional buyers or in
a public offering registered under the Securities Act of 1933. This security has been deemed liquid under guidelines approved by the Trust’s Board of Trustees. At October 31, 2013,
the value of this security was $2,800,000, representing 0.19% of net assets.
dSee Note 7 regarding investments in the Institutional Fiduciary Trust Money Market Portfolio.
Annual Report | The accompanying notes are an integral part of these financial statements. | 79
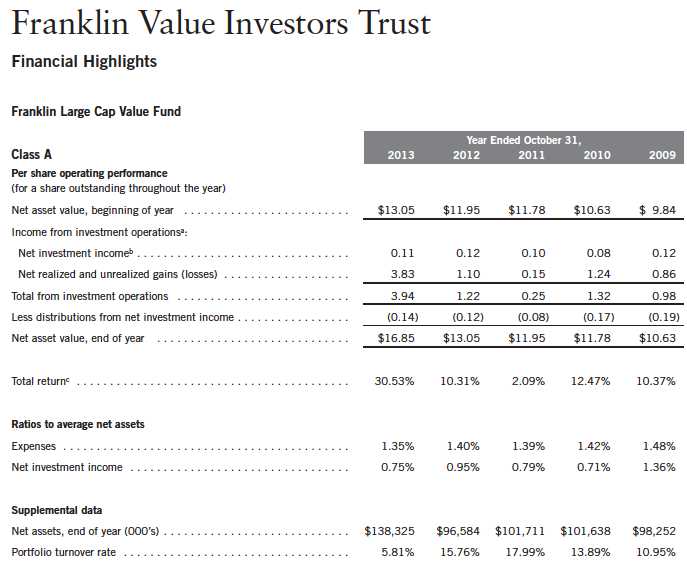
aThe amount shown for a share outstanding throughout the period may not correlate with the Statement of Operations for the period due to the timing of sales and repurchases of
the Fund shares in relation to income earned and/or fluctuating market value of the investments of the Fund.
bBased on average daily shares outstanding.
cTotal return does not reflect sales commissions or contingent deferred sales charges, if applicable.
80 | The accompanying notes are an integral part of these financial statements. | Annual Report
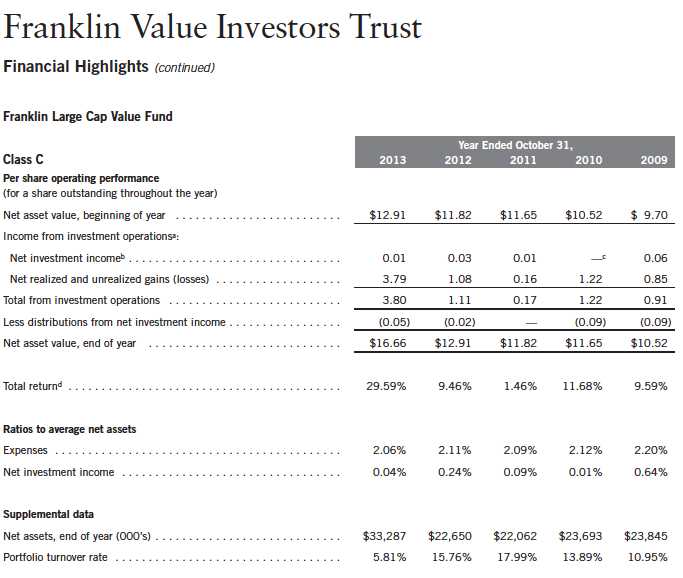
aThe amount shown for a share outstanding throughout the period may not correlate with the Statement of Operations for the period due to the timing of sales and repurchases of
the Fund shares in relation to income earned and/or fluctuating market value of the investments of the Fund.
bBased on average daily shares outstanding.
cAmount rounds to less than $0.01 per share.
dTotal return does not reflect sales commissions or contingent deferred sales charges, if applicable.
Annual Report | The accompanying notes are an integral part of these financial statements. | 81
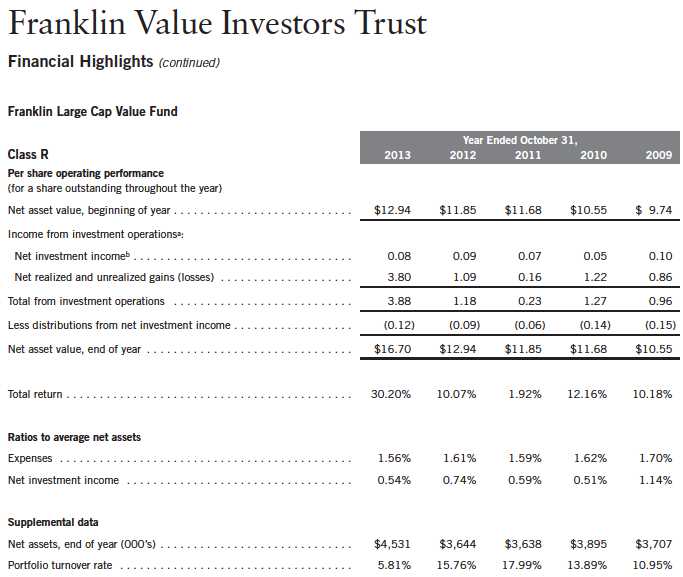
aThe amount shown for a share outstanding throughout the period may not correlate with the Statement of Operations for the period due to the timing of sales and repurchases of
the Fund shares in relation to income earned and/or fluctuating market value of the investments of the Fund.
bBased on average daily shares outstanding.
82 | The accompanying notes are an integral part of these financial statements. | Annual Report

aFor the period May 1, 2013 (effective date) to October 31, 2013.
bThe amount shown for a share outstanding throughout the period may not correlate with the Statement of Operations for the period due to the timing of sales and repurchases of
the Fund shares in relation to income earned and/or fluctuating market value of the investments of the Fund.
cBased on average daily shares outstanding.
dTotal return is not annualized for periods less than one year.
eRatios are annualized for periods less than one year.
Annual Report | The accompanying notes are an integral part of these financial statements. | 83
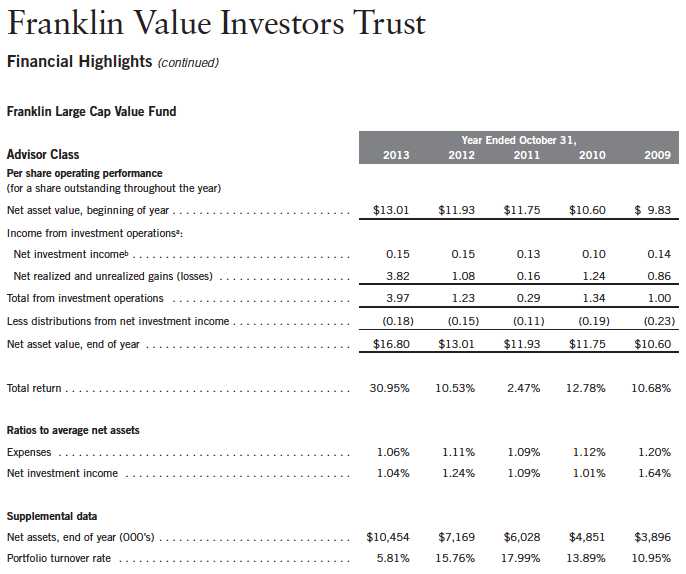
aThe amount shown for a share outstanding throughout the period may not correlate with the Statement of Operations for the period due to the timing of sales and repurchases of
the Fund shares in relation to income earned and/or fluctuating market value of the investments of the Fund.
bBased on average daily shares outstanding.
84 | The accompanying notes are an integral part of these financial statements. | Annual Report
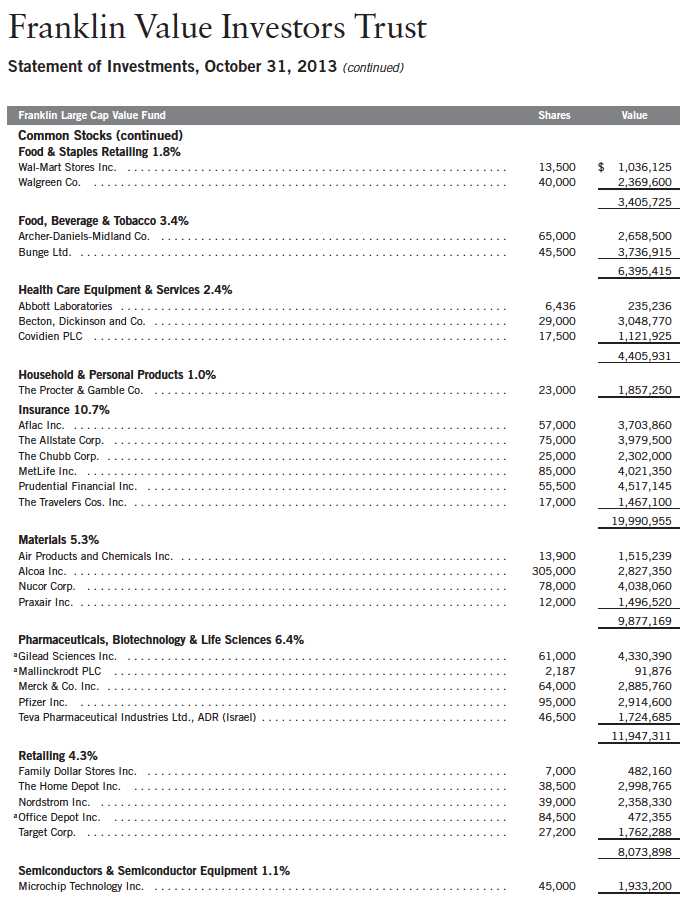
86 | Annual Report
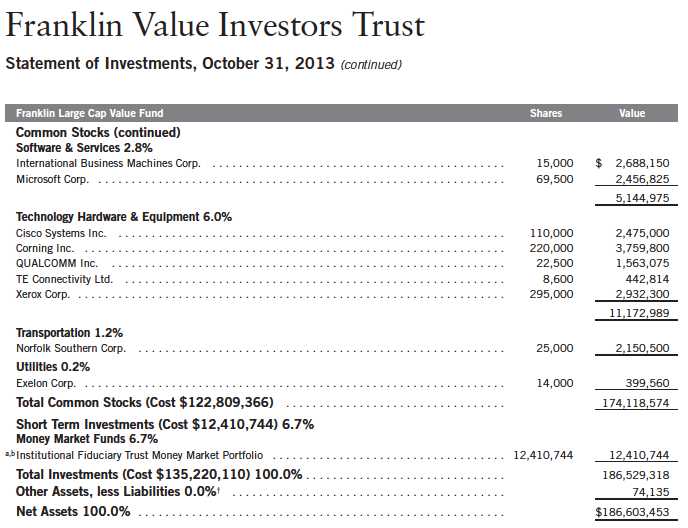
See Abbreviations on page 142.
†Rounds to less than 0.1% of net assets.
aNon-income producing.
bSee Note 7 regarding investments in the Institutional Fiduciary Trust Money Market Portfolio.
Annual Report | The accompanying notes are an integral part of these financial statements. | 87
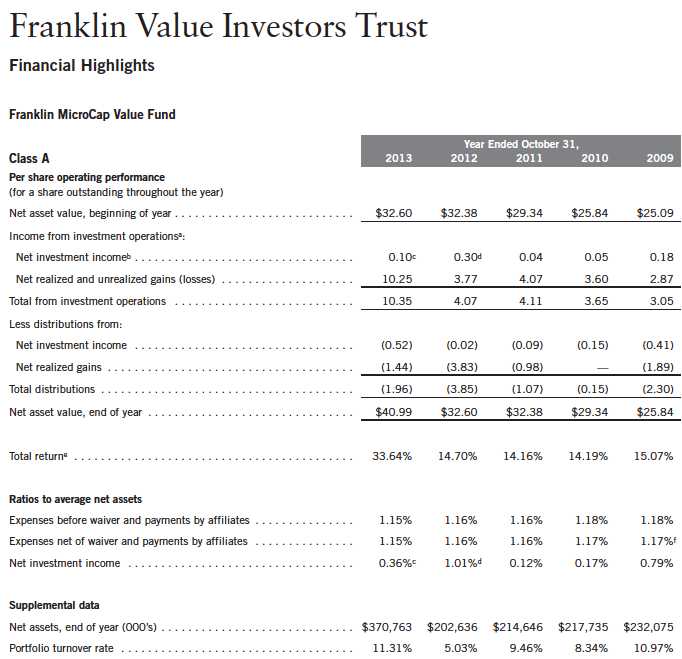
aThe amount shown for a share outstanding throughout the period may not correlate with the Statement of Operations for the period due to the timing of sales and repurchases of
the Fund shares in relation to income earned and/or fluctuating market value of the investments of the Fund.
bBased on average daily shares outstanding.
cNet investment income per share includes approximately $0.17 per share received in the form of special dividends. Excluding these amounts, the ratio of net investment income to
average net assets would have been (0.10)%.
dNet investment income per share includes approximately $0.23 per share received in the form of special dividends. Excluding these amounts, the ratio of net investment income to
average net assets would have been 0.25%.
eTotal return does not reflect sales commissions or contingent deferred sales charges, if applicable.
fBenefit of expense reduction rounds to less than 0.01%.
88 | The accompanying notes are an integral part of these financial statements. | Annual Report
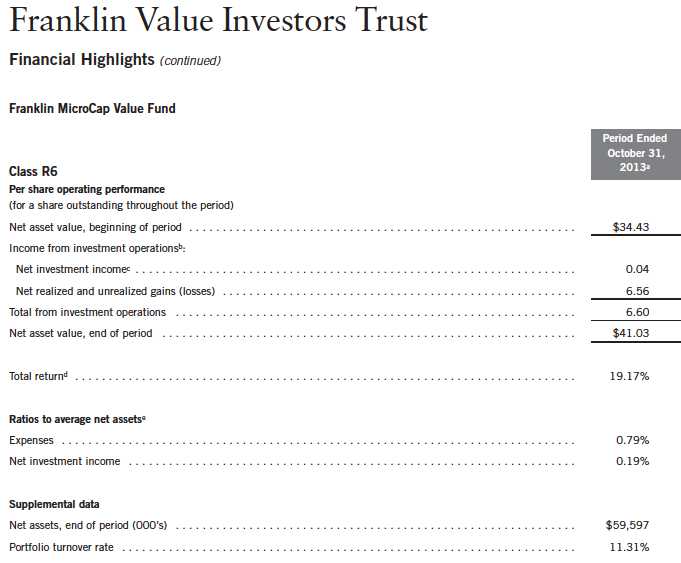
aFor the period May 1, 2013 (effective date) to October 31, 2013.
bThe amount shown for a share outstanding throughout the period may not correlate with the Statement of Operations for the period due to the timing of sales and repurchases of
the Fund shares in relation to income earned and/or fluctuating market value of the investments of the Fund.
cBased on average daily shares outstanding.
dTotal return is not annualized for periods less than one year.
eRatios are annualized for periods less than one year.
Annual Report | The accompanying notes are an integral part of these financial statements. | 89
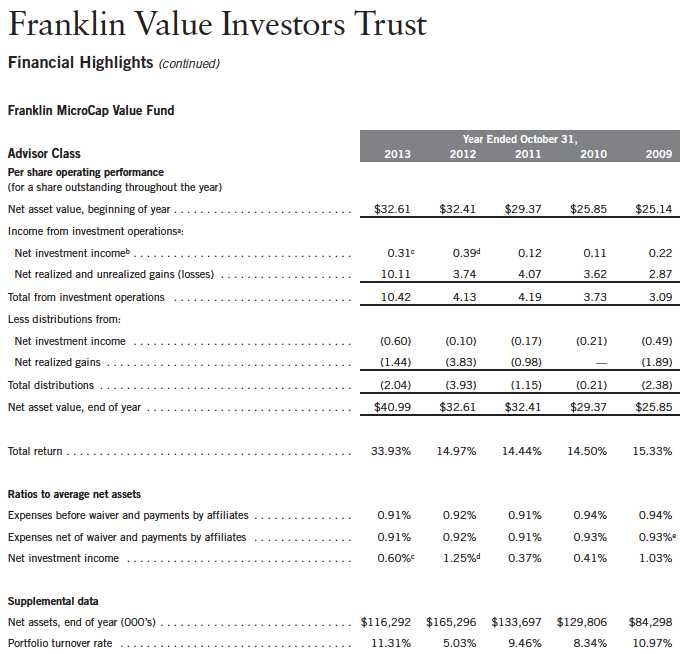
aThe amount shown for a share outstanding throughout the period may not correlate with the Statement of Operations for the period due to the timing of sales and repurchases of
the Fund shares in relation to income earned and/or fluctuating market value of the investments of the Fund.
bBased on average daily shares outstanding.
cNet investment income per share includes approximately $0.17 per share received in the form of special dividends. Excluding these amounts, the ratio of net investment income to
average net assets would have been 0.14%.
dNet investment income per share includes approximately $0.23 per share received in the form of special dividends. Excluding these amounts, the ratio of net investment income to
average net assets would have been 0.49%.
eBenefit of expense reduction rounds to less than 0.01%.
90 | The accompanying notes are an integral part of these financial statements. | Annual Report
Franklin Value Investors Trust
Statement of Investments, October 31, 2013
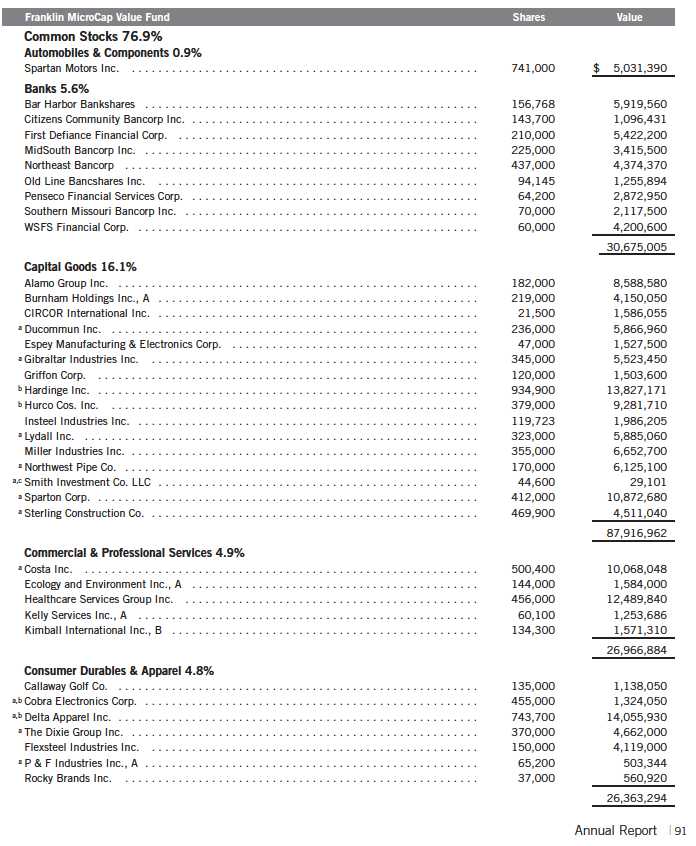
Franklin Value Investors Trust
Statement of Investments, October 31, 2013 (continued)
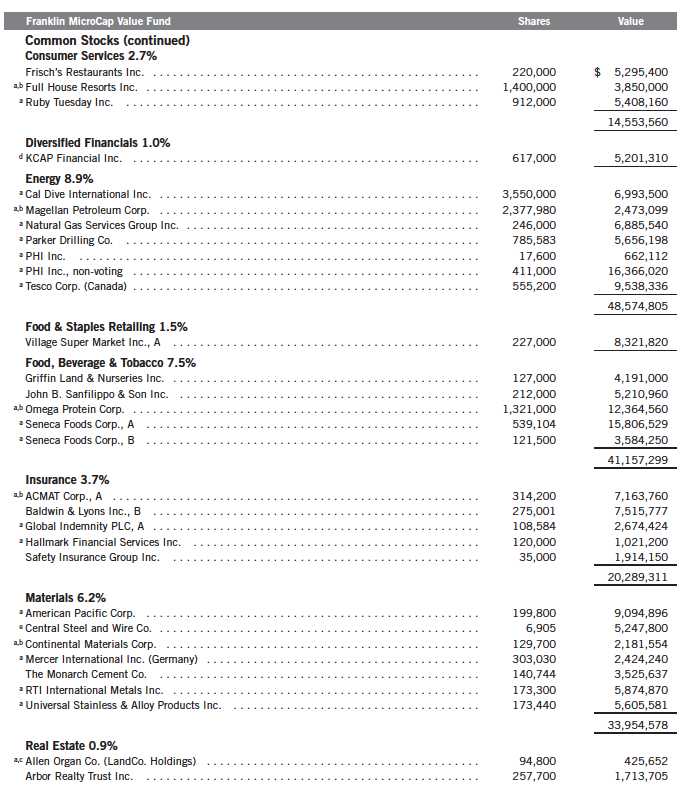
92 | Annual Report
Franklin Value Investors Trust
Statement of Investments, October 31, 2013 (continued)

Annual Report | 93
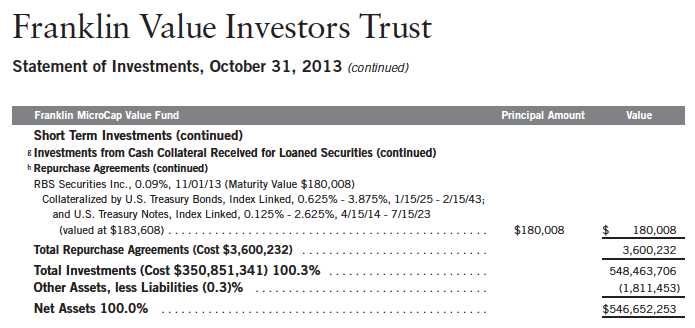
aNon-income producing.
bSee Note 9 regarding holdings of 5% voting securities.
cSee Note 8 regarding restricted securities.
dA portion or all of the security is on loan at October 31, 2013. See Note 1(d).
eAt October 31, 2013, pursuant to the Fund’s policies and the requirements of applicable securities law, the Fund may be restricted from trading this security for a limited or
extended period of time due to ownership limits and/or potential possession of material non-public information.
fSee Note 7 regarding investments in the Institutional Fiduciary Trust Money Market Portfolio.
gSee Note 1(d) regarding securities on loan.
hSee Note 1(c) regarding repurchase agreements.
iThe security is traded on a discount basis with no stated coupon rate.
94 | The accompanying notes are an integral part of these financial statements. | Annual Report

aThe amount shown for a share outstanding throughout the period may not correlate with the Statement of Operations for the period due to the timing of sales and repurchases of
the Fund shares in relation to income earned and/or fluctuating market value of the investments of the Fund.
bBased on average daily shares outstanding.
cNet investment income per share includes approximately $0.03 per share received in the form of special dividends. Excluding these amounts, the ratio of net investment income to
average net assets would have been 0.61%.
dNet investment income per share includes approximately $(0.06) per share of a return of capital adjustment to a previously recorded special dividend received by the Fund.
Excluding this non-recurring amount, the ratio of net investment income to average net assets would have been 1.16%.
eTotal return does not reflect sales commissions or contingent deferred sales charges, if applicable.
Annual Report | The accompanying notes are an integral part of these financial statements. | 95
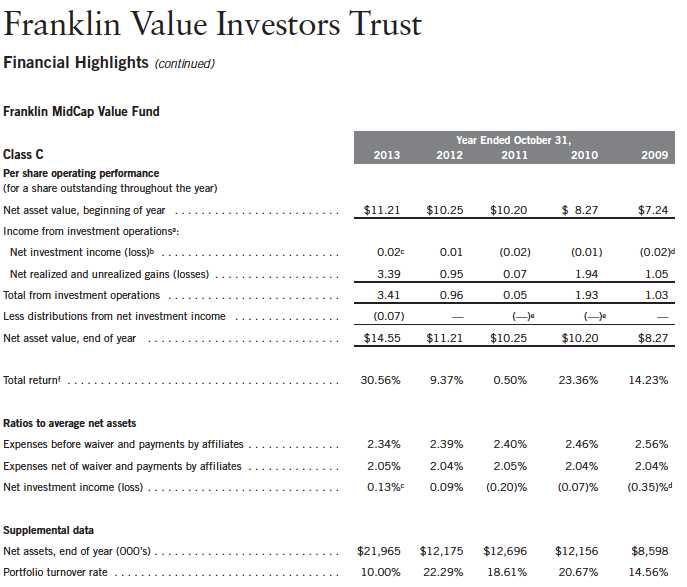
aThe amount shown for a share outstanding throughout the period may not correlate with the Statement of Operations for the period due to the timing of sales and repurchases of
the Fund shares in relation to income earned and/or fluctuating market value of the investments of the Fund.
bBased on average daily shares outstanding.
cNet investment income per share includes approximately $0.03 per share received in the form of special dividends. Excluding these amounts, the ratio of net investment income to
average net assets would have been (0.09)%.
dNet investment income per share includes approximately $(0.06) per share of a return of capital adjustment to a previously recorded special dividend received by the Fund.
Excluding this non-recurring amount, the ratio of net investment income to average net assets would have been 0.48%.
eAmount rounds to less than $0.01 per share.
fTotal return does not reflect sales commissions or contingent deferred sales charges, if applicable.
96 | The accompanying notes are an integral part of these financial statements. | Annual Report

aThe amount shown for a share outstanding throughout the period may not correlate with the Statement of Operations for the period due to the timing of sales and repurchases of
the Fund shares in relation to income earned and/or fluctuating market value of the investments of the Fund.
bBased on average daily shares outstanding.
cNet investment income per share includes approximately $0.03 per share received in the form of special dividends. Excluding these amounts, the ratio of net investment income to
average net assets would have been 0.41%.
dNet investment income per share includes approximately $(0.06) per share of a return of capital adjustment to a previously recorded special dividend received by the Fund.
Excluding this non-recurring amount, the ratio of net investment income to average net assets would have been 0.97%.
Annual Report | The accompanying notes are an integral part of these financial statements. | 97
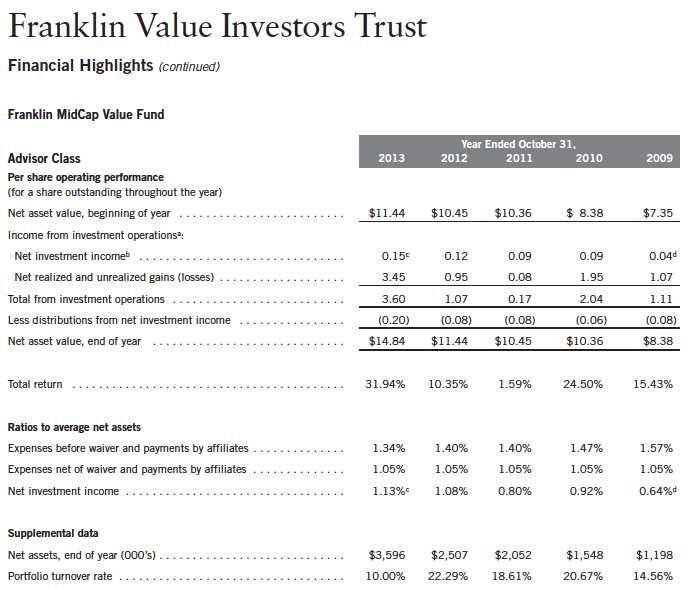
aThe amount shown for a share outstanding throughout the period may not correlate with the Statement of Operations for the period due to the timing of sales and repurchases of
the Fund shares in relation to income earned and/or fluctuating market value of the investments of the Fund.
bBased on average daily shares outstanding.
cNet investment income per share includes approximately $0.03 per share received in the form of special dividends. Excluding these amounts, the ratio of net investment income to
average net assets would have been 0.91%.
dNet investment income per share includes approximately $(0.06) per share of a return of capital adjustment to a previously recorded special dividend received by the Fund.
Excluding this non-recurring amount, the ratio of net investment income to average net assets would have been 1.47%.
98 | The accompanying notes are an integral part of these financial statements. | Annual Report
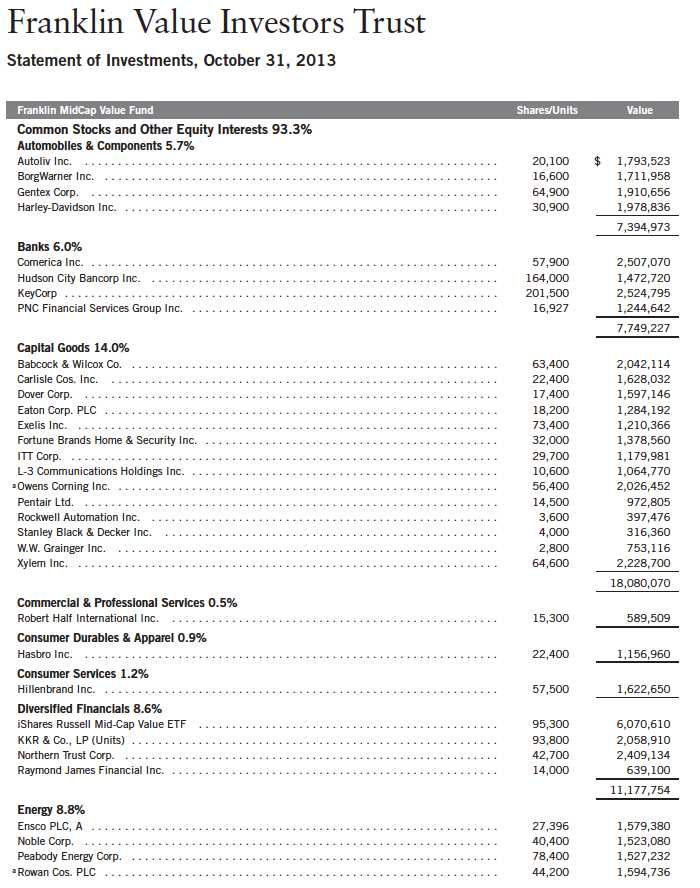
Annual Report | 99
Franklin Value Investors Trust
Statement of Investments, October 31, 2013 (continued)
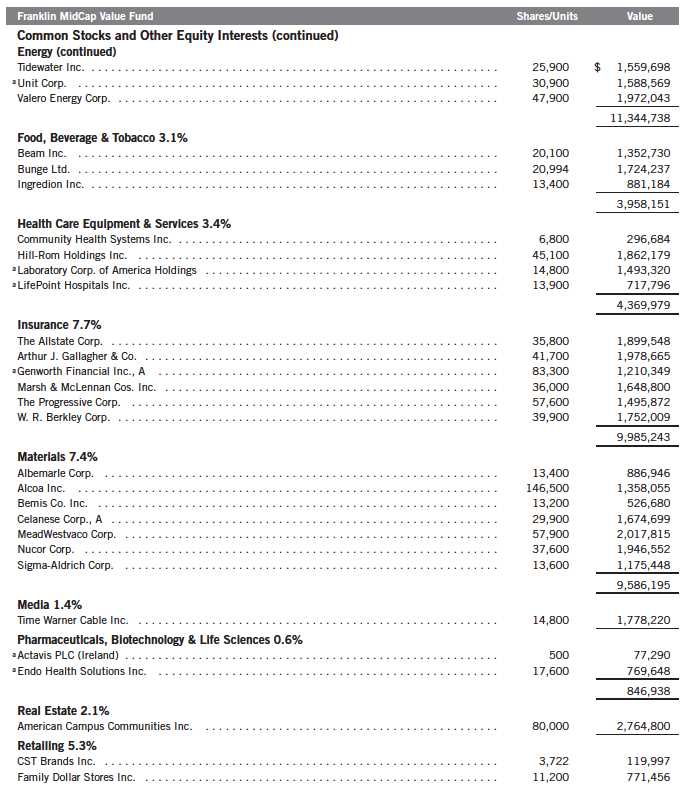
100 | Annual Report

Annual Report | The accompanying notes are an integral part of these financial statements. | 101
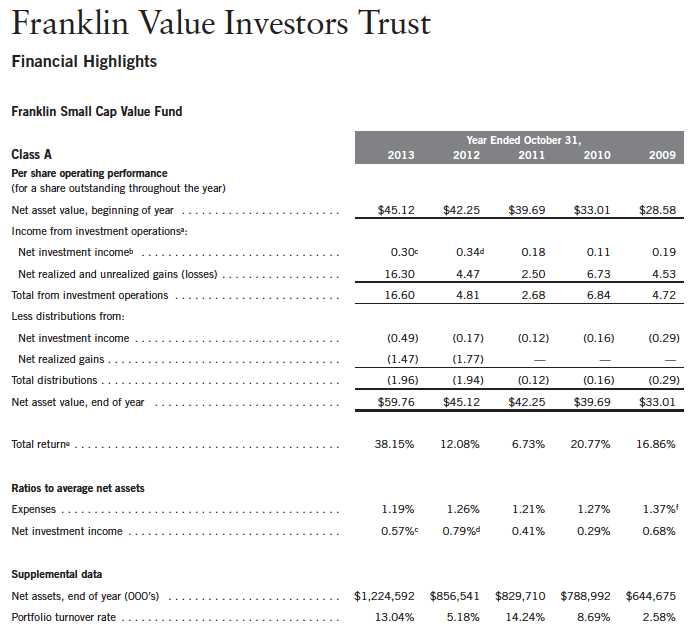
aThe amount shown for a share outstanding throughout the period may not correlate with the Statement of Operations for the period due to the timing of sales and repurchases of
the Fund shares in relation to income earned and/or fluctuating market value of the investments of the Fund.
bBased on average daily shares outstanding.
cNet investment income per share includes approximately $0.10 per share received in the form of special dividends. Excluding these amounts, the ratio of net investment income to
average net assets would have been 0.38%.
dNet investment income per share includes approximately $0.14 per share received in the form of special dividends. Excluding these amounts, the ratio of net investment income to
average net assets would have been 0.48%.
eTotal return does not reflect sales commissions or contingent deferred sales charges, if applicable.
fBenefit of expense reduction rounds to less than 0.01%.
102 | The accompanying notes are an integral part of these financial statements. | Annual Report
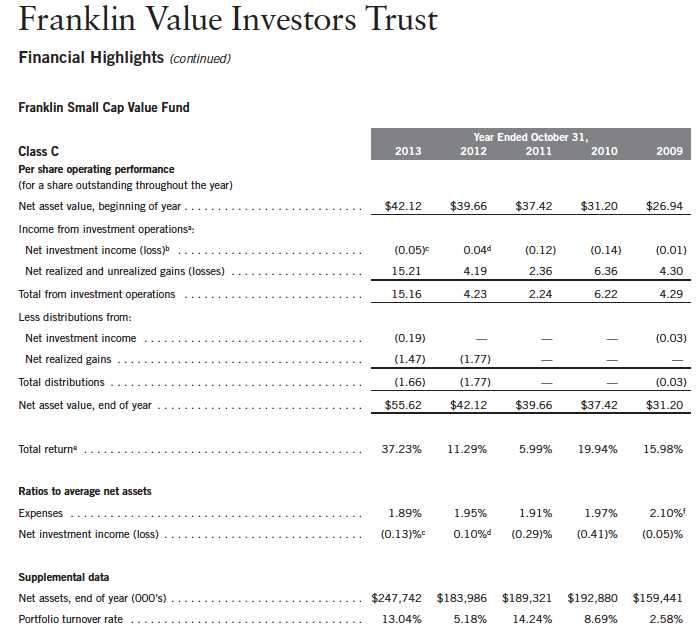
aThe amount shown for a share outstanding throughout the period may not correlate with the Statement of Operations for the period due to the timing of sales and repurchases of
the Fund shares in relation to income earned and/or fluctuating market value of the investments of the Fund.
bBased on average daily shares outstanding.
cNet investment income per share includes approximately $0.10 per share received in the form of special dividends. Excluding these amounts, the ratio of net investment income to
average net assets would have been (0.32)%.
dNet investment income per share includes approximately $0.14 per share received in the form of special dividends. Excluding these amounts, the ratio of net investment income to
average net assets would have been (0.21)%.
eTotal return does not reflect sales commissions or contingent deferred sales charges, if applicable.
fBenefit of expense reduction rounds to less than 0.01%.
Annual Report | The accompanying notes are an integral part of these financial statements. | 103
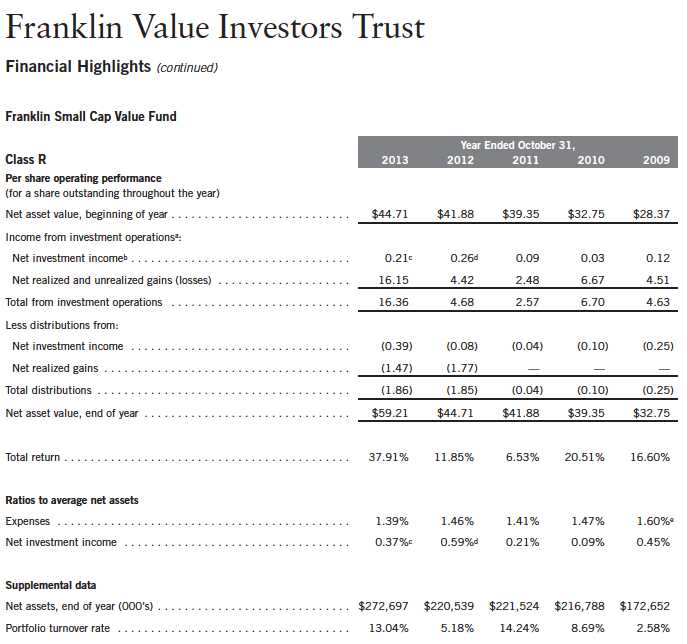
aThe amount shown for a share outstanding throughout the period may not correlate with the Statement of Operations for the period due to the timing of sales and repurchases of
the Fund shares in relation to income earned and/or fluctuating market value of the investments of the Fund.
bBased on average daily shares outstanding.
cNet investment income per share includes approximately $0.10 per share received in the form of special dividends. Excluding these amounts, the ratio of net investment income to
average net assets would have been 0.18%.
dNet investment income per share includes approximately $0.14 per share received in the form of special dividends. Excluding these amounts, the ratio of net investment income to
average net assets would have been 0.28%.
eBenefit of expense reduction rounds to less than 0.01%.
104 | The accompanying notes are an integral part of these financial statements. | Annual Report
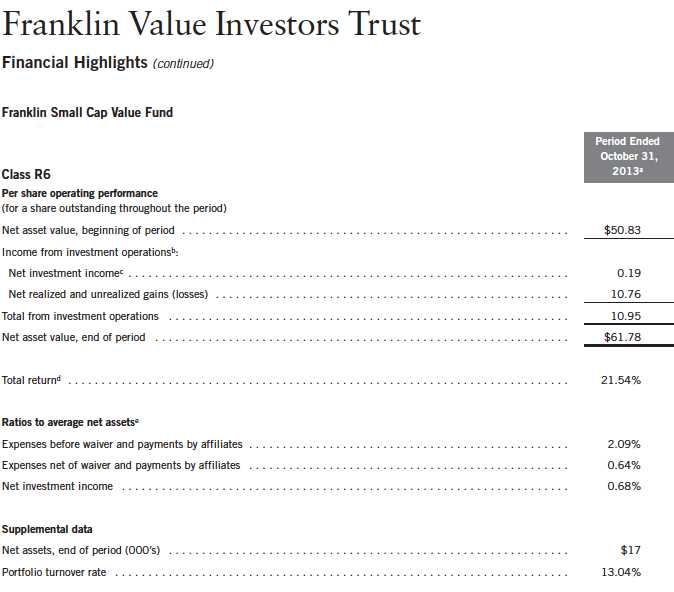
aFor the period May 1, 2013 (effective date) to October 31, 2013.
bThe amount shown for a share outstanding throughout the period may not correlate with the Statement of Operations for the period due to the timing of sales and repurchases of
the Fund shares in relation to income earned and/or fluctuating market value of the investments of the Fund.
cBased on average daily shares outstanding.
dTotal return is not annualized for periods less than one year.
eRatios are annualized for periods less than one year.
Annual Report | The accompanying notes are an integral part of these financial statements. | 105

aThe amount shown for a share outstanding throughout the period may not correlate with the Statement of Operations for the period due to the timing of sales and repurchases of
the Fund shares in relation to income earned and/or fluctuating market value of the investments of the Fund.
bBased on average daily shares outstanding.
cNet investment income per share includes approximately $0.10 per share received in the form of special dividends. Excluding these amounts, the ratio of net investment income to
average net assets would have been 0.68%.
dNet investment income per share includes approximately $0.14 per share received in the form of special dividends. Excluding these amounts, the ratio of net investment income to
average net assets would have been 0.78%.
eBenefit of expense reduction rounds to less than 0.01%.
106 | The accompanying notes are an integral part of these financial statements. | Annual Report
Franklin Value Investors Trust
Statement of Investments, October 31, 2013

Annual Report | 107
Franklin Value Investors Trust
Statement of Investments, October 31, 2013 (continued)
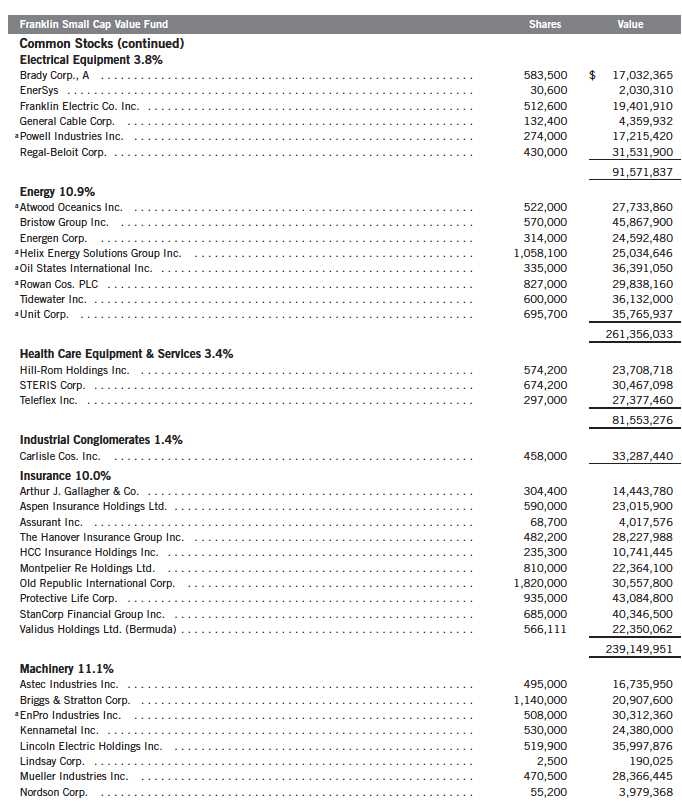
108 | Annual Report
Franklin Value Investors Trust
Statement of Investments, October 31, 2013 (continued)
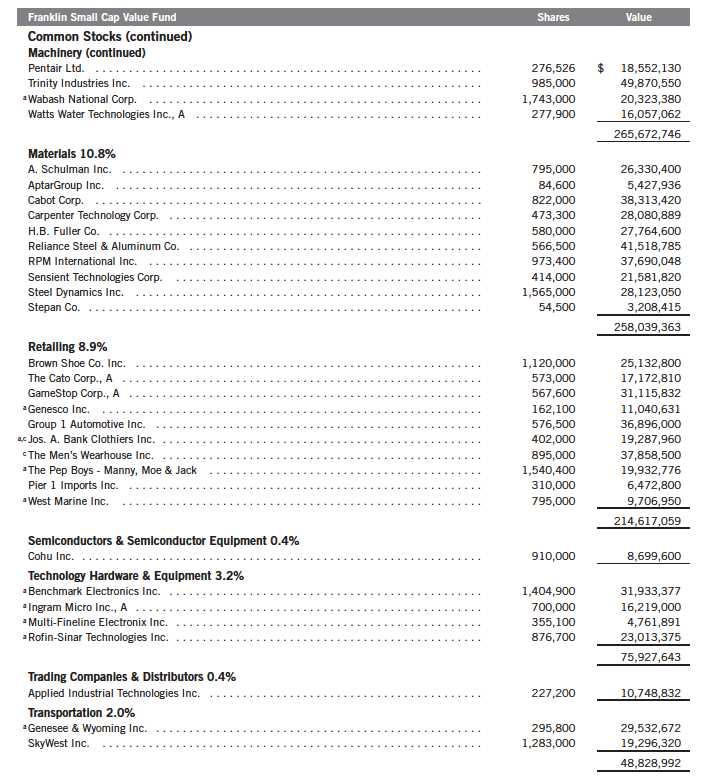
Annual Report | 109
Franklin Value Investors Trust
Statement of Investments, October 31, 2013 (continued)
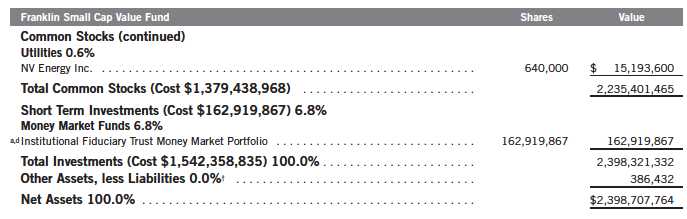
†Rounds to less than 0.1% of net assets.
aNon-income producing.
bSee Note 9 regarding holdings of 5% voting securities.
cAt October 31, 2013, pursuant to the Fund’s policies and the requirements of applicable securities law, the Fund may be restricted from trading these securities for a limited or
extended period of time due to ownership limits and/or potential possession of material non-public information.
dSee Note 7 regarding investments in the Institutional Fiduciary Trust Money Market Portfolio.
110 | The accompanying notes are an integral part of these financial statements. | Annual Report

Annual Report | The accompanying notes are an integral part of these financial statements. | 111
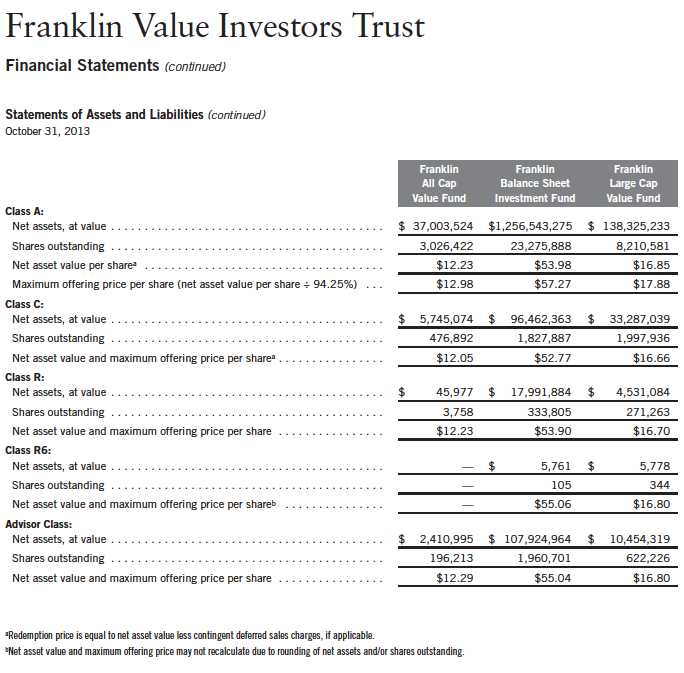
112 | The accompanying notes are an integral part of these financial statements. | Annual Report
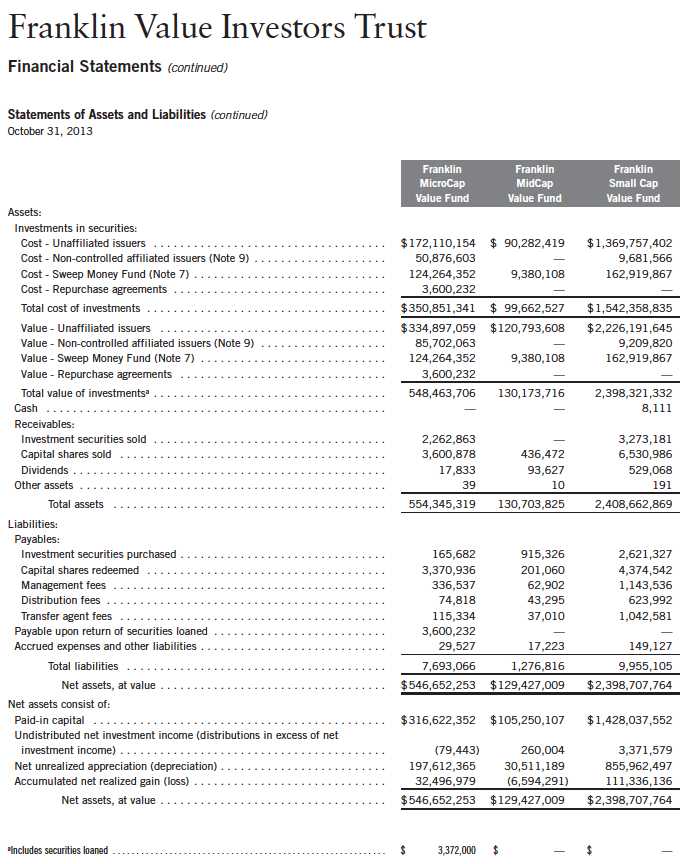
Annual Report | The accompanying notes are an integral part of these financial statements. | 113
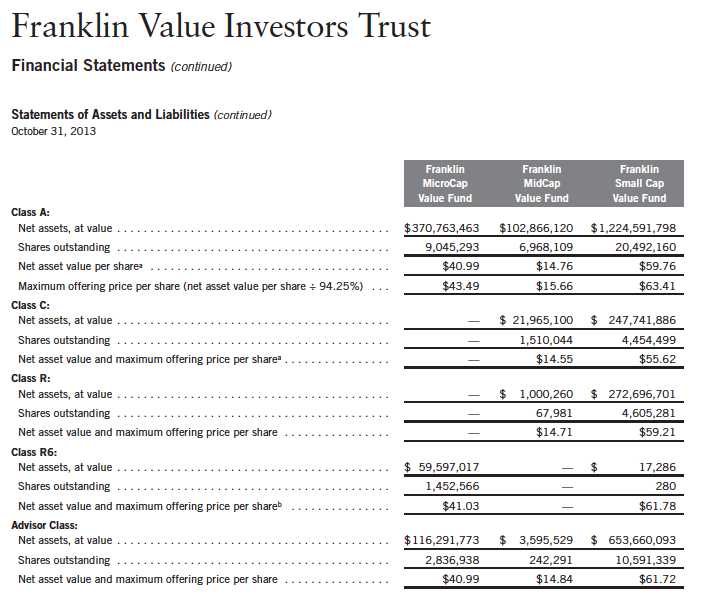
aRedemption price is equal to net asset value less contingent deferred sales charges, if applicable.
bNet asset value and maximum offering price may not recalculate due to rounding of net assets and/shares outstanding.
114 | The accompanying notes are an integral part of these financial statements. | Annual Report

Annual Report | The accompanying notes are an integral part of these financial statements. | 115
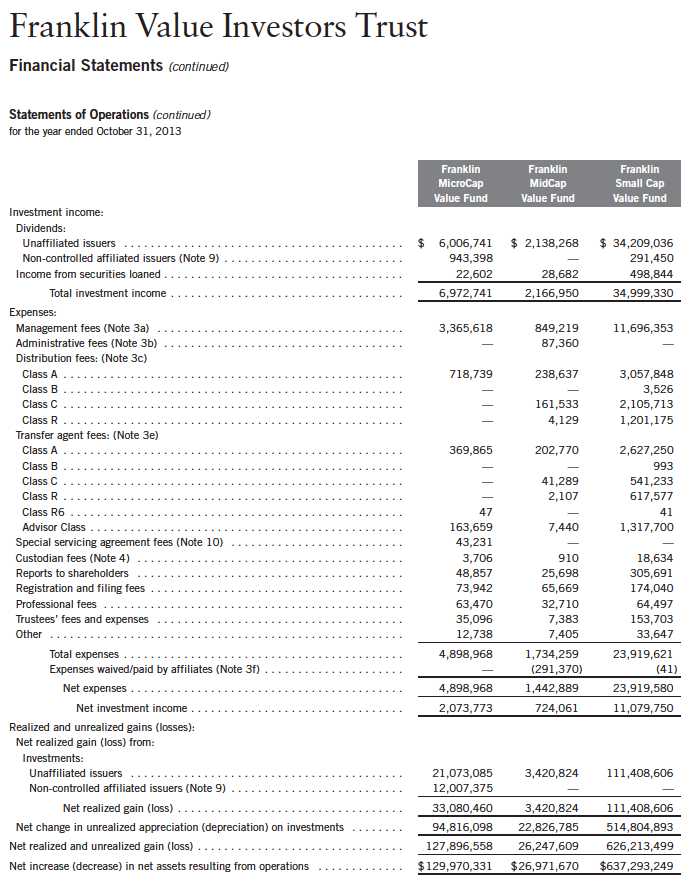
116 | The accompanying notes are an integral part of these financial statements. | Annual Report
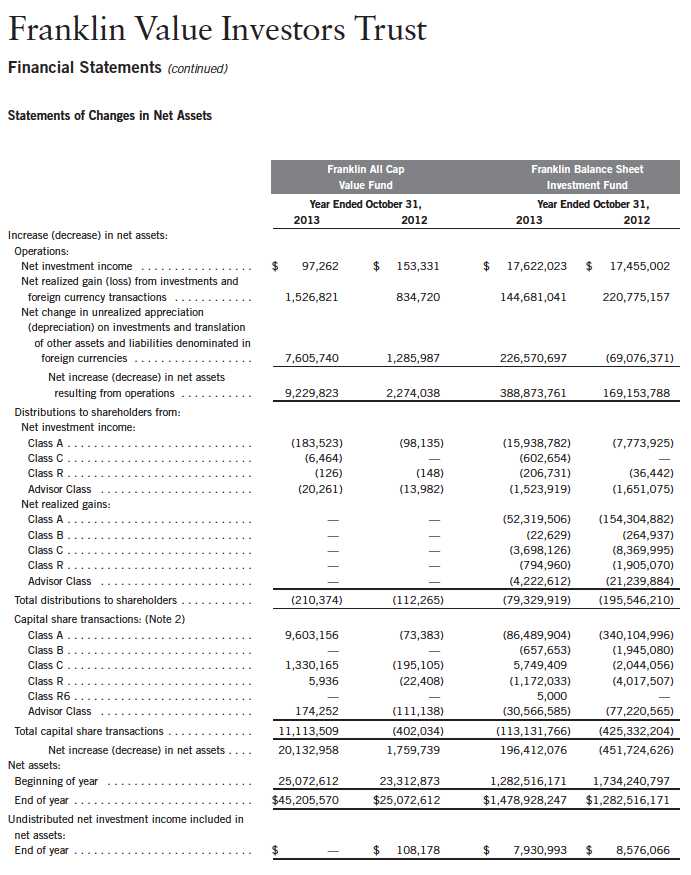
Annual Report | The accompanying notes are an integral part of these financial statements. | 117

118 | The accompanying notes are an integral part of these financial statements. | Annual Report

Annual Report | The accompanying notes are an integral part of these financial statements. | 119
Franklin Value Investors Trust
Notes to Financial Statements
1. ORGANIZATION AND SIGNIFICANT ACCOUNTING POLICIES
Franklin Value Investors Trust (Trust) is registered under the Investment Company Act of 1940, as amended, (1940 Act) as an open-end investment company, consisting of six funds (Funds). The classes of shares offered within each of the Funds are indicated below. Each class of shares differs by its initial sales load, contingent deferred sales charges, voting rights on matters affecting a single class, its exchange privilege and fees primarily due to differing arrangements for distribution and transfer agent fees.

The following summarizes the Funds’ significant accounting policies.
a. Financial Instrument Valuation
The Funds’ investments in financial instruments are carried at fair value daily. Fair value is the price that would be received to sell an asset or paid to transfer a liability in an orderly transaction between market participants on the measurement date. Under procedures approved by the Trust’s Board of Trustees (the Board), the Funds’ administrator, investment manager and other affiliates have formed the Valuation and Liquidity Oversight Committee (VLOC). The VLOC provides administration and oversight of the Funds’ valuation policies and procedures, which are approved annually by the Board. Among other things, these procedures allow the Funds to utilize independent pricing services, quotations from securities and financial instrument dealers, and other market sources to determine fair value.
Equity securities and exchange traded funds listed on an exchange or on the NASDAQ National Market System are valued at the last quoted sale price or the official closing price of the day, respectively. Foreign equity securities are valued as of the close of trading on the foreign stock exchange on which the security is primarily traded, or the NYSE, whichever is earlier. The value is then converted into its U.S. dollar equivalent at the foreign exchange rate in effect at the close of the NYSE on the day that the value of the security is determined. Over-the-counter (OTC) securities are valued within the range of the most recent quoted bid and ask prices. Securities that trade in multiple markets or on multiple exchanges are valued according to the broadest and most representative market. Certain equity securities are valued based upon fundamental characteristics or relationships to similar securities. Investments in open-end mutual funds are valued at the closing net asset value. Repurchase agreements are valued at cost, which approximates market value.
The Funds have procedures to determine the fair value of financial instruments for which market prices are not reliable or readily available. Under these procedures, the VLOC convenes on a
120 | Annual Report
Franklin Value Investors Trust
Notes to Financial Statements (continued)
| 1. | ORGANIZATION AND SIGNIFICANT ACCOUNTING POLICIES (continued) |
| a. | Financial Instrument Valuation (continued) |
regular basis to review such financial instruments and considers a number of factors, including significant unobservable valuation inputs, when arriving at fair value. The VLOC primarily employs a market-based approach which may use related or comparable assets or liabilities, recent transactions, market multiples, book values, and other relevant information for the investment to determine the fair value of the investment. An income-based valuation approach may also be used in which the anticipated future cash flows of the investment are discounted to calculate fair value. Discounts may also be applied due to the nature or duration of any restrictions on the disposition of the investments. Due to the inherent uncertainty of valuations of such investments, the fair values may differ significantly from the values that would have been used had an active market existed. The VLOC employs various methods for calibrating these valuation approaches including a regular review of key inputs and assumptions, transactional back-testing or disposition analysis, and reviews of any related market activity.
Trading in securities on foreign securities stock exchanges and OTC markets may be completed before the daily close of business on the NYSE. Occasionally, events occur between the time at which trading in a foreign security is completed and the close of the NYSE that might call into question the reliability of the value of a portfolio security held by the fund. As a result, differences may arise between the value of the Funds’ portfolio securities as determined at the foreign market close and the latest indications of value at the close of the NYSE. In order to minimize the potential for these differences, the VLOC monitors price movements following the close of trading in foreign stock markets through a series of country specific market proxies (such as baskets of American Depositary Receipts, futures contracts and exchange traded funds). These price movements are measured against established trigger thresholds for each specific market proxy to assist in determining if an event has occurred that may call into question the reliability of the values of the foreign securities held by the Funds. If such an event occurs, the securities may be valued using fair value procedures, which may include the use of independent pricing services.
In addition, certain foreign markets may be open on days that the NYSE is closed, which could result in differences between the value of the Funds’ portfolio securities on the last business day and the last calendar day of the reporting period. Any significant security valuation changes due to an open foreign market are adjusted and reflected by the Funds for financial reporting purposes.
b. Foreign Currency Translation
Portfolio securities and other assets and liabilities denominated in foreign currencies are translated into U.S. dollars based on the exchange rate of such currencies against U.S. dollars on the date of valuation. The Funds may enter into foreign currency exchange contracts to facilitate transactions denominated in a foreign currency. Purchases and sales of securities, income and expense items denominated in foreign currencies are translated into U.S. dollars at the exchange rate in effect on the transaction date. Portfolio securities and assets and liabilities denominated in foreign currencies contain risks that those currencies will decline in value relative to the U.S. dollar. Occasionally, events may impact the availability or reliability of foreign exchange rates
Annual Report | 121
Franklin Value Investors Trust
Notes to Financial Statements (continued)
| 1. | ORGANIZATION AND SIGNIFICANT ACCOUNTING POLICIES (continued) |
| b. | Foreign Currency Translation (continued) |
used to convert the U.S. dollar equivalent value. If such an event occurs, the foreign exchange rate will be valued at fair value using procedures established and approved by the Board.
The Funds do not separately report the effect of changes in foreign exchange rates from changes in market prices on securities held. Such changes are included in net realized and unrealized gain or loss from investments on the Statements of Operations.
Realized foreign exchange gains or losses arise from sales of foreign currencies, currency gains or losses realized between the trade and settlement dates on securities transactions and the difference between the recorded amounts of dividends, interest, and foreign withholding taxes and the U.S. dollar equivalent of the amounts actually received or paid. Net unrealized foreign exchange gains and losses arise from changes in foreign exchange rates on foreign denominated assets and liabilities other than investments in securities held at the end of the reporting period.
c. Repurchase Agreements
Certain funds enter into repurchase agreements, which are accounted for as a loan by the fund to the seller, collateralized by securities which are delivered to the fund’s custodian. The market value, including accrued interest, of the initial collateralization is required to be at least 102% of the dollar amount invested by the fund, with the value of the underlying securities marked to market daily to maintain coverage of at least 100%. Repurchase agreements are subject to the terms of Master Repurchase Agreements (MRAs) with approved counterparties (sellers). The MRAs contain various provisions, including but not limited to events of default and maintenance of collateral for repurchase agreements. In the event of default by either the seller or the funds, certain MRAs may permit the non-defaulting party to net and close-out all transactions, if any, traded under such agreements. The funds may sell securities it holds as collateral and apply the proceeds towards the repurchase price and any other amounts owed by the seller to the funds in the event of default by the seller. This could involve costs or delays in addition to a loss on the securities if their value falls below the repurchase price owed by the seller. All repurchase agreements held by the funds at year end, as indicated in the Statement of Investments, had been entered into on October 31, 2013.
d. Securities Lending
Certain funds participate in an agency based securities lending program. The fund receives cash collateral against the loaned securities in an amount equal to at least 102% of the market value of the loaned securities. Collateral is maintained over the life of the loan in an amount not less than 100% of the market value of loaned securities, as determined at the close of fund business each day; any additional collateral required due to changes in security values is delivered to the fund on the next business day. The collateral is invested in repurchase agreements as indicated on the Statements of Investments. The fund receives income from the investment of cash collateral,
122 | Annual Report
Franklin Value Investors Trust
Notes to Financial Statements (continued)
| 1. | ORGANIZATION AND SIGNIFICANT ACCOUNTING POLICIES (continued) |
| d. | Securities Lending (continued) |
in addition to lending fees and rebates paid by the borrower. The fund bears the market risk with respect to the collateral investment, securities loaned, and the risk that the agent may default on its obligations to the fund. The securities lending agent has agreed to indemnify the fund in the event of default by a third party borrower.
e. Income and Deferred Taxes
It is each fund’s policy to qualify as a regulated investment company under the Internal Revenue Code. Each fund intends to distribute to shareholders substantially all of its taxable income and net realized gains to relieve it from federal income and excise taxes. As a result, no provision for U.S. federal income taxes is required.
The Funds may be subject to foreign taxation related to income received, capital gains on the sale of securities and certain foreign currency transactions in the foreign jurisdictions in which it invests. Foreign taxes, if any, are recorded based on the tax regulations and rates that exist in the foreign markets in which the Funds invest. When a capital gain tax is determined to apply the Funds record an estimated deferred tax liability in an amount that would be payable if the securities were disposed of on the valuation date.
Each fund recognizes the tax benefits of uncertain tax positions only when the position is “more likely than not” to be sustained upon examination by the tax authorities based on the technical merits of the tax position. As of October 31, 2013, and for all open tax years, each fund has determined that no liability for unrecognized tax benefits is required in each fund’s financial statements related to uncertain tax positions taken on a tax return (or expected to be taken on future tax returns). Open tax years are those that remain subject to examination and are based on each tax jurisdiction statute of limitation.
f. Security Transactions, Investment Income, Expenses and Distributions
Security transactions are accounted for on trade date. Realized gains and losses on security transactions are determined on a specific identification basis. Estimated expenses are accrued daily. Dividend income, is recorded on the ex-dividend date except that certain dividends from foreign securities are recognized as soon as the Funds are notified of the ex-dividend date. Distributions to shareholders are recorded on the ex-dividend date and are determined according to income tax regulations (tax basis). Distributable earnings determined on a tax basis may differ from earnings recorded in accordance with accounting principles generally accepted in the United States of America. These differences may be permanent or temporary. Permanent differences are reclassified among capital accounts to reflect their tax character. These reclassifications have no impact on net assets or the results of operations. Temporary differences are not reclassified, as they may reverse in subsequent periods.
Annual Report | 123
Franklin Value Investors Trust
Notes to Financial Statements (continued)
| 1. | ORGANIZATION AND SIGNIFICANT ACCOUNTING POLICIES (continued) |
| f. | Security Transactions, Investment Income, Expenses and Distributions (continued) |
Common expenses incurred by the Trust are allocated among the Funds based on the ratio of net assets of each fund to the combined net assets of the Trust. Fund specific expenses are charged directly to the fund that incurred the expense.
Realized and unrealized gains and losses and net investment income, not including class specific expenses, are allocated daily to each class of shares based upon the relative proportion of net assets of each class. Differences in per share distributions, by class, are generally due to differences in class specific expenses.
Distributions received by the funds from certain securities may be a return of capital (ROC). Such distributions reduce the cost basis of the securities, and any distributions in excess of the cost basis are recognized as capital gains.
g. Accounting Estimates
The preparation of financial statements in accordance with accounting principles generally accepted in the United States of America requires management to make estimates and assumptions that affect the reported amounts of assets and liabilities at the date of the financial statements and the amounts of income and expenses during the reporting period. Actual results could differ from those estimates.
h. Guarantees and Indemnifications
Under the Trust’s organizational documents, its officers and trustees are indemnified by the Trust against certain liabilities arising out of the performance of their duties to the Trust. Additionally, in the normal course of business, the Trust, on behalf of the Funds, enters into contracts with service providers that contain general indemnification clauses. The Trust’s maximum exposure under these arrangements is unknown as this would involve future claims that may be made against the Trust that have not yet occurred. Currently, the Trust expects the risk of loss to be remote.
124 | Annual Report
Franklin Value Investors Trust
Notes to Financial Statements (continued)
2. SHARES OF BENEFICIAL INTEREST
At October 31, 2013, there were an unlimited number of shares authorized ($0.01 par value).
Transactions in the Funds’ shares were as follows:
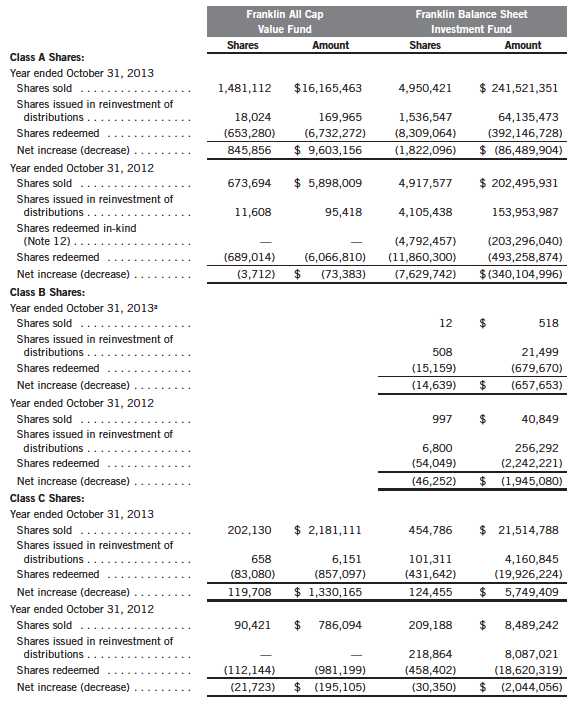
Annual Report | 125
Franklin Value Investors Trust
Notes to Financial Statements (continued)
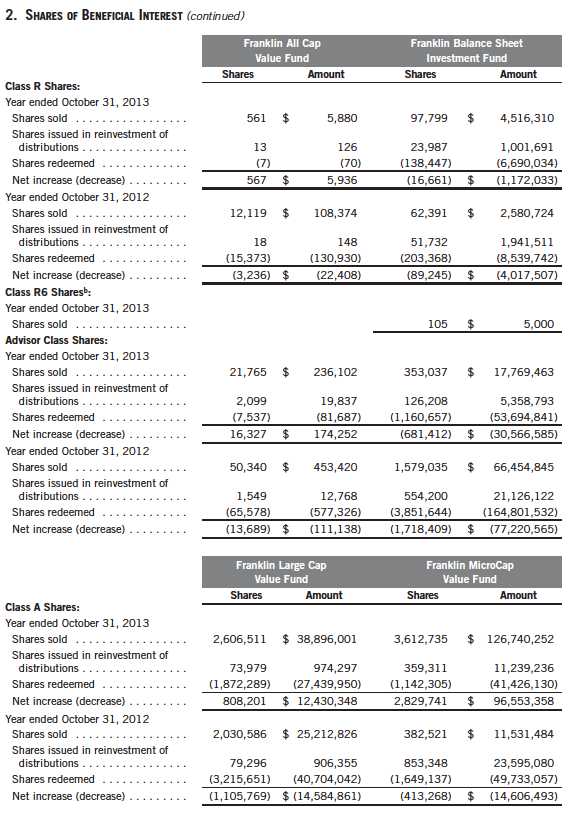
126 | Annual Report
Franklin Value Investors Trust
Notes to Financial Statements (continued)

Annual Report | 127
Franklin Value Investors Trust
Notes to Financial Statements (continued)
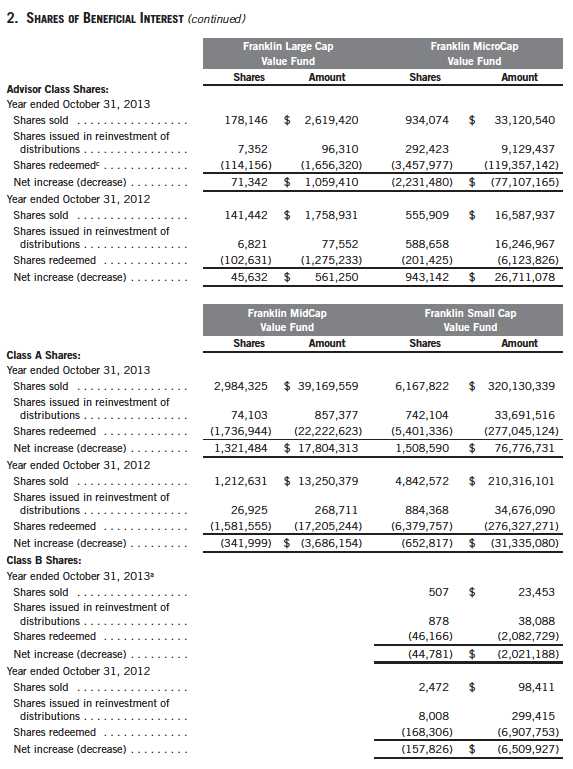
128 | Annual Report
Franklin Value Investors Trust
Notes to Financial Statements (continued)
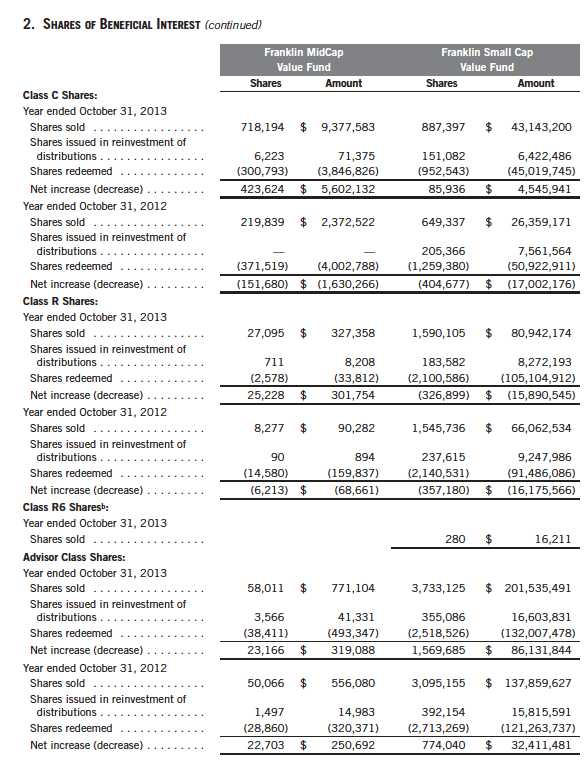
aEffective March 22, 2013, all Class B shares were converted into Class A.
bFor the period May 1, 2013 (effective date) to October 31, 2013.
cEffective May 1, 2013, a portion of Advisor Class shares were exchanged into Class R6.
Annual Report | 129
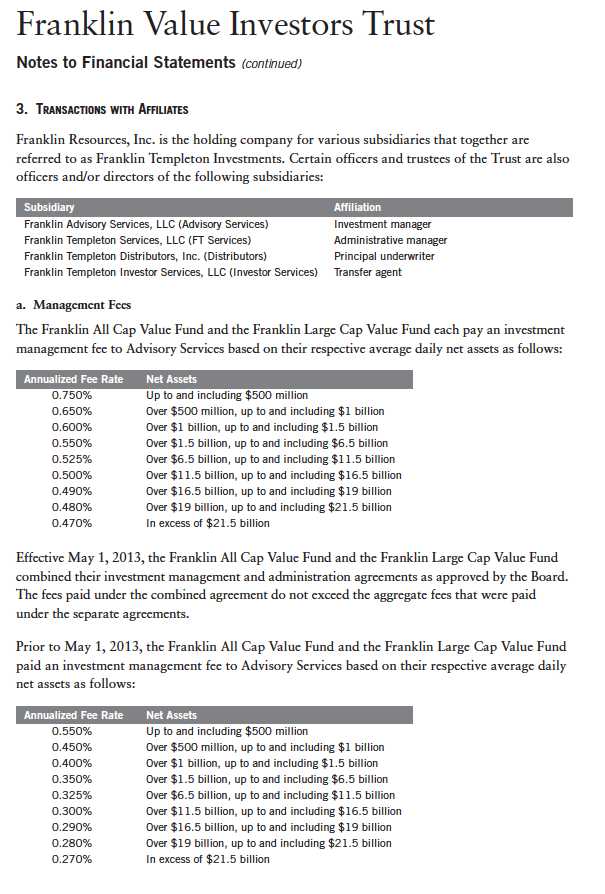
130 | Annual Report

Annual Report | 131
Franklin Value Investors Trust
Notes to Financial Statements (continued)
| 3. | TRANSACTIONS WITH AFFILIATES (continued) |
| a. | Management Fees (continued) |
The Franklin Small Cap Value Fund pays an investment management fee to Advisory Services based on the average daily net assets of the fund as follows:
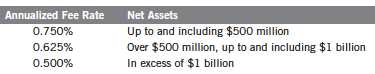
b. Administrative Fees
Effective May 1, 2013, under an agreement with Advisory Services, FT Services provides administrative services to the Franklin All Cap Value Fund, the Franklin Large Cap Value Fund and the Franklin MidCap Value Fund. The fee is paid by Advisory Services based on each fund’s average daily net assets, and is not an additional expense of the fund. Prior to May 1, 2013, the Funds paid FT Services for administrative services. The Franklin All Cap Value Fund, the Franklin Large Cap Value Fund and the Franklin MidCap Value Fund paid administrative fees of 0.20% per year of their respective average daily net assets.
Under an agreement with Advisory Services, the administrative fee for the Franklin Balance Sheet Investment Fund, the Franklin MicroCap Value Fund and the Franklin Small Cap Value Fund is paid by Advisory Services based on each fund’s average daily net assets, and is not an additional expense of the funds.
c. Distribution Fees
The Board has adopted distribution plans for each share class, with the exception of Class R6 and Advisor Class shares, pursuant to Rule 12b-1 under the 1940 Act. Distribution fees are not charged on shares held by affiliates. Under the Funds’ Class A reimbursement distribution plans, the Funds reimburse Distributors for costs incurred in connection with the servicing, sale and distribution of each fund’s shares up to the maximum annual plan rate. Under the Class A reimbursement distribution plans, costs exceeding the maximum for the current plan year cannot be reimbursed in subsequent periods. In addition, under the Funds’ Class B, C and R compensation distribution plans, the Funds pay Distributors for costs incurred in connection with the servicing, sale and distribution of each fund’s shares up to the maximum annual plan rate for each class. The plan year, for purposes of monitoring compliance with the maximum annual plan rates, is February 1 through January 31 for each fund.
The maximum annual plan rates, based on the average daily net assets, for each class, are as follows:
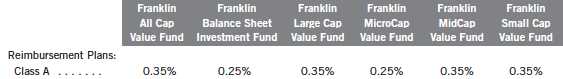
132 | Annual Report
Franklin Value Investors Trust
Notes to Financial Statements (continued)
| 3. | TRANSACTIONS WITH AFFILIATES (continued) |
| c. | Distribution Fees (continued) |
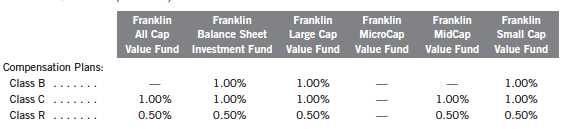
The Board has set the current rate at 0.30% per year for Class A shares for the Franklin All Cap Value Fund, the Franklin Large Cap Value Fund, the Franklin MidCap Value Fund, and the Franklin Small Cap Value Fund until further notice and approval by the Board.
d. Sales Charges/Underwriting Agreements
Front-end sales charges and contingent deferred sales charges (CDSC) do not represent expenses of the Funds. These charges are deducted from the proceeds of sales of fund shares prior to investment or from redemption proceeds prior to remittance, as applicable. Distributors has advised the Funds of the following commission transactions related to the sales and redemptions of the Funds’ shares for the year:
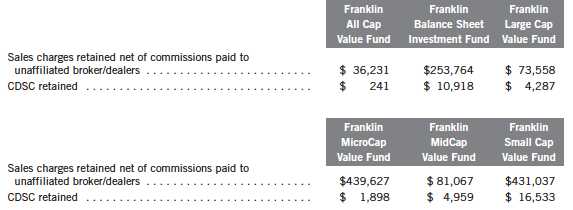
e. Transfer Agent Fees
Each class of shares, except for Class R6, pays transfer agent fees to Investor Services for its performance of shareholder servicing obligations and reimburses Investor Services for out of pocket expenses incurred, including shareholding servicing fees paid to third parties. These fees are allocated daily based upon their relative proportion of such classes’ aggregate net assets. Class R6 pays Investor Services transfer agent fees specific to that class.
Annual Report | 133
Franklin Value Investors Trust
Notes to Financial Statements (continued)
| 3. | TRANSACTIONS WITH AFFILIATES (continued) |
| e. | Transfer Agent Fees (continued) |
For the year ended October 31, 2013, the Funds paid transfer agent fees as noted in the Statements of Operations of which the following amounts were retained by Investor Services:
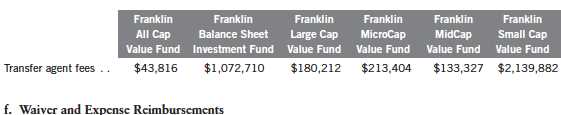
Advisory Services and FT Services have contractually agreed in advance to waive or limit their respective fees and to assume as their own expense certain expenses otherwise payable by the Franklin All Cap Value Fund and the Franklin MidCap Value Fund so that the expenses (excluding distribution fees and acquired fund fees and expenses) for Class A, Class C, Class R and Advisor Class of the funds do not exceed 0.95% and 1.05%, respectively (other than certain non-routine expenses or costs, including those relating to litigation, indemnification, reorganizations, and liquidations) until February 28, 2014. Prior to March 1, 2013, expenses were limited to 0.90% for the Franklin All Cap Value Fund.
Additionally, Investor Services has contractually agreed in advance to waive or limit its fees so that the Class R6 transfer agent fees for the Franklin Balance Sheet Investment Fund, the Franklin Large Cap Value Fund, the Franklin MicroCap Value Fund and the Franklin Small Cap Value Fund do not exceed 0.01% through February 28, 2014. For the Franklin MicroCap Value Fund, there were no expenses waived during the year ended October 31, 2013.
4. EXPENSE OFFSET ARRANGEMENT
The Funds have entered into an arrangement with their custodian whereby credits realized as a result of uninvested cash balances are used to reduce a portion of the Funds’ custodian expenses. During the year ended October 31, 2013, there were no credits earned.
5. INCOME TAXES
For tax purposes, capital losses may be carried over to offset future capital gains. Capital loss carryforwards with no expiration, if any, must be fully utilized before those losses with expiration dates.
134 | Annual Report
Franklin Value Investors Trust
Notes to Financial Statements (continued)
5. INCOME TAXES (continued)
At October 31, 2013, the capital loss carryforwards were as follows:
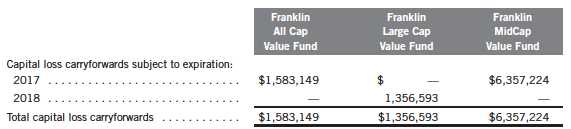
During the year ended October 31, 2013, the funds utilized capital loss carryforwards as follows:

The tax character of distributions paid during the years ended October 31, 2013 and 2012, was as follows:
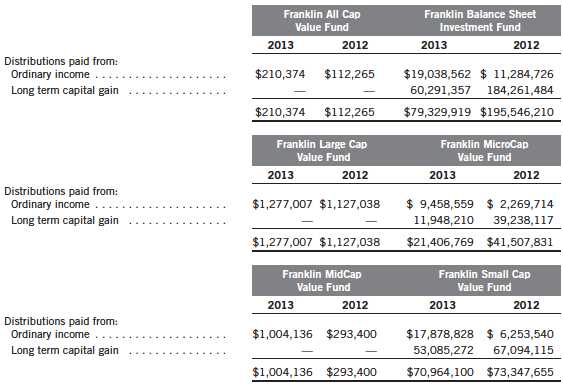
Annual Report | 135
Franklin Value Investors Trust
Notes to Financial Statements (continued)
5. INCOME TAXES (continued)
At October 31, 2013, the cost of investments, net unrealized appreciation (depreciation), undistributed ordinary income and undistributed long term capital gains for income tax purposes were as follows:
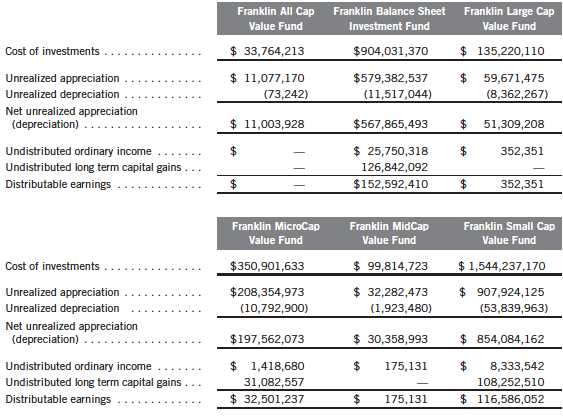
Differences between income and/or capital gains as determined on a book basis and a tax basis are primarily due to differing treatments of wash sales, pass- through entity income, passive foreign investment company shares and corporate actions.
6. INVESTMENT TRANSACTIONS
Purchases and sales of investments (excluding short term securities) for the year ended October 31, 2013, were as follows:
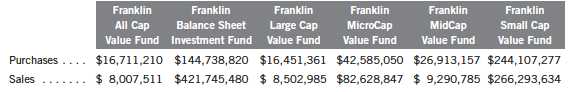
136 | Annual Report
Franklin Value Investors Trust
Notes to Financial Statements (continued)
7. INVESTMENTS IN INSTITUTIONAL FIDUCIARY TRUST MONEY MARKET PORTFOLIO
The Funds invest in the Institutional Fiduciary Trust Money Market Portfolio (Sweep Money Fund), an open-end investment company managed by Franklin Advisers, Inc. (an affiliate of the investment manager). Management fees paid by the Funds are reduced on assets invested in the Sweep Money Fund, in an amount not to exceed the management and administrative fees paid by the Sweep Money Fund.
8. RESTRICTED SECURITIES
The Funds invest in securities that are restricted under the Securities Act of 1933 (1933 Act) or which are subject to legal, contractual, or other agreed upon restrictions on resale. Restricted securities are often purchased in private placement transactions, and cannot be sold without prior registration unless the sale is pursuant to an exemption under the 1933 Act. Disposal of these securities may require greater effort and expense, and prompt sale at an acceptable price may be difficult. The Funds may have registration rights for restricted securities. The issuer generally incurs all registration costs.
At October, 31, 2013, the Franklin MicroCap Value Fund held investments in restricted securities, excluding certain securities exempt from registration under the 1933 Act deemed to be liquid, as follows:

9. HOLDINGS OF 5% VOTING SECURITIES OF PORTFOLIO COMPANIES
The 1940 Act defines “affiliated companies” to include investments in portfolio companies in which a fund owns 5% or more of the outstanding voting securities. Investments in “affiliated companies” for the Franklin Balance Sheet Investment Fund, the Franklin MicroCap Value Fund and the Franklin Small Cap Value Fund for the year ended October 31, 2013, were as shown below.

Annual Report | 137
Franklin Value Investors Trust
Notes to Financial Statements (continued)
| 9. | HOLDINGS OF 5% VOTING SECURITIES OF PORTFOLIO COMPANIES (continued) |

10. SPECIAL SERVICING AGREEMENT
The Franklin MicroCap Value Fund, which is an eligible underlying investment of one or more of the Franklin Templeton Fund Allocator Series Funds (Allocator Funds), participated in a Special Servicing Agreement (SSA) with the Allocator Funds and certain service providers of the fund and the Allocator Funds. Under the SSA, the fund may pay a portion of the Allocator Funds’ expenses (other than any asset allocation, administrative and distribution fees), to the extent such payments are less than the amount of the benefits realized or expected to be realized by the fund (e.g., due to reduced costs associated with servicing accounts) from the investment in the fund by the Allocator Funds. The Allocator Funds are either managed by Franklin Advisers, Inc. or administered by FT Services, affiliates of Advisory Services. For the year ended October 31, 2013, the fund was held by one or more of the Allocator Funds and the amount of expenses borne by the fund is noted in the Statements of Operations. At October 31, 2013, 10.32% of the fund’s outstanding shares were held by one or more of the Allocator Funds. Effective May 1, 2013, the SSA was discontinued until further notice.
138 | Annual Report
Franklin Value Investors Trust
Notes to Financial Statements (continued)
11. CREDIT FACILITY
The Funds, together with other U.S. registered and foreign investment funds (collectively, Borrowers), managed by Franklin Templeton Investments, are borrowers in a joint syndicated senior unsecured credit facility totaling $1.5 billion (Global Credit Facility) which matures on January 17, 2014. This Global Credit Facility provides a source of funds to the Borrowers for temporary and emergency purposes, including the ability to meet future unanticipated or unusually large redemption requests.
Under the terms of the Global Credit Facility, the Funds shall, in addition to interest charged on any borrowings made by the Funds and other costs incurred by the Funds, pay their share of fees and expenses incurred in connection with the implementation and maintenance of the Global Credit Facility, based upon their relative share of the aggregate net assets of all of the Borrowers, including an annual commitment fee of 0.07% based upon the unused portion of the Global Credit Facility. These fees are reflected in other expenses on the Statements of Operations. During the year ended October 31, 2013, the Funds did not use the Global Credit Facility.
12. REDEMPTION IN-KIND
During the year ended October 31, 2012, the Franklin Balance Sheet Investment Fund realized $159,737,506 of net gains resulting from a redemption in-kind in which a shareholder redeemed fund shares for securities held by the Fund rather than for cash. Because such gains are not taxable to the Fund and are not netted with capital gains that are distributed to remaining shareholders, they have been reclassified from accumulated net realized gains to paid-in capital.
13. FAIR VALUE MEASUREMENTS
The Funds follow a fair value hierarchy that distinguishes between market data obtained from independent sources (observable inputs) and the Funds’ own market assumptions (unobservable inputs). These inputs are used in determining the value of the Funds’ financial instruments and are summarized in the following fair value hierarchy:
- Level 1 – quoted prices in active markets for identical financial instruments
- Level 2 – other significant observable inputs (including quoted prices for similar financial instruments, interest rates, prepayment speed, credit risk, etc.)
- Level 3 – significant unobservable inputs (including the Funds’ own assumptions in deter- mining the fair value of financial instruments)
The input levels are not necessarily an indication of the risk or liquidity associated with financial instruments at that level.
Annual Report | 139
Franklin Value Investors Trust
Notes to Financial Statements (continued)
13. FAIR VALUE MEASUREMENTS (continued)
For movements between the levels within the fair value hierarchy, the Funds have adopted a policy of recognizing the transfers as of the date of the underlying event which caused the movement.
A summary of inputs used as of October 31, 2013, in valuing the Funds’ assets carried at fair value, is as follows:
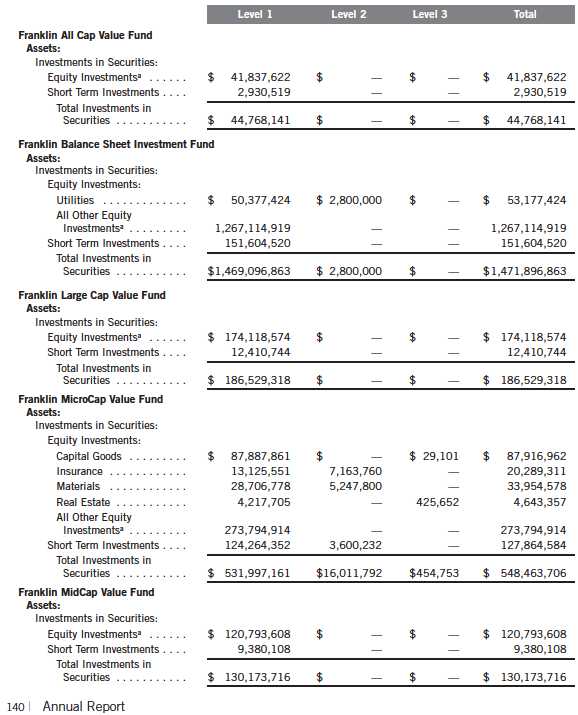
Franklin Value Investors Trust
Notes to Financial Statements (continued)
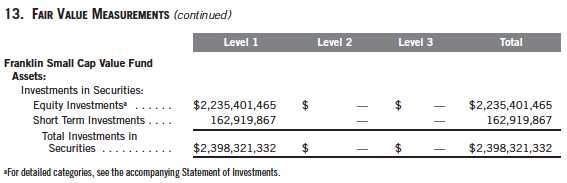
A reconciliation of assets in which Level 3 inputs are used in determining fair value is presented when there are significant Level 3 investments at the end of the period.
14. NEW ACCOUNTING PRONOUNCEMENTS
In December 2011, the Financial Accounting Standards Board (FASB) issued Accounting Standards Update (ASU) No. 2011-11, Balance Sheet (Topic 210): Disclosures about Offsetting Assets and Liabilities. The amendments in the ASU enhance disclosures about offsetting of financial assets and liabilities to enable investors to understand the effect of these arrangements on a fund’s financial position. In January 2013, FASB issued ASU No. 2013-01, Balance Sheet (Topic 210): Clarifying the Scope of Disclosures about Offsetting Assets and Liabilities. The amendments in ASU No. 2013-01 clarify the intended scope of disclosures required by ASU No. 2011-11. These ASUs are effective for interim and annual reporting periods beginning on or after January 1, 2013. The Funds believe the adoption of these ASUs will not have a material impact on their financial statements.
In June 2013, FASB issued ASU No. 2013-08, Investment Companies (Topic 946): Amendments to the Scope, Measurement, and Disclosure Requirements. The ASU modifies the criteria used in defining an investment company under U.S. Generally Accepted Accounting Principles and also sets forth certain measurement and disclosure requirements. Under the ASU, an entity that is registered under the 1940 Act automatically qualifies as an investment company. The ASU is effective for interim and annual reporting periods beginning after December 15, 2013. The Funds are currently reviewing the requirements and believe the adoption of this ASU will not have a material impact on their financial statements.
Annual Report | 141
Franklin Value Investors Trust
Notes to Financial Statements (continued)
15. SUBSEQUENT EVENTS
The Funds have evaluated subsequent events through the issuance of the financial statements and determined that no events have occurred that require disclosure.
ABBREVIATIONS
Selected Portfolio
ADR - American Depositary Receipt
ETF - Exchange Traded Fund
142 | Annual Report
Franklin Value Investors Trust
Report of Independent Registered Public Accounting Firm
To the Board of Trustees and Shareholders of Franklin Value Investors Trust
In our opinion, the accompanying statements of assets and liabilities, including the statements of investments, and the related statements of operations and of changes in net assets and the financial highlights present fairly, in all material respects, the financial position of Franklin All Cap Value Fund, Franklin Balance Sheet Investment Fund, Franklin Large Cap Value Fund, Franklin MicroCap Value Fund, Franklin MidCap Value Fund and Franklin Small Cap Value Fund (separate portfolios of Franklin Value Investors Trust, hereafter referred to as the “Funds”) at October 31, 2013, the results of each of their operations for the year then ended, the changes in each of their net assets for each of the two years in the period then ended and the financial highlights for each of the periods presented, in conformity with accounting principles generally accepted in the United States of America. These financial statements and financial highlights (hereafter referred to as “financial statements”) are the responsibility of the Funds’ management. Our responsibility is to express an opinion on these financial statements based on our audits. We conducted our audits of these financial statements in accordance with the standards of the Public Company Accounting Oversight Board (United States). Those standards require that we plan and perform the audit to obtain reasonable assurance about whether the financial statements are free of material misstatement. An audit includes examining, on a test basis, evidence supporting the amounts and disclosures in the financial statements, assessing the accounting principles used and significant estimates made by management, and evaluating the overall financial statement presentation. We believe that our audits, which included confirmation of securities at October 31, 2013 by correspondence with the custodian, transfer agent and brokers, provide a reasonable basis for our opinion.
PricewaterhouseCoopers LLP
San Francisco, California
December 17, 2013
Annual Report | 143
Franklin Value Investors Trust
Tax Information (unaudited)
Under Section 852(b)(3)(C) of the Internal Revenue Code (Code), the Funds hereby report the maximum amount allowable but no less than the following amounts as long term capital gain dividends for the fiscal year ended October 31, 2013:

Under Section 871(k)(2)(C) of the Code, the Funds hereby report the maximum amount allowable but no less than the following amounts as short term capital gain dividends for purposes of the tax imposed under Section 871(a)(1)(A) of the Code for the fiscal year ended October 31, 2013:

Under Section 854(b)(1)(A) of the Code, the Funds hereby report the following percentage amounts of the ordinary income dividends as income qualifying for the dividends received deduction for the fiscal year ended October 31, 2013:

Under Section 854(b)(1)(B) of the Code, the Funds hereby report the maximum amount allowable but no less than the following amounts as qualified dividends for purposes of the maximum rate under Section 1(h)(11) of the Code for the fiscal year ended October 31, 2013:
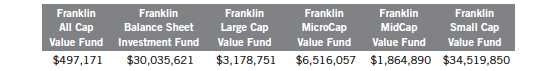
Distributions, including qualified dividend income, paid during calendar year 2013 will be reported to shareholders on Form 1099-DIV by mid-February 2014. Shareholders are advised to check with their tax advisors for information on the treatment of these amounts on their individual income tax returns.
144 | Annual Report
Franklin Value Investors Trust
Board Members and Officers
The name, year of birth and address of the officers and board members, as well as their affiliations, positions held with the Trust, principal occupations during at least the past five years and number of portfolios overseen in the Franklin Templeton Investments fund complex are shown below. Generally, each board member serves until that person’s successor is elected and qualified.

Annual Report | 145
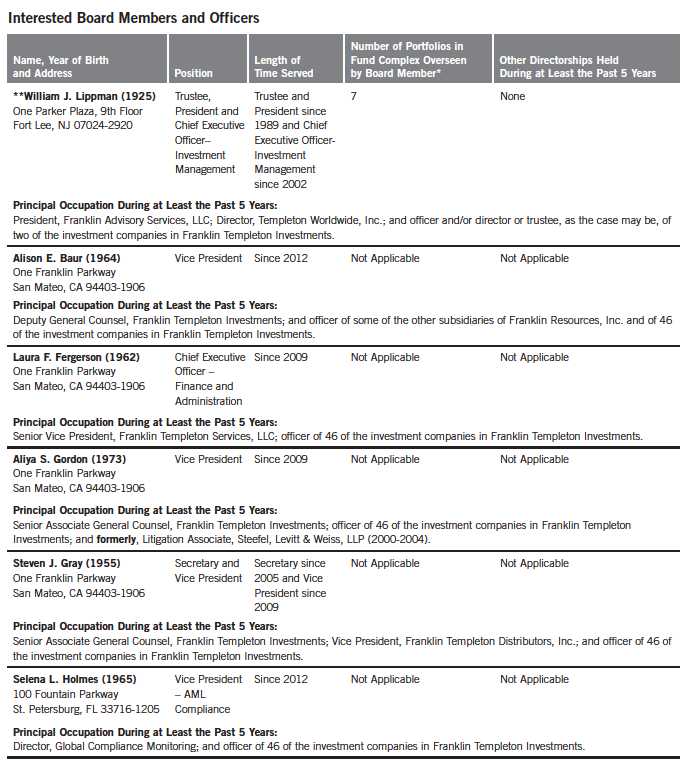
146 | Annual Report

Annual Report | 147

148 | Annual Report
Franklin Value Investors Trust
Shareholder Information
Proxy Voting Policies and Procedures
The Trust’s investment manager has established Proxy Voting Policies and Procedures (Policies) that the Trust uses to determine how to vote proxies relating to portfolio securities. Shareholders may view the Trust’s complete Policies online at franklintempleton.com. Alternatively, shareholders may request copies of the Policies free of charge by calling the Proxy Group collect at (954) 527-7678 or by sending a written request to: Franklin Templeton Companies, LLC, 300 S.E. 2nd Street, Fort Lauderdale, FL 33301, Attention: Proxy Group. Copies of the Trust’s proxy voting records are also made available online at franklintempleton.com and posted on the U.S. Securities and Exchange Commission’s website at sec.gov and reflect the most recent 12-month period ended June 30.
Quarterly Statement of Investments
The Trust files a complete statement of investments with the U.S. Securities and Exchange Commission for the first and third quarters for each fiscal year on Form N-Q. Shareholders may view the filed Form N-Q by visiting the Commission’s website at sec.gov. The filed form may also be viewed and copied at the Commission’s Public Reference Room in Washington, DC. Information regarding the operations of the Public Reference Room may be obtained by calling (800) SEC-0330.
Householding of Reports and Prospectuses
You will receive each Fund’s financial reports every six months as well as an annual updated summary prospectus (prospectus available upon request). To reduce Fund expenses, we try to identify related shareholders in a household and send only one copy of the financial reports and summary prospectus. This process, called “householding,” will continue indefinitely unless you instruct us otherwise. If you prefer not to have these documents householded, please call us at (800) 632-2301. At any time you may view current prospectuses/summary prospectuses and financial reports on our website. If you choose, you may receive these documents through electronic delivery.
Annual Report | 149
This page intentionally left blank.
This page intentionally left blank.
This page intentionally left blank.