UNITED STATES
SECURITIES AND EXCHANGE COMMISSION
Washington, DC 20549
FORM N-CSR
CERTIFIED SHAREHOLDER REPORT OF REGISTERED MANAGEMENT INVESTMENT COMPANIES
Investment Company Act file number_811-05878
__Franklin Value Investors Trust
(Exact name of registrant as specified in charter)
One Franklin Parkway, San Mateo, CA 94403-1906
(Address of principal executive offices) (Zip code)
Craig S. Tyle, One Franklin Parkway, San Mateo, CA 94403-1906
(Name and address of agent for service)
Registrant's telephone number, including area code: _650 312-2000
Date of fiscal year end: 10/31
Date of reporting period: _10/31/16
Item 1. Reports to Stockholders.
| |
| Contents | |
| |
| Annual Report | |
| Economic and Market Overview | 3 |
| Franklin Balance Sheet Investment Fund | 4 |
| Franklin MicroCap Value Fund | 11 |
| Franklin MidCap Value Fund | 18 |
| Franklin Small Cap Value Fund | 25 |
| Financial Highlights and Statements of Investments | 32 |
| Financial Statements | 65 |
| Notes to Financial Statements | 73 |
| Report of Independent Registered | |
| Public Accounting Firm . | 89 |
| Tax Information . | 90 |
| Board Members and Officers | 91 |
| Shareholder Information | 96 |
Visit franklintempleton.com for fund updates, to access your account, or to find helpful financial planning tools.
2 Not part of the annual report
franklintempleton.com
Annual Report
Economic and Market Overview
The U.S. economy expanded during the 12 months under review. The economy grew at a faster pace in 2016’s third quarter than in 2016’s second and first quarters and 2015’s fourth quarter, mainly due to personal consumption expenditures, exports, private inventory investment, federal government spending and nonresidential fixed investment. Manufacturing conditions generally contracted during the first half of the period but generally expanded in the second half. The services sector, although volatile, continued to grow throughout the period. The unemployment rate decreased slightly from 5.0% in October 2015 to 4.9% at period-end.1 Monthly retail sales grew for most of the review period, and rose to the highest level in April in more than a year, due to a broad-based increase across most retail categories. Inflation, as measured by the Consumer Price Index (CPI), rose slightly in October, led by an increase in gasoline and shelter prices.
After maintaining a near-zero interest rate for seven years to support the U.S. economy’s recovery, the U.S. Federal Reserve (Fed) raised its target range for the federal funds rate to 0.25%–0.50% at its December 2015 meeting and maintained the rate through period-end. The Fed noted at its September meeting that although the case for raising interest rates has strengthened, it will wait for further evidence of continued progress toward its objectives.
The 10-year Treasury yield, which moves inversely to price, shifted throughout the period. It rose from 2.16% on October 30, 2015, to a period high of 2.36% in November 2015. However, negative interest rates in Japan and Europe, and central banks’ purchases of government bonds pushed down the Treasury yield. The U.K.’s historic referendum to leave the European Union in June 2016 (also known as “Brexit”) also boosted safe haven buying by investors. The Treasury yield reached a period low of 1.37% in early July, and ended the period at 1.84%. The yields rose toward period-end due to positive economic data and signals from the Fed on the possibility of an increase in interest rates in the near term.
The foregoing information reflects our analysis and opinions as of October 31, 2016. The information is not a complete analysis of every aspect of any market, country, industry, security or fund. Statements of fact are from sources considered reliable.
1. Source: Bureau of Labor Statistics.
franklintempleton.com
Annual Report
3
Franklin Balance Sheet Investment Fund
This annual report for Franklin Balance Sheet Investment Fund covers the fiscal year ended October 31, 2016.
Your Fund’s Goal and Main Investments
The Fund seeks high total return, of which capital appreciation and income are components, by investing most of its assets in equity securities of companies of any size that we believe are undervalued in the marketplace at the time of purchase but have the potential for capital appreciation.
Performance Overview
The Fund’s Class A shares delivered a +4.44% cumulative total return for the 12 months under review. In comparison, the Russell 3000® Value Index, which measures performance of those Russell 3000® Index companies with lower price-to-book ratios and lower forecasted growth values, generated a +6.55% total return for the same period.1 You can find more of the Fund’s performance data in the Performance Summary beginning on page 7.
Performance data represent past performance, which does not guarantee future results. Investment return and principal value will fluctuate, and you may have a gain or loss when you sell your shares. Current performance may differ from figures shown. For most recent month-end performance, go to franklintempleton.com or call (800) 342-5236.
Investment Strategy
Our strategy uses low price-to-book value as its primary reference valuation measure. Book value per share is a company’s net worth or shareholders’ equity on an accounting or “book” basis, divided by shares outstanding. The equity securities bought by the Fund will typically be purchased at a low price relative to book value. This strategy is not aimed at short-term trading gains, and we do not adhere to the composition of the benchmark. Rather, we try to identify individual companies that meet our investment criteria, with a 3-5 year investment horizon.
1. Source: Morningstar.
The index is unmanaged and includes reinvestment of any income or distributions. It does not reflect any fees, expenses or sales charges. One cannot invest directly in an
index, and an index is not representative of the Fund’s portfolio.
See www.franklintempletondatasources.com for additional data provider information.
The dollar value, number of shares or principal amount, and names of all portfolio holdings are listed in the Fund’s Statement of Investments (SOI).
The SOI begins on page 37.
4 Annual Report
franklintempleton.com
FRANKLIN BALANCE SHEET INVESTMENT FUND
Manager’s Discussion
During the 12 months under review, holdings that positively contributed to Fund performance included Fabrinet, Corning and MKS Instruments.
Fabrinet is a leading electronic manufacturer of optical components with facilities in Silicon Valley and Thailand. Having traded at what we considered low valuations with a strong net cash balance sheet, the stock enjoyed significant appreciation as optical equipment demand increased significantly throughout the year driven by data center growth, the upgrades of multiple U.S. mobile networks and increased demand in China.
Corning was the largest Fund position at period-end. The company offered what we considered attractive growth opportunities through its science, technology and innovation in the specialty glass market, where it began to break into new end markets such as data centers, automotive and life sciences. In our view, the company also exhibited excellent value characteristics, such as strong free cash flow, low capital requirements, an increasing dividend and large share repurchases. Second quarter financial results showed an improving pricing dynamic relative to the pricing in the flat panel display business, highlighting the strength of Corning’s business model.
MKS Instruments provides critical components to the semiconductor capital equipment industry. The stock appreciated as demand associated with smaller, faster semiconductor production improved throughout the period. Additionally, the firm acquired Newport, a laser manufacturer. Investors have gradually become more comfortable that this acquisition can materially increase the combined entity’s earnings power.
Detractors from Fund performance included First Solar, Ruby Tuesday and Rowan Companies.
First Solar is a leading manufacturer of solar panels and global developer of utility scale solar facilities. Despite having a strong balance sheet and steadily improving panel efficiencies, the declining prices offered by competing panel manufacturers continued to threaten First Solar’s profit levels.
Ruby Tuesday operates a chain of casual dining restaurants. The new management team’s efforts to rejuvenate the company’s concept could not overcome negative trends in the family dining segment. We reduced and finally exited our position.
We viewed Rowan, an offshore oil and gas driller, as one the strongest players in a stressed market. We believed that Rowan’s drilling rig assets could have long-term appeal once demand recovers and that the company has the balance sheet to withstand this severe downturn. Although Rowan’s stock fared better than its peers during the period, investors have little interest in these stocks until there is more visibility around a bottoming in demand for drilling rigs.
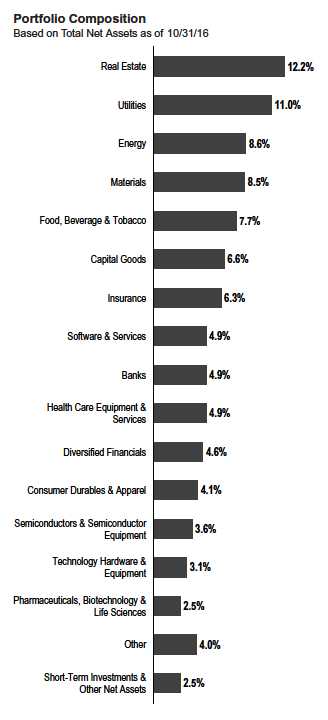
Top 10 Holdings
10/31/16
| | |
| Company | % of Total | |
| Sector/Industry | Net Assets | |
| Corning Inc. | 4.0 | % |
| Technology Hardware & Equipment | | |
| JPMorgan Chase & Co. | 2.5 | % |
| Banks | | |
| Citizens Financial Group Inc. | 2.5 | % |
| Banks | | |
| MKS Instruments Inc. | 2.2 | % |
| Semiconductors & Semiconductor Equipment | | |
| Bio-Rad Laboratories Inc. | 2.2 | % |
| Pharmaceuticals, Biotechnology & Life Sciences | | |
| Archer-Daniels-Midland Co. | 1.9 | % |
| Food, Beverage & Tobacco | | |
| Comerica Inc. | 1.8 | % |
| Banks | | |
| Morgan Stanley | 1.7 | % |
| Diversified Financials | | |
| Royal Dutch Shell PLC | 1.7 | % |
| Energy | | |
| Bunge Ltd. | 1.7 | % |
| Food, Beverage & Tobacco | | |
During the reporting period, several large new purchases included JPMorgan Chase, an investment banking services provider; Royal Dutch Shell, an oil and gas exploration company; Toll Brothers, a real estate company; Morgan Stanley, a financial services provider; and Wesco International, an industrial supply company; among several others. We also added to existing positions including Time, a mass media company; Regal Beloit, an electric and mechanical products manufacturer; and Chevron, a large integrated energy company.
In contrast, the Fund’s largest liquidations included E-L Financial, Fresh Del Monte Produce, Keycorp, Ingram Micro and Assurant. We also reduced several holdings including the aforementioned Fabrinet, First Solar and Encore Wire.
franklintempleton.com
Annual Report
5
FRANKLIN BALANCE SHEET INVESTMENT FUND
Thank you for your continued participation in Franklin Balance Sheet Investment Fund. We look forward to continuing to serve your investment needs.

The foregoing information reflects our analysis, opinions and portfolio holdings as of October 31, 2016, the end of the reporting period. The way we implement our main investment strategies and the resulting portfolio holdings may change depending on factors such as market and economic conditions. These opinions may not be relied upon as investment advice or an offer for a particular security. The information is not a complete analysis of every aspect of any market, country, industry, security or the Fund. Statements of fact are from sources considered reliable, but the investment manager makes no representation or warranty as to their completeness or accuracy. Although historical performance is no guarantee of future results, these insights may help you understand our investment management philosophy.
6 Annual Report
franklintempleton.com
FRANKLIN BALANCE SHEET INVESTMENT FUND
Performance Summary as of October 31, 2016
The performance table and graphs do not reflect any taxes that a shareholder would pay on Fund dividends, capital gain distributions, if any, or any realized gains on the sale of Fund shares. Total return reflects reinvestment of the Fund’s dividends and capital gain distributions, if any, and any unrealized gains or losses.
Performance as of 10/31/161
Cumulative total return excludes sales charges. Average annual total returns include maximum sales charges. Sales charges will vary depending on the size of the investment and the class of share purchased. The maximum is 5.75% and the minimum is 0%. Class A: 5.75% maximum initial sales charge; Advisor Class: no sales charges. For other share classes, visit franklintempleton.com.
| | | | | | |
| | Cumulative | | Average Annual | | Average Annual | |
| Share Class | Total Return2 | | Total Return3 | | Total Return (9/30/16)4 | |
| A | | | | | | |
| 1-Year | +4.44 | % | -1.55 | % | +6.95 | % |
| 5-Year | +53.43 | % | +7.66 | % | +10.69 | % |
| 10-Year | +37.13 | % | +2.60 | % | +3.11 | % |
| Advisor | | | | | | |
| 1-Year | +4.69 | % | +4.69 | % | +13.78 | % |
| 5-Year | +55.30 | % | +9.20 | % | +12.29 | % |
| 10-Year | +42.54 | % | +3.61 | % | +4.13 | % |
Performance data represent past performance, which does not guarantee future results. Investment return and principal value will fluctuate, and you may have a gain or loss when you sell your shares. Current performance may differ from figures shown. For most recent month-end performance, go to franklintempleton.com or call (800) 342-5236.
See page 9 for Performance Summary footnotes.
franklintempleton.com
Annual Report
7
FRANKLIN BALANCE SHEET INVESTMENT FUND
PERFORMANCE SUMMARY
Total Return Index Comparison for a Hypothetical $10,000 Investment1
Total return represents the change in value of an investment over the periods shown. It includes any applicable maximum sales charge, Fund expenses, account fees and reinvested distributions. The unmanaged indexes include reinvestment of any income or distributions. They differ from the Fund in composition and do not pay management fees or expenses. One cannot invest directly in an index.

See page 9 for Performance Summary footnotes.
8 Annual Report
franklintempleton.com
FRANKLIN BALANCE SHEET INVESTMENT FUND
PERFORMANCE SUMMARY
| | | | |
| Total Annual Operating Expenses7 | | | |
| Share Class | With Waiver | | Without Waiver | |
| A | 0.95 | % | 0.96 | % |
| Advisor | 0.70 | % | 0.71 | % |
Each class of shares is available to certain eligible investors and has different annual fees and expenses, as described in the prospectus.
All investments involve risks, including possible loss of principal. Value securities may not increase in price as anticipated or may decline further in value. While
smaller and midsize companies may offer substantial opportunities for capital growth, they also involve heightened risks and should be considered speculative.
Historically, smaller and midsize company securities have been more volatile in price than larger company securities, especially over the short term. The Fund
may invest up to 25% of its total assets in foreign securities, which may involve special risks, including currency fluctuations and economic and political
uncertainty. The Fund is actively managed but there is no guarantee that the manager’s investment decisions will produce the desired results. The Fund’s
prospectus also includes a description of the main investment risks.
1. The Fund has a fee waiver associated with any investment it makes in a Franklin Templeton money fund and/or other Franklin Templeton fund, contractually guaranteed
through its current fiscal year-end. Fund investment results reflect the fee waiver; without this waiver, the results would have been lower.
2. Cumulative total return represents the change in value of an investment over the periods indicated.
3. Average annual total return represents the average annual change in value of an investment over the periods indicated. Return for less than one year, ifany,hasnotbeen
annualized.
4. In accordance with SEC rules, we provide standardized average annual total return information through the latest calendar quarter.
5. Source: Morningstar. The Russell 3000 Value Index is market capitalization weighted and measures performance of those Russell 3000 Index companies with lower
price-to-book ratios and lower forecasted growth values.
6. Source: Bureau of Labor Statistics, bls.gov/cpi. The Consumer Price Index is a commonly used measure of the inflation rate.
7. Figures are as stated in the Fund’s current prospectus and may differ from the expense ratios disclosed in the Your Fund’s Expenses and Financial Highlights sections in this
report. In periods of market volatility, assets may decline significantly, causing total annual Fund operating expenses to become higher than the figures shown.
See www.franklintempletondatasources.com for additional data provider information.
franklintempleton.com
Annual Report
9
FRANKLIN BALANCE SHEET INVESTMENT FUND
Your Fund’s Expenses
As a Fund shareholder, you can incur two types of costs: (1) transaction costs, including sales charges (loads) on Fund purchases and redemptions; and (2) ongoing Fund costs, including management fees, distribution and service (12b-1) fees, and other Fund expenses. All mutual funds have ongoing costs, sometimes referred to as operating expenses. The table below shows ongoing costs of investing in the Fund and can help you understand these costs and compare them with those of other mutual funds. The table assumes a $1,000 investment held for the six months indicated.
Actual Fund Expenses
The table below provides information about actual account values and actual expenses in the columns under the heading “Actual.” In these columns the Fund’s actual return, which includes the effect of Fund expenses, is used to calculate the “Ending Account Value” for each class of shares. You can estimate the expenses you paid during the period by following these steps (of course, your account value and expenses will differ from those in this illustration): Divide your account value by $1,000 (if your account had an $8,600 value, then $8,600 ÷ $1,000 = 8.6). Then multiply the result by the number in the row for your class of shares under the headings “Actual” and “Expenses Paid During Period” (if Actual Expenses Paid During Period were $7.50, then 8.6 x $7.50 = $64.50). In this illustration, the actual expenses paid this period are $64.50.
Hypothetical Example for Comparison with Other Funds
Under the heading “Hypothetical” in the table, information is provided about hypothetical account values and hypothetical expenses based on the Fund’s actual expense ratio and an assumed rate of return of 5% per year before expenses, which is not the Fund’s actual return. This information may not be used to estimate the actual ending account balance or expenses you paid for the period, but it can help you compare ongoing costs of investing in the Fund with those of other funds. To do so, compare this 5% hypothetical example for the class of shares you hold with the 5% hypothetical examples that appear in the shareholder reports of other funds.
Please note that expenses shown in the table are meant to highlight ongoing costs and do not reflect any transactional costs. Therefore, information under the heading “Hypothetical” is useful in comparing ongoing costs only, and will not help you compare total costs of owning different funds. In addition, if transactional costs were included, your total costs would have been higher.
| | | | | | | | | | | | |
| | | | | | | Actual | | Hypothetical | | |
| | | | | (actual return after expenses) | | (5% annual return before expenses) | | |
| | | | | | | Expenses | | | | Expenses | Net | |
| | | Beginning | | Ending | | Paid During | | Ending | | Paid During | Annualized | |
| Share | | Account | | Account | | Period | | Account | | Period | Expense | |
| Class | | Value 5/1/16 | | Value 10/31/16 | | 5/1/16–10/31/161,2 | | Value 10/31/16 | | 5/1/16–10/31/161,2 | Ratio2 | |
| A | $ | 1,000 | $ | 1,033.00 | $ | 4.45 | $ | 1,020.76 | $ | 4.42 | 0.87 | % |
| C | $ | 1,000 | $ | 1,029.00 | $ | 8.26 | $ | 1,016.99 | $ | 8.21 | 1.62 | % |
| R | $ | 1,000 | $ | 1,031.70 | $ | 5.72 | $ | 1,019.51 | $ | 5.69 | 1.12 | % |
| R6 | $ | 1,000 | $ | 1,034.70 | $ | 2.45 | $ | 1,022.72 | $ | 2.44 | 0.48 | % |
| Advisor | $ | 1,000 | $ | 1,034.30 | $ | 3.17 | $ | 1,022.02 | $ | 3.15 | 0.62 | % |
1. Expenses are equal to the annualized expense ratio for the six-month period as indicated above–in the far right column–multiplied by the simple average account value
over the period indicated, and then multiplied by 184/366 to reflect the one-half year period.
2. Reflects expenses after fee waivers and expense reimbursements. Does not include acquired fund fees and expenses.
10 Annual Report
franklintempleton.com
Franklin MicroCap Value Fund
This annual report for Franklin MicroCap Value Fund covers the fiscal year ended October 31, 2016. The Fund closed to new investors (with the exception of certain retirement accounts) in January 2004 and has remained closed except for two days in mid-February 2013, when the Fund was opened on a limited basis. Existing shareholders may add to or reduce their investments in the Fund; however, once an account is reduced to zero, it may not be reopened unless the Fund reopens.
Your Fund’s Goal and Main Investments
The Fund seeks high total return, of which capital appreciation and income are components, by investing at least 80% of its net assets in securities of companies with market capitalizations under $500 million at the time of purchase that we believe are undervalued in the marketplace.1
Performance Overview
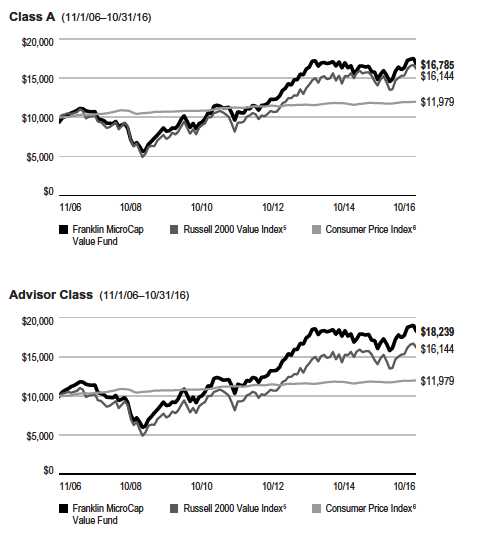
The Fund’s Class A shares delivered a +8.25% cumulative total return for the 12 months under review. In comparison, the Russell 2000® Value Index, which measures performance of those Russell 2000® Index companies with lower price-to-book ratios and lower forecasted growth values, had a +8.81% total return for the same period.2 You can find more of the Fund’s performance data in the Performance Summary beginning on page 14.
Performance data represent past performance, which does not guarantee future results. Investment return and principal value will fluctuate, and you may have a gain or loss when you sell your shares. Current performance may differ from figures shown. For most recent month-end performance, go to franklintempleton.com or call (800) 342-5236.
Investment Strategy
Our strategy is to buy shares of financially sound, well-established companies at a low price-to-book value, where we have reasonable confidence that book value will increase over several years. We limit purchases to companies with market capitalizations of less than $500 million, which we define as “microcap.”1 Book value per share is a company’s net worth or shareholders’ equity on an accounting or “book” basis, divided by shares outstanding. This strategy is not aimed
at short-term trading gains, nor do we consider the composition of any index. Rather, we try to identify individual companies that meet our investment criteria, and we assume at purchase that we will hold the positions for several years.
1. Effective 12/10/12, the maximum market capitalization for each investment that the Fund can invest in increased from $400 million at time of purchase to $500 million.
2. Source: Morningstar.
The index is unmanaged and includes reinvestment of any income or distributions. It does not reflect any fees, expenses or sales charges. One cannot invest directly in an
index, and an index is not representative of the Fund’s portfolio.
See www.franklintempletondatasources.com for additional data provider information.
The dollar value, number of shares or principal amount, and names of all portfolio holdings are listed in the Fund’s Statement of Investments (SOI).
The SOI begins on page 43.
franklintempleton.com
Annual Report
11
FRANKLIN MICROCAP VALUE FUND
| | |
| Top 10 Holdings | | |
| 10/31/16 | | |
| Company | % of Total | |
| Sector/Industry | Net Assets | |
| Seneca Foods Corp. | 4.1 | % |
| Food, Beverage & Tobacco | | |
| Healthcare Services Group Inc. | 2.9 | % |
| Commercial & Professional Services | | |
| Hurco Cos. Inc. | 2.6 | % |
| Machinery | | |
| Bar Harbor Bankshares | 2.5 | % |
| Banks | | |
| Delta Apparel Inc. | 2.4 | % |
| Consumer Durables & Apparel | | |
| Miller Industries Inc. | 2.4 | % |
| Machinery | | |
| Hardinge Inc. | 2.4 | % |
| Machinery | | |
| Gibraltar Industries Inc. | 2.3 | % |
| Building Products | | |
| Sterling Construction Co. | 2.3 | % |
| Construction & Engineering | | |
| Alamo Group Inc. | 2.2 | % |
| Machinery | | |
Manager’s Discussion
During the 12 months under review, holdings that positively contributed to Fund performance included Olympic Steel, Spartan Motors and Sterling Construction.
Olympic Steel processes and distributes flat-rolled and tubular steel. Its sales and margins are highly sensitive to steel prices and sales volumes. Higher steel prices in the first half of 2016 and anticipated increases in infrastructure spending led to a rebound in the stock price.
Spartan Motors makes specialty delivery and emergency response vehicles and chassis. Spartan is in the second year of a lean manufacturing transformation, the first visible results of which emerged in 2016. In September, the U.S. Postal Service named Spartan a finalist in its Next Generation Delivery Vehicle Program to replace the Service’s aging delivery fleet.
Sterling Construction is a heavy civil construction contractor in turnaround mode after suffering persistent losses from poorly bid highway work in Texas. New management shored up the company’s balance sheet and improved execution, and Congress passed a multi-year highway bill that could benefit Sterling in coming years.
Detractors from Fund performance included Ardmore Shipping, Ruby Tuesday and PHI.
Ardmore Shipping operates a fleet of product tankers that transport chemicals around the globe. Overcapacity from tonnage ordered in prior years depressed rates and vessel prices throughout the sector, and that trend continued during the period. New orders for tonnage dropped in response. It takes roughly three years to fulfill new orders. Global demand continues to grow, and we believe supply and demand could come into balance again.
Ruby Tuesday operates a chain of casual dining restaurants. Efforts on the part of new management to rejuvenate the concept could not overcome negative trends in the family dining segment. We reduced and finally exited our position.
PHI provides helicopter transportation to the offshore energy industry in the Gulf of Mexico, as well as air medical services on land. PHI’s customers scaled back capital plans in response to lower energy prices, resulting in fewer flight hours for PHI. The company’s air medical division also felt the effects of depressed energy markets, as revenue from a service customer in the Middle East declined.
During the reporting period, we initiated several positions including Aegean Marine Petroleum Network, an international marine fuel logistics company; Richardson Electronics, a provider of engineered solutions, power grid and microwave tubes and related consumables; Armstrong Flooring, a flooring products provider; Invacare, a manufacturer of wheelchairs, bariatric equipment, disability scooters, respiratory products and other homecare products; and Rocky Brands, a producer of outdoor and work apparel and accessories. We also added to some positions including Global Power Equipment Group, a provider of equipment and maintenance support services for the power-generation industry; Northwest Pipe, a manufacturer of steel pipe; and Ardmore Shipping.
We exited positions in Lydall, Insteel Industries, Americas Car Mart, MidSouth Bancorp, and Ruby Tuesday, among others. The Fund reduced its holdings in Omega Protein, Gibraltar Industries and Spartan Motors, among others.
12 Annual Report
franklintempleton.com
FRANKLIN MICROCAP VALUE FUND
Thank you for your continued participation in Franklin MicroCap Value Fund. We look forward to continuing to serve your investment needs.

The foregoing information reflects our analysis, opinions and portfolio holdings as of October 31, 2016, the end of the reporting period. The way we implement our main investment strategies and the resulting portfolio holdings may change depending on factors such as market and economic conditions. These opinions may not be relied upon as investment advice or an offer for a particular security. The information is not a complete analysis of every aspect of any market, country, industry, security or the Fund. Statements of fact are from sources considered reliable, but the investment manager makes no representation or warranty as to their completeness or accuracy. Although historical performance is no guarantee of future results, these insights may help you understand our investment management philosophy.
franklintempleton.com
Annual Report
13
FRANKLIN MICROCAP VALUE FUND
Performance Summary as of October 31, 2016
The performance table and graphs do not reflect any taxes that a shareholder would pay on Fund dividends, capital gain distributions, if any, or any realized gains on the sale of Fund shares. Total return reflects reinvestment of the Fund’s dividends and capital gain distributions, if any, and any unrealized gains or losses.
Performance as of 10/31/161
Cumulative total return excludes sales charges. Average annual total returns include maximum sales charges. Sales charges will vary depending on the size of the investment and the class of share purchased. The maximum is 5.75% and the minimum is 0%. Class A: 5.75% maximum initial sales charge; Advisor Class: no sales charges. For other share classes, visit franklintempleton.com.
| | | | | | |
| | Cumulative | | Average Annual | | Average Annual | |
| Share Class | Total Return2 | | Total Return3 | | Total Return (9/30/16)4 | |
| A | | | | | | |
| 1-Year | +8.25 | % | +2.02 | % | +11.66 | % |
| 5-Year | +56.84 | % | +8.13 | % | +11.44 | % |
| 10-Year | +78.08 | % | +5.32 | % | +6.02 | % |
| Advisor | | | | | | |
| 1-Year | +8.53 | % | +8.53 | % | +18.71 | % |
| 5-Year | +58.72 | % | +9.68 | % | +13.04 | % |
| 10-Year | +82.39 | % | +6.19 | % | +6.90 | % |
Performance data represent past performance, which does not guarantee future results. Investment return and principal value will fluctuate, and you may have a gain or loss when you sell your shares. Current performance may differ from figures shown. For most recent month-end performance, go to franklintempleton.com or call (800) 342-5236.
See page 16 for Performance Summary footnotes.
14 Annual Report
franklintempleton.com
FRANKLIN MICROCAP VALUE FUND
PERFORMANCE SUMMARY
Total Return Index Comparison for a Hypothetical $10,000 Investment1
Total return represents the change in value of an investment over the periods shown. It includes any applicable maximum sales charge, Fund expenses, account fees and reinvested distributions. The unmanaged indexes include reinvestment of any income or distributions. They differ from the Fund in composition and do not pay management fees or expenses. One cannot invest directly in an index.
See page 16 for Performance Summary footnotes.
franklintempleton.com
Annual Report
15
FRANKLIN MICROCAP VALUE FUND
PERFORMANCE SUMMARY
| | | | |
| Total Annual Operating Expenses7 | | | |
| Share Class | With Waiver | | Without Waiver | |
| A | 1.20 | % | 1.21 | % |
| Advisor | 0.96 | % | 0.97 | % |
Each class of shares is available to certain eligible investors and has different annual fees and expenses, as described in the prospectus.
All investments involve risks, including possible loss of principal. The Fund’s ability to invest in smaller company securities that may have limited liquidity
involves additional risks, such as relatively small revenues, limited product lines and small market share. Historically, these stocks have exhibited greater price
volatility than larger company stocks, especially over the short term. In addition, the Fund may invest up to 25% of its total assets in foreign securities, which
involve special risks, including currency fluctuations and economic and political uncertainty. The Fund is actively managed but there is no guarantee that the
manager’s investment decisions will produce the desired results. The Fund’s prospectus also includes a description of the main investment risks.
1. The Fund has a fee waiver associated with any investments it makes in a Franklin Templeton money fund and/or other Franklin Templeton fund, contractually guaranteed
through its current fiscal year-end. Fund investment results reflect the fee waiver; without this waiver, the results would have been lower.
2. Cumulative total return represents the change in value of an investment over the periods indicated.
3. Average annual total return represents the average annual change in value of an investment over the periods indicated. Return for less than one year, ifany,hasnotbeen
annualized.
4. In accordance with SEC rules, we provide standardized average annual total return information through the latest calendar quarter.
5. Source: Morningstar. The Russell 2000 Value Index is market capitalization weighted and measures performance of those Russell 2000 Index companies with lower
price-to-book ratios and lower forecasted growth values.
6. Source: Bureau of Labor Statistics, bls.gov/cpi. The Consumer Price Index is a commonly used measure of the inflation rate.
7. Figures are as stated in the Fund’s current prospectus and may differ from the expense ratios disclosed in the Your Fund’s Expenses and Financial Highlights sections in this
report. In periods of market volatility, assets may decline significantly, causing total annual Fund operating expenses to become higher than the figures shown.
See www.franklintempletondatasources.com for additional data provider information.
16 Annual Report
franklintempleton.com
FRANKLIN MICROCAP VALUE FUND
Your Fund’s Expenses
As a Fund shareholder, you can incur two types of costs: (1) transaction costs, including sales charges (loads) on Fund purchases and redemptions; and (2) ongoing Fund costs, including management fees, distribution and service (12b-1) fees, and other Fund expenses. All mutual funds have ongoing costs, sometimes referred to as operating expenses. The table below shows ongoing costs of investing in the Fund and can help you understand these costs and compare them with those of other mutual funds. The table assumes a $1,000 investment held for the six months indicated.
Actual Fund Expenses
The table below provides information about actual account values and actual expenses in the columns under the heading “Actual.” In these columns the Fund’s actual return, which includes the effect of Fund expenses, is used to calculate the “Ending Account Value” for each class of shares. You can estimate the expenses you paid during the period by following these steps (of course, your account value and expenses will differ from those in this illustration): Divide your account value by $1,000 (if your account had an $8,600 value, then $8,600 ÷ $1,000 = 8.6). Then multiply the result by the number in the row for your class of shares under the headings “Actual” and “Expenses Paid During Period” (if Actual Expenses Paid During Period were $7.50, then 8.6 x $7.50 = $64.50). In this illustration, the actual expenses paid this period are $64.50.
Hypothetical Example for Comparison with Other Funds
Under the heading “Hypothetical” in the table, information is provided about hypothetical account values and hypothetical expenses based on the Fund’s actual expense ratio and an assumed rate of return of 5% per year before expenses, which is not the Fund’s actual return. This information may not be used to estimate the actual ending account balance or expenses you paid for the period, but it can help you compare ongoing costs of investing in the Fund with those of other funds. To do so, compare this 5% hypothetical example for the class of shares you hold with the 5% hypothetical examples that appear in the shareholder reports of other funds.
Please note that expenses shown in the table are meant to highlight ongoing costs and do not reflect any transactional costs. Therefore, information under the heading “Hypothetical” is useful in comparing ongoing costs only, and will not help you compare total costs of owning different funds. In addition, if transactional costs were included, your total costs would have been higher.
| | | | | | | | | | | | |
| | | | | | | Actual | | Hypothetical | | |
| | | | | (actual return after expenses) | | (5% annual return before expenses) | | |
| |
| | | | | | | Expenses | | | | Expenses | Net | |
| | | Beginning | | Ending | | Paid During | | Ending | | Paid During | Annualized | |
| Share | | Account | | Account | | Period | | Account | | Period | Expense | |
| Class | | Value 5/1/16 | | Value 10/31/16 | | 5/1/16–10/31/161,2 | | Value 10/31/16 | | 5/1/16–10/31/161,2 | Ratio2 | |
| |
| A | $ | 1,000 | $ | 1,023.20 | $ | 6.00 | $ | 1,019.20 | $ | 5.99 | 1.18 | % |
| R6 | $ | 1,000 | $ | 1,025.30 | $ | 4.07 | $ | 1,021.11 | $ | 4.06 | 0.80 | % |
| Advisor | $ | 1,000 | $ | 1,024.70 | $ | 4.73 | $ | 1,020.46 | $ | 4.72 | 0.93 | % |
1. Expenses are equal to the annualized expense ratio for the six-month period as indicated above–in the far right column–multiplied by the simple average account value
over the period indicated, and then multiplied by 184/366 to reflect the one-half year period.
2. Reflects expenses after fee waivers and expense reimbursements. Does not include acquired fund fees and expenses.
franklintempleton.com
Annual Report
17
Franklin MidCap Value Fund
This annual report for Franklin MidCap Value Fund covers the fiscal year ended October 31, 2016.
Your Fund’s Goal and Main Investments
The Fund seeks long-term total return by investing at least 80% of net assets in securities of mid-capitalization companies that we believe are undervalued. We define mid-capitalization companies as those with market capitalizations that are similar in size at the time of purchase to those in the Russell Midcap® Index.1
Performance Overview
The Fund’s Class A shares delivered a +4.61% cumulative total return for the 12 months under review. In comparison, the Russell Midcap® Value Index, which measures performance of those Russell Midcap® Index companies with lower price-to-book ratios and lower forecasted growth values, generated a +7.84% total return for the same period.2 You can find more of the Fund’s performance data in the Performance Summary beginning on page 21.
Performance data represent past performance, which does not guarantee future results. Investment return and principal value will fluctuate, and you may have a gain or loss when you sell your shares. Current performance may differ from figures shown. For most recent month-end performance, go to franklintempleton.com or call (800) 342-5236.
Investment Strategy
Our goal is to invest in mid-capitalization companies that we determine are currently undervalued and have the potential for capital appreciation. The Fund purchases stocks that are out of favor in the market for reasons we believe will prove to be temporary in nature. In addition, the Fund may invest in companies with valuable intangibles we believe are not reflected in the stock price. This strategy is not aimed at short-term trading gains, nor do we consider the composition of any index. Rather, we try to identify attractively priced, financially sound companies that meet our investment criteria, and we assume at purchase that we will hold the position for several years.
1. The Russell Midcap Index is market capitalization weighted and measures performance of the smallest companies in the Russell 1000 Index, which represent a modest
amount of the Russell 1000 Index’s total market capitalization.
2. Source: Morningstar.
The index is unmanaged and includes reinvestment of any income or distributions. It does not reflect any fees, expenses or sales charges. One cannot invest directly in an
index, and an index is not representative of the Fund’s portfolio.
See www.franklintempletondatasources.com for additional data provider information.
The dollar value, number of shares or principal amount, and names of all portfolio holdings are listed in the Fund’s Statement of Investments (SOI).
The SOI begins on page 51.
18 Annual Report
franklintempleton.com
FRANKLIN MIDCAP VALUE FUND
Manager’s Discussion
During the 12 months under review, holdings that positively contributed to Fund performance included Pinnacle Foods, Albemarle and Ingevity.
Shares of Pinnacle Foods, a packaged foods company, rose based on the acquisition of Boulder Brands, continued improvements in the company’s legacy businesses, a dividend increase and a well-received hiring of a new chief executive officer (CEO). We remain positive on the company, given what we consider the potential for still greater synergies from Boulder Brands, a particularly strong outlook for gross margin expansion over the next several years and what we considered an attractive valuation relative to its peer group.
Shares of Albemarle, a specialty chemicals producer, continued to perform well, as earlier momentum from improved operating performance and heightened expectations surrounding the lithium business continued to propel the stock. Ingevity, a specialty chemicals and activated carbon manufacturer, made strong gains in a relatively short period of time as a publicly traded entity.
Spun out of Westrock, a stock we also own, Ingevity rallied as investors quickly came to appreciate the company’s unique and low-cost auto vapor containment solutions, their commanding market share and strong adoption rates driven by ever higher regulatory standards. We continue to believe the shares are underpriced given what we considered the company’s attractive free cash flow profile.
Detractors from Fund performance included Realogy Holdings, Perrigo and HollyFrontier (sold by period-end).
Realogy Holdings, the largest residential real estate broker in the U.S., reported lower-than-expected earnings due to weakness at the high-end and coastal regions of the real estate market. At period-end, the stock traded at an 11% free cash flow yield. Despite the near-term weakness, we remain positive on the stock.
Perrigo, a healthcare supplier and pharmaceuticals company, was adversely affected by the abrupt departure of its CEO, a reduction in earnings guidance and investor concerns about diminishing pricing power in its generics business. New management is focused on resetting the company’s guidance to more realistic levels and on improving profitability at its underperforming European subsidiary. We agree with management’s actions and regard many of the problems as fixable or one-time in nature.
HollyFrontier (HFC) is an independent oil refiner operating five refineries serving the Rockies, midcontinent and Southwest. The company lowered its outlook due to poor refining conditions and biofuel blending costs that are high relative to peers. As a smaller pure-play refiner focused in the midcontinent, HFC is more exposed to market forces than many of its peers. We exited our position in HollyFrontier by period-end.
Top 10 Holdings
10/31/16
| | |
| Company | % of Total | |
| Sector/Industry | Net Assets | |
| Pinnacle Foods Inc. | 3.1 | % |
| Food, Beverage & Tobacco | | |
| Western Digital Corp. | 2.3 | % |
| Technology Hardware & Equipment | | |
| TreeHouse Foods Inc. | 2.0 | % |
| Food, Beverage & Tobacco | | |
| Toll Brothers Inc. | 1.9 | % |
| Consumer Durables & Apparel | | |
| Lam Research Corp. | 1.7 | % |
| Semiconductors & Semiconductor Equipment | | |
| Ingevity Corp. | 1.7 | % |
| Materials | | |
| Hologic Inc. | 1.6 | % |
| Health Care Equipment & Services | | |
| Ferroglobe PLC | 1.6 | % |
| Materials | | |
| Versum Materials Inc. | 1.6 | % |
| Semiconductors & Semiconductor Equipment | | |
| Marathon Petroleum Corp. | 1.5 | % |
| Energy | | |
During the reporting period, the Fund initiated positions in Invesco, an independent investment management company; Toll Brothers, a luxury homes builder; Michael Kors Holdings, a luxury fashion company; Synchrony Financial, a financial services provider; and the aforementioned Pinnacle Foods. We also added to several positions with the largest purchases including Western Digital, a data storage solutions provider; Wabco Holdings, a provider of electronic automation systems for heavy duty commercial vehicles; and Autodesk, a software company.
The Fund exited positions including ITC Holdings, Equity Lifestyle Properties, Envision Healthcare Holdings, SanDisk and Resmed. We also reduced holdings in many positions including Michael Kors Holdings, Invesco and Endo International.
franklintempleton.com
Annual Report
19
FRANKLIN MIDCAP VALUE FUND
Thank you for your continued participation in Franklin MidCap Value Fund. We look forward to continuing to serve your investment needs.

The foregoing information reflects our analysis, opinions and portfolio holdings as of October 31, 2016, the end of the reporting period. The way we implement our main investment strategies and the resulting portfolio holdings may change depending on factors such as market and economic conditions. These opinions may not be relied upon as investment advice or an offer for a particular security. The information is not a complete analysis of every aspect of any market, country, industry, security or the Fund. Statements of fact are from sources considered reliable, but the investment manager makes no representation or warranty as to their completeness or accuracy. Although historical performance is no guarantee of future results, these insights may help you understand our investment management philosophy.
20 Annual Report
franklintempleton.com
FRANKLIN MIDCAP VALUE FUND
Performance Summary as of October 31, 2016
The performance table and graphs do not reflect any taxes that a shareholder would pay on Fund dividends, capital gain distributions, if any, or any realized gains on the sale of Fund shares. Total return reflects reinvestment of the Fund’s dividends and capital gain distributions, if any, and any unrealized gains or losses.
Performance as of 10/31/161
Cumulative total return excludes sales charges. Average annual total returns include maximum sales charges. Sales charges will vary depending on the size of the investment and the class of share purchased. The maximum is 5.75% and the minimum is 0%. Class A: 5.75% maximum initial sales charge; Advisor Class: no sales charges. For other share classes, visit franklintempleton.com.
| | | | | | |
| | Cumulative | | Average Annual | | Average Annual | |
| Share Class | Total Return2 | | Total Return3 | | Total Return (9/30/16)4 | |
| A | | | | | | |
| 1-Year | +4.61 | % | -1.41 | % | +7.42 | % |
| 5-Year | +61.23 | % | +8.74 | % | +11.84 | % |
| 10-Year | +58.20 | % | +4.08 | % | +4.63 | % |
| Advisor | | | | | | |
| 1-Year | +4.93 | % | +4.93 | % | +14.24 | % |
| 5-Year | +63.68 | % | +10.36 | % | +13.50 | % |
| 10-Year | +63.29 | % | +5.03 | % | +5.58 | % |
Performance data represent past performance, which does not guarantee future results. Investment return and principal value will fluctuate, and you may have a gain or loss when you sell your shares. Current performance may differ from figures shown. For most recent month-end performance, go to franklintempleton.com or call (800) 342-5236.
See page 23 for Performance Summary footnotes.
franklintempleton.com
Annual Report
21
FRANKLIN MIDCAP VALUE FUND
PERFORMANCE SUMMARY
Total Return Index Comparison for a Hypothetical $10,000 Investment1
Total return represents the change in value of an investment over the periods shown. It includes any applicable maximum sales charge, Fund expenses, account fees and reinvested distributions. The unmanaged indexes include reinvestment of any income or distributions. They differ from the Fund in composition and do not pay management fees or expenses. One cannot invest directly in an index.

See page 23 for Performance Summary footnotes.
22 Annual Report
franklintempleton.com
FRANKLIN MIDCAP VALUE FUND
PERFORMANCE SUMMARY
| | | | |
| Total Annual Operating Expenses7 | | | |
| Share Class | With Waiver | | Without Waiver | |
| A | 1.30 | % | 1.56 | % |
| Advisor | 1.05 | % | 1.31 | % |
Each class of shares is available to certain eligible investors and has different annual fees and expenses, as described in the prospectus.
All investments involve risks, including possible loss of principal. Stock prices fluctuate, sometimes rapidly and dramatically, due to factors affecting individual
companies, particular industries or sectors, or general market conditions. Historically, midsize company securities have been more volatile in price than larger
company securities, especially over the short term. Midsize companies may be more susceptible to particular economic events or competitive factors than are
larger, more broadly diversified companies. In addition, the Fund may invest up to 25% of its total assets in foreign securities, which involve special risks,
including currency fluctuations and economic and political uncertainty. The Fund is actively managed but there is no guarantee that the manager’s investment
decisions will produce the desired results. The Fund’s prospectus also includes a description of the main investment risks.
1. The Fund has an expense reduction contractually guaranteed through 2/28/17. The Fund also has a fee waiver associated with any investments it makes in a Franklin
Templeton money fund and/or other Franklin Templeton fund, contractually guaranteed through its current fiscal year-end. Fund investment results reflect the expense reduction
and fee waiver; without these reductions, the results would have been lower.
2. Cumulative total return represents the change in value of an investment over the periods indicated.
3. Average annual total return represents the average annual change in value of an investment over the periods indicated. Return for less than one year, ifany,hasnotbeen
annualized.
4. In accordance with SEC rules, we provide standardized average annual total return information through the latest calendar quarter.
5. Source: Morningstar. The Russell Midcap Value Index is market capitalization weighted and measures performance of those Russell Midcap Index companies with lower
price-to-book ratios and lower forecasted growth values.
6. Source: Bureau of Labor Statistics, bls.gov/cpi. The Consumer Price Index is a commonly used measure of the inflation rate.
7. Figures are as stated in the Fund’s current prospectus and may differ from the expense ratios disclosed in the Your Fund’s Expenses and Financial Highlights sections in this
report. In periods of market volatility, assets may decline significantly, causing total annual Fund operating expenses to become higher than the figures shown.
See www.franklintempletondatasources.com for additional data provider information.
franklintempleton.com
Annual Report
23
FRANKLIN MIDCAP VALUE FUND
Your Fund’s Expenses
As a Fund shareholder, you can incur two types of costs: (1) transaction costs, including sales charges (loads) on Fund purchases and redemptions; and (2) ongoing Fund costs, including management fees, distribution and service (12b-1) fees, and other Fund expenses. All mutual funds have ongoing costs, sometimes referred to as operating expenses. The table below shows ongoing costs of investing in the Fund and can help you understand these costs and compare them with those of other mutual funds. The table assumes a $1,000 investment held for the six months indicated.
Actual Fund Expenses
The table below provides information about actual account values and actual expenses in the columns under the heading “Actual.” In these columns the Fund’s actual return, which includes the effect of Fund expenses, is used to calculate the “Ending Account Value” for each class of shares. You can estimate the expenses you paid during the period by following these steps (of course, your account value and expenses will differ from those in this illustration): Divide your account value by $1,000 (if your account had an $8,600 value, then $8,600 ÷ $1,000 = 8.6). Then multiply the result by the number in the row for your class of shares under the headings “Actual” and “Expenses Paid During Period” (if Actual Expenses Paid During Period were $7.50, then 8.6 x $7.50 = $64.50). In this illustration, the actual expenses paid this period are $64.50.
Hypothetical Example for Comparison with Other Funds
Under the heading “Hypothetical” in the table, information is provided about hypothetical account values and hypothetical expenses based on the Fund’s actual expense ratio and an assumed rate of return of 5% per year before expenses, which is not the Fund’s actual return. This information may not be used to estimate the actual ending account balance or expenses you paid for the period, but it can help you compare ongoing costs of investing in the Fund with those of other funds. To do so, compare this 5% hypothetical example for the class of shares you hold with the 5% hypothetical examples that appear in the shareholder reports of other funds.
Please note that expenses shown in the table are meant to highlight ongoing costs and do not reflect any transactional costs. Therefore, information under the heading “Hypothetical” is useful in comparing ongoing costs only, and will not help you compare total costs of owning different funds. In addition, if transactional costs were included, your total costs would have been higher.
| | | | | | | | | | | | |
| | | | | | | Actual | | Hypothetical | | |
| | | | | (actual return after expenses) | | (5% annual return before expenses) | | |
| | | | | | | Expenses | | | | Expenses | Net | |
| | | Beginning | | Ending | | Paid During | | Ending | | Paid During | Annualized | |
| Share | | Account | | Account | | Period | | Account | | Period | Expense | |
| Class | | Value 5/1/16 | | Value 10/31/16 | | 5/1/16–10/31/161,2 | | Value 10/31/16 | | 5/1/16–10/31/161,2 | Ratio2 | |
| A | $ | 1,000 | $ | 1,035.60 | $ | 6.65 | $ | 1,018.60 | $ | 6.60 | 1.30 | % |
| C | $ | 1,000 | $ | 1,031.90 | $ | 10.47 | $ | 1,014.83 | $ | 10.38 | 2.05 | % |
| R | $ | 1,000 | $ | 1,034.20 | $ | 7.93 | $ | 1,017.34 | $ | 7.86 | 1.55 | % |
| Advisor | $ | 1,000 | $ | 1,037.60 | $ | 5.38 | $ | 1,019.86 | $ | 5.33 | 1.05 | % |
1. Expenses are equal to the annualized expense ratio for the six-month period as indicated above–in the far right column–multiplied by the simple average account value
over the period indicated, and then multiplied by 184/366 to reflect the one-half year period.
2. Reflects expenses after fee waivers and expense reimbursements. Does not include acquired fund fees and expenses.
24 Annual Report
franklintempleton.com
Franklin Small Cap Value Fund
We are pleased to bring you Franklin Small Cap Value Fund’s annual report for the fiscal year ended October 31, 2016. We welcome the former shareholders of Franklin All Cap Value Fund that now own shares of Franklin Small Cap Value Fund as a result of Franklin All Cap Value Fund’s reorganization that took effect on April 1, 2016.
Your Fund’s Goal and Main Investments
The Fund seeks long-term total return by investing at least 80% of net assets in securities of small-capitalization companies that we believe are undervalued. We define small-capitalization companies as those with market capitalizations less than $3.5 billion at the time of purchase. Effective September 30, 2016, the definition of small-capitalization companies was revised as follows: Small-capitalization companies are companies with market capitalizations (the total market value of a company’s outstanding stock) not exceeding either the highest market capitalization in the Russell 2000TM Index or the 12-month average of the highest market capitalization in the Russell 2000TM Index, whichever is greater, at the time of purchase.1
Performance Overview
The Fund’s Class A shares delivered a +11.15% cumulative total return for the 12 months under review. In comparison, the Fund’s new benchmark, the Russell 2000TM Value Index, which measures performance of those Russell 2000TM Index companies with lower price-to-book ratios and lower forecasted growth values, had a +8.81% total return for the same period, while its previous benchmark, the Russell 2500TM Value Index, which measures performance of those Russell 2500TM Index companies with lower price-to-book ratios and lower forecasted growth values, had a +7.78% total return for the same period.2 As the investment manager believes the composition of the Russell 2000 ValueTM Index aligns more closely with the Fund’s portfolio, it has replaced the Russell 2500TM Value Index as the Fund’s benchmark. You can find more of the Fund’s performance data in the Performance Summary beginning on page 28.
Performance data represent past performance, which does not guarantee future results. Investment return and principal value
will fluctuate, and you may have a gain or loss when you sell your shares. Current performance may differ from figures shown. For most recent month-end performance, go to franklintempleton.com or call (800) 342-5236.
Investment Strategy
We seek to invest in small-capitalization companies that we believe are selling below their underlying worth and hold them until they reach what we consider their fair value. We seek a diversified portfolio of fundamentally sound companies purchased at attractive prices, often when they are out of favor with other investors. Portfolio securities are selected without regard to benchmark comparisons and are based on fundamental, bottom-up research focusing on several criteria, such as low price relative to earnings, book value or cash flow. We also consider stocks with recent sharp price declines that we believe still have significant growth potential or that possess valuable intangibles not reflected in the stock price.
Manager’s Discussion
During the 12 months under review, holdings that aided Fund performance included Astec Industries, Maple Leaf Foods and Drew Industries.
Astec Industries, a manufacturer of road paving and construction related equipment, benefited from optimism surrounding further federal funding for highways, strong sales of new products such as wood pellet plants, a growing backlog and improved profitability.
Maple Leaf Foods, a Canadian-based producer of fresh and packaged meats, experienced stronger-than-expected sales and profits as the company neared the end of its multi-year manufacturing and network optimization plan and also increased its dividend. As a result, nearly all duplicative costs were eliminated, cash flow generation improved and the company was able to focus on driving growth through new product innovation.
Drew Industries, a leading component supplier for recreational vehicles (RVs), delivered what we considered attractive sales and earnings growth throughout the year. Management
1. The Russell 2000TM Index is market capitalization weighted and measures performance of the 2,000 smallest companies in the Russell 3000 Index, which represent a small
amount of the total market capitalization of the Russell 3000 Index.
2. Source: Morningstar.
The index is unmanaged and includes reinvestment of any income or distributions. It does not reflect any fees, expenses or sales charges. One cannot invest directly in an
index, and an index is not representative of the Fund’s portfolio.
See www.franklintempletondatasources.com for additional data provider information.
The dollar value, number of shares or principal amount, and names of all portfolio holdings are listed in the Fund’s Statement of Investments (SOI).
The SOI begins on page 60.
franklintempleton.com
Annual Report
25
FRANKLIN SMALL CAP VALUE FUND
highlighted strong momentum with summer demand tracking above historical norms, putting the overall RV industry on pace to ship a record number of units in 2016. Additionally, management indicated that its operating margin was expected to surpass prior peak levels. The outlook for Drew appears favorable to us given the company’s dominant market position, margin growth opportunities in adjacent categories and favorable secular trends as the RV industry attracts a younger customer base.
Detractors from Fund performance included Tailored Brands (formerly, Men’s Wearhouse), Bristow Group and A. Schulman.
Tailored Brands, a specialty apparel retailer, reported disappointing results from its recently acquired Jos. A. Bank business as a change to a less promotional-driven model and a more challenging retail environment substantially impacted sales. Tailored Brands was sold during the period.
Bristow Group, a provider of helicopter transportation services to the offshore oil and gas industry, along with search and rescue operations to government entities, reported weak earnings and cut its dividend as declining energy prices and competitor pressures affected both revenues and profitability. We exited our position in Bristow during the period.
Shares of A. Schulman, a plastic compounds and resins supplier, declined due to challenging economic conditions and internal execution issues related to recent acquisitions. These conditions and challenges led to weaker-than-expected sales and earnings during the period. As a result, the company replaced its Chief Executive Officer (CEO) in August with its current Chairman and former CEO.
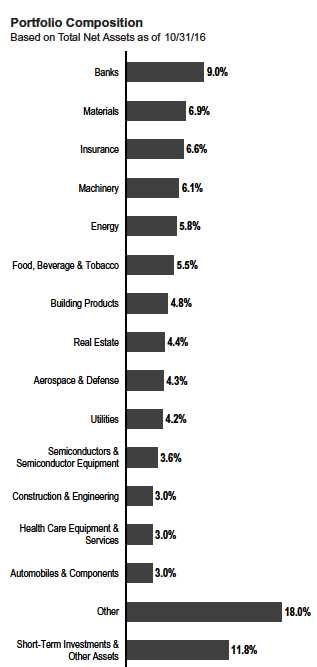
Top 10 Holdings
10/31/16
| | |
| Company | % of Total | |
| Sector/Industry | Net Assets | |
| Maple Leaf Foods Inc. | 2.8 | % |
| Food, Beverage & Tobacco | | |
| AAR Corp. | 2.5 | % |
| Aerospace & Defense | | |
| LTC Properties Inc. | 2.5 | % |
| Real Estate | | |
| Sensient Technologies Corp. | 2.3 | % |
| Materials | | |
| Gerresheimer AG | 2.1 | % |
| Pharmaceuticals, Biotechnology & Life Sciences | | |
| IDACORP Inc. | 2.1 | % |
| Utilities | | |
| Astec Industries Inc. | 2.0 | % |
| Machinery | | |
| Spire Inc. | 1.9 | % |
| Utilities | | |
| Unit Corp. | 1.8 | % |
| Energy | | |
| Aspen Insurance Holdings Ltd. | 1.7 | % |
| Insurance | | |
During the reporting period, we added some new positions with the largest purchases including Columbia Banking System, a community bank; Brandywine Realty Trust, a real estate
26 Annual Report
franklintempleton.com
FRANKLIN SMALL CAP VALUE FUND
investment trust focused primarily on suburban office properties; Mueller Water Products, a manufacturer and distributor of fire hydrants, pipe fittings and valves; SAIA, a trucking company; and BNC Bancorp, a financial services provider. The Fund also added to several holdings including Lakeland Financial, a bank; Oil States International, an oil services and drilling equipment provider; and IDACORP, an electric utility.
In contrast, the Fund exited positions including Axiall, Teleflex, Pep Boys – Manny, Moe & Jack, StanCorp Financial and Ingram Micro. All of which were due to takeovers, with the exception of Teleflex. We reduced holdings in several positions including Universal Forest Products, Regal Beloit and LA-Z-Boy.
Thank you for your continued participation in Franklin Small Cap Value Fund. We look forward to continuing to serve your investment needs.

The foregoing information reflects our analysis, opinions and portfolio holdings as of October 31, 2016, the end of the reporting period. The way we implement our main investment strategies and the resulting portfolio holdings may change depending on factors such as market and economic conditions. These opinions may not be relied upon as investment advice or an offer for a particular security. The information is not a complete analysis of every aspect of any market, country, industry, security or the Fund. Statements of fact are from sources considered reliable, but the investment manager makes no representation or warranty as to their completeness or accuracy. Although historical performance is no guarantee of future results, these insights may help you understand our investment management philosophy.
franklintempleton.com
Annual Report
27
FRANKLIN SMALL CAP VALUE FUND
Performance Summary as of October 31, 2016
The performance table and graphs do not reflect any taxes that a shareholder would pay on Fund dividends, capital gain distributions, if any, or any realized gains on the sale of Fund shares. Total return reflects reinvestment of the Fund’s dividends and capital gain distributions, if any, and any unrealized gains or losses.
Performance as of 10/31/161
Cumulative total return excludes sales charges. Average annual total returns include maximum sales charges. Sales charges will vary depending on the size of the investment and the class of share purchased. The maximum is 5.75% and the minimum is 0%. Class A: 5.75% maximum initial sales charge; Advisor Class: no sales charges. For other share classes, visit franklintempleton.com.
| | | | | | |
| | Cumulative | | Average Annual | | Average Annual | |
| Share Class | Total Return2 | | Total Return3 | | Total Return (9/30/16)4 | |
| A | | | | | | |
| 1-Year | +11.15 | % | +4.75 | % | +15.14 | % |
| 5-Year | +72.68 | % | +10.23 | % | +14.51 | % |
| 10-Year | +85.46 | % | +5.74 | % | +6.46 | % |
| Advisor | | | | | | |
| 1-Year | +11.43 | % | +11.43 | % | +22.48 | % |
| 5-Year | +75.17 | % | +11.86 | % | +16.21 | % |
| 10-Year | +90.79 | % | +6.67 | % | +7.40 | % |
Performance data represent past performance, which does not guarantee future results. Investment return and principal value will
fluctuate, and you may have a gain or loss when you sell your shares. Current performance may differ from figures shown. For most
recent month-end performance, go to franklintempleton.com or call (800) 342-5236.
See page 30 for Performance Summary footnotes.
28 Annual Report
franklintempleton.com
FRANKLIN SMALL CAP VALUE FUND
PERFORMANCE SUMMARY
Total Return Index Comparison for a Hypothetical $10,000 Investment1
Total return represents the change in value of an investment over the periods shown. It includes any applicable maximum sales charge, Fund expenses, account fees and reinvested distributions. The unmanaged indexes include reinvestment of any income or distributions. They differ from the Fund in composition and do not pay management fees or expenses. One cannot invest directly in an index.

See page 30 for Performance Summary footnotes.
franklintempleton.com
Annual Report
29
FRANKLIN SMALL CAP VALUE FUND
PERFORMANCE SUMMARY
| | | | |
| Total Annual Operating Expenses7 | | | |
| Share Class | With Waiver | | Without Waiver | |
| A | 1.12 | % | 1.13 | % |
| Advisor | 0.87 | % | 0.88 | % |
Each class of shares is available to certain eligible investors and has different annual fees and expenses, as described in the prospectus.
All investments involve risks, including possible loss of principal. The Fund’s investments in smaller company stocks carry special risks as such stocks have
historically exhibited greater price volatility than larger company stocks, particularly over the short term. Additionally, smaller companies often have relatively
small revenues, limited product lines and small market share. In addition, the Fund may invest up to 25% of its total assets in foreign securities, which involve
special risks, including currency fluctuations and economic and political uncertainty. The Fund is actively managed but there is no guarantee that the manager’s
investment decisions will produce the desired results. The Fund’s prospectus also includes a description of the main investment risks.
1. The Fund has a fee waiver associated with any investment it makes in a Franklin Templeton money fund and/or other Franklin Templeton fund, contractually guaranteed
through its current fiscal year-end. Fund investment results reflect the fee waiver; without this waiver, the results would have been lower.
2. Cumulative total return represents the change in value of an investment over the periods indicated.
3. Average annual total return represents the average annual change in value of an investment over the periods indicated. Return for less than one year, ifany,hasnotbeen
annualized.
4. In accordance with SEC rules, we provide standardized average annual total return information through the latest calendar quarter.
5. Source: Morningstar. The Russell 2000 Value Index measures performance of those Russell 2000 Index companies with lower price-to-book ratios and lower forecasted
growth values.
6. Source: Bureau of Labor Statistics, bls.gov/cpi. The Consumer Price Index is a commonly used measure of the inflation rate.
7. Figures are as stated in the Fund’s current prospectus and may differ from the expense ratios disclosed in the Your Fund’s Expenses and Financial Highlights sections in this
report. In periods of market volatility, assets may decline significantly, causing total annual Fund operating expenses to become higher than the figures shown.
See www.franklintempletondatasources.com for additional data provider information.
30 Annual Report
franklintempleton.com
FRANKLIN SMALL CAP VALUE FUND
Your Fund’s Expenses
As a Fund shareholder, you can incur two types of costs: (1) transaction costs, including sales charges (loads) on Fund purchases and redemptions; and (2) ongoing Fund costs, including management fees, distribution and service (12b-1) fees, and other Fund expenses. All mutual funds have ongoing costs, sometimes referred to as operating expenses. The table below shows ongoing costs of investing in the Fund and can help you understand these costs and compare them with those of other mutual funds. The table assumes a $1,000 investment held for the six months indicated.
Actual Fund Expenses
The table below provides information about actual account values and actual expenses in the columns under the heading “Actual.” In these columns the Fund’s actual return, which includes the effect of Fund expenses, is used to calculate the “Ending Account Value” for each class of shares. You can estimate the expenses you paid during the period by following these steps (of course, your account value and expenses will differ from those in this illustration): Divide your account value by $1,000 (if your account had an $8,600 value, then $8,600 ÷ $1,000 = 8.6). Then multiply the result by the number in the row for your class of shares under the headings “Actual” and “Expenses Paid During Period” (if Actual Expenses Paid During Period were $7.50, then 8.6 x $7.50 = $64.50). In this illustration, the actual expenses paid this period are $64.50.
Hypothetical Example for Comparison with Other Funds
Under the heading “Hypothetical” in the table, information is provided about hypothetical account values and hypothetical expenses based on the Fund’s actual expense ratio and an assumed rate of return of 5% per year before expenses, which is not the Fund’s actual return. This information may not be used to estimate the actual ending account balance or expenses you paid for the period, but it can help you compare ongoing costs of investing in the Fund with those of other funds. To do so, compare this 5% hypothetical example for the class of shares you hold with the 5% hypothetical examples that appear in the shareholder reports of other funds.
Please note that expenses shown in the table are meant to highlight ongoing costs and do not reflect any transactional costs. Therefore, information under the heading “Hypothetical” is useful in comparing ongoing costs only, and will not help you compare total costs of owning different funds. In addition, if transactional costs were included, your total costs would have been higher.
| | | | | | | | | | | | |
| | | | | | | Actual | | Hypothetical | | |
| | | | | (actual return after expenses) | | (5% annual return before expenses) | | |
| | | | | | | Expenses | | | | Expenses | Net | |
| | | Beginning | | Ending | | Paid During | | Ending | | Paid During | Annualized | |
| Share | | Account | | Account | | Period | | Account | | Period | Expense | |
| Class | | Value 5/1/16 | | Value 10/31/16 | | 5/1/16–10/31/161,2 | | Value 10/31/16 | | 5/1/16–10/31/161,2 | Ratio2 | |
| A | $ | 1,000 | $ | 1,087.10 | $ | 5.56 | $ | 1,019.81 | $ | 5.38 | 1.06 | % |
| C | $ | 1,000 | $ | 1,083.10 | $ | 9.48 | $ | 1,016.04 | $ | 9.17 | 1.81 | % |
| R | $ | 1,000 | $ | 1,085.80 | $ | 6.87 | $ | 1,018.55 | $ | 6.65 | 1.31 | % |
| R6 | $ | 1,000 | $ | 1,089.70 | $ | 3.20 | $ | 1,022.07 | $ | 3.10 | 0.61 | % |
| Advisor | $ | 1,000 | $ | 1,088.40 | $ | 4.25 | $ | 1,021.06 | $ | 4.12 | 0.81 | % |
1. Expenses are equal to the annualized expense ratio for the six-month period as indicated above–in the far right column–multiplied by the simple average account value
over the period indicated, and then multiplied by 184/366 to reflect the one-half year period.
2. Reflects expenses after fee waivers and expense reimbursements. Does not include acquired fund fees and expenses.
franklintempleton.com
Annual Report
31

| | | | | | | | | | | | | | | |
| Financial Highlights | | | | | | | | | | | | | | | |
| Franklin Balance Sheet Investment Fund | | | | | | | | | | | | | | | |
| | | | | | Year Ended October 31, | | | | |
| | | 2016 | | | 2015 | | | 2014 | | | 2013 | | | 2012 | |
| Class A | | | | | | | | | | | | | | | |
| Per share operating performance | | | | | | | | | | | | | | | |
| (for a share outstanding throughout the year) | | | | | | | | | | | | | | | |
| Net asset value, beginning of year | $ | 40.06 | | $ | 51.55 | | $ | 53.98 | | $ | 43.01 | | $ | 44.05 | |
| Income from investment operationsa: | | | | | | | | | | | | | | | |
| Net investment incomeb | | 0.22 | | | 0.19 | | | 0.46 | c | | 0.64 | d | | 0.48 | |
| Net realized and unrealized gains (losses) | | 1.17 | | | (3.92 | ) | | 3.06 | | | 13.15 | | | 3.65 | |
| Total from investment operations | | 1.39 | | | (3.73 | ) | | 3.52 | | | 13.79 | | | 4.13 | |
| Less distributions from: | | | | | | | | | | | | | | | |
| Net investment income | | (0.28 | ) | | (0.17 | ) | | (0.65 | ) | | (0.66 | ) | | (0.25 | ) |
| Net realized gains | | (5.77 | ) | | (7.59 | ) | | (5.30 | ) | | (2.16 | ) | | (4.92 | ) |
| Total distributions | | (6.05 | ) | | (7.76 | ) | | (5.95 | ) | | (2.82 | ) | | (5.17 | ) |
| Net asset value, end of year. | $ | 35.40 | | $ | 40.06 | | $ | 51.55 | | $ | 53.98 | | $ | 43.01 | |
| |
| Total returne | | 4.44 | % | | (7.73 | )% | | 6.97 | % | | 33.97 | % | | 11.09 | % |
| |
| Ratios to average net assets | | | | | | | | | | | | | | | |
| Expenses before waiver and payments by affiliates | | 0.94 | % | | 0.95 | % | | 0.90 | % | | 0.91 | % | | 0.99 | % |
| Expenses net of waiver and payments by affiliates | | 0.91 | %f | | 0.94 | % | | 0.89 | %f | | 0.91 | % | | 0.99 | % |
| Net investment income | | 0.62 | % | | 0.45 | % | | 0.89 | %c | | 1.34 | %d | | 1.16 | % |
| |
| Supplemental data | | | | | | | | | | | | | | | |
| Net assets, end of year (000’s) | $ | 795,663 | | $ | 915,285 | | $ | 1,221,903 | | $ | 1,256,543 | | $ | 1,079,418 | |
| Portfolio turnover rate | | 30.25 | % | | 26.31 | % | | 25.08 | % | | 11.54 | % | | 7.91 | %g |
aThe amount shown for a share outstanding throughout the period may not correlate with the Statement of Operations for the period due to the timing of sales and
repurchases of the Fund’s shares in relation to income earned and/or fluctuating fair value of the investments of the Fund.
bBased on average daily shares outstanding.
cNet investment income per share includes approximately $0.15 per share related to income received in the form of special dividends in connection with certain Fund
holdings. Excluding this amount, the ratio of net investment income to average net assets would have been 0.61%.
dNet investment income per share includes approximately $0.15 per share related to income received in the form of special dividends in connection with certain Fund
holdings. Excluding this amount, the ratio of net investment income to average net assets would have been 1.02%.
eTotal return does not reflect sales commissions or contingent deferred sales charges, if applicable.
fBenefit of expense reduction rounds to less than 0.01%.
gExcludes the value of portfolio securities delivered as a result of a redemption in-kind.
32 Annual Report | The accompanying notes are an integral part of these financial statements.
franklintempleton.com
FRANKLIN VALUE INVESTORS TRUST
FINANCIAL HIGHLIGHTS
| | | | | | | | | | | | | | | |
| Franklin Balance Sheet Investment Fund (continued) | | | | | | | | | | | | | | | |
| | | | | | Year Ended October 31, | | | | | | | |
| | | 2016 | | | 2015 | | | 2014 | | | 2013 | | | 2012 | |
| Class C | | | | | | | | | | | | | | | |
| Per share operating performance | | | | | | | | | | | | | | | |
| (for a share outstanding throughout the year) | | | | | | | | | | | | | | | |
| Net asset value, beginning of year | $ | 38.70 | | $ | 50.22 | | $ | 52.77 | | $ | 42.10 | | $ | 43.27 | |
| Income from investment operationsa: | | | | | | | | | | | | | | | |
| Net investment income (loss)b | | (0.04 | ) | | (0.12 | ) | | 0.07 | c | | 0.25 | d | | 0.15 | |
| Net realized and unrealized gains (losses) | | 1.12 | | | (3.81 | ) | | 2.99 | | | 12.93 | | | 3.60 | |
| Total from investment operations | | 1.08 | | | (3.93 | ) | | 3.06 | | | 13.18 | | | 3.75 | |
| Less distributions from: | | | | | | | | | | | | | | | |
| Net investment income | | — | | | — | | | (0.31 | ) | | (0.35 | ) | | — | |
| Net realized gains | | (5.77 | ) | | (7.59 | ) | | (5.30 | ) | | (2.16 | ) | | (4.92 | ) |
| Total distributions | | (5.77 | ) | | (7.59 | ) | | (5.61 | ) | | (2.51 | ) | | (4.92 | ) |
| Net asset value, end of year. | $ | 34.01 | | $ | 38.70 | | $ | 50.22 | | $ | 52.77 | | $ | 42.10 | |
| |
| Total returne | | 3.65 | % | | (8.41 | )% | | 6.17 | % | | 33.01 | % | | 10.25 | % |
| |
| Ratios to average net assets | | | | | | | | | | | | | | | |
| Expenses before waiver and payments by affiliates | | 1.69 | % | | 1.70 | % | | 1.65 | % | | 1.66 | % | | 1.74 | % |
| Expenses net of waiver and payments by affiliates | | 1.66 | %f | | 1.69 | % | | 1.64 | %f | | 1.66 | % | | 1.74 | % |
| Net investment income (loss) | | (0.13 | )% | | (0.30 | )% | | 0.14 | %c | | 0.59 | %d | | 0.41 | % |
| |
| Supplemental data | | | | | | | | | | | | | | | |
| Net assets, end of year (000’s) | $ | 61,567 | | $ | 73,185 | | $ | 96,279 | | $ | 96,462 | | $ | 71,723 | |
| Portfolio turnover rate | | 30.25 | % | | 26.31 | % | | 25.08 | % | | 11.54 | % | | 7.91 | %g |
aThe amount shown for a share outstanding throughout the period may not correlate with the Statement of Operations for the period due to the timing of sales and
repurchases of the Fund’s shares in relation to income earned and/or fluctuating fair value of the investments of the Fund.
bBased on average daily shares outstanding.
cNet investment income per share includes approximately $0.15 per share related to income received in the form of special dividends in connection with certain Fund
holdings. Excluding this amount, the ratio of net investment income to average net assets would have been (0.14)%.
dNet investment income per share includes approximately $0.15 per share related to income received in the form of special dividends in connection with certain Fund
holdings. Excluding this amount, the ratio of net investment income to average net assets would have been 0.27%.
eTotal return does not reflect sales commissions or contingent deferred sales charges, if applicable.
fBenefit of expense reduction rounds to less than 0.01%.
gExcludes the value of portfolio securities delivered as a result of a redemption in-kind.
franklintempleton.com
The accompanying notes are an integral part of these financial statements. | Annual Report 33
FRANKLIN VALUE INVESTORS TRUST
FINANCIAL HIGHLIGHTS
| | | | | | | | | | | | | | | |
| Franklin Balance Sheet Investment Fund (continued) | | | | | | | | | | | | | | | |
| | | | | | Year Ended October 31, | | | | | | | |
| | | 2016 | | | 2015 | | | 2014 | | | 2013 | | | 2012 | |
| Class R | | | | | | | | | | | | | | | |
| Per share operating performance | | | | | | | | | | | | | | | |
| (for a share outstanding throughout the year) | | | | | | | | | | | | | | | |
| Net asset value, beginning of year | $ | 40.06 | | $ | 51.48 | | $ | 53.90 | | $ | 42.95 | | $ | 43.94 | |
| Income from investment operationsa: | | | | | | | | | | | | | | | |
| Net investment incomeb | | 0.13 | | | 0.09 | | | 0.36 | c | | 0.49 | d | | 0.37 | |
| Net realized and unrealized gains (losses) | | 1.17 | | | (3.91 | ) | | 3.01 | | | 13.18 | | | 3.65 | |
| Total from investment operations | | 1.30 | | | (3.82 | ) | | 3.37 | | | 13.67 | | | 4.02 | |
| Less distributions from: | | | | | | | | | | | | | | | |
| Net investment income | | (0.17 | ) | | (0.01 | ) | | (0.49 | ) | | (0.56 | ) | | (0.09 | ) |
| Net realized gains | | (5.77 | ) | | (7.59 | ) | | (5.30 | ) | | (2.16 | ) | | (4.92 | ) |
| Total distributions | | (5.94 | ) | | (7.60 | ) | | (5.79 | ) | | (2.72 | ) | | (5.01 | ) |
| Net asset value, end of year. | $ | 35.42 | | $ | 40.06 | | $ | 51.48 | | $ | 53.90 | | $ | 42.95 | |
| |
| Total return | | 4.17 | % | | (7.94 | )% | | 6.67 | % | | 33.67 | % | | 10.80 | % |
| |
| Ratios to average net assets | | | | | | | | | | | | | | | |
| Expenses before waiver and payments by affiliates | | 1.19 | % | | 1.20 | % | | 1.15 | % | | 1.16 | % | | 1.24 | % |
| Expenses net of waiver and payments by affiliates | | 1.16 | %e | | 1.19 | % | | 1.14 | %e | | 1.16 | % | | 1.24 | % |
| Net investment income | | 0.37 | % | | 0.20 | % | | 0.64 | %c | | 1.09 | %d | | 0.91 | % |
| |
| Supplemental data | | | | | | | | | | | | | | | |
| Net assets, end of year (000’s) | $ | 8,486 | | $ | 9,831 | | $ | 14,261 | | $ | 17,992 | | $ | 15,053 | |
| Portfolio turnover rate | | 30.25 | % | | 26.31 | % | | 25.08 | % | | 11.54 | % | | 7.91 | %f |
aThe amount shown for a share outstanding throughout the period may not correlate with the Statement of Operations for the period due to the timing of sales and
repurchases of the Fund’s shares in relation to income earned and/or fluctuating fair value of the investments of the Fund.
bBased on average daily shares outstanding.
cNet investment income per share includes approximately $0.15 per share related to income received in the form of special dividends in connection with certain Fund
holdings. Excluding this amount, the ratio of net investment income to average net assets would have been 0.36%.
dNet investment income per share includes approximately $0.15 per share related to income received in the form of special dividends in connection with certain Fund
holdings. Excluding this amount, the ratio of net investment income to average net assets would have been 0.77%.
eBenefit of expense reduction rounds to less than 0.01%.
fExcludes the value of portfolio securities delivered as a result of a redemption in-kind.
34 Annual Report | The accompanying notes are an integral part of these financial statements.
franklintempleton.com
FRANKLIN VALUE INVESTORS TRUST
FINANCIAL HIGHLIGHTS
| | | | | | | | | | | | |
| Franklin Balance Sheet Investment Fund (continued) | | | | | | | | | | | | |
| | | | | | Year Ended October 31, | | | | |
| | | 2016 | | | 2015 | | | 2014 | | | 2013 | a |
| Class R6 | | | | | | | | | | | | |
| Per share operating performance | | | | | | | | | | | | |
| (for a share outstanding throughout the year) | | | | | | | | | | | | |
| Net asset value, beginning of year | $ | 41.10 | | $ | 52.70 | | $ | 55.06 | | $ | 47.79 | |
| Income from investment operationsb: | | | | | | | | | | | | |
| Net investment incomec | | 0.35 | | | 0.37 | | | 0.47 | d | | 0.32 | e |
| Net realized and unrealized gains (losses) | | 1.20 | | | (3.99 | ) | | 3.32 | | | 6.95 | |
| Total from investment operations | | 1.55 | | | (3.62 | ) | | 3.79 | | | 7.27 | |
| Less distributions from: | | | | | | | | | | | | |
| Net investment income. | | (0.48 | ) | | (0.39 | ) | | (0.85 | ) | | — | |
| Net realized gains | | (5.77 | ) | | (7.59 | ) | | (5.30 | ) | | — | |
| Total distributions | | (6.25 | ) | | (7.98 | ) | | (6.15 | ) | | — | |
| Net asset value, end of year | $ | 36.40 | | $ | 41.10 | | $ | 52.70 | | $ | 55.06 | |
| |
| Total returnf | | 4.86 | % | | (7.33 | )% | | 7.37 | % | | 15.21 | % |
| |
| Ratios to average net assetsg | | | | | | | | | | | | |
| Expenses before waiver and payments by affiliates | | 0.53 | % | | 0.51 | % | | 0.50 | % | | 2.10 | % |
| Expenses net of waiver and payments by affiliates | | 0.50 | %h | | 0.50 | % | | 0.49 | %h | | 0.51 | % |
| Net investment income | | 1.03 | % | | 0.89 | % | | 1.29 | %d | | 1.25 | %e |
| |
| Supplemental data | | | | | | | | | | | | |
| Net assets, end of year (000’s) | $ | 157 | | $ | 7,412 | | $ | 7,863 | | $ | 6 | |
| Portfolio turnover rate | | 30.25 | % | | 26.31 | % | | 25.08 | % | | 11.54 | % |
aFor the period May 1, 2013 (effective date) to October 31, 2013.
bThe amount shown for a share outstanding throughout the period may not correlate with the Statement of Operations for the period due to the timing of sales and
repurchases of the Fund’s shares in relation to income earned and/or fluctuating fair value of the investments of the Fund.
cBased on average daily shares outstanding.
dNet investment income per share includes approximately $0.15 per share related to income received in the form of special dividends in connection with certain Fund
holdings. Excluding this amount, the ratio of net investment income to average net assets would have been 1.01%.
eNet investment income per share includes approximately $0.07 per share related to income received in the form of special dividends in connection with certain Fund
holdings. Excluding this amount, the ratio of net investment income to average net assets would have been 1.00%.
fTotal return is not annualized for periods less than one year.
gRatios are annualized for periods less than one year.
hBenefit of expense reduction rounds to less than 0.01%.
franklintempleton.com
The accompanying notes are an integral part of these financial statements. | Annual Report 35
FRANKLIN VALUE INVESTORS TRUST
FINANCIAL HIGHLIGHTS
| | | | | | | | | | | | | | | |
| Franklin Balance Sheet Investment Fund (continued) | | | | | | | | | | | | | | | |
| | | | | | Year Ended October 31, | | | | |
| | | 2016 | | | 2015 | | | 2014 | | | 2013 | | | 2012 | |
| Advisor Class | | | | | | | | | | | | | | | |
| Per share operating performance | | | | | | | | | | | | | | | |
| (for a share outstanding throughout the year) | | | | | | | | | | | | | | | |
| Net asset value, beginning of year | $ | 41.08 | | $ | 52.68 | | $ | 55.04 | | $ | 43.79 | | $ | 44.82 | |
| Income from investment operationsa: | | | | | | | | | | | | | | | |
| Net investment incomeb | | 0.31 | | | 0.30 | | | 0.60 | c | | 0.79 | d | | 0.58 | |
| Net realized and unrealized gains (losses) | | 1.20 | | | (4.00 | ) | | 3.12 | | | 13.40 | | | 3.69 | |
| Total from investment operations | | 1.51 | | | (3.70 | ) | | 3.72 | | | 14.19 | | | 4.27 | |
| Less distributions from: | | | | | | | | | | | | | | | |
| Net investment income | | (0.37 | ) | | (0.31 | ) | | (0.78 | ) | | (0.78 | ) | | (0.38 | ) |
| Net realized gains | | (5.77 | ) | | (7.59 | ) | | (5.30 | ) | | (2.16 | ) | | (4.92 | ) |
| Total distributions | | (6.14 | ) | | (7.90 | ) | | (6.08 | ) | | (2.94 | ) | | (5.30 | ) |
| Net asset value, end of year. | $ | 36.45 | | $ | 41.08 | | $ | 52.68 | | $ | 55.04 | | $ | 43.79 | |
| |
| Total return | | 4.69 | % | | (7.51 | )% | | 7.23 | % | | 34.39 | % | | 11.34 | % |
| |
| Ratios to average net assets | | | | | | | | | | | | | | | |
| Expenses before waiver and payments by affiliates | | 0.69 | % | | 0.70 | % | | 0.65 | % | | 0.66 | % | | 0.74 | % |
| Expenses net of waiver and payments by affiliates | | 0.66 | %e | | 0.69 | % | | 0.64 | %e | | 0.66 | % | | 0.74 | % |
| Net investment income | | 0.87 | % | | 0.70 | % | | 1.14 | %c | | 1.59 | %d | | 1.41 | % |
| |
| Supplemental data | | | | | | | | | | | | | | | |
| Net assets, end of year (000’s) | $ | 75,573 | | $ | 69,330 | | $ | 115,254 | | $ | 107,925 | | $ | 115,694 | |
| Portfolio turnover rate | | 30.25 | % | | 26.31 | % | | 25.08 | % | | 11.54 | % | | 7.91 | %f |
aThe amount shown for a share outstanding throughout the period may not correlate with the Statement of Operations for the period due to the timing of sales and
repurchases of the Fund’s shares in relation to income earned and/or fluctuating fair value of the investments of the Fund.
bBased on average daily shares outstanding.
cNet investment income per share includes approximately $0.15 per share related to income received in the form of special dividends in connection with certain Fund
holdings. Excluding this amount, the ratio of net investment income to average net assets would have been 0.86%.
dNet investment income per share includes approximately $0.15 per share related to income received in the form of special dividends in connection with certain Fund
holdings. Excluding this amount, the ratio of net investment income to average net assets would have been 1.27%.
eBenefit of expense reduction rounds to less than 0.01%.
fExcludes the value of portfolio securities delivered as a result of a redemption in-kind.
36 Annual Report | The accompanying notes are an integral part of these financial statements.
franklintempleton.com
FRANKLIN VALUE INVESTORS TRUST
| | | |
| Statement of Investments, October 31, 2016 | | | |
| Franklin Balance Sheet Investment Fund | | | |
| | Shares | | Value |
| |
| Common Stocks 82.2% | | | |
| Automobiles & Components 1.0% | | | |
| General Motors Co | 300,300 | $ | 9,489,480 |
| Banks 11.2% | | | |
| Citigroup Inc | 294,400 | | 14,469,760 |
| Citizens Financial Group Inc | 880,000 | | 23,179,200 |
| Comerica Inc | 323,800 | | 16,866,742 |
| Farmers & Merchants Bank of Long Beach | 1,475 | | 9,218,750 |
| JPMorgan Chase & Co | 343,000 | | 23,756,180 |
| PNC Financial Services Group Inc | 105,100 | | 10,047,560 |
| Regions Financial Corp | 750,400 | | 8,036,784 |
| | | | 105,574,976 |
| Capital Goods 6.7% | | | |
| a Aerovironment Inc | 171,771 | | 4,120,786 |
| Astec Industries Inc | 81,600 | | 4,517,376 |
| a Chart Industries Inc | 147,500 | | 4,091,650 |
| Cubic Corp | 70,000 | | 2,989,000 |
| Encore Wire Corp | 136,200 | | 4,651,230 |
| Granite Construction Inc | 58,500 | | 2,875,860 |
| Mueller Industries Inc | 396,000 | | 11,994,840 |
| Regal Beloit Corp | 173,000 | | 10,224,300 |
| Terex Corp | 320,300 | | 7,648,764 |
| a WESCO International Inc | 187,700 | | 10,173,340 |
| | | | 63,287,146 |
| Commercial & Professional Services 3.3% | | | |
| a Acco Brands Corp | 609,680 | | 6,767,448 |
| a FTI Consulting Inc | 121,300 | | 4,725,848 |
| Heidrick & Struggles International Inc | 585,100 | | 10,824,350 |
| Kelly Services Inc., A | 127,400 | | 2,386,202 |
| Tetra Tech Inc | 155,000 | | 5,959,750 |
| | | | 30,663,598 |
| Consumer Durables & Apparel 2.1% | | | |
| M.D.C. Holdings Inc | 252,500 | | 5,986,775 |
| a Toll Brothers Inc | 500,800 | | 13,741,952 |
| | | | 19,728,727 |
| Consumer Services 1.6% | | | |
| Vail Resorts Inc | 94,500 | | 15,067,080 |
| Diversified Financials 2.2% | | | |
| Capital One Financial Corp | 55,800 | | 4,131,432 |
| Morgan Stanley | 479,900 | | 16,110,243 |
| | | | 20,241,675 |
| Energy 14.1% | | | |
| a Arch Coal Inc | 127,000 | | 9,319,260 |
| Chevron Corp | 116,400 | | 12,192,900 |
| a Cloud Peak Energy Inc | 2,254,600 | | 13,888,336 |
| Devon Energy Corp | 379,500 | | 14,379,255 |
| Helmerich & Payne Inc | 71,700 | | 4,524,987 |
| a McDermott International Inc | 2,505,200 | | 12,876,728 |
| Occidental Petroleum Corp | 199,500 | | 14,545,545 |
| QEP Resources Inc | 703,300 | | 11,302,031 |
| Rowan Cos. PLC | 963,800 | | 12,789,626 |
franklintempleton.com
Annual Report
37
FRANKLIN VALUE INVESTORS TRUST
STATEMENT OF INVESTMENTS
| | | |
| Franklin Balance Sheet Investment Fund (continued) | | | |
| | Shares | | Value |
| |
| Common Stocks (continued) | | | |
| Energy (continued) | | | |
| Royal Dutch Shell PLC, A, ADR (United Kingdom) | 322,600 | $ | 16,068,706 |
| Superior Energy Services Inc | 414,900 | | 5,874,984 |
| Tenaris SA (Italy) | 370,600 | | 5,239,444 |
| | | | 133,001,802 |
| Food, Beverage & Tobacco 4.3% | | | |
| Archer-Daniels-Midland Co | 405,400 | | 17,663,278 |
| Bunge Ltd | 253,800 | | 15,738,138 |
| GrainCorp Ltd. (Australia) | 459,436 | | 2,936,706 |
| Sanderson Farms Inc | 50,000 | | 4,499,000 |
| | | | 40,837,122 |
| Health Care Equipment & Services 0.9% | | | |
| Invacare Corp | 202,500 | | 1,852,875 |
| National Healthcare Corp | 105,000 | | 6,793,500 |
| | | | 8,646,375 |
| Life & Health Insurance 4.4% | | | |
| MetLife Inc | 327,800 | | 15,393,488 |
| National Western Life Group Inc., A | 51,500 | | 11,093,100 |
| Prudential Financial Inc | 178,200 | | 15,109,578 |
| | | | 41,596,166 |
| Materials 5.0% | | | |
| Albemarle Corp | 62,000 | | 5,180,100 |
| Alcoa Inc | 89,043 | | 2,557,315 |
| APERAM (Luxembourg) | 147,000 | | 6,679,272 |
| a Century Aluminum Co | 939,700 | | 6,869,207 |
| Domtar Corp | 220,000 | | 7,909,000 |
| a Intrepid Potash Inc | 454,000 | | 472,160 |
| Materion Corp | 149,000 | | 4,514,700 |
| The Mosaic Co | 212,200 | | 4,993,066 |
| Reliance Steel & Aluminum Co | 113,600 | | 7,813,408 |
| | | | 46,988,228 |
| Media 2.8% | | | |
| News Corp., B | 857,000 | | 10,626,800 |
| Scholastic Corp | 187,100 | | 7,156,575 |
| Time Inc | 654,100 | | 8,503,300 |
| | | | 26,286,675 |
| Multi-line Insurance 0.3% | | | |
| American International Group Inc | 41,000 | | 2,529,700 |
| Pharmaceuticals, Biotechnology & Life Sciences 2.2% | | | |
| a Bio-Rad Laboratories Inc., A | 131,428 | | 20,776,138 |
| Property & Casualty Insurance 3.2% | | | |
| Chubb Ltd | 105,332 | | 13,377,164 |
| Selective Insurance Group Inc | 132,600 | | 4,899,570 |
| The Travelers Cos. Inc | 105,000 | | 11,358,900 |
| | | | 29,635,634 |
| Real Estate 1.4% | | | |
| a,b Trinity Place Holdings Inc | 1,342,554 | | 12,969,072 |
38 Annual Report
franklintempleton.com
FRANKLIN VALUE INVESTORS TRUST
STATEMENT OF INVESTMENTS
| | | | |
| Franklin Balance Sheet Investment Fund (continued) | | | | |
| | Shares | | Value | |
| |
| Common Stocks (continued) | | | | |
| Retailing 0.7% | | | | |
| Abercrombie & Fitch Co., A | 308,300 | $ | 4,504,263 | |
| Haverty Furniture Cos. Inc | 131,300 | | 2,330,575 | |
| | | | 6,834,838 | |
| Semiconductors & Semiconductor Equipment 4.8% | | | | |
| Brooks Automation Inc | 568,400 | | 7,406,252 | |
| a First Solar Inc | 102,100 | | 4,134,029 | |
| MKS Instruments Inc | 419,000 | | 21,138,550 | |
| a Photronics Inc | 1,317,400 | | 12,778,780 | |
| | | | 45,457,611 | |
| Technology Hardware & Equipment 5.0% | | | | |
| Corning Inc | 1,658,400 | | 37,662,264 | |
| a Fabrinet (Thailand) | 56,700 | | 2,152,332 | |
| a Rogers Corp | 129,200 | | 7,032,356 | |
| | | | 46,846,952 | |
| Telecommunication Services 1.5% | | | | |
| a Iridium Communications Inc | 771,883 | | 6,290,846 | |
| a ORBCOMM Inc | 820,700 | | 7,328,851 | |
| | | | 13,619,697 | |
| Utilities 3.5% | | | | |
| Eversource Energy | 136,000 | | 7,488,160 | |
| Great Plains Energy Inc | 253,000 | | 7,195,320 | |
| IDACORP Inc | 134,000 | | 10,504,260 | |
| PNM Resources Inc | 249,000 | | 8,179,650 | |
| | | | 33,367,390 | |
| Total Common Stocks (Cost $620,303,312) | | | 773,446,082 | |
| |
| Convertible Preferred Stocks (Cost $4,719,389) 0.6% | | | | |
| Telecommunication Services 0.6% | | | | |
| Iridium Communications Inc., 6.75%, cvt., pfd., B | 20,000 | | 6,110,000 | |
| Total Investments before Short Term Investments (Cost $625,022,701) | | | 779,556,082 | |
| |
| Short Term Investments (Cost $164,192,937) 17.4% | | | | |
| Money Market Funds 17.4% | | | | |
| a,c Institutional Fiduciary Trust Money Market Portfolio | 164,192,937 | | 164,192,937 | |
| Total Investments (Cost $789,215,638) 100.2% | | | 943,749,019 | |
| Other Assets, less Liabilities (0.2)% | | | (2,303,077 | ) |
| Net Assets 100.0% | | $ | 941,445,942 | |
See Abbreviations on page 88.
aNon-income producing.
bSee Note 7 regarding holdings of 5% voting securities.
cSee Note 3(f) regarding investments in affiliated management investment companies.
franklintempleton.com
The accompanying notes are an integral part of these financial statements. | Annual Report 39
FRANKLIN VALUE INVESTORS TRUST
| | | | | | | | | | | | | | | |
| Financial Highlights | | | | | | | | | | | | | | | |
| Franklin MicroCap Value Fund | | | | | | | | | | | | | | | |
| | | | | | Year Ended October 31, | | | | |
| | | 2016 | | | 2015 | | | 2014 | | | 2013 | | | 2012 | |
| Class A | | | | | | | | | | | | | | | |
| Per share operating performance | | | | | | | | | | | | | | | |
| (for a share outstanding throughout the year) | | | | | | | | | | | | | | | |
| Net asset value, beginning of year | $ | 32.90 | | $ | 39.88 | | $ | 40.99 | | $ | 32.60 | | $ | 32.38 | |
| Income from investment operationsa: | | | | | | | | | | | | | | | |
| Net investment income (loss)b | | 0.11 | c | | —d | | | (0.07 | )e | | 0.10 | f | | 0.30 | g |
| Net realized and unrealized gains (losses) | | 2.22 | | | (3.33 | ) | | 1.44 | | | 10.25 | | | 3.77 | |
| Total from investment operations | | 2.33 | | | (3.33 | ) | | 1.37 | | | 10.35 | | | 4.07 | |
| Less distributions from: | | | | | | | | | | | | | | | |
| Net investment income | | — | | | — | | | (0.04 | ) | | (0.52 | ) | | (0.02 | ) |
| Net realized gains | | (3.90 | ) | | (3.65 | ) | | (2.44 | ) | | (1.44 | ) | | (3.83 | ) |
| Total distributions | | (3.90 | ) | | (3.65 | ) | | (2.48 | ) | | (1.96 | ) | | (3.85 | ) |
| Net asset value, end of year. | $ | 31.33 | | $ | 32.90 | | $ | 39.88 | | $ | 40.99 | | $ | 32.60 | |
| |
| Total returnh | | 8.25 | % | | (8.58 | )% | | 3.39 | % | | 33.64 | % | | 14.70 | % |
| |
| Ratios to average net assets | | | | | | | | | | | | | | | |
| Expenses before waiver and payments by affiliates | | 1.19 | % | | 1.20 | % | | 1.16 | % | | 1.15 | % | | 1.16 | % |
| Expenses net of waiver and payments by affiliates | | 1.18 | %i | | 1.19 | % | | 1.14 | %i | | 1.15 | % | | 1.16 | % |
| Net investment income (loss) | | 0.36 | %c | | 0.02 | % | | (0.17 | )%e | | 0.36 | %f | | 1.01 | %g |
| |
| Supplemental data | | | | | | | | | | | | | | | |
| Net assets, end of year (000’s) | $ | 232,964 | | $ | 258,143 | | $ | 346,820 | | $ | 370,763 | | $ | 202,636 | |
| Portfolio turnover rate | | 11.72 | % | | 8.64 | % | | 11.63 | % | | 11.31 | % | | 5.03 | % |
aThe amount shown for a share outstanding throughout the period may not correlate with the Statement of Operations for the period due to the timing of sales and
repurchases of the Fund’s shares in relation to income earned and/or fluctuating fair value of the investments of the Fund.
bBased on average daily shares outstanding.
cNet investment income per share includes approximately $0.07 per share related to income received in the form of special dividends in connection with certain Fund
holdings. Excluding this amount, the ratio of net investment income to average net assets would have been 0.13%.
dAmount rounds to less than $0.01 per share.
eNet investment income per share includes approximately $0.06 per share related to income received in the form of special dividends in connection with certain Fund
holdings. Excluding this amount, the ratio of net investment income to average net assets would have been (0.31)%.
fNet investment income per share includes approximately $0.17 per share related to income received in the form of special dividends in connection with certain Fund
holdings. Excluding this amount, the ratio of net investment income to average net assets would have been (0.10)%.
gNet investment income per share includes approximately $0.23 per share related to income received in the form of special dividends in connection with certain Fund
holdings. Excluding this amount, the ratio of net investment income to average net assets would have been 0.25%.
hTotal return does not reflect sales commissions or contingent deferred sales charges, if applicable.
iBenefit of expense reduction rounds to less than 0.01%.
40 Annual Report | The accompanying notes are an integral part of these financial statements.
franklintempleton.com
FRANKLIN VALUE INVESTORS TRUST
FINANCIAL HIGHLIGHTS
| | | | | | | | | | | | |
| Franklin MicroCap Value Fund (continued) | | | | | | | | | | | | |
| | | | | | Year Ended October 31, | | | | |
| | | 2016 | | | 2015 | | | 2014 | | | 2013 | a |
| Class R6 | | | | | | | | | | | | |
| Per share operating performance | | | | | | | | | | | | |
| (for a share outstanding throughout the year) | | | | | | | | | | | | |
| Net asset value, beginning of year | $ | 33.09 | | $ | 39.94 | | $ | 41.03 | | $ | 34.43 | |
| Income from investment operationsb: | | | | | | | | | | | | |
| Net investment incomec | | 0.22 | d | | 0.14 | | | 0.03 | e | | 0.04 | |
| Net realized and unrealized gains (losses) | | 2.25 | | | (3.34 | ) | | 1.50 | | | 6.56 | |
| Total from investment operations | | 2.47 | | | (3.20 | ) | | 1.53 | | | 6.60 | |
| Less distributions from: | | | | | | | | | | | | |
| Net investment income. | | — | | | — | | | (0.18 | ) | | — | |
| Net realized gains | | (3.90 | ) | | (3.65 | ) | | (2.44 | ) | | — | |
| Total distributions | | (3.90 | ) | | (3.65 | ) | | (2.62 | ) | | — | |
| Net asset value, end of year | $ | 31.66 | | $ | 33.09 | | $ | 39.94 | | $ | 41.03 | |
| |
| Total returnf | | 8.67 | % | | (8.21 | )% | | 3.79 | % | | 19.17 | % |
| |
| Ratios to average net assetsg | | | | | | | | | | | | |
| Expenses before waiver and payments by affiliates | | 0.81 | % | | 0.81 | % | | 0.79 | % | | 0.79 | % |
| Expenses net of waiver and payments by affiliates | | 0.80 | %h | | 0.80 | % | | 0.77 | %h | | 0.79 | % |
| Net investment income | | 0.74 | %d | | 0.41 | % | | 0.20 | %e | | 0.19 | % |
| |
| Supplemental data | | | | | | | | | | | | |
| Net assets, end of year (000’s) | $ | 18,288 | | $ | 18,031 | | $ | 25,020 | | $ | 59,597 | |
| Portfolio turnover rate | | 11.72 | % | | 8.64 | % | | 11.63 | % | | 11.31 | % |
aFor the period May 1, 2013 (effective date) to October 31, 2013.
bThe amount shown for a share outstanding throughout the period may not correlate with the Statement of Operations for the period due to the timing of sales and
repurchases of the Fund’s shares in relation to income earned and/or fluctuating fair value of the investments of the Fund.
cBased on average daily shares outstanding.
dNet investment income per share includes approximately $0.07 per share related to income received in the form of special dividends in connection with certain Fund
holdings. Excluding this amount, the ratio of net investment income to average net assets would have been 0.51%.
eNet investment income per share includes approximately $0.06 per share related to income received in the form of special dividends in connection with certain Fund
holdings. Excluding this amount, the ratio of net investment income to average net assets would have been 0.06%.
fTotal return is not annualized for periods less than one year.
gRatios are annualized for periods less than one year.
hBenefit of expense reduction rounds to less than 0.01%.
franklintempleton.com
The accompanying notes are an integral part of these financial statements. | Annual Report 41
FRANKLIN VALUE INVESTORS TRUST
FINANCIAL HIGHLIGHTS
| | | | | | | | | | | | | | | |
| Franklin MicroCap Value Fund (continued) | | | | | | | | | | | | | | | |
| | | | | | Year Ended October 31, | | | | |
| | | 2016 | | | 2015 | | | 2014 | | | 2013 | | | 2012 | |
| Advisor Class | | | | | | | | | | | | | | | |
| Per share operating performance | | | | | | | | | | | | | | | |
| (for a share outstanding throughout the year) | | | | | | | | | | | | | | | |
| Net asset value, beginning of year | $ | 33.00 | | $ | 39.90 | | $ | 40.99 | | $ | 32.61 | | $ | 32.41 | |
| Income from investment operationsa: | | | | | | | | | | | | | | | |
| Net investment incomeb | | 0.18 | c | | 0.09 | | | 0.04 | d | | 0.31 | e | | 0.39 | f |
| Net realized and unrealized gains (losses) | | 2.24 | | | (3.34 | ) | | 1.43 | | | 10.11 | | | 3.74 | |
| Total from investment operations | | 2.42 | | | (3.25 | ) | | 1.47 | | | 10.42 | | | 4.13 | |
| Less distributions from: | | | | | | | | | | | | | | | |
| Net investment income | | — | | | — | | | (0.12 | ) | | (0.60 | ) | | (0.10 | ) |
| Net realized gains | | (3.90 | ) | | (3.65 | ) | | (2.44 | ) | | (1.44 | ) | | (3.83 | ) |
| Total distributions | | (3.90 | ) | | (3.65 | ) | | (2.56 | ) | | (2.04 | ) | | (3.93 | ) |
| Net asset value, end of year. | $ | 31.52 | | $ | 33.00 | | $ | 39.90 | | $ | 40.99 | | $ | 32.61 | |
| |
| Total return | | 8.53 | % | | (8.36 | )% | | 3.64 | % | | 33.93 | % | | 14.97 | % |
| |
| Ratios to average net assets | | | | | | | | | | | | | | | |
| Expenses before waiver and payments by affiliates | | 0.95 | % | | 0.96 | % | | 0.92 | % | | 0.91 | % | | 0.92 | % |
| Expenses net of waiver and payments by affiliates | | 0.94 | %g | | 0.95 | % | | 0.90 | %g | | 0.91 | % | | 0.92 | % |
| Net investment income | | 0.60 | %c | | 0.26 | % | | 0.07 | %d | | 0.60 | %e | | 1.25 | %f |
| |
| Supplemental data | | | | | | | | | | | | | | | |
| Net assets, end of year (000’s) | $ | 63,410 | | $ | 67,538 | | $ | 89,880 | | $ | 116,292 | | $ | 165,296 | |
| Portfolio turnover rate | | 11.72 | % | | 8.64 | % | | 11.63 | % | | 11.31 | % | | 5.03 | % |
aThe amount shown for a share outstanding throughout the period may not correlate with the Statement of Operations for the period due to the timing of sales and
repurchases of the Fund’s shares in relation to income earned and/or fluctuating fair value of the investments of the Fund.
bBased on average daily shares outstanding.
cNet investment income per share includes approximately $0.07 per share related to income received in the form of special dividends in connection with certain Fund
holdings. Excluding this amount, the ratio of net investment income to average net assets would have been 0.37%.
dNet investment income per share includes approximately $0.06 per share related to income received in the form of special dividends in connection with certain Fund
holdings. Excluding this amount, the ratio of net investment income to average net assets would have been (0.07)%.
eNet investment income per share includes approximately $0.17 per share related to income received in the form of special dividends in connection with certain Fund
holdings. Excluding this amount, the ratio of net investment income to average net assets would have been 0.14%.
fNet investment income per share includes approximately $0.23 per share related to income received in the form of special dividends in connection with certain Fund
holdings. Excluding this amount, the ratio of net investment income to average net assets would have been 0.49%.
gBenefit of expense reduction rounds to less than 0.01%.
42 Annual Report | The accompanying notes are an integral part of these financial statements.
franklintempleton.com
FRANKLIN VALUE INVESTORS TRUST
Statement of Investments, October 31, 2016
Franklin MicroCap Value Fund
| | | |
| | Shares | | Value |
| |
| Common Stocks 97.1% | | | |
| Aerospace & Defense 3.0% | | | |
| a Ducommun Inc | 260,000 | $ | 4,950,400 |
| a Sparton Corp | 193,000 | | 4,618,490 |
| | | | 9,568,890 |
| Automobiles & Components 2.1% | | | |
| Spartan Motors Inc | 775,900 | | 6,633,945 |
| Banks 12.4% | | | |
| Bar Harbor Bankshares | 214,500 | | 7,797,075 |
| Citizens Community Bancorp Inc | 90,000 | | 976,500 |
| County Bancorp Inc | 50,000 | | 985,000 |
| First Defiance Financial Corp | 155,000 | | 6,119,400 |
| First Internet Bancorp | 51,000 | | 1,338,750 |
| Investar Holding Corp | 220,000 | | 3,575,000 |
| b Northeast Bancorp | 459,500 | | 5,146,400 |
| Old Line Bancshares Inc | 94,145 | | 1,853,244 |
| Peoples Financial Services Corp | 87,543 | | 3,487,713 |
| Southern Missouri Bancorp Inc | 118,000 | | 2,901,620 |
| WSFS Financial Corp | 140,000 | | 4,907,000 |
| | | | 39,087,702 |
| Building Products 5.1% | | | |
| a Armstrong Flooring Inc | 160,000 | | 2,590,400 |
| Burnham Holdings Inc., A | 219,000 | | 3,602,550 |
| a,b Continental Materials Corp | 116,914 | | 2,566,262 |
| a Gibraltar Industries Inc | 189,000 | | 7,352,100 |
| | | | 16,111,312 |
| Commercial & Professional Services 3.3% | | | |
| Ecology and Environment Inc., A | 122,900 | | 1,204,420 |
| Healthcare Services Group Inc | 248,000 | | 9,168,560 |
| | | | 10,372,980 |
| Construction & Engineering 4.7% | | | |
| a Northwest Pipe Co | 287,600 | | 3,770,436 |
| a Orion Group Holdings Inc | 460,000 | | 3,716,800 |
| a Sterling Construction Co | 1,000,000 | | 7,280,000 |
| | | | 14,767,236 |
| Consumer Durables & Apparel 3.7% | | | |
| a,b Delta Apparel Inc | 455,100 | | 7,509,150 |
| Flexsteel Industries Inc | 57,500 | | 2,409,250 |
| Rocky Brands Inc | 170,600 | | 1,825,420 |
| | | | 11,743,820 |
| Consumer Services 1.5% | | | |
| a,b Full House Resorts Inc | 1,945,304 | | 3,170,846 |
| Golden Entertainment Inc | 129,800 | | 1,487,508 |
| | | | 4,658,354 |
| Diversified Financials 1.0% | | | |
| KCAP Financial Inc | 764,988 | | 3,228,249 |
| Electrical Equipment 1.6% | | | |
| a Broadwind Energy Inc | 100,000 | | 435,000 |
| a,b Global Power Equipment Group Inc | 1,275,000 | | 4,717,500 |
| | | | 5,152,500 |
franklintempleton.com
Annual Report
43
FRANKLIN VALUE INVESTORS TRUST
STATEMENT OF INVESTMENTS
| | | |
| Franklin MicroCap Value Fund (continued) | | | |
| | Shares | | Value |
| |
| Common Stocks (continued) | | | |
| Energy 9.8% | | | |
| Adams Resources & Energy Inc | 2,000 | $ | 73,080 |
| Aegean Marine Petroleum Network Inc. (Greece) | 343,300 | | 2,952,380 |
| Ardmore Shipping Corp. (Ireland) | 465,000 | | 2,720,250 |
| a Cloud Peak Energy Inc | 480,000 | | 2,956,800 |
| Gulf Island Fabrication Inc | 192,400 | | 1,924,000 |
| a Natural Gas Services Group Inc | 200,000 | | 4,340,000 |
| a Pacific Ethanol Inc | 130,000 | | 968,500 |
| a Parker Drilling Co | 900,000 | | 1,800,000 |
| a PHI Inc | 17,600 | | 265,760 |
| a PHI Inc., non-voting | 391,000 | | 6,091,780 |
| a Renewable Energy Group Inc | 323,100 | | 2,827,125 |
| Tesco Corp | 555,200 | | 3,803,120 |
| | | | 30,722,795 |
| Food & Staples Retailing 2.2% | | | |
| Village Super Market Inc., A | 227,000 | | 6,787,300 |
| Food, Beverage & Tobacco 7.4% | | | |
| John B. Sanfilippo & Son Inc | 71,300 | | 3,613,484 |
| a Omega Protein Corp | 300,000 | | 6,690,000 |
| a Seneca Foods Corp., A | 303,000 | | 8,908,200 |
| a Seneca Foods Corp., B | 121,500 | | 4,009,500 |
| | | | 23,221,184 |
| Health Care Equipment & Services 0.5% | | | |
| Invacare Corp | 165,000 | | 1,509,750 |
| Insurance 4.6% | | | |
| a ACMAT Corp., A | 196,300 | | 4,451,102 |
| Baldwin & Lyons Inc., B | 276,801 | | 6,809,305 |
| a Global Indemnity PLC, A | 60,000 | | 1,802,400 |
| a Hallmark Financial Services Inc | 143,685 | | 1,488,577 |
| | | | 14,551,384 |
| Machinery 9.7% | | | |
| Alamo Group Inc | 107,500 | | 6,978,900 |
| b Hardinge Inc | 764,000 | | 7,410,800 |
| Hurco Cos. Inc | 309,000 | | 8,095,800 |
| a Key Technology Inc | 61,500 | | 634,065 |
| Miller Industries Inc | 340,000 | | 7,463,000 |
| | | | 30,582,565 |
| Materials 5.8% | | | |
| Friedman Industries Inc | 120,000 | | 613,200 |
| Mercer International Inc. (Canada) | 200,000 | | 1,580,000 |
| The Monarch Cement Co | 140,744 | | 5,418,644 |
| Olympic Steel Inc | 214,100 | | 4,943,569 |
| Schnitzer Steel Industries Inc., A | 100,000 | | 2,415,000 |
| a Universal Stainless & Alloy Products Inc | 301,000 | | 3,160,500 |
| | | | 18,130,913 |
| Real Estate 1.8% | | | |
| Arbor Realty Trust Inc | 220,000 | | 1,612,600 |
| a Bresler & Reiner Inc | 205,000 | | 92,250 |
| Griffin Industrial Realty Inc | 122,000 | | 3,800,300 |
44 Annual Report
franklintempleton.com
FRANKLIN VALUE INVESTORS TRUST
STATEMENT OF INVESTMENTS
| | | |
| Franklin MicroCap Value Fund (continued) | | | |
| | Shares | | Value |
| |
| Common Stocks (continued) | | | |
| Real Estate (continued) | | | |
| a,b Origen Financial Inc | 1,900,000 | $ | 247,475 |
| | | | 5,752,625 |
| Retailing 5.0% | | | |
| Caleres Inc | 200,000 | | 5,002,000 |
| Fred’s Inc | 260,000 | | 2,373,800 |
| Haverty Furniture Cos. Inc | 175,400 | | 3,113,350 |
| Shoe Carnival Inc | 200,000 | | 5,074,000 |
| | | | 15,563,150 |
| Semiconductors & Semiconductor Equipment 1.5% | | | |
| a AXT Inc | 52,881 | | 272,337 |
| a Photronics Inc | 452,000 | | 4,384,400 |
| | | | 4,656,737 |
| Technology Hardware & Equipment 2.3% | | | |
| a Key Tronic Corp | 430,000 | | 3,319,600 |
| a Kimball Electronics Inc | 100,725 | | 1,400,077 |
| a Perceptron Inc | 17,414 | | 107,706 |
| Richardson Electronics Ltd | 375,000 | | 2,343,750 |
| | | | 7,171,133 |
| Telecommunication Services 4.6% | | | |
| a Alaska Communications Systems Group Inc | 1,150,000 | | 1,863,000 |
| ATN International Inc | 66,000 | | 4,464,240 |
| a Hawaiian Telcom Holdco Inc | 225,000 | | 4,617,000 |
| North State Telecommunications Corp., B | 21,757 | | 1,218,392 |
| a ORBCOMM Inc | 250,000 | | 2,232,500 |
| | | | 14,395,132 |
| Trading Companies & Distributors 1.1% | | | |
| Central Steel and Wire Co | 6,000 | | 2,595,000 |
| Houston Wire & Cable Co | 185,000 | | 989,750 |
| | | | 3,584,750 |
| Transportation 1.5% | | | |
| Celadon Group Inc | 200,000 | | 1,300,000 |
| Global Ship Lease Inc., A (United Kingdom) | 700,000 | | 917,000 |
| Providence and Worcester Railroad Co | 99,890 | | 2,496,251 |
| | | | 4,713,251 |
| Utilities 0.9% | | | |
| Gas Natural Inc | 227,000 | | 2,803,450 |
| Total Common Stocks (Cost $215,226,714) | | | 305,471,107 |
franklintempleton.com
Annual Report
45
FRANKLIN VALUE INVESTORS TRUST
STATEMENT OF INVESTMENTS
| | | |
| Franklin MicroCap Value Fund (continued) | | | |
| | Shares | | Value |
| Short Term Investments (Cost $8,048,646) 2.5% | | | |
| Money Market Funds 2.5% | | | |
| a,c Institutional Fiduciary Trust Money Market Portfolio | 8,048,646 | $ | 8,048,646 |
| Total Investments (Cost $223,275,360) 99.6% | | | 313,519,753 |
| Other Assets, less Liabilities 0.4% | | | 1,142,782 |
| Net Assets 100.0% | | $ | 314,662,535 |
aNon-income producing.
bSee Note 7 regarding holdings of 5% voting securities.
cSee Note 3(f) regarding investments in affiliated management investment companies.
46 Annual Report | The accompanying notes are an integral part of these financial statements.
franklintempleton.com
FRANKLIN VALUE INVESTORS TRUST
| | | | | | | | | | | | | | | |
| Financial Highlights | | | | | | | | | | | | | | | |
| Franklin MidCap Value Fund | | | | | | | | | | | | | | | |
| | | | | | Year Ended October 31, | | | | |
| | | 2016 | | | 2015 | | | 2014 | | | 2013 | | | 2012 | |
| Class A | | | | | | | | | | | | | | | |
| Per share operating performance | | | | | | | | | | | | | | | |
| (for a share outstanding throughout the year) | | | | | | | | | | | | | | | |
| Net asset value, beginning of year | $ | 15.22 | | $ | 16.13 | | $ | 14.76 | | $ | 11.38 | | $ | 10.39 | |
| Income from investment operationsa: | | | | | | | | | | | | | | | |
| Net investment incomeb | | 0.12 | c | | 0.11 | | | 0.08 | d | | 0.11 | e | | 0.08 | |
| Net realized and unrealized gains (losses) | | 0.48 | | | (0.60 | ) | | 1.37 | | | 3.43 | | | 0.96 | |
| Total from investment operations | | 0.60 | | | (0.49 | ) | | 1.45 | | | 3.54 | | | 1.04 | |
| Less distributions from: | | | | | | | | | | | | | | | |
| Net investment income | | (0.07 | ) | | (0.11 | ) | | (0.08 | ) | | (0.16 | ) | | (0.05 | ) |
| Net realized gains | | (1.22 | ) | | (0.31 | ) | | — | | | — | | | — | |
| Total distributions | | (1.29 | ) | | (0.42 | ) | | (0.08 | ) | | (0.16 | ) | | (0.05 | ) |
| Net asset value, end of year. | $ | 14.53 | | $ | 15.22 | | $ | 16.13 | | $ | 14.76 | | $ | 11.38 | |
| |
| Total returnf | | 4.61 | % | | (3.07 | )% | | 9.91 | % | | 31.47 | % | | 10.04 | % |
| |
| Ratios to average net assets | | | | | | | | | | | | | | | |
| Expenses before waiver and payments by affiliates | | 1.54 | % | | 1.60 | % | | 1.56 | % | | 1.64 | % | | 1.70 | % |
| Expenses net of waiver and payments by affiliates | | 1.30 | % | | 1.34 | % | | 1.35 | %g | | 1.35 | % | | 1.35 | % |
| Net investment income | | 0.87 | %c | | 0.72 | % | | 0.50 | %d | | 0.83 | %e | | 0.78 | % |
| |
| Supplemental data | | | | | | | | | | | | | | | |
| Net assets, end of year (000’s) | $ | 128,906 | | $ | 127,043 | | $ | 128,483 | | $ | 102,866 | | $ | 64,265 | |
| Portfolio turnover rate | | 86.55 | % | | 61.80 | % | | 24.44 | % | | 10.00 | % | | 22.29 | % |
aThe amount shown for a share outstanding throughout the period may not correlate with the Statement of Operations for the period due to the timing of sales and
repurchases of the Fund’s shares in relation to income earned and/or fluctuating fair value of the investments of the Fund.
bBased on average daily shares outstanding.
cNet investment income per share includes approximately $0.05 per share related to income received in the form of special dividends in connection with certain Fund
holdings. Excluding this amount, the ratio of net investment income to average net assets would have been 0.49%.
dNet investment income per share includes approximately $0.02 per share related to income received in the form of special dividends in connection with certain Fund
holdings. Excluding this amount, the ratio of net investment income to average net assets would have been 0.38%.
eNet investment income per share includes approximately $0.03 per share related to income received in the form of special dividends in connection with certain Fund
holdings. Excluding this amount, the ratio of net investment income to average net assets would have been 0.61%.
fTotal return does not reflect sales commissions or contingent deferred sales charges, if applicable.
gBenefit of expense reduction rounds to less than 0.01%.
franklintempleton.com
The accompanying notes are an integral part of these financial statements. | Annual Report 47
FRANKLIN VALUE INVESTORS TRUST
FINANCIAL HIGHLIGHTS
| | | | | | | | | | | | | | | |
| Franklin MidCap Value Fund (continued) | | | | | | | | | | | | | | | |
| | | | | | Year Ended October 31, | | | | | | | |
| | | 2016 | | | 2015 | | | 2014 | | | 2013 | | | 2012 | |
| Class C | | | | | | | | | | | | | | | |
| Per share operating performance | | | | | | | | | | | | | | | |
| (for a share outstanding throughout the year) | | | | | | | | | | | | | | | |
| Net asset value, beginning of year | $ | 14.97 | | $ | 15.87 | | $ | 14.55 | | $ | 11.21 | | $ | 10.25 | |
| Income from investment operationsa: | | | | | | | | | | | | | | | |
| Net investment income (loss)b | | 0.02 | c | | —d | | | (0.03 | )e | | 0.02 | f | | 0.01 | |
| Net realized and unrealized gains (losses) | | 0.47 | | | (0.59 | ) | | 1.36 | | | 3.39 | | | 0.95 | |
| Total from investment operations | | 0.49 | | | (0.59 | ) | | 1.33 | | | 3.41 | | | 0.96 | |
| Less distributions from: | | | | | | | | | | | | | | | |
| Net investment income | | — | | | — | | | (0.01 | ) | | (0.07 | ) | | — | |
| Net realized gains | | (1.22 | ) | | (0.31 | ) | | — | | | — | | | — | |
| Total distributions | | (1.22 | ) | | (0.31 | ) | | (0.01 | ) | | (0.07 | ) | | — | |
| Net asset value, end of year. | $ | 14.24 | | $ | 14.97 | | $ | 15.87 | | $ | 14.55 | | $ | 11.21 | |
| |
| Total returng | | 3.88 | % | | (3.75 | )% | | 9.12 | % | | 30.56 | % | | 9.37 | % |
| |
| Ratios to average net assets | | | | | | | | | | | | | | | |
| Expenses before waiver and payments by affiliates | | 2.28 | % | | 2.31 | % | | 2.26 | % | | 2.34 | % | | 2.39 | % |
| Expenses net of waiver and payments by affiliates | | 2.04 | % | | 2.05 | % | | 2.05 | %h | | 2.05 | % | | 2.04 | % |
| Net investment income (loss) | | 0.13 | %c | | 0.01 | % | | (0.20 | )%e | | 0.13 | %f | | 0.09 | % |
| |
| Supplemental data | | | | | | | | | | | | | | | |
| Net assets, end of year (000’s) | $ | 23,197 | | $ | 23,329 | | $ | 23,926 | | $ | 21,965 | | $ | 12,175 | |
| Portfolio turnover rate | | 86.55 | % | | 61.80 | % | | 24.44 | % | | 10.00 | % | | 22.29 | % |
aThe amount shown for a share outstanding throughout the period may not correlate with the Statement of Operations for the period due to the timing of sales and
repurchases of the Fund’s shares in relation to income earned and/or fluctuating fair value of the investments of the Fund.
bBased on average daily shares outstanding.
cNet investment income per share includes approximately $0.05 per share related to income received in the form of special dividends in connection with certain Fund
holdings. Excluding this amount, the ratio of net investment income to average net assets would have been (0.25)%.
dAmount rounds to less than $0.01 per share.
eNet investment income per share includes approximately $0.02 per share related to income received in the form of special dividends in connection with certain Fund
holdings. Excluding this amount, the ratio of net investment income to average net assets would have been (0.32)%.
fNet investment income per share includes approximately $0.03 per share related to income received in the form of special dividends in connection with certain Fund
holdings. Excluding this amount, the ratio of net investment income to average net assets would have been (0.09)%.
gTotal return does not reflect sales commissions or contingent deferred sales charges, if applicable.
hBenefit of expense reduction rounds to less than 0.01%.
48 Annual Report | The accompanying notes are an integral part of these financial statements.
franklintempleton.com
FRANKLIN VALUE INVESTORS TRUST
FINANCIAL HIGHLIGHTS
| | | | | | | | | | | | | | | |
| Franklin MidCap Value Fund (continued) | | | | | | | | | | | | | | | |
| | | | | | Year Ended October 31, | | | | | | | |
| | | 2016 | | | 2015 | | | 2014 | | | 2013 | | | 2012 | |
| Class R | | | | | | | | | | | | | | | |
| Per share operating performance | | | | | | | | | | | | | | | |
| (for a share outstanding throughout the year) | | | | | | | | | | | | | | | |
| Net asset value, beginning of year | $ | 15.19 | | $ | 16.09 | | $ | 14.71 | | $ | 11.35 | | $ | 10.36 | |
| Income from investment operationsa: | | | | | | | | | | | | | | | |
| Net investment incomeb | | 0.09 | c | | 0.08 | | | 0.05 | d | | 0.08 | e | | 0.06 | |
| Net realized and unrealized gains (losses) | | 0.48 | | | (0.61 | ) | | 1.38 | | | 3.42 | | | 0.95 | |
| Total from investment operations | | 0.57 | | | (0.53 | ) | | 1.43 | | | 3.50 | | | 1.01 | |
| Less distributions from: | | | | | | | | | | | | | | | |
| Net investment income | | (0.01 | ) | | (0.06 | ) | | (0.05 | ) | | (0.14 | ) | | (0.02 | ) |
| Net realized gains | | (1.22 | ) | | (0.31 | ) | | — | | | — | | | — | |
| Total distributions | | (1.23 | ) | | (0.37 | ) | | (0.05 | ) | | (0.14 | ) | | (0.02 | ) |
| Net asset value, end of year. | $ | 14.53 | | $ | 15.19 | | $ | 16.09 | | $ | 14.71 | | $ | 11.35 | |
| |
| Total return | | 4.40 | % | | (3.30 | )% | | 9.75 | % | | 31.22 | % | | 9.77 | % |
| |
| Ratios to average net assets | | | | | | | | | | | | | | | |
| Expenses before waiver and payments by affiliates | | 1.79 | % | | 1.81 | % | | 1.76 | % | | 1.84 | % | | 1.90 | % |
| Expenses net of waiver and payments by affiliates | | 1.55 | % | | 1.55 | % | | 1.55 | %f | | 1.55 | % | | 1.55 | % |
| Net investment income | | 0.62 | %c | | 0.51 | % | | 0.30 | %d | | 0.63 | %e | | 0.58 | % |
| |
| Supplemental data | | | | | | | | | | | | | | | |
| Net assets, end of year (000’s) | $ | 712 | | $ | 755 | | $ | 1,103 | | $ | 1,000 | | $ | 485 | |
| Portfolio turnover rate | | 86.55 | % | | 61.80 | % | | 24.44 | % | | 10.00 | % | | 22.29 | % |
aThe amount shown for a share outstanding throughout the period may not correlate with the Statement of Operations for the period due to the timing of sales and
repurchases of the Fund’s shares in relation to income earned and/or fluctuating fair value of the investments of the Fund.
bBased on average daily shares outstanding.
cNet investment income per share includes approximately $0.05 per share related to income received in the form of special dividends in connection with certain Fund
holdings. Excluding this amount, the ratio of net investment income to average net assets would have been 0.24%.
dNet investment income per share includes approximately $0.02 per share related to income received in the form of special dividends in connection with certain Fund
holdings. Excluding this amount, the ratio of net investment income to average net assets would have been 0.18%.
eNet investment income per share includes approximately $0.03 per share related to income received in the form of special dividends in connection with certain Fund
holdings. Excluding this amount, the ratio of net investment income to average net assets would have been 0.41%.
fBenefit of expense reduction rounds to less than 0.01%.
franklintempleton.com
The accompanying notes are an integral part of these financial statements. | Annual Report 49
FRANKLIN VALUE INVESTORS TRUST
FINANCIAL HIGHLIGHTS
| | | | | | | | | | | | | | | |
| Franklin MidCap Value Fund (continued) | | | | | | | | | | | | | | | |
| | | | | | Year Ended October 31, | | | | | | | |
| | | 2016 | | | 2015 | | | 2014 | | | 2013 | | | 2012 | |
| Advisor Class | | | | | | | | | | | | | | | |
| Per share operating performance | | | | | | | | | | | | | | | |
| (for a share outstanding throughout the year) | | | | | | | | | | | | | | | |
| Net asset value, beginning of year | $ | 15.31 | | $ | 16.23 | | $ | 14.84 | | $ | 11.44 | | $ | 10.45 | |
| Income from investment operationsa: | | | | | | | | | | | | | | | |
| Net investment incomeb | | 0.16 | c | | 0.16 | | | 0.13 | d | | 0.15 | e | | 0.12 | |
| Net realized and unrealized gains (losses) | | 0.47 | | | (0.62 | ) | | 1.38 | | | 3.45 | | | 0.95 | |
| Total from investment operations | | 0.63 | | | (0.46 | ) | | 1.51 | | | 3.60 | | | 1.07 | |
| Less distributions from: | | | | | | | | | | | | | | | |
| Net investment income | | (0.11 | ) | | (0.15 | ) | | (0.12 | ) | | (0.20 | ) | | (0.08 | ) |
| Net realized gains | | (1.22 | ) | | (0.31 | ) | | — | | | — | | | — | |
| Total distributions | | (1.33 | ) | | (0.46 | ) | | (0.12 | ) | | (0.20 | ) | | (0.08 | ) |
| Net asset value, end of year. | $ | 14.61 | | $ | 15.31 | | $ | 16.23 | | $ | 14.84 | | $ | 11.44 | |
| |
| Total return | | 4.93 | % | | (2.83 | )% | | 10.25 | % | | 31.94 | % | | 10.35 | % |
| |
| Ratios to average net assets | | | | | | | | | | | | | | | |
| Expenses before waiver and payments by affiliates | | 1.29 | % | | 1.31 | % | | 1.26 | % | | 1.34 | % | | 1.40 | % |
| Expenses net of waiver and payments by affiliates | | 1.05 | % | | 1.05 | % | | 1.05 | %f | | 1.05 | % | | 1.05 | % |
| Net investment income | | 1.12 | %c | | 1.01 | % | | 0.80 | %d | | 1.13 | %e | | 1.08 | % |
| |
| Supplemental data | | | | | | | | | | | | | | | |
| Net assets, end of year (000’s) | $ | 5,980 | | $ | 4,706 | | $ | 4,369 | | $ | 3,596 | | $ | 2,507 | |
| Portfolio turnover rate | | 86.55 | % | | 61.80 | % | | 24.44 | % | | 10.00 | % | | 22.29 | % |
aThe amount shown for a share outstanding throughout the period may not correlate with the Statement of Operations for the period due to the timing of sales and
repurchases of the Fund’s shares in relation to income earned and/or fluctuating fair value of the investments of the Fund.
bBased on average daily shares outstanding.
cNet investment income per share includes approximately $0.05 per share related to income received in the form of special dividends in connection with certain Fund
holdings. Excluding this amount, the ratio of net investment income to average net assets would have been 0.74%.
dNet investment income per share includes approximately $0.02 per share related to income received in the form of special dividends in connection with certain Fund
holdings. Excluding this amount, the ratio of net investment income to average net assets would have been 0.68%.
eNet investment income per share includes approximately $0.03 per share related to income received in the form of special dividends in connection with certain Fund
holdings. Excluding this amount, the ratio of net investment income to average net assets would have been 0.91%.
fBenefit of expense reduction rounds to less than 0.01%.
50 Annual Report | The accompanying notes are an integral part of these financial statements.
franklintempleton.com
FRANKLIN VALUE INVESTORS TRUST
| | | |
| Statement of Investments, October 31, 2016 | | | |
| Franklin MidCap Value Fund | | | |
| | Shares | | Value |
| |
| Common Stocks 97.5% | | | |
| Automobiles & Components 0.6% | | | |
| Harley-Davidson Inc | 17,200 | $ | 980,744 |
| Banks 4.9% | | | |
| Citizens Financial Group Inc | 28,700 | | 755,958 |
| Comerica Inc | 13,700 | | 713,633 |
| First Horizon National Corp | 157,900 | | 2,433,239 |
| First Republic Bank/CA | 9,700 | | 721,971 |
| KeyCorp | 50,100 | | 707,412 |
| Regions Financial Corp | 67,900 | | 727,209 |
| SunTrust Banks Inc | 37,100 | | 1,678,033 |
| | | | 7,737,455 |
| Capital Goods 6.6% | | | |
| BWX Technologies Inc | 29,100 | | 1,141,302 |
| Carlisle Cos. Inc | 13,400 | | 1,404,990 |
| Johnson Controls International PLC | 20,100 | | 810,432 |
| L-3 Communications Holdings Inc | 9,300 | | 1,273,542 |
| Parker-Hannifin Corp | 6,400 | | 785,600 |
| Pentair PLC (United Kingdom) | 13,800 | | 760,794 |
| Roper Technologies Inc | 5,000 | | 866,550 |
| a WABCO Holdings Inc | 11,200 | | 1,102,752 |
| Xylem Inc | 48,000 | | 2,319,840 |
| | | | 10,465,802 |
| Commercial & Professional Services 0.5% | | | |
| Robert Half International Inc | 20,300 | | 759,626 |
| Consumer Durables & Apparel 4.1% | | | |
| CalAtlantic Group Inc | 38,200 | | 1,234,624 |
| a Michael Kors Holdings Ltd | 25,800 | | 1,310,124 |
| PVH Corp | 5,000 | | 534,900 |
| Ralph Lauren Corp | 5,000 | | 490,500 |
| a Toll Brothers Inc | 109,700 | | 3,010,168 |
| | | | 6,580,316 |
| Diversified Financials 4.6% | | | |
| a E*TRADE Financial Corp | 17,100 | | 481,536 |
| Invesco Ltd | 51,200 | | 1,438,208 |
| Northern Trust Corp | 12,100 | | 876,282 |
| Raymond James Financial Inc | 11,400 | | 685,368 |
| a SLM Corp | 98,000 | | 690,900 |
| Synchrony Financial | 74,500 | | 2,129,955 |
| T. Rowe Price Group Inc | 16,300 | | 1,043,363 |
| | | | 7,345,612 |
| Energy 8.6% | | | |
| Baker Hughes Inc | 14,000 | | 775,600 |
| Cabot Oil & Gas Corp., A | 100 | | 2,088 |
| a Cheniere Energy Inc | 100 | | 3,770 |
| Cimarex Energy Co | 9,100 | | 1,175,083 |
| a Concho Resources Inc | 9,200 | | 1,167,848 |
| Devon Energy Corp | 12,100 | | 458,469 |
| a Diamondback Energy Inc | 9,300 | | 848,997 |
| EQT Corp | 16,800 | | 1,108,800 |
| a FMC Technologies Inc | 29,800 | | 961,646 |
franklintempleton.com
Annual Report
51
FRANKLIN VALUE INVESTORS TRUST
STATEMENT OF INVESTMENTS
| | | |
| Franklin MidCap Value Fund (continued) | | | |
| | Shares | | Value |
| |
| Common Stocks (continued) | | | |
| Energy (continued) | | | |
| Helmerich & Payne Inc | 25,100 | $ | 1,584,061 |
| Marathon Petroleum Corp | 56,400 | | 2,458,476 |
| Noble Energy Inc | 49,900 | | 1,720,053 |
| Pioneer Natural Resources Co | 8,000 | | 1,432,160 |
| | | | 13,697,051 |
| Food & Staples Retailing 0.5% | | | |
| a United Natural Foods Inc | 20,000 | | 834,800 |
| Food, Beverage & Tobacco 7.7% | | | |
| Ingredion Inc | 7,000 | | 918,190 |
| The J. M. Smucker Co | 17,000 | | 2,232,270 |
| Pilgrim’s Pride Corp | 18,100 | | 395,304 |
| Pinnacle Foods Inc | 94,600 | | 4,864,332 |
| a TreeHouse Foods Inc | 36,300 | | 3,175,524 |
| Tyson Foods Inc | 9,500 | | 673,075 |
| | | | 12,258,695 |
| Health Care Equipment & Services 4.9% | | | |
| a AmSurg Corp | 29,800 | | 1,780,550 |
| a Hologic Inc | 70,000 | | 2,520,700 |
| a Laboratory Corp. of America Holdings | 6,698 | | 839,528 |
| a Premier Inc., A | 35,000 | | 1,114,400 |
| Zimmer Biomet Holdings Inc | 13,800 | | 1,454,520 |
| | | | 7,709,698 |
| Insurance 6.3% | | | |
| Arthur J. Gallagher & Co | 17,200 | | 829,556 |
| The Hartford Financial Services Group Inc | 26,900 | | 1,186,559 |
| Principal Financial Group Inc | 19,300 | | 1,053,780 |
| The Progressive Corp | 36,400 | | 1,146,964 |
| RenaissanceRe Holdings Ltd | 10,300 | | 1,280,187 |
| W. R. Berkley Corp | 21,200 | | 1,210,520 |
| Willis Towers Watson PLC | 6,200 | | 780,580 |
| XL Group Ltd. (Ireland) | 70,800 | | 2,456,760 |
| | | | 9,944,906 |
| Materials 8.5% | | | |
| Albemarle Corp | 7,400 | | 618,270 |
| Domtar Corp | 20,800 | | 747,760 |
| Ferroglobe PLC | 271,500 | | 2,511,375 |
| a Freeport-McMoRan Inc., B | 76,800 | | 858,624 |
| a Ingevity Corp | 65,209 | | 2,699,652 |
| Martin Marietta Materials Inc | 6,000 | | 1,112,280 |
| The Mosaic Co | 100 | | 2,353 |
| Newmont Mining Corp | 24,900 | | 922,296 |
| Nucor Corp | 15,300 | | 747,405 |
| Tahoe Resources Inc | 82,800 | | 998,568 |
| Teck Resources Ltd., B (Canada) | 34,700 | | 748,826 |
| WestRock Co | 34,956 | | 1,614,618 |
| | | | 13,582,027 |
52 Annual Report
franklintempleton.com
FRANKLIN VALUE INVESTORS TRUST
STATEMENT OF INVESTMENTS
| | | |
| Franklin MidCap Value Fund (continued) | | | |
| | Shares | | Value |
| |
| Common Stocks (continued) | | | |
| Media 1.1% | | | |
| John Wiley & Sons Inc., A | 14,500 | $ | 748,200 |
| TEGNA Inc | 51,200 | | 1,004,544 |
| | | | 1,752,744 |
| Pharmaceuticals, Biotechnology & Life Sciences 2.5% | | | |
| Agilent Technologies Inc | 34,100 | | 1,485,737 |
| a Endo International PLC | 20,300 | | 380,625 |
| a Horizon Pharma PLC | 29,900 | | 499,928 |
| a Jazz Pharmaceuticals PLC | 4,600 | | 503,562 |
| a Mallinckrodt PLC | 5,500 | | 325,930 |
| Perrigo Co. PLC | 8,600 | | 715,434 |
| | | | 3,911,216 |
| Real Estate 12.2% | | | |
| Alexandria Real Estate Equities Inc | 15,200 | | 1,638,712 |
| Apartment Investment & Management Co., A | 21,500 | | 947,505 |
| Boston Properties Inc | 12,300 | | 1,481,904 |
| DDR Corp | 62,500 | | 955,625 |
| Duke Realty Corp | 53,000 | | 1,385,950 |
| General Growth Properties Inc | 46,600 | | 1,162,670 |
| Healthcare Realty Trust Inc | 30,400 | | 969,456 |
| Host Hotels & Resorts Inc | 35,800 | | 554,184 |
| Kilroy Realty Corp | 26,100 | | 1,874,763 |
| Liberty Property Trust | 23,900 | | 966,277 |
| Life Storage Inc | 13,300 | | 1,072,645 |
| Physicians Realty Trust | 94,100 | | 1,860,357 |
| Prologis Inc | 15,900 | | 829,344 |
| Realogy Holdings Corp | 33,000 | | 755,370 |
| UDR Inc | 23,200 | | 811,304 |
| Weingarten Realty Investors | 24,600 | | 890,766 |
| Weyerhaeuser Co | 39,700 | | 1,188,221 |
| | | | 19,345,053 |
| Retailing 0.0%† | | | |
| Big Lots Inc | 100 | | 4,340 |
| Semiconductors & Semiconductor Equipment 3.6% | | | |
| a First Solar Inc | 11,900 | | 481,831 |
| Lam Research Corp | 28,200 | | 2,731,452 |
| a Versum Materials Inc | 110,000 | | 2,497,000 |
| | | | 5,710,283 |
| Software & Services 4.9% | | | |
| a Autodesk Inc | 19,500 | | 1,409,460 |
| Leidos Holdings Inc | 18,125 | | 753,456 |
| a Mobileye NV (Israel) | 48,200 | | 1,792,076 |
| a PTC Inc | 42,700 | | 2,025,688 |
| Science Applications International Corp | 16,071 | | 1,107,453 |
| Total System Services Inc | 13,400 | | 668,392 |
| | | | 7,756,525 |
| Technology Hardware & Equipment 3.1% | | | |
| a Keysight Technologies Inc | 39,150 | | 1,284,120 |
| Western Digital Corp | 62,400 | | 3,646,656 |
| | | | 4,930,776 |
franklintempleton.com
Annual Report
53
FRANKLIN VALUE INVESTORS TRUST
STATEMENT OF INVESTMENTS
| | | | |
| Franklin MidCap Value Fund (continued) | | | | |
| | Shares | | Value | |
| |
| Common Stocks (continued) | | | | |
| Telecommunication Services 0.6% | | | | |
| a Level 3 Communications Inc | 16,500 | $ | 926,475 | |
| Transportation 0.7% | | | | |
| a JetBlue Airways Corp | 68,400 | | 1,195,632 | |
| Utilities 11.0% | | | | |
| American Water Works Co. Inc | 17,800 | | 1,317,912 | |
| Atmos Energy Corp | 23,200 | | 1,725,848 | |
| a,b Calpine Corp | 100 | | 1,190 | |
| CenterPoint Energy Inc | 65,200 | | 1,486,560 | |
| CMS Energy Corp | 40,500 | | 1,707,075 | |
| DTE Energy Co | 18,400 | | 1,766,584 | |
| Edison International | 22,500 | | 1,653,300 | |
| Eversource Energy | 30,100 | | 1,657,306 | |
| FirstEnergy Corp | 50,100 | | 1,717,929 | |
| PNM Resources Inc | 40,900 | | 1,343,565 | |
| Sempra Energy | 16,400 | | 1,756,440 | |
| UGI Corp | 27,400 | | 1,268,346 | |
| | | | 17,402,055 | |
| Total Common Stocks (Cost $136,178,407) | | | 154,831,831 | |
| |
| Management Investment Companies (Cost $6,785) 0.0%† | | | | |
| Diversified Financials 0.0%† | | | | |
| iShares Russell Mid-Cap Value ETF | 100 | | 7,492 | |
| Total Investments before Short Term Investments (Cost $136,185,192) | | | 154,839,323 | |
| |
| Short Term Investments (Cost $4,347,627) 2.7% | | | | |
| Money Market Funds 2.7% | | | | |
| a,c Institutional Fiduciary Trust Money Market Portfolio | 4,347,627 | | 4,347,627 | |
| Total Investments (Cost $140,532,819) 100.2% | | | 159,186,950 | |
| Other Assets, less Liabilities (0.2)% | | | (391,786 | ) |
| Net Assets 100.0% | | $ | 158,795,164 | |
See Abbreviations on page 88.
†Rounds to less than 0.1% of net assets.
aNon-income producing.
bAt October 31, 2016, pursuant to the Fund’s policies and the requirements of applicable securities law, the Fund is restricted from trading this security at year end.
cSee Note 3(f) regarding investments in affiliated management investment companies.
54 Annual Report | The accompanying notes are an integral part of these financial statements.
franklintempleton.com
FRANKLIN VALUE INVESTORS TRUST
| | | | | | | | | | | | | | | |
| Financial Highlights | | | | | | | | | | | | | | | |
| Franklin Small Cap Value Fund | | | | | | | | | | | | | | | |
| | | | | | Year Ended October 31, | | | | |
| | | 2016 | | | 2015 | | | 2014 | | | 2013 | | | 2012 | |
| Class A | | | | | | | | | | | | | | | |
| Per share operating performance | | | | | | | | | | | | | | | |
| (for a share outstanding throughout the year) | | | | | | | | | | | | | | | |
| Net asset value, beginning of year | $ | 51.72 | | $ | 58.96 | | $ | 59.76 | | $ | 45.12 | | $ | 42.25 | |
| Income from investment operationsa: | | | | | | | | | | | | | | | |
| Net investment incomeb | | 0.20 | | | 0.30 | c | | 0.16 | d | | 0.30 | e | | 0.34 | f |
| Net realized and unrealized gains (losses) | | 4.74 | | | (2.33 | ) | | 2.03 | | | 16.30 | | | 4.47 | |
| Total from investment operations | | 4.94 | | | (2.03 | ) | | 2.19 | | | 16.60 | | | 4.81 | |
| Less distributions from: | | | | | | | | | | | | | | | |
| Net investment income | | (0.29 | ) | | (0.12 | ) | | (0.25 | ) | | (0.49 | ) | | (0.17 | ) |
| Net realized gains | | (4.92 | ) | | (5.09 | ) | | (2.74 | ) | | (1.47 | ) | | (1.77 | ) |
| Total distributions | | (5.21 | ) | | (5.21 | ) | | (2.99 | ) | | (1.96 | ) | | (1.94 | ) |
| Net asset value, end of year. | $ | 51.45 | | $ | 51.72 | | $ | 58.96 | | $ | 59.76 | | $ | 45.12 | |
| |
| Total returng | | 11.15 | % | | (3.31 | )% | | 3.76 | % | | 38.15 | % | | 12.08 | % |
| |
| Ratios to average net assets | | | | | | | | | | | | | | | |
| Expenses before waiver and payments by affiliates | | 1.11 | % | | 1.16 | % | | 1.13 | % | | 1.19 | % | | 1.26 | % |
| Expenses net of waiver and payments by affiliates | | 1.09 | %h | | 1.15 | % | | 1.13 | %h,i | | 1.19 | % | | 1.26 | % |
| Net investment income | | 0.40 | % | | 0.56 | %c | | 0.27 | %d | | 0.57 | %e | | 0.79 | %f |
| |
| Supplemental data | | | | | | | | | | | | | | | |
| Net assets, end of year (000’s) | $ | 1,125,268 | | $ | 1,062,353 | | $ | 1,294,724 | | $ | 1,224,592 | | $ | 856,541 | |
| Portfolio turnover rate | | 41.89 | % | | 25.88 | % | | 21.30 | % | | 13.04 | % | | 5.18 | % |
aThe amount shown for a share outstanding throughout the period may not correlate with the Statement of Operations for the period due to the timing of sales and
repurchases of the Fund’s shares in relation to income earned and/or fluctuating fair value of the investments of the Fund.
bBased on average daily shares outstanding.
cNet investment income per share includes approximately $0.11 per share related to income received in the form of special dividends. in connection with certain Fund
holdings. Excluding this amount, the ratio of net investment income to average net assets would have been 0.36%.
dNet investment income per share includes approximately $0.04 per share related to income received in the form of special dividends in connection with certain Fund
holdings. Excluding this amount, the ratio of net investment income to average net assets would have been 0.21%.
eNet investment income per share includes approximately $0.10 per share related to income received in the form of special dividends in connection with certain Fund
holdings. Excluding this amount, the ratio of net investment income to average net assets would have been 0.38%.
fNet investment income per share includes approximately $0.14 per share related to income received in the form of special dividends in connection with certain Fund
holdings. Excluding this amount, the ratio of net investment income to average net assets would have been 0.48%.
gTotal return does not reflect sales commissions or contingent deferred sales charges, if applicable.
hBenefit of expense reduction rounds to less than 0.01%.
iBenefit of waiver and payments by affiliates rounds to less than 0.01%.
franklintempleton.com
The accompanying notes are an integral part of these financial statements. | Annual Report 55
FRANKLIN VALUE INVESTORS TRUST
FINANCIAL HIGHLIGHTS
| | | | | | | | | | | | | | | |
| Franklin Small Cap Value Fund (continued) | | | | | | | | | | | | | | | |
| | | | | | Year Ended October 31, | | | | |
| | | 2016 | | | 2015 | | | 2014 | | | 2013 | | | 2012 | |
| Class C | | | | | | | | | | | | | | | |
| Per share operating performance | | | | | | | | | | | | | | | |
| (for a share outstanding throughout the year) | | | | | | | | | | | | | | | |
| Net asset value, beginning of year | $ | 47.22 | | $ | 54.53 | | $ | 55.62 | | $ | 42.12 | | $ | 39.66 | |
| Income from investment operationsa: | | | | | | | | | | | | | | | |
| Net investment income (loss)b | | (0.14 | ) | | (0.07 | )c | | (0.24 | )d | | (0.05 | )e | | 0.04 | f |
| Net realized and unrealized gains (losses) | | 4.26 | | | (2.15 | ) | | 1.89 | | | 15.21 | | | 4.19 | |
| Total from investment operations | | 4.12 | | | (2.22 | ) | | 1.65 | | | 15.16 | | | 4.23 | |
| Less distributions from: | | | | | | | | | | | | | | | |
| Net investment income | | — | | | — | | | — | | | (0.19 | ) | | — | |
| Net realized gains | | (4.92 | ) | | (5.09 | ) | | (2.74 | ) | | (1.47 | ) | | (1.77 | ) |
| Total distributions | | (4.92 | ) | | (5.09 | ) | | (2.74 | ) | | (1.66 | ) | | (1.77 | ) |
| Net asset value, end of year. | $ | 46.42 | | $ | 47.22 | | $ | 54.53 | | $ | 55.62 | | $ | 42.12 | |
| |
| Total returng | | 10.35 | % | | (4.01 | )% | | 3.03 | % | | 37.23 | % | | 11.29 | % |
| |
| Ratios to average net assets | | | | | | | | | | | | | | | |
| Expenses before waiver and payments by affiliates | | 1.86 | % | | 1.87 | % | | 1.83 | % | | 1.89 | % | | 1.95 | % |
| Expenses net of waiver and payments by affiliates | | 1.84 | %h | | 1.86 | % | | 1.83 | %h,i | | 1.89 | % | | 1.95 | % |
| Net investment income (loss) | | (0.35 | )% | | (0.15 | )%c | | (0.43 | )%d | | (0.13 | )%e | | 0.10 | %f |
| |
| Supplemental data | | | | | | | | | | | | | | | |
| Net assets, end of year (000’s) | $ | 219,150 | | $ | 229,119 | | $ | 266,845 | | $ | 247,742 | | $ | 183,986 | |
| Portfolio turnover rate | | 41.89 | % | | 25.88 | % | | 21.30 | % | | 13.04 | % | | 5.18 | % |
aThe amount shown for a share outstanding throughout the period may not correlate with the Statement of Operations for the period due to the timing of sales and
repurchases of the Fund’s shares in relation to income earned and/or fluctuating fair value of the investments of the Fund.
bBased on average daily shares outstanding.
cNet investment income per share includes approximately $0.11 per share related to income received in the form of special dividends in connection with certain Fund
holdings. Excluding this amount, the ratio of net investment income to average net assets would have been (0.35)%.
dNet investment income per share includes approximately $0.04 per share related to income received in the form of special dividends in connection with certain Fund
holdings. Excluding this amount, the ratio of net investment income to average net assets would have been (0.49)%.
eNet investment income per share includes approximately $0.10 per share related to income received in the form of special dividends in connection with certain Fund
holdings. Excluding this amount, the ratio of net investment income to average net assets would have been (0.32)%.
fNet investment income per share includes approximately $0.14 per share related to income received in the form of special dividends in connection with certain Fund
holdings. Excluding this amount, the ratio of net investment income to average net assets would have been (0.21)%.
gTotal return does not reflect sales commissions or contingent deferred sales charges, if applicable.
hBenefit of expense reduction rounds to less than 0.01%.
iBenefit of waiver and payments by affiliates rounds to less than 0.01%.
56 Annual Report | The accompanying notes are an integral part of these financial statements.
franklintempleton.com
FRANKLIN VALUE INVESTORS TRUST
FINANCIAL HIGHLIGHTS
| | | | | | | | | | | | | | | |
| Franklin Small Cap Value Fund (continued) | | | | | | | | | | | | | | | |
| | | | | | Year Ended October 31, | | | | |
| | | 2016 | | | 2015 | | | 2014 | | | 2013 | | | 2012 | |
| Class R | | | | | | | | | | | | | | | |
| Per share operating performance | | | | | | | | | | | | | | | |
| (for a share outstanding throughout the year) | | | | | | | | | | | | | | | |
| Net asset value, beginning of year | $ | 51.18 | | $ | 58.40 | | $ | 59.21 | | $ | 44.71 | | $ | 41.88 | |
| Income from investment operationsa: | | | | | | | | | | | | | | | |
| Net investment incomeb | | 0.08 | | | 0.19 | c | | 0.04 | d | | 0.21 | e | | 0.26 | f |
| Net realized and unrealized gains (losses) | | 4.69 | | | (2.32 | ) | | 2.02 | | | 16.15 | | | 4.42 | |
| Total from investment operations | | 4.77 | | | (2.13 | ) | | 2.06 | | | 16.36 | | | 4.68 | |
| Less distributions from: | | | | | | | | | | | | | | | |
| Net investment income | | (0.16 | ) | | (—)g | | | (0.13 | ) | | (0.39 | ) | | (0.08 | ) |
| Net realized gains | | (4.92 | ) | | (5.09 | ) | | (2.74 | ) | | (1.47 | ) | | (1.77 | ) |
| Total distributions | | (5.08 | ) | | (5.09 | ) | | (2.87 | ) | | (1.86 | ) | | (1.85 | ) |
| Net asset value, end of year. | $ | 50.87 | | $ | 51.18 | | $ | 58.40 | | $ | 59.21 | | $ | 44.71 | |
| |
| Total return | | 10.90 | % | | (3.53 | )% | | 3.55 | % | | 37.91 | % | | 11.85 | % |
| |
| Ratios to average net assets | | | | | | | | | | | | | | | |
| Expenses before waiver and payments by affiliates | | 1.36 | % | | 1.37 | % | | 1.33 | % | | 1.39 | % | | 1.46 | % |
| Expenses net of waiver and payments by affiliates | | 1.34 | %h | | 1.36 | % | | 1.33 | %h,i | | 1.39 | % | | 1.46 | % |
| Net investment income | | 0.15 | % | | 0.35 | %c | | 0.07 | %d | | 0.37 | %e | | 0.59 | %f |
| |
| Supplemental data | | | | | | | | | | | | | | | |
| Net assets, end of year (000’s) | $ | 212,194 | | $ | 221,939 | | $ | 280,908 | | $ | 272,697 | | $ | 220,539 | |
| Portfolio turnover rate | | 41.89 | % | | 25.88 | % | | 21.30 | % | | 13.04 | % | | 5.18 | % |
aThe amount shown for a share outstanding throughout the period may not correlate with the Statement of Operations for the period due to the timing of sales and
repurchases of the Fund’s shares in relation to income earned and/or fluctuating fair value of the investments of the Fund.
bBased on average daily shares outstanding.
cNet investment income per share includes approximately $0.11 per share related to income received in the form of special dividends in connection with certain Fund
holdings. Excluding this amount, the ratio of net investment income to average net assets would have been 0.15%.
dNet investment income per share includes approximately $0.04 per share related to income received in the form of special dividends in connection with certain Fund
holdings. Excluding this amount, the ratio of net investment income to average net assets would have been 0.01%.
eNet investment income per share includes approximately $0.10 per share related to income received in the form of special dividends in connection with certain Fund
holdings. Excluding this amount, the ratio of net investment income to average net assets would have been 0.18%.
fNet investment income per share includes approximately $0.14 per share related to income received in the form of special dividends in connection with certain Fund
holdings. Excluding this amount, the ratio of net investment income to average net assets would have been 0.28%.
gAmount rounds to less than $0.01 per share.
hBenefit of expense reduction rounds to less than 0.01%.
iBenefit of waiver and payments by affiliates rounds to less than 0.01%.
franklintempleton.com
The accompanying notes are an integral part of these financial statements. | Annual Report 57
FRANKLIN VALUE INVESTORS TRUST
FINANCIAL HIGHLIGHTS
| | | | | | | | | | | | |
| Franklin Small Cap Value Fund (continued) | | | | | | | | | | | | |
| | | | | | Year Ended October 31, | | | | |
| | | 2016 | | | 2015 | | | 2014 | | | 2013 | a |
| Class R6 | | | | | | | | | | | | |
| Per share operating performance | | | | | | | | | | | | |
| (for a share outstanding throughout the year) | | | | | | | | | | | | |
| Net asset value, beginning of year | $ | 53.75 | | $ | 61.09 | | $ | 61.78 | | $ | 50.83 | |
| Income from investment operationsb: | | | | | | | | | | | | |
| Net investment incomec | | 0.43 | | | 0.62 | d | | 0.42 | e | | 0.19 | |
| Net realized and unrealized gains (losses) | | 4.93 | | | (2.43 | ) | | 2.16 | | | 10.76 | |
| Total from investment operations | | 5.36 | | | (1.81 | ) | | 2.58 | | | 10.95 | |
| Less distributions from: | | | | | | | | | | | | |
| Net investment income. | | (0.59 | ) | | (0.44 | ) | | (0.53 | ) | | — | |
| Net realized gains | | (4.92 | ) | | (5.09 | ) | | (2.74 | ) | | — | |
| Total distributions | | (5.51 | ) | | (5.53 | ) | | (3.27 | ) | | — | |
| Net asset value, end of year | $ | 53.60 | | $ | 53.75 | | $ | 61.09 | | $ | 61.78 | |
| |
| Total return | | 11.69 | % | | (2.80 | )% | | 4.31 | % | | 21.54 | % |
| |
| Ratios to average net assets | | | | | | | | | | | | |
| Expenses before waiver and payments by affiliates | | 0.64 | % | | 0.62 | % | | 0.60 | % | | 2.09 | % |
| Expenses net of waiver and payments by affiliates | | 0.62 | %f | | 0.61 | % | | 0.60 | %f,g | | 0.64 | % |
| Net investment income | | 0.87 | % | | 1.10 | %d | | 0.80 | %e | | 0.68 | % |
| |
| Supplemental data | | | | | | | | | | | | |
| Net assets, end of year (000’s) | $ | 100,101 | | $ | 59,339 | | $ | 34,278 | | $ | 17 | |
| Portfolio turnover rate | | 41.89 | % | | 25.88 | % | | 21.30 | % | | 13.04 | % |
aFor the period May 1, 2013 (effective date) to October 31, 2013.
bThe amount shown for a share outstanding throughout the period may not correlate with the Statement of Operations for the period due to the timing of sales and
repurchases of the Fund’s shares in relation to income earned and/or fluctuating fair value of the investments of the Fund.
cBased on average daily shares outstanding.
dNet investment income per share includes approximately $0.11 per share related to income received in the form of special dividends in connection with certain Fund
holdings. Excluding this amount, the ratio of net investment income to average net assets would have been 0.90%.
eNet investment income per share includes approximately $0.04 per share related to income received in the form of special dividends in connection with certain Fund
holdings. Excluding this amount, the ratio of net investment income to average net assets would have been 0.74%.
fBenefit of expense reduction rounds to less than 0.01%.
gBenefit of waiver and payments by affiliates rounds to less than 0.01%.
58 Annual Report | The accompanying notes are an integral part of these financial statements.
franklintempleton.com
FRANKLIN VALUE INVESTORS TRUST
FINANCIAL HIGHLIGHTS
| | | | | | | | | | | | | | | |
| Franklin Small Cap Value Fund (continued) | | | | | | | | | | | | | | | |
| | | | | | Year Ended October 31, | | | | |
| | | 2016 | | | 2015 | | | 2014 | | | 2013 | | | 2012 | |
| Advisor Class | | | | | | | | | | | | | | | |
| Per share operating performance | | | | | | | | | | | | | | | |
| (for a share outstanding throughout the year) | | | | | | | | | | | | | | | |
| Net asset value, beginning of year | $ | 53.67 | | $ | 61.01 | | $ | 61.72 | | $ | 46.54 | | $ | 43.53 | |
| Income from investment operationsa: | | | | | | | | | | | | | | | |
| Net investment incomeb | | 0.32 | | | 0.47 | c | | 0.34 | d | | 0.46 | e | | 0.48 | f |
| Net realized and unrealized gains (losses) | | 4.94 | | | (2.41 | ) | | 2.10 | | | 16.82 | | | 4.60 | |
| Total from investment operations | | 5.26 | | | (1.94 | ) | | 2.44 | | | 17.28 | | | 5.08 | |
| Less distributions from: | | | | | | | | | | | | | | | |
| Net investment income | | (0.43 | ) | | (0.31 | ) | | (0.41 | ) | | (0.63 | ) | | (0.30 | ) |
| Net realized gains | | (4.92 | ) | | (5.09 | ) | | (2.74 | ) | | (1.47 | ) | | (1.77 | ) |
| Total distributions | | (5.35 | ) | | (5.40 | ) | | (3.15 | ) | | (2.10 | ) | | (2.07 | ) |
| Net asset value, end of year. | $ | 53.58 | | $ | 53.67 | | $ | 61.01 | | $ | 61.72 | | $ | 46.54 | |
| |
| Total return | | 11.43 | % | | (3.03 | )% | | 4.07 | % | | 38.56 | % | | 12.42 | % |
| |
| Ratios to average net assets | | | | | | | | | | | | | | | |
| Expenses before waiver and payments by affiliates | | 0.86 | % | | 0.87 | % | | 0.83 | % | | 0.89 | % | | 0.96 | % |
| Expenses net of waiver and payments by affiliates | | 0.84 | %g | | 0.86 | % | | 0.83 | %g,h | | 0.89 | % | | 0.96 | % |
| Net investment income | | 0.65 | % | | 0.85 | %c | | 0.57 | %d | | 0.87 | %e | | 1.09 | %f |
| |
| Supplemental data | | | | | | | | | | | | | | | |
| Net assets, end of year (000’s) | $ | 893,324 | | $ | 635,499 | | $ | 816,430 | | $ | 653,660 | | $ | 419,840 | |
| Portfolio turnover rate | | 41.89 | % | | 25.88 | % | | 21.30 | % | | 13.04 | % | | 5.18 | % |
aThe amount shown for a share outstanding throughout the period may not correlate with the Statement of Operations for the period due to the timing of sales and
repurchases of the Fund’s shares in relation to income earned and/or fluctuating fair value of the investments of the Fund.
bBased on average daily shares outstanding.
cNet investment income per share includes approximately $0.11 per share related to income received in the form of special dividends in connection with certain Fund
holdings. Excluding this amount, the ratio of net investment income to average net assets would have been 0.65%.
dNet investment income per share includes approximately $0.04 per share related to income received in the form of special dividends in connection with certain Fund
holdings. Excluding this amount, the ratio of net investment income to average net assets would have been 0.51%.
eNet investment income per share includes approximately $0.10 per share related to income received in the form of special dividends in connection with certain Fund
holdings. Excluding this amount, the ratio of net investment income to average net assets would have been 0.68%.
fNet investment income per share includes approximately $0.14 per share related to income received in the form of special dividends in connection with certain Fund
holdings. Excluding this amount, the ratio of net investment income to average net assets would have been 0.78%.
gBenefit of expense reduction rounds to less than 0.01%.
hBenefit of waiver and payments by affiliates rounds to less than 0.01%.
franklintempleton.com
The accompanying notes are an integral part of these financial statements. | Annual Report 59
FRANKLIN VALUE INVESTORS TRUST
| | | |
| Statement of Investments, October 31, 2016 | | | |
| Franklin Small Cap Value Fund | | | |
| | Shares | | Value |
| |
| Common Stocks 87.6% | | | |
| Aerospace & Defense 4.3% | | | |
| a AAR Corp | 2,010,507 | $ | 64,678,010 |
| Cubic Corp | 501,100 | | 21,396,970 |
| b Esterline Technologies Corp | 312,800 | | 22,975,160 |
| | | | 109,050,140 |
| Automobiles & Components 3.0% | | | |
| Drew Industries Inc | 345,300 | | 30,921,615 |
| Gentex Corp | 726,100 | | 12,278,351 |
| Spartan Motors Inc | 5,000 | | 42,750 |
| Thor Industries Inc | 313,600 | | 24,871,616 |
| Winnebago Industries Inc | 272,000 | | 7,684,000 |
| | | | 75,798,332 |
| Banks 9.0% | | | |
| BNC Bancorp | 1,219,400 | | 30,363,060 |
| Chemical Financial Corp | 959,255 | | 41,200,002 |
| Columbia Banking System Inc | 1,139,900 | | 37,639,498 |
| EverBank Financial Corp | 1,291,400 | | 24,936,934 |
| First Horizon National Corp | 1,285,700 | | 19,812,637 |
| First of Long Island Corp | 305,300 | | 9,754,335 |
| German American Bancorp Inc | 107,900 | | 4,200,547 |
| Lakeland Financial Corp | 925,600 | | 34,099,104 |
| Peoples Bancorp Inc | 467,000 | | 11,567,590 |
| TrustCo Bank Corp. NY | 1,103,300 | | 7,723,100 |
| Washington Trust Bancorp Inc | 189,500 | | 8,698,050 |
| | | | 229,994,857 |
| Building Products 4.8% | | | |
| b Armstrong Flooring Inc | 903,700 | | 14,630,903 |
| b Gibraltar Industries Inc | 690,900 | | 26,876,010 |
| Griffon Corp | 693,600 | | 11,583,120 |
| Insteel Industries Inc | 225,500 | | 6,065,950 |
| Simpson Manufacturing Co. Inc | 951,000 | | 40,702,800 |
| Universal Forest Products Inc | 275,100 | | 23,655,849 |
| | | | 123,514,632 |
| Commercial & Professional Services 2.3% | | | |
| b Huron Consulting Group Inc | 299,600 | | 16,792,580 |
| McGrath RentCorp | 853,131 | | 25,679,243 |
| MSA Safety Inc | 264,500 | | 15,420,350 |
| | | | 57,892,173 |
| Construction & Engineering 3.0% | | | |
| Argan Inc | 64,100 | | 3,644,085 |
| EMCOR Group Inc | 620,100 | | 37,491,246 |
| Granite Construction Inc | 734,470 | | 36,106,545 |
| | | | 77,241,876 |
| Consumer Durables & Apparel 2.7% | | | |
| b BRP Inc. (Canada) | 1,503,700 | | 29,059,766 |
| Brunswick Corp | 82,300 | | 3,580,050 |
| Hooker Furniture Corp | 208,200 | | 5,475,660 |
| La-Z-Boy Inc | 541,100 | | 12,661,740 |
| b M/I Homes Inc | 799,500 | | 17,197,245 |
| | | | 67,974,461 |
60 Annual Report
franklintempleton.com
FRANKLIN VALUE INVESTORS TRUST
STATEMENT OF INVESTMENTS
| | | |
| Franklin Small Cap Value Fund (continued) | | | |
| | Shares | | Value |
| |
| Common Stocks (continued) | | | |
| Consumer Services 0.8% | | | |
| Brinker International Inc | 399,900 | $ | 19,691,076 |
| Electrical Equipment 1.5% | | | |
| Encore Wire Corp | 12,400 | | 423,460 |
| EnerSys | 479,500 | | 31,229,835 |
| Regal Beloit Corp | 111,300 | | 6,577,830 |
| | | | 38,231,125 |
| Energy 5.2% | | | |
| Energen Corp | 452,700 | | 22,693,851 |
| b Helix Energy Solutions Group Inc | 1,297,000 | | 11,309,840 |
| Hunting PLC (United Kingdom) | 4,254,519 | | 26,223,132 |
| b Natural Gas Services Group Inc | 254,700 | | 5,526,990 |
| b Oil States International Inc | 1,169,000 | | 34,193,250 |
| b PHI Inc | 40,000 | | 604,000 |
| b PHI Inc., non-voting | 71,200 | | 1,109,296 |
| b Unit Corp | 1,731,100 | | 29,653,743 |
| | | | 131,314,102 |
| Food, Beverage & Tobacco 5.5% | | | |
| AGT Food and Ingredients Inc. (Canada) | 507,800 | | 14,434,501 |
| Dairy Crest Group PLC (United Kingdom) | 2,118,486 | | 15,819,401 |
| GrainCorp Ltd. (Australia) | 717,046 | | 4,583,344 |
| a,b Landec Corp | 1,423,100 | | 18,856,075 |
| Maple Leaf Foods Inc. (Canada) | 3,125,800 | | 71,170,628 |
| b Omega Protein Corp | 690,100 | | 15,389,230 |
| | | | 140,253,179 |
| Health Care Equipment & Services 3.0% | | | |
| Hill-Rom Holdings Inc | 679,500 | | 37,651,095 |
| STERIS PLC | 592,400 | | 39,584,168 |
| | | | 77,235,263 |
| Industrial Conglomerates 1.6% | | | |
| Carlisle Cos. Inc | 385,300 | | 40,398,705 |
| Insurance 6.6% | | | |
| Arthur J. Gallagher & Co | 304,400 | | 14,681,212 |
| Aspen Insurance Holdings Ltd | 917,100 | | 44,250,075 |
| Endurance Specialty Holdings Ltd | 203,337 | | 18,696,837 |
| The Hanover Insurance Group Inc | 347,400 | | 26,468,406 |
| Old Republic International Corp | 1,448,500 | | 24,421,710 |
| Validus Holdings Ltd | 791,311 | | 40,435,992 |
| | | | 168,954,232 |
| Machinery 6.1% | | | |
| Astec Industries Inc | 916,500 | | 50,737,440 |
| Franklin Electric Co. Inc | 245,200 | | 8,937,540 |
| Hillenbrand Inc | 208,200 | | 6,318,870 |
| John Bean Technologies Corp | 18,000 | | 1,437,300 |
| c Lindsay Corp | 204,800 | | 16,035,840 |
| Miller Industries Inc | 55,400 | | 1,216,030 |
| Mueller Industries Inc | 915,000 | | 27,715,350 |
| Mueller Water Products Inc., A | 2,768,000 | | 34,101,760 |
| b Wabash National Corp | 900 | | 10,125 |
franklintempleton.com
Annual Report
61
FRANKLIN VALUE INVESTORS TRUST
STATEMENT OF INVESTMENTS
| | | |
| Franklin Small Cap Value Fund (continued) | | | |
| | Shares | | Value |
| |
| Common Stocks (continued) | | | |
| Machinery (continued) | | | |
| Watts Water Technologies Inc., A | 131,600 | $ | 7,896,000 |
| | | | 154,406,255 |
| Materials 6.9% | | | |
| AptarGroup Inc | 84,600 | | 6,043,824 |
| b Detour Gold Corp. (Canada) | 1,203,300 | | 22,931,530 |
| H.B. Fuller Co | 655,500 | | 27,576,885 |
| b Ingevity Corp | 407,500 | | 16,870,500 |
| Minerals Technologies Inc | 184,400 | | 12,391,680 |
| OceanaGold Corp. (Australia) | 5,573,600 | | 17,031,310 |
| A Schulman Inc | 231,776 | | 6,663,560 |
| Sensient Technologies Corp | 795,800 | | 59,295,058 |
| Stepan Co | 107,800 | | 7,657,034 |
| | | | 176,461,381 |
| Pharmaceuticals, Biotechnology & Life Sciences 2.1% | | | |
| Gerresheimer AG (Germany) | 711,900 | | 53,691,166 |
| Real Estate 4.4% | | | |
| Brandywine Realty Trust | 2,276,500 | | 35,285,750 |
| LTC Properties Inc | 1,254,531 | | 62,864,549 |
| Sunstone Hotel Investors Inc | 1,108,800 | | 13,926,528 |
| | | | 112,076,827 |
| Retailing 1.3% | | | |
| Caleres Inc | 646,900 | | 16,178,969 |
| The Cato Corp., A | 485,900 | | 14,416,653 |
| b Genesco Inc | 24,000 | | 1,291,200 |
| b West Marine Inc | 75,600 | | 604,800 |
| | | | 32,491,622 |
| Semiconductors & Semiconductor Equipment 3.6% | | | |
| Cohu Inc | 1,050,000 | | 11,749,500 |
| b Kulicke and Soffa Industries Inc. (Singapore) | 307,600 | | 4,072,624 |
| MKS Instruments Inc | 752,000 | | 37,938,400 |
| b Photronics Inc | 2,394,500 | | 23,226,650 |
| b Versum Materials Inc | 706,900 | | 16,046,630 |
| | | | 93,033,804 |
| Software & Services 1.3% | | | |
| Mentor Graphics Corp | 1,181,300 | | 34,139,570 |
| Technology Hardware & Equipment 1.3% | | | |
| b NetScout Systems Inc | 762,820 | | 20,939,409 |
| b Rogers Corp | 224,800 | | 12,235,864 |
| | | | 33,175,273 |
| Telecommunication Services 0.6% | | | |
| b ORBCOMM Inc | 1,728,300 | | 15,433,719 |
| Transportation 2.5% | | | |
| b SAIA Inc | 1,001,200 | | 35,692,780 |
| b Spirit Airlines Inc | 589,800 | | 28,269,114 |
| | | | 63,961,894 |
62 Annual Report
franklintempleton.com
FRANKLIN VALUE INVESTORS TRUST
STATEMENT OF INVESTMENTS
| | | | |
| Franklin Small Cap Value Fund (continued) | | | | |
| | | Shares | | Value |
| Common Stocks (continued) | | | | |
| Utilities 4.2% | | | | |
| Connecticut Water Service Inc | | 82,800 | $ | 4,311,396 |
| IDACORP Inc | | 681,520 | | 53,424,352 |
| Spire Inc | | 785,000 | | 49,298,000 |
| | | | | 107,033,748 |
| Total Common Stocks (Cost $1,755,074,895) | | | | 2,233,449,412 |
| |
| |
| | | Principal | | |
| | | Amount | | |
| Corporate Bonds (Cost $16,473,029) 0.6% | | | | |
| Energy 0.6% | | | | |
| Unit Corp., senior sub. note, 6.625%, 5/15/21 | $ | 17,386,000 | | 16,082,050 |
| Total Investments before Short Term Investments (Cost $1,771,547,924) | | | | 2,249,531,462 |
| |
| |
| | | Shares | | |
| Short Term Investments 11.1% | | | | |
| Money Market Funds (Cost $273,078,587) 10.7% | | | | |
| b,d Institutional Fiduciary Trust Money Market Portfolio | | 273,078,587 | | 273,078,587 |
| e Investments from Cash Collateral Received for Loaned Securities 0.4% | | | | |
| Money Market Funds (Cost $6,649,000) 0.3% | | | | |
| b,d Institutional Fiduciary Trust Money Market Portfolio | | 6,649,000 | | 6,649,000 |
| |
| |
| | | Principal | | |
| | | Amount | | |
| f Repurchase Agreement (Cost $1,663,412) 0.1% | | | | |
| Joint Repurchase Agreement, 0.32%, 11/10/16 (Maturity Value $1,663,427) | | | | |
| BNP Paribas Securities Corp. | | | | |
| Collateralized by gU.S. Treasury Bill, 12/22/16 - 3/02/17; U.S. Treasury Bond, 7.875% - 8.75%, | | | | |
| 5/15/17 - 2/15/21; U.S. Treasury Note, 0.875% - 3.625%, 5/15/17 - 9/30/21; hU.S. Treasury Note, | | | | |
| FRN, 0.414%, 4/30/17; and U.S. Treasury Strips, 2/15/17 - 8/15/21 (valued at $1,696,680) | $ | 1,663,412 | | 1,663,412 |
| Total Investments from Cash Collateral Received for Loaned Securities | | | | |
| (Cost $8,312,412) | | | | 8,312,412 |
| Total Investments (Cost $2,052,938,923) 99.3% | | | | 2,530,922,461 |
| Other Assets, less Liabilities 0.7% | | | | 19,114,287 |
| Net Assets 100.0% | | | $ | 2,550,036,748 |
franklintempleton.com
Annual Report
63
FRANKLIN VALUE INVESTORS TRUST
STATEMENT OF INVESTMENTS
Franklin Small Cap Value Fund (continued)
See Abbreviations on page 88.
aSee Note 7 regarding holdings of 5% voting securities.
bNon-income producing.
cA portion or all of the security is on loan at October 31, 2016. See Note 1(d).
dSee Note 3(f) regarding investments in affiliated management investment companies.
eSee Note 1(d) regarding securities on loan.
fSee Note 1(c) regarding joint repurchase agreement.
gThe security was issued on a discount basis with no stated coupon rate.
hThe coupon rate shown represents the rate at period end.
64 Annual Report | The accompanying notes are an integral part of these financial statements.
franklintempleton.com
FRANKLIN VALUE INVESTORS TRUST
| | | | | | |
| Financial Statements | | | | | | |
| |
| |
| Statements of Assets and Liabilities | | | | | | |
| October 31, 2016 | | | | | | |
| |
| | | Franklin Balance Sheet | | Franklin MicroCap | | Franklin MidCap |
| | | Investment Fund | | Value Fund | | Value Fund |
| Assets: | | | | | | |
| Investments in securities: | | | | | | |
| Cost - Unaffiliated issuers | $ | 614,721,079 | $ | 185,769,938 | $ | 136,185,192 |
| Cost - Non-controlled affiliates (Note 3f and 7) | | 174,494,559 | | 37,505,422 | | 4,347,627 |
| Total cost of investments | $ | 789,215,638 | $ | 223,275,360 | $ | 140,532,819 |
| Value - Unaffiliated issuers | $ | 766,587,010 | $ | 274,702,674 | $ | 154,839,323 |
| Value - Non-controlled affiliates (Note 3f and 7) | | 177,162,009 | | 38,817,079 | | 4,347,627 |
| Total value of investments | | 943,749,019 | | 313,519,753 | | 159,186,950 |
| Receivables: | | | | | | |
| Investment securities sold | | 6,039,591 | | 1,770,846 | | 3,391,682 |
| Capital shares sold | | 1,027,672 | | 95,863 | | 276,004 |
| Dividends and interest | | 386,080 | | 1,200 | | 49,366 |
| Due from custodian | | — | | 260,000 | | — |
| Other assets | | 196 | | 64 | | 31 |
| Total assets | | 951,202,558 | | 315,647,726 | | 162,904,033 |
| Liabilities: | | | | | | |
| Payables: | | | | | | |
| Investment securities purchased | | 6,661,384 | | 219,966 | | 3,340,474 |
| Capital shares redeemed | | 2,187,641 | | 409,139 | | 563,258 |
| Management fees | | 342,687 | | 204,298 | | 94,990 |
| Distribution fees | | 228,488 | | 50,056 | | 47,790 |
| Transfer agent fees | | 251,590 | | 73,522 | | 41,220 |
| Accrued expenses and other liabilities. | | 84,826 | | 28,210 | | 21,137 |
| Total liabilities | | 9,756,616 | | 985,191 | | 4,108,869 |
| Net assets, at value | $ | 941,445,942 | $ | 314,662,535 | $ | 158,795,164 |
| Net assets consist of: | | | | | | |
| Paid-in capital | $ | 724,609,389 | $ | 193,701,849 | $ | 137,806,427 |
| Undistributed net investment income | | 3,000,781 | | 1,020,893 | | 730,286 |
| Net unrealized appreciation (depreciation) | | 154,533,381 | | 90,244,393 | | 18,654,131 |
| Accumulated net realized gain (loss) | | 59,302,391 | | 29,695,400 | | 1,604,320 |
| Net assets, at value | $ | 941,445,942 | $ | 314,662,535 | $ | 158,795,164 |
franklintempleton.com
The accompanying notes are an integral part of these financial statements. | Annual Report 65
FRANKLIN VALUE INVESTORS TRUST
FINANCIAL STATEMENTS
| | | | | | | | |
| Statements of Assets and Liabilities (continued) | | | | | | | | |
| October 31, 2016 | | | | | | | | |
| |
| | | | Franklin Balance Sheet | | Franklin MicroCap | | | Franklin MidCap |
| | | | Investment Fund | | Value Fund | | | Value Fund |
| Class A: | | | | | | | | |
| Net assets, at value | $ | | 795,662,819 | $ | 232,963,883 | $ | | 128,905,886 |
| Shares outstanding. | | | 22,478,593 | | 7,435,810 | | | 8,869,290 |
| Net asset value per sharea | | $ | 35.40 | $ | 31.33 | | $ | 14.53 |
| Maximum offering price per share (net asset value per share ÷ | | | | | | | | |
| 94.25%) | | $ | 37.56 | $ | 33.24 | | $ | 15.42 |
| Class C: | | | | | | | | |
| Net assets, at value | $ | | 61,567,410 | | | $ | | 23,196,985 |
| Shares outstanding. | | | 1,810,251 | | | | | 1,629,459 |
| Net asset value and maximum offering price per sharea | | $ | 34.01 | | | | $ | 14.24 |
| Class R: | | | | | | | | |
| Net assets, at value | $ | | 8,485,689 | | | $ | | 712,219 |
| Shares outstanding. | | | 239,574 | | | | | 49,011 |
| Net asset value and maximum offering price per share | | $ | 35.42 | | | | $ | 14.53 |
| Class R6: | | | | | | | | |
| Net assets, at value | $ | | 157,109 | $ | 18,288,190 | | | |
| Shares outstanding. | | | 4,316 | | 577,652 | | | |
| Net asset value and maximum offering price per share | | $ | 36.40 | $ | 31.66 | | | |
| Advisor Class: | | | | | | | | |
| Net assets, at value | $ | | 75,572,915 | $ | 63,410,462 | $ | | 5,980,074 |
| Shares outstanding. | | | 2,073,179 | | 2,011,737 | | | 409,176 |
| Net asset value and maximum offering price per share | | $ | 36.45 | $ | 31.52 | | $ | 14.61 |
aRedemption price is equal to net asset value less contingent deferred sales charges, if applicable.
66 Annual Report | The accompanying notes are an integral part of these financial statements.
franklintempleton.com
FRANKLIN VALUE INVESTORS TRUST
FINANCIAL STATEMENTS
| | |
| Statements of Assets and Liabilities (continued) | | |
| October 31, 2016 | | |
| |
| | | Franklin Small Cap |
| | | Value Fund |
| Assets: | | |
| Investments in securities: | | |
| Cost - Unaffiliated issuers | $ | 1,712,010,572 |
| Cost - Non-controlled affiliates (Note 3f and 7) | | 339,264,939 |
| Cost - Repurchase agreements | | 1,663,412 |
| Total cost of investments | $ | 2,052,938,923 |
| Value - Unaffiliated issuers | $ | 2,165,997,377 |
| Value - Non-controlled affiliates (Note 3f and 7) | | 363,261,672 |
| Value - Repurchase agreements | | 1,663,412 |
| Total value of investments* | | 2,530,922,461 |
| Receivables: | | |
| Investment securities sold | | 40,948,695 |
| Capital shares sold | | 5,085,630 |
| Dividends and interest. | | 1,330,126 |
| Other assets | | 436 |
| Total assets | | 2,578,287,348 |
| Liabilities: | | |
| Payables: | | |
| Investment securities purchased | | 8,823,834 |
| Capital shares redeemed | | 8,326,959 |
| Management fees. | | 1,178,795 |
| Distribution fees | | 527,451 |
| Transfer agent fees | | 900,209 |
| Payable upon return of securities loaned | | 8,312,412 |
| Accrued expenses and other liabilities | | 180,940 |
| Total liabilities | | 28,250,600 |
| Net assets, at value | $ | 2,550,036,748 |
| Net assets consist of: | | |
| Paid-in capital | $ | 1,938,563,467 |
| Undistributed net investment income | | 5,140,223 |
| Net unrealized appreciation (depreciation) | | 477,979,676 |
| Accumulated net realized gain (loss) | | 128,353,382 |
| Net assets, at value | $ | 2,550,036,748 |
*Includessecuritiesloaned................................................................$ 8,135,370
franklintempleton.com
The accompanying notes are an integral part of these financial statements. | Annual Report 67
FRANKLIN VALUE INVESTORS TRUST
FINANCIAL STATEMENTS
| | | |
| Statements of Assets and Liabilities (continued) | | | |
| October 31, 2016 | | | |
| |
| | | | Franklin Small Cap |
| | | | Value Fund |
| Class A: | | | |
| Net assets, at value | $ | | 1,125,267,545 |
| Shares outstanding | | | 21,873,047 |
| Net asset value per sharea | | $ | 51.45 |
| Maximum offering price per share (net asset value per share ÷ 94.25%) | | $ | 54.59 |
| Class C: | | | |
| Net assets, at value | $ | | 219,150,210 |
| Shares outstanding | | | 4,721,219 |
| Net asset value and maximum offering price per sharea | | $ | 46.42 |
| Class R: | | | |
| Net assets, at value | $ | | 212,193,695 |
| Shares outstanding | | | 4,171,268 |
| Net asset value and maximum offering price per share | | $ | 50.87 |
| Class R6: | | | |
| Net assets, at value | $ | | 100,100,819 |
| Shares outstanding | | | 1,867,476 |
| Net asset value and maximum offering price per share | | $ | 53.60 |
| Advisor Class: | | | |
| Net assets, at value | $ | | 893,324,479 |
| Shares outstanding | | | 16,671,434 |
| Net asset value and maximum offering price per share | | $ | 53.58 |
aRedemption price is equal to net asset value less contingent deferred sales charges, if applicable.
68 Annual Report | The accompanying notes are an integral part of these financial statements.
franklintempleton.com
FRANKLIN VALUE INVESTORS TRUST
FINANCIAL STATEMENTS
| | | | | | | | | |
| Statements of Operations | | | | | | | | | |
| for the year ended October 31, 2016 | | | | | | | | | |
| |
| | | Franklin Balance Sheet | | | Franklin MicroCap | | | Franklin MidCap | |
| | | Investment Fund | | | Value Fund | | | Value Fund | |
| Investment income: | | | | | | | | | |
| Dividends: | | | | | | | | | |
| Unaffiliated issuers | $ | 14,911,246 | | $ | 4,732,886 | | $ | 3,330,864 | |
| Non-controlled affiliates (Note 3f and 7) | | — | | | 207,325 | | | — | |
| Income from securities loaned (net of fees and rebates) | | — | | | — | | | 4,087 | |
| Total investment income | | 14,911,246 | | | 4,940,211 | | | 3,334,951 | |
| Expenses: | | | | | | | | | |
| Management fees (Note 3a) | | 4,616,864 | | | 2,404,036 | | | 1,462,385 | |
| Distribution fees: (Note 3c) | | | | | | | | | |
| Class A | | 2,071,045 | | | 588,424 | | | 314,538 | |
| Class C | | 646,687 | | | — | | | 227,074 | |
| Class R | | 43,644 | | | — | | | 3,368 | |
| Transfer agent fees: (Note 3e) | | | | | | | | | |
| Class A | | 1,395,765 | | | 338,833 | | | 281,598 | |
| Class C | | 108,956 | | | — | | | 51,189 | |
| Class R | | 14,712 | | | — | | | 1,508 | |
| Class R6 | | 300 | | | 205 | | | — | |
| Advisor Class | | 107,593 | | | 85,062 | | | 10,523 | |
| Custodian fees (Note 4) | | 9,900 | | | 2,660 | | | 1,316 | |
| Reports to shareholders. | | 165,251 | | | 45,730 | | | 39,884 | |
| Registration and filing fees | | 112,962 | | | 69,746 | | | 65,119 | |
| Professional fees | | 83,139 | | | 57,836 | | | 67,276 | |
| Trustees’ fees and expenses | | 49,186 | | | 16,042 | | | 7,388 | |
| Other | | 23,941 | | | 14,104 | | | 7,730 | |
| Total expenses | | 9,449,945 | | | 3,622,678 | | | 2,540,896 | |
| Expense reductions (Note 4) | | (187 | ) | | (63 | ) | | — | |
| Expenses waived/paid by affiliates (Note 3f and 3g) | | (285,777 | ) | | (30,153 | ) | | (379,389 | ) |
| Net expenses | | 9,163,981 | | | 3,592,462 | | | 2,161,507 | |
| Net investment income | | 5,747,265 | | | 1,347,749 | | | 1,173,444 | |
| Realized and unrealized gains (losses): | | | | | | | | | |
| Net realized gain (loss) from: | | | | | | | | | |
| Investments: | | | | | | | | | |
| Unaffiliated issuers | | 79,964,191 | | | 19,698,108 | | | 2,089,977 | |
| Non-controlled affiliates (Note 3f and 7) | | (13,170,728 | ) | | 12,254,092 | | | — | |
| Realized gain distributions from REITs | | — | | | — | | | 153,128 | |
| Foreign currency transactions | | (202,652 | ) | | — | | | — | |
| Net realized gain (loss) | | 66,590,811 | | | 31,952,200 | | | 2,243,105 | |
| Net change in unrealized appreciation (depreciation) on: | | | | | | | | | |
| Investments | | (32,021,337 | ) | | (7,844,719 | ) | | 3,250,542 | |
| Net realized and unrealized gain (loss) | | 34,569,474 | | | 24,107,481 | | | 5,493,647 | |
| Net increase (decrease) in net assets resulting from operations | $ | 40,316,739 | | $ | 25,455,230 | | $ | 6,667,091 | |
franklintempleton.com
The accompanying notes are an integral part of these financial statements. | Annual Report 69
FRANKLIN VALUE INVESTORS TRUST
FINANCIAL STATEMENTS
| | | |
| Statements of Operations (continued) | | | |
| for the year ended October 31, 2016 | | | |
| |
| | | Franklin Small Cap | |
| | | Value Fund | |
| Investment income: | | | |
| Dividends: | | | |
| Unaffiliated issuers | $ | 30,171,774 | |
| Non-controlled affiliates (Note 3f and 7) | | 738,879 | |
| Interest | | 1,251,743 | |
| Income from securities loaned (net of fees and rebates) | | 300,431 | |
| Total investment income | | 32,462,827 | |
| Expenses: | | | |
| Management fees (Note 3a) | | 12,767,794 | |
| Distribution fees: (Note 3c) | | | |
| Class A | | 2,650,349 | |
| Class C | | 2,209,019 | |
| Class R | | 1,048,874 | |
| Transfer agent fees: (Note 3e) | | | |
| Class A | | 2,429,968 | |
| Class C | | 507,610 | |
| Class R | | 480,992 | |
| Class R6 | | 6,026 | |
| Advisor Class | | 1,422,035 | |
| Custodian fees (Note 4) | | 34,588 | |
| Reports to shareholders | | 376,190 | |
| Registration and filing fees. | | 242,024 | |
| Professional fees | | 123,537 | |
| Trustees’ fees and expenses | | 103,768 | |
| Other | | 67,111 | |
| Total expenses | | 24,469,885 | |
| Expense reductions (Note 4) | | (43 | ) |
| Expenses waived/paid by affiliates (Note 3f and 3g) | | (472,012 | ) |
| Net expenses | | 23,997,830 | |
| Net investment income. | | 8,464,997 | |
| Realized and unrealized gains (losses): | | | |
| Net realized gain (loss) from: | | | |
| Investments: | | | |
| Unaffiliated issuers | | 142,284,007 | |
| Non-controlled affiliates (Note 3f and 7) | | 474,206 | |
| Realized gain distributions from REITs | | 16,155 | |
| Foreign currency transactions. | | (239,088 | ) |
| Net realized gain (loss) | | 142,535,280 | |
| Net change in unrealized appreciation (depreciation) on: | | | |
| Investments | | 67,066,626 | |
| Translation of other assets and liabilities | | | |
| denominated in foreign currencies. | | (2,834 | ) |
| Net change in unrealized appreciation (depreciation) | | 67,063,792 | |
| Net realized and unrealized gain (loss) | | 209,599,072 | |
| Net increase (decrease) in net assets resulting from operations | $ | 218,064,069 | |
70 Annual Report | The accompanying notes are an integral part of these financial statements.
franklintempleton.com
FRANKLIN VALUE INVESTORS TRUST
FINANCIAL STATEMENTS
| | | | | | | | | | | | | | |
| Statements of Changes in Net Assets | | | | | | | | | | | | | | |
| |
| | | Franklin Balance Sheet | | | Franklin MicroCap | |
| | | Investment Fund | | | Value Fund | | |
| | | Year Ended October 31, | | | Year Ended October 31, | |
| | | 2016 | | | | 2015 | | | 2016 | | | | 2015 | |
| Increase (decrease) in net assets: | | | | | | | | | | | | | | |
| Operations: | | | | | | | | | | | | | | |
| Net investment income. | $ | 5,747,265 | | | $ | 5,345,173 | | $ | 1,347,749 | | | $ | 321,845 | |
| Net realized gain (loss) | | 66,590,811 | | | | 149,270,750 | | | 31,952,200 | | | 38,812,000 | |
| Net change in unrealized appreciation (depreciation) | | (32,021,337 | ) | | (260,058,370 | ) | | (7,844,719 | ) | | (75,270,265 | ) |
| Net increase (decrease) in net assets resulting from | | | | | | | | | | | | | | |
| operations | | 40,316,739 | | | (105,442,447 | ) | | 25,455,230 | | | (36,136,420 | ) |
| Distributions to shareholders from: | | | | | | | | | | | | | | |
| Net investment income: | | | | | | | | | | | | | | |
| Class A | | (6,163,510 | ) | | | (3,957,412 | ) | | — | | | | — | |
| Class R | | (40,973 | ) | | | (1,756 | ) | | — | | | | — | |
| Class R6 | | (86,862 | ) | | | (57,404 | ) | | — | | | | — | |
| Advisor Class | | (567,388 | ) | | | (644,542 | ) | | — | | | | — | |
| Net realized gains: | | | | | | | | | | | | | | |
| Class A | | (127,240,321 | ) | | (177,375,288 | ) | | (29,640,539 | ) | | (31,272,031 | ) |
| Class C | | (10,707,264 | ) | | | (14,401,328 | ) | | — | | | | — | |
| Class R | | (1,392,805 | ) | | | (1,988,576 | ) | | — | | | | — | |
| Class R6 | | (1,044,533 | ) | | | (1,129,406 | ) | | (2,087,901 | ) | | (2,229,315 | ) |
| Advisor Class | | (8,916,476 | ) | | | (15,940,901 | ) | | (7,083,319 | ) | | (7,981,634 | ) |
| Total distributions to shareholders. | | (156,160,132 | ) | | (215,496,613 | ) | | (38,811,759 | ) | | (41,482,980 | ) |
| Capital share transactions: (Note 2) | | | | | | | | | | | | | | |
| Class A | | (20,929,475 | ) | | | (39,456,578 | ) | | (14,615,220 | ) | | (29,885,991 | ) |
| Class C | | (2,931,602 | ) | | | (1,325,175 | ) | | — | | | | — | |
| Class R | | (225,350 | ) | | | (1,483,804 | ) | | — | | | | — | |
| Class R6 | | (6,369,642 | ) | | | 1,316,064 | | | 800,571 | | | (2,944,946 | ) |
| Advisor Class | | 12,702,903 | | | | (18,629,141 | ) | | (1,878,032 | ) | | (7,557,529 | ) |
| Total capital share transactions | | (17,753,166 | ) | | | (59,578,634 | ) | | (15,692,681 | ) | | (40,388,466 | ) |
| Net increase (decrease) in net assets | | (133,596,559 | ) | | (380,517,694 | ) | | (29,049,210 | ) | | (118,007,866 | ) |
| Net assets: | | | | | | | | | | | | | | |
| Beginning of year | | 1,075,042,501 | | | 1,455,560,195 | | | 343,711,745 | | | 461,719,611 | |
| End of year | $ | 941,445,942 | | $ | 1,075,042,501 | | $ | 314,662,535 | | $ | 343,711,745 | |
| Undistributed net investment income included in net assets: | | | | | | | | | | | | | | |
| End of year | $ | 3,000,781 | | | $ | 4,314,901 | | $ | 1,020,893 | | | $ | — | |
| Distributions in excess of net investment income included in | | | | | | | | | | �� | | | | |
| net assets: | | | | | | | | | | | | | | |
| End of year | $ | — | | | $ | — | | $ | — | | | $ | (391,259 | ) |
franklintempleton.com
The accompanying notes are an integral part of these financial statements. | Annual Report 71
FRANKLIN VALUE INVESTORS TRUST
FINANCIAL STATEMENTS
| | | | | | | | | | | | |
| Statements of Changes in Net Assets (continued) | | | | | | | | | | | | |
| |
| | | Franklin MidCap | | | Franklin Small Cap | |
| | | Value Fund | | | Value Fund | |
| | | Year Ended October 31, | | | Year Ended October 31, | |
| | | 2016 | | | 2015 | | | 2016 | | | 2015 | |
| Increase (decrease) in net assets: | | | | | | | | | | | | |
| Operations: | | | | | | | | | | | | |
| Net investment income | $ | 1,173,444 | | $ | 1,000,348 | | $ | 8,464,997 | | $ | 14,135,832 | |
| Net realized gain (loss) | | 2,243,105 | | | 12,284,486 | | | 142,535,280 | | | 207,937,724 | |
| Net change in unrealized appreciation (depreciation) | | 3,250,542 | | | (18,638,584 | ) | | 67,063,792 | | | (301,245,883 | ) |
| Net increase (decrease) in net assets resulting from | | | | | | | | | | | | |
| operations | | 6,667,091 | | | (5,353,750 | ) | | 218,064,069 | | | (79,172,327 | ) |
| Distributions to shareholders from: | | | | | | | | | | | | |
| Net investment income: | | | | | | | | | | | | |
| Class A | | (566,129 | ) | | (866,505 | ) | | (5,808,824 | ) | | (2,585,362 | ) |
| Class R | | (487 | ) | | (3,785 | ) | | (679,366 | ) | | (8,002 | ) |
| Class R6 | | — | | | — | | | (693,643 | ) | | (298,630 | ) |
| Advisor Class | | (34,226 | ) | | (42,471 | ) | | (4,845,956 | ) | | (4,065,275 | ) |
| Net realized gains: | | | | | | | | | | | | |
| Class A | | (10,163,601 | ) | | (2,473,197 | ) | | (99,834,697 | ) | | (110,504,165 | ) |
| Class C | | (1,886,762 | ) | | (466,142 | ) | | (23,379,887 | ) | | (24,786,735 | ) |
| Class R | | (57,562 | ) | | (18,353 | ) | | (21,061,215 | ) | | (23,952,774 | ) |
| Class R6 | | — | | | — | | | (5,810,056 | ) | | (3,448,309 | ) |
| Advisor Class | | (366,722 | ) | | (84,941 | ) | | (55,891,621 | ) | | (67,827,243 | ) |
| Total distributions to shareholders | | (13,075,489 | ) | | (3,955,394 | ) | | (218,005,265 | ) | | (237,476,495 | ) |
| Capital share transactions: (Note 2) | | | | | | | | | | | | |
| Class A | | 6,921,151 | | | 6,132,968 | | | 57,050,882 | | | (82,172,729 | ) |
| Class C | | 973,731 | | | 853,401 | | | (8,339,210 | ) | | (2,782,028 | ) |
| Class R | | (13,076 | ) | | (300,745 | ) | | (8,987,914 | ) | | (26,620,260 | ) |
| Class R6 | | — | | | — | | | 39,750,357 | | | 31,865,969 | |
| Advisor Class | | 1,487,504 | | | 577,641 | | | 262,254,964 | | | (88,579,327 | ) |
| Total capital share transactions | | 9,369,310 | | | 7,263,265 | | | 341,729,079 | | | (168,288,375 | ) |
| Net increase (decrease) in net assets | | 2,960,912 | | | (2,045,879 | ) | | 341,787,883 | | | (484,937,197 | ) |
| Net assets: | | | | | | | | | | | | |
| Beginning of year | | 155,834,252 | | | 157,880,131 | | | 2,208,248,865 | | | 2,693,186,062 | |
| End of year. | $ | 158,795,164 | | $ | 155,834,252 | | $ | 2,550,036,748 | | $ | 2,208,248,865 | |
| Undistributed net investment income included in net assets: | | | | | | | | | | | | |
| End of year. | $ | 730,286 | | $ | 147,654 | | $ | 5,140,223 | | $ | 8,918,000 | |
72 Annual Report | The accompanying notes are an integral part of these financial statements.
franklintempleton.com
FRANKLIN VALUE INVESTORS TRUST
Notes to Financial Statements
1. Organization and Significant Accounting Policies
Franklin Value Investors Trust (Trust) is registered under the Investment Company Act of 1940 (1940 Act) as an open-end management investment company, consisting of four separate funds (Funds) and applies the specialized accounting and reporting guidance in U.S. Generally Accepted Accounting Principles (U.S. GAAP). The classes of shares offered within each of the Funds are indicated below. Each class of shares differs by its initial sales load, contingent deferred sales charges, voting rights on matters affecting a single class, its exchange privilege and fees primarily due to differing arrangements for distribution and transfer agent fees.
|
| Class A, Class R6 & Advisor Class |
| Franklin MicroCap Value Funda |
| Class A, Class C, Class R & Advisor Class |
| Franklin MidCap Value Fund |
| Class A, Class C, Class R, Class R6 & Advisor Class |
| Franklin Balance Sheet Investment Fund |
| Franklin Small Cap Value Fund |
aFranklin MicroCap Value Fund was closed to new investors with limited exceptions effective January 2004, and has remained closed except for two days in mid-February 2013, when the Fund was opened on a limited basis.
The following summarizes the Funds’ significant accounting policies.
a. Financial Instrument Valuation
The Funds’ investments in financial instruments are carried at fair value daily. Fair value is the price that would be received to sell an asset or paid to transfer a liability in an orderly transaction between market participants on the measurement date. The Funds calculate the net asset value (NAV) per share as of 4 p.m. Eastern time each day the New York Stock Exchange (NYSE) is open for trading. Under compliance policies and procedures approved by the Trust’s Board of Trustees (the Board), the Funds’ administrator has responsibility for oversight of valuation, including leading the cross-functional Valuation Committee (VC). The VC provides administration and oversight of the Funds’ valuation policies and procedures, which are approved annually by the Board. Among other things, these procedures allow the Funds to utilize independent pricing services, quotations from securities and financial instrument dealers, and other market sources to determine fair value.
Equity securities and exchange traded funds listed on an exchange or on the NASDAQ National Market System are valued at the last quoted sale price or the official closing price of the day, respectively. Foreign equity securities are valued as of the close of trading on the foreign stock exchange on which the security is primarily traded or as of 4 p.m. Eastern time, whichever is earlier. The value is then converted into its U.S. dollar equivalent at the foreign exchange rate in effect at 4 p.m. Eastern time on the day that the value of the security is determined. Over-the-counter (OTC) securities are valued within the range of the most recent quoted bid and ask prices. Securities that trade in multiple markets or on multiple exchanges are valued according to the broadest and most representative market. Certain equity securities are valued based upon fundamental characteristics or relationships to similar securities.
Debt securities generally trade in the OTC market rather than on a securities exchange. The Funds’ pricing services use multiple valuation techniques to determine fair value. In instances where sufficient market activity exists, the pricing services may utilize a market-based approach through which quotes from market makers are used to determine fair value. In instances where sufficient market activity may not exist or is limited, the pricing services also utilize proprietary valuation models which may consider market characteristics such as benchmark yield curves, credit spreads, estimated default rates, anticipated market interest rate volatility, coupon rates, anticipated timing of principal repayments, underlying collateral, and other unique security features in order to estimate the relevant cash flows, which are then discounted to calculate the fair value.
Investments in open-end mutual funds are valued at the closing NAV. Investments in repurchase agreements are valued at cost, which approximates fair value.
The Funds have procedures to determine the fair value of financial instruments for which market prices are not reliable or readily available. Under these procedures, the VC convenes on a regular basis to review such financial instruments and considers a number of factors, including significant unobservable valuation inputs, when arriving at fair value. The VC primarily employs a market-based approach which may use related or comparable assets or liabilities, recent transactions, market multiples, book values, and other relevant information for the investment to determine the fair value of the investment. An income-based valuation approach may also be used in which the anticipated future cash flows of the investment are
franklintempleton.com
Annual Report
73
FRANKLIN VALUE INVESTORS TRUST
NOTES TO FINANCIAL STATEMENTS
1. Organization and Significant Accounting
Policies (continued)
a. Financial Instrument Valuation (continued)
discounted to calculate fair value. Discounts may also be applied due to the nature or duration of any restrictions on the disposition of the investments. Due to the inherent uncertainty of valuations of such investments, the fair values may differ significantly from the values that would have been used had an active market existed. The VC employs various methods for calibrating these valuation approaches including a regular review of key inputs and assumptions, transactional back-testing or disposition analysis, and reviews of any related market activity.
Trading in securities on foreign securities stock exchanges and OTC markets may be completed before 4 p.m. Eastern time. In addition, trading in certain foreign markets may not take place on every NYSE business day. Occasionally, events occur between the time at which trading in a foreign security is completed and the close of the NYSE that might call into question the reliability of the value of a portfolio security held by the Fund. As a result, differences may arise between the value of the Funds’ portfolio securities as determined at the foreign market close and the latest indications of value at the close of the NYSE. In order to minimize the potential for these differences, the VC monitors price movements following the close of trading in foreign stock markets through a series of country specific market proxies (such as baskets of American Depositary Receipts, futures contracts and exchange traded funds). These price movements are measured against established trigger thresholds for each specific market proxy to assist in determining if an event has occurred that may call into question the reliability of the values of the foreign securities held by the Funds. If such an event occurs, the securities may be valued using fair value procedures, which may include the use of independent pricing services.
When the last day of the reporting period is a non-business day, certain foreign markets may be open on those days that the NYSE is closed, which could result in differences between the value of the Funds’ portfolio securities on the last business day and the last calendar day of the reporting period. Any significant security valuation changes due to an open foreign market are adjusted and reflected by the Funds for financial reporting purposes.
b. Foreign Currency Translation
Portfolio securities and other assets and liabilities denominated in foreign currencies are translated into U.S. dollars based on the exchange rate of such currencies against U.S. dollars on the date of valuation. The Funds may enter into foreign currency exchange contracts to facilitate transactions denominated in a foreign currency. Purchases and sales of securities, income and expense items denominated in foreign currencies are translated into U.S. dollars at the exchange rate in effect on the transaction date. Portfolio securities and assets and liabilities denominated in foreign currencies contain risks that those currencies will decline in value relative to the U.S. dollar. Occasionally, events may impact the availability or reliability of foreign exchange rates used to convert the U.S. dollar equivalent value. If such an event occurs, the foreign exchange rate will be valued at fair value using procedures established and approved by the Board.
The Funds do not separately report the effect of changes in foreign exchange rates from changes in market prices on securities held. Such changes are included in net realized and unrealized gain or loss from investments in the Statements of Operations.
Realized foreign exchange gains or losses arise from sales of foreign currencies, currency gains or losses realized between the trade and settlement dates on securities transactions and the difference between the recorded amounts of dividends, interest, and foreign withholding taxes and the U.S. dollar equivalent of the amounts actually received or paid. Net unrealized foreign exchange gains and losses arise from changes in foreign exchange rates on foreign denominated assets and liabilities other than investments in securities held at the end of the reporting period.
c. Joint Repurchase Agreement
Certain or all Funds enter into a joint repurchase agreement whereby their uninvested cash balance is deposited into a joint cash account with other funds managed by the investment manager or an affiliate of the investment manager and is used to invest in one or more repurchase agreements. The value and face amount of the joint repurchase agreement are allocated to the funds based on their pro-rata interest. A repurchase agreement is accounted for as a loan by the Fund to the seller, collateralized by securities which are delivered to the Funds’ custodian. The fair value, including accrued interest, of the initial collateralization is required to be at least 102% of the dollar amount invested by the funds, with the value of the
74 Annual Report
franklintempleton.com
FRANKLIN VALUE INVESTORS TRUST
NOTES TO FINANCIAL STATEMENTS
underlying securities marked to market daily to maintain coverage of at least 100%. Repurchase agreements are subject to the terms of Master Repurchase Agreements (MRAs) with approved counterparties (sellers). The MRAs contain various provisions, including but not limited to events of default and maintenance of collateral for repurchase agreements. In the event of default by either the seller or the Funds, certain MRAs may permit the non-defaulting party to net and close-out all transactions, if any, traded under such agreements. The Funds may sell securities it holds as collateral and apply the proceeds towards the repurchase price and any other amounts owed by the seller to the Funds in the event of default by the seller. This could involve costs or delays in addition to a loss on the securities if their value falls below the repurchase price owed by the seller. The joint repurchase agreement held by the Funds at year end, as indicated in the Statements of Investments, had been entered into on October 31, 2016.
d. Securities Lending
Certain or all Funds participate in an agency based securities lending program to earn additional income. The Fund receives cash collateral against the loaned securities in an amount equal to at least 102% of the fair value of the loaned securities. Collateral is maintained over the life of the loan in an amount not less than 100% of the fair value of loaned securities, as determined at the close of Fund business each day; any additional collateral required due to changes in security values is delivered to the Fund on the next business day. The collateral is deposited into a joint cash account with other funds and is used to invest in a money market fund managed by Franklin Advisers, Inc., an affiliate of the Funds, and/or a joint repurchase agreement. The Fund may receive income from the investment of cash collateral, in addition to lending fees and rebates paid by the borrower. Income from securities loaned, net of fees paid to the securities lending agent and/or third-party vendor, is reported separately in the Statements of Operations. The Fund bears the market risk with respect to the collateral investment, securities loaned, and the risk that the agent may default on its obligations to the Fund. If the borrower defaults on its obligation to return the securities loaned, the Fund has the right to repurchase the securities in the open market using the collateral received. The securities lending agent has agreed to indemnify the Fund in the event of default by a third party borrower.
e. Income and Deferred Taxes
It is each Fund’s policy to qualify as a regulated investment company under the Internal Revenue Code. Each Fund intends to distribute to shareholders substantially all of its taxable income and net realized gains to relieve it from federal income and excise taxes. As a result, no provision for U.S. federal income taxes is required.
The Funds may be subject to foreign taxation related to income received, capital gains on the sale of securities and certain foreign currency transactions in the foreign jurisdictions in which the Funds invest. Foreign taxes, if any, are recorded based on the tax regulations and rates that exist in the foreign markets in which the Funds invest. When a capital gain tax is determined to apply, certain or all Funds record an estimated deferred tax liability in an amount that would be payable if the securities were disposed of on the valuation date. As a result of several court cases, in certain countries across the European Union, certain or all Funds filed additional tax reclaims for previously withheld taxes on dividends earned in those countries (EU reclaims). These additional filings are subject to various administrative proceedings by the local jurisdictions’ tax authorities within the European Union, as well as a number of related judicial proceedings. Income recognized, if any, for EU reclaims is reflected as other income in the Statements of Operations and any related receivable, if any, is reflected as European Union tax reclaims in the Statements of Assets and Liabilities. When uncertainty exists as to the ultimate resolution of these proceedings, the likelihood of receipt of these EU reclaims, and the potential timing of payment, no amounts are reflected in the financial statements.
Each Fund may recognize an income tax liability related to its uncertain tax positions under U.S. GAAP when the uncertain tax position has a less than 50% probability that it will be sustained upon examination by the tax authorities based on its technical merits. As of October 31, 2016, each Fund has determined that no tax liability is required in its financial statements related to uncertain tax positions for any open tax years (or expected to be taken in future tax years). Open tax years are those that remain subject to examination and are based on each tax jurisdiction’s statute of limitation.
franklintempleton.com
Annual Report
75
FRANKLIN VALUE INVESTORS TRUST
NOTES TO FINANCIAL STATEMENTS
1. Organization and Significant Accounting
Policies (continued)
f. Security Transactions, Investment Income, Expenses and Distributions
Security transactions are accounted for on trade date. Realized gains and losses on security transactions are determined on a specific identification basis. Interest income and estimated expenses are accrued daily. Dividend income is recorded on the ex-dividend date except for certain dividends from securities where the dividend rate is not available. In such cases, the dividend is recorded as soon as the information is received by the Funds. Distributions to shareholders are recorded on the ex-dividend date and are determined according to income tax regulations (tax basis). Distributable earnings determined on a tax basis may differ from earnings recorded in accordance with U.S. GAAP. These differences may be permanent or temporary. Permanent differences are reclassified among capital accounts to reflect their tax character. These reclassifications have no impact on net assets or the results of operations. Temporary differences are not reclassified, as they may reverse in subsequent periods.
Common expenses incurred by the Trust are allocated among the Funds based on the ratio of net assets of each Fund to the combined net assets of the Trust. Fund specific expenses are charged directly to the Fund that incurred the expense.
Realized and unrealized gains and losses and net investment income, not including class specific expenses, are allocated daily to each class of shares based upon the relative proportion of net assets of each class. Differences in per share distributions, by class, are generally due to differences in class specific expenses.
g. Accounting Estimates
The preparation of financial statements in accordance with U.S. GAAP requires management to make estimates and assumptions that affect the reported amounts of assets and liabilities at the date of the financial statements and the amounts of income and expenses during the reporting period. Actual results could differ from those estimates.
h. Guarantees and Indemnifications
Under the Trust’s organizational documents, its officers and trustees are indemnified by the Trust against certain liabilities arising out of the performance of their duties to the Trust. Additionally, in the normal course of business, the Trust, on behalf of the Funds, enters into contracts with service providers that contain general indemnification clauses. The Trust’s maximum exposure under these arrangements is unknown as this would involve future claims that may be made against the Trust that have not yet occurred. Currently, the Trust expects the risk of loss to be remote.
76 Annual Report
franklintempleton.com
FRANKLIN VALUE INVESTORS TRUST
NOTES TO FINANCIAL STATEMENTS
2. Shares of Beneficial Interest
At October 31, 2016, there were an unlimited number of shares authorized (without par value). Transactions in the Funds’ shares were as follows:
| | | | | | | | | | | |
| | Franklin Balance Sheet | | Franklin MicroCap | |
| | Investment Fund | | Value Fund | |
| | Shares | | | | Amount | | Shares | | | Amount | |
| Class A Shares: | | | | | | | | | | | |
| Year ended October 31, 2016 | | | | | | | | | | | |
| Shares sold. | 3,788,284 | | $ | 129,548,000 | | 356,685 | | $ | 10,517,221 | |
| Shares issued in reinvestment of distributions | 3,737,816 | | | 124,132,878 | | 996,581 | | | 28,382,616 | |
| Shares redeemed | (7,892,827 | ) | | (274,610,353 | ) | (1,763,502 | ) | | (53,515,057 | ) |
| Net increase (decrease) | (366,727 | ) | | $ | (20,929,475 | ) | (410,236 | ) | $ | (14,615,220 | ) |
| Year ended October 31, 2015 | | | | | | | | | | | |
| Shares sold. | 2,982,041 | | $ | 127,746,082 | | 324,987 | | $ | 11,261,598 | |
| Shares issued in reinvestment of distributions | 4,080,647 | | | 169,142,832 | | 882,953 | | | 29,834,976 | |
| Shares redeemed | (7,922,471 | ) | | (336,345,492 | ) | (2,058,848 | ) | | (70,982,565 | ) |
| Net increase (decrease) | (859,783 | ) | | $ | (39,456,578 | ) | (850,908 | ) | $ | (29,885,991 | ) |
| Class C Shares: | | | | | | | | | | | |
| Year ended October 31, 2016 | | | | | | | | | | | |
| Shares sold. | 209,480 | | | $ | 6,928,314 | | | | | | |
| Shares issued in reinvestment of distributions | 328,845 | | | | 10,562,502 | | | | | | |
| Shares redeemed | (619,094 | ) | | | (20,422,418 | ) | | | | | |
| Net increase (decrease) | (80,769 | ) | | $ | (2,931,602 | ) | | | | | |
| Year ended October 31, 2015 | | | | | | | | | | | |
| Shares sold. | 190,088 | | | $ | 7,865,985 | | | | | | |
| Shares issued in reinvestment of distributions | 350,650 | | | | 14,131,204 | | | | | | |
| Shares redeemed | (567,025 | ) | | | (23,322,364 | ) | | | | | |
| Net increase (decrease) | (26,287 | ) | | $ | (1,325,175 | ) | | | | | |
| Class R Shares: | | | | | | | | | | | |
| Year ended October 31, 2016 | | | | | | | | | | | |
| Shares sold. | 39,717 | | | $ | 1,367,615 | | | | | | |
| Shares issued in reinvestment of distributions | 43,057 | | | | 1,433,778 | | | | | | |
| Shares redeemed | (88,601 | ) | | | (3,026,743 | ) | | | | | |
| Net increase (decrease) | (5,827 | ) | | $ | (225,350 | ) | | | | | |
| Year ended October 31, 2015 | | | | | | | | | | | |
| Shares sold. | 43,924 | | | $ | 1,888,602 | | | | | | |
| Shares issued in reinvestment of distributions | 47,914 | | | | 1,990,332 | | | | | | |
| Shares redeemed | (123,440 | ) | | | (5,362,738 | ) | | | | | |
| Net increase (decrease) | (31,602 | ) | | $ | (1,483,804 | ) | | | | | |
franklintempleton.com
Annual Report
77
FRANKLIN VALUE INVESTORS TRUST
NOTES TO FINANCIAL STATEMENTS
| | | | | | | | | | | | |
| 2. Shares of Beneficial Interest (continued) | | | | | | | | | | | | |
| |
| | Franklin Balance Sheet | | Franklin MicroCap | |
| | Investment Fund | | Value Fund | |
| | Shares | | | | Amount | | Shares | | | | Amount | |
| Class R6 Shares: | | | | | | | | | | | | |
| Year ended October 31, 2016 | | | | | | | | | | | | |
| Shares sold. | 72,039 | | | $ | 2,491,495 | | 152,058 | | | $ | 4,534,813 | |
| Shares issued in reinvestment of distributions | 722 | | | | 24,574 | | 950 | | | | 27,259 | |
| Shares redeemed | (248,767 | ) | | | (8,885,711 | ) | (120,212 | ) | | | (3,761,501 | ) |
| Net increase (decrease) | (176,006 | ) | | $ | (6,369,642 | ) | 32,796 | | | $ | 800,571 | |
| Year ended October 31, 2015 | | | | | | | | | | | | |
| Shares sold. | 82,914 | | | $ | 3,565,508 | | 114,444 | | | $ | 3,929,258 | |
| Shares issued in reinvestment of distributions | — | | | | — | | 8,160 | | | | 276,364 | |
| Shares redeemed | (51,792 | ) | | | (2,249,444 | ) | (204,167 | ) | | | (7,150,568 | ) |
| Net increase (decrease) | 31,122 | | | $ | 1,316,064 | | (81,563 | ) | $ | (2,944,946 | ) |
| Advisor Class Shares: | | | | | | | | | | | | |
| Year ended October 31, 2016 | | | | | | | | | | | | |
| Shares sold. | 1,022,225 | | | $ | 36,994,037 | | 443,266 | | $ | 13,682,421 | |
| Shares issued in reinvestment of distributions | 267,802 | | | | 9,137,398 | | 227,808 | | | | 6,513,025 | |
| Shares redeemed | (904,675 | ) | | | (33,428,532 | ) | (705,636 | ) | | | (22,073,478 | ) |
| Net increase (decrease) | 385,352 | | | $ | 12,702,903 | | (34,562 | ) | $ | (1,878,032 | ) |
| Year ended October 31, 2015 | | | | | | | | | | | | |
| Shares sold. | 962,485 | | | $ | 40,938,747 | | 801,057 | | $ | 27,290,882 | |
| Shares issued in reinvestment of distributions | 382,991 | | | | 16,242,641 | | 218,953 | | | | 7,405,000 | |
| Shares redeemed | (1,845,642 | ) | | | (75,810,529 | ) | (1,226,178 | ) | | | (42,253,411 | ) |
| Net increase (decrease) | (500,166 | ) | | $ | (18,629,141 | ) | (206,168 | ) | $ | (7,557,529 | ) |
| |
| |
| | Franklin MidCap | | Franklin Small Cap | |
| | Value Fund | | Value Fund | |
| | Shares | | | | Amount | | Shares | | | | Amount | |
| Class A Shares: | | | | | | | | | | | | |
| Year ended October 31, 2016 | | | | | | | | | | | | |
| Shares sold. | 2,008,588 | | $ | 28,082,865 | | 4,705,984 | | $ | 230,621,518 | |
| Shares issued in reinvestment of distributions | 789,108 | | | 10,581,940 | | 2,182,073 | | | | 96,404,005 | |
| Shares issued on reorganization (Note 8) | — | | | | — | | 771,169 | | | | 32,670,477 | |
| Shares redeemed | (2,273,020 | ) | | (31,743,654 | ) | (6,327,141 | ) | | (302,645,118 | ) |
| Net increase (decrease) | 524,676 | | | $ | 6,921,151 | | 1,332,085 | | | $ | 57,050,882 | |
| Year ended October 31, 2015 | | | | | | | | | | | | |
| Shares sold. | 1,884,426 | | $ | 29,749,760 | | 3,824,195 | | $ | 204,728,167 | |
| Shares issued in reinvestment of distributions | 214,510 | | | | 3,273,429 | | 2,025,011 | | | 103,336,289 | |
| Shares redeemed | (1,718,427 | ) | | (26,890,221 | ) | (7,267,182 | ) | | (390,237,185 | ) |
| Net increase (decrease) | 380,509 | | | $ | 6,132,968 | | (1,417,976 | ) | $ | (82,172,729 | ) |
78 Annual Report
franklintempleton.com
FRANKLIN VALUE INVESTORS TRUST
NOTES TO FINANCIAL STATEMENTS
| | | | | | | | | | | |
| | Franklin MidCap | | Franklin Small Cap | |
| | Value Fund | | | Value Fund | |
| | Shares | | | Amount | | Shares | | | Amount | |
| Class C Shares: | | | | | | | | | | | |
| Year ended October 31, 2016 | | | | | | | | | | | |
| Shares sold. | 404,432 | | $ | 5,582,883 | | 712,170 | | $ | 31,364,976 | |
| Shares issued in reinvestment of distributions | 138,620 | | | 1,832,553 | | 535,257 | | | 21,474,498 | |
| Shares issued on reorganization (Note 8) | — | | | | — | | 148,730 | | | 5,709,810 | |
| Shares redeemed | (472,144 | ) | | (6,441,705 | ) | (1,527,317 | ) | | (66,888,494 | ) |
| Net increase (decrease) | 70,908 | | | $ | 973,731 | | (131,160 | ) | $ | (8,339,210 | ) |
| Year ended October 31, 2015 | | | | | | | | | | | |
| Shares sold. | 406,918 | | $ | 6,357,539 | | 670,073 | | $ | 32,945,114 | |
| Shares issued in reinvestment of distributions | 29,826 | | | | 450,366 | | 479,995 | | | 22,502,184 | |
| Shares redeemed | (386,023 | ) | | (5,954,504 | ) | (1,191,237 | ) | | (58,229,326 | ) |
| Net increase (decrease) | 50,721 | | | $ | 853,401 | | (41,169 | ) | $ | (2,782,028 | ) |
| Class R Shares: | | | | | | | | | | | |
| Year ended October 31, 2016 | | | | | | | | | | | |
| Shares sold. | 6,784 | | | $ | 96,073 | | 925,146 | | $ | 44,110,152 | |
| Shares issued in reinvestment of distributions | 4,322 | | | | 58,049 | | 473,666 | | | 20,737,082 | |
| Shares issued on reorganization (Note 8) | — | | | | — | | 1,308 | | | 54,856 | |
| Shares redeemed | (11,824 | ) | | (167,198 | ) | (1,564,983 | ) | | (73,890,004 | ) |
| Net increase (decrease) | (718 | ) | | $ | (13,076 | ) | (164,863 | ) | $ | (8,987,914 | ) |
| Year ended October 31, 2015 | | | | | | | | | | | |
| Shares sold. | 9,507 | | | $ | 151,491 | | 948,990 | | $ | 50,222,888 | |
| Shares issued in reinvestment of distributions | 1,451 | | | | 22,138 | | 450,281 | | | 22,784,204 | |
| Shares redeemed | (29,779 | ) | | (474,374 | ) | (1,873,284 | ) | | (99,627,352 | ) |
| Net increase (decrease) | (18,821 | ) | $ | (300,745 | ) | (474,013 | ) | $ | (26,620,260 | ) |
| Class R6 Shares: | | | | | | | | | | | |
| Year ended October 31, 2016 | | | | | | | | | | | |
| Shares sold. | | | | | | | 993,588 | | $ | 51,685,865 | |
| Shares issued in reinvestment of distributions | | | | | | | 94,970 | | | 4,353,446 | |
| Shares redeemed | | | | | | | (325,163 | ) | | (16,288,954 | ) |
| Net increase (decrease) | | | | | | | 763,395 | | $ | 39,750,357 | |
| Year ended October 31, 2015 | | | | | | | | | | | |
| Shares sold. | | | | | | | 1,056,050 | | $ | 59,655,409 | |
| Shares issued in reinvestment of distributions | | | | | | | 30,966 | | | 1,634,378 | |
| Shares redeemed | | | | | | | (544,057 | ) | | (29,423,818 | ) |
| Net increase (decrease) | | | | | | | 542,959 | | $ | 31,865,969 | |
franklintempleton.com
Annual Report
79
FRANKLIN VALUE INVESTORS TRUST
NOTES TO FINANCIAL STATEMENTS
| | | | | | | | | | |
| 2. Shares of Beneficial Interest (continued) | | | | | | | | | | |
| |
| | Franklin MidCap | | Franklin Small Cap | |
| | Value Fund | | Value Fund | |
| | Shares | | | Amount | | Shares | | | Amount | |
| Advisor Class Shares: | | | | | | | | | | |
| Year ended October 31, 2016 | | | | | | | | | | |
| Shares sold. | 290,876 | | $ | 4,276,186 | | 8,800,748 | | $ | 461,859,393 | |
| Shares issued in reinvestment of distributions | 27,119 | | | 365,015 | | 1,240,446 | | | 56,948,853 | |
| Shares issued on reorganization (Note 8) | — | | | — | | 57,090 | | | 2,515,323 | |
| Shares redeemed | (216,129 | ) | | (3,153,697 | ) | (5,268,076 | ) | | (259,068,605 | ) |
| Net increase (decrease) | 101,866 | | $ | 1,487,504 | | 4,830,208 | | $ | 262,254,964 | |
| Year ended October 31, 2015 | | | | | | | | | | |
| Shares sold. | 77,835 | | $ | 1,210,833 | | 3,869,868 | | $ | 215,282,871 | |
| Shares issued in reinvestment of distributions | 7,944 | | | 121,696 | | 1,276,090 | | | 67,403,070 | |
| Shares redeemed | (47,730 | ) | | (754,888 | ) | (6,686,035 | ) | | (371,265,268 | ) |
| Net increase (decrease) | 38,049 | | $ | 577,641 | | (1,540,077 | ) | $ | (88,579,327 | ) |
3. Transactions with Affiliates
Franklin Resources, Inc. is the holding company for various subsidiaries that together are referred to as Franklin Templeton Investments. Certain officers and trustees of the Trust are also officers and/or directors of the following subsidiaries:
| |
| Subsidiary | Affiliation |
| Franklin Advisory Services, LLC (Advisory Services) | Investment manager |
| Franklin Templeton Services, LLC (FT Services) | Administrative manager |
| Franklin Templeton Distributors, Inc. (Distributors) | Principal underwriter |
| Franklin Templeton Investor Services, LLC (Investor Services) | Transfer agent |
a. Management Fees
Franklin Balance Sheet Investment Fund pays an investment management fee to Advisory Services based on the average daily net assets of the fund as follows:
| | |
| Annualized Fee Rate | | Net Assets |
| 0.625% | | Up to and including $100 million |
| 0.500% | | Over $100 million, up to and including $250 million |
| 0.450% | | Over $250 million, up to and including $7.5 billion |
| 0.440% | | Over $7.5 billion, up to and including $10 billion |
| 0.430% | | Over $10 billion, up to and including $12.5 billion |
| 0.420% | | Over $12.5 billion, up to and including $15 billion |
| 0.400% | | In excess of $15 billion |
Franklin MicroCap Value Fund pays an investment management fee to Advisory Services of 0.75% per year of the average daily net assets of the fund.
80 Annual Report
franklintempleton.com
FRANKLIN VALUE INVESTORS TRUST
NOTES TO FINANCIAL STATEMENTS
Franklin MidCap Value Fund pays an investment management fee to Advisory Services based on the average daily net assets of the fund as follows:
| | |
| Annualized Fee Rate | | Net Assets |
| 0.950% | | Up to and including $500 million |
| 0.850% | | Over $500 million, up to and including $1 billion |
| 0.800% | | Over $1 billion, up to and including $1.5 billion |
| 0.750% | | Over $1.5 billion, up to and including $6.5 billion |
| 0.725% | | Over $6.5 billion, up to and including $11.5 billion |
| 0.700% | | Over $11.5 billion, up to and including $16.5 billion |
| 0.690% | | Over $16.5 billion, up to and including $19 billion |
| 0.680% | | Over $19 billion, up to and including $21.5 billion |
| 0.670% | | In excess of $21.5 billion |
Franklin Small Cap Value Fund pays an investment management fee to Advisory Services based on the average daily net assets of the fund as follows:
| | |
| Annualized Fee Rate | | Net Assets |
| 0.750% | | Up to and including $500 million |
| 0.625% | | Over $500 million, up to and including $1 billion |
| 0.500% | | Over $1 billion, up to and including $5 billion |
| 0.490% | | In excess of $5 billion |
For the year ended October 31, 2016, each Fund’s effective investment management fee rate based on average daily net assets was as follows:
| | | | | | | |
| Franklin Balance | | | | | | Franklin Small | |
| Sheet | | Franklin MicroCap | | Franklin MidCap | | Cap | |
| Investment Fund | | Value Fund | | Value Fund | | Value Fund | |
| |
| 0.476 | % | 0.750 | % | 0.950 | % | 0.586 | % |
b. Administrative Fees
Under an agreement with Advisory Services, FT Services provides administrative services to the Funds. The fee is paid by Advisory Services based on the Funds’ average daily net assets and is not an additional expense of the Funds.
c. Distribution Fees
The Board has adopted distribution plans for each share class, with the exception of Class R6 and Advisor Class shares, pursuant to Rule 12b-1 under the 1940 Act. Under the Funds’ Class A reimbursement distribution plan, the Funds reimburse Distributors for costs incurred in connection with the servicing, sale and distribution of each Fund’s shares up to the maximum annual plan rate. Under the Class A reimbursement distribution plans, costs exceeding the maximum for the current plan year cannot be reimbursed in subsequent periods. In addition, under the Funds’ Class C and R compensation distribution plans, the Funds pay Distributors for costs incurred in connection with the servicing, sale and distribution of each Fund’s shares up to the maximum annual plan rate for each class. The plan year, for purposes of monitoring compliance with the maximum annual plan rates, is February 1 through January 31 for each Fund.
franklintempleton.com
Annual Report
81
FRANKLIN VALUE INVESTORS TRUST
NOTES TO FINANCIAL STATEMENTS
3. Transactions with Affiliates (continued)
c. Distribution Fees (continued)
The maximum annual plan rates, based on the average daily net assets, for each class, are as follows:
| | | | | | | | |
| | Franklin Balance Sheet | | Franklin MicroCap | | Franklin MidCap | | Franklin Small Cap | |
| | Investment Fund | | Value Fund | | Value Fund | | Value Fund | |
| |
| Reimbursement Plans: | | | | | | | | |
| Class A. | 0.25 | % | 0.25 | % | 0.35 | % | 0.35 | % |
| Compensation Plans: | | | | | | | | |
| Class C | 1.00 | % | — | | 1.00 | % | 1.00 | % |
| Class R | 0.50 | % | — | | 0.50 | % | 0.50 | % |
For Franklin MidCap Value Fund and Franklin Small Cap Value Fund, the Board has set the current rate at 0.25% per year for Class A shares, effective August 1, 2015, until further notice and approval by the Board.
d. Sales Charges/Underwriting Agreements
Front-end sales charges and contingent deferred sales charges (CDSC) do not represent expenses of the Funds. These charges are deducted from the proceeds of sales of fund shares prior to investment or from redemption proceeds prior to remittance, as applicable. Distributors has advised the Funds of the following commission transactions related to the sales and redemptions of the Funds’ shares for the year:
| | | | | | | | |
| | | Franklin Balance Sheet | | Franklin MicroCap | | Franklin MidCap | | Franklin Small Cap |
| | | Investment Fund | | Value Fund | | Value Fund | | Value Fund |
| |
| Sales charges retained net of commissions | | | | | | | | |
| paid to unaffiliated brokers/dealers. | $ | 211,925 | $ | 10,522 | $ | 69,320 | $ | 347,262 |
| CDSC retained | $ | 6,037 | $ | 21 | $ | 3,242 | $ | 15,245 |
e. Transfer Agent Fees
Each class of shares, except for Class R6, pays transfer agent fees to Investor Services for its performance of shareholder servicing obligations and reimburses Investor Services for out of pocket expenses incurred, including shareholder servicing fees paid to third parties. These fees are allocated daily based upon their relative proportion of such classes’ aggregate net assets. Class R6 pays Investor Services transfer agent fees specific to that class.
For the year ended October 31, 2016, the Funds paid transfer agent fees as noted in the Statements of Operations of which the following amounts were retained by Investor Services:
| | | | | | | | |
| | | Franklin Balance Sheet | | Franklin MicroCap | | Franklin MidCap | | Franklin Small Cap |
| | | Investment Fund | | Value Fund | | Value Fund | | Value Fund |
| |
| Transfer agent fees | $ | 748,087 | $ | 165,450 | $ | 176,439 | $ | 2,096,335 |
82 Annual Report
franklintempleton.com
FRANKLIN VALUE INVESTORS TRUST
NOTES TO FINANCIAL STATEMENTS
f. Investments in Affiliated Management Investment Companies
Certain or all Funds invest in one or more affiliated management investment companies for purposes other than exercising a controlling influence over the management or policies. Management fees paid by the Funds are waived on assets invested in the affiliated management investment companies, as noted in the Statements of Operations, in an amount not to exceed the management and administrative fees paid directly or indirectly by each affiliate. Prior to November 1, 2013, the waiver was accounted for as a reduction to management fees. During the year ended October 31, 2016, all Funds held investments in affiliated management investment companies as follows:
| | | | | | | | | | | |
| | | | | | | | | | | % of | |
| | | | | | | | | | | Affiliated | |
| | Number of | | | | Number of | | | | | Fund Shares | |
| | Shares Held | | | | Shares | | Value | | | Outstanding | |
| | at Beginning | Gross | Gross | | Held at End | | at End | Investment | Realized | Held at End | |
| | of Year | Additions | Reductions | | of Year | | of Year | Income | Gain (Loss) | of Year | |
| Non-Controlled Affiliates | | | | | | | | | | | |
| Franklin Balance Sheet Investment Fund | | | | | | | | | | |
| Institutional Fiduciary Trust Money | | | | | | | | | | | |
| Market Portfolio | 102,695,280 | 287,700,288 | (226,202,631 | ) | 164,192,937 | $ | 164,192,937 | $– | $– | 1.0 | % |
| Franklin MicroCap Value Fund | | | | | | | | | | | |
| Institutional Fiduciary Trust Money | | | | | | | | | | | |
| Market Portfolio | 16,116,739 | 52,599,179 | (60,667,272 | ) | 8,048,646 | $ | 8,048,646 | $– | $– | –%a | |
| Franklin MidCap Value Fund | | | | | | | | | | | |
| Institutional Fiduciary Trust Money | | | | | | | | | | | |
| Market Portfolio | 2,941,745 | 67,649,709 | (66,243,827 | ) | 4,347,627 | $ | 4,347,627 | $– | $– | –%a | |
| Franklin Small Cap Value Fund | | | | | | | | | | | |
| Institutional Fiduciary Trust Money | | | | | | | | | | | |
| Market Portfolio | 156,137,127 | 739,421,025 | (615,830,565 | ) | 279,727,587 | $ | 279,727,587 | $– | $– | 1.7 | % |
| aRounds to less than 0.1%. | | | | | | | | | | | |
| |
| g. Waiver and Expense Reimbursements | | | | | | | | | | |
Advisory Services has contractually agreed in advance to waive or limit its fees and to assume as its own expense certain expenses otherwise payable by Franklin MidCap Value Fund so that the expenses (excluding distribution fees, and acquired fund fees and expenses) for each class of the Fund does not exceed 1.05% based on the average net assets of each class (other than certain non-routine expenses or costs, including those relating to litigation, indemnification, reorganizations, and liquidations) until February 28, 2017.
Additionally, Investor Services has contractually agreed in advance to waive or limit its fees so that the Class R6 transfer agent fees do not exceed 0.01% until February 28, 2017. For Franklin Balance Sheet Investment Fund and Franklin MicroCap Value Fund, there were no Class R6 transfer agent fees waived during the year ended October 31, 2016.
4. Expense Offset Arrangement
The Funds have entered into an arrangement with their custodian whereby credits realized as a result of uninvested cash balances are used to reduce a portion of the Funds’ custodian expenses. During the year ended October 31, 2016, the custodian fees were reduced as noted in the Statements of Operations.
5. Income Taxes
For tax purposes, capital losses may be carried over to offset future capital gains, if any.
franklintempleton.com
Annual Report
83
FRANKLIN VALUE INVESTORS TRUST
NOTES TO FINANCIAL STATEMENTS
5. Income Taxes (continued)
During the year ended October 31, 2016, Franklin Small Cap Value Fund utilized $73,633 of capital loss carryforwards, which were from the merged Franklin All Cap Value Fund.
The tax character of distributions paid during the years ended October 31, 2016 and 2015, was as follows:
| | | | | | | | | | | | |
| | | Franklin Balance Sheet | | Franklin MicroCap | | Franklin MidCap |
| | | Investment Fund | | Value Fund | | Value Fund |
| | | 2016 | | 2015 | | 2016 | | 2015 | | 2016 | | 2015 |
| Distributions paid from: | | | | | | | | | | | | |
| Ordinary income | $ | 6,858,733 | $ | 26,525,797 | $ | — | $ | 842,070 | $ | 960,569 | $ | 912,761 |
| Long term capital gain | | 149,301,399 | | 188,970,816 | | 38,811,759 | | 40,640,910 | | 12,114,920 | | 3,042,633 |
| | $ | 156,160,132 | $ | 215,496,613 | $ | 38,811,759 | $ | 41,482,980 | $ | 13,075,489 | $ | 3,955,394 |
| |
| | | Franklin Small Cap | | | | | | | | |
| | | Value Fund | | | | | | | | |
| | | 2016 | | 2015 | | | | | | | | |
| Distributions paid from: | | | | | | | | | | | | |
| Ordinary income | $ | 12,027,789 | $ | 12,731,751 | | | | | | | | |
| Long term capital gain | | 205,977,476 | | 224,744,744 | | | | | | | | |
| | $ | 218,005,265 | $ | 237,476,495 | | | | | | | | |
At October 31, 2016, the cost of investments, net unrealized appreciation (depreciation), undistributed ordinary income and undistributed long term capital gains for income tax purposes were as follows:
| | | | | | | | | |
| | | Franklin Balance Sheet | | | Franklin MicroCap | | | Franklin MidCap | |
| | | Investment Fund | | | Value Fund | | | Value Fund | |
| Cost of investments | $ | 790,877,043 | | $ | 223,275,360 | | $ | 140,914,828 | |
| |
| Unrealized appreciation | $ | 187,388,793 | | $ | 125,484,889 | | $ | 21,854,375 | |
| Unrealized depreciation | | (34,516,817 | ) | | (35,240,496 | ) | | (3,582,253 | ) |
| Net unrealized appreciation (depreciation) | $ | 152,871,976 | | $ | 90,244,393 | | $ | 18,272,122 | |
| |
| Undistributed ordinary income | $ | 3,000,786 | | $ | 1,560,749 | | $ | 730,291 | |
| Undistributed long term capital gains | | 60,963,800 | | | 29,155,543 | | | 1,986,325 | |
| Distributable earnings | $ | 63,964,586 | | $ | 30,716,292 | | $ | 2,716,616 | |
| | | Franklin Small Cap | | | | | | | |
| | | Value Fund | | | | | | | |
| Cost of investments | $ | 2,055,555,851 | | | | | | | |
| |
| Unrealized appreciation | $ | 540,319,613 | | | | | | | |
| Unrealized depreciation | | (64,953,003 | ) | | | | | | |
| Net unrealized appreciation (depreciation) | $ | 475,366,610 | | | | | | | |
| |
| Undistributed ordinary income | $ | 5,140,195 | | | | | | | |
| Undistributed long term capital gains. | | 130,970,310 | | | | | | | |
| Distributable earnings | $ | 136,110,505 | | | | | | | |
84 Annual Report
franklintempleton.com
FRANKLIN VALUE INVESTORS TRUST
NOTES TO FINANCIAL STATEMENTS
Differences between income and/or capital gains as determined on a book basis and a tax basis are primarily due to differing treatment of wash sales.
The Funds utilized a tax accounting practice to treat a portion of the proceeds from capital shares redeemed as a distribution from realized capital gains.
6. Investment Transactions
Purchases and sales of investments (excluding short term securities) for the year ended October 31, 2016, were as follows:
| | | | | | | | |
| | | Franklin Balance Sheet | | Franklin MicroCap | | Franklin MidCap | | Franklin Small Cap |
| | | Investment Fund | | Value Fund | | Value Fund | | Value Fund |
| Purchases | $ | 264,711,069 | $ | 36,399,522 | $ | 131,379,186 | $ | 853,911,305 |
| Sales | $ | 498,233,151 | $ | 83,032,128 | $ | 135,065,666 | $ | 937,200,659 |
At October 31, 2016, in connection with securities lending transactions, the Franklin Small Cap Value Fund loaned equity investments and received $8,312,412 of cash collateral. The gross amount of recognized liability for such transactions is included in payable upon return of securities loaned in the Statement of Assets and Liabilities. The agreements can be terminated at any time.
7. Holdings of 5% Voting Securities of Portfolio Companies
The 1940 Act defines "affiliated companies" to include investments in portfolio companies in which a fund owns 5% or more of the outstanding voting securities. Investments in "affiliated companies" for Franklin Balance Sheet Investment Fund, Franklin MicroCap Value Fund and Franklin Small Cap Value Fund for the year ended October 31, 2016, were as shown below.
| | | | | | | | | | | | | |
| | Number of | | | | | Number of | | | | | | | |
| | Shares Held | | | | | Shares | | | | | | | |
| | at Beginning | Gross | | Gross | | Held at End | | Value at | | Investment | | Realized | |
| Name of Issuer | of Year | Additions | | Reductions | | of Year | | End of Year | | Income | | Gain (Loss) | |
| |
| Franklin Balance Sheet Investment Fund | | | | | | | | | | | | |
| Non-Controlled Affiliates | | | | | | | | | | | | | |
| Ruby Tuesday Inc | 3,089,000 | — | | (3,089,000 | ) | — | $ | — | $ | — | $ | (12,832,306 | ) |
| Trinity Place Holdings Inc | 1,200,000 | 298,034 | | (155,480 | ) | 1,342,554 | | 12,969,072 | | — | | (338,422 | ) |
| Total Affiliated Securities (Value is 1.4% of Net Assets) | | | | | $ | 12,969,072 | $ | — | $ | (13,170,728 | ) |
| |
| Franklin MicroCap Value Fund | | | | | | | | | | | | | |
| Non-Controlled Affiliates | | | | | | | | | | | | | |
| ACMAT Corp., A | 235,600 | — | | (39,300 | ) | 196,300 | $ | —a | $ | — | $ | 795,432 | |
| Continental Materials Corp | 129,700 | — | | (12,786 | ) | 116,914 | | 2,566,262 | | — | | (20,101 | ) |
| Delta Apparel Inc | 640,000 | — | | (184,900 | ) | 455,100 | | 7,509,150 | | — | | 3,002,128 | |
| Full House Resorts Inc | 1,600,000 | 345,304 | b | — | | 1,945,304 | | 3,170,846 | | — | | — | |
| Global Power Equipment | | | | | | | | | | | | | |
| Group Inc | 675,000 | 600,000 | | — | | 1,275,000 | | 4,717,500 | | — | | — | |
| Hardinge Inc | 934,900 | — | | (170,900 | ) | 764,000 | | 7,410,800 | | 68,476 | | 204,620 | |
| Hurco Cos. Inc | 365,000 | — | | (56,000 | ) | 309,000 | | —a | | 120,469 | | 604,245 | |
| Northeast Bancorp | 459,500 | — | | — | | 459,500 | | 5,146,400 | | 18,380 | | — | |
| Omega Protein Corp | 720,000 | — | | (420,000 | ) | 300,000 | | —a | | — | | 7,667,768 | |
| Origen Financial Inc | 1,900,000 | — | | — | | 1,900,000 | | 247,475 | | — | | — | |
| Total Affiliated Securities (Value is 9.8% of Net Assets) | | | | | $ | 30,768,433 | $ | 207,325 | $ | 12,254,092 | |
| |
| Franklin Small Cap Value Fund | | | | | | | | | | | | | |
| Non-Controlled Affiliates | | | | | | | | | | | | | |
| AAR Corp | 2,063,800 | 110,207 | b,c | (163,500 | ) | 2,010,507 | $ | 64,678,010 | $ | 622,299 | $ | (710,399 | ) |
| Hooker Furniture Corp | 582,900 | — | | (374,700 | ) | 208,200 | | —a | | 116,580 | | 1,184,605 | |
franklintempleton.com
Annual Report
85
FRANKLIN VALUE INVESTORS TRUST
NOTES TO FINANCIAL STATEMENTS
| | | | | | | | | | | | |
| 7. Holdings of 5% Voting Securities of Portfolio Companies (continued) | | | | | | | |
| |
| |
| | Number of | | | | Number of | | | | | | | |
| | Shares Held | | | | Shares | | | | | | | |
| | at Beginning | Gross | | Gross | Held at End | | | Value at | | Investment | | Realized |
| Name of Issuer | of Year | Additions | | Reductions | of Year | | | End of Year | | Income | | Gain (Loss) |
| |
| Franklin Small Cap Value Fund (continued) | | | | | | | | | | | |
| Non-Controlled Affiliates (continued) | | | | | | | | | | | |
| Landec Corp | — | 1,423,100 | b,c | — | 1,423,100 | | $ | 18,856,075 | $ | — | $ | — |
| Total Affiliated Securities (Value is 3.3% of Net Assets) | | | | | $ | 83,534,085 | $ | 738,879 | $ | 474,206 |
As of October 31, 2016, no longer an affiliate. bGross addition was the result of various corporate actions. cA portion or all of the gross additions were acquired through merger acquisitions.
8. Reorganization
On April 1, 2016, Franklin Small Cap Value Fund (Surviving Fund), pursuant to a plan of reorganization approved on March 11, 2016 by shareholders of Franklin All Cap Value Fund (Acquired Fund), acquired 100% of the Acquired Fund’s net assets, primarily made up of investment securities, which included $4,490,137 of unrealized appreciation, through a tax-free exchange of 978,297 shares of the Acquired Fund (valued at $40,950,466). Immediately after the completion of the reorganization, the combined net assets of the Surviving Fund were $2,113,985,094.
The primary reasons for the reorganization were to combine the Acquired Fund with a larger fund that had lower annual fund operating expense ratios, better long-term performance, generally similar investment goals and principal investment strategies/risks. The estimated cost of the reorganization was $122,000 of which the Surviving Fund and the Acquired Fund each paid 25% and Advisory Services paid 50%. The allocated portion of the Surviving Fund’s reorganization expenses are included with professional fees and reports to shareholders expenses in the Statement of Operations.
Assuming the reorganization had been completed on November 1, 2015, the Surviving Fund’s pro forma results of operations, would have been as follows:
| | | | | | |
| | | | | | | Net Increase |
| | | | | Net Realized and | | (Decrease) in Net |
| | | | | Unrealized Gain | | Assets from |
| Period | | Net Investment Income | | (Loss) | | Operations |
| |
| For the period November 1, 2015, through October 31, 2016 | $ | 8,628,628 | $ | 209,964,738 | $ | 218,593,366 |
Subsequent to the reorganization, the Fund has been managed as a single entity. Accordingly, it is impracticable to identify the amount of net investment income attributable to the Acquired Fund’s assets after the completion of the reorganization.
9. Credit Facility
Certain or all Funds, together with other U.S. registered and foreign investment funds (collectively, Borrowers), managed by Franklin Templeton Investments, are borrowers in a joint syndicated senior unsecured credit facility totaling $2 billion (Global Credit Facility) which matures on February 10, 2017. This Global Credit Facility provides a source of funds to the Borrowers for temporary and emergency purposes, including the ability to meet future unanticipated or unusually large redemption requests.
86 Annual Report
franklintempleton.com
FRANKLIN VALUE INVESTORS TRUST
NOTES TO FINANCIAL STATEMENTS
Under the terms of the Global Credit Facility, the Funds shall, in addition to interest charged on any borrowings made by the Funds and other costs incurred by the Funds, pay their share of fees and expenses incurred in connection with the implementation and maintenance of the Global Credit Facility, based upon their relative share of the aggregate net assets of all of the Borrowers, including an annual commitment fee of 0.07% based upon the unused portion of the Global Credit Facility. Effective February 12, 2016, the annual commitment fee is 0.15%.These fees are reflected in other expenses in the Statements of Operations. During the year ended October 31, 2016, the Funds did not use the Global Credit Facility.
10. Fair Value Measurements
The Funds follow a fair value hierarchy that distinguishes between market data obtained from independent sources (observable inputs) and the Funds’ own market assumptions (unobservable inputs). These inputs are used in determining the value of the Funds’ financial instruments and are summarized in the following fair value hierarchy:
- Level 1 – quoted prices in active markets for identical financial instruments
- Level 2 – other significant observable inputs (including quoted prices for similar financial instruments, interest rates, prepayment speed, credit risk, etc.)
- Level 3 – significant unobservable inputs (including the Fund’s own assumptions in determining the fair value of financial instruments)
The input levels are not necessarily an indication of the risk or liquidity associated with financial instruments at that level.
For movements between the levels within the fair value hierarchy, the Funds have adopted a policy of recognizing the transfers as of the date of the underlying event which caused the movement.
A summary of inputs used as of October 31, 2016, in valuing the Fund’s assets carried at fair value, is as follows:
| | | | | | | | |
| | | Level 1 | | Level 2 | | Level 3 | | Total |
| Franklin Balance Sheet Investment Fund | | | | | | | | |
| Assets: | | | | | | | | |
| Investments in Securities: | | | | | | | | |
| Equity Investments:a | | | | | | | | |
| Telecommunication Services | $ | 13,619,697 | $ | 6,110,000 | $ | — | $ | 19,729,697 |
| All Other Equity Investmentsb | | 759,826,385 | | — | | — | | 759,826,385 |
| Short Term Investments | | 164,192,937 | | — | | — | | 164,192,937 |
| Total Investments in Securities | $ | 937,639,019 | $ | 6,110,000 | $ | — | $ | 943,749,019 |
| |
| Franklin MicroCap Value Fund | | | | | | | | |
| Assets: | | | | | | | | |
| Investments in Securities: | | | | | | | | |
| Equity Investments: | | | | | | | | |
| Insurance | $ | 10,100,282 | $ | 4,451,102 | $ | — | $ | 14,551,384 |
| Real Estate | | 5,660,375 | | 92,250 | | — | | 5,752,625 |
| All Other Equity Investmentsb | | 285,167,098 | | — | | — | | 285,167,098 |
| Short Term Investments | | 8,048,646 | | — | | — | | 8,048,646 |
| Total Investments in Securities | $ | 308,976,401 | $ | 4,543,352 | $ | — | $ | 313,519,753 |
franklintempleton.com
Annual Report
87
FRANKLIN VALUE INVESTORS TRUST
NOTES TO FINANCIAL STATEMENTS
| | | | | | | | |
| 10. Fair Value Measurements (continued) | | | | | | | | |
| |
| |
| | | Level 1 | | Level 2 | | Level 3 | | Total |
| Franklin MidCap Value Fund | | | | | | | | |
| Assets: | | | | | | | | |
| Investments in Securities: | | | | | | | | |
| Equity Investmentsa,b | $ | 154,839,323 | $ | — | $ | — | $ | 154,839,323 |
| Short Term Investments | | 4,347,627 | | — | | — | | 4,347,627 |
| Total Investments in Securities | $ | 159,186,950 | $ | — | $ | — | $ | 159,186,950 |
| |
| Franklin Small Cap Value Fund | | | | | | | | |
| Assets: | | | | | | | | |
| Investments in Securities: | | | | | | | | |
| Equity Investmentsb | $ | 2,233,449,412 | $ | — | $ | — | $ | 2,233,449,412 |
| Corporate Bonds | | — | | 16,082,050 | | — | | 16,082,050 |
| Short Term Investments | | 279,727,587 | | 1,663,412 | | — | | 281,390,999 |
| Total Investments in Securities | $ | 2,513,176,999 | $ | 17,745,462 | $ | — | $ | 2,530,922,461 |
aIncludes common, convertible preferred stocks and management investment companies. bFor detailed categories, see the accompanying Statement of Investments.
A reconciliation of assets in which Level 3 inputs are used in determining fair value is presented when there are significant Level 3 financial instruments at the end of the year.
11. Subsequent Events
The Funds have evaluated subsequent events through the issuance of the financial statements and determined that no events have occurred that require disclosure.
| |
| Abbreviations |
| |
| Selected Portfolio |
| ADR | American Depositary Receipt |
| ETF | Exchange Traded Fund |
| FRN | Floating Rate Note |
88 Annual Report
franklintempleton.com
FRANKLIN VALUE INVESTORS TRUST
Report of Independent Registered Public Accounting Firm
To the Board of Trustees and Shareholders of Franklin Value Investors Trust
In our opinion, the accompanying statements of assets and liabilities, including the statements of investments, and the related statements of operations and of changes in net assets and the financial highlights present fairly, in all material respects, the financial position of Franklin Balance Sheet Investment Fund, Franklin MicroCap Value Fund, Franklin MidCap Value Fund and Franklin Small Cap Value Fund (separate portfolios of Franklin Value Investors Trust, hereafter referred to as the "Funds") as of October 31, 2016, the results of each of their operations for the year then ended, the changes in each of their net assets for each of the two years in the period then ended and the financial highlights for each of the periods presented, in conformity with accounting principles generally accepted in the United States of America. These financial statements and financial highlights (hereafter referred to as "financial statements") are the responsibility of the Funds’ management. Our responsibility is to express an opinion on these financial statements based on our audits. We conducted our audits of these financial statements in accordance with the standards of the Public Company Accounting Oversight Board (United States). Those standards require that we plan and perform the audit to obtain reasonable assurance about whether the financial statements are free of material misstatement. An audit includes examining, on a test basis, evidence supporting the amounts and disclosures in the financial statements, assessing the accounting principles used and significant estimates made by management, and evaluating the overall financial statement presentation. We believe that our audits, which included confirmation of securities as of October 31, 2016 by correspondence with the custodian, transfer agent and brokers, provide a reasonable basis for our opinion.
PricewaterhouseCoopers LLP
San Francisco, California December 16, 2016
franklintempleton.com
Annual Report
89
FRANKLIN VALUE INVESTORS TRUST
Tax Information (unaudited)
Under Section 852(b)(3)(C) of the Internal Revenue Code (Code), the Funds hereby report the maximum amount allowable but no less than the following amounts as long term capital gain dividends for the fiscal year ended October 31, 2016:
| | | | | | | | |
| Franklin | | Franklin | | Franklin | | | Franklin | |
| Balance Sheet | | MicroCap Value | | MidCap Value | | | Small Cap Value | |
| Investment Fund | | Fund | | Fund | | | Fund | |
| $156,168,174 | $ | 41,003,197 | $ | 12,326,926 | | $ | 220,271,956 | |
| |
| Under Section 871(k)(2)(C) of the Code, the Funds hereby report the maximum amount allowable but no less than the following | |
| amounts as short term capital gain dividends for purposes of the tax imposed under Section 871(a)(1)(A) of the Code for the fiscal | |
| year ended October 31, 2016: | | | | | | | | |
| |
| Franklin | | Franklin | | Franklin | | | Franklin | |
| Balance Sheet | | MicroCap Value | | MidCap Value | | | Small Cap Value | |
| Investment Fund | | Fund | | Fund | | | Fund | |
| $ — | $ | — | $ | 359,672 | | $ | — | |
| |
| Under Section 854(b)(1)(A) of the Code, the Funds hereby report the following percentage amounts of the ordinary income | |
| dividends as income qualifying for the dividends received deduction for the fiscal year ended October 31, 2016: | |
| |
| Franklin | | Franklin | | Franklin | | | Franklin | |
| Balance Sheet | | MicroCap Value | | MidCap Value | | | Small Cap Value | |
| Investment Fund | | Fund | | Fund | | | Fund | |
| 100% | | — | | 100 | % | | 100 | % |
Under Section 854(b)(1)(B) of the Code, the Funds hereby report the maximum amount allowable but no less than the following amounts as qualified dividends for purposes of the maximum rate under Section 1(h)(11) of the Code for the fiscal year ended October 31, 2016:
| | | | | | | |
| | Franklin | | Franklin | | Franklin | | Franklin |
| | Balance Sheet | | MicroCap Value | | MidCap Value | | Small Cap Value |
| | Investment Fund | | Fund | | Fund | | Fund |
| |
| $ | 14,683,236 | $ | 4,653,579 | $ | 2,734,967 | $ | 28,462,701 |
Distributions, including qualified dividend income, paid during calendar year 2016 will be reported to shareholders on Form 1099-DIV by mid-February 2017. Shareholders are advised to check with their tax advisors for information on the treatment of these amounts on their individual income tax returns.
90 Annual Report
franklintempleton.com
FRANKLIN VALUE INVESTORS TRUST
Board Members and Officers
The name, year of birth and address of the officers and board members, as well as their affiliations, positions held with the Trust, principal occupations during at least the past five years and number of U.S. registered portfolios overseen in the Franklin Templeton Investments fund complex, are shown below. Generally, each board member serves until that person’s successor is elected and qualified.
| | | | |
| Independent Board Members | | | |
| |
| | | | Number of Portfolios in | |
| Name, Year of Birth | | Length of | Fund Complex Overseen | Other Directorships Held |
| and Address | Position | Time Served | by Board Member* | During at Least the Past 5 Years |
| |
| Edward I. Altman, Ph.D. (1941) | Trustee | Since 2015 | 16 | None |
| One Franklin Parkway | | | | |
| San Mateo, CA 94403-1906 | | | | |
| Principal Occupation During at Least the Past 5 Years: | | |
| Max L. Heine Professor of Finance, Emeritus and Director of The Credit and Debt Markets Research Program, Salomon Center, Stern School |
| of Business, New York University; editor and author of numerous financial publications; financial consultant; an adviser to numerous financial |
| and publishing organizations; and formerly, Vice Director, Salomon Center, Stern School of Business, New York University. |
| |
| Ann Torre Bates (1958) | Trustee | Since 2015 | 42 | Ares Capital Corporation (specialty |
| One Franklin Parkway | | | | finance company) (2010-present), |
| San Mateo, CA 94403-1906 | | | | United Natural Foods, Inc. (distributor |
| | | | | of natural, organic and specialty foods) |
| | | | | (2013-present), Allied Capital |
| | | | | Corporation (financial services) |
| | | | | (2003-2010), SLM Corporation (Sallie |
| | | | | Mae) (1997-2014) and Navient |
| | | | | Corporation (loan management, |
| | | | | servicing and asset recovery) |
| | | | | (2014-2016). |
| Principal Occupation During at Least the Past 5 Years: | | |
| Director of various companies; and formerly, Executive Vice President and Chief Financial Officer, NHP Incorporated (manager of multifamily |
| housing) (1995-1997); and Vice President and Treasurer, US Airways, Inc. (until 1995). | |
| |
| Burton J. Greenwald (1929) | Vice | Vice | 16 | Franklin Templeton Emerging Markets |
| One Franklin Parkway | Chairman | Chairman | | Debt Opportunities Fund PLC and |
| San Mateo, CA 94403-1906 | and | since 2015 | | Fiduciary International Ireland Limited |
| | Trustee | and Trustee | | (1999-2015). |
| | | since 2001 | | |
| Principal Occupation During at Least the Past 5 Years: | | |
| Managing Director, B.J. Greenwald Associates (management consultants to the financial services industry); and formerly, Chairman, Fiduciary |
| Trust International Funds; Executive Vice President, L.F. Rothschild Fund Management, Inc.; President and Director, Merit Mutual Funds; |
| President, Underwriting Division and Director, National Securities & Research Corporation; Governor, Investment Company Institute; and |
| Chairman, ICI Public Information Committee. | | | |
| |
| Jan Hopkins Trachtman (1947) | Trustee | Since 2015 | 16 | None |
| One Franklin Parkway | | | | |
| San Mateo, CA 94403-1906 | | | | |
| Principal Occupation During at Least the Past 5 Years: | | |
| President and Founder, The Jan Hopkins Group (communications consulting firm); serves on Advisory Board of Knight Bagehot Fellowship; |
| and formerly, President, Economic Club of New York (2007-2015); Anchor/Correspondent, CNN Financial News (until 2003); Managing |
| Director and Head of Client Communications, Citigroup Private Bank (until 2005); Off-Air Reporter, ABC News’ World News Tonight; and Editor, |
| CBS Network News. | | | | |
| |
| Keith E. Mitchell (1954) | Trustee | Since 2015 | 16 | None |
| One Franklin Parkway | | | | |
| San Mateo, CA 94403-1906 | | | | |
| Principal Occupation During at Least the Past 5 Years: | | |
| Director of various boards of asset management firms; and formerly, Managing Member, Mitchell, Hartley & Bechtel Advisers, LLC (formerly, |
| Mitchell Advisers, LLC) (advisory firm) (2003-2015) and Managing Director, Putman Lovell NBF. | |
franklintempleton.com
Annual Report
91
FRANKLIN VALUE INVESTORS TRUST
| | | | |
| Independent Board Members (continued) | | |
| |
| |
| |
| | | | Number of Portfolios in | |
| Name, Year of Birth | | Length of | Fund Complex Overseen | Other Directorships Held |
| and Address | Position | Time Served | by Board Member* | During at Least the Past 5 Years |
| |
| David W. Niemiec (1949) | Trustee | Since 2011 | 42 | Emeritus Corporation (assisted living) |
| One Franklin Parkway | | | | (1999-2010) and OSI Pharmaceuticals, |
| San Mateo, CA 94403-1906 | | | | Inc. (pharmaceutical products) |
| | | | | (2006-2010). |
| Principal Occupation During at Least the Past 5 Years: | | |
| Advisor, Saratoga Partners (private equity fund); and formerly, Managing Director, Saratoga Partners (1998-2001) and SBC Warburg Dillon |
| Read (investment banking) (1997-1998); Vice Chairman, Dillon, Read & Co. Inc. (investment banking) (1991-1997); and Chief Financial Officer, |
| Dillon, Read & Co. Inc. (1982-1997). | | | |
| |
| Charles Rubens II (1930) | Trustee | Since 1989 | 16 | None |
| One Franklin Parkway | | | | |
| San Mateo, CA 94403-1906 | | | | |
| Principal Occupation During at Least the Past 5 Years: | | |
| Private investor and president of non-profit organizations; and formerly, an executive of Time, Inc.; and Trustee of Colorado College. |
| |
| Robert E. Wade (1946) | Chairman of | Chairman | 42 | El Oro Ltd (investments) |
| One Franklin Parkway | the Board and | of the | | (2003-present). |
| San Mateo, CA 94403-1906 | Trustee | Board | | |
| | | since 2015 | | |
| | | and | | |
| | | Trustee | | |
| | | since 2004 | | |
| Principal Occupation During at Least the Past 5 Years: | | |
| Attorney at law engaged in private practice (1972-2008) and member of various boards. | |
| |
| Gregory H. Williams (1943) | Trustee | Since 2008 | 16 | None |
| One Franklin Parkway | | | | |
| San Mateo, CA 94403-1906 | | | | |
| Principal Occupation During at Least the Past 5 Years: | | |
| Private investor; Consultant; and formerly, President, University of Cincinnati (2009-2012); President, The City College of New York |
| (2001-2009); Dean, College of Law, Ohio State University (1993-2001); and Associate Vice President, Academic Affairs and Professor of Law, |
| University of Iowa (1977-1993). | | | | |
| |
| |
| Interested Board Members and Officers | | |
| |
| | | | Number of Portfolios in | |
| Name, Year of Birth | | Length of | Fund Complex Overseen | Other Directorships Held |
| and Address | Position | Time Served | by Board Member* | During at Least the Past 5 Years |
| |
| **Gregory E. Johnson (1961) | Trustee | Since 2015 | 158 | None |
| One Franklin Parkway | | | | |
| San Mateo, CA 94403-1906 | | | | |
| Principal Occupation During at Least the Past 5 Years: | | |
| Chairman of the Board, Member - Office of the Chairman, Director and Chief Executive Officer, Franklin Resources, Inc.; officer and/or director |
| or trustee, as the case may be, of some of the other subsidiaries of Franklin Resources, Inc. and of 44 of the investment companies in Franklin |
| Templeton Investments; Vice Chairman, Investment Company Institute; and formerly, President, Franklin Resources, Inc. (1994-2015). |
| |
| **Jennifer M. Johnson (1964) | Trustee | Since 2015 | 15 | None |
| One Franklin Parkway | | | | |
| San Mateo, CA 94403-1906 | | | | |
| Principal Occupation During at Least the Past 5 Years: | | |
| Co-President, Franklin Resources, Inc.; officer and/or director or trustee, as the case may be, of some of the other subsidiaries of Franklin |
| Resources, Inc. and of four of the investment companies in Franklin Templeton Investments; and formerly, Chief Operating Officer and |
| Executive Vice President, Franklin Resources, Inc. (1994-2015); Executive Vice President of Operations and Technology, Franklin Resources, |
| Inc. (2005-2010); and Senior Vice President, Franklin Resources, Inc. (2003-2005). | |
92 Annual Report
franklintempleton.com
FRANKLIN VALUE INVESTORS TRUST
| | | | |
| Interested Board Members and Officers (continued) | |
| |
| |
| |
| | | | Number of Portfolios in | |
| Name, Year of Birth | | Length of | Fund Complex Overseen | Other Directorships Held |
| and Address | Position | Time Served | by Board Member* | During at Least the Past 5 Years |
| |
| Alison E. Baur (1964) | Vice President | Since 2012 | Not Applicable | Not Applicable |
| One Franklin Parkway | | | | |
| San Mateo, CA 94403-1906 | | | | |
| Principal Occupation During at Least the Past 5 Years: | | |
| Deputy General Counsel, Franklin Templeton Investments; and officer of some of the other subsidiaries of Franklin Resources, Inc. and of 45 |
| of the investment companies in Franklin Templeton Investments. | | |
| |
| Laura F. Fergerson (1962) | Chief | Since 2009 | Not Applicable | Not Applicable |
| One Franklin Parkway | Executive | | | |
| San Mateo, CA 94403-1906 | Officer- | | | |
| | Finance and | | | |
| | Administration | | | |
| Principal Occupation During at Least the Past 5 Years: | | |
| Senior Vice President, Franklin Templeton Services, LLC; Vice President, Franklin Advisers, Inc. and Franklin Templeton Institutional, LLC; and |
| officer of 45 of the investment companies in Franklin Templeton Investments. | |
| |
| Aliya S. Gordon (1973) | Vice President | Since 2009 | Not Applicable | Not Applicable |
| One Franklin Parkway | | | | |
| San Mateo, CA 94403-1906 | | | | |
| Principal Occupation During at Least the Past 5 Years: | | |
| Senior Associate General Counsel, Franklin Templeton Investments; and officer of 45 of the investment companies in Franklin Templeton |
| Investments. | | | | |
| |
| Steven J. Gray (1955) | Secretary | Secretary | Not Applicable | Not Applicable |
| One Franklin Parkway | and Vice | since 2005 | | |
| San Mateo, CA 94403-1906 | President | and Vice | | |
| | | President | | |
| | | since 2009 | | |
| Principal Occupation During at Least the Past 5 Years: | | |
| Senior Associate General Counsel, Franklin Templeton Investments; Vice President, Franklin Templeton Distributors, Inc. and Franklin |
| Alternative Strategies Advisers, LLC; and officer of 45 of the investment companies in Franklin Templeton Investments. |
| |
| Rupert H. Johnson, Jr. (1940) | Vice President | Since 1989 | Not Applicable | Not Applicable |
| One Franklin Parkway | | | | |
| San Mateo, CA 94403-1906 | | | | |
| Principal Occupation During at Least the Past 5 Years: | | |
| Vice Chairman, Member - Office of the Chairman and Director, Franklin Resources, Inc.; Director, Franklin Advisers, Inc.; Senior Vice |
| President, Franklin Advisory Services, LLC; and officer and/or director or trustee, as the case may be, of some of the other subsidiaries of |
| Franklin Resources, Inc. and of 42 of the investment companies in Franklin Templeton Investments. | |
| |
| Robert G. Kubilis (1973) | Treasurer, | Since 2012 | Not Applicable | Not Applicable |
| 300 S.E. 2nd Street | Chief Financial | | | |
| Fort Lauderdale, FL 33301-1923 | Officer and | | | |
| | Chief | | | |
| | Accounting | | | |
| | Officer | | | |
| Principal Occupation During at Least the Past 5 Years: | | |
| Treasurer, U.S. Fund Administration & Reporting, Franklin Templeton Investments; and officer of four of the investment companies in Franklin |
| Templeton Investments. | | | | |
| |
| Robert Lim (1948) | Vice President | Since May | Not Applicable | Not Applicable |
| One Franklin Parkway | – AML | 2016 | | |
| San Mateo, CA 94403-1906 | Compliance | | | |
| Principal Occupation During at Least the Past 5 Years: | | |
| Vice President, Franklin Templeton Companies, LLC; Chief Compliance Officer, Franklin Templeton Distributors, Inc. and Franklin Templeton |
| Investor Services, LLC; and officer of 45 of the investment companies in Franklin Templeton Investments. |
franklintempleton.com
Annual Report
93
FRANKLIN VALUE INVESTORS TRUST
| | | | |
| Interested Board Members and Officers (continued) | |
| |
| |
| |
| | | | Number of Portfolios in | |
| Name, Year of Birth | | Length of | Fund Complex Overseen | Other Directorships Held |
| and Address | Position | Time Served | by Board Member* | During at Least the Past 5 Years |
| |
| Kimberly H. Novotny (1972) | Vice President | Since 2013 | Not Applicable | Not Applicable |
| 300 S.E. 2nd Street | | | | |
| Fort Lauderdale, FL 33301-1923 | | | | |
| Principal Occupation During at Least the Past 5 Years: | | |
| Associate General Counsel, Franklin Templeton Investments; Vice President and Corporate Secretary, Fiduciary Trust International of the |
| South; Vice President, Templeton Investment Counsel, LLC; Assistant Secretary, Franklin Resources, Inc.; and officer of 45 of the investment |
| companies in Franklin Templeton Investments. | | | |
| |
| Robert C. Rosselot (1960) | Chief | Since 2013 | Not Applicable | Not Applicable |
| 300 S.E. 2nd Street | Compliance | | | |
| Fort Lauderdale, FL 33301-1923 | Officer | | | |
| Principal Occupation During at Least the Past 5 Years: | | |
| Director, Global Compliance, Franklin Templeton Investments; Vice President, Franklin Templeton Companies, LLC; officer of 45 of the |
| investment companies in Franklin Templeton Investments; and formerly, Senior Associate General Counsel, Franklin Templeton Investments |
| (2007-2013); and Secretary and Vice President, Templeton Group of Funds (2004-2013). | |
| |
| Karen L. Skidmore (1952) | Vice | Since 2006 | Not Applicable | Not Applicable |
| One Franklin Parkway | President | | | |
| San Mateo, CA 94403-1906 | | | | |
| Principal Occupation During at Least the Past 5 Years: | | |
| Senior Associate General Counsel, Franklin Templeton Investments; and officer of 45 of the investment companies in Franklin Templeton |
| Investments. | | | | |
| |
| Donald G. Taylor (1954) | President | Since 2014 | Not Applicable | Not Applicable |
| 55 Challenger Road, | and Chief | | | |
| Suite 501 Ridgefield Park, NJ | Executive | | | |
| 07660 | Officer- | | | |
| | Investment | | | |
| | Management | | | |
| Principal Occupation During at Least the Past 5 Years: | | |
| President and Chief Investment Officer, Franklin Advisory Services, LLC; and officer of two of the investment companies in Franklin Templeton |
| Investments. | | | | |
| |
| Navid J. Tofigh (1972) | Vice President | Since 2015 | Not Applicable | Not Applicable |
| One Franklin Parkway | | | | |
| San Mateo, CA 94403-1906 | | | | |
| Principal Occupation During at Least the Past 5 Years: | | |
| Associate General Counsel, Franklin Templeton Investments; and officer of 45 of the investment companies in Franklin Templeton Investments. |
| |
| Craig S. Tyle (1960) | Vice President | Since 2005 | Not Applicable | Not Applicable |
| One Franklin Parkway | | | | |
| San Mateo, CA 94403-1906 | | | | |
| Principal Occupation During at Least the Past 5 Years: | | |
| General Counsel and Executive Vice President, Franklin Resources, Inc.; and officer of some of the other subsidiaries of Franklin Resources, |
| Inc. and of 45 of the investment companies in Franklin Templeton Investments. | |
| |
| Lori A. Weber (1964) | Vice President | Since 2011 | Not Applicable | Not Applicable |
| 300 S.E. 2nd Street | | | | |
| Fort Lauderdale, FL 33301-1923 | | | | |
| Principal Occupation During at Least the Past 5 Years: | | |
| Senior Associate General Counsel, Franklin Templeton Investments; Assistant Secretary, Franklin Resources, Inc.; Vice President and |
| Secretary, Templeton Investment Counsel, LLC; and officer of 45 of the investment companies in Franklin Templeton Investments. |
| |
| We base the number of portfolios on each separate series of the U.S. registered investment companies within the Franklin Templeton Investments fund complex. These |
| portfolios have a common investment manager or affiliated investment managers. | | |
| **Gregory E. Johnson is considered to be an interested person of the Fund under the federal securities laws due to his position as an officer and director of Franklin |
| Resources, Inc. (Resources), which is the parent company of the Fund’s investment manager and distributor. Jennifer M. Johnson is considered to be an interested person of |
| the Fund under the federal securities laws due to her position as officer and director of Resources. | |
94 Annual Report
franklintempleton.com
FRANKLIN VALUE INVESTORS TRUST
Interested Board Members and Officers (continued)
Note 1: Rupert H. Johnson, Jr. is the uncle of Gregory E. Johnson and Jennifer M. Johnson. Gregory E. Johnson and Jennifer M. Johnson are siblings. Note 2: Officer information is current as of the date of this report. It is possible that after this date, information about officers may change.
Note 3: Effective September 30, 2016, William J. Lippman ceased to be a trustee of the Trust.
The Sarbanes-Oxley Act of 2002 and Rules adopted by the U.S. Securities and Exchange Commission require the Fund to disclose whether the Fund’s Audit Committee includes at least one member who is an audit committee financial expert within the meaning of such Act and Rules. The Fund’s Board has determined that there is at least one such financial expert on the Audit Committee and has designated David W. Niemiec as an audit committee financial expert. The Board believes that Mr. Niemiec qualifies as such an expert in view of his extensive business background and experience. Mr. Niemiec has served as a member of the Fund Audit Committee since 2013, currently serves as an Advisor to Saratoga Partners and was formerly its Managing Director from 1998 to 2001. Mr. Niemiec was formerly a director of Emeritus Corporation from 1999 to 2010 and OSI Pharmaceuticals, Inc. from 2006 to 2010, Managing Director of SBC Warburg Dillon Read from 1997 to 1998, and was Vice Chairman from 1991 to 1997 and Chief Financial Officer from 1982 to 1997 of Dillon, Read & Co. Inc. As a result of such background and experience, the Board believes that Mr. Niemiec has acquired an understanding of generally accepted accounting principles and financial statements, the general application of such principles in connection with the accounting estimates, accruals and reserves, and analyzing and evaluating financial statements that present a breadth and level of complexity of accounting issues generally comparable to those of the Fund, as well as an understanding of internal controls and procedures for financial reporting and an understanding of audit committee functions. Mr. Niemiec is an independent Board member as that term is defined under the applicable U.S. Securities and Exchange Commission Rules and Releases.
The Statement of Additional Information (SAI) includes additional information about the board members and is available, without charge, upon request.
Shareholders may call (800) DIAL BEN/342-5236 to request the SAI.
franklintempleton.com
Annual Report
95
FRANKLIN VALUE INVESTORS TRUST
Shareholder Information
Proxy Voting Policies and Procedures
The Trust’s investment manager has established Proxy Voting Policies and Procedures (Policies) that the Trust uses to determine how to vote proxies relating to portfolio securities. Shareholders may view the Trust’s complete Policies online at franklintempleton.com. Alternatively, shareholders may request copies of the Policies free of charge by calling the Proxy Group collect at (954) 527-7678 or by sending a written request to: Franklin Templeton Companies, LLC, 300 S.E. 2nd Street, Fort Lauderdale, FL 33301, Attention: Proxy Group. Copies of the Trust’s proxy voting records are also made available online at franklintempleton.com and posted on the U.S. Securities and Exchange Commission’s website at sec.gov and reflect the most recent 12-month period ended June 30.
Quarterly Statement of Investments
The Trust files a complete statement of investments with the U.S. Securities and Exchange Commission for the first and third quarters for each fiscal year on Form N-Q. Shareholders may view the filed Form N-Q by visiting the Commission’s website at sec.gov. The filed form may also be viewed and copied at the Commission’s Public Reference Room in Washington, DC. Information regarding the operations of the Public Reference Room may be obtained by calling (800) SEC-0330.
Householding of Reports and Prospectuses
You will receive each Fund’s financial reports every six months as well as an annual updated summary prospectus (prospectus available upon request). To reduce Fund expenses, we try to identify related shareholders in a household and send only one copy of the financial reports and summary prospectus. This process, called “householding,” will continue indefinitely unless you instruct us otherwise. If you prefer not to have these documents householded, please call us at (800) 632-2301. At any time you may view current prospectuses/summary prospectuses and financial reports on our website. If you choose, you may receive these documents through electronic delivery.
96 Annual Report
franklintempleton.com

Authorized for distribution only when accompanied or preceded by a summary prospectus and/or prospectus. Investors should carefully consider a fund’s investment goals, risks, charges and expenses before investing. A prospectus contains this and other information; please read it carefully before investing.
To help ensure we provide you with quality service, all calls to and from our service areas are monitored and/or recorded.
| |
| © 2016 Franklin Templeton Investments. All rights reserved. | FVIT A 12/16 |
Item 2. Code of Ethics.
(a) The Registrant has adopted a code of ethics that applies to its principal executive officers and principal financial and accounting officer.
(c) N/A
(d) N/A
(f) Pursuant to Item 12(a)(1), the Registrant is attaching as an exhibit a copy of its code of ethics that applies to its principal executive officers and principal financial and accounting officer.
Item 3. Audit Committee Financial Expert.
(a)(1) The Registrant has an audit committee financial expert serving on its audit committee.
(2) The audit committee financial expert is David W. Niemiec and he is "independent" as defined under the relevant Securities and Exchange Commission Rules and Releases.
Item 4. Principal Accountant Fees and Services.
(a) Audit Fees
The aggregate fees paid to the principal accountant for professional services rendered by the principal accountant for the audit of the registrant’s annual financial statements or for services that are normally provided by the principal accountant in connection with statutory and regulatory filings or engagements were $129,375 for the fiscal year ended October 31, 2016 and $196,819 for the fiscal year ended October 31, 2015.
(b) Audit-Related Fees
The aggregate fees paid to the principal accountant for assurance and related services rendered by the principal accountant to the registrant that are reasonably related to the performance of the audit of the registrant's financial statements and are not reported under paragraph
(a) of Item 4 were $3,011 for the fiscal year ended October 31, 2016 and $2,952 for the fiscal year ended October 31, 2015. The services for which these fees were paid included attestation services.
There were no fees paid to the principal accountant for assurance and related services rendered by the principal accountant to the registrant's investment adviser and any entity controlling, controlled by or under common control with the investment adviser that provides ongoing services to the registrant that are reasonably related to the performance of the audit of their financial statements.
(c) Tax Fees
There were no fees paid to the principal accountant for professional services rendered by the principal accountant to the registrant for tax compliance, tax advice and tax planning.
There were no fees paid to the principal accountant for professional services rendered by the principal accountant to the registrant’s investment adviser and any entity controlling, controlled by or under common control with the investment adviser that provides ongoing services to the registrant for tax compliance, tax advice and tax planning.
(d) All Other Fees
The aggregate fees paid to the principal accountant for products and services rendered by the principal accountant to the registrant not reported in paragraphs (a)-(c) of Item 4 were $0 for the fiscal year ended October 31, 2016 and $1,344 for the fiscal year ended October 31, 2015. The services for which these fees were paid include review of materials provided to the fund Board in connection with the investment management contract renewal process.
The aggregate fees paid to the principal accountant for products and services rendered by the principal accountant to the registrant’s investment adviser and any entity controlling, controlled by or under common control with the investment adviser that provides ongoing services to the registrant not reported in paragraphs (a)-(c) of Item 4 were $0 for the fiscal year ended October 31, 2016 and $9,000 for the fiscal year ended October 31, 2015. The services for which these fees were paid included review of materials provided to the fund Board in connection with the investment management contract renewal process.
(e) (1) The registrant’s audit committee is directly responsible for approving the services to be provided by the auditors, including:
(i) pre-approval of all audit and audit related services;
(ii) pre-approval of all non-audit related services to be provided to the Fund by the auditors;
(iii) pre-approval of all non-audit related services to be provided to the registrant by the auditors to the registrant’s investment adviser or to any entity that controls, is controlled by or is under common control with the registrant’s investment adviser and that provides ongoing services to the registrant where the non-audit services relate directly to the operations or financial reporting of the registrant; and
(iv) establishment by the audit committee, if deemed necessary or appropriate, as an alternative to committee pre-approval of services to be provided by the auditors, as required by paragraphs (ii) and (iii) above, of policies and procedures to permit such services to be pre-approved by other means, such as through establishment of guidelines or by action of a designated member or members of the committee; provided the policies and procedures are detailed as to the particular service and the committee is informed of each service and such policies and procedures do not include delegation of audit committee responsibilities, as contemplated under the Securities Exchange Act of 1934, to management; subject, in the case of (ii) through (iv), to any waivers, exceptions or exemptions that may be available under applicable law or rules.
(e) (2) None of the services provided to the registrant described in paragraphs (b)-(d) of Item 4 were approved by the audit committee pursuant to paragraph (c)(7)(i)(C) of Rule 2-01 of regulation S-X.
(f) No disclosures are required by this Item 4(f).
(g) The aggregate non-audit fees paid to the principal accountant for services rendered by the principal accountant to the registrant and the registrant’s investment adviser and any entity controlling, controlled by or under common control with the investment adviser that provides ongoing services to the registrant were $3,011 for the fiscal year ended October 31, 2016 and $13,296 for the fiscal year ended October 31, 2015.
(h) The registrant’s audit committee of the board has considered whether the provision of non-audit services that were rendered to the registrant’s investment adviser (not including any sub-adviser whose role is primarily portfolio management and is subcontracted with or overseen by another investment adviser), and any entity controlling, controlled by, or under common control with the investment adviser that provides ongoing services to the registrant that were not pre-approved pursuant to paragraph (c)(7)(ii) of Rule 2-01 of Regulation S-X is compatible with maintaining the principal accountant’s independence.
Item 5. Audit Committee of Listed Registrants. N/A
Item 6. Schedule of Investments. N/A
Item 7. Disclosure of Proxy Voting Policies and Procedures for Closed-End Management Investment Companies. N/A
Item 8. Portfolio Managers of Closed-End Management Investment Companies. N/A
Item 9. Purchases of Equity Securities by Closed-End Management Investment Company and Affiliated Purchasers. N/A
Item 10. Submission of Matters to a Vote of Security Holders.
There have been no changes to the procedures by which shareholders may recommend nominees to the Registrant's Board of Trustees that would require disclosure herein.
Item 11. Controls and Procedures.
(a) Evaluation of Disclosure Controls and Procedures. The Registrant maintains disclosure controls and procedures that are designed to ensure that information required to be disclosed in the Registrant’s filings under the Securities Exchange Act of 1934 and the Investment Company Act of 1940 is recorded, processed, summarized and reported within the periods specified in the rules and forms of the Securities and Exchange Commission. Such information is accumulated and communicated to the Registrant’s management, including its principal executive officer and principal financial officer, as appropriate, to allow timely decisions regarding required disclosure. The Registrant’s management, including the principal executive officer and the principal financial officer, recognizes that any set of controls and procedures, no matter how well designed and operated, can provide only reasonable assurance of achieving the desired control objectives.
Within 90 days prior to the filing date of this Shareholder Report on Form N-CSR, the Registrant had carried out an evaluation, under the supervision and with the participation of the Registrant’s management, including the Registrant’s principal executive officer and the Registrant’s principal financial officer, of the effectiveness of the design and operation of the Registrant’s disclosure controls and procedures. Based on such evaluation, the Registrant’s principal executive officer and principal financial officer concluded that the Registrant’s disclosure controls and procedures are effective.
(b) Changes in Internal Controls. There have been no changes in the Registrant’s internal controls or in other factors that could materially affect the internal controls over financial reporting subsequent to the date of their evaluation in connection with the preparation of this Shareholder Report on Form N-CSR.
Item 12. Exhibits.
(a) (1) Code of Ethics
(a)(2) Certifications pursuant to Section 302 of the Sarbanes-Oxley Act of 2002 of Laura F. Fergerson, Chief Executive Officer - Finance and Administration, and Robert G. Kubilis, Chief Financial Officer and Chief Accounting Officer
(b) Certifications pursuant to Section 906 of the Sarbanes-Oxley Act of 2002 of Laura F. Fergerson, Chief Executive Officer - Finance and Administration, and Robert G. Kubilis, Chief Financial Officer and Chief Accounting Officer
SIGNATURES
Pursuant to the requirements of the Securities Exchange Act of 1934 and the Investment Company Act of 1940, the registrant has duly caused this report to be signed on its behalf by the undersigned, thereunto duly authorized.
FRANKLIN VALUE INVESTORS TRUST
By /s/Laura F. Fergerson
Laura F. Fergerson
Chief Executive Officer –
Finance and Administration
Date December 27, 2016
Pursuant to the requirements of the Securities Exchange Act of 1934 and the Investment Company Act of 1940, this report has been signed below by the following persons on behalf of the registrant and in the capacities and on the dates indicated.
By /s/Laura F. Fergerson
Laura F. Fergerson
Chief Executive Officer –
Finance and Administration
Date December 27, 2016
By /s/Robert G. Kubilis
Robert G. Kubilis
Chief Financial Officer and
Chief Accounting Officer
Date December 27, 2016