UNITED STATES
SECURITIES AND EXCHANGE COMMISSION
Washington, DC 20549
FORM N-CSR
CERTIFIED SHAREHOLDER REPORT OF REGISTERED MANAGEMENT INVESTMENT COMPANIES
Investment Company Act file number_811-05878
__Franklin Value Investors Trust
(Exact name of registrant as specified in charter)
One Franklin Parkway, San Mateo, CA 94403-1906
(Address of principal executive offices) (Zip code)
Craig S. Tyle, One Franklin Parkway, San Mateo, CA 94403-1906
(Name and address of agent for service)
Registrant's telephone number, including area code: _650 312-2000
Date of fiscal year end: 10/31
Date of reporting period: _10/31/15
Item 1. Reports to Stockholders.

Annual Report
and Shareholder Letter
October 31, 2015
Franklin Value Investors Trust
Franklin All Cap Value Fund
Franklin Balance Sheet Investment Fund
Franklin Large Cap Value Fund
Franklin MicroCap Value Fund
Franklin MidCap Value Fund
Franklin Small Cap Value Fund

Sign up for electronic delivery at franklintempleton.com/edelivery
| |
| Contents | |
| Annual Report | |
| Economic and Market Overview | 3 |
| Franklin All Cap Value Fund | 4 |
| Franklin Balance Sheet Investment Fund | 14 |
| Franklin Large Cap Value Fund | 24 |
| Franklin MicroCap Value Fund | 34 |
| Franklin MidCap Value Fund | 42 |
| Franklin Small Cap Value Fund | 52 |
| Financial Highlights and Statements of Investments | 62 |
| Financial Statements | 109 |
| Notes to Financial Statements | 118 |
| Report of Independent Registered | |
| Public Accounting Firm | 135 |
| Tax Information | 136 |
| Board Members and Officers | 137 |
| Meeting of Shareholders | 142 |
| Shareholder Information | 145 |
Visit franklintempleton.com for fund updates,
to access your account, or to find helpful
financial planning tools.
|
2 Annual Report franklintempleton.com
Annual Report
Economic and Market Overview
The U.S. economy grew moderately during the 12 months under review. After recording a small gain in 2015’s first quarter, the economy strengthened in the second quarter but moderated in the third quarter despite healthy consumer spending. Businesses cut back on inventories, exports slowed, and state and local governments reduced their spending. In contrast, non-manufacturing activities strengthened. The unemployment rate declined to 5.0% at period-end, the lowest level in more than seven years.1 Housing market data were generally encouraging as existing home sales and prices rose amid low mortgage rates. Retail sales grew modestly, driven by automobile and auto component sales. Inflation remained subdued, but after two consecutive declines, monthly inflation, as measured by the Consumer Price Index, rose in October as prices for energy and other goods increased.
During the period, the Federal Reserve (Fed) kept its target interest rate at 0%–0.25% while considering when an increase might be appropriate. Although global financial markets anticipated an increase, in September and October the Fed kept interest rates unchanged and said it expected moderate economic expansion, but it would continue to monitor developments domestically and abroad.
Although U.S. stock markets experienced sell-offs at times during the period, investor confidence generally grew as corporate profits remained healthy, the Fed kept its target interest rate low, the eurozone economy improved, China implemented more stimulus measures and Greece reached an agreement with its creditors. Toward period-end, U.S. stocks rallied amid easing concerns about China and increased optimism that certain central banks might introduce additional stimulus measures. Despite periods of volatility, the broad U.S. stock market, as measured by the Standard & Poor’s® 500 Index, had a moderate gain. However, large capitalization value stocks, as measured by the Russell 1000® Value Index, were relatively flat, while small capitalization value stocks, as measured by the Russell 2000® Value Index, registered a loss.
1. Source: Bureau of Labor Statistics.
franklintempleton.com
Annual Report
|
3
Franklin All Cap Value Fund
This annual report for Franklin All Cap Value Fund covers the fiscal year ended October 31, 2015. Effective December 10, 2015, the Fund will close to all new investments (with limited exceptions), in preparation for a proposed Fund reorganization subject to shareholder approval.
Your Fund’s Goal and Main Investments
The Fund seeks long-term total return by primarily investing in stocks of companies of any size that we believe are undervalued at the time of purchase and have the potential for capital appreciation.
Performance Overview
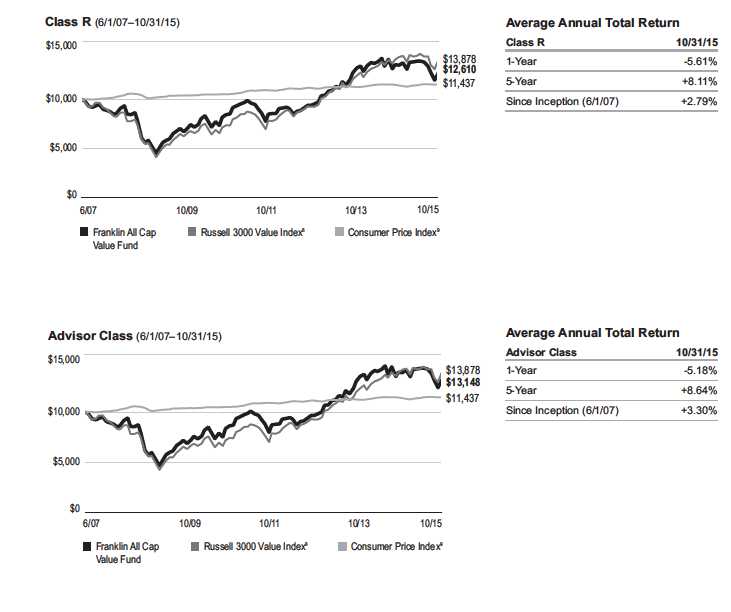
For the 12 months under review, the Fund’s Class A shares had a -5.45% cumulative total return. In comparison, the Russell 3000® Value Index, which measures performance of those Russell 3000® Index companies with lower price-to-book ratios and lower forecasted growth values, generated a +0.24% total return.1 Although this report covers a 12-month period, our investment strategy aims for long-term results. You can find the Fund’s long-term performance data in the Performance Summary beginning on page 7.
Performance data represent past performance, which does not guarantee future results. Investment return and principal value will fluctuate, and you may have a gain or loss when you sell your shares. Current performance may differ from figures shown. Please visit franklintempleton.com or call (800) 342-5236 for most recent month-end performance.
Investment Strategy
Our goal is to invest in stocks of companies of any size that we determine are currently undervalued and have the potential for capital appreciation. The Fund purchases securities that are out of favor in the market for reasons we believe will prove to be temporary in nature, or that appear to be inexpensive measured by factors such as price relative to earnings, book value or cash flow. In addition, the Fund may invest in companies with valuable intangibles we believe are not reflected in the stock price. This strategy is not aimed at short-term trading gains, nor do we consider the composition of any index. Rather, we try to identify attractively priced, financially sound companies that meet our investment criteria, and we assume at purchase that we will hold the positions for several years.

1. Source: Morningstar.
The index is unmanaged and includes reinvested dividends. One cannot invest directly in an index, and an index is not representative of the Fund’s portfolio. See www.franklintempletondatasources.com for additional data provider information.
The dollar value, number of shares or principal amount, and names of all portfolio holdings are listed in the Fund’s Statement of Investments (SOI).
The SOI begins on page 66.
|
4 Annual Report
franklintempleton.com
FRANKLIN ALL CAP VALUE FUND
Manager’s Discussion
During the 12 months under review, holdings that helped absolute Fund performance included Gibraltar Industries, Universal Forest Products and The Pep Boys – Manny, Moe & Jack. Gibraltar Industries, a construction infrastructure products manufacturer, benefited from increased investor confidence in management’s long-term plans to improve profitability and a positive response to a recently announced strategic acquisition. We sold shares of Gibraltar as it reached our target price, but we still had a meaningful position believing the company had an attractive long-term outlook. Universal Forest Products, a wood-based constructions materials provider, reported better-than-expected earnings due to strong overall demand and penetration into new markets. The Pep Boys, an automobile sales and services provider, received a cash takeover offer from Bridgestone at nearly a 24% premium to the prior day’s closing price.
Detractors from absolute Fund performance included PHI, Axiall and Unit Corp. PHI provides helicopter transportation to the offshore energy industry and air medical services. Lower energy prices led PHI’s customers to cancel or delay capital projects, which reduced flight hours and revenue for PHI. Axiall, a chemical and building products manufacturer, was negatively affected by weaker-than-expected end-market pricing due to industry-wide chlor-alkali capacity expansions and still relatively weak demand. The company replaced its chief executive officer and is implementing cost-cutting measures to offset weakness while simultaneously exploring alternatives for its building products business. Given the recent changes, we believe Axiall has the potential for share price appreciation as global growth worries abate and energy prices stabilize over time. Shares of Unit Corp., an onshore provider of drilling rigs, experienced a negative impact from a sharp drop in oil prices that began in mid-2014. The company’s subsequent reduction in its rig count was also expected to hinder earnings.
| | |
| Top 10 Holdings | | |
| 10/31/15 | | |
| Company | % of Total | |
| Sector/Industry | Net Assets | |
| AAR Corp. | 4.4 | % |
| Aerospace & Defense | | |
| The Kraft Heinz Co. | 3.8 | % |
| Food, Beverage & Tobacco | | |
| Universal Forest Products Inc. | 3.0 | % |
| Building Products | | |
| Axiall Corp. | 2.9 | % |
| Materials | | |
| Maple Leaf Foods Inc. (Canada) | 2.9 | % |
| Food, Beverage & Tobacco | | |
| Orbcomm Inc. | 2.8 | % |
| Telecommunication Services | | |
| The Pep Boys – Manny, Moe & Jack | 2.8 | % |
| Retailing | | |
| Gibraltar Industries Inc. | 2.8 | % |
| Building Products | | |
| Sanofi, ADR (France) | 2.7 | % |
| Pharmaceuticals, Biotechnology & Life Sciences | | |
| Insteel Industries Inc. | 2.5 | % |
| Building Products | | |
During the reporting period, some of our large new purchases were Orbcomm, a wireless communications provider; Sanofi, a pharmaceutical producer; Prudential Financial, an insurance provider and investment manager; The Kraft Heinz Co. a food and beverage producer; Mattel, a toy manufacturer; The Men’s Wearhouse, a men’s clothing retailer; and LTC Properties, a health care facility real estate investment trust. We also added to several existing positions including AAR, an aviation and government defense services and products provider; Everbank Financial, a commercial bank; and the aforementioned Axiall, among others. Conversely, we liquidated positions in Royal Caribbean Cruises, L.B. Foster and QUALCOMM, among others. We also reduced several positions including Corning, Omega Protein, Target and Gibraltar Industries.
franklintempleton.com
Annual Report
|
5
FRANKLIN ALL CAP VALUE FUND
As fellow shareholders, we found recent Fund performance disappointing. Although the market has not favored our value investing style in recent years, we have maintained our disciplined process and continue to believe it can reward investors over the long term. Thank you for your continued participation in Franklin All Cap Value Fund. We look forward to continuing to serve your investment needs.

Donald G. Taylor, CPA
Bruce C. Baughman, CPA
Portfolio Management Team
The foregoing information reflects our analysis, opinions and portfolio holdings as of October 31, 2015, the end of the reporting period. The way we implement our main investment strategies and the resulting portfolio holdings may change depending on factors such as market and economic conditions. These opinions may not be relied upon as investment advice or an offer for a particular security. The information is not a complete analysis of every aspect of any market, country, industry, security or the Fund. Statements of fact are from sources considered reliable, but the investment manager makes no representation or warranty as to their completeness or accuracy. Although historical performance is no guarantee of future results, these insights may help you understand our investment management philosophy.
|
6 Annual Report
franklintempleton.com
FRANKLIN ALL CAP VALUE FUND
Performance Summary as of October 31, 2015
Your dividend income will vary depending on dividends or interest paid by securities in the Fund’s portfolio, adjusted for operating expenses of each class. Capital gain distributions are net profits realized from the sale of portfolio securities. The performance table and graphs do not reflect any taxes that a shareholder would pay on Fund dividends, capital gain distributions, if any, or any realized gains on the sale of Fund shares. Total return reflects reinvestment of the Fund’s dividends and capital gain distributions, if any, and any unrealized gains or losses.
| | | | | | |
| Net Asset Value | | | | | | |
| Share Class (Symbol) | | 10/31/15 | | 10/31/14 | | Change |
| A (FRAVX) | $ | 11.87 | $ | 13.01 | -$ | 1.14 |
| C (N/A) | $ | 11.55 | $ | 12.74 | -$ | 1.19 |
| R (N/A) | $ | 11.86 | $ | 13.00 | -$ | 1.14 |
| Advisor (N/A) | $ | 11.94 | $ | 13.09 | -$ | 1.15 |
| |
| |
| Distributions1 (11/1/14–10/31/15) | | | | | | |
| | | Dividend | | Long-Term | | |
| Share Class | | Income | | Capital Gain | | Total |
| A | $ | 0.0094 | $ | 0.4254 | $ | 0.4348 |
| C | | — | $ | 0.4254 | $ | 0.4254 |
| R | $ | 0.0008 | $ | 0.4254 | $ | 0.4262 |
| Advisor | $ | 0.0499 | $ | 0.4254 | $ | 0.4753 |
franklintempleton.com
Annual Report
|
7
FRANKLIN ALL CAP VALUE FUND
PERFORMANCE SUMMARY
Performance as of 10/31/152
Cumulative total return excludes sales charges. Average annual total returns and value of $10,000 investment include maximum sales charges. Class A: 5.75% maximum initial sales charge; Class C: 1% contingent deferred sales charge in first year only;
Class R/Advisor Class: no sales charges.
| | | | | | | | | | | | |
| | | | | | | | | | Total Annual Operating Expenses7 | |
| | Cumulative | | Average Annual | | | Value of | Average Annual | | | | | |
| Share Class | Total Return3 | | Total Return4 $10,000 Investment5 | Total Return (9/30/15)6 | | (with waiver) | | (without waiver) | |
| A | | | | | | | | | 1.25 | % | 1.42 | % |
| 1-Year | -5.45 | % | -10.86 | % | $ | 8,914 | -13.56 | % | | | | |
| 5-Year | +49.13 | % | +7.05 | % | $ | 14,060 | +6.39 | % | | | | |
| Since Inception (6/1/07) +28.12% | | +2.27 | % | $ | 12,075 | +1.53 | % | | | | |
| C | | | | | | | | | 1.95 | % | 2.12 | % |
| 1-Year | -6.05 | % | -6.96 | % | $ | 9,304 | -9.83 | % | | | | |
| 5-Year | +43.97 | % | +7.56 | % | $ | 14,397 | +6.89 | % | | | | |
| Since Inception (6/1/07) +20.91% | | +2.28 | % | $ | 12,091 | +1.55 | % | | | | |
| R | | | | | | | | | 1.45 | % | 1.62 | % |
| 1-Year | -5.61 | % | -5.61 | % | $ | 9,439 | -8.44 | % | | | | |
| 5-Year | +47.66 | % | +8.11 | % | $ | 14,766 | +7.45 | % | | | | |
| Since Inception (6/1/07) +26.10% | | +2.79 | % | $ | 12,610 | +2.07 | % | | | | |
| Advisor | | | | | | | | | 0.95 | % | 1.12 | % |
| 1-Year | -5.18 | % | -5.18 | % | $ | 9,482 | -8.01 | % | | | | |
| 5-Year | +51.32 | % | +8.64 | % | $ | 15,132 | +7.99 | % | | | | |
| Since Inception (6/1/07) +31.48% | | +3.30 | % | $ | 13,148 | +2.58 | % | | | | |
Performance data represent past performance, which does not guarantee future results. Investment return and principal value will fluctuate, and you may have a gain or loss when you sell your shares. Current performance may differ from figures shown. For most recent month-end performance, go to franklintempleton.com or call (800) 342-5236.
|
8 Annual Report
franklintempleton.com
FRANKLIN ALL CAP VALUE FUND
PERFORMANCE SUMMARY
Total Return Index Comparison for a Hypothetical $10,000 Investment2
Total return represents the change in value of an investment over the periods shown. It includes any applicable maximum sales charge, Fund expenses, account fees and reinvested distributions. The unmanaged index includes reinvestment of any income or distributions. It differs from the Fund in composition and does not pay management fees or expenses. One cannot invest directly in an index.

|
franklintempleton.com Annual Report 9
FRANKLIN ALL CAP VALUE FUND
PERFORMANCE SUMMARY
Total Return Index Comparison for a Hypothetical $10,000 Investment2 (continued)
|
10 Annual Report franklintempleton.com
FRANKLIN ALL CAP VALUE FUND
PERFORMANCE SUMMARY
All investments involve risks, including possible loss of principal. Value securities may not increase in price as anticipated or may decline further in value. While smaller and midsize companies may offer substantial opportunities for capital growth, they also involve heightened risks and should be considered speculative. Historically, smaller and midsize company securities have been more volatile in price than larger company securities, especially over the short term. The Fund may invest up to 25% of its total assets in foreign securities, which may involve special risks, including currency fluctuations and economic and political uncertainty. The Fund is actively managed but there is no guarantee that the manager’s investment decisions will produce the desired results. The Fund’s prospectus also includes a description of the main investment risks.
| |
| Class C: | These shares have higher annual fees and expenses than Class A shares. |
| Class R: | Shares are available to certain eligible investors as described in the prospectus. These shares have higher annual fees and expenses than Class A shares. |
| Advisor Class: | Shares are available to certain eligible investors as described in the prospectus. |
1. The distribution amount is the sum of the dividend payments to shareholders for the period shown and includes only estimated tax-basis net investment income and
capital gain.
2. The Fund has an expense reduction contractually guaranteed through at least 2/29/16 and a fee waiver associated with any investment in a Franklin Templeton money
fund, contractually guaranteed through at least its current fiscal year-end. Fund investment results reflect the expense reduction and fee waiver, to the extent applicable;
without these reductions, the results would have been lower.
3. Cumulative total return represents the change in value of an investment over the periods indicated.
4. Average annual total return represents the average annual change in value of an investment over the periods indicated.
5. These figures represent the value of a hypothetical $10,000 investment in the Fund over the periods indicated.
6. In accordance with SEC rules, we provide standardized average annual total return information through the latest calendar quarter.
7. Figures are as stated in the Fund’s current prospectus. In periods of market volatility, assets may decline significantly, causing total annual Fund operating expenses to
become higher than the figures shown.
8. Source: Morningstar. The Russell 3000 Value Index is market capitalization weighted and measures performance of those Russell 3000 Index companies with lower
price-to-book ratios and lower forecasted growth values.
9. Source: Bureau of Labor Statistics, bls.gov/cpi. The Consumer Price Index is a commonly used measure of the inflation rate.
See www.franklintempletondatasources.com for additional data provider information.
|
franklintempleton.com Annual Report 11
FRANKLIN ALL CAP VALUE FUND
Your Fund’s Expenses
As a Fund shareholder, you can incur two types of costs:
- Transaction costs, including sales charges (loads) on Fund purchases; and
- Ongoing Fund costs, including management fees, distribu- tion and service (12b-1) fees, and other Fund expenses. All mutual funds have ongoing costs, sometimes referred to as operating expenses.
The following table shows ongoing costs of investing in the Fund and can help you understand these costs and compare them with those of other mutual funds. The table assumes a $1,000 investment held for the six months indicated.
Actual Fund Expenses
The first line (Actual) for each share class listed in the table provides actual account values and expenses. The “Ending Account Value” is derived from the Fund’s actual return, which includes the effect of Fund expenses.
You can estimate the expenses you paid during the period by following these steps. Of course, your account value and expenses will differ from those in this illustration:
| 1. | Divide your account value by $1,000. |
| | If an account had an $8,600 value, then $8,600 ÷ $1,000 = 8.6. |
| 2. | Multiply the result by the number under the heading “Expenses Paid During Period.” |
| | If Expenses Paid During Period were $7.50, then 8.6 x $7.50 = $64.50. |
In this illustration, the estimated expenses paid this period are $64.50.
Hypothetical Example for Comparison with Other Funds
Information in the second line (Hypothetical) for each class in the table can help you compare ongoing costs of investing in the Fund with those of other mutual funds. This information may not be used to estimate the actual ending account balance or expenses you paid during the period. The hypothetical “Ending Account Value” is based on the actual expense ratio for each class and an assumed 5% annual rate of return before expenses, which does not represent the Fund’s actual return. The figure under the heading “Expenses Paid During Period” shows the hypothetical expenses your account would have incurred under this scenario. You can compare this figure with the 5% hypothetical examples that appear in shareholder reports of other funds.
Please note that expenses shown in the table are meant to highlight ongoing costs and do not reflect any transaction costs, such as sales charges. Therefore, the second line for each class is useful in comparing ongoing costs only, and will not help you compare total costs of owning different funds. In addition, if transaction costs were included, your total costs would have been higher. Please refer to the Fund prospectus for additional information on operating expenses.
|
12 Annual Report
franklintempleton.com
FRANKLIN ALL CAP VALUE FUND
YOUR FUND’S EXPENSES
| | | | | | |
| | | Beginning Account | | Ending Account | | Expenses Paid During |
| Share Class | | Value 5/1/15 | | Value 10/31/15 | | Period* 5/1/15–10/31/15 |
| A | | | | | | |
| Actual | $ | 1,000 | $ | 921.60 | $ | 5.91 |
| Hypothetical (5% return before expenses) | $ | 1,000 | $ | 1,019.06 | $ | 6.21 |
| C | | | | | | |
| Actual | $ | 1,000 | $ | 918.10 | $ | 9.38 |
| Hypothetical (5% return before expenses) | $ | 1,000 | $ | 1,015.43 | $ | 9.86 |
| R | | | | | | |
| Actual | $ | 1,000 | $ | 920.00 | $ | 7.02 |
| Hypothetical (5% return before expenses) | $ | 1,000 | $ | 1,017.90 | $ | 7.37 |
| Advisor | | | | | | |
| Actual | $ | 1,000 | $ | 922.70 | $ | 4.60 |
| Hypothetical (5% return before expenses) | $ | 1,000 | $ | 1,020.42 | $ | 4.84 |
*Expenses are calculated using the most recent six-month expense ratio, net of expense waivers, annualized for each class (A: 1.22%;
C: 1.94%; R: 1.45%; and Advisor: 0.95%), multiplied by the average account value over the period, multiplied by 184/365 to reflect the
one-half year period.
franklintempleton.com
Annual Report
|
13
Franklin Balance Sheet Investment Fund
This annual report for Franklin Balance Sheet Investment Fund covers the fiscal year ended October 31, 2015.
Your Fund’s Goal and Main Investments
The Fund seeks high total return, of which capital appreciation and income are components, by investing most of its assets in equity securities of companies of any size that we believe are undervalued in the marketplace at the time of purchase but have the potential for capital appreciation.
Performance Overview
For the 12 months under review, the Fund’s Class A shares had a -7.73% cumulative total return. In comparison, the Russell 3000® Value Index, which measures performance of those Russell 3000® Index companies with lower price-to-book ratios and lower forecasted growth values, generated a +0.24% total return.1 Although this report covers a 12-month period, our investment strategy aims for long-term results. You can find the Fund’s long-term performance data in the Performance Summary beginning on page 17.
Performance data represent past performance, which does not guarantee future results. Investment return and principal value will fluctuate, and you may have a gain or loss when you sell your shares. Current performance may differ from figures shown. Please visit franklintempleton.com or call (800) 342-5236 for most recent month-end performance.
Investment Strategy
Our strategy uses low price-to-book value as its primary reference valuation measure. Book value per share is a company’s net worth or shareholders’ equity on an accounting or “book” basis, divided by shares outstanding. The equity securities bought by the Fund will typically be purchased at a low price relative to book value. This strategy is not aimed at short-term trading gains, and we do not adhere to the composition of the benchmark. Rather, we try to identify individual companies that meet our investment criteria, with a 3-5 year investment horizon.
1. Source: Morningstar.
The index is unmanaged and includes reinvested dividends. One cannot invest directly in an index, and an index is not representative of the Fund’s portfolio. See www.franklintempletondatasources.com for additional data provider information.
The dollar value, number of shares or principal amount, and names of all portfolio holdings are listed in the Fund’s Statement of Investments (SOI).
The SOI begins on page 74.
|
14 Annual Report
franklintempleton.com
FRANKLIN BALANCE SHEET INVESTMENT FUND
Manager’s Discussion
During the 12 months under review, holdings that helped absolute Fund performance included StanCorp Financial Group, HCC Insurance Holdings and Fresh Del Monte Produce. StanCorp Financial Group, an insurance provider and asset manager, received a cash takeover offer from Meiji Yasuda Life Insurance at nearly a 50% premium to the prior day’s closing price. HCC Insurance Holdings, a specialty insurance provider, received an offer from Tokio Marine Holding at a 38% premium to its prior day’s closing price. Fresh Del Monte Produce, a fruit producer and marketer, reported three consecutive quarters of significant earnings growth as the global banana market experienced increased demand and price stabilization. The company was successful in its efforts to focus on higher value products and geographic expansion by leveraging its existing infrastructure and relationships.
Detractors from absolute Fund performance included Intrepid Potash, Cloud Peak Energy and PHI. Shares of Intrepid Potash, a potash producer and mine operator, declined as low crop prices, a strong U.S. dollar and an influx of new supply led to weaker potash prices. These conditions threatened the viability of a high-production-cost mine. Cloud Peak Energy, a coal mine owner and operator, experienced a difficult pricing environment for its Powder River Basin coal as the decline of natural gas prices encouraged utility customers to switch from coal to gas. Moreover, a price decline in the seaborne thermal coal market also negatively impacted the company’s export tonnage. PHI provides helicopter transportation to the offshore energy industry and air medical services. Lower energy prices led PHI’s customers to cancel or delay capital projects, which reduced flight hours and revenue for PHI.
During the reporting period, some of our large new purchases were Ruby Tuesday, a restaurant chain; Bio-Rad Laboratories, a specialty chemicals producer; Occidental Petroleum, an oil and gas producer; News Corp., a media and information services provider; M.D.C. Holdings, a lender and housing
| | |
| Top 10 Holdings | | |
| 10/31/15 | | |
| Company | % of Total | |
| Sector/Industry | Net Assets | |
| Corning Inc. | 3.9 | % |
| Technology Hardware & Equipment | | |
| E-L Financial Corp. Ltd. | 2.7 | % |
| Life & Health Insurance | | |
| First Solar Inc. | 2.6 | % |
| Semiconductors & Semiconductor Equipment | | |
| Citigroup Inc. | 2.5 | % |
| Banks | | |
| National Western Life Group Inc., A | 2.5 | % |
| Life & Health Insurance | | |
| The Chubb Corp. | 2.4 | % |
| Property & Casualty Insurance | | |
| Photronics Inc. | 2.3 | % |
| Semiconductors & Semiconductor Equipment | | |
| MetLife Inc. | 2.3 | % |
| Life & Health Insurance | | |
| KeyCorp | 2.3 | % |
| Banks | | |
| Prudential Financial Inc. | 2.3 | % |
| Life & Health Insurance | | |
developer; Fabrinet, an electronic manufacturing services provider; and QEP Resources, an oil and gas producer. We also added to existing positions including Cloud Peak Energy, mentioned earlier; First Solar, a solar power provider; Ingram Micro, a technology distribution provider; Photronics, a pho-tomask (microscopic electronic circuit images) retailer; and Apache, an oil and gas producer; among others. In contrast, some of the largest liquidations included Ashland, Reliance Steel & Aluminum, Old Republic International, Tidewater and the aforementioned HCC Insurance Holdings, among others. We reduced several positions including Archer Daniels Midland, Selective Insurance Group, Bunge, Citigroup, Assurant, Vail Resorts, Allegheny Technologies and KeyCorp.
franklintempleton.com
Annual Report
|
15
FRANKLIN BALANCE SHEET INVESTMENT FUND
As fellow shareholders, we found recent Fund performance disappointing. Although the market has not favored our value investing style in recent years, we have maintained our disciplined process and continue to believe it can reward investors over the long term. Thank you for your continued participation in Franklin Balance Sheet Investment Fund. We look forward to continuing to serve your investment needs.

Bruce C. Baughman, CPA
Donald G. Taylor, CPA
Portfolio Management Team
The foregoing information reflects our analysis, opinions and portfolio holdings as of October 31, 2015, the end of the reporting period. The way we implement our main investment strategies and the resulting portfolio holdings may change depending on factors such as market and economic conditions. These opinions may not be relied upon as investment advice or an offer for a particular security. The information is not a complete analysis of every aspect of any market, country, industry, security or the Fund. Statements of fact are from sources considered reliable, but the investment manager makes no representation or warranty as to their completeness or accuracy. Although historical performance is no guarantee of future results, these insights may help you understand our investment management philosophy.
|
16 Annual Report
franklintempleton.com
FRANKLIN BALANCE SHEET INVESTMENT FUND
Performance Summary as of October 31, 2015
Your dividend income will vary depending on dividends or interest paid by securities in the Fund’s portfolio, adjusted for operating expenses of each class. Capital gain distributions are net profits realized from the sale of portfolio securities. The performance table and graphs do not reflect any taxes that a shareholder would pay on Fund dividends, capital gain distributions, if any, or any realized gains on the sale of Fund shares. Total return reflects reinvestment of the Fund’s dividends and capital gain distributions, if any, and any unrealized gains or losses.
| | | | | | | | |
| Net Asset Value | | | | | | | | |
| Share Class (Symbol) | | 10/31/15 | | 10/31/14 | | Change | | |
| A (FRBSX) | $ | 40.06 | $ | 51.55 | -$ | 11.49 | | |
| C (FCBSX) | $ | 38.70 | $ | 50.22 | -$ | 11.52 | | |
| R (FBSRX) | $ | 40.06 | $ | 51.48 | -$ | 11.42 | | |
| R6 (FBSIX) | $ | 41.10 | $ | 52.70 | -$ | 11.60 | | |
| Advisor (FBSAX) | $ | 41.08 | $ | 52.68 | -$ | 11.60 | | |
| |
| |
| Distributions1 (11/1/14–10/31/15) | | | | | | | | |
| | | Dividend | | Short-Term | | Long-Term | | |
| Share Class | | Income | | Capital Gain | | Capital Gain | | Total |
| A | $ | 0.1685 | $ | 0.7874 | $ | 6.7992 | $ | 7.7551 |
| C | | — | $ | 0.7874 | $ | 6.7992 | $ | 7.5866 |
| R | $ | 0.0067 | $ | 0.7874 | $ | 6.7992 | $ | 7.5933 |
| R6 | $ | 0.3856 | $ | 0.7874 | $ | 6.7992 | $ | 7.9722 |
| Advisor | $ | 0.3057 | $ | 0.7874 | $ | 6.7992 | $ | 7.8923 |
franklintempleton.com
Annual Report
|
17
FRANKLIN BALANCE SHEET INVESTMENT FUND
PERFORMANCE SUMMARY
Performance as of 10/31/152
Cumulative total return excludes sales charges. Average annual total returns and value of $10,000 investment include maximum sales charges. Class A: 5.75% maximum initial sales charge; Class C: 1% contingent deferred sales charge in first year only;
Class R/R6/Advisor Class: no sales charges.
| | | | | | | | | | | | |
| | | | | | | | | | Total Annual Operating Expenses7 | |
| | Cumulative | | Average Annual | | | Value of | Average Annual | | | | | |
| Share Class | Total Return3 | | Total Return4 | | $ | 10,000 Investment5 | Total Return (9/30/15)6 | | (with waiver) | | (without waiver) | |
| A | | | | | | | | | 0.90 | % | 0.91 | % |
| 1-Year | -7.73 | % | -13.02 | % | $ | 8,698 | -18.48 | % | | | | |
| 5-Year | +50.94 | % | +7.31 | % | $ | 14,227 | +6.77 | % | | | | |
| 10-Year | +54.32 | % | +3.82 | % | $ | 14,545 | +2.94 | % | | | | |
| C | | | | | | | | | 1.65 | % | 1.66 | % |
| 1-Year | -8.41 | % | -9.18 | % | $ | 9,082 | -14.88 | % | | | | |
| 5-Year | +45.40 | % | +7.77 | % | $ | 14,540 | +7.24 | % | | | | |
| 10-Year | +43.04 | % | +3.64 | % | $ | 14,304 | +2.77 | % | | | | |
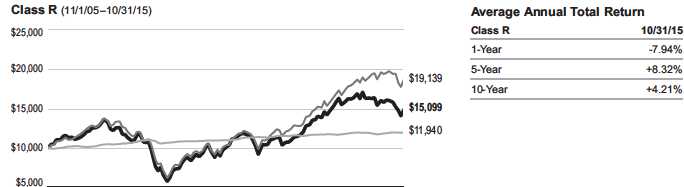
| R | | | | | | | | | 1.15 | % | 1.16 | % |
| 1-Year | -7.94 | % | -7.94 | % | $ | 9,206 | -13.73 | % | | | | |
| 5-Year | +49.10 | % | +8.32 | % | $ | 14,910 | +7.77 | % | | | | |
| 10-Year | +50.99 | % | +4.21 | % | $ | 15,099 | +3.32 | % | | | | |
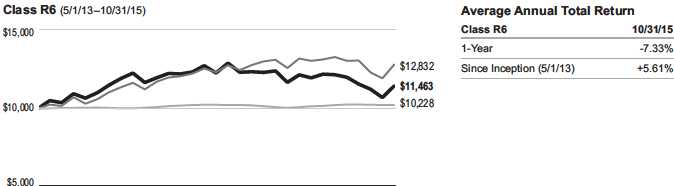
| R6 | | | | | | | | | 0.50 | % | 0.51 | % |
| 1-Year | -7.33 | % | -7.33 | % | $ | 9,267 | -13.15 | % | | | | |
| Since Inception (5/1/13) +14.63% | | +5.61 | % | $ | 11,463 | +2.89 | % | | | | |
| Advisor | | | | | | | | | 0.65 | % | 0.66 | % |
| 1-Year | -7.51 | % | -7.51 | % | $ | 9,249 | -13.30 | % | | | | |
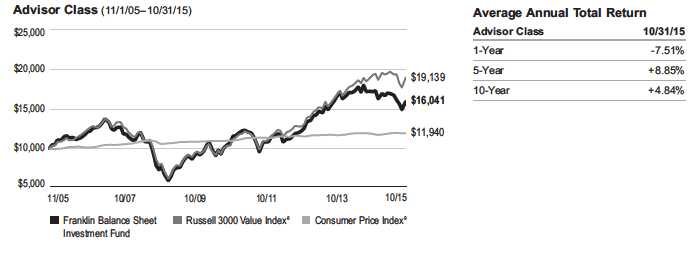
| 5-Year | +52.81 | % | +8.85 | % | $ | 15,281 | +8.30 | % | | | | |
| 10-Year | +60.41 | % | +4.84 | % | $ | 16,041 | +3.95 | % | | | | |
Performance data represent past performance, which does not guarantee future results. Investment return and principal value will fluctuate, and you may have a gain or loss when you sell your shares. Current performance may differ from figures shown. For most recent month-end performance, go to franklintempleton.com or call (800) 342-5236.
|
18 Annual Report
franklintempleton.com
FRANKLIN BALANCE SHEET INVESTMENT FUND
PERFORMANCE SUMMARY
Total Return Index Comparison for a Hypothetical $10,000 Investment2
Total return represents the change in value of an investment over the periods shown. It includes any applicable maximum sales charge, Fund expenses, account fees and reinvested distributions. The unmanaged index includes reinvestment of any income or distributions. It differs from the Fund in composition and does not pay management fees or expenses. One cannot invest directly in an index.

|
franklintempleton.com Annual Report 19
FRANKLIN BALANCE SHEET INVESTMENT FUND
PERFORMANCE SUMMARY
Total Return Index Comparison for a Hypothetical $10,000 Investment2 (continued)

|
20 Annual Report
franklintempleton.com
FRANKLIN BALANCE SHEET INVESTMENT FUND
PERFORMANCE SUMMARY
Total Return Index Comparison for a Hypothetical $10,000 Investment2 (continued)
All investments involve risks, including possible loss of principal. Value securities may not increase in price as anticipated or may decline further in value. While smaller and midsize companies may offer substantial opportunities for capital growth, they also involve heightened risks and should be considered speculative. Historically, smaller and midsize company securities have been more volatile in price than larger company securities, especially over the short term. The Fund may invest up to 25% of its total assets in foreign securities, which may involve special risks, including currency fluctuations and economic and political uncertainty. The Fund is actively managed but there is no guarantee that the manager’s investment decisions will produce the desired results. The Fund’s prospectus also includes a description of the main investment risks.
Class C: These shares have higher annual fees and expenses than Class A shares.
Class R: Shares are available to certain eligible investors as described in the prospectus. These shares have higher annual fees and expenses than Class A shares.
Class R6: Shares are available to certain eligible investors as described in the prospectus.
Advisor Class: Shares are available to certain eligible investors as described in the prospectus.
1. The distribution amount is the sum of the dividend payments to shareholders for the period shown and includes only estimated tax-basis net investment income and
capital gain.
2. The Fund has a fee waiver associated with any investment in a Franklin Templeton money fund, contractually guaranteed through at least its current fiscal year-end.
Fund investment results reflect the fee waiver; without this reduction, the results would have been lower.
3. Cumulative total return represents the change in value of an investment over the periods indicated.
4. Average annual total return represents the average annual change in value of an investment over the periods indicated.
5. These figures represent the value of a hypothetical $10,000 investment in the Fund over the periods indicated.
6. In accordance with SEC rules, we provide standardized average annual total return information through the latest calendar quarter.
7. Figures are as stated in the Fund’s current prospectus. In periods of market volatility, assets may decline significantly, causing total annual Fund operating expenses to
become higher than the figures shown.
8. Source: Morningstar. The Russell 3000 Value Index is market capitalization weighted and measures performance of those Russell 3000 Index companies with lower
price-to-book ratios and lower forecasted growth values.
9. Source: Bureau of Labor Statistics, bls.gov/cpi. The Consumer Price Index is a commonly used measure of the inflation rate.
See www.franklintempletondatasources.com for additional data provider information.
franklintempleton.com
Annual Report
|
21
FRANKLIN BALANCE SHEET INVESTMENT FUND
Your Fund’s Expenses
As a Fund shareholder, you can incur two types of costs:
- Transaction costs, including sales charges (loads) on Fund purchases; and
- Ongoing Fund costs, including management fees, distribu- tion and service (12b-1) fees, and other Fund expenses. All mutual funds have ongoing costs, sometimes referred to as operating expenses.
The following table shows ongoing costs of investing in the Fund and can help you understand these costs and compare them with those of other mutual funds. The table assumes a $1,000 investment held for the six months indicated.
Actual Fund Expenses
The first line (Actual) for each share class listed in the table provides actual account values and expenses. The “Ending Account Value” is derived from the Fund’s actual return, which includes the effect of Fund expenses.
You can estimate the expenses you paid during the period by following these steps. Of course, your account value and expenses will differ from those in this illustration:
| 1. | Divide your account value by $1,000. |
| | If an account had an $8,600 value, then $8,600 ÷ $1,000 = 8.6. |
| 2. | Multiply the result by the number under the heading “Expenses Paid During Period.” |
| | If Expenses Paid During Period were $7.50, then 8.6 x $7.50 = $64.50. |
In this illustration, the estimated expenses paid this period are $64.50.
Hypothetical Example for Comparison with Other Funds
Information in the second line (Hypothetical) for each class in the table can help you compare ongoing costs of investing in the Fund with those of other mutual funds. This information may not be used to estimate the actual ending account balance or expenses you paid during the period. The hypothetical “Ending Account Value” is based on the actual expense ratio for each class and an assumed 5% annual rate of return before expenses, which does not represent the Fund’s actual return. The figure under the heading “Expenses Paid During Period” shows the hypothetical expenses your account would have incurred under this scenario. You can compare this figure with the 5% hypothetical examples that appear in shareholder reports of other funds.
Please note that expenses shown in the table are meant to highlight ongoing costs and do not reflect any transaction costs, such as sales charges. Therefore, the second line for each class is useful in comparing ongoing costs only, and will not help you compare total costs of owning different funds. In addition, if transaction costs were included, your total costs would have been higher. Please refer to the Fund prospectus for additional information on operating expenses.
|
22 Annual Report
franklintempleton.com
FRANKLIN BALANCE SHEET INVESTMENT FUND
YOUR FUND’S EXPENSES
| | | | | | |
| | | Beginning Account | | Ending Account | | Expenses Paid During |
| Share Class | | Value 5/1/15 | | Value 10/31/15 | | Period* 5/1/15–10/31/15 |
| A | | | | | | |
| Actual | $ | 1,000 | $ | 936.40 | $ | 4.78 |
| Hypothetical (5% return before expenses) | $ | 1,000 | $ | 1,020.27 | $ | 4.99 |
| C | | | | | | |
| Actual | $ | 1,000 | $ | 933.00 | $ | 8.43 |
| Hypothetical (5% return before expenses) | $ | 1,000 | $ | 1,016.48 | $ | 8.79 |
| R | | | | | | |
| Actual | $ | 1,000 | $ | 935.30 | $ | 6.00 |
| Hypothetical (5% return before expenses) | $ | 1,000 | $ | 1,019.00 | $ | 6.26 |
| R6 | | | | | | |
| Actual | $ | 1,000 | $ | 938.40 | $ | 2.54 |
| Hypothetical (5% return before expenses) | $ | 1,000 | $ | 1,022.58 | $ | 2.65 |
| Advisor | | | | | | |
| Actual | $ | 1,000 | $ | 937.50 | $ | 3.57 |
| Hypothetical (5% return before expenses) | $ | 1,000 | $ | 1,021.53 | $ | 3.72 |
*Expenses are calculated using the most recent six-month expense ratio, net of expense waivers, annualized for each class (A: 0.98%;
C: 1.73%; R: 1.23%; R6: 0.52%; and Advisor: 0.73%), multiplied by the average account value over the period, multiplied by 184/365 to reflect
the one-half year period.
franklintempleton.com
Annual Report
|
23
Franklin Large Cap Value Fund
This annual report for Franklin Large Cap Value Fund covers the fiscal year ended October 31, 2015.
Your Fund’s Goal and Main Investments
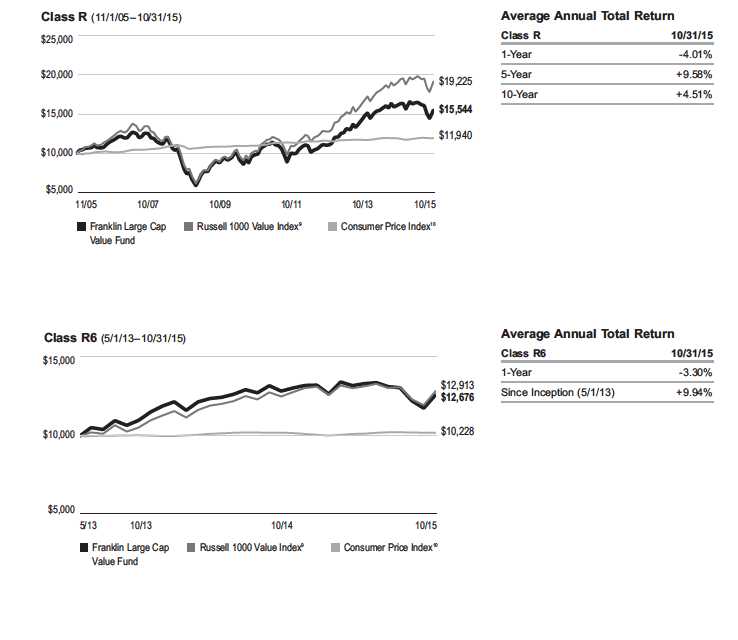
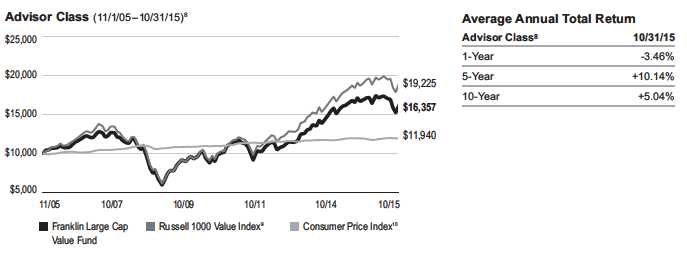
The Fund seeks long-term capital appreciation by investing at least 80% of its net assets in large capitalization companies that we believe are undervalued. We define large capitalization companies as those with market capitalizations that are similar in size at the time of purchase to those in the Russell 1000® Index.1
Performance Overview
For the 12 months under review, the Fund’s Class A shares had a -3.75% cumulative total return. In comparison, the Russell 1000® Value Index, which measures performance of those Russell 1000® Index companies with lower price-to-book ratios and lower forecasted growth values, generated a +0.53% total return.2 Although this report covers a 12-month period, our investment strategy aims for long-term results. You can find the Fund’s long-term performance data in the Performance Summary beginning on page 27.
Performance data represent past performance, which does not guarantee future results. Investment return and principal value will fluctuate, and you may have a gain or loss when you sell your shares. Current performance may differ from figures shown. Please visit franklintempleton.com or call (800) 342-5236 for most recent month-end performance.
Investment Strategy
We seek to invest in securities of large capitalization companies that we believe are selling below their underlying worth and hold them until they reach what we consider their fair value. Our aim is to construct a diversified portfolio of fundamentally sound companies purchased at attractive prices, often when they are out of favor with other investors for reasons we believe are temporary. Portfolio securities are selected without regard to benchmark comparisons and are based on fundamental, bottom-up research focusing on several criteria, such as low price relative to earnings, cash flow or book value. We also consider stocks with recent sharp price declines that we believe still have significant growth potential or that possess valuable intangibles not reflected in the stock price.

1. The Russell 1000 Index is market capitalization weighted and measures performance of the largest companies in the Russell 3000 Index, which represents the majority
of the U.S. market’s total market capitalization.
2. Source: Morningstar.
The index is unmanaged and includes reinvested dividends. One cannot invest directly in an index, and an index is not representative of the Fund’s portfolio.
See www.franklintempletondatasources.com for additional data provider information.
The dollar value, number of shares or principal amount, and names of all portfolio holdings are listed in the Fund’s Statement of Investments (SOI).
The SOI begins on page 82.

FRANKLIN LARGE CAP VALUE FUND
Manager’s Discussion
During the 12 months under review, holdings that helped absolute Fund performance included NIKE, Walgreens Boots Alliance and Home Depot. Shares of NIKE, an apparel manufacturer and retailer, rose due to continued strong performance as the company reported solid growth over the past two quarters in gross revenues (on a currency-neutral basis) and in its estimates of future sales. We expect NIKE to experience continued revenue growth based on the company’s innovation and progressive market segmentation. NIKE also increased the automation of its supplier factory base, which we believe should drive margin expansion. Shares of Walgreens, the largest U.S. drug store operator, rose amid the final stages of its integration with Alliance Boots, a multi-national health and beauty group. The stock benefited from positive sentiment around management’s strategic plans to create a global health care company with a consumer-centric beauty focus. Home Depot, a home improvement retailer, experienced better-than-expected earnings due to a housing recovery cycle along with company improvements in its merchandising and distribution network.
Detractors from absolute Fund performance included Alcoa, Ensco and Xerox. Alcoa, a manufacturer and developer of lightweight metals, exceeded revenue expectations, but fears of disruption to aluminum market demand from increased Chinese supply affected its valuation. Shares of Ensco, an operator of offshore drilling rigs, declined due to weaker demand for drilling services associated with depressed oil prices. Nevertheless, in our view Ensco remained one of the better positioned offshore drillers trading at a significant discount to its book value. Shares of Xerox, a business outsourcing services provider, fell due to lower-than-expected earnings attributed to higher costs in implementing health care services contracts.
During the reporting period, we initiated positions including Sanofi, a pharmaceutical provider; Discover Financial Services, a banking and credit services provider; Western Digital, a data storage solutions provider; Albemarle, a commercial chemical producer; BB&T, an insurance, lending and financial services provider; Ralph Lauren, an apparel retailer; Roche Holding, a
| | |
| Top 10 Holdings | | |
| 10/31/15 | | |
| Company | % of Total | |
| Sector/Industry | Net Assets | |
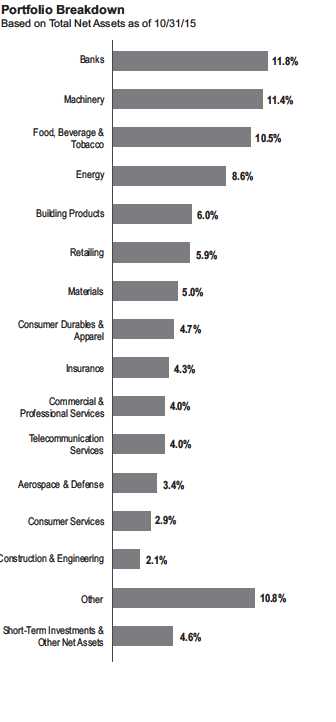
| NIKE Inc., B | 2.1 | % |
| Consumer Durables & Apparel | | |
| General Dynamics Corp. | 1.9 | % |
| Capital Goods | | |
| Target Corp. | 1.8 | % |
| Retailing | | |
| CVS Health Corp. | 1.8 | % |
| Food & Staples Retailing | | |
| Aflac Inc. | 1.8 | % |
| Insurance | | |
| Corning Inc. | 1.8 | % |
| Technology Hardware & Equipment | | |
| Citigroup Inc. | 1.8 | % |
| Banks | | |
| Johnson Controls Inc. | 1.7 | % |
| Automobiles & Components | | |
| The Allstate Corp. | 1.7 | % |
| Insurance | | |
| Merck & Co. Inc. | 1.7 | % |
| Pharmaceuticals, Biotechnology & Life Sciences | | |
pharmaceutical and diagnostics research and services provider; Mosaic, an agricultural nutrient provider; SanDisk, a flash storage developer and provider; American Airlines Group, an airline operator; Medtronic, a medical technology provider; and KKR & Co., an asset manager. We also added to some existing positions, including FMC, a chemical solutions and marketing provider; EMC, an information technology provider; First Solar, a solar power provider; and Regions Financial, a lending and financial services provider, among others. In contrast, some of the largest liquidations included 3M Co., a worldwide, diversified industrial and consumer company; Gilead Sciences, a biophar-maceutical company; Chubb, an insurance provider; Progressive, an automotive and residential insurance provider; and the aforementioned Walgreens. We also reduced our holdings in Teva Pharmaceutical Industries, Home Depot, Norfolk Southern and Allstate, among others.
franklintempleton.com
Annual Report
|
25
FRANKLIN LARGE CAP VALUE FUND
As fellow shareholders, we found recent Fund performance disappointing. Although the market has not favored our value investing style in recent years, we have maintained our disciplined process and continue to believe it can reward investors over the long term. Thank you for your continued participation in Franklin Large Cap Value Fund. We look forward to continuing to serve your investment needs.

CFA® is a trademark owned by CFA Institute.
The foregoing information reflects our analysis, opinions and portfolio holdings as of October 31, 2015, the end of the reporting period. The way we implement our main investment strategies and the resulting portfolio holdings may change depending on factors such as market and economic conditions. These opinions may not be relied upon as investment advice or an offer for a particular security. The information is not a complete analysis of every aspect of any market, country, industry, security or the Fund. Statements of fact are from sources considered reliable, but the investment manager makes no representation or warranty as to their completeness or accuracy. Although historical performance is no guarantee of future results, these insights may help you understand our investment management philosophy.
|
26 Annual Report
franklintempleton.com
FRANKLIN LARGE CAP VALUE FUND
Performance Summary as of October 31, 2015
Your dividend income will vary depending on dividends or interest paid by securities in the Fund’s portfolio, adjusted for operating expenses of each class. Capital gain distributions are net profits realized from the sale of portfolio securities. The performance table and graphs do not reflect any taxes that a shareholder would pay on Fund dividends, capital gain distributions, if any, or any realized gains on the sale of Fund shares. Total return reflects reinvestment of the Fund’s dividends and capital gain distributions, if any, and any unrealized gains or losses.
| | | | | | |
| Net Asset Value | | | | | | |
| Share Class (Symbol) | | 10/31/15 | | 10/31/14 | | Change |
| A (FLVAX) | $ | 17.86 | $ | 18.91 | -$ | 1.05 |
| C (FLCVX) | $ | 17.61 | $ | 18.67 | -$ | 1.06 |
| R (FLCRX) | $ | 17.71 | $ | 18.76 | -$ | 1.05 |
| R6 (FRLGX) | $ | 17.82 | $ | 18.87 | -$ | 1.05 |
| Advisor (N/A) | $ | 17.81 | $ | 18.86 | -$ | 1.05 |
| |
| |
| Distributions1 (11/1/14–10/31/15) | | | | | | |
| | | Dividend | | Long-Term | | |
| Share Class | | Income | | Capital Gain | | Total |
| A | $ | 0.1052 | $ | 0.2390 | $ | 0.3442 |
| C | | — | $ | 0.2390 | $ | 0.2390 |
| R | $ | 0.0621 | $ | 0.2390 | $ | 0.3011 |
| R6 | $ | 0.1895 | $ | 0.2390 | $ | 0.4285 |
| Advisor | $ | 0.1615 | $ | 0.2390 | $ | 0.4005 |
franklintempleton.com
Annual Report
|
27
FRANKLIN LARGE CAP VALUE FUND
PERFORMANCE SUMMARY
Performance as of 10/31/152
Cumulative total return excludes sales charges. Average annual total returns and value of $10,000 investment include maximum sales charges. Class A: 5.75% maximum initial sales charge; Class C: 1% contingent deferred sales charge in first year only;
Class R/R6/Advisor Class: no sales charges.
| | | | | | | | | | |
| | Cumulative | | Average Annual | | | Value of | Average Annual | | Total Annual | |
| Share Class | Total Return3 | | Total Return4 | | $ | 10,000 Investment5 | Total Return (9/30/15)6 | | Operating Expenses7 | |
| A | | | | | | | | | 1.30 | % |
| 1-Year | -3.75 | % | -9.27 | % | $ | 9,073 | -14.22 | % | | |
| 5-Year | +59.68 | % | +8.52 | % | $ | 15,048 | +7.64 | % | | |
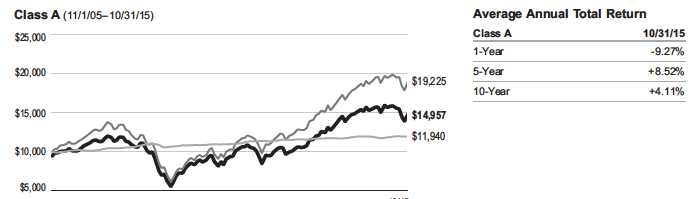
| 10-Year | +58.65 | % | +4.11 | % | $ | 14,957 | +3.29 | % | | |
| C | | | | | | | | | 2.00 | % |
| 1-Year | -4.42 | % | -5.36 | % | $ | 9,464 | -10.46 | % | | |
| 5-Year | +54.15 | % | +9.04 | % | $ | 15,415 | +8.16 | % | | |
| 10-Year | +47.99 | % | +4.00 | % | $ | 14,799 | +3.19 | % | | |
| R | | | | | | | | | 1.50 | % |
| 1-Year | -4.01 | % | -4.01 | % | $ | 9,599 | -9.16 | % | | |
| 5-Year | +58.01 | % | +9.58 | % | $ | 15,801 | +8.69 | % | | |
| 10-Year | +55.44 | % | +4.51 | % | $ | 15,544 | +3.69 | % | | |
| R6 | | | | | | | | | 0.83 | % |
| 1-Year | -3.30 | % | -3.30 | % | $ | 9,670 | -8.52 | % | | |
| Since Inception (5/1/13) +26.76% | | +9.94 | % | $ | 12,676 | +7.12 | % | | |
| Advisor8 | | | | | | | | | 1.00 | % |
| 1-Year | -3.46 | % | -3.46 | % | $ | 9,654 | -8.66 | % | | |
| 5-Year | +62.07 | % | +10.14 | % | $ | 16,207 | +9.24 | % | | |
| 10-Year | +63.57 | % | +5.04 | % | $ | 16,357 | +4.23 | % | | |
Performance data represent past performance, which does not guarantee future results. Investment return and principal value will fluctuate, and you may have a gain or loss when you sell your shares. Current performance may differ from figures shown. For most recent month-end performance, go to franklintempleton.com or call (800) 342-5236.
|
28 Annual Report
franklintempleton.com
FRANKLIN LARGE CAP VALUE FUND
PERFORMANCE SUMMARY
Total Return Index Comparison for a Hypothetical $10,000 Investment2
Total return represents the change in value of an investment over the periods shown. It includes any applicable maximum sales charge, Fund expenses, account fees and reinvested distributions. The unmanaged index includes reinvestment of any income or distributions. It differs from the Fund in composition and does not pay management fees or expenses. One cannot invest directly in an index


franklintempleton.com
Annual Report
|
29
FRANKLIN LARGE CAP VALUE FUND
PERFORMANCE SUMMARY
Total Return Index Comparison for a Hypothetical $10,000 Investment2 (continued)
|
30 Annual Report
franklintempleton.com
FRANKLIN LARGE CAP VALUE FUND
PERFORMANCE SUMMARY
Total Return Index Comparison for a Hypothetical $10,000 Investment2 (continued)
All investments involve risks, including possible loss of principal. Stock prices fluctuate, sometimes rapidly and dramatically, due to factors affecting individual companies, particular industries or sectors, or general market conditions. These price movements may result from factors affecting individual companies, industries or the securities market as a whole. The Fund may invest up to 25% of its total assets in foreign securities, which may involve special risks, including currency fluctuations and economic and political uncertainty. The Fund is actively managed but there is no guarantee that the manager’s investment decisions will produce the desired results. The Fund’s prospectus also includes a description of the main investment risks.
Class C: These shares have higher annual fees and expenses than Class A shares.
Class R: Shares are available to certain eligible investors as described in the prospectus. These shares have higher annual fees and expenses than Class A shares.
Class R6: Shares are available to certain eligible investors as described in the prospectus.
Advisor Class: Shares are available to certain eligible investors as described in the prospectus.
1. The distribution amount is the sum of the dividend payments to shareholders for the period shown and includes only estimated tax-basis net investment income and
capital gain.
2. The Fund has a fee waiver associated with any investment in a Franklin Templeton money fund, contractually guaranteed through at least its current fiscal year-end.
Fund investment results reflect the fee waiver, to the extent applicable; without these reductions, the results would have been lower.
3. Cumulative total return represents the change in value of an investment over the periods indicated.
4. Average annual total return represents the average annual change in value of an investment over the periods indicated.
5. These figures represent the value of a hypothetical $10,000 investment in the Fund over the periods indicated.
6. In accordance with SEC rules, we provide standardized average annual total return information through the latest calendar quarter.
7. Figures are as stated in the Fund’s current prospectus. In periods of market volatility, assets may decline significantly, causing total annual Fund operating expenses to
become higher than the figures shown.
8. Effective 11/1/05, the Fund began offering Advisor Class shares, which do not have sales charges or a Rule 12b-1 plan. Performance quotations for this class reflect the
following methods of calculation: (a) For periods prior to 11/1/05, a restated figure is used based upon the Fund’s Class A performance, excluding the effect of Class A’s
maximum initial sales charge, but reflecting the effect of the Class A Rule 12b-1 fees; and (b) for periods after 11/1/05, actual Advisor Class performance is used reflecting
all charges and fees applicable to that class. Since 11/1/05 (commencement of sales), the cumulative and average annual total returns of Advisor Class shares were
+63.91% and +5.07%.
9. Source: Morningstar. The Russell 1000 Value Index is market capitalization weighted and measures performance of those Russell 1000 Index companies with lower
price-to-book ratios and lower forecasted growth values.
10. Source: Bureau of Labor Statistics, bls.gov/cpi. The Consumer Price Index is a commonly used measure of the inflation rate.
See www.franklintempletondatasources.com for additional data provider information.
franklintempleton.com
Annual Report
|
31
FRANKLIN LARGE CAP VALUE FUND
Your Fund’s Expenses
As a Fund shareholder, you can incur two types of costs:
- Transaction costs, including sales charges (loads) on Fund purchases; and
- Ongoing Fund costs, including management fees, distribu- tion and service (12b-1) fees, and other Fund expenses. All mutual funds have ongoing costs, sometimes referred to as operating expenses.
The following table shows ongoing costs of investing in the Fund and can help you understand these costs and compare them with those of other mutual funds. The table assumes a $1,000 investment held for the six months indicated.
Actual Fund Expenses
The first line (Actual) for each share class listed in the table provides actual account values and expenses. The “Ending Account Value” is derived from the Fund’s actual return, which includes the effect of Fund expenses.
You can estimate the expenses you paid during the period by following these steps. Of course, your account value and expenses will differ from those in this illustration:
| 1. | Divide your account value by $1,000. |
| | If an account had an $8,600 value, then $8,600 ÷ $1,000 = 8.6. |
| 2. | Multiply the result by the number under the heading “Expenses Paid During Period.” |
| | If Expenses Paid During Period were $7.50, then 8.6 x $7.50 = $64.50. |
In this illustration, the estimated expenses paid this period are $64.50.
Hypothetical Example for Comparison with Other Funds
Information in the second line (Hypothetical) for each class in the table can help you compare ongoing costs of investing in the Fund with those of other mutual funds. This information may not be used to estimate the actual ending account balance or expenses you paid during the period. The hypothetical “Ending Account Value” is based on the actual expense ratio for each class and an assumed 5% annual rate of return before expenses, which does not represent the Fund’s actual return. The figure under the heading “Expenses Paid During Period” shows the hypothetical expenses your account would have incurred under this scenario. You can compare this figure with the 5% hypothetical examples that appear in shareholder reports of other funds.
Please note that expenses shown in the table are meant to highlight ongoing costs and do not reflect any transaction costs, such as sales charges. Therefore, the second line for each class is useful in comparing ongoing costs only, and will not help you compare total costs of owning different funds. In addition, if transaction costs were included, your total costs would have been higher. Please refer to the Fund prospectus for additional information on operating expenses.
|
32 Annual Report
franklintempleton.com
FRANKLIN LARGE CAP VALUE FUND
YOUR FUND’S EXPENSES
| | | | | | |
| | | Beginning Account | | Ending Account | | Expenses Paid During |
| Share Class | | Value 5/1/15 | | Value 10/31/15 | | Period* 5/1/15–10/31/15 |
| A | | | | | | |
| Actual | $ | 1,000 | $ | 944.50 | $ | 6.62 |
| Hypothetical (5% return before expenses) | $ | 1,000 | $ | 1,018.40 | $ | 6.87 |
| C | | | | | | |
| Actual | $ | 1,000 | $ | 940.70 | $ | 10.17 |
| Hypothetical (5% return before expenses) | $ | 1,000 | $ | 1,014.72 | $ | 10.56 |
| R | | | | | | |
| Actual | $ | 1,000 | $ | 943.00 | $ | 7.74 |
| Hypothetical (5% return before expenses) | $ | 1,000 | $ | 1,017.24 | $ | 8.03 |
| R6 | | | | | | |
| Actual | $ | 1,000 | $ | 946.90 | $ | 4.22 |
| Hypothetical (5% return before expenses) | $ | 1,000 | $ | 1,020.87 | $ | 4.38 |
| Advisor | | | | | | |
| Actual | $ | 1,000 | $ | 945.80 | $ | 5.30 |
| Hypothetical (5% return before expenses) | $ | 1,000 | $ | 1,019.76 | $ | 5.50 |
*Expenses are calculated using the most recent six-month expense ratio, net of expense waivers, annualized for each class (A: 1.35%;
C: 2.08%; R: 1.58%; R6: 0.86%; and Advisor: 1.08%), multiplied by the average account value over the period, multiplied by 184/365 to reflect
the one-half year period.
franklintempleton.com
Annual Report
|
33
Franklin MicroCap Value Fund
This annual report for the Franklin MicroCap Value Fund covers the fiscal year ended October 31, 2015. The Fund closed to new investors (with the exception of certain retirement accounts) in January 2004 and has remained closed except for two days in mid-February 2013, when we opened the Fund on a limited basis. Existing shareholders may add to or reduce their investments in the Fund; however, once an account is reduced to zero, it may not be reopened unless the Fund reopens.
Your Fund’s Goal and Main Investments
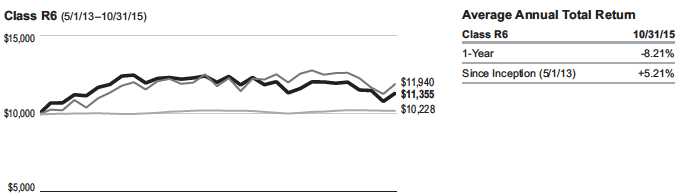
The Fund seeks high total return, of which capital appreciation and income are components, by investing at least 80% of its net assets in securities of companies with market capitalizations under $500 million at the time of purchase that we believe are undervalued in the marketplace.1
Performance Overview
For the 12 months under review, the Fund’s Class A shares had a -8.58% cumulative total return. In comparison, the Russell 2000® Value Index, which measures performance of those Russell 2000® Index companies with lower price-to-book ratios and lower forecasted growth values, had a -2.88% total return.2 Although this report covers a 12-month period, our investment strategy aims for long-term results. You can find the Fund’s long-term performance data in the Performance Summary beginning on page 37.
Performance data represent past performance, which does not guarantee future results. Investment return and principal value will fluctuate, and you may have a gain or loss when you sell your shares. Current performance may differ from figures shown. Please visit franklintempleton.com or call (800) 342-5236 for most recent month-end performance.
Investment Strategy
Our strategy is to buy shares of financially sound, well-established companies at a low price-to-book value, where we have reasonable confidence that book value will increase over several years. We limit purchases to companies with market capitalizations of less than $500 million, which we define as “microcap.”1 Book value per share is a company’s
1. Effective 12/10/12, the maximum market capitalization for each investment that the Fund can invest in increased from $400 million at time of purchase to $500 million.
2. Source: Morningstar.
The index is unmanaged and includes reinvested dividends. One cannot invest directly in an index, and an index is not representative of the Fund’s portfolio.
See www.franklintempletondatasources.com for additional data provider information.
The dollar value, number of shares or principal amount, and names of all portfolio holdings are listed in the Fund’s Statement of Investments (SOI).
The SOI begins on page 88.

FRANKLIN MICROCAP VALUE FUND
| | |
| Top 10 Holdings | | |
| 10/31/15 | | |
| Company | % of Total | |
| Sector/Industry | Net Assets | |
| Seneca Foods Corp., A & B | 4.6 | % |
| Food, Beverage & Tobacco | | |
| Omega Protein Corp. | 3.8 | % |
| Food, Beverage & Tobacco | | |
| Gibraltar Industries Inc. | 3.6 | % |
| Building Products | | |
| Healthcare Services Group Inc. | 3.3 | % |
| Commercial & Professional Services | | |
| Delta Apparel Inc. | 3.1 | % |
| Consumer Durables & Apparel | | |
| Hurco Cos. Inc | 2.9 | % |
| Machinery | | |
| Hardinge Inc. | 2.6 | % |
| Machinery | | |
| Miller Industries Inc. | 2.3 | % |
| Machinery | | |
| Bar Harbor Bankshares | 2.3 | % |
| Banks | | |
| PHI Inc. | 2.3 | % |
| Energy | | |
net worth or shareholders’ equity on an accounting or “book” basis, divided by shares outstanding. This strategy is not aimed at short-term trading gains, nor do we consider the composition of any index. Rather, we try to identify individual companies that meet our investment criteria, and we assume at purchase that we will hold the positions for several years.
Manager’s Discussion
During the 12 months under review, holdings that helped absolute Fund performance included Gibraltar Industries, Delta Apparel and John B. Sanfilippo & Sons. Gibraltar Industries, a manufacturer of building and infrastructure products, reported earnings gains from a recent acquisition and from programs to improve plant-level operations. The company’s new management’s efforts led to sharply better operating results. Delta
Apparel, an apparel designer and retailer, divested a non-core segment, reported recovering margins after several quarters of poor results and announced a share repurchase authorization. John B. Sanfilippo & Sons, a nut and snack items producer, reported better-than-expected earnings despite experiencing higher costs for certain ingredients.
Detractors from absolute Fund performance included PHI, International Shipholding and Global Power Equipment. PHI provides helicopter transportation to the offshore energy industry and air medical services. Lower energy prices led PHI’s customers to cancel or delay capital projects, which reduced flight hours and revenue for PHI. International Shipholding specializes in “niche” marine transportation services, such as the Jones Act, rail ferry and trans-ocean auto cargos. Depressed freight rates and equipment outages in 2015 impaired the company’s cash flows enough to raise credit concerns. Global Power Equipment Group makes equipment and offers engineering services for the power generation industry. In May, the company had to delay filing quarterly results and said it will restate prior results because of accounting errors and in August disclosed the loss of a long-term contract with a large customer.
During the reporting period, we initiated positions in Alaska Communications Systems Group, a telecommunications provider; Renewable Energy Group, a biodiesel producer; Golden Entertainment, a casino operator; County Bancorp, a community bank; and Friedman Industries, a steel service center and pipe manufacturer. We added to existing positions in Sterling Construction, a heavy civil construction contractor; Leapfrog Enterprises, a child-focused educational technology developer; and the aforementioned Global Power Equipment Group; among others. We exited positions in P.A.M. Transportation, RTI International Metals, Frisch’s Restaurants, Saia, Griffon, Kimball International, and Callaway Golf. We reduced positions in Omega Protein, Healthcare Services Group, Lydall, Seneca Foods, Origen Financial, Dixie Group and the aforementioned Delta Apparel and John B. Sanfilippo & Sons.
franklintempleton.com
Annual Report
|
35
FRANKLIN MICROCAP VALUE FUND
As fellow shareholders, we found recent Fund performance disappointing. Although the market has not favored our value investing style in recent years, we have maintained our disciplined process and continue to believe it can reward investors over the long term. Thank you for your continued participation in Franklin MicroCap Value Fund. We look forward to continuing to serve your investment needs.


Bruce C. Baughman, CPA
Lead Portfolio Manager
Donald G. Taylor, CPA
Portfolio Management Team
The foregoing information reflects our analysis, opinions and portfolio holdings as of October 31, 2015, the end of the reporting period. The way we implement our main investment strategies and the resulting portfolio holdings may change depending on factors such as market and economic conditions. These opinions may not be relied upon as investment advice or an offer for a particular security. The information is not a complete analysis of every aspect of any market, country, industry, security or the Fund. Statements of fact are from sources considered reliable, but the investment manager makes no representation or warranty as to their completeness or accuracy. Although historical performance is no guarantee of future results, these insights may help you understand our investment management philosophy.
|
36 Annual Report
franklintempleton.com
FRANKLIN MICROCAP VALUE FUND
Performance Summary as of October 31, 2015
Your dividend income will vary depending on dividends or interest paid by securities in the Fund’s portfolio, adjusted for operating expenses of each class. Capital gain distributions are net profits realized from the sale of portfolio securities. The performance table and graphs do not reflect any taxes that a shareholder would pay on Fund dividends, capital gain distributions, if any, or any realized gains on the sale of Fund shares. Total return reflects reinvestment of the Fund’s dividends and capital gain distributions, if any, and any unrealized gains or losses.
| | | | | | |
| Net Asset Value | | | | | | |
| Share Class (Symbol) | | 10/31/15 | | 10/31/14 | | Change |
| A (FRMCX) | $ | 32.90 | $ | 39.88 | -$ | 6.98 |
| R6 (FMCVX) | $ | 33.09 | $ | 39.94 | -$ | 6.85 |
| Advisor (FVRMX) | $ | 33.00 | $ | 39.90 | -$ | 6.90 |
| |
| |
| Distributions1 (11/1/14–10/31/15) | | | | | | |
| | | Short-Term | | Long-Term | | |
| Share Class | | Capital Gain | | Capital Gain | | Total |
| A | $ | 0.0742 | $ | 3.5793 | $ | 3.6535 |
| R6 | $ | 0.0742 | $ | 3.5793 | $ | 3.6535 |
| Advisor | $ | 0.0742 | $ | 3.5793 | $ | 3.6535 |
franklintempleton.com
Annual Report
|
37
FRANKLIN MICROCAP VALUE FUND
PERFORMANCE SUMMARY
Performance as of 10/31/152
Cumulative total return excludes sales charges. Average annual total returns and value of $10,000 investment include maximum sales charges. Class A: 5.75% maximum initial sales charge; Class R6/Advisor Class: no sales charges.
| | | | | | | | | | | | |
| | | | | | | | | | Total Annual Operating Expenses7 | |
| | Cumulative | | Average Annual | | | Value of | Average Annual | | | | | |
| Share Class | Total Return3 | | Total Return4 | | $ | 10,000 Investment5 | Total Return (9/30/15)6 | | (with waiver) | | (without waiver) | |
| A | | | | | | | | | 1.16 | % | 1.18 | % |
| 1-Year | -8.58 | % | -13.83 | % | $ | 8,617 | -14.50 | % | | | | |
| 5-Year | +65.40 | % | +9.29 | % | $ | 15,589 | +8.71 | % | | | | |
| 10-Year | +92.88 | % | +6.16 | % | $ | 18,178 | +5.46 | % | | | | |
| R6 | | | | | | | | | 0.79 | % | 0.81 | % |
| 1-Year | -8.21 | % | -8.21 | % | $ | 9,179 | -8.93 | % | | | | |
| Since Inception (5/1/13) +13.55% | | +5.21 | % | $ | 11,355 | +3.34 | % | | | | |
| Advisor8 | | | | | | | | | 0.92 | % | 0.94 | % |
| 1-Year | -8.36 | % | -8.36 | % | $ | 9,164 | -9.05 | % | | | | |
| 5-Year | +67.36 | % | +10.85 | % | $ | 16,736 | +10.28 | % | | | | |
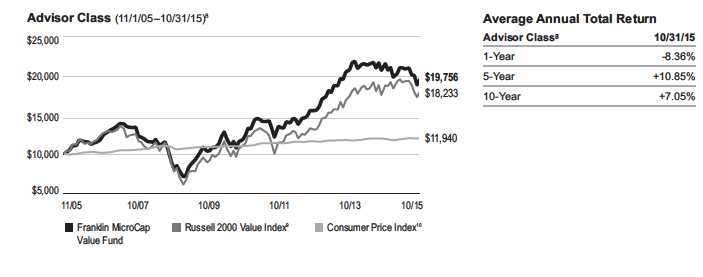
| 10-Year | +97.56 | % | +7.05 | % | $ | 19,756 | +6.35 | % | | | | |
Performance data represent past performance, which does not guarantee future results. Investment return and principal value will fluctuate, and you may have a gain or loss when you sell your shares. Current performance may differ from figures shown. For most recent month-end performance, go to franklintempleton.com or call (800) 342-5236.
|
38 Annual Report
franklintempleton.com
FRANKLIN MICROCAP VALUE FUND
PERFORMANCE SUMMARY
Total Return Index Comparison for a Hypothetical $10,000 Investment2
Total return represents the change in value of an investment over the periods shown. It includes any applicable maximum sales charge, Fund expenses, account fees and reinvested distributions. The unmanaged index includes reinvestment of any income or distributions. It differs from the Fund in composition and does not pay management fees or expenses. One cannot invest directly in an index.


franklintempleton.com
Annual Report
|
39
FRANKLIN MICROCAP VALUE FUND
PERFORMANCE SUMMARY
Total Return Index Comparison for a Hypothetical $10,000 Investment2 (continued)
All investments involve risks, including possible loss of principal. The Fund’s ability to invest in smaller company securities that may have limited liquidity involves additional risks, such as relatively small revenues, limited product lines and small market share. Historically, these stocks have exhibited greater price volatility than larger company stocks, especially over the short term. In addition, the Fund may invest up to 25% of its total assets in foreign securities, which involve special risks, including currency fluctuations and economic and political uncertainty. The Fund is actively managed but there is no guarantee that the manager’s investment decisions will produce the desired results. The Fund’s prospectus also includes a description of the main investment risks.
Class R6: Shares are available to certain eligible investors as described in the prospectus.
Advisor Class: Shares are available to certain eligible investors as described in the prospectus.
1. The distribution amount is the sum of the dividend payments to shareholders for the period shown and includes only estimated tax-basis net investment income and
capital gain.
2. The Fund has a fee waiver associated with any investment in a Franklin Templeton money fund, contractually guaranteed through at least its current fiscal year-end.
Fund investment results reflect the fee waiver, to the extent applicable; without this reduction, the results would have been lower.
3. Cumulative total return represents the change in value of an investment over the periods indicated.
4. Average annual total return represents the average annual change in value of an investment over the periods indicated.
5. These figures represent the value of a hypothetical $10,000 investment in the Fund over the periods indicated.
6. In accordance with SEC rules, we provide standardized average annual total return information through the latest calendar quarter.
7. Figures are as stated in the Fund’s current prospectus. In periods of market volatility, assets may decline significantly, causing total annual Fund operating expenses to
become higher than the figures shown.
8. Effective 11/1/05, the Fund began offering Advisor Class shares, which do not have sales charges or a Rule 12b-1 plan. Performance quotations for this class reflect the
following methods of calculation: (a) For periods prior to 11/1/05, a restated figure is used based upon the Fund’s Class A performance, excluding the effect of Class A’s
maximum initial sales charge, but reflecting the effect of the Class A Rule 12b-1 fees; and (b) for periods after 11/1/05, actual Advisor Class performance is used reflecting
all charges and fees applicable to that class. Since 11/1/05 (commencement of sales), the cumulative and average annual total returns of Advisor Class shares were
+96.89% and +7.01%.
9. Source: Morningstar. The Russell 2000 Value Index is market capitalization weighted and measures performance of those Russell 2000 Index companies with lower
price-to-book ratios and lower forecasted growth values.
10. Source: Bureau of Labor Statistics, bls.gov/cpi. The Consumer Price Index is a commonly used measure of the inflation rate.
See www.franklintempletondatasources.com for additional data provider information.
|
40 Annual Report
franklintempleton.com
FRANKLIN MICROCAP VALUE FUND
Your Fund’s Expenses
As a Fund shareholder, you can incur two types of costs:
- Transaction costs, including sales charges (loads) on Fund purchases; and
- Ongoing Fund costs, including management fees, distribu- tion and service (12b-1) fees, and other Fund expenses. All mutual funds have ongoing costs, sometimes referred to as operating expenses.
The following table shows ongoing costs of investing in the Fund and can help you understand these costs and compare them with those of other mutual funds. The table assumes a $1,000 investment held for the six months indicated.
Actual Fund Expenses
The first line (Actual) for each share class listed in the table provides actual account values and expenses. The “Ending Account Value” is derived from the Fund’s actual return, which includes the effect of Fund expenses.
You can estimate the expenses you paid during the period by following these steps. Of course, your account value and expenses will differ from those in this illustration:
| 1. | Divide your account value by $1,000. |
| | If an account had an $8,600 value, then $8,600 ÷ $1,000 = 8.6. |
| 2. | Multiply the result by the number under the heading “Expenses Paid During Period.” |
| | If Expenses Paid During Period were $7.50, then 8.6 x $7.50 = $64.50. |
In this illustration, the estimated expenses paid this period are $64.50.
Hypothetical Example for Comparison with Other Funds
Information in the second line (Hypothetical) for each class in the table can help you compare ongoing costs of investing in the Fund with those of other mutual funds. This information may not be used to estimate the actual ending account balance or expenses you paid during the period. The hypothetical “Ending Account Value” is based on the actual expense ratio for each class and an assumed 5% annual rate of return before expenses, which does not represent the Fund’s actual return. The figure under the heading “Expenses Paid During Period” shows the hypothetical expenses your account would have incurred under this scenario. You can compare this figure with the 5% hypothetical examples that appear in shareholder reports of other funds.
Please note that expenses shown in the table are meant to highlight ongoing costs and do not reflect any transaction costs, such as sales charges. Therefore, the second line for each class is useful in comparing ongoing costs only, and will not help you compare total costs of owning different funds. In addition, if transaction costs were included, your total costs would have been higher. Please refer to the Fund prospectus for additional information on operating expenses.
| | | | | | |
| | | Beginning Account | | Ending Account | | Expenses Paid During |
| Share Class | | Value 5/1/15 | | Value 10/31/15 | | Period* 5/1/15–10/31/15 |
| A | | | | | | |
| Actual | $ | 1,000 | $ | 938.10 | $ | 6.06 |
| Hypothetical (5% return before expenses) | $ | 1,000 | $ | 1,018.95 | $ | 6.31 |
| R6 | | | | | | |
| Actual | $ | 1,000 | $ | 940.10 | $ | 3.96 |
| Hypothetical (5% return before expenses) | $ | 1,000 | $ | 1,021.12 | $ | 4.13 |
| Advisor | | | | | | |
| Actual | $ | 1,000 | $ | 939.40 | $ | 4.84 |
| Hypothetical (5% return before expenses) | $ | 1,000 | $ | 1,020.21 | $ | 5.04 |
*Expenses are calculated using the most recent six-month expense ratio, net of expense waivers, annualized for each class (A: 1.24%;
R6: 0.81%; and Advisor: 0.99%), multiplied by the average account value over the period, multiplied by 184/365 to reflect the one-half year
period.
franklintempleton.com
Annual Report
|
41
Franklin MidCap Value Fund
This annual report for Franklin MidCap Value Fund covers the fiscal year ended October 31, 2015.
Your Fund’s Goals and Main Investments
The Fund seeks long-term total return by investing at least 80% of net assets in securities of mid-capitalization companies that we believe are undervalued. We define mid-capitalization companies as those with market capitalizations that are similar in size at the time of purchase to those in the Russell Midcap® Index.1
Performance Overview
For the 12 months under review, the Fund’s Class A shares had a -3.07% cumulative total return. In comparison, the Russell Midcap® Value Index, which measures performance of those Russell Midcap® Index companies with lower price-to-book ratios and lower forecasted growth values, generated a +0.47% total return.2 Although this report covers a 12-month period, our investment strategy aims for long-term results. You can find the Fund’s long-term performance data in the Performance Summary beginning on page 45.
Performance data represent past performance, which does not guarantee future results. Investment return and principal value will fluctuate, and you may have a gain or loss when you sell your shares. Current performance may differ from figures shown. Please visit franklintempleton.com or call (800) 342-5236 for most recent month-end performance.
Investment Strategy
Our goal is to invest in mid-capitalization companies that we determine are currently undervalued and have the potential for capital appreciation. The Fund purchases stocks that are out of favor in the market for reasons we believe will prove to be temporary in nature. In addition, the Fund may invest in companies with valuable intangibles we believe are not reflected in the stock price. This strategy is not aimed at short-term trading gains, nor do we consider the composition of any index. Rather, we try to identify attractively priced, financially sound companies that meet our investment criteria, and we assume at purchase that we will hold the positions for several years.
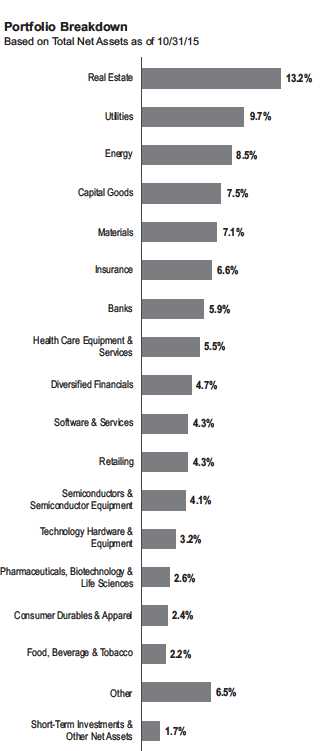
1. The Russell Midcap Index is market capitalization weighted and measures performance of the smallest companies in the Russell 1000 Index, which represent a modest
amount of the Russell 1000 Index’s total market capitalization.
2. Source: Morningstar.
The index is unmanaged and includes reinvested dividends. One cannot invest directly in an index, and an index is not representative of the Fund’s portfolio.
See www.franklintempletondatasources.com for additional data provider information.
The dollar value, number of shares or principal amount, and names of all portfolio holdings are listed in the Fund’s Statement of Investments (SOI).
The SOI begins on page 95.
|
42 Annual Report franklintempleton.com
FRANKLIN MIDCAP VALUE FUNDManager’s Discussion
During the 12 months under review, holdings that helped absolute Fund performance included Progressive, ResMed and Total System Services. Shares of Progressive, an insurance provider, experienced strong performance as the company maintained its strong commercial underwriting margin and realized gains from its acquisition of ARX Holding. ResMed, a medical equipment designer and manufacturer, launched new products and expanded market opportunities, which contributed to better-than-expected earnings. Total System Services, an electronic payment processing provider for the financial industry, benefited from a number of card issuing clients that are growing faster than the broader credit card industry and from its solid expense management.
Detractors from absolute Fund performance included Intrepid Potash, Axiall and Host Hotels & Resorts. Shares of Intrepid Potash, a potash producer and mine operator, declined as low crop prices, a strong U.S. dollar and an influx of new supply led to weaker potash prices. These conditions threatened the viability of a high-production-cost mine. Axiall, a chemical and building products manufacturer, was negatively affected by weaker-than-expected end-market pricing due to industry-wide chlor-alkali capacity expansions and still relatively weak demand. The company replaced its chief executive officer and is implementing cost-cutting measures to offset weakness while simultaneously exploring alternatives for its building products business. Host Hotels & Resorts, a lodgings operator, lowered its outlook for the remainder of 2015 due to weaker-than-anticipated demand. Similar to other hotel operators, the company cited particularly soft leisure business in its U.S. destinations. Nonetheless, we believe the company’s strong brands, which include Marriott, Ritz-Carlton, Westin and Four Seasons, as well as its assets in key gateway cities and high-demand locations, bode well for the stock’s prospects.
| | |
| Top 10 Holdings | | |
| 10/31/15 | | |
| Company | % of Total | |
| Sector/Industry | Net Assets | |
| Northern Trust Corp. | 2.0 | % |
| Diversified Financials | | |
| Host Hotels & Resorts Inc. | 1.9 | % |
| Real Estate | | |
| The Progressive Corp. | 1.7 | % |
| Insurance | | |
| Eversource Energy | 1.6 | % |
| Utilities | | |
| Raymond James Financial Inc. | 1.6 | % |
| Diversified Financials | | |
| ITC Holdings Corp. | 1.6 | % |
| Utilities | | |
| Sempra Energy | 1.5 | % |
| Utilities | | |
| Regions Financial Corp. | 1.4 | % |
| Banks | | |
| Principal Financial Group Inc. | 1.4 | % |
| Insurance | | |
| W. R. Berkley Corp | 1.4 | % |
| Insurance | | |
During the reporting period, some of our large new purchases included ITC Holdings, an electricity transmission provider; SanDisk, a flash storage developer and provider; Amdocs, a communications, media and entertainment computer systems integration developer; Mosaic, an agricultural nutrient provider; and Concho Resources, an oil and gas producer; as well as ResMed and Intrepid Potash, mentioned earlier. We added to existing positions in Liberty Property Trust and DDR, both real estate investment trusts, among others. We liquidated our positions in American Campus Communities, CareFusion, Nordstrom,
franklintempleton.com
Annual Report
|
43
FRANKLIN MIDCAP VALUE FUND
Marsh & McLennan, Altera, Sigma-Aldrich and Urban Outfitters, among others. We also reduced our positions in Xylem, Hill-Rom Holdings, Microchip Technology, John Wiley & Sons, Cadence Design and the aforementioned Total System Services, among others.
As fellow shareholders, we found recent Fund performance disappointing. Although the market has not favored our value investing style in recent years, we have maintained our disciplined process and continue to believe it can reward investors over the long term. Thank you for your continued participation in Franklin MidCap Value Fund. We look forward to continuing to serve your investment needs.

Jakov Stipanov, CFA
Donald G. Taylor, CPA
Portfolio Management Team
The foregoing information reflects our analysis, opinions and portfolio holdings as of October 31, 2015, the end of the reporting period. The way we implement our main investment strategies and the resulting portfolio holdings may change depending on factors such as market and economic conditions. These opinions may not be relied upon as investment advice or an offer for a particular security. The information is not a complete analysis of every aspect of any market, country, industry, security or the Fund. Statements of fact are from sources considered reliable, but the investment manager makes no representation or warranty as to their completeness or accuracy. Although historical performance is no guarantee of future results, these insights may help you understand our investment management philosophy.
|
44 Annual Report
franklintempleton.com
FRANKLIN MIDCAP VALUE FUND
Performance Summary as of October 31, 2015
Your dividend income will vary depending on dividends or interest paid by securities in the Fund’s portfolio, adjusted for operating expenses of each class. Capital gain distributions are net profits realized from the sale of portfolio securities. The performance table and graphs do not reflect any taxes that a shareholder would pay on Fund dividends, capital gain distributions, if any, or any realized gains on the sale of Fund shares. Total return reflects reinvestment of the Fund’s dividends and capital gain distributions, if any, and any unrealized gains or losses.
| | | | | | |
| Net Asset Value | | | | | | |
| Share Class (Symbol) | | 10/31/15 | | 10/31/14 | | Change |
| A (FMVAX) | $ | 15.22 | $ | 16.13 | -$ | 0.91 |
| C (FMVCX) | $ | 14.97 | $ | 15.87 | -$ | 0.90 |
| R (N/A) | $ | 15.19 | $ | 16.09 | -$ | 0.90 |
| Advisor (N/A) | $ | 15.31 | $ | 16.23 | -$ | 0.92 |
| |
| |
| Distributions1 (11/1/14–10/31/15) | | | | | | |
| | | Dividend | | Long-Term | | |
| Share Class | | Income | | Capital Gain | | Total |
| A | $ | 0.1077 | $ | 0.3074 | $ | 0.4151 |
| C | | — | $ | 0.3074 | $ | 0.3074 |
| R | $ | 0.0634 | $ | 0.3074 | $ | 0.3708 |
| Advisor | $ | 0.1537 | $ | 0.3074 | $ | 0.4611 |
franklintempleton.com
Annual Report
|
45
FRANKLIN MIDCAP VALUE FUND
PERFORMANCE SUMMARY
Performance as of 10/31/152
Cumulative total return excludes sales charges. Average annual total returns and value of $10,000 investment include maximum sales charges. Class A: 5.75% maximum initial sales charge; Class C: 1% contingent deferred sales charge in first year only;
Class R/Advisor Class: no sales charges.
| | | | | | | | | | | | |
| | | | | | | | | | Total Annual Operating Expenses7 | |
| | Cumulative | | Average Annual | | | Value of | Average Annual | | | | | |
| Share Class | Total Return3 | | Total Return4 $10,000 Investment5 | Total Return (9/30/15)6 | | (with waiver) | | (without waiver) | |
| A | | | | | | | | | 1.36 | % | 1.57 | % |
| 1-Year | -3.07 | % | -8.63 | % | $ | 9,137 | -11.17 | % | | | | |
| 5-Year | +56.07 | % | +8.02 | % | $ | 14,708 | +7.61 | % | | | | |
| 10-Year | +76.49 | % | +5.22 | % | $ | 16,631 | +4.23 | % | | | | |
| C | | | | | | | | | 2.06 | % | 2.27 | % |
| 1-Year | -3.75 | % | -4.69 | % | $ | 9,531 | -7.38 | % | | | | |
| 5-Year | +50.71 | % | +8.55 | % | $ | 15,071 | +8.13 | % | | | | |
| 10-Year | +64.96 | % | +5.13 | % | $ | 16,496 | +4.14 | % | | | | |
| R | | | | | | | | | 1.56 | % | 1.77 | % |
| 1-Year | -3.30 | % | -3.30 | % | $ | 9,670 | -5.99 | % | | | | |
| 5-Year | +54.47 | % | +9.09 | % | $ | 15,447 | +8.66 | % | | | | |
| 10-Year | +73.26 | % | +5.65 | % | $ | 17,326 | +4.66 | % | | | | |
| Advisor | | | | | | | | | 1.06 | % | 1.27 | % |
| 1-Year | -2.83 | % | -2.83 | % | $ | 9,717 | -5.52 | % | | | | |
| 5-Year | +58.46 | % | +9.64 | % | $ | 15,846 | +9.21 | % | | | | |
| 10-Year | +82.36 | % | +6.19 | % | $ | 18,236 | +5.19 | % | | | | |
Performance data represent past performance, which does not guarantee future results. Investment return and principal value will fluctuate, and you may have a gain or loss when you sell your shares. Current performance may differ from figures shown. For most recent month-end performance, go to franklintempleton.com or call (800) 342-5236.
|
46 Annual Report
franklintempleton.com
FRANKLIN MIDCAP VALUE FUND
PERFORMANCE SUMMARY
Total Return Index Comparison for a Hypothetical $10,000 Investment2
Total return represents the change in value of an investment over the periods shown. It includes any applicable maximum sales charge, Fund expenses, account fees and reinvested distributions. The unmanaged index includes reinvestment of any income or distributions. It differs from the Fund in composition and does not pay management fees or expenses. One cannot invest directly in an index.
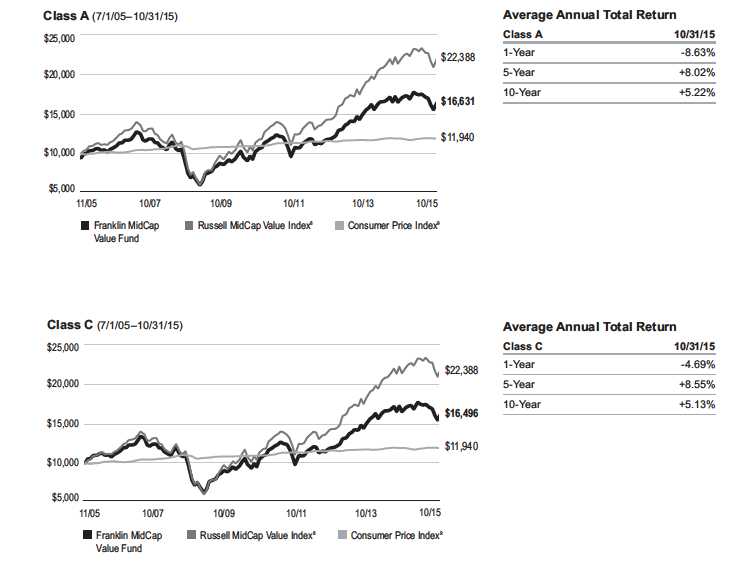
|
franklintempleton.com Annual Report 47
FRANKLIN MIDCAP VALUE FUND
PERFORMANCE SUMMARY
Total Return Index Comparison for a Hypothetical $10,000 Investment2 (continued)
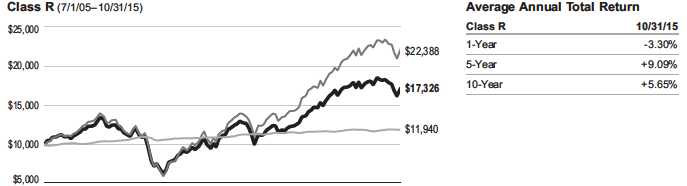


|
48 Annual Report
franklintempleton.com
FRANKLIN MIDCAP VALUE FUND
PERFORMANCE SUMMARY
All investments involve risks, including possible loss of principal. Stock prices fluctuate, sometimes rapidly and dramatically, due to factors affecting individual companies, particular industries or sectors, or general market conditions. Historically, midsize company securities have been more volatile in price than larger company securities, especially over the short term. Midsize companies may be more susceptible to particular economic events or competitive factors than are larger, more broadly diversified companies. In addition, the Fund may invest up to 25% of its total assets in foreign securities, which involve special risks, including currency fluctuations and economic and political uncertainty. The Fund is actively managed but there is no guarantee that the manager’s investment decisions will produce the desired results. The Fund’s prospectus also includes a description of the main investment risks.
Class C: These shares have higher annual fees and expenses than Class A shares.
Class R: Shares are available to certain eligible investors as described in the prospectus. These shares have higher annual fees and expenses than Class A shares.
Advisor Class: Shares are available to certain eligible investors as described in the prospectus.
1. The distribution amount is the sum of the dividend payments to shareholders for the period shown and includes only estimated tax-basis net investment income and
capital gain.
2. The Fund has an expense reduction contractually guaranteed through at least 2/29/16 and a fee waiver associated with any investment in a Franklin Templeton money
fund, contractually guaranteed through at least its current fiscal year-end. Fund investment results reflect the expense reduction and fee waiver, to the extent applicable;
without these reductions, the results would have been lower.
3. Cumulative total return represents the change in value of an investment over the periods indicated.
4. Average annual total return represents the average annual change in value of an investment over the periods indicated.
5. These figures represent the value of a hypothetical $10,000 investment in the Fund over the periods indicated.
6. In accordance with SEC rules, we provide standardized average annual total return information through the latest calendar quarter.
7. Figures are as stated in the Fund’s current prospectus. In periods of market volatility, assets may decline significantly, causing total annual Fund operating expenses to
become higher than the figures shown.
8. Source: Morningstar. The Russell Midcap Value Index is market capitalization weighted and measures performance of those Russell Midcap Index companies with lower
price-to-book ratios and lower forecasted growth values.
9. Source: Bureau of Labor Statistics, bls.gov/cpi. The Consumer Price Index is a commonly used measure of the inflation rate.
See www.franklintempletondatasources.com for additional data provider information.
franklintempleton.com
Annual Report
|
49
FRANKLIN MIDCAP VALUE FUND
Your Fund’s Expenses
As a Fund shareholder, you can incur two types of costs:
- Transaction costs, including sales charges (loads) on Fund purchases; and
- Ongoing Fund costs, including management fees, distribu- tion and service (12b-1) fees, and other Fund expenses. All mutual funds have ongoing costs, sometimes referred to as operating expenses.
The following table shows ongoing costs of investing in the Fund and can help you understand these costs and compare them with those of other mutual funds. The table assumes a $1,000 investment held for the six months indicated.
Actual Fund Expenses
The first line (Actual) for each share class listed in the table provides actual account values and expenses. The “Ending Account Value” is derived from the Fund’s actual return, which includes the effect of Fund expenses.
You can estimate the expenses you paid during the period by following these steps. Of course, your account value and expenses will differ from those in this illustration:
| 1. | Divide your account value by $1,000. |
| | If an account had an $8,600 value, then $8,600 ÷ $1,000 = 8.6. |
| 2. | Multiply the result by the number under the heading “Expenses Paid During Period.” |
| | If Expenses Paid During Period were $7.50, then 8.6 x $7.50 = $64.50. |
In this illustration, the estimated expenses paid this period are $64.50.
Hypothetical Example for Comparison with Other Funds
Information in the second line (Hypothetical) for each class in the table can help you compare ongoing costs of investing in the Fund with those of other mutual funds. This information may not be used to estimate the actual ending account balance or expenses you paid during the period. The hypothetical “Ending Account Value” is based on the actual expense ratio for each class and an assumed 5% annual rate of return before expenses, which does not represent the Fund’s actual return. The figure under the heading “Expenses Paid During Period” shows the hypothetical expenses your account would have incurred under this scenario. You can compare this figure with the 5% hypothetical examples that appear in shareholder reports of other funds.
Please note that expenses shown in the table are meant to highlight ongoing costs and do not reflect any transaction costs, such as sales charges. Therefore, the second line for each class is useful in comparing ongoing costs only, and will not help you compare total costs of owning different funds. In addition, if transaction costs were included, your total costs would have been higher. Please refer to the Fund prospectus for additional information on operating expenses.
|
50 Annual Report
franklintempleton.com
FRANKLIN MIDCAP VALUE FUND
YOUR FUND’S EXPENSES
| | | | | | |
| | | Beginning Account | | Ending Account | | Expenses Paid During |
| Share Class | | Value 5/1/15 | | Value 10/31/15 | | Period* 5/1/15–10/31/15 |
| A | | | | | | |
| Actual | $ | 1,000 | $ | 947.70 | $ | 6.53 |
| Hypothetical (5% return before expenses) | $ | 1,000 | $ | 1,018.50 | $ | 6.77 |
| C | | | | | | |
| Actual | $ | 1,000 | $ | 945.10 | $ | 10.05 |
| Hypothetical (5% return before expenses) | $ | 1,000 | $ | 1,014.87 | $ | 10.41 |
| R | | | | | | |
| Actual | $ | 1,000 | $ | 947.00 | $ | 7.61 |
| Hypothetical (5% return before expenses) | $ | 1,000 | $ | 1,017.39 | $ | 7.88 |
| Advisor | | | | | | |
| Actual | $ | 1,000 | $ | 949.20 | $ | 5.16 |
| Hypothetical (5% return before expenses) | $ | 1,000 | $ | 1,019.91 | $ | 5.35 |
*Expenses are calculated using the most recent six-month expense ratio, net of expense waivers, annualized for each class (A: 1.33%; C: 2.05%; R: 1.55%; and Advisor: 1.05%), multiplied by the average account value over the period, multiplied by 184/365 to reflect the one-half year period.
franklintempleton.com
Annual Report
|
51
Franklin Small Cap Value Fund
This annual report for Franklin Small Cap Value Fund covers the fiscal year ended October 31, 2015.
Your Fund’s Goal and Main Investments
The Fund seeks long-term total return by investing at least 80% of net assets in securities of small-capitalization companies that we believe are undervalued. We define small-capitalization companies as those with market capitalizations less than $3.5 billion at the time of purchase.
Performance Overview
For the 12 months under review, the Fund’s Class A shares had a -3.31% cumulative total return. In comparison, the Russell 2500TM Value Index, which measures performance of those Russell 2500TM Index companies with lower price-to-book ratios and lower forecasted growth values, had a -1.06% total return.1 Although this report covers a 12-month period, our investment strategy aims for long-term results. You can find the Fund’s long-term performance data in the Performance Summary beginning on page 55.
Performance data represent past performance, which does not guarantee future results. Investment return and principal value will fluctuate, and you may have a gain or loss when you sell your shares. Current performance may differ from figures shown. Please visit franklintempleton.com or call (800) 342-5236 for most recent month-end performance.
Investment Strategy
We seek to invest in small-capitalization companies that we believe are selling below their underlying worth and hold them until they reach what we consider their fair value. We seek a diversified portfolio of fundamentally sound companies purchased at attractive prices, often when they are out of favor with other investors. Portfolio securities are selected without regard to benchmark comparisons and are based on fundamental, bottom-up research focusing on several criteria, such as low price relative to earnings, book value or cash flow. We also consider stocks with recent sharp price declines that we believe still have significant growth potential or that possess valuable intangibles not reflected in the stock price.
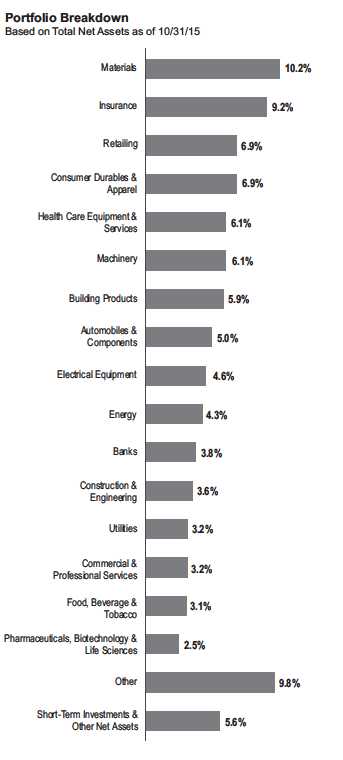
1. Source: Morningstar.
The index is unmanaged and includes reinvested dividends. One cannot invest directly in an index, and an index is not representative of the Fund’s portfolio.
See www.franklintempletondatasources.com for additional data provider information.
The dollar value, number of shares or principal amount, and names of all portfolio holdings are listed in the Fund’s Statement of Investments (SOI).
The SOI begins on page 105.
|
52 Annual Report franklintempleton.com
FRANKLIN SMALL CAP VALUE FUNDManager’s Discussion
During the 12 months under review, holdings that helped absolute Fund performance included StanCorp Financial Group, Universal Forest Products and Gerresheimer. StanCorp Financial Group, an insurance provider, received a cash takeover offer from Meiji Yasuda Life Insurance at nearly a 50% premium to the prior day’s closing price. Universal Forest Products, a wood-based construction materials provider, reported better-than-expected earnings due to strong overall demand and penetration into new markets. Gerresheimer, a health-care-focused glass and plastics products provider, benefited from strategic moves intended to improve the long-term return profile of its business. Specifically, the company sold its low-margin glass tubing business and acquired Centor, a leading, high-margin, U.S.-based manufacturer of plastic vials.
Detractors from absolute Fund performance included Unit Corp., Axiall and Helix Energy Solutions Group. Shares of Unit Corp., an onshore provider of drilling rigs, experienced a negative impact from a sharp drop in oil prices that began in mid-2014. The company’s subsequent reduction in its rig count was also expected to hinder earnings. Axiall, a chemical and building products manufacturer, was negatively affected by weaker-than-expected end-market pricing due to industry-wide chlor-alkali capacity expansions and still relatively weak demand. The company replaced its chief executive officer and is implementing cost-cutting measures to offset weakness while simultaneously exploring alternatives for its building products business. Given the recent changes, we believe Axiall has the potential for share price appreciation as global growth worries abate and energy prices stabilize over time. Helix Energy Solutions Group, an offshore provider of well production services, was hurt by a substantial drop in oil prices, which raised the level of uncertainty regarding future business opportunities and profitability.
During the reporting period, some of our large new purchases included LTC Properties, a real estate investment trust; Laclede Group, a natural gas service provider; BRP, a recreational vehicle and high performance engine manufacturer and distributor; Crocs, a footwear manufacturer and distributor; MKS Instruments, a developer and distributor of control products for manufacturing processes; IDACORP, an electric energy provider; Allegheny Technologies, a specialty materials
| | |
| Top 10 Holdings | | |
| 10/31/15 | | |
| Company | % of Total | |
| Sector/Industry | Net Assets | |
| Universal Forest Products Inc. | 2.7 | % |
| Building Products | | |
| Gerresheimer AG | 2.5 | % |
| Pharmaceuticals, Biotechnology & Life Sciences | | |
| STERIS Corp. | 2.4 | % |
| Health Care Equipment & Services | | |
| Maple Leaf Foods Inc. | 2.3 | % |
| Food, Beverage & Tobacco | | |
| LTC Properties Inc. | 2.3 | % |
| Real Estate | | |
| Regal Beloit Corp. | 2.2 | % |
| Electrical Equipment | | |
| AAR Corp. | 2.1 | % |
| Aerospace & Defense | | |
| EMCOR Group Inc. | 2.1 | % |
| Construction & Engineering | | |
| Aspen Insurance Holdings Ltd. | 2.1 | % |
| Insurance | | |
| La-Z-Boy Inc. | 2.1 | % |
| Consumer Durables & Apparel | | |
manufacturer; Huron Consulting Group, an operational and financial consultation services provider; and Invacare, a health care products developer and distributor. We also added to our positions in Everbank Financial, a commercial bank; Hunting, a manufacturer and distributor of oil extraction products; The Pep Boys – Manny, Moe & Jack, an automotive sales and services provider; AAR, an aviation and government defense services and products provider; Aspen Insurance Holdings, an insurance and reinsurance provider; Drew Industries, a manufacturer and distributor of parts for recreational vehicles and manufactured homes; McGrath RentCorp, an equipment rental provider; and the aforementioned Axiall and Gerresheimer, among others. We liquidated our positions in several securities including Apogee Enterprises, Cabot, Reliance Steel & Aluminum, Steel Dynamics, Lincoln Electric Holdings, Rowan Companies, EnPro Industries, SkyWest and Tidewater. We also reduced positions in Group 1 Automotive, RPM International, Thor Industries, Sensient Technologies, Hillenbrand, and StanCorp Financial, mentioned above, as well as several others.
franklintempleton.com
Annual Report
|
53
FRANKLIN SMALL CAP VALUE FUND
As fellow shareholders, we found recent Fund performance disappointing. Although the market has not favored our value investing style in recent years, we have maintained our disciplined process and continue to believe it can reward investors over the long term. Thank you for your continued participation in Franklin Small Cap Value Fund. We look forward to continuing to serve your investment needs.

Donald G. Taylor, CPA
Bruce C. Baughman, CPA
Portfolio Management Team
The foregoing information reflects our analysis, opinions and portfolio holdings as of October 31, 2015, the end of the reporting period. The way we implement our main investment strategies and the resulting portfolio holdings may change depending on factors such as market and economic conditions. These opinions may not be relied upon as investment advice or an offer for a particular security. The information is not a complete analysis of every aspect of any market, country, industry, security or the Fund. Statements of fact are from sources considered reliable, but the investment manager makes no representation or warranty as to their completeness or accuracy. Although historical performance is no guarantee of future results, these insights may help you understand our investment management philosophy.
|
54 Annual Report
franklintempleton.com
FRANKLIN SMALL CAP VALUE FUND
Performance Summary as of October 31, 2015
Your dividend income will vary depending on dividends or interest paid by securities in the Fund’s portfolio, adjusted for operating expenses of each class. Capital gain distributions are net profits realized from the sale of portfolio securities. The performance table and graphs do not reflect any taxes that a shareholder would pay on Fund dividends, capital gain distributions, if any, or any realized gains on the sale of Fund shares. Total return reflects reinvestment of the Fund’s dividends and capital gain distributions, if any, and any unrealized gains or losses.
| | | | | | | | |
| Net Asset Value | | | | | | | | |
| Share Class (Symbol) | | 10/31/15 | | 10/31/14 | | Change | | |
| A (FRVLX) | $ | 51.72 | $ | 58.96 | -$ | 7.24 | | |
| C (FRVFX) | $ | 47.22 | $ | 54.53 | -$ | 7.31 | | |
| R (FVFRX) | $ | 51.18 | $ | 58.40 | -$ | 7.22 | | |
| R6 (FRCSX) | $ | 53.75 | $ | 61.09 | -$ | 7.34 | | |
| Advisor (FVADX) | $ | 53.67 | $ | 61.01 | -$ | 7.34 | | |
| |
| |
| Distributions1 (11/1/14–10/31/15) | | | | | | | | |
| | | Dividend | | Short-Term | | Long-Term | | |
| Share Class | | Income | | Capital Gain | | Capital Gain | | Total |
| A | $ | 0.1190 | $ | 0.1275 | $ | 4.9613 | $ | 5.2078 |
| C | | — | $ | 0.1275 | $ | 4.9613 | $ | 5.0888 |
| R | $ | 0.0017 | $ | 0.1275 | $ | 4.9613 | $ | 5.0905 |
| R6 | $ | 0.4407 | $ | 0.1275 | $ | 4.9613 | $ | 5.5295 |
| Advisor | $ | 0.3050 | $ | 0.1275 | $ | 4.9613 | $ | 5.3938 |
franklintempleton.com
Annual Report
|
55
FRANKLIN SMALL CAP VALUE FUND
PERFORMANCE SUMMARY
Performance as of 10/31/152
Cumulative total return excludes sales charges. Average annual total returns and value of $10,000 investment include maximum sales charges. Class A: 5.75% maximum initial sales charge; Class C: 1% contingent deferred sales charge in first year only;
Class R/R6/Advisor Class: no sales charges.
| | | | | | | | | | |
| | Cumulative | | Average Annual | | | Value of | Average Annual | | Total Annual | |
| Share Class | Total Return3 | | Total Return4 | | $ | 10,000 Investment5 | Total Return (9/30/15)6 | | Operating Expenses7 | |
| A | | | | | | | | | 1.14 | % |
| 1-Year | -3.31 | % | -8.87 | % | $ | 9,113 | -10.32 | % | | |
| 5-Year | +65.81 | % | +9.34 | % | $ | 15,628 | +8.68 | % | | |
| 10-Year | +96.43 | % | +6.35 | % | $ | 18,515 | +5.28 | % | | |
| C | | | | | | | | | 1.84 | % |
| 1-Year | -4.01 | % | -4.87 | % | $ | 9,513 | -6.38 | % | | |
| 5-Year | +60.09 | % | +9.87 | % | $ | 16,009 | +9.22 | % | | |
| 10-Year | +83.04 | % | +6.23 | % | $ | 18,304 | +5.16 | % | | |
| R | | | | | | | | | 1.34 | % |
| 1-Year | -3.53 | % | -3.53 | % | $ | 9,647 | -5.05 | % | | |
| 5-Year | +64.15 | % | +10.42 | % | $ | 16,415 | +9.76 | % | | |
| 10-Year | +92.38 | % | +6.76 | % | $ | 19,238 | +5.68 | % | | |
| R6 | | | | | | | | | 0.61 | % |
| 1-Year | -2.80 | % | -2.80 | % | $ | 9,720 | -4.36 | % | | |
| Since Inception (5/1/13) +23.23% | | +8.71 | % | $ | 12,323 | +5.89 | % | | |
| Advisor | | | | | | | | | 0.84 | % |
| 1-Year | -3.03 | % | -3.03 | % | $ | 9,697 | -4.57 | % | | |
| 5-Year | +68.28 | % | +10.97 | % | $ | 16,828 | +10.31 | % | | |
| 10-Year | +102.27 | % | +7.30 | % | $ | 20,227 | +6.21 | % | | |
Performance data represent past performance, which does not guarantee future results. Investment return and principal value will fluctuate, and you may have a gain or loss when you sell your shares. Current performance may differ from figures shown. For most recent month-end performance, go to franklintempleton.com or call (800) 342-5236.
|
56 Annual Report
franklintempleton.com
FRANKLIN SMALL CAP VALUE FUND
PERFORMANCE SUMMARY
Total Return Index Comparison for a Hypothetical $10,000 Investment2
Total return represents the change in value of an investment over the periods shown. It includes any applicable maximum sales charge, Fund expenses, account fees and reinvested distributions. The unmanaged index includes reinvestment of any income or distributions. It differs from the Fund in composition and does not pay management fees or expenses. One cannot invest directly in an index.
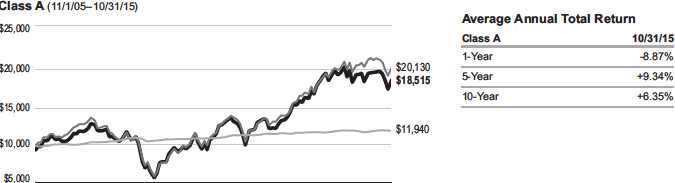

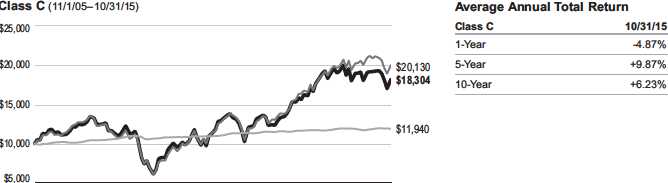

franklintempleton.com
Annual Report
|
57
FRANKLIN SMALL CAP VALUE FUND
PERFORMANCE SUMMARY
Total Return Index Comparison for a Hypothetical $10,000 Investment2 (continued)
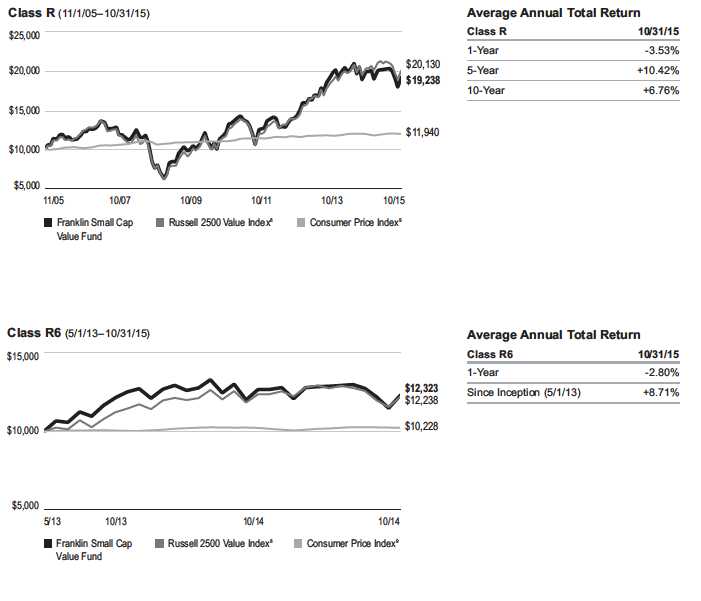
|
58 Annual Report
franklintempleton.com
FRANKLIN SMALL CAP VALUE FUND
PERFORMANCE SUMMARY
Total Return Index Comparison for a Hypothetical $10,000 Investment2 (continued)
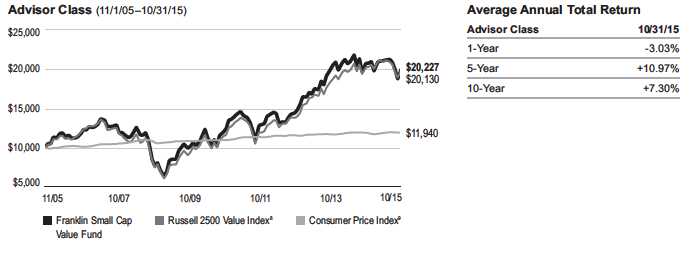
All investments involve risks, including possible loss of principal. The Fund’s investments in smaller company stocks carry special risks as such stocks have historically exhibited greater price volatility than larger company stocks, particularly over the short term. Additionally, smaller companies often have relatively small revenues, limited product lines and small market share. In addition, the Fund may invest up to 25% of its total assets in foreign securities, which involve special risks, including currency fluctuations and economic and political uncertainty. The Fund is actively managed but there is no guarantee that the manager’s investment decisions will produce the desired results. The Fund’s prospectus also includes a description of the main investment risks.
Class C: These shares have higher annual fees and expenses than Class A shares.
Class R: Shares are available to certain eligible investors as described in the prospectus. These shares have higher annual fees and expenses than Class A shares.
Class R6: Shares are available to certain eligible investors as described in the prospectus.
Advisor Class: Shares are available to certain eligible investors as described in the prospectus.
1. The distribution amount is the sum of the dividend payments to shareholders for the period shown and includes only estimated tax-basis net investment income and
capital gain.
2. The Fund has a fee waiver associated with any investment in a Franklin Templeton money fund, contractually guaranteed through at least its current fiscal year-end.
Fund investment results reflect the fee waiver, to the extent applicable; without these reductions, the results would have been lower.
3. Cumulative total return represents the change in value of an investment over the periods indicated.
4. Average annual total return represents the average annual change in value of an investment over the periods indicated.
5. These figures represent the value of a hypothetical $10,000 investment in the Fund over the periods indicated.
6. In accordance with SEC rules, we provide standardized average annual total return information through the latest calendar quarter.
7. Figures are as stated in the Fund’s current prospectus. In periods of market volatility, assets may decline significantly, causing total annual Fund operating expenses to
become higher than the figures shown.
8. Source: Morningstar. The Russell 2500 Value Index is market capitalization weighted and measures performance of those Russell 2500 Index companies with lower
price-to-book ratios and lower forecasted growth values.
9. Source: Bureau of Labor Statistics, bls.gov/cpi. The Consumer Price Index is a commonly used measure of the inflation rate.
See www.franklintempletondatasources.com for additional data provider information.
franklintempleton.com
Annual Report
|
59
FRANKLIN SMALL CAP VALUE FUND
Your Fund’s Expenses
As a Fund shareholder, you can incur two types of costs:
- Transaction costs, including sales charges (loads) on Fund purchases; and
- Ongoing Fund costs, including management fees, distribu- tion and service (12b-1) fees, and other Fund expenses. All mutual funds have ongoing costs, sometimes referred to as operating expenses.
The following table shows ongoing costs of investing in the Fund and can help you understand these costs and compare them with those of other mutual funds. The table assumes a $1,000 investment held for the six months indicated.
Actual Fund Expenses
The first line (Actual) for each share class listed in the table provides actual account values and expenses. The “Ending Account Value” is derived from the Fund’s actual return, which includes the effect of Fund expenses.
You can estimate the expenses you paid during the period by following these steps. Of course, your account value and expenses will differ from those in this illustration:
| 1. | Divide your account value by $1,000. |
| | If an account had an $8,600 value, then $8,600 ÷ $1,000 = 8.6. |
| 2. | Multiply the result by the number under the heading “Expenses Paid During Period.” |
| | If Expenses Paid During Period were $7.50, then 8.6 x $7.50 = $64.50. |
In this illustration, the estimated expenses paid this period are $64.50.
Hypothetical Example for Comparison with Other Funds
Information in the second line (Hypothetical) for each class in the table can help you compare ongoing costs of investing in the Fund with those of other mutual funds. This information may not be used to estimate the actual ending account balance or expenses you paid during the period. The hypothetical “Ending Account Value” is based on the actual expense ratio for each class and an assumed 5% annual rate of return before expenses, which does not represent the Fund’s actual return. The figure under the heading “Expenses Paid During Period” shows the hypothetical expenses your account would have incurred under this scenario. You can compare this figure with the 5% hypothetical examples that appear in shareholder reports of other funds.
Please note that expenses shown in the table are meant to highlight ongoing costs and do not reflect any transaction costs, such as sales charges. Therefore, the second line for each class is useful in comparing ongoing costs only, and will not help you compare total costs of owning different funds. In addition, if transaction costs were included, your total costs would have been higher. Please refer to the Fund prospectus for additional information on operating expenses.
|
60 Annual Report
franklintempleton.com
FRANKLIN SMALL CAP VALUE FUND
YOUR FUND’S EXPENSES
| | | | | | |
| | | Beginning Account | | Ending Account | | Expenses Paid During |
| Share Class | | Value 5/1/15 | | Value 10/31/15 | | Period* 5/1/15–10/31/15 |
| A | | | | | | |
| Actual | $ | 1,000 | $ | 953.50 | $ | 5.76 |
| Hypothetical (5% return before expenses) | $ | 1,000 | $ | 1,019.31 | $ | 5.96 |
| C | | | | | | |
| Actual | $ | 1,000 | $ | 949.90 | $ | 9.29 |
| Hypothetical (5% return before expenses) | $ | 1,000 | $ | 1,015.68 | $ | 9.60 |
| R | | | | | | |
| Actual | $ | 1,000 | $ | 952.40 | $ | 6.84 |
| Hypothetical (5% return before expenses) | $ | 1,000 | $ | 1,018.20 | $ | 7.07 |
| R6 | | | | | | |
| Actual | $ | 1,000 | $ | 956.10 | $ | 3.06 |
| Hypothetical (5% return before expenses) | $ | 1,000 | $ | 1,022.13 | $ | 3.16 |
| Advisor | | | | | | |
| Actual | $ | 1,000 | $ | 954.80 | $ | 4.39 |
| Hypothetical (5% return before expenses) | $ | 1,000 | $ | 1,020.72 | $ | 4.53 |
*Expenses are calculated using the most recent six-month expense ratio, net of expense waivers, annualized for each class (A: 1.17%;
C: 1.89%; R: 1.39%; R6: 0.61%; and Advisor: 0.89%), multiplied by the average account value over the period, multiplied by 184/365 to reflect
the one-half year period.
franklintempleton.com
Annual Report
|
61
| | | | | | | | | | | | | | | |
| FRANKLIN VALUE INVESTORS TRUST | | | | | | | | | | | | | | | |
| |
| |
| Financial Highlights | | | | | | | | | | | | | | | |
| Franklin All Cap Value Fund | | | | | | | | | | | | | | | |
| | | | | | Year Ended October 31, | | | | |
| | | 2015 | | | 2014 | | | 2013 | | | 2012 | | | 2011 | |
| Class A | | | | | | | | | | | | | | | |
| Per share operating performance | | | | | | | | | | | | | | | |
| (for a share outstanding throughout the year) | | | | | | | | | | | | | | | |
| Net asset value, beginning of year | $ | 13.01 | | $ | 12.23 | | $ | 9.23 | | $ | 8.45 | | $ | 8.41 | |
| Income from investment operationsa: | | | | | | | | | | | | | | | |
| Net investment incomeb | | 0.02 | | | 0.02 | | | 0.04 | | | 0.06 | | | 0.04 | |
| Net realized and unrealized gains (losses) | | (0.72 | ) | | 0.78 | | | 3.04 | | | 0.77 | | | 0.03 | |
| Total from investment operations | | (0.70 | ) | | 0.80 | | | 3.08 | | | 0.83 | | | 0.07 | |
| Less distributions from: | | | | | | | | | | | | | | | |
| Net investment income | | (0.01 | ) | | (0.02 | ) | | (0.08 | ) | | (0.05 | ) | | (0.03 | ) |
| Net realized gains | | (0.43 | ) | | — | | | — | | | — | | | — | |
| Total distributions | | (0.44 | ) | | (0.02 | ) | | (0.08 | ) | | (0.05 | ) | | (0.03 | ) |
| Net asset value, end of year | $ | 11.87 | | $ | 13.01 | | $ | 12.23 | | $ | 9.23 | | $ | 8.45 | |
| |
| Total returnc | | (5.45 | )% | | 6.51 | % | | 33.69 | % | | 9.83 | % | | 0.86 | % |
| |
| Ratios to average net assets | | | | | | | | | | | | | | | |
| Expenses before waiver and payments by affiliates | | 1.57 | % | | 1.42 | % | | 1.59 | % | | 1.67 | % | | 1.72 | % |
| Expenses net of waiver and payments by affiliates | | 1.24 | % | | 1.25 | % | | 1.23 | % | | 1.20 | % | | 1.20 | % |
| Net investment income | | 0.17 | % | | 0.12 | % | | 0.37 | % | | 0.70 | % | | 0.46 | % |
| |
| Supplemental data | | | | | | | | | | | | | | | |
| Net assets, end of year (000’s) | $ | 40,894 | | $ | 46,657 | | $ | 37,004 | | $ | 20,127 | | $ | 18,455 | |
| Portfolio turnover rate | | 80.06 | % | | 29.81 | % | | 26.63 | % | | 26.94 | % | | 34.96 | % |
aThe amount shown for a share outstanding throughout the period may not correlate with the Statement of Operations for the period due to the timing of sales and
repurchases of the Fund’s shares in relation to income earned and/or fluctuating fair value of the investments of the Fund.
bBased on average daily shares outstanding.
cTotal return does not reflect sales commissions or contingent deferred sales charges, if applicable.
|
62 Annual Report | The accompanying notes are an integral part of these financial statements.
franklintempleton.com
FRANKLIN VALUE INVESTORS TRUST
FINANCIAL HIGHLIGHTS
| | | | | | | | | | | | | | | |
| Franklin All Cap Value Fund (continued) | | | | | | | | | | | | | | | |
| | | | | | Year Ended October 31, | | | | |
| | | 2015 | | | 2014 | | | 2013 | | | 2012 | | | 2011 | |
| Class C | | | | | | | | | | | | | | | |
| Per share operating performance | | | | | | | | | | | | | | | |
| (for a share outstanding throughout the year) | | | | | | | | | | | | | | | |
| Net asset value, beginning of year | $ | 12.74 | | $ | 12.05 | | $ | 9.09 | | $ | 8.34 | | $ | 8.33 | |
| Income from investment operationsa: | | | | | | | | | | | | | | | |
| Net investment income (loss)b | | (0.06 | ) | | (0.07 | ) | | (0.03 | ) | | —c | | | (0.02 | ) |
| Net realized and unrealized gains (losses) | | (0.70 | ) | | 0.76 | | | 3.01 | | | 0.75 | | | 0.03 | |
| Total from investment operations | | (0.76 | ) | | 0.69 | | | 2.98 | | | 0.75 | | | 0.01 | |
| Less distributions from: | | | | | | | | | | | | | | | |
| Net investment income | | — | | | — | | | (0.02 | ) | | — | | | — | |
| Net realized gains | | (0.43 | ) | | — | | | — | | | — | | | — | |
| Total distributions | | (0.43 | ) | | — | | | (0.02 | ) | | — | | | — | |
| Net asset value, end of year | $ | 11.55 | | $ | 12.74 | | $ | 12.05 | | $ | 9.09 | | $ | 8.34 | |
| |
| Total returnd | | (6.05 | )% | | 5.73 | % | | 32.82 | % | | 8.99 | % | | 0.12 | % |
| |
| Ratios to average net assets | | | | | | | | | | | | | | | |
| Expenses before waiver and payments by affiliates | | 2.27 | % | | 2.12 | % | | 2.29 | % | | 2.37 | % | | 2.42 | % |
| Expenses net of waiver and payments by affiliates | | 1.94 | % | | 1.95 | % | | 1.93 | % | | 1.90 | % | | 1.90 | % |
| Net investment income (loss) | | (0.53 | )% | | (0.58 | )% | | (0.33 | )% | | —%e | | | (0.24 | )% |
| |
| Supplemental data | | | | | | | | | | | | | | | |
| Net assets, end of year (000’s) | $ | 6,521 | | $ | 8,279 | | $ | 5,745 | | $ | 3,248 | | $ | 3,159 | |
| Portfolio turnover rate | | 80.06 | % | | 29.81 | % | | 26.63 | % | | 26.94 | % | | 34.96 | % |
aThe amount shown for a share outstanding throughout the period may not correlate with the Statement of Operations for the period due to the timing of sales and
repurchases of the Fund’s shares in relation to income earned and/or fluctuating fair value of the investments of the Fund.
bBased on average daily shares outstanding.
cAmount rounds to less than $0.01 per share.
dTotal return does not reflect sales commissions or contingent deferred sales charges, if applicable.
eRounds to less than 0.01%.
franklintempleton.com
|
The accompanying notes are an integral part of these financial statements. | Annual Report 63
| | | | | | | | | | | | | | | |
| FRANKLIN VALUE INVESTORS TRUST | | | | | | | | | | | | | | | |
| FINANCIAL HIGHLIGHTS | | | | | | | | | | | | | | | |
| |
| |
| |
| Franklin All Cap Value Fund (continued) | | | | | | | | | | | | | | | |
| | | | | | Year Ended October 31, | | | | |
| | | 2015 | | | 2014 | | | 2013 | | | 2012 | | | 2011 | |
| Class R | | | | | | | | | | | | | | | |
| Per share operating performance | | | | | | | | | | | | | | | |
| (for a share outstanding throughout the year) | | | | | | | | | | | | | | | |
| Net asset value, beginning of year | $ | 13.00 | | $ | 12.23 | | $ | 9.21 | | $ | 8.43 | | $ | 8.39 | |
| Income from investment operationsa: | | | | | | | | | | | | | | | |
| Net investment income (loss)b | | (0.01 | ) | | (0.01 | ) | | 0.02 | | | 0.06 | | | 0.02 | |
| Net realized and unrealized gains (losses) | | (0.70 | ) | | 0.78 | | | 3.04 | | | 0.75 | | | 0.04 | |
| Total from investment operations | | (0.71 | ) | | 0.77 | | | 3.06 | | | 0.81 | | | 0.06 | |
| Less distributions from: | | | | | | | | | | | | | | | |
| Net investment income | | (—)c | | | — | | | (0.04 | ) | | (0.03 | ) | | (0.02 | ) |
| Net realized gains | | (0.43 | ) | | — | | | — | | | — | | | — | |
| Total distributions | | (0.43 | ) | | — | | | (0.04 | ) | | (0.03 | ) | | (0.02 | ) |
| Net asset value, end of year | $ | 11.86 | | $ | 13.00 | | $ | 12.23 | | $ | 9.21 | | $ | 8.43 | |
| |
| Total return | | (5.61 | )% | | 6.30 | % | | 33.45 | % | | 9.61 | % | | 0.69 | % |
| |
| Ratios to average net assets | | | | | | | | | | | | | | | |
| Expenses before waiver and payments by affiliates | | 1.78 | % | | 1.62 | % | | 1.79 | % | | 1.87 | % | | 1.92 | % |
| Expenses net of waiver and payments by affiliates | | 1.45 | % | | 1.45 | % | | 1.43 | % | | 1.40 | % | | 1.40 | % |
| Net investment income (loss) | | (0.04 | )% | | (0.08 | )% | | 0.17 | % | | 0.50 | % | | 0.26 | % |
| |
| Supplemental data | | | | | | | | | | | | | | | |
| Net assets, end of year (000’s) | $ | 59 | | $ | 79 | | $ | 46 | | $ | 29 | | $ | 54 | |
| Portfolio turnover rate | | 80.06 | % | | 29.81 | % | | 26.63 | % | | 26.94 | % | | 34.96 | % |
aThe amount shown for a share outstanding throughout the period may not correlate with the Statement of Operations for the period due to the timing of sales and
repurchases of the Fund’s shares in relation to income earned and/or fluctuating fair value of the investments of the Fund.
bBased on average daily shares outstanding.
cAmount rounds to less than $0.01 per share.
|
64 Annual Report | The accompanying notes are an integral part of these financial statements.
franklintempleton.com
FRANKLIN VALUE INVESTORS TRUST
FINANCIAL HIGHLIGHTS
| | | | | | | | | | | | | | | |
| Franklin All Cap Value Fund (continued) | | | | | | | | | | | | | | | |
| | | | | | Year Ended October 31, | | | | |
| | | 2015 | | | 2014 | | | 2013 | | | 2012 | | | 2011 | |
| Advisor Class | | | | | | | | | | | | | | | |
| Per share operating performance | | | | | | | | | | | | | | | |
| (for a share outstanding throughout the year) | | | | | | | | | | | | | | | |
| Net asset value, beginning of year | $ | 13.09 | | $ | 12.29 | | $ | 9.28 | | $ | 8.49 | | $ | 8.45 | |
| Income from investment operationsa: | | | | | | | | | | | | | | | |
| Net investment incomeb | | 0.06 | | | 0.05 | | | 0.07 | | | 0.09 | | | 0.07 | |
| Net realized and unrealized gains (losses) | | (0.73 | ) | | 0.79 | | | 3.05 | | | 0.77 | | | 0.02 | |
| Total from investment operations | | (0.67 | ) | | 0.84 | | | 3.12 | | | 0.86 | | | 0.09 | |
| Less distributions from: | | | | | | | | | | | | | | | |
| Net investment income | | (0.05 | ) | | (0.04 | ) | | (0.11 | ) | | (0.07 | ) | | (0.05 | ) |
| Net realized gains | | (0.43 | ) | | — | | | — | | | — | | | — | |
| Total distributions | | (0.48 | ) | | (0.04 | ) | | (0.11 | ) | | (0.07 | ) | | (0.05 | ) |
| Net asset value, end of year | $ | 11.94 | | $ | 13.09 | | $ | 12.29 | | $ | 9.28 | | $ | 8.49 | |
| |
| Total return | | (5.18 | )% | | 6.83 | % | | 34.00 | % | | 10.28 | % | | 1.09 | % |
| |
| Ratios to average net assets | | | | | | | | | | | | | | | |
| Expenses before waiver and payments by affiliates | | 1.28 | % | | 1.12 | % | | 1.29 | % | | 1.37 | % | | 1.42 | % |
| Expenses net of waiver and payments by affiliates | | 0.95 | % | | 0.95 | % | | 0.93 | % | | 0.90 | % | | 0.90 | % |
| Net investment income | | 0.46 | % | | 0.42 | % | | 0.67 | % | | 1.00 | % | | 0.76 | % |
| |
| Supplemental data | | | | | | | | | | | | | | | |
| Net assets, end of year (000’s) | $ | 2,916 | | $ | 2,978 | | $ | 2,411 | | $ | 1,668 | | $ | 1,644 | |
| Portfolio turnover rate | | 80.06 | % | | 29.81 | % | | 26.63 | % | | 26.94 | % | | 34.96 | % |
aThe amount shown for a share outstanding throughout the period may not correlate with the Statement of Operations for the period due to the timing of sales and
repurchases of the Fund’s shares in relation to income earned and/or fluctuating fair value of the investments of the Fund.
bBased on average daily shares outstanding.
franklintempleton.com
|
The accompanying notes are an integral part of these financial statements. | Annual Report 65
| | | |
| FRANKLIN VALUE INVESTORS TRUST | | | |
| |
| |
| |
| |
| Statement of Investments, October 31, 2015 | | | |
| |
| Franklin All Cap Value Fund | | | |
| | Shares | | Value |
| Common Stocks 87.0% | | | |
| Aerospace & Defense 4.4% | | | |
| AAR Corp. | 97,707 | $ | 2,216,971 |
| Automobiles & Components 2.6% | | | |
| Gentex Corp. | 19,000 | | 311,410 |
| Johnson Controls Inc. | 3,000 | | 135,540 |
| Spartan Motors Inc. | 213,800 | | 882,994 |
| | | | 1,329,944 |
| Banks 5.0% | | | |
| EverBank Financial Corp. | 68,100 | | 1,175,406 |
| KeyCorp | 20,000 | | 248,400 |
| U.S. Bancorp | 26,200 | | 1,105,116 |
| | | | 2,528,922 |
| Building Products 10.2% | | | |
| aGibraltar Industries Inc. | 55,000 | | 1,392,600 |
| Griffon Corp. | 55,000 | | 944,900 |
| Insteel Industries Inc. | 60,000 | | 1,283,400 |
| Universal Forest Products Inc. | 21,000 | | 1,525,230 |
| | | | 5,146,130 |
| Commercial & Professional Services 0.9% | | | |
| aHuron Consulting Group Inc. | 4,000 | | 193,200 |
| McGrath RentCorp | 8,700 | | 261,435 |
| | | | 454,635 |
| Consumer Durables & Apparel 5.2% | | | |
| aBRP Inc. (Canada) | 40,000 | | 720,125 |
| Coach Inc. | 500 | | 15,600 |
| aCrocs Inc. | 62,400 | | 673,920 |
| aHelen of Troy Ltd. | 900 | | 89,289 |
| La-Z-Boy Inc. | 30,000 | | 856,500 |
| Mattel Inc. | 10,000 | | 245,800 |
| | | | 2,601,234 |
| Electrical Equipment 2.5% | | | |
| Eaton Corp. PLC | 1,000 | | 55,910 |
| Encore Wire Corp. | 2,400 | | 102,648 |
| Regal Beloit Corp. | 17,000 | | 1,084,430 |
| | | | 1,242,988 |
| Energy 5.3% | | | |
| Apache Corp. | 1,000 | | 47,130 |
| Baker Hughes Inc. | 3,000 | | 158,040 |
| Bristow Group Inc. | 9,000 | | 312,570 |
| California Resources Corp. | 3,000 | | 12,120 |
| Denbury Resources Inc. | 1,000 | | 3,540 |
| Hunting PLC (United Kingdom) | 60,000 | | 332,725 |
| aNatural Gas Services Group Inc. | 3,000 | | 67,560 |
| Occidental Petroleum Corp. | 1,000 | | 74,540 |
| aPHI Inc. | 35,700 | | 678,300 |
| aPHI Inc., non-voting | 31,000 | | 590,240 |
| Rowan Cos. PLC | 100 | | 1,968 |
| aUnit Corp. | 30,000 | | 378,300 |
| | | | 2,657,033 |
| |
| 66 | Annual Report | franklintempleton.com |
| | | |
| | FRANKLIN VALUE INVESTORS TRUST |
| | STATEMENT OF INVESTMENTS |
| |
| |
| |
| |
| Franklin All Cap Value Fund (continued) | | | |
| | Shares | | Value |
| Common Stocks (continued) | | | |
| Food & Staples Retailing 1.0% | | | |
| Wal-Mart Stores Inc. | 8,900 | $ | 509,436 |
| Food, Beverage & Tobacco 10.3% | | | |
| GrainCorp Ltd. (Australia) | 55,000 | | 354,871 |
| The Kraft Heinz Co. | 24,733 | | 1,928,432 |
| Maple Leaf Foods Inc. (Canada) | 91,000 | | 1,446,897 |
| aOmega Protein Corp. | 35,000 | | 637,000 |
| PepsiCo Inc. | 8,000 | | 817,520 |
| | | | 5,184,720 |
| Health Care Equipment & Services 3.3% | | | |
| Becton, Dickinson and Co. | 5,000 | | 712,600 |
| STERIS Corp. | 12,500 | | 936,875 |
| | | | 1,649,475 |
| Household & Personal Products 1.0% | | | |
| The Procter & Gamble Co. | 6,800 | | 519,384 |
| Insurance 0.7% | | | |
| The Allstate Corp. | 3,300 | | 204,204 |
| Prudential Financial Inc. | 2,000 | | 165,000 |
| | | | 369,204 |
| Machinery 3.5% | | | |
| John Bean Technologies Corp. | 18,000 | | 807,480 |
| Miller Industries Inc. | 20,000 | | 453,600 |
| aWabash National Corp. | 40,900 | | 489,573 |
| Xylem Inc. | 1,000 | | 36,410 |
| | | | 1,787,063 |
| Materials 9.7% | | | |
| Albemarle Corp. | 500 | | 26,760 |
| Alcoa Inc. | 120,000 | | 1,071,600 |
| Allegheny Technologies Inc. | 15,900 | | 233,730 |
| Axiall Corp. | 73,300 | | 1,484,325 |
| Carpenter Technology Corp. | 7,500 | | 249,825 |
| H.B. Fuller Co. | 11,700 | | 444,483 |
| Kaiser Aluminum Corp. | 100 | | 8,129 |
| Minerals Technologies Inc. | 5,800 | | 341,852 |
| Sensient Technologies Corp. | 13,000 | | 848,510 |
| Stepan Co. | 3,500 | | 185,255 |
| | | | 4,894,469 |
| Pharmaceuticals, Biotechnology & Life Sciences 7.6% | | | |
| Gerresheimer AG (Germany) | 15,600 | | 1,216,959 |
| Johnson & Johnson | 12,000 | | 1,212,360 |
| Sanofi, ADR (France) | 27,500 | | 1,384,350 |
| | | | 3,813,669 |
| Real Estate 2.0% | | | |
| LTC Properties Inc. | 23,400 | | 1,002,690 |
franklintempleton.com
Annual Report
|
67
FRANKLIN VALUE INVESTORS TRUST
STATEMENT OF INVESTMENTS
| | | | |
| Franklin All Cap Value Fund (continued) | | | | |
| | | Shares | | Value |
| Common Stocks (continued) | | | | |
| Retailing 4.2% | | | | |
| The Men’s Wearhouse Inc. | | 16,900 | $ | 675,662 |
| aThe Pep Boys - Manny, Moe & Jack | | 93,165 | | 1,401,202 |
| Target Corp. | | 500 | | 38,590 |
| | | | | 2,115,454 |
| Semiconductors & Semiconductor Equipment 1.9% | | | | |
| Microchip Technology Inc. | | 10,000 | | 482,900 |
| MKS Instruments Inc. | | 13,000 | | 458,120 |
| | | | | 941,020 |
| Technology Hardware & Equipment 0.2% | | | | |
| Corning Inc. | | 5,000 | | 93,000 |
| Telecommunication Services 2.8% | | | | |
| aOrbcomm Inc. | | 237,500 | | 1,410,750 |
| Utilities 2.7% | | | | |
| IDACORP Inc. | | 9,400 | | 628,390 |
| The Laclede Group Inc. | | 13,000 | | 761,410 |
| | | | | 1,389,800 |
| Total Common Stocks (Cost $39,710,433) | | | | 43,857,991 |
| | | Principal | | |
| | | Amount | | |
| Corporate Bonds (Cost $289,762) 0.5% | | | | |
| Energy 0.5% | | | | |
| Unit Corp., senior sub. note, 6.625%, 5/15/21 | $ | 299,000 | | 240,695 |
| Total Investments before Short Term Investments (Cost $40,000,195) | | | | 44,098,686 |
| | | Shares | | |
| Short Term Investments (Cost $6,094,257) 12.1% | | | | |
| Money Market Funds 12.1% | | | | |
| a,bInstitutional Fiduciary Trust Money Market Portfolio | | 6,094,257 | | 6,094,257 |
| Total Investments (Cost $46,094,452) 99.6% | | | | 50,192,943 |
| Other Assets, less Liabilities 0.4% | | | | 197,187 |
| Net Assets 100.0% | | | $ | 50,390,130 |
See Abbreviations on page 134.
aNon-income producing.
bSee Note 3(f) regarding investments in affiliated management investment companies.
|
68 Annual Report | The accompanying notes are an integral part of these financial statements.
franklintempleton.com
| | | | | | | | | | | | | | | |
| | | | | | FRANKLIN VALUE INVESTORS TRUST | |
| |
| |
| Financial Highlights | | | | | | | | | | | | | | | |
| Franklin Balance Sheet Investment Fund | | | | | | | | | | | | | | | |
| | | | | | Year Ended October 31, | | | | |
| | | 2015 | | | 2014 | | | 2013 | | | 2012 | | | 2011 | |
| Class A | | | | | | | | | | | | | | | |
| Per share operating performance | | | | | | | | | | | | | | | |
| (for a share outstanding throughout the year) | | | | | | | | | | | | | | | |
| Net asset value, beginning of year | $ | 51.55 | | $ | 53.98 | | $ | 43.01 | | $ | 44.05 | | $ | 47.25 | |
| Income from investment operationsa: | | | | | | | | | | | | | | | |
| Net investment incomeb | | 0.19 | | | 0.46 | c | | 0.64 | d | | 0.48 | | | 0.50 | |
| Net realized and unrealized gains (losses) | | (3.92 | ) | | 3.06 | | | 13.15 | | | 3.65 | | | 1.02 | |
| Total from investment operations | | (3.73 | ) | | 3.52 | | | 13.79 | | | 4.13 | | | 1.52 | |
| Less distributions from: | | | | | | | | | | | | | | | |
| Net investment income | | (0.17 | ) | | (0.65 | ) | | (0.66 | ) | | (0.25 | ) | | (0.79 | ) |
| Net realized gains | | (7.59 | ) | | (5.30 | ) | | (2.16 | ) | | (4.92 | ) | | (3.93 | ) |
| Total distributions | | (7.76 | ) | | (5.95 | ) | | (2.82 | ) | | (5.17 | ) | | (4.72 | ) |
| Net asset value, end of year | $ | 40.06 | | $ | 51.55 | | $ | 53.98 | | $ | 43.01 | | $ | 44.05 | |
| |
| Total returne | | (7.73 | )% | | 6.97 | % | | 33.97 | % | | 11.09 | % | | 2.75 | % |
| |
| Ratios to average net assets | | | | | | | | | | | | | | | |
| Expenses before waiver and payments by affiliates | | 0.95 | % | | 0.90 | % | | 0.91 | % | | 0.99 | % | | 0.94 | % |
| Expenses net of waiver and payments by affiliates | | 0.94 | % | | 0.89 | %f | | 0.91 | % | | 0.99 | % | | 0.94 | % |
| Net investment income | | 0.45 | % | | 0.89 | %c | | 1.34 | %d | | 1.16 | % | | 1.06 | % |
| |
| Supplemental data | | | | | | | | | | | | | | | |
| Net assets, end of year (000’s) | $ | 915,285 | | $ | 1,221,903 | | $ | 1,256,543 | | $ | 1,079,418 | | $ | 1,441,777 | |
| Portfolio turnover rate | | 26.31 | % | | 25.08 | % | | 11.54 | % | | 7.91 | %g | | 9.66 | % |
aThe amount shown for a share outstanding throughout the period may not correlate with the Statement of Operations for the period due to the timing of sales and
repurchases of the Fund’s shares in relation to income earned and/or fluctuating fair value of the investments of the Fund.
bBased on average daily shares outstanding.
cNet investment income per share includes approximately $0.15 per share received in the form of special dividends. Excluding these amounts, the ratio of net investment
income to average net assets would have been 0.61%.
dNet investment income per share includes approximately $0.15 per share received in the form of special dividends. Excluding these amounts, the ratio of net investment
income to average net assets would have been 1.02%.
eTotal return does not reflect sales commissions or contingent deferred sales charges, if applicable.
fBenefit of expense reduction rounds to less than 0.01%.
gExcludes the value of portfolio securities delivered as a result of a redemption in-kind.
franklintempleton.com
|
The accompanying notes are an integral part of these financial statements. | Annual Report 69
| | | | | | | | | | | | | | | |
| FRANKLIN VALUE INVESTORS TRUST | | | | | | | | | | | | | | | |
| FINANCIAL HIGHLIGHTS | | | | | | | | | | | | | | | |
| |
| |
| |
| Franklin Balance Sheet Investment Fund (continued) | | | | | | | | | | | | | | | |
| | | | | | Year Ended October 31, | | | | |
| | | 2015 | | | 2014 | | | 2013 | | | 2012 | | | 2011 | |
| Class C | | | | | | | | | | | | | | | |
| Per share operating performance | | | | | | | | | | | | | | | |
| (for a share outstanding throughout the year) | | | | | | | | | | | | | | | |
| Net asset value, beginning of year | $ | 50.22 | | $ | 52.77 | | $ | 42.10 | | $ | 43.27 | | $ | 46.51 | |
| Income from investment operationsa: | | | | | | | | | | | | | | | |
| Net investment income (loss)b | | (0.12 | ) | | 0.07 | c | | 0.25 | d | | 0.15 | | | 0.12 | |
| Net realized and unrealized gains (losses) | | (3.81 | ) | | 2.99 | | | 12.93 | | | 3.60 | | | 1.02 | |
| Total from investment operations | | (3.93 | ) | | 3.06 | | | 13.18 | | | 3.75 | | | 1.14 | |
| Less distributions from: | | | | | | | | | | | | | | | |
| Net investment income | | — | | | (0.31 | ) | | (0.35 | ) | | — | | | (0.45 | ) |
| Net realized gains | | (7.59 | ) | | (5.30 | ) | | (2.16 | ) | | (4.92 | ) | | (3.93 | ) |
| Total distributions | | (7.59 | ) | | (5.61 | ) | | (2.51 | ) | | (4.92 | ) | | (4.38 | ) |
| Net asset value, end of year | $ | 38.70 | | $ | 50.22 | | $ | 52.77 | | $ | 42.10 | | $ | 43.27 | |
| |
| Total returne | | (8.41 | )% | | 6.17 | % | | 33.01 | % | | 10.25 | % | | 1.97 | % |
| |
| Ratios to average net assets | | | | | | | | | | | | | | | |
| Expenses before waiver and payments by affiliates | | 1.70 | % | | 1.65 | % | | 1.66 | % | | 1.74 | % | | 1.69 | % |
| Expenses net of waiver and payments by affiliates | | 1.69 | % | | 1.64 | %f | | 1.66 | % | | 1.74 | % | | 1.69 | % |
| Net investment income (loss) | | (0.30 | )% | | 0.14 | %c | | 0.59 | %d | | 0.41 | % | | 0.31 | % |
| |
| Supplemental data | | | | | | | | | | | | | | | |
| Net assets, end of year (000’s) | $ | 73,185 | | $ | 96,279 | | $ | 96,462 | | $ | 71,723 | | $ | 75,025 | |
| Portfolio turnover rate | | 26.31 | % | | 25.08 | % | | 11.54 | % | | 7.91 | %g | | 9.66 | % |
aThe amount shown for a share outstanding throughout the period may not correlate with the Statement of Operations for the period due to the timing of sales and
repurchases of the Fund’s shares in relation to income earned and/or fluctuating fair value of the investments of the Fund.
bBased on average daily shares outstanding.
cNet investment income per share includes approximately $0.15 per share received in the form of special dividends. Excluding these amounts, the ratio of net investment
income to average net assets would have been (0.14)%.
dNet investment income per share includes approximately $0.15 per share received in the form of special dividends. Excluding these amounts, the ratio of net investment
income to average net assets would have been 0.27%.
eTotal return does not reflect sales commissions or contingent deferred sales charges, if applicable.
fBenefit of expense reduction rounds to less than 0.01%.
gExcludes the value of portfolio securities delivered as a result of a redemption in-kind.
|
70 Annual Report | The accompanying notes are an integral part of these financial statements.
franklintempleton.com
| | | | | | | | | | | | | | | |
| | | | | | FRANKLIN VALUE INVESTORS TRUST | |
| | | | | | | | | FINANCIAL HIGHLIGHTS | |
| |
| |
| |
| Franklin Balance Sheet Investment Fund (continued) | | | | | | | | | | | | | | | |
| | | | | | Year Ended October 31, | | | | |
| | | 2015 | | | 2014 | | | 2013 | | | 2012 | | | 2011 | |
| Class R | | | | | | | | | | | | | | | |
| Per share operating performance | | | | | | | | | | | | | | | |
| (for a share outstanding throughout the year) | | | | | | | | | | | | | | | |
| Net asset value, beginning of year | $ | 51.48 | | $ | 53.90 | | $ | 42.95 | | $ | 43.94 | | $ | 47.12 | |
| Income from investment operationsa: | | | | | | | | | | | | | | | |
| Net investment incomeb | | 0.09 | | | 0.36 | c | | 0.49 | d | | 0.37 | | | 0.42 | |
| Net realized and unrealized gains (losses) | | (3.91 | ) | | 3.01 | | | 13.18 | | | 3.65 | | | 0.98 | |
| Total from investment operations | | (3.82 | ) | | 3.37 | | | 13.67 | | | 4.02 | | | 1.40 | |
| Less distributions from: | | | | | | | | | | | | | | | |
| Net investment income | | (0.01 | ) | | (0.49 | ) | | (0.56 | ) | | (0.09 | ) | | (0.65 | ) |
| Net realized gains | | (7.59 | ) | | (5.30 | ) | | (2.16 | ) | | (4.92 | ) | | (3.93 | ) |
| Total distributions | | (7.60 | ) | | (5.79 | ) | | (2.72 | ) | | (5.01 | ) | | (4.58 | ) |
| Net asset value, end of year | $ | 40.06 | | $ | 51.48 | | $ | 53.90 | | $ | 42.95 | | $ | 43.94 | |
| |
| Total return | | (7.94 | )% | | 6.67 | % | | 33.67 | % | | 10.80 | % | | 2.50 | % |
| |
| Ratios to average net assets | | | | | | | | | | | | | | | |
| Expenses before waiver and payments by affiliates | | 1.20 | % | | 1.15 | % | | 1.16 | % | | 1.24 | % | | 1.19 | % |
| Expenses net of waiver and payments by affiliates | | 1.19 | % | | 1.14 | %e | | 1.16 | % | | 1.24 | % | | 1.19 | % |
| Net investment income | | 0.20 | % | | 0.64 | %c | | 1.09 | %d | | 0.91 | % | | 0.81 | % |
| |
| Supplemental data | | | | | | | | | | | | | | | |
| Net assets, end of year (000’s) | $ | 9,831 | | $ | 14,261 | | $ | 17,992 | | $ | 15,053 | | $ | 19,321 | |
| Portfolio turnover rate | | 26.31 | % | | 25.08 | % | | 11.54 | % | | 7.91 | %f | | 9.66 | % |
aThe amount shown for a share outstanding throughout the period may not correlate with the Statement of Operations for the period due to the timing of sales and
repurchases of the Fund’s shares in relation to income earned and/or fluctuating fair value of the investments of the Fund.
bBased on average daily shares outstanding.
cNet investment income per share includes approximately $0.15 per share received in the form of special dividends. Excluding these amounts, the ratio of net investment
income to average net assets would have been 0.36%.
dNet investment income per share includes approximately $0.15 per share received in the form of special dividends. Excluding these amounts, the ratio of net investment
income to average net assets would have been 0.77%.
eBenefit of expense reduction rounds to less than 0.01%.
fExcludes the value of portfolio securities delivered as a result of a redemption in-kind.
franklintempleton.com
|
The accompanying notes are an integral part of these financial statements. | Annual Report 71
| | | | | | | | | |
| FRANKLIN VALUE INVESTORS TRUST | | | | | | | | | |
| FINANCIAL HIGHLIGHTS | | | | | | | | | |
| |
| |
| |
| Franklin Balance Sheet Investment Fund (continued) | | | | | | | | | |
| | | Year Ended October 31, | |
| | | 2015 | | | 2014 | | | 2013 | a |
| Class R6 | | | | | | | | | |
| Per share operating performance | | | | | | | | | |
| (for a share outstanding throughout the year) | | | | | | | | | |
| Net asset value, beginning of year | $ | 52.70 | | $ | 55.06 | | $ | 47.79 | |
| Income from investment operationsb: | | | | | | | | | |
| Net investment incomec | | 0.37 | | | 0.47 | d | | 0.32 | e |
| Net realized and unrealized gains (losses) | | (3.99 | ) | | 3.32 | | | 6.95 | |
| Total from investment operations | | (3.62 | ) | | 3.79 | | | 7.27 | |
| Less distributions from: | | | | | | | | | |
| Net investment income | | (0.39 | ) | | (0.85 | ) | | — | |
| Net realized gains | | (7.59 | ) | | (5.30 | ) | | — | |
| Total distributions | | (7.98 | ) | | (6.15 | ) | | — | |
| Net asset value, end of year | $ | 41.10 | | $ | 52.70 | | $ | 55.06 | |
| |
| Total returnf | | (7.33 | )% | | 7.37 | % | | 15.21 | % |
| |
| Ratios to average net assetsg | | | | | | | | | |
| Expenses before waiver and payments by affiliates | | 0.51 | % | | 0.50 | % | | 2.10 | % |
| Expenses net of waiver and payments by affiliates | | 0.50 | % | | 0.49 | %h | | 0.51 | % |
| Net investment income | | 0.89 | % | | 1.29 | %d | | 1.25 | %e |
| |
| Supplemental data | | | | | | | | | |
| Net assets, end of year (000’s) | $ | 7,412 | | $ | 7,863 | | $ | 6 | |
| Portfolio turnover rate | | 26.31 | % | | 25.08 | % | | 11.54 | % |
aFor the period May 1, 2013 (effective date) to October 31, 2013.
bThe amount shown for a share outstanding throughout the period may not correlate with the Statement of Operations for the period due to the timing of sales and
repurchases of the Fund’s shares in relation to income earned and/or fluctuating fair value of the investments of the Fund.
cBased on average daily shares outstanding.
dNet investment income per share includes approximately $0.15 per share received in the form of special dividends. Excluding these amounts, the ratio of net investment
income to average net assets would have been 1.01%.
eNet investment income per share includes approximately $0.07 per share received in the form of special dividends. Excluding these amounts, the ratio of net investment
income to average net assets would have been 1.00%.
fTotal return is not annualized for periods less than one year.
gRatios are annualized for periods less than one year.
hBenefit of expense reduction rounds to less than 0.01%.
|
72 Annual Report | The accompanying notes are an integral part of these financial statements.
franklintempleton.com
| | | | | | | | | | | | | | | |
| | | | | | FRANKLIN VALUE INVESTORS TRUST | |
| | | | | | | | | FINANCIAL HIGHLIGHTS | |
| |
| |
| |
| Franklin Balance Sheet Investment Fund (continued) | | | | | | | | | | | | | | | |
| | | | | | Year Ended October 31, | | | | |
| | | 2015 | | | 2014 | | | 2013 | | | 2012 | | | 2011 | |
| Advisor Class | | | | | | | | | | | | | | | |
| Per share operating performance | | | | | | | | | | | | | | | |
| (for a share outstanding throughout the year) | | | | | | | | | | | | | | | |
| Net asset value, beginning of year | $ | 52.68 | | $ | 55.04 | | $ | 43.79 | | $ | 44.82 | | $ | 48.01 | |
| Income from investment operationsa: | | | | | | | | | | | | | | | |
| Net investment incomeb | | 0.30 | | | 0.60 | c | | 0.79 | d | | 0.58 | | | 0.58 | |
| Net realized and unrealized gains (losses) | | (4.00 | ) | | 3.12 | | | 13.40 | | | 3.69 | | | 1.08 | |
| Total from investment operations | | (3.70 | ) | | 3.72 | | | 14.19 | | | 4.27 | | | 1.66 | |
| Less distributions from: | | | | | | | | | | | | | | | |
| Net investment income | | (0.31 | ) | | (0.78 | ) | | (0.78 | ) | | (0.38 | ) | | (0.92 | ) |
| Net realized gains | | (7.59 | ) | | (5.30 | ) | | (2.16 | ) | | (4.92 | ) | | (3.93 | ) |
| Total distributions | | (7.90 | ) | | (6.08 | ) | | (2.94 | ) | | (5.30 | ) | | (4.85 | ) |
| Net asset value, end of year | $ | 41.08 | | $ | 52.68 | | $ | 55.04 | | $ | 43.79 | | $ | 44.82 | |
| |
| Total return | | (7.51 | )% | | 7.23 | % | | 34.39 | % | | 11.34 | % | | 3.01 | % |
| |
| Ratios to average net assets | | | | | | | | | | | | | | | |
| Expenses before waiver and payments by affiliates | | 0.70 | % | | 0.65 | % | | 0.66 | % | | 0.74 | % | | 0.69 | % |
| Expenses net of waiver and payments by affiliates | | 0.69 | % | | 0.64 | %e | | 0.66 | % | | 0.74 | % | | 0.69 | % |
| Net investment income | | 0.70 | % | | 1.14 | %c | | 1.59 | %d | | 1.41 | % | | 1.31 | % |
| |
| Supplemental data | | | | | | | | | | | | | | | |
| Net assets, end of year (000’s) | $ | 69,330 | | $ | 115,254 | | $ | 107,925 | | $ | 115,694 | | $ | 195,437 | |
| Portfolio turnover rate | | 26.31 | % | | 25.08 | % | | 11.54 | % | | 7.91 | %f | | 9.66 | % |
aThe amount shown for a share outstanding throughout the period may not correlate with the Statement of Operations for the period due to the timing of sales and
repurchases of the Fund’s shares in relation to income earned and/or fluctuating fair value of the investments of the Fund.
bBased on average daily shares outstanding.
cNet investment income per share includes approximately $0.15 per share received in the form of special dividends. Excluding these amounts, the ratio of net investment
income to average net assets would have been 0.86%.
dNet investment income per share includes approximately $0.15 per share received in the form of special dividends. Excluding these amounts, the ratio of net investment
income to average net assets would have been 1.27%.
eBenefit of expense reduction rounds to less than 0.01%.
fExcludes the value of portfolio securities delivered as a result of a redemption in-kind.
franklintempleton.com
|
The accompanying notes are an integral part of these financial statements. | Annual Report 73
| | | |
| FRANKLIN VALUE INVESTORS TRUST | | | |
| |
| |
| |
| |
| Statement of Investments, October 31, 2015 | | | |
| |
| Franklin Balance Sheet Investment Fund | | | |
| | Shares | | Value |
| Common Stocks 90.3% | | | |
| Banks 9.9% | | | |
| Citigroup Inc. | 508,000 | $ | 27,010,360 |
| Citizens Financial Group Inc. | 880,000 | | 21,384,000 |
| Comerica Inc. | 433,000 | | 18,792,200 |
| Farmers & Merchants Bank of Long Beach | 1,475 | | 8,923,750 |
| KeyCorp | 2,009,000 | | 24,951,780 |
| Regions Financial Corp. | 555,000 | | 5,189,250 |
| | | | 106,251,340 |
| Capital Goods 5.0% | | | |
| a Aerovironment Inc. | 126,000 | | 2,906,820 |
| a Chart Industries Inc. | 282,000 | | 4,847,580 |
| Cubic Corp. | 125,000 | | 5,606,250 |
| Encore Wire Corp. | 535,000 | | 22,881,950 |
| Granite Construction Inc. | 82,000 | | 2,692,880 |
| Mueller Industries Inc. | 396,000 | | 12,481,920 |
| Regal Beloit Corp. | 42,000 | | 2,679,180 |
| | | | 54,096,580 |
| Commercial & Professional Services 2.7% | | | |
| a Acco Brands Corp. | 435,000 | | 3,510,450 |
| Heidrick & Struggles International Inc. | 255,600 | | 6,788,736 |
| Kelly Services Inc., A | 920,000 | | 14,536,000 |
| Tetra Tech Inc. | 155,000 | | 4,169,500 |
| | | | 29,004,686 |
| Consumer Durables & Apparel 1.1% | | | |
| M.D.C. Holdings Inc. | 457,000 | | 11,877,430 |
| Consumer Services 2.9% | | | |
| Royal Caribbean Cruises Ltd. | 42,000 | | 4,130,700 |
| a Ruby Tuesday Inc. | 3,089,000 | | 16,155,470 |
| Vail Resorts Inc. | 94,500 | | 10,789,065 |
| | | | 31,075,235 |
| Energy 11.2% | | | |
| Apache Corp. | 333,000 | | 15,694,290 |
| Chevron Corp. | 63,000 | | 5,725,440 |
| a Cloud Peak Energy Inc. | 2,956,000 | | 8,779,320 |
| Devon Energy Corp. | 524,600 | | 21,996,478 |
| Ensco PLC, A | 487,000 | | 8,098,810 |
| a McDermott International Inc. | 1,598,000 | | 7,366,780 |
| Occidental Petroleum Corp. | 199,500 | | 14,870,730 |
| a PHI Inc. | 77,500 | | 1,472,500 |
| a PHI Inc., non-voting | 390,000 | | 7,425,600 |
| QEP Resources Inc. | 457,000 | | 7,065,220 |
| Rowan Cos. PLC | 884,000 | | 17,397,120 |
| Superior Energy Services Inc. | 300,000 | | 4,248,000 |
| | | | 120,140,288 |
| Food, Beverage & Tobacco 7.4% | | | |
| Archer-Daniels-Midland Co. | 375,000 | | 17,122,500 |
| Bunge Ltd. | 305,100 | | 22,260,096 |
| Fresh Del Monte Produce Inc. | 517,000 | | 23,590,710 |
|
74 Annual Report
franklintempleton.com
FRANKLIN VALUE INVESTORS TRUST
STATEMENT OF INVESTMENTS
| | | |
| Franklin Balance Sheet Investment Fund (continued) | | | |
| | Shares | | Value |
| Common Stocks (continued) | | | |
| Food, Beverage & Tobacco (continued) | | | |
| GrainCorp Ltd. (Australia) | 1,999,000 | $ | 12,897,943 |
| Sanderson Farms Inc. | 50,000 | | 3,475,500 |
| | | | 79,346,749 |
| Health Care Equipment & Services 1.3% | | | |
| Invacare Corp. | 429,000 | | 7,413,120 |
| National Healthcare Corp. | 105,000 | | 6,854,400 |
| | | | 14,267,520 |
| Life & Health Insurance 11.0% | | | |
| E-L Financial Corp. Ltd. (Canada) | 55,000 | | 28,561,049 |
| MetLife Inc. | 495,300 | | 24,953,214 |
| National Western Life Group Inc., A | 102,500 | | 26,443,975 |
| Prudential Financial Inc. | 297,000 | | 24,502,500 |
| StanCorp Financial Group Inc. | 119,800 | | 13,743,456 |
| | | | 118,204,194 |
| Materials 3.9% | | | |
| Albemarle Corp. | 62,000 | | 3,318,240 |
| Alcoa Inc. | 1,630,830 | | 14,563,312 |
| Allegheny Technologies Inc. | 424,000 | | 6,232,800 |
| Axiall Corp. | 90,000 | | 1,822,500 |
| Domtar Corp. | 220,000 | | 9,072,800 |
| a Intrepid Potash Inc. | 1,308,000 | | 5,048,880 |
| Materion Corp. | 85,000 | | 2,562,750 |
| | | | 42,621,282 |
| Media 1.5% | | | |
| News Corp., B | 857,000 | | 13,266,360 |
| Time Inc. | 137,000 | | 2,545,460 |
| | | | 15,811,820 |
| Multi-line Insurance 2.5% | | | |
| American National Insurance Co. | 91,000 | | 9,398,480 |
| Assurant Inc. | 215,000 | | 17,528,950 |
| | | | 26,927,430 |
| Pharmaceuticals, Biotechnology & Life Sciences 1.7% | | | |
| a Bio-Rad Laboratories Inc., A | 131,428 | | 18,331,577 |
| Property & Casualty Insurance 5.4% | | | |
| The Chubb Corp. | 197,000 | | 25,481,950 |
| Selective Insurance Group Inc. | 309,000 | | 11,275,410 |
| The Travelers Cos. Inc. | 190,600 | | 21,516,834 |
| | | | 58,274,194 |
| Real Estate 0.7% | | | |
| a,b Trinity Place Holdings Inc. | 1,200,000 | | 7,200,000 |
| Retailing 1.6% | | | |
| Abercrombie & Fitch Co., A | 247,000 | | 5,233,930 |
| Haverty Furniture Cos. Inc. | 505,000 | | 11,822,050 |
| | | | 17,055,980 |
franklintempleton.com
Annual Report
|
75
FRANKLIN VALUE INVESTORS TRUST
STATEMENT OF INVESTMENTS
| | | | |
| Franklin Balance Sheet Investment Fund (continued) | | | | |
| | Shares | | Value | |
| |
| Common Stocks (continued) | | | | |
| Semiconductors & Semiconductor Equipment 7.7% | | | | |
| Brooks Automation Inc. | 603,000 | $ | 6,657,120 | |
| a First Solar Inc. | 482,000 | | 27,507,740 | |
| MKS Instruments Inc. | 666,000 | | 23,469,840 | |
| a Photronics Inc. | 2,625,000 | | 25,173,750 | |
| | | | 82,808,450 | |
| Technology Hardware & Equipment 7.1% | | | | |
| Corning Inc. | 2,255,000 | | 41,943,000 | |
| a Fabrinet (Thailand) | 655,000 | | 14,193,850 | |
| Ingram Micro Inc., A | 548,000 | | 16,319,440 | |
| a Rofin-Sinar Technologies Inc. | 133,000 | | 3,851,680 | |
| | | | 76,307,970 | |
| Telecommunication Services 2.5% | | | | |
| a Iridium Communications Inc. | 1,975,883 | | 16,221,999 | |
| a Orbcomm Inc. | 1,750,000 | | 10,395,000 | |
| | | | 26,616,999 | |
| Utilities 3.2% | | | | |
| Eversource Energy | 136,000 | | 6,927,840 | |
| Great Plains Energy Inc. | 253,000 | | 6,957,500 | |
| IDACORP Inc. | 134,000 | | 8,957,900 | |
| PNM Resources Inc. | 249,000 | | 7,001,880 | |
| Westar Energy Inc. | 130,000 | | 5,161,000 | |
| | | | 35,006,120 | |
| Total Common Stocks and Other Equity Interests (Cost $787,084,222) | | | 971,225,844 | |
| Convertible Preferred Stocks (Cost $4,667,094) 0.6% | | | | |
| Telecommunication Services 0.6% | | | | |
| Iridium Communications Inc., 6.75%, cvt., pfd., B | 20,000 | | 6,041,250 | |
| Escrows and Litigation Trusts (Cost $—) 0.1% | | | | |
| Utilities 0.1% | | | | |
| a,c,dKGen Power Liquidating Trust, Contingent Distribution | 2,800,000 | | 1,038,940 | |
| Total Investments before Short Term Investments (Cost $791,751,316) | | | 978,306,034 | |
| Short Term Investments (Cost $102,695,280) 9.6% | | | | |
| Money Market Funds 9.6% | | | | |
| a,e Institutional Fiduciary Trust Money Market Portfolio | 102,695,280 | | 102,695,280 | |
| Total Investments (Cost $894,446,596) 100.6% | | | 1,081,001,314 | |
| Other Assets, less Liabilities (0.6)% | | | (5,958,813 | ) |
| Net Assets 100.0% | | $ | 1,075,042,501 | |
aNon-income producing.
bSee Note 8 regarding holdings of 5% voting securities.
cContingent distributions represent the right to receive additional distributions, if any, during the reorganization of the underlying company.
dSecurity has been deemed illiquid because it may not be able to be sold within seven days.
eSee Note 3(f) regarding investments in affiliated management investment companies.
|
76 Annual Report | The accompanying notes are an integral part of these financial statements.
franklintempleton.com
| | | | | | | | | | | | | | | |
| | | | | | FRANKLIN VALUE INVESTORS TRUST | |
| |
| |
| Financial Highlights | | | | | | | | | | | | | | | |
| Franklin Large Cap Value Fund | | | | | | | | | | | | | | | |
| | | | | | Year Ended October 31, | | | | |
| | | 2015 | | | 2014 | | | 2013 | | | 2012 | | | 2011 | |
| Class A | | | | | | | | | | | | | | | |
| Per share operating performance | | | | | | | | | | | | | | | |
| (for a share outstanding throughout the year) | | | | | | | | | | | | | | | |
| Net asset value, beginning of year | $ | 18.91 | | $ | 16.85 | | $ | 13.05 | | $ | 11.95 | | $ | 11.78 | |
| Income from investment operationsa: | | | | | | | | | | | | | | | |
| Net investment incomeb | | 0.16 | | | 0.11 | | | 0.11 | | | 0.12 | | | 0.10 | |
| Net realized and unrealized gains (losses) | | (0.86 | ) | | 2.05 | | | 3.83 | | | 1.10 | | | 0.15 | |
| Total from investment operations | | (0.70 | ) | | 2.16 | | | 3.94 | | | 1.22 | | | 0.25 | |
| Less distributions from: | | | | | | | | | | | | | | | |
| Net investment income | | (0.11 | ) | | (0.10 | ) | | (0.14 | ) | | (0.12 | ) | | (0.08 | ) |
| Net realized gains | | (0.24 | ) | | — | | | — | | | — | | | — | |
| Total distributions | | (0.35 | ) | | (0.10 | ) | | (0.14 | ) | | (0.12 | ) | | (0.08 | ) |
| Net asset value, end of year | $ | 17.86 | | $ | 18.91 | | $ | 16.85 | | $ | 13.05 | | $ | 11.95 | |
| |
| Total returnc | | (3.75 | )% | | 12.86 | % | | 30.53 | % | | 10.31 | % | | 2.09 | % |
| |
| Ratios to average net assets | | | | | | | | | | | | | | | |
| Expenses | | 1.31 | %d | | 1.31 | %d | | 1.35 | % | | 1.40 | % | | 1.39 | % |
| Net investment income | | 0.87 | % | | 0.61 | % | | 0.75 | % | | 0.95 | % | | 0.79 | % |
| |
| Supplemental data | | | | | | | | | | | | | | | |
| Net assets, end of year (000’s) | $ | 150,557 | | $ | 163,384 | | $ | 138,325 | | $ | 96,584 | | $ | 101,711 | |
| Portfolio turnover rate | | 16.14 | % | | 7.25 | % | | 5.81 | % | | 15.76 | % | | 17.99 | % |
aThe amount shown for a share outstanding throughout the period may not correlate with the Statement of Operations for the period due to the timing of sales and
repurchases of the Fund’s shares in relation to income earned and/or fluctuating fair value of the investments of the Fund.
bBased on average daily shares outstanding.
cTotal return does not reflect sales commissions or contingent deferred sales charges, if applicable.
dBenefit of waiver and payments by affiliates rounds to less than 0.01%.
franklintempleton.com
|
The accompanying notes are an integral part of these financial statements. | Annual Report 77
FRANKLIN VALUE INVESTORS TRUST
FINANCIAL HIGHLIGHTS
| | | | | | | | | | | | | | | |
| Franklin Large Cap Value Fund (continued) | | | | | | | | | | | | | | | |
| | | | | | Year Ended October 31, | | | | |
| | | 2015 | | | 2014 | | | 2013 | | | 2012 | | | 2011 | |
| Class C | | | | | | | | | | | | | | | |
| Per share operating performance | | | | | | | | | | | | | | | |
| (for a share outstanding throughout the year) | | | | | | | | | | | | | | | |
| Net asset value, beginning of year | $ | 18.67 | | $ | 16.66 | | $ | 12.91 | | $ | 11.82 | | $ | 11.65 | |
| Income from investment operationsa: | | | | | | | | | | | | | | | |
| Net investment income (loss)b | | 0.03 | | | (0.01 | ) | | 0.01 | | | 0.03 | | | 0.01 | |
| Net realized and unrealized gains (losses) | | (0.85 | ) | | 2.02 | | | 3.79 | | | 1.08 | | | 0.16 | |
| Total from investment operations | | (0.82 | ) | | 2.01 | | | 3.80 | | | 1.11 | | | 0.17 | |
| Less distributions from: | | | | | | | | | | | | | | | |
| Net investment income | | — | | | — | | | (0.05 | ) | | (0.02 | ) | | — | |
| Net realized gains | | (0.24 | ) | | — | | | — | | | — | | | — | |
| Total distributions | | (0.24 | ) | | — | | | (0.05 | ) | | (0.02 | ) | | — | |
| Net asset value, end of year | $ | 17.61 | | $ | 18.67 | | $ | 16.66 | | $ | 12.91 | | $ | 11.82 | |
| |
| Total returnc | | (4.42 | )% | | 12.06 | % | | 29.59 | % | | 9.46 | % | | 1.46 | % |
| |
| Ratios to average net assets | | | | | | | | | | | | | | | |
| Expenses | | 2.03 | %d | | 2.00 | %d | | 2.06 | % | | 2.11 | % | | 2.09 | % |
| Net investment income (loss) | | 0.15 | % | | (0.08 | )% | | 0.04 | % | | 0.24 | % | | 0.09 | % |
| |
| Supplemental data | | | | | | | | | | | | | | | |
| Net assets, end of year (000’s) | $ | 36,825 | | $ | 39,232 | | $ | 33,287 | | $ | 22,650 | | $ | 22,062 | |
| Portfolio turnover rate | | 16.14 | % | | 7.25 | % | | 5.81 | % | | 15.76 | % | | 17.99 | % |
aThe amount shown for a share outstanding throughout the period may not correlate with the Statement of Operations for the period due to the timing of sales and
repurchases of the Fund’s shares in relation to income earned and/or fluctuating fair value of the investments of the Fund.
bBased on average daily shares outstanding.
cTotal return does not reflect sales commissions or contingent deferred sales charges, if applicable.
dBenefit of waiver and payments by affiliates rounds to less than 0.01%.
|
78 Annual Report | The accompanying notes are an integral part of these financial statements.
franklintempleton.com
FRANKLIN VALUE INVESTORS TRUST
FINANCIAL HIGHLIGHTS
| | | | | | | | | | | | | | | |
| Franklin Large Cap Value Fund (continued) | | | | | | | | | | | | | | | |
| | | | | | Year Ended October 31, | | | | |
| | | 2015 | | | 2014 | | | 2013 | | | 2012 | | | 2011 | |
| Class R | | | | | | | | | | | | | | | |
| Per share operating performance | | | | | | | | | | | | | | | |
| Net asset value, beginning of year | $ | 18.76 | | $ | 16.70 | | $ | 12.94 | | $ | 11.85 | | $ | 11.68 | |
| Income from investment operationsa: | | | | | | | | | | | | | | | |
| Net investment incomeb | | 0.12 | | | 0.08 | | | 0.08 | | | 0.09 | | | 0.07 | |
| Net realized and unrealized gains (losses) | | (0.87 | ) | | 2.03 | | | 3.80 | | | 1.09 | | | 0.16 | |
| Total from investment operations | | (0.75 | ) | | 2.11 | | | 3.88 | | | 1.18 | | | 0.23 | |
| Less distributions from: | | | | | | | | | | | | | | | |
| Net investment income | | (0.06 | ) | | (0.05 | ) | | (0.12 | ) | | (0.09 | ) | | (0.06 | ) |
| Net realized gains | | (0.24 | ) | | — | | | — | | | — | | | — | |
| Total distributions | | (0.30 | ) | | (0.05 | ) | | (0.12 | ) | | (0.09 | ) | | (0.06 | ) |
| Net asset value, end of year | $ | 17.71 | | $ | 18.76 | | $ | 16.70 | | $ | 12.94 | | $ | 11.85 | |
| |
| Total return | | (4.01 | )% | | 12.69 | % | | 30.20 | % | | 10.07 | % | | 1.92 | % |
| |
| Ratios to average net assets | | | | | | | | | | | | | | | |
| Expenses | | 1.53 | %c | | 1.50 | %c | | 1.56 | % | | 1.61 | % | | 1.59 | % |
| Net investment income | | 0.65 | % | | 0.42 | % | | 0.54 | % | | 0.74 | % | | 0.59 | % |
| |
| Supplemental data | | | | | | | | | | | | | | | |
| Net assets, end of year (000’s) | $ | 4,322 | | $ | 4,822 | | $ | 4,531 | | $ | 3,644 | | $ | 3,638 | |
| Portfolio turnover rate | | 16.14 | % | | 7.25 | % | | 5.81 | % | | 15.76 | % | | 17.99 | % |
aThe amount shown for a share outstanding throughout the period may not correlate with the Statement of Operations for the period due to the timing of sales and
repurchases of the Fund’s shares in relation to income earned and/or fluctuating fair value of the investments of the Fund.
bBased on average daily shares outstanding.
cBenefit of waiver and payments by affiliates rounds to less than 0.01%.
franklintempleton.com
|
The accompanying notes are an integral part of these financial statements. | Annual Report 79
FRANKLIN VALUE INVESTORS TRUST
FINANCIAL HIGHLIGHTS
| | | | | | | | | |
| Franklin Large Cap Value Fund (continued) | | | | | | | | | |
| | | Year Ended October 31, | |
| | | 2015 | | | 2014 | | | 2013 | a |
| Class R6 | | | | | | | | | |
| Per share operating performance | | | | | | | | | |
| (for a share outstanding throughout the year) | | | | | | | | | |
| Net asset value, beginning of year | $ | 18.87 | | $ | 16.80 | | $ | 14.55 | |
| Income from investment operationsb: | | | | | | | | | |
| Net investment incomec | | 0.25 | | | 0.18 | | | 0.09 | |
| Net realized and unrealized gains (losses) | | (0.87 | ) | | 2.07 | | | 2.16 | |
| Total from investment operations | | (0.62 | ) | | 2.25 | | | 2.25 | |
| Less distributions from: | | | | | | | | | |
| Net investment income | | (0.19 | ) | | (0.18 | ) | | — | |
| Net realized gains | | (0.24 | ) | | — | | | — | |
| Total distributions | | (0.43 | ) | | (0.18 | ) | | — | |
| Net asset value, end of year | $ | 17.82 | | $ | 18.87 | | $ | 16.80 | |
| |
| Total returnd | | (3.30 | )% | | 13.54 | % | | 15.46 | % |
| |
| Ratios to average net assetse | | | | | �� | | | | |
| Expenses before waiver and payments by affiliates | | 0.84 | % | | 0.83 | % | | 2.22 | % |
| Expenses net of waiver and payments by affiliates | | 0.84 | %f | | 0.83 | %f | | 0.87 | % |
| Net investment income | | 1.34 | % | | 1.09 | % | | 1.23 | % |
| |
| Supplemental data | | | | | | | | | |
| Net assets, end of year (000’s) | $ | 7,722 | | $ | 7,534 | | $ | 6 | |
| Portfolio turnover rate | | 16.14 | % | | 7.25 | % | | 5.81 | % |
aFor the period May 1, 2013 (effective date) to October 31, 2013.
bThe amount shown for a share outstanding throughout the period may not correlate with the Statement of Operations for the period due to the timing of sales and
repurchases of the Fund’s shares in relation to income earned and/or fluctuating fair value of the investments of the Fund.
cBased on average daily shares outstanding.
dTotal return is not annualized for periods less than one year.
eRatios are annualized for periods less than one year.
fBenefit of waiver and payments by affiliates rounds to less than 0.01%.
|
80 Annual Report | The accompanying notes are an integral part of these financial statements.
franklintempleton.com
| | | | | | | | | | | | | | | |
| | | | | | FRANKLIN VALUE INVESTORS TRUST | |
| | | | | | | | | FINANCIAL HIGHLIGHTS | |
| |
| |
| |
| Franklin Large Cap Value Fund (continued) | | | | | | | | | | | | | | | |
| | | | | | Year Ended October 31, | | | | |
| | | 2015 | | | 2014 | | | 2013 | | | 2012 | | | 2011 | |
| Advisor Class | | | | | | | | | | | | | | | |
| Per share operating performance | | | | | | | | | | | | | | | |
| (for a share outstanding throughout the year) | | | | | | | | | | | | | | | |
| Net asset value, beginning of year | $ | 18.86 | | $ | 16.80 | | $ | 13.01 | | $ | 11.93 | | $ | 11.75 | |
| Income from investment operationsa: | | | | | | | | | | | | | | | |
| Net investment incomeb | | 0.21 | | | 0.17 | | | 0.15 | | | 0.15 | | | 0.13 | |
| Net realized and unrealized gains (losses) | | (0.86 | ) | | 2.03 | | | 3.82 | | | 1.08 | | | 0.16 | |
| Total from investment operations | | (0.65 | ) | | 2.20 | | | 3.97 | | | 1.23 | | | 0.29 | |
| Less distributions from: | | | | | | | | | | | | | | | |
| Net investment income | | (0.16 | ) | | (0.14 | ) | | (0.18 | ) | | (0.15 | ) | | (0.11 | ) |
| Net realized gains | | (0.24 | ) | | — | | | — | | | — | | | — | |
| Total distributions | | (0.40 | ) | | (0.14 | ) | | (0.18 | ) | | (0.15 | ) | | (0.11 | ) |
| Net asset value, end of year | $ | 17.81 | | $ | 18.86 | | $ | 16.80 | | $ | 13.01 | | $ | 11.93 | |
| |
| Total return | | (3.46 | )% | | 13.19 | % | | 30.95 | % | | 10.53 | % | | 2.47 | % |
| |
| Ratios to average net assets | | | | | | | | | | | | | | | |
| Expenses | | 1.03 | %c | | 1.00 | %c | | 1.06 | % | | 1.11 | % | | 1.09 | % |
| Net investment income | | 1.15 | % | | 0.92 | % | | 1.04 | % | | 1.24 | % | | 1.09 | % |
| |
| Supplemental data | | | | | | | | | | | | | | | |
| Net assets, end of year (000’s) | $ | 6,828 | | $ | 6,858 | | $ | 10,454 | | $ | 7,169 | | $ | 6,028 | |
| Portfolio turnover rate | | 16.14 | % | | 7.25 | % | | 5.81 | % | | 15.76 | % | | 17.99 | % |
aThe amount shown for a share outstanding throughout the period may not correlate with the Statement of Operations for the period due to the timing of sales and
repurchases of the Fund’s shares in relation to income earned and/or fluctuating fair value of the investments of the Fund.
bBased on average daily shares outstanding.
cBenefit of waiver and payments by affiliates rounds to less than 0.01%.
franklintempleton.com
|
The accompanying notes are an integral part of these financial statements. | Annual Report 81
| | | |
| FRANKLIN VALUE INVESTORS TRUST | | | |
| |
| |
| |
| |
| Statement of Investments, October 31, 2015 | | | |
| |
| Franklin Large Cap Value Fund | | | |
| | Shares | | Value |
| Common Stocks 96.6% | | | |
| Automobiles & Components 2.8% | | | |
| BorgWarner Inc. | 51,000 | $ | 2,183,820 |
| Johnson Controls Inc. | 78,500 | | 3,546,630 |
| | | | 5,730,450 |
| Banks 9.6% | | | |
| Bank of America Corp. | 136,000 | | 2,282,080 |
| BB&T Corp. | 69,000 | | 2,563,350 |
| Citigroup Inc. | 68,000 | | 3,615,560 |
| Comerica Inc. | 70,000 | | 3,038,000 |
| KeyCorp | 246,000 | | 3,055,320 |
| Regions Financial Corp. | 250,000 | | 2,337,500 |
| U.S. Bancorp | 71,000 | | 2,994,780 |
| | | | 19,886,590 |
| Capital Goods 12.4% | | | |
| Dover Corp. | 34,500 | | 2,222,835 |
| Eaton Corp. PLC | 55,000 | | 3,075,050 |
| General Dynamics Corp. | 26,000 | | 3,863,080 |
| General Electric Co. | 83,500 | | 2,414,820 |
| Illinois Tool Works Inc. | 28,000 | | 2,574,320 |
| Parker Hannifin Corp. | 27,000 | | 2,826,900 |
| Pentair PLC (United Kingdom) | 46,000 | | 2,572,320 |
| Rockwell Automation Inc. | 15,000 | | 1,637,400 |
| Stanley Black & Decker Inc. | 22,000 | | 2,331,560 |
| United Technologies Corp. | 20,500 | | 2,017,405 |
| | | | 25,535,690 |
| Consumer Durables & Apparel 3.0% | | | |
| NIKE Inc., B | 32,400 | | 4,245,372 |
| Ralph Lauren Corp. | 18,500 | | 2,049,245 |
| | | | 6,294,617 |
| Diversified Financials 5.6% | | | |
| aBerkshire Hathaway Inc., A | 8 | | 1,636,768 |
| Capital One Financial Corp. | 20,456 | | 1,613,978 |
| Discover Financial Services | 47,000 | | 2,642,340 |
| KKR & Co., LP | 35,000 | | 600,250 |
| Northern Trust Corp. | 27,000 | | 1,900,530 |
| State Street Corp. | 45,000 | | 3,105,000 |
| | | | 11,498,866 |
| Energy 10.0% | | | |
| Apache Corp. | 19,400 | | 914,322 |
| Baker Hughes Inc. | 37,200 | | 1,959,696 |
| California Resources Corp. | 9,000 | | 36,360 |
| Chevron Corp. | 20,000 | | 1,817,600 |
| ConocoPhillips | 21,500 | | 1,147,025 |
| Denbury Resources Inc. | 168,000 | | 594,720 |
| Devon Energy Corp. | 27,000 | | 1,132,110 |
| Ensco PLC, A | 56,000 | | 931,280 |
| Exxon Mobil Corp. | 29,000 | | 2,399,460 |
| HollyFrontier Corp. | 57,000 | | 2,791,290 |
| Occidental Petroleum Corp. | 17,500 | | 1,304,450 |
| |
| |
| 82 | Annual Report | franklintempleton.com |
FRANKLIN VALUE INVESTORS TRUST
STATEMENT OF INVESTMENTS
| | | |
| Franklin Large Cap Value Fund (continued) | | | |
| | Shares | | Value |
| Common Stocks (continued) | | | |
| Energy (continued) | | | |
| Phillips 66 | 19,250 | $ | 1,714,212 |
| Schlumberger Ltd. | 23,000 | | 1,797,680 |
| Valero Energy Corp. | 32,000 | | 2,109,440 |
| | | | 20,649,645 |
| Food & Staples Retailing 1.8% | | | |
| CVS Health Corp. | 37,000 | | 3,654,860 |
| Food, Beverage & Tobacco 2.8% | | | |
| Archer-Daniels-Midland Co. | 65,000 | | 2,967,900 |
| Bunge Ltd. | 37,500 | | 2,736,000 |
| | | | 5,703,900 |
| Health Care Equipment & Services 3.9% | | | |
| Abbott Laboratories | 43,300 | | 1,939,840 |
| Becton, Dickinson and Co. | 24,000 | | 3,420,480 |
| Medtronic PLC | 35,400 | | 2,616,768 |
| | | | 7,977,088 |
| Household & Personal Products 0.7% | | | |
| The Procter & Gamble Co. | 20,000 | | 1,527,600 |
| Insurance 9.0% | | | |
| Aflac Inc. | 57,000 | | 3,633,750 |
| The Allstate Corp. | 57,000 | | 3,527,160 |
| MetLife Inc. | 63,000 | | 3,173,940 |
| Principal Financial Group Inc. | 58,000 | | 2,909,280 |
| Prudential Financial Inc. | 41,000 | | 3,382,500 |
| The Travelers Cos. Inc. | 17,000 | | 1,919,130 |
| | | | 18,545,760 |
| Materials 7.0% | | | |
| Air Products and Chemicals Inc. | 10,400 | | 1,445,392 |
| Albemarle Corp. | 42,000 | | 2,247,840 |
| Alcoa Inc. | 305,000 | | 2,723,650 |
| FMC Corp. | 39,000 | | 1,587,690 |
| The Mosaic Co. | 52,000 | | 1,757,080 |
| Nucor Corp. | 78,000 | | 3,299,400 |
| Praxair Inc. | 12,000 | | 1,333,080 |
| | | | 14,394,132 |
| Pharmaceuticals, Biotechnology & Life Sciences 6.5% | | | |
| Merck & Co. Inc. | 64,000 | | 3,498,240 |
| Pfizer Inc. | 95,000 | | 3,212,900 |
| Roche Holding AG, ADR (Switzerland) | 70,000 | | 2,373,700 |
| Sanofi, ADR (France) | 65,000 | | 3,272,100 |
| Teva Pharmaceutical Industries Ltd., ADR (Israel) | 18,000 | | 1,065,420 |
| | | | 13,422,360 |
| Retailing 4.5% | | | |
| The Home Depot Inc. | 25,500 | | 3,152,820 |
| Nordstrom Inc. | 39,000 | | 2,543,190 |
| Target Corp. | 48,000 | | 3,704,640 |
| | | | 9,400,650 |
| |
| |
| franklintempleton.com | Annual Report | 83 |
FRANKLIN VALUE INVESTORS TRUST
STATEMENT OF INVESTMENTS
| | | | |
| Franklin Large Cap Value Fund (continued) | | | | |
| | Shares | | Value | |
| Common Stocks (continued) | | | | |
| Semiconductors & Semiconductor Equipment 3.2% | | | | |
| aFirst Solar Inc. | 48,000 | $ | 2,739,360 | |
| Maxim Integrated Products Inc. | 43,600 | | 1,786,728 | |
| Microchip Technology Inc. | 45,000 | | 2,173,050 | |
| | | | 6,699,138 | |
| Software & Services 4.0% | | | | |
| International Business Machines Corp. | 10,000 | | 1,400,800 | |
| Microsoft Corp. | 54,500 | | 2,868,880 | |
| aTeradata Corp. | 40,000 | | 1,124,400 | |
| Xerox Corp. | 295,000 | | 2,770,050 | |
| | | | 8,164,130 | |
| Technology Hardware & Equipment 7.9% | | | | |
| Cisco Systems Inc. | 110,000 | | 3,173,500 | |
| Corning Inc. | 195,000 | | 3,627,000 | |
| EMC Corp. | 65,200 | | 1,709,544 | |
| QUALCOMM Inc. | 22,500 | | 1,336,950 | |
| SanDisk Corp. | 34,000 | | 2,618,000 | |
| TE Connectivity Ltd. | 23,600 | | 1,520,784 | |
| Western Digital Corp. | 35,000 | | 2,338,700 | |
| | | | 16,324,478 | |
| Transportation 1.4% | | | | |
| American Airlines Group Inc. | 44,000 | | 2,033,680 | |
| Norfolk Southern Corp. | 11,000 | | 880,330 | |
| | | | 2,914,010 | |
| Utilities 0.5% | | | | |
| Exelon Corp. | 34,000 | | 949,280 | |
| Total Common Stocks (Cost $155,088,100) | | | 199,273,244 | |
| Short Term Investments (Cost $7,732,885) 3.8% | | | | |
| Money Market Funds 3.8% | | | | |
| a,bInstitutional Fiduciary Trust Money Market Portfolio | 7,732,885 | | 7,732,885 | |
| Total Investments (Cost $162,820,985) 100.4% | | | 207,006,129 | |
| Other Assets, less Liabilities (0.4)% | | | (751,844 | ) |
| Net Assets 100.0% | | $ | 206,254,285 | |
See Abbreviations on page 134.
aNon-income producing.
bSee Note 3(f) regarding investments in affiliated management investment companies.
|
84 Annual Report | The accompanying notes are an integral part of these financial statements.
franklintempleton.com
| | | | | | | | | | | | | | | |
| | | | | | FRANKLIN VALUE INVESTORS TRUST | |
| |
| |
| Financial Highlights | | | | | | | | | | | | | | | |
| Franklin MicroCap Value Fund | | | | | | | | | | | | | | | |
| | | | | | Year Ended October 31, | | | | |
| | | 2015 | | | 2014 | | | 2013 | | | 2012 | | | 2011 | |
| Class A | | | | | | | | | | | | | | | |
| Per share operating performance | | | | | | | | | | | | | | | |
| (for a share outstanding throughout the year) | | | | | | | | | | | | | | | |
| Net asset value, beginning of year | $ | 39.88 | | $ | 40.99 | | $ | 32.60 | | $ | 32.38 | | $ | 29.34 | |
| Income from investment operationsa: | | | | | | | | | | | | | | | |
| Net investment income (loss)b | | —c | | | (0.07 | )d | | 0.10 | e | | 0.30 | f | | 0.04 | |
| Net realized and unrealized gains (losses) | | (3.33 | ) | | 1.44 | | | 10.25 | | | 3.77 | | | 4.07 | |
| Total from investment operations | | (3.33 | ) | | 1.37 | | | 10.35 | | | 4.07 | | | 4.11 | |
| Less distributions from: | | | | | | | | | | | | | | | |
| Net investment income | | — | | | (0.04 | ) | | (0.52 | ) | | (0.02 | ) | | (0.09 | ) |
| Net realized gains | | (3.65 | ) | | (2.44 | ) | | (1.44 | ) | | (3.83 | ) | | (0.98 | ) |
| Total distributions | | (3.65 | ) | | (2.48 | ) | | (1.96 | ) | | (3.85 | ) | | (1.07 | ) |
| Net asset value, end of year | $ | 32.90 | | $ | 39.88 | | $ | 40.99 | | $ | 32.60 | | $ | 32.38 | |
| |
| Total returng | | (8.58 | )% | | 3.39 | % | | 33.64 | % | | 14.70 | % | | 14.16 | % |
| |
| Ratios to average net assets | | | | | | | | | | | | | | | |
| Expenses before waiver and payments by affiliates | | 1.20 | % | | 1.16 | % | | 1.15 | % | | 1.16 | % | | 1.16 | % |
| Expenses net of waiver and payments by affiliates | | 1.19 | % | | 1.14 | %h | | 1.15 | % | | 1.16 | % | | 1.16 | % |
| Net investment income (loss) | | 0.02 | % | | (0.17 | )%d | | 0.36 | %e | | 1.01 | %f | | 0.12 | % |
| |
| Supplemental data | | | | | | | | | | | | | | | |
| Net assets, end of year (000’s) | $ | 258,143 | | $ | 346,820 | | $ | 370,763 | | $ | 202,636 | | $ | 214,646 | |
| Portfolio turnover rate | | 8.64 | % | | 11.63 | % | | 11.31 | % | | 5.03 | % | | 9.46 | % |
aThe amount shown for a share outstanding throughout the period may not correlate with the Statement of Operations for the period due to the timing of sales and
repurchases of the Fund’s shares in relation to income earned and/or fluctuating fair value of the investments of the Fund.
bBased on average daily shares outstanding.
cAmount rounds to less than $0.01 per share.
dNet investment income per share includes approximately $0.06 per share received in the form of special dividends. Excluding these amounts, the ratio of net investment
income to average net assets would have been (0.31)%.
eNet investment income per share includes approximately $0.17 per share received in the form of special dividends. Excluding these amounts, the ratio of net investment
income to average net assets would have been (0.10)%.
fNet investment income per share includes approximately $0.23 per share received in the form of special dividends. Excluding these amounts, the ratio of net investment
income to average net assets would have been 0.25%.
gTotal return does not reflect sales commissions or contingent deferred sales charges, if applicable.
hBenefit of expense reduction rounds to less than 0.01%.
franklintempleton.com
|
The accompanying notes are an integral part of these financial statements. | Annual Report 85
FRANKLIN VALUE INVESTORS TRUST
FINANCIAL HIGHLIGHTS
| | | | | | | | | |
| Franklin MicroCap Value Fund (continued) | | | | | | | | | |
| | | Year Ended October 31, | |
| | | 2015 | | | 2014 | | | 2013 | a |
| Class R6 | | | | | | | | | |
| Per share operating performance | | | | | | | | | |
| (for a share outstanding throughout the year) | | | | | | | | | |
| Net asset value, beginning of year | $ | 39.94 | | $ | 41.03 | | $ | 34.43 | |
| Income from investment operationsb: | | | | | | | | | |
| Net investment incomec | | 0.14 | | | 0.03 | d | | 0.04 | |
| Net realized and unrealized gains (losses) | | (3.34 | ) | | 1.50 | | | 6.56 | |
| Total from investment operations | | (3.20 | ) | | 1.53 | | | 6.60 | |
| Less distributions from: | | | | | | | | | |
| Net investment income | | — | | | (0.18 | ) | | — | |
| Net realized gains | | (3.65 | ) | | (2.44 | ) | | — | |
| Total distributions | | (3.65 | ) | | (2.62 | ) | | — | |
| Net asset value, end of year | $ | 33.09 | | $ | 39.94 | | $ | 41.03 | |
| |
| Total returne | | (8.21 | )% | | 3.79 | % | | 19.17 | % |
| |
| Ratios to average net assetsf | | | | | | | | | |
| Expenses before waiver and payments by affiliates | | 0.81 | % | | 0.79 | % | | 0.79 | % |
| Expenses net of waiver and payments by affiliates | | 0.80 | % | | 0.77 | %g | | 0.79 | % |
| Net investment income | | 0.41 | % | | 0.20 | %d | | 0.19 | % |
| |
| Supplemental data | | | | | | | | | |
| Net assets, end of year (000’s) | $ | 18,031 | | $ | 25,020 | | $ | 59,597 | |
| Portfolio turnover rate | | 8.64 | % | | 11.63 | % | | 11.31 | % |
aFor the period May 1, 2013 (effective date) to October 31, 2013.
bThe amount shown for a share outstanding throughout the period may not correlate with the Statement of Operations for the period due to the timing of sales and
repurchases of the Fund’s shares in relation to income earned and/or fluctuating fair value of the investments of the Fund.
cBased on average daily shares outstanding.
dNet investment income per share includes approximately $0.06 per share received in the form of special dividends. Excluding these amounts, the ratio of net investment
income to average net assets would have been 0.06%.
eTotal return is not annualized for periods less than one year.
fRatios are annualized for periods less than one year.
gBenefit of expense reduction rounds to less than 0.01%.
|
86 Annual Report | The accompanying notes are an integral part of these financial statements.
franklintempleton.com
| | | | | | | | | | | | | | | |
| | | | | | FRANKLIN VALUE INVESTORS TRUST | |
| | | | | | | | | FINANCIAL HIGHLIGHTS | |
| |
| |
| |
| Franklin MicroCap Value Fund (continued) | | | | | | | | | | | | | | | |
| | | | | | Year Ended October 31, | | | | |
| | | 2015 | | | 2014 | | | 2013 | | | 2012 | | | 2011 | |
| Advisor Class | | | | | | | | | | | | | | | |
| Per share operating performance | | | | | | | | | | | | | | | |
| (for a share outstanding throughout the year) | | | | | | | | | | | | | | | |
| Net asset value, beginning of year | $ | 39.90 | | $ | 40.99 | | $ | 32.61 | | $ | 32.41 | | $ | 29.37 | |
| Income from investment operationsa: | | | | | | | | | | | | | | | |
| Net investment incomeb | | 0.09 | | | 0.04 | c | | 0.31 | d | | 0.39 | e | | 0.12 | |
| Net realized and unrealized gains (losses) | | (3.34 | ) | | 1.43 | | | 10.11 | | | 3.74 | | | 4.07 | |
| Total from investment operations | | (3.25 | ) | | 1.47 | | | 10.42 | | | 4.13 | | | 4.19 | |
| Less distributions from: | | | | | | | | | | | | | | | |
| Net investment income | | — | | | (0.12 | ) | | (0.60 | ) | | (0.10 | ) | | (0.17 | ) |
| Net realized gains | | (3.65 | ) | | (2.44 | ) | | (1.44 | ) | | (3.83 | ) | | (0.98 | ) |
| Total distributions | | (3.65 | ) | | (2.56 | ) | | (2.04 | ) | | (3.93 | ) | | (1.15 | ) |
| Net asset value, end of year | $ | 33.00 | | $ | 39.90 | | $ | 40.99 | | $ | 32.61 | | $ | 32.41 | |
| |
| Total return | | (8.36 | )% | | 3.64 | % | | 33.93 | % | | 14.97 | % | | 14.44 | % |
| |
| Ratios to average net assets | | | | | | | | | | | | | | | |
| Expenses before waiver and payments by affiliates | | 0.96 | % | | 0.92 | % | | 0.91 | % | | 0.92 | % | | 0.91 | % |
| Expenses net of waiver and payments by affiliates | | 0.95 | % | | 0.90 | %f | | 0.91 | % | | 0.92 | % | | 0.91 | % |
| Net investment income | | 0.26 | % | | 0.07 | %c | | 0.60 | %d | | 1.25 | %e | | 0.37 | % |
| |
| Supplemental data | | | | | | | | | | | | | | | |
| Net assets, end of year (000’s) | $ | 67,538 | | $ | 89,880 | | $ | 116,292 | | $ | 165,296 | | $ | 133,697 | |
| Portfolio turnover rate | | 8.64 | % | | 11.63 | % | | 11.31 | % | | 5.03 | % | | 9.46 | % |
aThe amount shown for a share outstanding throughout the period may not correlate with the Statement of Operations for the period due to the timing of sales and
repurchases of the Fund’s shares in relation to income earned and/or fluctuating fair value of the investments of the Fund.
bBased on average daily shares outstanding.
cNet investment income per share includes approximately $0.06 per share received in the form of special dividends. Excluding these amounts, the ratio of net investment
income to average net assets would have been (0.07)%.
dNet investment income per share includes approximately $0.17 per share received in the form of special dividends. Excluding these amounts, the ratio of net investment
income to average net assets would have been 0.14%.
eNet investment income per share includes approximately $0.23 per share received in the form of special dividends. Excluding these amounts, the ratio of net investment
income to average net assets would have been 0.49%.
fBenefit of expense reduction rounds to less than 0.01%.
franklintempleton.com
|
The accompanying notes are an integral part of these financial statements. | Annual Report 87
| | | |
| FRANKLIN VALUE INVESTORS TRUST | | | |
| |
| |
| |
| |
| Statement of Investments, October 31, 2015 | | | |
| |
| Franklin MicroCap Value Fund | | | |
| | Shares | | Value |
| Common Stocks 95.4% | | | |
| Aerospace & Defense 3.4% | | | |
| aDucommun Inc. | 269,042 | $ | 5,822,069 |
| aSparton Corp. | 255,211 | | 6,005,115 |
| | | | 11,827,184 |
| Automobiles & Components 1.8% | | | |
| Spartan Motors Inc. | 1,500,000 | | 6,195,000 |
| Banks 11.8% | | | |
| Bar Harbor Bankshares | 224,000 | | 7,918,400 |
| Citizens Community Bancorp Inc. | 128,700 | | 1,142,856 |
| County Bancorp Inc. | 50,000 | | 916,500 |
| First Defiance Financial Corp. | 193,000 | | 7,391,900 |
| Investar Holding Corp. | 200,000 | | 3,158,000 |
| MidSouth Bancorp Inc. | 143,700 | | 1,458,555 |
| bNortheast Bancorp | 459,500 | | 4,939,625 |
| Old Line Bancshares Inc. | 94,145 | | 1,614,587 |
| Peoples Financial Services Corp. | 87,543 | | 3,564,751 |
| Southern Missouri Bancorp Inc. | 140,000 | | 3,089,800 |
| WSFS Financial Corp. | 170,000 | | 5,400,900 |
| | | | 40,595,874 |
| Building Products 6.0% | | | |
| Burnham Holdings Inc., A | 219,000 | | 3,723,000 |
| a,bContinental Materials Corp. | 129,700 | | 1,710,743 |
| aGibraltar Industries Inc. | 495,000 | | 12,533,400 |
| Insteel Industries Inc. | 119,723 | | 2,560,875 |
| | | | 20,528,018 |
| Commercial & Professional Services 4.0% | | | |
| Ecology and Environment Inc., A | 144,000 | | 1,527,840 |
| Healthcare Services Group Inc. | 307,000 | | 11,438,820 |
| Kelly Services Inc., A | 60,100 | | 949,580 |
| | | | 13,916,240 |
| Construction & Engineering 2.1% | | | |
| aNorthwest Pipe Co. | 170,600 | | 2,253,626 |
| aOrion Marine Group Inc. | 310,000 | | 1,212,100 |
| aSterling Construction Co. | 963,400 | | 3,728,358 |
| | | | 7,194,084 |
| Consumer Durables & Apparel 4.7% | | | |
| a,bDelta Apparel Inc. | 640,000 | | 10,515,200 |
| aThe Dixie Group Inc. | 50,000 | | 328,500 |
| Flexsteel Industries Inc. | 112,000 | | 4,870,880 |
| aLeapFrog Enterprises Inc. | 500,000 | | 400,000 |
| | | | 16,114,580 |
| Consumer Services 2.9% | | | |
| a,bFull House Resorts Inc. | 1,600,000 | | 2,256,000 |
| aGolden Entertainment Inc. | 129,800 | | 1,213,630 |
| aRuby Tuesday Inc. | 1,260,000 | | 6,589,800 |
| | | | 10,059,430 |
| Diversified Financials 1.0% | | | |
| KCAP Financial Inc. | 702,578 | | 3,451,648 |
| |
| 88 | Annual Report | franklintempleton.com |
FRANKLIN VALUE INVESTORS TRUST
STATEMENT OF INVESTMENTS
| | | |
| Franklin MicroCap Value Fund (continued) | | | |
| | Shares | | Value |
| Common Stocks (continued) | | | |
| Electrical Equipment 0.9% | | | |
| Global Power Equipment Group Inc. | 675,000 | $ | 2,922,750 |
| Energy 8.6% | | | |
| Ardmore Shipping Corp. (Ireland) | 365,000 | | 5,237,750 |
| aCloud Peak Energy Inc. | 480,000 | | 1,425,600 |
| Gulf Island Fabrication Inc. | 127,200 | | 1,285,992 |
| aNatural Gas Services Group Inc. | 200,000 | | 4,504,000 |
| aParker Drilling Co. | 1,035,000 | | 2,960,100 |
| aPHI Inc. | 17,600 | | 334,400 |
| aPHI Inc., non-voting | 391,000 | | 7,444,640 |
| aRenewable Energy Group Inc. | 247,000 | | 1,948,830 |
| Tesco Corp. | 555,200 | | 4,441,600 |
| | | | 29,582,912 |
| Food & Staples Retailing 1.7% | | | |
| Village Super Market Inc., A | 227,000 | | 5,688,620 |
| Food, Beverage & Tobacco 10.5% | | | |
| John B. Sanfilippo & Son Inc. | 109,000 | | 7,054,480 |
| aOmega Protein Corp. | 720,000 | | 13,104,000 |
| aSeneca Foods Corp., A | 403,892 | | 11,785,569 |
| aSeneca Foods Corp., B | 121,500 | | 3,971,227 |
| | | | 35,915,276 |
| Industrial Conglomerates 0.0%† | | | |
| a,cSmith Investment Co. LLC | 44,600 | | 31,332 |
| Insurance 4.3% | | | |
| a,bACMAT Corp., A | 235,600 | | 4,005,200 |
| Baldwin & Lyons Inc., B | 305,001 | | 7,085,173 |
| aGlobal Indemnity PLC, A | 74,000 | | 2,102,340 |
| aHallmark Financial Services Inc. | 120,000 | | 1,558,800 |
| | | | 14,751,513 |
| Machinery 11.4% | | | |
| Alamo Group Inc. | 155,897 | | 7,314,687 |
| bHardinge Inc. | 934,900 | | 8,844,154 |
| bHurco Cos. Inc. | 365,000 | | 9,807,550 |
| aLydall Inc. | 152,000 | | 5,202,960 |
| Miller Industries Inc. | 355,000 | | 8,051,400 |
| | | | 39,220,751 |
| Materials 5.0% | | | |
| Central Steel and Wire Co. | 6,905 | | 4,262,974 |
| Friedman Industries Inc. | 78,791 | | 471,958 |
| Mercer International Inc. (Canada) | 200,000 | | 2,160,000 |
| The Monarch Cement Co. | 140,744 | | 4,398,250 |
| Olympic Steel Inc. | 350,000 | | 3,349,500 |
| aUniversal Stainless & Alloy Products Inc. | 301,000 | | 2,618,700 |
| | | | 17,261,382 |
| Real Estate 1.7% | | | |
| a,cAllen Organ Co. (LandCo. Holdings) | 94,800 | | 444,612 |
| Arbor Realty Trust Inc. | 257,700 | | 1,610,625 |
| aBresler & Reiner Inc. | 205,000 | | 112,750 |
| |
| |
| franklintempleton.com | Annual Report | 89 |
FRANKLIN VALUE INVESTORS TRUST
STATEMENT OF INVESTMENTS
| | | | |
| Franklin MicroCap Value Fund (continued) | | | | |
| | Shares | | Value | |
| Common Stocks (continued) | | | | |
| Real Estate (continued) | | | | |
| Griffin Industrial Realty Inc. | 127,000 | $ | 3,248,660 | |
| a,bOrigen Financial Inc. | 1,900,000 | | 261,535 | |
| | | | 5,678,182 | |
| Retailing 5.9% | | | | |
| Caleres Inc. | 226,000 | | 6,906,560 | |
| Fred’s Inc. | 260,000 | | 3,595,800 | |
| Haverty Furniture Cos. Inc. | 200,000 | | 4,682,000 | |
| Shoe Carnival Inc. | 233,000 | | 5,235,510 | |
| | | | 20,419,870 | |
| Semiconductors & Semiconductor Equipment 1.3% | | | | |
| aPhotronics Inc. | 464,797 | | 4,457,403 | |
| Technology Hardware & Equipment 1.3% | | | | |
| aKey Tronic Corp. | 400,000 | | 3,332,000 | |
| aKimball Electronics Inc. | 100,725 | | 1,147,258 | |
| | | | 4,479,258 | |
| Telecommunication Services 4.0% | | | | |
| aAlaska Communications Systems Group Inc. | 1,100,000 | | 2,519,000 | |
| Atlantic Tele-Network Inc. | 66,000 | | 5,043,720 | |
| aHawaiian Telcom Holdco Inc. | 225,000 | | 5,134,500 | |
| North State Telecommunications Corp., B | 21,757 | | 1,048,035 | |
| | | | 13,745,255 | |
| Transportation 1.1% | | | | |
| International Shipholding Corp. | 345,000 | | 700,350 | |
| Providence and Worcester Railroad Co. | 190,000 | | 3,043,800 | |
| | | | 3,744,150 | |
| Total Common Stocks (Cost $229,691,600) | | | 327,780,712 | |
| Short Term Investments (Cost $16,116,739) 4.7% | | | | |
| Money Market Funds 4.7% | | | | |
| a,dInstitutional Fiduciary Trust Money Market Portfolio | 16,116,739 | | 16,116,739 | |
| Total Investments (Cost $245,808,339) 100.1% | | | 343,897,451 | |
| Other Assets, less Liabilities (0.1)% | | | (185,706 | ) |
| Net Assets 100.0% | | $ | 343,711,745 | |
†Rounds to less than 0.1% of net assets.
aNon-income producing.
bSee Note 8 regarding holdings of 5% voting securities.
cSee Note 7 regarding restricted securities.
dSee Note 3(f) regarding investments in affiliated management investment companies.
|
90 Annual Report | The accompanying notes are an integral part of these financial statements.
franklintempleton.com
| | | | | | | | | | | | | | | |
| | | | | | FRANKLIN VALUE INVESTORS TRUST | |
| |
| |
| Financial Highlights | | | | | | | | | | | | | | | |
| Franklin MidCap Value Fund | | | | | | | | | | | | | | | |
| | | | | | Year Ended October 31, | | | | |
| | | 2015 | | | 2014 | | | 2013 | | | 2012 | | | 2011 | |
| Class A | | | | | | | | | | | | | | | |
| Per share operating performance | | | | | | | | | | | | | | | |
| (for a share outstanding throughout the year) | | | | | | | | | | | | | | | |
| Net asset value, beginning of year | $ | 16.13 | | $ | 14.76 | | $ | 11.38 | | $ | 10.39 | | $ | 10.31 | |
| Income from investment operationsa: | | | | | | | | | | | | | | | |
| Net investment incomeb | | 0.11 | | | 0.08 | c | | 0.11 | d | | 0.08 | | | 0.05 | |
| Net realized and unrealized gains (losses) | | (0.60 | ) | | 1.37 | | | 3.43 | | | 0.96 | | | 0.08 | |
| Total from investment operations | | (0.49 | ) | | 1.45 | | | 3.54 | | | 1.04 | | | 0.13 | |
| Less distributions from: | | | | | | | | | | | | | | | |
| Net investment income | | (0.11 | ) | | (0.08 | ) | | (0.16 | ) | | (0.05 | ) | | (0.05 | ) |
| Net realized gains | | (0.31 | ) | | — | | | — | | | — | | | — | |
| Total distributions | | (0.42 | ) | | (0.08 | ) | | (0.16 | ) | | (0.05 | ) | | (0.05 | ) |
| Net asset value, end of year | $ | 15.22 | | $ | 16.13 | | $ | 14.76 | | $ | 11.38 | | $ | 10.39 | |
| |
| Total returne | | (3.07 | )% | | 9.91 | % | | 31.47 | % | | 10.04 | % | | 1.26 | % |
| |
| Ratios to average net assets | | | | | | | | | | | | | | | |
| Expenses before waiver and payments by affiliates | | 1.60 | % | | 1.56 | % | | 1.64 | % | | 1.70 | % | | 1.70 | % |
| Expenses net of waiver and payments by affiliates | | 1.34 | % | | 1.35 | %f | | 1.35 | % | | 1.35 | % | | 1.35 | % |
| Net investment income | | 0.72 | % | | 0.50 | %c | | 0.83 | %d | | 0.78 | % | | 0.50 | % |
| |
| Supplemental data | | | | | | | | | | | | | | | |
| Net assets, end of year (000’s) | $ | 127,043 | | $ | 128,483 | | $ | 102,866 | | $ | 64,265 | | $ | 62,226 | |
| Portfolio turnover rate | | 61.80 | % | | 24.44 | % | | 10.00 | % | | 22.29 | % | | 18.61 | % |
aThe amount shown for a share outstanding throughout the period may not correlate with the Statement of Operations for the period due to the timing of sales and
repurchases of the Fund’s shares in relation to income earned and/or fluctuating fair value of the investments of the Fund.
bBased on average daily shares outstanding.
cNet investment income per share includes approximately $0.02 per share received in the form of special dividends. Excluding these amounts, the ratio of net investment
income to average net assets would have been 0.38%.
dNet investment income per share includes approximately $0.03 per share received in the form of special dividends. Excluding these amounts, the ratio of net investment
income to average net assets would have been 0.61%.
eTotal return does not reflect sales commissions or contingent deferred sales charges, if applicable.
fBenefit of expense reduction rounds to less than 0.01%.
franklintempleton.com
|
The accompanying notes are an integral part of these financial statements. | Annual Report 91
| | | | | | | | | | | | | | | |
| FRANKLIN VALUE INVESTORS TRUST | | | | | | | | | | | | | | | |
| FINANCIAL HIGHLIGHTS | | | | | | | | | | | | | | | |
| |
| |
| |
| Franklin MidCap Value Fund (continued) | | | | | | | | | | | | | | | |
| | | | | | Year Ended October 31, | | | | |
| | | 2015 | | | 2014 | | | 2013 | | | 2012 | | | 2011 | |
| Class C | | | | | | | | | | | | | | | |
| Per share operating performance | | | | | | | | | | | | | | | |
| (for a share outstanding throughout the year) | | | | | | | | | | | | | | | |
| Net asset value, beginning of year | $ | 15.87 | | $ | 14.55 | | $ | 11.21 | | $ | 10.25 | | $ | 10.20 | |
| Income from investment operationsa: | | | | | | | | | | | | | | | |
| Net investment income (loss)b | | —c | | | (0.03 | )d | | 0.02 | e | | 0.01 | | | (0.02 | ) |
| Net realized and unrealized gains (losses) | | (0.59 | ) | | 1.36 | | | 3.39 | | | 0.95 | | | 0.07 | |
| Total from investment operations | | (0.59 | ) | | 1.33 | | | 3.41 | | | 0.96 | | | 0.05 | |
| Less distributions from: | | | | | | | | | | | | | | | |
| Net investment income | | — | | | (0.01 | ) | | (0.07 | ) | | — | | | (—)c | |
| Net realized gains | | (0.31 | ) | | — | | | — | | | — | | | — | |
| Total distributions | | (0.31 | ) | | (0.01 | ) | | (0.07 | ) | | — | | | (—)c | |
| Net asset value, end of year | $ | 14.97 | | $ | 15.87 | | $ | 14.55 | | $ | 11.21 | | $ | 10.25 | |
| |
| Total returnf | | (3.75 | )% | | 9.12 | % | | 30.56 | % | | 9.37 | % | | 0.50 | % |
| |
| Ratios to average net assets | | | | | | | | | | | | | | | |
| Expenses before waiver and payments by affiliates | | 2.31 | % | | 2.26 | % | | 2.34 | % | | 2.39 | % | | 2.40 | % |
| Expenses net of waiver and payments by affiliates | | 2.05 | % | | 2.05 | %g | | 2.05 | % | | 2.04 | % | | 2.05 | % |
| Net investment income (loss) | | 0.01 | % | | (0.20 | )%d | | 0.13 | %e | | 0.09 | % | | (0.20 | )% |
| |
| Supplemental data | | | | | | | | | | | | | | | |
| Net assets, end of year (000’s) | $ | 23,329 | | $ | 23,926 | | $ | 21,965 | | $ | 12,175 | | $ | 12,696 | |
| Portfolio turnover rate | | 61.80 | % | | 24.44 | % | | 10.00 | % | | 22.29 | % | | 18.61 | % |
aThe amount shown for a share outstanding throughout the period may not correlate with the Statement of Operations for the period due to the timing of sales and
repurchases of the Fund’s shares in relation to income earned and/or fluctuating fair value of the investments of the Fund.
bBased on average daily shares outstanding.
cAmount rounds to less than $0.01 per share.
dNet investment income per share includes approximately $0.02 per share received in the form of special dividends. Excluding these amounts, the ratio of net investment
income to average net assets would have been (0.32)%.
eNet investment income per share includes approximately $0.03 per share received in the form of special dividends. Excluding these amounts, the ratio of net investment
income to average net assets would have been (0.09)%.
fTotal return does not reflect sales commissions or contingent deferred sales charges, if applicable.
gBenefit of expense reduction rounds to less than 0.01%.
|
92 Annual Report | The accompanying notes are an integral part of these financial statements.
franklintempleton.com
FRANKLIN VALUE INVESTORS TRUST
FINANCIAL HIGHLIGHTS
| | | | | | | | | | | | | | | |
| Franklin MidCap Value Fund (continued) | | | | | | | | | | | | | | | |
| | | | | | Year Ended October 31, | | | | |
| | | 2015 | | | 2014 | | | 2013 | | | 2012 | | | 2011 | |
| Class R | | | | | | | | | | | | | | | |
| Per share operating performance | | | | | | | | | | | | | | | |
| (for a share outstanding throughout the year) | | | | | | | | | | | | | | | |
| Net asset value, beginning of year | $ | 16.09 | | $ | 14.71 | | $ | 11.35 | | $ | 10.36 | | $ | 10.28 | |
| Income from investment operationsa: | | | | | | | | | | | | | | | |
| Net investment incomeb | | 0.08 | | | 0.05 | c | | 0.08 | d | | 0.06 | | | 0.03 | |
| Net realized and unrealized gains (losses) | | (0.61 | ) | | 1.38 | | | 3.42 | | | 0.95 | | | 0.08 | |
| Total from investment operations | | (0.53 | ) | | 1.43 | | | 3.50 | | | 1.01 | | | 0.11 | |
| Less distributions from: | | | | | | | | | | | | | | | |
| Net investment income | | (0.06 | ) | | (0.05 | ) | | (0.14 | ) | | (0.02 | ) | | (0.03 | ) |
| Net realized gains | | (0.31 | ) | | — | | | — | | | — | | | — | |
| Total distributions | | (0.37 | ) | | (0.05 | ) | | (0.14 | ) | | (0.02 | ) | | (0.03 | ) |
| Net asset value, end of year | $ | 15.19 | | $ | 16.09 | | $ | 14.71 | | $ | 11.35 | | $ | 10.36 | |
| |
| Total return | | (3.30 | )% | | 9.75 | % | | 31.22 | % | | 9.77 | % | | 1.05 | % |
| |
| Ratios to average net assets | | | | | | | | | | | | | | | |
| Expenses before waiver and payments by affiliates | | 1.81 | % | | 1.76 | % | | 1.84 | % | | 1.90 | % | | 1.90 | % |
| Expenses net of waiver and payments by affiliates | | 1.55 | % | | 1.55 | %e | | 1.55 | % | | 1.55 | % | | 1.55 | % |
| Net investment income | | 0.51 | % | | 0.30 | %c | | 0.63 | %d | | 0.58 | % | | 0.30 | % |
| |
| Supplemental data | | | | | | | | | | | | | | | |
| Net assets, end of year (000’s) | $ | 755 | | $ | 1,103 | | $ | 1,000 | | $ | 485 | | $ | 507 | |
| Portfolio turnover rate | | 61.80 | % | | 24.44 | % | | 10.00 | % | | 22.29 | % | | 18.61 | % |
aThe amount shown for a share outstanding throughout the period may not correlate with the Statement of Operations for the period due to the timing of sales and
repurchases of the Fund’s shares in relation to income earned and/or fluctuating fair value of the investments of the Fund.
bBased on average daily shares outstanding.
cNet investment income per share includes approximately $0.02 per share received in the form of special dividends. Excluding these amounts, the ratio of net investment
income to average net assets would have been 0.18%.
dNet investment income per share includes approximately $0.03 per share received in the form of special dividends. Excluding these amounts, the ratio of net investment
income to average net assets would have been 0.41%.
eBenefit of expense reduction rounds to less than 0.01%.

| | | | | | | | | | | | | | | |
| FRANKLIN VALUE INVESTORS TRUST | | | | | | | | | | | | | | | |
| FINANCIAL HIGHLIGHTS | | | | | | | | | | | | | | | |
| |
| |
| |
| Franklin MidCap Value Fund (continued) | | | | | | | | | | | | | | | |
| | | | | | Year Ended October 31, | | | | |
| | | 2015 | | | 2014 | | | 2013 | | | 2012 | | | 2011 | |
| Advisor Class | | | | | | | | | | | | | | | |
| Per share operating performance | | | | | | | | | | | | | | | |
| (for a share outstanding throughout the year) | | | | | | | | | | | | | | | |
| Net asset value, beginning of year | $ | 16.23 | | $ | 14.84 | | $ | 11.44 | | $ | 10.45 | | $ | 10.36 | |
| Income from investment operationsa: | | | | | | | | | | | | | | | |
| Net investment incomeb | | 0.16 | | | 0.13 | c | | 0.15 | d | | 0.12 | | | 0.09 | |
| Net realized and unrealized gains (losses) | | (0.62 | ) | | 1.38 | | | 3.45 | | | 0.95 | | | 0.08 | |
| Total from investment operations | | (0.46 | ) | | 1.51 | | | 3.60 | | | 1.07 | | | 0.17 | |
| Less distributions from: | | | | | | | | | | | | | | | |
| Net investment income | | (0.15 | ) | | (0.12 | ) | | (0.20 | ) | | (0.08 | ) | | (0.08 | ) |
| Net realized gains | | (0.31 | ) | | — | | | — | | | — | | | — | |
| Total distributions | | (0.46 | ) | | (0.12 | ) | | (0.20 | ) | | (0.08 | ) | | (0.08 | ) |
| Net asset value, end of year | $ | 15.31 | | $ | 16.23 | | $ | 14.84 | | $ | 11.44 | | $ | 10.45 | |
| |
| Total return | | (2.83 | )% | | 10.25 | % | | 31.94 | % | | 10.35 | % | | 1.59 | % |
| |
| Ratios to average net assets | | | | | | | | | | | | | | | |
| Expenses before waiver and payments by affiliates | | 1.31 | % | | 1.26 | % | | 1.34 | % | | 1.40 | % | | 1.40 | % |
| Expenses net of waiver and payments by affiliates | | 1.05 | % | | 1.05 | %e | | 1.05 | % | | 1.05 | % | | 1.05 | % |
| Net investment income | | 1.01 | % | | 0.80 | %c | | 1.13 | %d | | 1.08 | % | | 0.80 | % |
| |
| Supplemental data | | | | | | | | | | | | | | | |
| Net assets, end of year (000’s) | $ | 4,706 | | $ | 4,369 | | $ | 3,596 | | $ | 2,507 | | $ | 2,052 | |
| Portfolio turnover rate | | 61.80 | % | | 24.44 | % | | 10.00 | % | | 22.29 | % | | 18.61 | % |
aThe amount shown for a share outstanding throughout the period may not correlate with the Statement of Operations for the period due to the timing of sales and
repurchases of the Fund’s shares in relation to income earned and/or fluctuating fair value of the investments of the Fund.
bBased on average daily shares outstanding.
cNet investment income per share includes approximately $0.02 per share received in the form of special dividends. Excluding these amounts, the ratio of net investment
income to average net assets would have been 0.68%.
dNet investment income per share includes approximately $0.03 per share received in the form of special dividends. Excluding these amounts, the ratio of net investment
income to average net assets would have been 0.91%.
eBenefit of expense reduction rounds to less than 0.01%.

| | | |
| | FRANKLIN VALUE INVESTORS TRUST |
| |
| |
| |
| |
| Statement of Investments, October 31, 2015 | | | |
| |
| Franklin MidCap Value Fund | | | |
| | Shares/Units | | Value |
| Common Stocks and Other Equity Interests 98.3% | | | |
| Automobiles & Components 1.4% | | | |
| BorgWarner Inc. | 7,400 | $ | 316,868 |
| Harley-Davidson Inc. | 36,200 | | 1,790,090 |
| | | | 2,106,958 |
| Banks 5.9% | | | |
| Citizens Financial Group Inc. | 79,600 | | 1,934,280 |
| Comerica Inc. | 36,700 | | 1,592,780 |
| KeyCorp | 179,000 | | 2,223,180 |
| Regions Financial Corp. | 239,600 | | 2,240,260 |
| SunTrust Banks Inc. | 28,600 | | 1,187,472 |
| | | | 9,177,972 |
| Capital Goods 7.5% | | | |
| BWX Technologies Inc. | 29,100 | | 823,530 |
| Carlisle Cos. Inc. | 13,400 | | 1,165,800 |
| Dover Corp. | 6,800 | | 438,124 |
| Fortune Brands Home & Security Inc. | 22,200 | | 1,161,726 |
| ITT Corp. | 29,700 | | 1,175,526 |
| KBR Inc. | 25,000 | | 461,000 |
| L-3 Communications Holdings Inc. | 12,200 | | 1,542,080 |
| Owens Corning Inc. | 24,674 | | 1,123,407 |
| Pentair PLC (United Kingdom) | 7,800 | | 436,176 |
| Regal Beloit Corp. | 18,000 | | 1,148,220 |
| Rockwell Automation Inc. | 3,800 | | 414,808 |
| Stanley Black & Decker Inc. | 800 | | 84,784 |
| W.W. Grainger Inc. | 1,900 | | 399,000 |
| aWABCO Holdings Inc. | 4,000 | | 448,920 |
| Xylem Inc. | 23,200 | | 844,712 |
| | | | 11,667,813 |
| Commercial & Professional Services 1.8% | | | |
| Robert Half International Inc. | 15,300 | | 805,698 |
| Towers Watson & Co. | 12,200 | | 1,507,432 |
| Waste Connections Inc. | 9,382 | | 511,132 |
| | | | 2,824,262 |
| Consumer Durables & Apparel 2.4% | | | |
| Coach Inc. | 37,800 | | 1,179,360 |
| Hasbro Inc. | 10,100 | | 775,983 |
| Pulte Group Inc. | 65,200 | | 1,195,116 |
| Ralph Lauren Corp. | 6,000 | | 664,620 |
| | | | 3,815,079 |
| Consumer Services 0.5% | | | |
| H&R Block Inc. | 21,100 | | 786,186 |
| Diversified Financials 4.7% | | | |
| KKR & Co., LP (units) | 100,800 | | 1,728,720 |
| Northern Trust Corp. | 43,300 | | 3,047,887 |
| Raymond James Financial Inc. | 45,300 | | 2,496,483 |
| | | | 7,273,090 |
| Energy 8.5% | | | |
| Cabot Oil & Gas Corp., A | 30,500 | | 662,155 |
| aCheniere Energy Inc. | 12,700 | | 628,904 |
| |
| franklintempleton.com | Annual Report | 95 |
| | | |
| FRANKLIN VALUE INVESTORS TRUST | | | |
| STATEMENT OF INVESTMENTS | | | |
| |
| |
| |
| |
| Franklin MidCap Value Fund (continued) | | | |
| | Shares/Units | | Value |
| Common Stocks and Other Equity Interests (continued) | | | |
| Energy (continued) | | | |
| Cimarex Energy Co. | 7,200 | $ | 850,032 |
| aConcho Resources Inc. | 17,800 | | 2,063,198 |
| aDiamondback Energy Inc. | 26,400 | | 1,949,376 |
| EQT Corp. | 15,100 | | 997,657 |
| aFMC Technologies Inc. | 22,700 | | 767,941 |
| Helmerich & Payne Inc. | 12,000 | | 675,240 |
| HollyFrontier Corp. | 25,800 | | 1,263,426 |
| National Oilwell Varco Inc. | 24,700 | | 929,708 |
| Noble Energy Inc. | 18,800 | | 673,792 |
| Pioneer Natural Resources Co. | 5,900 | | 809,126 |
| Range Resources Corp. | 8,400 | | 255,696 |
| Rowan Cos. PLC | 39,900 | | 785,232 |
| | | | 13,311,483 |
| Food, Beverage & Tobacco 2.2% | | | |
| Bunge Ltd. | 7,594 | | 554,058 |
| Ingredion Inc. | 14,100 | | 1,340,346 |
| Pilgrim’s Pride Corp. | 18,100 | | 343,719 |
| Tyson Foods Inc. | 26,500 | | 1,175,540 |
| | | | 3,413,663 |
| Health Care Equipment & Services 5.5% | | | |
| aCommunity Health Systems Inc. | 6,800 | | 190,672 |
| DENTSPLY International Inc. | 19,900 | | 1,210,915 |
| Hill-Rom Holdings Inc. | 14,000 | | 737,660 |
| aLaboratory Corp. of America Holdings | 6,800 | | 834,632 |
| aLifePoint Health Inc. | 15,500 | | 1,067,640 |
| aMednax Inc. | 14,600 | | 1,028,862 |
| aPremier Inc., A | 10,700 | | 361,767 |
| ResMed Inc. | 25,100 | | 1,446,011 |
| Zimmer Biomet Holdings Inc. | 16,300 | | 1,704,491 |
| | | | 8,582,650 |
| Insurance 6.6% | | | |
| Arthur J. Gallagher & Co. | 17,200 | | 752,156 |
| The Hartford Financial Services Group Inc. | 24,700 | | 1,142,622 |
| Principal Financial Group Inc. | 44,500 | | 2,232,120 |
| The Progressive Corp. | 81,900 | | 2,713,347 |
| RenaissanceRe Holdings Ltd. | 11,100 | | 1,216,893 |
| W. R. Berkley Corp. | 39,900 | | 2,227,617 |
| | | | 10,284,755 |
| Materials 7.1% | | | |
| Albemarle Corp. | 35,100 | | 1,878,552 |
| Alcoa Inc. | 59,500 | | 531,335 |
| Ashland Inc. | 14,400 | | 1,579,968 |
| Axiall Corp. | 42,000 | | 850,500 |
| Celanese Corp., A | 11,400 | | 809,970 |
| Domtar Corp. | 31,600 | | 1,303,184 |
| The Mosaic Co. | 52,700 | | 1,780,733 |
| Nucor Corp. | 25,300 | | 1,070,190 |
| WestRock Co. | 23,556 | | 1,266,371 |
| | | | 11,070,803 |
| |
| 96 | Annual Report | franklintempleton.com |
| | | |
| | FRANKLIN VALUE INVESTORS TRUST |
| | STATEMENT OF INVESTMENTS |
| |
| |
| |
| |
| Franklin MidCap Value Fund (continued) | | | |
| | Shares/Units | | Value |
| Common Stocks and Other Equity Interests (continued) | | | |
| Media 1.1% | | | |
| John Wiley & Sons Inc., A | 14,500 | $ | 758,785 |
| TEGNA Inc. | 32,500 | | 878,800 |
| | | | 1,637,585 |
| Pharmaceuticals, Biotechnology & Life Sciences 2.6% | | | |
| Agilent Technologies Inc. | 32,300 | | 1,219,648 |
| aBio-Rad Laboratories Inc., A | 8,200 | | 1,143,736 |
| aMedivation Inc. | 15,400 | | 647,724 |
| Perrigo Co. PLC | 7,100 | | 1,119,954 |
| | | | 4,131,062 |
| Real Estate 13.2% | | | |
| Alexandria Real Estate Equities Inc. | 5,500 | | 493,570 |
| Apartment Investment & Management Co., A | 26,700 | | 1,046,373 |
| Boston Properties Inc. | 17,000 | | 2,139,450 |
| Brixmor Property Group Inc. | 33,800 | | 865,956 |
| Camden Property Trust | 13,400 | | 988,786 |
| DDR Corp. | 100,900 | | 1,695,120 |
| Duke Realty Corp. | 61,500 | | 1,273,050 |
| Equity Lifestyle Properties Inc. | 31,300 | | 1,893,024 |
| General Growth Properties Inc. | 30,500 | | 882,975 |
| Host Hotels & Resorts Inc. | 172,100 | | 2,982,493 |
| Liberty Property Trust | 36,600 | | 1,245,132 |
| Prologis Inc. | 26,800 | | 1,145,164 |
| aRealogy Holdings Corp. | 28,000 | | 1,094,800 |
| UDR Inc. | 31,300 | | 1,078,598 |
| Weingarten Realty Investors | 24,600 | | 879,696 |
| Weyerhaeuser Co. | 28,000 | | 821,240 |
| | | | 20,525,427 |
| Retailing 4.3% | | | |
| Best Buy Co. Inc. | 27,400 | | 959,822 |
| Big Lots Inc. | 24,300 | | 1,120,230 |
| Chico’s FAS Inc. | 76,400 | | 1,055,848 |
| DSW Inc., A | 51,600 | | 1,286,904 |
| bGameStop Corp., A | 19,500 | | 898,365 |
| The Gap Inc. | 24,500 | | 666,890 |
| Staples Inc. | 50,700 | | 658,593 |
| | | | 6,646,652 |
| Semiconductors & Semiconductor Equipment 4.1% | | | |
| aFirst Solar Inc. | 20,300 | | 1,158,521 |
| KLA-Tencor Corp. | 15,500 | | 1,040,360 |
| Lam Research Corp. | 11,700 | | 896,103 |
| Maxim Integrated Products Inc. | 18,200 | | 745,836 |
| Microchip Technology Inc. | 18,800 | | 907,852 |
| NVIDIA Corp. | 28,800 | | 817,056 |
| Teradyne Inc. | 40,800 | | 796,416 |
| | | | 6,362,144 |
| Software & Services 4.3% | | | |
| Amdocs Ltd. | 20,000 | | 1,191,400 |
| aAutodesk Inc. | 9,300 | | 513,267 |
| aCadence Design Systems Inc. | 47,500 | | 1,055,450 |
| |
| franklintempleton.com | Annual Report | 97 |
| | | |
| FRANKLIN VALUE INVESTORS TRUST | | | |
| STATEMENT OF INVESTMENTS | | | |
| |
| |
| |
| |
| Franklin MidCap Value Fund (continued) | | | |
| | Shares/Units | | Value |
| Common Stocks and Other Equity Interests (continued) | | | |
| Software & Services (continued) | | | |
| Leidos Holdings Inc. | 17,825 | $ | 937,060 |
| Science Applications International Corp. | 16,071 | | 737,016 |
| Symantec Corp. | 38,000 | | 782,800 |
| Total System Services Inc. | 17,100 | | 896,895 |
| Xerox Corp. | 61,500 | | 577,485 |
| | | | 6,691,373 |
| Technology Hardware & Equipment 3.2% | | | |
| Corning Inc. | 42,100 | | 783,060 |
| aKeysight Technologies Inc. | 30,150 | | 997,362 |
| aKnowles Corp. | 49,400 | | 823,004 |
| SanDisk Corp. | 22,100 | | 1,701,700 |
| Western Digital Corp. | 10,500 | | 701,610 |
| | | | 5,006,736 |
| Telecommunication Services 0.8% | | | |
| CenturyLink Inc. | 13,100 | | 369,551 |
| aLevel 3 Communications Inc. | 16,500 | | 840,675 |
| | | | 1,210,226 |
| Transportation 0.9% | | | |
| Alaska Air Group Inc. | 9,500 | | 724,375 |
| J.B. Hunt Transport Services Inc. | 9,900 | | 756,063 |
| | | | 1,480,438 |
| Utilities 9.7% | | | |
| American Water Works Co. Inc. | 13,400 | | 768,624 |
| aCalpine Corp. | 112,100 | | 1,738,671 |
| CMS Energy Corp. | 56,500 | | 2,037,955 |
| DTE Energy Co. | 25,300 | | 2,064,227 |
| Eversource Energy | 49,700 | | 2,531,718 |
| ITC Holdings Corp. | 75,900 | | 2,483,448 |
| Sempra Energy | 22,800 | | 2,334,948 |
| UGI Corp. | 33,300 | | 1,221,111 |
| | | | 15,180,702 |
| Total Common Stocks and Other Equity Interests (Cost $137,783,470) | | | 153,187,059 |
| Short Term Investments 2.5% | | | |
| Money Market Funds (Cost $2,941,745) 1.9% | | | |
| a,cInstitutional Fiduciary Trust Money Market Portfolio | 2,941,745 | | 2,941,745 |
|
98 Annual Report
franklintempleton.com
FRANKLIN VALUE INVESTORS TRUST
STATEMENT OF INVESTMENTS
| | | | | |
| Franklin MidCap Value Fund (continued) | | | | | |
| | | Principal | | | |
| | | Amount | | Value | |
| Short Term Investments (continued) | | | | | |
| dInvestments from Cash Collateral Received for Loaned Securities | | | | | |
| (Cost $907,003) 0.6% | | | | | |
| Repurchase Agreements 0.6% | | | | | |
| eJoint Repurchase Agreement, 0.07%, 11/02/15 (Maturity Value $907,008) | | | | | |
| RBS Securities Inc. | | | | | |
| Collateralized by U.S. Treasury Note, 0.184% - 3.375%, 8/15/16 - 8/15/21 | | | | | |
| (valued at $925,143) | $ | 907,003 | $ | 907,003 | |
| Total Investments (Cost $141,632,218) 100.8% | | | | 157,035,807 | |
| Other Assets, less Liabilities (0.8)% | | | | (1,201,555 | ) |
| |
| Net Assets 100.0% | | | $ | 155,834,252 | |
aNon-income producing.
bA portion or all of the security is on loan at October 31, 2015. See Note 1(d).
cSee Note 3(f) regarding investments in affiliated management investment companies.
dSee Note 1(d) regarding securities on loan.
eSee Note 1(c) regarding joint repurchase agreement.

| | | | | | | | | | | | | | | |
| FRANKLIN VALUE INVESTORS TRUST | | | | | | | | | | | | | | | |
| |
| |
| Financial Highlights | | | | | | | | | | | | | | | |
| Franklin Small Cap Value Fund | | | | | | | | | | | | | | | |
| | | | | | Year Ended October 31, | | | | |
| | | 2015 | | | 2014 | | | 2013 | | | 2012 | | | 2011 | |
| Class A | | | | | | | | | | | | | | | |
| Per share operating performance | | | | | | | | | | | | | | | |
| (for a share outstanding throughout the year) | | | | | | | | | | | | | | | |
| Net asset value, beginning of year | $ | 58.96 | | $ | 59.76 | | $ | 45.12 | | $ | 42.25 | | $ | 39.69 | |
| Income from investment operationsa: | | | | | | | | | | | | | | | |
| Net investment incomeb | | 0.30 | c | | 0.16 | d | | 0.30 | e | | 0.34 | f | | 0.18 | |
| Net realized and unrealized gains (losses) | | (2.33 | ) | | 2.03 | | | 16.30 | | | 4.47 | | | 2.50 | |
| Total from investment operations | | (2.03 | ) | | 2.19 | | | 16.60 | | | 4.81 | | | 2.68 | |
| Less distributions from: | | | | | | | | | | | | | | | |
| Net investment income | | (0.12 | ) | | (0.25 | ) | | (0.49 | ) | | (0.17 | ) | | (0.12 | ) |
| Net realized gains | | (5.09 | ) | | (2.74 | ) | | (1.47 | ) | | (1.77 | ) | | — | |
| Total distributions | | (5.21 | ) | | (2.99 | ) | | (1.96 | ) | | (1.94 | ) | | (0.12 | ) |
| Net asset value, end of year | $ | 51.72 | | $ | 58.96 | | $ | 59.76 | | $ | 45.12 | | $ | 42.25 | |
| |
| Total returng | | (3.31 | )% | | 3.76 | % | | 38.15 | % | | 12.08 | % | | 6.73 | % |
| |
| Ratios to average net assets | | | | | | | | | | | | | | | |
| Expenses before waiver and payments by affiliates | | 1.16 | % | | 1.13 | % | | 1.19 | % | | 1.26 | % | | 1.21 | % |
| Expenses net of waiver and payments by affiliates | | 1.15 | % | | 1.13 | %h | | 1.19 | % | | 1.26 | % | | 1.21 | % |
| Net investment income | | 0.56 | %c | | 0.27 | %d | | 0.57 | %e | | 0.79 | %f | | 0.41 | % |
| |
| Supplemental data | | | | | | | | | | | | | | | |
| Net assets, end of year (000’s) | $ | 1,062,353 | | $ | 1,294,724 | | $ | 1,224,592 | | $ | 856,541 | | $ | 829,710 | |
| Portfolio turnover rate | | 25.88 | % | | 21.30 | % | | 13.04 | % | | 5.18 | % | | 14.24 | % |
aThe amount shown for a share outstanding throughout the period may not correlate with the Statement of Operations for the period due to the timing of sales and
repurchases of the Fund’s shares in relation to income earned and/or fluctuating fair value of the investments of the Fund.
bBased on average daily shares outstanding.
cNet investment income per share includes approximately $0.11 per share received in the form of special dividends in connection with certain Fund holdings. Excluding this
amount, the ratio of net investment income to average net assets would have been 0.36%.
dNet investment income per share includes approximately $0.04 per share received in the form of special dividends. Excluding these amounts, the ratio of net investment
income to average net assets would have been 0.21%.
eNet investment income per share includes approximately $0.10 per share received in the form of special dividends. Excluding these amounts, the ratio of net investment
income to average net assets would have been 0.38%.
fNet investment income per share includes approximately $0.14 per share received in the form of special dividends. Excluding these amounts, the ratio of net investment
income to average net assets would have been 0.48%.
gTotal return does not reflect sales commissions or contingent deferred sales charges, if applicable.
hBenefit of waiver and payments by affiliates and expense reduction rounds to less than 0.01%.

| | | | | | | | | | | | | | | |
| | | | | | FRANKLIN VALUE INVESTORS TRUST | |
| | | | | | | | | FINANCIAL HIGHLIGHTS | |
| |
| |
| |
| Franklin Small Cap Value Fund (continued) | | | | | | | | | | | | | | | |
| | | | | | Year Ended October 31, | | | | |
| | | 2015 | | | 2014 | | | 2013 | | | 2012 | | | 2011 | |
| Class C | | | | | | | | | | | | | | | |
| Per share operating performance | | | | | | | | | | | | | | | |
| (for a share outstanding throughout the year) | | | | | | | | | | | | | | | |
| Net asset value, beginning of year | $ | 54.53 | | $ | 55.62 | | $ | 42.12 | | $ | 39.66 | | $ | 37.42 | |
| Income from investment operationsa: | | | | | | | | | | | | | | | |
| Net investment income (loss)b | | (0.07 | )c | | (0.24 | )d | | (0.05 | )e | | 0.04 | f | | (0.12 | ) |
| Net realized and unrealized gains (losses) | | (2.15 | ) | | 1.89 | | | 15.21 | | | 4.19 | | | 2.36 | |
| Total from investment operations | | (2.22 | ) | | 1.65 | | | 15.16 | | | 4.23 | | | 2.24 | |
| Less distributions from: | | | | | | | | | | | | | | | |
| Net investment income | | — | | | — | | | (0.19 | ) | | — | | | — | |
| Net realized gains | | (5.09 | ) | | (2.74 | ) | | (1.47 | ) | | (1.77 | ) | | — | |
| Total distributions | | (5.09 | ) | | (2.74 | ) | | (1.66 | ) | | (1.77 | ) | | — | |
| Net asset value, end of year | $ | 47.22 | | $ | 54.53 | | $ | 55.62 | | $ | 42.12 | | $ | 39.66 | |
| |
| Total returng | | (4.01 | )% | | 3.03 | % | | 37.23 | % | | 11.29 | % | | 5.99 | % |
| |
| Ratios to average net assets | | | | | | | | | | | | | | | |
| Expenses before waiver and payments by affiliates | | 1.87 | % | | 1.83 | % | | 1.89 | % | | 1.95 | % | | 1.91 | % |
| Expenses net of waiver and payments by affiliates | | 1.86 | % | | 1.83 | %h | | 1.89 | % | | 1.95 | % | | 1.91 | % |
| Net investment income (loss) | | (0.15 | )%c | | (0.43 | )%d | | (0.13 | )%e | | 0.10 | %f | | (0.29 | )% |
| |
| Supplemental data | | | | | | | | | | | | | | | |
| Net assets, end of year (000’s) | $ | 229,119 | | $ | 266,845 | | $ | 247,742 | | $ | 183,986 | | $ | 189,321 | |
| Portfolio turnover rate | | 25.88 | % | | 21.30 | % | | 13.04 | % | | 5.18 | % | | 14.24 | % |
aThe amount shown for a share outstanding throughout the period may not correlate with the Statement of Operations for the period due to the timing of sales and
repurchases of the Fund’s shares in relation to income earned and/or fluctuating fair value of the investments of the Fund.
bBased on average daily shares outstanding.
cNet investment income per share includes approximately $0.11 per share received in the form of special dividends in connection with certain Fund holdings. Excluding this
amount, the ratio of net investment income to average net assets would have been (0.35)%.
dNet investment income per share includes approximately $0.04 per share received in the form of special dividends. Excluding these amounts, the ratio of net investment
income to average net assets would have been (0.49)%.
eNet investment income per share includes approximately $0.10 per share received in the form of special dividends. Excluding these amounts, the ratio of net investment
income to average net assets would have been (0.32)%.
fNet investment income per share includes approximately $0.14 per share received in the form of special dividends. Excluding these amounts, the ratio of net investment
income to average net assets would have been (0.21)%.
gTotal return does not reflect sales commissions or contingent deferred sales charges, if applicable.
hBenefit of waiver and payments by affiliates and expense reduction rounds to less than 0.01%.
| 101
franklintempleton.com The accompanying notes are an integral part of these financial statements. | Annual Report
| | | | | | | | | | | | | | | |
| FRANKLIN VALUE INVESTORS TRUST | | | | | | | | | | | | | | | |
| FINANCIAL HIGHLIGHTS | | | | | | | | | | | | | | | |
| |
| |
| |
| Franklin Small Cap Value Fund (continued) | | | | | | | | | | | | | | | |
| | | | | | Year Ended October 31, | | | | |
| | | 2015 | | | 2014 | | | 2013 | | | 2012 | | | 2011 | |
| Class R | | | | | | | | | | | | | | | |
| Per share operating performance | | | | | | | | | | | | | | | |
| (for a share outstanding throughout the year) | | | | | | | | | | | | | | | |
| Net asset value, beginning of year | $ | 58.40 | | $ | 59.21 | | $ | 44.71 | | $ | 41.88 | | $ | 39.35 | |
| Income from investment operationsa: | | | | | | | | | | | | | | | |
| Net investment incomeb | | 0.19 | c | | 0.04 | d | | 0.21 | e | | 0.26 | f | | 0.09 | |
| Net realized and unrealized gains (losses) | | (2.32 | ) | | 2.02 | | | 16.15 | | | 4.42 | | | 2.48 | |
| Total from investment operations | | (2.13 | ) | | 2.06 | | | 16.36 | | | 4.68 | | | 2.57 | |
| Less distributions from: | | | | | | | | | | | | | | | |
| Net investment income | | (—)g | | | (0.13 | ) | | (0.39 | ) | | (0.08 | ) | | (0.04 | ) |
| Net realized gains | | (5.09 | ) | | (2.74 | ) | | (1.47 | ) | | (1.77 | ) | | — | |
| Total distributions | | (5.09 | ) | | (2.87 | ) | | (1.86 | ) | | (1.85 | ) | | (0.04 | ) |
| Net asset value, end of year | $ | 51.18 | | $ | 58.40 | | $ | 59.21 | | $ | 44.71 | | $ | 41.88 | |
| |
| Total return | | (3.53 | )% | | 3.55 | % | | 37.91 | % | | 11.85 | % | | 6.53 | % |
| |
| Ratios to average net assets | | | | | | | | | | | | | | | |
| Expenses before waiver and payments by affiliates | | 1.37 | % | | 1.33 | % | | 1.39 | % | | 1.46 | % | | 1.41 | % |
| Expenses net of waiver and payments by affiliates | | 1.36 | % | | 1.33 | %h | | 1.39 | % | | 1.46 | % | | 1.41 | % |
| Net investment income | | 0.35 | %c | | 0.07 | %d | | 0.37 | %e | | 0.59 | %f | | 0.21 | % |
| |
| Supplemental data | | | | | | | | | | | | | | | |
| Net assets, end of year (000’s) | $ | 221,939 | | $ | 280,908 | | $ | 272,697 | | $ | 220,539 | | $ | 221,524 | |
| Portfolio turnover rate | | 25.88 | % | | 21.30 | % | | 13.04 | % | | 5.18 | % | | 14.24 | % |
aThe amount shown for a share outstanding throughout the period may not correlate with the Statement of Operations for the period due to the timing of sales and
repurchases of the Fund’s shares in relation to income earned and/or fluctuating fair value of the investments of the Fund.
bBased on average daily shares outstanding.
cNet investment income per share includes approximately $0.11 per share received in the form of special dividends in connection with certain Fund holdings. Excluding this
amount, the ratio of net investment income to average net assets would have been 0.15%.
dNet investment income per share includes approximately $0.04 per share received in the form of special dividends. Excluding these amounts, the ratio of net investment
income to average net assets would have been 0.01%.
eNet investment income per share includes approximately $0.10 per share received in the form of special dividends. Excluding these amounts, the ratio of net investment
income to average net assets would have been 0.18%.
fNet investment income per share includes approximately $0.14 per share received in the form of special dividends. Excluding these amounts, the ratio of net investment
income to average net assets would have been 0.28%.
gAmount rounds to less than $0.01 per share.
hBenefit of waiver and payments by affiliates and expense reduction rounds to less than 0.01%.

| | | | | | | | | |
| | | FRANKLIN VALUE INVESTORS TRUST | |
| | | FINANCIAL HIGHLIGHTS | |
| |
| |
| |
| Franklin Small Cap Value Fund (continued) | | | | �� | | | | | |
| | | Year Ended October 31, | |
| | | 2015 | | | 2014 | | | 2013 | a |
| Class R6 | | | | | | | | | |
| Per share operating performance | | | | | | | | | |
| (for a share outstanding throughout the year) | | | | | | | | | |
| Net asset value, beginning of year | $ | 61.09 | | $ | 61.78 | | $ | 50.83 | |
| Income from investment operationsb: | | | | | | | | | |
| Net investment incomec | | 0.62 | d | | 0.42 | e | | 0.19 | |
| Net realized and unrealized gains (losses) | | (2.43 | ) | | 2.16 | | | 10.76 | |
| Total from investment operations | | (1.81 | ) | | 2.58 | | | 10.95 | |
| Less distributions from: | | | | | | | | | |
| Net investment income | | (0.44 | ) | | (0.53 | ) | | — | |
| Net realized gains | | (5.09 | ) | | (2.74 | ) | | — | |
| Total distributions | | (5.53 | ) | | (3.27 | ) | | — | |
| Net asset value, end of year | $ | 53.75 | | $ | 61.09 | | $ | 61.78 | |
| |
| Total returnf | | (2.80 | )% | | 4.31 | % | | 21.54 | % |
| |
| Ratios to average net assetsg | | | | | | | | | |
| Expenses before waiver and payments by affiliates | | 0.62 | % | | 0.60 | % | | 2.09 | % |
| Expenses net of waiver and payments by affiliates | | 0.61 | % | | 0.60 | %h | | 0.64 | % |
| Net investment income | | 1.10 | %d | | 0.80 | %e | | 0.68 | % |
| |
| Supplemental data | | | | | | | | | |
| Net assets, end of year (000’s) | $ | 59,339 | | $ | 34,278 | | $ | 17 | |
| Portfolio turnover rate | | 25.88 | % | | 21.30 | % | | 13.04 | % |
aFor the period May 1, 2013 (effective date) to October 31, 2013.
bThe amount shown for a share outstanding throughout the period may not correlate with the Statement of Operations for the period due to the timing of sales and
repurchases of the Fund’s shares in relation to income earned and/or fluctuating fair value of the investments of the Fund.
cBased on average daily shares outstanding.
dNet investment income per share includes approximately $0.11 per share received in the form of special dividends in connection with certain Fund holdings. Excluding this
amount, the ratio of net investment income to average net assets would have been 0.90%.
eNet investment income per share includes approximately $0.04 per share received in the form of special dividends. Excluding these amounts, the ratio of net investment
income to average net assets would have been 0.74%.
fTotal return is not annualized for periods less than one year.
gRatios are annualized for periods less than one year.
hBenefit of waiver and payments by affiliates and expense reduction rounds to less than 0.01%.

| | | | | | | | | | | | | | | |
| FRANKLIN VALUE INVESTORS TRUST | | | | | | | | | | | | | | | |
| FINANCIAL HIGHLIGHTS | | | | | | | | | | | | | | | |
| |
| |
| |
| Franklin Small Cap Value Fund (continued) | | | | | | | | | | | | | | | |
| | | | | | Year Ended October 31, | | | | |
| | | 2015 | | | 2014 | | | 2013 | | | 2012 | | | 2011 | |
| Advisor Class | | | | | | | | | | | | | | | |
| Per share operating performance | | | | | | | | | | | | | | | |
| (for a share outstanding throughout the year) | | | | | | | | | | | | | | | |
| Net asset value, beginning of year | $ | 61.01 | | $ | 61.72 | | $ | 46.54 | | $ | 43.53 | | $ | 40.87 | |
| Income from investment operationsa: | | | | | | | | | | | | | | | |
| Net investment incomeb | | 0.47 | c | | 0.34 | d | | 0.46 | e | | 0.48 | f | | 0.32 | |
| Net realized and unrealized gains (losses) | | (2.41 | ) | | 2.10 | | | 16.82 | | | 4.60 | | | 2.57 | |
| Total from investment operations | | (1.94 | ) | | 2.44 | | | 17.28 | | | 5.08 | | | 2.89 | |
| Less distributions from: | | | | | | | | | | | | | | | |
| Net investment income | | (0.31 | ) | | (0.41 | ) | | (0.63 | ) | | (0.30 | ) | | (0.23 | ) |
| Net realized gains | | (5.09 | ) | | (2.74 | ) | | (1.47 | ) | | (1.77 | ) | | — | |
| Total distributions | | (5.40 | ) | | (3.15 | ) | | (2.10 | ) | | (2.07 | ) | | (0.23 | ) |
| Net asset value, end of year | $ | 53.67 | | $ | 61.01 | | $ | 61.72 | | $ | 46.54 | | $ | 43.53 | |
| |
| Total return | | (3.03 | )% | | 4.07 | % | | 38.56 | % | | 12.42 | % | | 7.05 | % |
| |
| Ratios to average net assets | | | | | | | | | | | | | | | |
| Expenses before waiver and payments by affiliates | | 0.87 | % | | 0.83 | % | | 0.89 | % | | 0.96 | % | | 0.91 | % |
| Expenses net of waiver and payments by affiliates | | 0.86 | % | | 0.83 | %g | | 0.89 | % | | 0.96 | % | | 0.91 | % |
| Net investment income | | 0.85 | %c | | 0.57 | %d | | 0.87 | %e | | 1.09 | %f | | 0.71 | % |
| |
| Supplemental data | | | | | | | | | | | | | | | |
| Net assets, end of year (000’s) | $ | 635,499 | | $ | 816,430 | | $ | 653,660 | | $ | 419,840 | | $ | 359,034 | |
| Portfolio turnover rate | | 25.88 | % | | 21.30 | % | | 13.04 | % | | 5.18 | % | | 14.24 | % |
aThe amount shown for a share outstanding throughout the period may not correlate with the Statement of Operations for the period due to the timing of sales and
repurchases of the Fund’s shares in relation to income earned and/or fluctuating fair value of the investments of the Fund.
bBased on average daily shares outstanding.
cNet investment income per share includes approximately $0.11 per share received in the form of special dividends in connection with certain Fund holdings. Excluding this
amount, the ratio of net investment income to average net assets would have been 0.65%.
dNet investment income per share includes approximately $0.04 per share received in the form of special dividends. Excluding these amounts, the ratio of net investment
income to average net assets would have been 0.51%.
eNet investment income per share includes approximately $0.10 per share received in the form of special dividends. Excluding these amounts, the ratio of net investment
income to average net assets would have been 0.68%.
fNet investment income per share includes approximately $0.14 per share received in the form of special dividends. Excluding these amounts, the ratio of net investment
income to average net assets would have been 0.78%.
gBenefit of waiver and payments by affiliates and expense reduction rounds to less than 0.01%.
104 |
Annual Report | The accompanying notes are an integral part of these financial statements. franklintempleton.com
| | | |
| | FRANKLIN VALUE INVESTORS TRUST |
| |
| |
| |
| |
| Statement of Investments, October 31, 2015 | | | |
| |
| Franklin Small Cap Value Fund | | | |
| | Shares | | Value |
| Common Stocks 93.9% | | | |
| Aerospace & Defense 2.1% | | | |
| aAAR Corp. | 2,063,800 | $ | 46,827,622 |
| Automobiles & Components 5.0% | | | |
| Drew Industries Inc. | 562,700 | | 33,666,341 |
| Gentex Corp. | 1,659,800 | | 27,204,122 |
| Thor Industries Inc. | 602,600 | | 32,588,608 |
| Winnebago Industries Inc. | 807,500 | | 16,949,425 |
| | | | 110,408,496 |
| Banks 3.8% | | | |
| Chemical Financial Corp. | 726,755 | | 24,658,797 |
| EverBank Financial Corp. | 2,456,000 | | 42,390,560 |
| Lakeland Financial Corp. | 47,800 | | 2,147,654 |
| Peoples Bancorp Inc. | 421,800 | | 8,081,688 |
| TrustCo Bank Corp. NY | 1,103,300 | | 6,873,559 |
| | | | 84,152,258 |
| Building Products 5.9% | | | |
| bGibraltar Industries Inc. | 1,451,800 | | 36,759,576 |
| Griffon Corp. | 276,900 | | 4,757,142 |
| Simpson Manufacturing Co. Inc. | 756,600 | | 28,735,668 |
| Universal Forest Products Inc. | 824,200 | | 59,861,646 |
| | | | 130,114,032 |
| Commercial & Professional Services 3.2% | | | |
| bHuron Consulting Group Inc. | 240,100 | | 11,596,830 |
| McGrath RentCorp | 1,060,000 | | 31,853,000 |
| MSA Safety Inc. | 616,300 | | 26,796,724 |
| | | | 70,246,554 |
| Construction & Engineering 3.6% | | | |
| EMCOR Group Inc. | 950,900 | | 45,909,452 |
| Granite Construction Inc. | 1,016,070 | | 33,367,739 |
| | | | 79,277,191 |
| Consumer Durables & Apparel 6.9% | | | |
| bBRP Inc. (Canada) | 1,436,100 | | 25,854,303 |
| Brunswick Corp. | 354,300 | | 19,064,883 |
| bCrocs Inc. | 1,983,900 | | 21,426,120 |
| bHelen of Troy Ltd. | 38,100 | | 3,779,901 |
| aHooker Furniture Corp. | 582,900 | | 14,467,578 |
| La-Z-Boy Inc. | 1,595,400 | | 45,548,670 |
| bM/I Homes Inc. | 943,300 | | 21,648,735 |
| | | | 151,790,190 |
| Electrical Equipment 4.6% | | | |
| EnerSys | 557,500 | | 34,001,925 |
| Franklin Electric Co. Inc. | 559,700 | | 18,447,712 |
| Regal Beloit Corp. | 763,100 | | 48,678,149 |
| | | | 101,127,786 |
| Energy 3.8% | | | |
| Bristow Group Inc. | 493,400 | | 17,135,782 |
| Energen Corp. | 319,900 | | 18,602,185 |

FRANKLIN VALUE INVESTORS TRUST
STATEMENT OF INVESTMENTS
| | | |
| Franklin Small Cap Value Fund (continued) | | | |
| | Shares | | Value |
| Common Stocks (continued) | | | |
| Energy (continued) | | | |
| bHelix Energy Solutions Group Inc. | 871,200 | $ | 5,035,536 |
| Hunting PLC (United Kingdom) | 2,375,100 | | 13,170,921 |
| bOil States International Inc. | 388,400 | | 11,655,884 |
| bUnit Corp. | 1,354,600 | | 17,081,506 |
| | | | 82,681,814 |
| Food, Beverage & Tobacco 3.1% | | | |
| GrainCorp Ltd. (Australia) | 2,675,000 | | 17,259,629 |
| Maple Leaf Foods Inc. (Canada) | 3,243,800 | | 51,576,308 |
| | | | 68,835,937 |
| Health Care Equipment & Services 6.1% | | | |
| Hill-Rom Holdings Inc. | 574,200 | | 30,254,598 |
| Invacare Corp. | 750,000 | | 12,960,000 |
| STERIS Corp. | 706,100 | | 52,922,195 |
| Teleflex Inc. | 297,000 | | 39,501,000 |
| | | | 135,637,793 |
| Industrial Conglomerates 1.8% | | | |
| Carlisle Cos. Inc. | 458,000 | | 39,846,000 |
| Insurance 9.2% | | | |
| Arthur J. Gallagher & Co. | 304,400 | | 13,311,412 |
| Aspen Insurance Holdings Ltd. | 944,400 | | 45,907,284 |
| Endurance Specialty Holdings Ltd. | 203,337 | | 12,836,665 |
| The Hanover Insurance Group Inc. | 414,500 | | 34,921,625 |
| Old Republic International Corp. | 1,820,000 | | 32,832,800 |
| StanCorp Financial Group Inc. | 331,400 | | 38,018,208 |
| Validus Holdings Ltd. | 585,411 | | 25,933,707 |
| | | | 203,761,701 |
| Machinery 6.1% | | | |
| Astec Industries Inc. | 1,097,000 | | 35,652,500 |
| Hillenbrand Inc. | 643,200 | | 19,083,744 |
| Kennametal Inc. | 21,000 | | 590,520 |
| cLindsay Corp. | 232,900 | | 15,785,962 |
| Mueller Industries Inc. | 1,198,500 | | 37,776,720 |
| bWabash National Corp. | 1,834,800 | | 21,962,556 |
| Watts Water Technologies Inc., A | 80,000 | | 4,355,200 |
| | | | 135,207,202 |
| Materials 10.2% | | | |
| A. Schulman Inc. | 741,376 | | 26,607,985 |
| Allegheny Technologies Inc. | 417,600 | | 6,138,720 |
| AptarGroup Inc. | 84,600 | | 6,223,176 |
| Axiall Corp. | 2,042,600 | | 41,362,650 |
| Carpenter Technology Corp. | 557,200 | | 18,560,332 |
| H.B. Fuller Co. | 664,000 | | 25,225,360 |
| Minerals Technologies Inc. | 468,600 | | 27,619,284 |
| RPM International Inc. | 253,100 | | 11,569,201 |
| Sensient Technologies Corp. | 685,600 | | 44,749,112 |
| Stepan Co. | 313,500 | | 16,593,555 |
| | | | 224,649,375 |

FRANKLIN VALUE INVESTORS TRUST
STATEMENT OF INVESTMENTS
| | | | |
| Franklin Small Cap Value Fund (continued) | | | | |
| | | Shares | | Value |
| Common Stocks (continued) | | | | |
| Pharmaceuticals, Biotechnology & Life Sciences 2.5% | | | | |
| Gerresheimer AG (Germany) | | 696,300 | $ | 54,318,522 |
| Real Estate 2.3% | | | | |
| LTC Properties Inc. | | 1,190,700 | | 51,021,495 |
| Retailing 6.9% | | | | |
| Caleres Inc. | | 740,800 | | 22,638,848 |
| The Cato Corp., A | | 561,200 | | 21,190,912 |
| bGenesco Inc. | | 316,400 | | 19,822,460 |
| Group 1 Automotive Inc. | | 129,900 | | 11,294,805 |
| The Men’s Wearhouse Inc. | | 736,700 | | 29,453,266 |
| bThe Pep Boys - Manny, Moe & Jack | | 2,684,329 | | 40,372,308 |
| bWest Marine Inc. | | 815,200 | | 8,298,736 |
| | | | | 153,071,335 |
| Semiconductors & Semiconductor Equipment 1.7% | | | | |
| Cohu Inc. | | 1,000,000 | | 12,590,000 |
| MKS Instruments Inc. | | 695,300 | | 24,502,372 |
| | | | | 37,092,372 |
| Technology Hardware & Equipment 1.9% | | | | |
| Ingram Micro Inc., A | | 708,400 | | 21,096,152 |
| bRofin-Sinar Technologies Inc. | | 713,000 | | 20,648,480 |
| | | | | 41,744,632 |
| Utilities 3.2% | | | | |
| IDACORP Inc. | | 391,720 | | 26,186,482 |
| The Laclede Group Inc. | | 762,200 | | 44,642,054 |
| | | | | 70,828,536 |
| Total Common Stocks (Cost $1,663,928,315) | | | | 2,072,640,843 |
| |
| | | Principal | | |
| | | Amount | | |
| |
| Corporate Bonds (Cost $13,496,716) 0.5% | | | | |
| Energy 0.5% | | | | |
| Unit Corp., senior sub. note, 6.625%, 5/15/21 | $ | 13,927,000 | | 11,211,235 |
| Total Investments before Short Term Investments (Cost $1,677,425,031) | | | | 2,083,852,078 |
| | | Shares | | |
| |
| Short Term Investments 7.1% | | | | |
| Money Market Funds (Cost $141,887,127) 6.4% | | | | |
| b,dInstitutional Fiduciary Trust Money Market Portfolio | | 141,887,127 | | 141,887,127 |
| eInvestments from Cash Collateral Received for Loaned Securities 0.7% | | | | |
| Money Market Funds (Cost $14,250,000) 0.6% | | | | |
| b,dInstitutional Fiduciary Trust Money Market Portfolio | | 14,250,000 | | 14,250,000 |

FRANKLIN VALUE INVESTORS TRUST
STATEMENT OF INVESTMENTS
| | | | | |
| Franklin Small Cap Value Fund (continued) | | | | | |
| | | Principal Amount | | Value | |
| Short Term Investments (continued) | | | | | |
| fRepurchase Agreements (Cost $1,587,317) 0.1% | | | | | |
| Joint Repurchase Agreement, 0.07%, 11/02/15 (Maturity Value $1,587,326) | | | | | |
| RBS Securities Inc. | | | | | |
| Collateralized by U.S. Treasury Note, 0.184% - 3.375%, 8/15/16 - 8/15/21 | | | | | |
| (Valued at $1,619,064) | $ | 1,587,317 | $ | 1,587,317 | |
| Total Investments from Cash Collateral Received for Loaned Securities | | | | | |
| (Cost $15,837,317) | | | | 15,837,317 | |
| Total Investments (Cost $1,835,149,475) 101.5% | | | | 2,241,576,522 | |
| Other Assets, less Liabilities (1.5)% | | | | (33,327,657 | ) |
| Net Assets 100.0% | | | $ | 2,208,248,865 | |
aSee Note 8 regarding holdings of 5% voting securities.
bNon-income producing.
cA portion or all of the security is on loan at October 31, 2015. See Note 1(d).
dSee Note 3(f) regarding investments in affiliated management investment companies.
eSee Note 1(d) regarding securities on loan.
fSee Note 1(c) regarding joint repurchase agreements.
108 |
Annual Report | The accompanying notes are an integral part of these financial statements. franklintempleton.com
| | | | | | |
| | | | | FRANKLIN VALUE INVESTORS TRUST |
| |
| |
| |
| |
| Financial Statements | | | | | | |
| |
| Statements of Assets and Liabilities | | | | | | |
| October 31, 2015 | | | | | | |
| |
| | | Franklin All Cap | | Franklin Balance Sheet | | Franklin Large Cap |
| | | Value Fund | | Investment Fund | | Value Fund |
| Assets: | | | | | | |
| Investments in securities: | | | | | | |
| Cost - Unaffiliated issuers | $ | 40,000,195 | $ | 781,354,481 | $ | 155,088,100 |
| Cost - Non-controlled affiliates (Note 3f and 8) | | 6,094,257 | | 113,092,115 | | 7,732,885 |
| Total cost of investments | $ | 46,094,452 | $ | 894,446,596 | $ | 162,820,985 |
| Value - Unaffiliated issuers | $ | 44,098,686 | $ | 971,106,034 | $ | 199,273,244 |
| Value - Non-controlled affiliates (Note 3f and 8) | | 6,094,257 | | 109,895,280 | | 7,732,885 |
| Total value of investments | | 50,192,943 | | 1,081,001,314 | | 207,006,129 |
| Receivables: | | | | | | |
| Investment securities sold | | 293,975 | | — | | 209,996 |
| Capital shares sold | | 23,422 | | 449,428 | | 323,142 |
| Dividends and interest | | 27,441 | | 261,350 | | 130,899 |
| Affiliates | | 39,203 | | — | | — |
| Other assets | | 12 | | 254 | | 42 |
| Total assets | | 50,576,996 | | 1,081,712,346 | | 207,670,208 |
| Liabilities: | | | | | | |
| Payables: | | | | | | |
| Investment securities purchased | | 11,786 | | 757,462 | | 879,065 |
| Capital shares redeemed | | 133,833 | | 4,754,474 | | 271,819 |
| Management fees | | — | | 421,212 | | 128,599 |
| Distribution fees | | 14,164 | | 259,112 | | 63,886 |
| Transfer agent fees | | 14,852 | | 394,657 | | 51,584 |
| Accrued expenses and other liabilities | | 12,231 | | 82,928 | | 20,970 |
| Total liabilities | | 186,866 | | 6,669,845 | | 1,415,923 |
| Net assets, at value | $ | 50,390,130 | $ | 1,075,042,501 | $ | 206,254,285 |
| Net assets consist of: | | | | | | |
| Paid-in capital | $ | 42,957,143 | $ | 735,495,780 | $ | 144,796,335 |
| Undistributed net investment income | | 21,122 | | 4,314,901 | | 1,130,257 |
| Net unrealized appreciation (depreciation) | | 4,098,471 | | 186,554,718 | | 44,185,144 |
| Accumulated net realized gain (loss) | | 3,313,394 | | 148,677,102 | | 16,142,549 |
| Net assets, at value | $ | 50,390,130 | $ | 1,075,042,501 | $ | 206,254,285 |
| 109
franklintempleton.com The accompanying notes are an integral part of these financial statements. | Annual Report
| | | | | | | | |
| FRANKLIN VALUE INVESTORS TRUST | | | | | | | | |
| FINANCIAL STATEMENTS | | | | | | | | |
| |
| |
| Statements of Assets and Liabilities (continued) | | | | | | | | |
| October 31, 2015 | | | | | | | | |
| |
| | | Franklin All Cap | | | Franklin Balance Sheet | | | Franklin Large Cap |
| | | Value Fund | | | Investment Fund | | | Value Fund |
| Class A: | | | | | | | | |
| Net assets, at value | $ | 40,894,300 | $ | | 915,284,719 | $ | | 150,556,562 |
| Shares outstanding | | 3,444,090 | | | 22,845,320 | | | 8,431,488 |
| Net asset value per sharea | $ | 11.87 | | $ | 40.06 | | $ | 17.86 |
| Maximum offering price per share (net asset value per | | | | | | | | |
| share ÷ 94.25%) | $ | 12.59 | | $ | 42.50 | | $ | 18.95 |
| Class C: | | | | | | | | |
| Net assets, at value | $ | 6,520,976 | $ | | 73,184,646 | $ | | 36,825,150 |
| Shares outstanding | | 564,657 | | | 1,891,020 | | | 2,090,901 |
| Net asset value and maximum offering price per sharea | $ | 11.55 | | $ | 38.70 | | $ | 17.61 |
| Class R: | | | | | | | | |
| Net assets, at value | $ | 58,730 | $ | | 9,830,836 | $ | | 4,322,472 |
| Shares outstanding | | 4,954 | | | 245,401 | | | 244,006 |
| Net asset value and maximum offering price per share | $ | 11.86 | | $ | 40.06 | | $ | 17.71 |
| Class R6: | | | | | | | | |
| Net assets, at value | | — | $ | | 7,411,985 | $ | | 7,722,451 |
| Shares outstanding | | — | | | 180,322 | | | 433,401 |
| Net asset value and maximum offering price per share | | — | | $ | 41.10 | | $ | 17.82 |
| Advisor Class: | | | | | | | | |
| Net assets, at value | $ | 2,916,124 | $ | | 69,330,315 | $ | | 6,827,650 |
| Shares outstanding | | 244,170 | | | 1,687,827 | | | 383,327 |
| Net asset value and maximum offering price per share | $ | 11.94 | | $ | 41.08 | | $ | 17.81 |
aRedemption price is equal to net asset value less contingent deferred sales charges, if applicable.
110 |
Annual Report | The accompanying notes are an integral part of these financial statements. franklintempleton.com
| | | | | | | |
| | | | | | FRANKLIN VALUE INVESTORS TRUST |
| | | | | | FINANCIAL STATEMENTS |
| |
| |
| Statements of Assets and Liabilities (continued) | | | | | | | |
| October 31, 2015 | | | | | | | |
| |
| | | Franklin MicroCap | | | Franklin MidCap | | Franklin Small Cap |
| | | Value Fund | | | Value Fund | | Value Fund |
| Assets: | | | | | | | |
| Investments in securities: | | | | | | | |
| Cost - Unaffiliated issuers | $ | 201,590,430 | | $ | 137,783,470 | $ | 1,622,446,270 |
| Cost - Non-controlled affiliates (Note 3f and 8) | | 44,217,909 | | | 2,941,745 | | 211,115,888 |
| Cost - Repurchase agreements | | — | | | 907,003 | | 1,587,317 |
| Total cost of investments | $ | 245,808,339 | | $ | 141,632,218 | $ | 1,835,149,475 |
| Value - Unaffiliated issuers | $ | 285,440,705 | | $ | 153,187,059 | $ | 2,022,556,878 |
| Value - Non-controlled affiliates (Note 3f and 8) | | 58,456,746 | | | 2,941,745 | | 217,432,327 |
| Value - Repurchase agreements | | — | | | 907,003 | | 1,587,317 |
| Total value of investmentsa | | 343,897,451 | | | 157,035,807 | | 2,241,576,522 |
| Receivables: | | | | | | | |
| Investment securities sold | | 541,313 | | | — | | 1,294,777 |
| Capital shares sold | | 48,133 | | | 147,414 | | 1,533,113 |
| Dividends and interest | | 470 | | | 47,433 | | 1,126,662 |
| Other assets | | 78 | | | 30 | | 489 |
| Total assets | | 344,487,445 | | | 157,230,684 | | 2,245,531,563 |
| Liabilities: | | | | | | | |
| Payables: | | | | | | | |
| Investment securities purchased | | 205,629 | | | — | | 4,673,421 |
| Capital shares redeemed | | 162,711 | | | 352,649 | | 13,878,088 |
| Management fees | | 217,961 | | | 17,155 | | 1,072,073 |
| Distribution fees | | 54,174 | | | 46,852 | | 507,365 |
| Transfer agent fees | | 105,616 | | | 51,431 | | 1,159,072 |
| Payable upon return of securities loaned | | — | | | 907,003 | | 15,837,317 |
| Accrued expenses and other liabilities | | 29,609 | | | 21,342 | | 155,362 |
| Total liabilities | | 775,700 | | | 1,396,432 | | 37,282,698 |
| Net assets, at value | $ | 343,711,745 | | $ | 155,834,252 | $ | 2,208,248,865 |
| Net assets consist of: | | | | | | | |
| Paid-in capital | $ | 207,203,092 | | $ | 128,225,225 | $ | 1,586,945,888 |
| Undistributed net investment income (distributions in excess of | | | | | | | |
| net investment income) | | (391,259 | ) | | 147,654 | | 8,918,000 |
| Net unrealized appreciation (depreciation) | | 98,089,112 | | | 15,403,589 | | 406,425,747 |
| Accumulated net realized gain (loss) | | 38,810,800 | | | 12,057,784 | | 205,959,230 |
| Net assets, at value | $ | 343,711,745 | | $ | 155,834,252 | $ | 2,208,248,865 |
| |
| |
| |
| |
| aIncludes securities loaned | $ | — | | $ | 893,758 | $ | 15,785,962 |
| 111
franklintempleton.com The accompanying notes are an integral part of these financial statements. | Annual Report
| | | | | | | |
| FRANKLIN VALUE INVESTORS TRUST | | | | | | | |
| FINANCIAL STATEMENTS | | | | | | | |
| |
| |
| Statements of Assets and Liabilities (continued) | | | | | | | |
| October 31, 2015 | | | | | | | |
| |
| | | Franklin MicroCap | | | Franklin MidCap | | Franklin Small Cap |
| | | Value Fund | | | Value Fund | | Value Fund |
| Class A: | | | | | | | |
| Net assets, at value | $ | 258,143,285 | $ | | 127,043,302 | $ | 1,062,353,180 |
| Shares outstanding | | 7,846,046 | | | 8,344,614 | | 20,540,962 |
| Net asset value per sharea | $ | 32.90 | | $ | 15.22 | $ | 51.72 |
| Maximum offering price per share (net asset value per | | | | | | | |
| share ÷ 94.25%) | $ | 34.91 | | $ | 16.15 | $ | 54.88 |
| Class C: | | | | | | | |
| Net assets, at value | | — | $ | | 23,329,119 | $ | 229,118,993 |
| Shares outstanding | | — | | | 1,558,551 | | 4,852,379 |
| Net asset value and maximum offering price per sharea | | — | | $ | 14.97 | $ | 47.22 |
| Class R: | | | | | | | |
| Net assets, at value | | — | $ | | 755,383 | $ | 221,938,719 |
| Shares outstanding | | — | | | 49,729 | | 4,336,131 |
| Net asset value and maximum offering price per share | | — | | $ | 15.19 | $ | 51.18 |
| Class R6: | | | | | | | |
| Net assets, at value | $ | 18,030,524 | | | — | $ | 59,338,836 |
| Shares outstanding | | 544,856 | | | — | | 1,104,081 |
| Net asset value and maximum offering price per share | $ | 33.09 | | | — | $ | 53.75 |
| Advisor Class: | | | | | | | |
| Net assets, at value | $ | 67,537,936 | $ | | 4,706,448 | $ | 635,499,137 |
| Shares outstanding | | 2,046,299 | | | 307,310 | | 11,841,226 |
| Net asset value and maximum offering price per share | $ | 33.00 | | $ | 15.31 | $ | 53.67 |
aRedemption price is equal to net asset value less contingent deferred sales charges, if applicable.
112 |
Annual Report | The accompanying notes are an integral part of these financial statements. franklintempleton.com
| | | | | | | | | |
| | | | | | FRANKLIN VALUE INVESTORS TRUST | |
| | | | | | FINANCIAL STATEMENTS | |
| |
| |
| Statements of Operations | | | | | | | | | |
| for the year ended October 31, 2015 | | | | | | | | | |
| |
| | | Franklin All Cap | | | Franklin Balance Sheet | | | Franklin Large Cap | |
| | | Value Fund | | | Investment Fund | | | Value Fund | |
| Investment income: | | | | | | | | | |
| Dividends | $ | 767,128 | | $ | 17,599,640 | | $ | 4,768,365 | |
| Interest | | 19,716 | | | — | | | — | |
| Income from securities loaned | | — | | | 16,804 | | | — | |
| Total investment income | | 786,844 | | | 17,616,444 | | | 4,768,365 | |
| Expenses: | | | | | | | | | |
| Management fees (Note 3a) | | 417,150 | | | 5,954,065 | | | 1,641,772 | |
| Distribution fees: (Note 3c) | | | | | | | | | |
| Class A | | 130,319 | | | 2,657,602 | | | 455,313 | |
| Class C | | 75,726 | | | 839,604 | | | 390,200 | |
| Class R | | 338 | | | 57,855 | | | 23,427 | |
| Transfer agent fees: (Note 3e) | | | | | | | | | |
| Class A | | 107,403 | | | 1,962,492 | | | 304,061 | |
| Class C | | 18,252 | | | 154,997 | | | 74,516 | |
| Class R | | 161 | | | 21,359 | | | 8,911 | |
| Class R6 | | — | | | 238 | | | 137 | |
| Advisor Class | | 7,176 | | | 185,105 | | | 13,287 | |
| Custodian fees (Note 4) | | 783 | | | 14,116 | | | 1,887 | |
| Reports to shareholders | | 14,075 | | | 144,876 | | | 36,376 | |
| Registration and filing fees | | 68,123 | | | 164,465 | | | 82,287 | |
| Professional fees | | 69,637 | | | 92,972 | | | 60,213 | |
| Trustees’ fees and expenses | | 2,748 | | | 66,177 | | | 10,516 | |
| Other | | 5,201 | | | 78,071 | | | 7,119 | |
| Total expenses | | 917,092 | | | 12,393,994 | | | 3,110,022 | |
| Expenses waived/paid by affiliates (Note 3f and 3g) | | (182,546 | ) | | (122,723 | ) | | (6,261 | ) |
| Net expenses | | 734,546 | | | 12,271,271 | | | 3,103,761 | |
| Net investment income | | 52,298 | | | 5,345,173 | | | 1,664,604 | |
| Realized and unrealized gains (losses): | | | | | | | | | |
| Net realized gain (loss) from: | | | | | | | | | |
| Investments | | 3,345,014 | | | 149,299,996 | | | 16,143,087 | |
| Foreign currency transactions | | (2,940 | ) | | (29,246 | ) | | (5,275 | ) |
| Net realized gain (loss) | | 3,342,074 | | | 149,270,750 | | | 16,137,812 | |
| Net change in unrealized appreciation (depreciation) on: | | | | | | | | | |
| Investments | | (6,332,358 | ) | | (260,058,370 | ) | | (26,095,364 | ) |
| Translation of other assets and liabilities denominated in foreign | | | | | | | | | |
| currencies | | 29 | | | — | | | — | |
| Net change in unrealized appreciation (depreciation) | | (6,332,329 | ) | | (260,058,370 | ) | | (26,095,364 | ) |
| Net realized and unrealized gain (loss) | | (2,990,255 | ) | | (110,787,620 | ) | | (9,957,552 | ) |
| Net increase (decrease) in net assets resulting from operations | $ | (2,937,957 | ) | $ | (105,442,447 | ) | $ | (8,292,948 | ) |
| 113
franklintempleton.com The accompanying notes are an integral part of these financial statements. | Annual Report
| | | | | | | | | |
| FRANKLIN VALUE INVESTORS TRUST | | | | | | | | | |
| FINANCIAL STATEMENTS | | | | | | | | | |
| |
| |
| Statements of Operations (continued) | | | | | | | | | |
| for the year ended October 31, 2015 | | | | | | | | | |
| |
| | | Franklin MicroCap | | | Franklin MidCap | | | Franklin Small Cap | |
| | | Value Fund | | | Value Fund | | | Value Fund | |
| |
| Investment income: | | | | | | | | | |
| Dividends: | | | | | | | | | |
| Unaffiliated issuers | $ | 4,616,054 | | $ | 3,189,567 | | $ | 39,233,690 | |
| Non-controlled affiliates (Note 8) | | 208,159 | | | — | | | 760,352 | |
| Interest | | — | | | — | | | 918,116 | |
| Income from securities loaned | | 855 | | | 144,977 | | | 1,779,057 | |
| Total investment income | | 4,825,068 | | | 3,334,544 | | | 42,691,215 | |
| Expenses: | | | | | | | | | |
| Management fees (Note 3a) | | 2,991,254 | | | 1,540,449 | | | 14,372,044 | |
| Distribution fees: (Note 3c) | | | | | | | | | |
| Class A | | 735,085 | | | 379,859 | | | 3,422,981 | |
| Class C | | — | | | 247,029 | | | 2,516,473 | |
| Class R | | — | | | 4,647 | | | 1,269,653 | |
| Transfer agent fees: (Note 3e) | | | | | | | | | |
| Class A | | 460,525 | | | 323,059 | | | 3,076,771 | |
| Class C | | — | | | 60,751 | | | 654,833 | |
| Class R | | — | | | 2,276 | | | 659,119 | |
| Class R6 | | 386 | | | — | | | 7,441 | |
| Advisor Class | | 116,680 | | | 11,062 | | | 1,940,168 | |
| Custodian fees (Note 4) | | 3,470 | | | 1,416 | | | 33,624 | |
| Reports to shareholders | | 45,967 | | | 35,330 | | | 298,749 | |
| Registration and filing fees | | 69,631 | | | 66,628 | | | 186,401 | |
| Professional fees | | 71,328 | | | 60,757 | | | 116,255 | |
| Trustees’ fees and expenses | | 20,476 | | | 7,636 | | | 125,059 | |
| Other | | 10,746 | | | 6,003 | | | 35,306 | |
| Total expenses | | 4,525,548 | | | 2,746,902 | | | 28,714,877 | |
| Expenses waived/paid by affiliates (Note 3f and 3g) | | (22,325 | ) | | (412,706 | ) | | (159,494 | ) |
| Net expenses | | 4,503,223 | | | 2,334,196 | | | 28,555,383 | |
| Net investment income | | 321,845 | | | 1,000,348 | | | 14,135,832 | |
| Realized and unrealized gains (losses): | | | | | | | | | |
| Net realized gain (loss) from: | | | | | | | | | |
| Investments: | | | | | | | | | |
| Unaffiliated issuers | | 43,151,337 | | | 12,284,486 | | | 207,574,118 | |
| Non-controlled affiliates (Note 8) | | (4,339,337 | ) | | — | | | 264,116 | |
| Foreign currency transactions | | — | | | — | | | 99,490 | |
| Net realized gain (loss) | | 38,812,000 | | | 12,284,486 | | | 207,937,724 | |
| Net change in unrealized appreciation (depreciation) on: | | | | | | | | | |
| Investments | | (75,270,265 | ) | | (18,638,584 | ) | | (301,245,221 | ) |
| Translation of other assets and liabilities denominated in foreign | | | | | | | | | |
| currencies | | — | | | — | | | (662 | ) |
| Net change in unrealized appreciation (depreciation) | | (75,270,265 | ) | | (18,638,584 | ) | | (301,245,883 | ) |
| Net realized and unrealized gain (loss) | | (36,458,265 | ) | | (6,354,098 | ) | | (93,308,159 | ) |
| Net increase (decrease) in net assets resulting from operations | $ | (36,136,420 | ) | $ | (5,353,750 | ) | $ | (79,172,327 | ) |

| | | | | | | | | | | | |
| | | | | | FRANKLIN VALUE INVESTORS TRUST | |
| | | | | | | | | FINANCIAL STATEMENTS | |
| |
| |
| Statements of Changes in Net Assets | | | | | | | | | | | | |
| |
| | | | | | | | | Franklin Balance Sheet | |
| | | Franklin All Cap Value Fund | | | Investment Fund | |
| | | Year Ended October 31, | | | Year Ended October 31, | |
| | | 2015 | | | 2014 | | | 2015 | | | 2014 | |
| Increase (decrease) in net assets: | | | | | | | | | | | | |
| Operations: | | | | | | | | | | | | |
| Net investment income | $ | 52,298 | | $ | 24,181 | | $ | 5,345,173 | | $ | 13,009,506 | |
| Net realized gain (loss) | | 3,342,074 | | | 3,487,251 | | | 149,270,750 | | | 210,815,819 | |
| Net change in unrealized appreciation (depreciation) | | (6,332,329 | ) | | (575,215 | ) | | (260,058,370 | ) | | (121,868,345 | ) |
| Net increase (decrease) in net assets resulting | | | | | | | | | | | | |
| from operations | | (2,937,957 | ) | | 2,936,217 | | | (105,442,447 | ) | | 101,956,980 | |
| Distributions to shareholders from: | | | | | | | | | | | | |
| Net investment income: | | | | | | | | | | | | |
| Class A | | (33,783 | ) | | (50,259 | ) | | (3,957,412 | ) | | (14,959,798 | ) |
| Class C | | — | | | — | | | — | | | (589,599 | ) |
| Class R | | (5 | ) | | — | | | (1,756 | ) | | (165,042 | ) |
| Class R6 | | — | | | — | | | (57,404 | ) | | (89 | ) |
| Advisor Class | | (11,336 | ) | | (7,582 | ) | | (644,542 | ) | | (1,543,619 | ) |
| Net realized gains: | | | | | | | | | | | | |
| Class A | | (1,524,390 | ) | | — | | | (177,375,288 | ) | | (122,421,330 | ) |
| Class C | | (271,238 | ) | | — | | | (14,401,328 | ) | | (9,966,279 | ) |
| Class R | | (2,591 | ) | | — | | | (1,988,576 | ) | | (1,768,405 | ) |
| Class R6 | | — | | | — | | | (1,129,406 | ) | | (554 | ) |
| Advisor Class | | (96,641 | ) | | — | | | (15,940,901 | ) | | (10,518,510 | ) |
| Total distributions to shareholders | | (1,939,984 | ) | | (57,841 | ) | | (215,496,613 | ) | | (161,933,225 | ) |
| Capital share transactions: (Note 2) | | | | | | | | | | | | |
| Class A | | (1,843,100 | ) | | 7,271,346 | | | (39,456,578 | ) | | 15,929,679 | |
| Class C | | (1,075,218 | ) | | 2,188,422 | | | (1,325,175 | ) | | 4,325,524 | |
| Class R | | (14,425 | ) | | 30,560 | | | (1,483,804 | ) | | (2,932,345 | ) |
| Class R6 | | — | | | — | | | 1,316,064 | | | 7,784,596 | |
| Advisor Class | | 208,266 | | | 418,274 | | | (18,629,141 | ) | | 11,500,739 | |
| Total capital share transactions | | (2,724,477 | ) | | 9,908,602 | | | (59,578,634 | ) | | 36,608,193 | |
| Net increase (decrease) in net assets | | (7,602,418 | ) | | 12,786,978 | | | (380,517,694 | ) | | (23,368,052 | ) |
| Net assets: | | | | | | | | | | | | |
| Beginning of year | | 57,992,548 | | | 45,205,570 | | | 1,455,560,195 | | | 1,478,928,247 | |
| End of year | $ | 50,390,130 | | $ | 57,992,548 | | $ | 1,075,042,501 | | $ | 1,455,560,195 | |
| Undistributed net investment income included in net | | | | | | | | | | | | |
| assets: | | | | | | | | | | | | |
| End of year | $ | 21,122 | | $ | — | | $ | 4,314,901 | | $ | 3,640,720 | |

| | | | | | | | | | | | |
| FRANKLIN VALUE INVESTORS TRUST | | | | | | | | | | | | |
| FINANCIAL STATEMENTS | | | | | | | | | | | | |
| |
| |
| Statements of Changes in Net Assets (continued) | | | | | | | | | | | | |
| |
| | | Franklin Large Cap Value Fund | | | Franklin MicroCap Value Fund | |
| | | Year Ended October 31, | | | Year Ended October 31, | |
| | | 2015 | | | 2014 | | | 2015 | | | 2014 | |
| Increase (decrease) in net assets: | | | | | | | | | | | | |
| Operations: | | | | | | | | | | | | |
| Net investment income (loss) | $ | 1,664,604 | | $ | 1,051,987 | | $ | 321,845 | | $ | (457,261 | ) |
| Net realized gain (loss) | | 16,137,812 | | | 4,197,297 | | | 38,812,000 | | | 41,797,793 | |
| Net change in unrealized appreciation | | | | | | | | | | | | |
| (depreciation) | | (26,095,364 | ) | | 18,971,300 | | | (75,270,265 | ) | | (24,252,988 | ) |
| Net increase (decrease) in net assets resulting | | | | | | | | | | | | |
| from operations | | (8,292,948 | ) | | 24,220,584 | | | (36,136,420 | ) | | 17,087,544 | |
| Distributions to shareholders from: | | | | | | | | | | | | |
| Net investment income: | | | | | | | | | | | | |
| Class A | | (918,042 | ) | | (792,172 | ) | | — | | | (418,914 | ) |
| Class R | | (16,051 | ) | | (14,847 | ) | | — | | | — | |
| Class R6 | | (77,645 | ) | | (63 | ) | | — | | | (257,885 | ) |
| Advisor Class | | (59,539 | ) | | (88,326 | ) | | — | | | (343,252 | ) |
| Net realized gains: | | | | | | | | | | | | |
| Class A | | (2,085,669 | ) | | — | | | (31,272,031 | ) | | (22,065,456 | ) |
| Class C | | (507,761 | ) | | — | | | — | | | — | |
| Class R | | (61,773 | ) | | — | | | — | | | — | |
| Class R6 | | (97,927 | ) | | — | | | (2,229,315 | ) | | (3,559,372 | ) |
| Advisor Class | | (88,111 | ) | | — | | | (7,981,634 | ) | | (6,844,604 | ) |
| Total distributions to shareholders | | (3,912,518 | ) | | (895,408 | ) | | (41,482,980 | ) | | (33,489,483 | ) |
| Capital share transactions: (Note 2) | | | | | | | | | | | | |
| Class A | | (3,971,569 | ) | | 7,768,816 | | | (29,885,991 | ) | | (13,690,618 | ) |
| Class C | | (134,925 | ) | | 1,832,820 | | | — | | | — | |
| Class R | | (255,021 | ) | | (272,749 | ) | | — | | | — | |
| Class R6 | | 632,155 | | | 7,059,112 | | | (2,944,946 | ) | | (31,539,116 | ) |
| Advisor Class | | 359,608 | | | (4,487,125 | ) | | (7,557,529 | ) | | (23,300,969 | ) |
| Total capital share transactions | | (3,369,752 | ) | | 11,900,874 | | | (40,388,466 | ) | | (68,530,703 | ) |
| Net increase (decrease) in net assets | | (15,575,218 | ) | | 35,226,050 | | | (118,007,866 | ) | | (84,932,642 | ) |
| Net assets: | | | | | | | | | | | | |
| Beginning of year | | 221,829,503 | | | 186,603,453 | | | 461,719,611 | | | 546,652,253 | |
| End of year | $ | 206,254,285 | | $ | 221,829,503 | | $ | 343,711,745 | | $ | 461,719,611 | |
| Undistributed net investment income (distributions | | | | | | | | | | | | |
| in excess of net investment income) included in | | | | | | | | | | | | |
| net assets: | | | | | | | | | | | | |
| End of year | $ | 1,130,257 | | $ | 542,205 | | $ | (391,259 | ) | $ | (1,208,938 | ) |

| | | | | | | | | | | | |
| | | | | | FRANKLIN VALUE INVESTORS TRUST | |
| | | | | | | | | FINANCIAL STATEMENTS | |
| |
| |
| Statements of Changes in Net Assets (continued) | | | | | | | | | | | | |
| |
| | | Franklin MidCap Value Fund | | | Franklin Small Cap Value Fund | |
| | | Year Ended October 31, | | | Year Ended October 31, | |
| | | 2015 | | | 2014 | | | 2015 | | | 2014 | |
| Increase (decrease) in net assets: | | | | | | | | | | | | |
| Operations: | | | | | | | | | | | | |
| Net investment income | $ | 1,000,348 | | $ | 588,940 | | $ | 14,135,832 | | $ | 6,938,106 | |
| Net realized gain (loss) | | 12,284,486 | | | 9,267,971 | | | 207,937,724 | | | 230,265,221 | |
| Net change in unrealized appreciation | | | | | | | | | | | | |
| (depreciation) | | (18,638,584 | ) | | 3,530,984 | | | (301,245,883 | ) | | (148,290,867 | ) |
| Net increase (decrease) in net assets resulting | | | | | | | | | | | | |
| from operations | | (5,353,750 | ) | | 13,387,895 | | | (79,172,327 | ) | | 88,912,460 | |
| Distributions to shareholders from: | | | | | | | | | | | | |
| Net investment income: | | | | | | | | | | | | |
| Class A | | (866,505 | ) | | (604,249 | ) | | (2,585,362 | ) | | (5,158,667 | ) |
| Class C | | — | | | (8,906 | ) | | — | | | (351 | ) |
| Class R | | (3,785 | ) | | (3,235 | ) | | (8,002 | ) | | (602,165 | ) |
| Class R6 | | — | | | — | | | (298,630 | ) | | (156 | ) |
| Advisor Class | | (42,471 | ) | | (30,235 | ) | | (4,065,275 | ) | | (4,460,827 | ) |
| Net realized gains: | | | | | | | | | | | | |
| Class A | | (2,473,197 | ) | | — | | | (110,504,165 | ) | | (56,728,963 | ) |
| Class C | | (466,142 | ) | | — | | | (24,786,735 | ) | | (12,277,329 | ) |
| Class R | | (18,353 | ) | | — | | | (23,952,774 | ) | | (12,617,850 | ) |
| Class R6 | | — | | | — | | | (3,448,309 | ) | | (802 | ) |
| Advisor Class | | (84,941 | ) | | — | | | (67,827,243 | ) | | (29,783,762 | ) |
| Total distributions to shareholders | | (3,955,394 | ) | | (646,625 | ) | | (237,476,495 | ) | | (121,630,872 | ) |
| Capital share transactions: (Note 2) | | | | | | | | | | | | |
| Class A | | 6,132,968 | | | 15,373,299 | | | (82,172,729 | ) | | 86,659,167 | |
| Class C | | 853,401 | | | (94,542 | ) | | (2,782,028 | ) | | 23,120,327 | |
| Class R | | (300,745 | ) | | 12,347 | | | (26,620,260 | ) | | 11,846,774 | |
| Class R6 | | — | | | — | | | 31,865,969 | | | 33,767,749 | |
| Advisor Class | | 577,641 | | | 420,748 | | | (88,579,327 | ) | | 171,802,693 | |
| Total capital share transactions | | 7,263,265 | | | 15,711,852 | | | (168,288,375 | ) | | 327,196,710 | |
| Net increase (decrease) in net assets | | (2,045,879 | ) | | 28,453,122 | | | (484,937,197 | ) | | 294,478,298 | |
| Net assets: | | | | | | | | | | | | |
| Beginning of year | | 157,880,131 | | | 129,427,009 | | | 2,693,186,062 | | | 2,398,707,764 | |
| End of year | $ | 155,834,252 | | $ | 157,880,131 | | $ | 2,208,248,865 | | $ | 2,693,186,062 | |
| Undistributed net investment income (distributions | | | | | | | | | | | | |
| in excess of net investment income) included in | | | | | | | | | | | | |
| net assets: | | | | | | | | | | | | |
| End of year | $ | 147,654 | | $ | 202,317 | | $ | 8,918,000 | | $ | (166,846 | ) |

FRANKLIN VALUE INVESTORS TRUST
Notes to Financial Statements
1. Organization and Significant Accounting Policies
Franklin Value Investors Trust (Trust) is registered under the Investment Company Act of 1940 (1940 Act) as an open-end management investment company, consisting of six funds (Funds) and applies the specialized accounting and reporting guidance in U.S. Generally Accepted Accounting Principles (U.S. GAAP). The classes of shares offered within each of the Funds are indicated below. Each class of shares differs by its initial sales load, contingent deferred sales charges, voting rights on matters affecting a single class, its exchange privilege and fees primarily due to differing arrangements for distribution and transfer agent fees.
|
| Class A, Class R6 & Advisor Class |
| Franklin MicroCap Value Funda |
| Class A, Class C, Class R & Advisor Class |
| Franklin All Cap Value Fundb |
| Franklin MidCap Value Fund |
| Class A, Class C, Class R, Class R6 & Advisor Class |
| Franklin Balance Sheet Investment Fund |
| Franklin Large Cap Value Fund |
| Franklin Small Cap Value Fund |
aFranklin MicroCap Value Fund was closed to new investors with limited
exceptions effective January 2004, and has remained closed except for two
days in mid-February 2013, when the Fund was opened on a limited basis.
bEffective December 10, 2015, Franklin All Cap Value Fund will close to all
new investments (with limited exceptions), in preparation for a proposed Fund
reorganization subject to shareholder approval.
The following summarizes the Funds’ significant accounting policies.
a. Financial Instrument Valuation
The Funds’ investments in financial instruments are carried at fair value daily. Fair value is the price that would be received to sell an asset or paid to transfer a liability in an orderly transaction between market participants on the measurement date. The Funds calculate the net asset value (NAV) per share as of 4 p.m. Eastern time each day the New York Stock Exchange (NYSE) is open for trading. Under compliance policies and procedures approved by the Trust’s Board of Trustees (the Board), the Funds’ administrator has responsibility for oversight of valuation, including leading the cross-functional Valuation and Liquidity Oversight Committee (VLOC). The VLOC provides administration and oversight of the Funds’ valuation policies and procedures, which are approved annually by the Board. Among other things, these procedures allow the Funds to utilize independent pricing services, quotations from
securities and financial instrument dealers, and other market sources to determine fair value.
Equity securities listed on an exchange or on the NASDAQ National Market System are valued at the last quoted sale price or the official closing price of the day, respectively. Foreign equity securities are valued as of the close of trading on the foreign stock exchange on which the security is primarily traded or as of 4 p.m. Eastern time, whichever is earlier. The value is then converted into its U.S. dollar equivalent at the foreign exchange rate in effect at 4 p.m. Eastern time on the day that the value of the security is determined. Over-the-counter (OTC) securities are valued within the range of the most recent quoted bid and ask prices. Securities that trade in multiple markets or on multiple exchanges are valued according to the broadest and most representative market. Certain equity securities are valued based upon fundamental characteristics or relationships to similar securities.
Debt securities generally trade in the OTC market rather than on a securities exchange. The Funds’ pricing services use multiple valuation techniques to determine fair value. In instances where sufficient market activity exists, the pricing services may utilize a market-based approach through which quotes from market makers are used to determine fair value. In instances where sufficient market activity may not exist or is limited, the pricing services also utilize proprietary valuation models which may consider market characteristics such as benchmark yield curves, credit spreads, estimated default rates, anticipated market interest rate volatility, coupon rates, anticipated timing of principal repayments, underlying collateral, and other unique security features in order to estimate the relevant cash flows, which are then discounted to calculate the fair value.
Investments in open-end mutual funds are valued at the closing NAV. Repurchase agreements are valued at cost, which approximates fair value.
The Funds have procedures to determine the fair value of financial instruments for which market prices are not reliable or readily available. Under these procedures, the VLOC convenes on a regular basis to review such financial instruments and considers a number of factors, including significant unobservable valuation inputs, when arriving at fair value. The VLOC primarily employs a market-based approach which may use related or comparable assets or liabilities, recent transactions, market multiples, book values, and other relevant information for the investment to determine the fair value of the investment. An income-based valuation approach may also
118 |
Annual Report franklintempleton.com
FRANKLIN VALUE INVESTORS TRUST
NOTES TO FINANCIAL STATEMENTS
be used in which the anticipated future cash flows of the investment are discounted to calculate fair value. Discounts may also be applied due to the nature or duration of any restrictions on the disposition of the investments. Due to the inherent uncertainty of valuations of such investments, the fair values may differ significantly from the values that would have been used had an active market existed. The VLOC employs various methods for calibrating these valuation approaches including a regular review of key inputs and assumptions, transactional back-testing or disposition analysis, and reviews of any related market activity.
Trading in securities on foreign securities stock exchanges and OTC markets may be completed before 4 p.m. Eastern time. In addition, trading in certain foreign markets may not take place on every NYSE business day. Occasionally, events occur between the time at which trading in a foreign security is completed and the close of the NYSE that might call into question the reliability of the value of a portfolio security held by the Fund. As a result, differences may arise between the value of the Funds’ portfolio securities as determined at the foreign market close and the latest indications of value at the close of the NYSE. In order to minimize the potential for these differences, the VLOC monitors price movements following the close of trading in foreign stock markets through a series of country specific market proxies (such as baskets of American Depositary Receipts, futures contracts and exchange traded funds). These price movements are measured against established trigger thresholds for each specific market proxy to assist in determining if an event has occurred that may call into question the reliability of the values of the foreign securities held by the Funds. If such an event occurs, the securities may be valued using fair value procedures, which may include the use of independent pricing services.
When the last day of the reporting period is a non-business day, certain foreign markets may be open on those days that the NYSE is closed, which could result in differences between the value of the Funds’ portfolio securities on the last business day and the last calendar day of the reporting period. Any significant security valuation changes due to an open foreign market are adjusted and reflected by the Funds for financial reporting purposes.
b. Foreign Currency Translation
Portfolio securities and other assets and liabilities denominated in foreign currencies are translated into U.S. dollars based on the exchange rate of such currencies against U.S. dollars on the
date of valuation. The Funds may enter into foreign currency exchange contracts to facilitate transactions denominated in a foreign currency. Purchases and sales of securities, income and expense items denominated in foreign currencies are translated into U.S. dollars at the exchange rate in effect on the transaction date. Portfolio securities and assets and liabilities denominated in foreign currencies contain risks that those currencies will decline in value relative to the U.S. dollar. Occasionally, events may impact the availability or reliability of foreign exchange rates used to convert the U.S. dollar equivalent value. If such an event occurs, the foreign exchange rate will be valued at fair value using procedures established and approved by the Board.
The Funds do not separately report the effect of changes in foreign exchange rates from changes in market prices on securities held. Such changes are included in net realized and unrealized gain or loss from investments in the Statements of Operations.
Realized foreign exchange gains or losses arise from sales of foreign currencies, currency gains or losses realized between the trade and settlement dates on securities transactions and the difference between the recorded amounts of dividends, interest, and foreign withholding taxes and the U.S. dollar equivalent of the amounts actually received or paid. Net unrealized foreign exchange gains and losses arise from changes in foreign exchange rates on foreign denominated assets and liabilities other than investments in securities held at the end of the reporting period.
c. Joint Repurchase Agreements
Certain Funds enter into a joint repurchase agreement whereby their uninvested cash balance is deposited into a joint cash account with other funds managed by the investment manager or an affiliate of the investment manager and is used to invest in one or more repurchase agreements. The value and face amount of the joint repurchase agreement are allocated to the funds based on their pro-rata interest. A repurchase agreement is accounted for as a loan by the Fund to the seller, collateralized by securities which are delivered to the Funds’ custodian. The fair value, including accrued interest, of the initial collateralization is required to be at least 102% of the dollar amount invested by the funds, with the value of the underlying securities marked to market daily to maintain coverage of at least 100%. Repurchase agreements are subject to the terms of Master Repurchase Agreements (MRAs) with approved coun-terparties (sellers). The MRAs contain various provisions, including but not limited to events of default and maintenance of collateral for repurchase agreements. In the event of default
| 119
franklintempleton.com Annual Report
FRANKLIN VALUE INVESTORS TRUST
NOTES TO FINANCIAL STATEMENTS
1. Organization and Significant Accounting
Policies (continued)
c. Joint Repurchase Agreements (continued)
by either the seller or the Funds, certain MRAs may permit the non-defaulting party to net and close-out all transactions, if any, traded under such agreements. The Funds may sell securities they hold as collateral and apply the proceeds towards the repurchase price and any other amounts owed by the seller to the Funds in the event of default by the seller. This could involve costs or delays in addition to a loss on the securities if their value falls below the repurchase price owed by the seller. The joint repurchase agreement held by the Funds at year end, as indicated in the Statements of Investments, had been entered into on October 30, 2015.
d. Securities Lending
Certain Funds participate in an agency based securities lending program to earn additional income. The Funds receive cash collateral against the loaned securities in an amount equal to at least 102% of the fair value of the loaned securities. Collateral is maintained over the life of the loan in an amount not less than 100% of the fair value of loaned securities, as determined at the close of Fund business each day; any additional collateral required due to changes in security values is delivered to the Fund on the next business day. The collateral is deposited into a joint cash account with other funds and is used to invest in a money market fund managed by Franklin Advisers, Inc., an affiliate of the Funds, and/or a joint repurchase agreement as indicated in the Statement of Investments. The total cash collateral received at year end was $907,003 and $15,837,317 for Franklin MidCap Value Fund and Franklin Small Cap Value Fund, respectively. The Fund may receive income from the investment of cash collateral, in addition to lending fees and rebates paid by the borrower. Income from securities loaned is reported separately in the Statements of Operations. The Funds bear the market risk with respect to the collateral investment, securities loaned, and the risk that the agent may default on its obligations to the Funds. If the borrower defaults on its obligation to return the securities loaned, the Funds have the right to repurchase the securities in the open market using the collateral received. The securities lending agent has agreed to indemnify the Fund in the event of default by a third party borrower.
e. Income and Deferred Taxes
It is each Fund’s policy to qualify as a regulated investment company under the Internal Revenue Code. Each Fund intends to distribute to shareholders substantially all of its taxable
income and net realized gains to relieve it from federal income and excise taxes. As a result, no provision for U.S. federal income taxes is required.
The Funds may be subject to foreign taxation related to income received, capital gains on the sale of securities and certain foreign currency transactions in the foreign jurisdictions in which the Funds invest. Foreign taxes, if any, are recorded based on the tax regulations and rates that exist in the foreign markets in which the Funds invest. When a capital gain tax is determined to apply, the Funds record an estimated deferred tax liability in an amount that would be payable if the securities were disposed of on the valuation date. As a result of several court cases, in certain countries across the European Union, Franklin Balance Sheet Investment Fund has filed additional tax reclaims for previously withheld taxes on dividends earned in those countries. These additional filings are subject to various administrative proceedings by the local jurisdictions’ tax authorities within the European Union, as well as a number of related judicial proceedings. At this time, uncertainty exists as to the ultimate resolution of these proceedings, the likelihood of receipt of these reclaims, and the potential timing of payment, and accordingly, no amounts are reflected in the financial statements.
Each Fund recognizes the tax benefits of uncertain tax positions only when the position is “more likely than not” to be sustained upon examination by the tax authorities based on the technical merits of the tax position. As of October 31, 2015, and for all open tax years, each Fund has determined that no liability for unrecognized tax benefits is required in each Fund’s financial statements related to uncertain tax positions taken on a tax return (or expected to be taken on future tax returns). Open tax years are those that remain subject to examination and are based on each tax jurisdiction’s statute of limitation.
f. Security Transactions, Investment Income, Expenses and Distributions
Security transactions are accounted for on trade date. Realized gains and losses on security transactions are determined on a specific identification basis. Interest income and estimated expenses are accrued daily. Dividend income is recorded on the ex-dividend date except for certain dividends from foreign securities where the dividend rate is not available. In such cases, the dividend is recorded as soon as the information is received by the Funds. Distributions to shareholders are recorded on the ex-dividend date and are determined according to income tax regulations (tax basis). Distributable earnings determined on a tax basis may differ from earnings recorded in accordance with
120 |
Annual Report franklintempleton.com
FRANKLIN VALUE INVESTORS TRUST
NOTES TO FINANCIAL STATEMENTS
U.S. GAAP. These differences may be permanent or temporary. Permanent differences are reclassified among capital accounts to reflect their tax character. These reclassifications have no impact on net assets or the results of operations. Temporary differences are not reclassified, as they may reverse in subsequent periods.
Common expenses incurred by the Trust are allocated among the Funds based on the ratio of net assets of each Fund to the combined net assets of the Trust. Fund specific expenses are charged directly to the fund that incurred the expense.
Realized and unrealized gains and losses and net investment income, not including class specific expenses, are allocated daily to each class of shares based upon the relative proportion of net assets of each class. Differences in per share distributions, by class, are generally due to differences in class specific expenses.
g. Accounting Estimates
The preparation of financial statements in accordance with U.S. GAAP requires management to make estimates and assumptions that affect the reported amounts of assets and liabilities at the date of the financial statements and the amounts of income and expenses during the reporting period. Actual results could differ from those estimates.
h. Guarantees and Indemnifications
Under the Trust’s organizational documents, its officers and trustees are indemnified by the Trust against certain liabilities arising out of the performance of their duties to the Trust. Additionally, in the normal course of business, the Trust, on behalf of the Funds, enters into contracts with service providers that contain general indemnification clauses. The Trust’s maximum exposure under these arrangements is unknown as this would involve future claims that may be made against the Trust that have not yet occurred. Currently, the Trust expects the risk of loss to be remote.
2. Shares of Beneficial Interest
At October 31, 2015, there were an unlimited number of shares authorized ($0.01 par value). Transactions in the Funds’ shares were as follows:
| | | | | | | | | | |
| | | | | | | Franklin Balance Sheet | |
| | Franklin All Cap Value Fund | | Investment Fund | |
| | Shares | | | Amount | | Shares | | | Amount | |
| |
| Class A Shares: | | | | | | | | | | |
| Year ended October 31, 2015 | | | | | | | | | | |
| Shares sold | 749,243 | | $ | 9,375,692 | | 2,982,041 | | $ | 127,746,082 | |
| Shares issued in reinvestment of distributions | 124,349 | | | 1,489,699 | | 4,080,647 | | | 169,142,832 | |
| Shares redeemed | (1,016,728 | ) | | (12,708,491 | ) | (7,922,471 | ) | | (336,345,492 | ) |
| Net increase (decrease) | (143,136 | ) | $ | (1,843,100 | ) | (859,783 | ) | $ | (39,456,578 | ) |
| Year ended October 31, 2014 | | | | | | | | | | |
| Shares sold | 1,386,632 | | $ | 17,898,876 | | 5,393,871 | | $ | 277,382,597 | |
| Shares issued in reinvestment of distributions | 3,879 | | | 48,353 | | 2,595,569 | | | 128,610,432 | |
| Shares redeemed | (829,707 | ) | | (10,675,883 | ) | (7,560,225 | ) | | (390,063,350 | ) |
| Net increase (decrease) | 560,804 | | $ | 7,271,346 | | 429,215 | | $ | 15,929,679 | |
| Class C Shares: | | | | | | | | | | |
| Year ended October 31, 2015 | | | | | | | | | | |
| Shares sold | 107,132 | | $ | 1,313,991 | | 190,088 | | $ | 7,865,985 | |
| Shares issued in reinvestment of distributions | 22,426 | | | 263,054 | | 350,650 | | | 14,131,204 | |
| Shares redeemed | (214,779 | ) | | (2,652,263 | ) | (567,025 | ) | | (23,322,364 | ) |
| Net increase (decrease) | (85,221 | ) | $ | (1,075,218 | ) | (26,287 | ) | $ | (1,325,175 | ) |
| 121
franklintempleton.com Annual Report
FRANKLIN VALUE INVESTORS TRUST
NOTES TO FINANCIAL STATEMENTS
| | | | | | | | | | |
| 2. Shares of Beneficial Interest (continued) | | | | | | | | | | |
| | | | | | | Franklin Balance Sheet | |
| | Franklin All Cap Value Fund | | Investment Fund | |
| | Shares | | | Amount | | Shares | | | Amount | |
| |
| Class C Shares: (continued) | | | | | | | | | | |
| Year ended October 31, 2014 | | | | | | | | | | |
| Shares sold | 317,351 | | $ | 4,023,681 | | 344,205 | | $ | 17,505,580 | |
| Shares issued in reinvestment of distributions | — | | | — | | 212,198 | | | 10,310,697 | |
| Shares redeemed | (144,365 | ) | | (1,835,259 | ) | (466,983 | ) | | (23,490,753 | ) |
| Net increase (decrease) | 172,986 | | $ | 2,188,422 | | 89,420 | | $ | 4,325,524 | |
| Class R Shares: | | | | | | | | | | |
| Year ended October 31, 2015 | | | | | | | | | | |
| Shares sold | 966 | | $ | 12,072 | | 43,924 | | $ | 1,888,602 | |
| Shares issued in reinvestment of distributions | 216 | | | 2,596 | | 47,914 | | | 1,990,332 | |
| Shares redeemed | (2,289 | ) | | (29,093 | ) | (123,440 | ) | | (5,362,738 | ) |
| Net increase (decrease) | (1,107 | ) | $ | (14,425 | ) | (31,602 | ) | $ | (1,483,804 | ) |
| Year ended October 31, 2014 | | | | | | | | | | |
| Shares sold | 2,312 | | $ | 30,678 | | 47,690 | | $ | 2,467,107 | |
| Shares issued in reinvestment of distributions | — | | | — | | 38,981 | | | 1,933,447 | |
| Shares redeemed | (9 | ) | | (118 | ) | (143,473 | ) | | (7,332,899 | ) |
| Net increase (decrease) | 2,303 | | $ | 30,560 | | (56,802 | ) | $ | (2,932,345 | ) |
| Class R6 Shares: | | | | | | | | | | |
| Year ended October 31, 2015 | | | | | | | | | | |
| Shares sold | | | | | | 82,914 | | $ | 3,565,508 | |
| Shares redeemed | | | | | | (51,792 | ) | | (2,249,444 | ) |
| Net increase (decrease) | | | | | | 31,122 | | $ | 1,316,064 | |
| Year ended October 31, 2014 | | | | | | | | | | |
| Shares sold | | | | | | 167,902 | | $ | 8,761,887 | |
| Shares redeemed | | | | | | (18,807 | ) | | (977,291 | ) |
| Net increase (decrease) | | | | | | 149,095 | | $ | 7,784,596 | |
| Advisor Class Shares: | | | | | | | | | | |
| Year ended October 31, 2015 | | | | | | | | | | |
| Shares sold | 34,167 | | $ | 426,868 | | 962,485 | | $ | 40,938,747 | |
| Shares issued in reinvestment of distributions | 8,454 | | | 101,619 | | 382,991 | | | 16,242,641 | |
| Shares redeemed | (25,999 | ) | | (320,221 | ) | (1,845,642 | ) | | (75,810,529 | ) |
| Net increase (decrease) | 16,622 | | $ | 208,266 | | (500,166 | ) | $ | (18,629,141 | ) |
| Year ended October 31, 2014 | | | | | | | | | | |
| Shares sold | 62,164 | | $ | 825,270 | | 536,829 | | $ | 28,174,157 | |
| Shares issued in reinvestment of distributions | 597 | | | 7,459 | | 233,789 | | | 11,811,029 | |
| Shares redeemed | (31,426 | ) | | (414,455 | ) | (543,326 | ) | | (28,484,447 | ) |
| Net increase (decrease) | 31,335 | | $ | 418,274 | | 227,292 | | $ | 11,500,739 | |
122 |
Annual Report franklintempleton.com
| | | | | | | | | | | |
| | | | | | FRANKLIN VALUE INVESTORS TRUST | |
| | | | | | NOTES TO FINANCIAL STATEMENTS | |
| |
| |
| |
| |
| | Franklin Large Cap Value Fund | | Franklin MicroCap Value Fund | |
| | Shares | | | Amount | | Shares | | | Amount | |
| |
| Class A Shares: | | | | | | | | | | | |
| Year ended October 31, 2015 | | | | | | | | | | | |
| Shares sold | 1,528,813 | | $ | 28,241,217 | | 324,987 | | $ | 11,261,598 | |
| Shares issued in reinvestment of distributions | 156,111 | | | | 2,813,128 | | 882,953 | | | 29,834,976 | |
| Shares redeemed | (1,895,152 | ) | | (35,025,914 | ) | (2,058,848 | ) | | (70,982,565 | ) |
| Net increase (decrease) | (210,228 | ) | | $ | (3,971,569 | ) | (850,908 | ) | $ | (29,885,991 | ) |
| Year ended October 31, 2014 | | | | | | | | | | | |
| Shares sold | 2,164,475 | | $ | 38,944,872 | | 615,494 | | $ | 24,566,846 | |
| Shares issued in reinvestment of distributions | 43,164 | | | | 738,121 | | 543,454 | | | 21,455,549 | |
| Shares redeemed | (1,776,504 | ) | | (31,914,177 | ) | (1,507,287 | ) | | (59,713,013 | ) |
| Net increase (decrease) | 431,135 | | | $ | 7,768,816 | | (348,339 | ) | $ | (13,690,618 | ) |
| Class C Shares: | | | | | | | | | | | |
| Year ended October 31, 2015 | | | | | | | | | | | |
| Shares sold | 513,908 | | | $ | 9,421,096 | | | | | | |
| Shares issued in reinvestment of distributions | 26,467 | | | | 473,494 | | | | | | |
| Shares redeemed | (550,438 | ) | | (10,029,515 | ) | | | | | |
| Net increase (decrease) | (10,063 | ) | | $ | (134,925 | ) | | | | | |
| Year ended October 31, 2014 | | | | | | | | | | | |
| Shares sold | 464,312 | | | $ | 8,272,177 | | | | | | |
| Shares redeemed | (361,284 | ) | | | (6,439,357 | ) | | | | | |
| Net increase (decrease) | 103,028 | | | $ | 1,832,820 | | | | | | |
| Class R Shares: | | | | | | | | | | | |
| Year ended October 31, 2015 | | | | | | | | | | | |
| Shares sold | 48,533 | | | $ | 884,334 | | | | | | |
| Shares issued in reinvestment of distributions | 4,341 | | | | 77,744 | | | | | | |
| Shares redeemed | (65,943 | ) | | | (1,217,099 | ) | | | | | |
| Net increase (decrease) | (13,069 | ) | | $ | (255,021 | ) | | | | | |
| Year ended October 31, 2014 | | | | | | | | | | | |
| Shares sold | 72,518 | | | $ | 1,283,689 | | | | | | |
| Shares issued in reinvestment of distributions | 873 | | | | 14,840 | | | | | | |
| Shares redeemed | (87,579 | ) | | | (1,571,278 | ) | | | | | |
| Net increase (decrease) | (14,188 | ) | | $ | (272,749 | ) | | | | | |
| Class R6 Shares: | | | | | | | | | | | |
| Year ended October 31, 2015 | | | | | | | | | | | |
| Shares sold | 170,683 | | | $ | 3,154,787 | | 114,444 | | $ | 3,929,258 | |
| Shares issued in reinvestment of distributions | — | | | | — | | 8,160 | | | 276,364 | |
| Shares redeemed | (136,630 | ) | | | (2,522,632 | ) | (204,167 | ) | | (7,150,568 | ) |
| Net increase (decrease) | 34,053 | | | $ | 632,155 | | (81,563 | ) | $ | (2,944,946 | ) |
| Year ended October 31, 2014 | | | | | | | | | | | |
| Shares sold | 449,657 | | | $ | 7,978,258 | | 740,076 | | $ | 29,481,275 | |
| Shares issued in reinvestment of distributions | — | | | | — | | 96,860 | | | 3,817,257 | |
| Shares redeemed | (50,653 | ) | | | (919,146 | ) | (1,663,083 | ) | | (64,837,648 | ) |
| Net increase (decrease) | 399,004 | | | $ | 7,059,112 | | (826,147 | ) | $ | (31,539,116 | ) |
| 123
franklintempleton.com Annual Report
| | | | | | | | | | |
| FRANKLIN VALUE INVESTORS TRUST | | | | | | | | | | |
| NOTES TO FINANCIAL STATEMENTS | | | | | | | | | | |
| |
| |
| |
| |
| 2. Shares of Beneficial Interest (continued) | | | | | | | | | | |
| | Franklin Large Cap Value Fund | | Franklin MicroCap Value Fund | |
| | Shares | | | Amount | | Shares | | | Amount | |
| |
| Advisor Class Shares: | | | | | | | | | | |
| Year ended October 31, 2015 | | | | | | | | | | |
| Shares sold | 71,923 | | $ | 1,333,749 | | 801,057 | | $ | 27,290,882 | |
| Shares issued in reinvestment of distributions | 7,482 | | | 134,147 | | 218,953 | | | 7,405,000 | |
| Shares redeemed | (59,609 | ) | | (1,108,288 | ) | (1,226,178 | ) | | (42,253,411 | ) |
| Net increase (decrease) | 19,796 | | $ | 359,608 | | (206,168 | ) | $ | (7,557,529 | ) |
| Year ended October 31, 2014 | | | | | | | | | | |
| Shares sold | 128,625 | | $ | 2,304,158 | | 290,343 | | $ | 11,573,412 | |
| Shares issued in reinvestment of distributions | 5,006 | | | 85,155 | | 171,112 | | | 6,745,230 | |
| Shares redeemed | (392,326 | ) | | (6,876,438 | ) | (1,045,926 | ) | | (41,619,611 | ) |
| Net increase (decrease) | (258,695 | ) | $ | (4,487,125 | ) | (584,471 | ) | $ | (23,300,969 | ) |
| |
| | Franklin MidCap Value Fund | | Franklin Small Cap Value Fund | |
| | Shares | | | Amount | | Shares | | | Amount | |
| |
| Class A Shares: | | | | | | | | | | |
| Year ended October 31, 2015 | | | | | | | | | | |
| Shares sold | 1,884,426 | | $ | 29,749,760 | | 3,824,195 | | $ | 204,728,167 | |
| Shares issued in reinvestment of distributions | 214,510 | | | 3,273,429 | | 2,025,011 | | | 103,336,289 | |
| Shares redeemed | (1,718,427 | ) | | (26,890,221 | ) | (7,267,182 | ) | (390,237,185 | ) |
| Net increase (decrease) | 380,509 | | $ | 6,132,968 | | (1,417,976 | ) | $ | (82,172,729 | ) |
| Year ended October 31, 2014 | | | | | | | | | | |
| Shares sold | 2,434,835 | | $ | 37,628,824 | | 5,748,092 | | $ | 339,423,757 | |
| Shares issued in reinvestment of distributions | 39,544 | | | 587,598 | | 984,630 | | | 56,941,176 | |
| Shares redeemed | (1,478,383 | ) | | (22,843,123 | ) | (5,265,944 | ) | (309,705,766 | ) |
| Net increase (decrease) | 995,996 | | $ | 15,373,299 | | 1,466,778 | | $ | 86,659,167 | |
| Class C Shares: | | | | | | | | | | |
| Year ended October 31, 2015 | | | | | | | | | | |
| Shares sold | 406,918 | | $ | 6,357,539 | | 670,073 | | $ | 32,945,114 | |
| Shares issued in reinvestment of distributions | 29,826 | | | 450,366 | | 479,995 | | | 22,502,184 | |
| Shares redeemed | (386,023 | ) | | (5,954,504 | ) | (1,191,237 | ) | | (58,229,326 | ) |
| Net increase (decrease) | 50,721 | | $ | 853,401 | | (41,169 | ) | $ | (2,782,028 | ) |
| Year ended October 31, 2014 | | | | | | | | | | |
| Shares sold | 493,756 | | $ | 7,527,219 | | 1,098,152 | | $ | 59,329,389 | |
| Shares issued in reinvestment of distributions | 578 | | | 8,494 | | 206,367 | | | 11,104,596 | |
| Shares redeemed | (496,548 | ) | | (7,630,255 | ) | (865,470 | ) | | (47,313,658 | ) |
| Net increase (decrease) | (2,214 | ) | $ | (94,542 | ) | 439,049 | | $ | 23,120,327 | |
| Class R Shares: | | | | | | | | | | |
| Year ended October 31, 2015 | | | | | | | | | | |
| Shares sold | 9,507 | | $ | 151,491 | | 948,990 | | $ | 50,222,888 | |
| Shares issued in reinvestment of distributions | 1,451 | | | 22,138 | | 450,281 | | | 22,784,204 | |
| Shares redeemed | (29,779 | ) | | (474,374 | ) | (1,873,284 | ) | | (99,627,352 | ) |
| Net increase (decrease) | (18,821 | ) | $ | (300,745 | ) | (474,013 | ) | $ | (26,620,260 | ) |
| Year ended October 31, 2014 | | | | | | | | | | |
| Shares sold | 8,957 | | $ | 140,047 | | 1,640,763 | | $ | 96,121,139 | |
| Shares issued in reinvestment of distributions | 218 | | | 3,235 | | 219,039 | | | 12,568,430 | |
| Shares redeemed | (8,606 | ) | | (130,935 | ) | (1,654,939 | ) | | (96,842,795 | ) |
| Net increase (decrease) | 569 | | $ | 12,347 | | 204,863 | | $ | 11,846,774 | |
124 |
Annual Report franklintempleton.com
FRANKLIN VALUE INVESTORS TRUST
NOTES TO FINANCIAL STATEMENTS
| | | | | | | | | | | |
| | Franklin MidCap Value Fund | | Franklin Small Cap Value Fund | |
| | Shares | | | Amount | | Shares | | | Amount | |
| |
| Class R6 Shares: | | | | | | | | | | | |
| Year ended October 31, 2015 | | | | | | | | | | | |
| Shares sold | | | | | | 1,056,050 | | | $ | 59,655,409 | |
| Shares issued in reinvestment of distributions | | | | | | 30,966 | | | | 1,634,378 | |
| Shares redeemed | | | | | | (544,057 | ) | | | (29,423,818 | ) |
| Net increase (decrease) | | | | | | 542,959 | | | $ | 31,865,969 | |
| Year ended October 31, 2014 | | | | | | | | | | | |
| Shares sold | | | | | | 626,045 | | | $ | 37,768,712 | |
| Shares issued in reinvestment of distributions | | | | | | 11 | | | | 636 | |
| Shares redeemed | | | | | | (65,214 | ) | | | (4,001,599 | ) |
| Net increase (decrease) | | | | | | 560,842 | | | $ | 33,767,749 | |
| Advisor Class Shares: | | | | | | | | | | | |
| Year ended October 31, 2015 | | | | | | | | | | | |
| Shares sold | 77,835 | | $ | 1,210,833 | | 3,869,868 | | $ | 215,282,871 | |
| Shares issued in reinvestment of distributions | 7,944 | | | 121,696 | | 1,276,090 | | | | 67,403,070 | |
| Shares redeemed | (47,730 | ) | | (754,888 | ) | (6,686,035 | ) | | (371,265,268 | ) |
| Net increase (decrease) | 38,049 | | $ | 577,641 | | (1,540,077 | ) | | $ | (88,579,327 | ) |
| Year ended October 31, 2014 | | | | | | | | | | | |
| Shares sold | 74,320 | | $ | 1,164,595 | | 5,964,306 | | $ | 364,433,191 | |
| Shares issued in reinvestment of distributions | 1,990 | | | 29,678 | | 527,625 | | | | 31,488,681 | |
| Shares redeemed | (49,340 | ) | | (773,525 | ) | (3,701,967 | ) | | (224,119,179 | ) |
| Net increase (decrease) | 26,970 | | $ | 420,748 | | 2,789,964 | | $ | 171,802,693 | |
3. Transactions with Affiliates
Franklin Resources, Inc. is the holding company for various subsidiaries that together are referred to as Franklin Templeton Investments. Certain officers and trustees of the Trust are also officers and/or directors of the following subsidiaries:
| |
| Subsidiary | Affiliation |
| Franklin Advisory Services, LLC (Advisory Services) | Investment manager |
| Franklin Templeton Services, LLC (FT Services) | Administrative manager |
| Franklin Templeton Distributors, Inc. (Distributors) | Principal underwriter |
| Franklin Templeton Investor Services, LLC (Investor Services) | Transfer agent |
| |
| a. Management Fees | |
Franklin All Cap Value Fund and Franklin Large Cap Value Fund each pay an investment management fee to Advisory Services based on the average daily net assets of each of the funds as follows:
| | | | | |
| Annualized Fee Rate | | Net Assets | | | |
| 0.750 | % | Up to and including $500 million | | | |
| 0.650 | % | Over $500 million, up to and including $1 billion | | | |
| 0.600 | % | Over $1 billion, up to and including $1.5 billion | | | |
| 0.550 | % | Over $1.5 billion, up to and including $6.5 billion | | | |
| 0.525 | % | Over $6.5 billion, up to and including $11.5 billion | | | |
| 0.500 | % | Over $11.5 billion, up to and including $16.5 billion | | | |
| 0.490 | % | Over $16.5 billion, up to and including $19 billion | | | |
| 0.480 | % | Over $19 billion, up to and including $21.5 billion | | | |
| 0.470 | % | In excess of $21.5 billion | | | |
| |
| franklintempleton.com | | | Annual Report | | | 125 |
FRANKLIN VALUE INVESTORS TRUST
NOTES TO FINANCIAL STATEMENTS
| 3. | Transactions with Affiliates (continued) |
| a. | Management Fees (continued) |
Franklin Balance Sheet Investment Fund pays an investment management fee to Advisory Services based on the average daily net assets of the fund as follows:
| | |
| Annualized Fee Rate | | Net Assets |
| 0.625 | % | Up to and including $100 million |
| 0.500 | % | Over $100 million, up to and including $250 million |
| 0.450 | % | Over $250 million, up to and including $7.5 billion |
| 0.440 | % | Over $7.5 billion, up to and including $10 billion |
| 0.430 | % | Over $10 billion, up to and including $12.5 billion |
| 0.420 | % | Over $12.5 billion, up to and including $15 billion |
| 0.400 | % | In excess of $15 billion |
|
| Franklin MicroCap Value Fund pays an investment management fee to Advisory Services of 0.75% per year of the average daily |
| net assets of the fund. |
| |
| Franklin MidCap Value Fund pays an investment management fee to Advisory Services based on the average daily net assets of the |
| fund as follows: |
| | |
| Annualized Fee Rate | | Net Assets |
| 0.950 | % | Up to and including $500 million |
| 0.850 | % | Over $500 million, up to and including $1 billion |
| 0.800 | % | Over $1 billion, up to and including $1.5 billion |
| 0.750 | % | Over $1.5 billion, up to and including $6.5 billion |
| 0.725 | % | Over $6.5 billion, up to and including $11.5 billion |
| 0.700 | % | Over $11.5 billion, up to and including $16.5 billion |
| 0.690 | % | Over $16.5 billion, up to and including $19 billion |
| 0.680 | % | Over $19 billion, up to and including $21.5 billion |
| 0.670 | % | In excess of $21.5 billion |
Franklin Small Cap Value Fund pays an investment management fee to Advisory Services based on the average daily net assets of the fund as follows:
| | |
| Annualized Fee Rate | | Net Assets |
| 0.750 | % | Up to and including $500 million |
| 0.625 | % | Over $500 million, up to and including $1 billion |
| 0.500 | % | Over $1 billion, up to and including $5 billion |
| 0.490 | % | In excess of $5 billion |
| |
| b. Administrative Fees | | |
Under an agreement with Advisory Services, FT Services provides administrative services to the Funds. The fee is paid by Advisory Services based on the Funds’ average daily net assets, and is not an additional expense of the Funds.
126 |
Annual Report franklintempleton.com
FRANKLIN VALUE INVESTORS TRUST
NOTES TO FINANCIAL STATEMENTS
c. Distribution Fees
The Board has adopted distribution plans for each share class, with the exception of Class R6 and Advisor Class shares, pursuant to Rule 12b-1 under the 1940 Act. Under the Funds’ Class A reimbursement distribution plan, the Funds reimburse Distributors for costs incurred in connection with the servicing, sale and distribution of each Fund’s shares up to the maximum annual plan rate. Under the Class A reimbursement distribution plans, costs exceeding the maximum for the current plan year cannot be reimbursed in subsequent periods. In addition, under the Funds’ Class C and R compensation distribution plans, the Funds pay Distributors for costs incurred in connection with the servicing, sale and distribution of each Fund’s shares up to the maximum annual plan rate for each class. The plan year, for purposes of monitoring compliance with the maximum annual plan rates, is February 1 through January 31 for each Fund.
The maximum annual plan rates, based on the average daily net assets, for each class, are as follows:
| | | | | | | | | | | | |
| | Franklin | | Franklin | | Franklin | | Franklin | | Franklin | | Franklin | |
| | All Cap | | Balance Sheet | | Large Cap | | MicroCap | | MidCap | | Small Cap | |
| | Value Fund | | Investment Fund | | Value Fund | | Value Fund | | Value Fund | | Value Fund | |
| Reimbursement Plans: | | | | | | | | | | | | |
| Class A | 0.35 | % | 0.25 | % | 0.35 | % | 0.25 | % | 0.35 | % | 0.35 | % |
| Compensation Plans: | | | | | | | | | | | | |
| Class C | 1.00 | % | 1.00 | % | 1.00 | % | — | | 1.00 | % | 1.00 | % |
| Class R | 0.50 | % | 0.50 | % | 0.50 | % | — | | 0.50 | % | 0.50 | % |
For Franklin All Cap Value Fund, Franklin Large Cap Value Fund, Franklin MidCap Value Fund, and Franklin Small Cap Value Fund, the Board has set the current rate at 0.25% per year for Class A shares, effective August 1, 2015, until further notice and approval by the Board. Prior to August 1, 2015, the Board had set the rate at 0.30% per year for Class A shares.
d. Sales Charges/Underwriting Agreements
Front-end sales charges and contingent deferred sales charges (CDSC) do not represent expenses of the Funds. These charges are deducted from the proceeds of sales of fund shares prior to investment or from redemption proceeds prior to remittance, as applicable. Distributors has advised the Funds of the following commission transactions related to the sales and redemptions of the Funds’ shares for the year:
| | | | | | | | | | | | |
| | | Franklin | | Franklin | | Franklin | | Franklin | | Franklin | | Franklin |
| | | All Cap | | Balance Sheet | | Large Cap | | MicroCap | | MidCap | | Small Cap |
| | | Value Fund | | Investment Fund | | Value Fund | | Value Fund | | Value Fund | | Value Fund |
| Sales charges retained net of | | | | | | | | | | | | |
| commissions paid to unaffiliated | | | | | | | | | | | | |
| broker/dealers | $ | 29,645 | $ | 169,327 | $ | 73,652 | $ | 17,262 | $ | 83,518 | $ | 269,507 |
| CDSC retained | $ | 2,758 | $ | 8,498 | $ | 5,210 | $ | 135 | $ | 2,963 | $ | 14,203 |
e. Transfer Agent Fees
Each class of shares, except for Class R6, pays transfer agent fees to Investor Services for its performance of shareholder servicing obligations and reimburses Investor Services for out of pocket expenses incurred, including shareholding servicing fees paid to third parties. These fees are allocated daily based upon their relative proportion of such classes’ aggregate net assets. Class R6 pays Investor Services transfer agent fees specific to that class.
For the year ended October 31, 2015, the Funds paid transfer agent fees as noted in the Statements of Operations of which the following amounts were retained by Investor Services:
| | | | | | | | | | | | |
| | | Franklin | | Franklin | | Franklin | | Franklin | | Franklin | | Franklin |
| | | All Cap | | Balance Sheet | | Large Cap | | MicroCap | | MidCap | | Small Cap |
| | | Value Fund | | Investment Fund | | Value Fund | | Value Fund | | Value Fund | | Value Fund |
| |
| Transfer agent fees | $ | 64,028 | $ | 887,768 | $ | 191,208 | $ | 197,586 | $ | 167,481 | $ | 2,351,010 |
| |
| |
| franklintempleton.com | | | | | | | | | | Annual Report | 127 |
FRANKLIN VALUE INVESTORS TRUST
NOTES TO FINANCIAL STATEMENTS
| 3. | Transactions with Affiliates (continued) |
| f. | Investments in Affiliated Management Investment Companies |
The Funds invest in an affiliated management investment company for purposes other than exercising a controlling influence over the management or policies. Management fees paid by the Funds are waived on assets invested in the affiliated management investment company, as noted in the Statements of Operations, in an amount not to exceed the management and administrative fees paid directly or indirectly by each affiliate. Prior to November 1, 2013, the waiver was accounted for as a reduction to management fees.
| | | | | | | | | | | |
| | | | | | | | | | | % of Affiliated | |
| | Number of | | | | Number of | | | | | Fund Shares | |
| | Shares Held | | | | Shares | | | | | Outstanding | |
| | at Beginning | Gross | Gross | | Held at End | | Value at | Investment | Realized | Held at | |
| | of Year | Additions | Reductions | | of Year | | End of Year | Income | Gain (Loss) | End of Year | |
| Franklin All Cap Value Fund | | | | | | | | | | | |
| Non-Controlled Affiliates | | | | | | | | | | | |
| Institutional Fiduciary Trust Money | | | | | | | | | | | |
| Market Portfolio | 2,415,951 | 32,686,092 | (29,007,786 | ) | 6,094,257 | $ | 6,094,257 | $ — | $ — | 0.03 | % |
| Franklin Balance Sheet | | | | | | | | | | | |
| Investment Fund | | | | | | | | | | | |
| Non-Controlled Affiliates | | | | | | | | | | | |
| Institutional Fiduciary Trust Money | | | | | | | | | | | |
| Market Portfolio | 192,857,335 | 265,744,027 | (355,906,082 | ) | 102,695,280 | $ | 102,695,280 | $ — | $ — | 0.46 | % |
| Franklin Large Cap Value Fund | | | | | | | | | | | |
| Non-Controlled Affiliates | | | | | | | | | | | |
| Institutional Fiduciary Trust Money | | | | | | | | | | | |
| Market Portfolio | 7,907,565 | 39,860,722 | (40,035,402 | ) | 7,732,885 | $ | 7,732,885 | $ — | $ — | 0.03 | % |
| Franklin MicroCap Value Fund | | | | | | | | | | | |
| Non-Controlled Affiliates | | | | | | | | | | | |
| Institutional Fiduciary Trust Money | | | | | | | | | | | |
| Market Portfolio | 44,628,215 | 57,357,557 | (85,869,033 | ) | 16,116,739 | $ | 16,116,739 | $ — | $ — | 0.07 | % |
| Franklin MidCap Value Fund | | | | | | | | | | | |
| Non-Controlled Affiliates | | | | | | | | | | | |
| Institutional Fiduciary Trust Money | | | | | | | | | | | |
| Market Portfolio | 3,487,573 | 72,400,315 | (72,946,143 | ) | 2,941,745 | $ | 2,941,745 | $ — | $ — | 0.01 | % |
| Franklin Small Cap Value Fund | | | | | | | | | | | |
| Non-Controlled Affiliates | | | | | | | | | | | |
| Institutional Fiduciary Trust Money | | | | | | | | | | | |
| Market Portfolio | 157,811,623 | 528,702,345 | (530,376,841 | ) | 156,137,127 | $ | 156,137,127 | $ — | $ — | 0.70 | % |
| |
| g. Waiver and Expense Reimbursements | | | | | | | | | | |
Advisory Services has contractually agreed in advance to waive or limit its fees and to assume as its own expense certain expenses otherwise payable by Franklin All Cap Value Fund and Franklin MidCap Value Fund so that the expenses (excluding distribution fees and acquired fund fees and expenses) for Class A, Class C, Class R and Advisor Class of the funds do not exceed 0.95% and 1.05% respectively (other than certain non-routine expenses or costs, including those relating to litigation, indemnification, reorganizations, and liquidations) until February 29, 2016.
Additionally, Investor Services has contractually agreed in advance to waive or limit its fees so that the Class R6 transfer agent fees do not exceed 0.01% until February 29, 2016. For Franklin Balance Sheet Investment Fund, Franklin Large Cap Value Fund and Franklin MicroCap Value Fund, there were no Class R6 transfer agent fees waived during the year ended October 31, 2015.

FRANKLIN VALUE INVESTORS TRUST
NOTES TO FINANCIAL STATEMENTS
4. Expense Offset Arrangement
The Funds have entered into an arrangement with their custodian whereby credits realized as a result of uninvested cash balances are used to reduce a portion of the Funds’ custodian expenses. During the year ended October 31, 2015, there were no credits earned.
5. Income Taxes
For tax purposes, the Funds may elect to defer any portion of a late-year ordinary loss to the first day of the following fiscal year. At October 31, 2015 Franklin MicroCap Value Fund deferred late-year ordinary losses of $316,437.
The tax character of distributions paid during the years ended October 31, 2015 and 2014, was as follows:
| | | | | | | | | | | | | | | |
| | | Franklin All Cap | | | Franklin Balance Sheet | | Franklin Large Cap |
| | | Value Fund | | | Investment Fund | | Value Fund | |
| | | 2015 | | 2014 | | 2015 | | 2014 | | 2015 | | | 2014 |
| Distributions paid from: | | | | | | | | | | | | | | | |
| Ordinary income | $ | 45,124 | | $ | 30,480 | $ | 26,525,797 | $ | 35,090,165 | $ | 1,071,277 | | $ | 895,408 |
| Long term capital gain | | 1,894,860 | | | 27,361 | | 188,970,816 | | 126,843,060 | | 2,841,241 | | | — |
| | $ | 1,939,984 | | $ | 57,841 | $ | 215,496,613 | $ | 161,933,225 | $ | 3,912,518 | | $ | 895,408 |
| |
| | | Franklin MicroCap | | Franklin MidCap | | Franklin Small Cap |
| | | Value Fund | | | Value Fund | | | Value Fund | |
| | | 2015 | | 2014 | | 2015 | | 2014 | | 2015 | | | 2014 |
| Distributions paid from: | | | | | | | | | | | | | | | |
| Ordinary income | $ | 842,070 | $ | 2,140,926 | $ | 912,761 | | $ | 646,625 | $ | 12,731,751 | $ | 13,376,470 |
| Long term capital gain | | 40,640,910 | | 31,348,557 | | 3,042,633 | | | — | | 224,744,744 | | 108,254,402 |
| | $ | 41,482,980 | $ | 33,489,483 | $ | 3,955,394 | | $ | 646,625 | $ | 237,476,495 | $ | 121,630,872 |
At October 31, 2015, the cost of investments, net unrealized appreciation (depreciation), undistributed ordinary income and undistributed long term capital gains for income tax purposes were as follows:
| | | | | | | | | |
| | | | | | Franklin | | | | |
| | | Franklin All Cap | | | Balance Sheet | | | Franklin Large Cap | |
| | | Value Fund | | | Investment Fund | | | Value Fund | |
| Cost of investments | $ | 46,168,258 | | $ | 895,068,740 | | $ | 162,820,985 | |
| |
| Unrealized appreciation | $ | 7,753,010 | | $ | 295,092,531 | | $ | 56,347,219 | |
| Unrealized depreciation | | (3,728,325 | ) | | (109,159,957 | ) | | (12,162,075 | ) |
| Net unrealized appreciation (depreciation) | $ | 4,024,685 | | $ | 185,932,574 | | $ | 44,185,144 | |
| |
| Undistributed ordinary income | $ | 21,122 | | $ | 4,314,905 | | $ | 1,374,954 | |
| Undistributed long term capital gains | | 3,387,200 | | | 149,299,246 | | | 15,897,850 | |
| Distributable earnings | $ | 3,408,322 | | $ | 153,614,151 | | $ | 17,272,804 | |

FRANKLIN VALUE INVESTORS TRUST
NOTES TO FINANCIAL STATEMENTS
| 5. | Income Taxes (continued) |
| | | | | | | | | |
| | | Franklin MicroCap | | | Franklin MidCap | | | Franklin Small Cap | |
| | | Value Fund | | | Value Fund | | | Value Fund | |
| Cost of investments | $ | 245,883,162 | | $ | 142,049,627 | | $ | 1,835,166,107 | |
| |
| Unrealized appreciation | $ | 140,718,041 | | $ | 24,361,788 | | $ | 557,921,407 | |
| Unrealized depreciation | | (42,703,752 | ) | | (9,375,608 | ) | | (151,510,992 | ) |
| Net unrealized appreciation (depreciation) | $ | 98,014,289 | | $ | 14,986,180 | | $ | 406,410,415 | |
| |
| Undistributed ordinary income | $ | — | | $ | 507,331 | | $ | 8,918,000 | |
| Undistributed long term capital gains | | 38,810,800 | | | 12,115,518 | | | 205,975,862 | |
| Distributable earnings | $ | 38,810,800 | | $ | 12,622,849 | | $ | 214,893,862 | |
Differences between income and/or capital gains as determined on a book basis and a tax basis are primarily due to differing treatments of pass-through entity income, corporate actions and wash sales.
6. Investment Transactions
Purchases and sales of investments (excluding short term securities) for the year ended October 31, 2015, were as follows:
| | | | | | | | | | | | |
| | | Franklin | | Franklin | | Franklin | | Franklin | Franklin | | | Franklin |
| | | All Cap | | Balance Sheet | | Large Cap | | MicroCap | MidCap | | | Small Cap |
| | | Value Fund | | Investment Fund | | Value Fund | | Value Fund | Value Fund | | | Value Fund |
| |
| Purchase | $ | 41,134,386 | $ | 299,765,840 | $ | 34,046,978 | $ | 32,269,817 | $102,990,525 | $ | 607,979,665 |
| Sales | $ | 49,626,999 | $ | 468,056,720 | $ | 38,611,455 | $ | 86,279,246 | $ 97,207,561 | $ | 973,463,845 |
7. Restricted Securities
Certain Funds invest in securities that are restricted under the Securities Act of 1933 (1933 Act) or which are subject to legal, contractual, or other agreed upon restrictions on resale. Restricted securities are often purchased in private placement transactions, and cannot be sold without prior registration unless the sale is pursuant to an exemption under the 1933 Act. Disposal of these securities may require greater effort and expense, and prompt sale at an acceptable price may be difficult. The Funds may have registration rights for restricted securities. The issuer generally incurs all registration costs.
At October 31, 2015, Franklin MicroCap Value Fund held investments in restricted securities, excluding certain securities exempt from registration under the 1933 Act deemed to be liquid, as follows:
| | | | | | |
| | | Acquisition | | | | |
| Shares | Issuer | Dates | | Cost | | Value |
| 94,800 | Allen Organ Co. (LandCo. Holdings) | 9/07/06 | $ | 181,146 | $ | 444,612 |
| 44,600 | Smith Investment Co. LLC | 1/20/09 | | — | | 31,332 |
| | Total Restricted Securities (Value is 0.14% of Net Assets) | | $ | 181,146 | $ | 475,944 |
130 |
Annual Report franklintempleton.com
FRANKLIN VALUE INVESTORS TRUST
NOTES TO FINANCIAL STATEMENTS
8. Holdings of 5% Voting Securities of Portfolio Companies
The 1940 Act defines “affiliated companies” to include investments in portfolio companies in which a fund owns 5% or more of the outstanding voting securities. Investments in “affiliated companies” for Franklin Balance Sheet Investment Fund, Franklin MicroCap Value Fund and Franklin Small Cap Value Fund for the year ended October 31, 2015, were as shown below.
| | | | | | | | | | | | | |
| | Number of | | | | Number of | | | | | | | | |
| | Shares Held | | | | Shares | | | | | | | | |
| | at Beginning | Gross | Gross | | Held at End | | Value at | | Investment | | | Realized | |
| Name of Issuer | of Year | Additions | Reductions | | of Year | | End of Year | | Income | | | Gain (Loss) | |
| Franklin Balance Sheet Investment Fund | | | | | | | | | | | | | |
| Non-Controlled Affiliates | | | | | | | | | | | | | |
| KGen Power Liquidating Trust, | | | | | | | | | | | | | |
| Contingent Distribution | 2,800,000 | — | — | | 2,800,000 | $ | —a,b | $ | — | $ | | — | |
| Trinity Place Holdings Inc. | 1,200,000 | — | — | | 1,200,000 | | 7,200,000 | | — | | | — | |
| Total Affiliated Securities (Value is 0.67% of Net Assets) | | | | | $ | 7,200,000 | $ | — | $ | | — | |
| |
| Franklin MicroCap Value Fund | | | | | | | | | | | | | |
| Non-Controlled Affiliates | | | | | | | | | | | | | |
| ACMAT Corp., A | 274,900 | — | (39,300 | ) | 235,600 | $ | 4,005,200 | $ | — | $ | | 772,245 | |
| Cal Dive International Inc. | 5,395,000 | — | (5,395,000 | ) | — | | — | | — | | | (9,361,898 | ) |
| Continental Materials Corp. | 129,700 | — | — | | 129,700 | | 1,710,743 | | — | | | — | |
| Delta Apparel Inc. | 800,000 | — | (160,000 | ) | 640,000 | | 10,515,200 | | — | | | 1,586,333 | |
| Full House Resorts Inc. | 1,600,000 | — | — | | 1,600,000 | | 2,256,000 | | — | | | — | |
| Hardinge Inc. | 934,900 | — | — | | 934,900 | | 8,844,154 | | 74,792 | | | — | |
| Hurco Cos. Inc. | 379,400 | — | (14,400 | ) | 365,000 | | 9,807,550 | | 115,212 | | | 254,703 | |
| Magellan Petroleum Corp. | 2,377,980 | 150,000 | (2,527,980 | )c | — | | — | | — | | | (572,147 | ) |
| Northeast Bancorp | 437,000 | 22,500 | — | | 459,500 | | 4,939,625 | | 18,155 | | | — | |
| Omega Protein Corp. | 1,080,000 | — | (360,000 | ) | 720,000 | | —a | | — | | | 2,981,427 | |
| Origen Financial Inc. | 1,900,000 | — | — | | 1,900,000 | | 261,535 | | — | | | — | |
| Total Affiliated Securities (Value is 12.32% of Net Assets) | | | | | $ | 42,340,007 | $ | 208,159 | $ | | (4,339,337 | ) |
| |
| Franklin Small Cap Value Fund | | | | | | | | | | | | | |
| Non-Controlled Affiliates | | | | | | | | | | | | | |
| AAR Corp. | 1,563,100 | 583,300 | (82,600 | ) | 2,063,800 | $ | 46,827,622 | $ | 527,192 | $ | | 264,116 | |
| Hooker Furniture Corp. | 582,900 | — | — | | 582,900 | | 14,467,578 | | 233,160 | | | — | |
| Total Affiliated Securities (Value is 2.78% of Net Assets) | | | | | $ | 61,295,200 | $ | 760,352 | $ | $ | 264,116 | |
aAs of October 31, 2015, no longer an affiliate.
bEffective June 30, 2014, the common shares were converted into liquidating trust interests, which are non-voting shares.
cA portion of the gross reduction was the result of a corporate action.
9. Upcoming Acquisitions/Reorganization
On October 20, 2015, the Board approved a proposal to reorganize Franklin All Cap Value Fund with and into Franklin Small Cap Value Fund, subject to approval by the shareholders of Franklin All Cap Value Fund.
10. Credit Facility
The Funds, together with other U.S. registered and foreign investment funds (collectively, Borrowers), managed by Franklin Templeton Investments, are borrowers in a joint syndicated senior unsecured credit facility totaling $2 billion (Global Credit Facility) which matures on February 12, 2016. This Global Credit Facility provides a source of funds to the Borrowers for temporary and emergency purposes, including the ability to meet future unanticipated or unusually large redemption requests.

FRANKLIN VALUE INVESTORS TRUST
NOTES TO FINANCIAL STATEMENTS
10. Credit Facility (continued)
Under the terms of the Global Credit Facility, the Funds shall, in addition to interest charged on any borrowings made by the Funds and other costs incurred by the Funds, pay their share of fees and expenses incurred in connection with the implementation and maintenance of the Global Credit Facility, based upon their relative share of the aggregate net assets of all of the Borrowers, including an annual commitment fee of 0.07% based upon the unused portion of the Global Credit Facility. These fees are reflected in other expenses in the Statements of Operations. During the year ended October 31, 2015, the Funds did not use the Global Credit Facility.
11. Reorganization to a Delaware Statutory Trust
On June 5, 2015, shareholders approved an Agreement and Plan of Reorganization whereby the Funds would be reorganized and their domicile changed from a Massachusetts business trust to a Delaware statutory trust. The reorganization became effective on November 2, 2015.
12. Fair Value Measurements
The Funds follow a fair value hierarchy that distinguishes between market data obtained from independent sources (observable inputs) and the Funds’ own market assumptions (unobservable inputs). These inputs are used in determining the value of the Funds’ financial instruments and are summarized in the following fair value hierarchy:
- Level 1 – quoted prices in active markets for identical financial instruments
- Level 2 – other significant observable inputs (including quoted prices for similar financial instruments, interest rates, prepayment speed, credit risk, etc.)
- Level 3 – significant unobservable inputs (including the Funds’ own assumptions in determining the fair value of financial instruments)
The input levels are not necessarily an indication of the risk or liquidity associated with financial instruments at that level.
For movements between the levels within the fair value hierarchy, the Funds have adopted a policy of recognizing the transfers as of the date of the underlying event which caused the movement.
A summary of inputs used as of October 31, 2015, in valuing the Funds’ assets carried at fair value, is as follows:
| | | | | | | | |
| | | Level 1 | | Level 2 | | Level 3 | | Total |
| Franklin All Cap Value Fund | | | | | | | | |
| Assets: | | | | | | | | |
| Investments in Securities | | | | | | | | |
| Equity Investmentsa | $ | 43,857,991 | $ | — | $ | — | $ | 43,857,991 |
| Corporate Bonds | | — | | 240,695 | | — | | 240,695 |
| Short Term Investments | | 6,094,257 | | — | | — | | 6,094,257 |
| Total Investments in Securities | $ | 49,952,248 | $ | 240,695 | $ | — | $ | 50,192,943 |
| Franklin Balance Sheet Investment Fund | | | | | | | | |
| Assets: | | | | | | | | |
| Investments in Securities | | | | | | | | |
| Equity Investments: | | | | | | | | |
| Telecommunication Services | $ | 26,616,999 | $ | 6,041,250 | $ | — | $ | 32,658,249 |
| All Other Equity Investmentsa,b | | 944,608,845 | | — | | — | | 944,608,845 |
| Escrows and Litigation Trusts | | — | | — | | 1,038,940 | | 1,038,940 |
| Short Term Investments | | 102,695,280 | | — | | — | | 102,695,280 |
| Total Investments in Securities | $ | 1,073,921,124 | $ | 6,041,250 | $ | 1,038,940 | $ | 1,081,001,314 |
132 |
Annual Report franklintempleton.com
| | | | | | | | | |
| | | | | | FRANKLIN VALUE INVESTORS TRUST |
| | | | | | NOTES TO FINANCIAL STATEMENTS |
| |
| |
| |
| |
| | | | Level 1 | | Level 2 | | Level 3 | | Total |
| Franklin Large Cap Value Fund | | | | | | | | | |
| Assets: | | | | | | | | | |
| Investments in Securities | | | | | | | | | |
| Equity Investmentsa | $ | 199,273,244 | $ | — | $ | — | $ | 199,273,244 |
| Short Term Investments | | 7,732,885 | | — | | — | | 7,732,885 |
| Total Investments in Securities | $ | 207,006,129 | $ | — | $ | — | $ | 207,006,129 |
| Franklin MicroCap Value Fund | | | | | | | | | |
| Assets: | | | | | | | | | |
| Investments in Securities: | | | | | | | | | |
| Equity Investments: | | | | | | | | | |
| Industrial Conglomerates | | $ | — | $ | — | $ | 31,332 | $ | 31,332 |
| Real Estate | | 5,120,820 | | 112,750 | | 444,612 | | 5,678,182 |
| All Other Equity Investmentsa | | 322,071,198 | | — | | — | | 322,071,198 |
| Short Term Investments | | 16,116,739 | | — | | — | | 16,116,739 |
| Total Investments in Securities | $ | 343,308,757 | $ | 112,750 | $ | 475,944 | $ | 343,897,451 |
| Franklin MidCap Value Fund | | | | | | | | | |
| Assets: | | | | | | | | | |
| Investments in Securities: | | | | | | | | | |
| Equity Investmentsa | $ | 153,187,059 | $ | — | $ | — | $ | 153,187,059 |
| Short Term Investments | | 2,941,745 | | 907,003 | | — | | 3,848,748 |
| Total Investments in Securities | $ | 156,128,804 | $ | 907,003 | $ | — | $ | 157,035,807 |
| Franklin Small Cap Value Fund | | | | | | | | | |
| Assets: | | | | | | | | | |
| Investments in Securities: | | | | | | | | | |
| Equity Investmentsa | $ | 2,072,640,843 | $ | — | $ | — | $ | 2,072,640,843 |
| Corporate Bonds | | | — | | 11,211,235 | | — | | 11,211,235 |
| Short Term Investments | | 156,137,127 | | 1,587,317 | | — | | 157,724,444 |
| Total Investments in Securities | $ | 2,228,777,970 | $ | 12,798,552 | $ | — | $ | 2,241,576,522 |
| |
| aFor detailed categories, see the accompanying Statement of Investments. | | | | | | | | | |
| bIncludes common and convertible preferred stocks as well as other equity investments. | | | | | | | |
A reconciliation of assets in which Level 3 inputs are used in determining fair value is presented when there are significant Level 3 financial instruments at the end of the year.
13. New Accounting Pronouncements
In June 2014, the Financial Accounting Standards Board issued Accounting Standards Update (ASU) No. 2014-11, Transfers and Servicing (Topic 860), Repurchase-to-Maturity Transactions, Repurchase Financings, and Disclosures. The ASU changes the accounting for certain repurchase agreements and expands disclosure requirements related to repurchase agreements, securities lending, repurchase-to-maturity and similar transactions. The ASU is effective for certain transactions accounted for as a sale for interim and annual reporting periods beginning after December 15, 2014 and transactions accounted for as secured borrowings for annual periods beginning after December 15, 2014, and for interim periods beginning after March 15, 2015. Management has reviewed the requirements and believes the adoption of this ASU will not have a material impact on the financial statements.
| 133
franklintempleton.com Annual Report
FRANKLIN VALUE INVESTORS TRUST
NOTES TO FINANCIAL STATEMENTS
14. Subsequent Events
The Funds have evaluated subsequent events through the issuance of the financial statements and determined that no events have occurred that require disclosure other than those already disclosed in the financial statements.
Abbreviations
Selected Portfolio
ADR American Depositary Receipt
134 |
Annual Report franklintempleton.com
FRANKLIN VALUE INVESTORS TRUST
Report of Independent Registered Public Accounting Firm
To the Board of Trustees and Shareholders of Franklin Value Investors Trust
In our opinion, the accompanying statements of assets and liabilities, including the statements of investments, and the related statements of operations and of changes in net assets and the financial highlights present fairly, in all material respects, the financial position of Franklin All Cap Value Fund, Franklin Balance Sheet Investment Fund, Franklin Large Cap Value Fund, Franklin MicroCap Value Fund, Franklin MidCap Value Fund and Franklin Small Cap Value Fund (separate portfolios of Franklin Value Investors Trust, hereafter referred to as the “Funds”) at October 31, 2015, the results of their operations for the year then ended, the changes in their net assets for each of the two years in the period then ended and the financial highlights for each of the periods presented, in conformity with accounting principles generally accepted in the United States of America. These financial statements and financial highlights (hereafter referred to as “financial statements”) are the responsibility of the Funds’ management. Our responsibility is to express an opinion on these financial statements based on our audits. We conducted our audits of these financial statements in accordance with the standards of the Public Company Accounting Oversight Board (United States). Those standards require that we plan and perform the audit to obtain reasonable assurance about whether the financial statements are free of material misstatement. An audit includes examining, on a test basis, evidence supporting the amounts and disclosures in the financial statements, assessing the accounting principles used and significant estimates made by management, and evaluating the overall financial statement presentation. We believe that our audits, which included confirmation of securities at October 31, 2015 by correspondence with the custodian, transfer agent and brokers, provide a reasonable basis for our opinion.
PricewaterhouseCoopers LLP
San Francisco, California
December 17, 2015
| 135
franklintempleton.com Annual Report
FRANKLIN VALUE INVESTORS TRUST
Tax Information (unaudited)
Under Section 852(b)(3)(C) of the Internal Revenue Code (Code), the Funds hereby report the maximum amount allowable but no less than the following amounts as long term capital gain dividends for the fiscal year ended October 31, 2015:
| | | | | | | | | | | |
| | | | Franklin | | | | | | | | |
| | Franklin All Cap | | Balance Sheet | | Franklin Large Cap | | Franklin MicroCap | | Franklin MidCap | | Franklin Small Cap |
| | Value Fund | | Investment Fund | | Value Fund | | Value Fund | | Value Fund | | Value Fund |
| $ | 1,894,860 | $ | 188,970,816 | $ | 2,841,241 | $ | 40,640,910 | $ | 3,042,633 | $ | 224,744,744 |
Under Section 871(k)(2)(C) of the Code, the Funds hereby report the maximum amount allowable but no less than the following amounts as short term capital gain dividends for purposes of the tax imposed under Section 871(a)(1)(A) of the Code for the fiscal year ended October 31, 2015:
| | | | | | | | | | | |
| | | | Franklin | | | | | | | | |
| | Franklin All Cap | | Balance Sheet | | Franklin Large Cap | | Franklin MicroCap | | Franklin MidCap | | Franklin Small Cap |
| | Value Fund | | Investment Fund | | Value Fund | | Value Fund | | Value Fund | | Value Fund |
| $ | — | $ | 21,884,051 | $ | — | $ | 842,070 | $ | — | $ | 5,772,089 |
Under Section 854(b)(1)(A) of the Code, the Funds hereby report the following percentage amounts of the ordinary income dividends as income qualifying for the dividends received deduction for the fiscal year ended October 31, 2015:
| | | | | | | | | | | |
| | | Franklin | | | | | | | | | |
| Franklin All Cap | | Balance Sheet | | Franklin Large Cap | | Franklin MicroCap | | Franklin MidCap | | Franklin Small Cap | |
| Value Fund | | Investment Fund | | Value Fund | | Value Fund | | Value Fund | | Value Fund | |
| 100 | % | 56.13 | % | 100 | % | 100 | % | 100 | % | 100 | % |
Under Section 854(b)(1)(B) of the Code, the Funds hereby report the maximum amount allowable but no less than the following amounts as qualified dividends for purposes of the maximum rate under Section 1(h)(11) of the Code for the fiscal year ended October 31, 2015:
| | | | | | | | | | | |
| | | | Franklin | | | | | | | | |
| | Franklin All Cap | | Balance Sheet | | Franklin Large Cap | | Franklin MicroCap | | Franklin MidCap | | Franklin Small Cap |
| | Value Fund | | Investment Fund | | Value Fund | | Value Fund | | Value Fund | | Value Fund |
| $ | 732,302 | $ | 16,895,717 | $ | 4,588,542 | $ | 4,554,845 | $ | 2,561,506 | $ | 39,051,481 |
Distributions, including qualified dividend income, paid during calendar year 2015 will be reported to shareholders on Form 1099-DIV by mid-February 2016. Shareholders are advised to check with their tax advisors for information on the treatment of these amounts on their individual income tax returns.
136 |
Annual Report franklintempleton.com
FRANKLIN VALUE INVESTORS TRUST
Board Members and Officers
The name, year of birth and address of the officers and board members, as well as their affiliations, positions held with the Trust, principal occupations during at least the past five years and number of portfolios overseen in the Franklin Templeton Investments fund complex, are shown below. Generally, each board member serves until that person’s successor is elected and qualified.
| | | | |
| Independent Board Members | | | |
| |
| | | | Number of Portfolios in | |
| Name, Year of Birth | | Length of | Fund Complex Overseen | Other Directorships Held |
| and Address | Position | Time Served | by Board Member* | During at Least the Past 5 Years |
| |
| Edward I. Altman, Ph.D. (1941) | Trustee | Since April 2015 | 17 | None |
| One Franklin Parkway | | | | |
| San Mateo, CA 94403-1906 | | | | |
Principal Occupation During at Least the Past 5 Years:
Max L. Heine Professor of Finance and Director of The Credit and Debt Markets Research Program, Salomon Center, Stern School of Business, New York University; editor and author of numerous financial publications; financial consultant; an adviser to numerous financial and publishing organizations; and formerly, Vice Director, Salomon Center, Stern School of Business, New York University.
| | | | |
| Ann Torre Bates (1958) | Trustee | Since April 2015 | 42 | Navient Corporation (loan |
| One Franklin Parkway | | | | management, servicing and asset |
| San Mateo, CA 94403-1906 | | | | recovery) (2014-present), Ares Capital |
| | | | | Corporation (specialty finance |
| | | | | company) (2010-present), United |
| | | | | Natural Foods, Inc. (distributor of |
| | | | | natural, organic and specialty foods) |
| | | | | (2013-present), Allied Capital |
| | | | | Corporation (financial services) |
| | | | | (2003-2010) and SLM Corporation |
| | | | | (Sallie Mae) (1997-2014). |
Principal Occupation During at Least the Past 5 Years:
Director of various companies; and formerly, Executive Vice President and Chief Financial Officer, NHP Incorporated (manager of multifamily housing) (1995-1997); and Vice President and Treasurer, US Airways, Inc. (until 1995).
| | | | |
| Burton J. Greenwald (1929) | Vice Chairman | Vice Chairman | 17 | Franklin Templeton Emerging Markets |
| One Franklin Parkway | and Trustee | since April 2015 | | Debt Opportunities Fund PLC and |
| San Mateo, CA 94403-1906 | | and Trustee | | Fiduciary International Ireland Limited |
| | | since 2001 | | (1999-2015). |
Principal Occupation During at Least the Past 5 Years:
Managing Director, B.J. Greenwald Associates (management consultants to the financial services industry); and formerly, Chairman, Fiduciary Trust International Funds; Executive Vice President, L.F. Rothschild Fund Management, Inc.; President and Director, Merit Mutual Funds; President, Underwriting Division and Director, National Securities & Research Corporation; Governor, Investment Company Institute; and Chairman, ICI Public Information Committee.
| | | |
| Jan Hopkins Trachtman (1947) Trustee | Since April 2015 | 17 | None |
| One Franklin Parkway | | | |
| San Mateo, CA 94403-1906 | | | |
Principal Occupation During at Least the Past 5 Years:
President and Founder, The Jan Hopkins Group (communications consulting firm); President, Economic Club of New York; serves on Advisory Board of Knight Bagehot Fellowship; and formerly, Anchor/Correspondent, CNN Financial News (until 2003); Managing Director and Head of Client Communications, Citigroup Private Bank (until 2005); Off-Air Reporter, ABC News’ World News Tonight; and Editor, CBS Network News.
| | | | |
| Keith E. Mitchell (1954) | Trustee | Since April 2015 | 17 | None |
| One Franklin Parkway | | | | |
| San Mateo, CA 94403-1906 | | | | |
Principal Occupation During at Least the Past 5 Years:
Director of various boards of asset management firms; and formerly, Managing Member, Mitchell, Hartley & Bechtel Advisers, LLC (formerly, Mitchell Advisers, LLC) (advisory firm) (2003-2015) and Managing Director, Putman Lovell NBF.
| 137
franklintempleton.com Annual Report
| | | | |
| FRANKLIN VALUE INVESTORS TRUST | | | |
| |
| |
| |
| |
| Independent Board Members (continued) | | |
| |
| | | | Number of Portfolios in | |
| Name, Year of Birth | | Length of | Fund Complex Overseen | Other Directorships Held |
| and Address | Position | Time Served | by Board Member* | During at Least the Past 5 Years |
| |
| David W. Niemiec (1949) | Trustee | Since 2011 | 42 | Emeritus Corporation (assisted living) |
| One Franklin Parkway | | | | (1999-2010) and OSI |
| San Mateo, CA 94403-1906 | | | | Pharmaceuticals, Inc. (pharmaceutical |
| | | | | products) (2006-2010). |
| Principal Occupation During at Least the Past 5 Years: | | |
Advisor, Saratoga Partners (private equity fund); and formerly, Managing Director, Saratoga Partners (1998-2001) and SBC Warburg Dillon Read (investment banking) (1997-1998); Vice Chairman, Dillon, Read & Co. Inc. (investment banking) (1991-1997); and Chief Financial Officer, Dillon, Read & Co. Inc. (1982-1997).
| | | | |
| Charles Rubens II (1930) | Trustee | Since 1989 | 17 | None |
| One Franklin Parkway | | | | |
| San Mateo, CA 94403-1906 | | | | |
Principal Occupation During at Least the Past 5 Years:
Private investor and president of non-profit organizations; and formerly, an executive of Time, Inc.; and Trustee of Colorado College.
| | | | |
| Robert E. Wade (1946) | Chairman of | Chairman of the 42 | El Oro Ltd (investments) |
| One Franklin Parkway | the Board and | Board since April | (2003-present). |
| San Mateo, CA 94403-1906 | Trustee | 2015 and Trustee | |
| | | since 2004 | | |
| |
| Principal Occupation During at Least the Past 5 Years: | | |
| Attorney at law engaged in private practice (1972-2008) and member of various boards. | |
| |
| Gregory H. Williams (1943) | Trustee | Since 2008 | 17 | None |
| One Franklin Parkway | | | | |
| San Mateo, CA 94403-1906 | | | | |
Principal Occupation During at Least the Past 5 Years:
Private investor; Consultant; and formerly, President, University of Cincinnati (2009-2012); President, The City College of New York (2001-2009); Dean, College of Law, Ohio State University (1993-2001); and Associate Vice President, Academic Affairs and Professor of Law, University of Iowa (1977-1993).
| | | | |
| Interested Board Members and Officers | | |
| |
| | | | Number of Portfolios in | |
| Name, Year of Birth | | Length of | Fund Complex Overseen | Other Directorships Held |
| and Address | Position | Time Served | by Board Member* | During at Least the Past 5 Years |
| |
| **Gregory E. Johnson (1961) | Trustee | Since April 2015 | 163 | None |
| One Franklin Parkway | | | | |
| San Mateo, CA 94403-1906 | | | | |
Principal Occupation During at Least the Past 5 Years:
Chairman of the Board, Member – Office of the Chairman, Director and Chief Executive Officer, Franklin Resources, Inc.; officer and/or director or trustee, as the case may be, of some of the other subsidiaries of Franklin Resources, Inc. and of 45 of the investment companies in Franklin Templeton Investments; Vice Chairman, Investment Company Institute; and formerly, President, Franklin Resources, Inc. (1994-2015).
138 |
Annual Report franklintempleton.com
FRANKLIN VALUE INVESTORS TRUST
| | | | |
| Interested Board Members and Officers (continued) | |
| |
| | | | Number of Portfolios in | |
| Name, Year of Birth | | Length of | Fund Complex Overseen | Other Directorships Held |
| and Address | Position | Time Served | by Board Member* | During at Least the Past 5 Years |
| |
| **Jennifer M. Johnson (1964) | Trustee | Since April 2015 | 10 | None |
| One Franklin Parkway | | | | |
| San Mateo, CA 94403-1906 | | | | |
Principal Occupation During at Least the Past 5 Years:
Co-President, Franklin Resources, Inc.; officer and/or director or trustee, as the case may be, of some of the other subsidiaries of Franklin Resources, Inc. and of three of the investment companies in Franklin Templeton Investments; and formerly, Chief Operating Officer and Executive Vice President, Franklin Resources, Inc. (1994-2015); Executive Vice President of Operations and Technology, Franklin Resources, Inc. (2005-2010); and Senior Vice President, Franklin Resources, Inc. (2003-2005).
| | | |
| **William J. Lippman (1925) Trustee | Since 1989 | 7 | None |
| 55 Challenger Road, Suite 501 | | | |
| Ridgefield Park, New Jersey 07660 | | | |
Principal Occupation During at Least the Past 5 Years:
Director or trustee, as the case may be, of two of the investment companies in Franklin Templeton Investments; and formerly, President, Franklin Advisory Services, LLC (1999-2014); and Director, Templeton Worldwide, Inc. (1994-2014).
| | | | |
| Alison E. Baur (1964) | Vice President | Since 2012 | Not Applicable | Not Applicable |
| One Franklin Parkway | | | | |
| San Mateo, CA 94403-1906 | | | | |
Principal Occupation During at Least the Past 5 Years:
Deputy General Counsel, Franklin Templeton Investments; and officer of some of the other subsidiaries of Franklin Resources, Inc. and of 45 of the investment companies in Franklin Templeton Investments.
| | | |
| Laura F. Fergerson (1962) | Chief Executive Since 2009 | Not Applicable | Not Applicable |
| One Franklin Parkway | Officer– | | |
| San Mateo, CA 94403-1906 | Finance and | | |
| | Administration | | |
Principal Occupation During at Least the Past 5 Years:
Senior Vice President, Franklin Templeton Services, LLC; Vice President, Franklin Advisers, Inc. and Franklin Templeton Institutional, LLC; and officer of 45 of the investment companies in Franklin Templeton Investments.
| | | | |
| Aliya S. Gordon (1973) | Vice President | Since 2009 | Not Applicable | Not Applicable |
| One Franklin Parkway | | | | |
| San Mateo, CA 94403-1906 | | | | |
Principal Occupation During at Least the Past 5 Years:
Senior Associate General Counsel, Franklin Templeton Investments; and officer of 45 of the investment companies in Franklin Templeton Investments.
| | | | |
| Steven J. Gray (1955) | Secretary and | Secretary since | Not Applicable | Not Applicable |
| One Franklin Parkway | Vice President | 2005 and Vice | | |
| San Mateo, CA 94403-1906 | | President since | | |
| | | 2009 | | |
Principal Occupation During at Least the Past 5 Years:
Senior Associate General Counsel, Franklin Templeton Investments; Vice President, Franklin Templeton Distributors, Inc. and Franklin Alternative Strategies Advisers, LLC; and officer of 45 of the investment companies in Franklin Templeton Investments.
| | | | |
| Selena L. Holmes (1965) | Vice President | Since 2012 | Not Applicable | Not Applicable |
| 100 Fountain Parkway | – AML | | | |
| St. Petersburg, FL 33716-1205 | Compliance | | | |
Principal Occupation During at Least the Past 5 Years:
Director, Global Compliance Monitoring; Chief Compliance Officer, Franklin Alternative Strategies Advisers, LLC; Vice President, Franklin Templeton Companies, LLC; and officer of 45 of the investment companies in Franklin Templeton Investments.
| 139
franklintempleton.com Annual Report
| | | | |
| FRANKLIN VALUE INVESTORS TRUST | | | |
| |
| |
| |
| |
| Interested Board Members and Officers (continued) | |
| |
| | | | Number of Portfolios in | |
| Name, Year of Birth | | Length of | Fund Complex Overseen | Other Directorships Held |
| and Address | Position | Time Served | by Board Member* | During at Least the Past 5 Years |
| |
| Rupert H. Johnson, Jr. (1940) | Vice President | Since 1989 | Not Applicable | Not Applicable |
| One Franklin Parkway | | | | |
| San Mateo, CA 94403-1906 | | | | |
| |
| Principal Occupation During at Least the Past 5 Years: | | |
| Vice Chairman, Member – Office of the Chairman and Director, Franklin Resources, Inc.; Director, Franklin Advisers, Inc.; Senior Vice |
| President, Franklin Advisory Services, LLC; and officer and/or director or trustee, as the case may be, of some of the other subsidiaries of |
| Franklin Resources, Inc. and of 43 of the investment companies in Franklin Templeton Investments. | |
| |
| Robert G. Kubilis (1973) | Treasurer, | Since 2012 | Not Applicable | Not Applicable |
| 300 S.E. 2nd Street | Chief Financial | | | |
| Fort Lauderdale, FL 33301-1923 | Officer and | | | |
| | Chief | | | |
| | Accounting | | | |
| | Officer | | | |
| |
| Principal Occupation During at Least the Past 5 Years: | | |
| Treasurer, U.S. Fund Administration & Reporting, Franklin Templeton Investments; and officer of four of the investment companies in Franklin |
| Templeton Investments. | | | | |
| |
| Kimberly H. Novotny (1972) | Vice President | Since 2013 | Not Applicable | Not Applicable |
| 300 S.E. 2nd Street | | | | |
| Fort Lauderdale, FL 33301-1923 | | | | |
| |
| Principal Occupation During at Least the Past 5 Years: | | |
| Associate General Counsel, Franklin Templeton Investments; Vice President, Fiduciary Trust International of the South and Templeton |
| Investment Counsel, LLC; Assistant Secretary, Franklin Resources, Inc.; and officer of 45 of the investment companies in Franklin Templeton |
| Investments. | | | | |
| |
| Robert C. Rosselot (1960) | Chief | Since 2013 | Not Applicable | Not Applicable |
| 300 S.E. 2nd Street | Compliance | | | |
| Fort Lauderdale, FL 33301-1923 | Officer | | | |
| |
| Principal Occupation During at Least the Past 5 Years: | | |
| Director, Global Compliance, Franklin Templeton Investments; Vice President, Franklin Templeton Companies, LLC; officer of 45 of the |
| investment companies in Franklin Templeton Investments; and formerly, Senior Associate General Counsel, Franklin Templeton Investments |
| (2007-2013); and Secretary and Vice President, Templeton Group of Funds (2004-2013). | |
| |
| Karen L. Skidmore (1952) | Vice President | Since 2009 | Not Applicable | Not Applicable |
| One Franklin Parkway | | | | |
| San Mateo, CA 94403-1906 | | | | |
| |
| Principal Occupation During at Least the Past 5 Years: | | |
| Senior Associate General Counsel, Franklin Templeton Investments; and officer of 45 of the investment companies in Franklin Templeton |
| Investments. | | | | |
| |
| Donald G. Taylor (1954) | President and | Since 2014 | Not Applicable | Not Applicable |
| 55 Challenger Road, Suite 501 | Chief Executive | | | |
| Ridgefield Park, New Jersey 07660 Officer – | | | |
| | Investment | | | |
| | Management | | | |
| |
| Principal Occupation During at Least the Past 5 Years: | | |
| President and Chief Investment Officer, Franklin Advisory Services, LLC; and officer of two of the investment companies in Franklin Templeton |
| Investments. | | | | |
140 |
Annual Report franklintempleton.com
FRANKLIN VALUE INVESTORS TRUST
| | | | |
| Interested Board Members and Officers (continued) | |
| |
| | | | Number of Portfolios in | |
| Name, Year of Birth | | Length of | Fund Complex Overseen | Other Directorships Held |
| and Address | Position | Time Served | by Board Member* | During at Least the Past 5 Years |
| |
| Navid Tofigh (1972) | Vice President | Since November | Not Applicable | Not Applicable |
| One Franklin Parkway | | 2015 | | |
| San Mateo, CA 94403-1906 | | | | |
| |
| Principal Occupation During at Least the Past 5 Years: | | |
| Associate General Counsel, Franklin Templeton Investments; and officer of 45 of the investment companies in Franklin Templeton |
| Investments. | | | | |
| |
| Craig S. Tyle (1960) | Vice President | Since 2005 | Not Applicable | Not Applicable |
| | | |
| One Franklin Parkway | | | |
| San Mateo, CA 94403-1906 | | | |
| |
| Principal Occupation During at Least the Past 5 Years: | | |
| General Counsel and Executive Vice President, Franklin Resources, Inc.; and officer of some of the other subsidiaries of Franklin Resources, |
| Inc. and of 45 of the investment companies in Franklin Templeton Investments. | |
| |
| Lori A. Weber (1964) | Vice President Since 2011 | Not Applicable | Not Applicable |
|
| 300 S.E. 2nd Street |
| Fort Lauderdale, FL 33301-1923 |
| |
| Principal Occupation During at Least the Past 5 Years: |
| Senior Associate General Counsel, Franklin Templeton Investments; Assistant Secretary, Franklin Resources, Inc.; Vice President and |
| Secretary, Templeton Investment Counsel, LLC; and officer of 45 of the investment companies in Franklin Templeton Investments. |
*We base the number of portfolios on each separate series of the U.S. registered investment companies within the Franklin Templeton Investments fund complex. These
portfolios have a common investment manager or affiliated investment managers.
**Gregory E. Johnson is considered to be an interested person of the Fund under the federal securities laws due to his position as an officer and director of Franklin
Resources, Inc. (Resources), which is the parent company of the Fund’s investment manager and distributor. Jennifer M. Johnson is considered to be an interested person
of the Fund under the federal securities laws due to her position as an officer of Resources. William J. Lippman is considered to be an interested person of the Fund under
the federal securities laws due to his position as a shareholder of Resources and his longstanding former positions as an officer of the Fund’s investment manager and
director of another subsidiary of Resources.
Note 1: Gregory E. Johnson and Jennifer M. Johnson are siblings. Rupert H. Johnson, Jr. is the uncle of Gregory E. Johnson and Jennifer M. Johnson.
Note 2: Officer information is current as of the date of this report. It is possible that after this date, information about officers may change.
The Sarbanes-Oxley Act of 2002 and Rules adopted by the Securities and Exchange Commission require the Fund to disclose whether the Fund’s Audit Committee
includes at least one member who is an audit committee financial expert within the meaning of such Act and Rules. The Fund’s Board has determined that there is
at least one such financial expert on the Audit Committee and has designated David W. Niemiec as an audit committee financial expert. The Board believes that
Mr. Niemiec qualifies as such an expert in view of his extensive business background and experience. Mr. Niemiec has served as a member of the Fund Audit
Committee since 2013, currently serves as an Advisor to Saratoga Partners and was formerly its Managing Director from 1998 to 2001. Mr. Niemiec was formerly a
director of Emeritus Corporation from 1999 to 2010 and OSI Pharmaceuticals, Inc. from 2006 to 2010, Managing Director of SBC Warburg Dillon Read from 1997 to
1998, and was Vice Chairman from 1991 to 1997 and Chief Financial Officer from 1982 to 1997 of Dillon, Read & Co. Inc. As a result of such background and experi-
ence, the Board believes that Mr. Niemiec has acquired an understanding of generally accepted accounting principles and financial statements, the general
application of such principles in connection with the accounting estimates, accruals and reserves, and analyzing and evaluating financial statements that present a
breadth and level of complexity of accounting issues generally comparable to those of the Fund, as well as an understanding of internal controls and procedures
for financial reporting and an understanding of audit committee functions. Mr. Niemiec is an independent Board member as that term is defined under the applicable
U.S. Securities and Exchange Commission Rules and Releases.
The Statement of Additional Information (SAI) includes additional information about the board members and is available, without charge, upon request.
Shareholders may call (800) DIAL BEN/342-5236 to request the SAI.
| 141
franklintempleton.com Annual Report
FRANKLIN VALUE INVESTORS TRUST
Meeting of Shareholders
Meeting of Shareholders, April 7, 2015, and reconvened on May 18, 2015 and June 5, 2015 (unaudited)
A Special Joint Meeting of Shareholders of Franklin Value Investors Trust (the “Trust”), Franklin Alternative Strategies Funds, Franklin Managed Trust and Franklin Mutual Series Funds was held at the offices of Franklin Templeton Investments, One Franklin Parkway, San Mateo, California on April 7, 2015, and reconvened on May 18, 2015, and June 5, 2015. The purpose of the meeting with respect to the Funds was to elect Trustees of the Trust and to vote on the following Proposals: to approve the use of a “manager of managers” structure whereby a Fund’s investment manager would be able to hire and replace subadvisors without shareholder approval, and to approve an agreement and plan of reorganization that provides for the reorganization of the Trust from its current form of organization as a Massachusetts business trust to a newly formed Delaware statutory trust. At the meeting, the following persons were elected by the shareholders to serve as Independent Trustees of the Trust: Edward I. Altman, Ann Torre Bates, Burton J. Greenwald, Keith Mitchell, David W. Niemiec, Charles Rubens II, Jan Hopkins Trachtman, Robert E. Wade and Gregory H. Williams. Gregory E. Johnson, Jennifer M. Johnson and William J. Lippman were elected by the shareholders to serve as Interested Trustees. Shareholders of each Fund also approved the use of a “manager of managers” structure and an agreement and plan of reorganization that provides for the reorganization of the Trust from its current form of organization as a Massachusetts business trust to a newly formed Delaware statutory trust. No other business was transacted at the meeting with respect to the Funds.
| | | | | | | | | | |
| The results of the voting at the meeting are as follows: | | | | | | | | |
| |
| Proposal 1. The Election of Trustees: | | | | | | | | | |
| |
| | | % of | | | | | % of | | | |
| | | Outstanding | | % of Shares | | | Outstanding | | % of Shares | |
| Name | For | Shares | | Present | | Withheld | Shares | | Present | |
| Edward I. Altman | 68,047,235.878 | 56.598 | % | 97.219 | % | 1,946,561.682 | 1.619 | % | 2.781 | % |
| Ann Torre Bates | 68,023,324.205 | 56.578 | % | 97.185 | % | 1,970,473.355 | 1.639 | % | 2.815 | % |
| Burton J. Greenwald | 67,939,172.924 | 56.508 | % | 97.065 | % | 2,054,624.636 | 1.709 | % | 2.935 | % |
| Keith Mitchell | 68,111,291.108 | 56.651 | % | 97.310 | % | 1,882,506.452 | 1.566 | % | 2.690 | % |
| David W. Niemiec | 68,083,121.597 | 56.628 | % | 97.270 | % | 1,910,675.963 | 1.589 | % | 2.730 | % |
| Charles Rubens II | 67,914,293.793 | 56.487 | % | 97.029 | % | 2,079,503.767 | 1.730 | % | 2.971 | % |
| Jan Hopkins Trachtman | 68,026,346.174 | 56.581 | % | 97.189 | % | 1,967,451.386 | 1.636 | % | 2.811 | % |
| Robert E. Wade | 68,079,510.684 | 56.625 | % | 97.265 | % | 1,914,286.876 | 1.592 | % | 2.735 | % |
| Gregory H. Williams | 68,074,016.329 | 56.620 | % | 97.257 | % | 1,919,781.231 | 1.597 | % | 2.743 | % |
| Gregory E. Johnson | 68,046,472.582 | 56.597 | % | 97.218 | % | 1,947,324.978 | 1.620 | % | 2.782 | % |
| Jennifer M. Johnson | 68,084,028.824 | 56.629 | % | 97.272 | % | 1,909,768.736 | 1.588 | % | 2.728 | % |
| William J. Lippman | 68,031,751.520 | 56.585 | % | 97.197 | % | 1,962,046.040 | 1.632 | % | 2.803 | % |
142 |
Annual Report franklintempleton.com
FRANKLIN VALUE INVESTORS TRUST
SHAREHOLDER INFORMATION
Proposal 3. To approve the use of a “manager of managers” structure whereby the Fund’s investment manager would be able to hire and replace subadvisors without shareholder approval.
| | | | | |
| | | % of | | | |
| | Shares | Outstanding | | % of Shares | |
| Franklin All Cap Value Fund | Voted | Shares | | Present | |
| For | 2,341,324.915 | 50.817 | % | 70.134 | % |
| Against | 164,514.875 | 3.571 | % | 4.928 | % |
| Abstain | 51,742.751 | 1.123 | % | 1.550 | % |
| Broker Non-Votes | 780,756.000 | 16.946 | % | 23.388 | % |
| |
| | | % of | | | |
| Franklin Balance Sheet | Shares | Outstanding | | % of Shares | |
| Investment Fund | Voted | Shares | | Present | |
| For | 15,906,350.135 | 49.895 | % | 75.061 | % |
| Against | 1,280,570.128 | 4.017 | % | 6.043 | % |
| Abstain | 690,617.918 | 2.166 | % | 3.259 | % |
| Broker Non-Votes | 3,313,645.000 | 10.394 | % | 15.637 | % |
| |
| | | % of | | | |
| | Shares | Outstanding | | % of Shares | |
| Franklin Large Cap Value Fund | Voted | Shares | | Present | |
| For | 6,011,402.586 | 49.585 | % | 73.752 | % |
| Against | 479,980.628 | 3.959 | % | 5.889 | % |
| Abstain | 218,228.918 | 1.800 | % | 2.677 | % |
| Broker Non-Votes | 1,441,216.000 | 11.888 | % | 17.682 | % |
| |
| | | % of | | | |
| | Shares | Outstanding | | % of Shares | |
| Franklin MicroCap Value Fund | Voted | Shares | | Present | |
| For | 6,315,701.002 | 51.588 | % | 75.163 | % |
| Against | 342,497.660 | 2.798 | % | 4.076 | % |
| Abstain | 182,275.363 | 1.489 | % | 2.169 | % |
| Broker Non-Votes | 1,562,206.000 | 12.760 | % | 18.592 | % |
| |
| | | % of | | | |
| | Shares | Outstanding | | % of Shares | |
| Franklin MidCap Value Fund | Voted | Shares | | Present | |
| For | 5,108,149.948 | 50.107 | % | 72.142 | % |
| Against | 384,605.359 | 3.773 | % | 5.432 | % |
| Abstain | 173,108.143 | 1.698 | % | 2.445 | % |
| Broker Non-Votes | 1,414,825.000 | 13.879 | % | 19.981 | % |
| |
| | | % of | | | |
| | Shares | Outstanding | | % of Shares | |
| Franklin Small Cap Value Fund | Voted | Shares | | Present | |
| For | 24,625,751.919 | 50.070 | % | 72.080 | % |
| Against | 1,466,388.537 | 2.982 | % | 4.292 | % |
| Abstain | 788,701.447 | 1.604 | % | 2.309 | % |
| Broker Non-Votes | 7,283,522.000 | 14.810 | % | 21.319 | % |
| 143
franklintempleton.com Annual Report
FRANKLIN VALUE INVESTORS TRUST
SHAREHOLDER INFORMATION
Proposal 4. To approve an agreement and plan of reorganization that provides for the reorganization of the Trust from its current form of organization as a Massachusetts business trust to a newly formed Delaware statutory trust.
| | | | | |
| | | % of | | | |
| | Shares | Outstanding | | % of Shares | |
| Franklin All Cap Value Fund | Voted | Shares | | Present | |
| For | 2,404,064.142 | 52.179 | % | 72.013 | % |
| Against | 63,881.044 | 1.387 | % | 1.914 | % |
| Abstain | 89,631.355 | 1.945 | % | 2.685 | % |
| Broker Non-Votes | 780,762.000 | 16.946 | % | 23.388 | % |
| |
| | | % of | | | |
| Franklin Balance Sheet | Shares | Outstanding | | % of Shares | |
| Investment Fund | Voted | Shares | | Present | |
| For | 16,212,155.515 | 50.854 | % | 76.504 | % |
| Against | 761,584.713 | 2.389 | % | 3.594 | % |
| Abstain | 903,797.953 | 2.835 | % | 4.265 | % |
| Broker Non-Votes | 3,313,645.000 | 10.394 | % | 15.637 | % |
| |
| | | % of | | | |
| | Shares | Outstanding | | % of Shares | |
| Franklin Large Cap Value Fund | Voted | Shares | | Present | |
| For | 6,133,045.865 | 50.588 | % | 75.244 | % |
| Against | 243,719.993 | 2.011 | % | 2.990 | % |
| Abstain | 332,840.274 | 2.745 | % | 4.084 | % |
| Broker Non-Votes | 1,441,222.000 | 11.888 | % | 17.682 | % |
| |
| | | % of | | | |
| | Shares | Outstanding | | % of Shares | |
| Franklin MicroCap Value Fund | Voted | Shares | | Present | |
| For | 6,354,526.593 | 51.905 | % | 75.625 | % |
| Against | 199,792.657 | 1.633 | % | 2.378 | % |
| Abstain | 286,140.775 | 2.337 | % | 3.405 | % |
| Broker Non-Votes | 1,562,220.000 | 12.760 | % | 18.592 | % |
| |
| | | % of | | | |
| | Shares | Outstanding | | % of Shares | |
| Franklin MidCap Value Fund | Voted | Shares | | Present | |
| For | 5,219,571.635 | 51.200 | % | 73.715 | % |
| Against | 165,935.945 | 1.628 | % | 2.344 | % |
| Abstain | 280,349.870 | 2.750 | % | 3.959 | % |
| Broker Non-Votes | 1,414,831.000 | 13.879 | % | 19.982 | % |
| |
| | | % of | | | |
| | Shares | Outstanding | | % of Shares | |
| Franklin Small Cap Value Fund | Voted | Shares | | Present | |
| For | 24,985,888.282 | 50.803 | % | 73.134 | % |
| Against | 793,650.382 | 1.614 | % | 2.323 | % |
| Abstain | 1,101,303.239 | 2.239 | % | 3.224 | % |
| Broker Non-Votes | 7,283,522.000 | 14.810 | % | 21.319 | % |
144 |
Annual Report franklintempleton.com
FRANKLIN VALUE INVESTORS TRUST
Shareholder Information
Proxy Voting Policies and Procedures
The Trust’s investment manager has established Proxy Voting Policies and Procedures (Policies) that the Trust uses to determine how to vote proxies relating to portfolio securities. Shareholders may view the Trust’s complete Policies online at franklintempleton.com. Alternatively, shareholders may request copies of the Policies free of charge by calling the Proxy Group collect at (954) 527-7678 or by sending a written request to: Franklin Templeton Companies, LLC, 300 S.E. 2nd Street, Fort Lauderdale, FL 33301, Attention: Proxy Group. Copies of the Trust’s proxy voting records are also made available online at franklintempleton.com and posted on the U.S. Securities and Exchange Commission’s website at sec.gov and reflect the most recent 12-month period ended June 30.
Quarterly Statement of Investments
The Trust files a complete statement of investments with the U.S. Securities and Exchange Commission for the first and third quarters for each fiscal year on Form N-Q. Shareholders may view the filed Form N-Q by visiting the Commission’s website at sec.gov. The filed form may also be viewed and copied at the Commission’s Public Reference Room in Washington, DC. Information regarding the operations of the Public Reference Room may be obtained by calling (800) SEC-0330.
Householding of Reports and Prospectuses
You will receive each Fund’s financial reports every six months as well as an annual updated summary prospectus (prospectus available upon request). To reduce Fund expenses, we try to identify related shareholders in a household and send only one copy of the financial reports and summary prospectus. This process, called “householding,” will continue indefinitely unless you instruct us otherwise. If you prefer not to have these documents householded, please call us at (800) 632-2301. At any time you may view current prospectuses/summary prospectuses and financial reports on our website. If you choose, you may receive these documents through electronic delivery.
| 145
franklintempleton.com Annual Report
FVIT P2 11/15
SUPPLEMENT DATED NOVEMBER 2, 2015 TO THE PROSPECTUS DATED MARCH 1, 2015 OF
Franklin Value Investors Trust
(Franklin All Cap Value Fund, Franklin Balance Sheet Investment Fund, Franklin Large Cap Value Fund, Franklin MicroCap Value Fund, Franklin MidCap Value Fund, Franklin Small Cap Value Fund)
The Board of Trustees recently approved a proposal to reorganize Franklin All Cap Value Fund (All Cap Value Fund), with and into Franklin Small Cap Value Fund (Small Cap Value Fund), each a series of Franklin Value Investors Trust.
It is anticipated that in January 2016 shareholders of the All Cap Value Fund will receive a Proxy and Prospectus/Proxy Statement requesting their votes on the reorganization. If approved by All Cap Value Fund shareholders, the transaction is currently expected to be completed on or about April 1, 2016.
Effective at the close of market (1:00 p.m. Pacific time or close of the New York Stock Exchange, whichever is earlier) on December 10, 2015, the Fund will be closed to all new investors except as noted below. Existing investors who had an open and funded account on December 10, 2015 can continue to invest in the Fund through exchanges and additional purchases after such date. The following categories of investors may continue to open new accounts in the Fund after the close of market on December 10, 2015, (1) clients of discretionary investment allocation programs where such programs had investments in the Fund prior to the close of market on December 10, 2015, and (2) Employer Sponsored Retirement Plans or benefit plans and their participants where the Fund was available to participants prior to the close of market on December 10, 2015. The All Cap Value Fund will not accept any additional purchases after the close of market on March 24, 2016. All Cap Value Fund reserves the right to change this policy at any time.
Please keep this supplement with your prospectus for future reference.
This page intentionally left blank.
This page intentionally left blank.

Annual Report and Shareholder Letter
Franklin Value Investors Trust
Investment Managers
Franklin Advisory Services, LLC
Distributor
Franklin Templeton Distributors, Inc.
(800) DIAL BEN® / 342-5236
franklintempleton.com
Shareholder Services
(800) 632-2301
Authorized for distribution only when accompanied or preceded by a summary prospectus and/or prospectus. Investors should carefully consider a fund’s investment goals, risks, charges and expenses before investing. A prospectus contains this and other information; please read it carefully before investing.
To help ensure we provide you with quality service, all calls to and from our service areas are monitored and/or recorded.
| |
| © 2015 Franklin Templeton Investments. All rights reserved. | FVIT A 12/15 |
Item 2. Code of Ethics.
(a) The Registrant has adopted a code of ethics that applies to its principal executive officers and principal financial and accounting officer.
(c) N/A
(d) N/A
(f) Pursuant to Item 12(a)(1), the Registrant is attaching as an exhibit a copy of its code of ethics that applies to its principal executive officers and principal financial and accounting officer.
Item 3. Audit Committee Financial Expert.
(a)(1) The Registrant has an audit committee financial expert serving on its audit committee.
(2) The audit committee financial expert is David W. Niemiec and he is "independent" as defined under the relevant Securities and Exchange Commission Rules and Releases.
Item 4. Principal Accountant Fees and Services.
(a) Audit Fees
The aggregate fees paid to the principal accountant for professional services rendered by the principal accountant for the audit of the registrant’s annual financial statements or for services that are normally provided by the principal accountant in connection with statutory and regulatory filings or engagements were $180,698 for the fiscal year ended October 31, 2015 and $181,547 for the fiscal year ended October 31, 2014.
(b) Audit-Related Fees
The aggregate fees paid to the principal accountant for assurance and related services rendered by the principal accountant to the registrant that are reasonably related to the performance of the audit of the registrant's financial statements and are not reported under paragraph
(a) of Item 4 were $2,952 for the fiscal year ended October 31, 2015 and $2,894 for the fiscal year ended October 31, 2014. The services for which these fees were paid included attestation services.
There were no fees paid to the principal accountant for assurance and related services rendered by the principal accountant to the registrant's investment adviser and any entity controlling, controlled by or under common control with the investment adviser that provides ongoing services to the registrant that are reasonably related to the performance of the audit of their financial statements.
(c)Tax Fees
There were no fees paid to the principal accountant for professional services rendered by the principal accountant to the registrant for tax compliance, tax advice and tax planning.
There were no fees paid to the principal accountant for professional services rendered by the principal accountant to the registrant’s investment adviser and any entity controlling, controlled by or under common control with the investment adviser that provides ongoing services to the registrant for tax compliance, tax advice and tax planning.
(d) All Other Fees
The aggregate fees paid to the principal accountant for products and services rendered by the principal accountant to the registrant not reported in paragraphs (a)-(c) of Item 4 were $0 for the fiscal year ended October 31, 2015 and $1,528 for the fiscal year ended October 31, 2014. The services for which these fees were paid include review of materials provided to the fund Board in connection with the investment management contract renewal process.
The aggregate fees paid to the principal accountant for products and services rendered by the principal accountant to the registrant’s investment adviser and any entity controlling, controlled by or under common control with the investment adviser that provides ongoing services to the registrant not reported in paragraphs (a)-(c) of Item 4 were $9,000 for the fiscal year ended October 31, 2015 and $158,208 for the fiscal year ended October 31, 2014. The services for which these fees were paid include preparation and review of materials provided to the fund Board in connection with the investment management contract renewal process.
(e) (1) The registrant’s audit committee is directly responsible for approving the services to be provided by the auditors, including:
(i) pre-approval of all audit and audit related services;
(ii) pre-approval of all non-audit related services to be provided to the Fund by the auditors;
(iii) pre-approval of all non-audit related services to be provided to the registrant by the auditors to the registrant’s investment adviser or to any entity that controls, is controlled by or is under common control with the registrant’s investment adviser and that provides ongoing services to the registrant where the non-audit services relate directly to the operations or financial reporting of the registrant; and
(iv) establishment by the audit committee, if deemed necessary or appropriate, as an alternative to committee pre-approval of services to be provided by the auditors, as required by paragraphs (ii) and (iii) above, of policies and procedures to permit such services to be pre-approved by other means, such as through establishment of guidelines or by action of a designated member or members of the committee; provided the policies and procedures are detailed as to the particular service and the committee is informed of each service and such policies and procedures do not include delegation of audit committee responsibilities, as contemplated under the Securities Exchange Act of 1934, to management; subject, in the case of (ii) through (iv), to any waivers, exceptions or exemptions that may be available under applicable law or rules.
(e) (2) None of the services provided to the registrant described in paragraphs (b)-(d) of Item 4 were approved by the audit committee pursuant to paragraph (c)(7)(i)(C) of Rule 2-01 of regulation S-X.
(f) No disclosures are required by this Item 4(f).
(g) The aggregate non-audit fees paid to the principal accountant for services rendered by the principal accountant to the registrant and the registrant’s investment adviser and any entity controlling, controlled by or under common control with the investment adviser that provides ongoing services to the registrant were $11,952 for the fiscal year ended October 31, 2015 and $162,630 for the fiscal year ended October 31, 2014.
(h) The registrant’s audit committee of the board has considered whether the provision of non-audit services that were rendered to the registrant’s investment adviser (not including any sub-adviser whose role is primarily portfolio management and is subcontracted with or overseen by another investment adviser), and any entity controlling, controlled by, or under common control with the investment adviser that provides ongoing services to the registrant that were not pre-approved pursuant to paragraph (c)(7)(ii) of Rule 2-01 of Regulation S-X is compatible with maintaining the principal accountant’s independence.
Item 5. Audit Committee of Listed Registrants. N/A
Item 6. Schedule of Investments. N/A
Item 7. Disclosure of Proxy Voting Policies and Procedures for Closed-End Management Investment Companies. N/A
Item 8. Portfolio Managers of Closed-End Management Investment Companies. N/A
Item 9. Purchases of Equity Securities by Closed-End Management Investment Company and Affiliated Purchasers. N/A
Item 10. Submission of Matters to a Vote of Security Holders.
There have been no changes to the procedures by which shareholders may recommend nominees to the Registrant's Board of Trustees that would require disclosure herein.
Item 11. Controls and Procedures.
(a) Evaluation of Disclosure Controls and Procedures. The Registrant maintains disclosure controls and procedures that are designed to ensure that information required to be disclosed in the Registrant’s filings under the Securities Exchange Act of 1934 and the Investment Company Act of 1940 is recorded, processed, summarized and reported within the periods specified in the rules and forms of the Securities and Exchange Commission. Such information is accumulated and communicated to the Registrant’s management, including its principal executive officer and principal financial officer, as appropriate, to allow timely decisions regarding required disclosure. The Registrant’s management, including the principal executive officer and the principal financial officer, recognizes that any set of controls and procedures, no matter how well designed and operated, can provide only reasonable assurance of achieving the desired control objectives.
Within 90 days prior to the filing date of this Shareholder Report on Form N-CSR, the Registrant had carried out an evaluation, under the supervision and with the participation of the Registrant’s management, including the Registrant’s principal executive officer and the Registrant’s principal financial officer, of the effectiveness of the design and operation of the Registrant’s disclosure controls and procedures. Based on such evaluation, the Registrant’s principal executive officer and principal financial officer concluded that the Registrant’s disclosure controls and procedures are effective.
(b) Changes in Internal Controls. There have been no changes in the Registrant’s internal controls or in other factors that could materially affect the internal controls over financial reporting subsequent to the date of their evaluation in connection with the preparation of this Shareholder Report on Form N-CSR.
Item 12. Exhibits.
(a) (1) Code of Ethics
(a)(2) Certifications pursuant to Section 302 of the Sarbanes-Oxley Act of 2002 of Laura F. Fergerson, Chief Executive Officer - Finance and Administration, and Robert G. Kubilis, Chief Financial Officer and Chief Accounting Officer
(b) Certifications pursuant to Section 906 of the Sarbanes-Oxley Act of 2002 of Laura F. Fergerson, Chief Executive Officer - Finance and Administration, and Robert G. Kubilis, Chief Financial Officer and Chief Accounting Officer
SIGNATURES
Pursuant to the requirements of the Securities Exchange Act of 1934 and the Investment Company Act of 1940, the registrant has duly caused this report to be signed on its behalf by the undersigned, thereunto duly authorized.
FRANKLIN VALUE INVESTORS TRUST
By /s/Laura F. Fergerson
Laura F. Fergerson
Chief Executive Officer –
Finance and Administration
Date December 28, 2015
Pursuant to the requirements of the Securities Exchange Act of 1934 and the Investment Company Act of 1940, this report has been signed below by the following persons on behalf of the registrant and in the capacities and on the dates indicated.
By /s/Laura F. Fergerson
Laura F. Fergerson
Chief Executive Officer –
Finance and Administration
Date December 28, 2015
By /s/Robert G. Kubilis
Robert G. Kubilis
Chief Financial Officer and
Chief Accounting Officer
Date December 28, 2015