UNITED STATES
SECURITIES AND EXCHANGE COMMISSION
Washington, DC 20549
FORM N-CSR
CERTIFIED SHAREHOLDER REPORT OF REGISTERED
MANAGEMENT INVESTMENT COMPANIES
Investment Company Act file number 811-05878
Franklin Value Investors Trust
(Exact name of registrant as specified in charter)
One Franklin Parkway, San Mateo, CA 94403-1906
(Address of principal executive offices) (Zip code)
Craig S. Tyle, One Franklin Parkway, San Mateo, CA 94403-1906
(Name and address of agent for service)
Registrant’s telephone number, including area code: 650 312-2000
Date of fiscal year end: 10/31
Date of reporting period: 10/31/17
Item 1. Reports to Stockholders.
| | | | | | |
| | 
| | | | Annual Report and Shareholder Letter October 31, 2017 |
Sign up for electronic delivery at franklintempleton.com/edelivery
Franklin Templeton Investments
Gain From Our Perspective®
At Franklin Templeton Investments, we’re dedicated to one goal: delivering exceptional asset management for our clients. By bringing together multiple, world-class investment teams in a single firm, we’re able to offer specialized expertise across styles and asset classes, all supported by the strength and resources of one of the world’s largest asset managers. This has helped us to become a trusted partner to individual and institutional investors across the globe.
Dear Shareholder:
During the 12 months ended October 31, 2017, equity markets moved steadily upwards. The Standard & Poor’s 500® Index (S&P 500®) posted a +23.63% total return and the MSCI World Index delivered a +23.46% total return.1 The political uncertainty of recent years has continued in 2017. In the US, President Trump has continued his unconventional governance approach, while Congress has remained relentlessly partisan, leading to significant uncertainty about policies and legislation. The financial markets expected “business friendly” moves, but specific legislative progress on issues such as health care, tax reform and infrastructure have yet to come to fruition. In the UK, a surprise election was called in April when the Conservative Party held a huge polling lead, but at the June election the Tories lost their majority in Parliament. Recent elections in France and Germany provided some much appreciated stability.
Despite the aforementioned and generally unsettling events, the global economy continued its slow expansion since the Great Recession. Unemployment also continued to decline in the US and most other developed markets. Wage growth showed signs of strengthening, and the US Federal Reserve announced the start of its balance-sheet reduction program and raised interest rates, perhaps signaling the next steps toward monetary normalization.
Equity markets appreciated as economic fundamentals improved. Valuation is, of course, a critical factor in our analysis and we always ask ourselves if current and potential investments represent an attractive balance of risk and reward.
As some equity markets reached all-time highs, we maintained our focus on individual investments and the prospects for each business in the context of its valuation and the backdrop of potential political and economic risks.
In many equity markets, growth stocks outperformed value stocks during the period. For example, among large-cap stocks, the Russell 1000® Growth Index returned +29.71%, while the Russell 1000® Value Index returned +17.78%.1 Within the small-cap universe, the Russell 2000® Growth Index returned +31.00%, while the Russell 2000® Value Index returned +24.81%.1 Among higher capitalization stocks, the differences in performance were driven in part by a significant rally in internet and software stocks, which provided a meaningful boost to growth indexes. We do not know how long these trends will continue, but historically, periods of strong performance by growth stocks have eventually been followed by relatively weaker performance. Another factor that contributed to the outperformance of growth stocks was the relatively greater exposure that value indexes have to areas of the economy that we believe are facing disruption from new technology (e.g., the rapid market share shift to online retailing from traditional bricks and mortar dominated retailers that are often labeled as value stocks). Exacerbating the disruption is the reality that many new technology companies are able to innovate without the need to show immediate profits. Among smaller capitalization stocks, a notable difference in performance was a greater exposure to the weak performing
1. Source: Morningstar.
Frank Russell Company is the source and owner of the trademarks, service marks and copyrights related to the Russell Indexes. Russell® is a trademark of Frank Russell Company.
See www.franklintempletondatasources.com for additional data provider information.
|
| Not FDIC Insured | May Lose Value | No Bank Guarantee |
| | | | | | |
| franklintempleton.com | | Not part of the annual report | | | 1 | |
energy sector, driven lower by concerns of excess supply and perceived technological disruptions.
Amid dynamic markets and evolving economic conditions, we believe active, professional investment management serves investors well. We also recognize the important role of financial advisors in today’s markets and encourage investors to continue to seek their advice. Amid changing markets and economic conditions, we are confident investors with a well-diversified portfolio and a patient, long-term outlook will be well positioned for the years ahead.
On the following pages, the Fund’s portfolio management team reviews investment decisions made during the past 12 months in light of the economic environment as well as industry and company-specific factors. Please remember all securities markets fluctuate, as do mutual fund share prices. We thank you for investing with Franklin Templeton, welcome your questions and comments, and look forward to continuing to serve your investment needs in the years ahead.
Sincerely,

Peter A. Langerman
Chief Executive Officer – Investment Management
Franklin Value Investors Trust
This letter reflects our analysis and opinions as of October 31, 2017, unless otherwise indicated. The information is not a complete analysis of every aspect of any market, country, industry, security or fund. Statements of fact are from sources considered reliable.
Contents
Annual Report
Visit franklintempleton.com for fund updates, to access your account, or to find helpful financial planning tools.
| | | | | | |
| | 2 | | | Not part of the annual report | | franklintempleton.com |
Annual Report
Economic and Market Overview
The US economy expanded during the 12-month period ended October 31, 2017. After moderating in the first quarter, the economy strengthened in 2017’s second quarter, largely due to growth in consumer spending, business investment, net exports and federal government spending. In 2017’s third quarter, the economy expanded at a faster pace. Consumer and federal government spending slowed, while business investment and net exports improved. The manufacturing and services sectors expanded during the period. The unemployment rate declined from 4.8% in October 2016, as reported at the beginning of the 12-month period, to 4.1% at period-end.1 Monthly retail sales were volatile, but were positive during most of the period. Annual inflation, as measured by the Consumer Price Index, increased from 1.6% in October 2016, as reported at the beginning of the 12-month period, to 2.0% at period-end.
The US Federal Reserve (Fed) raised its target range for the federal funds rate 0.25% three times during the period, amid signs of a growing US economy, strengthening labor market, and improving business spending. At its July and September 2017 meetings, the Fed kept its target range unchanged. Furthermore in September, the Fed mentioned that it would begin implementing its balance sheet reduction in October. The minutes of the Fed’s September meeting released in October suggested that many committee members were concerned that low inflation readings this year might not be transitory and could be more persistent than expected.
US equity markets rose during the 12-month period, benefiting from mostly upbeat economic data, better US corporate earnings, and signs of improvement in the Chinese and European economies. The markets were also supported by investor optimism arising from pro-growth and pro-business policy plans in the US, Emmanuel Macron’s victory in France’s presidential election, comments from the US Fed chair indicating optimism about the US economy and the likelihood of gradual rate hikes, and the Senate’s approval of a budget plan that raised expectations for tax reforms. However, continuing concerns about the terms of the UK’s exit from the European Union (also known as “Brexit”), uncertainty about President Trump’s ability to implement reforms, and geopolitical tensions in the Middle East and the Korean peninsula curbed market sentiment at times. Nevertheless, the broad US stock market, as measured by the Standard & Poor’s® 500 Index, generated a +23.63% total return for the period.2
The foregoing information reflects our analysis and opinions as of October 31, 2017. The information is not a complete analysis of every aspect of any market, country, industry, security or fund. Statements of fact are from sources considered reliable.
1. Source: Bureau of Labor Statistics.
2. Source: Morningstar.
See www.franklintempletondatasources.com for additional data provider information.
| | | | | | |
| franklintempleton.com | | Annual Report | | | 3 | |
Franklin Balance Sheet Investment Fund
We are pleased to bring you Franklin Balance Sheet Investment Fund’s annual report for the fiscal year ended October 31, 2017.
Your Fund’s Goal and Main Investments
The Fund seeks high total return, of which capital appreciation and income are components, by investing most of its assets in equity securities of companies of any size that we believe are undervalued in the marketplace at the time of purchase but have the potential for capital appreciation. The Fund invests predominantly in common stocks.
Performance Overview
The Fund’s Class A shares delivered a +23.63% cumulative total return for the 12 months under review. In comparison, the Russell 3000® Value Index, which measures performance of those Russell 3000® Index companies with generally lower price-to-book ratios and lower forecasted growth values than companies listed in other stock indexes, generated a +18.30% total return for the same period.1 You can find more of the Fund’s performance data in the Performance Summary beginning on page 7.
Performance data represent past performance, which does not guarantee future results. Investment return and principal value will fluctuate, and you may have a gain or loss when you sell your shares. Current performance may differ from figures shown. For most recent month-end performance, go to franklintempleton.com or call (800) 342-5236.
Investment Strategy
Our strategy uses low price-to-book value as its primary reference valuation measure. Book value per share is a company’s net worth or shareholders’ equity on an accounting or “book” basis, divided by shares outstanding. The equity securities bought by the Fund will typically be purchased at a low price relative to book value. This strategy is not aimed at short-term trading gains, and we do not attempt to mirror the component securities of the benchmark index. Rather, we try to identify individual companies that meet our investment criteria, with a three- to five-year investment horizon. We may invest in companies of any size, across the entire market capitalization spectrum including smaller and midsize companies.
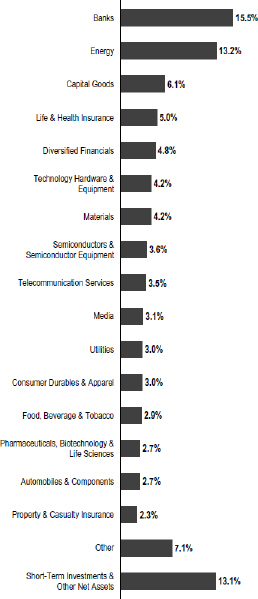
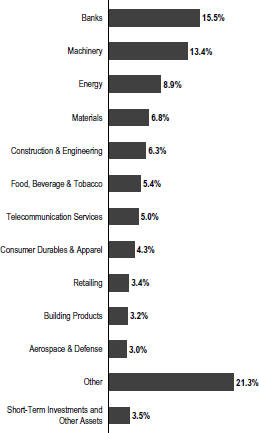
Portfolio Composition
Based on Total Net Assets as of 10/31/17
1. Source: Morningstar.
The index is unmanaged and includes reinvestment of any income or distributions. It does not reflect any fees, expenses or sales charges. One cannot invest directly in an index, and an index is not representative of the Fund’s portfolio.
See www.franklintempletondatasources.com for additional data provider information.
The dollar value, number of shares or principal amount, and names of all portfolio holdings are listed in the Fund’s Statement of Investments (SOI). The SOI begins on page 37.
| | | | |
| 4 | | Annual Report | | franklintempleton.com |
FRANKLIN BALANCE SHEET INVESTMENT FUND
Manager’s Discussion
During the 12 months under review, holdings that positively contributed to Fund performance included Corning, MKS Instruments and JP Morgan Chase.
Corning, a leading innovator in the discovery and design of new glass and ceramics materials, was the largest Fund position at period-end. The company’s recent financial results showed improving trends in its glass display and fiber optics businesses and earnings for the past several quarters beat analysts’ expectations. Corning continues to offer what we consider to be attractive growth opportunities through its science, technology and innovation in the specialty glass market, where the company’s products are breaking into new end markets such as automotive, life sciences and and fiber optics for data centers. The company exhibited, in our view, excellent value characteristics, such as strong free cash flow, low capital requirements, an increasing dividend and large share repurchases.
MKS Instruments provides subsystems solutions and instruments to semiconductor and other technology-centered manufacturing industries. During the period, MKS benefited from strong industry trends, while its operating model improvements drove its target profitability progressively higher. These factors, combined with the company’s diversification away from semiconductors through the acquisition of laser manufacturer Newport and paydown of its debt, led to higher market valuations.
JPMorgan Chase is a global financial institution with a diverse array of leading financial services franchises spanning consumer banking, commercial banking, asset management and investment banking. Its shares appreciated throughout the period, initially due to the perception of diminished regulation following Donald Trump’s presidential election victory in November 2016, but later from the specter of higher interest rates, accelerating economic growth and a benign credit environment.
Detractors from Fund performance included Cloud Peak Energy, Allergan and Trinity Place.
Cloud Peak Energy mines thermal coal in the Powder River Basin of Wyoming and Montana. Warm winters and regulatory pressures have diminished domestic demand for Cloud Peak’s coal. Additionally, low global prices and a strong dollar have undercut export volumes that Cloud Peak needs to operate profitably. As a result of long term structural concerns surrounding demand for thermal coal, we have exited the position.
Allergan experienced an adverse outcome during the period when a federal district court invalidated patents covering a top selling drug for the company. This potentially opens the door for generic competition earlier than the market anticipated. In addition, a drug in the company’s pipeline received some adverse clinical data which lowered investors’ expectations for future growth.
Trinity Place is a real estate development company that requires capital for the development of its landmark New York City assets. The stock sold off after the company announced it would allow existing stockholders to buy additional shares at below market prices to fund a development.
Top 10 Holdings
10/31/17
| | | | |
Company
Sector/Industry | | % of Total
Net Assets | |
Corning Inc.
Technology Hardware & Equipment | | | 4.2% | |
JPMorgan Chase & Co.
Banks | | | 3.6% | |
Royal Dutch Shell PLC (UK)
Energy | | | 3.2% | |
Bank of America Corp.
Banks | | | 3.2% | |
Toll Brothers Inc.
Consumer Durables & Apparel | | | 2.4% | |
Morgan Stanley
Diversified Financials | | | 2.4% | |
Citigroup Inc.
Banks | | | 2.3% | |
General Motors Co.
Automobiles & Components | | | 2.3% | |
Chevron Corp.
Energy | | | 2.0% | |
MKS Instruments Inc.
Semiconductors & Semiconductor Equipment | | | 2.0% | |
During the reporting period, several large new purchases included Bank of America, a multinational banking and financial services corporation; The Bank of New York Mellon, a banking and financial services holding company; TimkenSteel, a steel manufacturer; DSW, a footwear retailer; and the aforementioned Allergan, among several others. We also added to existing positions including Royal Dutch Shell, an oil and gas exploration company; Chevron, a large integrated energy company; and The Mosaic Company, a producer of fertilizers.
In contrast, the Fund’s largest liquidations included Century Aluminum, Rogers and Brooks Automation. We also reduced
| | | | | | |
| franklintempleton.com | | Annual Report | | | 5 | |
FRANKLIN BALANCE SHEET INVESTMENT FUND
several holdings including Citizens Financial Group, Comerica and the aforementioned MKS Instruments.
Thank you for your participation in Franklin Balance Sheet Investment Fund. We look forward to continuing to serve your investment needs.
| | |

| |  |
| | Grace Hoefig Lead Portfolio Manager |
| |
| | Daniel Perrin, CFA |
| |
| | Portfolio Management Team |
The foregoing information reflects our analysis, opinions and portfolio holdings as of October 31, 2017, the end of the reporting period. The way we implement our main investment strategies and the resulting portfolio holdings may change depending on factors such as market and economic conditions. These opinions may not be relied upon as investment advice or an offer for a particular security. The information is not a complete analysis of every aspect of any market, country, industry, security or the Fund. Statements of fact are from sources considered reliable, but the investment manager makes no representation or warranty as to their completeness or accuracy. Although historical performance is no guarantee of future results, these insights may help you understand our investment management philosophy.
|
Grace Hoefig is a vice president and portfolio manager for Franklin Equity Group’s US Value Team. She is the lead manager for the Franklin Balance Sheet Investment Fund and has more than 25 years of investment experience. Ms. Hoefig joined Franklin in 2008 as a research analyst for the Franklin Balance Sheet Investment Fund. She was named co-lead manager in 2012 and vice president and lead manager of the Fund in 2015. Before joining Franklin Templeton Investments in February 2008, Ms. Hoefig was a managing director at AXIA Capital Management LLC., and has held senior analyst positions at Heine Securities Co., First Manhattan Co. and Neuberger & Berman. Ms. Hoefig received a B.A. in environmental science from St. Michael’s College. |
|
Daniel Perrin joined Franklin Advisory Services as a research analyst in April 2013 Prior to joining Franklin Equity Group’s US Value Team, Mr. Perrin worked as a sector specialist, co-portfolio manager and generalist at various value-oriented investment firms investing globally and across market capitalizations. He began his career with Franklin Templeton in 1996. Mr. Perrin has a B.A. in history from University College London, the University of London, UK. He is a Chartered Financial Analyst (CFA) charterholder. |
| | | | |
| 6 | | Annual Report | | franklintempleton.com |
FRANKLIN BALANCE SHEET INVESTMENT FUND
Performance Summary as of October 31, 2017
The performance table and graphs do not reflect any taxes that a shareholder would pay on Fund dividends, capital gain distributions, if any, or any realized gains on the sale of Fund shares. Total return reflects reinvestment of the Fund’s dividends and capital gain distributions, if any, and any unrealized gains or losses. Your dividend income will vary depending on dividends or interest paid by securities in the Fund’s portfolio, adjusted for operating expenses of each class. Capital gain distributions are net profits realized from the sale of portfolio securities.
Performance as of 10/31/171
Cumulative total return excludes sales charges. Average annual total return includes maximum sales charges. Sales charges will vary depending on the size of the investment and the class of share purchased. The maximum is 5.75% and the minimum is 0%. Class A: 5.75% maximum initial sales charge; Advisor Class: no sales charges. For other share classes, visit franklintempleton.com.
| | | | | | | | |
| Share Class | | Cumulative Total Return2 | | | Average Annual Total Return3 | |
| | |
| A | | | | | | | | |
1-Year | | | +23.63% | | | | +16.52% | |
5-Year | | | +70.75% | | | | +9.99% | |
10-Year | | | +57.19% | | | | +4.01% | |
| | |
| Advisor | | | | | | | | |
1-Year | | | +23.98% | | | | +23.98% | |
5-Year | | | +72.93% | | | | +11.58% | |
10-Year | | | +63.45% | | | | +5.04% | |
Performance data represent past performance, which does not guarantee future results. Investment return and principal value will fluctuate, and you may have a gain or loss when you sell your shares. Current performance may differ from figures shown. For most recent month-end performance, go to franklintempleton.com or call (800) 342-5236.
See page 9 for Performance Summary footnotes.
| | | | | | |
| franklintempleton.com | | Annual Report | | | 7 | |
FRANKLIN BALANCE SHEET INVESTMENT FUND
PERFORMANCE SUMMARY
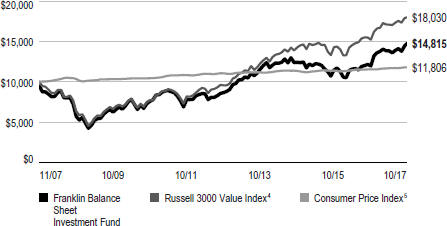
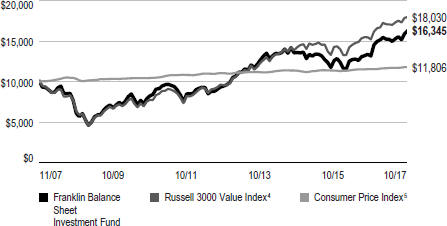
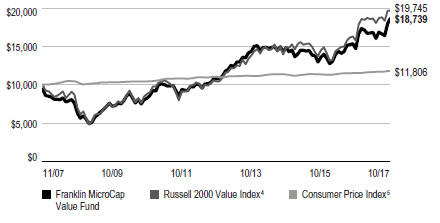
Total Return Index Comparison for a Hypothetical $10,000 Investment1
Total return represents the change in value of an investment over the periods shown. It includes any applicable maximum sales charge, Fund expenses, account fees and reinvested distributions. The unmanaged indexes include reinvestment of any income or distributions. They differ from the Fund in composition and do not pay management fees or expenses. One cannot invest directly in an index.
Class A (11/1/07–10/31/17)
Advisor Class (11/1/07–10/31/17)
See page 9 for Performance Summary footnotes.
| | | | |
| 8 | | Annual Report | | franklintempleton.com |
FRANKLIN BALANCE SHEET INVESTMENT FUND
PERFORMANCE SUMMARY
Distributions (11/1/16–10/31/17)
| | | | | | |
| Share Class | | Net Investment
Income | | Long-Term
Capital Gain | | Total |
A | | $0.1826 | | $2.3089 | | $2.4915 |
C | | — | | $2.3089 | | $2.3089 |
R | | $0.0950 | | $2.3089 | | $2.4039 |
R6 | | $0.2861 | | $2.3089 | | $2.5950 |
Advisor | | $0.2839 | | $2.3089 | | $2.5928 |
Total Annual Operating Expenses6
| | | | | | | | |
| Share Class | | With Waiver | | | Without Waiver | |
A | | | 0.93% | | | | 0.96% | |
Advisor | | | 0.68% | | | | 0.71% | |
Each class of shares is available to certain eligible investors and has different annual fees and expenses, as described in the prospectus.
All investments involve risks, including possible loss of principal. Value securities may not increase in price as anticipated or may decline further in value. While smaller and midsize companies may offer substantial opportunities for capital growth, they may also involve heightened risks and should be considered speculative. Historically, smaller- and midsize- company securities have been more volatile in price than larger-company securities, especially over the short term. In addition, the Fund may invest up to 25% of its total assets in foreign securities, which involve special risks, including currency fluctuations and economic and political uncertainty. The Fund is actively managed but there is no guarantee that the manager’s investment decisions will produce the desired results. The Fund’s prospectus also includes a description of the main investment risks.
1. The Fund has a fee waiver associated with any investment it makes in a Franklin Templeton money fund and/or other Franklin Templeton fund, contractually guaranteed through 2/28/18. Fund investment results reflect the fee waiver; without this waiver, the results would have been lower.
2. Cumulative total return represents the change in value of an investment over the periods indicated.
3. Average annual total return represents the average annual change in value of an investment over the periods indicated. Return for less than one year, if any, has not been annualized.
4. Source: Morningstar. The Russell 3000 Value Index is market capitalization weighted and measures performance of those Russell 3000 Index companies with lower price-to-book ratios and lower forecasted growth values.
5. Source: Bureau of Labor Statistics, bls.gov/cpi. The Consumer Price Index is a commonly used measure of the inflation rate.
6. Figures are as stated in the Fund’s current prospectus and may differ from the expense ratios disclosed in the Your Fund’s Expenses and Financial Highlights sections in this report. In periods of market volatility, assets may decline significantly, causing total annual Fund operating expenses to become higher than the figures shown.
See www.franklintempletondatasources.com for additional data provider information.
| | | | |
| franklintempleton.com | | Annual Report | | 9 |
FRANKLIN BALANCE SHEET INVESTMENT FUND
Your Fund’s Expenses
As a Fund shareholder, you can incur two types of costs: (1) transaction costs, including sales charges (loads) on Fund purchases and redemptions; and (2) ongoing Fund costs, including management fees, distribution and service (12b-1) fees, and other Fund expenses. All mutual funds have ongoing costs, sometimes referred to as operating expenses. The table below shows ongoing costs of investing in the Fund and can help you understand these costs and compare them with those of other mutual funds. The table assumes a $1,000 investment held for the six months indicated.
Actual Fund Expenses
The table below provides information about actual account values and actual expenses in the columns under the heading “Actual.” In these columns the Fund’s actual return, which includes the effect of Fund expenses, is used to calculate the “Ending Account Value” for each class of shares. You can estimate the expenses you paid during the period by following these steps (of course, your account value and expenses will differ from those in this illustration): Divide your account value by $1,000 (if your account had an $8,600 value, then $8,600 ÷ $1,000 = 8.6). Then multiply the result by the number in the row for your class of shares under the headings “Actual” and “Expenses Paid During Period” (if Actual Expenses Paid During Period were $7.50, then 8.6 x $7.50 = $64.50). In this illustration, the actual expenses paid this period are $64.50.
Hypothetical Example for Comparison with Other Funds
Under the heading “Hypothetical” in the table, information is provided about hypothetical account values and hypothetical expenses based on the Fund’s actual expense ratio and an assumed rate of return of 5% per year before expenses, which is not the Fund’s actual return. This information may not be used to estimate the actual ending account balance or expenses you paid for the period, but it can help you compare ongoing costs of investing in the Fund with those of other funds. To do so, compare this 5% hypothetical example for the class of shares you hold with the 5% hypothetical examples that appear in the shareholder reports of other funds.
Please note that expenses shown in the table are meant to highlight ongoing costs and do not reflect any transactional costs. Therefore, information under the heading “Hypothetical” is useful in comparing ongoing costs only, and will not help you compare total costs of owning different funds. In addition, if transactional costs were included, your total costs would have been higher.
| | | | | | | | | | | | | | | | | | | | | | | | | | | | | | | | | | | | |
| | | | | | | Actual
(actual return after expenses) | | | | Hypothetical
(5% annual return before expenses) | | | | |
Share
Class | | Beginning
Account
Value 5/1/17 | | | | Ending
Account
Value 10/31/17 | | Expenses
Paid During
Period
5/1/17–10/31/171,2 | | | | Ending
Account
Value 10/31/17 | | Expenses
Paid During
Period
5/1/17–10/31/171,2 | | | | Net
Annualized
Expense
Ratio2 |
| A | | | $ | 1,000 | | | | | | $ | 1,069.50 | | | | $ | 4.49 | | | | | | $ | 1,020.87 | | | | $ | 4.38 | | | | | | | 0.86 | % |
| C | | | $ | 1,000 | | | | | | $ | 1,065.70 | | | | $ | 8.38 | | | | | | $ | 1,017.09 | | | | $ | 8.19 | | | | | | | 1.61 | % |
| R | | | $ | 1,000 | | | | | | $ | 1,068.10 | | | | $ | 5.79 | | | | | | $ | 1,019.61 | | | | $ | 5.65 | | | | | | | 1.11 | % |
| R6 | | | $ | 1,000 | | | | | | $ | 1,071.60 | | | | $ | 2.45 | | | | | | $ | 1,022.84 | | | | $ | 2.40 | | | | | | | 0.47 | % |
| Advisor | | | $ | 1,000 | | | | | | $ | 1,071.00 | | | | $ | 3.18 | | | | | | $ | 1,022.13 | | | | $ | 3.11 | | | | | | | 0.61 | % |
1. Expenses are equal to the annualized expense ratio for the six-month period as indicated above—in the far right column—multiplied by the simple average account value over the period indicated, and then multiplied by 184/365 to reflect the one-half year period.
2. Reflects expenses after fee waivers and expense reimbursements. Does not include acquired fund fees and expenses.
| | | | |
| 10 | | Annual Report | | franklintempleton.com |
Franklin MicroCap Value Fund
We are pleased to bring you Franklin MicroCap Value Fund’s annual report for the fiscal year ended October 31, 2017. The Fund closed to new investors (with the exception of certain retirement accounts) in January 2004 and has remained closed except for two days in mid-February 2013, when the Fund was opened on a limited basis. Existing shareholders may add to or reduce their investments in the Fund; however, once an account is reduced to zero, it may not be reopened unless the Fund reopens.
Your Fund’s Goal and Main Investments
The Fund seeks high total return, of which capital appreciation and income are components, by investing at least 80% of its net assets in securities of companies with market capitalizations under $500 million at the time of purchase that we believe are undervalued in the marketplace and have the potential for capital appreciation. The Fund invests predominantly in common stocks.
Performance Overview
The Fund’s Class A shares delivered a +26.98% cumulative total return for the 12 months under review. In comparison, the Russell 2000® Value Index, which measures performance of those Russell 2000® Index companies with generally lower price-to-book ratios and lower forecasted growth values than companies listed in other stock indexes, generated a +24.81% total return for the same period.1 You can find more of the Fund’s performance data in the Performance Summary beginning on page 14.
Performance data represent past performance, which does not guarantee future results. Investment return and principal value will fluctuate, and you may have a gain or loss when you sell your shares. Current performance may differ from figures shown. For most recent month-end performance, go to franklintempleton.com or call (800) 342-5236.
Investment Strategy
Our strategy is to buy shares of financially sound, well-established companies at a low price-to-book value. In the case of financial companies, we look for consistently increasing book value over time. We limit purchases to companies with market capitalizations of less than $500 million, which we
Portfolio Composition
Based on Total Net Assets as of 10/31/17
define as “microcap.” Book value per share is a company’s net worth or shareholders’ equity on an accounting or “book” basis, divided by shares outstanding. This strategy is not aimed at short-term trading gains, nor do we consider the composition of any index. Rather, we try to identify individual companies that meet our investment criteria, and we assume at purchase that we will hold the positions for several years.
1. Source: Morningstar.
The index is unmanaged and includes reinvestment of any income or distributions. It does not reflect any fees, expenses or sales charges. One cannot invest directly in an index, and an index is not representative of the Fund’s portfolio.
See www.franklintempletondatasources.com for additional data provider information.
The dollar value, number of shares or principal amount, and names of all portfolio holdings are listed in the Fund’s Statement of Investments (SOI). The SOI begins on page 43.
| | | | | | |
| franklintempleton.com | | Annual Report | | | 11 | |
FRANKLIN MICROCAP VALUE FUND
Top 10 Holdings
10/31/17
| | |
Company Sector/Industry | | % of Total
Net Assets |
Seneca Foods Corp. | | 3.9% |
| Food, Beverage & Tobacco | | |
Spartan Motors Inc. | | 3.0% |
| Machinery | | |
Hurco Cos. Inc. | | 2.8% |
| Machinery | | |
Healthcare Services Group Inc. | | 2.8% |
| Commercial & Professional Services | | |
Hardinge Inc. | | 2.7% |
| Machinery | | |
Miller Industries Inc. | | 2.7% |
| Machinery | | |
Delta Apparel Inc. | | 2.5% |
| Consumer Durables & Apparel | | |
Bar Harbor Bankshares | | 2.4% |
| Banks | | |
Northeast Bancorp | | 2.4% |
| Banks | | |
Sterling Construction Co. | | 2.4% |
| Construction & Engineering | | |
Manager’s Discussion
During the 12 months under review, holdings that positively contributed to Fund performance included Sterling Construction, Northeast Bancorp and Hurco Companies.
Sterling Construction is a heavy civil construction contractor active in several western states. Shares of Sterling rose as the company continued to benefit from a turnaround that began in 2015 when board member Paul Varello assumed daily operating control. Since then, the company raised capital, sorted out its troubled Texas operations and, in April 2017, acquired Tealstone Residential Concrete, which serves the residential housing industry in Texas. Underpinning the turnaround is the fact that Sterling’s main business, transportation infrastructure, benefited from a cyclical upturn during the period.
Maine-based Northeast Bancorp specializes in purchasing commercial loans from other banks at discounts to outstanding principal balances. The bank grew its loan portfolio in 2016 to a size commensurate to its fixed operations costs, which enabled record earnings in 2017. The stock price also rose after its addition to the Russell 3000® Index in July 2017.
Hurco Companies, which the Fund has owned since 2009, designs and manufactures computer controlled machine tools. Europe is Hurco’s biggest end market, and sales were
depressed in the period leading up to and following Britain’s vote to leave the European Union. However, orders rebounded in 2017.
Detractors from Fund performance included Aegean Marine Petroleum Network, Cloud Peak Energy and PHI.
Aegean Marine Petroleum Network supplies bunker fuel and lubricants to ocean going vessels. Aegean shocked investors in May 2017 with a barely profitable first quarter, only three weeks after signaling good results at its first ever investor day. Management changes followed, but the changes have yet to produce results to allay investors’ concerns. We believe the company could benefit from low sulfur fuel regulations slated to take effect in 2020.
Cloud Peak Energy mines thermal coal in the Powder River Basin of Wyoming and Montana. Warm winters and regulatory pressures have diminished domestic demand for Cloud Peak’s coal. Additionally, low global prices and a strong dollar have undercut export volumes that Cloud Peak needs to operate profitably.
PHI provides helicopter transportation to the offshore energy industry in the Gulf of Mexico and air medical services on land. The recovery in energy prices has been enough to stimulate exploration and production on land, but not enough to restart the relatively more expensive deep water projects PHI serves. As a consequence, PHI’s flight hours in the Gulf of Mexico have yet to rebound.
During the reporting period, we initiated positions in Ameresco, an energy efficiency and renewable energy company; Titan Machinery, an agriculture and construction equipment dealer; and Ultralife, a provider of critical power solutions and communications systems. We also added to some positions including First Internet Bancorp, a bank holding company that conducts its business activities through its subsidiary, First Internet Bank of Indiana; Invacare, a manufacturer of wheelchairs, bariatric equipment, disability scooters, respiratory products and other homecare products; and the aforementioned Aegean Marine Petroleum Network.
We exited positions including Freds, KCAP Financial, Global Indemnity, Tesco and Hallmark Financial, as well as Gas Natural and Providence and Worcester Railroad, which were taken over during the period. The Fund also reduced its holdings in Healthcare Services Group and the aforementioned Sterling Construction and Hurco Companies, among others.
| | | | |
| 12 | | Annual Report | | franklintempleton.com |
FRANKLIN MICROCAP VALUE FUND
Thank you for your participation in Franklin MicroCap Value Fund. We look forward to continuing to serve your investment needs.
| | |
 | | 
Bruce C. Baughman, CPA Portfolio Manager |
The foregoing information reflects our analysis, opinions and portfolio holdings as of October 31, 2017, the end of the reporting period. The way we implement our main investment strategies and the resulting portfolio holdings may change depending on factors such as market and economic conditions. These opinions may not be relied upon as investment advice or an offer for a particular security. The information is not a complete analysis of every aspect of any market, country, industry, security or the Fund. Statements of fact are from sources considered reliable, but the investment manager makes no representation or warranty as to their completeness or accuracy. Although historical performance is no guarantee of future results, these insights may help you understand our investment management philosophy.
|
Bruce Baughman is a senior vice president and portfolio manager for Franklin Equity Group’s US Value Team that manages several equity funds, including Franklin MicroCap Value Fund, for which he is the lead manager. Before joining Franklin Templeton Investments in 1988, Mr. Baughman served as a portfolio manager with L.F. Rothschild and began his mutual fund career with the Pilgrim Group. Mr. Baughman holds a B.A. in English from Stanford University and an M.S. in accounting from New York University. He is a Certified Public Accountant. |
| | | | | | |
| franklintempleton.com | | Annual Report | | | 13 | |
FRANKLIN MICROCAP VALUE FUND
Performance Summary as of October 31, 2017
The performance table and graphs do not reflect any taxes that a shareholder would pay on Fund dividends, capital gain distributions, if any, or any realized gains on the sale of Fund shares. Total return reflects reinvestment of the Fund’s dividends and capital gain distributions, if any, and any unrealized gains or losses. Your dividend income will vary depending on dividends or interest paid by securities in the Fund’s portfolio, adjusted for operating expenses of each class. Capital gain distributions are net profits realized from the sale of portfolio securities.
Performance as of 10/31/171
Cumulative total return excludes sales charges. Average annual total return includes maximum sales charges. Sales charges will vary depending on the size of the investment and the class of share purchased. The maximum is 5.75% and the minimum is 0%. Class A: 5.75% maximum initial sales charge; Advisor Class: no sales charges. For other share classes, visit franklintempleton.com.
| | | | |
| Share Class | | Cumulative Total Return2 | | Average Annual
Total Return3 |
| A | | | | |
1-Year | | +26.98% | | +19.69% |
5-Year | | +73.64% | | +10.35% |
10-Year | | +98.85% | | +6.48% |
| | |
| Advisor | | | | |
1-Year | | +27.29% | | +27.29% |
5-Year | | +75.73% | | +11.94% |
10-Year | | +103.68% | | +7.37% |
Performance data represent past performance, which does not guarantee future results. Investment return and principal value will fluctuate, and you may have a gain or loss when you sell your shares. Current performance may differ from figures shown. For most recent month-end performance, go to franklintempleton.com or call (800) 342-5236.
See page 16 for Performance Summary footnotes.
| | | | |
| 14 | | Annual Report | | franklintempleton.com |
FRANKLIN MICROCAP VALUE FUND
PERFORMANCE SUMMARY
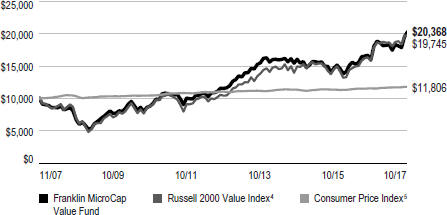
Total Return Index Comparison for a Hypothetical $10,000 Investment1
Total return represents the change in value of an investment over the periods shown. It includes any applicable maximum sales charge, Fund expenses, account fees and reinvested distributions. The unmanaged indexes include reinvestment of any income or distributions. They differ from the Fund in composition and do not pay management fees or expenses. One cannot invest directly in an index.
Class A (11/1/07–10/31/17)
Advisor Class (11/1/07–10/31/17)
See page 16 for Performance Summary footnotes.
| | | | |
| franklintempleton.com | | Annual Report | | 15 |
FRANKLIN MICROCAP VALUE FUND
PERFORMANCE SUMMARY
Distributions (11/1/16–10/31/17)
| | | | | | | | | | | | | | | | |
| Share Class | | Net Investment
Income | | | Short-Term
Capital Gain | | | Long-Term
Capital Gain | | | Total | |
A | | | $0.1071 | | | | $0.0390 | | | | $2.9578 | | | $ | 3.1039 | |
R6 | | | $0.2332 | | | | $0.0390 | | | | $2.9578 | | | $ | 3.2300 | |
Advisor | | | $0.1913 | | | | $0.0390 | | | | $2.9578 | | | $ | 3.1881 | |
Total Annual Operating Expenses6
| | | | | | | | |
| Share Class | | With Waiver | | | Without Waiver | |
A | | | 1.19% | | | | 1.20% | |
Advisor | | | 0.95% | | | | 0.96% | |
Each class of shares is available to certain eligible investors and has different annual fees and expenses, as described in the prospectus.
All investments involve risks, including possible loss of principal. The Fund’s ability to invest in smaller company securities that may have limited liquidity involves additional risks, such as relatively small revenues, limited product lines and small market share. Historically, these stocks have exhibited greater price volatility than larger company stocks, especially over the short term. In addition, the Fund may invest up to 25% of its total assets in foreign securities, which involve special risks, including currency fluctuations and economic and political uncertainty. The Fund is actively managed but there is no guarantee that the manager’s investment decisions will produce the desired results. The Fund’s prospectus also includes a description of the main investment risks.
1. The Fund has a fee waiver associated with any investment it makes in a Franklin Templeton money fund and/or other Franklin Templeton fund, contractually guaranteed through 2/28/18. Fund investment results reflect the fee waiver; without this waiver, the results would have been lower.
2. Cumulative total return represents the change in value of an investment over the periods indicated.
3. Average annual total return represents the average annual change in value of an investment over the periods indicated. Return for less than one year, if any, has not been annualized.
4. Source: Morningstar. The Russell 2000 Value Index is market capitalization weighted and measures performance of those Russell 2000 Index companies with lower price-to-book ratios and lower forecasted growth values.
5. Source: Bureau of Labor Statistics, bls.gov/cpi. The Consumer Price Index is a commonly used measure of the inflation rate.
6. Figures are as stated in the Fund’s current prospectus and may differ from the expense ratios disclosed in the Your Fund’s Expenses and Financial Highlights sections in this report. In periods of market volatility, assets may decline significantly, causing total annual Fund operating expenses to become higher than the figures shown.
See www.franklintempletondatasources.com for additional data provider information.
| | | | |
| 16 | | Annual Report | | franklintempleton.com |
FRANKLIN MICROCAP VALUE FUND
Your Fund’s Expenses
As a Fund shareholder, you can incur two types of costs: (1) transaction costs, including sales charges (loads) on Fund purchases and redemptions; and (2) ongoing Fund costs, including management fees, distribution and service (12b-1) fees, and other Fund expenses. All mutual funds have ongoing costs, sometimes referred to as operating expenses. The table below shows ongoing costs of investing in the Fund and can help you understand these costs and compare them with those of other mutual funds. The table assumes a $1,000 investment held for the six months indicated.
Actual Fund Expenses
The table below provides information about actual account values and actual expenses in the columns under the heading “Actual.” In these columns the Fund’s actual return, which includes the effect of Fund expenses, is used to calculate the “Ending Account Value” for each class of shares. You can estimate the expenses you paid during the period by following these steps (of course, your account value and expenses will differ from those in this illustration): Divide your account value by $1,000 (if your account had an $8,600 value, then $8,600 ÷ $1,000 = 8.6). Then multiply the result by the number in the row for your class of shares under the headings “Actual” and “Expenses Paid During Period” (if Actual Expenses Paid During Period were $7.50, then 8.6 x $7.50 = $64.50). In this illustration, the actual expenses paid this period are $64.50.
Hypothetical Example for Comparison with Other Funds
Under the heading “Hypothetical” in the table, information is provided about hypothetical account values and hypothetical expenses based on the Fund’s actual expense ratio and an assumed rate of return of 5% per year before expenses, which is not the Fund’s actual return. This information may not be used to estimate the actual ending account balance or expenses you paid for the period, but it can help you compare ongoing costs of investing in the Fund with those of other funds. To do so, compare this 5% hypothetical example for the class of shares you hold with the 5% hypothetical examples that appear in the shareholder reports of other funds.
Please note that expenses shown in the table are meant to highlight ongoing costs and do not reflect any transactional costs. Therefore, information under the heading “Hypothetical” is useful in comparing ongoing costs only, and will not help you compare total costs of owning different funds. In addition, if transactional costs were included, your total costs would have been higher.
| | | | | | | | | | | | | | | | | | | | | | | | | | | | | | | | | | | | | | | | | | | | | |
| | | | | | | Actual (actual return after expenses) | | | | Hypothetical (5% annual return before expenses) | | | | |
Share Class | | Beginning
Account
Value 5/1/17 | | | | Ending
Account
Value 10/31/17 | | Expenses Paid During
Period 5/1/17–10/31/171,2 | | | | Ending
Account
Value 10/31/17 | | Expenses Paid During
Period 5/1/17–10/31/171,2 | | | | Net
Annualized
Expense
Ratio2 |
| A | | | | $1,000 | | | | | | | | | | $1,110.70 | | | | | $6.12 | | | | | | | | | | $1,019.41 | | | | | $5.85 | | | | | | | | | | 1.15 | % |
| R6 | | | | $1,000 | | | | | | | | | | $1,112.60 | | | | | $4.21 | | | | | | | | | | $1,021.22 | | | | | $4.02 | | | | | | | | | | 0.79 | % |
| Advisor | | | | $1,000 | | | | | | | | | | $1,111.90 | | | | | $4.84 | | | | | | | | | | $1,020.62 | | | | | $4.63 | | | | | | | | | | 0.91 | % |
1. Expenses are equal to the annualized expense ratio for the six-month period as indicated above—in the far right column—multiplied by the simple average account value over the period indicated, and then multiplied by 184/365 to reflect the one-half year period.
2. Reflects expenses after fee waivers and expense reimbursements. Does not include acquired fund fees and expenses.
| | | | |
| franklintempleton.com | | Annual Report | | 17 |
Franklin MidCap Value Fund
This annual report for Franklin MidCap Value Fund covers the fiscal year ended October 31, 2017. The reorganization of Franklin MidCap Value Fund into Franklin Small Cap Value Fund, as approved by shareholders, was completed on December 1, 2017. Shares of Franklin MidCap Value Fund share classes A, C, R and Advisor were exchanged for shares in Franklin Small Cap Value Fund share classes A, C, R and Advisor, respectively.
Your Fund’s Goal and Main Investments
The Fund seeks long-term total return by investing at least 80% of net assets in securities of mid-capitalization companies that we believe are undervalued in the marketplace at the time of purchase and have the potential for capital appreciation. We define mid-capitalization companies as those with market capitalizations that are similar in size at the time of purchase to those in the Russell Midcap® Index.1 The Fund invests predominantly in common stocks.
Performance Overview
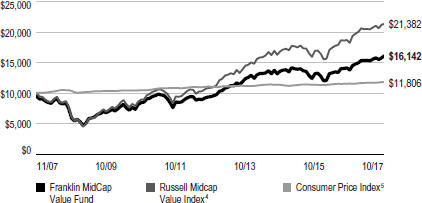
The Fund’s Class A shares delivered a +16.96% cumulative total return for the 12 months under review. In comparison, the Russell Midcap® Value Index, which measures performance of those Russell Midcap® Index companies with generally lower price-to-book ratios and lower forecasted growth values than companies listed in other stock indexes, generated a +17.12% total return for the same period.2 You can find more of the Fund’s performance data in the Performance Summary beginning on page 21.
Performance data represent past performance, which does not guarantee future results. Investment return and principal value will fluctuate, and you may have a gain or loss when you sell your shares. Current performance may differ from figures shown. For most recent month-end performance, go to franklintempleton.com or call (800) 342-5236.
Investment Strategy
Our goal is to invest in mid-capitalization companies that we believe are undervalued at the time of purchase and have the potential for capital appreciation. The Fund also may invest in equity real estate investment trusts. The types of companies the
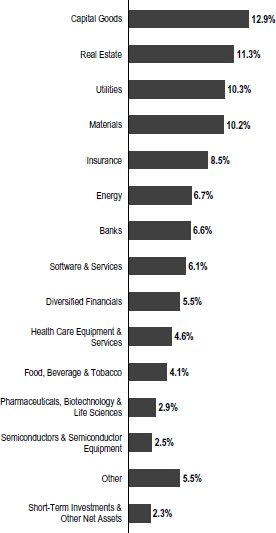
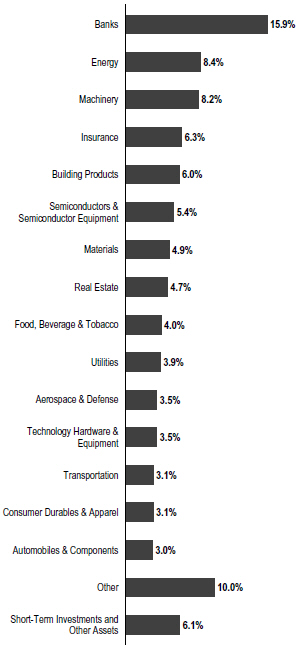
Portfolio Composition
Based on Total Net Assets as of 10/31/17
Fund may invest in include those that may be considered out of favor, such as companies attempting to recover from bankruptcy, business setbacks or adverse events (turnarounds) or cyclical downturns, or that may be considered potential
1. The Russell Midcap Index is market capitalization weighted and measures performance of the smallest companies in the Russell 1000 Index, which represent a modest amount of the Russell 1000 Index’s total market capitalization.
2. Source: Morningstar.
The index is unmanaged and includes reinvestment of any income or distributions. It does not reflect any fees, expenses or sales charges. One cannot invest directly in an index, and an index is not representative of the Fund’s portfolio.
See www.franklintempletondatasources.com for additional data provider information.
The dollar value, number of shares or principal amount, and names of all portfolio holdings are listed in the Fund’s Statement of Investments (SOI). The SOI begins on page 50.
| | | | |
| 18 | | Annual Report | | franklintempleton.com |
FRANKLIN MIDCAP VALUE FUND
takeover targets. The Fund may invest up to 25% of its total assets in foreign securities.
Manager’s Discussion
During the 12 months under review, holdings that positively contributed to Fund performance included Mobileye, Ingevity and Versum Materials.
Mobileye, a designer of advanced driver assistance systems, agreed to be purchased by Intel (not a Fund holding) at a significant premium to its prior-day stock price at the time of the acquisition announcement in March 2017. We exited the position during the period.
Ingevity, a specialty chemical company, experienced a rise in sales due to increasing demand for its activated carbon product. Activated carbon is used to control vapor emissions in passenger vehicles, and recent legislative mandates have driven its adoption by automakers in the North American vehicle market.
Versum Materials, a specialty materials and equipment company that primarily supplies into the semiconductor end market, reported a series of strong results during 2017. The company benefited from an industry shift toward materials-based manufacturing and the transition to a new memory architecture type called 3D NAND.
Detractors from Fund performance included DDR, Envision Healthcare and TreeHouse Foods.
DDR is a shopping center real estate investment trust with assets in 33 states and Puerto Rico. Shares declined due to lowered guidance tied to elevated retail tenant bankruptcies and store closures, which resulted in a higher portfolio vacancy rate and reduced earnings. In March 2017, DDR announced significant changes to its executive team, including the appointment of David Lukes as chief executive officer, as well as a new chief operating officer and a chief financial officer. The new management team announced several strategic objectives, including reducing debt through asset sales. The announcement negatively impacted earnings forecasts, but could ultimately improve the company’s liquidity and balance sheet positioning, in our view.
Envision Healthcare is a health care services company providing physician services and ambulatory surgical centers services in the US. Shares of Envision were negatively impacted by a number of events, including a downward revision to company earnings guidance for the second half of 2017 due to lower vol ume expectations, the departures of the
chief financial officer and president, and negative publicity regarding more expensive bills resulting from services by out-of-network physicians within in-network hospital emergency rooms. However, Envision announced some positive news, including the sale of its medical transportation business in August 2017 at a price that was in line with market expectations and a share buyback plan in September 2017.
TreeHouse Foods is the nation’s largest private label food and beverage manufacturer. Investors reacted negatively to the company’s inconsistent results and reduced earnings guidance due to weak overall packaged food trends and increased competition. The company made changes to its management team, and it is focused on integrating its recent acquisitions and lowering costs to offset the challenging environment.
Top 10 Holdings
10/31/17
| | | | |
Company Sector/Industry | | % of Total
Net Assets | |
Ferroglobe PLC Materials | | | 2.5% | |
Roper Technologies Inc. Capital Goods | | | 2.4% | |
Textron Inc. Capital Goods | | | 2.2% | |
WestRock Co. Materials | | | 1.8% | |
Marathon Petroleum Corp. Energy | | | 1.8% | |
Total System Services Inc. Software & Services | | | 1.8% | |
Ingevity Corp. Materials | | | 1.8% | |
Pinnacle Foods Inc. Food, Beverage & Tobacco | | | 1.8% | |
Envision Healthcare Corp. Health Care Equipment & Services | | | 1.6% | |
Red Hat Inc. Software & Services | | | 1.6% | |
During the reporting period, the Fund initiated positions in Textron, a diversified manufacturer; Molson Coors Brewing, one of the world’s largest beer makers by volume; Huntington Bancshares, a bank holding company; Johnson Controls International, a conglomerate that produces automotive parts and climate control equipment; and the aforementioned Envision Healthcare. We also added to several positions with the largest purchases including Roper Technologies, a diversified industrial company; SLM, the nation’s largest private originator of education loans; and the aforementioned Mobileye.
| | | | | | |
| franklintempleton.com | | Annual Report | | | 19 | |
FRANKLIN MIDCAP VALUE FUND
The Fund exited positions including Western Digital, Lam Research, The J. M. Smucker Company, Nucor, and Autodesk. We also reduced holdings in many positions including Toll Brothers, Pinnacle Foods and the aforementioned TreeHouse Foods.
Thank you for your participation in Franklin MidCap Value Fund. It has been our pleasure serving your investment needs.
| | |
 | | 
Steven B. Raineri Lead Portfolio Manager |
| | Christopher Meeker, CFA Portfolio Management Team |
The foregoing information reflects our analysis, opinions and portfolio holdings as of October 31, 2017, the end of the reporting period. The way we implement our main investment strategies and the resulting portfolio holdings may change depending on factors such as market and economic conditions. These opinions may not be relied upon as investment advice or an offer for a particular security. The information is not a complete analysis of every aspect of any market, country, industry, security or the Fund. Statements of fact are from sources considered reliable, but the investment manager makes no representation or warranty as to their completeness or accuracy. Although historical performance is no guarantee of future results, these insights may help you understand our investment management philosophy.
|
| Steven Raineri is a vice president/portfolio manager at Franklin Advisory Services, LLC. Mr. Raineri has more than 20 years of experience in the investment industry. Prior to joining Franklin Templeton Investments in 2005, Mr. Raineri worked for WoodAllen Capital Management, Dresdner Kleinwort Wasserstein and Gabelli & Company. He also served as a business valuation consultant for Arthur Andersen and J&W Seligman Valuations. Mr. Raineri holds a B.B.A. in finance from the City University of New York’s Bernard Baruch College and an M.B.A. in finance from Fordham University. |
|
| Christopher Meeker is a portfolio manager and research analyst for the Franklin MidCap Value Fund. He joined Franklin Templeton in September 2012 as a research analyst with Franklin Equity Group’s US Value team. Prior to joining Franklin Templeton, Mr. Meeker worked as a senior research analyst at Federated Global Investment Management with a focus on the international markets and coverage of the industrials, consumer and technology sectors. Mr. Meeker also has prior investment experience at Farr, Miller & Washington LLC, a boutique asset manager that employed a long-term and “private market value” based investment process. Prior to his buy-side work, Mr. Meeker spent six years as an investment banker with Houlihan Lokey Howard & Zukin, Inc. and AMT Capital Advisors, LLC specializing in mergers and acquisitions transactions and corporate valuation mandates. Mr. Meeker holds a B.A. in finance from Hobart College and is a Chartered Financial Analyst (CFA) charterholder. |
| | | | |
| 20 | | Annual Report | | franklintempleton.com |
FRANKLIN MIDCAP VALUE FUND
Performance Summary as of October 31, 2017
The performance table and graphs do not reflect any taxes that a shareholder would pay on Fund dividends, capital gain distributions, if any, or any realized gains on the sale of Fund shares. Total return reflects reinvestment of the Fund’s dividends and capital gain distributions, if any, and any unrealized gains or losses. Your dividend income will vary depending on dividends or interest paid by securities in the Fund’s portfolio, adjusted for operating expenses of each class. Capital gain distributions are net profits realized from the sale of portfolio securities.
Performance as of 10/31/171
Cumulative total return excludes sales charges. Average annual total return includes maximum sales charges. Sales charges will vary depending on the size of the investment and the class of share purchased. The maximum is 5.75% and the minimum is 0%. Class A: 5.75% maximum initial sales charge; Advisor Class: no sales charges. For other share classes, visit franklintempleton.com.
| | | | | | | | |
| Share Class | | Cumulative
Total Return2 | | | Average Annual
Total Return3 | |
| | |
| A | | | | | | | | |
1-Year | | | +16.96% | | | | +10.21% | |
5-Year | | | +71.37% | | | | +10.07% | |
10-Year | | | +71.31% | | | | +4.91% | |
| | |
| Advisor | | | | | | | | |
1-Year | | | +17.30% | | | | +17.30% | |
5-Year | | | +73.99% | | | | +11.71% | |
10-Year | | | +76.68% | | | | +5.86% | |
Performance data represent past performance, which does not guarantee future results. Investment return and principal value will fluctuate, and you may have a gain or loss when you sell your shares. Current performance may differ from figures shown. For most recent month-end performance, go to franklintempleton.com or call (800) 342-5236.
See page 23 for Performance Summary footnotes.
| | | | | | |
| franklintempleton.com | | Annual Report | | | 21 | |
FRANKLIN MIDCAP VALUE FUND
PERFORMANCE SUMMARY
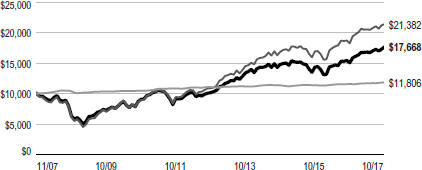
Total Return Index Comparison for a Hypothetical $10,000 Investment1
Total return represents the change in value of an investment over the periods shown. It includes any applicable maximum sales charge, Fund expenses, account fees and reinvested distributions. The unmanaged indexes include reinvestment of any income or distributions. They differ from the Fund in composition and do not pay management fees or expenses. One cannot invest directly in an index.
Class A (11/1/07–10/31/17)
Advisor Class (11/1/07–10/31/17)
See page 23 for Performance Summary footnotes.
| | | | |
| 22 | | Annual Report | | franklintempleton.com |
FRANKLIN MIDCAP VALUE FUND
PERFORMANCE SUMMARY
Distributions (11/1/16–10/31/17)
| | | | | | | | | | | | |
| Share Class | | Net Investment
Income | | | Long-Term
Capital Gain | | | Total | |
A | | | $0.1116 | | | | $0.1770 | | | | $0.2886 | |
C | | | $0.0100 | | | | $0.1770 | | | | $0.1870 | |
R | | | $0.0742 | | | | $0.1770 | | | | $0.2512 | |
Advisor | | | $0.1520 | | | | $0.1770 | | | | $0.3290 | |
Total Annual Operating Expenses6
| | | | | | | | |
| Share Class | | With Waiver | | | Without Waiver | |
A | | | 1.30% | | | | 1.54% | |
Advisor | | | 1.05% | | | | 1.29% | |
Each class of shares is available to certain eligible investors and has different annual fees and expenses, as described in the prospectus.
All investments involve risks, including possible loss of principal. Stock prices fluctuate, sometimes rapidly and dramatically, due to factors affecting individual companies, particular industries or sectors, or general market conditions. Historically, midsize company securities have been more volatile in price than larger company securities, especially over the short term. Mid-size companies may be more susceptible to particular economic events or competitive factors than are larger, more broadly diversified companies. In addition, the Fund may invest up to 25% of its total assets in foreign securities, which involve special risks, including currency fluctuations and economic and political uncertainty. The Fund is actively managed but there is no guarantee that the manager’s investment decisions will produce the desired results. The Fund’s prospectus also includes a description of the main investment risks.
1. The Fund has an expense reduction contractually guaranteed through 2/28/18. Fund investment results reflect the expense reduction; without this reduction, the results would have been lower.
2. Cumulative total return represents the change in value of an investment over the periods indicated.
3. Average annual total return represents the average annual change in value of an investment over the periods indicated. Return for less than one year, if any, has not been annualized.
4. Source: Morningstar. The Russell Midcap Value Index is market capitalization weighted and measures performance of those Russell Midcap Index companies with lower price-to-book ratios and lower forecasted growth values.
5. Source: Bureau of Labor Statistics, bls.gov/cpi. The Consumer Price Index is a commonly used measure of the inflation rate.
6. Figures are as stated in the Fund’s current prospectus and may differ from the expense ratios disclosed in the Your Fund’s Expenses and Financial Highlights sections in this report. In periods of market volatility, assets may decline significantly, causing total annual Fund operating expenses to become higher than the figures shown.
See www.franklintempletondatasources.com for additional data provider information.
| | | | | | |
| franklintempleton.com | | Annual Report | | | 23 | |
FRANKLIN MIDCAP VALUE FUND
Your Fund’s Expenses
As a Fund shareholder, you can incur two types of costs: (1) transaction costs, including sales charges (loads) on Fund purchases and redemptions; and (2) ongoing Fund costs, including management fees, distribution and service (12b-1) fees, and other Fund expenses. All mutual funds have ongoing costs, sometimes referred to as operating expenses. The table below shows ongoing costs of investing in the Fund and can help you understand these costs and compare them with those of other mutual funds. The table assumes a $1,000 investment held for the six months indicated.
Actual Fund Expenses
The table below provides information about actual account values and actual expenses in the columns under the heading “Actual.” In these columns the Fund’s actual return, which includes the effect of Fund expenses, is used to calculate the “Ending Account Value” for each class of shares. You can estimate the expenses you paid during the period by following these steps (of course, your account value and expenses will differ from those in this illustration): Divide your account value by $1,000 (if your account had an $8,600 value, then $8,600 ÷ $1,000 = 8.6). Then multiply the result by the number in the row for your class of shares under the headings “Actual” and “Expenses Paid During Period” (if Actual Expenses Paid During Period were $7.50, then 8.6 x $7.50 = $64.50). In this illustration, the actual expenses paid this period are $64.50.
Hypothetical Example for Comparison with Other Funds
Under the heading “Hypothetical” in the table, information is provided about hypothetical account values and hypothetical expenses based on the Fund’s actual expense ratio and an assumed rate of return of 5% per year before expenses, which is not the Fund’s actual return. This information may not be used to estimate the actual ending account balance or expenses you paid for the period, but it can help you compare ongoing costs of investing in the Fund with those of other funds. To do so, compare this 5% hypothetical example for the class of shares you hold with the 5% hypothetical examples that appear in the shareholder reports of other funds.
Please note that expenses shown in the table are meant to highlight ongoing costs and do not reflect any transactional costs. Therefore, information under the heading “Hypothetical” is useful in comparing ongoing costs only, and will not help you compare total costs of owning different funds. In addition, if transactional costs were included, your total costs would have been higher.
| | | | | | | | | | | | | | | | | | | | | | | | | | | | | | | | | | | | | | | | | | | | | |
| | | | | | | Actual (actual return after expenses) | | | | Hypothetical (5% annual return before expenses) | | | | |
Share
Class | | Beginning
Account
Value 5/1/17 | | | | Ending
Account
Value 10/31/17 | | Expenses
Paid During
Period
5/1/17–10/31/171,2 | | | | Ending
Account
Value 10/31/17 | | Expenses Paid
During Period
5/1/17–10/31/171,2 | | | | Net
Annualized
Expense
Ratio2 |
| A | | | | $1,000 | | | | | | | | | | $1,049.70 | | | | | $6.72 | | | | | | | | | | $1,018.65 | | | | | $6.61 | | | | | | | | | | 1.30 | % |
| C | | | | $1,000 | | | | | | | | | | $1,045.50 | | | | | $10.57 | | | | | | | | | | $1,014.87 | | | | | $10.41 | | | | | | | | | | 2.05 | % |
| R | | | | $1,000 | | | | | | | | | | $1,048.40 | | | | | $8.00 | | | | | | | | | | $1,017.39 | | | | | $7.88 | | | | | | | | | | 1.55 | % |
| Advisor | | | | $1,000 | | | | | | | | | | $1,050.70 | | | | | $5.43 | | | | | | | | | | $1,019.91 | | | | | $5.35 | | | | | | | | | | 1.05 | % |
1. Expenses are equal to the annualized expense ratio for the six-month period as indicated above—in the far right column—multiplied by the simple average account value over the period indicated, and then multiplied by 184/365 to reflect the one-half year period.
2. Reflects expenses after fee waivers and expense reimbursements. Does not include acquired fund fees and expenses.
| | | | |
| 24 | | Annual Report | | franklintempleton.com |
Franklin Small Cap Value Fund
This annual report for Franklin Small Cap Value Fund covers the period ended October 31, 2017. The reorganization of Franklin MidCap Value Fund into Franklin Small Cap Value Fund, as approved by shareholders, was completed on December 1, 2017. Shares of Franklin MidCap Value Fund share classes A, C, R and Advisor were exchanged for shares in Franklin Small Cap Value Fund share classes A, C, R and Advisor, respectively.
Your Fund’s Goal and Main Investments
The Fund seeks long-term total return by investing most of its assets in equity securities that the Fund’s investment manager believes are undervalued at the time of purchase and have the potential for capital appreciation. Under normal market conditions, the Fund invests at least 80% of its net assets in investments of small-capitalization (small-cap) companies. We define small-cap companies as those with market capitalizations that are similar in size at the time of purchase to those in the Russell 2000® Index.1 The Fund invests predominantly in common stocks.
Performance Overview
The Fund’s Class A shares delivered a +20.53% cumulative total return for the 12 months under review. In comparison, the Russell 2000TM Value Index, which measures performance of those Russell 2000TM Index companies with generally lower price-to-book ratios and lower forecasted growth values than companies listed in other stock indexes, generated a +24.81% total return for the same period.1,2 You can find more of the Fund’s performance data in the Performance Summary beginning on page 28.
Performance data represent past performance, which does not guarantee future results. Investment return and principal value will fluctuate, and you may have a gain or loss when you sell your shares. Current performance may differ from figures shown. For most recent month-end performance, go to franklintempleton.com or call (800) 342-5236.
Investment Strategy
Our strategy is to invest in small-capitalization companies that
Portfolio Composition
Based on Total Net Assets as of 10/31/17
1. The Russell 2000TM Index is market capitalization weighted and measures performance of the 2,000 smallest companies in the Russell 3000 Index, which represent a small amount of the total market capitalization of the Russell 3000 Index.
2. Source: Morningstar.
The index is unmanaged and includes reinvestment of any income or distributions. It does not reflect any fees, expenses or sales charges. One cannot invest directly in an index, and an index is not representative of the Fund’s portfolio.
See www.franklintempletondatasources.com for additional data provider information.
The dollar value, number of shares or principal amount, and names of all portfolio holdings are listed in the Fund’s Statement of Investments (SOI).
The SOI begins on page 59.
| | | | |
| franklintempleton.com | | Annual Report | | 25 |
FRANKLIN SMALL CAP VALUE FUND
we believe are undervalued at the time of purchase and have the potential for capital appreciation. A stock price is undervalued, or is a “value,” when it trades at less than the price at which the investment manager believes it would trade if the market reflected all factors relating to the company’s worth. Following this strategy, the Fund invests in companies that the investment manager believes have, for example: stock prices that are low relative to current, or historical or future earnings, book value, cash flow or sales; recent sharp price declines but the potential for good long-term earnings prospects; and valuable intangibles not reflected in the stock price. The Fund also may invest in equity real estate investment trusts (REITs).
The types of companies the Fund may invest in include those that may be considered out of favor, such as companies attempting to recover from bankruptcy, business setbacks or adverse events (turnarounds) or cyclical downturns, or that may be considered potential takeover targets. The Fund may invest up to 25% of its total assets in foreign securities.
Manager’s Discussion
During the 12 months under review, holdings that positively contributed to Fund performance included MKS Instruments, SAIA and Simpson Manufacturing.
MKS Instruments provides subsystems solutions and instruments to semiconductor and other technology-centered manufacturing industries. During the period, MKS benefited from strong industry trends, while its operating model improvements drove its target profitability progressively higher. These factors, combined with the company’s diversification away from semiconductors through the acquisition of laser manufacturer Newport and paydown of its debt, led to higher market valuations.
SAIA, a less-than-truckload (LTL) carrier, benefited from strength in the freight environment and its initiative to reset prices on low profitability accounts. The company reported improvements in tonnage, shipments, pricing and the overall market environment during the quarter ended September 2017. SAIA also had a good start to its planned expansion in 12 northeastern states. The company opened its first five terminals in the region by period-end and is planning to open a sixth terminal before the end of the 2017. SAIA further benefited from its exclusive partnership with Canada-based TST Overland Express3 to provide cross-border LTL services to and from Canada.
Simpson Manufacturing, a manufacturer of building products, saw its share price appreciate during the period due to continued demand from its principal end market, residential housing. Increased volume allowed Simpson to better leverage its costs, which lead to higher profits. Additionally, Simpson announced a new capital allocation plan in August 2016, which contributed to subsequent increases in cash returns to shareholders via dividends and share repurchases during the period under review.
Detractors from Fund performance included Detour Gold, Spirit Airlines and Oil States International.
Detour Gold, a gold mining company with assets located in Ontario, Canada, was negatively impacted by a downward revision to its 2017 gold production estimates due to heavy rains that delayed mining progress. Additionally, mining at its West Detour pit, which accounts for a significant portion of Detour’s gold reserves, was pushed out from 2019 to 2025 because of delays in securing mining permits.
Spirit Airlines, a leading low-cost carrier in the US, saw its share price negatively impacted by an increased level of pricing pressure in certain regions of the country from incumbent legacy airlines, such as United Airlines.3 The pricing environment changed meaningfully from the otherwise supportive environment that existed throughout most of the prior 18 months.
Oil States International, a provider of onshore and offshore well completion services, as well as deep-water connection products and services, experienced a decline in its stock price due to weaker-than-expected orders for its offshore products business as low oil prices continued to dampen activity.
During the reporting period, we added some new positions with the largest purchases including Rowan Companies, an offshore drilling company; Kennametal, a supplier of tooling and industrial materials; Zebra Technologies, a manufacturer of marking, tracking and computer printing technologies; Horace Mann Educators, an insurance company focused on serving educators; and Glacier Bancorp, a multi-bank holding company, headquartered in Montana. The Fund also added to several holdings including First Horizon National, a bank holding company; and the aforementioned Spirit Airlines and Simpson Manufacturing.
In contrast, the Fund exited positions including HB Fuller, Rogers, EverBank Financial, MSA Safety and Arthur J.
3. Not a Fund holding.
| | | | |
| 26 | | Annual Report | | franklintempleton.com |
FRANKLIN SMALL CAP VALUE FUND
| | | | |
| Top 10 Holdings | | | |
| 10/31/17 | | | |
| |
Company Sector/Industry | | % of Total
Net Assets | |
Simpson Manufacturing Co. Inc. | | | 2.7% | |
Building Products | | | | |
First Horizon National Corp. | | | 2.6% | |
Banks | | | | |
Chemical Financial Corp. | | | 2.6% | |
Banks | | | | |
AAR Corp. | | | 2.4% | |
Aerospace & Defense | | | | |
Columbia Banking System Inc. | | | 2.3% | |
Banks | | | | |
Spire Inc. | | | 2.1% | |
Utilities | | | | |
Maple Leaf Foods Inc. (Canada) | | | 2.0% | |
Food, Beverage & Tobacco | | | | |
Spirit Airlines Inc. | | | 1.9% | |
Transportation | | | | |
Lakeland Financial Corp. | | | 1.8% | |
Banks | | | | |
Mueller Water Products Inc. | | | 1.8% | |
Machinery | | | | |
Gallagher. Additionally, Mentor Graphics and Endurance Specialty Holdings were acquired in all cash deals during the period. We also reduced holdings in several positions including Astec Industries, Hill-Rom Holdings and the aforementioned MKS Instruments.
Thank you for your participation in Franklin Small Cap Value Fund. We look forward to continuing to serve your investment needs.
| | |
 | | 
Steven B. Raineri Lead Portfolio Manager |
| | Christopher Meeker, CFA |
| | Portfolio Management Team |
The foregoing information reflects our analysis, opinions and portfolio holdings as of October 31, 2017, the end of the reporting period. The way we implement our main investment strategies and the resulting portfolio holdings may change depending on factors such as market and economic conditions. These opinions may not be relied upon as investment advice or an offer for a particular security. The information is not a complete analysis of every aspect of any market, country, industry, security or the Fund. Statements of fact are from sources considered reliable, but the investment manager makes no representation or warranty as to their completeness or accuracy. Although historical performance is no guarantee of future results, these insights may help you understand our investment management philosophy.
Steven Raineri is a vice president/portfolio manager at Franklin Advisory Services, LLC. Mr. Raineri has more than 20 years of experience in the investment industry. Prior to joining Franklin Templeton Investments in 2005, Mr. Raineri worked for WoodAllen Capital Management, Dresdner Kleinwort Wasserstein and Gabelli & Company. He also served as a business valuation consultant for Arthur Andersen and J&W Seligman Valuations. Mr. Raineri holds a B.B.A. in finance from the City University of New York’s Bernard Baruch College and an M.B.A. in finance from Fordham University.
Christopher Meeker is a portfolio manager and research analyst for the Franklin Small Cap Value Fund. He joined Franklin Templeton in September 2012 as a research analyst with Franklin Equity Group’s US Value team. Prior to joining Franklin Templeton, Mr. Meeker worked as a senior research analyst at Federated Global Investment Management with a focus on the international markets and coverage of the industrials, consumer and technology sectors. Mr. Meeker also has prior investment experience at Farr, Miller & Washington LLC, a boutique asset manager that employed a long-term and “private market value” based investment process. Prior to his buy-side work, Mr. Meeker spent six years as an investment banker with Houlihan Lokey Howard & Zukin, Inc. and AMT Capital Advisors, LLC specializing in mergers and acquisitions transactions and corporate valuation mandates. Mr. Meeker holds a B.A. in finance from Hobart College and is a Chartered Financial Analyst (CFA) charterholder.
| | | | |
| franklintempleton.com | | Annual Report | | 27 |
FRANKLIN SMALL CAP VALUE FUND
Performance Summary as of October 31, 2017
The performance table and graphs do not reflect any taxes that a shareholder would pay on Fund dividends, capital gain distributions, if any, or any realized gains on the sale of Fund shares. Total return reflects reinvestment of the Fund’s dividends and capital gain distributions, if any, and any unrealized gains or losses. Your dividend income will vary depending on dividends or interest paid by securities in the Fund’s portfolio, adjusted for operating expenses of each class. Capital gain distributions are net profits realized from the sale of portfolio securities.
Performance as of 10/31/171
Cumulative total return excludes sales charges. Average annual total return includes maximum sales charges. Sales charges will vary depending on the size of the investment and the class of share purchased. The maximum is 5.75% and the minimum is 0%. Class A: 5.75% maximum initial sales charge; Advisor Class: no sales charges. For other share classes, visit franklintempleton.com.
| | | | | | | | |
| Share Class | | Cumulative
Total Return2 | | | Average Annual
Total Return3 | |
| A | | | | | | | | |
1-Year | | | +20.53% | | | | +13.59% | |
5-Year | | | +85.69% | | | | +11.85% | |
10-Year | | | +104.79% | | | | +6.80% | |
| | |
| Advisor | | | | | | | | |
1-Year | | | +20.84% | | | | +20.84% | |
5-Year | | | +88.29% | | | | +13.49% | |
10-Year | | | +110.69% | | | | +7.74% | |
Performance data represent past performance, which does not guarantee future results. Investment return and principal value will fluctuate, and you may have a gain or loss when you sell your shares. Current performance may differ from figures shown. For most recent month-end performance, go to franklintempleton.com or call (800) 342-5236.
See page 30 for Performance Summary footnotes.
| | | | |
| 28 | | Annual Report | | franklintempleton.com |
FRANKLIN SMALL CAP VALUE FUND
PERFORMANCE SUMMARY
Total Return Index Comparison for a Hypothetical $10,000 Investment1
Total return represents the change in value of an investment over the periods shown. It includes any applicable maximum sales charge, Fund expenses, account fees and reinvested distributions. The unmanaged indexes include reinvestment of any income or distributions. They differ from the Fund in composition and do not pay management fees or expenses. One cannot invest directly in an index.
Class A (11/1/07–10/31/17)
Advisor Class (11/1/07–10/31/17)
See page 30 for Performance Summary footnotes.
| | | | |
| franklintempleton.com | | Annual Report | | 29 |
FRANKLIN SMALL CAP VALUE FUND
PERFORMANCE SUMMARY
Distributions (11/1/16–10/31/17)
| | | | | | | | | | | | |
| Share Class | | Net Investment
Income | | | Long-Term
Capital Gain | | | Total | |
A | | | $0.1246 | | | | $2.6143 | | | | $2.7389 | |
C | | | — | | | | $2.6143 | | | | $2.6143 | |
R | | | — | | | | $2.6143 | | | | $2.6143 | |
R6 | | | $0.3524 | | | | $2.6143 | | | | $2.9667 | |
Advisor | | | $0.2667 | | | | $2.6143 | | | | $2.8810 | |
Total Annual Operating Expenses6
| | | | | | | | |
| Share Class | | With Waiver | | | Without Waiver | |
A | | | 1.11% | | | | 1.13% | |
Advisor | | | 0.86% | | | | 0.88% | |
Each class of shares is available to certain eligible investors and has different annual fees and expenses, as described in the prospectus.
All investments involve risks, including possible loss of principal. The Fund’s investments in smaller company stocks carry special risks as such stocks have historically exhibited greater price volatility than larger company stocks, particularly over the short term. Additionally, smaller companies often have relatively small revenues, limited product lines and small market share. In addition, the Fund may invest up to 25% of its total assets in foreign securities, which involve special risks, including currency fluctuations and economic and political uncertainty. The Fund is actively managed but there is no guarantee that the manager’s investment decisions will produce the desired results. The Fund’s prospectus also includes a description of the main investment risks.
1. The Fund has a fee waiver associated with any investment it makes in a Franklin Templeton money fund and/or other Franklin Templeton fund, contractually guaranteed through 2/28/18. Fund investment results reflect the fee waiver; without this waiver, the results would have been lower.
2. Cumulative total return represents the change in value of an investment over the periods indicated.
3. Average annual total return represents the average annual change in value of an investment over the periods indicated. Return for less than one year, if any, has not been annualized.
4. Source: Morningstar. The Russell 2000 Value Index measures performance of those Russell 2000 Index companies with lower price-to-book ratios and lower forecasted growth values.
5. Source: Bureau of Labor Statistics, bls.gov/cpi. The Consumer Price Index is a commonly used measure of the inflation rate.
6. Figures are as stated in the Fund’s current prospectus and may differ from the expense ratios disclosed in the Your Fund’s Expenses and Financial Highlights sections in this report. In periods of market volatility, assets may decline significantly, causing total annual Fund operating expenses to become higher than the figures shown.
See www.franklintempletondatasources.com for additional data provider information.
| | | | |
| 30 | | Annual Report | | franklintempleton.com |
FRANKLIN SMALL CAP VALUE FUND
Your Fund’s Expenses
As a Fund shareholder, you can incur two types of costs: (1) transaction costs, including sales charges (loads) on Fund purchases and redemptions; and (2) ongoing Fund costs, including management fees, distribution and service (12b-1) fees, and other Fund expenses. All mutual funds have ongoing costs, sometimes referred to as operating expenses. The table below shows ongoing costs of investing in the Fund and can help you understand these costs and compare them with those of other mutual funds. The table assumes a $1,000 investment held for the six months indicated.
Actual Fund Expenses
The table below provides information about actual account values and actual expenses in the columns under the heading “Actual.” In these columns the Fund’s actual return, which includes the effect of Fund expenses, is used to calculate the “Ending Account Value” for each class of shares. You can estimate the expenses you paid during the period by following these steps (of course, your account value and expenses will differ from those in this illustration): Divide your account value by $1,000 (if your account had an $8,600 value, then $8,600 ÷ $1,000 = 8.6). Then multiply the result by the number in the row for your class of shares under the headings “Actual” and “Expenses Paid During Period” (if Actual Expenses Paid During Period were $7.50, then 8.6 x $7.50 = $64.50). In this illustration, the actual expenses paid this period are $64.50.
Hypothetical Example for Comparison with Other Funds
Under the heading “Hypothetical” in the table, information is provided about hypothetical account values and hypothetical expenses based on the Fund’s actual expense ratio and an assumed rate of return of 5% per year before expenses, which is not the Fund’s actual return. This information may not be used to estimate the actual ending account balance or expenses you paid for the period, but it can help you compare ongoing costs of investing in the Fund with those of other funds. To do so, compare this 5% hypothetical example for the class of shares you hold with the 5% hypothetical examples that appear in the shareholder reports of other funds.
Please note that expenses shown in the table are meant to highlight ongoing costs and do not reflect any transactional costs. Therefore, information under the heading “Hypothetical” is useful in comparing ongoing costs only, and will not help you compare total costs of owning different funds. In addition, if transactional costs were included, your total costs would have been higher.
| | | | | | | | | | | | |
| | | | | Actual
(actual return after expenses) | | Hypothetical
(5% annual return before expenses) | | |
Share
Class | | Beginning
Account
Value 5/1/17 | | Ending
Account
Value 10/31/17 | | Expenses
Paid During
Period
5/1/17–10/31/171,2 | | Ending
Account
Value 10/31/17 | | Expenses
Paid During
Period
5/1/17–10/31/171,2 | | Net
Annualized
Expense
Ratio2 |
| | | | | | |
| A | | $1,000 | | $1,062.00 | | $5.41 | | $1,019.96 | | $5.30 | | 1.04% |
| C | | $1,000 | | $1,058.20 | | $9.29 | | $1,016.18 | | $9.10 | | 1.79% |
| R | | $1,000 | | $1,060.70 | | $6.70 | | $1,018.70 | | $6.56 | | 1.29% |
| R6 | | $1,000 | | $1,064.50 | | $3.07 | | $1,022.23 | | $3.01 | | 0.59% |
| Advisor | | $1,000 | | $1,063.50 | | $4.11 | | $1,021.22 | | $4.02 | | 0.79% |
1. Expenses are equal to the annualized expense ratio for the six-month period as indicated above—in the far right column—multiplied by the simple average account value over the period indicated, and then multiplied by 184/365 to reflect the one-half year period.
2. Reflects expenses after fee waivers and expense reimbursements. Does not include acquired fund fees and expenses.
| | | | |
| franklintempleton.com | | Annual Report | | 31 |
FRANKLIN VALUE INVESTORS TRUST
Financial Highlights
Franklin Balance Sheet Investment Fund
| | | | | | | | | | | | | | | | | | | | |
| | | Year Ended October 31, | |
| | | 2017 | | | 2016 | | | 2015 | | | 2014 | | | 2013 | |
| Class A | | | | | | | | | | | | | | | | | | | | |
Per share operating performance (for a share outstanding throughout the year) | | | | | | | | | | | | | | | | | | | | |
| | | | | |
Net asset value, beginning of year | | | $35.40 | | | | $40.06 | | | | $51.55 | | | | $53.98 | | | | $43.01 | |
| | | | |
| | | | | |
| Income from investment operationsa: | | | | | | | | | | | | | | | | | | | | |
| | | | | |
Net investment incomeb | | | 0.38 | c | | | 0.22 | | | | 0.19 | | | | 0.46 | d | | | 0.64 | e |
| | | | | |
Net realized and unrealized gains (losses) | | | 7.79 | | | | 1.17 | | | | (3.92 | ) | | | 3.06 | | | | 13.15 | |
| | | | |
| | | | | |
Total from investment operations | | | 8.17 | | | | 1.39 | | | | (3.73 | ) | | | 3.52 | | | | 13.79 | |
| | | | |
| | | | | |
Less distributions from: | | | | | | | | | | | | | | | | | | | | |
| | | | | |
Net investment income | | | (0.18 | ) | | | (0.28 | ) | | | (0.17 | ) | | | (0.65 | ) | | | (0.66 | ) |
| | | | | |
Net realized gains | | | (2.31 | ) | | | (5.77 | ) | | | (7.59 | ) | | | (5.30 | ) | | | (2.16 | ) |
| | | | |
| | | | | |
Total distributions | | | (2.49 | ) | | | (6.05 | ) | | | (7.76 | ) | | | (5.95 | ) | | | (2.82 | ) |
| | | | |
| | | | | |
Net asset value, end of year | | | $41.08 | | | | $35.40 | | | | $40.06 | | | | $51.55 | | | | $53.98 | |
| | | | |
| | | | | |
Total returnf | | | 23.63% | | | | 4.44% | | | | (7.73)% | | | | 6.97% | | | | 33.97% | |
| | | | | |
| Ratios to average net assets | | | | | | | | | | | | | | | | | | | | |
| | | | | |
Expenses before waiver and payments by affiliates | | | 0.92% | | | | 0.94% | | | | 0.95% | | | | 0.90% | | | | 0.91% | |
| | | | | |
Expenses net of waiver and payments by affiliates | | | 0.87% | g | | | 0.91% | g | | | 0.94% | | | | 0.89% | g | | | 0.91% | |
| | | | | |
Net investment income | | | 0.97% | c | | | 0.62% | | | | 0.45% | | | | 0.89% | d | | | 1.34% | e |
| | | | | |
| Supplemental data | | | | | | | | | | | | | | | | | | | | |
| | | | | |
Net assets, end of year (000’s) | | | $841,367 | | | | $795,663 | | | | $915,285 | | | | $1,221,903 | | | | $1,256,543 | |
| | | | | |
Portfolio turnover rate | | | 24.68% | | | | 30.25% | | | | 26.31% | | | | 25.08% | | | | 11.54% | |
aThe amount shown for a share outstanding throughout the period may not correlate with the Statement of Operations for the period due to the timing of sales and repurchases of the Fund’s shares in relation to income earned and/or fluctuating fair value of the investments of the Fund.
bBased on average daily shares outstanding.
cNet investment income per share includes approximately $0.09 per share related to income received in the form of special dividends in connection with certain Fund holdings. Excluding this amount, the ratio of net investment income to average net assets would have been 0.73%.
dNet investment income per share includes approximately $0.15 per share related to income received in the form of special dividends in connection with certain Fund holdings. Excluding this amount, the ratio of net investment income to average net assets would have been 0.61%.
eNet investment income per share includes approximately $0.15 per share related to income received in the form of special dividends in connection with certain Fund holdings. Excluding this amount, the ratio of net investment income to average net assets would have been 1.02%.
fTotal return does not reflect sales commissions or contingent deferred sales charges, if applicable.
gBenefit of expense reduction rounds to less than 0.01%.
| | | | |
| 32 | | Annual Report | The accompanying notes are an integral part of these financial statements. | | franklintempleton.com |
FRANKLIN VALUE INVESTORS TRUST
FINANCIAL HIGHLIGHTS
Franklin Balance Sheet Investment Fund (continued)
| | | | | | | | | | | | | | | | | | | | |
| | | Year Ended October 31, | |
| | | 2017 | | | 2016 | | | 2015 | | | 2014 | | | 2013 | |
| Class C | | | | | | | | | | | | | | | | | | | | |
| | | | | |
Per share operating performance (for a share outstanding throughout the year) | | | | | | | | | | | | | | | | | | | | |
| | | | | |
Net asset value, beginning of year | | | $34.01 | | | | $38.70 | | | | $50.22 | | | | $52.77 | | | | $42.10 | |
| | | | |
| | | | | |
| Income from investment operationsa: | | | | | | | | | | | | | | | | | | | | |
| | | | | |
Net investment income (loss)b | | | 0.08 | c | | | (0.04 | ) | | | (0.12 | ) | | | 0.07 | d | | | 0.25 | e |
| | | | | |
Net realized and unrealized gains (losses) | | | 7.49 | | | | 1.12 | | | | (3.81 | ) | | | 2.99 | | | | 12.93 | |
| | | | |
| | | | | |
Total from investment operations | | | 7.57 | | | | 1.08 | | | | (3.93 | ) | | | 3.06 | | | | 13.18 | |
| | | | |
| | | | | |
Less distributions from: | | | | | | | | | | | | | | | | | | | | |
| | | | | |
Net investment income | | | — | | | | — | | | | — | | | | (0.31 | ) | | | (0.35 | ) |
| | | | | |
Net realized gains | | | (2.31 | ) | | | (5.77 | ) | | | (7.59 | ) | | | (5.30 | ) | | | (2.16 | ) |
| | | | |
| | | | | |
Total distributions | | | (2.31 | ) | | | (5.77 | ) | | | (7.59 | ) | | | (5.61 | ) | | | (2.51 | ) |
| | | | |
| | | | | |
Net asset value, end of year | | | $39.27 | | | | $34.01 | | | | $38.70 | | | | $50.22 | | | | $52.77 | |
| | | | |
| | | | | |
Total returnf | | | 22.73% | | | | 3.65% | | | | (8.41)% | | | | 6.17% | | | | 33.01% | |
| | | | | |
| Ratios to average net assets | | | | | | | | | | | | | | | | | | | | |
| | | | | |
Expenses before waiver and payments by affiliates | | | 1.67% | | | | 1.69% | | | | 1.70% | | | | 1.65% | | | | 1.66% | |
| | | | | |
Expenses net of waiver and payments by affiliates | | | 1.62% | g | | | 1.66% | g | | | 1.69% | | | | 1.64% | g | | | 1.66% | |
| | | | | |
Net investment income (loss) | | | 0.22% | c | | | (0.13)% | | | | (0.30)% | | | | 0.14% | d | | | 0.59% | e |
| | | | | |
| Supplemental data | | | | | | | | | | | | | | | | | | | | |
| | | | | |
Net assets, end of year (000’s) | | | $65,586 | | | | $61,567 | | | | $73,185 | | | | $96,279 | | | | $96,462 | |
| | | | | |
Portfolio turnover rate | | | 24.68% | | | | 30.25% | | | | 26.31% | | | | 25.08% | | | | 11.54% | |
aThe amount shown for a share outstanding throughout the period may not correlate with the Statement of Operations for the period due to the timing of sales and repurchases of the Fund’s shares in relation to income earned and/or fluctuating fair value of the investments of the Fund.
bBased on average daily shares outstanding.
cNet investment income per share includes approximately $0.09 per share related to income received in the form of special dividends in connection with certain Fund holdings. Excluding this amount, the ratio of net investment income to average net assets would have been (0.02)%.
dNet investment income per share includes approximately $0.15 per share related to income received in the form of special dividends in connection with certain Fund holdings. Excluding this amount, the ratio of net investment income to average net assets would have been (0.14)%.
eNet investment income per share includes approximately $0.15 per share related to income received in the form of special dividends in connection with certain Fund holdings. Excluding this amount, the ratio of net investment income to average net assets would have been 0.27%.
fTotal return does not reflect sales commissions or contingent deferred sales charges, if applicable.
gBenefit of expense reduction rounds to less than 0.01%.
| | | | | | |
| franklintempleton.com | | The accompanying notes are an integral part of these financial statements. | Annual Report | | | 33 | |
FRANKLIN VALUE INVESTORS TRUST
FINANCIAL HIGHLIGHTS
Franklin Balance Sheet Investment Fund (continued)
| | | | | | | | | | | | | | | | | | | | |
| | | Year Ended October 31, | |
| | | 2017 | | | 2016 | | | 2015 | | | 2014 | | | 2013 | |
| Class R | | | | | | | | | | | | | | | | | | | | |
| | | | | |
Per share operating performance (for a share outstanding throughout the year) | | | | | | | | | | | | | | | | | | | | |
| | | | | |
Net asset value, beginning of year | | | $35.42 | | | | $40.06 | | | | $51.48 | | | | $53.90 | | | | $42.95 | |
| | | | |
| | | | | |
| Income from investment operationsa: | | | | | | | | | | | | | | | | | | | | |
| | | | | |
Net investment incomeb | | | 0.29 | c | | | 0.13 | | | | 0.09 | | | | 0.36 | d | | | 0.49 | e |
| | | | | |
Net realized and unrealized gains (losses) | | | 7.80 | | | | 1.17 | | | | (3.91 | ) | | | 3.01 | | | | 13.18 | |
| | | | |
| | | | | |
Total from investment operations | | | 8.09 | | | | 1.30 | | | | (3.82 | ) | | | 3.37 | | | | 13.67 | |
| | | | |
| | | | | |
| Less distributions from: | | | | | | | | | | | | | | | | | | | | |
| | | | | |
Net investment income | | | (0.10 | ) | | | (0.17 | ) | | | (0.01 | ) | | | (0.49 | ) | | | (0.56 | ) |
| | | | | |
Net realized gains | | | (2.31 | ) | | | (5.77 | ) | | | (7.59 | ) | | | (5.30 | ) | | | (2.16 | ) |
| | | | |
| | | | | |
Total distributions | | | (2.41 | ) | | | (5.94 | ) | | | (7.60 | ) | | | (5.79 | ) | | | (2.72 | ) |
| | | | |
| | | | | |
Net asset value, end of year | | | $41.10 | | | | $35.42 | | | | $40.06 | | | | $51.48 | | | | $53.90 | |
| | | | |
| | | | | |
Total return | | | 23.33% | | | | 4.17% | | | | (7.94)% | | | | 6.67% | | | | 33.67% | |
| | | | | |
| Ratios to average net assets | | | | | | | | | | | | | | | | | | | | |
| | | | | |
Expenses before waiver and payments by affiliates | | | 1.17% | | | | 1.19% | | | | 1.20% | | | | 1.15% | | | | 1.16% | |
| | | | | |
Expenses net of waiver and payments by affiliates | | | 1.12% | f | | | 1.16% | f | | | 1.19% | | | | 1.14% | f | | | 1.16% | |
| | | | | |
Net investment income | | | 0.72% | c | | | 0.37% | | | | 0.20% | | | | 0.64% | d | | | 1.09% | e |
| | | | | |
| Supplemental data | | | | | | | | | | | | | | | | | | | | |
| | | | | |
Net assets, end of year (000’s) | | | $7,884 | | | | $8,486 | | | | $9,831 | | | | $14,261 | | | | $17,992 | |
| | | | | |
Portfolio turnover rate | | | 24.68% | | | | 30.25% | | | | 26.31% | | | | 25.08% | | | | 11.54% | |
aThe amount shown for a share outstanding throughout the period may not correlate with the Statement of Operations for the period due to the timing of sales and repurchases of the Fund’s shares in relation to income earned and/or fluctuating fair value of the investments of the Fund.
bBased on average daily shares outstanding.
cNet investment income per share includes approximately $0.09 per share related to income received in the form of special dividends in connection with certain Fund holdings. Excluding this amount, the ratio of net investment income to average net assets would have been 0.48%.
dNet investment income per share includes approximately $0.15 per share related to income received in the form of special dividends in connection with certain Fund holdings. Excluding this amount, the ratio of net investment income to average net assets would have been 0.36%.
eNet investment income per share includes approximately $0.15 per share related to income received in the form of special dividends in connection with certain Fund holdings. Excluding this amount, the ratio of net investment income to average net assets would have been 0.77%.
fBenefit of expense reduction rounds to less than 0.01%.
| | | | |
| 34 | | Annual Report | The accompanying notes are an integral part of these financial statements. | | franklintempleton.com |
FRANKLIN VALUE INVESTORS TRUST
FINANCIAL HIGHLIGHTS
Franklin Balance Sheet Investment Fund (continued)
| | | | | | | | | | | | | | | | | | | | |
| | | Year Ended October 31, | |
| | | 2017 | | | 2016 | | | 2015 | | | 2014 | | | 2013a | |
| Class R6 | | | | | | | | | | | | | | | | | | | | |
| | | | | |
Per share operating performance (for a share outstanding throughout the year) | | | | | | | | | | | | | | | | | | | | |
| | | | | |
Net asset value, beginning of year | | | $36.40 | | | | $41.10 | | | | $52.70 | | | | $55.06 | | | | $47.79 | |
| | | | |
| | | | | |
| Income from investment operationsb: | | | | | | | | | | | | | | | | | | | | |
| | | | | |
Net investment incomec | | | 0.75 | d | | | 0.35 | | | | 0.37 | | | | 0.47 | e | | | 0.32 | f |
| | | | | |
Net realized and unrealized gains (losses) | | | 7.83 | | | | 1.20 | | | | (3.99 | ) | | | 3.32 | | | | 6.95 | |
| | | | |
| | | | | |
Total from investment operations | | | 8.58 | | | | 1.55 | | | | (3.62 | ) | | | 3.79 | | | | 7.27 | |
| | | | |
| | | | | |
| Less distributions from: | | | | | | | | | | | | | | | | | | | | |
| | | | | |
Net investment income | | | (0.29 | ) | | | (0.48 | ) | | | (0.39 | ) | | | (0.85 | ) | | | — | |
| | | | | |
Net realized gains | | | (2.31 | ) | | | (5.77 | ) | | | (7.59 | ) | | | (5.30 | ) | | | — | |
| | | | |
| | | | | |
Total distributions | | | (2.60 | ) | | | (6.25 | ) | | | (7.98 | ) | | | (6.15 | ) | | | — | |
| | | | |
| | | | | |
Net asset value, end of year | | | $42.38 | | | | $36.40 | | | | $41.10 | | | | $52.70 | | | | $55.06 | |
| | | | |
| | | | | |
Total returng | | | 24.10% | | | | 4.86% | | | | (7.33)% | | | | 7.37% | | | | 15.21% | |
| | | | | |
| Ratios to average net assetsh | | | | | | | | | | | | | | | | | | | | |
| | | | | |
Expenses before waiver and payments by affiliates | | | 0.57% | | | | 0.53% | | | | 0.51% | | | | 0.50% | | | | 2.10% | |
| | | | | |
Expenses net of waiver and payments by affiliates | | | 0.47% | i | | | 0.50% | i | | | 0.50% | | | | 0.49% | i | | | 0.51% | |
| | | | | |
Net investment income | | | 1.37% | d | | | 1.03% | | | | 0.89% | | | | 1.29% | e | | | 1.25% | f |
| | | | | |
| Supplemental data | | | | | | | | | | | | | | | | | | | | |
| | | | | |
Net assets, end of year (000’s) | | | $34,673 | | | | $157 | | | | $7,412 | | | | $7,863 | | | | $6 | |
| | | | | |
Portfolio turnover rate | | | 24.68% | | | | 30.25% | | | | 26.31% | | | | 25.08% | | | | 11.54% | |
aFor the period May 1, 2013 (effective date) to October 31, 2013.
bThe amount shown for a share outstanding throughout the period may not correlate with the Statement of Operations for the period due to the timing of sales and repurchases of the Fund’s shares in relation to income earned and/or fluctuating fair value of the investments of the Fund.
cBased on average daily shares outstanding.
dNet investment income per share includes approximately $0.09 per share related to income received in the form of special dividends in connection with certain Fund holdings. Excluding this amount, the ratio of net investment income to average net assets would have been 1.13%.
eNet investment income per share includes approximately $0.15 per share related to income received in the form of special dividends in connection with certain Fund holdings. Excluding this amount, the ratio of net investment income to average net assets would have been 1.01%.
fNet investment income per share includes approximately $0.07 per share related to income received in the form of special dividends in connection with certain Fund holdings. Excluding this amount, the ratio of net investment income to average net assets would have been 1.00%.
gTotal return is not annualized for periods less than one year.
hRatios are annualized for periods less than one year.
iBenefit of expense reduction rounds to less than 0.01%.
| | | | | | |
| franklintempleton.com | | The accompanying notes are an integral part of these financial statements. | Annual Report | | | 35 | |
FRANKLIN VALUE INVESTORS TRUST
FINANCIAL HIGHLIGHTS
Franklin Balance Sheet Investment Fund (continued)
| | | | | | | | | | | | | | | | | | | | |
| | | Year Ended October 31, | |
| | | 2017 | | | 2016 | | | 2015 | | | 2014 | | | 2013 | |
| Advisor Class | | | | | | | | | | | | | | | | | | | | |
| | | | | |
Per share operating performance (for a share outstanding throughout the year) | | | | | | | | | | | | | | | | | | | | |
| | | | | |
Net asset value, beginning of year | | | $36.45 | | | | $41.08 | | | | $52.68 | | | | $55.04 | | | | $43.79 | |
| | | | |
| | | | | |
| Income from investment operationsa: | | | | | | | | | | | | | | | | | | | | |
| | | | | |
Net investment incomeb | | | 0.49 | c | | | 0.31 | | | | 0.30 | | | | 0.60 | d | | | 0.79 | e |
| | | | | |
Net realized and unrealized gains (losses) | | | 8.04 | | | | 1.20 | | | | (4.00 | ) | | | 3.12 | | | | 13.40 | |
| | | | |
| | | | | |
Total from investment operations | | | 8.53 | | | | 1.51 | | | | (3.70 | ) | | | 3.72 | | | | 14.19 | |
| | | | |
| | | | | |
| Less distributions from: | | | | | | | | | | | | | | | | | | | | |
| | | | | |
Net investment income | | | (0.28 | ) | | | (0.37 | ) | | | (0.31 | ) | | | (0.78 | ) | | | (0.78 | ) |
| | | | | |
Net realized gains | | | (2.31 | ) | | | (5.77 | ) | | | (7.59 | ) | | | (5.30 | ) | | | (2.16 | ) |
| | | | |
| | | | | |
Total distributions | | | (2.59 | ) | | | (6.14 | ) | | | (7.90 | ) | | | (6.08 | ) | | | (2.94 | ) |
| | | | |
| | | | | |
Net asset value, end of year | | | $42.39 | | | | $36.45 | | | | $41.08 | | | | $52.68 | | | | $55.04 | |
| | | | |
| | | | | |
Total return | | | 23.98% | | | | 4.69% | | | | (7.51)% | | | | 7.23% | | | | 34.39% | |
| | | | | |
| Ratios to average net assets | | | | | | | | | | | | | | | | | | | | |
| | | | | |
Expenses before waiver and payments by affiliates | | | 0.67% | | | | 0.69% | | | | 0.70% | | | | 0.65% | | | | 0.66% | |
| | | | | |
Expenses net of waiver and payments by affiliates | | | 0.62% | f | | | 0.66% | f | | | 0.69% | | | | 0.64% | f | | | 0.66% | |
| | | | | |
Net investment income | | | 1.22% | c | | | 0.87% | | | | 0.70% | | | | 1.14% | d | | | 1.59% | e |
| | | | | |
| Supplemental data | | | | | | | | | | | | | | | | | | | | |
| | | | | |
Net assets, end of year (000’s) | | | $57,402 | | | | $75,573 | | | | $69,330 | | | | $115,254 | | | | $107,925 | |
| | | | | |
Portfolio turnover rate | | | 24.68% | | | | 30.25% | | | | 26.31% | | | | 25.08% | | | | 11.54% | |
aThe amount shown for a share outstanding throughout the period may not correlate with the Statement of Operations for the period due to the timing of sales and repurchases of the Fund’s shares in relation to income earned and/or fluctuating fair value of the investments of the Fund.
bBased on average daily shares outstanding.
cNet investment income per share includes approximately $0.09 per share related to income received in the form of special dividends in connection with certain Fund holdings. Excluding this amount, the ratio of net investment income to average net assets would have been 0.98%.
dNet investment income per share includes approximately $0.15 per share related to income received in the form of special dividends in connection with certain Fund holdings. Excluding this amount, the ratio of net investment income to average net assets would have been 0.86%.
eNet investment income per share includes approximately $0.15 per share related to income received in the form of special dividends in connection with certain Fund holdings. Excluding this amount, the ratio of net investment income to average net assets would have been 1.27%.
fBenefit of expense reduction rounds to less than 0.01%.
| | | | |
| 36 | | Annual Report | The accompanying notes are an integral part of these financial statements. | | franklintempleton.com |
FRANKLIN VALUE INVESTORS TRUST
Statement of Investments, October 31, 2017
Franklin Balance Sheet Investment Fund
| | | | | | | | | | |
| | | | | Shares | | | Value | |
| | | Common Stocks 85.9% | | | | | | |
| | Automobiles & Components 2.7% | | | | | | | | |
| | Cooper Tire & Rubber Co. | | | 129,100 | | | $ | 4,234,480 | |
| | General Motors Co. | | | 523,900 | | | | 22,517,222 | |
| | | | | | | | | | |
| | | | | | | | | 26,751,702 | |
| | | | | | | | | | |
| | Banks 15.5% | | | | | | | | |
| | Bank of America Corp. | | | 1,186,600 | | | | 32,500,974 | |
| | CIT Group Inc. | | | 215,600 | | | | 10,051,272 | |
| | Citigroup Inc. | | | 310,500 | | | | 22,821,750 | |
| | Citizens Financial Group Inc. | | | 417,300 | | | | 15,861,573 | |
| | Comerica Inc. | | | 126,900 | | | | 9,970,533 | |
| | Farmers & Merchants Bank of Long Beach | | | 1,475 | | | | 11,608,250 | |
| | JPMorgan Chase & Co. | | | 360,200 | | | | 36,239,722 | |
| | PNC Financial Services Group Inc. | | | 123,100 | | | | 16,838,849 | |
| | | | | | | | | | |
| | | | | | | | | 155,892,923 | |
| | | | | | | | | | |
| | Capital Goods 5.9% | | | | | | | | |
| | Johnson Controls International PLC | | | 78,923 | | | | 3,266,623 | |
| | Mueller Industries Inc. | | | 298,000 | | | | 10,355,500 | |
| | Regal Beloit Corp. | | | 174,800 | | | | 14,185,020 | |
| | Terex Corp. | | | 353,100 | | | | 16,634,541 | |
| a | | WESCO International Inc. | | | 230,300 | | | | 14,543,445 | |
| | | | | | | | | | |
| | | | | | | | | 58,985,129 | |
| | | | | | | | | | |
| | Commercial & Professional Services 1.8% | | | | | | | | |
| a | | FTI Consulting Inc. | | | 77,100 | | | | 3,296,025 | |
| | Heidrick & Struggles International Inc. | | | 297,800 | | | | 7,400,330 | |
| | Tetra Tech Inc. | | | 155,000 | | | | 7,633,750 | |
| | | | | | | | | | |
| | | | | | | | | 18,330,105 | |
| | | | | | | | | | |
| | Consumer Durables & Apparel 3.0% | | | | | | | | |
| | M.D.C. Holdings Inc. | | | 147,025 | | | | 5,445,806 | |
| | Toll Brothers Inc. | | | 533,600 | | | | 24,566,944 | |
| | | | | | | | | | |
| | | | | | | | | 30,012,750 | |
| | | | | | | | | | |
| | Consumer Services 1.8% | | | | | | | | |
| | Vail Resorts Inc. | | | 79,900 | | | | 18,298,698 | |
| | | | | | | | | | |
| | Diversified Financials 4.8% | | | | | | | | |
| | The Bank of New York Mellon Corp. | | | 312,400 | | | | 16,072,980 | |
| | Capital One Financial Corp. | | | 92,200 | | | | 8,498,996 | |
| | Morgan Stanley | | | 479,900 | | | | 23,995,000 | |
| | | | | | | | | | |
| | | | | | | | | 48,566,976 | |
| | | | | | | | | | |
| | Energy 13.2% | | | | | | | | |
| | Arch Coal Inc. | | | 127,000 | | | | 9,705,340 | |
| | Chevron Corp. | | | 178,600 | | | | 20,697,954 | |
| | Devon Energy Corp. | | | 195,400 | | | | 7,210,260 | |
| a | | McDermott International Inc. | | | 2,218,400 | | | | 14,685,808 | |
| | Occidental Petroleum Corp. | | | 247,600 | | | | 15,987,532 | |
| | Oceaneering International Inc. | | | 224,000 | | | | 4,529,280 | |
| a | | Rowan Cos. PLC | | | 1,239,300 | | | | 17,759,169 | |
| | Royal Dutch Shell PLC, A, ADR (United Kingdom) | | | 520,100 | | | | 32,781,903 | |
| | Tenaris SA (Italy) | | | 494,500 | | | | 6,769,377 | |
| | Valero Energy Corp. | | | 40,900 | | | | 3,226,601 | |
| | | | | | | | | | |
| | | | | | | | | 133,353,224 | |
| | | | | | | | | | |
| | | | |
| franklintempleton.com | | Annual Report | | 37 |
FRANKLIN VALUE INVESTORS TRUST
STATEMENT OF INVESTMENTS
Franklin Balance Sheet Investment Fund (continued)
| | | | | | | | | | |
| | | | | Shares | | | Value | |
| | Common Stocks (continued) | | | | | | | | |
| | Food, Beverage & Tobacco 2.9% | | | | | | | | |
| | Archer-Daniels-Midland Co. | | | 297,300 | | | $ | 12,150,651 | |
| | Bunge Ltd. | | | 201,500 | | | | 13,859,170 | |
| | GrainCorp Ltd. (Australia) | | | 459,436 | | | | 2,989,826 | |
| | | | | | | | | | |
| | | | | | | | | 28,999,647 | |
| | | | | | | | | | |
| | Life & Health Insurance 5.0% | | | | | | | | |
a | | Brighthouse Financial Inc. | | | 23,354 | | | | 1,452,152 | |
| | MetLife Inc. | | | 256,900 | | | | 13,764,702 | |
| | National Western Life Group Inc., A | | | 51,500 | | | | 18,415,370 | |
| | Prudential Financial Inc. | | | 155,400 | | | | 17,165,484 | |
| | | | | | | | | | |
| | | | | | | | | 50,797,708 | |
| | | | | | | | | | |
| | Materials 4.2% | | | | | | | | |
| | Aperam SA (Luxembourg) | | | 213,700 | | | | 11,498,734 | |
| | Domtar Corp. | | | 178,200 | | | | 8,432,424 | |
| | The Mosaic Co. | | | 332,700 | | | | 7,432,518 | |
| | Reliance Steel & Aluminum Co. | | | 113,600 | | | | 8,729,024 | |
a | | TimkenSteel Corp. | | | 450,500 | | | | 6,307,000 | |
| | | | | | | | | | |
| | | | | | | | | 42,399,700 | |
| | | | | | | | | | |
| | Media 3.1% | | | | | | | | |
| | News Corp., B | | | 1,085,700 | | | | 15,091,230 | |
| | Scholastic Corp. | | | 242,578 | | | | 8,960,831 | |
| | Time Inc. | | | 654,100 | | | | 7,587,560 | |
| | | | | | | | | | |
| | | | | | | | | 31,639,621 | |
| | | | | | | | | | |
| | Multi-line Insurance 1.3% | | | | | | | | |
| | American International Group Inc. | | | 160,800 | | | | 10,389,288 | |
| | The Hartford Financial Services Group Inc. | | | 45,800 | | | | 2,521,290 | |
| | | | | | | | | | |
| | | | | | | | | 12,910,578 | |
| | | | | | | | | | |
| | Pharmaceuticals, Biotechnology & Life Sciences 2.7% | | | | | | | | |
| | Allergan PLC | | | 66,200 | | | | 11,732,626 | |
a | | Bio-Rad Laboratories Inc., A | | | 68,428 | | | | 15,039,790 | |
| | | | | | | | | | |
| | | | | | | | | 26,772,416 | |
| | | | | | | | | | |
| | Property & Casualty Insurance 2.3% | | | | | | | | |
| | Chubb Ltd. | | | 94,232 | | | | 14,212,070 | |
| | The Travelers Cos. Inc. | | | 65,300 | | | | 8,648,985 | |
| | | | | | | | | | |
| | | | | | | | | 22,861,055 | |
| | | | | | | | | | |
| | Real Estate 0.9% | | | | | | | | |
| | Tier REIT Inc. | | | 283,900 | | | | 5,555,923 | |
a | | Trinity Place Holdings Inc. | | | 499,834 | | | | 3,598,805 | |
| | | | | | | | | | |
| | | | | | | | | 9,154,728 | |
| | | | | | | | | | |
| | Retailing 1.3% | | | | | | | | |
| | Abercrombie & Fitch Co., A | | | 228,500 | | | | 3,068,755 | |
| | DSW Inc., A | | | 545,240 | | | | 10,441,346 | |
| | | | | | | | | | |
| | | | | | | | | 13,510,101 | |
| | | | | | | | | | |
| | Semiconductors & Semiconductor Equipment 3.6% | | | | | | | | |
a | | Kulicke and Soffa Industries Inc. (Singapore) | | | 416,000 | | | | 9,422,400 | |
| | MKS Instruments Inc. | | | 180,800 | | | | 19,643,920 | |
a | | Photronics Inc. | | | 761,000 | | | | 7,381,700 | |
| | | | | | | | | | |
| | | | | | | | | 36,448,020 | |
| | | | | | | | | | |
| | | | |
| 38 | | Annual Report | | franklintempleton.com |
FRANKLIN VALUE INVESTORS TRUST
STATEMENT OF INVESTMENTS
Franklin Balance Sheet Investment Fund (continued)
| | | | | | | | | | |
| | | | | Shares | | | Value | |
| | Common Stocks (continued) | | | | | | | | |
| | Technology Hardware & Equipment 4.2% | | | | | | | | |
| | Corning Inc. | | | 1,361,000 | | | $ | 42,612,910 | |
| | | | | | | | | | |
| | Telecommunication Services 2.7% | | | | | | | | |
a | | Iridium Communications Inc. | | | 771,883 | | | | 9,262,596 | |
a | | ORBCOMM Inc. | | | 665,300 | | | | 7,524,543 | |
| | Vodafone Group PLC (United Kingdom) | | | 3,482,100 | | | | 9,973,215 | |
| | | | | | | | | | |
| | | | | | | | | 26,760,354 | |
| | | | | | | | | | |
| | Utilities 3.0% | | | | | | | | |
| | Eversource Energy | | | 136,000 | | | | 8,519,040 | |
| | Great Plains Energy Inc. | | | 86,300 | | | | 2,833,229 | |
| | IDACORP Inc. | | | 134,000 | | | | 12,332,020 | |
| | PNM Resources Inc. | | | 148,500 | | | | 6,444,900 | |
| | | | | | | | | | |
| | | | | | | | | 30,129,189 | |
| | | | | | | | | | |
| | Total Common Stocks (Cost $590,483,643) | | | | | | | 865,187,534 | |
| | | | | | | | | | |
| | | |
| | Convertible Preferred Stocks (Cost $4,716,875) 0.8% | | | | | | | | |
| | Telecommunication Services 0.8% | | | | | | | | |
| | Iridium Communications Inc., 6.75%, cvt., pfd., B | | | 20,000 | | | | 8,278,750 | |
| | | | | | | | | | |
| | | |
| | | | | Principal
Amount | | | | |
| | Corporate Bonds (Cost $1,490,000) 0.2% | | | | | | | | |
| | Capital Goods 0.2% | | | | | | | | |
| | Mueller Industries Inc., sub. bond, 6.00%, 3/01/27 | | $ | 1,490,000 | | | | 1,538,425 | |
| | | | | | | | | | |
| | Total Investments before Short Term Investments (Cost $596,690,518) | | | | | | | 875,004,709 | |
| | | | | | | | | | |
| | | |
| | | | | Shares | | | | |
| | Short Term Investments (Cost $133,130,464) 13.2% | | | | | | | | |
| | Money Market Funds 13.2% | | | | | | | | |
b,c | | Institutional Fiduciary Trust Money Market Portfolio, 0.69% | | | 133,130,464 | | | | 133,130,464 | |
| | | | | | | | | | |
| | Total Investments (Cost $729,820,982) 100.1% | | | | | | | 1,008,135,173 | |
| | Other Assets, less Liabilities (0.1)% | | | | | | | (1,222,624 | ) |
| | | | | | | | | | |
| | Net Assets 100.0% | | | | | | $ | 1,006,912,549 | |
| | | | | | | | | | |
See Abbreviations on page 85.
aNon-income producing.
bSee Note 3(f) regarding investments in affiliated management investment companies.
cThe rate shown is the annualized seven-day yield at period end.
| | | | | | |
| franklintempleton.com | | The accompanying notes are an integral part of these financial statements. | Annual Report | | | 39 | |
FRANKLIN VALUE INVESTORS TRUST
Financial Highlights
Franklin MicroCap Value Fund
| | | | | | | | | | | | | | | | | | | | |
| | | Year Ended October 31, | |
| | | 2017 | | | 2016 | | | 2015 | | | 2014 | | | 2013 | |
| Class A | | | | | | | | | | | | | | | | | | | | |
| | | | | |
Per share operating performance (for a share outstanding throughout the year) | | | | | | | | | | | | | | | | | | | | |
| | | | | |
Net asset value, beginning of year | | | $31.33 | | | | $32.90 | | | | $39.88 | | | | $40.99 | | | | $32.60 | |
| | | | |
| | | | | |
| Income from investment operationsa: | | | | | | | | | | | | | | | | | | | | |
| | | | | |
Net investment income (loss)b | | | 0.01 | | | | 0.11 | c | | | — | d | | | (0.07 | )e | | | 0.10 | f |
| | | | | |
Net realized and unrealized gains (losses) | | | 8.20 | | | | 2.22 | | | | (3.33 | ) | | | 1.44 | | | | 10.25 | |
| | | | |
| | | | | |
Total from investment operations | | | 8.21 | | | | 2.33 | | | | (3.33 | ) | | | 1.37 | | | | 10.35 | |
| | | | |
| | | | | |
Less distributions from: | | | | | | | | | | | | | | | | | | | | |
| | | | | |
Net investment income | | | (0.11 | ) | | | — | | | | — | | | | (0.04 | ) | | | (0.52 | ) |
| | | | | |
Net realized gains | | | (3.00 | ) | | | (3.90 | ) | | | (3.65 | ) | | | (2.44 | ) | | | (1.44 | ) |
| | | | |
| | | | | |
Total distributions | | | (3.11 | ) | | | (3.90 | ) | | | (3.65 | ) | | | (2.48 | ) | | | (1.96 | ) |
| | | | |
| | | | | |
Net asset value, end of year | | | $36.43 | | | | $31.33 | | | | $32.90 | | | | $39.88 | | | | $40.99 | |
| | | | |
| | | | | |
Total returng | | | 26.98% | | | | 8.25% | | | | (8.58)% | | | | 3.39% | | | | 33.64% | |
| | | | | |
| Ratios to average net assets | | | | | | | | | | | | | | | | | | | | |
| | | | | |
Expenses before waiver and payments by affiliates | | | 1.16% | | | | 1.19% | | | | 1.20% | | | | 1.16% | | | | 1.15% | |
| | | | | |
Expenses net of waiver and payments by affiliates | | | 1.15% | h | | | 1.18% | h | | | 1.19% | | | | 1.14% | h | | | 1.15% | |
| | | | | |
Net investment income (loss) | | | 0.03% | | | | 0.36% | c | | | 0.02% | | | | (0.17)% | e | | | 0.36% | f |
| | | | | |
| Supplemental data | | | | | | | | | | | | | | | | | | | | |
| | | | | |
Net assets, end of year (000’s) | | | $238,337 | | | | $232,964 | | | | $258,143 | | | | $346,820 | | | | $370,763 | |
| | | | | |
Portfolio turnover rate | | | 8.82% | | | | 11.72% | | | | 8.64% | | | | 11.63% | | | | 11.31% | |
aThe amount shown for a share outstanding throughout the period may not correlate with the Statement of Operations for the period due to the timing of sales and repurchases of the Fund’s shares in relation to income earned and/or fluctuating fair value of the investments of the Fund.
bBased on average daily shares outstanding.
cNet investment income per share includes approximately $0.07 per share related to income received in the form of special dividends in connection with certain Fund holdings. Excluding this amount, the ratio of net investment income to average net assets would have been 0.13%.
dAmount rounds to less than $0.01 per share.
eNet investment income per share includes approximately $0.06 per share related to income received in the form of special dividends in connection with certain Fund holdings. Excluding this amount, the ratio of net investment income to average net assets would have been (0.31)%.
fNet investment income per share includes approximately $0.17 per share related to income received in the form of special dividends in connection with certain Fund holdings. Excluding this amount, the ratio of net investment income to average net assets would have been (0.10)%.
gTotal return does not reflect sales commissions or contingent deferred sales charges, if applicable.
hBenefit of expense reduction rounds to less than 0.01%.
| | | | |
| 40 | | Annual Report | The accompanying notes are an integral part of these financial statements. | | franklintempleton.com |
FRANKLIN VALUE INVESTORS TRUST
FINANCIAL HIGHLIGHTS
Franklin MicroCap Value Fund (continued)
| | | | | | | | | | | | | | | | | | | | |
| | | Year Ended October 31, | |
| | | 2017 | | | 2016 | | | 2015 | | | 2014 | | | 2013a | |
| Class R6 | | | | | | | | | | | | | | | | | | | | |
| | | | | |
Per share operating performance (for a share outstanding throughout the year) | | | | | | | | | | | | | | | | | | | | |
| | | | | |
Net asset value, beginning of year | | | $31.66 | | | | $33.09 | | | | $39.94 | | | | $41.03 | | | | $34.43 | |
| | | | |
| | | | | |
| Income from investment operationsb: | | | | | | | | | | | | | | | | | | | | |
| | | | | |
Net investment incomec | | | 0.12 | | | | 0.22 | d | | | 0.14 | | | | 0.03 | e | | | 0.04 | |
| | | | | |
Net realized and unrealized gains (losses) | | | 8.30 | | | | 2.25 | | | | (3.34 | ) | | | 1.50 | | | | 6.56 | |
| | | | |
| | | | | |
Total from investment operations | | | 8.42 | | | | 2.47 | | | | (3.20 | ) | | | 1.53 | | | | 6.60 | |
| | | | |
| | | | | |
Less distributions from: | | | | | | | | | | | | | | | | | | | | |
| | | | | |
Net investment income | | | (0.23 | ) | | | — | | | | — | | | | (0.18 | ) | | | — | |
| | | | | |
Net realized gains | | | (3.00 | ) | | | (3.90 | ) | | | (3.65 | ) | | | (2.44 | ) | | | — | |
| | | | |
| | | | | |
Total distributions | | | (3.23 | ) | | | (3.90 | ) | | | (3.65 | ) | | | (2.62 | ) | | | — | |
| | | | |
| | | | | |
Net asset value, end of year | | | $36.85 | | | | $31.66 | | | | $33.09 | | | | $39.94 | | | | $41.03 | |
| | | | |
| | | | | |
Total returnf | | | 27.46% | | | | 8.67% | | | | (8.21)% | | | | 3.79% | | | | 19.17% | |
| | | | | |
| Ratios to average net assetsg | | | | | | | | | | | | | | | | | | | | |
| | | | | |
Expenses before waiver and payments by affiliates | | | 0.80% | | | | 0.81% | | | | 0.81% | | | | 0.79% | | | | 0.79% | |
| | | | | |
Expenses net of waiver and payments by affiliates | | | 0.79% | h | | | 0.80% | h | | | 0.80% | | | | 0.77% | h | | | 0.79% | |
| | | | | |
Net investment income | | | 0.39% | | | | 0.74% | d | | | 0.41% | | | | 0.20% | e | | | 0.19% | |
| | | | | |
| Supplemental data | | | | | | | | | | | | | | | | | | | | |
| | | | | |
Net assets, end of year (000’s) | | | $27,107 | | | | $18,288 | | | | $18,031 | | | | $25,020 | | | | $59,597 | |
| | | | | |
Portfolio turnover rate | | | 8.82% | | | | 11.72% | | | | 8.64% | | | | 11.63% | | | | 11.31% | |
aFor the period May 1, 2013 (effective date) to October 31, 2013.
bThe amount shown for a share outstanding throughout the period may not correlate with the Statement of Operations for the period due to the timing of sales and repurchases of the Fund’s shares in relation to income earned and/or fluctuating fair value of the investments of the Fund.
cBased on average daily shares outstanding.
dNet investment income per share includes approximately $0.07 per share related to income received in the form of special dividends in connection with certain Fund holdings. Excluding this amount, the ratio of net investment income to average net assets would have been 0.51%.
eNet investment income per share includes approximately $0.06 per share related to income received in the form of special dividends in connection with certain Fund holdings. Excluding this amount, the ratio of net investment income to average net assets would have been 0.06%.
fTotal return is not annualized for periods less than one year.
gRatios are annualized for periods less than one year.
hBenefit of expense reduction rounds to less than 0.01%.
| | | | | | |
| franklintempleton.com | | The accompanying notes are an integral part of these financial statements. | Annual Report | | | 41 | |
FRANKLIN VALUE INVESTORS TRUST
FINANCIAL HIGHLIGHTS
Franklin MicroCap Value Fund (continued)
| | | | | | | | | | | | | | | | | | | | |
| | | Year Ended October 31, | |
| | | 2017 | | | 2016 | | | 2015 | | | 2014 | | | 2013 | |
| Advisor Class | | | | | | | | | | | | | | | | | | | | |
| | | | | |
Per share operating performance (for a share outstanding throughout the year) | | | | | | | | | | | | | | | | | | | | |
| | | | | |
Net asset value, beginning of year | | | $31.52 | | | | $33.00 | | | | $39.90 | | | | $40.99 | | | | $32.61 | |
| | | | |
| | | | | |
| Income from investment operationsa: | | | | | | | | | | | | | | | | | | | | |
| | | | | |
Net investment incomeb | | | 0.09 | | | | 0.18 | c | | | 0.09 | | | | 0.04 | d | | | 0.31 | e |
| | | | | |
Net realized and unrealized gains (losses) | | | 8.25 | | | | 2.24 | | | | (3.34 | ) | | | 1.43 | | | | 10.11 | |
| | | | |
| | | | | |
Total from investment operations | | | 8.34 | | | | 2.42 | | | | (3.25 | ) | | | 1.47 | | | | 10.42 | |
| | | | |
| | | | | |
Less distributions from: | | | | | | | | | | | | | | | | | | | | |
| | | | | |
Net investment income | | | (0.19 | ) | | | — | | | | — | | | | (0.12 | ) | | | (0.60 | ) |
| | | | | |
Net realized gains | | | (3.00 | ) | | | (3.90 | ) | | | (3.65 | ) | | | (2.44 | ) | | | (1.44 | ) |
| | | | |
| | | | | |
Total distributions | | | (3.19 | ) | | | (3.90 | ) | | | (3.65 | ) | | | (2.56 | ) | | | (2.04 | ) |
| | | | |
| | | | | |
Net asset value, end of year | | | $36.67 | | | | $31.52 | | | | $33.00 | | | | $39.90 | | | | $40.99 | |
| | | | |
| | | | | |
Total return | | | 27.29% | | | | 8.53% | | | | (8.36)% | | | | 3.64% | | | | 33.93% | |
| | | | | |
| Ratios to average net assets | | | | | | | | | | | | | | | | | | | | |
| | | | | |
Expenses before waiver and payments by affiliates | | | 0.92% | | | | 0.95% | | | | 0.96% | | | | 0.92% | | | | 0.91% | |
| | | | | |
Expenses net of waiver and payments by affiliates | | | 0.91% | f | | | 0.94% | f | | | 0.95% | | | | 0.90% | f | | | 0.91% | |
| | | | | |
Net investment income | | | 0.27% | | | | 0.60% | c | | | 0.26% | | | | 0.07% | d | | | 0.60% | e |
| | | | | |
| Supplemental data | | | | | | | | | | | | | | | | | | | | |
| | | | | |
Net assets, end of year (000’s) | | | $76,228 | | | | $63,410 | | | | $67,538 | | | | $89,880 | | | | $116,292 | |
| | | | | |
Portfolio turnover rate | | | 8.82% | | | | 11.72% | | | | 8.64% | | | | 11.63% | | | | 11.31% | |
aThe amount shown for a share outstanding throughout the period may not correlate with the Statement of Operations for the period due to the timing of sales and repurchases of the Fund’s shares in relation to income earned and/or fluctuating fair value of the investments of the Fund.
bBased on average daily shares outstanding.
cNet investment income per share includes approximately $0.07 per share related to income received in the form of special dividends in connection with certain Fund holdings. Excluding this amount, the ratio of net investment income to average net assets would have been 0.37%.
dNet investment income per share includes approximately $0.06 per share related to income received in the form of special dividends in connection with certain Fund holdings. Excluding this amount, the ratio of net investment income to average net assets would have been (0.07)%.
eNet investment income per share includes approximately $0.17 per share related to income received in the form of special dividends in connection with certain Fund holdings. Excluding this amount, the ratio of net investment income to average net assets would have been 0.14%.
fBenefit of expense reduction rounds to less than 0.01%.
| | | | |
| 42 | | Annual Report | The accompanying notes are an integral part of these financial statements. | | franklintempleton.com |
FRANKLIN VALUE INVESTORS TRUST
Statement of Investments, October 31, 2017
Franklin MicroCap Value Fund
| | | | | | | | | | |
| | | | | Shares | | | Value | |
| | | | | | | | | | |
| | | Common Stocks 96.5% | | | | | | |
| | | Aerospace & Defense 3.0% | | | | | | |
| a | | Ducommun Inc. | | | 213,000 | | | $ | 7,022,610 | |
| a | | Sparton Corp. | | | 132,617 | | | | 3,088,650 | |
| | | | | | | | | | |
| | | | | | | | | 10,111,260 | |
| | | | | | | | | | |
| | | Banks 15.5% | | | | | | |
| | Bar Harbor Bankshares | | | 277,000 | | | | 8,373,710 | |
| | County Bancorp Inc. | | | 50,000 | | | | 1,633,000 | |
| | First Defiance Financial Corp. | | | 100,800 | | | | 5,463,360 | |
| | First Internet Bancorp | | | 206,800 | | | | 7,796,360 | |
| | Investar Holding Corp. | | | 220,000 | | | | 5,104,000 | |
| | Northeast Bancorp | | | 317,565 | | | | 8,177,299 | |
| | Old Line Bancshares Inc. | | | 54,000 | | | | 1,628,100 | |
| | Peoples Financial Services Corp. | | | 87,543 | | | | 3,969,199 | |
| | Southern Missouri Bancorp Inc. | | | 114,000 | | | | 4,210,020 | |
| | WSFS Financial Corp. | | | 129,700 | | | | 6,446,090 | |
| | | | | | | | | | |
| | | | | | | | | 52,801,138 | |
| | | | | | | | | | |
| | | Building Products 3.2% | | | | | | |
| a | | Armstrong Flooring Inc. | | | 29,800 | | | | 441,040 | |
| | Burnham Holdings Inc., A | | | 200,000 | | | | 2,901,000 | |
| a,b | | Continental Materials Corp. | | | 108,812 | | | | 2,094,631 | |
| a | | Gibraltar Industries Inc. | | | 170,000 | | | | 5,652,500 | |
| | | | | | | | | | |
| | | | | | | | | 11,089,171 | |
| | | | | | | | | | |
| | | Commercial & Professional Services 2.8% | | | | | | |
| | Healthcare Services Group Inc. | | | 179,800 | | | | 9,509,622 | |
| | | | | | | | | | |
| | | Construction & Engineering 6.3% | | | | | | |
| a | | Ameresco Inc., A | | | 649,900 | | | | 5,004,230 | |
| a | | Northwest Pipe Co. | | | 287,600 | | | | 5,245,824 | |
| a | | Orion Group Holdings Inc. | | | 445,000 | | | | 3,204,000 | |
| a | | Sterling Construction Co. | | | 457,382 | | | | 8,164,269 | |
| | | | | | | | | | |
| | | | | | | | | 21,618,323 | |
| | | | | | | | | | |
| | | Consumer Durables & Apparel 4.3% | | | | | | |
| a,b | | Delta Apparel Inc. | | | 413,050 | | | | 8,645,136 | |
| | Flexsteel Industries Inc. | | | 42,000 | | | | 2,111,340 | |
| | Rocky Brands Inc. | | | 217,620 | | | | 3,982,446 | |
| | | | | | | | | | |
| | | | | | | | | 14,738,922 | |
| | | | | | | | | | |
| | | Consumer Services 2.5% | | | | | | |
| a,b | | Full House Resorts Inc. | | | 1,923,520 | | | | 5,443,562 | |
| a | | Golden Entertainment Inc. | | | 115,700 | | | | 3,086,876 | |
| | | | | | | | | | |
| | | | | | | | | 8,530,438 | |
| | | | | | | | | | |
| | | Diversified Financials 0.6% | | | | | | |
| | Arbor Realty Trust Inc. | | | 220,000 | | | | 1,819,400 | |
| a,b | | Origen Financial Inc. | | | 1,900,000 | | | | 162,070 | |
| | | | | | | | | | |
| | | | | | | | | 1,981,470 | |
| | | | | | | | | | |
| | | Electrical Equipment 2.3% | | | | | | |
| a,b | | Global Power Equipment Group Inc. | | | 1,275,000 | | | | 5,163,750 | |
| a | | Ultralife Corp. | | | 367,321 | | | | 2,754,907 | |
| | | | | | | | | | |
| | | | | | | | | 7,918,657 | |
| | | | | | | | | | |
| | | | |
| franklintempleton.com | | Annual Report | | 43 |
FRANKLIN VALUE INVESTORS TRUST
STATEMENT OF INVESTMENTS
Franklin MicroCap Value Fund (continued)
| | | | | | | | | | |
| | | | | Shares | | | Value | |
| | | Common Stocks (continued) | | | | | | |
| | | Energy 8.9% | | | | | | |
| | Adams Resources & Energy Inc. | | | 24,626 | | | $ | 1,057,440 | |
| | Aegean Marine Petroleum Network Inc. (Greece) | | | 930,000 | | | | 4,185,000 | |
| a | | Ardmore Shipping Corp. (Ireland) | | | 489,000 | | | | 4,058,700 | |
| a | | Cloud Peak Energy Inc. | | | 580,000 | | | | 2,465,000 | |
| | Gulf Island Fabrication Inc. | | | 227,000 | | | | 2,985,050 | |
| a | | Natural Gas Services Group Inc. | | | 182,000 | | | | 5,059,600 | |
| a | | Pacific Ethanol Inc. | | | 413,500 | | | | 1,984,800 | |
| a | | PHI Inc. | | | 17,600 | | | | 200,992 | |
| a | | PHI Inc., non-voting | | | 391,000 | | | | 4,570,790 | |
| a | | Renewable Energy Group Inc. | | | 323,100 | | | | 3,909,510 | |
| | | | | | | | | | |
| | | | | | | | | 30,476,882 | |
| | | | | | | | | | |
| | | Food & Staples Retailing 1.6% | | | | | | |
| | Village Super Market Inc., A | | | 227,000 | | | | 5,445,730 | |
| | | | | | | | | | |
| | | Food, Beverage & Tobacco 5.4% | | | | | | |
| | John B. Sanfilippo & Son Inc. | | | 25,000 | | | | 1,471,250 | |
| | Omega Protein Corp. | | | 176,000 | | | | 3,854,400 | |
| a | | Seneca Foods Corp., A | | | 236,000 | | | | 8,496,000 | |
| a | | Seneca Foods Corp., B | | | 121,500 | | | | 4,598,775 | |
| | | | | | | | | | |
| | | | | | | | | 18,420,425 | |
| | | | | | | | | | |
| | | Health Care Equipment & Services 1.5% | | | | | | |
| | Invacare Corp. | | | 340,000 | | | | 5,270,000 | |
| | | | | | | | | | |
| | | Insurance 2.4% | | 176,650 | | | 3,497,670 | |
| a | | ACMAT Corp., A | | | | | | | | |
| | Baldwin & Lyons Inc., B | | | 211,434 | | | | 4,852,410 | |
| | | | | | | | | | |
| | | | | | | | | 8,350,080 | |
| | | | | | | | | | |
| | | Machinery 13.4% | | | | | | |
| | Alamo Group Inc. | | | 72,600 | | | | 7,659,300 | |
| | Hardinge Inc. | | | 552,500 | | | | 9,138,350 | |
| | Hurco Cos. Inc. | | | 217,700 | | | | 9,742,075 | |
| | Miller Industries Inc. | | | 321,000 | | | | 9,068,250 | |
| | Spartan Motors Inc. | | | 639,500 | | | | 10,327,925 | |
| | | | | | | | | | |
| | | | | | | | | 45,935,900 | |
| | | | | | | | | | |
| | | Materials 6.8% | | | | | | |
| | Friedman Industries Inc. | | | 130,000 | | | | 769,600 | |
| | Mercer International Inc. (Canada) | | | 200,000 | | | | 2,940,000 | |
| | The Monarch Cement Co. | | | 104,500 | | | | 6,938,800 | |
| | Olympic Steel Inc. | | | 163,200 | | | | 3,081,216 | |
| | Schnitzer Steel Industries Inc., A | | | 91,400 | | | | 2,691,730 | |
| a | | Universal Stainless & Alloy Products Inc. | | | 331,000 | | | | 6,785,500 | |
| | | | | | | | | | |
| | | | | | | | | 23,206,846 | |
| | | | | | | | | | |
| | | Real Estate 1.3% | | | | | | |
| | Griffin Industrial Realty Inc. | | | 122,000 | | | | 4,526,200 | |
| | | | | | | | | | |
| | | Retailing 3.4% | | | | | | |
| | Caleres Inc. | | | 172,000 | | | | 4,700,760 | |
| | Haverty Furniture Cos. Inc. | | | 155,000 | | | | 3,696,750 | |
| | Shoe Carnival Inc. | | | 175,000 | | | | 3,284,750 | |
| | | | | | | | | | |
| | | | | | | | | 11,682,260 | |
| | | | | | | | | | |
| | | | |
| 44 | | Annual Report | | franklintempleton.com |
FRANKLIN VALUE INVESTORS TRUST
STATEMENT OF INVESTMENTS
Franklin MicroCap Value Fund (continued)
| | | | | | | | | | |
| | | | | Shares | | | Value | |
| | | Common Stocks (continued) | | | | | | |
| | | Semiconductors & Semiconductor Equipment 1.3% | | | | | | |
| a | | Photronics Inc. | | | 452,000 | | | $ | 4,384,400 | |
| | | | | | | | | | |
| | | Technology Hardware & Equipment 2.3% | | | | | | |
| a | | Key Tronic Corp. | | | 480,000 | | | | 3,614,400 | |
| a | | Kimball Electronics Inc. | | | 79,000 | | | | 1,738,000 | |
| | Richardson Electronics Ltd. | | | 375,000 | | | | 2,482,500 | |
| | | | | | | | | | |
| | | | | | | | 7,834,900 | |
| | | | | | | | | | |
| | | Telecommunication Services 5.0% | | | | | | |
| a | | Alaska Communications Systems Group Inc. | | | 1,155,600 | | | | 2,819,664 | |
| | ATN International Inc. | | | 66,000 | | | | 3,583,141 | |
| a | | Hawaiian Telcom Holdco Inc. | | | 213,600 | | | | 6,440,040 | |
| | North State Telecommunications Corp., B | | | 21,757 | | | | 1,343,495 | |
| a | | ORBCOMM Inc. | | | 250,000 | | | | 2,827,500 | |
| | | | | | | | | | |
| | | | | | | | | 17,013,840 | |
| | | | | | | | | | |
| | | Trading Companies & Distributors 1.5% | | | | | | |
| | Central Steel and Wire Co. | | | 2,850 | | | | 1,211,250 | |
| a | | Houston Wire & Cable Co. | | | 250,000 | | | | 1,337,500 | |
| a | | Titan Machinery Inc. | | | 166,000 | | | | 2,471,740 | |
| | | | | | | | | | |
| | | | | | | | | 5,020,490 | |
| | | | | | | | | | |
| | | Transportation 1.2% | | | | | | |
| | Celadon Group Inc. | | | 395,300 | | | | 2,905,455 | |
| a | | Global Ship Lease Inc., A (United Kingdom) | | | 700,000 | | | | 1,015,000 | |
| | | | | | | | | | |
| | | | | | | | | 3,920,455 | |
| | | | | | | | | | |
| | Total Common Stocks (Cost $187,234,941) | | | | | | | 329,787,409 | |
| | | | | | | | | | |
| | | |
| | Short Term Investments (Cost $11,588,537) 3.4% | | | | | | | | |
| | | Money Market Funds 3.4% | | | | | | |
| c,d | | Institutional Fiduciary Trust Money Market Portfolio, 0.69% | | | 11,588,537 | | | | 11,588,537 | |
| | | | | | | | | | |
| | Total Investments (Cost $198,823,478) 99.9% | | | | | | | 341,375,946 | |
| | Other Assets, less Liabilities 0.1% | | | | | | | 296,766 | |
| | | | | | | | | | |
| | Net Assets 100.0% | | | | | | $ | 341,672,712 | |
| | | | | | | | | | |
aNon-income producing.
bSee Note 7 regarding holdings of 5% voting securities.
cSee Note 3(f) regarding investments in affiliated management investment companies.
dThe rate shown is the annualized seven-day yield at period end.
| | | | | | |
| franklintempleton.com | | The accompanying notes are an integral part of these financial statements. | Annual Report | | | 45 | |
FRANKLIN VALUE INVESTORS TRUST
Financial Highlights
Franklin MidCap Value Fund
| | | | | | | | | | | | | | | | | | | | |
| | | Year Ended October 31, | |
| | | 2017 | | | 2016 | | | 2015 | | | 2014 | | | 2013 | |
| Class A | | | | | | | | | | | | | | | | | | | | |
| | | | | |
Per share operating performance (for a share outstanding throughout the year) | | | | | | | | | | | | | | | | | | | | |
| | | | | |
Net asset value, beginning of year | | | $14.53 | | | | $15.22 | | | | $16.13 | | | | $14.76 | | | | $11.38 | |
| | | | |
| | | | | |
| Income from investment operationsa: | | | | | | | | | | | | | | | | | | | | |
| | | | | |
Net investment incomeb | | | 0.04 | | | | 0.12c | | | | 0.11 | | | | 0.08 | d | | | 0.11 | e |
| | | | | |
Net realized and unrealized gains (losses) | | | 2.40 | | | | 0.48 | | | | (0.60 | ) | | | 1.37 | | | | 3.43 | |
| | | | |
| | | | | |
Total from investment operations | | | 2.44 | | | | 0.60 | | | | (0.49 | ) | | | 1.45 | | | | 3.54 | |
| | | | |
| | | | | |
Less distributions from: | | | | | | | | | | | | | | | | | | | | |
| | | | | |
Net investment income | | | (0.11 | ) | | | (0.07 | ) | | | (0.11 | ) | | | (0.08 | ) | | | (0.16 | ) |
| | | | | |
Net realized gains | | | (0.18 | ) | | | (1.22 | ) | | | (0.31 | ) | | | — | | | | — | |
| | | | |
| | | | | |
Total distributions | | | (0.29 | ) | | | (1.29 | ) | | | (0.42 | ) | | | (0.08 | ) | | | (0.16 | ) |
| | | | |
| | | | | |
Net asset value, end of year | | | $16.68 | | | | $14.53 | | | | $15.22 | | | | $16.13 | | | | $14.76 | |
| | | | |
| | | | | |
Total returnf | | | 16.96% | | | | 4.61% | | | | (3.07)% | | | | 9.91% | | | | 31.47% | |
| | | | | |
| Ratios to average net assets | | | | | | | | | | | | | | | | | | | | |
| | | | | |
Expenses before waiver and payments by affiliates | | | 1.52% | | | | 1.54% | | | | 1.60% | | | | 1.56% | | | | 1.64% | |
| | | | | |
Expenses net of waiver and payments by affiliates | | | 1.30% | | | | 1.30% | | | | 1.34% | | | | 1.35% | g | | | 1.35% | |
| | | | | |
Net investment income | | | 0.26% | | | | 0.87% | c | | | 0.72% | | | | 0.50% | d | | | 0.83% | e |
| | | | | |
| Supplemental data | | | | | | | | | | | | | | | | | | | | |
| | | | | |
Net assets, end of year (000’s) | | | $148,652 | | | | $128,906 | | | | $127,043 | | | | $128,483 | | | | $102,866 | |
| | | | | |
Portfolio turnover rate | | | 39.27% | | | | 86.55% | | | | 61.80% | | | | 24.44% | | | | 10.00% | |
aThe amount shown for a share outstanding throughout the period may not correlate with the Statement of Operations for the period due to the timing of sales and repurchases of the Fund’s shares in relation to income earned and/or fluctuating fair value of the investments of the Fund.
bBased on average daily shares outstanding.
cNet investment income per share includes approximately $0.05 per share related to income received in the form of special dividends in connection with certain Fund holdings. Excluding this amount, the ratio of net investment income to average net assets would have been 0.49%.
dNet investment income per share includes approximately $0.02 per share related to income received in the form of special dividends in connection with certain Fund holdings. Excluding this amount, the ratio of net investment income to average net assets would have been 0.38%.
eNet investment income per share includes approximately $0.03 per share related to income received in the form of special dividends in connection with certain Fund holdings. Excluding this amount, the ratio of net investment income to average net assets would have been 0.61%.
fTotal return does not reflect sales commissions or contingent deferred sales charges, if applicable.
gBenefit of expense reduction rounds to less than 0.01%.
| | | | |
| 46 | | Annual Report | The accompanying notes are an integral part of these financial statements. | | franklintempleton.com |
FRANKLIN VALUE INVESTORS TRUST
FINANCIAL HIGHLIGHTS
Franklin MidCap Value Fund (continued)
| | | | | | | | | | | | | | | | | | | | |
| | | Year Ended October 31, | |
| | | 2017 | | | 2016 | | | 2015 | | | 2014 | | | 2013 | |
| Class C | | | | | | | | | | | | | | | | | | | | |
| | | | | |
Per share operating performance (for a share outstanding throughout the year) | | | | | | | | | | | | | | | | | | | | |
| | | | | |
Net asset value, beginning of year | | | $14.24 | | | | $14.97 | | | | $15.87 | | | | $14.55 | | | | $11.21 | |
| | | | |
| | | | | |
| Income from investment operationsa: | | | | | | | | | | | | | | | | | | | | |
| | | | | |
Net investment income (loss)b | | | (0.08 | ) | | | 0.02 | c | | | — | d | | | (0.03 | )e | | | 0.02 | f |
| | | | | |
Net realized and unrealized gains (losses) | | | 2.35 | | | | 0.47 | | | | (0.59 | ) | | | 1.36 | | | | 3.39 | |
| | | | |
| | | | | |
Total from investment operations | | | 2.27 | | | | 0.49 | | | | (0.59 | ) | | | 1.33 | | | | 3.41 | |
| | | | |
| | | | | |
Less distributions from: | | | | | | | | | | | | | | | | | | | | |
| | | | | |
Net investment income | | | (0.01 | ) | | | — | | | | — | | | | (0.01 | ) | | | (0.07 | ) |
| | | | | |
Net realized gains | | | (0.18 | ) | | | (1.22 | ) | | | (0.31 | ) | | | — | | | | — | |
| | | | |
| | | | | |
Total distributions | | | (0.19 | ) | | | (1.22 | ) | | | (0.31 | ) | | | (0.01 | ) | | | (0.07 | ) |
| | | | |
| | | | | |
Net asset value, end of year | | | $16.32 | | | | $14.24 | | | | $14.97 | | | | $15.87 | | | | $14.55 | |
| | | | |
| | | | | |
Total returng | | | 16.03% | | | | 3.88% | | | | (3.75)% | | | | 9.12% | | | | 30.56% | |
| | | | | |
| Ratios to average net assets | | | | | | | | | | | | | | | | | | | | |
| | | | | |
Expenses before waiver and payments by affiliates | | | 2.27% | | | | 2.28% | | | | 2.31% | | | | 2.26% | | | | 2.34% | |
| | | | | |
Expenses net of waiver and payments by affiliates | | | 2.05% | | | | 2.04% | | | | 2.05% | | | | 2.05% | h | | | 2.05% | |
| | | | | |
Net investment income (loss) | | | (0.49)% | | | | 0.13% | c | | | 0.01% | | | | (0.20)% | e | | | 0.13% | f |
| | | | | |
| Supplemental data | | | | | | | | | | | | | | | | | | | | |
| | | | | |
Net assets, end of year (000’s) | | | $26,579 | | | | $23,197 | | | | $23,329 | | | | $23,926 | | | | $21,965 | |
| | | | | |
Portfolio turnover rate | | | 39.27% | | | | 86.55% | | | | 61.80% | | | | 24.44% | | | | 10.00% | |
aThe amount shown for a share outstanding throughout the period may not correlate with the Statement of Operations for the period due to the timing of sales and repurchases of the Fund’s shares in relation to income earned and/or fluctuating fair value of the investments of the Fund.
bBased on average daily shares outstanding.
cNet investment income per share includes approximately $0.05 per share related to income received in the form of special dividends in connection with certain Fund holdings. Excluding this amount, the ratio of net investment income to average net assets would have been (0.25)%.
dAmount rounds to less than $0.01 per share.
eNet investment income per share includes approximately $0.02 per share related to income received in the form of special dividends in connection with certain Fund holdings. Excluding this amount, the ratio of net investment income to average net assets would have been (0.32)%.
fNet investment income per share includes approximately $0.03 per share related to income received in the form of special dividends in connection with certain Fund holdings. Excluding this amount, the ratio of net investment income to average net assets would have been (0.09)%.
gTotal return does not reflect sales commissions or contingent deferred sales charges, if applicable.
hBenefit of expense reduction rounds to less than 0.01%.
| | | | | | |
| franklintempleton.com | | The accompanying notes are an integral part of these financial statements. | Annual Report | | | 47 | |
FRANKLIN VALUE INVESTORS TRUST
FINANCIAL HIGHLIGHTS
Franklin MidCap Value Fund (continued)
| | | | | | | | | | | | | | | | | | | | |
| | | Year Ended October 31, | |
| | | 2017 | | | 2016 | | | 2015 | | | 2014 | | | 2013 | |
| Class R | | | | | | | | | | | | | | | | | | | | |
| | | | | |
Per share operating performance (for a share outstanding throughout the year) | | | | | | | | | | | | | | | | | | | | |
| | | | | |
Net asset value, beginning of year | | | $14.53 | | | | $15.19 | | | | $16.09 | | | | $14.71 | | | | $11.35 | |
| | | | |
| | | | | |
| Income from investment operationsa: | | | | | | | | | | | | | | | | | | | | |
| | | | | |
Net investment incomeb | | | — | c | | | 0.09 | d | | | 0.08 | | | | 0.05 | e | | | 0.08 | f |
| | | | | |
Net realized and unrealized gains (losses) | | | 2.40 | | | | 0.48 | | | | (0.61 | ) | | | 1.38 | | | | 3.42 | |
| | | | |
| | | | | |
Total from investment operations | | | 2.40 | | | | 0.57 | | | | (0.53 | ) | | | 1.43 | | | | 3.50 | |
| | | | |
| | | | | |
Less distributions from: | | | | | | | | | | | | | | | | | | | | |
| | | | | |
Net investment income | | | (0.07 | ) | | | (0.01 | ) | | | (0.06 | ) | | | (0.05 | ) | | | (0.14 | ) |
| | | | | |
Net realized gains | | | (0.18 | ) | | | (1.22 | ) | | | (0.31 | ) | | | — | | | | — | |
| | | | |
| | | | | |
Total distributions | | | (0.25 | ) | | | (1.23 | ) | | | (0.37 | ) | | | (0.05 | ) | | | (0.14 | ) |
| | | | |
| | | | | |
Net asset value, end of year | | | $16.68 | | | | $14.53 | | | | $15.19 | | | | $16.09 | | | | $14.71 | |
| | | | |
| | | | | |
Total return | | | 16.68% | | | | 4.40% | | | | (3.30)% | | | | 9.75% | | | | 31.22% | |
| | | | | |
| Ratios to average net assets | | | | | | | | | | | | | | | | | | | | |
| | | | | |
Expenses before waiver and payments by affiliates | | | 1.77% | | | | 1.79% | | | | 1.81% | | | | 1.76% | | | | 1.84% | |
| | | | | |
Expenses net of waiver and payments by affiliates | | | 1.55% | | | | 1.55% | | | | 1.55% | | | | 1.55% | g | | | 1.55% | |
| | | | | |
Net investment income | | | 0.01% | | | | 0.62% | d | | | 0.51% | | | | 0.30% | e | | | 0.63% | f |
| | | | | |
| Supplemental data | | | | | | | | | | | | | | | | | | | | |
| | | | | |
Net assets, end of year (000’s) | | | $703 | | | | $712 | | | | $755 | | | | $1,103 | | | | $1,000 | |
| | | | | |
Portfolio turnover rate | | | 39.27% | | | | 86.55% | | | | 61.80% | | | | 24.44% | | | | 10.00% | |
aThe amount shown for a share outstanding throughout the period may not correlate with the Statement of Operations for the period due to the timing of sales and repurchases of the Fund’s shares in relation to income earned and/or fluctuating fair value of the investments of the Fund.
bBased on average daily shares outstanding.
cAmount rounds to less than $0.01 per share.
dNet investment income per share includes approximately $0.05 per share related to income received in the form of special dividends in connection with certain Fund holdings. Excluding this amount, the ratio of net investment income to average net assets would have been 0.24%.
eNet investment income per share includes approximately $0.02 per share related to income received in the form of special dividends in connection with certain Fund holdings. Excluding this amount, the ratio of net investment income to average net assets would have been 0.18%.
fNet investment income per share includes approximately $0.03 per share related to income received in the form of special dividends in connection with certain Fund holdings. Excluding this amount, the ratio of net investment income to average net assets would have been 0.41%.
gBenefit of expense reduction rounds to less than 0.01%.
| | | | |
| 48 | | Annual Report | The accompanying notes are an integral part of these financial statements. | | franklintempleton.com |
FRANKLIN VALUE INVESTORS TRUST
FINANCIAL HIGHLIGHTS
Franklin MidCap Value Fund (continued)
| | | | | | | | | | | | | | | | | | | | |
| | | Year Ended October 31, | |
| | | 2017 | | | 2016 | | | 2015 | | | 2014 | | | 2013 | |
| Advisor Class | | | | | | | | | | | | | | | | | | | | |
| | | | | |
Per share operating performance (for a share outstanding throughout the year) | | | | | | | | | | | | | | | | | | | | |
| | | | | |
| Net asset value, beginning of year | | | $14.61 | | | | $15.31 | | | | $16.23 | | | | $14.84 | | | | $11.44 | |
| | | | |
| | | | | |
Income from investment operationsa: | | | | | | | | | | | | | | | | | | | | |
| | | | | |
Net investment incomeb | | | 0.09 | | | | 0.16 | c | | | 0.16 | | | | 0.13 | d | | | 0.15 | e |
| | | | | |
Net realized and unrealized gains (losses) | | | 2.43 | | | | 0.47 | | | | (0.62 | ) | | | 1.38 | | | | 3.45 | |
| | | | |
| | | | | |
Total from investment operations | | | 2.52 | | | | 0.63 | | | | (0.46 | ) | | | 1.51 | | | | 3.60 | |
| | | | |
| | | | | |
Less distributions from: | | | | | | | | | | | | | | | | | | | | |
| | | | | |
Net investment income | | | (0.15 | ) | | | (0.11 | ) | | | (0.15 | ) | | | (0.12 | ) | | | (0.20 | ) |
| | | | | |
Net realized gains | | | (0.18 | ) | | | (1.22 | ) | | | (0.31 | ) | | | — | | | | — | |
| | | | |
| | | | | |
Total distributions | | | (0.33 | ) | | | (1.33 | ) | | | (0.46 | ) | | | (0.12 | ) | | | (0.20 | ) |
| | | | |
| | | | | |
Net asset value, end of year | | | $16.80 | | | | $14.61 | | | | $15.31 | | | | $16.23 | | | | $14.84 | |
| | | | |
| | | | | |
Total return | | | 17.30% | | | | 4.93% | | | | (2.83)% | | | | 10.25% | | | | 31.94% | |
| | | | | |
| Ratios to average net assets | | | | | | | | | | | | | | | | | | | | |
| | | | | |
Expenses before waiver and payments by affiliates | | | 1.27% | | | | 1.29% | | | | 1.31% | | | | 1.26% | | | | 1.34% | |
| | | | | |
Expenses net of waiver and payments by affiliates | | | 1.05% | | | | 1.05% | | | | 1.05% | | | | 1.05% | f | | | 1.05% | |
| | | | | |
Net investment income | | | 0.51% | | | | 1.12% | c | | | 1.01% | | | | 0.80% | d | | | 1.13% | e |
| | | | | |
| Supplemental data | | | | | | | | | | | | | | | | | | | | |
| | | | | |
Net assets, end of year (000’s) | | | $9,596 | | | | $5,980 | | | | $4,706 | | | | $4,369 | | | | $3,596 | |
| | | | | |
Portfolio turnover rate | | | 39.27% | | | | 86.55% | | | | 61.80% | | | | 24.44% | | | | 10.00% | |
aThe amount shown for a share outstanding throughout the period may not correlate with the Statement of Operations for the period due to the timing of sales and repurchases of the Fund’s shares in relation to income earned and/or fluctuating fair value of the investments of the Fund.
bBased on average daily shares outstanding.
cNet investment income per share includes approximately $0.05 per share related to income received in the form of special dividends in connection with certain Fund holdings. Excluding this amount, the ratio of net investment income to average net assets would have been 0.74%.
dNet investment income per share includes approximately $0.02 per share related to income received in the form of special dividends in connection with certain Fund holdings. Excluding this amount, the ratio of net investment income to average net assets would have been 0.68%.
eNet investment income per share includes approximately $0.03 per share related to income received in the form of special dividends in connection with certain Fund holdings. Excluding this amount, the ratio of net investment income to average net assets would have been 0.91%.
fBenefit of expense reduction rounds to less than 0.01%.
| | | | | | |
| franklintempleton.com | | The accompanying notes are an integral part of these financial statements. | Annual Report | | | 49 | |
FRANKLIN VALUE INVESTORS TRUST
Statement of Investments, October 31, 2017
Franklin MidCap Value Fund
| | | | | | | | | | |
| | | | | Shares/
Units | | | Value | |
| | | Common Stocks and Other Equity Interests 97.7% | | | | | | |
| | | Automobiles & Components 0.7% | | | | | | |
| | Delphi Automotive PLC | | | 12,600 | | | $ | 1,252,188 | |
| | | | | | | | | | |
| | | Banks 6.6% | | | | | | |
| | Citizens Financial Group Inc. | | | 27,200 | | | | 1,033,872 | |
| | First Horizon National Corp. | | | 157,900 | | | | 2,963,783 | |
| | First Republic Bank/CA | | | 25,700 | | | | 2,503,180 | |
| | Huntington Bancshares Inc. | | | 180,400 | | | | 2,489,520 | |
| | KeyCorp | | | 54,700 | | | | 998,275 | |
| | SunTrust Banks Inc. | | | 37,100 | | | | 2,233,791 | |
| | | | | | | | | | |
| | | | | | | | | 12,222,421 | |
| | | | | | | | | | |
| | | Capital Goods 12.9% | | | | | | |
| | BWX Technologies Inc. | | | 29,100 | | | | 1,743,672 | |
| | Carlisle Cos. Inc. | | | 16,500 | | | | 1,812,195 | |
| | Johnson Controls International PLC | | �� | 69,100 | | | | 2,860,049 | |
| | L3 Technologies Inc. | | | 15,300 | | | | 2,863,854 | |
| | Parker-Hannifin Corp. | | | 6,400 | | | | 1,168,704 | |
| | Pentair PLC (United Kingdom) | | | 13,800 | | | | 972,348 | |
| | Roper Technologies Inc. | | | 16,900 | | | | 4,363,073 | |
| | Textron Inc. | | | 75,900 | | | | 4,002,966 | |
| a | | WABCO Holdings Inc. | | | 11,200 | | | | 1,652,784 | |
| | Xylem Inc. | | | 38,300 | | | | 2,548,099 | |
| | | | | | | | | | |
| | | | | | | | | 23,987,744 | |
| | | | | | | | | | |
| | | Consumer Durables & Apparel 1.3% | | | | | | |
| | PVH Corp. | | | 8,200 | | | | 1,039,842 | |
| | Toll Brothers Inc. | | | 28,800 | | | | 1,325,952 | |
| | | | | | | | | | |
| | | | | | | | | 2,365,794 | |
| | | | | | | | | | |
| | | Diversified Financials 5.5% | | | | | | |
| | Invesco Ltd. | | | 31,200 | | | | 1,116,648 | |
| | Navient Corp. | | | 54,000 | | | | 672,840 | |
| | Northern Trust Corp. | | | 12,100 | | | | 1,131,592 | |
| | Raymond James Financial Inc. | | | 11,400 | | | | 966,492 | |
| a | | SLM Corp. | | | 238,400 | | | | 2,524,656 | |
| | Synchrony Financial | | | 74,500 | | | | 2,430,190 | |
| | T. Rowe Price Group Inc. | | | 13,700 | | | | 1,272,730 | |
| | | | | | | | | | |
| | | | | | | | | 10,115,148 | |
| | | | | | | | | | |
| | | Energy 6.7% | | | | | | |
| | Baker Hughes a GE Co., A | | | 14,000 | | | | 440,020 | |
| | Cameco Corp. (Canada) | | | 73,000 | | | | 594,220 | |
| a | | Concho Resources Inc. | | | 7,100 | | | | 952,891 | |
| | Devon Energy Corp. | | | 21,700 | | | | 800,730 | |
| a | | Diamondback Energy Inc. | | | 9,300 | | | | 996,588 | |
| | EQT Corp. | | | 16,800 | | | | 1,050,672 | |
| | Helmerich & Payne Inc. | | | 20,700 | | | | 1,124,217 | |
| | Marathon Petroleum Corp. | | | 56,400 | | | | 3,369,336 | |
| | Noble Energy Inc. | | | 82,300 | | | | 2,293,701 | |
| a | | TechnipFMC PLC (United Kingdom) | | | 29,800 | | | | 816,222 | |
| | | | | | | | | | |
| | | | | | | | | 12,438,597 | |
| | | | | | | | | | |
| | | | |
| 50 | | Annual Report | | franklintempleton.com |
FRANKLIN VALUE INVESTORS TRUST
STATEMENT OF INVESTMENTS
Franklin MidCap Value Fund (continued)
| | | | | | | | | | |
| | | | | Shares/
Units | | | Value | |
| | Common Stocks and Other Equity Interests (continued) | | | | | | | | |
| | | Food, Beverage & Tobacco 4.1% | | | | | | |
| | Molson Coors Brewing Co., B | | | 30,100 | | | $ | 2,434,187 | |
| | Pinnacle Foods Inc. | | | 59,900 | | | | 3,259,758 | |
| a | | TreeHouse Foods Inc. | | | 27,300 | | | | 1,812,174 | |
| | | | | | | | | | |
| | | | | | | | | 7,506,119 | |
| | | | | | | | | | |
| | | Health Care Equipment & Services 4.6% | | | | | | |
| | DENTSPLY SIRONA Inc. | | | 13,600 | | | | 830,552 | |
| a | | Envision Healthcare Corp. | | | 71,400 | | | | 3,041,640 | |
| a | | Hologic Inc. | | | 78,600 | | | | 2,975,010 | |
| | Zimmer Biomet Holdings Inc. | | | 13,800 | | | | 1,678,356 | |
| | | | | | | | | | |
| | | | | | | | | 8,525,558 | |
| | | | | | | | | | |
| | | Insurance 8.5% | | | | | | |
| | Arthur J. Gallagher & Co. | | | 17,200 | | | | 1,089,276 | |
| | The Hartford Financial Services Group Inc. | | | 39,700 | | | | 2,185,485 | |
| | Lincoln National Corp. | | | 20,000 | | | | 1,515,600 | |
| | Principal Financial Group Inc. | | | 15,300 | | | | 1,007,505 | |
| | The Progressive Corp. | | | 36,400 | | | | 1,770,860 | |
| | RenaissanceRe Holdings Ltd. | | | 6,500 | | | | 899,340 | |
| | W.R. Berkley Corp. | | | 21,200 | | | | 1,453,896 | |
| | Willis Towers Watson PLC | | | 18,000 | | | | 2,899,440 | |
| | XL Group Ltd. (Bermuda) | | | 70,800 | | | | 2,865,276 | |
| | | | | | | | | | |
| | | | | | | | | 15,686,678 | |
| | | | | | | | | | |
| | | Materials 10.2% | | | | | | |
| | Albemarle Corp. | | | 7,400 | | | | 1,042,586 | |
| a | | Axalta Coating Systems Ltd. | | | 45,200 | | | | 1,502,900 | |
| | Ferroglobe PLC | | | 294,275 | | | | 4,705,457 | |
| a,b | | Ferroglobe Representation and Warranty Insurance Trust | | | 196,900 | | | | — | |
| a | | Freeport-McMoRan Inc. | | | 76,800 | | | | 1,073,664 | |
| a | | Ingevity Corp. | | | 46,309 | | | | 3,298,590 | |
| | Martin Marietta Materials Inc. | | | 6,000 | | | | 1,301,100 | |
| | The Mosaic Co. | | | 31,600 | | | | 705,944 | |
| | Newmont Mining Corp. | | | 44,500 | | | | 1,609,120 | |
| | Tahoe Resources Inc. (Canada) | | | 82,800 | | | | 397,440 | |
| | WestRock Co. | | | 54,956 | | | | 3,370,452 | |
| | | | | | | | | | |
| | | | | | | | | 19,007,253 | |
| | | | | | | | | | |
| | | Media 1.3% | | | | | | |
| | John Wiley & Sons Inc., A | | | 14,500 | | | | 792,425 | |
| | TEGNA Inc. | | | 51,200 | | | | 626,176 | |
| | Viacom Inc., B | | | 43,300 | | | | 1,040,499 | |
| | | | | | | | | | |
| | | | | | | | | 2,459,100 | |
| | | | | | | | | | |
| | | Pharmaceuticals, Biotechnology & Life Sciences 2.9% | | | | | | |
| | Agilent Technologies Inc. | | | 18,200 | | | | 1,238,146 | |
| a | | Jazz Pharmaceuticals PLC | | | 4,900 | | | | 693,497 | |
| | Perrigo Co. PLC | | | 28,800 | | | | 2,332,512 | |
| a | | Waters Corp. | | | 5,800 | | | | 1,137,090 | |
| | | | | | | | | | |
| | | | | | | | | 5,401,245 | |
| | | | | | | | | | |
| | | | | | |
| franklintempleton.com | | Annual Report | | | 51 | |
FRANKLIN VALUE INVESTORS TRUST
STATEMENT OF INVESTMENTS
Franklin MidCap Value Fund (continued)
| | | | | | | | | | |
| | | | | Shares/
Units | | | Value | |
| | | Common Stocks and Other Equity Interests (continued) | | | | | | |
| | Real Estate 11.3% | | | | | | | | |
| | Alexandria Real Estate Equities Inc. | | | 15,200 | | | $ | 1,884,192 | |
| | Boston Properties Inc. | | | 12,300 | | | | 1,490,514 | |
| | DDR Corp. | | | 234,800 | | | | 1,800,916 | |
| | Duke Realty Corp. | | | 53,000 | | | | 1,509,440 | |
| | Healthcare Realty Trust Inc. | | | 43,600 | | | | 1,405,664 | |
| | Host Hotels & Resorts Inc. | | | 35,800 | | | | 700,248 | |
| | Kilroy Realty Corp. | | | 18,200 | | | | 1,296,386 | |
| | Life Storage Inc. | | | 25,500 | | | | 2,060,910 | |
| | Mid-America Apartment Communities Inc. | | | 14,000 | | | | 1,432,900 | |
| | Physicians Realty Trust | | | 50,400 | | | | 875,952 | |
| | Prologis Inc. | | | 15,900 | | | | 1,026,822 | |
| | Realogy Holdings Corp. | | | 87,900 | | | | 2,841,807 | |
| | UDR Inc. | | | 23,200 | | | | 899,928 | |
| | Weingarten Realty Investors | | | 24,600 | | | | 749,070 | |
| | Weyerhaeuser Co. | | | 29,500 | | | | 1,059,345 | |
| | | | | | | | | | |
| | | | | | | | | 21,034,094 | |
| | | | | | | | | | |
| | Retailing 0.6% | | | | | | | | |
| | L Brands Inc. | | | 23,600 | | | | 1,015,744 | |
| | | | | | | | | | |
| | Semiconductors & Semiconductor Equipment 2.5% | | | | | | | | |
| a | | First Solar Inc. | | | 11,900 | | | | 652,358 | |
| | Versum Materials Inc. | | | 65,300 | | | | 2,747,824 | |
| | Xilinx Inc. | | | 17,100 | | | | 1,260,099 | |
| | | | | | | | | | |
| | | | | | | | | 4,660,281 | |
| | | | | | | | | | |
| | Software & Services 6.1% | | | | | | | | |
| a | | Cars.com Inc. | | | 17,066 | | | | 406,512 | |
| | Leidos Holdings Inc. | | | 18,125 | | | | 1,133,175 | |
| a | | PTC Inc. | | | 35,200 | | | | 2,339,040 | |
| a | | Red Hat Inc. | | | 24,800 | | | | 2,996,584 | |
| | Science Applications International Corp. | | | 16,071 | | | | 1,178,647 | |
| | Total System Services Inc. | | | 46,000 | | | | 3,314,300 | |
| | | | | | | | | | |
| | | | | | | | | 11,368,258 | |
| | | | | | | | | | |
| | Technology Hardware & Equipment 0.9% | | | | | | | | |
| a | | Keysight Technologies Inc. | | | 39,150 | | | | 1,748,830 | |
| | | | | | | | | | |
| | Transportation 0.7% | | | | | | | | |
| a | | JetBlue Airways Corp. | | | 68,400 | | | | 1,309,860 | |
| | | | | | | | | | |
| | Utilities 10.3% | | | | | | | | |
| | American Water Works Co. Inc. | | | 20,800 | | | | 1,825,408 | |
| | Atmos Energy Corp. | | | 15,600 | | | | 1,360,944 | |
| | CenterPoint Energy Inc. | | | 36,600 | | | | 1,082,628 | |
| | CMS Energy Corp. | | | 22,200 | | | | 1,073,814 | |
| | DTE Energy Co. | | | 11,800 | | | | 1,303,428 | |
| | Edison International | | | 16,300 | | | | 1,303,185 | |
| | Eversource Energy | | | 21,300 | | | | 1,334,232 | |
| | FirstEnergy Corp. | | | 37,200 | | | | 1,225,740 | |
| | PNM Resources Inc. | | | 34,900 | | | | 1,514,660 | |
| | Sempra Energy | | | 14,800 | | | | 1,739,000 | |
| | UGI Corp. | | | 25,000 | | | | 1,196,500 | |
| | WEC Energy Group Inc. | | | 31,500 | | | | 2,122,785 | |
| | | | |
| 52 | | Annual Report | | franklintempleton.com |
FRANKLIN VALUE INVESTORS TRUST
STATEMENT OF INVESTMENTS
Franklin MidCap Value Fund (continued)
| | | | | | | | | | |
| | | | | Shares/
Units | | | Value | |
| | | Common Stocks and Other Equity Interests (continued) | | | | | | |
| | Utilities (continued) | | | | | | | | |
| | Xcel Energy Inc. | | | 42,600 | | | $ | 2,109,552 | |
| | | | | | | | | | |
| | | | | | | | | 19,191,876 | |
| | | | | | | | | | |
| | Total Common Stocks and Other Equity Interests (Cost $147,242,953) | | | | | | | 181,296,788 | |
| | | | | | | | | | |
| | | |
| | Management Investment Companies (Cost $6,785) 0.0%† | | | | | | | | |
| | Diversified Financials 0.0%† | | | | | | | | |
| | iShares Russell Mid-Cap Value ETF | | | 100 | | | | 8,564 | |
| | | | | | | | | | |
| | Total Investments before Short Term Investments (Cost $147,249,738) | | | | | | | 181,305,352 | |
| | | | | | | | | | |
| | | |
| | | Short Term Investments (Cost $4,800,858) 2.6% | | | | | | |
| | Money Market Funds 2.6% | | | | | | | | |
| c,d | | Institutional Fiduciary Trust Money Market Portfolio, 0.69% | | | 4,800,858 | | | | 4,800,858 | |
| | | | | | | | | | |
| | Total Investments (Cost $152,050,596) 100.3% | | | | | | | 186,106,210 | |
| | Other Assets, less Liabilities (0.3)% | | | | | | | (575,884 | ) |
| | | | | | | | | | |
| | Net Assets 100.0% | | | | | | $ | 185,530,326 | |
| | | | | | | | | | |
See Abbreviations on page 85.
†Rounds to less than 0.1% of net assets.
aNon-income producing.
bFair valued using significant unobservable inputs. See Note 10 regarding fair value measurements.
cSee Note 3(f) regarding investments in affiliated management investment companies.
dThe rate shown is the annualized seven-day yield at period end.
| | | | | | |
| franklintempleton.com | | The accompanying notes are an integral part of these financial statements. | Annual Report | | | 53 | |
FRANKLIN VALUE INVESTORS TRUST
Financial Highlights
Franklin Small Cap Value Fund
| | | | | | | | | | | | | | | | | | | | |
| | | Year Ended October 31, | |
| | | 2017 | | | 2016 | | | 2015 | | | 2014 | | | 2013 | |
| Class A | | | | | | | | | | | | | | | | | | | | |
| | | | | |
Per share operating performance
(for a share outstanding throughout the year) | | | | | | | | | | | | | | | | | | | | |
| | | | | |
Net asset value, beginning of year | | | $51.45 | | | | $51.72 | | | | $58.96 | | | | $59.76 | | | | $45.12 | |
| | | | |
| | | | | |
| Income from investment operationsa: | | | | | | | | | | | | | | | | | | | | |
| | | | | |
Net investment incomeb | | | 0.31 | c | | | 0.20 | | | | 0.30 | d | | | 0.16 | e | | | 0.30 | f |
| | | | | |
Net realized and unrealized gains (losses) | | | 10.04 | | | | 4.74 | | | | (2.33 | ) | | | 2.03 | | | | 16.30 | |
| | | | |
| | | | | |
Total from investment operations | | | 10.35 | | | | 4.94 | | | | (2.03 | ) | | | 2.19 | | | | 16.60 | |
| | | | |
| | | | | |
| Less distributions from: | | | | | | | | | | | | | | | | | | | | |
| | | | | |
Net investment income | | | (0.12 | ) | | | (0.29 | ) | | | (0.12 | ) | | | (0.25 | ) | | | (0.49 | ) |
| | | | | |
Net realized gains | | | (2.61 | ) | | | (4.92 | ) | | | (5.09 | ) | | | (2.74 | ) | | | (1.47 | ) |
| | | | |
| | | | | |
Total distributions | | | (2.73 | ) | | | (5.21 | ) | | | (5.21 | ) | | | (2.99 | ) | | | (1.96 | ) |
| | | | |
| | | | | |
Net asset value, end of year | | | $59.07 | | | | $51.45 | | | | $51.72 | | | | $58.96 | | | | $59.76 | |
| | | | |
| | | | | |
Total returng | | | 20.53% | | | | 11.15% | | | | (3.31)% | | | | 3.76% | | | | 38.15% | |
| | | | | |
| Ratios to average net assets | | | | | | | | | | | | | | | | | | | | |
| | | | | |
Expenses before waiver and payments by affiliates | | | 1.05% | | | | 1.11% | | | | 1.16% | | | | 1.13% | | | | 1.19% | |
| | | | | |
Expenses net of waiver and payments by affiliates | | | 1.03% | h | | | 1.09% | h | | | 1.15% | | | | 1.13% | h,i | | | 1.19% | |
| | | | | |
Net investment income | | | 0.58% | c | | | 0.40% | | | | 0.56% | d | | | 0.27% | e | | | 0.57% | f |
| | | | | |
| Supplemental data | | | | | | | | | | | | | | | | | | | | |
| | | | | |
Net assets, end of year (000’s) | | | $1,364,629 | | | | $1,125,268 | | | | $1,062,353 | | | | $1,294,724 | | | | $1,224,592 | |
| | | | | |
Portfolio turnover rate | | | 33.38% | | | | 41.89% | | | | 25.88% | | | | 21.30% | | | | 13.04% | |
aThe amount shown for a share outstanding throughout the period may not correlate with the Statement of Operations for the period due to the timing of sales and repurchases of the Fund’s shares in relation to income earned and/or fluctuating fair value of the investments of the Fund.
bBased on average daily shares outstanding.
cNet investment income per share includes approximately $0.16 per share related to income received in the form of special dividends in connection with certain Fund holdings. Excluding this amount, the ratio of net investment income to average net assets would have been 0.29%.
dNet investment income per share includes approximately $0.11 per share related to income received in the form of special dividends in connection with certain Fund holdings. Excluding this amount, the ratio of net investment income to average net assets would have been 0.36%.
eNet investment income per share includes approximately $0.04 per share related to income received in the form of special dividends in connection with certain Fund holdings. Excluding this amount, the ratio of net investment income to average net assets would have been 0.21%.
fNet investment income per share includes approximately $0.10 per share related to income received in the form of special dividends in connection with certain Fund holdings. Excluding this amount, the ratio of net investment income to average net assets would have been 0.38%.
gTotal return does not reflect sales commissions or contingent deferred sales charges, if applicable.
hBenefit of expense reduction rounds to less than 0.01%.
iBenefit of waiver and payments by affiliates rounds to less than 0.01%.
| | | | |
| 54 | | Annual Report | The accompanying notes are an integral part of these financial statements. | | franklintempleton.com |
FRANKLIN VALUE INVESTORS TRUST
FINANCIAL HIGHLIGHTS
Franklin Small Cap Value Fund (continued)
| | | | | | | | | | | | | | | | | | | | |
| | | Year Ended October 31, | |
| | | 2017 | | | 2016 | | | 2015 | | | 2014 | | | 2013 | |
| Class C | | | | | | | | | | | | | | | | | | | | |
| | | | | |
Per share operating performance
(for a share outstanding throughout the year) | | | | | | | | | | | | | | | | | | | | |
| | | | | |
Net asset value, beginning of year | | | $46.42 | | | | $47.22 | | | | $54.53 | | | | $55.62 | | | | $42.12 | |
| | | | |
| | | | | |
| Income from investment operationsa: | | | | | | | | | | | | | | | | | | | | |
| | | | | |
Net investment income (loss)b | | | (0.09 | )c | | | (0.14 | ) | | | (0.07 | )d | | | (0.24 | )e | | | (0.05 | )f |
| | | | | |
Net realized and unrealized gains (losses) | | | 9.03 | | | | 4.26 | | | | (2.15 | ) | | | 1.89 | | | | 15.21 | |
| | | | |
| | | | | |
Total from investment operations | | | 8.94 | | | | 4.12 | | | | (2.22 | ) | | | 1.65 | | | | 15.16 | |
| | | | |
| | | | | |
| Less distributions from: | | | | | | | | | | | | | | | | | | | | |
| | | | | |
Net investment income | | | — | | | | — | | | | — | | | | — | | | | (0.19 | ) |
| | | | | |
Net realized gains | | | (2.61 | ) | | | (4.92 | ) | | | (5.09 | ) | | | (2.74 | ) | | | (1.47 | ) |
| | | | |
| | | | | |
Total distributions | | | (2.61 | ) | | | (4.92 | ) | | | (5.09 | ) | | | (2.74 | ) | | | (1.66 | ) |
| | | | |
| | | | | |
Net asset value, end of year | | | $52.75 | | | | $46.42 | | | | $47.22 | | | | $54.53 | | | | $55.62 | |
| | | | |
| | | | | |
Total returng | | | 19.62% | | | | 10.35% | | | | (4.01)% | | | | 3.03% | | | | 37.23% | |
| | | | | |
| Ratios to average net assets | | | | | | | | | | | | | | | | | | | | |
| | | | | |
Expenses before waiver and payments by affiliates | | | 1.80% | | | | 1.86% | | | | 1.87% | | | | 1.83% | | | | 1.89% | |
| | | | | |
Expenses net of waiver and payments by affiliates | | | 1.78% | h | | | 1.84% | h | | | 1.86% | | | | 1.83% | h,i | | | 1.89% | |
| | | | | |
Net investment income (loss) | | | (0.17)% | c | | | (0.35)% | | | | (0.15)% | d | | | (0.43)% | e | | | (0.13)% | f |
| | | | | |
| Supplemental data | | | | | | | | | | | | | | | | | | | | |
| | | | | |
Net assets, end of year (000’s) | | | $225,228 | | | | $219,150 | | | | $229,119 | | | | $266,845 | | | | $247,742 | |
| | | | | |
Portfolio turnover rate | | | 33.38% | | | | 41.89% | | | | 25.88% | | | | 21.30% | | | | 13.04% | |
aThe amount shown for a share outstanding throughout the period may not correlate with the Statement of Operations for the period due to the timing of sales and repurchases of the Fund’s shares in relation to income earned and/or fluctuating fair value of the investments of the Fund.
bBased on average daily shares outstanding.
cNet investment income per share includes approximately $0.16 per share related to income received in the form of special dividends in connection with certain Fund holdings. Excluding this amount, the ratio of net investment income to average net assets would have been (0.46)%.
dNet investment income per share includes approximately $0.11 per share related to income received in the form of special dividends in connection with certain Fund holdings. Excluding this amount, the ratio of net investment income to average net assets would have been (0.35)%.
eNet investment income per share includes approximately $0.04 per share related to income received in the form of special dividends in connection with certain Fund holdings. Excluding this amount, the ratio of net investment income to average net assets would have been (0.49)%.
fNet investment income per share includes approximately $0.10 per share related to income received in the form of special dividends in connection with certain Fund holdings. Excluding this amount, the ratio of net investment income to average net assets would have been (0.32)%.
gTotal return does not reflect sales commissions or contingent deferred sales charges, if applicable.
hBenefit of expense reduction rounds to less than 0.01%.
iBenefit of waiver and payments by affiliates rounds to less than 0.01%.
| | | | | | |
| franklintempleton.com | | The accompanying notes are an integral part of these financial statements. | Annual Report | | | 55 | |
FRANKLIN VALUE INVESTORS TRUST
FINANCIAL HIGHLIGHTS
Franklin Small Cap Value Fund (continued)
| | | | | | | | | | | | | | | | | | | | |
| | | Year Ended October 31, | |
| | | 2017 | | | 2016 | | | 2015 | | | 2014 | | | 2013 | |
| Class R | | | | | | | | | | | | | | | | | | | | |
| | | | | |
Per share operating performance
(for a share outstanding throughout the year) | | | | | | | | | | | | | | | | | | | | |
| | | | | |
Net asset value, beginning of year | | | $50.87 | | | | $51.18 | | | | $58.40 | | | | $59.21 | | | | $44.71 | |
| | | | |
| | | | | |
| Income from investment operationsa: | | | | | | | | | | | | | | | | | | | | |
| | | | | |
Net investment incomeb | | | 0.18 | c | | | 0.08 | | | | 0.19 | d | | | 0.04 | e | | | 0.21 | f |
| | | | | |
Net realized and unrealized gains (losses) | | | 9.93 | | | | 4.69 | | | | (2.32 | ) | | | 2.02 | | | | 16.15 | |
| | | | |
| | | | | |
Total from investment operations | | | 10.11 | | | | 4.77 | | | | (2.13 | ) | | | 2.06 | | | | 16.36 | |
| | | | |
| | | | | |
| Less distributions from: | | | | | | | | | | | | | | | | | | | | |
| | | | | |
Net investment income | | | — | | | | (0.16 | ) | | | (— | )g | | | (0.13 | ) | | | (0.39 | ) |
| | | | | |
Net realized gains | | | (2.61 | ) | | | (4.92 | ) | | | (5.09 | ) | | | (2.74 | ) | | | (1.47 | ) |
| | | | |
| | | | | |
Total distributions | | | (2.61 | ) | | | (5.08 | ) | | | (5.09 | ) | | | (2.87 | ) | | | (1.86 | ) |
| | | | |
| | | | | |
Net asset value, end of year | | | $58.37 | | | | $50.87 | | | | $51.18 | | | | $58.40 | | | | $59.21 | |
| | | | |
| | | | | |
Total return | | | 20.23% | | | | 10.90% | | | | (3.53)% | | | | 3.55% | | | | 37.91% | |
| | | | | |
| Ratios to average net assets | | | | | | | | | | | | | | | | | | | | |
| | | | | |
Expenses before waiver and payments by affiliates | | | 1.30% | | | | 1.36% | | | | 1.37% | | | | 1.33% | | | | 1.39% | |
| | | | | |
Expenses net of waiver and payments by affiliates | | | 1.28% | h | | | 1.34% | h | | | 1.36% | | | | 1.33% | h,i | | | 1.39% | |
| | | | | |
Net investment income | | | 0.33% | c | | | 0.15% | | | | 0.35% | d | | | 0.07% | e | | | 0.37% | f |
| | | | | |
| Supplemental data | | | | | | | | | | | | | | | | | | | | |
| | | | | |
Net assets, end of year (000’s) | | | $209,627 | | | | $212,194 | | | | $221,939 | | | | $280,908 | | | | $272,697 | |
| | | | | |
Portfolio turnover rate | | | 33.38% | | | | 41.89% | | | | 25.88% | | | | 21.30% | | | | 13.04% | |
aThe amount shown for a share outstanding throughout the period may not correlate with the Statement of Operations for the period due to the timing of sales and repurchases of the Fund’s shares in relation to income earned and/or fluctuating fair value of the investments of the Fund.
bBased on average daily shares outstanding.
cNet investment income per share includes approximately $0.16 per share related to income received in the form of special dividends in connection with certain Fund holdings. Excluding this amount, the ratio of net investment income to average net assets would have been 0.04%.
dNet investment income per share includes approximately $0.11 per share related to income received in the form of special dividends in connection with certain Fund holdings. Excluding this amount, the ratio of net investment income to average net assets would have been 0.15%.
eNet investment income per share includes approximately $0.04 per share related to income received in the form of special dividends in connection with certain Fund holdings. Excluding this amount, the ratio of net investment income to average net assets would have been 0.01%.
fNet investment income per share includes approximately $0.10 per share related to income received in the form of special dividends in connection with certain Fund holdings. Excluding this amount, the ratio of net investment income to average net assets would have been 0.18%.
gAmount rounds to less than $0.01 per share.
hBenefit of expense reduction rounds to less than 0.01%.
iBenefit of waiver and payments by affiliates rounds to less than 0.01%.
| | | | |
| 56 | | Annual Report | The accompanying notes are an integral part of these financial statements. | | franklintempleton.com |
FRANKLIN VALUE INVESTORS TRUST
FINANCIAL HIGHLIGHTS
Franklin Small Cap Value Fund (continued)
| | | | | | | | | | | | | | | | | | | | |
| | | Year Ended October 31, | |
| | | 2017 | | | 2016 | | | 2015 | | | 2014 | | | 2013a | |
| Class R6 | | | | | | | | | | | | | | | | | | | | |
| | | | | |
Per share operating performance
(for a share outstanding throughout the year) | | | | | | | | | | | | | | | | | | | | |
| | | | | |
Net asset value, beginning of year | | | $53.60 | | | | $53.75 | | | | $61.09 | | | | $61.78 | | | | $50.83 | |
| | | | |
| | | | | |
| Income from investment operationsb: | | | | | | | | | | | | | | | | | | | | |
| | | | | |
Net investment incomec | | | 0.58 | d | | | 0.43 | | | | 0.62 | e | | | 0.42 | f | | | 0.19 | |
| | | | | |
Net realized and unrealized gains (losses) | | | 10.49 | | | | 4.93 | | | | (2.43 | ) | | | 2.16 | | | | 10.76 | |
| | | | |
| | | | | |
Total from investment operations | | | 11.07 | | | | 5.36 | | | | (1.81 | ) | | | 2.58 | | | | 10.95 | |
| | | | |
| | | | | |
| Less distributions from: | | | | | | | | | | | | | | | | | | | | |
| | | | | |
Net investment income | | | (0.35 | ) | | | (0.59 | ) | | | (0.44 | ) | | | (0.53 | ) | | | — | |
| | | | | |
Net realized gains | | | (2.61 | ) | | | (4.92 | ) | | | (5.09 | ) | | | (2.74 | ) | | | — | |
| | | | |
| | | | | |
Total distributions | | | (2.96 | ) | | | (5.51 | ) | | | (5.53 | ) | | | (3.27 | ) | | | — | |
| | | | |
| | | | | |
Net asset value, end of year. | | | $61.71 | | | | $53.60 | | | | $53.75 | | | | $61.09 | | | | $61.78 | |
| | | | |
| | | | | |
Total return | | | 21.07% | | | | 11.69% | | | | (2.80)% | | | | 4.31% | | | | 21.54% | |
| | | | | |
| Ratios to average net assetsg | | | | | | | | | | | | | | | | | | | | |
| | | | | |
Expenses before waiver and payments by affiliates | | | 0.60% | | | | 0.64% | | | | 0.62% | | | | 0.60% | | | | 2.09% | |
| | | | | |
Expenses net of waiver and payments by affiliates | | | 0.58% | h | | | 0.62% | h | | | 0.61% | | | | 0.60% | h,i | | | 0.64% | |
| | | | | |
Net investment income | | | 1.03% | d | | | 0.87% | | | | 1.10% | e | | | 0.80% | f | | | 0.68% | |
| | | | | |
| Supplemental data | | | | | | | | | | | | | | | | | | | | |
| | | | | |
Net assets, end of year (000’s) | | | $221,246 | | | | $100,101 | | | | $59,339 | | | | $34,278 | | | | $17 | |
| | | | | |
Portfolio turnover rate | | | 33.38% | | | | 41.89% | | | | 25.88% | | | | 21.30% | | | | 13.04% | |
aFor the period May 1, 2013 (effective date) to October 31, 2013.
bThe amount shown for a share outstanding throughout the period may not correlate with the Statement of Operations for the period due to the timing of sales and repurchases of the Fund’s shares in relation to income earned and/or fluctuating fair value of the investments of the Fund.
cBased on average daily shares outstanding.
dNet investment income per share includes approximately $0.16 per share related to income received in the form of special dividends in connection with certain Fund holdings. Excluding this amount, the ratio of net investment income to average net assets would have been 0.74%.
eNet investment income per share includes approximately $0.11 per share related to income received in the form of special dividends in connection with certain Fund holdings. Excluding this amount, the ratio of net investment income to average net assets would have been 0.90%.
fNet investment income per share includes approximately $0.04 per share related to income received in the form of special dividends in connection with certain Fund holdings. Excluding this amount, the ratio of net investment income to average net assets would have been 0.74%.
gRatios are annualized for periods less than one year.
hBenefit of expense reduction rounds to less than 0.01%.
iBenefit of waiver and payments by affiliates rounds to less than 0.01%.
| | | | | | |
| franklintempleton.com | | The accompanying notes are an integral part of these financial statements. | Annual Report | | | 57 | |
FRANKLIN VALUE INVESTORS TRUST
FINANCIAL HIGHLIGHTS
Franklin Small Cap Value Fund (continued)
| | | | | | | | | | | | | | | | | | | | |
| | | Year Ended October 31, | |
| | | 2017 | | | 2016 | | | 2015 | | | 2014 | | | 2013 | |
| Advisor Class | | | | | | | | | | | | | | | | | | | | |
| | | | | |
Per share operating performance
(for a share outstanding throughout the year) | | | | | | | | | | | | | | | | | | | | |
| | | | | |
Net asset value, beginning of year | | | $53.58 | | | | $53.67 | | | | $61.01 | | | | $61.72 | | | | $46.54 | |
| | | | |
| | | | | |
| Income from investment operationsa: | | | | | | | | | | | | | | | | | | | | |
| | | | | |
Net investment incomeb | | | 0.48 | c | | | 0.32 | | | | 0.47 | d | | | 0.34 | e | | | 0.46 | f |
| | | | | |
Net realized and unrealized gains (losses) | | | 10.48 | | | | 4.94 | | | | (2.41 | ) | | | 2.10 | | | | 16.82 | |
| | | | |
| | | | | |
Total from investment operations | | | 10.96 | | | | 5.26 | | | | (1.94 | ) | | | 2.44 | | | | 17.28 | |
| | | | |
| | | | | |
| Less distributions from: | | | | | | | | | | | | | | | | | | | | |
| | | | | |
Net investment income | | | (0.27 | ) | | | (0.43 | ) | | | (0.31 | ) | | | (0.41 | ) | | | (0.63 | ) |
| | | | | |
Net realized gains | | | (2.61 | ) | | | (4.92 | ) | | | (5.09 | ) | | | (2.74 | ) | | | (1.47 | ) |
| | | | |
| | | | | |
Total distributions | | | (2.88 | ) | | | (5.35 | ) | | | (5.40 | ) | | | (3.15 | ) | | | (2.10 | ) |
| | | | |
| | | | | |
Net asset value, end of year | | | $61.66 | | | | $53.58 | | | | $53.67 | | | | $61.01 | | | | $61.72 | |
| | | | |
| | | | | |
Total return | | | 20.84% | | | | 11.43% | | | | (3.03)% | | | | 4.07% | | | | 38.56% | |
| | | | | |
| Ratios to average net assets | | | | | | | | | | | | | | | | | | | | |
| | | | | |
Expenses before waiver and payments by affiliates | | | 0.80% | | | | 0.86% | | | | 0.87% | | | | 0.83% | | | | 0.89% | |
| | | | | |
Expenses net of waiver and payments by affiliates | | | 0.78% | g | | | 0.84% | g | | | 0.86% | | | | 0.83% | g,h | | | 0.89% | |
| | | | | |
Net investment income | | | 0.83% | c | | | 0.65% | | | | 0.85% | d | | | 0.57% | e | | | 0.87% | f |
| | | | | |
| Supplemental data | | | | | | | | | | | | | | | | | | | | |
| | | | | |
Net assets, end of year (000’s) | | | $583,364 | | | | $893,324 | | | | $635,499 | | | | $816,430 | | | | $653,660 | |
| | | | | |
Portfolio turnover rate | | | 33.38% | | | | 41.89% | | | | 25.88% | | | | 21.30% | | | | 13.04% | |
aThe amount shown for a share outstanding throughout the period may not correlate with the Statement of Operations for the period due to the timing of sales and repurchases of the Fund’s shares in relation to income earned and/or fluctuating fair value of the investments of the Fund.
bBased on average daily shares outstanding.
cNet investment income per share includes approximately $0.16 per share related to income received in the form of special dividends in connection with certain Fund holdings. Excluding this amount, the ratio of net investment income to average net assets would have been 0.54%.
dNet investment income per share includes approximately $0.11 per share related to income received in the form of special dividends in connection with certain Fund holdings. Excluding this amount, the ratio of net investment income to average net assets would have been 0.65%.
eNet investment income per share includes approximately $0.04 per share related to income received in the form of special dividends in connection with certain Fund holdings. Excluding this amount, the ratio of net investment income to average net assets would have been 0.51%.
fNet investment income per share includes approximately $0.10 per share related to income received in the form of special dividends in connection with certain Fund holdings. Excluding this amount, the ratio of net investment income to average net assets would have been 0.68%.
gBenefit of expense reduction rounds to less than 0.01%.
hBenefit of waiver and payments by affiliates rounds to less than 0.01%.
| | | | |
| 58 | | Annual Report | The accompanying notes are an integral part of these financial statements. | | franklintempleton.com |
FRANKLIN VALUE INVESTORS TRUST
Statement of Investments, October 31, 2017
Franklin Small Cap Value Fund
| | | | | | | | | | |
| | | | | Shares | | | Value | |
| | | | | | | | | | |
| | | Common Stocks 93.0% | | | | | | |
| | | Aerospace & Defense 3.5% | | | | | | |
| | AAR Corp. | | | 1,591,051 | | | $ | 61,875,973 | |
| | Cubic Corp. | | | 11,269 | | | | 614,724 | |
| a | | Esterline Technologies Corp. | | | 298,908 | | | | 28,351,424 | |
| | | | | | | | | | |
| | | | | | | | | 90,842,121 | |
| | | | | | | | | | |
| | | Automobiles & Components 3.0% | | | | | | |
| | Gentex Corp. | | | 74,000 | | | | 1,436,340 | |
| | LCI Industries | | | 272,700 | | | | 33,760,260 | |
| | Thor Industries Inc. | | | 253,000 | | | | 34,463,660 | |
| | Winnebago Industries Inc. | | | 175,200 | | | | 8,611,080 | |
| | | | | | | | | | |
| | | | | | | | | 78,271,340 | |
| | | | | | | | | | |
| | | Banks 15.9% | | | | | | |
| | Access National Corp. | | | 490,720 | | | | 14,279,952 | |
| | Bryn Mawr Bank Corp. | | | 428,196 | | | | 18,776,395 | |
| | Chemical Financial Corp. | | | 1,265,353 | | | | 66,671,450 | |
| | Columbia Banking System Inc. | | | 1,376,490 | | | | 59,891,080 | |
| | First Horizon National Corp. | | | 3,558,444 | | | | 66,791,994 | |
| | First of Long Island Corp. | | | 927,406 | | | | 29,259,659 | |
| | German American Bancorp Inc. | | | 223,400 | | | | 8,037,932 | |
| | Glacier Bancorp Inc. | | | 787,400 | | | | 29,889,704 | |
| | Lakeland Financial Corp. | | | 980,951 | | | | 47,360,314 | |
| | Peoples Bancorp Inc. | | | 456,226 | | | | 15,110,205 | |
| | Pinnacle Financial Partners Inc. | | | 522,298 | | | | 34,576,128 | |
| | TrustCo Bank Corp. NY | | | 1,103,300 | | | | 10,122,777 | |
| | Washington Trust Bancorp Inc. | | | 235,041 | | | | 13,044,775 | |
| | | | | | | | | | |
| | | | | | | | | 413,812,365 | |
| | | | | | | | | | |
| | | Building Products 6.0% | | | | | | |
| a | | Gibraltar Industries Inc. | | | 805,257 | | | | 26,774,795 | |
| | Griffon Corp. | | | 66,880 | | | | 1,508,144 | |
| | Insteel Industries Inc. | | | 568,253 | | | | 14,518,864 | |
| | Simpson Manufacturing Co. Inc. | | | 1,283,961 | | | | 71,567,986 | |
| | Universal Forest Products Inc. | | | 365,093 | | | | 41,219,000 | |
| | | | | | | | | | |
| | | | | | | | | 155,588,789 | |
| | | | | | | | | | |
| | | Commercial & Professional Services 1.5% | | | | | | |
| | McGrath RentCorp | | | 869,831 | | | | 38,881,446 | |
| | | | | | | | | | |
| | | Construction & Engineering 1.9% | | | | | | |
| | Argan Inc. | | | 35,833 | | | | 2,463,519 | |
| | EMCOR Group Inc. | | | 196,184 | | | | 15,794,774 | |
| | Granite Construction Inc. | | | 486,147 | | | | 30,962,702 | |
| | | | | | | | | | |
| | | | | | | | | 49,220,995 | |
| | | | | | | | | | |
| | | Consumer Durables & Apparel 3.1% | | | | | | |
| | BRP Inc. (Canada) | | | 1,314,467 | | | | 44,197,813 | |
| | Hooker Furniture Corp. | | | 53,436 | | | | 2,532,866 | |
| | La-Z-Boy Inc. | | | 101,101 | | | | 2,724,672 | |
| a | | M/I Homes Inc. | | | 931,628 | | | | 31,116,375 | |
| | | | | | | | | | |
| | | | | | | | | 80,571,726 | |
| | | | | | | | | | |
| | | Consumer Services 0.7% | | | | | | |
| | Brinker International Inc. | | | 559,877 | | | | 17,199,421 | |
| | | | | | | | | | |
| | | | |
| franklintempleton.com | | Annual Report | | 59 |
FRANKLIN VALUE INVESTORS TRUST
STATEMENT OF INVESTMENTS
Franklin Small Cap Value Fund (continued)
| | | | | | | | | | |
| | | | | Shares | | | Value | |
| | | Common Stocks (continued) | | | | | | |
| | | Electrical Equipment 1.1% | | | | | | |
| | Encore Wire Corp. | | | 46,800 | | | $ | 2,113,020 | |
| | EnerSys | | | 177,813 | | | | 12,334,888 | |
| | Regal Beloit Corp. | | | 165,100 | | | | 13,397,865 | |
| | | | | | | | | | |
| | | | | | | | | 27,845,773 | |
| | | | | | | | | | |
| | | Energy 7.7% | | | | | | |
| a | | Energen Corp. | | | 764,200 | | | | 39,509,140 | |
| a | | Helix Energy Solutions Group Inc. | | | 62,850 | | | | 428,637 | |
| a | | Hunting PLC (United Kingdom) | | | 6,065,124 | | | | 42,179,514 | |
| a | | Natural Gas Services Group Inc. | | | 531,000 | | | | 14,761,800 | |
| a | | Oil States International Inc. | | | 1,530,700 | | | | 35,282,635 | |
| a | | PHI Inc. | | | 40,000 | | | | 456,800 | |
| a | | PHI Inc., non-voting | | | 71,200 | | | | 832,328 | |
| a | | Rowan Cos. PLC | | | 3,112,958 | | | | 44,608,688 | |
| a | | Unit Corp. | | | 1,201,002 | | | | 22,482,757 | |
| | | | | | | | | | |
| | | | | | | | | 200,542,299 | |
| | | | | | | | | | |
| | | Food, Beverage & Tobacco 4.0% | | | | | | |
| | Dairy Crest Group PLC (United Kingdom) | | | 3,654,300 | | | | 29,491,419 | |
| | Graincorp Ltd. (Australia) | | | 717,046 | | | | 4,666,249 | |
| a,b | | Landec Corp. | | | 1,423,100 | | | | 18,856,075 | |
| | Maple Leaf Foods Inc. (Canada) | | | 2,002,652 | | | | 51,962,883 | |
| | | | | | | | | | |
| | | | | | | | | 104,976,626 | |
| | | | | | | | | | |
| | | Health Care Equipment & Services 2.3% | | | | | | |
| | Hill-Rom Holdings Inc. | | | 363,800 | | | | 29,362,298 | |
| | STERIS PLC | | | 337,293 | | | | 31,479,556 | |
| | | | | | | | | | |
| | | | | | | | | 60,841,854 | |
| | | | | | | | | | |
| | | Industrial Conglomerates 0.5% | | | | | | |
| | Carlisle Cos. Inc. | | | 118,793 | | | | 13,047,035 | |
| | | | | | | | | | |
| | | Insurance 6.3% | | | | | | |
| | Aspen Insurance Holdings Ltd. | | | 398,163 | | | | 17,081,193 | |
| | The Hanover Insurance Group Inc. | | | 439,300 | | | | 43,218,334 | |
| | Horace Mann Educators Corp. | | | 799,466 | | | | 35,016,611 | |
| | Old Republic International Corp. | | | 2,220,200 | | | | 45,047,858 | |
| | Validus Holdings Ltd. | | | 478,155 | | | | 24,902,312 | |
| | | | | | | | | | |
| | | | | | | | | 165,266,308 | |
| | | | | | | | | | |
| | | Machinery 8.0% | | | | | | |
| | Astec Industries Inc. | | | 250,578 | | | | 13,017,527 | |
| | Federal Signal Corp. | | | 856,900 | | | | 18,294,815 | |
| | Hillenbrand Inc. | | | 33,132 | | | | 1,310,370 | |
| | Kennametal Inc. | | | 1,036,014 | | | | 45,222,011 | |
| a | | The Manitowoc Co. Inc. | | | 3,033,823 | | | | 28,881,994 | |
| | Miller Industries Inc. | | | 55,400 | | | | 1,565,050 | |
| | Mueller Industries Inc. | | | 877,425 | | | | 30,490,519 | |
| | Mueller Water Products Inc., A | | | 3,962,252 | | | | 47,309,289 | |
| | Spartan Motors Inc. | | | 5,000 | | | | 80,750 | |
| | Titan International Inc. | | | 2,370,382 | | | | 23,087,521 | |
| | | | | | | | | | |
| | | | | | | | | 209,259,846 | |
| | | | | | | | | | |
| | | | |
| 60 | | Annual Report | | franklintempleton.com |
FRANKLIN VALUE INVESTORS TRUST
STATEMENT OF INVESTMENTS
Franklin Small Cap Value Fund (continued)
| | | | | | | | | | |
| | | | | Shares | | | Value | |
| | Common Stocks (continued) | | | | | | | | |
| | Materials 4.9% | | | | | | | | |
| | AptarGroup Inc. | | | 21,039 | | | $ | 1,831,866 | |
a | | Detour Gold Corp. (Canada) | | | 1,672,800 | | | | 17,836,455 | |
a | | Ingevity Corp. | | | 371,796 | | | | 26,483,029 | |
| | Minerals Technologies Inc. | | | 240,227 | | | | 17,272,321 | |
| | OceanaGold Corp. (Australia) | | | 6,881,000 | | | | 18,462,456 | |
| | Reliance Steel & Aluminum Co. | | | 269,037 | | | | 20,672,803 | |
| | A Schulman Inc. | | | 341,298 | | | | 13,413,011 | |
| | Sensient Technologies Corp. | | | 154,616 | | | | 11,758,547 | |
| | | | | | | | | | |
| | | | | | | | | 127,730,488 | |
| | | | | | | | | | |
| | Pharmaceuticals, Biotechnology & Life Sciences 1.4% | | | | | | | | |
| | Gerresheimer AG (Germany) | | | 465,902 | | | | 37,040,611 | |
| | | | | | | | | | |
| | Real Estate 4.7% | | | | | | | | |
| | Brandywine Realty Trust | | | 2,340,373 | | | | 40,933,124 | |
| | Highwoods Properties Inc. | | | 264,900 | | | | 13,523,145 | |
| | LTC Properties Inc. | | | 896,830 | | | | 41,711,563 | |
| | Sunstone Hotel Investors Inc. | | | 1,642,836 | | | | 26,811,084 | |
| | | | | | | | | | |
| | | | | | | | | 122,978,916 | |
| | | | | | | | | | |
| | Retailing 0.5% | | | | | | | | |
| | Caleres Inc. | | | 454,114 | | | | 12,410,936 | |
| | | | | | | | | | |
| | Semiconductors & Semiconductor Equipment 5.4% | | | | | | | | |
| | Cohu Inc. | | | 998,700 | | | | 25,766,460 | |
a | | Kulicke and Soffa Industries Inc. (Singapore) | | | 1,314,677 | | | | 29,777,434 | |
| | MKS Instruments Inc. | | | 268,985 | | | | 29,225,220 | |
a | | Photronics Inc. | | | 2,071,200 | | | | 20,090,640 | |
| | Versum Materials Inc. | | | 837,294 | | | | 35,233,332 | |
| | | | | | | | | | |
| | | | | | | | | 140,093,086 | |
| | | | | | | | | | |
| | Technology Hardware & Equipment 3.5% | | | | | | | | |
a | | NetScout Systems Inc. | | | 632,769 | | | | 17,970,640 | |
a | | Plexus Corp. | | | 424,203 | | | | 26,058,790 | |
a | | Zebra Technologies Corp., A | | | 401,900 | | | | 46,616,381 | |
| | | | | | | | | | |
| | | | | | | | | 90,645,811 | |
| | | | | | | | | | |
| | Telecommunication Services 0.1% | | | | | | | | |
a | | ORBCOMM Inc. | | | 119,750 | | | | 1,354,373 | |
| | | | | | | | | | |
| | Transportation 3.1% | | | | | | | | |
a | | SAIA Inc. | | | 486,125 | | | | 31,500,900 | |
a | | Spirit Airlines Inc. | | | 1,348,000 | | | | 49,997,320 | |
| | | | | | | | | | |
| | | | | | | | | 81,498,220 | |
| | | | | | | | | | |
| | Utilities 3.9% | | | | | | | | |
| | Connecticut Water Service Inc. | | | 82,800 | | | | 5,135,256 | |
| | IDACORP Inc. | | | 474,099 | | | | 43,631,331 | |
| | Spire Inc. | | | 685,070 | | | | 54,086,276 | |
| | | | | | | | | | |
| | | | | | | | | 102,852,863 | |
| | | | | | | | | | |
| | Total Common Stocks (Cost $1,740,244,197) | | | | | | | 2,422,773,248 | |
| | | | | | | | | | |
| | | | | | |
| franklintempleton.com | | Annual Report | | | 61 | |
FRANKLIN VALUE INVESTORS TRUST
STATEMENT OF INVESTMENTS
Franklin Small Cap Value Fund (continued)
| | | | | | | | | | |
| | | | | Principal
Amount | | | Value | |
| | Corporate Bonds 0.9% | | | | | | | | |
| | Energy 0.7% | | | | | | | | |
| | Unit Corp., senior sub. note, 6.625%, 5/15/21 | | $ | 17,386,000 | | | $ | 17,538,127 | |
| | | | | | | | | | |
| | Machinery 0.2% | | | | | | | | |
| | Mueller Industries Inc., sub. bond, 6.00%, 3/01/27 | | | 4,532,000 | | | | 4,679,290 | |
| | | | | | | | | | |
| | Total Corporate Bonds (Cost $21,173,481) | | | | | | | 22,217,417 | |
| | | | | | | | | | |
| | Total Investments before Short Term Investments (Cost $1,761,417,678) | | | | | | | 2,444,990,665 | |
| | | | | | | | | | |
| | | |
| | | | | Shares | | | | |
| | Short Term Investments (Cost $41,161,870) 1.6% | | | | | | | | |
| | Money Market Funds 1.6% | | | | | | | | |
c,d | | Institutional Fiduciary Trust Money Market Portfolio, 0.69% | | | 41,161,870 | | | | 41,161,870 | |
| | | | | | | | | | |
| | Total Investments (Cost $1,802,579,548) 95.5% | | | | | | | 2,486,152,535 | |
| | Other Assets, less Liabilities 4.5% | | | | | | | 117,940,931 | |
| | | | | | | | | | |
| | Net Assets 100.0% | | | | | | $ | 2,604,093,466 | |
| | | | | | | | | | |
aNon-income producing.
bSee Note 7 regarding holdings of 5% voting securities.
cSee Note 3(f) regarding investments in affiliated management investment companies.
dThe rate shown is the annualized seven-day yield at period end.
| | | | |
| 62 | | Annual Report | The accompanying notes are an integral part of these financial statements. | | franklintempleton.com |
FRANKLIN VALUE INVESTORS TRUST
Financial Statements
Statements of Assets and Liabilities
October 31, 2017
| | | | | | | | | | | | |
| | | Franklin Balance Sheet
Investment Fund | | | Franklin MicroCap
Value Fund | | | Franklin MidCap
Value Fund | |
Assets: | | | | | | | | | | | | |
Investments in securities: | | | | | | | | | | | | |
Cost - Unaffiliated issuers | | | $ 596,690,518 | | | | $167,612,378 | | | | $147,249,738 | |
Cost - Non-controlled affiliates (Note 3f and 7) | | | 133,130,464 | | | | 31,211,100 | | | | 4,800,858 | |
| | | | |
Value - Unaffiliated issuers | | | $ 875,004,709 | | | | $308,278,260 | | | | $181,305,352 | |
Value - Non-controlled affiliates (Note 3f and 7) | | | 133,130,464 | | | | 33,097,686 | | | | 4,800,858 | |
Receivables: | | | | | | | | | | | | |
Investment securities sold | | | 1,601,470 | | | | 1,112,425 | | | | — | |
Capital shares sold | | | 1,017,420 | | | | 56,980 | | | | 10,472 | |
Dividends and interest | | | 449,440 | | | | 1,300 | | | | 28,289 | |
Other assets | | | 313 | | | | 106 | | | | 55 | |
| | | | |
Total assets | | | 1,011,203,816 | | | | 342,546,757 | | | | 186,145,026 | |
| | | | |
Liabilities: | | | | | | | | | | | | |
Payables: | | | | | | | | | | | | |
Investment securities purchased | | | 2,060,622 | | | | — | | | | — | |
Capital shares redeemed | | | 1,313,222 | | | | 518,802 | | | | 366,433 | |
Management fees | | | 363,027 | | | | 213,470 | | | | 93,331 | |
Distribution fees | | | 236,892 | | | | 49,484 | | | | 54,564 | |
Transfer agent fees | | | 250,821 | | | | 67,915 | | | | 75,478 | |
Accrued expenses and other liabilities | | | 66,683 | | | | 24,374 | | | | 24,894 | |
| | | | |
Total liabilities | | | 4,291,267 | | | | 874,045 | | | | 614,700 | |
| | | | |
Net assets, at value | | | $1,006,912,549 | | | | $341,672,712 | | | | $185,530,326 | |
| | | | |
Net assets consist of: | | | | | | | | | | | | |
Paid-in capital | | | $ 655,183,291 | | | | $174,744,376 | | | | $141,303,192 | |
Undistributed net investment income | | | 8,021,470 | | | | 180,823 | | | | 110,287 | |
Net unrealized appreciation (depreciation) | | | 278,314,191 | | | | 142,552,468 | | | | 34,055,614 | |
Accumulated net realized gain (loss) | | | 65,393,597 | | | | 24,195,045 | | | | 10,061,233 | |
| | | | |
Net assets, at value | | | $1,006,912,549 | | | | $341,672,712 | | | | $185,530,326 | |
| | | | |
| | | | | | |
| franklintempleton.com | | The accompanying notes are an integral part of these financial statements. | Annual Report | | | 63 | |
FRANKLIN VALUE INVESTORS TRUST
FINANCIAL STATEMENTS
Statements of Assets and Liabilities (continued)
October 31, 2017
| | | | | | | | | | | | |
| | | Franklin Balance Sheet
Investment Fund | | | Franklin MicroCap
Value Fund | | | Franklin MidCap
Value Fund | |
| Class A: | | | | | | | | | | | | |
Net assets, at value | | | $841,367,025 | | | | $238,337,490 | | | | $148,652,123 | |
| | | | |
Shares outstanding | | | 20,480,327 | | | | 6,542,464 | | | | 8,911,312 | |
| | | | |
Net asset value per sharea | | | $41.08 | | | | $36.43 | | | | $16.68 | |
| | | | |
Maximum offering price per share (net asset value per share ÷ 94.25%) | | | $43.59 | | | | $38.65 | | | | $17.70 | |
| | | | |
| Class C: | | | | | | | | | | | | |
Net assets, at value | | | $ 65,586,051 | | | | | | | | $ 26,579,061 | |
| | | | | | | | | | | | |
Shares outstanding | | | 1,670,214 | | | | | | | | 1,628,539 | |
| | | | | | | | | | | | |
Net asset value and maximum offering price per sharea | | | $39.27 | | | | | | | | $16.32 | |
| | | | | | | | | | | | |
| Class R: | | | | | | | | | | | | |
Net assets, at value | | | $ 7,884,202 | | | | | | | | $ 702,663 | |
| | | | | | | | | | | | |
Shares outstanding | | | 191,812 | | | | | | | | 42,131 | |
| | | | | | | | | | | | |
Net asset value and maximum offering price per share | | | $41.10 | | | | | | | | $16.68 | |
| | | | | | | | | | | | |
| Class R6: | | | | | | | | | | | | |
Net assets, at value | | | $ 34,672,934 | | | | $ 27,106,840 | | | | | |
| | | | | | | | |
Shares outstanding | | | 818,114 | | | | 735,672 | | | | | |
| | | | | | | | |
Net asset value and maximum offering price per share | | | $42.38 | | | | $36.85 | | | | | |
| | | | | | | | |
| Advisor Class: | | | | | | | | | | | | |
Net assets, at value | | | $ 57,402,337 | | | | $ 76,228,382 | | | | $ 9,596,479 | |
| | | | |
Shares outstanding | | | 1,354,253 | | | | 2,078,795 | | | | 571,366 | |
| | | | |
Net asset value and maximum offering price per share | | | $42.39 | | | | $36.67 | | | | $16.80 | |
| | | | |
aRedemption price is equal to net asset value less contingent deferred sales charges, if applicable.
| | | | |
| 64 | | Annual Report | The accompanying notes are an integral part of these financial statements. | | franklintempleton.com |
FRANKLIN VALUE INVESTORS TRUST
FINANCIAL STATEMENTS
Statements of Assets and Liabilities (continued)
October 31, 2017
| | | | |
| | | Franklin Small Cap
Value Fund | |
Assets: | | | | |
Investments in securities: | | | | |
Cost - Unaffiliated issuers | | | $1,745,035,767 | |
Cost - Non-controlled affiliates (Note 3f and 7) | | | 57,543,781 | |
| | | | |
Value - Unaffiliated issuers | | | $2,426,134,590 | |
Value - Non-controlled affiliates (Note 3f and 7) | | | 60,017,945 | |
Receivables: | | | | |
Investment securities sold | | | 4,858,508 | |
Capital shares sold | | | 150,285,512 | |
Dividends and interest | | | 1,571,959 | |
Other assets | | | 855 | |
| | | | |
Total assets | | | 2,642,869,369 | |
| | | | |
Liabilities: | | | | |
Payables: | | | | |
Investment securities purchased | | | 27,602,901 | |
Capital shares redeemed | | | 8,331,499 | |
Management fees | | | 1,174,506 | |
Distribution fees | | | 534,749 | |
Transfer agent fees | | | 965,231 | |
Accrued expenses and other liabilities | | | 167,017 | |
| | | | |
Total liabilities | | | 38,775,903 | |
| | | | |
Net assets, at value | | | $2,604,093,466 | |
| | | | |
Net assets consist of: | | | | |
Paid-in capital | | | $1,705,051,823 | |
Undistributed net investment income | | | 13,752,537 | |
Net unrealized appreciation (depreciation) | | | 683,586,413 | |
Accumulated net realized gain (loss) | | | 201,702,693 | |
| | | | |
Net assets, at value | | | $2,604,093,466 | |
| | | | |
| | | | | | |
| franklintempleton.com | | The accompanying notes are an integral part of these financial statements. | Annual Report | | | 65 | |
FRANKLIN VALUE INVESTORS TRUST
FINANCIAL STATEMENTS
Statements of Assets and Liabilities (continued)
October 31, 2017
| | | | |
| | | Franklin Small Cap
Value Fund | |
| Class A: | | | | |
Net assets, at value | | | $1,364,628,830 | |
| | | | |
Shares outstanding | | | 23,100,676 | |
| | | | |
Net asset value per sharea | | | $59.07 | |
| | | | |
Maximum offering price per share (net asset value per share ÷ 94.25%) | | | $62.67 | |
| | | | |
| Class C: | | | | |
Net assets, at value | | | $ 225,227,541 | |
| | | | |
Shares outstanding | | | 4,269,709 | |
| | | | |
Net asset value and maximum offering price per sharea | | | $52.75 | |
| | | | |
| Class R: | | | | |
Net assets, at value | | | $ 209,627,270 | |
| | | | |
Shares outstanding | | | 3,591,504 | |
| | | | |
Net asset value and maximum offering price per share | | | $58.37 | |
| | | | |
| Class R6: | | | | |
Net assets, at value | | | $ 221,245,571 | |
| | | | |
Shares outstanding | | | 3,585,303 | |
| | | | |
Net asset value and maximum offering price per share | | | $61.71 | |
| | | | |
| Advisor Class: | | | | |
Net assets, at value | | | $ 583,364,254 | |
| | | | |
Shares outstanding | | | 9,460,605 | |
| | | | |
Net asset value and maximum offering price per share | | | $61.66 | |
| | | | |
aRedemption price is equal to net asset value less contingent deferred sales charges, if applicable.
| | | | |
| 66 | | Annual Report | The accompanying notes are an integral part of these financial statements. | | franklintempleton.com |
FRANKLIN VALUE INVESTORS TRUST
FINANCIAL STATEMENTS
Statements of Operations
for the year ended October 31, 2017
| | | | | | | | | | | | |
| | | Franklin Balance Sheet
Investment Fund | | | Franklin MicroCap
Value Fund | | | Franklin MidCap
Value Fund | |
Investment income: | | | | | | | | | | | | |
Dividends: | | | | | | | | | | | | |
Unaffiliated issuers | | | | | | | | | | | | |
Paid in cash | | | $ 16,733,943 | | | | $ 3,880,636 | | | | $ 2,851,838 | |
Non-cash dividends | | | 1,490,000 | | | | — | | | | — | |
Non-controlled affiliates (Note 3f and 7) | | | | | | | | | | | | |
Paid in cash | | | 597,007 | | | | 98,269 | | | | 21,884 | |
Interest: | | | | | | | | | | | | |
Unaffiliated issuers | | | 57,365 | | | | — | | | | — | |
Income from securities loaned (net of fees and rebates) | | | — | | | | 730 | | | | 7,952 | |
| | | | |
Total investment income | | | 18,878,315 | | | | 3,979,635 | | | | 2,881,674 | |
| | | | |
Expenses: | | | | | | | | | | | | |
Management fees (Note 3a) | | | 4,863,053 | | | | 2,517,461 | | | | 1,757,021 | |
Distribution fees: (Note 3c) | | | | | | | | | | | | |
Class A | | | 2,131,545 | | | | 585,134 | | | | 371,525 | |
Class C | | | 666,342 | | | | — | | | | 266,722 | |
Class R | | | 44,703 | | | | — | | | | 3,433 | |
Transfer agent fees: (Note 3e) | | | | | | | | | | | | |
Class A | | | 1,333,738 | | | | 296,486 | | | | 327,762 | |
Class C | | | 104,232 | | | | — | | | | 58,812 | |
Class R | | | 14,050 | | | | — | | | | 1,516 | |
Class R6 | | | 434 | | | | 323 | | | | — | |
Advisor Class | | | 149,215 | | | | 91,088 | | | | 19,636 | |
Custodian fees (Note 4) | | | 9,011 | | | | 2,763 | | | | 1,512 | |
Reports to shareholders | | | 126,716 | | | | 25,514 | | | | 32,186 | |
Registration and filing fees | | | 112,545 | | | | 61,162 | | | | 77,489 | |
Professional fees | | | 76,396 | | | | 60,001 | | | | 58,305 | |
Trustees’ fees and expenses | | | 45,968 | | | | 15,227 | | | | 8,059 | |
Other | | | 20,370 | | | | 11,857 | | | | 12,624 | |
| | | | |
Total expenses | | | 9,698,318 | | | | 3,667,016 | | | | 2,996,602 | |
Expense reductions (Note 4) | | | (46 | ) | | | (26 | ) | | | — | |
Expenses waived/paid by affiliates (Note 3f and 3g) | | | (563,951 | ) | | | (37,050 | ) | | | (412,934 | ) |
| | | | |
Net expenses | | | 9,134,321 | | | | 3,629,940 | | | | 2,583,668 | |
| | | | |
Net investment income | | | 9,743,994 | | | | 349,695 | | | | 298,006 | |
| | | | |
Realized and unrealized gains (losses): | | | | | | | | | | | | |
Net realized gain (loss) from: | | | | | | | | | | | | |
Investments: | | | | | | | | | | | | |
Unaffiliated issuers | | | 79,521,736 | | | | 23,376,092 | | | | 11,497,743 | |
Non-controlled affiliates (Note 3f and 7) | | | (407,214 | ) | | | 3,017,888 | | | | — | |
Realized gain distributions from REITs | | | — | | | | 202,496 | | | | 205,872 | |
Foreign currency transactions | | | (38,246 | ) | | | — | | | | 212 | |
| | | | |
Net realized gain (loss) | | | 79,076,276 | | | | 26,596,476 | | | | 11,703,827 | |
| | | | |
Net change in unrealized appreciation (depreciation) on: | | | | | | | | | | | | |
Investments: | | | | | | | | | | | | |
Unaffiliated issuers | | | 123,780,810 | | | | 48,592,192 | | | | 15,401,483 | |
Non-controlled affiliates (Note 3f and 7) | | | — | | | | 3,715,883 | | | | — | |
| | | | |
Net change in unrealized appreciation (depreciation) | | | 123,780,810 | | | | 52,308,075 | | | | 15,401,483 | |
| | | | |
Net realized and unrealized gain (loss) | | | 202,857,086 | | | | 78,904,551 | | | | 27,105,310 | |
| | | | |
Net increase (decrease) in net assets resulting from operations | | | $212,601,080 | | | | $79,254,246 | | | | $27,403,316 | |
| | | | |
| | | | | | |
| franklintempleton.com | | The accompanying notes are an integral part of these financial statements. | Annual Report | | | 67 | |
FRANKLIN VALUE INVESTORS TRUST
FINANCIAL STATEMENTS
Statements of Operations (continued)
for the year ended October 31, 2017
| | | | |
| | | Franklin Small Cap
Value Fund | |
Investment income: | | | | |
Dividends: | | | | |
Unaffiliated issuers | | | | |
Paid in cash | | | $ 37,333,032 | |
Non-cash dividends | | | 4,532,000 | |
Non-controlled affiliates (Note 3f and 7) | | | | |
Paid in cash | | | 1,078,139 | |
Interest: | | | | |
Unaffiliated issuers | | | 1,494,756 | |
Income from securities loaned (net of fees and rebates) | | | 7,272 | |
| | | | |
Total investment income | | | 44,445,199 | |
| | | | |
Expenses: | | | | |
Management fees (Note 3a) | | | 15,682,467 | |
Distribution fees: (Note 3c) | | | | |
Class A | | | 3,050,430 | |
Class C | | | 2,318,640 | |
Class R | | | 1,102,412 | |
Transfer agent fees: (Note 3e) | | | | |
Class A | | | 2,585,897 | |
Class C | | | 491,834 | |
Class R | | | 468,871 | |
Class R6 | | | 9,104 | |
Advisor Class | | | 2,002,503 | |
Custodian fees (Note 4) | | | 43,007 | |
Reports to shareholders | | | 265,446 | |
Registration and filing fees | | | 152,739 | |
Professional fees | | | 85,866 | |
Trustees’ fees and expenses | | | 123,134 | |
Other | | | 51,612 | |
| | | | |
Total expenses | | | 28,433,962 | |
Expense reductions (Note 4) | | | (2,951 | ) |
Expenses waived/paid by affiliates (Note 3f and 3g) | | | (575,689 | ) |
| | | | |
Net expenses | | | 27,855,322 | |
| | | | |
Net investment income | | | 16,589,877 | |
| | | | |
Realized and unrealized gains (losses): | | | | |
Net realized gain (loss) from: | | | | |
Investments: | | | | |
Unaffiliated issuers | | | 254,429,749 | |
Non-controlled affiliates (Note 3f and 7) | | | 5,437,150 | |
Realized gain distributions from REITs | | | 1,169,912 | |
Foreign currency transactions | | | (15,931 | ) |
| | | | |
Net realized gain (loss) | | | 261,020,880 | |
| | | | |
Net change in unrealized appreciation (depreciation) on: | | | | |
Investments: | | | | |
Unaffiliated issuers | | | 205,589,449 | |
Translation of other assets and liabilities denominated in foreign currencies | | | 17,288 | |
| | | | |
Net change in unrealized appreciation (depreciation) | | | 205,606,737 | |
| | | | |
Net realized and unrealized gain (loss) | | | 466,627,617 | |
| | | | |
Net increase (decrease) in net assets resulting from operations | | | $483,217,494 | |
| | | | |
| | | | |
| 68 | | Annual Report | The accompanying notes are an integral part of these financial statements. | | franklintempleton.com |
FRANKLIN VALUE INVESTORS TRUST
FINANCIAL STATEMENTS
Statements of Changes in Net Assets
| | | | | | | | | | | | | | | | |
| | | Franklin Balance Sheet Investment Fund | | | Franklin MicroCap Value Fund | |
| | |
| | | Year Ended October 31, | | | Year Ended October 31, | |
| | | | |
| | | 2017 | | | 2016 | | | 2017 | | | 2016 | |
Increase (decrease) in net assets: | | | | | | | | | | | | | | | | |
Operations: | | | | | | | | | | | | | | | | |
Net investment income | | | $ 9,743,994 | | | | $ 5,747,265 | | | | $ 349,695 | | | | $ 1,347,749 | |
Net realized gain (loss) | | | 79,076,276 | | | | 66,590,811 | | | | 26,596,476 | | | | 31,952,200 | |
Net change in unrealized appreciation (depreciation) | | | 123,780,810 | | | | (32,021,337 | ) | | | 52,308,075 | | | | (7,844,719 | ) |
| | | | |
Net increase (decrease) in net assets resulting from operations | | | 212,601,080 | | | | 40,316,739 | | | | 79,254,246 | | | | 25,455,230 | |
| | | | |
Distributions to shareholders from: | | | | | | | | | | | | | | | | |
Net investment income: | | | | | | | | | | | | | | | | |
Class A | | | (4,060,775 | ) | | | (6,163,510 | ) | | | (781,224 | ) | | | — | |
Class R | | | (22,684 | ) | | | (40,973 | ) | | | — | | | | — | |
Class R6 | | | (1,448 | ) | | | (86,862 | ) | | | (135,057 | ) | | | — | |
Advisor Class | | | (600,152 | ) | | | (567,388 | ) | | | (384,628 | ) | | | — | |
Net realized gains: | | | | | | | | | | | | | | | | |
Class A | | | (51,331,731 | ) | | | (127,240,321 | ) | | | (21,859,680 | ) | | | (29,640,539 | ) |
Class C | | | (4,188,910 | ) | | | (10,707,264 | ) | | | — | | | | — | |
Class R | | | (551,321 | ) | | | (1,392,805 | ) | | | — | | | | — | |
Class R6 | | | (11,683 | ) | | | (1,044,533 | ) | | | (1,735,581 | ) | | | (2,087,901 | ) |
Advisor Class | | | (4,880,914 | ) | | | (8,916,476 | ) | | | (6,025,380 | ) | | | (7,083,319 | ) |
| | | | |
Total distributions to shareholders | | | (65,649,618 | ) | | | (156,160,132 | ) | | | (30,921,550 | ) | | | (38,811,759 | ) |
| | | | |
Capital share transactions: (Note 2) | | | | | | | | | | | | | | | | |
Class A | | | (77,357,974 | ) | | | (20,929,475 | ) | | | (29,044,783 | ) | | | (14,615,220 | ) |
Class C | | | (5,146,048 | ) | | | (2,931,602 | ) | | | — | | | | — | |
Class R | | | (1,907,276 | ) | | | (225,350 | ) | | | — | | | | — | |
Class R6 | | | 34,339,167 | | | | (6,369,642 | ) | | | 5,658,368 | | | | 800,571 | |
Advisor Class | | | (31,412,724 | ) | | | 12,702,903 | | | | 2,063,896 | | | | (1,878,032 | ) |
| | | | |
Total capital share transactions | | | (81,484,855 | ) | | | (17,753,166 | ) | | | (21,322,519 | ) | | | (15,692,681 | ) |
| | | | |
Net increase (decrease) in net assets | | | 65,466,607 | | | | (133,596,559 | ) | | | 27,010,177 | | | | (29,049,210 | ) |
Net assets: | | | | | | | | | | | | | | | | |
Beginning of year | | | 941,445,942 | | | | 1,075,042,501 | | | | 314,662,535 | | | | 343,711,745 | |
| | | | |
End of year | | | $1,006,912,549 | | | | $ 941,445,942 | | | | $341,672,712 | | | | $314,662,535 | |
| | | | |
Undistributed net investment income included in net assets: | | | | | | | | | | | | | | | | |
End of year | | | $ 8,021,470 | | | | $ 3,000,781 | | | | $ 180,823 | | | | $ 1,020,893 | |
| | | | |
| | | | | | |
| franklintempleton.com | | The accompanying notes are an integral part of these financial statements. | Annual Report | | | 69 | |
FRANKLIN VALUE INVESTORS TRUST
FINANCIAL STATEMENTS
Statements of Changes in Net Assets (continued)
| | | | | | | | | | | | | | | | |
| | | Franklin MidCap
Value Fund | | | Franklin Small Cap
Value Fund | |
| | | Year Ended October 31, | | | Year Ended October 31, | |
| | | 2017 | | | 2016 | | | 2017 | | | 2016 | |
Increase (decrease) in net assets: | | | | | | | | | | | | | | | | |
Operations: | | | | | | | | | | | | | | | | |
Net investment income | | $ | 298,006 | | | $ | 1,173,444 | | | $ | 16,589,877 | | | $ | 8,464,997 | |
Net realized gain (loss) | | | 11,703,827 | | | | 2,243,105 | | | | 261,020,880 | | | | 142,535,280 | |
Net change in unrealized appreciation (depreciation) | | | 15,401,483 | | | | 3,250,542 | | | | 205,606,737 | | | | 67,063,792 | |
| | | | |
Net increase (decrease) in net assets resulting from operations | | | 27,403,316 | | | | 6,667,091 | | | | 483,217,494 | | | | 218,064,069 | |
| | | | |
Distributions to shareholders from: | | | | | | | | | | | | | | | | |
Net investment income: | | | | | | | | | | | | | | | | |
Class A | | | (1,012,515 | ) | | | (566,129 | ) | | | (2,771,643 | ) | | | (5,808,824 | ) |
Class C | | | (16,788 | ) | | | — | | | | — | | | | — | |
Class R | | | (3,475 | ) | | | (487 | ) | | | — | | | | (679,366 | ) |
Class R6 | | | — | | | | — | | | | (694,508 | ) | | | (693,643 | ) |
Advisor Class | | | (64,778 | ) | | | (34,226 | ) | | | (4,517,276 | ) | | | (4,845,956 | ) |
Net realized gains: | | | | | | | | | | | | | | | | |
Class A | | | (1,605,870 | ) | | | (10,163,601 | ) | | | (58,123,153 | ) | | | (99,834,697 | ) |
Class C | | | (297,150 | ) | | | (1,886,762 | ) | | | (12,431,086 | ) | | | (23,379,887 | ) |
Class R | | | (8,290 | ) | | | (57,562 | ) | | | (10,985,538 | ) | | | (21,061,215 | ) |
Class R6 | | | — | | | | — | | | | (5,152,248 | ) | | | (5,810,056 | ) |
Advisor Class | | | (75,433 | ) | | | (366,722 | ) | | | (44,280,146 | ) | | | (55,891,621 | ) |
| | | | |
Total distributions to shareholders | | | (3,084,299 | ) | | | (13,075,489 | ) | | | (138,955,598 | ) | | | (218,005,265 | ) |
| | | | |
Capital share transactions: (Note 2) | | | | | | | | | | | | | | | | |
Class A | | | 117,251 | | | | 6,921,151 | | | | 76,610,126 | | | | 57,050,882 | |
Class C | | | (105,056 | ) | | | 973,731 | | | | (22,192,857 | ) | | | (8,339,210 | ) |
Class R | | | (103,944 | ) | | | (13,076 | ) | | | (31,723,743 | ) | | | (8,987,914 | ) |
Class R6 | | | — | | | | — | | | | 101,158,234 | | | | 39,750,357 | |
Advisor Class | | | 2,507,894 | | | | 1,487,504 | | | | (414,056,938 | ) | | | 262,254,964 | |
| | | | |
Total capital share transactions | | | 2,416,145 | | | | 9,369,310 | | | | (290,205,178 | ) | | | 341,729,079 | |
| | | | |
Net increase (decrease) in net assets | | | 26,735,162 | | | | 2,960,912 | | | | 54,056,718 | | | | 341,787,883 | |
Net assets: | | | | | | | | | | | | | | | | |
Beginning of year | | | 158,795,164 | | | | 155,834,252 | | | | 2,550,036,748 | | | | 2,208,248,865 | |
| | | | |
End of year | | $ | 185,530,326 | | | $ | 158,795,164 | | | $ | 2,604,093,466 | | | $ | 2,550,036,748 | |
| | | | |
Undistributed net investment income included in net assets: | | | | | | | | | | | | | | | | |
End of year | | $ | 110,287 | | | $ | 730,286 | | | $ | 13,752,537 | | | $ | 5,140,223 | |
| | | | |
| | | | |
| 70 | | Annual Report | The accompanying notes are an integral part of these financial statements. | | franklintempleton.com |
FRANKLIN VALUE INVESTORS TRUST
Notes to Financial Statements
1. Organization and Significant Accounting Policies
Franklin Value Investors Trust (Trust) is registered under the Investment Company Act of 1940 (1940 Act) as an open-end management investment company, consisting of four separate funds (Funds) and applies the specialized accounting and reporting guidance in U.S. Generally Accepted Accounting Principles (U.S. GAAP). The classes of shares offered within each of the Funds are indicated below. Each class of shares may differ by its initial sales load, contingent deferred sales charges, voting rights on matters affecting a single class, its exchange privilege and fees due to differing arrangements for distribution and transfer agent fees.
|
| Class A, Class R6 & Advisor Class |
Franklin MicroCap Value Funda |
|
| Class A, Class C, Class R & Advisor Class |
Franklin MidCap Value Fund |
|
| Class A, Class C, Class R, Class R6 & Advisor Class |
Franklin Balance Sheet Investment Fund |
Franklin Small Cap Value Fund |
aFranklin MicroCap Value Fund was closed to new investors with limited exceptions effective January 2004, and has remained closed except for two days in mid-February 2013, when the Fund was opened on a limited basis.
The following summarizes the Funds’ significant accounting policies.
a. Financial Instrument Valuation
The Funds’ investments in financial instruments are carried at fair value daily. Fair value is the price that would be received to sell an asset or paid to transfer a liability in an orderly transaction between market participants on the measurement date. The Funds calculate the net asset value (NAV) per share as of 4 p.m. Eastern time each day the New York Stock Exchange (NYSE) is open for trading. Under compliance policies and procedures approved by the Trust’s Board of Trustees (the Board), the Funds’ administrator has responsibility for oversight of valuation, including leading the cross-functional Valuation Committee (VC). The VC provides administration and oversight of the Funds’ valuation policies and procedures, which are approved annually by the Board. Among other things, these procedures allow the Funds to utilize independent pricing services, quotations from securities and financial instrument dealers, and other market sources to determine fair value.
Equity securities and exchange traded funds listed on an exchange or on the NASDAQ National Market System are valued at the last quoted sale price or the official closing price of the day, respectively. Foreign equity securities are valued as of the close of trading on the foreign stock exchange on which the security is primarily traded, or as of 4 p.m. Eastern time. The value is then converted into its U.S. dollar equivalent at the foreign exchange rate in effect at 4 p.m. Eastern time on the day that the value of the security is determined. Over-the-counter (OTC) securities are valued within the range of the most recent quoted bid and ask prices. Securities that trade in multiple markets or on multiple exchanges are valued according to the broadest and most representative market. Certain equity securities are valued based upon fundamental characteristics or relationships to similar securities.
Debt securities generally trade in the OTC market rather than on a securities exchange. The Funds’ pricing services use multiple valuation techniques to determine fair value. In instances where sufficient market activity exists, the pricing services may utilize a market-based approach through which quotes from market makers are used to determine fair value. In instances where sufficient market activity may not exist or is limited, the pricing services also utilize proprietary valuation models which may consider market characteristics such as benchmark yield curves, credit spreads, estimated default rates, anticipated market interest rate volatility, coupon rates, anticipated timing of principal repayments, underlying collateral, and other unique security features in order to estimate the relevant cash flows, which are then discounted to calculate the fair value.
Investments in open-end mutual funds are valued at the closing NAV.
The Funds have procedures to determine the fair value of financial instruments for which market prices are not reliable or readily available. Under these procedures, the VC convenes on a regular basis to review such financial instruments and considers a number of factors, including significant unobservable valuation inputs, when arriving at fair value. The VC primarily employs a market-based approach which may use related or comparable assets or liabilities, recent transactions, market multiples, book values, and other relevant information for the investment to determine the fair value of the investment. An income-based valuation approach may also be used in which the anticipated future cash flows of the investment are discounted to calculate fair value. Discounts may also be applied due to the nature or duration of any restrictions on the
| | | | | | |
| franklintempleton.com | | Annual Report | | | 71 | |
FRANKLIN VALUE INVESTORS TRUST
NOTES TO FINANCIAL STATEMENTS
1. Organization and Significant Accounting
Policies (continued)
a. Financial Instrument Valuation (continued)
disposition of the investments. Due to the inherent uncertainty of valuations of such investments, the fair values may differ significantly from the values that would have been used had an active market existed. The VC employs various methods for calibrating these valuation approaches including a regular review of key inputs and assumptions, transactional back-testing or disposition analysis, and reviews of any related market activity.
Trading in securities on foreign securities stock exchanges and OTC markets may be completed before 4 p.m. Eastern time. In addition, trading in certain foreign markets may not take place on every Funds’ business day. Occasionally, events occur between the time at which trading in a foreign security is completed and 4 p.m. Eastern time that might call into question the reliability of the value of a portfolio security held by the Fund. As a result, differences may arise between the value of the Funds’ portfolio securities as determined at the foreign market close and the latest indications of value at 4 p.m. Eastern time. In order to minimize the potential for these differences, the VC monitors price movements following the close of trading in foreign stock markets through a series of country specific market proxies (such as baskets of American Depositary Receipts, futures contracts and exchange traded funds). These price movements are measured against established trigger thresholds for each specific market proxy to assist in determining if an event has occurred that may call into question the reliability of the values of the foreign securities held by the Funds. If such an event occurs, the securities may be valued using fair value procedures, which may include the use of independent pricing services.
When the last day of the reporting period is a non-business day, certain foreign markets may be open on those days that the Funds’ NAV is not calculated, which could result in differences between the value of the Funds’ portfolio securities on the last business day and the last calendar day of the reporting period. Any significant security valuation changes due to an open foreign market are adjusted and reflected by the Funds for financial reporting purposes.
b. Foreign Currency Translation
Portfolio securities and other assets and liabilities denominated in foreign currencies are translated into U.S. dollars based on the exchange rate of such currencies against U.S. dollars on the date of valuation. The Funds may enter into foreign currency exchange contracts to facilitate transactions denominated in a foreign currency. Purchases and sales of securities, income and expense items denominated in foreign currencies are translated into U.S. dollars at the exchange rate in effect on the transaction date. Portfolio securities and assets and liabilities denominated in foreign currencies contain risks that those currencies will decline in value relative to the U.S. dollar. Occasionally, events may impact the availability or reliability of foreign exchange rates used to convert the U.S. dollar equivalent value. If such an event occurs, the foreign exchange rate will be valued at fair value using procedures established and approved by the Board.
The Funds do not separately report the effect of changes in foreign exchange rates from changes in market prices on securities held. Such changes are included in net realized and unrealized gain or loss from investments in the Statements of Operations.
Realized foreign exchange gains or losses arise from sales of foreign currencies, currency gains or losses realized between the trade and settlement dates on securities transactions and the difference between the recorded amounts of dividends, interest, and foreign withholding taxes and the U.S. dollar equivalent of the amounts actually received or paid. Net unrealized foreign exchange gains and losses arise from changes in foreign exchange rates on foreign denominated assets and liabilities other than investments in securities held at the end of the reporting period.
c. Securities Lending
Certain or all Funds participate in an agency based securities lending program to earn additional income. The Fund receives cash collateral against the loaned securities in an amount equal to at least 102% of the fair value of the loaned securities. Collateral is maintained over the life of the loan in an amount not less than 100% of the fair value of loaned securities, as determined at the close of Fund business each day; any additional collateral required due to changes in security values is delivered to the Fund on the next business day. The collateral is deposited into a joint cash account with other funds and is used to invest in a money market fund managed by Franklin Advisers, Inc., an affiliate of the Funds, and/or a joint
| | | | |
| 72 | | Annual Report | | franklintempleton.com |
FRANKLIN VALUE INVESTORS TRUST
NOTES TO FINANCIAL STATEMENTS
repurchase agreement. The Fund may receive income from the investment of cash collateral, in addition to lending fees and rebates paid by the borrower. Income from securities loaned, net of fees paid to the securities lending agent and/or third-party vendor, is reported separately in the Statements of Operations. The Fund bears the market risk with respect to the collateral investment, securities loaned, and the risk that the agent may default on its obligations to the Fund. If the borrower defaults on its obligation to return the securities loaned, the Fund has the right to repurchase the securities in the open market using the collateral received. The securities lending agent has agreed to indemnify the Fund in the event of default by a third party borrower. At October 31, 2017, the Funds had no securities on loan.
d. Income and Deferred Taxes
It is each Fund’s policy to qualify as a regulated investment company under the Internal Revenue Code. Each Fund intends to distribute to shareholders substantially all of its taxable income and net realized gains to relieve it from federal income and excise taxes. As a result, no provision for U.S. federal income taxes is required.
The Funds may be subject to foreign taxation related to income received, capital gains on the sale of securities and certain foreign currency transactions in the foreign jurisdictions in which the Funds invest. Foreign taxes, if any, are recorded based on the tax regulations and rates that exist in the foreign markets in which the Funds invest. When a capital gain tax is determined to apply, certain or all Funds record an estimated deferred tax liability in an amount that would be payable if the securities were disposed of on the valuation date.
As a result of several court cases, in certain countries across the European Union, certain or all Funds filed additional tax reclaims for previously withheld taxes on dividends earned in those countries (EU reclaims). These additional filings are subject to various administrative proceedings by the local jurisdictions’ tax authorities within the European Union, as well as a number of related judicial proceedings. Income recognized, if any, for EU reclaims is reflected as other income in the Statements of Operations and any related receivable, if any, is reflected as European Union tax reclaims in the Statements of Assets and Liabilities. When uncertainty exists as to the ultimate resolution of these proceedings, the likelihood of receipt of these EU reclaims, and the potential timing of payment, no amounts are reflected in the financial statements.
For U.S. income tax purposes, EU reclaims received by the Funds, if any, reduce the amounts of foreign taxes Fund shareholders can use as tax credits in their individual income tax returns.
Each Fund may recognize an income tax liability related to its uncertain tax positions under U.S. GAAP when the uncertain tax position has a less than 50% probability that it will be sustained upon examination by the tax authorities based on its technical merits. As of October 31, 2017, each Fund has determined that no tax liability is required in its financial statements related to uncertain tax positions for any open tax years (or expected to be taken in future tax years). Open tax years are those that remain subject to examination and are based on the statute of limitations in each jurisdiction in which the Fund invests.
e. Security Transactions, Investment Income, Expenses and Distributions
Security transactions are accounted for on trade date. Realized gains and losses on security transactions are determined on a specific identification basis. Interest income and estimated expenses are accrued daily. Amortization of premium and accretion of discount on debt securities are included in interest income. Dividend income is recorded on the ex-dividend date except for certain dividends from securities where the dividend rate is not available. In such cases, the dividend is recorded as soon as the information is received by the Funds. Distributions to shareholders are recorded on the ex-dividend date. Distributable earnings are determined according to income tax regulations (tax basis) and may differ from earnings recorded in accordance with U.S. GAAP. These differences may be permanent or temporary. Permanent differences are reclassified among capital accounts to reflect their tax character. These reclassifications have no impact on net assets or the results of operations. Temporary differences are not reclassified, as they may reverse in subsequent periods.
Common expenses incurred by the Trust are allocated among the Funds based on the ratio of net assets of each Fund to the combined net assets of the Trust. Fund specific expenses are charged directly to the Fund that incurred the expense.
Realized and unrealized gains and losses and net investment income, excluding class specific expenses, are allocated daily to each class of shares based upon the relative proportion of net assets of each class. Differences in per share distributions by class are generally due to differences in class specific expenses.
| | | | | | |
| franklintempleton.com | | Annual Report | | | 73 | |
FRANKLIN VALUE INVESTORS TRUST
NOTES TO FINANCIAL STATEMENTS
1. Organization and Significant Accounting Policies (continued)
e. Security Transactions, Investment Income, Expenses and Distributions (continued)
Distributions received by the Funds from certain securities may be a return of capital (ROC). Such distributions reduce the cost basis of the securities, and any distributions in excess of the cost basis are recognized as capital gains.
f. Accounting Estimates
The preparation of financial statements in accordance with U.S. GAAP requires management to make estimates and assumptions that affect the reported amounts of assets and liabilities at the date of the financial statements and the amounts of income and expenses during the reporting period. Actual results could differ from those estimates.
g. Guarantees and Indemnifications
Under the Trust’s organizational documents, its officers and trustees are indemnified by the Trust against certain liabilities arising out of the performance of their duties to the Trust. Additionally, in the normal course of business, the Trust, on behalf of the Funds, enters into contracts with service providers that contain general indemnification clauses. The Trust’s maximum exposure under these arrangements is unknown as this would involve future claims that may be made against the Trust that have not yet occurred. Currently, the Trust expects the risk of loss to be remote.
2. Shares of Beneficial Interest
At October 31, 2017, there were an unlimited number of shares authorized (without par value). Transactions in the Funds’ shares were as follows:
| | | | | | | | | | | | | | | | |
| | | Franklin Balance Sheet
Investment Fund | | | Franklin MicroCap Value Fund | |
| | | Shares | | | Amount | | | Shares | | | Amount | |
Class A Shares: | | | | | | | | | | | | | | | | |
Year ended October 31, 2017 | | | | | | | | | | | | | | | | |
Shares sold | | | 5,153,316 | | | $ | 199,298,774 | | | | 335,438 | | | $ | 11,155,577 | |
Shares issued in reinvestment of distributions | | | 1,350,870 | | | | 51,495,167 | | | | 647,525 | | | | 21,828,068 | |
Shares redeemed | | | (8,502,452 | ) | | | (328,151,915 | ) | | | (1,876,309 | ) | | | (62,028,428 | ) |
Net increase (decrease) | | | (1,998,266 | ) | | $ | (77,357,974 | ) | | | (893,346 | ) | | $ | (29,044,783 | ) |
Year ended October 31, 2016 | | | | | | | | | | | | | | | | |
Shares sold | | | 3,788,284 | | | $ | 129,548,000 | | | | 356,685 | | | $ | 10,517,221 | |
Shares issued in reinvestment of distributions | | | 3,737,816 | | | | 124,132,878 | | | | 996,581 | | | | 28,382,616 | |
Shares redeemed | | | (7,892,827 | ) | | | (274,610,353 | ) | | | (1,763,502 | ) | | | (53,515,057 | ) |
Net increase (decrease) | | | (366,727 | ) | | $ | (20,929,475 | ) | | | (410,236 | ) | | $ | (14,615,220 | ) |
Class C Shares: | | | | | | | | | | | | | | | | |
Year ended October 31, 2017 | | | | | | | | | | | | | | | | |
Shares sold | | | 272,141 | | | $ | 10,085,492 | | | | | | | | | |
Shares issued in reinvestment of distributions | | | 112,965 | | | | 4,143,570 | | | | | | | | | |
Shares redeemed | | | (525,143 | ) | | | (19,375,110 | ) | | | | | | | | |
Net increase (decrease) | | | (140,037 | ) | | $ | (5,146,048 | ) | | | | | | | | |
Year ended October 31, 2016 | | | | | | | | | | | | | | | | |
Shares sold | | | 209,480 | | | $ | 6,928,314 | | | | | | | | | |
Shares issued in reinvestment of distributions | | | 328,845 | | | | 10,562,502 | | | | | | | | | |
Shares redeemed | | | (619,094 | ) | | | (20,422,418 | ) | | | | | | | | |
Net increase (decrease) | | | (80,769 | ) | | $ | (2,931,602 | ) | | | | | | | | |
| | | | |
| 74 | | Annual Report | | franklintempleton.com |
FRANKLIN VALUE INVESTORS TRUST
NOTES TO FINANCIAL STATEMENTS
| | | | | | | | | | | | | | | | |
| | | Franklin Balance Sheet
Investment Fund | | | Franklin MicroCap
Value Fund | |
| | | Shares | | | Amount | | | Shares | | | Amount | |
Class R Shares: | | | | | | | | | | | | | | | | |
Year ended October 31, 2017 | | | | | | | | | | | | | | | | |
Shares sold | | | 31,687 | | | $ | 1,218,604 | | | | | | | | | |
Shares issued in reinvestment of distributions | | | 15,015 | | | | 574,005 | | | | | | | | | |
Shares redeemed | | | (94,464 | ) | | | (3,699,885 | ) | | | | | | | | |
Net increase (decrease) | | | (47,762 | ) | | $ | (1,907,276 | ) | | | | | | | | |
Year ended October 31, 2016 | | | | | | | | | | | | | | | | |
Shares sold | | | 39,717 | | | $ | 1,367,615 | | | | | | | | | |
Shares issued in reinvestment of distributions | | | 43,057 | | | | 1,433,778 | | | | | | | | | |
Shares redeemed | | | (88,601 | ) | | | (3,026,743 | ) | | | | | | | | |
Net increase (decrease) | | | (5,827 | ) | | $ | (225,350 | ) | | | | | | | | |
Class R6 Shares: | | | | | | | | | | | | | | | | |
Year ended October 31, 2017 | | | | | | | | | | | | | | | | |
Shares sold | | | 820,594 | | | $ | 34,624,354 | | | | 313,078 | | | $ | 10,926,309 | |
Shares issued in reinvestment of distributions | | | 335 | | | | 13,130 | | | | 328 | | | | 11,145 | |
Shares redeemed | | | (7,131 | ) | | | (298,317 | ) | | | (155,386 | ) | | | (5,279,086 | ) |
Net increase (decrease) | | | 813,798 | | | $ | 34,339,167 | | | | 158,020 | | | $ | 5,658,368 | |
Year ended October 31, 2016 | | | | | | | | | | | | | | | | |
Shares sold | | | 72,039 | | | $ | 2,491,495 | | | | 152,058 | | | $ | 4,534,813 | |
Shares issued in reinvestment of distributions | | | 722 | | | | 24,574 | | | | 950 | | | | 27,259 | |
Shares redeemed | | | (248,767 | ) | | | (8,885,711 | ) | | | (120,212 | ) | | | (3,761,501 | ) |
Net increase (decrease) | | | (176,006 | ) | | $ | (6,369,642 | ) | | | 32,796 | | | $ | 800,571 | |
Advisor Class Shares: | | | | | | | | | | | | | | | | |
Year ended October 31, 2017 | | | | | | | | | | | | | | | | |
Shares sold | | | 1,261,267 | | | $ | 49,915,900 | | | | 520,855 | | | $ | 17,493,211 | |
Shares issued in reinvestment of distributions | | | 135,705 | | | | 5,326,412 | | | | 181,160 | | | | 6,134,063 | |
Shares redeemed | | | (2,115,898 | ) | | | (86,655,036 | ) | | | (634,957 | ) | | | (21,563,378 | ) |
Net increase (decrease) | | | (718,926 | ) | | $ | (31,412,724 | ) | | | 67,058 | | | $ | 2,063,896 | |
Year ended October 31, 2016 | | | | | | | | | | | | | | | | |
Shares sold | | | 1,022,225 | | | $ | 36,994,037 | | | | 443,266 | | | $ | 13,682,421 | |
Shares issued in reinvestment of distributions | | | 267,802 | | | | 9,137,398 | | | | 227,808 | | | | 6,513,025 | |
Shares redeemed | | | (904,675 | ) | | | (33,428,532 | ) | | | (705,636 | ) | | | (22,073,478 | ) |
Net increase (decrease) | | | 385,352 | | | $ | 12,702,903 | | | | (34,562 | ) | | $ | (1,878,032 | ) |
| | | | | | |
| franklintempleton.com | | Annual Report | | | 75 | |
FRANKLIN VALUE INVESTORS TRUST
NOTES TO FINANCIAL STATEMENTS
2. Shares of Beneficial Interest (continued)
| | | | | | | | | | | | | | | | |
| | | Franklin MidCap
Value Fund | | | Franklin Small Cap Value Fund | |
| | | Shares | | | Amount | | | Shares | | | Amount | |
Class A Shares: | | | | | | | | | | | | | | | | |
Year ended October 31, 2017 | | | | | | | | | | | | | | | | |
Shares sold | | | 2,352,567 | | | $ | 36,729,974 | | | | 7,963,603 | | | $ | 447,630,182 | |
Shares issued in reinvestment of distributions | | | 168,958 | | | | 2,585,061 | | | | 1,010,594 | | | | 55,825,171 | |
Shares redeemed | | | (2,479,503 | ) | | | (39,197,784 | ) | | | (7,746,568 | ) | | | (426,845,227 | ) |
Net increase (decrease) | | | 42,022 | | | $ | 117,251 | | | | 1,227,629 | | | $ | 76,610,126 | |
Year ended October 31, 2016 | | | | | | | | | | | | | | | | |
Shares sold | | | 2,008,588 | | | $ | 28,082,865 | | | | 4,705,984 | | | $ | 230,621,518 | |
Shares issued in reinvestment of distributions | | | 789,108 | | | | 10,581,940 | | | | 2,182,073 | | | | 96,404,005 | |
Shares issued on reorganization | | | — | | | | — | | | | 771,169 | | | | 32,670,477 | |
Shares redeemed | | | (2,273,020 | ) | | | (31,743,654 | ) | | | (6,327,141 | ) | | | (302,645,118 | ) |
Net increase (decrease) | | | 524,676 | | | $ | 6,921,151 | | | | 1,332,085 | | | $ | 57,050,882 | |
Class C Shares: | | | | | | | | | | | | | | | | |
Year ended October 31, 2017 | | | | | | | | | | | | | | | | |
Shares sold | | | 462,281 | | | $ | 7,089,052 | | | | 748,489 | | | $ | 36,949,706 | |
Shares issued in reinvestment of distributions | | | 20,598 | | | | 310,417 | | | | 234,411 | | | | 11,638,500 | |
Shares redeemed | | | (483,799 | ) | | | (7,504,525 | ) | | | (1,434,410 | ) | | | (70,781,063 | ) |
Net increase (decrease) | | | (920 | ) | | $ | (105,056 | ) | | | (451,510 | ) | | $ | (22,192,857 | ) |
Year ended October 31, 2016 | | | | | | | | | | | | | | | | |
Shares sold | | | 404,432 | | | $ | 5,582,883 | | | | 712,170 | | | $ | 31,364,976 | |
Shares issued in reinvestment of distributions | | | 138,620 | | | | 1,832,553 | | | | 535,257 | | | | 21,474,498 | |
Shares issued on reorganization | | | — | | | | — | | | | 148,730 | | | | 5,709,810 | |
Shares redeemed | | | (472,144 | ) | | | (6,441,705 | ) | | | (1,527,317 | ) | | | (66,888,494 | ) |
Net increase (decrease) | | | 70,908 | | | $ | 973,731 | | | | (131,160 | ) | | $ | (8,339,210 | ) |
Class R Shares: | | | | | | | | | | | | | | | | |
Year ended October 31, 2017 | | | | | | | | | | | | | | | | |
Shares sold | | | 6,728 | | | $ | 106,668 | | | | 1,007,604 | | | $ | 54,925,905 | |
Shares issued in reinvestment of distributions | | | 768 | | | | 11,765 | | | | 191,550 | | | | 10,477,784 | |
Shares redeemed | | | (14,376 | ) | | | (222,377 | ) | | | (1,778,918 | ) | | | (97,127,432 | ) |
Net increase (decrease) | | | (6,880 | ) | | $ | (103,944 | ) | | | (579,764 | ) | | $ | (31,723,743 | ) |
Year ended October 31, 2016 | | | | | | | | | | | | | | | | |
Shares sold | | | 6,784 | | | $ | 96,073 | | | | 925,146 | | | $ | 44,110,152 | |
Shares issued in reinvestment of distributions | | | 4,322 | | | | 58,049 | | | | 473,666 | | | | 20,737,082 | |
Shares issued on reorganization | | | — | | | | — | | | | 1,308 | | | | 54,856 | |
Shares redeemed | | | (11,824 | ) | | | (167,198 | ) | | | (1,564,983 | ) | | | (73,890,004 | ) |
Net increase (decrease) | | | (718 | ) | | $ | (13,076 | ) | | | (164,863 | ) | | $ | (8,987,914 | ) |
| | | | |
| 76 | | Annual Report | | franklintempleton.com |
FRANKLIN VALUE INVESTORS TRUST
NOTES TO FINANCIAL STATEMENTS
| | | | | | | | | | | | | | | | |
| | | Franklin MidCap Value Fund | | | Franklin Small Cap Value Fund | |
| | | Shares | | | Amount | | | Shares | | | Amount | |
Class R6 Shares: | | | | | | | | | | | | | | | | |
Year ended October 31, 2017 | | | | | | | | | | | | | | | | |
Shares sold | | | | | | | | | | | 2,383,568 | | | $ | 139,507,090 | |
Shares issued in reinvestment of distributions | | | | | | | | | | | 79,035 | | | | 4,542,911 | |
Shares redeemed | | | | | | | | | | | (744,776 | ) | | | (42,891,767 | ) |
Net increase (decrease) | | | | | | | | | | | 1,717,827 | | | $ | 101,158,234 | |
Year ended October 31, 2016 | | | | | | | | | | | | | | | | |
Shares sold | | | | | | | | | | | 993,588 | | | $ | 51,685,865 | |
Shares issued in reinvestment of distributions | | | | | | | | | | | 94,970 | | | | 4,353,446 | |
Shares redeemed | | | | | | | | | | | (325,163 | ) | | | (16,288,954 | ) |
Net increase (decrease) | | | | | | | | | | | 763,395 | | | $ | 39,750,357 | |
Advisor Class Shares: | | | | | | | | | | | | | | | | |
Year ended October 31, 2017 | | | | | | | | | | | | | | | | |
Shares sold | | | 559,480 | | | $ | 8,859,315 | | | | 4,646,503 | | | $ | 267,144,603 | |
Shares issued in reinvestment of distributions | | | 8,156 | | | | 125,195 | | | | 813,656 | | | | 46,809,648 | |
Shares redeemed | | | (405,446 | ) | | | (6,476,616 | ) | | | (12,670,988 | ) | | | (728,011,189 | ) |
Net increase (decrease) | | | 162,190 | | | $ | 2,507,894 | | | | (7,210,829 | ) | | $ | (414,056,938 | ) |
Year ended October 31, 2016 | | | | | | | | | | | | | | | | |
Shares sold | | | 290,876 | | | $ | 4,276,186 | | | | 8,800,748 | | | $ | 461,859,393 | |
Shares issued in reinvestment of distributions | | | 27,119 | | | | 365,015 | | | | 1,240,446 | | | | 56,948,853 | |
Shares issued on reorganization | | | — | | | | — | | | | 57,090 | | | | 2,515,323 | |
Shares redeemed | | | (216,129 | ) | | | (3,153,697 | ) | | | (5,268,076 | ) | | | (259,068,605 | ) |
Net increase (decrease) | | | 101,866 | | | $ | 1,487,504 | | | | 4,830,208 | | | $ | 262,254,964 | |
3. Transactions with Affiliates
Franklin Resources, Inc. is the holding company for various subsidiaries that together are referred to as Franklin Templeton Investments. Certain officers and trustees of the Trust are also officers and/or directors of the following subsidiaries:
| | |
| Subsidiary | | Affiliation |
| Franklin Advisory Services, LLC (Advisory Services) | | Investment manager |
| Franklin Templeton Services, LLC (FT Services) | | Administrative manager |
| Franklin Templeton Distributors, Inc. (Distributors) | | Principal underwriter |
| Franklin Templeton Investor Services, LLC (Investor Services) | | Transfer agent |
| | | | | | |
| franklintempleton.com | | Annual Report | | | 77 | |
FRANKLIN VALUE INVESTORS TRUST
NOTES TO FINANCIAL STATEMENTS
3. Transactions with Affiliates (continued)
a. Management Fees
Franklin Balance Sheet Investment Fund pays an investment management fee to Advisory Services based on the average daily net assets of the Fund as follows:
| | |
| Annualized Fee Rate | | Net Assets |
| 0.625% | | Up to and including $100 million |
| 0.500% | | Over $100 million, up to and including $250 million |
| 0.450% | | Over $250 million, up to and including $7.5 billion |
| 0.440% | | Over $7.5 billion, up to and including $10 billion |
| 0.430% | | Over $10 billion, up to and including $12.5 billion |
| 0.420% | | Over $12.5 billion, up to and including $15 billion |
| 0.400% | | In excess of $15 billion |
Franklin MicroCap Value Fund pays an investment management fee to Advisory Services of 0.75% per year of the average daily net assets of the Fund.
Franklin MidCap Value Fund pays an investment management fee to Advisory Services based on the average daily net assets of the Fund as follows:
| | |
| Annualized Fee Rate | | Net Assets |
| 0.950% | | Up to and including $500 million |
| 0.850% | | Over $500 million, up to and including $1 billion |
| 0.800% | | Over $1 billion, up to and including $1.5 billion |
| 0.750% | | Over $1.5 billion, up to and including $6.5 billion |
| 0.725% | | Over $6.5 billion, up to and including $11.5 billion |
| 0.700% | | Over $11.5 billion, up to and including $16.5 billion |
| 0.690% | | Over $16.5 billion, up to and including $19 billion |
| 0.680% | | Over $19 billion, up to and including $21.5 billion |
| 0.670% | | In excess of $21.5 billion |
Franklin Small Cap Value Fund pays an investment management fee to Advisory Services based on the average daily net assets of the Fund as follows:
| | |
| Annualized Fee Rate | | Net Assets |
| 0.750% | | Up to and including $500 million |
| 0.625% | | Over $500 million, up to and including $1 billion |
| 0.500% | | Over $1 billion, up to and including $5 billion |
| 0.490% | | In excess of $5 billion |
For the year ended October 31, 2017, each Fund’s effective investment management fee rate based on average daily net assets was as follows:
| | | | | | | | | | | | | | |
Franklin Balance
Sheet
Investment Fund | | | Franklin MicroCap
Value Fund | | | Franklin MidCap
Value Fund | | | Franklin Small
Cap
Value Fund | |
| | 0.474% | | | | 0.750% | | | | 0.950% | | | | 0.568% | |
| | | | |
| 78 | | Annual Report | | franklintempleton.com |
FRANKLIN VALUE INVESTORS TRUST
NOTES TO FINANCIAL STATEMENTS
b. Administrative Fees
Under an agreement with Advisory Services, FT Services provides administrative services to the Funds. The fee is paid by Advisory Services based on the Funds’ average daily net assets and is not an additional expense of the Funds.
c. Distribution Fees
The Board has adopted distribution plans for each share class, with the exception of Class R6 and Advisor Class shares, pursuant to Rule 12b-1 under the 1940 Act. Under the Funds’ Class A reimbursement distribution plans, the Funds reimburse Distributors for costs incurred in connection with the servicing, sale and distribution of each Fund’s shares up to the maximum annual plan rate. Under the Class A reimbursement distribution plans, costs exceeding the maximum for the current plan year cannot be reimbursed in subsequent periods. In addition, under the Funds’ Class C and R compensation distribution plans, the Funds pay Distributors for costs incurred in connection with the servicing, sale and distribution of each Fund’s shares up to the maximum annual plan rate for each class. The plan year, for purposes of monitoring compliance with the maximum annual plan rates, is February 1 through January 31 for each Fund.
The maximum annual plan rates, based on the average daily net assets, for each class, are as follows:
| | | | | | | | | | | | | | | | |
| | | Franklin Balance Sheet
Investment Fund | | | Franklin MicroCap
Value Fund | | | Franklin MidCap
Value Fund | | | Franklin Small Cap
Value Fund | |
| Reimbursement Plans: | | | | | | | | | | | | | | | | |
Class A | | | 0.25% | | | | 0.25% | | | | 0.35% | | | | 0.35% | |
| Compensation Plans: | | | | | | | | | | | | | | | | |
Class C | | | 1.00% | | | | — | | | | 1.00% | | | | 1.00% | |
Class R | | | 0.50% | | | | — | | | | 0.50% | | | | 0.50% | |
For Franklin MidCap Value Fund and Franklin Small Cap Value Fund, the Board has set the current rate at 0.25% per year for Class A shares until further notice and approval by the Board.
d. Sales Charges/Underwriting Agreements
Front-end sales charges and contingent deferred sales charges (CDSC) do not represent expenses of the Funds. These charges are deducted from the proceeds of sales of fund shares prior to investment or from redemption proceeds prior to remittance, as applicable. Distributors has advised the Funds of the following commission transactions related to the sales and redemptions of the Funds’ shares for the year:
| | | | | | | | | | | | | | | | |
| | | Franklin Balance Sheet
Investment Fund | | | Franklin MicroCap
Value Fund | | | Franklin MidCap
Value Fund | | | Franklin Small Cap
Value Fund | |
Sales charges retained net of commissions paid to unaffiliated brokers/dealers | | | $213,083 | | | | $9,638 | | | | $80,691 | | | | $395,756 | |
CDSC retained | | | $ 19,379 | | | | $ — | | | | $ 2,859 | | | | $ 18,075 | |
e. Transfer Agent Fees
Each class of shares, except for Class R6, pays transfer agent fees to Investor Services for its performance of shareholder servicing obligations and reimburses Investor Services for out of pocket expenses incurred, including shareholder servicing fees paid to third parties. These fees are allocated daily based upon their relative proportion of such classes’ aggregate net assets. Class R6 pays Investor Services transfer agent fees specific to that class.
| | | | | | |
| franklintempleton.com | | Annual Report | | | 79 | |
FRANKLIN VALUE INVESTORS TRUST
NOTES TO FINANCIAL STATEMENTS
3. Transactions with Affiliates (continued)
e. Transfer Agent Fees (continued)
For the year ended October 31, 2017, the Funds paid transfer agent fees as noted in the Statements of Operations of which the following amounts were retained by Investor Services:
| | | | | | | | | | | | | | | | |
| | | Franklin Balance Sheet
Investment Fund | | | Franklin MicroCap
Value Fund | | | Franklin MidCap
Value Fund | | | Franklin Small Cap
Value Fund | |
Transfer agent fees | | | $678,418 | | | | $141,603 | | | | $180,926 | | | | $2,098,069 | |
f. Investments in Affiliated Management Investment Companies
Certain or all Funds invest in one or more affiliated management investment companies for purposes other than exercising a controlling influence over the management or policies. Management fees paid by the Funds are waived on assets invested in the affiliated management investment companies, as noted in the Statements of Operations, in an amount not to exceed the management and administrative fees paid directly or indirectly by each affiliate. Prior to November 1, 2013, the waiver was accounted for as a reduction to management fees. During the year ended October 31, 2017, investments in affiliated management investment companies were as follows:
| | | | | | | | | | | | | | | | | | | | | | | | | | | | | | | | |
| | | Number of
Shares Held
at Beginning
of Year | | | Gross
Additions | | | Gross
Reductions | | | Number of
Shares
Held at End
of Year | | | Value
at End
of Year | | | Dividend
Income | | | Realized
Gain (Loss) | | | Net Change in
Unrealized
Appreciation
(Depreciation) | |
Franklin Balance Sheet Investment Fund | | | | | | | | | | | | | | | | | | | | | | | | | | | | | | | | |
Non-Controlled Affiliates | | | | | | | | | | | | | | | | | | | | | | | | | | | | | | | | |
Institutional Fiduciary Trust Money Market Portfolio, 0.69% | | | 164,192,937 | | | | 168,501,783 | | | | (199,564,256 | ) | | | 133,130,464 | | | | $133,130,464 | | | | $597,007 | | | | $— | | | | $— | |
Franklin MicroCap Value Fund | | | | | | | | | | | | | | | | | | | | | | | | | | | | | | | | |
Non-Controlled Affiliates | | | | | | | | | | | | | | | | | | | | | | | | | | | | | | | | |
Institutional Fiduciary Trust Money Market Portfolio, 0.69% | | | 8,048,646 | | | | 49,236,773 | | | | (45,696,882 | ) | | | 11,588,537 | | | | $ 11,588,537 | | | | $ 37,759 | | | | $— | | | | $— | |
Franklin MidCap Value Fund | | | | | | | | | | | | | | | | | | | | | | | | | | | | | | | | |
Non-Controlled Affiliates | | | | | | | | | | | | | | | | | | | | | | | | | | | | | | | | |
Institutional Fiduciary Trust Money Market Portfolio, 0.69% | | | 4,347,627 | | | | 58,307,478 | | | | (57,854,247 | ) | | | 4,800,858 | | | | $ 4,800,858 | | | | $ 21,884 | | | | $— | | | | $— | |
Franklin Small Cap Value Fund | | | | | | | | | | | | | | | | | | | | | | | | | | | | | | | | |
Non-Controlled Affiliates | | | | | | | | | | | | | | | | | | | | | | | | | | | | | | | | |
Institutional Fiduciary Trust Money Market Portfolio, 0.69% | | | 279,727,587 | | | | 685,269,440 | | | | (923,835,157 | ) | | | 41,161,870 | | | | $ 41,161,870 | | | | $476,281 | | | | $— | | | | $— | |
g. Waiver and Expense Reimbursements
Advisory Services has contractually agreed in advance to waive or limit its fees and to assume as its own expense certain expenses otherwise payable by Franklin MidCap Value Fund so that the expenses (excluding distribution fees, and acquired fund fees and expenses) for each class of the Fund does not exceed 1.05% based on the average net assets of each class (other than certain non-routine expenses or costs, including those relating to litigation, indemnification, reorganizations, and liquidations) until February 28, 2018. Total expenses waived or paid are not subject to recapture subsequent to the Fund’s fiscal year end.
For Franklin Balance Sheet Investment Fund, Franklin MicroCap Value Fund and Franklin Small Cap Value Fund, Investor Services has voluntarily agreed in advance to waive or limit its fees so that the Class R6 transfer agent fees do not exceed 0.01%. Investor Services may discontinue this waiver in the future. For Franklin MicroCap Value Fund and Franklin Small Cap Value Fund, there were no Class R6 transfer agent fees waived during the year ended October 31, 2017.
| | | | |
| 80 | | Annual Report | | franklintempleton.com |
FRANKLIN VALUE INVESTORS TRUST
NOTES TO FINANCIAL STATEMENTS
4. Expense Offset Arrangement
The Funds have entered into an arrangement with their custodian whereby credits realized as a result of uninvested cash balances are used to reduce a portion of the Funds’ custodian expenses. During the year ended October 31, 2017, the custodian fees were reduced as noted in the Statements of Operations.
5. Income Taxes
The tax character of distributions paid during the years ended October 31, 2017 and 2016, was as follows:
| | | | | | | | | | | | | | | | | | | | | | | | |
| | | Franklin Balance Sheet
Investment Fund | | | Franklin MicroCap
Value Fund | | | Franklin MidCap
Value Fund | |
| | | | | | |
| | | 2017 | | | 2016 | | | 2017 | | | 2016 | | | 2017 | | | 2016 | |
| | | | | | |
Distributions paid from: | | | | | | | | | | | | | | | | | | | | | | | | |
Ordinary income | | | $ 4,685,059 | | | | $ 6,858,733 | | | | $ 1,686,388 | | | $ | — | | | $ | 1,097,556 | | | $ | 960,569 | |
Long term capital gain | | | 60,964,559 | | | | 149,301,399 | | | | 29,235,162 | | | | 38,811,759 | | | | 1,986,743 | | | | 12,114,920 | |
| | | $ 65,649,618 | | | | $ 156,160,132 | | | | $30,921,550 | | | $ | 38,811,759 | | | $ | 3,084,299 | | | $ | 13,075,489 | |
| | | | | | | | |
| | | Franklin Small Cap
Value Fund | |
| | |
| | | 2017 | | | 2016 | |
Distributions paid from: | | | | | | | | |
Ordinary income | | $ | 7,983,427 | | | $ | 12,027,789 | |
Long term capital gain | | | 130,972,171 | | | | 205,977,476 | |
| | $ | 138,955,598 | | | $ | 218,005,265 | |
At October 31, 2017, the cost of investments, net unrealized appreciation (depreciation), undistributed ordinary income and undistributed long term capital gains for income tax purposes were as follows:
| | | | | | | | | | | | | | | | |
| | | Franklin Balance Sheet
Investment Fund | | | Franklin MicroCap
Value Fund | | | Franklin MidCap
Value Fund | | | Franklin Small Cap
Value Fund | |
| | | | |
Cost of investments | | | $729,865,793 | | | | $198,823,478 | | | | $152,264,751 | | | | $1,806,946,429 | |
| | | | |
Unrealized appreciation | | | $295,032,895 | | | | $162,305,808 | | | | $ 43,698,850 | | | | $ 707,100,236 | |
Unrealized depreciation | | | (16,763,515 | ) | | | (19,753,340 | ) | | | (9,857,391 | ) | | | (27,894,130 | ) |
| | | | |
Net unrealized appreciation (depreciation) | | | $278,269,380 | | | | $142,552,468 | | | | $ 33,841,459 | | | | $ 679,206,106 | |
| | | | |
Undistributed ordinary income | | | $ 14,531,092 | | | | $ 496,716 | | | | $ 2,129,236 | | | | $ 44,509,595 | |
Undistributed long term capital gains | | | 58,928,792 | | | | 23,879,153 | | | | 8,256,440 | | | | 175,312,519 | |
| | | | |
Distributable earnings | | | $ 73,459,884 | | | | $ 24,375,869 | | | | $ 10,385,676 | | | | $ 219,822,114 | |
Differences between income and/or capital gains as determined on a book basis and a tax basis are primarily due to differing treatments of non-deductible expenses and wash sales.
The Funds utilized a tax accounting practice to treat a portion of the proceeds from capital shares redeemed as a distribution from realized capital gains.
| | | | | | |
| franklintempleton.com | | Annual Report | | | 81 | |
FRANKLIN VALUE INVESTORS TRUST
NOTES TO FINANCIAL STATEMENTS
6. Investment Transactions
Purchases and sales of investments (excluding short term securities) for the year ended October 31, 2017, were as follows:
| | | | | | | | | | | | | | | | |
| | | Franklin Balance Sheet
Investment Fund | | | Franklin MicroCap
Value Fund | | | Franklin MidCap
Value Fund | | | Franklin Small Cap
Value Fund | |
| | | | |
Purchases | | | $211,801,842 | | | | $28,646,958 | | | | $70,142,462 | | | | $ 858,621,302 | |
Sales | | | $320,429,135 | | | | $83,124,510 | | | | $70,575,525 | | | | $1,133,316,575 | |
7. Holdings of 5% Voting Securities of Portfolio Companies
The 1940 Act defines “affiliated companies” to include investments in portfolio companies in which a fund owns 5% or more of the outstanding voting securities. During the year ended October 31, 2017, investments in “affiliated companies” were as follows:
| | | | | | | | | | | | | | | | | | | | | | | | | | | | | | | | |
| Name of Issuer | | Number of
Shares Held
at Beginning
of Year | | | Gross
Additions | | | Gross
Reductions | | | Number of
Shares Held
at End
of Year | | | Value
at End
of Year | | | Dividend
Income | | | Realized
Gain (Loss) | | | Net Change in
Unrealized
Appreciation
(Depreciation) | |
| | | | | | | | |
Franklin Balance Sheet Investment Fund | | | | | | | | | | | | | | | | | | | | | | | | | | | | | | | | |
Non-Controlled Affiliates | | | | | | | | | | | | | | | | | | | | | | | | | | | | | | | | |
Trinity Place Holdings Inc. (Value is —% of Net Assets) | | | 1,342,554 | | | | — | | | | (842,720 | ) | | | 499,834 | | | | $ — | a | | | $ — | | | | $ (407,214) | | | | $ —a | |
| | | | | | | | |
Franklin MicroCap Value Fund | | | | | | | | | | | | | | | | | | | | | | | | | | | | | | | | |
Non-Controlled Affiliates | | | | | | | | | | | | | | | | | | | | | | | | | | | | | | | | |
Continental Materials Corp. | | | 116,914 | | | | — | | | | (8,102 | ) | | | 108,812 | | | | $ 2,094,631 | | | | $ — | | | | $ 17,487 | | | | $ (298,658 | ) |
Delta Apparel Inc. | | | 455,100 | | | | — | | | | (42,050 | ) | | | 413,050 | | | | 8,645,136 | | | | — | | | | 650,736 | | | | 1,305,500 | |
Full House Resorts Inc. | | | 1,945,304 | | | | — | | | | (21,784 | ) | | | 1,923,520 | | | | 5,443,562 | | | | — | | | | (32,274 | ) | | | 2,348,196 | |
Global Power Equipment Group Inc. | | | 1,275,000 | | | | — | | | | — | | | | 1,275,000 | | | | 5,163,750 | | | | — | | | | — | | | | 446,250 | |
Hardinge Inc. | | | 764,000 | | | | — | | | | (211,500 | ) | | | 552,500 | | | | — | a | | | 42,980 | | | | 351,959 | | | | — | a |
Northeast Bancorp | | | 459,500 | | | | — | | | | (141,935 | ) | | | 317,565 | | | | — | a | | | 17,530 | | | | 2,029,980 | | | | — | a |
Origen Financial Inc. | | | 1,900,000 | | | | — | | | | — | | | | 1,900,000 | | | | 162,070 | | | | — | | | | — | | | | (85,405 | ) |
| | | | |
Total Affiliated Securities (Value is 6.3% of Net Assets) | | | | $21,509,149 | | | | $ 60,510 | | | | $3,017,888 | | | | $3,715,883 | |
| | | | | | | | |
Franklin Small Cap Value Fund | | | | | | | | | | | | | | | | | | | | | | | | | | | | | | | | |
Non-Controlled Affiliates | | | | | | | | | | | | | | | | | | | | | | | | | | | | | | | | |
AAR Corp. | | | 2,010,507 | | | | 345,000 | | | | (764,456 | ) | | | 1,591,051 | | | | $ — | a | | | $601,858 | | | | $5,437,150 | | | | $ — | a |
Landec Corp. | | | 1,423,100 | | | | — | | | | — | | | | 1,423,100 | | | | 18,856,075 | | | | — | | | | — | | | | — | |
| | | | |
Total Affiliated Securities (Value is 0.7% of Net Assets) | | | | $18,856,075 | | | | $601,858 | | | | $5,437,150 | | | | $ — | |
aAs of October 31, 2017, no longer an affiliate. | |
8. Reorganization
On December 1, 2017, Franklin Small Cap Value Fund (Surviving Fund), pursuant to a plan of reorganization approved on October 27, 2017, by shareholders of Franklin MidCap Value Fund (Acquired Fund), acquired 100% of the Acquired Fund’s net assets, primarily made up of investment securities, which included $19,471,853 of unrealized appreciation, through a tax-free exchange of 3,029,475 shares of the Acquired Fund (valued at $162,397,044). Immediately after the completion of the reorganization, the combined net assets of the Surviving Fund were $2,811,180,553.
| | | | |
| 82 | | Annual Report | | franklintempleton.com |
FRANKLIN VALUE INVESTORS TRUST
NOTES TO FINANCIAL STATEMENTS
The primary purpose for the reorganization was to combine the Acquired Fund with a larger fund that had lower annual fund operating expense ratios, better overall historical performance, same investment goals and similar principal investment strategies/risks. The estimated cost of the reorganization was $222,400 of which the Surviving Fund and the Acquired Fund each paid 25% and Advisory Services paid 50%. The allocated portion of the Surviving Fund’s reorganization expenses are included with transfer agent fees and professional fees expenses in the Statement of Operations.
Assuming the reorganization had been completed on November 1, 2016, the Surviving Fund’s pro forma results of operations, would have been as follows:
| | | | | | | | | | | | |
| Period | | Net Investment
Income | | | Net Realized
and Unrealized
Gain (Loss) | | | Net Increase
(Decrease) in Net
Assets from
Operations | |
For the period November 1, 2016, through October 31, 2017 | | | $16,887,883 | | | | $493,732,927 | | | | $510,620,810 | |
Subsequent to the reorganization, the Fund has been managed as a single entity. Accordingly, it is impracticable to identify the amount of net investment income attributable to the Acquired Fund’s assets after the completion of the reorganization.
9. Credit Facility
The Funds together with other U.S. registered and foreign investment funds (collectively, Borrowers), managed by Franklin Templeton Investments, are borrowers in a joint syndicated senior unsecured credit facility totaling $2 billion (Global Credit Facility) which matures on February 9, 2018. This Global Credit Facility provides a source of funds to the Borrowers for temporary and emergency purposes, including the ability to meet future unanticipated or unusually large redemption requests.
Under the terms of the Global Credit Facility, the Funds shall, in addition to interest charged on any borrowings made by the Funds and other costs incurred by the Funds, pay their share of fees and expenses incurred in connection with the implementation and maintenance of the Global Credit Facility, based upon their relative share of the aggregate net assets of all of the Borrowers, including an annual commitment fee of 0.15% based upon the unused portion of the Global Credit Facility. These fees are reflected in other expenses in the Statements of Operations. During the year ended October 31, 2017, the Funds did not use the Global Credit Facility.
10. Fair Value Measurements
The Funds follow a fair value hierarchy that distinguishes between market data obtained from independent sources (observable inputs) and the Funds’ own market assumptions (unobservable inputs). These inputs are used in determining the value of the Funds’ financial instruments and are summarized in the following fair value hierarchy:
| | • | | Level 1 – quoted prices in active markets for identical financial instruments |
| | • | | Level 2 – other significant observable inputs (including quoted prices for similar financial instruments, interest rates, prepayment speed, credit risk, etc.) |
| | • | | Level 3 – significant unobservable inputs (including the Funds’ own assumptions in determining the fair value of financial instruments) |
The input levels are not necessarily an indication of the risk or liquidity associated with financial instruments at that level.
For movements between the levels within the fair value hierarchy, the Funds have adopted a policy of recognizing the transfers as of the date of the underlying event which caused the movement.
| | | | | | |
| franklintempleton.com | | Annual Report | | | 83 | |
FRANKLIN VALUE INVESTORS TRUST
NOTES TO FINANCIAL STATEMENTS
10. Fair Value Measurements (continued)
A summary of inputs used as of October 31, 2017, in valuing the Funds’ assets carried at fair value, is as follows:
| | | | | | | | | | | | | | | | |
| | | Level 1 | | | Level 2 | | | Level 3 | | | Total | |
Franklin Balance Sheet Investment Fund | | | | | | | | | | | | | | | | |
Assets: | | | | | | | | | | | | | | | | |
Investments in Securities: | | | | | | | | | | | | | | | | |
Equity Investments:a | | | | | | | | | | | | | | | | |
Telecommunication Services | | $ | 26,760,354 | | | $ | 8,278,750 | | | $ | — | | | $ | 35,039,104 | |
All Other Equity Investmentsb | | | 838,427,180 | | | | — | | | | — | | | | 838,427,180 | |
Corporate Bonds | | | — | | | | 1,538,425 | | | | — | | | | 1,538,425 | |
Short Term Investments | | | 133,130,464 | | | | — | | | | — | | | | 133,130,464 | |
| | | | |
Total Investments in Securities | | $ | 998,317,998 | | | $ | 9,817,175 | | | $ | — | | | $ | 1,008,135,173 | |
| | | | |
| | | | |
Franklin MicroCap Value Fund | | | | | | | | | | | | | | | | |
Assets: | | | | | | | | | | | | | | | | |
Investments in Securities: | | | | | | | | | | | | | | | | |
Equity Investments: | | | | | | | | | | | | | | | | |
Food, Beverage & Tobacco | | $ | 13,821,650 | | | $ | 4,598,775 | | | $ | — | | | $ | 18,420,425 | |
Insurance | | | 4,852,410 | | | | 3,497,670 | | | | — | | | | 8,350,080 | |
All Other Equity Investmentsb | | | 303,016,904 | | | | — | | | | — | | | | 303,016,904 | |
Short Term Investments | | | 11,588,537 | | | | — | | | | — | | | | 11,588,537 | |
| | | | |
Total Investments in Securities | | $ | 333,279,501 | | | $ | 8,096,445 | | | $ | — | | | $ | 341,375,946 | |
| | | | |
| | | | |
Franklin MidCap Value Fund | | | | | | | | | | | | | | | | |
Assets: | | | | | | | | | | | | | | | | |
Investments in Securities: | | | | | | | | | | | | | | | | |
Equity Investmentsa,b | | $ | 181,305,352 | | | $ | — | | | $ | —c | | | $ | 181,305,352 | |
Short Term Investments | | | 4,800,858 | | | | — | | | | — | | | | 4,800,858 | |
| | | | |
Total Investments in Securities | | $ | 186,106,210 | | | $ | — | | | $ | — | | | $ | 186,106,210 | |
| | | | |
| | | | |
Franklin Small Cap Value Fund | | | | | | | | | | | | | | | | |
Assets: | | | | | | | | | | | | | | | | |
Investments in Securities: | | | | | | | | | | | | | | | | |
Equity Investmentsb | | $ | 2,422,773,248 | | | $ | — | | | $ | — | | | $ | 2,422,773,248 | |
Corporate Bonds | | | — | | | | 22,217,417 | | | | — | | | | 22,217,417 | |
Short Term Investments | | | 41,161,870 | | | | — | | | | — | | | | 41,161,870 | |
| | | | |
Total Investments in Securities | | $ | 2,463,935,118 | | | $ | 22,217,417 | | | $ | — | | | $ | 2,486,152,535 | |
| | | | |
aIncludes common, convertible preferred stocks and management investment companies as well as other equity interests.
bFor detailed categories, see the accompanying Statements of Investments.
cIncludes securities determined to have no value at October 31, 2017.
A reconciliation of assets in which Level 3 inputs are used in determining fair value is presented when there are significant Level 3 financial instruments at the beginning and/or end of the year.
11. New Accounting Pronouncements
In March 2017, the Financial Accounting Standards Board (FASB) issued Accounting Standards Update (ASU) No. 2017-08, Receivables—Nonrefundable Fees and Other Costs (Subtopic 310-20): Premium Amortization on Purchased Callable Debt Securities. The amendments in the ASU shorten the amortization period for certain callable debt securities acquired at a premium, to be amortized to the earliest call date. The ASU does not require an accounting change for securities acquired at a discount, which continues to be amortized to maturity. The ASU is effective for fiscal years and interim periods within those fiscal years beginning after December 15, 2018. Management is currently evaluating the impact, if any, of applying this provision.
| | | | |
| 84 | | Annual Report | | franklintempleton.com |
FRANKLIN VALUE INVESTORS TRUST
NOTES TO FINANCIAL STATEMENTS
12. Subsequent Events
The Funds have evaluated subsequent events through the issuance of the financial statements and determined that no events have occurred that require disclosure other than those already disclosed in the financial statements.
Abbreviations
| | | | |
| Selected Portfolio | | |
| ADR | | American Depositary Receipt | | |
| ETF | | Exchange Traded Fund | | |
| REIT | | Real Estate Investment Trust | | |
| | | | | | |
| franklintempleton.com | | Annual Report | | | 85 | |
FRANKLIN VALUE INVESTORS TRUST
Report of Independent Registered Public Accounting Firm
To the Board of Trustees of Franklin Value Investors Trust and Shareholders of the Franklin Balance Sheet Investment Fund, Franklin MicroCap Value Fund, Franklin MidCap Value Fund, and Franklin Small Cap Value Fund:
In our opinion, the accompanying statements of assets and liabilities, including the statements of investments, and the related statements of operations and of changes in net assets and the financial highlights present fairly, in all material respects, the financial position of Franklin Balance Sheet Investment Fund, Franklin MicroCap Value Fund, Franklin MidCap Value Fund, and Franklin Small Cap Value Fund (the “Funds”) as of October 31, 2017, the results of each of their operations for the year then ended, the changes in each of their net assets for each of the two years in the period then ended and the financial highlights for each of the periods indicated, in conformity with accounting principles generally accepted in the United States of America. These financial statements and financial highlights (hereafter referred to as “financial statements”) are the responsibility of the Funds’ management. Our responsibility is to express an opinion on these financial statements based on our audits. We conducted our audits of these financial statements in accordance with the standards of the Public Company Accounting Oversight Board (United States). Those standards require that we plan and perform the audit to obtain reasonable assurance about whether the financial statements are free of material misstatement. An audit includes examining, on a test basis, evidence supporting the amounts and disclosures in the financial statements, assessing the accounting principles used and significant estimates made by management, and evaluating the overall financial statement presentation. We believe that our audits, which included confirmation of securities as of October 31, 2017 by correspondence with the custodian, transfer agent and brokers, provide a reasonable basis for our opinion.
PricewaterhouseCoopers LLP
San Francisco, California
December 18, 2017
| | | | |
| 86 | | Annual Report | | franklintempleton.com |
FRANKLIN VALUE INVESTORS TRUST
Tax Information (unaudited)
Under Section 852(b)(3)(C) of the Internal Revenue Code (Code), the Funds hereby report the maximum amount allowable but no less than the following amounts as long term capital gain dividends for the fiscal year ended October 31, 2017:
| | | | | | | | | | |
| | | Franklin Balance Sheet Investment Fund | | Franklin MicroCap Value Fund | | Franklin MidCap Value Fund | | Franklin Small Cap Value Fund | | |
| | $73,023,316 | | $31,636,591 | | $3,081,388 | | $186,633,335 | | |
Under Section 871(k)(2)(C) of the Code, the Funds hereby report the maximum amount allowable but no less than the following amounts as short term capital gain dividends for purposes of the tax imposed under Section 871(a)(1)(A) of the Code for the fiscal year ended October 31, 2017:
| | | | | | | | | | |
| | | Franklin Balance Sheet Investment Fund | | Franklin MicroCap Value Fund | | Franklin MidCap Value Fund | | Franklin Small Cap Value Fund | | |
| | $ — | | $539,858 | | $ — | | $ — | | |
Under Section 854(b)(1)(A) of the Code, the Funds hereby report the following percentage amounts of the ordinary income dividends as income qualifying for the dividends received deduction for the fiscal year ended October 31, 2017:
| | | | | | | | | | |
| | | Franklin Balance Sheet Investment Fund | | Franklin MicroCap Value Fund | | Franklin MidCap Value Fund | | Franklin Small Cap Value Fund | | |
| | 100% | | 100% | | 100% | | 100% | | |
Under Section 854(b)(1)(B) of the Code, the Funds hereby report the maximum amount allowable but no less than the following amounts as qualified dividends for purposes of the maximum rate under Section 1(h)(11) of the Code for the fiscal year ended October 31, 2017:
| | | | | | | | | | |
| | | Franklin Balance Sheet Investment Fund | | Franklin MicroCap Value Fund | | Franklin MidCap Value Fund | | Franklin Small Cap Value Fund | | |
| | $16,588,466 | | $3,667,973 | | $2,409,945 | | $39,085,504 | | |
Distributions, including qualified dividend income, paid during calendar year 2017 will be reported to shareholders on Form 1099-DIV by mid-February 2018. Shareholders are advised to check with their tax advisors for information on the treatment of these amounts on their individual income tax returns.
| | | | | | |
| franklintempleton.com | | Annual Report | | | 87 | |
FRANKLIN VALUE INVESTORS TRUST
Board Members and Officers
The name, year of birth and address of the officers and board members, as well as their affiliations, positions held with the Trust, principal occupations during at least the past five years and number of US registered portfolios overseen in the Franklin Templeton Investments fund complex, are shown below. Generally, each board member serves until that person’s successor is elected and qualified.
Independent Board Members
| | | | | | | | |
Name, Year of Birth and Address | | Position | | Length of Time Served | | Number of Portfolios in
Fund Complex Overseen
by Board Member* | | Other Directorships Held During at Least the Past 5 Years |
| Edward I. Altman, Ph.D. (1941) | | Trustee | | Since 2015 | | 16 | | None |
| One Franklin Parkway | | | | | | | | |
San Mateo, CA 94403-1906 | | | | | | | | |
| Principal Occupation During at Least the Past 5 Years: |
| Max L. Heine Professor of Finance, Emeritus and Director of The Credit and Debt Markets Research Program, Salomon Center, Stern School of Business, New York University; editor and author of numerous financial publications; financial consultant; an adviser to numerous financial and publishing organizations; and formerly, Vice Director, Salomon Center, Stern School of Business, New York University. |
| | | | |
Ann Torre Bates (1958) One Franklin Parkway San Mateo, CA 94403-1906 | | Trustee | | Since 2015 | | 42 | | Ares Capital Corporation (specialty finance company) (2010-present), United Natural Foods, Inc. (distributor of natural, organic and specialty foods) (2013-present), Allied Capital Corporation (financial services) (2003-2010), SLM Corporation (Sallie Mae) (1997-2014) and Navient Corporation (loan management, servicing and asset recovery) (2014-2016). |
| Principal Occupation During at Least the Past 5 Years: |
| Director of various companies; and formerly, Executive Vice President and Chief Financial Officer, NHP Incorporated (manager of multifamily housing) (1995-1997); and Vice President and Treasurer, US Airways, Inc. (until 1995). |
| | | | |
Burton J. Greenwald (1929) One Franklin Parkway San Mateo, CA 94403-1906 | | Vice Chairman and Trustee | | Vice Chairman since 2015 and Trustee since 2001 | | 16 | | Franklin Templeton Emerging Markets Debt Opportunities Fund PLC (1999-present) and Fiduciary International Ireland Limited (1999-2015). |
| Principal Occupation During at Least the Past 5 Years: |
| Managing Director, B.J. Greenwald Associates (management consultants to the financial services industry); and formerly, Chairman, Fiduciary Trust International Funds; Executive Vice President, L.F. Rothschild Fund Management, Inc.; President and Director, Merit Mutual Funds; President, Underwriting Division and Director, National Securities & Research Corporation; Governor, Investment Company Institute; and Chairman, ICI Public Information Committee. |
| | | | |
| Jan Hopkins Trachtman (1947) | | Trustee | | Since 2015 | | 16 | | None |
| One Franklin Parkway | | | | | | | | |
San Mateo, CA 94403-1906 | | | | | | | | |
| Principal Occupation During at Least the Past 5 Years: |
| President and Founder, The Jan Hopkins Group (communications consulting firm); serves on Advisory Board of Knight Bagehot Fellowship; and formerly, President, Economic Club of New York (2007-2015); Anchor/Correspondent, CNN Financial News (until 2003); Managing Director and Head of Client Communications, Citigroup Private Bank (until 2005); Off-Air Reporter, ABC News’ World News Tonight; and Editor, CBS Network News. |
| | | | |
| Keith E. Mitchell (1954) | | Trustee | | Since 2015 | | 16 | | None |
| One Franklin Parkway | | | | | | | | |
San Mateo, CA 94403-1906 | | | | | | | | |
| Principal Occupation During at Least the Past 5 Years: |
| Director of various boards of asset management firms; and formerly, Managing Member, Mitchell, Hartley & Bechtel Advisers, LLC (formerly, Mitchell Advisers, LLC) (advisory firm) (2003-2015) and Managing Director, Putman Lovell NBF. |
| | | | |
| 88 | | Annual Report | | franklintempleton.com |
FRANKLIN VALUE INVESTORS TRUST
Independent Board Members (continued)
| | | | | | | | |
Name, Year of Birth and Address | | Position | | Length of Time Served | | Number of Portfolios in
Fund Complex Overseen
by Board Member* | | Other Directorships Held During at Least the Past 5 Years |
David W. Niemiec (1949) One Franklin Parkway San Mateo, CA 94403-1906 | | Trustee | | Since 2011 | | 42 | | Hess Midstream Partners LP (oil and gas midstream infrastructure) (April 2017-present). |
| Principal Occupation During at Least the Past 5 Years: | | |
| Advisor, Saratoga Partners (private equity fund); and formerly, Managing Director, Saratoga Partners (1998-2001) and SBC Warburg Dillon Read (investment banking) (1997-1998); Vice Chairman, Dillon, Read & Co. Inc. (investment banking) (1991-1997); and Chief Financial Officer, Dillon, Read & Co. Inc. (1982-1997). |
| | | | |
| Charles Rubens II (1930) | | Trustee | | Since 1989 | | 16 | | None |
| One Franklin Parkway | | | | | | | | |
San Mateo, CA 94403-1906 | | | | | | | | |
Principal Occupation During at Least the Past 5 Years: Private investor and president of non-profit organizations; and formerly, an executive of Time, Inc.; and Trustee of Colorado College. |
| | | | |
Robert E. Wade (1946) One Franklin Parkway San Mateo, CA 94403-1906 | | Chairman of the Board and Trustee | | Chairman of the Board since 2015 and Trustee since 2004 | | 42 | | El Oro Ltd (investments) (2003-present). |
| Principal Occupation During at Least the Past 5 Years: |
| Attorney at law engaged in private practice as a sole practitioner (1972-2008) and member of various boards. |
| | | | |
| Gregory H. Williams (1943) | | Trustee | | Since 2008 | | 16 | | None |
| One Franklin Parkway | | | | | | | | |
San Mateo, CA 94403-1906 | | | | | | | | |
| Principal Occupation During at Least the Past 5 Years: |
| Private investor; Consultant; and formerly, President, University of Cincinnati (2009-2012); President, The City College of New York (2001-2009); Dean, College of Law, Ohio State University (1993-2001); and Associate Vice President, Academic Affairs and Professor of Law, University of Iowa (1977-1993). |
Interested Board Members and Officers
| | | | | | | | |
Name, Year of Birth and Address | | Position | | Length of Time Served | | Number of Portfolios in
Fund Complex Overseen
by Board Member* | | Other Directorships Held During at Least the Past 5 Years |
| | | | |
| **Gregory E. Johnson (1961) | | Trustee | | Since 2015 | | 155 | | None |
| One Franklin Parkway | | | | | | | | |
San Mateo, CA 94403-1906 | | | | | | | | |
| Principal Occupation During at Least the Past 5 Years: |
| Chairman of the Board, Member - Office of the Chairman, Director and Chief Executive Officer, Franklin Resources, Inc.; officer and/or director or trustee, as the case may be, of some of the other subsidiaries of Franklin Resources, Inc. and of 43 of the investment companies in Franklin Templeton Investments; Vice Chairman, Investment Company Institute; and formerly, President, Franklin Resources, Inc. (1994-2015). |
| | | | |
| **Jennifer M. Johnson (1964) | | Trustee | | Since 2015 | | 42 | | None |
| One Franklin Parkway | | | | | | | | |
San Mateo, CA 94403-1906 | | | | | | | | |
| Principal Occupation During at Least the Past 5 Years: |
| President and Chief Operating Officer, Franklin Resources, Inc.; officer and/or director or trustee, as the case may be, of some of the other subsidiaries of Franklin Resources, Inc. and of five of the investment companies in Franklin Templeton Investments; and formerly, Chief Operating Officer and Executive Vice President, Franklin Resources, Inc. (1994-2015); Executive Vice President of Operations and Technology, Franklin Resources, Inc. (2005-2010); and Senior Vice President, Franklin Resources, Inc. (2003-2005). |
| | | | | | |
| franklintempleton.com | | Annual Report | | | 89 | |
FRANKLIN VALUE INVESTORS TRUST
Interested Board Members and Officers (continued)
| | | | | | | | |
Name, Year of Birth and Address | | Position | | Length of Time Served | | Number of Portfolios in
Fund Complex Overseen
by Board Member* | | Other Directorships Held During at Least the Past 5 Years |
| | | | |
Alison E. Baur (1964) One Franklin Parkway San Mateo, CA 94403-1906 | | Vice President | | Since 2012 | | Not Applicable | | Not Applicable |
| Principal Occupation During at Least the Past 5 Years: | | |
| Deputy General Counsel, Franklin Templeton Investments; and officer of some of the other subsidiaries of Franklin Resources, Inc. and of 45 of the investment companies in Franklin Templeton Investments. |
| | | | |
| Aliya S. Gordon (1973) | | Vice President | | Since 2009 | | Not Applicable | | Not Applicable |
| One Franklin Parkway | | | | | | | | |
San Mateo, CA 94403-1906 | | | | | | | | |
| Principal Occupation During at Least the Past 5 Years: |
| Senior Associate General Counsel, Franklin Templeton Investments; and officer of 45 of the investment companies in Franklin Templeton Investments. |
| | | | |
Steven J. Gray (1955) One Franklin Parkway San Mateo, CA 94403-1906 | | Secretary and Vice President | | Secretary since 2005 and Vice President since 2009 | | Not Applicable | | Not Applicable |
| Principal Occupation During at Least the Past 5 Years: |
| Senior Associate General Counsel, Franklin Templeton Investments; Vice President, Franklin Templeton Distributors, Inc. FT AlphaParity, LLC; and officer of 45 of the investment companies in Franklin Templeton Investments. |
| | | | |
Matthew T. Hinkle (1971) One Franklin Parkway San Mateo, CA 94403-1906 | | Chief Executive Officer – Finance and Administration | | Since June 2017 | | Not Applicable | | Not Applicable |
| Principal Occupation During at Least the Past 5 Years: |
| Senior Vice President, Franklin Templeton Services, LLC; officer of 45 of the investment companies in Franklin Templeton Investments; and formerly, Vice President, Global Tax (2012-April 2017) and Treasurer/Assistant Treasurer, Franklin Templeton Investments (2009-2017). |
| | | | |
| Rupert H. Johnson, Jr. (1940) | | Vice President | | Since 1989 | | Not Applicable | | Not Applicable |
| One Franklin Parkway | | | | | | | | |
San Mateo, CA 94403-1906 | | | | | | | | |
| Principal Occupation During at Least the Past 5 Years: |
| Vice Chairman, Member - Office of the Chairman and Director, Franklin Resources, Inc.; Director, Franklin Advisers, Inc.; Senior Vice President, Franklin Advisory Services, LLC; and officer and/or director or trustee, as the case may be, of some of the other subsidiaries of Franklin Resources, Inc. and of 41 of the investment companies in Franklin Templeton Investments. |
| | | | |
Robert G. Kubilis (1973) 300 S.E. 2nd Street Fort Lauderdale, FL 33301-1923 | | Chief Financial Officer, Chief Accounting Officer and Treasurer | | Since 2012 | | Not Applicable | | Not Applicable |
| Principal Occupation During at Least the Past 5 Years: |
| Treasurer, U.S. Fund Administration & Reporting, Franklin Templeton Investments; and officer of 18 of the investment companies in Franklin Templeton Investments. |
| | | | |
Peter A. Langerman (1955) c/o Franklin Mutual Advisers, LLC 101 John F. Kennedy Parkway Short Hills, NJ 07078-2716 | | President and Chief Executive Officer – Investment Management | | Since July 2017 | | Not Applicable | | Not Applicable |
| Principal Occupation During at Least the Past 5 Years: |
| Chairman of the Board, Chief Executive Officer and President, Franklin Mutual Advisers, LLC; President and Chief Investment Officer, Franklin Advisory Services, LLC; and officer and/or director, as the case may be, of three of the investment companies in Franklin Templeton Investments. |
| | | | |
| 90 | | Annual Report | | franklintempleton.com |
FRANKLIN VALUE INVESTORS TRUST
Interested Board Members and Officers (continued)
| | | | | | | | |
Name, Year of Birth and Address | | Position | | Length of Time Served | | Number of Portfolios in
Fund Complex Overseen
by Board Member* | | Other Directorships Held During at Least the Past 5 Years |
| | | | |
Robert Lim (1948) One Franklin Parkway San Mateo, CA 94403-1906 | | Vice President – AML Compliance | | Since 2016 | | Not Applicable | | Not Applicable |
| Principal Occupation During at Least the Past 5 Years: |
| Vice President, Franklin Templeton Companies, LLC; Chief Compliance Officer, Franklin Templeton Distributors, Inc. and Franklin Templeton Investor Services, LLC; and officer of 45 of the investment companies in Franklin Templeton Investments. |
| | | | |
| Kimberly H. Novotny (1972) | | Vice President | | Since 2013 | | Not Applicable | | Not Applicable |
| 300 S.E. 2nd Street | | | | | | | | |
Fort Lauderdale, FL 33301-1923 | | | | | | | | |
| Principal Occupation During at Least the Past 5 Years: |
| Associate General Counsel, Franklin Templeton Investments; Vice President and Corporate Secretary, Fiduciary Trust International of the South; Vice President, Templeton Investment Counsel, LLC; Assistant Secretary, Franklin Resources, Inc.; and officer of 45 of the investment companies in Franklin Templeton Investments. |
| | | | |
Robert C. Rosselot (1960) 300 S.E. 2nd Street Fort Lauderdale, FL 33301-1923 | | Chief Compliance Officer | | Since 2013 | | Not Applicable | | Not Applicable |
| Principal Occupation During at Least the Past 5 Years: |
| Director, Global Compliance, Franklin Templeton Investments; Vice President, Franklin Templeton Companies, LLC; officer of 45 of the investment companies in Franklin Templeton Investments; and formerly, Senior Associate General Counsel, Franklin Templeton Investments (2007-2013); and Secretary and Vice President, Templeton Group of Funds (2004-2013). |
| | | | |
Karen L. Skidmore (1952) One Franklin Parkway San Mateo, CA 94403-1906 | | Vice President | | Since 2006 | | Not Applicable | | Not Applicable |
| Principal Occupation During at Least the Past 5 Years: |
| Senior Associate General Counsel, Franklin Templeton Investments; and officer of 45 of the investment companies in Franklin Templeton Investments. |
| | | | |
Navid J. Tofigh (1972) One Franklin Parkway San Mateo, CA 94403-1906 | | Vice President | | Since 2015 | | Not Applicable | | Not Applicable |
|
| Principal Occupation During at Least the Past 5 Years: |
| Associate General Counsel, Franklin Templeton Investments; and officer of 45 of the investment companies in Franklin Templeton Investments. |
| | | | |
Craig S. Tyle (1960) One Franklin Parkway San Mateo, CA 94403-1906 | | Vice President | | Since 2005 | | Not Applicable | | Not Applicable |
| Principal Occupation During at Least the Past 5 Years: |
| General Counsel and Executive Vice President, Franklin Resources, Inc.; and officer of some of the other subsidiaries of Franklin Resources, Inc. and of 45 of the investment companies in Franklin Templeton Investments. |
| | | | |
Lori A. Weber (1964) 300 S.E. 2nd Street Fort Lauderdale, FL 33301-1923 | | Vice President | | Since 2011 | | Not Applicable | | Not Applicable |
| Principal Occupation During at Least the Past 5 Years: |
| Senior Associate General Counsel, Franklin Templeton Investments; Assistant Secretary, Franklin Resources, Inc.; Vice President and Secretary, Templeton Investment Counsel, LLC; and officer of 45 of the investment companies in Franklin Templeton Investments. |
|
We base the number of portfolios on each separate series of the US registered investment companies within the Franklin Templeton Investments fund complex. These portfolios have a common investment manager or affiliated investment managers. **Gregory E. Johnson is considered to be an interested person of the Fund under the federal securities laws due to his position as an officer and director of Franklin Resources, Inc. (Resources), which is the parent company of the Fund’s investment manager and distributor. Jennifer M. Johnson is considered to be an interested person of the Fund under the federal securities laws due to her position as officer and director of Resources. Note 1: Rupert H. Johnson, Jr. is the uncle of Gregory E. Johnson and Jennifer M. Johnson. Gregory E. Johnson and Jennifer M. Johnson are siblings. |
| | | | | | |
| franklintempleton.com | | Annual Report | | | 91 | |
FRANKLIN VALUE INVESTORS TRUST
Interested Board Members and Officers (continued)
Note 2: Officer information is current as of the date of this report. It is possible that after this date, information about officers may change.
The Sarbanes-Oxley Act of 2002 and Rules adopted by the U.S. Securities and Exchange Commission require the Fund to disclose whether the Fund’s Audit Committee includes at least one member who is an audit committee financial expert within the meaning of such Act and Rules. The Fund’s Board has determined that there is at least one such financial expert on the Audit Committee and has designated each of Ann Torre Bates and David W. Niemiec as an audit committee financial expert. The Board believes that Ms. Bates and Mr. Niemiec qualify as such an expert in view of their extensive business background and experience. Ms. Bates has served as a member of the Fund Audit Committee since 2015. She currently serves as a director of Ares Capital Corporation (2010-present) and United Natural Foods, Inc. (2013-present) and was formerly a director of Navient Corporation from 2014-2016, SLM Corporation from 1997 to 2014 and Allied Capital Corporation from 2003 to 2010, Executive Vice President and Chief Financial Officer of NHP Incorporated from 1995 to 1997 and Vice President and Treasurer of US Airways, Inc. until 1995. Mr. Niemiec has served as a member of the Fund Audit Committee since 2011, currently serves as an Advisor to Saratoga Partners and was formerly its Managing Director from 1998 to 2001 and serves as a director of Hess Midstream Partners LP (April 2017-present). Mr. Niemiec was formerly a director of Emeritus Corporation from 1999 to 2010 and OSI Pharmaceuticals, Inc. from 2006 to 2010, Managing Director of SBC Warburg Dillon Read from 1997 to 1998, and was Vice Chairman from 1991 to 1997 and Chief Financial Officer from 1982 to 1997 of Dillon, Read & Co. Inc. As a result of such background and experience, the Board believes that Ms. Bates and Mr. Niemiec have each acquired an understanding of generally accepted accounting principles and financial statements, the general application of such principles in connection with the accounting estimates, accruals and reserves, and analyzing and evaluating financial statements that present a breadth and level of complexity of accounting issues generally comparable to those of the Fund, as well as an understanding of internal controls and procedures for financial reporting and an understanding of audit committee functions. Ms. Bates and Mr. Niemiec are independent Board members as that term is defined under the applicable U.S. Securities and Exchange Commission Rules and Releases.
The Statement of Additional Information (SAI) includes additional information about the board members and is available, without charge, upon request. Shareholders may call (800) DIAL BEN/342-5236 to request the SAI.
| | | | |
| 92 | | Annual Report | | franklintempleton.com |
FRANKLIN VALUE INVESTORS TRUST
Shareholder Information
Board Approval of Investment Management Agreements
FRANKLIN VALUE INVESTORS TRUST
The Board of Trustees (Board), including a majority of trustees that are not “interested persons” as such term is defined in section 2(a)(19) of the Investment Company Act of 1940 (hereinafter referred to as “independent trustees”), at an in-person meeting held on May 22, 2017, unanimously approved the renewal of the investment management agreement for each of the funds within the Trust (Fund(s)). Prior to a meeting of all of the trustees for the purpose of considering such renewal, the independent trustees participated in two other meetings held in connection with the renewal process. Throughout the process, the independent trustees received assistance and advice from and met separately with independent counsel. The independent trustees met with and interviewed officers of the investment manager (including portfolio managers), the transfer agent and shareholder services group and the distributor. In approving the renewal of the investment management agreement for each Fund, the Board, including the independent trustees, determined that the investment management fee structure was fair and reasonable and that continuance of the agreement was in the best interests of each such Fund and its shareholders.
In reaching their decision on the investment management agreement, the trustees took into account information furnished throughout the year at regular Board meetings, as well as information specifically requested and furnished for the renewal process, which culminated in the meetings referred to above for the specific purpose of considering such agreement. Information furnished throughout the year included, among others, reports on each Fund’s investment performance, expenses, portfolio composition, portfolio brokerage execution, client commission arrangements, derivatives, securities lending, asset segregation, portfolio turnover, Rule 12b-1 plan, distribution, shareholder servicing, legal and compliance matters, pricing of securities, sales and redemptions, and marketing support payments made to financial intermediaries, as well as a third-party survey of transfer agent fees charged to funds within the Franklin Templeton Investments (FTI) complex in comparison with those charged to other fund complexes deemed comparable. Also, related financial statements and other information about the scope and quality of services provided by the investment manager and its affiliates and enhancements to such services over the past year were provided. In addition, the trustees received periodic reports
throughout the year and during the renewal process relating to compliance with each Fund’s investment policies and restrictions. During the renewal process, the independent trustees considered the investment manager’s methods of operation within the Franklin Templeton group and its activities on behalf of other clients. The Board also noted that it received an annual report on all payments made by FTI or the Funds to financial intermediaries engaged in the sale of Fund shares, as well as a memorandum relating to third-party servicing arrangements in response to a Guidance Update from the U.S. Securities and Exchange Commission (SEC) relating to mutual fund distribution and sub-accounting fees.
The information obtained by the trustees during the renewal process also included a special report prepared by Broadridge Financial Solutions, Inc., an independent third-party analyst that utilizes data from Lipper, Inc. (“Lipper”), comparing each Fund’s investment performance and expenses with those of other mutual funds deemed comparable to such Fund as selected by Lipper (Broadridge Section 15(c) Report). The trustees reviewed the Broadridge Section 15(c) Report and its usefulness in the renewal process with respect to matters such as comparative fees, expenses, expense ratios, performance and volatility. They concluded that the report continues to be a reliable resource in the performance of their duties.
In addition, the trustees received a Profitability Study (Profitability Study) prepared by management discussing the profitability to FTI from its overall U.S. fund operations, as well as on an individual fund-by-fund basis. Over the past year, the Board and counsel to the independent trustees continued to receive reports on management’s handling of recent regulatory inquiries and pending legal actions against the investment manager and its affiliates. The independent trustees were satisfied with the actions taken to date by management in response to such regulatory and legal matters.
Particular attention was given to management’s diligent risk management program, including continual monitoring and management of cybersecurity, liquidity and counterparty credit risk, and attention given to derivatives and other complex instruments that are held and expected to be held by each Fund and how such instruments are used to carry out such Fund’s investment goal(s). The Board also took into account, among other things, management’s efforts in establishing a global credit facility for the benefit of the Funds and other accounts managed by FTI to provide a source of cash for temporary and emergency purposes or to meet unusual redemption requests as well as the strong financial position of the investment
| | | | | | |
| franklintempleton.com | | Annual Report | | | 93 | |
FRANKLIN VALUE INVESTORS TRUST
SHAREHOLDER INFORMATION
manager’s parent company and its commitment to the mutual fund business. In addition, the Board received updates from management on the SEC’s progress in implementing the rule-making requirements established by the Dodd-Frank Wall Street Reform and Consumer Protection Act (Dodd-Frank Act), which was enacted July 21, 2010, and the investment manager’s compliance with rules and regulations already promulgated by the SEC under such act.
In addition to the above and other matters considered by the trustees throughout the course of the year, the following discussion relates to certain primary factors relevant to the Board’s decision. This discussion of the information and factors considered by the Board (including the information and factors discussed above) is not intended to be exhaustive, but rather summarizes certain factors considered by the Board. In view of the wide variety of factors considered, the Board did not, unless otherwise noted, find it practicable to quantify or otherwise assign relative weights to the foregoing factors. In addition, individual trustees may have assigned different weights to various factors.
NATURE, EXTENT AND QUALITY OF SERVICES. The trustees reviewed the nature, extent and quality of the services provided, and to be provided, by the investment manager. The trustees cited the investment manager’s ability to implement each Fund’s disciplined value investment approach and its long-term relationship with such Fund as reasons that shareholders choose to invest, and remain invested, in such Fund. The trustees reviewed each Fund’s portfolio management team, including its performance, staffing, skills and compensation program. With respect to portfolio manager compensation, management assured the trustees that each Fund’s long-term performance is a significant component of incentive-based compensation and noted that a portion of a portfolio manager’s incentive-based compensation is paid in shares of pre-designated funds from the portfolio manager’s fund management area. The trustees noted that the portfolio manager compensation program aligned the interests of the portfolio managers with that of shareholders of the Funds. The trustees discussed with management various other products, portfolios and entities that are advised by the investment manager and the allocation of assets and expenses among and within them, as well as their relative fees and reasons for differences with respect thereto and any potential conflicts. During regular Board meetings and the aforementioned meetings of the independent trustees, the trustees received reports and presentations on the investment manager’s best execution trading policies. The trustees considered periodic
reports provided to them showing that the investment manager complied with the investment policies and restrictions of the Funds as well as other reports periodically furnished to the Board covering matters such as the compliance of portfolio managers and other management personnel with the code of ethics covering the investment management personnel, the adherence to fair value pricing procedures established by the Board and the accuracy of net asset value calculations. The Board noted the extent of the benefits provided to Fund shareholders from being part of the Franklin Templeton group of funds, including the right to exchange investments between funds (same class) without a sales charge, the ability to reinvest Fund dividends into other funds and the right to combine holdings of other funds to obtain reduced sales charges. The Board considered the investment manager’s significant efforts in developing and implementing compliance procedures established in accordance with SEC and other requirements.
The Board considered the nature, extent and quality of the services to be provided under the Funds’ other service agreements to determine that, on an overall basis, Fund shareholders were well served. In this connection, the Board also took into account transfer agent and shareholder services provided to Fund shareholders by an affiliate of the investment manager, noting continuing expenditures by management to increase and improve the scope of such services and favorable periodic reports on shareholder services conducted by independent third parties. While such considerations directly affected the trustees’ decision in renewing the Funds’ transfer agent and shareholder services agreement, the Board also considered these commitments as incidental benefits to Fund shareholders deriving from the investment management relationship.
Based on their review, the trustees were satisfied with the nature and quality of the overall services provided, and to be provided, by the investment manager and its affiliates to each Fund and its shareholders and were confident in the abilities of the management team to continue the disciplined value investment approach of such Fund and to provide quality services to such Fund and its shareholders.
INVESTMENT PERFORMANCE. The trustees reviewed and placed significant emphasis on the investment performance of each Fund over the one-, three-, five- and 10-year periods ended December 31, 2016. They considered the history of successful performance of each Fund relative to various benchmarks. As part of their review, they inquired of management regarding benchmarks, style drift and restrictions
| | | | |
| 94 | | Annual Report | | franklintempleton.com |
FRANKLIN VALUE INVESTORS TRUST
SHAREHOLDER INFORMATION
on permitted investments. Consideration was also given to performance in the context of available levels of cash during the periods.
The trustees had meetings during the year, including the meetings referred to above held in connection with the renewal process, with each Fund’s portfolio managers to discuss performance and the management of such Fund. In addition, particular attention in assessing performance was given to the Broadridge Section 15(c) Report. That report showed the investment performance of the Fund (Class A shares) in comparison to other funds determined comparable by Lipper.
Franklin Balance Sheet Investment. The comparable funds to this Fund, as chosen by Lipper, included all retail and institutional global mid-cap value funds. The Fund had total returns in the second-best performing quintile for the one-year period ended December 31, 2016, and had annualized total returns for the three- and five-year periods in the lowest performing quintile. The trustees noted that the Fund’s total return on an annualized basis for the 10-year period ended December 31, 2016 was also in the lowest performing quintile. The trustees also compared Fund performance to other industry benchmarks, including measures of risk-adjusted performance of a fund, as part of their evaluation of investment performance. The trustees discussed with management the reasons for the relative underperformance for the three-, five-, and ten-year periods ended December 31, 2016 and recent improvements made to the investment manager’s investment processes. Taking into account such discussions and the recent improvement in relative performance, the Board intended to continue to monitor future performance, but did not believe such comparative performance warranted any change in portfolio management. The Board concluded that the Fund had performed in an acceptable manner in the context of the Fund’s goal.
Franklin MicroCap Value Fund. The comparable funds to this Fund, as chosen by Lipper, included all retail and institutional small-cap value funds. The Fund had total returns in the second-best performing quintile for the one-year period ended December 31, 2016, and had annualized total returns for the three- and five- year periods in the second-lowest performing quintile. The trustees noted that the Fund’s total return on an annualized basis for the 10-year period ended December 31, 2016 was in the middle performing quintile. The trustees discussed with management the reasons for the relative underperformance for the three- and five- year periods ended December 31, 2016. Taking into account such discussions and
the recent improvement in relative performance, the Board intended to continue to monitor future performance, but did not believe such comparative performance warranted any change in portfolio management. The Board concluded that the Fund had performed in an acceptable manner in the context of the Fund’s goal.
Franklin MidCap Value Fund. The comparable funds to this Fund, as chosen by Lipper, included all retail and institutional mid-cap value funds. The Fund had total returns in the second-lowest performing quintile for the one-year period ended December 31, 2016, and had annualized total returns for the three- and five-year periods in the lowest performing quintile. The trustees noted that the Fund’s total return on an annualized basis for the 10-year period ended December 31, 2016 was also in the lowest performing quintile. The Board discussed with management the reasons for the relative underperformance for all periods ended December 31, 2016. The Board concluded that the Fund’s performance was not acceptable, but, due to the proposal to combine the Fund with and into the Franklin Small Cap Value Fund (the “Reorganization”), did not warrant any further action.
Franklin Small Cap Value Fund. The comparable funds to this Fund, as chosen by Lipper, included all retail and institutional small-cap value funds. The Fund had total returns in the second-best performing quintile for the one-year period ended December 31, 2016, and had annualized total returns for the three- and five-year periods in the middle performing quintile. The trustees noted that the Fund’s total return on an annualized basis for the 10-year period ended December 31, 2016 was also in the middle performing quintile. The Board was satisfied with such comparative performance.
The trustees also compared Fund performance to other industry benchmarks, including measures of risk-adjusted performance of a fund, as part of their evaluation of investment performance. The trustees concluded that the Fund had continued to perform well in comparison to its various benchmarks and in the context of the Fund’s goal.
COMPARATIVE EXPENSES AND MANAGEMENT PROFITABILITY. The trustees considered the cost of the services provided and to be provided and the profits realized by the investment manager and its affiliates from their respective relationships with the Funds. As part of the renewal process, the trustees explored with management the trends in expense ratios over the past three fiscal years and the reasons for any increases in each Fund’s expense ratios (or components thereof). In considering the appropriateness of the management
| | | | | | |
| franklintempleton.com | | Annual Report | | | 95 | |
FRANKLIN VALUE INVESTORS TRUST
SHAREHOLDER INFORMATION
fee and other expenses charged to each Fund, the Board took into account various factors including investment performance and matters relating to Fund operations, including, but not limited to, the quality and experience of its portfolio managers and research staff. Consideration was also given to a comparative analysis in the Broadridge Section 15(c) Report of the investment management fee and total expense ratio of each Fund in comparison with those of a group of other funds selected by Lipper as its appropriate Lipper expense group. Lipper expense data is based upon information taken from each Fund’s most recent annual report, which reflects historical asset levels that may be quite different from those currently existing, particularly in a period of market volatility. While recognizing such inherent limitation and the fact that expense ratios generally increase as assets decline and decrease as assets grow, the Board believed the independent analysis conducted by Lipper to be an appropriate measure of comparative expenses.
In reviewing comparative costs, emphasis was given to each Fund’s contractual management fee in comparison with the contractual management fee that would have been charged by other funds within its Lipper expense group assuming they were similar in size to such Fund, as well as the actual total expenses of such Fund in comparison with those of its Lipper expense group. The Lipper contractual management fee analysis includes administrative charges as being part of the management fee, and total expenses, for comparative consistency, are shown by Lipper for Fund Class A shares.
Franklin Balance Sheet Investment Fund. This Fund’s contractual management fee rate was in the least expensive quintile of its Lipper expense group and its total expenses were also in the least expensive quintile of such group. The Board was satisfied with such comparative fees and expenses.
Franklin MicroCap Value Fund. This Fund’s contractual management fee rate was in the least expensive quintile of its Lipper expense group and its total expenses were also in the least expensive quintile of such group. The Board was satisfied with such comparative fees and expenses.
Franklin MidCap Value Fund. This Fund’s contractual management fee rate was in the most expensive quintile of its Lipper expense group and its total expenses were also in the most expensive quintile of such group. The Board found such comparative fees and expenses to be acceptable in light of the Reorganization.
Franklin Small Cap Value Fund. This Fund’s contractual management fee rate was in the least expensive quintile of its Lipper expense group and its total expenses were also in the least expensive quintile of such group. The Board was satisfied with such comparative fees and expenses.
The trustees also reviewed the Profitability Study addressing profitability of Franklin Resources, Inc., from its overall U.S. fund business, as well as profitability to each Fund’s investment manager and its affiliates, from providing investment management and other services to such Fund during the 12-month period ended September 30, 2016, the most recent fiscal year-end of Franklin Resources, Inc. The trustees reviewed the basis on which such reports are prepared and the cost allocation methodology utilized in the Profitability Study, it being recognized that allocation methodologies may each be reasonable while producing different results. In this respect, the Board noted that the reasonableness of the cost allocation methodologies was reviewed by independent accountants on an every other year basis.
The independent trustees met with management to discuss the Profitability Study. This included, among other things, a comparison of investment management income with investment management expenses of each Fund; comparison of underwriting revenues and expenses; the relative relationship of investment management and underwriting expenses; shareholder servicing profitability; economies of scale; and the relative contribution of such Fund to the profitability of the investment manager and its parent. In discussing the Profitability Study with the Board, the investment manager stated its belief that the costs incurred in establishing the infrastructure necessary to operate the type of mutual fund operations conducted by it and its affiliates may not be fully reflected in the expenses allocated to each Fund in determining its profitability.
The Board also took into account management’s expenditures in improving shareholder services provided to the Funds, as well as the need to meet additional regulatory and compliance requirements resulting from the Sarbanes-Oxley Act, the Dodd-Frank Act and recent SEC and other regulatory requirements. The trustees also considered the extent to which the investment manager may derive ancillary benefits from Fund operations, including those derived from economies of scale, discussed below, the allocation of Fund brokerage and the use of commission dollars to pay for research and other similar services.
| | | | |
| 96 | | Annual Report | | franklintempleton.com |
FRANKLIN VALUE INVESTORS TRUST
SHAREHOLDER INFORMATION
Based upon their consideration of all these factors, the trustees determined that the level of profits realized by the investment manager and its affiliates in providing services to each Fund was not excessive in view of the nature, quality and extent of services provided.
ECONOMIES OF SCALE. The Board considered economies of scale realized by the investment manager and its affiliates as each Fund grows larger and the extent to which they are shared with Fund shareholders, as for example, in the level of the investment management fee charged, in the quality and efficiency of services rendered and in increased capital commitments benefiting each Fund directly or indirectly. While recognizing that any precise determination is inherently subjective, the trustees noted that, based upon the Profitability Study, as some funds increase in size, at some point economies of scale may result in the investment manager realizing a larger profit margin on investment management services provided to such a fund.
With respect to the Franklin MicroCap Value Fund, the fee structure under the investment management agreement for the Fund provides a flat fee of 0.75% at all asset levels. It was noted the Fund primarily invests in domestic and foreign securities with a market capitalization of less than $500 million that are believed to be undervalued at the time of purchase. Management stated its belief that such limited investment options curtail the potential size of the Fund, thus preventing the type of economies of scale that might benefit other funds from increases in size and also pointed out that the Fund, whose asset size was approximately $345 million as of February 28, 2017, has been closed to new investors, with limited exceptions, since January 14, 2004, and had a very brief re-opening on February 15, 2013 and closed again to new investors (with limited exceptions) on February 19, 2013. Management also expressed its view that this fee was relatively low for this type of a fund and pointed out the favorable comparison of fees and expenses within its Lipper expense group. The independent trustees acknowledged that management’s explanation provided a reasonable basis for believing the existing fee rate under the investment management agreement was fair and that, in view of the Fund’s current modest size, management was not benefiting from any meaningful economies of scale in its management of the Fund, but would continue to monitor such matters.
With respect to all of the other Funds, the trustees also noted that benefits of economies of scale will be shared with Fund shareholders due to the decline in the effective investment
management fee rate as breakpoints are achieved by each Fund. The trustees noted that breakpoints had been instituted as part of each Fund’s investment management fee and that the Board regularly evaluates whether additional breakpoints are appropriate. The trustees assessed the savings to shareholders resulting from such breakpoints and believed they were, and continue to be, appropriate and they agreed to continue to monitor the appropriateness of the breakpoints. The trustees also considered the effects an increase in assets under management would have on the investment management fee and expense ratio of each Fund. To the extent further economies of scale may be realized by the investment manager and its affiliates, the Board believed the investment management and administrative fees provide a sharing of benefits with each Fund and its shareholders.
Proxy Voting Policies and Procedures
The Trust’s investment manager has established Proxy Voting Policies and Procedures (Policies) that the Trust uses to determine how to vote proxies relating to portfolio securities. Shareholders may view the Trust’s complete Policies online at franklintempleton.com. Alternatively, shareholders may request copies of the Policies free of charge by calling the Proxy Group collect at (954) 527-7678 or by sending a written request to: Franklin Templeton Companies, LLC, 300 S.E. 2nd Street, Fort Lauderdale, FL 33301, Attention: Proxy Group. Copies of the Trust’s proxy voting records are also made available online at franklintempleton.com and posted on the US Securities and Exchange Commission’s website at sec.gov and reflect the most recent 12-month period ended June 30.
Quarterly Statement of Investments
The Trust files a complete statement of investments with the US Securities and Exchange Commission for the first and third quarters for each fiscal year on Form N-Q. Shareholders may view the filed Form N-Q by visiting the Commission’s website at sec.gov. The filed form may also be viewed and copied at the Commission’s Public Reference Room in Washington, DC. Information regarding the operations of the Public Reference Room may be obtained by calling (800) SEC-0330.
Householding of Reports and Prospectuses
You will receive each Fund’s financial reports every six months as well as an annual updated summary prospectus (prospectus available upon request). To reduce Fund expenses, we try to identify related shareholders in a household and send only one copy of the financial reports and summary prospectus. This process, called “householding,” will continue indefinitely
| | | | | | |
| franklintempleton.com | | Annual Report | | | 97 | |
FRANKLIN VALUE INVESTORS TRUST
SHAREHOLDER INFORMATION
unless you instruct us otherwise. If you prefer not to have these documents householded, please call us at (800) 632-2301. At any time you may view current prospectuses/summary prospectuses and financial reports on our website. If you choose, you may receive these documents through electronic delivery.
| | | | |
| 98 | | Annual Report | | franklintempleton.com |
This page intentionally left blank.
This page intentionally left blank.
Annual Report and Shareholder Letter
Franklin Value Investors Trust
Investment Manager
Franklin Advisory Services, LLC
Distributor
Franklin Templeton Distributors, Inc.
(800) DIAL BEN® / 342-5236
franklintempleton.com
Shareholder Services
(800) 632-2301
Authorized for distribution only when accompanied or preceded by a summary prospectus and/or prospectus. Investors should carefully consider a fund’s investment goals, risks, charges and expenses before investing. A prospectus contains this and other information; please read it carefully before investing.
To help ensure we provide you with quality service, all calls to and from our service areas are monitored and/or recorded.
© 2017 Franklin Templeton Investments. All rights reserved.
FVIT A2017 12/17
(a) The Registrant has adopted a code of ethics that applies to its principal executive officers and principal financial and accounting officer.
(c) N/A
(d) N/A
(f) Pursuant to Item 12(a)(1), the Registrant is attaching as an exhibit a copy of its code of ethics that applies to its principal executive officers and principal financial and accounting officer.
| Item 3. | Audit Committee Financial Expert. |
(a)(1) The Registrant has an audit committee financial expert serving on its audit committee.
(2) The audit committee financial expert is David W. Niemiec and he is “independent” as defined under the relevant Securities and Exchange Commission Rules and Releases.
| Item 4. | Principal Accountant Fees and Services. |
(a) Audit Fees
The aggregate fees paid to the principal accountant for professional services rendered by the principal accountant for the audit of the registrant’s annual financial statements or for services that are normally provided by the principal accountant in connection with statutory and regulatory filings or engagements were $127,928 for the fiscal year ended October 31, 2017 and $132,209 for the fiscal year ended October 31, 2016.
(b) Audit-Related Fees
The aggregate fees paid to the principal accountant for assurance and related services rendered by the principal accountant to the registrant that are reasonably related to the performance of the audit of the registrant’s financial statements and are not reported under paragraph (a) of Item 4 were $3,071 for the fiscal year ended October 31, 2017 and $3,011 for the fiscal year ended October 31, 2016. The services for which these fees were paid included attestation services.
There were no fees paid to the principal accountant for assurance and related services rendered by the principal accountant to the registrant’s investment adviser and any entity controlling, controlled by or under common control with the investment adviser that provides ongoing services to the registrant that are reasonably related to the performance of the audit of their financial statements.
(c) Tax Fees
There were no fees paid to the principal accountant for professional services rendered by the principal accountant to the registrant for tax compliance, tax advice and tax planning.
There were no fees paid to the principal accountant for professional services rendered by the principal accountant to the registrant’s investment adviser and any entity controlling, controlled by or under common control with the investment adviser that provides ongoing services to the registrant for tax compliance, tax advice and tax planning.
(d) All Other Fees
There were no fees paid to the principal accountant for products and services rendered by the principal accountant to the registrant not reported in paragraphs (a) - (c) of Item 4.
The aggregate fees paid to the principal accountant for products and services rendered by the principal accountant to the registrant’s investment adviser and any entity controlling, controlled by or under common control with the investment adviser that provides ongoing services to the registrant not reported in paragraphs (a) - (c) of Item 4 were $14,000 for the fiscal year ended October 31, 2017 and $0 for the fiscal year ended October 31, 2016. The services for which these fees were paid included benchmarking services in connection with 2015 ICI TA Survey.
(e) (1) The registrant’s audit committee is directly responsible for approving the services to be provided by the auditors, including:
(i) pre-approval of all audit and audit related services;
(ii) pre-approval of all non-audit related services to be provided to the Fund by the auditors;
(iii) pre-approval of all non-audit related services to be provided to the registrant by the auditors to the registrant’s investment adviser or to any entity that controls, is controlled by or is under common control with the registrant’s investment adviser and that provides ongoing services to the registrant where the non-audit services relate directly to the operations or financial reporting of the registrant; and
(iv) establishment by the audit committee, if deemed necessary or appropriate, as an alternative to committee pre-approval of services to be provided by the auditors, as required by paragraphs (ii) and (iii) above, of policies and procedures to permit such services to be pre-approved by other means, such as through establishment of guidelines or by action of a designated member or members of the committee; provided the policies and procedures are detailed as to the particular service and the committee is informed of each service and such policies and procedures do not include delegation of audit committee responsibilities, as contemplated under the Securities Exchange Act of 1934, to management; subject, in the case of (ii) through (iv), to any waivers, exceptions or exemptions that may be available under applicable law or rules.
(e) (2) None of the services provided to the registrant described in paragraphs (b) - (d) of Item 4 were approved by the audit committee pursuant to paragraph (c)(7)(i)(C) of Rule 2-01 of regulation S-X.
(f) No disclosures are required by this Item 4(f).
(g) The aggregate non-audit fees paid to the principal accountant for services rendered by the principal accountant to the registrant and the registrant’s investment adviser and any entity controlling, controlled by or under common control with the investment adviser that provides ongoing services to the registrant were $17,071 for the fiscal year ended October 31, 2017 and $3,011 for the fiscal year ended October 31, 2016.
(h) The registrant’s audit committee of the board has considered whether the provision of non-audit services that were rendered to the registrant’s investment adviser (not including any sub-adviser whose role is primarily portfolio management and is subcontracted with or overseen by another investment adviser), and any entity controlling, controlled by, or under common control with the investment adviser that provides ongoing services to the registrant that were not pre-approved pursuant to paragraph (c)(7)(ii) of Rule 2-01 of Regulation S-X is compatible with maintaining the principal accountant’s independence.
| Item 5. | Audit Committee of Listed Registrants. N/A |
| Item 6. | Schedule of Investments. N/A |
| Item 7. | Disclosure of Proxy Voting Policies and Procedures for Closed-End Management Investment Companies. N/A |
| Item 8. | Portfolio Managers of Closed-End Management Investment Companies. N/A |
| Item 9. | Purchases of Equity Securities by Closed-End Management Investment Company and Affiliated Purchasers. N/A |
| Item 10. | Submission of Matters to a Vote of Security Holders. |
There have been no changes to the procedures by which shareholders may recommend nominees to the Registrant’s Board of Trustees that would require disclosure herein.
| Item 11. | Controls and Procedures. |
(a) Evaluation of Disclosure Controls and Procedures. The Registrant maintains disclosure controls and procedures that are designed to ensure that information required to be disclosed in the Registrant’s filings under the Securities Exchange Act of 1934 and the Investment Company Act of 1940 is recorded, processed, summarized and reported
within the periods specified in the rules and forms of the Securities and Exchange Commission. Such information is accumulated and communicated to the Registrant’s management, including its principal executive officer and principal financial officer, as appropriate, to allow timely decisions regarding required disclosure. The Registrant’s management, including the principal executive officer and the principal financial officer, recognizes that any set of controls and procedures, no matter how well designed and operated, can provide only reasonable assurance of achieving the desired control objectives.
Within 90 days prior to the filing date of this Shareholder Report on Form N-CSR, the Registrant had carried out an evaluation, under the supervision and with the participation of the Registrant’s management, including the Registrant’s principal executive officer and the Registrant’s principal financial officer, of the effectiveness of the design and operation of the Registrant’s disclosure controls and procedures. Based on such evaluation, the Registrant’s principal executive officer and principal financial officer concluded that the Registrant’s disclosure controls and procedures are effective.
(b) Changes in Internal Controls. There have been no changes in the Registrant’s internal controls or in other factors that could materially affect the internal controls over financial reporting subsequent to the date of their evaluation in connection with the preparation of this Shareholder Report on Form N-CSR.
(a) (1) Code of Ethics
(a)(2) Certifications pursuant to Section 302 of the Sarbanes-Oxley Act of 2002 of Matthew T. Hinkle, Chief Executive Officer - Finance and Administration, and Robert G. Kubilis, Chief Financial Officer and Chief Accounting Officer
(b) Certifications pursuant to Section 906 of the Sarbanes-Oxley Act of 2002 of Matthew T. Hinkle, Chief Executive Officer - Finance and Administration, and Robert G. Kubilis, Chief Financial Officer and Chief Accounting Officer
SIGNATURES
Pursuant to the requirements of the Securities Exchange Act of 1934 and the Investment Company Act of 1940, the registrant has duly caused this report to be signed on its behalf by the undersigned, thereunto duly authorized.
FRANKLIN VALUE INVESTORS TRUST
| | |
By | | /s/ Matthew T. Hinkle |
| | Matthew T. Hinkle |
| | Chief Executive Officer – Finance and Administration |
| | Date December 27, 2017 |
Pursuant to the requirements of the Securities Exchange Act of 1934 and the Investment Company Act of 1940, this report has been signed below by the following persons on behalf of the registrant and in the capacities and on the dates indicated.
| | |
By | | /s/ Matthew T. Hinkle |
| | Matthew T. Hinkle |
| | Chief Executive Officer – Finance and Administration |
| | Date December 27, 2017 |
| |
By | | /s/ Robert G. Kubilis |
| | Robert G. Kubilis |
| | Chief Financial Officer and |
| | Chief Accounting Officer |
| | Date December 27, 2017 |