UNITED STATES
SECURITIES AND EXCHANGE COMMISSION
Washington, DC 20549
FORM N-CSR/A
CERTIFIED SHAREHOLDER REPORT OF REGISTERED
MANAGEMENT INVESTMENT COMPANIES
Investment Company Act file number 811-05878
Franklin Value Investors Trust
(Exact name of registrant as specified in charter)
One Franklin Parkway, San Mateo, CA 94403-1906
(Address of principal executive offices) (Zip code)
Craig S. Tyle, One Franklin Parkway, San Mateo, CA 94403-1906
(Name and address of agent for service)
Registrant’s telephone number, including area code: 650 312-2000
Date of fiscal year end: 10/31
Date of reporting period: 10/31/18
| Item 1. | Reports to Stockholders. |
Franklin Templeton Investments
Successful investing begins with ambition. And achievement only comes when you reach for it. That’s why we continually strive to deliver better outcomes for investors. No matter what your goals are, our deep, global investment expertise allows us to offer solutions that can help.
During our more than 70 years of experience, we’ve managed through all kinds of markets—up, down and those in between. We’re always preparing for what may come next. It’s because of this, combined with our strength as one of the world’s largest asset managers that we’ve earned the trust of millions of investors around the world.
Dear Shareholder:
During the 12 months ended October 31, 2018, many U.S. equity markets finished higher, although the more important event was the return of volatility to financial markets. The Russell 3000® Value and Russell 2000® Value indexes posted total returns of +2.78% and-0.59%, respectively, while the Standard & Poor’s 500® Index (S&P 500®) delivered a +7.35% total return.1
Positive corporate and economic fundamentals helped drive the overall gains in equity markets during the period. The primary tailwinds were strong U.S. corporate earnings growth, healthy consumer and business investment spending, and the positive effect of major U.S. tax cuts. In addition, the global economy continued its steady expansion since the financial crisis of 2008–2009. Unemployment continued to decline in the U.S. and other developed markets, while U.S. wage growth showed some signs of accelerating.
However, volatility reasserted itself in 2018. As measured by the Chicago Board Options Exchange Volatility Index (VIX), 2017 was the least volatile year on record for the S&P 500, but the VIX surged in early February 2018 to its highest level since the summer of 2015, and climbed again in October 2018.2 Higher bond yields, a flattening U.S. Treasury yield curve and the gradual reversal of ultra-loose monetary policy by the U.S. Federal Reserve (Fed) were key drivers of market turbulence.Small-cap stocks were also adversely affected by widening
U.S. credit spreads—the difference in yield between U.S. Treasury and corporate bonds—after steadily narrowing since 2016. Heightened trade tensions between the U.S. and China, geopolitical events, and a growing belief in the latter stages of the period that corporate earnings and economic growth will likely decelerate in 2019 were additional drags on equity markets.
Valuation is an essential factor in our analysis and we always ask ourselves if current and potential investments represent an attractive balance of risk and reward. The Russell 2000® Value Index hit anall-time high in August 2018, while the Russell 3000® Value Index and S&P 500 Index reached new highs in September 2018, but U.S. stocks fell sharply in October 2018. In all market conditions, we maintain a focus on individual investments and the prospects for each business in the context of its valuation and the backdrop of potential political and economic risks.
In U.S. equity markets, growth stocks outperformed value stocks during the period. The differences in performance were partly driven by the rally in information technology stocks, which provided a meaningful boost to growth indexes until they suffered a correction in October. We do not know if the October decline portends a shift in the fortunes of growth stocks or is simply a temporary setback. Historically, periods of
1. Source: Morningstar.
Frank Russell Company is the source and owner of the trademarks, service marks and copyrights related to the Russell Indexes. Russell® is a trademark of Frank Russell Company.
2. The VIX Index measures U.S. stock market volatility based on prices of S&P 500 options.
See www.franklintempletondatasources.com for additional data provider information.
Not FDIC Insured | May Lose Value | No Bank Guarantee |
| franklintempleton.com | Not part of the annual report | 1 | ||
strong performance by growth stocks have been followed by relatively weaker performance relative to value stocks.
Another factor that contributed to the outperformance of growth stocks was the relatively greater exposure that value indexes have to areas of the economy that we believe are facing disruption from new technology. This factor may override more typical cyclical forces that have previously worked to the benefit of value investors with long time horizons and patience. Exacerbating the disruption is the reality that many new technology companies are able to innovate without the need to show immediate profits.
Amid dynamic markets and evolving economic conditions, we believe active, professional investment management serves investors well. We also recognize the important role of financial advisors in today’s markets and encourage investors to continue to seek their advice. Amid changing markets and economic conditions, we are confident investors with a well-diversified portfolio and a patient, long-term outlook will be well positioned for the years ahead.
On the following pages, the Fund’s portfolio management team reviews investment decisions that pertain to performance during the past 12 months in light of the economic environment and other factors. Please remember all securities markets fluctuate, as do mutual fund share prices. We thank you for investing with Franklin Templeton, welcome your questions and comments, and look forward to continuing to serve your investment needs in the years ahead.
Sincerely,

Peter A. Langerman
Chief Executive Officer – Investment Management
Franklin Value Investors Trust
This letter reflects our analysis and opinions as of October 31, 2018, unless otherwise indicated. The information is not a complete analysis of every aspect of any market, country, industry, security or fund. Statements of fact are from sources considered reliable.
| 3 | ||||
| 4 | ||||
| 11 | ||||
| 18 | ||||
| 25 | ||||
| 49 | ||||
| 54 | ||||
| 70 | ||||
| 71 | ||||
| 72 | ||||
|
| 77
|
| |
Visitfranklintempleton.comfor fund updates, to access your account, or to find helpful financial planning tools.
2 | Not part of the annual report | franklintempleton.com | ||
The U.S. economy grew during the 12 months under review. The economy grew faster in 2018’s second quarter than in the first, driven by consumer spending, business investment, exports and government spending, but moderated in the third quarter due to declines in exports and housing investment. The manufacturing and services sectors expanded during the period. The unemployment rate declined from 4.1% in October 2017 to a nearly49-year low of 3.7% atperiod-end.1 Annual inflation, as measured by the Consumer Price Index, increased from 2.0% in October 2017 to 2.5% atperiod-end.1
The U.S. Federal Reserve (Fed) raised its target range for the federal funds rate 0.25% at its December 2017 meeting and continued to reduce its balance sheet as part of its ongoing plan to normalize monetary policy. In his congressional testimonies in February and July 2018, as well as at the Fed symposium in August, Fed Chair Jerome Powell reiterated the Fed’s intention to gradually raise interest rates. As widely expected, the Fed further raised its target range for the federal funds rate 0.25% each at its March, June and September 2018 meetings, to 2.00%–2.25%. At its September meeting, the Fed raised its forecast for U.S. economic growth in 2018 and 2019 and projected one more rate increase in 2018. Minutes from the Fed’s September meeting (released in October) indicated that a few Fed officials expected monetary policy to become modestly restrictive of economic growth, while some officials seemed to favor increasing the federal funds rate temporarily above what they consider to be its longer-term level to reduce the risk of overshooting the Fed’s inflation objective. In contrast, some Fed officials indicated they would not favor a restrictive policy unless they see clear signs of an overheating economy and rising inflation.
U.S. equity markets overall rose during the period, benefiting from mostly upbeat economic data, and better U.S. corporate earnings, as well as the passage of the U.S. tax reform bill. After reaching record highs in January 2018, U.S. stocks declined amid concerns that strong economic growth and rising inflation would lead the Fed to increase its target rate faster than expected, as well as fears of tighter regulation of information technology and technology-related companies. Other factors that curbed investor sentiment included tensions between the U.S. and North Korea at certain times during the period, political uncertainties in the U.S., the Trump administration’s protectionist policies, and the potential impact of escalating U.S.-China trade tensions on global growth and
corporate earnings. Partially offsetting these concerns were an overall easing of tensions in the Korean peninsula in the latter part of the period, intermittent U.S.-China trade negotiations, an agreement between the U.S. and the European Union to try to reduce trade barriers, and a potential trade deal between the U.S., Mexico and Canada. After reaching a newall-time high in September 2018, the broad U.S. stock market, as measured by the Standard & Poor’s 500 Index (S&P 500), experienced heightened volatility in October amid investor concerns about the Fed’s interest-rate path, rising U.S. Treasury yields, trade, a potentially moderating economy and several big companies’ weaker-than-expected fourth-quarter 2018 revenue guidance. In this environment, the S&P 500 generated a +7.35% total return for the12-month period.2
The foregoing information reflects our analysis and opinions as of October 31, 2018. The information is not a complete analysis of every aspect of any market, country, industry, security or fund. Statements of fact are from sources considered reliable.
1. US Source: Bureau of Labor Statistics.
| franklintempleton.com | Annual Report | 3 | ||
Franklin Balance Sheet Investment Fund
This annual report for Franklin Balance Sheet Investment Fund covers the fiscal year ended October 31, 2018.
Your Fund’s Goal and Main Investments
The Fund seeks high total return, of which capital appreciation and income are components, by investing most of its assets in equity securities of companies of any size that we believe are undervalued in the marketplace at the time of purchase but have the potential for capital appreciation. The Fund invests predominantly in common stocks.
Performance Overview
The Fund’s Class A shares had a-0.15% cumulative total return for the 12 months under review. In comparison, the Russell 3000® Value Index, which measures performance of those Russell 3000® Index companies with generally lowerprice-to-book ratios and lower forecasted growth values than companies listed in other stock indexes, generated a +2.78% total return for the same period.1 You can find more of the Fund’s performance data in the Performance Summary beginning on page 7.
Performance data represent past performance, which does not guarantee future results. Investment return and principal value will fluctuate, and you may have a gain or loss when you sell your shares. Current performance may differ from figures shown. For most recentmonth-end performance, go tofranklintempleton.comor call(800)342-5236.
Investment Strategy
Our strategy uses lowprice-to-book value as its primary reference valuation measure. Book value per share is a company’s net worth or shareholders’ equity on an accounting or “book” basis, divided by shares outstanding. The equity securities bought by the Fund will typically be purchased at a low price relative to book value. This strategy is not aimed at short-term trading gains, and we do not attempt to mirror the component securities of the benchmark index. Rather, we try to identify individual companies that meet our investment criteria, with a three- to five-year investment horizon. We may invest in companies of any size, across the entire market capitalization spectrum including smaller and midsize companies.
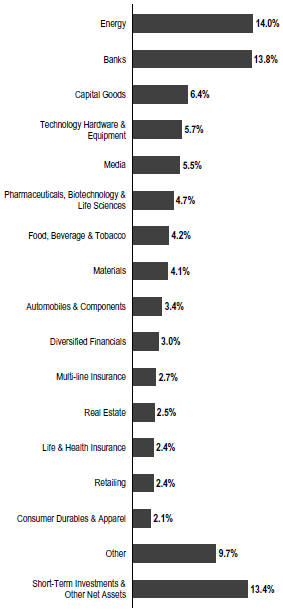
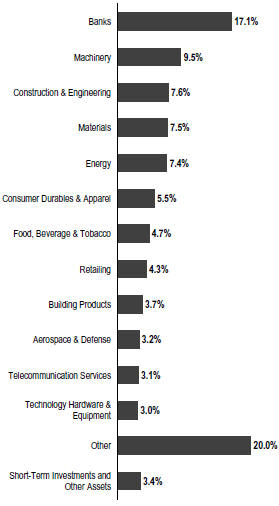
Portfolio Composition
Based on Total Net Assets as of 10/31/18
1. Source: Morningstar.
The index is unmanaged and includes reinvestment of any income or distributions. It does not reflect any fees, expenses or sales charges. One cannot invest directly in an index, and an index is not representative of the Fund’s portfolio.
The dollar value, number of shares or principal amount, and names of all portfolio holdings are listed in the Fund’s Statement of Investments (SOI).
The SOI begins on page 30.
4 | Annual Report | franklintempleton.com | ||
FRANKLIN BALANCE SHEET INVESTMENT FUND
Manager’s Discussion
During the 12 months under review, holdings that positively contributed to Fund performance included Iridium Communications, DSW and Discovery.
Iridium Communications is a satellite, voice and data communications company with a long-term U.S. Department of Defense contract and a stake in Aireon,2 a joint venture that could track much of the world’s commercial aviation in real time. During the period, Iridium reported strong results and raised its 2018 full-year guidance. In addition, it deployed more of its NEXT satellite constellation, while Aireon received maritime distress certification, which will enable it to better penetrate the monopolistic maritime market. Iridium’s entire constellation of NEXT satellites is scheduled to go into orbit by the end of 2018. Accordingly, we believe Iridium could benefit from greater growth prospects, an extended period of low capital expenditures, higher free cash flow, reduced leverage and market recognition of Aieron’s value.
DSW is a leading fashion-focused women’s footwear retailer with more than 500 stores in the U.S. The stock price began to rally in March 2018, driven by solid same-store sales and higher margins. The positive financial results were due in part to innovativein-store initiatives that are resonating with its customers, astute inventory selection and scaled back discounting. In our view, DSW has solid growth potential, strong financial characteristics, and anin-store experience that appeals to its customers and defends against encroachment from online competitors. These factors lead us to believe DSW’s improving financial performance could be sustainable, and we still viewed the stock’s valuation as attractive atperiod-end.
Discovery is a global media company with a portfolio of television networks and brands, along with corresponding online content distribution. The stock price rallied inmid-2018 after the announcement that John Malone, the chairman of Liberty Media2 and a member of Discovery’s board, increased his position in the company. In addition, media stocks, including Discovery, got a boost from AT&T2 obtaining regulatory approval to buy Time Warner,2 as investors believed the decision meant further industry consolidation was more likely to occur. Further positive news came in September 2018 when Discovery announced that some of its networks would be added toover-the-top (OTT) providers Hulu2 and Sling2. Investors believed the agreements could help operating
earnings and cash flows amid the structural trend of cable subscribers migrating to OTT providers.
Detractors from Fund performance included McDermott International, American International Group (AIG) and Toll Brothers.
McDermott International is an energy-oriented engineering and construction company that has undergone what we considered an impressive turnaround in recent years. In the face of this turnaround and amid strengthening end markets for its construction services, McDermott announced the acquisition of Chicago Bridge and Iron2 in December 2017. Thestock-for-stock merger was met with immediate skepticism on the part of the investment community, a skepticism that turned out to be well founded, as subsequent quarterly results of the merged companies have shown excessive charges related to Chicago Bridge and Iron’s legacy contracts. These charges have created balance sheet concerns, forcing McDermott to announce the sale of its tank storage business, as well as initiate a private placement preferred stock offering that carried a punitive interest rate. Despite the recent negative news, we continued to have confidence in the management team’s track record in turnarounds. We believe the acquisition of Chicago Bridge and Iron is based on a sound strategic rationale and that the merger could lead to steadier and stronger earnings potential that is not reflected in the current valuation of the shares atperiod-end.
Shares of U.S.-based insurer AIG moved lower due to the announcement in November 2017 of additional commercial reserves and an increase in the loss estimate on current business, a trend of generally weak earnings and management’s limited success in turning around AIG’s operating performance. The reserve charges were particularly disappointing given AIG’s prior actions to set aside resources to meet losses related to prior-year accident claims. In October 2018, the stock price finished the12-month period on a down note due to larger-than-expected catastrophe related losses announced ahead of quarterly results. The losses were due to multiple typhoons in Japan, Hurricane Florence and mudslides in California. Investors tend to look beyond uncharacteristic weather-related losses, but we believe AIG’s series of operating challenges and negative surprises in recent years played a role in how sharply the stock price declined.
2. Not a Fund holding.
See www.franklintempletondatasources.com for additional data provider information.
| franklintempleton.com | Annual Report | 5 | ||
FRANKLIN BALANCE SHEET INVESTMENT FUND
Toll Brothers is a residential construction company that specializes in building luxury homes. The stock price began to decline in early 2018 due to investor fears that the Fed’s interest-rate tightening cycle might derail the recovery in the U.S. housing market, as well as higher construction costs and labor shortages. Investor concern grew as U.S. housing data showed a slowdown in sales activity. Although Toll Brothers, along with many other homebuilders, reported solid quarterly results during the third quarter of 2018, higher interest rates and a deterioration in home sales weighed on the share prices of homebuilders. Atperiod-end we still viewed Toll Brothers as attractive on a fundamental basis. The longer-term housing market outlook remains fairly positive due to demographic factors, namely first-time millennial homebuyers, while Toll Brothers appears to have adopted a balanced capital allocation process and a focus on return on equity.
Top 10 Holdings
10/31/18
Company Sector/Industry | % of Total Net Assets | |
Corning Inc. Technology Hardware & Equipment | 4.6% | |
JPMorgan Chase & Co. Banks | 4.4% | |
Kinder Morgan Inc. Energy | 3.8% | |
Bank of America Corp. Banks | 3.6% | |
Discovery Inc. Media | 2.7% | |
General Motors Co. Automobiles & Components | 2.7% | |
Chevron Corp. Energy | 2.0% | |
Royal Dutch Shell PLC (U.K.) Energy | 1.9% | |
Bio-Rad Laboratories Inc. Pharmaceuticals, Biotechnology & Life Sciences | 1.8% | |
Allergan PLC Pharmaceuticals, Biotechnology & Life Sciences | 1.7% |
During the reporting period, several large new purchases included Kinder Morgan, an energy infrastructure company; Perrigo, a manufacturer of health care products andover-the-counter pharmaceuticals; Dick’s Sporting Goods, a sports equipment retailer; Everest Re Group, a reinsurance company; and the aforementioned Discovery. We also added to existing positions including The Hartford Financial Services Group, an insurance and financial services provider; Johnson Controls International, a conglomerate that produces
automotive parts and climate control equipment; and the aforementioned AIG.
In contrast, the Fund’s largest liquidations included Metlife, Comerica and the aforementioned Iridium Communications. We also reduced several holdings including Royal Dutch Shell, Morgan Stanley and MKS Instruments.
As fellow shareholders, we find recent absolute and relative performance disappointing, but it is not uncommon for the Fund to lag the equity market at times given our deep value approach that will often deviate from the sector weightings of our benchmark. Relative to its benchmark, the Fund was hurt by stock selection in the financials (specifically the insurance industry) and information technology sectors, while a combination of an underweighted exposure and stock selection in the health care sector also hurt performance. We remain committed to our disciplined, value investing approach as we seek to generate attractive risk-adjusted returns for our shareholders.
Thank you for your participation in Franklin Balance Sheet Investment Fund. We look forward to continuing to serve your investment needs.
 |
Grace Hoefig Portfolio Manager |

The foregoing information reflects our analysis, opinions and portfolio holdings as of October 31, 2018, the end of the reporting period. The way we implement our main investment strategies and the resulting portfolio holdings may change depending on factors such as market and economic conditions. These opinions may not be relied upon as investment advice or an offer for a particular security. The information is not a complete analysis of every aspect of any market, country, industry, security or the Fund. Statements of fact are from sources considered reliable, but the investment manager makes no representation or warranty as to their completeness or accuracy. Although historical performance is no guarantee of future results, these insights may help you understand our investment management philosophy.
6 | Annual Report | franklintempleton.com | ||
FRANKLIN BALANCE SHEET INVESTMENT FUND
Performance Summary as of October 31, 2018
The performance table and graphs do not reflect any taxes that a shareholder would pay on Fund dividends, capital gain distributions, if any, or any realized gains on the sale of Fund shares. Total return reflects reinvestment of the Fund’s dividends and capital gain distributions, if any, and any unrealized gains or losses. Your dividend income will vary depending on dividends or interest paid by securities in the Fund’s portfolio, adjusted for operating expenses of each class. Capital gain distributions are net profits realized from the sale of portfolio securities.
Performance as of 10/31/181
Cumulative total return excludes sales charges. Average annual total return includes maximum sales charges. Sales charges will vary depending on the size of the investment and the class of share purchased. The maximum is 5.50% and the minimum is 0%.Class A:5.50% maximum initial sales charge;Advisor Class:no sales charges. For other share classes, visitfranklintempleton.com.
| Share Class | Cumulative Total Return2 | Average Annual Total Return3 | ||||||||
A4 | ||||||||||
1-Year | -0.15% | -5.64% | ||||||||
5-Year | +27.32% | +3.77% | ||||||||
10-Year | +158.56% | +9.35% | ||||||||
Advisor | ||||||||||
1-Year | +0.07% | +0.07% | ||||||||
5-Year | +28.89% | +5.21% | ||||||||
10-Year | +168.76% | +10.39% | ||||||||
Performance data represent past performance, which does not guarantee future results. Investment return and principal value will fluctuate, and you may have a gain or loss when you sell your shares. Current performance may differ from figures shown. For most recentmonth-end performance, go tofranklintempleton.comor call(800)342-5236.
See page 9 for Performance Summary footnotes.
| franklintempleton.com | Annual Report | 7 | ||
FRANKLIN BALANCE SHEET INVESTMENT FUND
PERFORMANCE SUMMARY
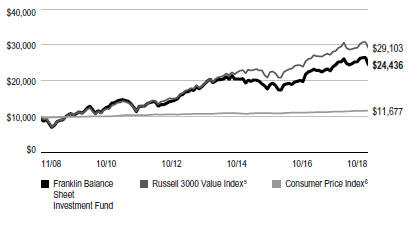
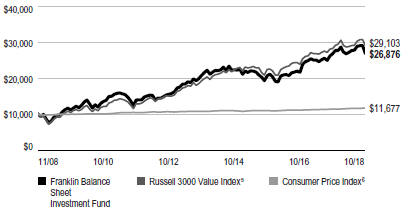
Total Return Index Comparison for a Hypothetical $10,000 Investment1
Total return represents the change in value of an investment over the periods shown. It includes any applicable maximum sales charge, Fund expenses, account fees and reinvested distributions. The unmanaged indexes include reinvestment of any income or distributions. They differ from the Fund in composition and do not pay management fees or expenses. One cannot invest directly in an index.
Class A(11/1/08–10/31/18)
Advisor Class(11/1/08–10/31/18)
See page 9 for Performance Summary footnotes.
8 | Annual Report | franklintempleton.com | ||
FRANKLIN BALANCE SHEET INVESTMENT FUND
PERFORMANCE SUMMARY
Distributions(11/1/17–10/31/18)
| Share Class | Net Investment Income | Short-Term Capital Gain | Long-Term Capital Gain | Total | ||||||||
A | $0.4618 | $0.2693 | $2.4379 | $3.1690 | ||||||||
C | $0.1668 | $0.2693 | $2.4379 | $2.8740 | ||||||||
R | $0.3266 | $0.2693 | $2.4379 | $3.0338 | ||||||||
R6 | $0.6306 | $0.2693 | $2.4379 | $3.3378 | ||||||||
Advisor | $0.5276 | $0.2693 | $2.4379 | $3.2348 | ||||||||
Total Annual Operating Expenses7
| ||||||||||||
| Share Class | With Waiver | Without Waiver | ||||||||||
A | 0.92% | 0.97% | ||||||||||
Advisor | 0.67% | 0.72% | ||||||||||
Each class of shares is available to certain eligible investors and has different annual fees and expenses, as described in the prospectus.
All investments involve risks, including possible loss of principal. Value securities may not increase in price as anticipated or may decline further in value. While smaller and midsize companies may offer substantial opportunities for capital growth, they may also involve heightened risks and should be considered speculative. Historically, smaller- andmidsize- company securities have been more volatile in price than larger-company securities, especially over the short term. In addition, the Fund may invest up to 25% of its total assets in foreign securities, which involve special risks, including currency fluctuations and economic and political uncertainty. The Fund is actively managed but there is no guarantee that the manager’s investment decisions will produce the desired results. The Fund’s prospectus also includes a description of the main investment risks.
1. The Fund has a fee waiver associated with any investment it makes in a Franklin Templeton money fund and/or other Franklin Templeton fund, contractually guaranteed through 2/28/19. Fund investment results reflect the fee waiver; without this waiver, the results would have been lower.
2. Cumulative total return represents the change in value of an investment over the periods indicated.
3. Average annual total return represents the average annual change in value of an investment over the periods indicated. Return for less than one year, if any, has not been annualized.
4. Prior to 9/10/18, these shares were offered at a higher initial sales charge of 5.75%, thus actual returns would have differed. Total returns with sales charges have been restated to reflect the current maximum initial sales charge of 5.50%.
5. Source: Morningstar. The Russell 3000 Value Index is market capitalization weighted and measures performance of those Russell 3000 Index companies with lowerprice-to-book ratios and lower forecasted growth values.
6. Source: Bureau of Labor Statistics, bls.gov/cpi. The Consumer Price Index is a commonly used measure of the inflation rate.
7. Figures are as stated in the Fund’s current prospectus and may differ from the expense ratios disclosed in the Your Fund’s Expenses and Financial Highlights sections in this report. In periods of market volatility, assets may decline significantly, causing total annual Fund operating expenses to become higher than the figures shown.
See www.franklintempletondatasources.com for additional data provider information.
| franklintempleton.com | Annual Report | 9 | ||
FRANKLIN BALANCE SHEET INVESTMENT FUND
Your Fund’s Expenses
As a Fund shareholder, you can incur two types of costs: (1) transaction costs, including sales charges (loads) on Fund purchases and redemptions; and (2) ongoing Fund costs, including management fees, distribution and service(12b-1) fees, and other Fund expenses. All mutual funds have ongoing costs, sometimes referred to as operating expenses. The table below shows ongoing costs of investing in the Fund and can help you understand these costs and compare them with those of other mutual funds. The table assumes a $1,000 investment held for the six months indicated.
Actual Fund Expenses
The table below provides information about actual account values and actual expenses in the columns under the heading “Actual.” In these columns the Fund’s actual return, which includes the effect of Fund expenses, is used to calculate the “Ending Account Value” for each class of shares. You can estimate the expenses you paid during the period by following these steps (ofcourse, your account value and expenses will differ from those in this illustration):Divide your account value by $1,000 (ifyour account had an $8,600 value, then $8,600 ÷ $1,000 = 8.6). Then multiply the result by the number in the row for your class of shares under the headings “Actual” and “Expenses Paid During Period” (ifActual Expenses Paid During Period were $7.50, then 8.6 x $7.50 = $64.50). In this illustration, the actual expenses paid this period are $64.50.
Hypothetical Example for Comparison with Other Funds
Under the heading “Hypothetical” in the table, information is provided about hypothetical account values and hypothetical expenses based on the Fund’s actual expense ratio and an assumed rate of return of 5% per year before expenses, which is not the Fund’s actual return. This information may not be used to estimate the actual ending account balance or expenses you paid for the period, but it can help you compare ongoing costs of investing in the Fund with those of other funds. To do so, compare this 5% hypothetical example for the class of shares you hold with the 5% hypothetical examples that appear in the shareholder reports of other funds.
Please note that expenses shown in the table are meant to highlight ongoing costs and do not reflect any transactional costs. Therefore, information under the heading “Hypothetical” is useful in comparing ongoing costs only, and will not help you compare total costs of owning different funds. In addition, if transactional costs were included, your total costs would have been higher.
| Actual (actual return after expenses) | Hypothetical (5% annual return before expenses) | |||||||||||
| Share Class | Beginning Account Value 5/1/18 | Ending Account Value 10/31/18 | Expenses Paid During 5/1/18–10/31/181,2 | Ending Account Value 10/31/18 | Expenses Paid During | Net Annualized Expense Ratio2 | ||||||
|
|
|
| |||||||||
A | $1,000 | $986.20 | $4.26 | $1,020.92 | $4.33 | 0.85% | ||||||
C | $1,000 | $982.30 | $7.99 | $1,017.14 | $8.13 | 1.60% | ||||||
R | $1,000 | $985.00 | $5.50 | $1,019.66 | $5.60 | 1.10% | ||||||
R6 | $1,000 | $987.70 | $2.51 | $1,022.68 | $2.55 | 0.50% | ||||||
Advisor | $1,000 | $987.20 | $3.01 | $1,022.18 | $3.06 | 0.60% | ||||||
1. Expenses are equal to the annualized expense ratio for thesix-month period as indicated above—in the far right column—multiplied by the simple average account value over the period indicated, and then multiplied by 184/365 to reflect theone-half year period.
2. Reflects expenses after fee waivers and expense reimbursements. Does not include acquired fund fees and expenses.
10 | Annual Report | franklintempleton.com | ||
This annual report for Franklin MicroCap Value Fund covers the fiscal year ended October 31, 2018. The Fund closed to new investors (with the exception of certain retirement accounts) in January 2004 and has remained closed except for two days inmid-February 2013, when the Fund was opened on a limited basis. Existing shareholders may add to or reduce their investments in the Fund; however, once an account is reduced to zero, it may not be reopened unless the Fund reopens.
Your Fund’s Goal and Main Investments
The Fund seeks high total return, of which capital appreciation and income are components, by investing at least 80% of its net assets in securities of companies with market capitalizations under $500 million at the time of purchase that we believe are undervalued in the marketplace and have the potential for capital appreciation. The Fund invests predominantly in common stocks.
Performance Overview
The Fund’s Class A shares had a-8.11% cumulative total return for the 12 months under review. In comparison, the Russell 2000® Value Index, which measures performance of those Russell 2000® Index companies with generally lowerprice-to-book ratios and lower forecasted growth values than companies listed in other stock indexes, had a-0.59% total return for the same period.1 You can find more of the Fund’s performance data in the Performance Summary beginning on page 14.
Performance data represent past performance, which does not guarantee future results. Investment return and principal value will fluctuate, and you may have a gain or loss when you sell your shares. Current performance may differ from figures shown. For most recentmonth-end performance, go tofranklintempleton.comor call(800)342-5236.
Investment Strategy
Our strategy is to buy shares of financially sound, well-established companies at a lowprice-to-book value. In the case of financial companies, we look for consistently increasing book value over time. We limit purchases to companies with market capitalizations of less than $500 million, which we define as “microcap.” Book value per share is a company’s net worth or shareholders’ equity on an accounting or “book”
Portfolio Composition
Based on Total Net Assets as of 10/31/18
basis, divided by shares outstanding. This strategy is not aimed at short-term trading gains, nor do we consider the composition of any index. Rather, we try to identify individual companies that meet our investment criteria, and we assume at purchase that we will hold the positions for several years.
Manager’s Discussion
During the 12 months under review, holdings that positively contributed to Fund performance included Renewable Energy
1. Source: Morningstar.
The index is unmanaged and includes reinvestment of any income or distributions. It does not reflect any fees, expenses or sales charges. One cannot invest directly in an index, and an index is not representative of the Fund’s portfolio.
The dollar value, number of shares or principal amount, and names of all portfolio holdings are listed in the Fund’s Statement of Investments (SOI).
The SOI begins on page 37.
| franklintempleton.com | Annual Report | 11 | ||
FRANKLIN MICROCAP VALUE FUND
| Top 10 Holdings | ||||
| 10/31/18 | ||||
Company Sector/Industry | % of Total Net Assets | |||
Seneca Foods Corp. Food, Beverage & Tobacco | 4.2% | |||
Ameresco Inc. Construction & Engineering | 2.9% | |||
Delta Apparel Inc. Consumer Durables & Apparel | 2.9% | |||
Miller Industries Inc. Machinery | 2.8% | |||
Healthcare Services Group Inc. Commercial & Professional Services | 2.8% | |||
Bar Harbor Bankshares Banks | 2.7% | |||
Ducommun Inc. Aerospace & Defense | 2.7% | |||
Hurco Cos. Inc. Machinery | 2.5% | |||
The Monarch Cement Co. Materials | 2.4% | |||
Alamo Group Inc. Machinery | 2.3% | |||
Group, Ameresco and Rocky Brands. Ameresco is listed among the Fund’s largest positions in the Top 10 Holdings table on this page.
Renewable Energy Group produces biomass-based diesel fuel from natural fats and sugars, much of it recycled food waste. Renewable’s second-quarter 2018 results were, in management’s words, a “step change in earnings power.” Free cash flow in the quarter jumped to nearly half the company’s market capitalization as of the day before the announcement. These positive results were attained without renewal in 2018 of the Biodiesel Mixture Excise Tax Credit (BTC). We expect the BTC, a key subsidy for renewable fuels, to be reinstated retroactively early in 2019.
Ameresco provides renewable energy and energy efficiency solutions to large consumers of purchased power, primarily in the public sector. Ameresco’s revenue, earnings and order backlog have been trending upward, as it has accumulated a portfolio of energy assets capable of providing a stable, growing stream of cash flows from long-term sales contracts. We believe Ameresco is a rare value stock that benefits from technological change. For example, the energy savings afforded
by switching to LED lighting or owning dedicated solar installations creates demand for Ameresco’s services.
After several years of uneven sales and financial returns, Rocky Brands, a footwear and apparel designer and manufacturer, sharpened its focus on its strengths, such as military, outdoor and work boots. The company also upgraded its online presence to better address current consumer preferences. Beginning in the second half of 2017, those efforts began to pay off with better sales and margins. We think Rocky’s brands have the potential to be significantly better recognized as authentic brands in their various categories.
Detractors from Fund performance included Aegean Marine Petroleum Network,2 Spartan Motors and First Internet Bancorp.
Aegean Marine Petroleum Network buys, stores and delivers fuel and lubricants to ships. We believe our losses in the stock were the result of highly questionable financial transactions that pointed to potential self-dealing on the part of company insiders. Problems began to surface in early 2017, but the real nature of the problems was not evident for another year. In February 2018, the company announced a plan to buy a private company controlled by Aegean’s former chairman on terms that we believed were manifestly unfair to Aegean. We stayed involved because of an activist campaign to change the board of directors and block the deal. The action succeeded, and the deal was abandoned. However, disclosures following a forensic examination convinced us to sell our position.
Spartan Motors makes specialty delivery and emergency response vehicles and chassis. In 2017, the company won the largest contract in its history to supply the United States Postal Service with more than 2,000 cargo body fleet vehicles, and more recently the company was selected to provide part of Amazon’s (not a Fund holding) 20,000 delivery vehicle order. However, despite impressive revenue growth in 2018, parts shortages and U.S. tariffs on imported steel and aluminum greatly reduced Spartan’s margins. Management expects the headwinds to continue into 2019.
First Internet Bancorp is an internet-based bank that seeks to minimize expenses through reliance on digital transactions. Unlike conventional banks with retail branches, First Internet Bancorp uses its online presence to attract deposits and generate loans. The bank has grown its loan book much faster than its peers, necessitating four equity raises in two years.
2. Sold by period-end.
See www.franklintempletondatasources.com for additional data provider information.
12 | Annual Report | franklintempleton.com | ||
FRANKLIN MICROCAP VALUE FUND
Asset quality has held up well to date despite the rapid growth, but investors are wary as the credit cycle ages and the pace of loan growth continues. Another problem is the Fed’s moves to raise interest rates have compressed lending margins for banks, especially for those that rely on wholesale funding such as First Internet Bancorp.
During the reporting period, we initiated positions in LSI Industries, a lighting, graphics and display components company; FreightCar America, a manufacturer of railway freight cars; Powell Industries, a provider of electrical energy equipment; and REX American Resources, an ethanol producer and retailer. We also added to some positions including Pacific Ethanol, a renewable fuels and alcohol products company; Houston Wire & Cable, an industrial wire and cable distributor; Titan Machinery, an agriculture and construction equipment dealer; Ultralife, a maker of specialized batteries and communications systems; and Flexsteel Industries, a furniture company.
We exited positions including Hardinge, Protective Insurance, Hawaiian Telcom, Golden Entertainment, Omega Protein and the aforementioned Aegean Marine Petroleum Network. The Fund also reduced its holdings in Shoe Carnival, Sterling Construction, Hurco and the aforementioned Renewable Energy, Spartan Motors and Williams Industrial Services Group.
We are disappointed with the relative and absolute performance of our Fund, particularly because stock selection accounts for the biggest part of the shortfall. Relative to its benchmark, the Fund was hurt by stock selection in the industrials and energy sectors, as well as a combination of underweighted exposure and stock selection in the health care sector. Starting over a year ago, we made changes to our process aimed at improving the quality of our holdings, primarily centered on balance sheet strength. The changes take time to implement in a portfolio such as ours, given the nature of our deep value strategy. We are confident that our actions are lowering risk in the Fund without diminishing what we consider opportunities. Like yourselves, we are shareholders. We are committed to returning the Fund to outperformance at lower-than-market risk.
Thank you for your participation in Franklin MicroCap Value Fund. We look forward to continuing to serve your investment needs.
|
Bruce C. Baughman, CPA Portfolio Manager |


The foregoing information reflects our analysis, opinions and portfolio holdings as of October 31, 2018, the end of the reporting period. The way we implement our main investment strategies and the resulting portfolio holdings may change depending on factors such as market and economic conditions. These opinions may not be relied upon as investment advice or an offer for a particular security. The information is not a complete analysis of every aspect of any market, country, industry, security or the Fund. Statements of fact are from sources considered reliable, but the investment manager makes no representation or warranty as to their completeness or accuracy. Although historical performance is no guarantee of future results, these insights may help you understand our investment management philosophy.
| franklintempleton.com | Annual Report | 13 | ||
FRANKLIN MICROCAP VALUE FUND
Performance Summary as of October 31, 2018
The performance table and graphs do not reflect any taxes that a shareholder would pay on Fund dividends, capital gain distributions, if any, or any realized gains on the sale of Fund shares. Total return reflects reinvestment of the Fund’s dividends and capital gain distributions, if any, and any unrealized gains or losses. Your dividend income will vary depending on dividends or interest paid by securities in the Fund’s portfolio, adjusted for operating expenses of each class. Capital gain distributions are net profits realized from the sale of portfolio securities.
Performance as of 10/31/181
Cumulative total return excludes sales charges. Average annual total return includes maximum sales charges. Sales charges will vary depending on the size of the investment and the class of share purchased. The maximum is 5.50% and the minimum is 0%.Class A:5.50% maximum initial sales charge;Advisor Class:no sales charges. For other share classes, visitfranklintempleton.com.
| Share Class | Cumulative Total Return2 | Average Annual Total Return3 | ||||||
A4 | ||||||||
1-Year | -8.11% | -13.16% | ||||||
5-Year | +19.40% | +2.44% | ||||||
10-Year | +174.53% | +10.00% | ||||||
Advisor | ||||||||
1-Year | -7.90% | -7.90% | ||||||
5-Year | +20.85% | +3.86% | ||||||
10-Year | +181.21% | +10.89% | ||||||
Performance data represent past performance, which does not guarantee future results. Investment return and principal value will fluctuate, and you may have a gain or loss when you sell your shares. Current performance may differ from figures shown. For most recentmonth-end performance, go tofranklintempleton.comor call(800)342-5236.
See page 16 for Performance Summary footnotes.
14 | Annual Report | franklintempleton.com | ||
FRANKLIN MICROCAP VALUE FUND
PERFORMANCE SUMMARY
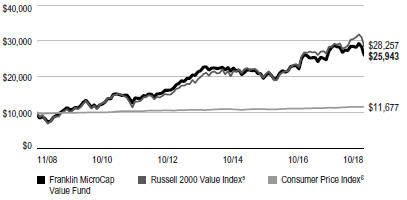
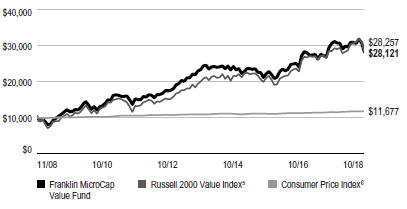
Total Return Index Comparison for a Hypothetical $10,000 Investment1
Total return represents the change in value of an investment over the periods shown. It includes any applicable maximum sales charge, Fund expenses, account fees and reinvested distributions. The unmanaged indexes include reinvestment of any income or distributions. They differ from the Fund in composition and do not pay management fees or expenses. One cannot invest directly in an index.
Class A(11/1/08–10/31/18)
Advisor Class(11/1/08–10/31/18)
See page 16 for Performance Summary footnotes.
| franklintempleton.com | Annual Report | 15 | ||
FRANKLIN MICROCAP VALUE FUND
PERFORMANCE SUMMARY
| Distributions(11/1/17–10/31/18) | ||||||||||||||||
Share Class
| Net Investment Income
| Short-Term Capital Gain
| Long-Term Capital Gain
| Total
| ||||||||||||
A | $0.0008 | $0.0344 | $2.5942 | $2.6294 | ||||||||||||
R6 | $0.1330 | $0.0344 | $2.5942 | $2.7616 | ||||||||||||
Advisor | $0.0905 | $0.0344 | $2.5942 | $2.7191 | ||||||||||||
| Total Annual Operating Expenses7 | ||||||||
Share Class
| With Waiver
| Without Waiver
| ||||||
A | 1.16% | 1.17% | ||||||
Advisor | 0.92% | 0.93% | ||||||
Each class of shares is available to certain eligible investors and has different annual fees and expenses, as described in the prospectus.
All investments involve risks, including possible loss of principal. The Fund’s ability to invest in smaller company securities that may have limited liquidity involves additional risks, such as relatively small revenues, limited product lines and small market share. Historically, these stocks have exhibited greater price volatility than larger company stocks, especially over the short term. In addition, the Fund may invest up to 25% of its total assets in foreign securities, which involve special risks, including currency fluctuations and economic and political uncertainty. The Fund is actively managed but there is no guarantee that the manager’s investment decisions will produce the desired results. The Fund’s prospectus also includes a description of the main investment risks.
1. The Fund has a fee waiver associated with any investment it makes in a Franklin Templeton money fund and/or other Franklin Templeton fund, contractually guaranteed through 2/28/19. Fund investment results reflect the fee waiver; without this waiver, the results would have been lower.
2. Cumulative total return represents the change in value of an investment over the periods indicated.
3. Average annual total return represents the average annual change in value of an investment over the periods indicated. Return for less than one year, if any, has not been annualized.
4. Prior to 9/10/18, these shares were offered at a higher initial sales charge of 5.75%, thus actual returns would have differed. Total returns with sales charges have been restated to reflect the current maximum initial sales charge of 5.50%.
5. Source: Morningstar. The Russell 2000 Value Index is market capitalization weighted and measures performance of those Russell 2000 Index companies with lowerprice-to-book ratios and lower forecasted growth values.
6. Source: Bureau of Labor Statistics, bls.gov/cpi. The Consumer Price Index is a commonly used measure of the inflation rate.
7. Figures are as stated in the Fund’s current prospectus and may differ from the expense ratios disclosed in the Your Fund’s Expenses and Financial Highlights sections in this report. In periods of market volatility, assets may decline significantly, causing total annual Fund operating expenses to become higher than the figures shown.
See www.franklintempletondatasources.com for additional data provider information.
16 | Annual Report | franklintempleton.com | ||
FRANKLIN MICROCAP VALUE FUND
Your Fund’s Expenses
As a Fund shareholder, you can incur two types of costs: (1) transaction costs, including sales charges (loads) on Fund purchases and redemptions; and (2) ongoing Fund costs, including management fees, distribution and service(12b-1) fees, and other Fund expenses. All mutual funds have ongoing costs, sometimes referred to as operating expenses. The table below shows ongoing costs of investing in the Fund and can help you understand these costs and compare them with those of other mutual funds. The table assumes a $1,000 investment held for the six months indicated.
Actual Fund Expenses
The table below provides information about actual account values and actual expenses in the columns under the heading “Actual.” In these columns the Fund’s actual return, which includes the effect of Fund expenses, is used to calculate the “Ending Account Value” for each class of shares. You can estimate the expenses you paid during the period by following these steps (ofcourse, your account value and expenses will differ from those in this illustration):Divide your account value by $1,000 (ifyour account had an $8,600 value, then $8,600 ÷ $1,000 = 8.6). Then multiply the result by the number in the row for your class of shares under the headings “Actual” and “Expenses Paid During Period” (ifActual Expenses Paid During Period were $7.50, then 8.6 x $7.50 = $64.50). In this illustration, the actual expenses paid this period are $64.50.
Hypothetical Example for Comparison with Other Funds
Under the heading “Hypothetical” in the table, information is provided about hypothetical account values and hypothetical expenses based on the Fund’s actual expense ratio and an assumed rate of return of 5% per year before expenses, which is not the Fund’s actual return. This information may not be used to estimate the actual ending account balance or expenses you paid for the period, but it can help you compare ongoing costs of investing in the Fund with those of other funds. To do so, compare this 5% hypothetical example for the class of shares you hold with the 5% hypothetical examples that appear in the shareholder reports of other funds.
Please note that expenses shown in the table are meant to highlight ongoing costs and do not reflect any transactional costs. Therefore, information under the heading “Hypothetical” is useful in comparing ongoing costs only, and will not help you compare total costs of owning different funds. In addition, if transactional costs were included, your total costs would have been higher.
| Actual (actual return after expenses) | Hypothetical (5% annual return before expenses) | |||||||||||
| Share Class | Beginning Account Value 5/1/18 | Ending Account Value 10/31/18 | Expenses Paid During 5/1/18–10/31/181,2 | Ending Account Value 10/31/18 | Expenses Paid During 5/1/18–10/31/181,2 | Net Annualized Expense Ratio2 | ||||||
|
|
|
| |||||||||
A | $1,000 | $947.30 | $5.64 | $1,019.41 | $5.85 | 1.15% | ||||||
R6 | $1,000 | $948.70 | $4.03 | $1,021.07 | $4.18 | 0.82% | ||||||
Advisor | $1,000 | $948.50 | $4.42 | $1,020.67 | $4.58 | 0.90% | ||||||
1. Expenses are equal to the annualized expense ratio for thesix-month period as indicated above—in the far right column—multiplied by the simple average account value over the period indicated, and then multiplied by 184/365 to reflect theone-half year period.
2. Reflects expenses after fee waivers and expense reimbursements. Does not include acquired fund fees and expenses.
| franklintempleton.com | Annual Report | 17 | ||
This annual report for Franklin Small Cap Value Fund covers the fiscal year ended October 31, 2018. The reorganization of Franklin MidCap Value Fund into Franklin Small Cap Value Fund, as approved by shareholders, was completed on December 1, 2017. Shares of Franklin MidCap Value Fund share classes A, C, R and Advisor were exchanged for shares in Franklin Small Cap Value Fund share classes A, C, R and Advisor, respectively. We welcome the former shareholders of Franklin MidCap Value Fund that now own shares of Franklin Small Cap Value Fund.
Your Fund’s Goal and Main Investments
The Fund seeks long-term total return by investing most of its assets in equity securities that the Fund’s investment manager believes are undervalued at the time of purchase and have the potential for capital appreciation. Under normal market conditions, the Fund invests at least 80% of its net assets in investments of small-capitalization(small-cap) companies. We definesmall-cap companies as those with market capitalizations that are similar in size at the time of purchase to those in the Russell 2000® Index.1 The Fund invests predominantly in common stocks.
Performance Overview
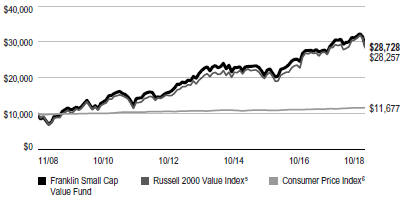
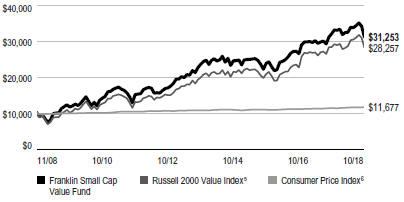
The Fund’s Class A shares had a-3.04% cumulative total return for the 12 months under review. In comparison, the Russell 2000® Value Index, which measures performance of those Russell 2000® Index companies with generally lowerprice-to-book ratios and lower forecasted growth values than companies listed in other stock indexes, had a-0.59% total return for the same period.1,2 You can find more of the Fund’s performance data in the Performance Summary beginning on page 21.
Performance data represent past performance, which does not guarantee future results. Investment return and principal value will fluctuate, and you may have a gain or loss when you sell your shares. Current performance may differ from figures shown. For most recentmonth-end performance, go tofranklintempleton.comor call(800)342-5236.
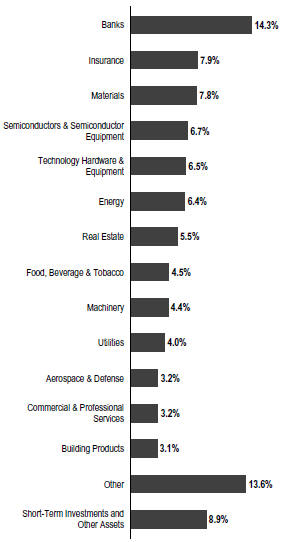
Portfolio Composition
Based on Total Net Assets as of 10/31/18
Investment Strategy
Our strategy is to invest insmall-cap companies that we believe are undervalued at the time of purchase and have the potential for capital appreciation. A stock is undervalued, or is a “value,” when it trades at less than the price at which the investment
1. The Russell 2000 Index is market capitalization weighted and measures performance of the 2,000 smallest companies in the Russell 3000 Index, which represent a small amount of the total market capitalization of the Russell 3000 Index.
2. Source: Morningstar.
The index is unmanaged and includes reinvestment of any income or distributions. It does not reflect any fees, expenses or sales charges. One cannot invest directly in an index, and an index is not representative of the Fund’s portfolio.
The dollar value, number of shares or principal amount, and names of all portfolio holdings are listed in the Fund’s Statement of Investments (SOI).
The SOI begins on page 45.
18 | Annual Report | franklintempleton.com | ||
FRANKLIN SMALL CAP VALUE FUND
manager believes it would trade if the market reflected all factors relating to the company’s worth. Following this strategy, the Fund invests in companies that the investment manager believes have, for example: stock prices that are low relative to current, or historical or future earnings, book value, cash flow or sales; recent sharp price declines but the potential for good long-term earnings prospects; and valuable intangibles not reflected in the stock price. The Fund also may invest in equity real estate investment trusts (REITs).
The Fund may invest up to 25% of its total assets in foreign securities.
Manager’s Discussion
During the 12 months under review, holdings that positively contributed to Fund performance included Zebra Technologies, Esterline Technologies and Energen. Zebra Technologies is listed among the Fund’s largest positions in the Top 10 Holdings table on page 20.
Zebra Technologies is a leader in the automatic identification and data capture market. Shares of Zebra Technologies rose during the year, as it reported an acceleration in year-over-year organic revenue growth, improved its gross profit margins, and made substantial progress on reducing and refinancing its debt. These positive developments helped improve the company’s earnings power. Atperiod-end we remained optimistic about Zebra Technologies’ growth prospects due to its ability to improve customer supply chains through its leadership position in mobile computing, barcode printing, data capture and RFID technologies.
Shares of Esterline Technologies, an aerospace and defense component supplier, jumped in July 2018 after reports that it was exploring a possible sale. The aerospace industry has been undergoing a consolidation phase fueled by a combination of possible increases in U.S. defense spending, growing passenger air traffic and increased industry competitiveness. In addition to speculation of a potential sale, Esterline posted improved results in August 2018 for its fiscal third quarter, including 20% operating margins in its materials business. In October 2018, the company announced an agreement to be purchased by Transdigm3 at a nearly 40% premium to its share price.
Energen is an oil and gas exploration and production company. The stock price generally followed rising crude oil prices. In addition, shares of Energen were boosted in June 2018 due to
news that activist investor Carl Icahn increased his stake in the company and in August 2018 after the announcement of an agreement to be purchased by Diamondback Energy3 at a meaningful premium. Analysts expected the acquisition to enable Diamondback Energy to consolidate its position in the Permian Basin and benefit from economies of scale.
Detractors from Fund performance included LCI Industries, Astec Industries and Versum Materials.
LCI Industries is a leading original equipment manufacturer and replacement components producer for recreational vehicles (RVs), manufactured homes and watercraft. The stock price declined as an increase in RV dealer inventories led investors to expect a reduction in production to bring supplies back in line with the pace of demand. In addition, an increase in interest rates also dampened investor sentiment. However, LCI has spent several years diversifying its business beyond RVs, and we believe its efforts lessened the negative impact. According to our analysis, consumers remain interested in the RV lifestyle, and we believe that orders will rebound and investor sentiment will improve.
Astec Industries, a leading manufacturer of road paving and mining equipment, saw its shares hurt by a decline in orders and a substantial charge related to its wood pellet business. We continued to see opportunities for Astec to increase earnings and free cash flow generation. Astec is also taking steps to improve margins and capital allocation, including retaining an outside consulting firm to assist in reducing procurement costs.
Versum Materials is a specialty materials and equipment company that primarily supplies manufacturers of logic and memory semiconductors. The company continued to post strong revenue growth and operating margins during the period, but its shares fell due to investor concerns regarding the semiconductor product cycle. The industry is experiencing a cyclical downturn as signaled by abuild-up of inventory levels and a decrease in the average selling prices of products among Versum’s key memory customers. We remain optimistic about the company’s growth prospects as industry developments in semiconductor engineering and innovation, such as increasing memory and computing capacity on physically smaller chips, have driven up demand for specialty materials.
During the reporting period, we added some new positions with the largest purchases including Synaptics, a developer of human interface hardware and software; Carpenter Technology,
3. Not a Fund holding.
See www.franklintempletondatasources.com for additional data provider information.
| franklintempleton.com | Annual Report | 19 | ||
FRANKLIN SMALL CAP VALUE FUND
| Top 10 Holdings | ||||
| 10/31/18 | ||||
Company Sector/Industry | % of Total Net Assets | |||
Old Republic International Corp. Insurance | 3.2% | |||
First Horizon National Corp. Banks | 2.7% | |||
Zebra Technologies Corp. Technology Hardware & Equipment | 2.7% | |||
The Hanover Insurance Group Inc. Insurance | 2.7% | |||
Gibraltar Industries Inc. Building Products | 2.5% | |||
Columbia Banking System Inc. Banks | 2.4% | |||
Regal Beloit Corp. Electrical Equipment | 2.2% | |||
Maple Leaf Foods Inc. (Canada) Food, Beverage & Tobacco | 2.2% | |||
Hunting PLC (U.K.) Energy | 2.2% | |||
Brinker International Inc. Consumer Services | 2.2% | |||
a producer of stainless steels and special corrosion-resistant alloys; Advanced Energy Industries, a developer of power supplies and solutions for semiconductor and industrial manufacturers; Retail Properties of America, a real estate investment trust that owns and manages high-quality shopping centers; and Finisar, a supplier of optical communication products. The Fund also added to several holdings including Caleres, a footwear company; Black Hills, an electric and gas utility company; Brinker International, a company that owns casual dining restaurant chains; and the aforementioned Esterline Technologies and Astec Industries.
In contrast, the Fund exited positions including BRP, Spirit Airlines, Validus Holdings, Gerresheimer and SAIA. We also reduced holdings in several positions including Simpson Manufacturing, AAR, Rowan Companies and McGrath RentCorp.
As fellow shareholders, we find recent absolute and relative performance disappointing, but it is not uncommon for the Fund to lag the equity market at times. Relative to its benchmark, the Fund was hurt by stock selection in the consumer discretionary and information technology sectors, while its underweighted exposure to the health care sector also hurt performance. We remain committed to our disciplined, value investing approach as we seek to generate attractive risk-adjusted returns for our shareholders.
Thank you for your participation in Franklin Small Cap Value Fund. We look forward to continuing to serve your investment needs.
 |  | |
Steven B. Raineri Lead Portfolio Manager | ||
Christopher Meeker, CFA | ||
Portfolio Management Team |
The foregoing information reflects our analysis, opinions and portfolio holdings as of October 31, 2018, the end of the reporting period. The way we implement our main investment strategies and the resulting portfolio holdings may change depending on factors such as market and economic conditions. These opinions may not be relied upon as investment advice or an offer for a particular security. The information is not a complete analysis of every aspect of any market, country, industry, security or the Fund. Statements of fact are from sources considered reliable, but the investment manager makes no representation or warranty as to their completeness or accuracy. Although historical performance is no guarantee of future results, these insights may help you understand our investment management philosophy.
20 | Annual Report | franklintempleton.com | ||
FRANKLIN SMALL CAP VALUE FUND
Performance Summary as of October 31, 2018
The performance table and graphs do not reflect any taxes that a shareholder would pay on Fund dividends, capital gain distributions, if any, or any realized gains on the sale of Fund shares. Total return reflects reinvestment of the Fund’s dividends and capital gain distributions, if any, and any unrealized gains or losses. Your dividend income will vary depending on dividends or interest paid by securities in the Fund’s portfolio, adjusted for operating expenses of each class. Capital gain distributions are net profits realized from the sale of portfolio securities.
Performance as of 10/31/181
Cumulative total return excludes sales charges. Average annual total return includes maximum sales charges. Sales charges will vary depending on the size of the investment and the class of share purchased. The maximum is 5.50% and the minimum is 0%.Class A:5.50% maximum initial sales charge;Advisor Class:no sales charges. For other share classes, visitfranklintempleton.com.
| Share Class | Cumulative Total Return2 | Average Annual Total Return3 | ||||||
A4 | ||||||||
1-Year | -3.04% | -8.38% | ||||||
5-Year | +30.32% | +4.25% | ||||||
10-Year | +203.96% | +11.13% | ||||||
Advisor | ||||||||
1-Year | -2.81% | -2.81% | ||||||
5-Year | +32.08% | +5.72% | ||||||
10-Year | +212.53% | +12.07% | ||||||
Performance data represent past performance, which does not guarantee future results. Investment return and principal value will fluctuate, and you may have a gain or loss when you sell your shares. Current performance may differ from figures shown. For most recentmonth-end performance, go tofranklintempleton.comor call(800)342-5236.
See page 23 for Performance Summary footnotes.
| franklintempleton.com | Annual Report | 21 | ||
FRANKLIN SMALL CAP VALUE FUND
PERFORMANCE SUMMARY
Total Return Index Comparison for a Hypothetical $10,000 Investment1
Total return represents the change in value of an investment over the periods shown. It includes any applicable maximum sales charge, Fund expenses, account fees and reinvested distributions. The unmanaged indexes include reinvestment of any income or distributions. They differ from the Fund in composition and do not pay management fees or expenses. One cannot invest directly in an index.
Class A(11/1/08–10/31/18)
Advisor Class(11/1/08–10/31/18)
See page 23 for Performance Summary footnotes.
22 | Annual Report | franklintempleton.com | ||
FRANKLIN SMALL CAP VALUE FUND
PERFORMANCE SUMMARY
| Distributions(11/1/17–10/31/18) | ||||||||||||||||
Share Class
| Net Investment
| Short-Term
| Long-Term
| Total
| ||||||||||||
A | $0.4205 | $0.6718 | $3.8289 | $4.9212 | ||||||||||||
C | $0.0602 | $0.6718 | $3.8289 | $4.5609 | ||||||||||||
R | $0.2118 | $0.6718 | $3.8289 | $4.7125 | ||||||||||||
R6 | $0.6468 | $0.6718 | $3.8289 | $5.1475 | ||||||||||||
Advisor | $0.4708 | $0.6718 | $3.8289 | $4.9715 | ||||||||||||
| Total Annual Operating Expenses7 | ||||||||
| Share Class | With Waiver
| Without Waiver
| ||||||
A | 1.05% | 1.07% | ||||||
Advisor | 0.80% | 0.82% | ||||||
Each class of shares is available to certain eligible investors and has different annual fees and expenses, as described in the prospectus.
All investments involve risks, including possible loss of principal. The Fund’s investments in smaller company stocks carry special risks as such stocks have historically exhibited greater price volatility than larger company stocks, particularly over the short term. Additionally, smaller companies often have relatively small revenues, limited product lines and small market share. In addition, the Fund may invest up to 25% of its total assets in foreign securities, which involve special risks, including currency fluctuations and economic and political uncertainty. The Fund is actively managed but there is no guarantee that the manager’s investment decisions will produce the desired results. The Fund’s prospectus also includes a description of the main investment risks.
1. The Fund has a fee waiver associated with any investment it makes in a Franklin Templeton money fund and/or other Franklin Templeton fund, contractually guaranteed through 2/28/19. Fund investment results reflect the fee waiver; without this waiver, the results would have been lower.
2. Cumulative total return represents the change in value of an investment over the periods indicated.
3. Average annual total return represents the average annual change in value of an investment over the periods indicated. Return for less than one year, if any, has not been annualized.
4. Prior to 9/10/18, these shares were offered at a higher initial sales charge of 5.75%, thus actual returns would have differed. Total returns with sales charges have been restated to reflect the current maximum initial sales charge of 5.50%.
5. Source: Morningstar. The Russell 2000 Value Index measures performance of those Russell 2000 Index companies with lowerprice-to-book ratios and lower forecasted growth values.
6. Source: Bureau of Labor Statistics, bls.gov/cpi. The Consumer Price Index is a commonly used measure of the inflation rate.
7. Figures are as stated in the Fund’s current prospectus and may differ from the expense ratios disclosed in the Your Fund’s Expenses and Financial Highlights sections in this report. In periods of market volatility, assets may decline significantly, causing total annual Fund operating expenses to become higher than the figures shown.
See www.franklintempletondatasources.com for additional data provider information.
| franklintempleton.com | Annual Report | 23 | ||
FRANKLIN SMALL CAP VALUE FUND
Your Fund’s Expenses
As a Fund shareholder, you can incur two types of costs: (1) transaction costs, including sales charges (loads) on Fund purchases and redemptions; and (2) ongoing Fund costs, including management fees, distribution and service(12b-1) fees, and other Fund expenses. All mutual funds have ongoing costs, sometimes referred to as operating expenses. The table below shows ongoing costs of investing in the Fund and can help you understand these costs and compare them with those of other mutual funds. The table assumes a $1,000 investment held for the six months indicated.
Actual Fund Expenses
The table below provides information about actual account values and actual expenses in the columns under the heading “Actual.” In these columns the Fund’s actual return, which includes the effect of Fund expenses, is used to calculate the “Ending Account Value” for each class of shares. You can estimate the expenses you paid during the period by following these steps (of course, your account value and expenses will differ from those in this illustration): Divide your account value by $1,000 (if your account had an $8,600 value, then $8,600 ÷ $1,000 = 8.6). Then multiply the result by the number in the row for your class of shares under the headings “Actual” and “Expenses Paid During Period” (if Actual Expenses Paid During Period were $7.50, then 8.6 x $7.50 =$64.50). In this illustration, the actual expenses paid this period are $64.50.
Hypothetical Example for Comparison with Other Funds
Under the heading “Hypothetical” in the table, information is provided about hypothetical account values and hypothetical expenses based on the Fund’s actual expense ratio and an assumed rate of return of 5% per year before expenses, which is not the Fund’s actual return. This information may not be used to estimate the actual ending account balance or expenses you paid for the period, but it can help you compare ongoing costs of investing in the Fund with those of other funds. To do so, compare this 5% hypothetical example for the class of shares you hold with the 5% hypothetical examples that appear in the shareholder reports of other funds.
Please note that expenses shown in the table are meant to highlight ongoing costs and do not reflect any transactional costs. Therefore, information under the heading “Hypothetical” is useful in comparing ongoing costs only, and will not help you compare total costs of owning different funds. In addition, if transactional costs were included, your total costs would have been higher.
| Actual (actual return after expenses) | Hypothetical (5% annual return before expenses) | |||||||||||
| Share Class | Beginning Account Value 5/1/18 | Ending Account Value 10/31/18 | Expenses Paid During 5/1/18–10/31/181,2 | Ending Account Value 10/31/18 | Expenses Paid During Period 5/1/18–10/31/181,2 | Net Annualized Expense Ratio2 | ||||||
|
|
|
| |||||||||
A | $1,000 | $958.40 | $5.13 | $1,019.96 | $5.30 | 1.04% | ||||||
C | $1,000 | $954.80 | $8.82 | $1,016.18 | $9.10 | 1.79% | ||||||
R | $1,000 | $957.30 | $6.36 | $1,018.70 | $6.56 | 1.29% | ||||||
R6 | $1,000 | $960.50 | $2.96 | $1,022.18 | $3.06 | 0.60% | ||||||
Advisor | $1,000 | $959.20 | $3.90 | $1,021.22 | $4.02 | 0.79% | ||||||
1. Expenses are equal to the annualized expense ratio for thesix-month period as indicated above—in the far right column—multiplied by the simple average account value over the period indicated, and then multiplied by 184/365 to reflect theone-half year period.
2. Reflects expenses after fee waivers and expense reimbursements. Does not include acquired fund fees and expenses.
24 | Annual Report | franklintempleton.com | ||
FRANKLIN VALUE INVESTORS TRUST
Franklin Balance Sheet Investment Fund
| Year Ended October 31, | ||||||||||||||||||||
| 2018 | 2017 | 2016 | 2015 | 2014 | ||||||||||||||||
Class A | ||||||||||||||||||||
Per share operating performance | ||||||||||||||||||||
(for a share outstanding throughout the year) | ||||||||||||||||||||
Net asset value, beginning of year | $41.08 | $35.40 | $40.06 | $51.55 | $53.98 | |||||||||||||||
Income from investment operationsa: | ||||||||||||||||||||
Net investment incomeb | 0.45 | 0.38 | c | 0.22 | 0.19 | 0.46 | d | |||||||||||||
Net realized and unrealized gains (losses) | (0.43 | ) | 7.79 | 1.17 | (3.92 | ) | 3.06 | |||||||||||||
Total from investment operations | 0.02 | 8.17 | 1.39 | (3.73 | ) | 3.52 | ||||||||||||||
Less distributions from: | ||||||||||||||||||||
Net investment income | (0.46 | ) | (0.18 | ) | (0.28 | ) | (0.17 | ) | (0.65 | ) | ||||||||||
Net realized gains | (2.71 | ) | (2.31 | ) | (5.77 | ) | (7.59 | ) | (5.30 | ) | ||||||||||
Total distributions | (3.17 | ) | (2.49 | ) | (6.05 | ) | (7.76 | ) | (5.95 | ) | ||||||||||
Net asset value, end of year | $37.93 | $41.08 | $35.40 | $40.06 | $51.55 | |||||||||||||||
Total returne | (0.15)% | 23.63% | 4.44% | (7.73)% | 6.97% | |||||||||||||||
Ratios to average net assets | ||||||||||||||||||||
Expenses before waiver and payments by affiliates | 0.91% | 0.92% | 0.94% | 0.95% | 0.90% | |||||||||||||||
Expenses net of waiver and payments by affiliates | 0.86% | f | 0.87% | f | 0.91% | f | 0.94% | 0.89% | f | |||||||||||
Net investment income | 1.13% | 0.97% | c | 0.62% | 0.45% | 0.89% | d | |||||||||||||
Supplemental data | ||||||||||||||||||||
Net assets, end of year (000’s) | $772,976 | $841,367 | $795,663 | $915,285 | $1,221,903 | |||||||||||||||
Portfolio turnover rate | 29.85% | 24.68% | 30.25% | 26.31% | 25.08% | |||||||||||||||
aThe amount shown for a share outstanding throughout the period may not correlate with the Statement of Operations for the period due to the timing of sales and repurchases of the Fund’s shares in relation to income earned and/or fluctuating fair value of the investments of the Fund.
bBased on average daily shares outstanding.
cNet investment income per share includes approximately $0.09 per share related to income received in the form of special dividends in connection with certain Fund holdings. Excluding this amount, the ratio of net investment income to average net assets would have been 0.73%.
dNet investment income per share includes approximately $0.15 per share related to income received in the form of special dividends in connection with certain Fund holdings. Excluding this amount, the ratio of net investment income to average net assets would have been 0.61%.
eTotal return does not reflect sales commissions or contingent deferred sales charges, if applicable.
fBenefit of expense reduction rounds to less than 0.01%.
| franklintempleton.com | The accompanying notes are an integral part of these financial statements. | Annual Report | 25 | ||
FRANKLIN VALUE INVESTORS TRUST
FINANCIAL HIGHLIGHTS
Franklin Balance Sheet Investment Fund(continued)
| Year Ended October 31, | ||||||||||||||||||||
| 2018 | 2017 | 2016 | 2015 | 2014 | ||||||||||||||||
Class C | ||||||||||||||||||||
Per share operating performance | ||||||||||||||||||||
(for a share outstanding throughout the year) | ||||||||||||||||||||
Net asset value, beginning of year | $39.27 | $34.01 | $38.70 | $50.22 | $52.77 | |||||||||||||||
Income from investment operationsa: | ||||||||||||||||||||
Net investment income (loss)b | 0.15 | 0.08 | c | (0.04 | ) | (0.12 | ) | 0.07 | d | |||||||||||
Net realized and unrealized gains (losses) | (0.41 | ) | 7.49 | 1.12 | (3.81 | ) | 2.99 | |||||||||||||
Total from investment operations | (0.26 | ) | 7.57 | 1.08 | (3.93 | ) | 3.06 | |||||||||||||
Less distributions from: | ||||||||||||||||||||
Net investment income | (0.17 | ) | — | — | — | (0.31 | ) | |||||||||||||
Net realized gains | (2.71 | ) | (2.31 | ) | (5.77 | ) | (7.59 | ) | (5.30 | ) | ||||||||||
Total distributions | (2.88 | ) | (2.31 | ) | (5.77 | ) | (7.59 | ) | (5.61 | ) | ||||||||||
Net asset value, end of year | $36.13 | $39.27 | $34.01 | $38.70 | $50.22 | |||||||||||||||
Total returne | (0.91)% | 22.73% | 3.65% | (8.41)% | 6.17% | |||||||||||||||
Ratios to average net assets | ||||||||||||||||||||
Expenses before waiver and payments by affiliates | 1.66% | 1.67% | 1.69% | 1.70% | 1.65% | |||||||||||||||
Expenses net of waiver and payments by affiliates | 1.61% | f | 1.62% | f | 1.66% | f | 1.69% | 1.64% | f | |||||||||||
Net investment income (loss) | 0.38% | 0.22% | c | (0.13)% | (0.30)% | 0.14% | d | |||||||||||||
Supplemental data | ||||||||||||||||||||
Net assets, end of year (000’s) | $33,854 | $65,586 | $61,567 | $73,185 | $96,279 | |||||||||||||||
Portfolio turnover rate | 29.85% | 24.68% | 30.25% | 26.31% | 25.08% | |||||||||||||||
aThe amount shown for a share outstanding throughout the period may not correlate with the Statement of Operations for the period due to the timing of sales and repurchases of the Fund’s shares in relation to income earned and/or fluctuating fair value of the investments of the Fund.
bBased on average daily shares outstanding.
cNet investment income per share includes approximately $0.09 per share related to income received in the form of special dividends in connection with certain Fund holdings. Excluding this amount, the ratio of net investment income to average net assets would have been (0.02)%.
dNet investment income per share includes approximately $0.15 per share related to income received in the form of special dividends in connection with certain Fund holdings. Excluding this amount, the ratio of net investment income to average net assets would have been (0.14)%.
eTotal return does not reflect sales commissions or contingent deferred sales charges, if applicable.
fBenefit of expense reduction rounds to less than 0.01%.
26 | Annual Report | The accompanying notes are an integral part of these financial statements. | franklintempleton.com | ||
FRANKLIN VALUE INVESTORS TRUST
FINANCIAL HIGHLIGHTS
Franklin Balance Sheet Investment Fund(continued)
| Year Ended October 31, | ||||||||||||||||||||
| 2018 | 2017 | 2016 | 2015 | 2014 | ||||||||||||||||
Class R | ||||||||||||||||||||
Per share operating performance | ||||||||||||||||||||
(for a share outstanding throughout the year) | ||||||||||||||||||||
Net asset value, beginning of year | $41.10 | $35.42 | $40.06 | $51.48 | $53.90 | |||||||||||||||
Income from investment operationsa: | ||||||||||||||||||||
Net investment incomeb | 0.35 | 0.29 | c | 0.13 | 0.09 | 0.36 | d | |||||||||||||
Net realized and unrealized gains (losses) | (0.42 | ) | 7.80 | 1.17 | (3.91 | ) | 3.01 | |||||||||||||
Total from investment operations | (0.07 | ) | 8.09 | 1.30 | (3.82 | ) | 3.37 | |||||||||||||
Less distributions from: | ||||||||||||||||||||
Net investment income | (0.33 | ) | (0.10 | ) | (0.17 | ) | (0.01 | ) | (0.49 | ) | ||||||||||
Net realized gains | (2.71 | ) | (2.31 | ) | (5.77 | ) | (7.59 | ) | (5.30 | ) | ||||||||||
Total distributions | (3.04 | ) | (2.41 | ) | (5.94 | ) | (7.60 | ) | (5.79 | ) | ||||||||||
Net asset value, end of year | $37.99 | $41.10 | $35.42 | $40.06 | $51.48 | |||||||||||||||
Total return | (0.39)% | 23.33% | 4.17% | (7.94)% | 6.67% | |||||||||||||||
Ratios to average net assets | ||||||||||||||||||||
Expenses before waiver and payments by affiliates | 1.16% | 1.17% | 1.19% | 1.20% | 1.15% | |||||||||||||||
Expenses net of waiver and payments by affiliates | 1.11% | e | 1.12% | e | 1.16% | e | 1.19% | 1.14% | e | |||||||||||
Net investment income | 0.88% | 0.72% | c | 0.37% | 0.20% | 0.64% | d | |||||||||||||
Supplemental data | ||||||||||||||||||||
Net assets, end of year (000’s) | $7,280 | $7,884 | $8,486 | $9,831 | $14,261 | |||||||||||||||
Portfolio turnover rate | 29.85% | 24.68% | 30.25% | 26.31% | 25.08% | |||||||||||||||
aThe amount shown for a share outstanding throughout the period may not correlate with the Statement of Operations for the period due to the timing of sales and repurchases of the Fund’s shares in relation to income earned and/or fluctuating fair value of the investments of the Fund.
bBased on average daily shares outstanding.
cNet investment income per share includes approximately $0.09 per share related to income received in the form of special dividends in connection with certain Fund holdings. Excluding this amount, the ratio of net investment income to average net assets would have been 0.48%.
dNet investment income per share includes approximately $0.15 per share related to income received in the form of special dividends in connection with certain Fund holdings. Excluding this amount, the ratio of net investment income to average net assets would have been 0.36%.
eBenefit of expense reduction rounds to less than 0.01%.
| franklintempleton.com | The accompanying notes are an integral part of these financial statements. | Annual Report | 27 | ||
FRANKLIN VALUE INVESTORS TRUST
FINANCIAL HIGHLIGHTS
Franklin Balance Sheet Investment Fund(continued)
| Year Ended October 31, | ||||||||||||||||||||
| 2018 | 2017 | 2016 | 2015 | 2014 | ||||||||||||||||
Class R6 | ||||||||||||||||||||
Per share operating performance | ||||||||||||||||||||
(for a share outstanding throughout the year) | ||||||||||||||||||||
Net asset value, beginning of year | $42.38 | $36.40 | $41.10 | $52.70 | $55.06 | |||||||||||||||
Income from investment operationsa: | ||||||||||||||||||||
Net investment incomeb | 0.61 | 0.75 | c | 0.35 | 0.37 | 0.47 | d | |||||||||||||
Net realized and unrealized gains (losses) | (0.45 | ) | 7.83 | 1.20 | (3.99 | ) | 3.32 | |||||||||||||
Total from investment operations | 0.16 | 8.58 | 1.55 | (3.62 | ) | 3.79 | ||||||||||||||
Less distributions from: | ||||||||||||||||||||
Net investment income | (0.63 | ) | (0.29 | ) | (0.48 | ) | (0.39 | ) | (0.85 | ) | ||||||||||
Net realized gains | (2.71 | ) | (2.31 | ) | (5.77 | ) | (7.59 | ) | (5.30 | ) | ||||||||||
Total distributions | (3.34 | ) | (2.60 | ) | (6.25 | ) | (7.98 | ) | (6.15 | ) | ||||||||||
Net asset value, end of year | $39.20 | $42.38 | $36.40 | $41.10 | $52.70 | |||||||||||||||
Total return | 0.19% | 24.10% | 4.86% | (7.33)% | 7.37% | |||||||||||||||
Ratios to average net assets | ||||||||||||||||||||
Expenses before waiver and payments by affiliates | 0.57% | 0.57% | 0.53% | 0.51% | 0.50% | |||||||||||||||
Expenses net of waiver and payments by affiliates | 0.50% | e | 0.47% | e | 0.50% | e | 0.50% | 0.49% | e | |||||||||||
Net investment income | 1.49% | 1.37% | c | 1.03% | 0.89% | 1.29% | d | |||||||||||||
Supplemental data | ||||||||||||||||||||
Net assets, end of year (000’s) | $36,580 | $34,673 | $157 | $7,412 | $7,863 | |||||||||||||||
Portfolio turnover rate | 29.85% | 24.68% | 30.25% | 26.31% | 25.08% | |||||||||||||||
aThe amount shown for a share outstanding throughout the period may not correlate with the Statement of Operations for the period due to the timing of sales and repurchases of the Fund’s shares in relation to income earned and/or fluctuating fair value of the investments of the Fund.
bBased on average daily shares outstanding.
cNet investment income per share includes approximately $0.09 per share related to income received in the form of special dividends in connection with certain Fund holdings. Excluding this amount, the ratio of net investment income to average net assets would have been 1.13%.
dNet investment income per share includes approximately $0.15 per share related to income received in the form of special dividends in connection with certain Fund holdings. Excluding this amount, the ratio of net investment income to average net assets would have been 1.01%.
eBenefit of expense reduction rounds to less than 0.01%.
28 | Annual Report | The accompanying notes are an integral part of these financial statements. | franklintempleton.com | ||
FRANKLIN VALUE INVESTORS TRUST
FINANCIAL HIGHLIGHTS
Franklin Balance Sheet Investment Fund(continued)
| Year Ended October 31, | ||||||||||||||||||||
| 2018 | 2017 | 2016 | 2015 | 2014 | ||||||||||||||||
Advisor Class | ||||||||||||||||||||
Per share operating performance | ||||||||||||||||||||
(for a share outstanding throughout the year) | ||||||||||||||||||||
Net asset value, beginning of year | $42.39 | $36.45 | $41.08 | $52.68 | $55.04 | |||||||||||||||
Income from investment operationsa: | ||||||||||||||||||||
Net investment incomeb | 0.57 | 0.49 | c | 0.31 | 0.30 | 0.60 | d | |||||||||||||
Net realized and unrealized gains (losses) | (0.46 | ) | 8.04 | 1.20 | (4.00 | ) | 3.12 | |||||||||||||
Total from investment operations | 0.11 | 8.53 | 1.51 | (3.70 | ) | 3.72 | ||||||||||||||
Less distributions from: | ||||||||||||||||||||
Net investment income | (0.53 | ) | (0.28 | ) | (0.37 | ) | (0.31 | ) | (0.78 | ) | ||||||||||
Net realized gains | (2.71 | ) | (2.31 | ) | (5.77 | ) | (7.59 | ) | (5.30 | ) | ||||||||||
Total distributions | (3.24 | ) | (2.59 | ) | (6.14 | ) | (7.90 | ) | (6.08 | ) | ||||||||||
Net asset value, end of year | $39.26 | $42.39 | $36.45 | $41.08 | $52.68 | |||||||||||||||
Total return | 0.07% | 23.98% | 4.69% | (7.51)% | 7.23% | |||||||||||||||
Ratios to average net assets | ||||||||||||||||||||
Expenses before waiver and payments by affiliates | 0.66% | 0.67% | 0.69% | 0.70% | 0.65% | |||||||||||||||
Expenses net of waiver and payments by affiliates | 0.61% | e | 0.62% | e | 0.66% | e | 0.69% | 0.64% | e | |||||||||||
Net investment income | 1.38% | 1.22% | c | 0.87% | 0.70% | 1.14% | d | |||||||||||||
Supplemental data | ||||||||||||||||||||
Net assets, end of year (000’s) | $48,616 | $57,402 | $75,573 | $69,330 | $115,254 | |||||||||||||||
Portfolio turnover rate | 29.85% | 24.68% | 30.25% | 26.31% | 25.08% | |||||||||||||||
aThe amount shown for a share outstanding throughout the period may not correlate with the Statement of Operations for the period due to the timing of sales and repurchases of the Fund’s shares in relation to income earned and/or fluctuating fair value of the investments of the Fund.
bBased on average daily shares outstanding.
cNet investment income per share includes approximately $0.09 per share related to income received in the form of special dividends in connection with certain Fund holdings. Excluding this amount, the ratio of net investment income to average net assets would have been 0.98%.
dNet investment income per share includes approximately $0.15 per share related to income received in the form of special dividends in connection with certain Fund holdings. Excluding this amount, the ratio of net investment income to average net assets would have been 0.86%.
eBenefit of expense reduction rounds to less than 0.01%.
| franklintempleton.com | The accompanying notes are an integral part of these financial statements. | Annual Report | 29 | ||
FRANKLIN VALUE INVESTORS TRUST
Statement of Investments, October 31, 2018
Franklin Balance Sheet Investment Fund
| Shares/ Units | Value | |||||||
Common Stocks and Other Equity Interests 84.2% | ||||||||
Automobiles & Components 3.4% | ||||||||
Cooper Tire & Rubber Co. | 212,800 | $ | 6,573,392 | |||||
General Motors Co. | 650,000 | 23,783,500 | ||||||
| 30,356,892 | ||||||||
Banks 13.8% | ||||||||
Bank of America Corp. | 1,186,600 | 32,631,500 | ||||||
CIT Group Inc. | 141,000 | 6,680,580 | ||||||
Citigroup Inc. | 183,700 | 12,025,002 | ||||||
Citizens Financial Group Inc. | 246,500 | 9,206,775 | ||||||
Farmers & Merchants Bank of Long Beach | 1,475 | 12,113,437 | ||||||
JPMorgan Chase & Co. | 360,200 | 39,269,004 | ||||||
PNC Financial Services Group Inc. | 93,600 | 12,026,664 | ||||||
| 123,952,962 | ||||||||
Capital Goods 6.2% | ||||||||
Astec Industries Inc. | 105,800 | 3,979,138 | ||||||
The Greenbrier Cos. Inc. | 133,800 | 6,348,810 | ||||||
Johnson Controls International PLC | 341,600 | 10,920,952 | ||||||
Regal Beloit Corp. | 169,200 | 12,131,640 | ||||||
Terex Corp. | 329,800 | 11,012,022 | ||||||
aWESCO International Inc. | 230,300 | 11,556,454 | ||||||
| 55,949,016 | ||||||||
Commercial & Professional Services 1.4% | ||||||||
aFTI Consulting Inc. | 38,800 | 2,681,468 | ||||||
Tetra Tech Inc. | 155,000 | 10,236,200 | ||||||
| 12,917,668 | ||||||||
Consumer Durables & Apparel 2.1% | ||||||||
Lennar Corp., B | 223,900 | 8,008,903 | ||||||
Toll Brothers Inc. | 331,400 | 11,154,924 | ||||||
| 19,163,827 | ||||||||
Consumer Services 1.4% | ||||||||
Vail Resorts Inc. | 50,400 | 12,666,528 | ||||||
Diversified Financials 3.0% | ||||||||
The Bank of New York Mellon Corp. | 152,500 | 7,217,825 | ||||||
Capital One Financial Corp. | 116,000 | 10,358,800 | ||||||
Morgan Stanley | 207,500 | 9,474,450 | ||||||
| 27,051,075 | ||||||||
Energy 13.6% | ||||||||
Arch Coal Inc. | 84,700 | 8,122,730 | ||||||
Chevron Corp. | 163,400 | 18,243,610 | ||||||
aDril-Quip Inc. | 125,700 | 5,349,792 | ||||||
Husky Energy Inc. (Canada) | 702,700 | 9,935,985 | ||||||
Kinder Morgan Inc. | 1,994,000 | 33,937,880 | ||||||
aMcDermott International Inc. | 535,966 | 4,143,017 | ||||||
Occidental Petroleum Corp. | 185,600 | 12,448,192 | ||||||
Plains All American Pipeline LP | 115,800 | 2,520,966 | ||||||
aRowan Cos. PLC | 431,626 | 6,867,170 | ||||||
Royal Dutch Shell PLC, A, ADR (United Kingdom) | 270,500 | 17,092,895 | ||||||
Valero Energy Corp. | 40,900 | 3,725,581 | ||||||
| 122,387,818 | ||||||||
30 | Annual Report | franklintempleton.com | ||
FRANKLIN VALUE INVESTORS TRUST
STATEMENT OF INVESTMENTS
Franklin Balance Sheet Investment Fund(continued)
| Shares/ Units | Value | |||||||
Common Stocks and Other Equity Interests(continued) | ||||||||
Food, Beverage & Tobacco 4.2% | ||||||||
Archer-Daniels-Midland Co. | 297,300 | $ | 14,047,425 | |||||
Bunge Ltd. | 217,300 | 13,429,140 | ||||||
GrainCorp Ltd. (Australia) | 459,436 | 2,679,745 | ||||||
Molson Coors Brewing Co., B | 118,700 | 7,596,800 | ||||||
| 37,753,110 | ||||||||
Life & Health Insurance 2.4% | ||||||||
National Western Life Group Inc., A | 31,200 | 8,401,536 | ||||||
Prudential Financial Inc. | 140,500 | 13,176,090 | ||||||
| 21,577,626 | ||||||||
Materials 4.1% | ||||||||
Aperam SA (Luxembourg) | 158,800 | 5,412,019 | ||||||
Domtar Corp. | 178,200 | 8,252,442 | ||||||
The Mosaic Co. | 420,600 | 13,013,364 | ||||||
Reliance Steel & Aluminum Co. | 129,700 | 10,235,924 | ||||||
| 36,913,749 | ||||||||
Media 5.5% | ||||||||
aDiscovery Inc., C | 822,200 | 24,098,682 | ||||||
News Corp., B | 1,085,700 | 14,483,238 | ||||||
Scholastic Corp. | 242,578 | 10,523,034 | ||||||
| 49,104,954 | ||||||||
Multi-line Insurance 2.7% | ||||||||
American International Group Inc. | 332,500 | 13,728,925 | ||||||
The Hartford Financial Services Group Inc. | 224,300 | 10,187,706 | ||||||
| 23,916,631 | ||||||||
Pharmaceuticals, Biotechnology & Life Sciences 4.7% | ||||||||
Allergan PLC | 100,100 | 15,816,801 | ||||||
aBio-Rad Laboratories Inc., A | 58,228 | 15,887,510 | ||||||
Perrigo Co. PLC | 154,800 | 10,882,440 | ||||||
| 42,586,751 | ||||||||
Property & Casualty Insurance 1.2% | ||||||||
Chubb Ltd. | 86,132 | 10,758,748 | ||||||
Real Estate 2.5% | ||||||||
Mid-America Apartment Communities Inc. | 54,200 | 5,295,882 | ||||||
Regency Centers Corp. | 124,400 | 7,881,984 | ||||||
Tier REIT Inc. | 313,100 | 6,784,877 | ||||||
aTrinity Place Holdings Inc. | 499,834 | 2,669,113 | ||||||
| 22,631,856 | ||||||||
Reinsurance 1.1% | ||||||||
Everest Re Group Ltd. | 43,600 | 9,498,696 | ||||||
Retailing 2.4% | ||||||||
Dick’s Sporting Goods Inc. | 321,400 | 11,367,918 | ||||||
DSW Inc., A | 369,563 | 9,811,898 | ||||||
| 21,179,816 | ||||||||
| franklintempleton.com | Annual Report | 31 | ||
FRANKLIN VALUE INVESTORS TRUST
STATEMENT OF INVESTMENTS
Franklin Balance Sheet Investment Fund(continued)
| Shares/ Units | Value | |||||||
Common Stocks and Other Equity Interests(continued) | ||||||||
Semiconductors & Semiconductor Equipment 1.5% | ||||||||
Kulicke and Soffa Industries Inc. (Singapore) | 314,100 | $ | 6,385,653 | |||||
MKS Instruments Inc. | 50,489 | 3,720,534 | ||||||
aPhotronics Inc. | 316,006 | 3,077,899 | ||||||
| 13,184,086 | ||||||||
Technology Hardware & Equipment 5.7% | ||||||||
Corning Inc. | 1,300,900 | 41,563,756 | ||||||
aFabrinet (Thailand) | 102,400 | 4,435,968 | ||||||
Western Digital Corp. | 132,700 | 5,715,389 | ||||||
| 51,715,113 | ||||||||
Utilities 1.3% | ||||||||
Eversource Energy | 89,200 | 5,642,792 | ||||||
IDACORP Inc. | 61,500 | 5,735,490 | ||||||
| 11,378,282 | ||||||||
Total Common Stocks and Other Equity Interests (Cost $612,294,488) | 756,645,204 | |||||||
Convertible Preferred Stocks (Cost $4,379,375) 1.5% | ||||||||
Telecommunication Services 1.5% | ||||||||
Iridium Communications Inc., 6.75%, cvt., pfd., B | 20,000 | 13,419,280 | ||||||
| Principal Amount | ||||||||
Corporate Bonds 0.9% | ||||||||
Capital Goods 0.2% | ||||||||
Mueller Industries Inc., sub. bond, 6.00%, 3/01/27 | $ | 1,490,000 | 1,434,125 | |||||
Energy 0.4% | ||||||||
bMcDermott Technology Americas Inc., senior note, 144A, 10.625%, 5/01/24 | 4,000,000 | 3,610,000 | ||||||
Software & Services 0.3% | ||||||||
bVeritas US Inc./Veritas Bermuda Ltd., senior note, 144A, 10.50%, 2/01/24 | 3,647,000 | 3,154,655 | ||||||
Total Corporate Bonds (Cost $8,406,165) | 8,198,780 | |||||||
Total Investments before Short Term Investments (Cost $625,080,028) | 778,263,264 | |||||||
32 | Annual Report | franklintempleton.com | ||
FRANKLIN VALUE INVESTORS TRUST
STATEMENT OF INVESTMENTS
Franklin Balance Sheet Investment Fund(continued)
| Shares | Value | |||||||
Short Term Investments (Cost $122,533,811) 13.6% | ||||||||
Money Market Funds 13.6% | ||||||||
c,dInstitutional Fiduciary Trust Money Market Portfolio, 1.83% | 122,533,811 | $ | 122,533,811 | |||||
Total Investments (Cost $747,613,839) 100.2% | 900,797,075 | |||||||
Other Assets, less Liabilities (0.2)% | (1,491,458 | ) | ||||||
Net Assets 100.0% | $ | 899,305,617 | ||||||
See Abbreviations on page 69.
aNon-income producing.
bSecurity was purchased pursuant to Rule 144A under the Securities Act of 1933 and may be sold in transactions exempt from registration only to qualified institutional buyers or in a public offering registered under the Securities Act of 1933. These securities have been deemed liquid under guidelines approved by the Trust’s Board of Trustees. At October 31, 2018, the aggregate value of these securities was $6,764,655, representing 0.8% of net assets.
cSee Note 3(f) regarding investments in affiliated management investment companies.
dThe rate shown is the annualizedseven-day effective yield at period end.
| franklintempleton.com | The accompanying notes are an integral part of these financial statements. | Annual Report | 33 | ||
FRANKLIN VALUE INVESTORS TRUST
Financial Highlights
Franklin MicroCap Value Fund
| Year Ended October 31, | ||||||||||||||||||||
| 2018 | 2017 | 2016 | 2015 | 2014 | ||||||||||||||||
Class A | ||||||||||||||||||||
Per share operating performance | ||||||||||||||||||||
(for a share outstanding throughout the year) | ||||||||||||||||||||
Net asset value, beginning of year | $36.43 | $31.33 | $32.90 | $39.88 | $40.99 | |||||||||||||||
Income from investment operationsa: | ||||||||||||||||||||
Net investment income (loss)b | (0.04) | 0.01 | 0.11 | c | — | d | (0.07) | e | ||||||||||||
Net realized and unrealized gains (losses) | (2.70) | 8.20 | 2.22 | (3.33) | 1.44 | |||||||||||||||
Total from investment operations | (2.74) | 8.21 | 2.33 | (3.33) | 1.37 | |||||||||||||||
Less distributions from: | ||||||||||||||||||||
Net investment income | (—) | d | (0.11) | — | — | (0.04) | ||||||||||||||
Net realized gains | (2.63) | (3.00) | (3.90) | (3.65) | (2.44) | |||||||||||||||
Total distributions | (2.63) | (3.11) | (3.90) | (3.65) | (2.48) | |||||||||||||||
Net asset value, end of year | $31.06 | $36.43 | $31.33 | $32.90 | $39.88 | |||||||||||||||
Total returnf | (8.11)% | 26.98% | 8.25% | (8.58)% | 3.39% | |||||||||||||||
Ratios to average net assets | ||||||||||||||||||||
Expenses before waiver and payments by affiliates | 1.17% | 1.16% | 1.19% | 1.20% | 1.16% | |||||||||||||||
Expenses net of waiver and payments by affiliates | 1.16% | g | 1.15% | g | 1.18% | g | 1.19% | 1.14% | g | |||||||||||
Net investment income (loss) | (0.11)% | 0.03% | 0.36% | c | 0.02% | (0.17)% | e | |||||||||||||
Supplemental data | ||||||||||||||||||||
Net assets, end of year (000’s) | $184,613 | $238,337 | $232,964 | $258,143 | $346,820 | |||||||||||||||
Portfolio turnover rate | 4.08% | 8.82% | 11.72% | 8.64% | 11.63% | |||||||||||||||
aThe amount shown for a share outstanding throughout the period may not correlate with the Statement of Operations for the period due to the timing of sales and repurchases of the Fund’s shares in relation to income earned and/or fluctuating fair value of the investments of the Fund.
bBased on average daily shares outstanding.
cNet investment income per share includes approximately $0.07 per share related to income received in the form of special dividends in connection with certain Fund holdings. Excluding this amount, the ratio of net investment income to average net assets would have been 0.13%.
dAmount rounds to less than $0.01 per share.
eNet investment income per share includes approximately $0.06 per share related to income received in the form of special dividends in connection with certain Fund holdings. Excluding this amount, the ratio of net investment income to average net assets would have been (0.31)%.
fTotal return does not reflect sales commissions or contingent deferred sales charges, if applicable.
gBenefit of expense reduction rounds to less than 0.01%.
34 | Annual Report | The accompanying notes are an integral part of these financial statements. | franklintempleton.com | ||
FRANKLIN VALUE INVESTORS TRUST
FINANCIAL HIGHLIGHTS
Franklin MicroCap Value Fund(continued)
| Year Ended October 31, | ||||||||||||||||||||
| 2018 | 2017 | 2016 | 2015 | 2014 | ||||||||||||||||
Class R6 | ||||||||||||||||||||
Per share operating performance | ||||||||||||||||||||
(for a share outstanding throughout the year) | ||||||||||||||||||||
Net asset value, beginning of year | $36.85 | $31.66 | $33.09 | $39.94 | $41.03 | |||||||||||||||
Income from investment operationsa: | ||||||||||||||||||||
Net investment incomeb | 0.08 | 0.12 | 0.22 | c | 0.14 | 0.03 | d | |||||||||||||
Net realized and unrealized gains (losses) | (2.74 | ) | 8.30 | 2.25 | (3.34 | ) | 1.50 | |||||||||||||
Total from investment operations | (2.66 | ) | 8.42 | 2.47 | (3.20 | ) | 1.53 | |||||||||||||
Less distributions from: | ||||||||||||||||||||
Net investment income | (0.13 | ) | (0.23 | ) | — | — | (0.18 | ) | ||||||||||||
Net realized gains | (2.63 | ) | (3.00 | ) | (3.90 | ) | (3.65 | ) | (2.44 | ) | ||||||||||
Total distributions | (2.76 | ) | (3.23 | ) | (3.90 | ) | (3.65 | ) | (2.62 | ) | ||||||||||
Net asset value, end of year | $31.43 | $36.85 | $31.66 | $33.09 | $39.94 | |||||||||||||||
Total return | (7.83)% | 27.46% | 8.67% | (8.21)% | 3.79% | |||||||||||||||
Ratios to average net assets | ||||||||||||||||||||
Expenses before waiver and payments by affiliates | 0.85% | 0.80% | 0.81% | 0.81% | 0.79% | |||||||||||||||
Expenses net of waiver and payments by affiliates | 0.82% | e | 0.79% | e | 0.80% | e | 0.80% | 0.77% | e | |||||||||||
Net investment income | 0.23% | 0.39% | 0.74% | c | 0.41% | 0.20% | d | |||||||||||||
Supplemental data | ||||||||||||||||||||
Net assets, end of year (000’s) | $21,070 | $27,107 | $18,288 | $18,031 | $25,020 | |||||||||||||||
Portfolio turnover rate | 4.08% | 8.82% | 11.72% | 8.64% | 11.63% | |||||||||||||||
aThe amount shown for a share outstanding throughout the period may not correlate with the Statement of Operations for the period due to the timing of sales and repurchases of the Fund’s shares in relation to income earned and/or fluctuating fair value of the investments of the Fund.
bBased on average daily shares outstanding.
cNet investment income per share includes approximately $0.07 per share related to income received in the form of special dividends in connection with certain Fund holdings. Excluding this amount, the ratio of net investment income to average net assets would have been 0.51%.
dNet investment income per share includes approximately $0.06 per share related to income received in the form of special dividends in connection with certain Fund holdings. Excluding this amount, the ratio of net investment income to average net assets would have been 0.06%.
eBenefit of expense reduction rounds to less than 0.01%.
| franklintempleton.com | The accompanying notes are an integral part of these financial statements. | Annual Report | 35 | ||
FRANKLIN VALUE INVESTORS TRUST
FINANCIAL HIGHLIGHTS
Franklin MicroCap Value Fund(continued)
| Year Ended October 31, | ||||||||||||||||||||
| 2018 | 2017 | 2016 | 2015 | 2014 | ||||||||||||||||
Advisor Class | ||||||||||||||||||||
Per share operating performance | ||||||||||||||||||||
(for a share outstanding throughout the year) | ||||||||||||||||||||
Net asset value, beginning of year | $36.67 | $31.52 | $33.00 | $39.90 | $40.99 | |||||||||||||||
Income from investment operationsa: | ||||||||||||||||||||
Net investment incomeb | 0.05 | 0.09 | 0.18 | c | 0.09 | 0.04 | d | |||||||||||||
Net realized and unrealized gains (losses) | (2.72 | ) | 8.25 | 2.24 | (3.34 | ) | 1.43 | |||||||||||||
Total from investment operations | (2.67 | ) | 8.34 | 2.42 | (3.25 | ) | 1.47 | |||||||||||||
Less distributions from: | ||||||||||||||||||||
Net investment income | (0.09 | ) | (0.19 | ) | — | — | (0.12 | ) | ||||||||||||
Net realized gains | (2.63 | ) | (3.00 | ) | (3.90 | ) | (3.65 | ) | (2.44 | ) | ||||||||||
Total distributions | (2.72 | ) | (3.19 | ) | (3.90 | ) | (3.65 | ) | (2.56 | ) | ||||||||||
Net asset value, end of year | $31.28 | $36.67 | $31.52 | $33.00 | $39.90 | |||||||||||||||
Total return | (7.90)% | 27.29% | 8.53% | (8.36)% | 3.64% | |||||||||||||||
Ratios to average net assets | ||||||||||||||||||||
Expenses before waiver and payments by affiliates | 0.92% | 0.92% | 0.95% | 0.96% | 0.92% | |||||||||||||||
Expenses net of waiver and payments by affiliates | 0.91% | e | 0.91% | e | 0.94% | e | 0.95% | 0.90% | e | |||||||||||
Net investment income | 0.14% | 0.27% | 0.60% | c | 0.26% | 0.07% | d | |||||||||||||
Supplemental data | ||||||||||||||||||||
Net assets, end of year (000’s) | $53,329 | $76,228 | $63,410 | $67,538 | $89,880 | |||||||||||||||
Portfolio turnover rate | 4.08% | 8.82% | 11.72% | 8.64% | 11.63% | |||||||||||||||
aThe amount shown for a share outstanding throughout the period may not correlate with the Statement of Operations for the period due to the timing of sales and repurchases of the Fund’s shares in relation to income earned and/or fluctuating fair value of the investments of the Fund.
bBased on average daily shares outstanding.
cNet investment income per share includes approximately $0.07 per share related to income received in the form of special dividends in connection with certain Fund holdings. Excluding this amount, the ratio of net investment income to average net assets would have been 0.37%.
dNet investment income per share includes approximately $0.06 per share related to income received in the form of special dividends in connection with certain Fund holdings. Excluding this amount, the ratio of net investment income to average net assets would have been (0.07)%.
eBenefit of expense reduction rounds to less than 0.01%.
36 | Annual Report | The accompanying notes are an integral part of these financial statements. | franklintempleton.com | ||
FRANKLIN VALUE INVESTORS TRUST
Statement of Investments, October 31, 2018
Franklin MicroCap Value Fund
| Shares | Value | |||||||
Common Stocks and Other Equity Interests 96.6% | ||||||||
Aerospace & Defense 3.2% | ||||||||
aDucommun Inc. | 186,900 | $ | 6,945,204 | |||||
aSparton Corp. | 113,503 | 1,405,167 | ||||||
|
| |||||||
| 8,350,371 | ||||||||
Banks 17.1% | ||||||||
Bar Harbor Bankshares | 272,000 | 6,955,040 | ||||||
County Bancorp Inc. | 36,159 | 752,649 | ||||||
First Defiance Financial Corp. | 201,600 | 5,487,552 | ||||||
First Internet Bancorp | 206,800 | 5,329,236 | ||||||
Investar Holding Corp. | 220,000 | 5,739,800 | ||||||
Northeast Bancorp | 303,465 | 5,708,177 | ||||||
Old Line Bancshares Inc. | 54,000 | 1,616,760 | ||||||
Peoples Financial Services Corp. | 87,543 | 3,730,207 | ||||||
Southern Missouri Bancorp Inc. | 114,000 | 3,838,380 | ||||||
WSFS Financial Corp. | 121,800 | 5,180,154 | ||||||
|
| |||||||
| 44,337,955 | ||||||||
Building Products 3.7% | ||||||||
Burnham Holdings Inc., A | 200,000 | 2,998,000 | ||||||
a,bContinental Materials Corp. | 88,712 | 1,375,480 | ||||||
aGibraltar Industries Inc. | 149,900 | 5,342,436 | ||||||
|
| |||||||
| 9,715,916 | ||||||||
Commercial & Professional Services 2.8% | ||||||||
Healthcare Services Group Inc. | 179,800 | 7,298,082 | ||||||
|
| |||||||
Construction & Engineering 7.6% | ||||||||
aAmeresco Inc., A | 458,200 | 7,500,734 | ||||||
aNorthwest Pipe Co. | 287,600 | 5,122,156 | ||||||
aOrion Group Holdings Inc. | 445,000 | 2,100,400 | ||||||
aSterling Construction Co. | 337,382 | 3,832,660 | ||||||
aWilliams Industrial Services Group Inc. | 671,900 | 1,175,825 | ||||||
|
| |||||||
| 19,731,775 | ||||||||
Consumer Durables & Apparel 5.5% | ||||||||
a,bDelta Apparel Inc. | 392,800 | 7,490,696 | ||||||
Flexsteel Industries Inc. | 52,900 | 1,344,718 | ||||||
Rocky Brands Inc. | 192,920 | 5,540,662 | ||||||
|
| |||||||
| 14,376,076 | ||||||||
Consumer Services 2.0% | ||||||||
a,bFull House Resorts Inc. | 1,857,420 | 5,089,331 | ||||||
|
| |||||||
Diversified Financials 1.1% | ||||||||
Arbor Realty Trust Inc. | 220,000 | 2,657,600 | ||||||
a,bOrigen Financial Inc. | 1,900,000 | 172,900 | ||||||
|
| |||||||
| 2,830,500 | ||||||||
Electrical Equipment 2.6% | ||||||||
LSI Industries Inc. | 457,200 | 1,975,104 | ||||||
Powell Industries Inc. | 60,000 | 1,749,600 | ||||||
aUltralife Corp. | 426,600 | 2,888,082 | ||||||
|
| |||||||
| 6,612,786 | ||||||||
| franklintempleton.com | Annual Report | 37 | ||
FRANKLIN VALUE INVESTORS TRUST
STATEMENT OF INVESTMENTS
Franklin MicroCap Value Fund(continued)
| Shares | Value | |||||||
Common Stocks and Other Equity Interests(continued) | ||||||||
Energy 7.4% | ||||||||
Adams Resources & Energy Inc. | 24,626 | $ | 998,585 | |||||
aArdmore Shipping Corp. (Ireland) | 489,000 | 3,158,940 | ||||||
aCloud Peak Energy Inc. | 580,000 | 991,800 | ||||||
Gulf Island Fabrication Inc. | 227,000 | 1,929,500 | ||||||
aNatural Gas Services Group Inc. | 182,000 | 3,512,600 | ||||||
aPacific Ethanol Inc. | 686,200 | 1,125,368 | ||||||
aPHI Inc. | 17,600 | 145,728 | ||||||
aPHI Inc.,non-voting | 251,700 | 1,960,743 | ||||||
aRenewable Energy Group Inc. | 126,400 | 3,928,512 | ||||||
aREX American Resources Corp. | 18,225 | 1,351,748 | ||||||
|
| |||||||
| 19,103,524 | ||||||||
Food & Staples Retailing 2.2% | ||||||||
Village Super Market Inc., A | 227,000 | 5,593,280 | ||||||
|
| |||||||
Food, Beverage & Tobacco 4.7% | ||||||||
John B. Sanfilippo & Son Inc. | 17,600 | 1,109,856 | ||||||
aSeneca Foods Corp., A | 221,500 | 7,006,045 | ||||||
aSeneca Foods Corp., B | 121,500 | 3,958,470 | ||||||
|
| |||||||
| 12,074,371 | ||||||||
Health Care Equipment & Services 1.7% | ||||||||
Invacare Corp. | 340,000 | 4,392,800 | ||||||
|
| |||||||
Insurance 1.9% | ||||||||
aACMAT Corp., A | 176,650 | 4,836,677 | ||||||
|
| |||||||
Machinery 9.5% | ||||||||
Alamo Group Inc. | 68,300 | 5,854,676 | ||||||
aFreightcar America Inc. | 152,700 | 2,183,610 | ||||||
Hurco Cos. Inc. | 160,800 | 6,550,992 | ||||||
Miller Industries Inc. | 303,300 | 7,330,761 | ||||||
Spartan Motors Inc. | 405,200 | 2,726,996 | ||||||
|
| |||||||
| 24,647,035 | ||||||||
Materials 7.5% | ||||||||
Friedman Industries Inc. | 120,000 | 1,056,000 | ||||||
Mercer International Inc. (Canada) | 200,000 | 3,042,000 | ||||||
The Monarch Cement Co. | 93,000 | 6,313,770 | ||||||
Olympic Steel Inc. | 141,400 | 2,666,804 | ||||||
Schnitzer Steel Industries Inc., A | 63,200 | 1,700,080 | ||||||
aUniversal Stainless & Alloy Products Inc. | 235,700 | 4,629,148 | ||||||
|
| |||||||
| 19,407,802 | ||||||||
Real Estate 1.7% | ||||||||
Griffin Industrial Realty Inc. | 122,000 | 4,284,640 | ||||||
|
| |||||||
Retailing 4.3% | ||||||||
Caleres Inc. | 161,000 | 5,506,200 | ||||||
Haverty Furniture Cos. Inc. | 155,000 | 3,143,400 | ||||||
Shoe Carnival Inc. | 62,800 | 2,557,844 | ||||||
|
| |||||||
| 11,207,444 | ||||||||
Semiconductors & Semiconductor Equipment 1.7% | ||||||||
aPhotronics Inc. | 452,000 | 4,402,480 | ||||||
|
| |||||||
38 | Annual Report | franklintempleton.com | ||
FRANKLIN VALUE INVESTORS TRUST
STATEMENT OF INVESTMENTS
Franklin MicroCap Value Fund(continued)
| Shares | Value | |||||||
Common Stocks and Other Equity Interests(continued) | ||||||||
Technology Hardware & Equipment 3.0% | ||||||||
aKey Tronic Corp. | 480,000 | $ | 3,518,400 | |||||
aKimball Electronics Inc. | 79,000 | 1,453,600 | ||||||
Richardson Electronics Ltd. | 375,000 | 2,865,000 | ||||||
|
| |||||||
| 7,837,000 | ||||||||
|
| |||||||
Telecommunication Services 3.1% | ||||||||
aAlaska Communications Systems Group Inc. | 1,155,600 | 1,687,176 | ||||||
ATN International Inc. | 45,300 | 3,827,397 | ||||||
North State Telecommunications Corp., B | 1,857 | 104,791 | ||||||
aORBCOMM Inc. | 250,000 | 2,382,500 | ||||||
|
| |||||||
| 8,001,864 | ||||||||
|
| |||||||
Trading Companies & Distributors 2.0% | ||||||||
a,cCentral Steel and Wire Co. | 2,750 | — | ||||||
aHouston Wire & Cable Co. | 375,350 | 2,345,937 | ||||||
aTitan Machinery Inc. | 202,400 | 2,884,200 | ||||||
|
| |||||||
| 5,230,137 | ||||||||
|
| |||||||
Transportation 0.3% | ||||||||
aCeladon Group Inc. | 395,300 | 913,143 | ||||||
|
| |||||||
Total Common Stocks and Other Equity Interests (Cost $146,206,944) | 250,274,989 | |||||||
|
| |||||||
Short Term Investments (Cost $8,437,728) 3.3% | ||||||||
Money Market Funds 3.3% | ||||||||
d,eInstitutional Fiduciary Trust Money Market Portfolio, 1.83% | 8,437,728 | 8,437,728 | ||||||
|
| |||||||
Total Investments (Cost $154,644,672) 99.9% | 258,712,717 | |||||||
Other Assets, less Liabilities 0.1% | 299,347 | |||||||
|
| |||||||
Net Assets 100.0% | $ | 259,012,064 | ||||||
|
| |||||||
aNon-income producing.
bSee Note 7 regarding holdings of 5% voting securities.
cFair valued using significant unobservable inputs. See Note 10 regarding fair value measurements.
dSee Note 3(f) regarding investments in affiliated management investment companies.
eThe rate shown is the annualizedseven-day effective yield at period end.
| franklintempleton.com | The accompanying notes are an integral part of these financial statements. | Annual Report | 39 | ||
FRANKLIN VALUE INVESTORS TRUST
Financial Highlights
Franklin Small Cap Value Fund
| Year Ended October 31, | ||||||||||||||||||||
| 2018 | 2017 | 2016 | 2015 | 2014 | ||||||||||||||||
Class A | ||||||||||||||||||||
Per share operating performance | ||||||||||||||||||||
(for a share outstanding throughout the year) | ||||||||||||||||||||
Net asset value, beginning of year | $59.07 | $51.45 | $51.72 | $58.96 | $59.76 | |||||||||||||||
Income from investment operationsa: | ||||||||||||||||||||
Net investment incomeb | 0.39 | c | 0.31 | d | 0.20 | 0.30 | e | 0.16 | f | |||||||||||
Net realized and unrealized gains (losses) | (1.95 | ) | 10.04 | 4.74 | (2.33 | ) | 2.03 | |||||||||||||
Total from investment operations | (1.56 | ) | 10.35 | 4.94 | (2.03 | ) | 2.19 | |||||||||||||
Less distributions from: | ||||||||||||||||||||
Net investment income | (0.42 | ) | (0.12 | ) | (0.29 | ) | (0.12 | ) | (0.25 | ) | ||||||||||
Net realized gains | (4.50 | ) | (2.61 | ) | (4.92 | ) | (5.09 | ) | (2.74 | ) | ||||||||||
Total distributions | (4.92 | ) | (2.73 | ) | (5.21 | ) | (5.21 | ) | (2.99 | ) | ||||||||||
Net asset value, end of year | $52.59 | $59.07 | $51.45 | $51.72 | $58.96 | |||||||||||||||
Total returng | (3.04)% | 20.53% | 11.15% | (3.31)% | 3.76% | |||||||||||||||
Ratios to average net assets | ||||||||||||||||||||
Expenses before waiver and payments by affiliates | 1.05% | 1.05% | 1.11% | 1.16% | 1.13% | |||||||||||||||
Expenses net of waiver and payments by affiliates | 1.03% | h | 1.03% | h | 1.09% | h | 1.15% | 1.13% | h,i | |||||||||||
Net investment income | 0.69% | c | 0.58% | d | 0.40% | 0.56% | e | 0.27% | f | |||||||||||
Supplemental data | ||||||||||||||||||||
Net assets, end of year (000’s) | $1,366,866 | $1,364,629 | $1,125,268 | $1,062,353 | $1,294,724 | |||||||||||||||
Portfolio turnover rate | 53.26% | 33.38% | 41.89% | 25.88% | 21.30% | |||||||||||||||
aThe amount shown for a share outstanding throughout the period may not correlate with the Statement of Operations for the period due to the timing of sales and repurchases of the Fund’s shares in relation to income earned and/or fluctuating fair value of the investments of the Fund.
bBased on average daily shares outstanding.
cNet investment income per share includes approximately $0.09 per share related to income received in the form of special dividends in connection with certain Fund holdings. Excluding this amount, the ratio of net investment income to average net assets would have been 0.52%.
dNet investment income per share includes approximately $0.16 per share related to income received in the form of special dividends in connection with certain Fund holdings. Excluding this amount, the ratio of net investment income to average net assets would have been 0.29%.
eNet investment income per share includes approximately $0.11 per share related to income received in the form of special dividends in connection with certain Fund holdings. Excluding this amount, the ratio of net investment income to average net assets would have been 0.36%.
fNet investment income per share includes approximately $0.04 per share related to income received in the form of special dividends in connection with certain Fund holdings. Excluding this amount, the ratio of net investment income to average net assets would have been 0.21%.
gTotal return does not reflect sales commissions or contingent deferred sales charges, if applicable.
hBenefit of expense reduction rounds to less than 0.01%.
iBenefit of waiver and payments by affiliates rounds to less than 0.01%.
40 | Annual Report | The accompanying notes are an integral part of these financial statements. | franklintempleton.com | ||
FRANKLIN VALUE INVESTORS TRUST
FINANCIAL HIGHLIGHTS
Franklin Small Cap Value Fund(continued)
| Year Ended October 31, | ||||||||||||||||||||
| 2018 | 2017 | 2016 | 2015 | 2014 | ||||||||||||||||
Class C | ||||||||||||||||||||
Per share operating performance | ||||||||||||||||||||
(for a share outstanding throughout the year) | ||||||||||||||||||||
Net asset value, beginning of year | $52.75 | $46.42 | $47.22 | $54.53 | $55.62 | |||||||||||||||
Income from investment operationsa: | ||||||||||||||||||||
Net investment income (loss)b | (0.02 | )c | (0.09 | )d | (0.14 | ) | (0.07 | )e | (0.24 | )f | ||||||||||
Net realized and unrealized gains (losses) | (1.72 | ) | 9.03 | 4.26 | (2.15 | ) | 1.89 | |||||||||||||
Total from investment operations | (1.74 | ) | 8.94 | 4.12 | (2.22 | ) | 1.65 | |||||||||||||
Less distributions from: | ||||||||||||||||||||
Net investment income | (0.06 | ) | — | — | — | — | ||||||||||||||
Net realized gains | (4.50 | ) | (2.61 | ) | (4.92 | ) | (5.09 | ) | (2.74 | ) | ||||||||||
Total distributions | (4.56 | ) | (2.61 | ) | (4.92 | ) | (5.09 | ) | (2.74 | ) | ||||||||||
Net asset value, end of year | $46.45 | $52.75 | $46.42 | $47.22 | $54.53 | |||||||||||||||
Total returng | (3.77)% | 19.62% | 10.35% | (4.01)% | 3.03% | |||||||||||||||
Ratios to average net assets | ||||||||||||||||||||
Expenses before waiver and payments by affiliates | 1.80% | 1.80% | 1.86% | 1.87% | 1.83% | |||||||||||||||
Expenses net of waiver and payments by affiliates | 1.78% | h | 1.78% | h | 1.84% | h | 1.86% | 1.83% | h,i | |||||||||||
Net investment income (loss) | (0.06)% | c | (0.17)% | d | (0.35)% | (0.15)% | e | (0.43)% | f | |||||||||||
Supplemental data | ||||||||||||||||||||
Net assets, end of year (000’s) | $138,188 | $225,228 | $219,150 | $229,119 | $266,845 | |||||||||||||||
Portfolio turnover rate | 53.26% | 33.38% | 41.89% | 25.88% | 21.30% | |||||||||||||||
aThe amount shown for a share outstanding throughout the period may not correlate with the Statement of Operations for the period due to the timing of sales and repurchases of the Fund’s shares in relation to income earned and/or fluctuating fair value of the investments of the Fund.
bBased on average daily shares outstanding.
cNet investment income per share includes approximately $0.09 per share related to income received in the form of special dividends in connection with certain Fund holdings. Excluding this amount, the ratio of net investment income to average net assets would have been (0.23)%.
dNet investment income per share includes approximately $0.16 per share related to income received in the form of special dividends in connection with certain Fund holdings. Excluding this amount, the ratio of net investment income to average net assets would have been (0.46)%.
eNet investment income per share includes approximately $0.11 per share related to income received in the form of special dividends in connection with certain Fund holdings. Excluding this amount, the ratio of net investment income to average net assets would have been (0.35)%.
fNet investment income per share includes approximately $0.04 per share related to income received in the form of special dividends in connection with certain Fund holdings. Excluding this amount, the ratio of net investment income to average net assets would have been (0.49)%.
gTotal return does not reflect sales commissions or contingent deferred sales charges, if applicable.
hBenefit of expense reduction rounds to less than 0.01%.
iBenefit of waiver and payments by affiliates rounds to less than 0.01%.
| franklintempleton.com | The accompanying notes are an integral part of these financial statements. | Annual Report | 41 | ||
FRANKLIN VALUE INVESTORS TRUST
FINANCIAL HIGHLIGHTS
Franklin Small Cap Value Fund(continued)
| Year Ended October 31, | ||||||||||||||||||||
| 2018 | 2017 | 2016 | 2015 | 2014 | ||||||||||||||||
Class R | ||||||||||||||||||||
Per share operating performance | ||||||||||||||||||||
(for a share outstanding throughout the year) | ||||||||||||||||||||
Net asset value, beginning of year | $58.37 | $50.87 | $51.18 | $58.40 | $59.21 | |||||||||||||||
Income from investment operationsa: | ||||||||||||||||||||
Net investment incomeb | 0.25 | c | 0.18 | d | 0.08 | 0.19 | e | 0.04 | f | |||||||||||
Net realized and unrealized gains (losses) | (1.93 | ) | 9.93 | 4.69 | (2.32 | ) | 2.02 | |||||||||||||
Total from investment operations | (1.68 | ) | 10.11 | 4.77 | (2.13 | ) | 2.06 | |||||||||||||
Less distributions from: | ||||||||||||||||||||
Net investment income | (0.21 | ) | — | (0.16 | ) | (— | )g | (0.13 | ) | |||||||||||
Net realized gains | (4.50 | ) | (2.61 | ) | (4.92 | ) | (5.09 | ) | (2.74 | ) | ||||||||||
Total distributions | (4.71 | ) | (2.61 | ) | (5.08 | ) | (5.09 | ) | (2.87 | ) | ||||||||||
Net asset value, end of year | $51.98 | $58.37 | $50.87 | $51.18 | $58.40 | |||||||||||||||
Total return | (3.28)% | 20.23% | 10.90% | (3.53 | )% | 3.55% | ||||||||||||||
Ratios to average net assets | ||||||||||||||||||||
Expenses before waiver and payments by affiliates | 1.30% | 1.30% | 1.36% | 1.37% | 1.33% | |||||||||||||||
Expenses net of waiver and payments by affiliates | 1.28% | h | 1.28% | h | 1.34% | h | 1.36% | 1.33% | h,i | |||||||||||
Net investment income | 0.44% | c | 0.33% | d | 0.15% | 0.35% | e | 0.07% | f | |||||||||||
Supplemental data | ||||||||||||||||||||
Net assets, end of year (000’s) | $158,678 | $209,627 | $212,194 | $221,939 | $280,908 | |||||||||||||||
Portfolio turnover rate | 53.26% | 33.38% | 41.89% | 25.88% | 21.30% | |||||||||||||||
aThe amount shown for a share outstanding throughout the period may not correlate with the Statement of Operations for the period due to the timing of sales and repurchases of the Fund’s shares in relation to income earned and/or fluctuating fair value of the investments of the Fund.
bBased on average daily shares outstanding.
cNet investment income per share includes approximately $0.09 per share related to income received in the form of special dividends in connection with certain Fund holdings. Excluding this amount, the ratio of net investment income to average net assets would have been 0.27%.
dNet investment income per share includes approximately $0.16 per share related to income received in the form of special dividends in connection with certain Fund holdings. Excluding this amount, the ratio of net investment income to average net assets would have been 0.04%.
eNet investment income per share includes approximately $0.11 per share related to income received in the form of special dividends in connection with certain Fund holdings. Excluding this amount, the ratio of net investment income to average net assets would have been 0.15%.
fNet investment income per share includes approximately $0.04 per share related to income received in the form of special dividends in connection with certain Fund holdings. Excluding this amount, the ratio of net investment income to average net assets would have been 0.01%.
gAmount rounds to less than $0.01 per share.
hBenefit of expense reduction rounds to less than 0.01%.
iBenefit of waiver and payments by affiliates rounds to less than 0.01%.
42 | Annual Report | The accompanying notes are an integral part of these financial statements. | franklintempleton.com | ||
FRANKLIN VALUE INVESTORS TRUST
FINANCIAL HIGHLIGHTS
Franklin Small Cap Value Fund(continued)
| Year Ended October 31, | ||||||||||||||||||||
| 2018 | 2017 | 2016 | 2015 | 2014 | ||||||||||||||||
Class R6 | ||||||||||||||||||||
Per share operating performance | ||||||||||||||||||||
(for a share outstanding throughout the year) | ||||||||||||||||||||
Net asset value, beginning of year | $61.71 | $53.60 | $53.75 | $61.09 | $61.78 | |||||||||||||||
Income from investment operationsa: | ||||||||||||||||||||
Net investment incomeb | 0.66 | c | 0.58 | d | 0.43 | 0.62 | e | 0.42 | f | |||||||||||
Net realized and unrealized gains (losses) | (2.05 | ) | 10.49 | 4.93 | (2.43 | ) | 2.16 | |||||||||||||
Total from investment operations | (1.39 | ) | 11.07 | 5.36 | (1.81 | ) | 2.58 | |||||||||||||
Less distributions from: | ||||||||||||||||||||
Net investment income | (0.65 | ) | (0.35 | ) | (0.59 | ) | (0.44 | ) | (0.53 | ) | ||||||||||
Net realized gains | (4.50 | ) | (2.61 | ) | (4.92 | ) | (5.09 | ) | (2.74 | ) | ||||||||||
Total distributions | (5.15 | ) | (2.96 | ) | (5.51 | ) | (5.53 | ) | (3.27 | ) | ||||||||||
Net asset value, end of year | $55.17 | $61.71 | $53.60 | $53.75 | $61.09 | |||||||||||||||
Total return | (2.63)% | 21.07% | 11.69% | (2.80)% | 4.31% | |||||||||||||||
Ratios to average net assets | ||||||||||||||||||||
Expenses before waiver and payments by affiliates | 0.66% | 0.60% | 0.64% | 0.62% | 0.60% | |||||||||||||||
Expenses net of waiver and payments by affiliates | 0.60% | g | 0.58% | g | 0.62% | g | 0.61% | 0.60% | g,h | |||||||||||
Net investment income | 1.12% | c | 1.03% | d | 0.87% | 1.10% | e | 0.80% | f | |||||||||||
Supplemental data | ||||||||||||||||||||
Net assets, end of year (000’s) | $270,426 | $221,246 | $100,101 | $59,339 | $34,278 | |||||||||||||||
Portfolio turnover rate | 53.26% | 33.38% | 41.89% | 25.88% | 21.30% | |||||||||||||||
aThe amount shown for a share outstanding throughout the period may not correlate with the Statement of Operations for the period due to the timing of sales and repurchases of the Fund’s shares in relation to income earned and/or fluctuating fair value of the investments of the Fund.
bBased on average daily shares outstanding.
cNet investment income per share includes approximately $0.09 per share related to income received in the form of special dividends in connection with certain Fund holdings. Excluding this amount, the ratio of net investment income to average net assets would have been 0.95%.
dNet investment income per share includes approximately $0.16 per share related to income received in the form of special dividends in connection with certain Fund holdings. Excluding this amount, the ratio of net investment income to average net assets would have been 0.74%.
eNet investment income per share includes approximately $0.11 per share related to income received in the form of special dividends in connection with certain Fund holdings. Excluding this amount, the ratio of net investment income to average net assets would have been 0.90%.
fNet investment income per share includes approximately $0.04 per share related to income received in the form of special dividends in connection with certain Fund holdings. Excluding this amount, the ratio of net investment income to average net assets would have been 0.74%.
gBenefit of expense reduction rounds to less than 0.01%.
hBenefit of waiver and payments by affiliates rounds to less than 0.01%.
| franklintempleton.com | The accompanying notes are an integral part of these financial statements. | Annual Report | 43 | ||
FRANKLIN VALUE INVESTORS TRUST
FINANCIAL HIGHLIGHTS
Franklin Small Cap Value Fund(continued)
| Year Ended October 31, | ||||||||||||||||||||
| 2018 | 2017 | 2016 | 2015 | 2014 | ||||||||||||||||
Advisor Class | ||||||||||||||||||||
Per share operating performance | ||||||||||||||||||||
(for a share outstanding throughout the year) | ||||||||||||||||||||
Net asset value, beginning of year | $61.66 | $53.58 | $53.67 | $61.01 | $61.72 | |||||||||||||||
Income from investment operationsa: | ||||||||||||||||||||
Net investment incomeb | 0.56 | c | 0.48 | d | 0.32 | 0.47 | e | 0.34 | f | |||||||||||
Net realized and unrealized gains (losses) | (2.06 | ) | 10.48 | 4.94 | (2.41 | ) | 2.10 | |||||||||||||
Total from investment operations | (1.50 | ) | 10.96 | 5.26 | (1.94 | ) | 2.44 | |||||||||||||
Less distributions from: | ||||||||||||||||||||
Net investment income | (0.47 | ) | (0.27 | ) | (0.43 | ) | (0.31 | ) | (0.41 | ) | ||||||||||
Net realized gains | (4.50 | ) | (2.61 | ) | (4.92 | ) | (5.09 | ) | (2.74 | ) | ||||||||||
Total distributions | (4.97 | ) | (2.88 | ) | (5.35 | ) | (5.40 | ) | (3.15 | ) | ||||||||||
Net asset value, end of year | $55.19 | $61.66 | $53.58 | $53.67 | $61.01 | |||||||||||||||
Total return | (2.81)% | 20.84% | 11.43% | (3.03)% | 4.07% | |||||||||||||||
Ratios to average net assets | ||||||||||||||||||||
Expenses before waiver and payments by affiliates | 0.80% | 0.80% | 0.86% | 0.87% | 0.83% | |||||||||||||||
Expenses net of waiver and payments by affiliates | 0.78% | g | 0.78% | g | 0.84% | g | 0.86% | 0.83% | g,h | |||||||||||
Net investment income | 0.94% | c | 0.83% | d | 0.65% | 0.85% | e | 0.57% | f | |||||||||||
Supplemental data | ||||||||||||||||||||
Net assets, end of year (000’s) | $544,792 | $583,364 | $893,324 | $635,499 | $816,430 | |||||||||||||||
Portfolio turnover rate | 53.26% | 33.38% | 41.89% | 25.88% | 21.30% | |||||||||||||||
aThe amount shown for a share outstanding throughout the period may not correlate with the Statement of Operations for the period due to the timing of sales and repurchases of the Fund’s shares in relation to income earned and/or fluctuating fair value of the investments of the Fund.
bBased on average daily shares outstanding.
cNet investment income per share includes approximately $0.09 per share related to income received in the form of special dividends in connection with certain Fund holdings. Excluding this amount, the ratio of net investment income to average net assets would have been 0.77%.
dNet investment income per share includes approximately $0.16 per share related to income received in the form of special dividends in connection with certain Fund holdings. Excluding this amount, the ratio of net investment income to average net assets would have been 0.54%.
eNet investment income per share includes approximately $0.11 per share related to income received in the form of special dividends in connection with certain Fund holdings. Excluding this amount, the ratio of net investment income to average net assets would have been 0.65%.
fNet investment income per share includes approximately $0.04 per share related to income received in the form of special dividends in connection with certain Fund holdings. Excluding this amount, the ratio of net investment income to average net assets would have been 0.51%.
gBenefit of expense reduction rounds to less than 0.01%.
hBenefit of waiver and payments by affiliates rounds to less than 0.01%.
44 | Annual Report | The accompanying notes are an integral part of these financial statements. | franklintempleton.com | ||
FRANKLIN VALUE INVESTORS TRUST
Statement of Investments, October 31, 2018
Franklin Small Cap Value Fund
| Shares | Value | |||||||
Common Stocks 90.2% | ||||||||
Aerospace & Defense 3.2% | ||||||||
AAR Corp. | 830,748 | $ | 39,526,990 | |||||
aEsterline Technologies Corp. | 231,013 | 27,111,686 | ||||||
aWesco Aircraft Holdings Inc. | 1,313,141 | 13,367,775 | ||||||
|
| |||||||
| 80,006,451 | ||||||||
Automobiles & Components 2.5% | ||||||||
Delphi Technologies PLC | 4,200 | 90,048 | ||||||
Gentex Corp. | 74,000 | 1,557,700 | ||||||
LCI Industries | 537,793 | 37,295,945 | ||||||
Thor Industries Inc. | 336,421 | 23,428,358 | ||||||
|
| |||||||
| 62,372,051 | ||||||||
Banks 14.3% | ||||||||
Access National Corp. | 490,720 | 12,743,999 | ||||||
Bryn Mawr Bank Corp. | 635,752 | 25,391,935 | ||||||
Chemical Financial Corp. | 1,109,753 | 52,003,026 | ||||||
Columbia Banking System Inc. | 1,575,990 | 58,453,469 | ||||||
First Horizon National Corp. | 4,176,344 | 67,406,192 | ||||||
First of Long Island Corp. | 1,230,606 | 24,870,547 | ||||||
German American Bancorp Inc. | 223,400 | 7,084,014 | ||||||
Glacier Bancorp Inc. | 611,700 | 25,936,080 | ||||||
Lakeland Financial Corp. | 905,575 | 38,966,892 | ||||||
Peoples Bancorp Inc. | 540,026 | 18,485,090 | ||||||
TrustCo Bank Corp. NY | 1,483,000 | 11,107,670 | ||||||
Washington Trust Bancorp Inc. | 235,041 | 12,069,355 | ||||||
|
| |||||||
| 354,518,269 | ||||||||
Building Products 3.1% | ||||||||
a,bGibraltar Industries Inc. | 1,734,757 | 61,826,740 | ||||||
Insteel Industries Inc. | 471,886 | 12,325,662 | ||||||
Simpson Manufacturing Co. Inc. | 36,990 | 2,111,389 | ||||||
Universal Forest Products Inc. | 36,379 | 1,028,434 | ||||||
|
| |||||||
| 77,292,225 | ||||||||
Commercial & Professional Services 3.2% | ||||||||
aHuron Consulting Group Inc. | 506,800 | 27,615,532 | ||||||
McGrath RentCorp. | 546,904 | 29,199,205 | ||||||
aTeam Inc. | 1,077,700 | 21,446,230 | ||||||
|
| |||||||
| 78,260,967 | ||||||||
Consumer Durables & Apparel 0.2% | ||||||||
Toll Brothers Inc. | 127,114 | 4,278,657 | ||||||
aUnifi Inc. | 86,209 | 1,973,324 | ||||||
|
| |||||||
| 6,251,981 | ||||||||
Consumer Services 2.2% | ||||||||
Brinker International Inc. | 1,247,177 | 54,065,123 | ||||||
|
| |||||||
Electrical Equipment 2.5% | ||||||||
Encore Wire Corp. | 156,018 | 6,895,996 | ||||||
Regal Beloit Corp. | 779,000 | 55,854,300 | ||||||
|
| |||||||
| 62,750,296 | ||||||||
| franklintempleton.com | Annual Report | 45 | ||
FRANKLIN VALUE INVESTORS TRUST
STATEMENT OF INVESTMENTS
Franklin Small Cap Value Fund(continued)
| Shares | Value | |||||||
Common Stocks(continued) | ||||||||
Energy 5.7% | ||||||||
aEnergen Corp. | 620,400 | $ | 44,650,188 | |||||
Hunting PLC (United Kingdom) | 6,353,114 | 54,772,974 | ||||||
aNatural Gas Services Group Inc. | 531,000 | 10,248,300 | ||||||
aOil States International Inc. | 1,072,125 | 23,876,224 | ||||||
aRowan Cos. PLC | 487,811 | 7,761,073 | ||||||
|
| |||||||
| 141,308,759 | ||||||||
Food, Beverage & Tobacco 4.5% | ||||||||
Dairy Crest Group PLC (United Kingdom) | 5,980,111 | 36,525,378 | ||||||
a,bLandec Corp. | 1,423,100 | 19,482,239 | ||||||
Maple Leaf Foods Inc. (Canada) | 2,436,826 | 55,433,325 | ||||||
|
| |||||||
| 111,440,942 | ||||||||
Health Care Equipment & Services 1.5% | ||||||||
aAMN Healthcare Services Inc. | 123,600 | 6,256,632 | ||||||
Hill-Rom Holdings Inc. | 167,100 | 14,049,768 | ||||||
STERIS PLC | 146,093 | 15,969,426 | ||||||
|
| |||||||
| 36,275,826 | ||||||||
Industrial Conglomerates 0.5% | ||||||||
Carlisle Cos. Inc. | 135,293 | 13,067,951 | ||||||
|
| |||||||
Insurance 7.9% | ||||||||
Aspen Insurance Holdings Ltd. | 173,463 | 7,264,630 | ||||||
The Hanover Insurance Group Inc. | 594,100 | 66,170,858 | ||||||
Horace Mann Educators Corp. | 1,107,466 | 43,501,265 | ||||||
Old Republic International Corp. | 3,579,000 | 78,916,950 | ||||||
|
| |||||||
| 195,853,703 | ||||||||
Machinery 4.2% | ||||||||
Astec Industries Inc. | 320,327 | 12,047,499 | ||||||
Federal Signal Corp. | 294,500 | 6,476,055 | ||||||
Kennametal Inc. | 86,714 | 3,074,011 | ||||||
aThe Manitowoc Co. Inc. | 476,405 | 8,708,683 | ||||||
Miller Industries Inc. | 55,400 | 1,339,018 | ||||||
Mueller Industries Inc. | 460,200 | 11,205,870 | ||||||
Mueller Water Products Inc., A | 4,857,444 | 49,837,375 | ||||||
Titan International Inc. | 1,595,991 | 11,267,697 | ||||||
|
| |||||||
| 103,956,208 | ||||||||
Materials 7.8% | ||||||||
Carpenter Technology Corp. | 987,243 | 43,053,667 | ||||||
aIngevity Corp. | 205,305 | 18,699,180 | ||||||
Minerals Technologies Inc. | 684,671 | 37,485,737 | ||||||
OceanaGold Corp. (Australia) | 17,587,400 | 50,644,870 | ||||||
PH Glatfelter Co. | 1,499,800 | 26,846,420 | ||||||
Reliance Steel & Aluminum Co. | 227,200 | 17,930,624 | ||||||
|
| |||||||
| 194,660,498 | ||||||||
Media & Entertainment 0.1% | ||||||||
John Wiley & Sons Inc., A | 14,500 | 786,480 | ||||||
TEGNA Inc. | 51,200 | 590,848 | ||||||
|
| |||||||
| 1,377,328 | ||||||||
46 | Annual Report | franklintempleton.com | ||
FRANKLIN VALUE INVESTORS TRUST
STATEMENT OF INVESTMENTS
Franklin Small Cap Value Fund(continued)
| Shares | Value | |||||||
Common Stocks(continued) | ||||||||
Pharmaceuticals, Biotechnology & Life Sciences 1.1% | ||||||||
aCambrex Corp. | 385,221 | $ | 20,528,427 | |||||
aSyneos Health Inc., A | 136,600 | 6,233,058 | ||||||
|
| |||||||
| 26,761,485 | ||||||||
Real Estate 5.5% | ||||||||
Brandywine Realty Trust | 1,735,373 | 24,399,345 | ||||||
Healthcare Realty Trust Inc. | 43,600 | 1,214,696 | ||||||
Highwoods Properties Inc. | 635,700 | 27,106,248 | ||||||
LTC Properties Inc. | 634,130 | 27,121,740 | ||||||
Retail Properties of America Inc., A | 3,175,367 | 38,961,753 | ||||||
Sunstone Hotel Investors Inc. | 1,164,136 | 16,845,048 | ||||||
Weingarten Realty Investors | 24,600 | 691,752 | ||||||
|
| |||||||
| 136,340,582 | ||||||||
Retailing 2.0% | ||||||||
Caleres Inc. | 1,461,066 | 49,968,457 | ||||||
|
| |||||||
Semiconductors & Semiconductor Equipment 6.7% | ||||||||
aAdvanced Energy Industries Inc. | 717,000 | 30,852,510 | ||||||
Cohu Inc. | 277,862 | 5,779,530 | ||||||
Kulicke and Soffa Industries Inc. (Singapore) | 296,277 | 6,023,311 | ||||||
MKS Instruments Inc. | 404,477 | 29,805,910 | ||||||
aSynaptics Inc. | 1,110,800 | 41,699,432 | ||||||
Versum Materials Inc. | 1,638,227 | 51,702,444 | ||||||
|
| |||||||
| 165,863,137 | ||||||||
Technology Hardware & Equipment 6.5% | ||||||||
aCoherent Inc. | 228,565 | 28,145,494 | ||||||
aFinisar Corp. | 2,034,800 | 33,960,812 | ||||||
aPlexus Corp. | 554,903 | 32,406,335 | ||||||
aZebra Technologies Corp., A | 405,000 | 67,351,500 | ||||||
|
| |||||||
| 161,864,141 | ||||||||
Transportation 1.0% | ||||||||
Heartland Express Inc. | 1,286,200 | 25,042,314 | ||||||
Utilities 4.0% | ||||||||
Black Hills Corp. | 687,200 | 40,888,400 | ||||||
IDACORP Inc. | 240,799 | 22,456,915 | ||||||
Spire Inc. | 483,658 | 35,103,897 | ||||||
|
| |||||||
| 98,449,212 | ||||||||
|
| |||||||
Total Common Stocks (Cost $2,001,540,256) | 2,237,747,906 | |||||||
|
| |||||||
| Principal Amount | ||||||||
Corporate Bonds 0.9% | ||||||||
Energy 0.7% | ||||||||
Unit Corp., senior sub. note, 6.625%, 5/15/21 | $ | 17,386,000 | 17,342,535 | |||||
|
| |||||||
Machinery 0.2% | ||||||||
Mueller Industries Inc., sub. bond, 6.00%, 3/01/27 | 4,532,000 | 4,362,050 | ||||||
Total Corporate Bonds (Cost $21,358,783) | 21,704,585 | |||||||
|
| |||||||
Total Investments before Short Term Investments (Cost $2,022,899,039) | 2,259,452,491 | |||||||
|
| |||||||
| franklintempleton.com | Annual Report | 47 | ||
FRANKLIN VALUE INVESTORS TRUST
STATEMENT OF INVESTMENTS
Franklin Small Cap Value Fund(continued)
| Shares | Value | |||||||
Short Term Investments (Cost $224,660,126) 9.1% | ||||||||
Money Market Funds 9.1% | ||||||||
c,dInstitutional Fiduciary Trust Money Market Portfolio, 1.83% | 224,660,126 | $ | 224,660,126 | |||||
|
| |||||||
Total Investments (Cost $2,247,559,165) 100.2% | 2,484,112,617 | |||||||
Other Assets, less Liabilities (0.2)% | (5,160,879 | ) | ||||||
|
| |||||||
Net Assets 100.0% | $ | 2,478,951,738 | ||||||
|
| |||||||
aNon-income producing.
bSee Note 7 regarding holdings of 5% voting securities.
cSee Note 3(f) regarding investments in affiliated management investment companies.
dThe rate shown is the annualizedseven-day effective yield at period end.
48 | Annual Report | The accompanying notes are an integral part of these financial statements. | franklintempleton.com | ||
FRANKLIN VALUE INVESTORS TRUST
Statements of Assets and Liabilities
October 31, 2018
| Franklin Balance Sheet Investment Fund | Franklin MicroCap Value Fund | Franklin Small Cap Value Fund | ||||||||
Assets: | ||||||||||
Investments in securities: | ||||||||||
Cost - Unaffiliated issuers | $625,080,028 | $139,314,489 | $1,955,750,088 | |||||||
Cost -Non-controlled affiliates (Note 3f and 7) | 122,533,811 | 15,330,183 | 291,809,077 | |||||||
Value - Unaffiliated issuers | $778,263,264 | $236,146,582 | $2,178,143,512 | |||||||
Value -Non-controlled affiliates (Note 3f and 7) | 122,533,811 | 22,566,135 | 305,969,105 | |||||||
Receivables: | ||||||||||
Investment securities sold | — | 1,414,402 | 5,902,888 | |||||||
Capital shares sold | 1,130,275 | 8,719 | 1,476,986 | |||||||
Dividends and interest | 1,075,296 | 7,200 | 1,607,489 | |||||||
Other assets | 299 | 94 | 791 | |||||||
Total assets | 903,002,945 | 260,143,132 | 2,493,100,771 | |||||||
Liabilities: | ||||||||||
Payables: | ||||||||||
Investment securities purchased | 1,411,371 | 28,970 | 6,827,618 | |||||||
Capital shares redeemed | 1,395,112 | 758,109 | 4,537,758 | |||||||
Management fees | 340,942 | 171,240 | 1,191,448 | |||||||
Distribution fees | 211,272 | 50,171 | 521,374 | |||||||
Transfer agent fees | 229,294 | 58,793 | 849,574 | |||||||
Accrued expenses and other liabilities | 109,337 | 63,785 | 221,261 | |||||||
Total liabilities | 3,697,328 | 1,131,068 | 14,149,033 | |||||||
Net assets, at value | $899,305,617 | $259,012,064 | $2,478,951,738 | |||||||
Net assets consist of: | ||||||||||
Paid-in capital | $632,292,480 | $140,921,180 | $1,901,278,235 | |||||||
Total distributable earnings (loss) | 267,013,137 | 118,090,884 | 577,673,503 | |||||||
Net assets, at value | $899,305,617 | $259,012,064 | $2,478,951,738 | |||||||
| franklintempleton.com | The accompanying notes are an integral part of these financial statements. | Annual Report | 49 | ||
FRANKLIN VALUE INVESTORS TRUST
FINANCIAL STATEMENTS
Statements of Assets and Liabilities(continued)
October 31, 2018
| Franklin Balance Sheet Investment Fund | Franklin MicroCap Value Fund | Franklin Small Cap Value Fund | ||||||||||||
Class A: | ||||||||||||||
Net assets, at value | $772,975,693 | $184,613,180 | $1,366,866,378 | |||||||||||
Shares outstanding | 20,380,755 | 5,942,888 | 25,991,231 | |||||||||||
Net asset value per sharea | $37.93 | $31.06 | $52.59 | |||||||||||
Maximum offering price per share (net asset value per share ÷ 94.50%) | $40.14 | $32.87 | $55.65 | |||||||||||
Class C: | ||||||||||||||
Net assets, at value | $33,853,517 | $138,188,375 | ||||||||||||
Shares outstanding | 936,957 | 2,975,047 | ||||||||||||
Net asset value and maximum offering price per sharea | $36.13 | �� | $46.45 | |||||||||||
Class R: | ||||||||||||||
Net assets, at value | $7,280,417 | $158,678,438 | ||||||||||||
Shares outstanding | 191,660 | 3,052,958 | ||||||||||||
Net asset value and maximum offering price per share | $37.99 | $51.98 | ||||||||||||
Class R6: | ||||||||||||||
Net assets, at value | $36,580,201 | $21,069,996 | $270,426,484 | |||||||||||
Shares outstanding | 933,145 | 670,355 | 4,901,895 | |||||||||||
Net asset value and maximum offering price per share | $39.20 | $31.43 | $55.17 | |||||||||||
Advisor Class: | ||||||||||||||
Net assets, at value | $48,615,789 | $53,328,888 | $544,792,063 | |||||||||||
Shares outstanding | 1,238,169 | 1,704,884 | 9,870,824 | |||||||||||
Net asset value and maximum offering price per share | $39.26 | $31.28 | $55.19 | |||||||||||
aRedemption price is equal to net asset value less contingent deferred sales charges, if applicable.
50 | Annual Report | The accompanying notes are an integral part of these financial statements. | franklintempleton.com | ||
FRANKLIN VALUE INVESTORS TRUST
FINANCIAL STATEMENTS
Statements of Operations
for the year ended October 31, 2018
| Franklin Balance Sheet Investment Fund | Franklin MicroCap Value Fund | Franklin Small Cap Value Fund | ||||||||||
Investment income: | ||||||||||||
Dividends: (net of foreign taxes)* | ||||||||||||
Unaffiliated issuers | $ | 17,639,162 | $ | 3,126,405 | $ | 43,269,283 | ||||||
Non-controlled affiliates (Note 3f and 7) | 1,632,908 | 147,392 | 1,643,678 | |||||||||
Interest: | ||||||||||||
Unaffiliated issuers | 429,951 | — | 1,609,044 | |||||||||
|
| |||||||||||
Total investment income | 19,702,021 | 3,273,797 | 46,522,005 | |||||||||
|
| |||||||||||
Expenses: | ||||||||||||
Management fees (Note 3a) | 4,700,306 | 2,347,162 | 15,387,608 | |||||||||
Distribution fees: (Note 3c) | ||||||||||||
Class A | 2,057,518 | 538,232 | 3,590,603 | |||||||||
Class C | 621,295 | — | 2,347,646 | |||||||||
Class R | 40,069 | — | 953,478 | |||||||||
Transfer agent fees: (Note 3e) | ||||||||||||
Class A | 1,147,290 | 236,541 | 2,858,473 | |||||||||
Class C | 86,774 | — | 469,652 | |||||||||
Class R | 11,259 | — | 380,866 | |||||||||
Class R6 | 20,844 | 9,412 | 144,854 | |||||||||
Advisor Class | 79,906 | 75,166 | 1,163,600 | |||||||||
Custodian fees (Note 4) | 10,663 | 2,551 | 37,722 | |||||||||
Reports to shareholders | 113,503 | 31,834 | 257,666 | |||||||||
Registration and filing fees | 110,327 | 51,084 | 150,219 | |||||||||
Professional fees | 74,466 | 65,235 | 89,595 | |||||||||
Trustees’ fees and expenses | 49,123 | 15,865 | 132,421 | |||||||||
Other | 26,041 | 14,166 | 64,165 | |||||||||
|
| |||||||||||
Total expenses | 9,149,384 | 3,387,248 | 28,028,568 | |||||||||
Expense reductions (Note 4) | (96 | ) | (349 | ) | (3,108 | ) | ||||||
Expenses waived/paid by affiliates (Note 3f and 3g) | (459,713 | ) | (43,554 | ) | (525,277 | ) | ||||||
|
| |||||||||||
Net expenses | 8,689,575 | 3,343,345 | 27,500,183 | |||||||||
|
| |||||||||||
Net investment income (loss) | 11,012,446 | (69,548 | ) | 19,021,822 | ||||||||
|
| |||||||||||
Realized and unrealized gains (losses): | ||||||||||||
Net realized gain (loss) from: | ||||||||||||
Investments: | ||||||||||||
Unaffiliated issuers | 116,971,413 | 22,888,852 | 369,035,633 | |||||||||
Non-controlled affiliates (Note 3f and 7) | — | (7,364,577 | ) | — | ||||||||
Foreign currency transactions | (10,029 | ) | — | 97,234 | ||||||||
|
| |||||||||||
Net realized gain (loss) | 116,961,384 | 15,524,275 | 369,132,867 | |||||||||
|
| |||||||||||
Net change in unrealized appreciation (depreciation) on: | ||||||||||||
Investments: | ||||||||||||
Unaffiliated issuers | (125,130,955 | ) | (36,921,648 | ) | (466,389,512 | ) | ||||||
Non-controlled affiliates (Note 3f and 7) | — | (1,562,775 | ) | (101,876 | ) | |||||||
Translation of other assets and liabilities denominated in foreign currencies | — | — | (9,902 | ) | ||||||||
|
| |||||||||||
Net change in unrealized appreciation (depreciation) | (125,130,955 | ) | (38,484,423 | ) | (466,501,290 | ) | ||||||
|
| |||||||||||
Net realized and unrealized gain (loss) | (8,169,571 | ) | (22,960,148 | ) | (97,368,423 | ) | ||||||
|
| |||||||||||
Net increase (decrease) in net assets resulting from operations | $ | 2,842,875 | $ | (23,029,696 | ) | $ | (78,346,601 | ) | ||||
|
| |||||||||||
*Foreign taxes withheld on dividends | $ | 339,225 | $ | — | $ | 201,881 | ||||||
| franklintempleton.com | The accompanying notes are an integral part of these financial statements. | Annual Report | 51 | ||
FRANKLIN VALUE INVESTORS TRUST
FINANCIAL STATEMENTS
Statements of Changes in Net Assets
Franklin Balance Sheet Investment Fund | Franklin MicroCap Value Fund | |||||||||||||||
|
| |||||||||||||||
| Year Ended October 31, | Year Ended October 31, | |||||||||||||||
|
| |||||||||||||||
| 2018 | 2017 | 2018 | 2017 | |||||||||||||
| ||||||||||||||||
Increase (decrease) in net assets: | ||||||||||||||||
Operations: | ||||||||||||||||
Net investment income (loss) | $ | 11,012,446 | $ | 9,743,994 | $ | (69,548 | ) | $ | 349,695 | |||||||
Net realized gain (loss) | 116,961,384 | 79,076,276 | 15,524,275 | 26,596,476 | ||||||||||||
Net change in unrealized appreciation (depreciation) | (125,130,955 | ) | 123,780,810 | (38,484,423 | ) | 52,308,075 | ||||||||||
�� |
| |||||||||||||||
Net increase (decrease) in net assets resulting from operations | 2,842,875 | 212,601,080 | (23,029,696 | ) | 79,254,246 | |||||||||||
|
| |||||||||||||||
Distributions to shareholders: (Note 1e) | ||||||||||||||||
Class A | (63,858,142 | ) | (55,392,506 | ) | (16,930,010 | ) | (22,640,904 | ) | ||||||||
Class C | (4,736,310 | ) | (4,188,910 | ) | — | — | ||||||||||
Class R | (566,420 | ) | (574,005 | ) | — | — | ||||||||||
Class R6 | (2,808,869 | ) | (13,131 | ) | (2,008,421 | ) | (1,870,638 | ) | ||||||||
Advisor Class | (4,346,980 | ) | (5,481,066 | ) | (5,544,430 | ) | (6,410,008 | ) | ||||||||
|
| |||||||||||||||
Total distributions to shareholders | (76,316,721 | ) | (65,649,618 | ) | (24,482,861 | ) | (30,921,550 | ) | ||||||||
|
| |||||||||||||||
Capital share transactions: (Note 2) | ||||||||||||||||
Class A | (6,214,274 | ) | (77,357,974 | ) | (20,418,551 | ) | (29,044,783 | ) | ||||||||
Class C | (27,397,769 | ) | (5,146,048 | ) | — | — | ||||||||||
Class R | (59,551 | ) | (1,907,276 | ) | — | — | ||||||||||
Class R6 | 4,636,880 | 34,339,167 | (2,163,383 | ) | 5,658,368 | |||||||||||
Advisor Class | (5,098,372 | ) | (31,412,724 | ) | (12,566,157 | ) | 2,063,896 | |||||||||
|
| |||||||||||||||
Total capital share transactions | (34,133,086 | ) | (81,484,855 | ) | (35,148,091 | ) | (21,322,519 | ) | ||||||||
|
| |||||||||||||||
Net increase (decrease) in net assets | (107,606,932 | ) | 65,466,607 | (82,660,648 | ) | 27,010,177 | ||||||||||
Net assets: | ||||||||||||||||
Beginning of year | 1,006,912,549 | 941,445,942 | 341,672,712 | 314,662,535 | ||||||||||||
|
| |||||||||||||||
End of year (Note 1e) | $ | 899,305,617 | $ | 1,006,912,549 | $ | 259,012,064 | $ | 341,672,712 | ||||||||
|
| |||||||||||||||
52 | Annual Report | The accompanying notes are an integral part of these financial statements. | franklintempleton.com | ||
FRANKLIN VALUE INVESTORS TRUST
FINANCIAL STATEMENTS
Statements of Changes in Net Assets(continued)
Franklin Small Cap Value Fund | ||||||||
|
| |||||||
| Year Ended October 31, | ||||||||
|
| |||||||
| 2018 | 2017 | |||||||
| ||||||||
Increase (decrease) in net assets: | ||||||||
Operations: | ||||||||
Net investment income | $ | 19,021,822 | $ | 16,589,877 | ||||
Net realized gain (loss) | 369,132,867 | 261,020,880 | ||||||
Net change in unrealized appreciation (depreciation) | (466,501,290 | ) | 205,606,737 | |||||
|
| |||||||
Net increase (decrease) in net assets resulting from operations | (78,346,601 | ) | 483,217,494 | |||||
|
| |||||||
Distributions to shareholders: (Note 1e) | ||||||||
Class A | (121,139,844 | ) | (60,894,796 | ) | ||||
Class C | (21,407,557 | ) | (12,431,086 | ) | ||||
Class R | (16,504,994 | ) | (10,985,538 | ) | ||||
Class R6 | (18,404,597 | ) | (5,846,756 | ) | ||||
Advisor Class | (46,728,288 | ) | (48,797,422 | ) | ||||
|
| |||||||
Total distributions to shareholders | (224,185,280 | ) | (138,955,598 | ) | ||||
|
| |||||||
Capital share transactions: (Note 2) | ||||||||
Class A | 166,463,826 | 76,610,126 | ||||||
Class C | (59,966,851 | ) | (22,192,857 | ) | ||||
Class R | (30,637,990 | ) | (31,723,743 | ) | ||||
Class R6 | 77,305,726 | 101,158,234 | ||||||
Advisor Class | 24,225,442 | (414,056,938 | ) | |||||
|
| |||||||
Total capital share transactions | 177,390,153 | (290,205,178 | ) | |||||
|
| |||||||
Net increase (decrease) in net assets | (125,141,728 | ) | 54,056,718 | |||||
Net assets: | ||||||||
Beginning of year | 2,604,093,466 | 2,550,036,748 | ||||||
|
| |||||||
End of year (Note 1e) | $ | 2,478,951,738 | $ | 2,604,093,466 | ||||
|
| |||||||
| franklintempleton.com | The accompanying notes are an integral part of these financial statements. | Annual Report | 53 | ||
FRANKLIN VALUE INVESTORS TRUST
1. Organization and Significant Accounting Policies
Franklin Value Investors Trust (Trust) is registered under the Investment Company Act of 1940 (1940 Act) as anopen-end management investment company, consisting of three separate funds (Funds) and applies the specialized accounting and reporting guidance in U.S. Generally Accepted Accounting Principles (U.S. GAAP). The classes of shares offered within each of the Funds are indicated below. Beginning on October 19, 2018, Class C shares automatically convert to Class A shares after they have been held for 10 years. Each class of shares may differ by its initial sales load, contingent deferred sales charges, voting rights on matters affecting a single class, its exchange privilege and fees due to differing arrangements for distribution and transfer agent fees.
Class A, Class R6 & Advisor Class
Franklin MicroCap Value Funda
Class A, Class C, Class R, Class R6 & Advisor Class
Franklin Balance Sheet Investment Fund
Franklin Small Cap Value Fund
aFranklin MicroCap Value Fund was closed to new investors with limited exceptions effective January 2004, and has remained closed except for two days inmid-February 2013, when the Fund was opened on a limited basis.
The following summarizes the Funds’ significant accounting policies.
a. Financial Instrument Valuation
The Funds’ investments in financial instruments are carried at fair value daily. Fair value is the price that would be received to sell an asset or paid to transfer a liability in an orderly transaction between market participants on the measurement date. The Funds calculate the net asset value (NAV) per share each business day as of 4 p.m. Eastern time or the regularly scheduled close of the New York Stock Exchange (NYSE), whichever is earlier. Under compliance policies and procedures approved by the Trust’s Board of Trustees (the Board), the Funds’ administrator has responsibility for oversight of valuation, including leading the cross-functional Valuation Committee (VC). The VC provides administration and oversight of the Funds’ valuation policies and procedures, which are approved annually by the Board. Among other things, these procedures allow the Funds to utilize independent pricing services, quotations from securities and financial instrument dealers, and other market sources to determine fair value.
Equity securities listed on an exchange or on the NASDAQ National Market System are valued at the last quoted sale price or the official closing price of the day, respectively. Foreign equity securities are valued as of the close of trading on the foreign stock exchange on which the security is primarily traded, or as of 4 p.m. Eastern time. The value is then converted into its U.S. dollar equivalent at the foreign exchange rate in effect at 4 p.m. Eastern time on the day that the value of the security is determined.Over-the-counter (OTC) securities are valued within the range of the most recent quoted bid and ask prices. Securities that trade in multiple markets or on multiple exchanges are valued according to the broadest and most representative market. Certain equity securities are valued based upon fundamental characteristics or relationships to similar securities.
Debt securities generally trade in the OTC market rather than on a securities exchange. The Funds’ pricing services use multiple valuation techniques to determine fair value. In instances where sufficient market activity exists, the pricing services may utilize a market-based approach through which quotes from market makers are used to determine fair value. In instances where sufficient market activity may not exist or is limited, the pricing services also utilize proprietary valuation models which may consider market characteristics such as benchmark yield curves, credit spreads, estimated default rates, anticipated market interest rate volatility, coupon rates, anticipated timing of principal repayments, underlying collateral, and other unique security features in order to estimate the relevant cash flows, which are then discounted to calculate the fair value.
Investments inopen-end mutual funds are valued at the closing NAV.
The Funds have procedures to determine the fair value of financial instruments for which market prices are not reliable or readily available. Under these procedures, the VC convenes on a regular basis to review such financial instruments and considers a number of factors, including significant unobservable valuation inputs, when arriving at fair value. The VC primarily employs a market-based approach which may use related or comparable assets or liabilities, recent transactions, market multiples, book values, and other relevant information for the investment to determine the fair value of the investment. An income-based valuation approach may also be used in which the anticipated future cash flows of the investment are discounted to calculate fair value. Discounts may also be applied due to the nature or duration of any restrictions on the
54 | Annual Report | franklintempleton.com | ||
FRANKLIN VALUE INVESTORS TRUST
NOTES TO FINANCIAL STATEMENTS
disposition of the investments. Due to the inherent uncertainty of valuations of such investments, the fair values may differ significantly from the values that would have been used had an active market existed. The VC employs various methods for calibrating these valuation approaches including a regular review of key inputs and assumptions, transactional back-testing or disposition analysis, and reviews of any related market activity.
Trading in securities on foreign securities stock exchanges and OTC markets may be completed before 4 p.m. Eastern time. In addition, trading in certain foreign markets may not take place on every Funds’ business day. Occasionally, events occur between the time at which trading in a foreign security is completed and 4 p.m. Eastern time that might call into question the reliability of the value of a portfolio security held by the Fund. As a result, differences may arise between the value of the Funds’ portfolio securities as determined at the foreign market close and the latest indications of value at 4 p.m. Eastern time. In order to minimize the potential for these differences, the VC monitors price movements following the close of trading in foreign stock markets through a series of country specific market proxies (such as baskets of American Depositary Receipts, futures contracts and exchange traded funds). These price movements are measured against established trigger thresholds for each specific market proxy to assist in determining if an event has occurred that may call into question the reliability of the values of the foreign securities held by the Funds. If such an event occurs, the securities may be valued using fair value procedures, which may include the use of independent pricing services.
When the last day of the reporting period is anon-business day, certain foreign markets may be open on those days that the Funds’ NAV is not calculated, which could result in differences between the value of the Funds’ portfolio securities on the last business day and the last calendar day of the reporting period. Any significant security valuation changes due to an open foreign market are adjusted and reflected by the Funds for financial reporting purposes.
b. Foreign Currency Translation
Portfolio securities and other assets and liabilities denominated in foreign currencies are translated into U.S. dollars based on the exchange rate of such currencies against U.S. dollars on the date of valuation. The Funds may enter into foreign currency exchange contracts to facilitate transactions denominated in a
foreign currency. Purchases and sales of securities, income and expense items denominated in foreign currencies are translated into U.S. dollars at the exchange rate in effect on the transaction date. Portfolio securities and assets and liabilities denominated in foreign currencies contain risks that those currencies will decline in value relative to the U.S. dollar. Occasionally, events may impact the availability or reliability of foreign exchange rates used to convert the U.S. dollar equivalent value. If such an event occurs, the foreign exchange rate will be valued at fair value using procedures established and approved by the Board.
The Funds do not separately report the effect of changes in foreign exchange rates from changes in market prices on securities held. Such changes are included in net realized and unrealized gain or loss from investments in the Statements of Operations.
Realized foreign exchange gains or losses arise from sales of foreign currencies, currency gains or losses realized between the trade and settlement dates on securities transactions and the difference between the recorded amounts of dividends, interest, and foreign withholding taxes and the U.S. dollar equivalent of the amounts actually received or paid. Net unrealized foreign exchange gains and losses arise from changes in foreign exchange rates on foreign denominated assets and liabilities other than investments in securities held at the end of the reporting period.
c. Securities Lending
Certain or all Funds participate in an agency based securities lending program to earn additional income. The Fund receives cash collateral against the loaned securities in an amount equal to at least 102% of the fair value of the loaned securities. Collateral is maintained over the life of the loan in an amount not less than 100% of the fair value of loaned securities, as determined at the close of Fund business each day; any additional collateral required due to changes in security values is delivered to the Fund on the next business day. The collateral is deposited into a joint cash account with other funds and is used to invest in a money market fund managed by Franklin Advisers, Inc., an affiliate of the Funds, and/or a joint repurchase agreement. The Fund may receive income from the investment of cash collateral, in addition to lending fees and rebates paid by the borrower. Income from securities loaned, net of fees paid to the securities lending agent and/or third-party vendor, is reported separately in the Statements of Operations, if any. The Fund bears the market risk with respect to the
| franklintempleton.com | Annual Report | 55 | ||
FRANKLIN VALUE INVESTORS TRUST
NOTES TO FINANCIAL STATEMENTS
1. Organization and Significant Accounting Policies(continued)
c. Securities Lending(continued)
collateral investment, securities loaned, and the risk that the agent may default on its obligations to the Fund. If the borrower defaults on its obligation to return the securities loaned, the Fund has the right to repurchase the securities in the open market using the collateral received. The securities lending agent has agreed to indemnify the Fund in the event of default by a third party borrower. At October 31, 2018, the Funds had no securities on loan.
d. Income and Deferred Taxes
It is each Fund’s policy to qualify as a regulated investment company under the Internal Revenue Code. Each Fund intends to distribute to shareholders substantially all of its taxable income and net realized gains to relieve it from federal income and excise taxes. As a result, no provision for U.S. federal income taxes is required.
The Funds may be subject to foreign taxation related to income received, capital gains on the sale of securities and certain foreign currency transactions in the foreign jurisdictions in which the Funds invest. Foreign taxes, if any, are recorded based on the tax regulations and rates that exist in the foreign markets in which the Funds invest. When a capital gain tax is determined to apply, certain or all Funds record an estimated deferred tax liability in an amount that would be payable if the securities were disposed of on the valuation date.
As a result of several court cases, in certain countries across the European Union, certain or all Funds filed additional tax reclaims for previously withheld taxes on dividends earned in those countries (EU reclaims). These additional filings are subject to various administrative proceedings by the local jurisdictions’ tax authorities within the European Union, as well as a number of related judicial proceedings. Income recognized, if any, for EU reclaims is reflected as other income in the Statements of Operations and any related receivable, if any, is reflected as European Union tax reclaims in the Statements of Assets and Liabilities. When uncertainty exists as to the ultimate resolution of these proceedings, the likelihood of receipt of these EU reclaims, and the potential timing of payment, no amounts are reflected in the financial statements. For U.S. income tax purposes, EU reclaims received by the
Funds, if any, reduce the amounts of foreign taxes Fund shareholders can use as tax credits in their individual income tax returns.
Each Fund may recognize an income tax liability related to its uncertain tax positions under U.S. GAAP when the uncertain tax position has a less than 50% probability that it will be sustained upon examination by the tax authorities based on its technical merits. As of October 31, 2018, each Fund has determined that no tax liability is required in its financial statements related to uncertain tax positions for any open tax years (or expected to be taken in future tax years). Open tax years are those that remain subject to examination and are based on the statute of limitations in each jurisdiction in which the Fund invests.
e. Security Transactions, Investment Income, Expenses and Distributions
Security transactions are accounted for on trade date. Realized gains and losses on security transactions are determined on a specific identification basis. Interest income and estimated expenses are accrued daily. Amortization of premium and accretion of discount on debt securities are included in interest income. Dividend income is recorded on theex-dividend date except for certain dividends from securities where the dividend rate is not available. In such cases, the dividend is recorded as soon as the information is received by the Funds. Distributions to shareholders are recorded on theex-dividend date. Distributable earnings are determined according to income tax regulations (tax basis) and may differ from earnings recorded in accordance with U.S. GAAP. These differences may be permanent or temporary. Permanent differences are reclassified among capital accounts to reflect their tax character. These reclassifications have no impact on net assets or the results of operations. Temporary differences are not reclassified, as they may reverse in subsequent periods.*
Common expenses incurred by the Trust are allocated among the Funds based on the ratio of net assets of each Fund to the combined net assets of the Trust or based on the ratio of number of shareholders of each Fund to the combined number of shareholders of the Trust. Fund specific expenses are charged directly to the Fund that incurred the expense.
56 | Annual Report | franklintempleton.com | ||
FRANKLIN VALUE INVESTORS TRUST
NOTES TO FINANCIAL STATEMENTS
Realized and unrealized gains and losses and net investment income, excluding class specific expenses, are allocated daily to each class of shares based upon the relative proportion of net assets of each class. Differences in per share distributions by class are generally due to differences in class specific expenses.
Distributions received by the Funds from certain securities may be a return of capital (ROC). Such distributions reduce the cost basis of the securities, and any distributions in excess of the cost basis are recognized as capital gains.
f. Accounting Estimates
The preparation of financial statements in accordance with U.S. GAAP requires management to make estimates and assumptions that affect the reported amounts of assets and liabilities at the date of the financial statements and the amounts of income and expenses during the reporting period. Actual results could differ from those estimates.
g. Guarantees and Indemnifications
Under the Trust’s organizational documents, its officers and trustees are indemnified by the Trust against certain liabilities arising out of the performance of their duties to the Trust. Additionally, in the normal course of business, the Trust, on behalf of the Funds, enters into contracts with service providers that contain general indemnification clauses. The Trust’s maximum exposure under these arrangements is unknown as this would involve future claims that may be made against the Trust that have not yet occurred. Currently, the Trust expects the risk of loss to be remote.
*Effective during the current reporting period, it is no longer required to present certain line items on the Statements of Changes in Net Assets. Such disclosure changes are included in the Statements of Changes in Net Assets, therefore prior period amounts are presented below.
For the year ended October 31, 2017, distributions to shareholders were as follows:
| Franklin Balance Sheet Investment Fund | Franklin MicroCap Value Fund | Franklin Small Cap Value Fund | ||||||||||
Distributions from net investment income: | ||||||||||||
Class A | $ (4,060,775 | ) | $ | (781,224 | ) | $ | (2,771,643 | ) | ||||
Class R | (22,684 | ) | — | — | ||||||||
Class R6 | (1,448 | ) | (135,057 | ) | (694,508 | ) | ||||||
Advisor Class | (600,152 | ) | (384,628 | ) | (4,517,276 | ) | ||||||
Distributions from net realized gains: | ||||||||||||
Class A | (51,331,731 | ) | (21,859,680 | ) | (58,123,153 | ) | ||||||
Class C | (4,188,910 | ) | — | (12,431,086 | ) | |||||||
Class R | (551,321 | ) | — | (10,985,538 | ) | |||||||
Class R6 | (11,683 | ) | (1,735,581 | ) | (5,152,248 | ) | ||||||
Advisor Class | (4,880,914 | ) | (6,025,380 | ) | (44,280,146 | ) | ||||||
For the year ended October 31, 2017, undistributed net investment income included in net assets were as follows:
|
| |||||||||||
| Fund | Undistributed net investment income | |||||||||||
Franklin Balance Sheet Investment Fund | $ 8,021,470 | |||||||||||
Franklin MicroCap Value Fund | $ 180,823 | |||||||||||
Franklin Small Cap Value Fund | $ 13,752,537 | |||||||||||
| franklintempleton.com | Annual Report | 57 | ||
FRANKLIN VALUE INVESTORS TRUST
NOTES TO FINANCIAL STATEMENTS
2. Shares of Beneficial Interest
At October 31, 2018, there were an unlimited number of shares authorized (without par value). Transactions in the Funds’ shares were as follows:
Franklin Balance Sheet Investment Fund | Franklin MicroCap Value Fund | |||||||||||||||
| Shares | Amount | Shares | Amount | |||||||||||||
Class A Shares: | ||||||||||||||||
Year ended October 31, 2018 | ||||||||||||||||
Shares solda | 2,982,655 | $ | 118,651,289 | 219,992 | $ | 7,482,134 | ||||||||||
Shares issued in reinvestment of distributions | 1,534,831 | 59,766,332 | 479,467 | 16,273,124 | ||||||||||||
Shares redeemed | (4,617,058 | ) | (184,631,895 | ) | (1,299,035 | ) | (44,173,809 | ) | ||||||||
Net increase (decrease) | (99,572 | ) | $ | (6,214,274 | ) | (599,576 | ) | $ | (20,418,551 | ) | ||||||
Year ended October 31, 2017 | ||||||||||||||||
Shares sold | 5,153,316 | $ | 199,298,774 | 335,438 | $ | 11,155,577 | ||||||||||
Shares issued in reinvestment of distributions | 1,350,870 | 51,495,167 | 647,525 | 21,828,068 | ||||||||||||
Shares redeemed | (8,502,452 | ) | (328,151,915 | ) | (1,876,309 | ) | (62,028,428 | ) | ||||||||
Net increase (decrease) | (1,998,266 | ) | $ | (77,357,974 | ) | (893,346 | ) | $ | (29,044,783 | ) | ||||||
Class C Shares: | ||||||||||||||||
Year ended October 31, 2018 | ||||||||||||||||
Shares sold | 188,787 | $ | 7,214,184 | |||||||||||||
Shares issued in reinvestment of distributions | 126,071 | 4,707,489 | ||||||||||||||
Shares redeemeda | (1,048,115 | ) | (39,319,442 | ) | ||||||||||||
Net increase (decrease) | (733,257 | ) | $ | (27,397,769 | ) | |||||||||||
Year ended October 31, 2017 | ||||||||||||||||
Shares sold | 272,141 | $ | 10,085,492 | |||||||||||||
Shares issued in reinvestment of distributions | 112,965 | 4,143,570 | ||||||||||||||
Shares redeemed | (525,143 | ) | (19,375,110 | ) | ||||||||||||
Net increase (decrease) | (140,037 | ) | $ | (5,146,048 | ) | |||||||||||
Class R Shares: | ||||||||||||||||
Year ended October 31, 2018 | ||||||||||||||||
Shares sold | 39,608 | $ | 1,569,912 | |||||||||||||
Shares issued in reinvestment of distributions | 14,494 | 566,420 | ||||||||||||||
Shares redeemed | (54,254 | ) | (2,195,883 | ) | ||||||||||||
Net increase (decrease) | (152 | ) | $ | (59,551 | ) | |||||||||||
Year ended October 31, 2017 | ||||||||||||||||
Shares sold | 31,687 | $ | 1,218,604 | |||||||||||||
Shares issued in reinvestment of distributions | 15,015 | 574,005 | ||||||||||||||
Shares redeemed | (94,464 | ) | (3,699,885 | ) | ||||||||||||
Net increase (decrease) | (47,762 | ) | $ | (1,907,276 | ) | |||||||||||
58 | Annual Report | franklintempleton.com | ||
FRANKLIN VALUE INVESTORS TRUST
NOTES TO FINANCIAL STATEMENTS
Franklin Balance Sheet Investment Fund | Franklin MicroCap Value Fund | |||||||||||||||
| Shares | Amount | Shares | Amount | |||||||||||||
Class R6 Shares: | ||||||||||||||||
Year ended October 31, 2018 | ||||||||||||||||
Shares sold | 294,138 | $ | 12,118,458 | 129,413 | $ | 4,450,790 | ||||||||||
Shares issued in reinvestment of distributions | 70,012 | 2,808,869 | 12,032 | 411,970 | ||||||||||||
Shares redeemed | (249,119 | ) | (10,290,447 | ) | (206,762 | ) | (7,026,143 | ) | ||||||||
Net increase (decrease) | 115,031 | $ | 4,636,880 | (65,317 | ) | $ | (2,163,383 | ) | ||||||||
Year ended October 31, 2017 | ||||||||||||||||
Shares sold | 820,594 | $ | 34,624,354 | 313,078 | $ | 10,926,309 | ||||||||||
Shares issued in reinvestment of distributions | 335 | 13,130 | 328 | 11,145 | ||||||||||||
Shares redeemed | (7,131 | ) | (298,317 | ) | (155,386 | ) | (5,279,086 | ) | ||||||||
Net increase (decrease) | 813,798 | $ | 34,339,167 | 158,020 | $ | 5,658,368 | ||||||||||
Advisor Class Shares: | ||||||||||||||||
Year ended October 31, 2018 | ||||||||||||||||
Shares sold | 384,827 | $ | 15,847,069 | 228,278 | $ | 7,757,572 | ||||||||||
Shares issued in reinvestment of distributions | 102,431 | 4,119,768 | 155,110 | 5,289,237 | ||||||||||||
Shares redeemed | (603,342 | ) | (25,065,209 | ) | (757,299 | ) | (25,612,966 | ) | ||||||||
Net increase (decrease) | (116,084 | ) | $ | (5,098,372 | ) | (373,911 | ) | $ | (12,566,157 | ) | ||||||
Year ended October 31, 2017 | ||||||||||||||||
Shares sold | 1,261,267 | $ | 49,915,900 | 520,855 | $ | 17,493,211 | ||||||||||
Shares issued in reinvestment of distributions | 135,705 | 5,326,412 | 181,160 | 6,134,063 | ||||||||||||
Shares redeemed | (2,115,898 | ) | (86,655,036 | ) | (634,957 | ) | (21,563,378 | ) | ||||||||
Net increase (decrease) | (718,926 | ) | $ | (31,412,724 | ) | 67,058 | $ | 2,063,896 | ||||||||
aMay include a portion of Class C shares that were automatically converted to Class A.
Franklin Small Cap Value Fund | ||||||||
| Shares | Amount | |||||||
Class A Shares: | ||||||||
Year ended October 31, 2018 | ||||||||
Shares solda | 5,035,724 | $ | 281,983,414 | |||||
Shares issued in reinvestment of distributions | 1,856,236 | 102,594,147 | ||||||
Shares issued on reorganization (Note 8) | 2,395,438 | 145,978,300 | ||||||
Shares redeemed | (6,396,843 | ) | (364,092,035 | ) | ||||
Net increase (decrease) | 2,890,555 | $ | 166,463,826 | |||||
Year ended October 31, 2017 | ||||||||
Shares sold | 7,963,603 | $ | 447,630,182 | |||||
Shares issued in reinvestment of distributions | 1,010,594 | 55,825,171 | ||||||
Shares redeemed | (7,746,568 | ) | (426,845,227 | ) | ||||
Net increase (decrease) | 1,227,629 | $ | 76,610,126 | |||||
| franklintempleton.com | Annual Report | 59 | ||
FRANKLIN VALUE INVESTORS TRUST
NOTES TO FINANCIAL STATEMENTS
2. Shares of Beneficial Interest(continued)
Franklin Small Cap Value Fund | ||||||||
| Shares | Amount | |||||||
Class C Shares: | ||||||||
Year ended October 31, 2018 | ||||||||
Shares sold | 648,509 | $ | 32,792,088 | |||||
Shares issued in reinvestment of distributions | 417,801 | 20,530,752 | ||||||
Shares issued on reorganization (Note 8) | 476,887 | 25,933,120 | ||||||
Shares redeemeda | (2,837,859 | ) | (139,222,811 | ) | ||||
Net increase (decrease) | (1,294,662 | ) | $ | (59,966,851 | ) | |||
Year ended October 31, 2017 | ||||||||
Shares sold | 748,489 | $ | 36,949,706 | |||||
Shares issued in reinvestment of distributions | 234,411 | 11,638,500 | ||||||
Shares redeemed | (1,434,410 | ) | (70,781,063 | ) | ||||
Net increase (decrease) | (451,510 | ) | $ | (22,192,857 | ) | |||
Class R Shares: | ||||||||
Year ended October 31, 2018 | ||||||||
Shares sold | 588,883 | $ | 32,991,812 | |||||
Shares issued in reinvestment of distributions | 287,094 | 15,718,387 | ||||||
Shares issued on reorganization (Note 8) | 11,794 | 709,888 | ||||||
Shares redeemed | (1,426,317 | ) | (80,058,077 | ) | ||||
Net increase (decrease) | (538,546 | ) | $ | (30,637,990 | ) | |||
Year ended October 31, 2017 | ||||||||
Shares sold | 1,007,604 | $ | 54,925,905 | |||||
Shares issued in reinvestment of distributions | 191,550 | 10,477,784 | ||||||
Shares redeemed | (1,778,918 | ) | (97,127,432 | ) | ||||
Net increase (decrease) | (579,764 | ) | $ | (31,723,743 | ) | |||
Class R6 Shares: | ||||||||
Year ended October 31, 2018 | ||||||||
Shares sold | 2,309,329 | $ | 137,334,342 | |||||
Shares issued in reinvestment of distributions | 276,595 | 15,978,906 | ||||||
Shares redeemed | (1,269,332 | ) | (76,007,522 | ) | ||||
Net increase (decrease) | 1,316,592 | $ | 77,305,726 | |||||
Year ended October 31, 2017 | ||||||||
Shares sold | 2,383,568 | $ | 139,507,090 | |||||
Shares issued in reinvestment of distributions | 79,035 | 4,542,911 | ||||||
Shares redeemed | (744,776 | ) | (42,891,767 | ) | ||||
Net increase (decrease) | 1,717,827 | $ | 101,158,234 | |||||
60 | Annual Report | franklintempleton.com | ||
FRANKLIN VALUE INVESTORS TRUST
NOTES TO FINANCIAL STATEMENTS
Franklin Small Cap Value Fund | ||||||||
| Shares | Amount | |||||||
Advisor Class Shares: | ||||||||
Year ended October 31, 2018 | ||||||||
Shares sold | 2,148,313 | $ | 128,184,231 | |||||
Shares issued in reinvestment of distributions | 748,624 | 43,337,870 | ||||||
Shares issued on reorganization (Note 8) | 145,356 | 9,247,589 | ||||||
Shares redeemed | (2,632,074 | ) | (156,544,248 | ) | ||||
Net increase (decrease) | 410,219 | $ | 24,225,442 | |||||
Year ended October 31, 2017 | ||||||||
Shares sold | 4,646,503 | $ | 267,144,603 | |||||
Shares issued in reinvestment of distributions | 813,656 | 46,809,648 | ||||||
Shares redeemed | (12,670,988 | ) | (728,011,189 | ) | ||||
Net increase (decrease) | (7,210,829 | ) | $ | (414,056,938 | ) | |||
aMay include a portion of Class C shares that were automatically converted to Class A.
3. Transactions with Affiliates
Franklin Resources, Inc. is the holding company for various subsidiaries that together are referred to as Franklin Templeton Investments. Certain officers and trustees of the Trust are also officers and/or directors of the following subsidiaries:
| Subsidiary | Affiliation | |
Franklin Advisory Services, LLC (Advisory Services) | Investment manager | |
Franklin Mutual Advisers, LLC (Franklin Mutual)# | Investment manager | |
Franklin Templeton Services, LLC (FT Services) | Administrative manager | |
Franklin Templeton Distributors, Inc. (Distributors) | Principal underwriter | |
Franklin Templeton Investor Services, LLC (Investor Services) | Transfer agent |
a. Management Fees
Franklin Balance Sheet Investment Fund pays an investment management fee to Advisory Services based on the average daily net assets of the Fund as follows:
| Annualized Fee Rate | Net Assets | |
0.625% | Up to and including $100 million | |
0.500% | Over $100 million, up to and including $250 million | |
0.450% | Over $250 million, up to and including $7.5 billion | |
0.440% | Over $7.5 billion, up to and including $10 billion | |
0.430% | Over $10 billion, up to and including $12.5 billion | |
0.420% | Over $12.5 billion, up to and including $15 billion | |
0.400% | In excess of $15 billion |
Franklin MicroCap Value Fund pays an investment management fee to Advisory Services of 0.75% per year of the average daily net assets of the Fund.
| franklintempleton.com | Annual Report | 61 | ||
FRANKLIN VALUE INVESTORS TRUST
NOTES TO FINANCIAL STATEMENTS
3. Transactions with Affiliates(continued)
a. Management Fees(continued)
Franklin Small Cap Value Fund pays an investment management fee to Advisory Services based on the average daily net assets of the Fund as follows:
| Annualized Fee Rate | Net Assets | |||
0.750% | Up to and including $500 million | |||
0.625% | Over $500 million, up to and including $1 billion | |||
0.500% | Over $1 billion, up to and including $5 billion | |||
0.490% | In excess of $5 billion |
For the year ended October 31, 2018, each Fund’s gross effective investment management fee rate based on average daily net assets was as follows:
Franklin Balance Sheet Investment Fund | Franklin MicroCap Value Fund | Franklin Small Cap Value Fund | ||||||
0.475% | 0.750% | 0.569% | ||||||
#Effective November 1, 2018, Franklin Mutual began serving as the Funds’ investment manager.
b. Administrative Fees
Under an agreement with Advisory Services, FT Services provides administrative services to the Funds. The fee is paid by Advisory Services based on the Funds’ average daily net assets and is not an additional expense of the Funds. Effective November 1, 2018, the fee will be paid by Franklin Mutual.
c. Distribution Fees
The Board has adopted distribution plans for each share class, with the exception of Class R6 and Advisor Class shares, pursuant to Rule12b-1 under the 1940 Act. Under the Funds’ Class A reimbursement distribution plans, the Funds reimburse Distributors for costs incurred in connection with the servicing, sale and distribution of each Fund’s shares up to the maximum annual plan rate. Under the Class A reimbursement distribution plans, costs exceeding the maximum for the current plan year cannot be reimbursed in subsequent periods. In addition, under the Funds’ Class C and R compensation distribution plans, the Funds pay Distributors for costs incurred in connection with the servicing, sale and distribution of each Fund’s shares up to the maximum annual plan rate for each class. The plan year, for purposes of monitoring compliance with the maximum annual plan rates, is February 1 through January 31 for each Fund.
The maximum annual plan rates, based on the average daily net assets, for each class, are as follows:
Franklin Balance Sheet
| Franklin MicroCap Value Fund | Franklin Small Cap Value Fund | ||||||||||
Reimbursement Plans: | ||||||||||||
Class A | 0.25% | 0.25% | 0.35% | |||||||||
Compensation Plans: | ||||||||||||
Class C | 1.00% | — | 1.00% | |||||||||
Class R | 0.50% | — | 0.50% | |||||||||
For Franklin Small Cap Value Fund, the Board has set the current rate at 0.25% per year for Class A shares until further notice and approval by the Board.
62 | Annual Report | franklintempleton.com | ||
FRANKLIN VALUE INVESTORS TRUST
NOTES TO FINANCIAL STATEMENTS
d. Sales Charges/Underwriting Agreements
Front-end sales charges and contingent deferred sales charges (CDSC) do not represent expenses of the Funds. These charges are deducted from the proceeds of sales of fund shares prior to investment or from redemption proceeds prior to remittance, as applicable. Distributors has advised the Funds of the following commission transactions related to the sales and redemptions of the Funds’ shares for the year:
Franklin Balance Sheet Investment Fund | Franklin MicroCap Value Fund | Franklin Small Cap Value Fund | ||||||||||
Sales charges retained net of commissions paid to unaffiliated brokers/dealers | $107,441 | $5,341 | $253,410 | |||||||||
CDSC retained | $ 5,129 | $ 80 | $ 18,456 | |||||||||
Effective September 10, 2018, the Board approved changes to certainfront-end sales charges and dealer commissions on Class A shares. Further details are disclosed in the Funds’ Prospectus.
e. Transfer Agent Fees
Each class of shares pays transfer agent fees to Investor Services for its performance of shareholder servicing obligations. Effective November 1, 2017, the fees are based on an annualized asset based fee of 0.02% plus a transaction based fee. Prior to November 1, 2017, the fees were account based fees that varied based on fund or account type. In addition, each class reimburses Investor Services for out of pocket expenses incurred and, except for Class R6, reimburses shareholder servicing fees paid to third parties. These fees are allocated daily based upon their relative proportion of such classes’ aggregate net assets. Class R6 pays Investor Services transfer agent fees specific to that class.
For the year ended October 31, 2018, the Funds paid transfer agent fees as noted in the Statements of Operations of which the following amounts were retained by Investor Services:
| Franklin Balance Sheet Investment Fund | Franklin MicroCap Value Fund | Franklin Small Cap Value Fund | ||||||||||
Transfer agent fees | $568,048 | $120,949 | $2,058,171 | |||||||||
f. Investments in Affiliated Management Investment Companies
Certain or all Funds invest in one or more affiliated management investment companies for purposes other than exercising a controlling influence over the management or policies. Management fees paid by the Funds are waived on assets invested in the affiliated management investment companies, as noted in the Statements of Operations, in an amount not to exceed the management and administrative fees paid directly or indirectly by each affiliate. During the year ended October 31, 2018, investments in affiliated management investment companies were as follows:
| Number of Shares Held at Beginning of Year | Gross Additions | Gross Reductions | Number of Shares Held at End of Year | Value at End of Year | Dividend Income | Realized Gain (Loss) | Net Change in Unrealized Appreciation (Depreciation) | |||||||||||||||||||||||||
Franklin Balance Sheet Investment Fund |
| |||||||||||||||||||||||||||||||
Non-Controlled Affiliates |
| |||||||||||||||||||||||||||||||
Institutional Fiduciary Trust Money Market Portfolio, 1.83% | 133,130,464 | 208,096,024 | (218,692,677 | ) | 122,533,811 | $122,533,811 | $ | 1,632,908 | $ — | $ — | ||||||||||||||||||||||
|
| |||||||||||||||||||||||||||||||
Franklin MicroCap Value Fund |
| |||||||||||||||||||||||||||||||
Non-Controlled Affiliates |
| |||||||||||||||||||||||||||||||
Institutional Fiduciary Trust Money Market Portfolio, 1.83% | 11,588,537 | 41,488,821 | (44,639,630 | ) | 8,437,728 | $ 8,437,728 | $ | 147,392 | $ — | $ — | ||||||||||||||||||||||
|
| |||||||||||||||||||||||||||||||
| franklintempleton.com | Annual Report | 63 | ||
FRANKLIN VALUE INVESTORS TRUST
NOTES TO FINANCIAL STATEMENTS
3. Transactions with Affiliates(continued)
f. Investments in Affiliated Management Investment Companies(continued)
| Number of Shares Held at Beginning of Year | Gross Additions | Gross Reductions | Number of Shares Held at End of Year | Value at End of Year | Dividend Income | Realized Gain (Loss) | Net Change in Unrealized Appreciation (Depreciation) | |||||||||||||||||||||||||
Franklin Small Cap Value Fund |
| |||||||||||||||||||||||||||||||
Non-Controlled Affiliates | ||||||||||||||||||||||||||||||||
Institutional Fiduciary Trust Money Market Portfolio, 1.83% | 41,161,870 | 812,455,075 | (628,956,819 | ) | 224,660,126 | $224,660,126 | $ | 1,643,678 | $ — | $ — | ||||||||||||||||||||||
|
| |||||||||||||||||||||||||||||||
g. Waiver and Expense Reimbursements
For Franklin MicroCap Value Fund and Franklin Small Cap Value Fund, Investor Services has voluntarily agreed in advance to waive or limit its fees so that the Class R6 transfer agent fees do not exceed 0.02% based on the average net assets of the class. Investor Services may discontinue this waiver in the future.
For Franklin Balance Sheet Investment Fund, Investor Services has contractually agreed in advance to waive or limit its fees so that the Class R6 transfer agent fees do not exceed 0.03% based on the average net assets of the class until February 28, 2019.
4. Expense Offset Arrangement
The Funds have entered into an arrangement with their custodian whereby credits realized as a result of uninvested cash balances are used to reduce a portion of the Funds’ custodian expenses. During the year ended October 31, 2018, the custodian fees were reduced as noted in the Statements of Operations.
5. Income Taxes
For tax purposes, the Fund may elect to defer any portion of a post-October capital loss or late-year ordinary loss to the first day of the following fiscal year. At October 31, 2018, Franklin MicroCap Value Fund deferred late-year ordinary losses of $175,138.
The tax character of distributions paid during the years ended October 31, 2018 and 2017, was as follows:
| Franklin Balance Sheet Investment Fund | Franklin MicroCap Value Fund | Franklin Small Cap Value Fund | ||||||||||||||||||||||
| 2018 | 2017 | 2018 | 2017 | 2018 | 2017 | |||||||||||||||||||
Distributions paid from: | ||||||||||||||||||||||||
Ordinary income | $ | 17,390,449 | $ | 4,685,059 | $ | 603,068 | $ | 1,686,388 | $ | 48,872,605 | $ | 7,983,427 | ||||||||||||
Long term capital gain | 58,926,272 | 60,964,559 | 23,879,793 | 29,235,162 | 175,312,675 | 130,972,171 | ||||||||||||||||||
|
| |||||||||||||||||||||||
| $ | 76,316,721 | $ | 65,649,618 | $ | 24,482,861 | $ | 30,921,550 | $ | 224,185,280 | $ | 138,955,598 | |||||||||||||
|
| |||||||||||||||||||||||
64 | Annual Report | franklintempleton.com | ||
FRANKLIN VALUE INVESTORS TRUST
NOTES TO FINANCIAL STATEMENTS
At October 31, 2018, the cost of investments, net unrealized appreciation (depreciation), undistributed ordinary income and undistributed long term capital gains for income tax purposes were as follows:
| Franklin Balance Sheet Investment Fund | Franklin MicroCap Value Fund | Franklin Small Cap Value Fund | ||||||||||
Cost of investments | $747,508,640 | $154,644,672 | $2,252,421,826 | |||||||||
|
| |||||||||||
Unrealized appreciation | $185,985,406 | $122,498,546 | $ 348,845,815 | |||||||||
Unrealized depreciation | (32,696,971 | ) | (18,430,501 | ) | (117,155,024 | ) | ||||||
|
| |||||||||||
Net unrealized appreciation (depreciation) | $153,288,435 | $104,068,045 | $ 231,690,791 | |||||||||
|
| |||||||||||
Distributable earnings: | ||||||||||||
Undistributed ordinary income | $ 12,012,514 | $ 903,813 | $ 47,944,171 | |||||||||
Undistributed long term capital gains | 101,712,196 | 13,294,168 | 298,035,019 | |||||||||
|
| |||||||||||
Total distributable earnings | $113,724,710 | $ 14,197,981 | $ 345,979,190 | |||||||||
|
| |||||||||||
Differences between income and/or capital gains as determined on a book basis and a tax basis are primarily due to differing treatments of pass-through entity income and wash sales.
The Funds utilized a tax accounting practice to treat a portion of the proceeds from capital shares redeemed as a distribution from realized capital gains.
6. Investment Transactions
Purchases and sales of investments (excluding short term securities) for the year ended October 31, 2018, were as follows:
| Franklin Balance Sheet Investment Fund | Franklin MicroCap Value Fund | Franklin Small Cap Value Fund | ||||||||||
Purchases | $255,136,714 | $12,251,791 | $1,360,258,986 | |||||||||
Sales | $343,417,243 | $68,798,728 | $1,565,136,635 | |||||||||
7. Holdings of 5% Voting Securities of Portfolio Companies
The 1940 Act defines “affiliated companies” to include investments in portfolio companies in which a fund owns 5% or more of the outstanding voting securities. During the year ended October 31, 2018, investments in “affiliated companies” were as follows:
| Name of Issuer | Number of Shares Held at Beginning of Year | Gross Additions | Gross Reductions | Number of Shares Held at End of Year | Value at End of Year | Dividend Income | Realized Gain (Loss) | Net Change in Unrealized Appreciation (Depreciation) | ||||||||||||||||||||||||
Franklin MicroCap Value Fund | ||||||||||||||||||||||||||||||||
Non-Controlled Affiliates | ||||||||||||||||||||||||||||||||
Continental Materials Corp. | 108,812 | — | (20,100 | ) | 88,712 | $ | 1,375,480 | $ — | $ | (4,059 | ) | $ (375,511 | ) | |||||||||||||||||||
Delta Apparel Inc. | 413,050 | — | (20,250 | ) | 392,800 | 7,490,696 | — | 321,992 | (1,072,807 | ) | ||||||||||||||||||||||
Full House Resorts Inc. | 1,923,520 | — | (66,100 | ) | 1,857,420 | 5,089,331 | — | 18,951 | (125,287 | ) | ||||||||||||||||||||||
Origen Financial Inc. | 1,900,000 | — | — | 1,900,000 | 172,900 | — | — | 10,830 | ||||||||||||||||||||||||
Williams Industrial Services Group Inc. | 1,275,000 | — | (603,100 | ) | 671,900 | — | a | — | (7,701,461 | ) | — | a | ||||||||||||||||||||
Total Affiliated Securities(Value is 5.5% of Net Assets) |
| $ | 14,128,407 | $ — | $ | (7,364,577 | ) | $(1,562,775) | ||||||||||||||||||||||||
Franklin Small Cap Value Fund | ||||||||||||||||||||||||||||||||
Non-Controlled Affiliates | ||||||||||||||||||||||||||||||||
Gibraltar Industries Inc. | 805,257 | 929,500 | — | 1,734,757 | $ | 61,826,740 | $ — | $ | — | $ (728,040 | ) | |||||||||||||||||||||
| franklintempleton.com | Annual Report | 65 | ||
FRANKLIN VALUE INVESTORS TRUST
NOTES TO FINANCIAL STATEMENTS
7. Holdings of 5% Voting Securities of Portfolio Companies(continued)
| Name of Issuer | Number of Shares Held at Beginning of Year | Gross Additions | Gross Reductions | Number of Shares Held at End of Year | Value at End of Year | Dividend Income | Realized Gain (Loss) | Net Change in Unrealized Appreciation (Depreciation) | ||||||||||||||||||||||||
Franklin Small Cap Value Fund(continued) |
| |||||||||||||||||||||||||||||||
Non-Controlled Affiliates(continued) |
| |||||||||||||||||||||||||||||||
Landec Corp. | 1,423,100 | — | — | 1,423,100 | $ | 19,482,239 | $ — | $ — | $ 626,164 | |||||||||||||||||||||||
Total Affiliated Securities(Value is 3.3% of Net Assets) |
| $ | 81,308,979 | $ — | $ — | $(101,876 | ) | |||||||||||||||||||||||||
aAs of October 31, 2018, no longer an affiliate. |
| |||||||||||||||||||||||||||||||
8. Reorganization
On December 1, 2017, Franklin Small Cap Value Fund (Surviving Fund), pursuant to a plan of reorganization approved on October 27, 2017, by shareholders of Franklin MidCap Value Fund (Acquired Fund), acquired 100% of the Acquired Fund’s net assets, primarily made up of investment securities, which included $19,471,853 of unrealized appreciation, through atax-free exchange of 3,029,475 shares of the Surviving Fund (valued at $181,868,897). Immediately after the completion of the reorganization, the combined net assets of the Surviving Fund were $2,811,180,553.
The primary purpose for the reorganization was to combine the Acquired Fund with a larger fund that had lower annual fund operating expense ratios, better overall historical performance, the same investment goals and similar principal investment strategies/risks. The estimated cost of the reorganization was $222,400 of which the Surviving Fund and the Acquired Fund each paid 25% and Advisory Services paid 50%. A portion of the Surviving Fund’s reorganization expenses are included with other expenses in the Statement of Operations.
Assuming the reorganization had been completed on November 1, 2017, the Surviving Fund’s pro forma results of operations, would have been as follows:
| Period | Net Investment Income | Net Realized and Unrealized Gain (Loss) | Net Increase Operations | |||||||||
For the period November 1, 2017, through October 31, 2018 | $19,161,222 | $(95,482,396 | ) | $(76,321,174 | ) | |||||||
Subsequent to the reorganization, the Fund has been managed as a single entity. Accordingly, it is impracticable to identify the amount of net investment income attributable to the Acquired Fund’s assets after the completion of the reorganization.
9. Credit Facility
The Funds, together with other U.S. registered and foreign investment funds (collectively, Borrowers), managed by Franklin Templeton Investments, are borrowers in a joint syndicated senior unsecured credit facility totaling $2 billion (Global Credit Facility) which matures on February 8, 2019. This Global Credit Facility provides a source of funds to the Borrowers for temporary and emergency purposes, including the ability to meet future unanticipated or unusually large redemption requests.
66 | Annual Report | franklintempleton.com | ||
FRANKLIN VALUE INVESTORS TRUST
NOTES TO FINANCIAL STATEMENTS
Under the terms of the Global Credit Facility, the Funds shall, in addition to interest charged on any borrowings made by the Funds and other costs incurred by the Funds, pay their share of fees and expenses incurred in connection with the implementation and maintenance of the Global Credit Facility, based upon their relative share of the aggregate net assets of all of the Borrowers, including an annual commitment fee of 0.15% based upon the unused portion of the Global Credit Facility. These fees are reflected in other expenses in the Statements of Operations. During the year ended October 31, 2018, the Funds did not use the Global Credit Facility.
10. Fair Value Measurements
The Funds follow a fair value hierarchy that distinguishes between market data obtained from independent sources (observable inputs) and the Funds’ own market assumptions (unobservable inputs). These inputs are used in determining the value of the Funds’ financial instruments and are summarized in the following fair value hierarchy:
| • | Level 1 – quoted prices in active markets for identical financial instruments |
| • | Level 2 – other significant observable inputs (including quoted prices for similar financial instruments, interest rates, prepayment speed, credit risk, etc.) |
| • | Level 3 – significant unobservable inputs (including the Funds’ own assumptions in determining the fair value of financial instruments) |
The input levels are not necessarily an indication of the risk or liquidity associated with financial instruments at that level.
For movements between the levels within the fair value hierarchy, the Funds have adopted a policy of recognizing the transfers as of the date of the underlying event which caused the movement.
A summary of inputs used as of October 31, 2018, in valuing the Funds’ assets carried at fair value, is as follows:
| Level 1 | Level 2 | Level 3 | Total | |||||||||||||
Franklin Balance Sheet Investment Fund Assets: | ||||||||||||||||
Investments in Securities:a | ||||||||||||||||
Equity Investments:b | ||||||||||||||||
Telecommunication Services | $ | — | $ | 13,419,280 | $ | — | $ | 13,419,280 | ||||||||
All Other Equity Investments | 756,645,204 | — | — | 756,645,204 | ||||||||||||
Corporate Bonds | — | 8,198,780 | — | 8,198,780 | ||||||||||||
Short Term Investments | 122,533,811 | — | — | 122,533,811 | ||||||||||||
Total Investments in Securities | $ | 879,179,015 | $ | 21,618,060 | $ | — | $ | 900,797,075 | ||||||||
Franklin MicroCap Value Fund Assets: | ||||||||||||||||
Investments in Securities:a | ||||||||||||||||
Equity Investments: | ||||||||||||||||
Trading Companies & Distributors | $ | 5,230,137 | $ | — | $ | — | c | $ | 5,230,137 | |||||||
All Other Equity Investments | 245,044,852 | — | — | 245,044,852 | ||||||||||||
Short Term Investments | 8,437,728 | — | — | 8,437,728 | ||||||||||||
Total Investments in Securities | $ | 258,712,717 | $ | — | $ | — | $ | 258,712,717 | ||||||||
| franklintempleton.com | Annual Report | 67 | ||
FRANKLIN VALUE INVESTORS TRUST
NOTES TO FINANCIAL STATEMENTS
10. Fair Value Measurements(continued)
| Level 1 | Level 2 | Level 3 | Total | |||||||||||||
Franklin Small Cap Value Fund Assets: | ||||||||||||||||
Investments in Securities:a | ||||||||||||||||
Equity Investments | $ | 2,237,747,906 | $ | — | $ | — | $ | 2,237,747,906 | ||||||||
Corporate Bonds | — | 21,704,585 | — | 21,704,585 | ||||||||||||
Short Term Investments | 224,660,126 | — | — | 224,660,126 | ||||||||||||
Total Investments in Securities | $ | 2,462,408,032 | $ | 21,704,585 | $ | — | $ | 2,484,112,617 | ||||||||
aFor detailed categories, see the accompanying Statements of Investments.
bIncludes common and convertible preferred stocks as well as other equity interests.
cIncludes securities determined to have no value at October 31, 2018.
A reconciliation of assets in which Level 3 inputs are used in determining fair value is presented when there are significant Level 3 financial instruments at the beginning and/or end of the year.
11. New Accounting Pronouncements
In August 2018, the Financial Accounting Standards Board issued Accounting Standards Update (ASU)No. 2018-13, Fair Value Measurement (Topic 820): Disclosure Framework—Changes to the Disclosure Requirements for Fair Value Measurements. The amendments in the ASU modify the disclosure requirements on fair value measurements in Topic 820. The ASU is effective for interim and annual reporting periods beginning after December 15, 2019. Management has reviewed the requirements and believes the adoption of this ASU will not have a material impact on the financial statements.
12. Change of Independent Registered Public Accounting Firm
On December 8, 2017, upon recommendation from the Audit Committee, the Board replaced PricewaterhouseCoopers LLP (PwC) with Ernst & Young LLP (E&Y) to serve as the Fund’s independent registered public accounting firm for the fiscal year ending October 31, 2018.
PwC’s reports on the Fund’s financial statements for the prior two fiscal years contained no adverse opinion or disclaimer of opinion nor were they qualified or modified as to uncertainty, audit scope, or accounting principles. During such fiscal years, (i) there were no disagreements with PwC on any matter of accounting principles or practices, financial statement disclosure, or audit scope or procedure, which disagreements, if not resolved to the satisfaction of PwC, would have caused them to make reference to the subject matter of the disagreements in connection with their reports on the Fund’s financial statements for such years, (ii) there were no reportable events, and (iii) prior to December 8, 2017 E&Y was not consulted regarding the application of accounting principles associated with any financial matter during the Fund’s prior two fiscal years.
13. Subsequent Events
The Funds have evaluated subsequent events through the issuance of the financial statements and determined that no events have occurred that require disclosure other than those already disclosed in the financial statements.
68 | Annual Report | franklintempleton.com | ||
FRANKLIN VALUE INVESTORS TRUST
NOTES TO FINANCIAL STATEMENTS
Abbreviations
Selected Portfolio
| ||||
ADR | American Depositary Receipt | |||
REIT |
Real Estate Investment Trust | |||
| franklintempleton.com | Annual Report | 69 | ||
FRANKLIN VALUE INVESTORS TRUST
Report of Independent Registered Public Accounting Firm
To the Board of Trustees of Franklin Value Investors Trust and Shareholders of Franklin Balance Sheet Investment Fund, Franklin MicroCap Value Fund, and Franklin Small Cap Value Fund:
Opinion on the Financial Statements
We have audited the accompanying statements of assets and liabilities of Franklin Value Investors Trust (the “Trust”) (comprising Franklin Balance Sheet Investment Fund, Franklin MicroCap Value Fund, and Franklin Small Cap Value Fund (collectively referred to as the “Funds”), including the statements of investments, as of October 31, 2018, and the related statements of operations, changes in net assets, and the financial highlights for the year then ended, and the related notes (collectively referred to as the “financial statements”). In our opinion, the financial statements present fairly, in all material respects, the financial position of each of the Funds comprising Franklin Value Investors Trust at October 31, 2018, the results of its operations, changes in its net assets, and its financial highlights for the year then ended, in conformity with U.S. generally accepted accounting principles.
The statements of changes in net assets for the year ended October 31, 2017 and the financial highlights for each of the four years in the period then ended October 31, 2017 for each of the Funds were audited by another auditor, who expressed an unqualified opinion in their report, dated December 18, 2017.
Basis for Opinion
These financial statements are the responsibility of the Funds’ management. Our responsibility is to express an opinion on the Funds’ financial statements based on our audits. We are a public accounting firm registered with the Public Company Accounting Oversight Board (United States) (“PCAOB”) and are required to be independent with respect to the Funds in accordance with the U.S. federal securities laws and the applicable rules and regulations of the Securities and Exchange Commission and the PCAOB.
We conducted our audits in accordance with the standards of the PCAOB. Those standards require that we plan and perform the audit to obtain reasonable assurance about whether the financial statements are free of material misstatement, whether due to error or fraud. The Funds are not required to have, nor were we engaged to perform, an audit of the Funds’ internal control over financial reporting. As part of our audits, we are required to obtain an understanding of internal control over financial reporting, but not for the purpose of expressing an opinion on the effectiveness of the Funds’ internal control over financial reporting. Accordingly, we express no such opinion.
Our audits included performing procedures to assess the risks of material misstatement of the financial statements, whether due to error or fraud, and performing procedures that respond to those risks. Such procedures included examining, on a test basis, evidence regarding the amounts and disclosures in the financial statements. Our procedures included confirmation of securities owned as of October 31, 2018, by correspondence with the custodian and brokers, or by other appropriate auditing procedures where replies from brokers were not received. Our audits also included evaluating the accounting principles used and significant estimates made by management, as well as evaluating the overall presentation of the financial statements. We believe that our audits provide a reasonable basis for our opinion.

We have served as the auditor of one or more Franklin investment companies since 1987.
Boston, Massachusetts
December 18, 2018
70 | Annual Report | franklintempleton.com | ||
FRANKLIN VALUE INVESTORS TRUST
Under Section 852(b)(3)(C) of the Internal Revenue Code, the Funds hereby report the maximum amount allowable but no less than the following amounts as long term capital gain dividends for the fiscal year ended October 31, 2018:
Franklin Balance Sheet Investment Fund | Franklin MicroCap Value Fund | Franklin Small Cap Value Fund | ||||||
$70,168,547 | $25,204,688 | $213,385,730 | ||||||
Under Section 871(k)(2)(C) of the Internal Revenue Code, the Funds hereby report the maximum amount allowable but no less than the following amounts as short term capital gain dividends for purposes of the tax imposed under Section 871(a)(1)(A) of the Internal Revenue Code for the fiscal year ended October 31, 2018:
Franklin Balance Sheet Investment Fund | Franklin MicroCap Value Fund | Franklin Small Cap Value Fund | ||||||
$6,509,619 | $316,654 | $30,759,414 | ||||||
Under Section 854(b)(1)(A) of the Internal Revenue Code, the Funds hereby report the following percentage amounts of the ordinary income dividends as income qualifying for the dividends received deduction for the fiscal year ended October 31, 2018:
Franklin Balance Sheet Investment Fund | Franklin MicroCap Value Fund | Franklin Small Cap Value Fund | ||||||
74.82% | 100.00% | 68.51% | ||||||
Under Section 854(b)(1)(B) of the Internal Revenue Code, the Funds hereby report the maximum amount allowable but no less than the following amounts as qualified dividends for purposes of the maximum rate under Section 1(h)(11) of the Internal Revenue Code for the fiscal year ended October 31, 2018:
Franklin Balance Sheet Investment Fund | Franklin MicroCap Value Fund | Franklin Small Cap Value Fund | ||||||
$16,954,017 | $2,835,520 | $37,342,279 | ||||||
Distributions, including qualified dividend income, paid during calendar year 2018 will be reported to shareholders on Form1099-DIV bymid-February 2019. Shareholders are advised to check with their tax advisors for information on the treatment of these amounts on their individual income tax returns.
| franklintempleton.com | Annual Report | 71 | ||
FRANKLIN VALUE INVESTORS TRUST
The name, year of birth and address of the officers and board members, as well as their affiliations, positions held with the Trust, principal occupations during at least the past five years and number of U.S. registered portfolios overseen in the Franklin Templeton Investments fund complex, are shown below. Generally, each board member serves until that person’s successor is elected and qualified.
Independent Board Members
| Number of Portfolios in | ||||||||
| Name, Year of Birth | Length of | Fund Complex Overseen | Other Directorships Held | |||||
and Address
| Position
| Time Served
| by Board Member*
| During at Least the Past 5 Years
| ||||
Edward I. Altman, Ph.D. (1941) |
Trustee |
Since 2015 |
14 |
None | ||||
| One Franklin Parkway | ||||||||
| San Mateo, CA 94403-1906 | ||||||||
| Principal Occupation During at Least the Past 5 Years: | ||||||||
Max L. Heine Professor of Finance, Emeritus and Director of The Credit and Debt Markets Research Program, Salomon Center, Stern School of Business, New York University; editor and author of numerous financial publications; financial consultant; an adviser to numerous financial and publishing organizations; andformerly, Vice Director, Salomon Center, Stern School of Business, New York University.
| ||||||||
Ann Torre Bates (1958) One Franklin Parkway San Mateo, CA 94403-1906 |
Trustee |
Since 2015 |
38 |
Ares Capital Corporation (specialty finance company) (2010-present), United Natural Foods, Inc. (distributor of natural, organic and specialty foods) (2013-present), Allied Capital Corporation (financial services) (2003-2010), SLM Corporation (Sallie Mae) (1997-2014) and Navient Corporation (loan management, servicing and asset recovery) (2014-2016). | ||||
| Principal Occupation During at Least the Past 5 Years: | ||||||||
Director of various companies; andformerly, Executive Vice President and Chief Financial Officer, NHP Incorporated (manager of multifamily housing) (1995-1997); and Vice President and Treasurer, US Airways, Inc. (until 1995).
| ||||||||
Burton J. Greenwald (1929) One Franklin Parkway San Mateo, CA 94403-1906 |
Vice Chairman and Trustee |
Vice Chairman since 2015 and Trustee since 2001 |
14 |
Franklin Templeton Emerging Markets Debt Opportunities Fund PLC (1999-present) and Fiduciary International Ireland Limited (1999-2015). | ||||
| Principal Occupation During at Least the Past 5 Years: | ||||||||
Managing Director, B.J. Greenwald Associates (management consultants to the financial services industry); andformerly, Chairman, Fiduciary Trust International Funds; Executive Vice President, L.F. Rothschild Fund Management, Inc.; President and Director, Merit Mutual Funds; President, Underwriting Division and Director, National Securities & Research Corporation; Governor, Investment Company Institute; and Chairman, ICI Public Information Committee.
| ||||||||
Keith E. Mitchell (1954) |
Trustee |
Since 2015 |
14 |
None | ||||
| One Franklin Parkway | ||||||||
| San Mateo, CA 94403-1906 | ||||||||
| Principal Occupation During at Least the Past 5 Years: | ||||||||
Director of various boards of asset management firms; andformerly, Managing Member, Mitchell, Hartley & Bechtel Advisers, LLC (formerly, Mitchell Advisers, LLC) (advisory firm) (2003-2015) and Managing Director, Putman Lovell NBF.
| ||||||||
David W. Niemiec (1949) One Franklin Parkway San Mateo, CA 94403-1906 |
Trustee |
Since 2011 |
38 |
Hess Midstream Partners LP (oil and gas midstream infrastructure) (2017-present). | ||||
| Principal Occupation During at Least the Past 5 Years: | ||||||||
Advisor, Saratoga Partners (private equity fund); andformerly, Managing Director, Saratoga Partners (1998-2001) and SBC Warburg Dillon Read (investment banking) (1997-1998); Vice Chairman, Dillon, Read & Co. Inc. (investment banking) (1991-1997); and Chief Financial Officer, Dillon, Read & Co. Inc. (1982-1997).
| ||||||||
72 | Annual Report | franklintempleton.com | ||
FRANKLIN VALUE INVESTORS TRUST
Independent Board Members(continued)
| Number of Portfolios in | ||||||||
| Name, Year of Birth | Length of | Fund Complex Overseen | Other Directorships Held | |||||
and Address
| Position
| Time Served
| by Board Member*
| During at Least the Past 5 Years
| ||||
Charles Rubens II (1930) One Franklin Parkway San Mateo, CA 94403-1906 |
Trustee |
Since 1989 |
14 |
None | ||||
| Principal Occupation During at Least the Past 5 Years: | ||||||||
Private investor and president ofnon-profit organizations; andformerly, an executive of Time, Inc.; and Trustee of Colorado College.
| ||||||||
Jan Hopkins Trachtman (1947) One Franklin Parkway San Mateo, CA 94403-1906 |
Trustee |
Since 2015 |
14 |
None | ||||
| Principal Occupation During at Least the Past 5 Years: | ||||||||
President and Founder, The Jan Hopkins Group (communications consulting firm); serves on Advisory Board of Knight Bagehot Fellowship; andformerly, President, Economic Club of New York (2007-2015); Anchor/Correspondent, CNN Financial News (until 2003); Managing Director and Head of Client Communications, Citigroup Private Bank (until 2005);Off-Air Reporter, ABC News’ World News Tonight; and Editor, CBS Network News.
| ||||||||
Robert E. Wade (1946) One Franklin Parkway San Mateo, CA 94403-1906 |
Chairman of the Board and Trustee |
Chairman of the Board since 2015 and Trustee since 2004 |
38 |
El Oro Ltd (investments) (2003-present). | ||||
| Principal Occupation During at Least the Past 5 Years: | ||||||||
Attorney at law engaged in private practice as a sole practitioner (1972-2008) and member of various boards.
| ||||||||
Gregory H. Williams (1943) |
Trustee |
Since 2008 |
14 |
None | ||||
| One Franklin Parkway | ||||||||
| San Mateo, CA 94403-1906 | ||||||||
| Principal Occupation During at Least the Past 5 Years: | ||||||||
Private investor; Consultant; andformerly, President, University of Cincinnati (2009-2012); President, The City College of New York (2001-2009); Dean, College of Law, Ohio State University (1993-2001); and Associate Vice President, Academic Affairs and Professor of Law, University of Iowa (1977-1993).
| ||||||||
Interested Board Members and Officers
| ||||||||
| Number of Portfolios in | ||||||||
| Name, Year of Birth | Length of | Fund Complex Overseen | Other Directorships Held | |||||
and Address
| Position
| Time Served
| by Board Member*
| During at Least the Past 5 Years
| ||||
**Gregory E. Johnson (1961) One Franklin Parkway San Mateo, CA 94403-1906 |
Trustee |
Since 2015 |
150 |
None | ||||
| Principal Occupation During at Least the Past 5 Years: | ||||||||
Chairman of the Board, Member - Office of the Chairman, Director and Chief Executive Officer, Franklin Resources, Inc.; officer and/or director or trustee, as the case may be, of some of the other subsidiaries of Franklin Resources, Inc. and of 42 of the investment companies in Franklin Templeton Investments; Vice Chairman, Investment Company Institute; andformerly, President, Franklin Resources, Inc. (1994-2015).
| ||||||||
**Jennifer M. Johnson (1964) One Franklin Parkway San Mateo, CA 94403-1906 |
Trustee |
Since 2015 |
46 |
None | ||||
| Principal Occupation During at Least the Past 5 Years: | ||||||||
President and Chief Operating Officer, Franklin Resources, Inc.; officer and/or director or trustee, as the case may be, of some of the other subsidiaries of Franklin Resources, Inc. and of four of the investment companies in Franklin Templeton Investments; andformerly, Chief Operating Officer and Executive Vice President, Franklin Resources, Inc. (1994-2015); Executive Vice President of Operations and Technology, Franklin Resources, Inc. (2005-2010); and Senior Vice President, Franklin Resources, Inc. (2003-2005).
| ||||||||
| franklintempleton.com | Annual Report | 73 | ||
FRANKLIN VALUE INVESTORS TRUST
Interested Board Members and Officers(continued)
| Number of Portfolios in | ||||||||
| Name, Year of Birth | Length of | Fund Complex Overseen | Other Directorships Held | |||||
and Address
| Position
| Time Served
| by Board Member*
| During at Least the Past 5 Years
| ||||
Alison E. Baur (1964) One Franklin Parkway San Mateo, CA 94403-1906 |
Vice President |
Since 2012 |
Not Applicable |
Not Applicable | ||||
| Principal Occupation During at Least the Past 5 Years: | ||||||||
Deputy General Counsel, Franklin Templeton Investments; and officer of some of the other subsidiaries of Franklin Resources, Inc. and of 44 of the investment companies in Franklin Templeton Investments.
| ||||||||
Aliya S. Gordon (1973) One Franklin Parkway San Mateo, CA 94403-1906 |
Vice President |
Since 2009 |
Not Applicable |
Not Applicable | ||||
| Principal Occupation During at Least the Past 5 Years: | ||||||||
Senior Associate General Counsel, Franklin Templeton Investments; and officer of 44 of the investment companies in Franklin Templeton Investments.
| ||||||||
Steven J. Gray (1955) One Franklin Parkway San Mateo, CA 94403-1906 |
Secretary and Vice President |
Secretary since 2005 and Vice President since 2009 |
Not Applicable |
Not Applicable | ||||
| Principal Occupation During at Least the Past 5 Years: | ||||||||
Senior Associate General Counsel, Franklin Templeton Investments; Vice President, Franklin Templeton Distributors, Inc. and FASA, LLC; and officer of 44 of the investment companies in Franklin Templeton Investments.
| ||||||||
Matthew T. Hinkle (1971) One Franklin Parkway San Mateo, CA 94403-1906 |
Chief Executive Officer – Finance and Administration |
Since 2017 |
Not Applicable |
Not Applicable | ||||
| Principal Occupation During at Least the Past 5 Years: | ||||||||
Senior Vice President, Franklin Templeton Services, LLC; officer of 44 of the investment companies in Franklin Templeton Investments; andformerly, Vice President, Global Tax (2012-April 2017) and Treasurer/Assistant Treasurer, Franklin Templeton Investments (2009-2017).
| ||||||||
Rupert H. Johnson, Jr. (1940) One Franklin Parkway San Mateo, CA 94403-1906 |
Vice President |
Since 1989 |
136 |
Not Applicable | ||||
| Principal Occupation During at Least the Past 5 Years: | ||||||||
Vice Chairman, Member - Office of the Chairman and Director, Franklin Resources, Inc.; Director, Franklin Advisers, Inc.; Senior Vice President, Franklin Advisory Services, LLC; and officer and/or director or trustee, as the case may be, of some of the other subsidiaries of Franklin Resources, Inc. and of 40 of the investment companies in Franklin Templeton Investments.
| ||||||||
Robert G. Kubilis (1973) 300 S.E. 2nd Street Fort Lauderdale, FL 33301-1923 |
Chief Financial Officer, Chief Accounting Officer and Treasurer |
Since 2012 |
Not Applicable |
Not Applicable | ||||
| Principal Occupation During at Least the Past 5 Years: | ||||||||
Treasurer, U.S. Fund Administration & Reporting, Franklin Templeton Investments; and officer of 16 of the investment companies in Franklin Templeton Investments.
| ||||||||
Peter A. Langerman (1955) c/o Franklin Mutual Advisers, LLC 101 John F. Kennedy Parkway Short Hills, NJ 07078-2716 |
President and Chief Executive Officer – Investment Management |
Since 2017 |
7 |
American International Group, Inc. (AIG) Credit Facility Trust (2010-2011). | ||||
| Principal Occupation During at Least the Past 5 Years: | ||||||||
Chairman of the Board, Chief Executive Officer and President, Franklin Mutual Advisers, LLC; President and Chief Investment Officer, Franklin Advisory Services, LLC; and officer and/or director, as the case may be, of three of the investment companies in Franklin Templeton Investments.
| ||||||||
74 | Annual Report | franklintempleton.com | ||
FRANKLIN VALUE INVESTORS TRUST
Interested Board Members and Officers(continued)
Name, Year of Birth and Address
| Position
| Length of Time Served
| Number of Portfolios in Fund Complex Overseen by Board Member*
| Other Directorships Held During at Least the Past 5 Years
| ||||
Robert Lim (1948) One Franklin Parkway San Mateo, CA 94403-1906 |
Vice President – AML Compliance |
Since 2016 |
Not Applicable |
Not Applicable | ||||
| Principal Occupation During at Least the Past 5 Years: | ||||||||
Vice President, Franklin Templeton Companies, LLC; Chief Compliance Officer, Franklin Templeton Distributors, Inc. and Franklin Templeton Investor Services, LLC; and officer of 44 of the investment companies in Franklin Templeton Investments.
| ||||||||
Kimberly H. Novotny (1972) 300 S.E. 2nd Street Fort Lauderdale, FL 33301-1923 |
Vice President |
Since 2013 |
Not Applicable |
Not Applicable | ||||
| Principal Occupation During at Least the Past 5 Years: | ||||||||
Associate General Counsel, Franklin Templeton Investments; Vice President and Corporate Secretary, Fiduciary Trust International of the South; Vice President, Templeton Investment Counsel, LLC; Assistant Secretary, Franklin Resources, Inc.; and officer of 44 of the investment companies in Franklin Templeton Investments.
| ||||||||
Robert C. Rosselot (1960) 300 S.E. 2nd Street Fort Lauderdale, FL 33301-1923 |
Chief Compliance Officer |
Since 2013 |
Not Applicable |
Not Applicable | ||||
| Principal Occupation During at Least the Past 5 Years: | ||||||||
Director, Global Compliance, Franklin Templeton Investments; Vice President, Franklin Templeton Companies, LLC; officer of 44 of the investment companies in Franklin Templeton Investments; andformerly, Senior Associate General Counsel, Franklin Templeton Investments (2007-2013); and Secretary and Vice President, Templeton Group of Funds (2004-2013).
| ||||||||
Karen L. Skidmore (1952) One Franklin Parkway San Mateo, CA 94403-1906 |
Vice President |
Since 2006 |
Not Applicable |
Not Applicable | ||||
| Principal Occupation During at Least the Past 5 Years: | ||||||||
Senior Associate General Counsel, Franklin Templeton Investments; and officer of 44 of the investment companies in Franklin Templeton Investments.
| ||||||||
Navid J. Tofigh (1972) One Franklin Parkway San Mateo, CA 94403-1906 |
Vice President |
Since 2015 |
Not Applicable |
Not Applicable | ||||
| Principal Occupation During at Least the Past 5 Years: | ||||||||
Associate General Counsel, Franklin Templeton Investments; and officer of 44 of the investment companies in Franklin Templeton Investments.
| ||||||||
Craig S. Tyle (1960) One Franklin Parkway San Mateo, CA 94403-1906 |
Vice President |
Since 2005 |
Not Applicable |
Not Applicable | ||||
| Principal Occupation During at Least the Past 5 Years: | ||||||||
General Counsel and Executive Vice President, Franklin Resources, Inc.; and officer of some of the other subsidiaries of Franklin Resources, Inc. and of 44 of the investment companies in Franklin Templeton Investments.
| ||||||||
Lori A. Weber (1964) 300 S.E. 2nd Street Fort Lauderdale, FL 33301-1923 |
Vice President |
Since 2011 |
Not Applicable |
Not Applicable | ||||
| Principal Occupation During at Least the Past 5 Years: | ||||||||
Senior Associate General Counsel, Franklin Templeton Investments; Assistant Secretary, Franklin Resources, Inc.; Vice President and Secretary, Templeton Investment Counsel, LLC; and officer of 44 of the investment companies in Franklin Templeton Investments.
| ||||||||
| franklintempleton.com | Annual Report | 75 | ||
FRANKLIN VALUE INVESTORS TRUST
*We base the number of portfolios on each separate series of the U.S. registered investment companies within the Franklin Templeton Investments fund complex. These portfolios have a common investment manager or affiliated investment managers.
**Gregory E. Johnson is considered to be an interested person of the Fund under the federal securities laws due to his position as an officer and director of Franklin Resources, Inc. (Resources), which is the parent company of the Fund’s investment manager and distributor. Jennifer M. Johnson is considered to be an interested person of the Fund under the federal securities laws due to her position as an officer of Resources.
Note 1: Gregory E. Johnson and Jennifer M. Johnson are siblings.
Note 2: Officer information is current as of the date of this report. It is possible that after this date, information about officers may change.
The Sarbanes-Oxley Act of 2002 and Rules adopted by the U.S. Securities and Exchange Commission require the Fund to disclose whether the Fund’s Audit Committee includes at least one member who is an audit committee financial expert within the meaning of such Act and Rules. The Fund’s Board has determined that there is at least one such financial expert on the Audit Committee and has designated each of Edward I. Altman, Ph.D., Ann Torre Bates and David W. Niemiec as an audit committee financial expert. The Board believes that Messrs. Altman and Niemiec and Ms. Bates qualify as such an expert in view of their extensive business background and experience. Mr. Altman has served as a member of the Fund Audit Committee since 2015. He currently serves as a Max L. Hines Professor of Finance, Emeritus and Director of The Credit and Debt Markets Research Program, Salomon Center, Stern School of Business, New York University. Ms. Bates has served as a member of the Fund Audit Committee since 2015. She currently serves as a director of Ares Capital Corporation (2010-present) and United Natural Foods, Inc. (2013-present) and was formerly a director of Navient Corporation from 2014 to 2016, SLM Corporation from 1997 to 2014 and Allied Capital Corporation from 2003 to 2010, Executive Vice President and Chief Financial Officer of NHP Incorporated from 1995 to 1997 and Vice President and Treasurer of US Airways, Inc. until 1995. Mr. Niemiec has served as a member of the Fund Audit Committee since 2015, currently serves as an Advisor to Saratoga Partners and was formerly its Managing Director from 1998 to 2001 and serves as a director of Hess Midstream Partners LP (2017-present). Mr. Niemiec was formerly a director of Emeritus Corporation from 1999 to 2010 and OSI Pharmaceuticals, Inc. from 2006 to 2010, Managing Director of SBC Warburg Dillon Read from 1997 to 1998, and was Vice Chairman from 1991 to 1997 and Chief Financial Officer from 1982 to 1997 of Dillon, Read & Co. Inc. As a result of such background and experience, the Board believes that Messrs. Altman and Niemiec and Ms. Bates have each acquired an understanding of generally accepted accounting principles and financial statements, the general application of such principles in connection with the accounting estimates, accruals and reserves, and analyzing and evaluating financial statements that present a breadth and level of complexity of accounting issues generally comparable to those of the Fund, as well as an understanding of internal controls and procedures for financial reporting and an understanding of audit committee functions. Messrs. Altman and Niemiec and Ms. Bates are independent Board members as that term is defined under the applicable U.S. Securities and Exchange Commission Rules and Releases.
The Statement of Additional Information (SAI) includes additional information about the board members and is available, without charge, upon request. Shareholders may call (800) DIALBEN/342-5236 to request the SAI.
76 | Annual Report | franklintempleton.com | ||
FRANKLIN VALUE INVESTORS TRUST
Board Approval of Investment Management Agreements
FRANKLIN VALUE INVESTORS TRUST (EACH SERIES OF SUCH TRUST, A “FUND”)
The Board of Trustees (Board), including a majority of trustees that are not “interested persons” as such term is defined in section 2(a)(19) of the Investment Company Act of 1940 (hereinafter referred to as “independent trustees”), at anin-person meeting held on May 17, 2018, unanimously approved the renewal of the Fund’s investment management agreement. Prior to a meeting of all of the trustees for the purpose of considering such renewal, the independent trustees participated in two other meetings held in connection with the renewal process. Throughout the process, the independent trustees received assistance and advice from and met separately with independent counsel. The independent trustees met with and interviewed officers of the investment manager (including portfolio managers), the transfer agent and shareholder services group and the distributor. In approving the renewal of the investment management agreement for the Fund, the Board, including the independent trustees, determined that the investment management fee structure was fair and reasonable and that continuance of the agreement was in the best interests of the Fund and its shareholders.
In reaching their decision on the investment management agreement, the trustees took into account information furnished throughout the year at regular Board meetings, as well as information specifically requested and furnished for the renewal process, which culminated in the meetings referred to above for the specific purpose of considering such agreement. Information furnished throughout the year included, among others, reports on the Fund’s investment performance, expenses, portfolio composition, portfolio brokerage execution, client commission arrangements, derivatives, securities lending, asset segregation, portfolio turnover, Rule12b-1 plan, distribution, shareholder servicing, legal and compliance matters, pricing of securities, sales and redemptions, and marketing support payments made to financial intermediaries, as well as a third-party survey of transfer agent fees charged to funds within the Franklin Templeton Investments (FTI) complex in comparison with those charged to other fund complexes deemed comparable. Also, related financial statements and other information about the scope and quality of services provided by the investment manager and its affiliates and enhancements to such services over the past year were provided. In addition, the trustees received periodic reports
throughout the year and during the renewal process relating to compliance with the Fund’s investment policies and restrictions. During the renewal process, the independent trustees considered the investment manager’s methods of operation within the Franklin Templeton group and its activities on behalf of other clients. The Board also noted that it received an annual report on all payments made by FTI or the Fund to financial intermediaries engaged in the sale of Fund shares, as well as a memorandum relating to third-party servicing arrangements in response to a Guidance Update from the U.S. Securities and Exchange Commission (SEC) relating to mutual fund distribution andsub-accounting fees.
The information obtained by the trustees during the renewal process also included a special report prepared by Broadridge Financial Solutions, Inc., an independent third-party analyst that utilizes data from Lipper, Inc. (“Lipper”), comparing the Fund’s investment performance and expenses with those of other mutual funds deemed comparable to the Fund as selected by Lipper (Broadridge Section 15(c) Report). The trustees reviewed the Broadridge Section 15(c) Report and its usefulness in the renewal process with respect to matters such as comparative fees, expenses, expense ratios, performance and volatility. They concluded that the report continues to be a reliable resource in the performance of their duties.
In addition, the trustees received a Profitability Study (Profitability Study) prepared by management discussing the profitability to FTI from its overall U.S. fund operations, as well as on an individualfund-by-fund basis. Over the past year, the Board and counsel to the independent trustees continued to receive reports on management’s handling of recent regulatory inquiries and pending legal actions against the investment manager and its affiliates. The independent trustees were satisfied with the actions taken to date by management in response to such regulatory and legal matters.
The trustees reviewed the personnel, operations, financial condition, and investment management capabilities, methodologies and resources of the investment manager. As part of this review, particular attention was given to management’s diligent risk management program, including continual monitoring and management of cybersecurity, liquidity and counterparty credit risk, and attention given to derivatives and other complex instruments that are held and expected to be held by the Fund and how such instruments are used to carry out the Fund’s investment goal(s). The Board also took into account, among other things, management’s efforts in establishing a global credit facility for the benefit of the Fund
| franklintempleton.com | Annual Report | 77 | ||
FRANKLIN VALUE INVESTORS TRUST
SHAREHOLDER INFORMATION
and other accounts managed by FTI to provide a source of cash for temporary and emergency purposes or to meet unusual redemption requests as well as the strong financial position of the investment manager’s parent company and its commitment to the mutual fund business. The Board noted management’s continuing efforts and expenditures in establishing effective business continuity plans and developing strategies to address areas of heightened concern in the mutual fund industry, such as cybersecurity and liquidity risk management. The Board also recognized management’s commitment to facilitating Board oversight of particular areas, including derivatives and payments to intermediaries, by enhanced reporting.
In addition to the above and other matters considered by the trustees throughout the course of the year, the following discussion relates to certain primary factors relevant to the Board’s decision. This discussion of the information and factors considered by the Board (including the information and factors discussed above) is not intended to be exhaustive, but rather summarizes certain factors considered by the Board. In view of the wide variety of factors considered, the Board did not, unless otherwise noted, find it practicable to quantify or otherwise assign relative weights to the foregoing factors. In addition, individual trustees may have assigned different weights to various factors.
NATURE, EXTENT AND QUALITY OF SERVICES.The trustees reviewed the nature, extent and quality of the services provided, and to be provided, by the investment manager. The trustees cited the investment manager’s ability to implement the Fund’s disciplined value investment approach and its long-term relationship with the Fund as reasons that shareholders choose to invest, and remain invested, in the Fund. The trustees reviewed the Fund’s portfolio management team, including its performance, staffing, skills and compensation program. With respect to portfolio manager compensation, management assured the trustees that the Fund’s long-term performance is a significant component of incentive-based compensation and noted that a portion of a portfolio manager’s incentive-based compensation is paid in shares ofpre-designated funds from the portfolio manager’s fund management area. The trustees noted that the portfolio manager compensation program aligned the interests of the portfolio managers with that of shareholders of the Fund. The trustees discussed with management various other products, portfolios and entities that are advised by the investment manager and the allocation of assets and expenses among and within them, as well as their relative fees and reasons for differences with respect thereto and any potential
conflicts. During regular Board meetings and the aforementioned meetings of the independent trustees, the trustees received reports and presentations on the investment manager’s best execution trading policies. The trustees considered periodic reports provided to them showing that the investment manager complied with the investment policies and restrictions of the Fund as well as other reports periodically furnished to the Board covering matters such as the compliance of portfolio managers and other management personnel with the code of ethics covering the investment management personnel, the adherence to fair value pricing procedures established by the Board and the accuracy of net asset value calculations. The Board noted the extent of the benefits provided to Fund shareholders from being part of the Franklin Templeton group of funds, including the right to exchange investments between funds (same class) without a sales charge, the ability to reinvest Fund dividends into other funds and the right to combine holdings of other funds to obtain reduced sales charges. The Board considered the investment manager’s significant efforts in developing and implementing compliance procedures established in accordance with SEC and other requirements.
The Board considered the nature, extent and quality of the services to be provided under the Fund’s other service agreements to determine that, on an overall basis, Fund shareholders were well served. In this connection, the Board also took into account transfer agent and shareholder services provided to Fund shareholders by an affiliate of the investment manager, noting continuing expenditures by management to increase and improve the scope of such services and favorable periodic reports on shareholder services conducted by independent third parties. While such considerations directly affected the trustees’ decision in renewing the Fund’s transfer agent and shareholder services agreement, the Board also considered these commitments as incidental benefits to Fund shareholders deriving from the investment management relationship.
Based on their review, the trustees were satisfied with the nature and quality of the overall services provided, and to be provided, by the investment manager and its affiliates to the Fund and its shareholders and were confident in the abilities of the management team to continue the disciplined value investment approach of the Fund and to provide quality services to the Fund and its shareholders.
INVESTMENT PERFORMANCE.The trustees reviewed and placed significant emphasis on the investment performance of the Fund over theone-, three-, five- and10-year periods
78 | Annual Report | franklintempleton.com | ||
FRANKLIN VALUE INVESTORS TRUST
SHAREHOLDER INFORMATION
ended February 28, 2018. They considered the history of successful performance of the Fund relative to various benchmarks. As part of their review, they inquired of management regarding benchmarks, style drift and restrictions on permitted investments. Consideration was also given to performance in the context of available levels of cash during the periods.
The trustees had meetings during the year, including the meetings referred to above held in connection with the renewal process, with the Fund’s portfolio managers to discuss performance and the management of the Fund. In addition to the materials provided by management in connection with the renewal process, the independent trustees requested supplemental information and additional presentations from the investment manager and senior management of FTI regarding the performance of the investment manager and the Fund. As part of these presentations, it was noted that senior management of FTI is conducting a review of the investment manager and the Fund and will report the results thereof to the independent trustees when completed. In addition, particular attention in assessing performance was given to the Broadridge Section 15(c) Report. That report showed the investment performance of the Fund (Class A shares) in comparison to other funds determined comparable by Lipper.
Franklin Balance Sheet Investment.The comparable funds to the Fund, as chosen by Lipper, included all retail and institutionalmulti-cap value funds. The Fund had total returns in the lowest performing quintile for theone-year period ended February 28, 2018, and had annualized total returns for the three- and five-year periods in the second-lowest and lowest performing quintiles, respectively. The trustees noted that the Fund’s total return on an annualized basis for the10-year period ended February 28, 2018 was in the second-lowest performing quintile. The trustees also compared Fund performance to other industry benchmarks, including measures of risk-adjusted performance of a fund, as part of their evaluation of investment performance. The trustees discussed with management the reasons for the relative underperformance for theone-, three-, five- and10-year periods ended February 28, 2018 and recent improvements made to the investment manager’s investment processes. While disappointed with the relative underperformance of the Fund, the Board did not believe that any changes with respect to the Fund were warranted at the time. The Board noted that it would continue to monitor future performance and, when available, would evaluate the results of the review being conducted by senior management of FTI.
Franklin MicroCap Value Fund.The comparable funds to the Fund, as chosen by Lipper, included all retail and institutionalsmall-cap value funds. The Fund had total returns in the middle performing quintile for theone-year period ended February 28, 2018, and had annualized total returns for the three- and five-year periods in the middle and second-lowest performing quintiles, respectively. The trustees noted that the Fund’s total return on an annualized basis for the10-year period ended February 28, 2018 was in the middle performing quintile. The trustees discussed with management the reasons for the relative underperformance for the five-year period ended February 28, 2018. Taking into account such discussions, the Board concluded that the Fund had performed in an acceptable manner in the context of the Fund’s goal.
The trustees also compared Fund performance to other industry benchmarks, including measures of risk-adjusted performance of a fund, as part of their evaluation of investment performance. The trustees concluded that the Fund had continued to perform well in comparison to its various benchmarks and in the context of the Fund’s goals.
Franklin Small Cap Value Fund.The comparable funds to the Fund, as chosen by Lipper, included all retail and institutionalsmall-cap value funds. The Fund had total returns in the second-best performing quintile for theone-year period ended February 28, 2018, and had annualized total returns for the three- and five-year periods in the second-best and middle performing quintiles, respectively. The trustees noted that the Fund’s total return on an annualized basis for the10-year period ended February 28, 2018 was in the second-best performing quintile. The Board was satisfied with such comparative performance.
The trustees also compared Fund performance to other industry benchmarks, including measures of risk-adjusted performance of a fund, as part of their evaluation of investment performance. The trustees concluded that the Fund had continued to perform well in comparison to its various benchmarks and in the context of the Fund’s goal.
COMPARATIVE EXPENSES AND MANAGEMENT PROFITABILITY.The trustees considered the cost of the services provided and to be provided and the profits realized by the investment manager and its affiliates from their respective relationships with the Fund. As part of the renewal process, the trustees explored with management the trends in expense ratios over the past three fiscal years and the reasons for any increases in the Fund’s expense ratios (or components thereof). In considering the appropriateness of the management fee and
| franklintempleton.com | Annual Report | 79 | ||
FRANKLIN VALUE INVESTORS TRUST
SHAREHOLDER INFORMATION
other expenses charged to the Fund, the Board took into account various factors including investment performance and matters relating to Fund operations, including, but not limited to, the quality and experience of its portfolio managers and research staff. Consideration was also given to a comparative analysis in the Broadridge Section 15(c) Report of the investment management fee and total expense ratio of the Fund in comparison with those of a group of other funds selected by Lipper as its appropriate Lipper expense group. Lipper expense data is based upon information taken from each fund’s most recent annual report, which reflects historical asset levels that may be quite different from those currently existing, particularly in a period of market volatility. While recognizing such inherent limitation and the fact that expense ratios generally increase as assets decline and decrease as assets grow, the Board believed the independent analysis conducted by Lipper to be an appropriate measure of comparative expenses.
In reviewing comparative costs, emphasis was given to the Fund’s contractual management fee in comparison with the contractual management fee that would have been charged by other funds within its Lipper expense group assuming they were similar in size to the Fund, as well as the actual total expenses of the Fund in comparison with those of its Lipper expense group. The Lipper contractual management fee analysis includes administrative charges as being part of the management fee, and total expenses, for comparative consistency, are shown by Lipper for Fund Class A shares.
Franklin Balance Sheet Investment Fund.The Fund’s contractual management fee rate was in the least expensive quintile of its Lipper expense group and its total expenses were also in the least expensive quintile of such group. The Board was satisfied with such comparative fees and expenses.
Franklin MicroCap Value Fund.The Fund’s contractual management fee rate was in the least expensive quintile of its Lipper expense group and its total expenses were also in the least expensive quintile of such group. The Board was satisfied with such comparative fees and expenses.
Franklin Small Cap Value Fund.The Fund’s contractual management fee rate was in the least expensive quintile of its Lipper expense group and its total expenses were also in the least expensive quintile of such group. The Board was satisfied with such comparative fees and expenses.
The trustees also reviewed the Profitability Study addressing profitability of Franklin Resources, Inc., from its overall U.S.
fund business, as well as profitability to the Fund’s investment manager and its affiliates, from providing investment management and other services to the Fund during the12-month period ended September 30, 2017, the most recent fiscalyear-end of Franklin Resources, Inc. The trustees reviewed the basis on which such reports are prepared and the cost allocation methodology utilized in the Profitability Study, it being recognized that allocation methodologies may each be reasonable while producing different results. In this respect, the Board noted that the reasonableness of the cost allocation methodologies was reviewed by independent accountants on an every other year basis.
The independent trustees met with management to discuss the Profitability Study. This included, among other things, a comparison of investment management income with investment management expenses of the Fund; comparison of underwriting revenues and expenses; the relative relationship of investment management and underwriting expenses; shareholder servicing profitability; economies of scale; and the relative contribution of the Fund to the profitability of the investment manager and its parent. In discussing the Profitability Study with the Board, the investment manager stated its belief that the costs incurred in establishing the infrastructure necessary to operate the type of mutual fund operations conducted by it and its affiliates may not be fully reflected in the expenses allocated to the Fund in determining its profitability.
The Board also took into account management’s expenditures in improving shareholder services provided to the Fund, as well as the need to meet additional regulatory and compliance requirements. The trustees also considered the extent to which the investment manager may derive ancillary benefits from Fund operations, including those derived from economies of scale, discussed below, the allocation of Fund brokerage and the use of commission dollars to pay for research and other similar services.
Based upon their consideration of all these factors, the trustees determined that the level of profits realized by the investment manager and its affiliates in providing services to the Fund was not excessive in view of the nature, quality and extent of services provided.
ECONOMIES OF SCALE.The Board considered economies of scale realized by the investment manager and its affiliates as the Fund grows larger and the extent to which they are shared with Fund shareholders, as for example, in the level of the investment management fee charged, in the quality and efficiency of services rendered and in increased capital
80 | Annual Report | franklintempleton.com | ||
FRANKLIN VALUE INVESTORS TRUST
SHAREHOLDER INFORMATION
commitments benefiting the Fund directly or indirectly. While recognizing that any precise determination is inherently subjective, the trustees noted that, based upon the Profitability Study, as some funds increase in size, at some point economies of scale may result in the investment manager realizing a larger profit margin on investment management services provided to such a fund.
With respect to the Franklin MicroCap Value Fund, the fee structure under the investment management agreement for the Fund provides a flat fee of 0.75% at all asset levels. It was noted the Fund primarily invests in domestic and foreign securities with a market capitalization of less than $500 million that are believed to be undervalued at the time of purchase. Management stated its belief that such limited investment options curtail the potential size of the Fund, thus preventing the type of economies of scale that might benefit other funds from increases in size and also pointed out that the Fund, whose asset size was approximately $310 million as of March 31, 2018, has been closed to new investors, with limited exceptions, since January 14, 2004, and had a very briefre-opening on February 15, 2013 and closed again to new investors (with limited exceptions) on February 19, 2013. Management also expressed its view that this fee was relatively low for this type of a fund and pointed out the favorable comparison of fees and expenses within its Lipper expense group. The independent trustees acknowledged that management’s explanation provided a reasonable basis for believing the existing fee rate under the investment management agreement was fair and that, in view of the Fund’s current modest size, management was not benefiting from any meaningful economies of scale in its management of the Fund, but would continue to monitor such matters.
With respect to all of the other Funds, the trustees also noted that benefits of economies of scale will be shared with Fund shareholders due to the decline in the effective investment management fee rate as breakpoints are achieved by the Fund. The trustees noted that breakpoints had been instituted as part of the Fund’s investment management fee and that the Board regularly evaluates whether additional breakpoints are appropriate. The trustees assessed the savings to shareholders resulting from such breakpoints and believed they were, and continue to be, appropriate and they agreed to continue to monitor the appropriateness of the breakpoints. The trustees also considered the effects an increase in assets under management would have on the investment management fee and expense ratio of the Fund. To the extent further economies of scale may be realized by the investment manager and its
affiliates, the Board believed the investment management and administrative fees provide a sharing of benefits with the Fund and its shareholders.
Proxy Voting Policies and Procedures
The Trust’s investment manager has established Proxy Voting Policies and Procedures (Policies) that the Trust uses to determine how to vote proxies relating to portfolio securities. Shareholders may view the Trust’s complete Policies online at franklintempleton.com. Alternatively, shareholders may request copies of the Policies free of charge by calling the Proxy Group collect at (954)527-7678 or by sending a written request to: Franklin Templeton Companies, LLC, 300 S.E. 2nd Street, Fort Lauderdale, FL 33301, Attention: Proxy Group. Copies of the Trust’s proxy voting records are also made available online at franklintempleton.com and posted on the U.S. Securities and Exchange Commission’s website at sec.gov and reflect the most recent12-month period ended June 30.
Quarterly Statement of Investments
The Trust files a complete statement of investments with the U.S. Securities and Exchange Commission for the first and third quarters for each fiscal year on FormN-Q. Shareholders may view the filed FormN-Q by visiting the Commission’s website at sec.gov. The filed form may also be viewed and copied at the Commission’s Public Reference Room in Washington, DC. Information regarding the operations of the Public Reference Room may be obtained by calling(800) SEC-0330.
Householding of Reports and Prospectuses
You will receive each Fund’s financial reports every six months as well as an annual updated summary prospectus (prospectus available upon request). To reduce Fund expenses, we try to identify related shareholders in a household and send only one copy of the financial reports and summary prospectus. This process, called “householding,” will continue indefinitely unless you instruct us otherwise. If you prefer not to have these documents householded, please call us at (800)632-2301. At any time you may view current prospectuses/summary prospectuses and financial reports on our website. If you choose, you may receive these documents through electronic delivery.
| franklintempleton.com | Annual Report | 81 | ||
This page intentionally left blank.
This page intentionally left blank.
This page intentionally left blank.
 |
Annual Report and Shareholder Letter Franklin Value Investors Trust
Investment Manager Franklin Mutual Advisers, LLC
Distributor Franklin Templeton Distributors, Inc. (800) DIAL BEN®/342-5236 franklintempleton.com
Shareholder Services (800)632-2301 |
Authorized for distribution only when accompanied or preceded by a summary prospectus and/or prospectus. Investors should carefully consider a fund’s investment goals, risks, charges and expenses before investing. A prospectus contains this and other information; please read it carefully before investing.
To help ensure we provide you with quality service, all calls to and from our service areas are monitored and/or recorded.
| © 2018 Franklin Templeton Investments. All rights reserved. | FVIT A 12/18 |
| Item 2. | Code of Ethics. |
(a) The Registrant has adopted a code of ethics that applies to its principal executive officers and principal financial and accounting officer.
(c) N/A
(d) N/A
(f) Pursuant to Item 13(a)(1), the Registrant is attaching as an exhibit a copy of its code of ethics that applies to its principal executive officers and principal financial and accounting officer.
| Item 3. | Audit Committee Financial Expert. |
(a)(1) The Registrant has an audit committee financial expert serving on its audit committee.
(2) The audit committee financial expert is David W. Niemiec and he is “independent” as defined under the relevant Securities and Exchange Commission Rules and Releases.
| Item 4. | Principal Accountant Fees and Services. |
(a) Audit Fees
The aggregate fees paid to the principal accountant for professional services rendered by the principal accountant for the audit of the registrant’s annual financial statements or for services that are normally provided by the principal accountant in connection with statutory and regulatory filings or engagements were $92,925 for the fiscal year ended October 31, 2018 and $131,674 for the fiscal year ended October 31, 2017.
(b) Audit-Related Fees
The aggregate fees paid to the principal accountant for assurance and related services rendered by the principal accountant to the registrant that are reasonably related to the performance of the audit of the registrant’s financial statements and are not reported under paragraph
(a) of Item 4 were $0 for the fiscal year ended October 31, 2018 and $3,071 for the fiscal year ended October 31, 2017. The services for which these fees were paid included attestation services.
There were no fees paid to the principal accountant for assurance and related services rendered by the principal accountant to the registrant’s investment adviser and any entity controlling, controlled by or under common control with the investment adviser that provides ongoing services to the registrant that are reasonably related to the performance of the audit of their financial statements.
(c) Tax Fees
The aggregate fees paid to the principal accountant for professional services rendered by the principal accountant to the registrant for tax compliance, tax advice and tax planning were $410 for the fiscal year ended October 31, 2018 and $0 for the fiscal year ended October 31, 2017. The services for which these fees were paid include identifying passive foreign investment companies.
The aggregate fees paid to the principal accountant for professional services rendered by the principal accountant to the registrant’s investment adviser and any entity controlling, controlled by or under common control with the investment adviser that provides ongoing services to the registrant for tax compliance, tax advice and tax planning were $81,210 for the fiscal year ended October 31, 2018 and $0 for the fiscal year ended October 31, 2017. The services for which these fees were paid included global withholding tax reporter service and India tax compliance services.
(d) All Other Fees
There were no fees paid to the principal accountant for products and services rendered by the principal accountant to the registrant not reported in paragraphs (a)-(c) of Item 4.
The aggregate fees paid to the principal accountant for products and services rendered by the principal accountant to the registrant’s investment adviser and any entity controlling, controlled by or under common control with the investment adviser that provides ongoing services to the registrant not reported in paragraphs (a)-(c) of Item 4 were $0 for the fiscal year ended October 31, 2018 and $14,000 for the fiscal year ended October 31, 2017. The services for which these fees were paid included benchmarking services in connection with ICI TA Survey.
(e) (1) The registrant’s audit committee is directly responsible for approving the services to be provided by the auditors, including:
(i)pre-approval of all audit and audit related services;
(ii)pre-approval of allnon-audit related services to be provided to the Fund by the auditors;
(iii)pre-approval of allnon-audit related services to be provided to the registrant by the auditors to the registrant’s investment adviser or to any entity that controls, is controlled by or is under common control with the registrant’s investment adviser and that provides ongoing services to the registrant where thenon-audit services relate directly to the operations or financial reporting of the registrant; and
(iv) establishment by the audit committee, if deemed necessary or appropriate, as an alternative to committeepre-approval of services to be provided by the auditors, as required by paragraphs (ii) and (iii) above, of policies and procedures to permit such services to bepre-approved by other means, such as through establishment of guidelines or by action of a designated member or members of the committee; provided the policies and procedures are detailed as to the particular service and the committee is informed of each service and such policies and procedures do not include delegation of audit committee responsibilities, as contemplated under the Securities Exchange Act of 1934, to management; subject, in the case of (ii) through (iv), to any waivers, exceptions or exemptions that may be available under applicable law or rules.
(e) (2) None of the services provided to the registrant described in paragraphs (b)-(d) of Item 4 were approved by the audit committee pursuant to paragraph (c)(7)(i)(C) of Rule2-01 of regulationS-X.
(f) No disclosures are required by this Item 4(f).
(g) The aggregatenon-audit fees paid to the principal accountant for services rendered by the principal accountant to the registrant and the registrant’s investment adviser and any entity controlling, controlled by or under common control with the investment adviser that provides ongoing services to the registrant were $81,620 for the fiscal year ended October 31, 2018 and $17,071 for the fiscal year ended October 31, 2017.
(h) The registrant’s audit committee of the board has considered whether the provision ofnon-audit services that were rendered to the registrant’s investment adviser (not including anysub-adviser whose role is primarily portfolio management and is subcontracted with or overseen by another investment adviser), and any entity controlling, controlled by, or under common control with the investment adviser that provides ongoing services to the registrant that were notpre-approved pursuant to paragraph (c)(7)(ii) of Rule2-01 of RegulationS-X is compatible with maintaining the principal accountant’s independence.
| Item 5. | Audit Committee of Listed Registrants. N/A |
| Item 6. | Schedule of Investments. N/A |
| Item 7. | Disclosure of Proxy Voting Policies and Procedures forClosed-End Management Investment Companies. N/A |
| Item 8. | Portfolio Managers ofClosed-End Management Investment Companies. N/A |
| Item 9. | Purchases of Equity Securities byClosed-End Management Investment Company and Affiliated Purchasers. N/A |
| Item 10. | Submission of Matters to a Vote of Security Holders. |
There have been no changes to the procedures by which shareholders may recommend nominees to the Registrant’s Board of Trustees that would require disclosure herein.
| Item 11. | Controls and Procedures. |
(a) Evaluation of Disclosure Controls and Procedures. The Registrant maintains disclosure controls and procedures that are designed to provide reasonable assurance that information required to be disclosed in the Registrant’s filings under the Securities Exchange Act of 1934, as amended, and the Investment Company Act of 1940 is recorded, processed, summarized and reported within the periods specified in the rules and forms of the Securities and Exchange Commission. Such information is accumulated and communicated to the Registrant’s management, including its principal executive officer and principal financial officer, as appropriate, to allow timely decisions regarding required disclosure. The Registrant’s management, including the principal executive officer and the principal financial officer, recognizes that any set of controls and procedures, no matter how well designed and operated, can provide only reasonable assurance of achieving the desired control objectives.
Within 90 days prior to the filing date of this Shareholder Report onForm N-CSR, the Registrant had carried out an evaluation, under the supervision and with the participation of the Registrant’s management, including the Registrant’s principal executive officer and the Registrant’s principal financial officer, of the effectiveness of the design and operation of the Registrant’s disclosure controls and procedures. Based on such evaluation, the Registrant’s principal executive officer and principal financial officer concluded that the Registrant’s disclosure controls and procedures are effective.
(b) Changes in Internal Controls. There have been no changes in the Registrant’s internal control over financial reporting that occurred during the period covered by this report that has materially affected, or is reasonably likely to materially affect the internal control over financial reporting.
| Item 12. | Disclosure of Securities Lending Activities forClosed-End Management Investment Company. N/A |
| Item 13. | Exhibits. |
(a)(1) Code of Ethics
(a)(2) Certifications pursuant to Section 302 of the Sarbanes-Oxley Act of 2002 of Matthew T. Hinkle, Chief Executive Officer—Finance and Administration, and Robert G. Kubilis, Chief Financial Officer and Chief Accounting Officer
(a)(3) N/A
(a)(4) Change in Independent Registered Public Accountants
(b) Certifications pursuant to Section 906 of the Sarbanes-Oxley Act of 2002 of Matthew T. Hinkle, Chief Executive Officer—Finance and Administration, and Robert G. Kubilis, Chief Financial Officer and Chief Accounting Officer
SIGNATURES
Pursuant to the requirements of the Securities Exchange Act of 1934 and the Investment Company Act of 1940, the registrant has duly caused this report to be signed on its behalf by the undersigned, thereunto duly authorized.
| FRANKLIN VALUE INVESTORS TRUST | ||
| By | /s/ MATTHEW T. HINKLE | |
| Matthew T. Hinkle | ||
| Chief Executive Officer – Finance and Administration | ||
Date November 29, 2019 | ||
Pursuant to the requirements of the Securities Exchange Act of 1934 and the Investment Company Act of 1940, this report has been signed below by the following persons on behalf of the registrant and in the capacities and on the dates indicated.
| By | /s/ MATTHEW T. HINKLE | |
| Matthew T. Hinkle | ||
| Chief Executive Officer – Finance and Administration | ||
Date November 29, 2019 | ||
| By | /s/ ROBERT G. KUBILIS | |
| Robert G. Kubilis | ||
| Chief Financial Officer and Chief Accounting Officer | ||
Date November 29, 2019 | ||