
Semiannual Report
Economic and Market Overview
The U.S. economy, as measured by gross domestic product growth, expanded during the six-month period ended April 30, 2012. The national unemployment rate for April 2012 stood at 8.1%, compared with 8.9% at the start of the period.1 Jobless claims touched a four-year low in February, and job creation was fairly robust. Consistent with employment trends, industrial production and manufacturing activity increased toward the end of the period. Automobile sales rose to their highest levels since February 2008, and consumer confidence climbed to pre-recession levels. Outside of the U.S., Greece secured bailout financing as bondholders agreed to concessions and the country enacted austerity measures. Although the long-term resolution of the European debt situation remained unclear, the European Central Bank’s plan to increase liquidity through loans was well received and seemed to improve investor sentiment.
At the end of the reporting period, however, significant challenges to the economy remained, including uncertainty surrounding deeply indebted European countries, soaring gas prices amid political turmoil in the Middle East, indications of reduced economic stimulus from the federal government, and continued malaise in the U.S. housing market. Signs of China’s economic growth slowdown contributed to pessimism as, despite a higher overall level of U.S. exports, the U.S. trade deficit widened following decreases in exports to China and the eurozone.
Amid the improved economic reports, U.S. stock markets reached multi-year highs in late March and early April 2012. The Dow Jones Industrial Average exceeded the 13,000 level for the first time since 2008, and the NASDAQ Composite Index hit an 11-year high. Leading market sectors included consumer discretionary, information technology and financials. Conversely, utilities and energy lagged the broader market.
The foregoing information reflects our analysis and opinions as of April 30, 2012. The information is not a complete analysis of every aspect of any market, country, industry, security or fund. Statements of fact are from sources considered reliable.
1. Source: U.S. Bureau of Labor Statistics.
Semiannual Report | 3

Performance Summary as of 4/30/12
Franklin All Cap Value Fund
Your dividend income will vary depending on dividends or interest paid by securities in the Fund’s portfolio, adjusted for operating expenses of each class. Capital gain distributions are net profits realized from the sale of portfolio securities. The performance table does not reflect any taxes that a shareholder would pay on Fund dividends, capital gain distributions, if any, or any realized gains on the sale of Fund shares. Total return reflects reinvestment of the Fund’s dividends and capital gain distributions, if any, and any unrealized gains or losses.

Semiannual Report | 7
Performance Summary (continued)
Endnotes
All investments involve risks, including possible loss of principal. Value securities may not increase in price as anticipated or may decline further in value. While smaller and midsize companies may offer substantial opportunities for capital growth, they also involve heightened risks and should be considered speculative. Historically, smaller and midsize company securities have been more volatile in price than larger company securities, especially over the short term. The Fund may invest up to 25% of its total assets in foreign securities, which may involve special risks, including currency fluctuations and economic and political uncertainty. The Fund is actively managed but there is no guarantee that the manager’s investment decisions will produce the desired results. The Fund’s prospectus also includes a description of the main investment risks.
Class C: These shares have higher annual fees and expenses than Class A shares.
Class R: Shares are available to certain eligible investors as described in the prospectus. These shares have higher annual fees and expenses
than Class A shares.
Advisor Class: Shares are available to certain eligible investors as described in the prospectus.
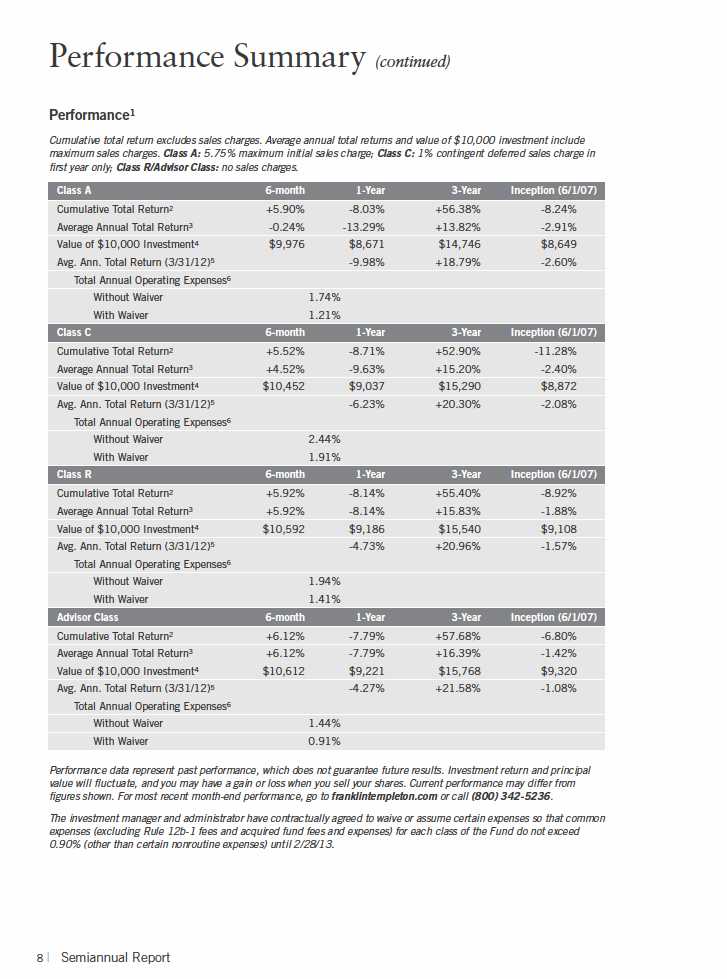
1. If the manager and administrator had not waived fees, the Fund’s total returns would have been lower. 2. Cumulative total return represents the change in value of an investment over the periods indicated.
3. Average annual total return represents the average annual change in value of an investment over the periods indicated. Six-month return has not been annualized.
4. These figures represent the value of a hypothetical $10,000 investment in the Fund over the periods indicated.
5. In accordance with SEC rules, we provide standardized average annual total return information through the latest calendar quarter.
6. Figures are as stated in the Fund’s prospectus current as of the date of this report. In periods of market volatility, assets may decline significantly, causing total annual Fund operating expenses to become higher than the figures shown.
Semiannual Report | 9
Your Fund’s Expenses
Franklin All Cap Value Fund
As a Fund shareholder, you can incur two types of costs:
- Transaction costs, including sales charges (loads) on Fund purchases; and
- Ongoing Fund costs, including management fees, distribution and service (12b-1) fees, and other Fund expenses. All mutual funds have ongoing costs, sometimes referred to as operating expenses.
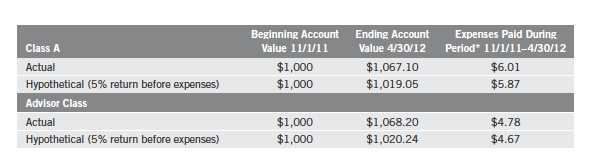
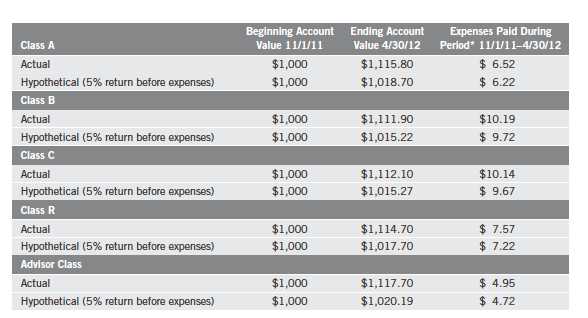
The following table shows ongoing costs of investing in the Fund and can help you understand these costs and compare them with those of other mutual funds. The table assumes a $1,000 investment held for the six months indicated.
Actual Fund Expenses
The first line (Actual) for each share class listed in the table provides actual account values and expenses. The “Ending Account Value” is derived from the Fund’s actual return, which includes the effect of Fund expenses.
You can estimate the expenses you paid during the period by following these steps. Of course, your account value and expenses will differ from those in this illustration:
| 1. | Divide your account value by $1,000. |
| | If an account had an $8,600 value, then $8,600 ÷ $1,000 = 8.6. |
| 2. | Multiply the result by the number under the heading “Expenses Paid During Period.” |
| | If Expenses Paid During Period were $7.50, then 8.6 x $7.50 = $64.50. |
In this illustration, the estimated expenses paid this period are $64.50.
Hypothetical Example for Comparison with Other Funds
Information in the second line (Hypothetical) for each class in the table can help you compare ongoing costs of investing in the Fund with those of other mutual funds. This information may not be used to estimate the actual ending account balance or expenses you paid during the period. The hypothetical “Ending Account Value” is based on the actual expense ratio for each class and an assumed 5% annual rate of return before expenses, which does not represent the Fund’s actual return. The figure under the heading “Expenses Paid During Period” shows the hypothetical expenses your account would have incurred under this scenario. You can compare this figure with the 5% hypothetical examples that appear in shareholder reports of other funds.
10 | Semiannual Report
Your Fund’s Expenses (continued)
Please note that expenses shown in the table are meant to highlight ongoing costs and do not reflect any transaction costs, such as sales charges. Therefore, the second line for each class is useful in comparing ongoing costs only, and will not help you compare total costs of owning different funds. In addition, if transaction costs were included, your total costs would have been higher. Please refer to the Fund prospectus for additional information on operating expenses.
Semiannual Report | 11

Performance Summary as of 4/30/12
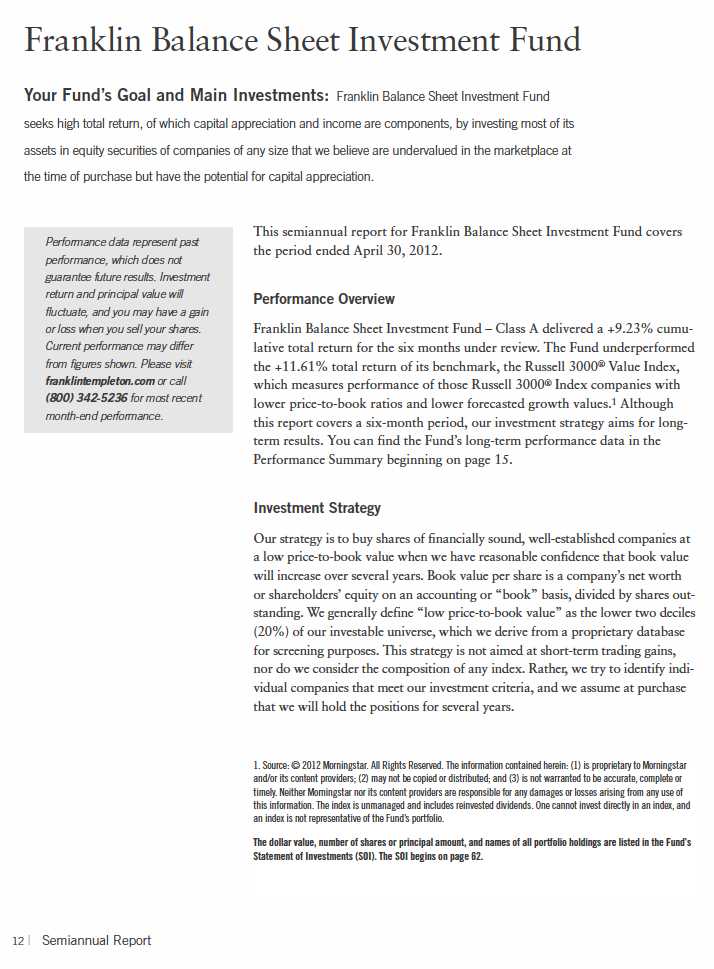
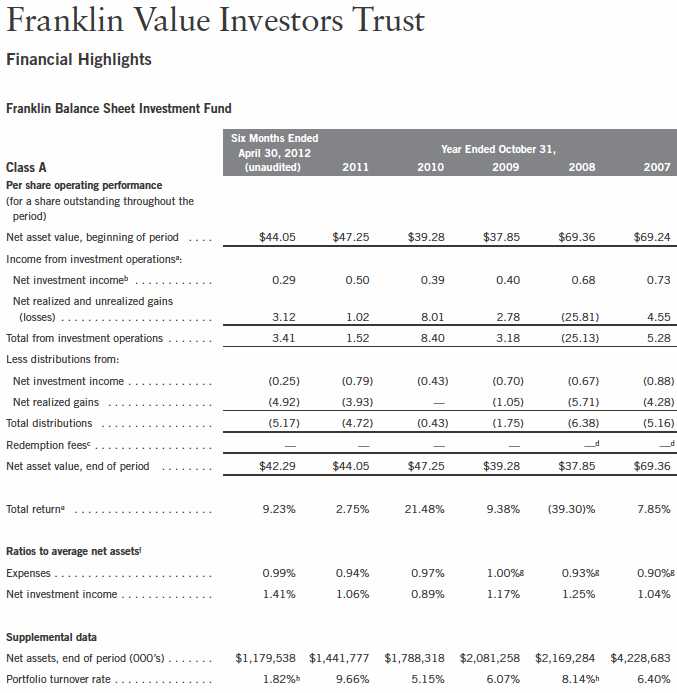
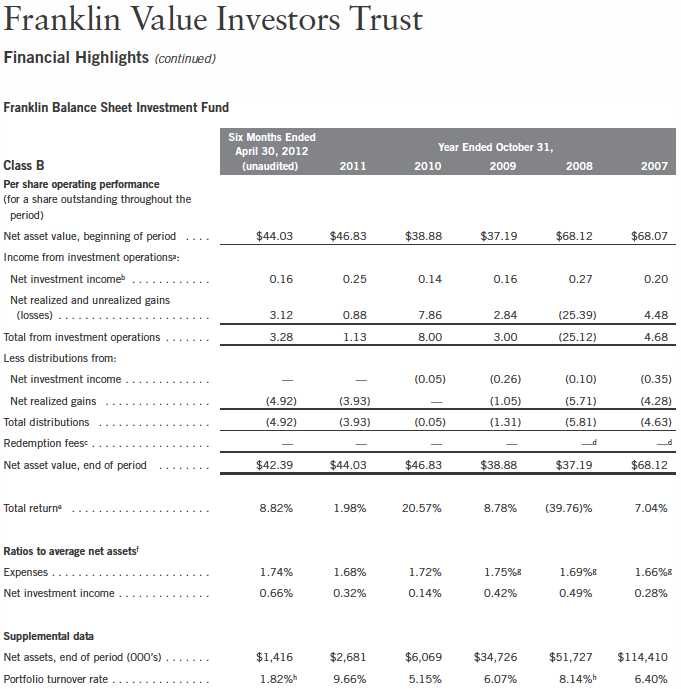
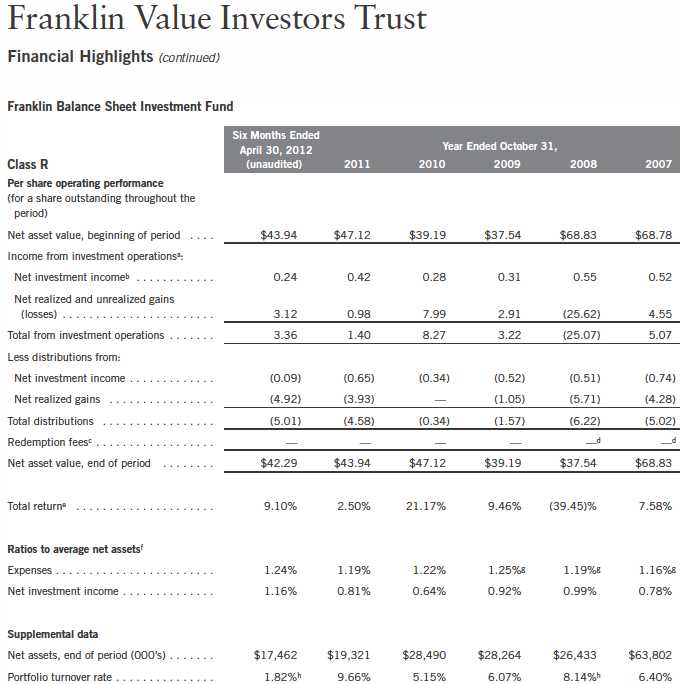
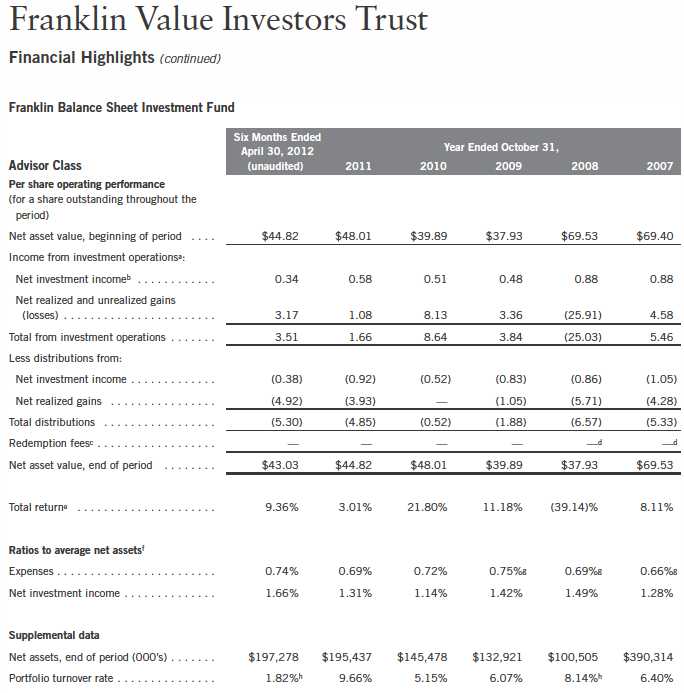
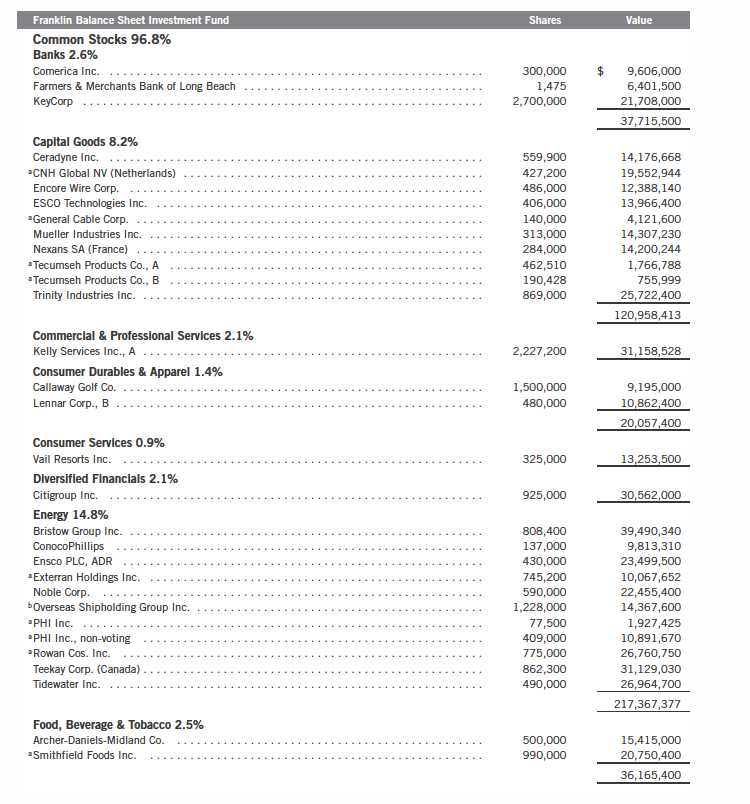
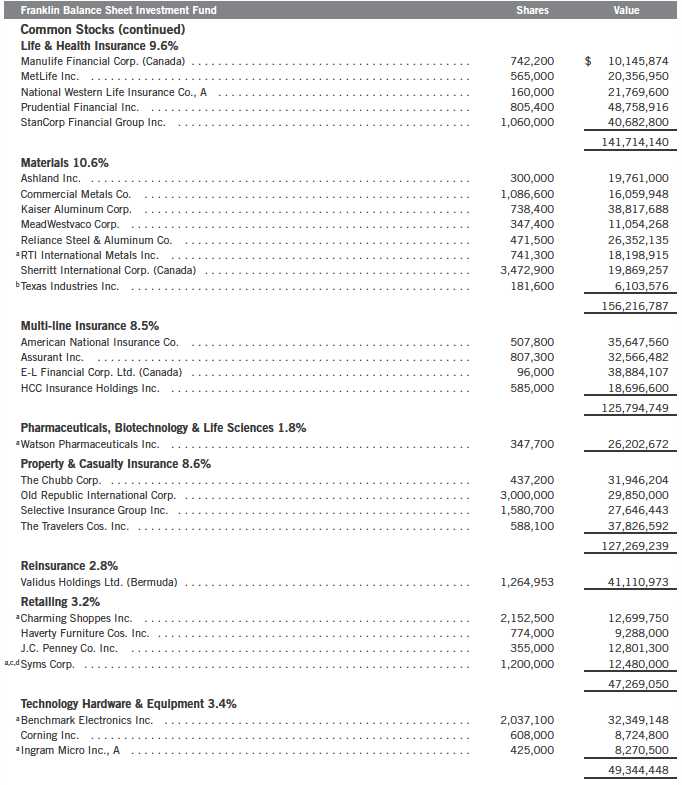
Franklin Balance Sheet Investment Fund
Your dividend income will vary depending on dividends or interest paid by securities in the Fund’s portfolio, adjusted for operating expenses of each class. Capital gain distributions are net profits realized from the sale of portfolio securities. The performance table does not reflect any taxes that a shareholder would pay on Fund dividends, capital gain distributions, if any, or any realized gains on the sale of Fund shares. Total return reflects reinvestment of the Fund’s dividends and capital gain distributions, if any, and any unrealized gains or losses.
Semiannual Report | 15
Performance Summary (continued)
Performance
Cumulative total return excludes sales charges. Average annual total returns and value of $10,000 investment include maximum sales charges. Class A: 5.75% maximum initial sales charge; Class B: contingent deferred sales charge (CDSC) declining from 4% to 1% over six years, and eliminated thereafter; Class C: 1% CDSC in first year only;
Class R/Advisor Class: no sales charges.
Performance data represent past performance, which does not guarantee future results. Investment return and principal value will fluctuate, and you may have a gain or loss when you sell your shares. Current performance may differ from figures shown. For most recent month-end performance, go to franklintempleton.com or call (800) 342-5236.
16 | Semiannual Report
Performance Summary (continued)
Endnotes
All investments involve risks, including possible loss of principal. Value securities may not increase in price as anticipated or may decline further in value. While smaller and midsize companies may offer substantial opportunities for capital growth, they also involve heightened risks and should be considered speculative. Historically, smaller and midsize company securities have been more volatile in price than larger company securities, especially over the short term. The Fund may invest up to 25% of its total assets in foreign securities, which may involve special risks, including currency fluctuations and economic and political uncertainty. The Fund is actively managed but there is no guarantee that the manager’s investment decisions will produce the desired results. The Fund’s prospectus also includes a description of the main investment risks.
| |
Class B: Class C: | These shares have higher annual fees and expenses than Class A shares. Prior to 1/1/04, these shares were offered with an initial sales charge; thus actual total returns would have differed. These shares have higher annual fees and expenses than Class A shares. |
Class R: | Shares are available to certain eligible investors as described in the prospectus. These shares have higher annual fees and expenses than Class A shares. |
Advisor Class: | Shares are available to certain eligible investors as described in the prospectus. |
1. Cumulative total return represents the change in value of an investment over the periods indicated.
2. Average annual total return represents the average annual change in value of an investment over the periods indicated. Six-month return has not been annualized.
3. These figures represent the value of a hypothetical $10,000 investment in the Fund over the periods indicated.
4. In accordance with SEC rules, we provide standardized average annual total return information through the latest calendar quarter.
5. Figures are as stated in the Fund’s prospectus current as of the date of this report. In periods of market volatility, assets may decline significantly, causing total annual Fund operating expenses to become higher than the figures shown.
Semiannual Report | 17
Your Fund’s Expenses
Franklin Balance Sheet Investment Fund
As a Fund shareholder, you can incur two types of costs:
- Transaction costs, including sales charges (loads) on Fund purchases; and
- Ongoing Fund costs, including management fees, distribution and service (12b-1) fees, and other Fund expenses. All mutual funds have ongoing costs, sometimes referred to as operating expenses.
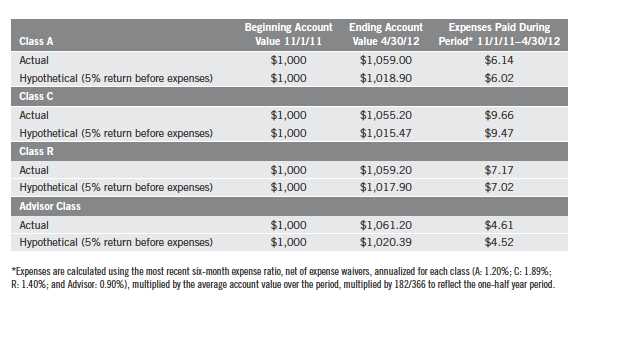
The following table shows ongoing costs of investing in the Fund and can help you understand these costs and compare them with those of other mutual funds. The table assumes a $1,000 investment held for the six months indicated.
Actual Fund Expenses
The first line (Actual) for each share class listed in the table provides actual account values and expenses. The “Ending Account Value” is derived from the Fund’s actual return, which includes the effect of Fund expenses.
You can estimate the expenses you paid during the period by following these steps. Of course, your account value and expenses will differ from those in this illustration:
| 1. | Divide your account value by $1,000. |
| | If an account had an $8,600 value, then $8,600 ÷ $1,000 = 8.6. |
| 2. | Multiply the result by the number under the heading “Expenses Paid During Period.” |
| | If Expenses Paid During Period were $7.50, then 8.6 x $7.50 = $64.50. |
In this illustration, the estimated expenses paid this period are $64.50.
Hypothetical Example for Comparison with Other Funds
Information in the second line (Hypothetical) for each class in the table can help you compare ongoing costs of investing in the Fund with those of other mutual funds. This information may not be used to estimate the actual ending account balance or expenses you paid during the period. The hypothetical “Ending Account Value” is based on the actual expense ratio for each class and an assumed 5% annual rate of return before expenses, which does not represent the Fund’s actual return. The figure under the heading “Expenses Paid During Period” shows the hypothetical expenses your account would have incurred under this scenario. You can compare this figure with the 5% hypothetical examples that appear in shareholder reports of other funds.
18 | Semiannual Report
Your Fund’s Expenses (continued)
Please note that expenses shown in the table are meant to highlight ongoing costs and do not reflect any transaction costs, such as sales charges. Therefore, the second line for each class is useful in comparing ongoing costs only, and will not help you compare total costs of owning different funds. In addition, if transaction costs were included, your total costs would have been higher. Please refer to the Fund prospectus for additional information on operating expenses.

*Expenses are calculated using the most recent six-month expense ratio, annualized for each class (A: 0.99%; B: 1.74%; C: 1.74%; R: 1.24%; and Advisor: 0.74%), multiplied by the average account value over the period, multiplied by 182/366 to reflect the one-half year period.
Semiannual Report | 19
Manager’s Discussion
During the six-month period under review, contributors to Fund performance included several holdings in the financials sector such as insurer Allstate.3 Some consumer discretionary holdings also boosted results, including The Home Depot and J.C. Penney, along with health care sector holdings such as pharmaceutical company Pfizer.4 Another key contributor to Fund performance was global software and services provider Microsoft.
Detractors from performance included energy company Chesapeake Energy and coal producer Peabody Energy, information technology provider Computer Sciences, and others such as aluminum producer Alcoa and electronics and services retailer Best Buy.
During the reporting period, the Fund initiated positions in diversified oil services company Baker Hughes, bank holding companies Comerica and Keycorp, world leader in specialty glass and ceramics Corning, insurer Progressive, and drug manufacturer Watson Pharmaceutical. We also added to our holdings in gas and oil producer Devon Energy, health care products manufacturer Johnson & Johnson and insurer Prudential Financial, and made smaller additions to several other positions. We liquidated our positions in Best Buy, Computer Sciences, J.C. Penney, and Peabody Energy, along with ITT and two securities we received as a result of its spinoff, Exelis and Xylem. We reduced our holdings in The Home Depot, International Business Machines, NIKE and State Street, among others.
3. The financials sector comprises banks, diversified financials and insurance in the SOI.
4. The consumer discretionary sector comprises consumer durables and apparel, consumer services and retailing in the SOI. The health care sector comprises health care equipment and services; and pharmaceuticals, biotechnology and life sciences in the SOI.

Semiannual Report | 21
22 | Semiannual Report
Performance Summary as of 4/30/12
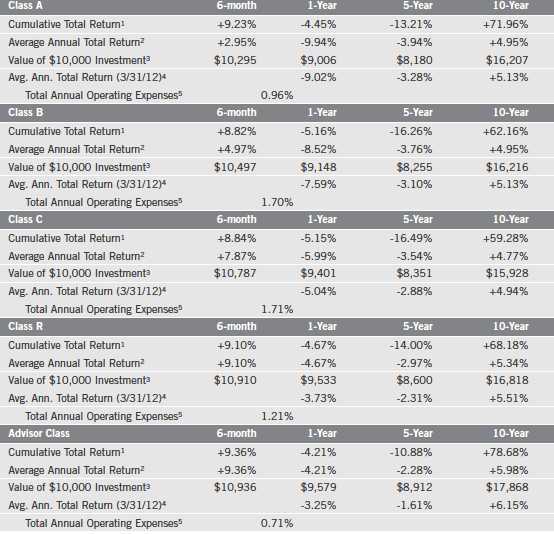
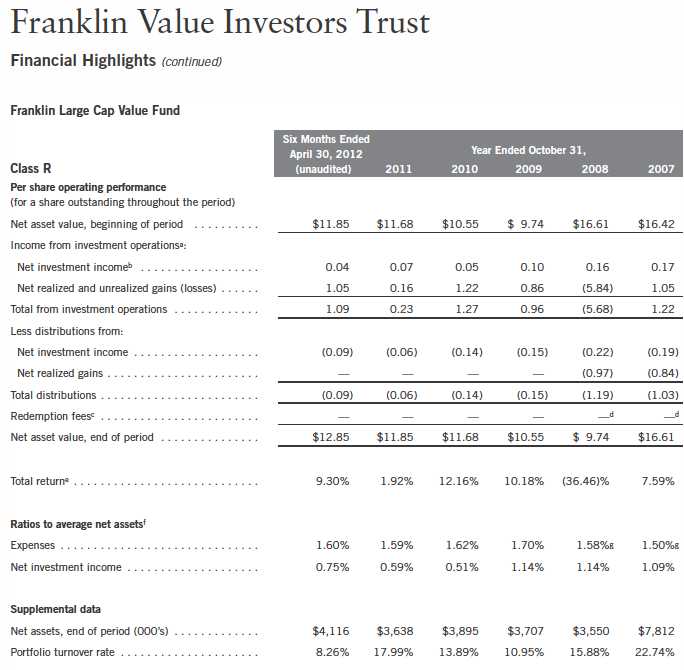
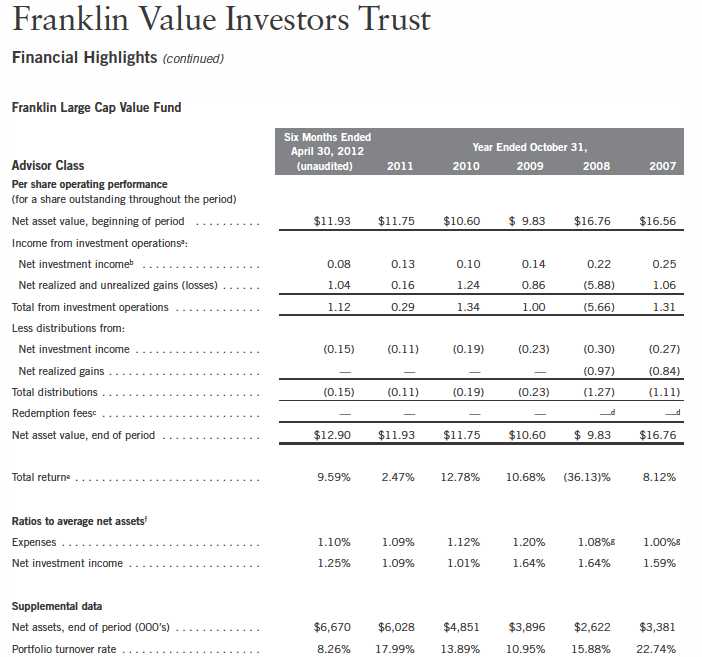
Franklin Large Cap Value Fund
Your dividend income will vary depending on dividends or interest paid by securities in the Fund’s portfolio, adjusted for operating expenses of each class. Capital gain distributions are net profits realized from the sale of portfolio securities. The performance table does not reflect any taxes that a shareholder would pay on Fund dividends, capital gain distributions, if any, or any realized gains on the sale of Fund shares. Total return reflects reinvestment of the Fund’s dividends and capital gain distributions, if any, and any unrealized gains or losses.
Semiannual Report | 23
Performance Summary (continued)
Performance1
Cumulative total return excludes sales charges. Average annual total returns and value of $10,000 investment include maximum sales charges. Class A: 5.75% maximum initial sales charge; Class B: contingent deferred sales charge (CDSC) declining from 4% to 1% over six years, and eliminated thereafter; Class C: 1% CDSC in first year only;
Class R/Advisor Class: no sales charges.
Performance data represent past performance, which does not guarantee future results. Investment return and principal value will fluctuate, and you may have a gain or loss when you sell your shares. Current performance may differ from figures shown. For most recent month-end performance, go to franklintempleton.com or call (800) 342-5236.
24 | Semiannual Report
Performance Summary (continued)
Endnotes
All investments involve risks, including possible loss of principal. Stock prices fluctuate, sometimes rapidly and dramatically, due to factors affecting individual companies, particular industries or sectors, or general market conditions. The Fund may invest up to 25% of its total assets in foreign securities, which may involve special risks, including currency fluctuations and economic and political uncertainty. The Fund is actively managed but there is no guarantee that the manager’s investment decisions will produce the desired results. The Fund’s prospectus also includes a description of the main investment risks.
| |
Class B: Class C: | These shares have higher annual fees and expenses than Class A shares. Prior to 1/1/04, these shares were offered with an initial sales charge; thus actual total returns would have differed. These shares have higher annual fees and expenses than Class A shares. |
Class R: | Shares are available to certain eligible investors as described in the prospectus. These shares have higher annual fees and expenses than Class A shares. |
Advisor Class: | Shares are available to certain eligible investors as described in the prospectus. |
1. Past expense reductions by the Fund’s manager increased the Fund’s total returns. If the manager had not taken this action, the Fund’s total returns would have been lower.
2. Cumulative total return represents the change in value of an investment over the periods indicated.
3. Average annual total return represents the average annual change in value of an investment over the periods indicated. Six-month return has not been annualized.
4. These figures represent the value of a hypothetical $10,000 investment in the Fund over the periods indicated.
5. In accordance with SEC rules, we provide standardized average annual total return information through the latest calendar quarter.
6. Figures are as stated in the Fund’s prospectus current as of the date of this report. In periods of market volatility, assets may decline significantly, causing total annual Fund operating expenses to become higher than the figures shown.
7. Effective 11/1/05, the Fund began offering Advisor Class shares, which do not have sales charges or a Rule 12b-1 plan. Performance quotations for this class reflect the following methods of calculation: (a) For periods prior to 11/1/05, a restated figure is used based upon the Fund’s Class A performance, excluding the effect of Class A’s maximum initial sales charge, but reflecting the effect of the Class A Rule 12b-1 fees; and (b) for periods after 11/1/05, actual Advisor Class performance is used reflecting all charges and fees applicable to that class. Since 11/1/05 (commencement of sales), the cumulative and average annual total returns of Advisor Class shares were +13.57% and +1.98%.
Semiannual Report | 25
Your Fund’s Expenses
Franklin Large Cap Value Fund
As a Fund shareholder, you can incur two types of costs:
- Transaction costs, including sales charges (loads) on Fund purchases; and
- Ongoing Fund costs, including management fees, distribution and service (12b-1) fees, and other Fund expenses. All mutual funds have ongoing costs, sometimes referred to as operating expenses.
The following table shows ongoing costs of investing in the Fund and can help you understand these costs and compare them with those of other mutual funds. The table assumes a $1,000 investment held for the six months indicated.
Actual Fund Expenses
The first line (Actual) for each share class listed in the table provides actual account values and expenses. The “Ending Account Value” is derived from the Fund’s actual return, which includes the effect of Fund expenses.
You can estimate the expenses you paid during the period by following these steps. Of course, your account value and expenses will differ from those in this illustration:
| 1. | Divide your account value by $1,000. |
| | If an account had an $8,600 value, then $8,600 ÷ $1,000 = 8.6. |
| 2. | Multiply the result by the number under the heading “Expenses Paid During Period.” |
| | If Expenses Paid During Period were $7.50, then 8.6 x $7.50 = $64.50. |
In this illustration, the estimated expenses paid this period are $64.50.
Hypothetical Example for Comparison with Other Funds
Information in the second line (Hypothetical) for each class in the table can help you compare ongoing costs of investing in the Fund with those of other mutual funds. This information may not be used to estimate the actual ending account balance or expenses you paid during the period. The hypothetical “Ending Account Value” is based on the actual expense ratio for each class and an assumed 5% annual rate of return before expenses, which does not represent the Fund’s actual return. The figure under the heading “Expenses Paid During Period” shows the hypothetical expenses your account would have incurred under this scenario. You can compare this figure with the 5% hypothetical examples that appear in shareholder reports of other funds.
26 | Semiannual Report
Your Fund’s Expenses (continued)
Please note that expenses shown in the table are meant to highlight ongoing costs and do not reflect any transaction costs, such as sales charges. Therefore, the second line for each class is useful in comparing ongoing costs only, and will not help you compare total costs of owning different funds. In addition, if transaction costs were included, your total costs would have been higher. Please refer to the Fund prospectus for additional information on operating expenses.
*Expenses are calculated using the most recent six-month expense ratio, annualized for each class (A: 1.40%; B: 2.09%; C: 2.10%; R: 1.60%; and Advisor: 1.10%), multiplied by the average account value over the period, multiplied by 182/366 to reflect the one-half year period.
Semiannual Report | 27

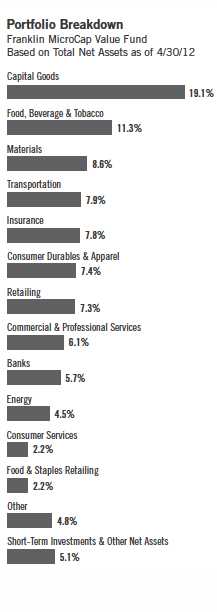
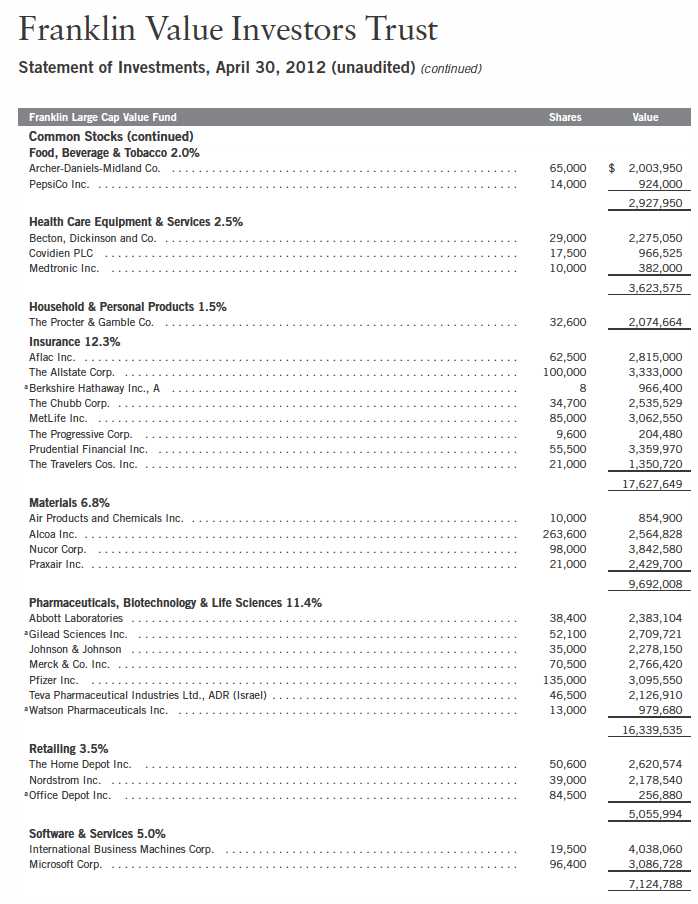
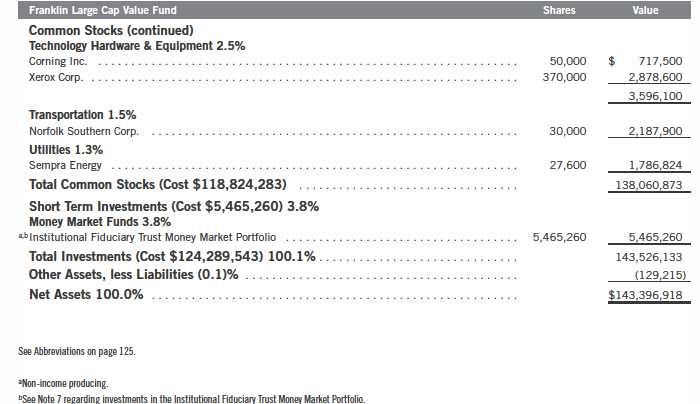
Manager’s Discussion
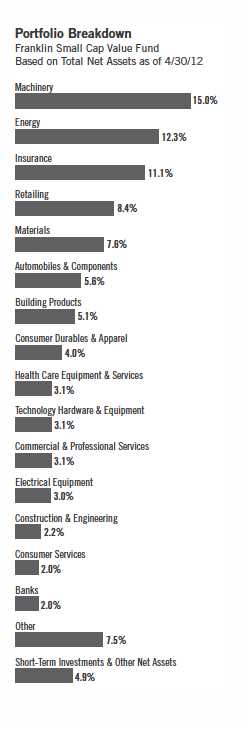
On April 30, 2012, the Fund’s total net assets were $355.9 million, with short-term investments and other net assets making up 5.1%, compared with total net assets of $348.3 million and short-term investments and other net assets of 7.0% on October 31, 2011. The Fund closed to new investors (with the exception of certain retirement accounts) in January 2004. The close does not restrict existing shareholders from adding to or reducing their investment in the Fund, except that once an account is reduced to zero, it may not be reopened unless the Fund reopens.
We identified four new investment opportunities during the period under review: men’s apparel retailer Casual Male Retail Group, furniture and electronic assemblies manufacturer Kimball International, footwear and apparel manufacturer Rocky Brands and savings bank Southern Missouri Bancorp. We also added to existing positions in Brown Shoe, Lydall and Omega Protein, among others. Cash deployed into new and existing positions totaled $6.8 million during the period.
Portfolio sales totaled $14.0 million. We eliminated our positions in Layne Christensen and A.O. Smith Corp. during the reporting period. We also reduced positions in Alamo Group, Intertape Polymer Group and Smithfield Foods, among others.
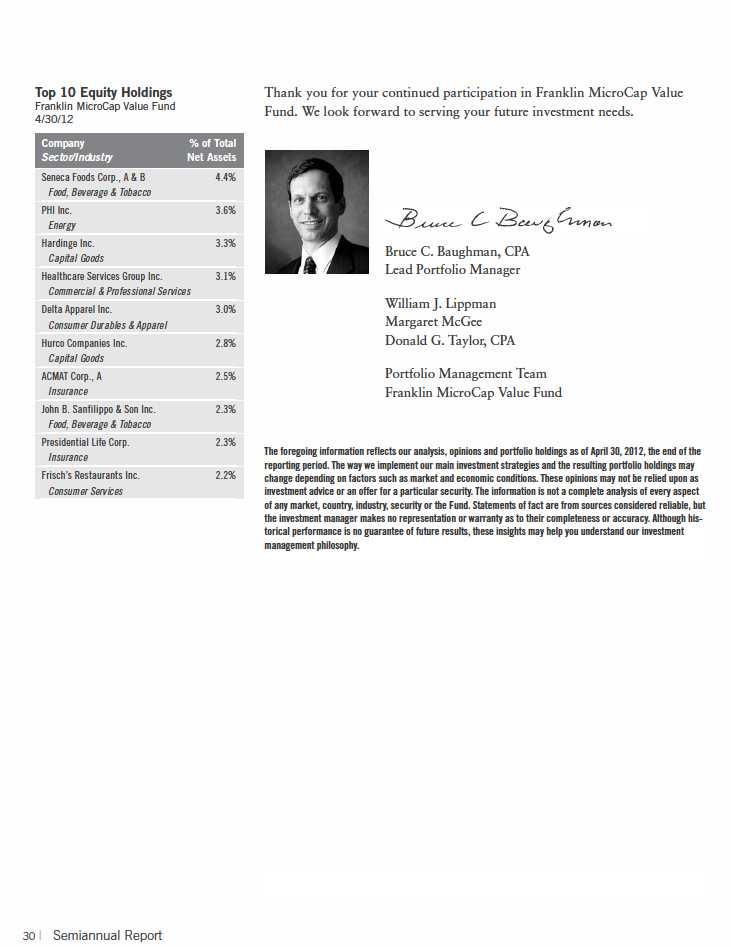
During the six months under review, key contributors to performance included John B. Sanfilippo & Son (tree nuts and snacks), Hardinge (machine tools), Alamo Group (agricultural and maintenance equipment), PHI (energy industry helicopter transportation) and Healthcare Services Group (nursing home housekeeping and food service).
Detractors from performance included Omega Protein Group (fish meal and oil), Delta Apparel (t-shirts), Miller Industries (vehicle towing and recovery equipment), USA Truck (transportation services) and American Pacific (specialty chemicals).
Semiannual Report | 29

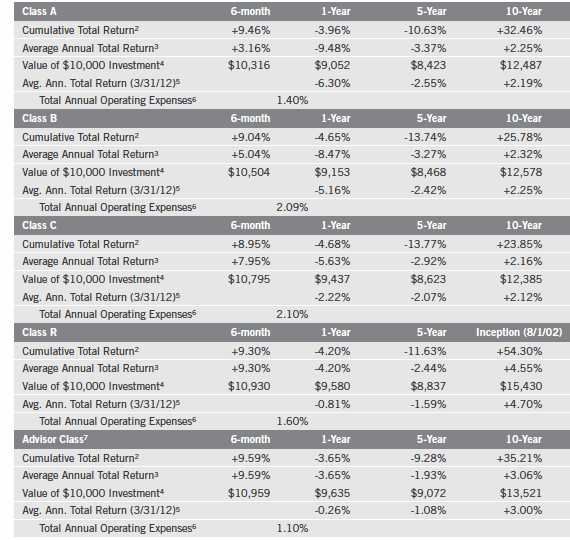
Performance Summary (continued)
Endnotes
All investments involve risks, including possible loss of principal. The Fund’s ability to invest in smaller company securities that may have limited liquidity involves additional risks, such as relatively small revenues, limited product lines and small market share. Historically, these stocks have exhibited greater price volatility than larger company stocks, especially over the short term. In addition, the Fund may invest up to 25% of its total assets in foreign securities, which involve special risks, including currency fluctuations and economic and political uncertainty. The Fund is actively managed but there is no guarantee that the manager’s investment decisions will produce the desired results. The Fund’s prospectus also includes a description of the main investment risks.
Advisor Class: Shares are available to certain eligible investors as described in the prospectus.
1. Cumulative total return represents the change in value of an investment over the periods indicated.
2. Average annual total return represents the average annual change in value of an investment over the periods indicated. Six-month return has not been annualized.
3. These figures represent the value of a hypothetical $10,000 investment in the Fund over the periods indicated.
4. In accordance with SEC rules, we provide standardized average annual total return information through the latest calendar quarter.
5. Figures are as stated in the Fund’s prospectus current as of the date of this report. In periods of market volatility, assets may decline significantly, causing total annual Fund operating expenses to become higher than the figures shown.
6. Effective 11/1/05, the Fund began offering Advisor Class shares, which do not have sales charges or a Rule 12b-1 plan. Performance quotations for this class reflect the following methods of calculation: (a) For periods prior to 11/1/05, a restated figure is used based upon the Fund’s Class A performance, excluding the effect of Class A’s maximum initial sales charge, but reflecting the effect of the Class A Rule 12b-1 fees; and (b) for periods after 11/1/05, actual Advisor Class performance is used reflecting all charges and fees applicable to that class. Since 11/1/05 (commencement of sales), the cumulative and average annual total returns of Advisor Class shares were +43.82% and +5.76%.
32 | Semiannual Report
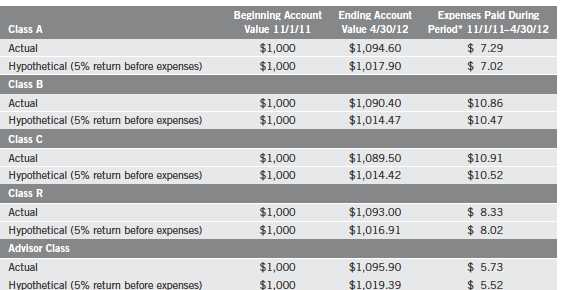
Your Fund’s Expenses
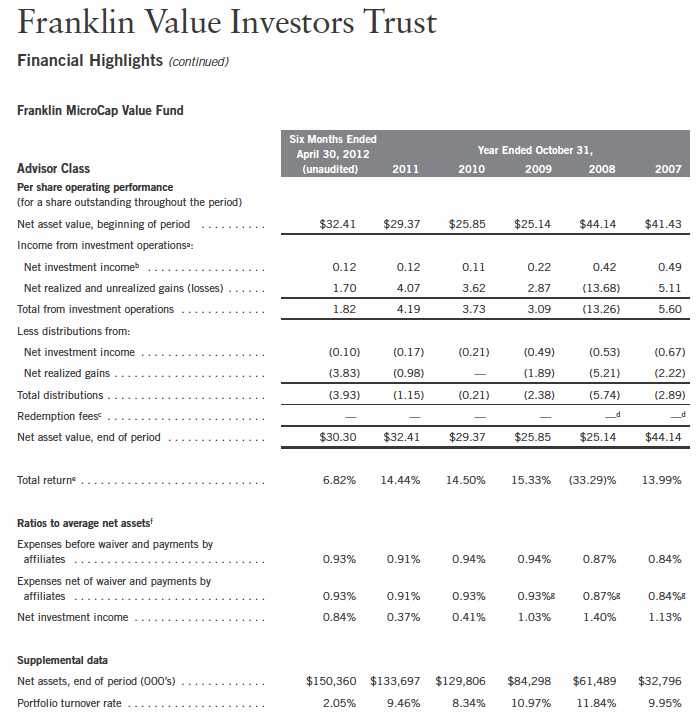
Franklin MicroCap Value Fund
As a Fund shareholder, you can incur two types of costs:
- Transaction costs, including sales charges (loads) on Fund purchases; and
- Ongoing Fund costs, including management fees, distribution and service (12b-1) fees, and other Fund expenses. All mutual funds have ongoing costs, sometimes referred to as operating expenses.
The following table shows ongoing costs of investing in the Fund and can help you understand these costs and compare them with those of other mutual funds. The table assumes a $1,000 investment held for the six months indicated.
Actual Fund Expenses
The first line (Actual) for each share class listed in the table provides actual account values and expenses. The “Ending Account Value” is derived from the Fund’s actual return, which includes the effect of Fund expenses.
You can estimate the expenses you paid during the period by following these steps. Of course, your account value and expenses will differ from those in this illustration:
| 1. | Divide your account value by $1,000. |
| | If an account had an $8,600 value, then $8,600 ÷ $1,000 = 8.6. |
| 2. | Multiply the result by the number under the heading “Expenses Paid During Period.” |
| | If Expenses Paid During Period were $7.50, then 8.6 x $7.50 = $64.50. |
In this illustration, the estimated expenses paid this period are $64.50.
Hypothetical Example for Comparison with Other Funds
Information in the second line (Hypothetical) for each class in the table can help you compare ongoing costs of investing in the Fund with those of other mutual funds. This information may not be used to estimate the actual ending account balance or expenses you paid during the period. The hypothetical “Ending Account Value” is based on the actual expense ratio for each class and an assumed 5% annual rate of return before expenses, which does not represent the Fund’s actual return. The figure under the heading “Expenses Paid During Period” shows the hypothetical expenses your account would have incurred under this scenario. You can compare this figure with the 5% hypothetical examples that appear in shareholder reports of other funds.
Semiannual Report | 33
Your Fund’s Expenses (continued)
Please note that expenses shown in the table are meant to highlight ongoing costs and do not reflect any transaction costs, such as sales charges. Therefore, the second line for each class is useful in comparing ongoing costs only, and will not help you compare total costs of owning different funds. In addition, if transaction costs were included, your total costs would have been higher. Please refer to the Fund prospectus for additional information on operating expenses.
*Expenses are calculated using the most recent six-month expense ratio, annualized for each class (A: 1.17% and Advisor: 0.93%), multiplied by the average account value over the period, multiplied by 182/366 to reflect the one-half year period.
34 | Semiannual Report


36 | Semiannual Report

Performance Summary as of 4/30/12
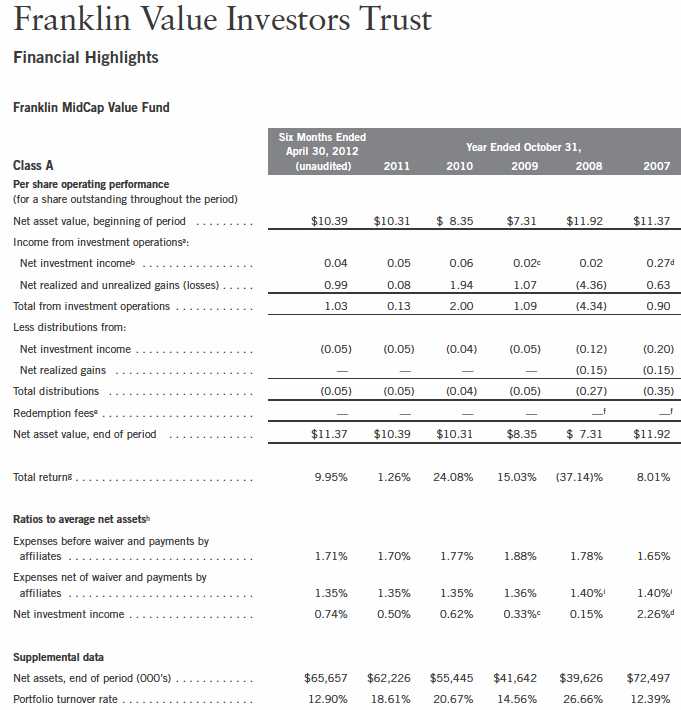
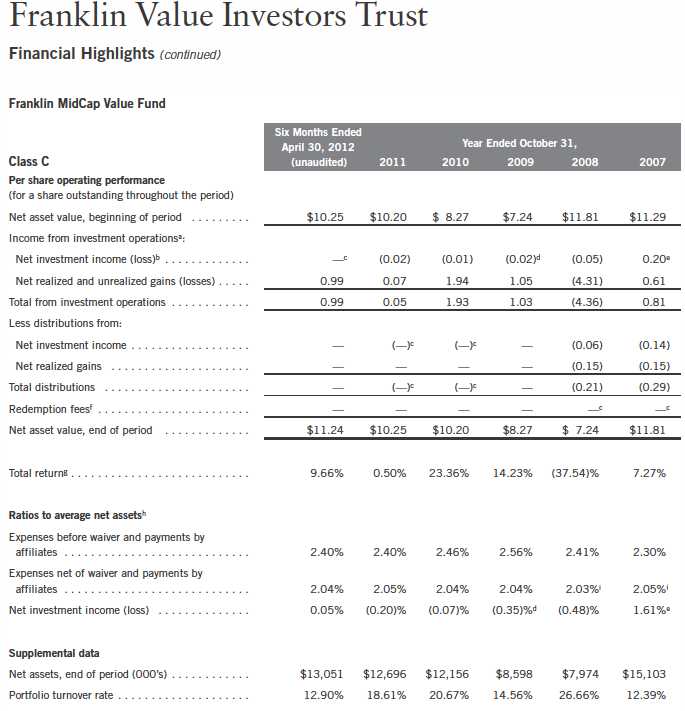
Franklin MidCap Value Fund
Your dividend income will vary depending on dividends or interest paid by securities in the Fund’s portfolio, adjusted for operating expenses of each class. Capital gain distributions are net profits realized from the sale of portfolio securities. The performance table does not reflect any taxes that a shareholder would pay on Fund dividends, capital gain distributions, if any, or any realized gains on the sale of Fund shares. Total return reflects reinvestment of the Fund’s dividends and capital gain distributions, if any, and any unrealized gains or losses.

38 | Semiannual Report
Semiannual Report | 39
Performance Summary (continued)
Endnotes
All investments involve risks, including possible loss of principal. Stock prices fluctuate, sometimes rapidly and dramatically, due to factors affecting individual companies, particular industries or sectors, or general market conditions. Historically, midsize company securities have been more volatile in price than larger company securities, especially over the short term. Midsize companies may be more susceptible to particular economic events or competitive factors than are larger, more broadly diversified companies. In addition, the Fund may invest up to 25% of its total assets in foreign securities, which involve special risks, including currency fluctuations and economic and political uncertainty. The Fund is actively managed but there is no guarantee that the manager’s investment decisions will produce the desired results. The Fund’s prospectus also includes a description of the main investment risks.
| |
Class C: Class R: | These shares have higher annual fees and expenses than Class A shares. Shares are available to certain eligible investors as described in the prospectus. These shares have higher annual fees and expenses than Class A shares. |
Advisor Class: | Shares are available to certain eligible investors as described in the prospectus. |
1. If the manager and administrator had not waived fees, the Fund’s total returns would have been lower. 2. Cumulative total return represents the change in value of an investment over the periods indicated.
3. Average annual total return represents the average annual change in value of an investment over the periods indicated. Six-month return has not been annualized.
4. These figures represent the value of a hypothetical $10,000 investment in the Fund over the periods indicated.
5. In accordance with SEC rules, we provide standardized average annual total return information through the latest calendar quarter.
6. Figures are as stated in the Fund’s prospectus current as of the date of this report. In periods of market volatility, assets may decline significantly, causing total annual Fund operating expenses to become higher than the figures shown.
40 | Semiannual Report
Your Fund’s Expenses
Franklin MidCap Value Fund
As a Fund shareholder, you can incur two types of costs:
- Transaction costs, including sales charges (loads) on Fund purchases; and
- Ongoing Fund costs, including management fees, distribution and service (12b-1) fees, and other Fund expenses. All mutual funds have ongoing costs, sometimes referred to as operating expenses.
The following table shows ongoing costs of investing in the Fund and can help you understand these costs and compare them with those of other mutual funds. The table assumes a $1,000 investment held for the six months indicated.
Actual Fund Expenses
The first line (Actual) for each share class listed in the table provides actual account values and expenses. The “Ending Account Value” is derived from the Fund’s actual return, which includes the effect of Fund expenses.
You can estimate the expenses you paid during the period by following these steps. Of course, your account value and expenses will differ from those in this illustration:
| 1. | Divide your account value by $1,000. |
| | If an account had an $8,600 value, then $8,600 ÷ $1,000 = 8.6. |
| 2. | Multiply the result by the number under the heading “Expenses Paid During Period.” |
| | If Expenses Paid During Period were $7.50, then 8.6 x $7.50 = $64.50. |
In this illustration, the estimated expenses paid this period are $64.50.
Hypothetical Example for Comparison with Other Funds
Information in the second line (Hypothetical) for each class in the table can help you compare ongoing costs of investing in the Fund with those of other mutual funds. This information may not be used to estimate the actual ending account balance or expenses you paid during the period. The hypothetical “Ending Account Value” is based on the actual expense ratio for each class and an assumed 5% annual rate of return before expenses, which does not represent the Fund’s actual return. The figure under the heading “Expenses Paid During Period” shows the hypothetical expenses your account would have incurred under this scenario. You can compare this figure with the 5% hypothetical examples that appear in shareholder reports of other funds.
Semiannual Report | 41
Your Fund’s Expenses (continued)
Please note that expenses shown in the table are meant to highlight ongoing costs and do not reflect any transaction costs, such as sales charges. Therefore, the second line for each class is useful in comparing ongoing costs only, and will not help you compare total costs of owning different funds. In addition, if transaction costs were included, your total costs would have been higher. Please refer to the Fund prospectus for additional information on operating expenses.
*Expenses are calculated using the most recent six-month expense ratio, net of expense waivers, annualized for each class (A: 1.35%; C: 2.04%; R: 1.55%; and Advisor: 1.05%), multiplied by the average account value over the period, multiplied by 182/366 to reflect the one-half year period.
42 | Semiannual Report
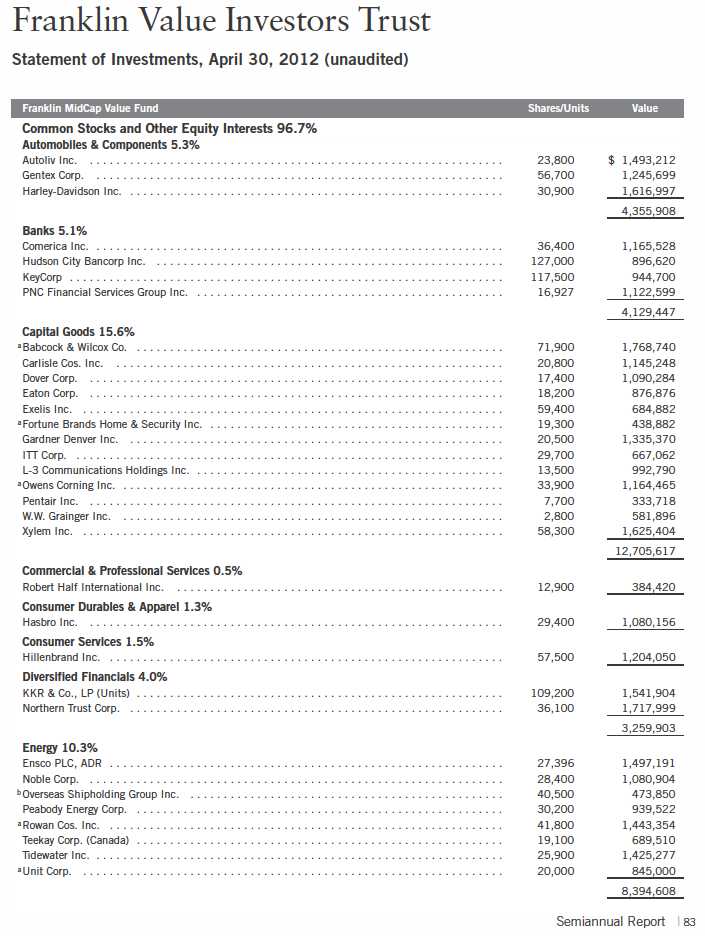
Manager’s Discussion
During the six-month period under review, contributors to performance included several holdings in the consumer discretionary sector such as auto dealership operator Group 1 Automotive and recreational vehicle manufacturer Thor Industries.2 Some industrials sector holdings also boosted results, including lumber products manufacturer Universal Forest Products.3 Other key contributors to Fund performance were insurer Protective Life and steel service centers provider Reliance Steel & Aluminum.
Detractors from performance included industrials sector holdings such as regional airliner SkyWest, ceramics products manufacturer Ceradyne, and aircraft-related aftermarket service provider AAR. Among other detractors were auto components supplier Gentex and oil and gas exploration company Unit Corp.
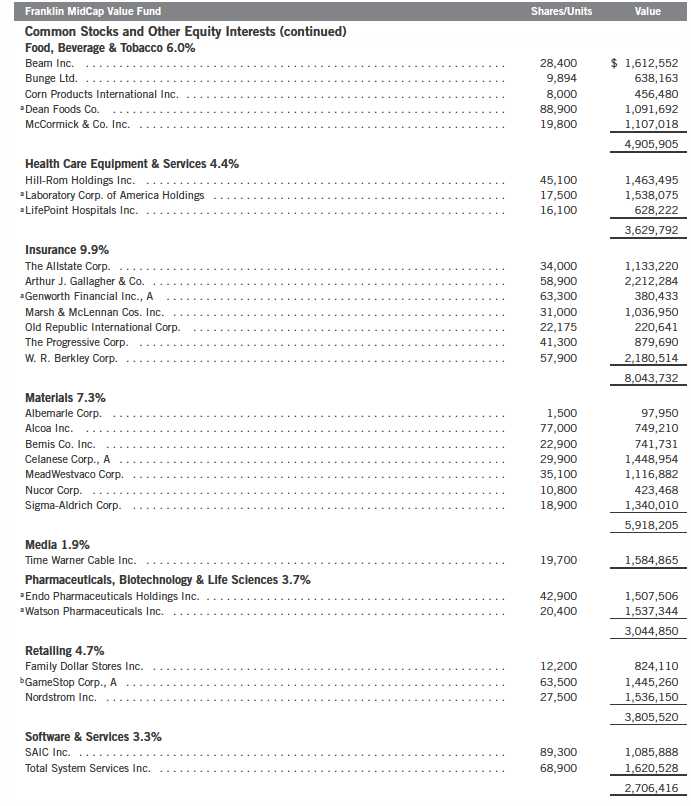
During the reporting period, the Fund initiated a position in branded apparel manufacturer Maidenform Brands. We also added to existing positions in AAR, Hill-Rom Holdings and Kaydon, among others. We liquidated holdings in American National Insurance, Casey’s General Stores, D.R. Horton, J.C. Penney, Mettler-Toledo International, Transatlantic Holdings and Tuesday Morning. We also reduced our holdings in Lancaster Colony, RLI and Roper Industries.
2. The consumer discretionary sector comprises automobiles and components, consumer durables and apparel, consumer services and retailing in the SOI.
3. The industrials sector comprises aerospace and defense, building products, commercial and professional services, construction and engineering, electrical equipment, industrial conglomerates, machinery, trading companies and distributors, and transportation in the SOI.
44 | Semiannual Report
Semiannual Report | 45
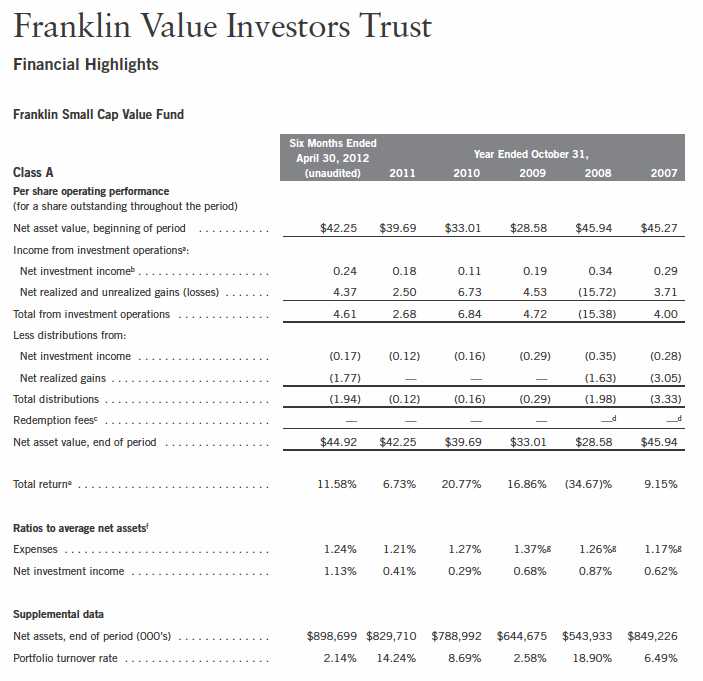
Performance Summary as of 4/30/12
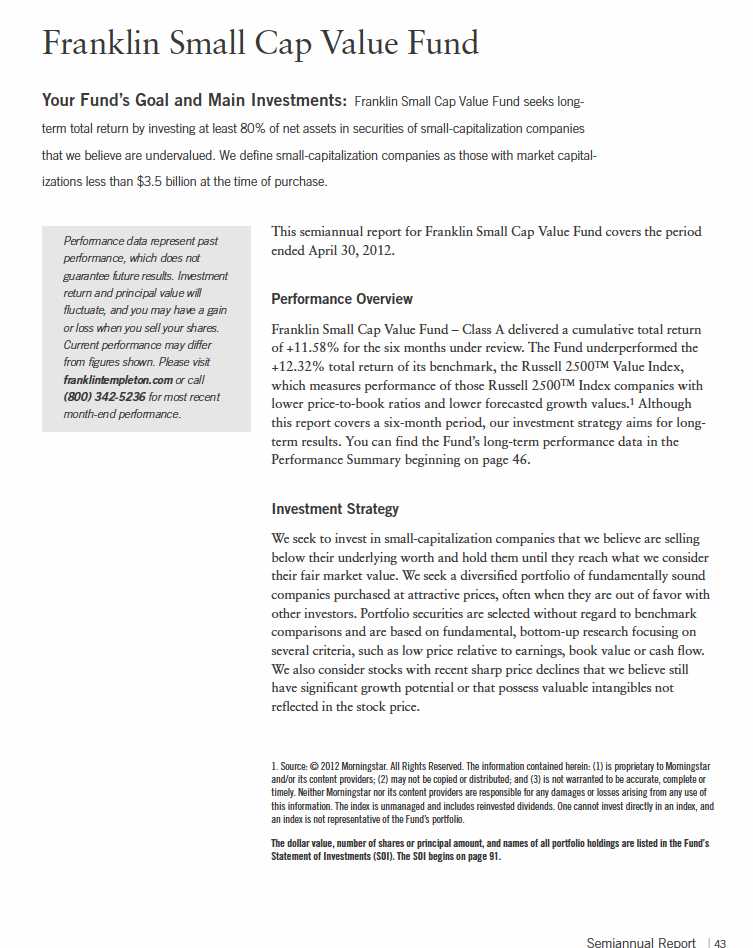
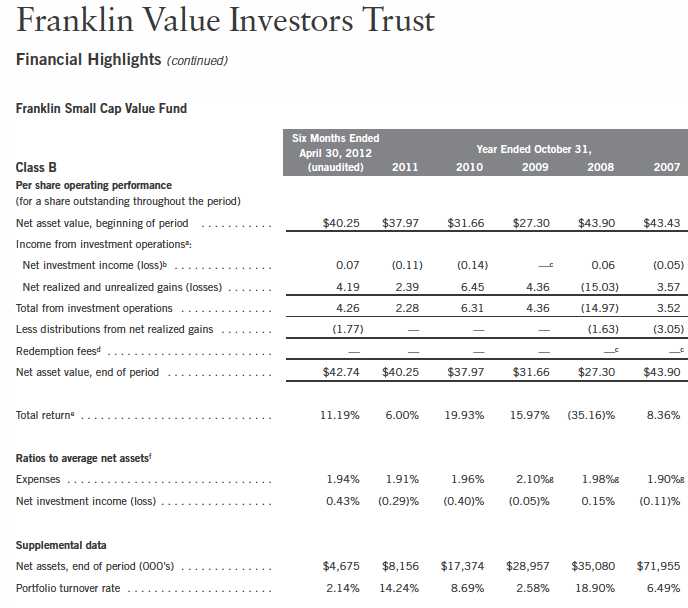
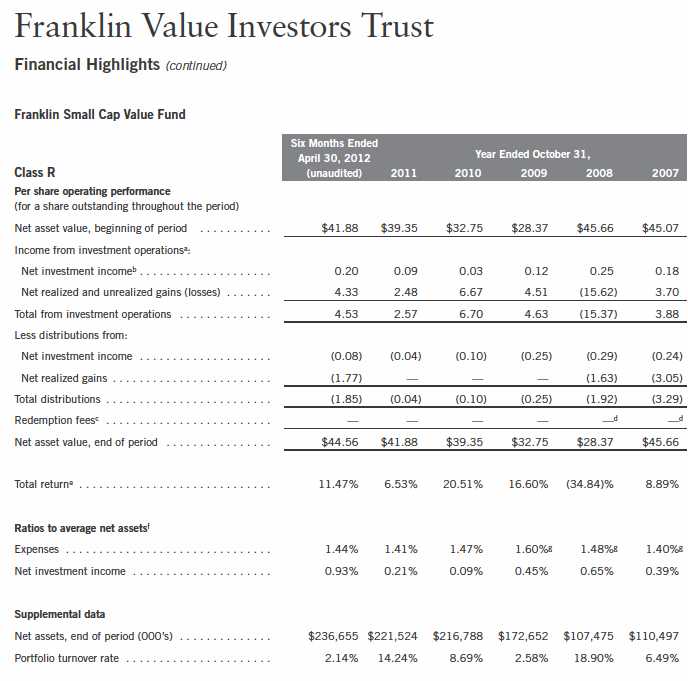
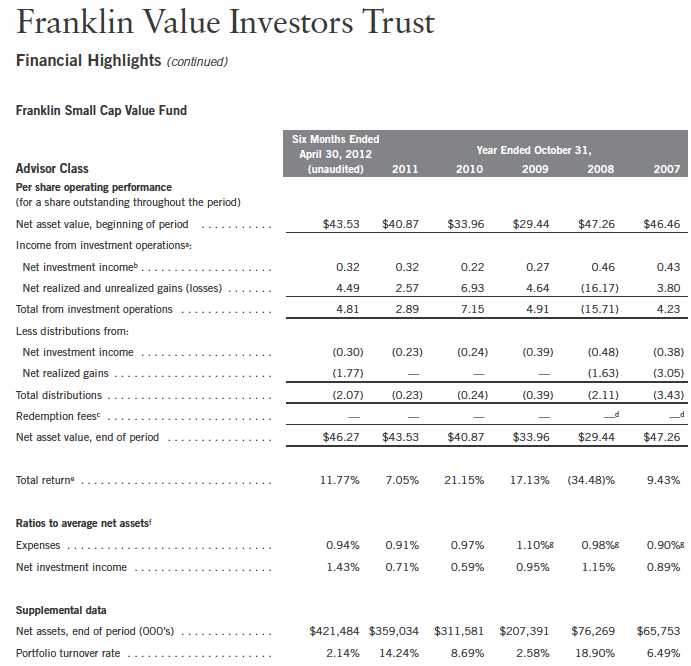
Franklin Small Cap Value Fund
Your dividend income will vary depending on dividends or interest paid by securities in the Fund’s portfolio, adjusted for operating expenses of each class. Capital gain distributions are net profits realized from the sale of portfolio securities. The performance table does not reflect any taxes that a shareholder would pay on Fund dividends, capital gain distributions, if any, or any realized gains on the sale of Fund shares. Total return reflects reinvestment of the Fund’s dividends and capital gain distributions, if any, and any unrealized gains or losses.
46 | Semiannual Report
Performance Summary (continued)
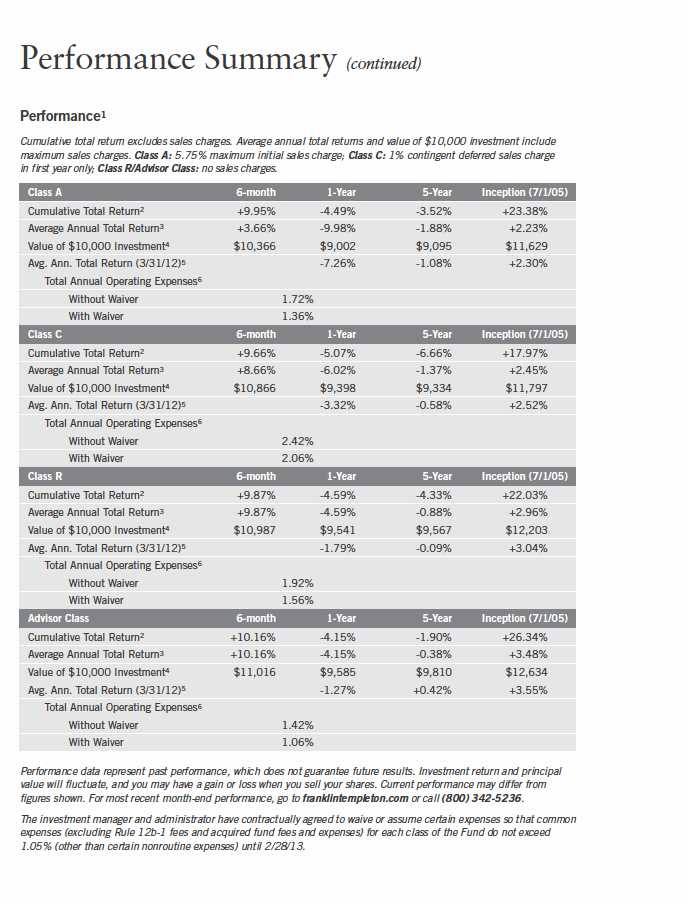
Performance
Cumulative total return excludes sales charges. Average annual total returns and value of $10,000 investment include maximum sales charges. Class A: 5.75% maximum initial sales charge; Class B: contingent deferred sales charge (CDSC) declining from 4% to 1% over six years, and eliminated thereafter; Class C: 1% CDSC in first year only;
Class R/Advisor Class: no sales charges.
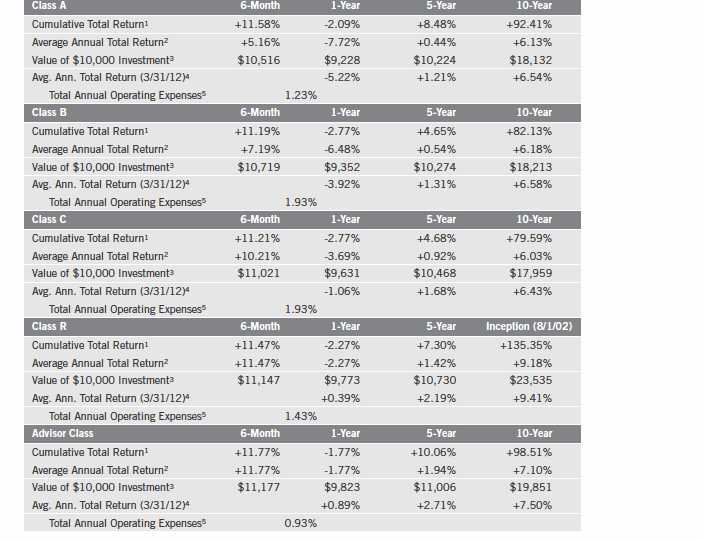
Performance data represent past performance, which does not guarantee future results. Investment return and principal value will fluctuate, and you may have a gain or loss when you sell your shares. Current performance may differ from figures shown. For most recent month-end performance, go to franklintempleton.com or call (800) 342-5236.
Performance Summary (continued)
Endnotes
All investments involve risks, including possible loss of principal. The Fund’s investments in smaller company stocks carry special risks as such stocks have historically exhibited greater price volatility than larger company stocks, particularly over the short term. Additionally, smaller companies often have relatively small revenues, limited product lines and small market share. In addition, the Fund may invest up to 25% of its total assets in foreign securities, which involve special risks, including currency fluctuations and economic and political uncertainty. The Fund is actively managed but there is no guarantee that the manager’s investment decisions will produce the desired results. The Fund’s prospectus also includes a description of the main investment risks.
| |
Class B: Class C: | These shares have higher annual fees and expenses than Class A shares. Prior to 1/1/04, these shares were offered with an initial sales charge; thus actual total returns would have differed. These shares have higher annual fees and expenses than Class A shares. |
Class R: | Shares are available to certain eligible investors as described in the prospectus. These shares have higher annual fees and expenses than Class A shares. |
Advisor Class: | Shares are available to certain eligible investors as described in the prospectus. |
1. Cumulative total return represents the change in value of an investment over the periods indicated.
2. Average annual total return represents the average annual change in value of an investment over the periods indicated. Six-month return has not been annualized.
3. These figures represent the value of a hypothetical $10,000 investment in the Fund over the periods indicated.
4. In accordance with SEC rules, we provide standardized average annual total return information through the latest calendar quarter.
5. Figures are as stated in the Fund’s prospectus current as of the date of this report. In periods of market volatility, assets may decline significantly, causing total annual Fund operating expenses to become higher than the figures shown.
48 | Semiannual Report
Your Fund’s Expenses
Franklin Small Cap Value Fund
As a Fund shareholder, you can incur two types of costs:
- Transaction costs, including sales charges (loads) on Fund purchases; and
- Ongoing Fund costs, including management fees, distribution and service (12b-1) fees, and other Fund expenses. All mutual funds have ongoing costs, sometimes referred to as operating expenses.
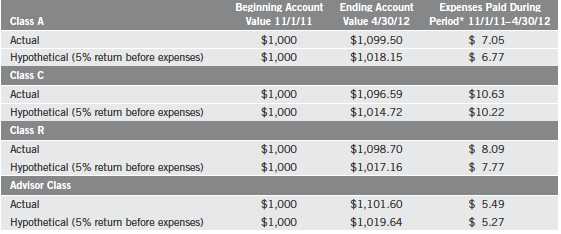
The following table shows ongoing costs of investing in the Fund and can help you understand these costs and compare them with those of other mutual funds. The table assumes a $1,000 investment held for the six months indicated.
Actual Fund Expenses
The first line (Actual) for each share class listed in the table provides actual account values and expenses. The “Ending Account Value” is derived from the Fund’s actual return, which includes the effect of Fund expenses.
You can estimate the expenses you paid during the period by following these steps. Of course, your account value and expenses will differ from those in this illustration:
| 1. | Divide your account value by $1,000. |
| | If an account had an $8,600 value, then $8,600 ÷ $1,000 = 8.6. |
| 2. | Multiply the result by the number under the heading “Expenses Paid During Period.” |
| | If Expenses Paid During Period were $7.50, then 8.6 x $7.50 = $64.50. |
In this illustration, the estimated expenses paid this period are $64.50.
Hypothetical Example for Comparison with Other Funds
Information in the second line (Hypothetical) for each class in the table can help you compare ongoing costs of investing in the Fund with those of other mutual funds. This information may not be used to estimate the actual ending account balance or expenses you paid during the period. The hypothetical “Ending Account Value” is based on the actual expense ratio for each class and an assumed 5% annual rate of return before expenses, which does not represent the Fund’s actual return. The figure under the heading “Expenses Paid During Period” shows the hypothetical expenses your account would have incurred under this scenario. You can compare this figure with the 5% hypothetical examples that appear in shareholder reports of other funds.
Semiannual Report | 49
Your Fund’s Expenses (continued)
Please note that expenses shown in the table are meant to highlight ongoing costs and do not reflect any transaction costs, such as sales charges. Therefore, the second line for each class is useful in comparing ongoing costs only, and will not help you compare total costs of owning different funds. In addition, if transaction costs were included, your total costs would have been higher. Please refer to the Fund prospectus for additional information on operating expenses.
*Expenses are calculated using the most recent six-month expense ratio, annualized for each class (A: 1.24%; B: 1.94%; C: 1.93%; R: 1.44%; and Advisor: 0.94%), multiplied by the average account value over the period, multiplied by 182/366 to reflect the one-half year period.
50 | Semiannual Report
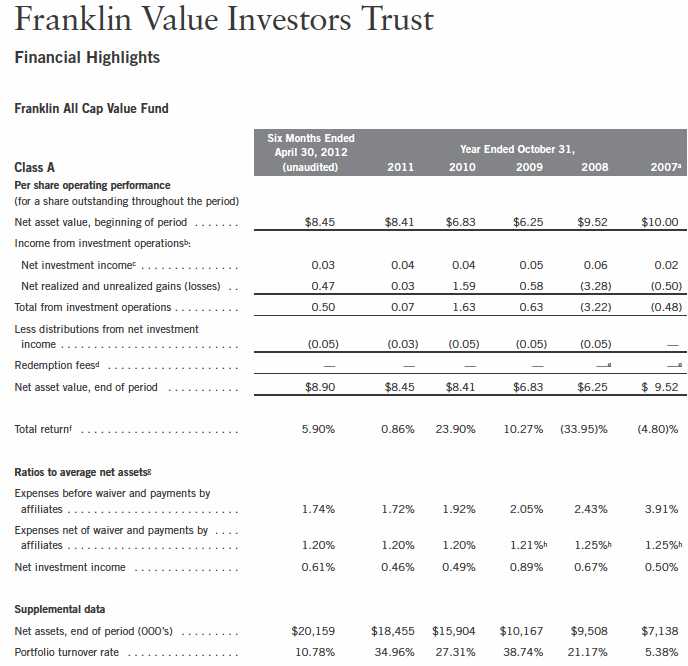
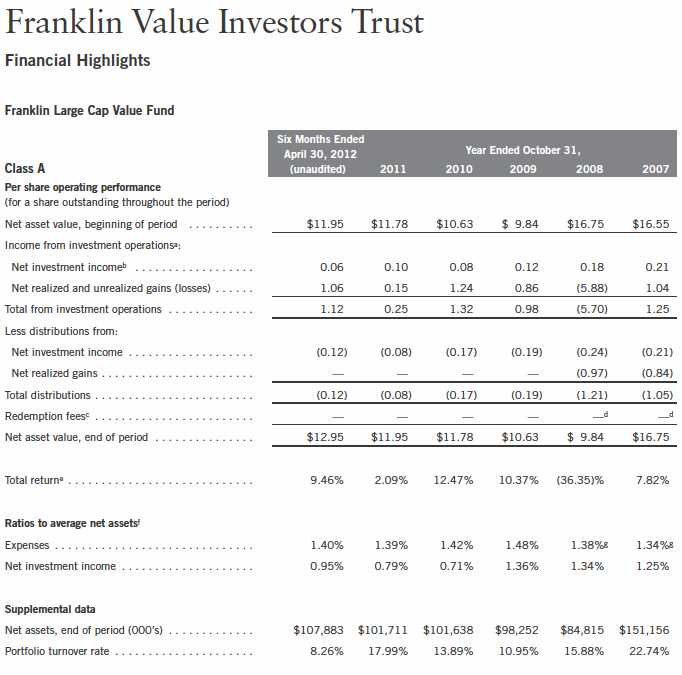
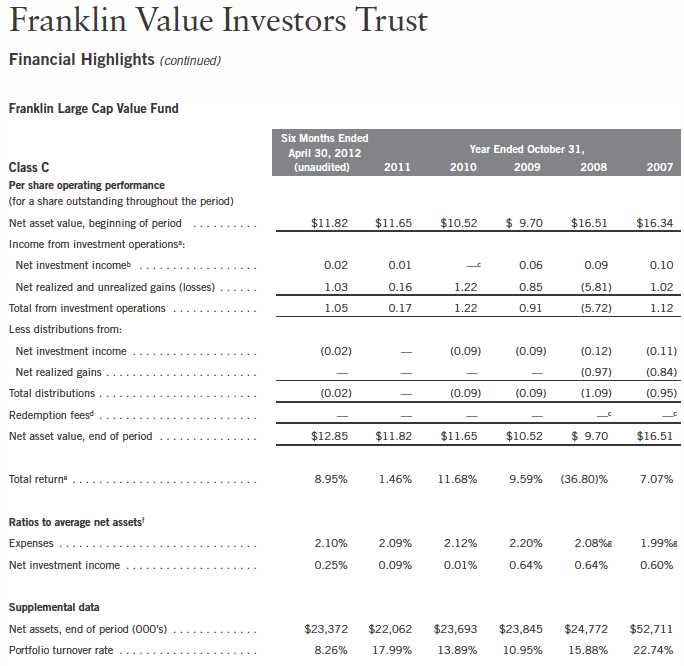
aFor the period June 1, 2007 (commencement of operations) to October 31, 2007.
bThe amount shown for a share outstanding throughout the period may not correlate with the Statement of Operations for the period due to the timing of sales and repurchases of
the Fund shares in relation to income earned and/or fluctuating market value of the investments of the Fund.
cBased on average daily shares outstanding.
dEffective September 1, 2008, the redemption fee was eliminated.
eAmount rounds to less than $0.01 per share.
fTotal return does not reflect sales commissions or contingent deferred sales charges, if applicable, and is not annualized for periods less than one year.
gRatios are annualized for periods less than one year.
hBenefit of expense reduction rounds to less than 0.01%.
Semiannual Report | The accompanying notes are an integral part of these financial statements. | 51

aFor the period June 1, 2007 (commencement of operations) to October 31, 2007.
bThe amount shown for a share outstanding throughout the period may not correlate with the Statement of Operations for the period due to the timing of sales and repurchases of
the Fund shares in relation to income earned and/or fluctuating market value of the investments of the Fund.
cBased on average daily shares outstanding.
dAmount rounds to less than $0.01 per share.
eEffective September 1, 2008, the redemption fee was eliminated.
fTotal return does not reflect sales commissions or contingent deferred sales charges, if applicable, and is not annualized for periods less than one year.
gRatios are annualized for periods less than one year.
hBenefit of expense reduction rounds to less than 0.01%.
52 | The accompanying notes are an integral part of these financial statements. | Semiannual Report

aFor the period June 1, 2007 (commencement of operations) to October 31, 2007.
bThe amount shown for a share outstanding throughout the period may not correlate with the Statement of Operations for the period due to the timing of sales and repurchases of
the Fund shares in relation to income earned and/or fluctuating market value of the investments of the Fund.
cBased on average daily shares outstanding.
dEffective September 1, 2008, the redemption fee was eliminated.
eAmount rounds to less than $0.01 per share.
fTotal return does not reflect sales commissions or contingent deferred sales charges, if applicable, and is not annualized for periods less than one year.
gRatios are annualized for periods less than one year.
hBenefit of expense reduction rounds to less than 0.01%.
Semiannual Report | The accompanying notes are an integral part of these financial statements. | 53

aFor the period June 1, 2007 (commencement of operations) to October 31, 2007.
bThe amount shown for a share outstanding throughout the period may not correlate with the Statement of Operations for the period due to the timing of sales and repurchases of
the Fund shares in relation to income earned and/or fluctuating market value of the investments of the Fund.
cBased on average daily shares outstanding.
dEffective September 1, 2008, the redemption fee was eliminated.
eAmount rounds to less than $0.01 per share.
fTotal return is not annualized for periods less than one year.
gRatios are annualized for periods less than one year.
hBenefit of expense reduction rounds to less than 0.01%.
54 | The accompanying notes are an integral part of these financial statements. | Semiannual Report
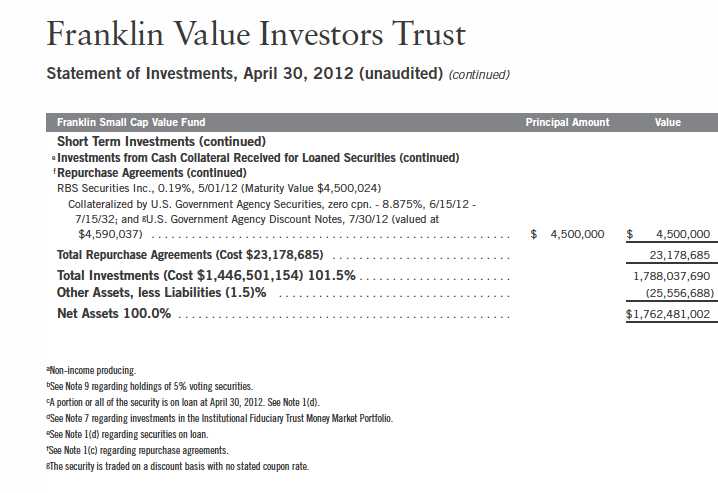
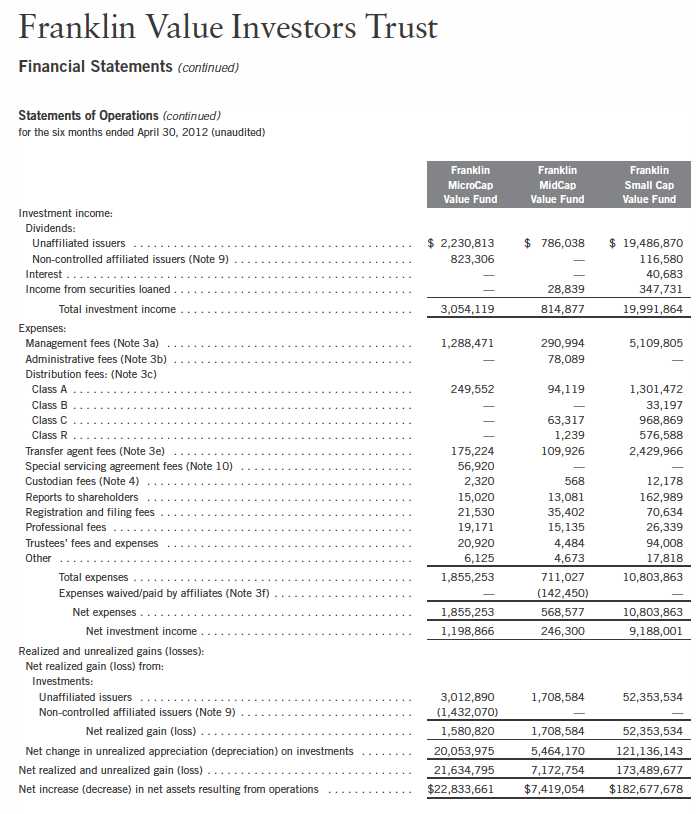
Franklin Value Investors Trust
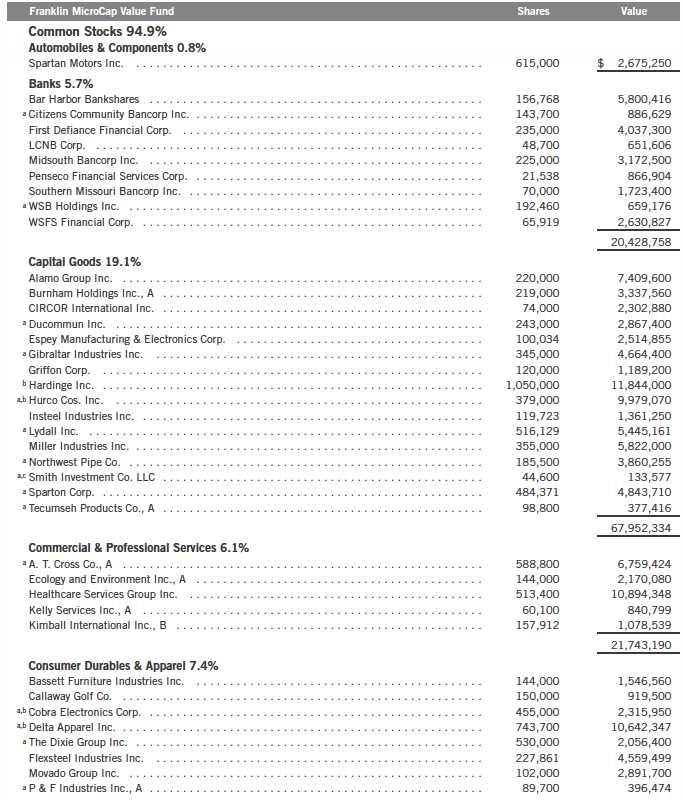
Statement of Investments, April 30, 2012 (unaudited)
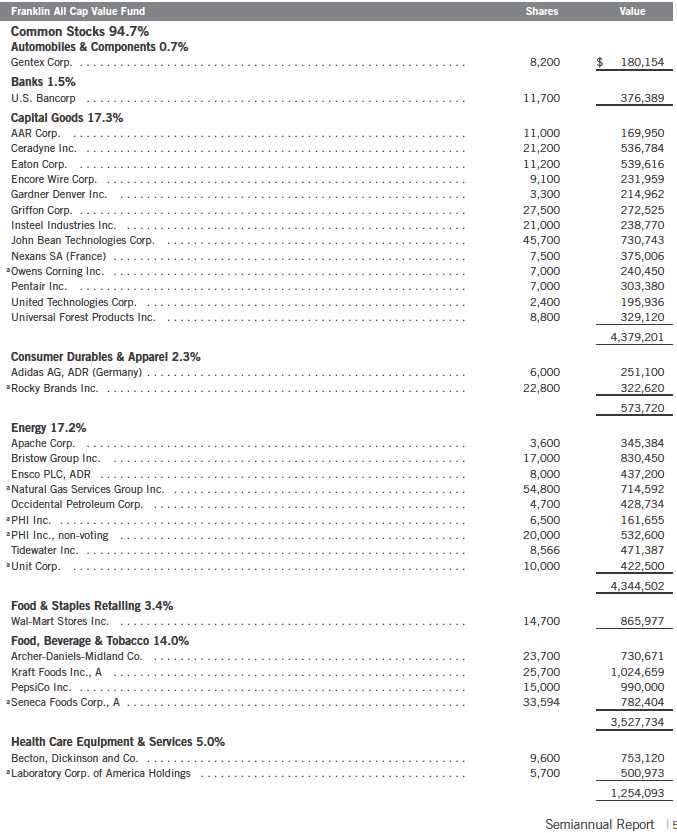
Franklin Value Investors Trust
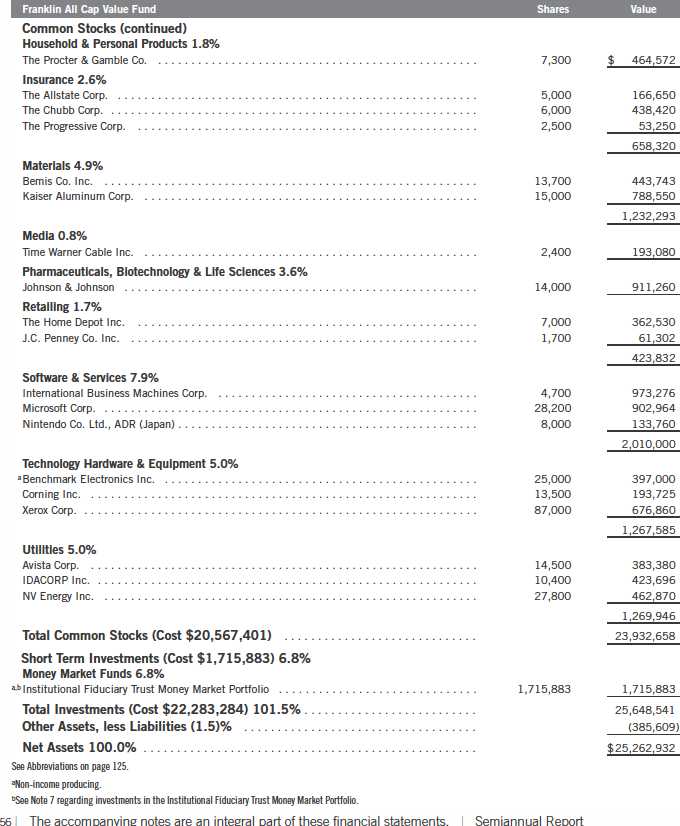
Statement of Investments, April 30, 2012 (unaudited) (continued)
aThe amount shown for a share outstanding throughout the period may not correlate with the Statement of Operations for the period due to the timing of sales and repurchases of
the Fund shares in relation to income earned and/or fluctuating market value of the investments of the Fund.
bBased on average daily shares outstanding.
cEffective September 1, 2008, the redemption fee was eliminated.
dAmount rounds to less than $0.01 per share.
eTotal return does not reflect sales commissions or contingent deferred sales charges, if applicable, and is not annualized for periods less than one year.
fRatios are annualized for periods less than one year.
gBenefit of expense reduction rounds to less than 0.01%.
hExcludes the value of portfolio securities delivered as a result of redemptions in-kind.
Semiannual Report | The accompanying notes are an integral part of these financial statements. | 57
aThe amount shown for a share outstanding throughout the period may not correlate with the Statement of Operations for the period due to the timing of sales and repurchases of
the Fund shares in relation to income earned and/or fluctuating market value of the investments of the Fund.
bBased on average daily shares outstanding.
cEffective September 1, 2008, the redemption fee was eliminated.
dAmount rounds to less than $0.01 per share.
eTotal return does not reflect sales commissions or contingent deferred sales charges, if applicable, and is not annualized for periods less than one year.
fRatios are annualized for periods less than one year.
gBenefit of expense reduction rounds to less than 0.01%.
hExcludes the value of portfolio securities delivered as a result of redemptions in-kind.
58 | The accompanying notes are an integral part of these financial statements. | Semiannual Report

aThe amount shown for a share outstanding throughout the period may not correlate with the Statement of Operations for the period due to the timing of sales and repurchases of
the Fund shares in relation to income earned and/or fluctuating market value of the investments of the Fund.
bBased on average daily shares outstanding.
cEffective September 1, 2008, the redemption fee was eliminated.
dAmount rounds to less than $0.01 per share.
eTotal return does not reflect sales commissions or contingent deferred sales charges, if applicable, and is not annualized for periods less than one year.
fRatios are annualized for periods less than one year.
gBenefit of expense reduction rounds to less than 0.01%.
hExcludes the value of portfolio securities delivered as a result of redemptions in-kind.
Semiannual Report | The accompanying notes are an integral part of these financial statements. | 59
aThe amount shown for a share outstanding throughout the period may not correlate with the Statement of Operations for the period due to the timing of sales and repurchases of
the Fund shares in relation to income earned and/or fluctuating market value of the investments of the Fund.
bBased on average daily shares outstanding.
cEffective September 1, 2008, the redemption fee was eliminated.
dAmount rounds to less than $0.01 per share.
eTotal return does not reflect sales commissions or contingent deferred sales charges, if applicable, and is not annualized for periods less than one year.
fRatios are annualized for periods less than one year.
gBenefit of expense reduction rounds to less than 0.01%.
hExcludes the value of portfolio securities delivered as a result of redemptions in-kind.
60 | The accompanying notes are an integral part of these financial statements. | Semiannual Report
aThe amount shown for a share outstanding throughout the period may not correlate with the Statement of Operations for the period due to the timing of sales and repurchases of
the Fund shares in relation to income earned and/or fluctuating market value of the investments of the Fund.
bBased on average daily shares outstanding.
cEffective September 1, 2008, the redemption fee was eliminated.
dAmount rounds to less than $0.01 per share.
eTotal return is not annualized for periods less than one year.
fRatios are annualized for periods less than one year.
gBenefit of expense reduction rounds to less than 0.01%.
hExcludes the value of portfolio securities delivered as a result of redemptions in-kind.
Semiannual Report | The accompanying notes are an integral part of these financial statements. | 61
Franklin Value Investors Trust
Statement of Investments, April 30, 2012 (unaudited)
62 | Semiannual Report
Franklin Value Investors Trust
Statement of Investments, April 30, 2012 (unaudited) (continued)
Semiannual Report | 63

64 | Semiannual Report
Franklin Value Investors Trust
Statement of Investments, April 30, 2012 (unaudited) (continued)
Franklin Balance Sheet Investment Fund
See Abbreviations on page 125.
aNon-income producing.
bA portion or all of the security is on loan at April 30, 2012. See Note 1(d).
cSee Note 9 regarding holdings of 5% voting securities.
dAt April 30, 2012, pursuant to the Fund’s policies and the requirements of applicable securities law, the Fund may be restricted from trading this security for a limited or extended
period of time due to ownership limits and/or potential possession of material non-public information.
eSecurity was purchased pursuant to Rule 144A under the Securities Act of 1933 and may be sold in transactions exempt from registration only to qualified institutional buyers or in
a public offering registered under the Securities Act of 1933. This security has been deemed liquid under guidelines approved by the Trust’s Board of Trustees. At April 30, 2012, the
value of this security was $33,022,500, representing 2.24% of net assets.
fSee Note 7 regarding investments in the Institutional Fiduciary Trust Money Market Portfolio.
gSee Note 1(d) regarding securities on loan.
hSee Note 1(c) regarding repurchase agreements.
iThe security is traded on a discount basis with no stated coupon rate.
Semiannual Report | The accompanying notes are an integral part of these financial statements. | 65
aThe amount shown for a share outstanding throughout the period may not correlate with the Statement of Operations for the period due to the timing of sales and repurchases of
the Fund shares in relation to income earned and/or fluctuating market value of the investments of the Fund.
bBased on average daily shares outstanding.
cEffective September 1, 2008, the redemption fee was eliminated.
dAmount rounds to less than $0.01 per share.
eTotal return does not reflect sales commissions or contingent deferred sales charges, if applicable, and is not annualized for periods less than one year.
fRatios are annualized for periods less than one year.
gBenefit of expense reduction rounds to less than 0.01%.
66 | The accompanying notes are an integral part of these financial statements. | Semiannual Report

aThe amount shown for a share outstanding throughout the period may not correlate with the Statement of Operations for the period due to the timing of sales and repurchases of
the Fund shares in relation to income earned and/or fluctuating market value of the investments of the Fund.
bBased on average daily shares outstanding.
cEffective September 1, 2008, the redemption fee was eliminated.
dAmount rounds to less than $0.01 per share.
eTotal return does not reflect sales commissions or contingent deferred sales charges, if applicable, and is not annualized for periods less than one year.
fRatios are annualized for periods less than one year.
gBenefit of expense reduction rounds to less than 0.01%.
Semiannual Report | The accompanying notes are an integral part of these financial statements. | 67
aThe amount shown for a share outstanding throughout the period may not correlate with the Statement of Operations for the period due to the timing of sales and repurchases of
the Fund shares in relation to income earned and/or fluctuating market value of the investments of the Fund.
bBased on average daily shares outstanding.
cAmount rounds to less than $0.01 per share.
dEffective September 1, 2008, the redemption fee was eliminated.
eTotal return does not reflect sales commissions or contingent deferred sales charges, if applicable, and is not annualized for periods less than one year.
fRatios are annualized for periods less than one year.
gBenefit of expense reduction rounds to less than 0.01%.
68 | The accompanying notes are an integral part of these financial statements. | Semiannual Report
aThe amount shown for a share outstanding throughout the period may not correlate with the Statement of Operations for the period due to the timing of sales and repurchases of
the Fund shares in relation to income earned and/or fluctuating market value of the investments of the Fund.
bBased on average daily shares outstanding.
cEffective September 1, 2008, the redemption fee was eliminated.
dAmount rounds to less than $0.01 per share.
eTotal return does not reflect sales commissions or contingent deferred sales charges, if applicable, and is not annualized for periods less than one year.
fRatios are annualized for periods less than one year.
gBenefit of expense reduction rounds to less than 0.01%.
Semiannual Report | The accompanying notes are an integral part of these financial statements. | 69
aThe amount shown for a share outstanding throughout the period may not correlate with the Statement of Operations for the period due to the timing of sales and repurchases of
the Fund shares in relation to income earned and/or fluctuating market value of the investments of the Fund.
bBased on average daily shares outstanding.
cEffective September 1, 2008, the redemption fee was eliminated.
dAmount rounds to less than $0.01 per share.
eTotal return is not annualized for periods less than one year.
fRatios are annualized for periods less than one year.
gBenefit of expense reduction rounds to less than 0.01%.
70 | The accompanying notes are an integral part of these financial statements. | Semiannual Report
Franklin Value Investors Trust
Statement of Investments, April 30, 2012 (unaudited)

Semiannual Report | 71
72 | Semiannual Report
Franklin Value Investors Trust
Statement of Investments, April 30, 2012 (unaudited) (continued)
Semiannual Report | The accompanying notes are an integral part of these financial statements. | 73

aThe amount shown for a share outstanding throughout the period may not correlate with the Statement of Operations for the period due to the timing of sales and repurchases of
the Fund shares in relation to income earned and/or fluctuating market value of the investments of the Fund.
bBased on average daily shares outstanding.
cEffective September 1, 2008, the redemption fee was eliminated.
dAmount rounds to less than $0.01 per share.
eTotal return does not reflect sales commissions or contingent deferred sales charges, if applicable, and is not annualized for periods less than one year.
fRatios are annualized for periods less than one year.
gBenefit of expense reduction rounds to less than 0.01%.
74 | The accompanying notes are an integral part of these financial statements. | Semiannual Report
aThe amount shown for a share outstanding throughout the period may not correlate with the Statement of Operations for the period due to the timing of sales and repurchases of
the Fund shares in relation to income earned and/or fluctuating market value of the investments of the Fund.
bBased on average daily shares outstanding.
cEffective September 1, 2008, the redemption fee was eliminated.
dAmount rounds to less than $0.01 per share.
eTotal return is not annualized for periods less than one year.
fRatios are annualized for periods less than one year.
gBenefit of expense reduction rounds to less than 0.01%.
Semiannual Report | The accompanying notes are an integral part of these financial statements. | 75
Franklin Value Investors Trust
Statement of Investments, April 30, 2012 (unaudited)
76 | Semiannual Report
Franklin Value Investors Trust
Statement of Investments, April 30, 2012 (unaudited) (continued)

Semiannual Report | 77
Franklin Value Investors Trust
Statement of Investments, April 30, 2012 (unaudited) (continued)

aNon-income producing.
bSee Note 9 regarding holdings of 5% voting securities.
cSee Note 8 regarding restricted securities.
dAt April 30, 2012, pursuant to the Fund’s policies and the requirements of applicable securities law, the Fund may be restricted from trading this security for a limited or extended
period of time due to ownership limits and/or potential possession of material non-public information.
eSee Note 7 regarding investments in the Institutional Fiduciary Trust Money Market Portfolio.
78 | The accompanying notes are an integral part of these financial statements. | Semiannual Report
aThe amount shown for a share outstanding throughout the period may not correlate with the Statement of Operations for the period due to the timing of sales and repurchases of
the Fund shares in relation to income earned and/or fluctuating market value of the investments of the Fund.
bBased on average daily shares outstanding.
cNet investment income per share includes approximately $(0.06) per share of a return of capital adjustment to a previously recorded special dividend received by the Fund.
Excluding this non-recurring amount, the ratio of net investment income to average net assets would have been 1.16%.
dNet investment income per share includes approximately $0.13 per share received in the form of a special dividend paid in connection with a corporate spin-off. Excluding this
non-recurring amount, the ratio of net investment income to average net assets would have been 1.18%.
eEffective September 1, 2008, the redemption fee was eliminated.
fAmount rounds to less than $0.01 per share.
gTotal return does not reflect sales commissions or contingent deferred sales charges, if applicable, and is not annualized for periods less than one year.
hRatios are annualized for periods less than one year.
iBenefit of expense reduction rounds to less than 0.01%.
Semiannual Report | The accompanying notes are an integral part of these financial statements. | 79
aThe amount shown for a share outstanding throughout the period may not correlate with the Statement of Operations for the period due to the timing of sales and repurchases of
the Fund shares in relation to income earned and/or fluctuating market value of the investments of the Fund.
bBased on average daily shares outstanding.
cAmount rounds to less than $0.01 per share.
dNet investment income per share includes approximately $(0.06) per share of a return of capital adjustment to a previously recorded special dividend received by the Fund.
Excluding this non-recurring amount, the ratio of net investment income to average net assets would have been 0.48%.
eNet investment income per share includes approximately $0.13 per share received in the form of a special dividend paid in connection with a corporate spin-off. Excluding this
non-recurring amount, the ratio of net investment income to average net assets would have been 0.53%.
fEffective September 1, 2008, the redemption fee was eliminated.
gTotal return does not reflect sales commissions or contingent deferred sales charges, if applicable, and is not annualized for periods less than one year.
hRatios are annualized for periods less than one year.
iBenefit of expense reduction rounds to less than 0.01%.
80 | The accompanying notes are an integral part of these financial statements. | Semiannual Report

aThe amount shown for a share outstanding throughout the period may not correlate with the Statement of Operations for the period due to the timing of sales and repurchases of
the Fund shares in relation to income earned and/or fluctuating market value of the investments of the Fund.
bBased on average daily shares outstanding.
cNet investment income per share includes approximately $(0.06) per share of a return of capital adjustment to a previously recorded special dividend received by the Fund.
Excluding this non-recurring amount, the ratio of net investment income to average net assets would have been 0.97%.
dAmount rounds to less than $0.01 per share.
eNet investment income per share includes approximately $0.13 per share received in the form of a special dividend paid in connection with a corporate spin-off. Excluding this
non-recurring amount, the ratio of net investment income to average net assets would have been 1.03%.
fEffective September 1, 2008, the redemption fee was eliminated.
gTotal return does not reflect sales commissions or contingent deferred sales charges, if applicable, and is not annualized for periods less than one year.
hRatios are annualized for periods less than one year.
iBenefit of expense reduction rounds to less than 0.01%.
jRounds to less than 0.01%.
Semiannual Report | The accompanying notes are an integral part of these financial statements. | 81

aThe amount shown for a share outstanding throughout the period may not correlate with the Statement of Operations for the period due to the timing of sales and repurchases of
the Fund shares in relation to income earned and/or fluctuating market value of the investments of the Fund.
bBased on average daily shares outstanding.
cNet investment income per share includes approximately $(0.06) per share of a return of capital adjustment to a previously recorded special dividend received by the Fund.
Excluding this non-recurring amount, the ratio of net investment income to average net assets would have been 1.47%.
dNet investment income per share includes approximately $0.13 per share received in the form of a special dividend paid in connection with a corporate spin-off. Excluding this
non-recurring amount, the ratio of net investment income to average net assets would have been 1.53%.
eEffective September 1, 2008, the redemption fee was eliminated.
fAmount rounds to less than $0.01 per share.
gTotal return is not annualized for periods less than one year.
hRatios are annualized for periods less than one year.
iBenefit of expense reduction rounds to less than 0.01%.
82 | The accompanying notes are an integral part of these financial statements. | Semiannual Report
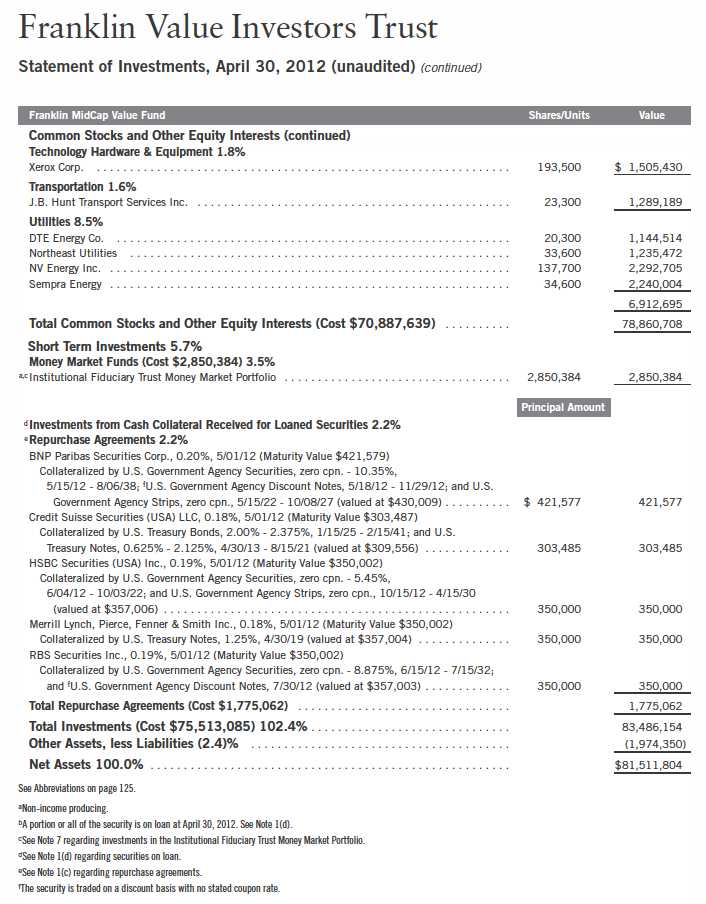
Franklin Value Investors Trust
Statement of Investments, April 30, 2012 (unaudited) (continued)
84 | Semiannual Report
Semiannual Report | The accompanying notes are an integral part of these financial statements. | 85
aThe amount shown for a share outstanding throughout the period may not correlate with the Statement of Operations for the period due to the timing of sales and repurchases of
the Fund shares in relation to income earned and/or fluctuating market value of the investments of the Fund.
bBased on average daily shares outstanding.
cEffective September 1, 2008, the redemption fee was eliminated.
dAmount rounds to less than $0.01 per share.
eTotal return does not reflect sales commissions or contingent deferred sales charges, if applicable, and is not annualized for periods less than one year.
fRatios are annualized for periods less than one year.
gBenefit of expense reduction rounds to less than 0.01%.
86 | The accompanying notes are an integral part of these financial statements. | Semiannual Report
aThe amount shown for a share outstanding throughout the period may not correlate with the Statement of Operations for the period due to the timing of sales and repurchases of
the Fund shares in relation to income earned and/or fluctuating market value of the investments of the Fund.
bBased on average daily shares outstanding.
cAmount rounds to less than $0.01 per share.
dEffective September 1, 2008, the redemption fee was eliminated.
eTotal return does not reflect sales commissions or contingent deferred sales charges, if applicable, and is not annualized for periods less than one year.
fRatios are annualized for periods less than one year.
gBenefit of expense reduction rounds to less than 0.01%.
Semiannual Report | The accompanying notes are an integral part of these financial statements. | 87

aThe amount shown for a share outstanding throughout the period may not correlate with the Statement of Operations for the period due to the timing of sales and repurchases of
the Fund shares in relation to income earned and/or fluctuating market value of the investments of the Fund.
bBased on average daily shares outstanding.
cEffective September 1, 2008, the redemption fee was eliminated.
dAmount rounds to less than $0.01 per share.
eTotal return does not reflect sales commissions or contingent deferred sales charges, if applicable, and is not annualized for periods less than one year.
fRatios are annualized for periods less than one year.
gBenefit of expense reduction rounds to less than 0.01%.
88 | The accompanying notes are an integral part of these financial statements. | Semiannual Report
The amount shown for a share outstanding throughout the period may not correlate with the Statement of Operations for the period due to the timing of sales and repurchases of
the Fund shares in relation to income earned and/or fluctuating market value of the investments of the Fund.
bBased on average daily shares outstanding.
cEffective September 1, 2008, the redemption fee was eliminated.
dAmount rounds to less than $0.01 per share.
eTotal return does not reflect sales commissions or contingent deferred sales charges, if applicable, and is not annualized for periods less than one year.
fRatios are annualized for periods less than one year.
gBenefit of expense reduction rounds to less than 0.01%.
Semiannual Report | The accompanying notes are an integral part of these financial statements. | 89
aThe amount shown for a share outstanding throughout the period may not correlate with the Statement of Operations for the period due to the timing of sales and repurchases of
the Fund shares in relation to income earned and/or fluctuating market value of the investments of the Fund.
bBased on average daily shares outstanding.
cEffective September 1, 2008, the redemption fee was eliminated.
dAmount rounds to less than $0.01 per share.
eTotal return is not annualized for periods less than one year.
fRatios are annualized for periods less than one year.
gBenefit of expense reduction rounds to less than 0.01%.
90 | The accompanying notes are an integral part of these financial statements. | Semiannual Report

Semiannual Report | 91

92 | Semiannual Report
Franklin Value Investors Trust
Statement of Investments, April 30, 2012 (unaudited) (continued)

Semiannual Report | 93
Franklin Value Investors Trust
Statement of Investments, April 30, 2012 (unaudited) (continued)

94 | Semiannual Report
Semiannual Report | The accompanying notes are an integral part of these financial statements. | 95

96 | The accompanying notes are an integral part of these financial statements. | Semiannual Report

Semiannual Report | The accompanying notes are an integral part of these financial statements. | 97

98 | The accompanying notes are an integral part of these financial statements. | Semiannual Report
Franklin Value Investors Trust
Financial Statements (continued)
Statements of Assets and Liabilities (continued)
April 30, 2012 (unaudited)
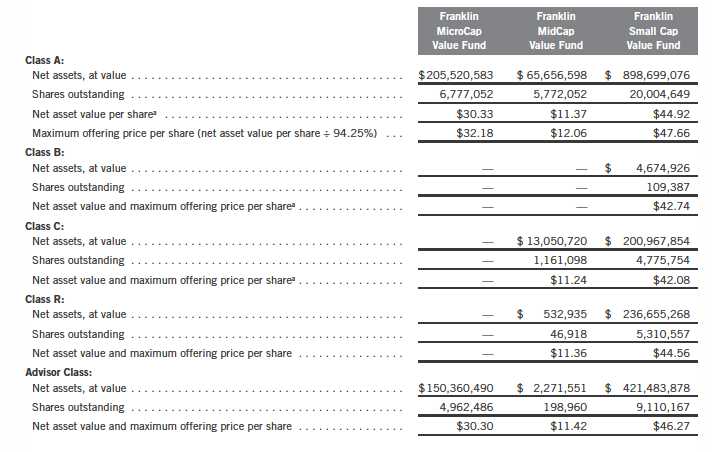
aRedemption price is equal to net asset value less contingent deferred sales charges, if applicable.
Semiannual Report | The accompanying notes are an integral part of these financial statements. | 99

100 | The accompanying notes are an integral part of these financial statements. | Semiannual Report
Semiannual Report | The accompanying notes are an integral part of these financial statements. | 101

102 | The accompanying notes are an integral part of these financial statements. | Semiannual Report

Semiannual Report | The accompanying notes are an integral part of these financial statements. | 103

104 | The accompanying notes are an integral part of these financial statements. | Semiannual Report
Franklin Value Investors Trust
Notes to Financial Statements (unaudited)
1. ORGANIZATION AND SIGNIFICANT ACCOUNTING POLICIES
Franklin Value Investors Trust (Trust) is registered under the Investment Company Act of 1940, as amended, (1940 Act) as an open-end investment company, consisting of six funds (Funds). The classes of shares offered within each of the Funds are indicated below. Each class of shares differs by its initial sales load, contingent deferred sales charges, distribution fees, voting rights on matters affecting a single class and its exchange privilege.
| | |
| | Class A, Class C, | Class A, Class B, Class C, |
| Class A & Advisor Class | Class R & Advisor Class | Class R & Advisor Class |
| Franklin MicroCap Value Fund | Franklin All Cap Value Fund | Franklin Balance Sheet Investment Fund |
| | Franklin MidCap Value Fund | Franklin Large Cap Value Fund |
| | | Franklin Small Cap Value Fund |
The following summarizes the Funds’ significant accounting policies.
a. Financial Instrument Valuation
The Funds’ investments in securities and other financial instruments are carried at fair value daily. Fair value is the price that would be received to sell an asset or paid to transfer a liability in an orderly transaction between market participants on the measurement date. Under procedures approved by the Trust’s Board of Trustees (the Board), the Fund’s administrator, investment manager and other affiliates have formed the Valuation and Liquidity Oversight Committee (VLOC). The VLOC provides administration and oversight of the Funds’ valuation policies and procedures, which are approved annually by the Board. Among other things, these procedures allow the Funds to utilize independent pricing services, quotations from securities and financial instrument dealers, and other market sources to determine fair value.
Equity securities listed on an exchange or on the NASDAQ National Market System are valued at the last quoted sale price or the official closing price of the day, respectively. Foreign equity securities are valued as of the close of trading on the foreign stock exchange on which the security is primarily traded, or the NYSE, whichever is earlier. The value is then converted into its U.S. dollar equivalent at the foreign exchange rate in effect at the close of the NYSE on the day that the value of the security is determined. Over-the-counter securities are valued within the range of the most recent quoted bid and ask prices. Securities that trade in multiple markets or on multiple exchanges are valued according to the broadest and most representative market. Certain equity securities are valued based upon fundamental characteristics or relationships to similar securities. Investments in open-end mutual funds are valued at the closing net asset value.
Debt securities generally trade in the over-the-counter market rather than on a securities exchange. The Funds’ pricing services use multiple valuation techniques to determine fair value. In instances where sufficient market activity exists, the pricing services may utilize a market-based approach through which quotes from market makers are used to determine fair value. In instances where sufficient market activity may not exist or is limited, the pricing services also utilize proprietary valuation models which may consider market characteristics such as benchmark yield curves, credit spreads, estimated default rates, anticipated market interest rate
Semiannual Report | 105
Franklin Value Investors Trust
Notes to Financial Statements (unaudited) (continued)
| 1. | ORGANIZATION AND SIGNIFICANT ACCOUNTING POLICIES (continued) |
| a. | Financial Instrument Valuation (continued) |
volatility, coupon rates, anticipated timing of principal repayments, underlying collateral, and other unique security features in order to estimate the relevant cash flows, which are then discounted to calculate the fair value. Repurchase agreements are valued at cost, which approximates market value.
The Funds have procedures to determine the fair value of securities and other financial instruments for which market prices are not reliable or readily available. Under these procedures, the VLOC convenes on a regular basis to review such securities and considers a number of factors, including significant unobservable valuation inputs, when arriving at fair value. The VLOC primarily employs a market-based approach which may use related or comparable assets or liabilities, recent transactions, market multiples, book values, and other relevant information for the investment to determine the fair value of the investment. An income-based valuation approach may also be used in which the anticipated future cash flows of the investment are discounted to calculate fair value. Discounts may also be applied due to the nature or duration of any restrictions on the disposition of the investments. Due to the inherent uncertainty of valuations of such investments, the fair values may differ significantly from the values that would have been used had an active market existed. The VLOC employs various methods for calibrating these valuation approaches including a regular review of key inputs and assumptions, transactional back-testing or disposition analysis, and reviews of any related market activity.
Trading in securities on foreign securities stock exchanges and over-the-counter markets may be completed before the daily close of business on the NYSE. Occasionally, events occur between the time at which trading in a foreign security is completed and the close of the NYSE that might call into question the reliability of the value of a portfolio security held by the fund. As a result, differences may arise between the value of the Funds’ portfolio securities as determined at the foreign market close and the latest indications of value at the close of the NYSE. In order to minimize the potential for these differences, the VLOC monitors price movements following the close of trading in foreign stock markets through a series of country specific market proxies (such as baskets of American Depositary Receipts, futures contracts and exchange traded funds). These price movements are measured against established trigger thresholds for each specific market proxy to assist in determining if an event has occurred that may call into question the reliability of the values of the foreign securities held by the Funds. If such an event occurs, the securities may be valued using fair value procedures, which may include the use of independent pricing services.
b. Foreign Currency Translation
Portfolio securities and other assets and liabilities denominated in foreign currencies are translated into U.S. dollars based on the exchange rate of such currencies against U.S. dollars on the date of valuation. The Funds may enter into foreign currency exchange contracts to facilitate transactions denominated in a foreign currency. Purchases and sales of securities, income and
106 | Semiannual Report
Franklin Value Investors Trust
Notes to Financial Statements (unaudited) (continued)
| 1. | ORGANIZATION AND SIGNIFICANT ACCOUNTING POLICIES (continued) |
| b. | Foreign Currency Translation (continued) |
expense items denominated in foreign currencies are translated into U.S. dollars at the exchange rate in effect on the transaction date. Portfolio securities and assets and liabilities denominated in foreign currencies contain risks that those currencies will decline in value relative to the U.S. dollar. Occasionally, events may impact the availability or reliability of foreign exchange rates used to convert the U.S. dollar equivalent value. If such an event occurs, the foreign exchange rate will be valued at fair value using procedures established and approved by the Board.
The Funds do not separately report the effect of changes in foreign exchange rates from changes in market prices on securities held. Such changes are included in net realized and unrealized gain or loss from investments on the Statement of Operations.
Realized foreign exchange gains or losses arise from sales of foreign currencies, currency gains or losses realized between the trade and settlement dates on securities transactions and the difference between the recorded amounts of dividends, interest, and foreign withholding taxes and the U.S. dollar equivalent of the amounts actually received or paid. Net unrealized foreign exchange gains and losses arise from changes in foreign exchange rates on foreign denominated assets and liabilities other than investments in securities held at the end of the reporting period.
c. Repurchase Agreements
Certain funds enter into repurchase agreements, which are accounted for as a loan by the fund to the seller, collateralized by securities which are delivered to the fund’s custodian. The market value, including accrued interest, of the initial collateralization is required to be at least 102% of the dollar amount invested by the fund, with the value of the underlying securities marked to market daily to maintain coverage of at least 100%. All repurchase agreements held by the Funds at period end had been entered into on April 30, 2012.
d. Securities Lending
Certain Funds participate in a principal based security lending program. The Fund receives cash collateral against the loaned securities in an amount equal to at least 102% of the market value of the loaned securities. Collateral is maintained over the life of the loan in an amount not less than 100% of the market value of loaned securities, as determined at the close of Fund business each day; any additional collateral required due to changes in security values is delivered to the Fund on the next business day. The collateral is invested in repurchase agreements as indicated on the Statement of Investments. The Fund receives income from the investment of cash collateral, in addition to lending fees and rebates paid by the borrower. The Fund bears the market risk with respect to the collateral investment, securities loaned, and the risk that the principal may default on its obligations to the Fund.
Semiannual Report | 107
Franklin Value Investors Trust
Notes to Financial Statements (unaudited) (continued)
| 1. | ORGANIZATION AND SIGNIFICANT ACCOUNTING POLICIES (continued) |
| e. | Income Taxes |
It is each fund’s policy to qualify as a regulated investment company under the Internal Revenue Code. Each fund intends to distribute to shareholders substantially all of its taxable income and net realized gains to relieve it from federal income and, if applicable, excise taxes. As a result, no provision for U.S. federal income taxes is required.
The Funds may be subject to foreign taxation related to income received, capital gains on the sale of securities and certain foreign currency transactions in the foreign jurisdictions in which it invests. Foreign taxes, if any, are recorded based on the tax regulations and rates that exist in the foreign markets in which the Funds invest. When a capital gain tax is determined to apply the Funds record an estimated deferred tax liability in an amount that would be payable if the securities were disposed of on the valuation date.
Each fund recognizes the tax benefits of uncertain tax positions only when the position is “more likely than not” to be sustained upon examination by the tax authorities based on the technical merits of the tax position. As of April 30, 2012, and for all open tax years, each fund has determined that no liability for unrecognized tax benefits is required in each fund’s financial statements related to uncertain tax positions taken on a tax return (or expected to be taken on future tax returns). Open tax years are those that remain subject to examination and are based on each tax jurisdiction statute of limitation.
f. Security Transactions, Investment Income, Expenses and Distributions
Security transactions are accounted for on trade date. Realized gains and losses on security transactions are determined on a specific identification basis. Interest income and estimated expenses are accrued daily. Dividend income is recorded on the ex-dividend date except that certain dividends from foreign securities are recognized as soon as the Funds are notified of the ex-dividend date. Distributions to shareholders are recorded on the ex-dividend date and are determined according to income tax regulations (tax basis). Distributable earnings determined on a tax basis may differ from earnings recorded in accordance with accounting principles generally accepted in the United States of America. These differences may be permanent or temporary. Permanent differences are reclassified among capital accounts to reflect their tax character. These reclassifications have no impact on net assets or the results of operations. Temporary differences are not reclassified, as they may reverse in subsequent periods.
Common expenses incurred by the Trust are allocated among the Funds based on the ratio of net assets of each fund to the combined net assets of the Trust. Fund specific expenses are charged directly to the fund that incurred the expense.
Realized and unrealized gains and losses and net investment income, not including class specific expenses, are allocated daily to each class of shares based upon the relative proportion of net assets of each class. Differences in per share distributions, by class, are generally due to differences in class specific expenses.
108 | Semiannual Report
Franklin Value Investors Trust
Notes to Financial Statements (unaudited) (continued)
| 1. | ORGANIZATION AND SIGNIFICANT ACCOUNTING POLICIES (continued) |
| f. | Security Transactions, Investment Income, Expenses and Distributions (continued) |
Distributions received by the fund from certain securities may be a return of capital (ROC). Such distributions reduce the cost basis of the securities, and any distributions in excess of the cost basis are recognized as capital gains.
g. Accounting Estimates
The preparation of financial statements in accordance with accounting principles generally accepted in the United States of America requires management to make estimates and assumptions that affect the reported amounts of assets and liabilities at the date of the financial statements and the amounts of income and expenses during the reporting period. Actual results could differ from those estimates.
h. Guarantees and Indemnifications
Under the Trust’s organizational documents, its officers and trustees are indemnified by the Trust against certain liabilities arising out of the performance of their duties to the Trust. Additionally, in the normal course of business, the Trust, on behalf of the Funds, enters into contracts with service providers that contain general indemnification clauses. The Trust’s maximum exposure under these arrangements is unknown as this would involve future claims that may be made against the Trust that have not yet occurred. Currently, the Trust expects the risk of loss to be remote.
2. SHARES OF BENEFICIAL INTEREST
At April 30, 2012, there were an unlimited number of shares authorized ($0.01 par value).
Transactions in the Funds’ shares were as follows:

Franklin Value Investors Trust
Notes to Financial Statements (unaudited) (continued)
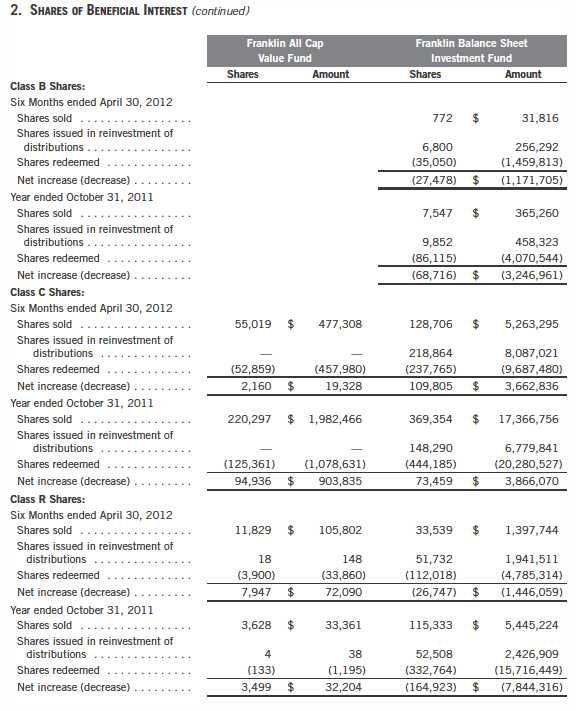
110 | Semiannual Report
Franklin Value Investors Trust
Notes to Financial Statements (unaudited) (continued)
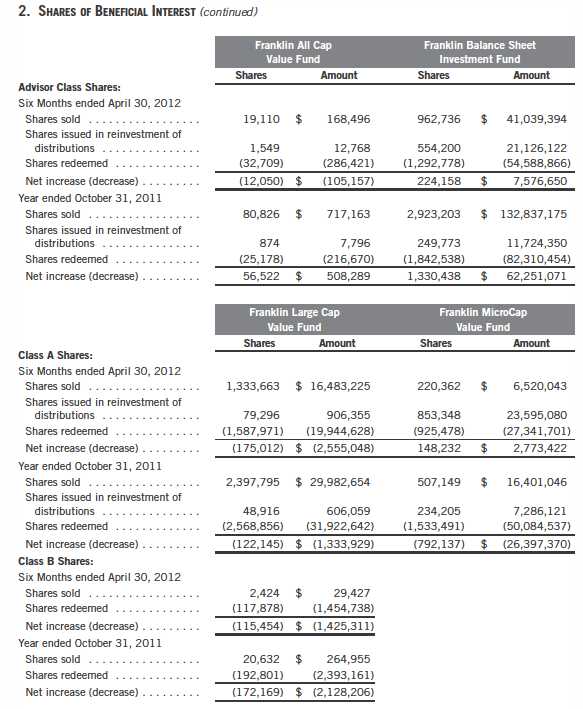
Semiannual Report | 111
Franklin Value Investors Trust
Notes to Financial Statements (unaudited) (continued)

112 | Semiannual Report
Franklin Value Investors Trust
Notes to Financial Statements (unaudited) (continued)
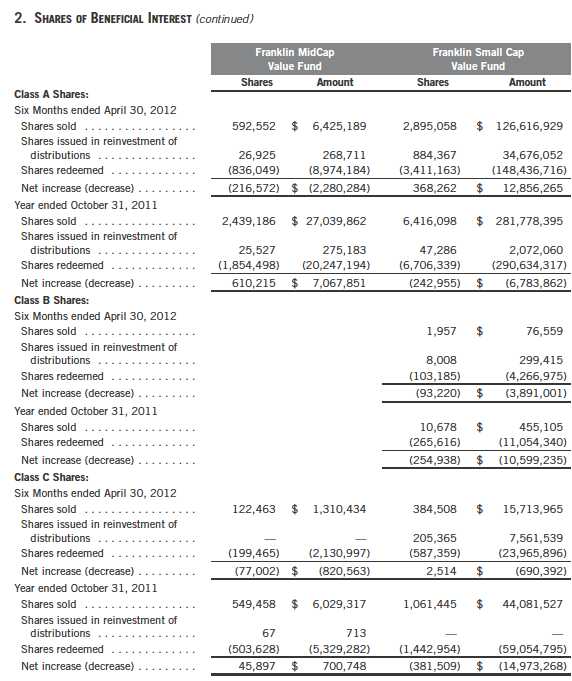
Semiannual Report | 113
Franklin Value Investors Trust
Notes to Financial Statements (unaudited) (continued)

114 | Semiannual Report
Franklin Value Investors Trust
Notes to Financial Statements (unaudited) (continued)
| 3. | TRANSACTIONS WITH AFFILIATES (continued) |
| a. | Management Fees |
The Franklin All Cap Value Fund and the Franklin Large Cap Value Fund each pay an investment management fee to Advisory Services based on their respective average daily net assets as follows:
| | |
| Annualized Fee Rate | | Net Assets |
| 0.550 | % | Up to and including $500 million |
| 0.450 | % | Over $500 million, up to and including $1 billion |
| 0.400 | % | Over $1 billion, up to and including $1.5 billion |
| 0.350 | % | Over $1.5 billion, up to and including $6.5 billion |
| 0.325 | % | Over $6.5 billion, up to and including $11.5 billion |
| 0.300 | % | Over $11.5 billion, up to and including $16.5 billion |
| 0.290 | % | Over $16.5 billion, up to and including $19 billion |
| 0.280 | % | Over $19 billion, up to and including $21.5 billion |
| 0.270 | % | In excess of $21.5 billion |
The Franklin Balance Sheet Investment Fund pays an investment management fee to Advisory Services based on the average daily net assets of the fund as follows:
| | |
| Annualized Fee Rate | | Net Assets |
| 0.625 | % | Up to and including $100 million |
| 0.500 | % | Over $100 million, up to and including $250 million |
| 0.450 | % | Over $250 million, up to and including $7.5 billion |
| 0.440 | % | Over $7.5 billion, up to and including $10 billion |
| 0.430 | % | Over $10 billion, up to and including $12.5 billion |
| 0.420 | % | Over $12.5 billion, up to and including $15 billion |
| 0.400 | % | In excess of $15 billion |
The Franklin MicroCap Value Fund pays an investment management fee to Advisory Services of 0.75% per year of the average daily net assets of the fund.
The Franklin MidCap Value Fund pays an investment management fee to Advisory Services based on the average daily net assets of the fund as follows:
| | |
| Annualized Fee Rate | | Net Assets |
| 0.750 | % | Up to and including $500 million |
| 0.650 | % | Over $500 million, up to and including $1 billion |
| 0.600 | % | Over $1 billion, up to and including $1.5 billion |
| 0.550 | % | Over $1.5 billion, up to and including $6.5 billion |
| 0.525 | % | Over $6.5 billion, up to and including $11.5 billion |
| 0.500 | % | Over $11.5 billion, up to and including $16.5 billion |
| 0.490 | % | Over $16.5 billion, up to and including $19 billion |
| 0.480 | % | Over $19 billion, up to and including $21.5 billion |
| 0.470 | % | In excess of $21.5 billion |
Semiannual Report | 115
Franklin Value Investors Trust
Notes to Financial Statements (unaudited) (continued)
| 3. | TRANSACTIONS WITH AFFILIATES (continued) |
| a. | Management Fees (continued) |
The Franklin Small Cap Value Fund pays an investment management fee to Advisory Services based on the average daily net assets of the fund as follows:
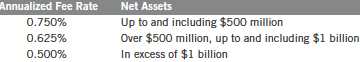
b. Administrative Fees
FT Services provides administrative services to the Funds. The Franklin All Cap Value Fund, the Franklin Large Cap Value Fund and Franklin MidCap Value Fund each pay an administrative fee to FT Services of 0.20% per year of their respective average daily net assets. Under an agreement with Advisory Services, the administrative fee for the Franklin Balance Sheet Investment Fund, the Franklin MicroCap Value Fund and the Franklin Small Cap Value Fund is paid by Advisory Services based on each fund’s average daily net assets, and is not an additional expense of the funds.
c. Distribution Fees
The Board has adopted distribution plans for each share class, with the exception of Advisor Class shares, pursuant to Rule 12b-1 under the 1940 Act. Under the Funds’ Class A reimbursement distribution plans, the Funds reimburse Distributors for costs incurred in connection with the servicing, sale and distribution of each fund’s shares up to the maximum annual plan rate. Under the Class A reimbursement distribution plans, costs exceeding the maximum for the current plan year cannot be reimbursed in subsequent periods.
In addition, under the Funds’ Class B, C and R compensation distribution plans, the Funds pay Distributors for costs incurred in connection with the servicing, sale and distribution of each fund’s shares up to the maximum annual plan rate for each class.
The maximum annual plan rates, based on the average daily net assets, for each class, are as follows:
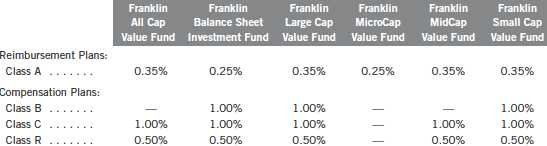
116 | Semiannual Report
Franklin Value Investors Trust
Notes to Financial Statements (unaudited) (continued)
| 3. | TRANSACTIONS WITH AFFILIATES (continued) |
| c. | Distribution Fees (continued) |
The Board has set the current rate at 0.30% per year for Class A shares for the Franklin All Cap Value Fund, the Franklin Large Cap Value Fund, the Franklin MidCap Value Fund, and the Franklin Small Cap Value Fund until further notice and approval by the Board.
d. Sales Charges/Underwriting Agreements
Front-end sales charges and contingent deferred sales charges (CDSC) do not represent expenses of the Funds. These charges are deducted from the proceeds of sales of fund shares prior to investment or from redemption proceeds prior to remittance, as applicable. Distributors has advised the Funds of the following commission transactions related to the sales and redemptions of the Funds’ shares for the period:
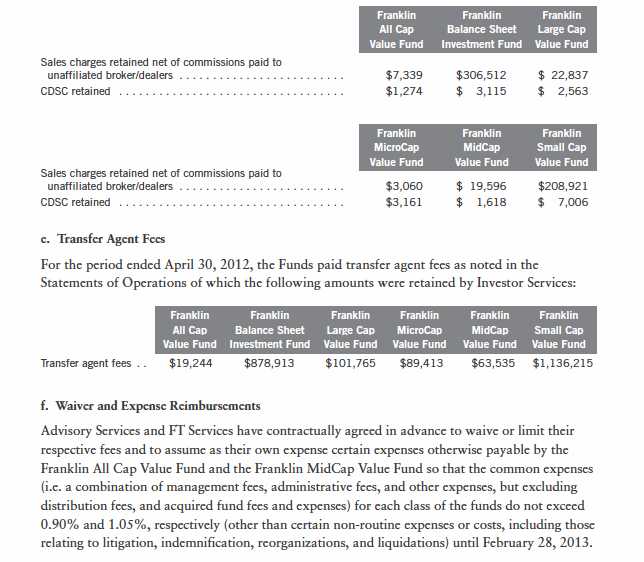
Semiannual Report | 117
Franklin Value Investors Trust
Notes to Financial Statements (unaudited) (continued)
4. EXPENSE OFFSET ARRANGEMENT
The Funds have entered into an arrangement with their custodian whereby credits realized as a result of uninvested cash balances are used to reduce a portion of the Funds’ custodian expenses. During the period ended April 30, 2012, there were no credits earned.
5. INCOME TAXES
For tax purposes, capital losses may be carried over to offset future capital gains, if any. At October 31, 2011, the capital loss carryforwards were as follows:

Franklin Value Investors Trust
Notes to Financial Statements (unaudited) (continued)
5. INCOME TAXES (continued)
Differences between income and/or capital gains as determined on a book basis and a tax basis are primarily due to differing treatments of wash sales.
6. INVESTMENT TRANSACTIONS
Purchases and sales of investments (excluding short term securities) for the period ended April 30, 2012, were as follows:
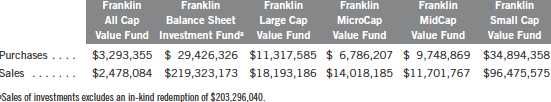
7. INVESTMENTS IN INSTITUTIONAL FIDUCIARY TRUST MONEY MARKET PORTFOLIO
The Funds invest in the Institutional Fiduciary Trust Money Market Portfolio (Sweep Money Fund), an open-end investment company managed by Franklin Advisers, Inc. (an affiliate of the investment manager). Management fees paid by the Funds are reduced on assets invested in the Sweep Money Fund, in an amount not to exceed the management and administrative fees paid by the Sweep Money Fund.
8. RESTRICTED SECURITIES
The Funds invest in securities that are restricted under the Securities Act of 1933 (1933 Act) or which are subject to legal, contractual, or other agreed upon restrictions on resale. Restricted securities are often purchased in private placement transactions, and cannot be sold without prior registration unless the sale is pursuant to an exemption under the 1933 Act. Disposal of these securities may require greater effort and expense, and prompt sale at an acceptable price may be difficult. The Funds may have registration rights for restricted securities. The issuer generally incurs all registration costs.
Semiannual Report | 119
Franklin Value Investors Trust
Notes to Financial Statements (unaudited) (continued)
8. RESTRICTED SECURITIES (continued)
At April 30, 2012, the Franklin MicroCap Value Fund held investments in restricted securities, excluding certain securities exempt from registration under the 1933 Act deemed to be liquid, as follows:

Franklin Value Investors Trust
Notes to Financial Statements (unaudited) (continued)
10. SPECIAL SERVICING AGREEMENT
The Franklin MicroCap Value Fund, which is eligible underlying investment of one or more of the Franklin Templeton Fund Allocator Series Funds (Allocator Funds), participates in a Special Servicing Agreement (SSA) with the Allocator Funds and certain service providers of the fund and the Allocator Funds. Under the SSA, the fund may pay a portion of the Allocator Funds’ expenses (other than any asset allocation, administrative and distribution fees), to the extent such payments are less than the amount of the benefits realized or expected to be realized by the fund (e.g., due to reduced costs associated with servicing accounts) from the investment in the fund by the Allocator Funds. The Allocator Funds are either managed by Franklin Advisers, Inc. or administered by FT Services, affiliates of Advisory Services. For the period ended April 30, 2012, the fund was held by one or more of the Allocator Funds and the amount of expenses borne by the fund is noted in the Statements of Operations. At April 30, 2012, 24.69% of the fund’s outstanding shares was held by one or more of the Allocator Funds.
11. CREDIT FACILITY
The Funds, together with other U.S. registered and foreign investment funds (collectively, Borrowers), managed by Franklin Templeton Investments, are borrowers in a joint syndicated senior unsecured credit facility totaling $1.5 billion (Global Credit Facility) which matures on January 18, 2013. This Global Credit Facility provides a source of funds to the Borrowers for temporary and emergency purposes, including the ability to meet future unanticipated or unusually large redemption requests.
Under the terms of the Global Credit Facility, the Funds shall, in addition to interest charged on any borrowings made by the Funds and other costs incurred by the Funds, pay their share of fees and expenses incurred in connection with the implementation and maintenance of the Global Credit Facility, based upon their relative share of the aggregate net assets of all of the Borrowers, including an annual commitment fee of 0.08% based upon the unused portion of the Global Credit Facility, which is reflected in other expenses on the Statements of Operations. During the period ended April 30, 2012, the Funds did not use the Global Credit Facility.
12. REDEMPTION IN-KIND
During the period ended April 30, 2012, the Franklin Balance Sheet Investment Fund realized $159,737,506 of net gains resulting from a redemption in-kind in which a shareholder redeemed fund shares for securities held by the Fund rather than for cash. Because such gains are not taxable to the Fund, and are not netted with capital gains that are distributed to remaining shareholders, they have been reclassified from accumulated net realized gains to paid-in capital.
Semiannual Report | 121
Franklin Value Investors Trust
Notes to Financial Statements (unaudited) (continued)
13. FAIR VALUE MEASUREMENTS
The Funds follow a fair value hierarchy that distinguishes between market data obtained from independent sources (observable inputs) and the Funds’ own market assumptions (unobservable inputs). These inputs are used in determining the value of the Funds’ investments and are summarized in the following fair value hierarchy:
- Level 1 – quoted prices in active markets for identical securities
- Level 2 – other significant observable inputs (including quoted prices for similar securities, interest rates, prepayment speed, credit risk, etc.)
- Level 3 – significant unobservable inputs (including the Funds’ own assumptions in deter- mining the fair value of investments)
The inputs or methodology used for valuing securities are not an indication of the risk associated with investing in those securities.
For movements between the levels within the fair value hierarchy, the Fund has adopted a policy of recognizing the transfers as of the date of the underlying event which caused the movement.
A summary of inputs used as of April 30, 2012, in valuing the Funds’ assets and liabilities carried at fair value, is as follows:
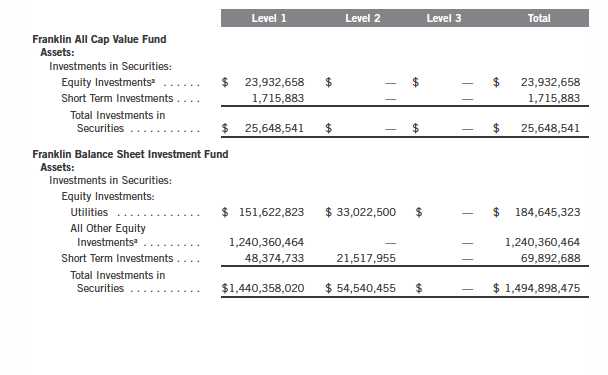
122 | Semiannual Report
Franklin Value Investors Trust
Notes to Financial Statements (unaudited) (continued)
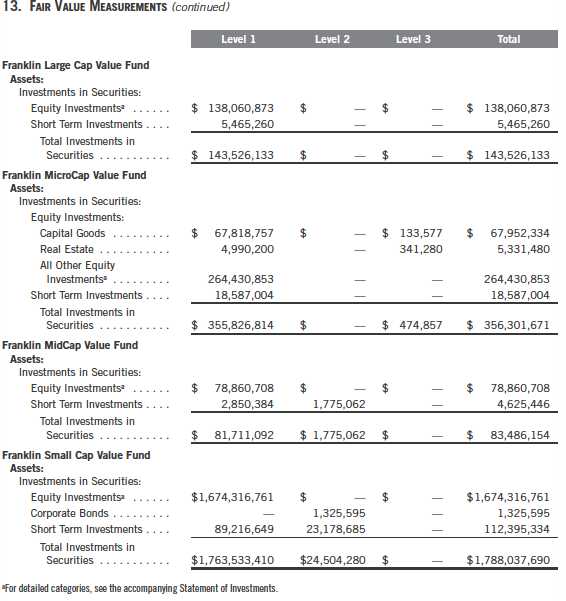
Semiannual Report | 123
Franklin Value Investors Trust
Notes to Financial Statements (unaudited) (continued)
13. FAIR VALUE MEASUREMENTS (continued)
At April 30, 2012, the reconciliation of assets in which significant unobservable inputs (Level 3) were used in determining the Franklin MicroCap Value Fund’s fair value, is as follows:

14. NEW ACCOUNTING PRONOUNCEMENTS
In May 2011, the Financial Accounting Standards Board (FASB) issued Accounting Standards Update (ASU) No. 2011-04, Fair Value Measurement (Topic 820): Amendments to Achieve Common Fair Value Measurement and Disclosure Requirements in U.S. GAAP and IFRSs. The amendments in the ASU will improve the comparability of fair value measurements presented and disclosed in financial statements prepared in accordance with U.S. GAAP (Generally Accepted Accounting Principles) and IFRS (International Financial Reporting Standards) and include new guidance for certain fair value measurement principles and disclosure requirements. The ASU is effective for interim and annual periods beginning after December 15, 2011. The Funds believe the adoption of this ASU will not have a material impact on the financial statements.
In December 2011, FASB issued ASU No. 2011-11, Balance Sheet (Topic 210): Disclosures about Offsetting Assets and Liabilities. The amendments in the ASU enhance disclosures about offsetting of financial assets and liabilities to enable investors to understand the effect of these arrangements on a Fund’s financial position. The ASU is effective for interim and annual reporting periods beginning on or after January 1, 2013. The Funds believe the adoption of this ASU will not have a material impact on the financial statements.
15. SUBSEQUENT EVENTS
The Funds have evaluated subsequent events through the issuance of the financial statements and determined that no events have occurred that require disclosure.
124 | Semiannual Report
Franklin Value Investors Trust
Notes to Financial Statements (unaudited) (continued)
ABBREVIATIONS
Selected Portfolio
ADR - American Depositary Receipt
Semiannual Report | 125
Franklin Value Investors Trust
Shareholder Information
Board Review of Investment Management Agreement
At a meeting held February 28, 2012, the Board of Trustees (Board), including a majority of non-interested or independent Trustees, approved renewal of the investment management agreement for each of the Funds within the Trust (Fund(s)). In reaching this decision, the Board took into account information furnished throughout the year at regular Board meetings, as well as information prepared specifically in connection with the annual renewal review process. Information furnished and discussed throughout the year included investment performance reports and related financial information for each Fund, as well as periodic reports on expenses, shareholder services, legal and compliance matters, risk control, pricing, brokerage commissions and execution and other services provided by the Investment Manager (Manager) and its affiliates. Information furnished specifically in connection with the renewal process included a report for each Fund prepared by Lipper, Inc. (Lipper), an independent organization, as well as additional material, including a Fund profitability analysis prepared by management. The Lipper reports compared each Fund’s investment performance and expenses with those of other mutual funds deemed comparable to the Fund as selected by Lipper. The Fund profitability analysis discussed the profitability to Franklin Templeton Investments from its overall U.S. fund operations, as well as on an individual fund-by-fund basis. Additional material accompanying such profitability analysis including information on a fund-by-fund basis listing portfolio managers and other accounts they manage, as well as information on management fees charged by the Manager and its affiliates to U.S. mutual funds and other accounts, including management’s explanation of differences where relevant. Such material also included a memorandum prepared by management describing project initiatives and capital investments relating to the services provided to the Funds by the Franklin Templeton Investments organization, as well as a memorandum relating to economies of scale and an analysis concerning transfer agent fees charged by an affiliate of the Manager.
In considering such materials, the independent Trustees received assistance and advice from and met separately with independent counsel. While the investment management agreements for all Funds were considered at the same Board meeting, the Board dealt with each Fund separately. In approving continuance of the investment management agreement for each Fund, the Board, including a majority of independent Trustees, determined that the existing management fee structure was fair and reasonable and that continuance of the investment management agreement was in the best interests of each Fund and its shareholders. While attention was given to all information furnished, the following discusses some primary factors relevant to the Board’s decision.
NATURE, EXTENT AND QUALITY OF SERVICES. The Board was satisfied with the nature and quality of the overall services provided by the Manager and its affiliates to the Funds and their shareholders. In addition to investment performance and expenses discussed later, the Board’s opinion was based, in part, upon periodic reports furnished it showing that the investment policies and restrictions for each Fund were consistently complied with as well as other reports periodically furnished the Board covering matters such as the compliance of portfolio managers and other management personnel with the code of ethics adopted throughout the Franklin Templeton fund complex, the adherence to fair value pricing procedures established by the Board, and the accuracy
126 | Semiannual Report
Franklin Value Investors Trust
Shareholder Information (continued)
Board Review of Investment Management Agreement (continued)
of net asset value calculations. The Board also noted the extent of benefits provided Fund shareholders from being part of the Franklin Templeton family of funds, including the right to exchange investments between the same class of funds without a sales charge, the ability to reinvest Fund dividends into other funds and the right to combine holdings in other funds to obtain a reduced sales charge. Favorable consideration was given to management’s continuous efforts and expenditures in establishing back-up systems and recovery procedures to function in the event of a natural disaster, it being noted that such systems and procedures had functioned smoothly during the Florida hurricanes and blackouts experienced in previous years. Among other factors taken into account by the Board were the Manager’s best execution trading policies, including a favorable report on the efficiency of its trading operations by an independent portfolio trading analytical firm, which also covered foreign exchange transactions. Consideration was also given to the experience of each Fund’s portfolio management team, the number of accounts managed and general method of compensation. In this latter respect, the Board noted that a primary factor in management’s determination of a portfolio manager’s bonus compensation was the relative investment performance of the funds he or she managed and that a portion of such bonus was required to be invested in a predesignated list of funds within such person’s fund management area so as to be aligned with the interests of shareholders. In this respect, the Board after making inquiries of management, received assurances that bonus composition was not unduly influenced by one-year or short-term performance but was based primarily on longer periods consistent with the interests of long-term shareholders. The Board also took into account the quality of transfer agent and shareholder services provided Fund shareholders by an affiliate of the Manager and the continuous enhancements to the Franklin Templeton website. Particular attention was given to management’s conservative approach and diligent risk management procedures, including expanded collateralization requirements. It was noted that the Funds did not currently invest in derivatives or other complex instruments. The Board also took into account, among other things, management’s efforts in establishing a global credit facility for the benefit of the Funds and other accounts managed by Franklin Templeton Investments to provide a source of cash for temporary and emergency purposes or to meet unusual redemption requests as well as the strong financial position of the Manager’s parent company and its commitment to the mutual fund business as evidenced by its subsidization of money market funds.
INVESTMENT PERFORMANCE. The Board placed significant emphasis on the investment performance of each Fund in view of its importance to shareholders. While consideration was given to performance reports and discussions with the portfolio management team at Board meetings throughout the year, particular attention in assessing performance was given to the Lipper reports furnished for the agreement renewals. The Lipper reports prepared for each individual Fund showed the investment performance of its Class A shares in comparison to a performance universe selected by Lipper. Comparative performance for each Fund was shown for 2011 and for the previous 10 years ended December 31, 2011, for those Funds which had been in existence for such length of time, and for lesser periods for other Funds depending on when their operations commenced. The following summarizes the performance results for each of the Funds.
Semiannual Report | 127
Franklin Value Investors Trust
Shareholder Information (continued)
Board Review of Investment Management Agreement (continued)
Franklin All Cap Value Fund – The performance universe for this Fund consisted of the Fund and all retail and institutional multi-cap value funds. The Lipper report showed the performance of the Fund to be in the second-lowest performing quintile of such universe during 2011, but on an annualized basis to be in the second-highest performing quintile of such universe for its four years of operation. The Board discussed with management the reasons for its 2011 underperformance but believed the Fund’s overall performance during its limited period of operations was acceptable.
Franklin Balance Sheet Investment Fund – The performance universe for this Fund consisted of the Fund and all retail and institutional mid-cap value funds as selected by Lipper. The Lipper report showed the Fund’s total return during 2011 to be in the second-lowest quintile of such performance universe, and on an annualized basis to be in the lowest quintile of such universe for the previous three- and five-year periods, and in the second-lowest quintile of such universe for the previous 10-year period. In discussing such performance, management pointed out that the Fund’s performance reflected its disciplined approach of investing in companies with strong balance sheets and having low price-to-book ratios, which investments were generally out of favor during recent market conditions. The Board was advised by management that the Fund’s investment performance reflected adherence to the criteria of its investment strategy described in the prospectus. While continuing to carefully monitor and evaluate future performance, the Board believed the Fund’s performance did not warrant any change in portfolio management or the basic strategy employed.
Franklin Large Cap Value Fund – The performance universe for this Fund consisted of the Fund and all retail and institutional large-cap value funds as selected by Lipper. The Lipper report comparison showed the Fund’s total return during 2011 to be in the lowest quintile of such universe, and on an annualized basis to be in the second-lowest quintile of such universe for each of the previous three- and five-year periods, and the lowest quintile of such universe during the previous 10-year period. The Board was not satisfied with such performance but believed that management was taking appropriate steps to improve it, noting a change in the lead portfolio manager in 2008 and the hiring of an additional analyst during the past two years.
Franklin MicroCap Value Fund – The performance universe for this Fund consisted of the Fund and all retail and institutional small-cap value funds as selected by Lipper. The Lipper report comparison showed the Fund’s total return during 2011 to be in the highest performing quintile of such performance universe, and on an annualized basis in the middle quintile of such universe for the previous three-year period and in the second-highest and highest quintiles of such performance universe during the previous five- and 10-year periods, respectively. The Board was satisfied with the Fund’s comparative performance as shown in the Lipper report.
Franklin MidCap Value Fund – The performance universe for this Fund consisted of the Fund and all retail and institutional mid-cap value funds as selected by Lipper. The Lipper report showed the Fund’s total return for 2011 to be in the second-lowest quintile of such universe, and on an annualized basis in the lowest and second-lowest quintiles of such universe for the previous three- and five-year periods, respectively. The Board was not satisfied with such performance but did not
128 | Semiannual Report
Franklin Value Investors Trust
Shareholder Information (continued)
Board Review of Investment Management Agreement (continued)
believe any immediate change in portfolio management or investment strategy was warranted. In this respect, while intending to closely monitor future performance, the Board noted the Fund’s limited period of operation and the fact that, as shown in the Lipper report during two of its six years of operations, its total return was in the second-highest quintile of its performance universe and in one of such six years was in the middle quintile of such universe.
Franklin Small Cap Value Fund – The performance universe for this Fund consisted of the Fund and all retail and institutional small-cap value funds as selected by Lipper. The Lipper report comparison showed that the Fund’s total return for 2011 placed it in the second-highest quintile of such performance universe and that its total return on an annualized basis was also in the second-highest quintile of such universe for each of the previous three- and five-year periods and in the middle quintile of such universe for the previous 10-year period. The Board was satisfied with the Fund’s comparative performance as shown in the Lipper report.
COMPARATIVE EXPENSES. Consideration was given to a comparative analysis of the management fees and total expense ratios of each Fund compared with those of a group of other funds selected by Lipper as constituting its appropriate Lipper expense group. Lipper expense data is based upon information taken from each fund’s most recent annual report, which reflects historical asset levels that may be quite different from those currently existing, particularly in a period of market volatility. While recognizing such inherent limitation and the fact that expense ratios generally increase as assets decline and decrease as assets grow, the Board believed the independent analysis conducted by Lipper to be an appropriate measure of comparative expenses. In reviewing comparative costs, Lipper provides information on each Fund’s contractual investment management fee in comparison with the contractual investment management fee that would have been charged by other funds within its Lipper expense group assuming they were similar in size to the Fund, as well as the actual total expenses of the Fund in comparison with those of its expense group. The Lipper contractual investment management fee comparison includes within such fee any separate administrative fees, and Lipper actual total expenses, for comparative consistency, are shown by Lipper for Fund Class A shares. Such expense comparisons in the case of each of Franklin Balance Sheet Investment Fund, Franklin MicroCap Value Fund, Franklin Small Cap Value Fund and Franklin All Cap Value Fund showed their contractual investment management fee rates and total expense ratios to be in either the least expensive or second least expensive quintile of their respective Lipper expense groups. The Board was satisfied with the expenses of these Funds. The Lipper report for Franklin Large Cap Value Fund showed its contractual investment management fee rate to be below the median of its expense group, and its actual total expense ratio to be within 14 basis points above the median of such expense group. The Board found the expenses of such Fund to be acceptable. The Lipper report for Franklin MidCap Value Fund showed both its contractual fee rate and its actual total expense ratio to be at the median of its expense group. The Board found the expenses of such Fund to be acceptable.
Semiannual Report | 129
Franklin Value Investors Trust
Shareholder Information (continued)
Board Review of Investment Management Agreement (continued)
MANAGEMENT PROFITABILITY. The Board also considered the level of profits realized by the Manager and its affiliates in connection with the operation of each Fund. In this respect, the Board reviewed the Fund profitability analysis that addresses the overall profitability of Franklin Templeton’s U.S. fund business, as well as its profits in providing management and other services to each of the individual funds during the 12-month period ended September 30, 2011, being the most recent fiscal year-end for Franklin Resources, Inc., the Manager’s parent. In reviewing the analysis, attention was given to the methodology followed in allocating costs to each Fund, it being recognized that allocation methodologies are inherently subjective and various allocation methodologies may each be reasonable while producing different results. In this respect, the Board noted that, while being continuously refined and reflecting changes in the Manager’s own cost accounting, the cost allocation methodology was consistent with that followed in profitability report presentations for the Funds made in prior years and that the Funds’ independent registered public accounting firm had been engaged by the Manager to review the reasonableness of the allocation methodologies solely for use by the Funds’ Board in reference to the profitability analysis. In reviewing and discussing such analysis, management discussed with the Board its belief that costs incurred in establishing the infrastructure necessary for the type of mutual fund operations conducted by the Manager and its affiliates may not be fully reflected in the expenses allocated to each Fund in determining its profitability, as well as the fact that the level of profits, to a certain extent, reflected operational cost savings and efficiencies initiated by management. The Board also took into account management’s expenditures in improving shareholder services provided the Funds, as well as the need to implement systems and meet additional regulatory and compliance requirements resulting from statutes such as the Sarbanes-Oxley and Dodd-Frank Acts and recent SEC and other regulatory requirements. In addition, the Board considered a third-party study comparing the profitability of the Manager’s parent on an overall basis to other publicly held managers broken down to show profitability from management operations exclusive of distribution expenses, as well as profitability including distribution expenses. The Board also considered the extent to which the Manager and its affiliates might derive ancillary benefits from fund operations, including revenues generated from transfer agent services and potential benefits resulting from allocation of fund brokerage and the use of commission dollars to pay for research. Based upon its consideration of all these factors, the Board determined that the level of profits realized by the Manager and its affiliates from providing services to each Fund was not excessive in view of the nature, quality and extent of services provided.
ECONOMIES OF SCALE. The Board also considered whether economies of scale are realized by the Manager as the Funds grow larger and the extent to which this is reflected in the level of management fees charged. While recognizing that any precise determination is inherently subjective, the Board noted that based upon the Fund profitability analysis, it appears that as some funds get larger, at some point economies of scale do result in the Manager realizing a larger profit margin on management services provided such a fund. The Board also noted that economies of scale are shared with each Fund and its shareholders through management fee breakpoints so that as a Fund grows in size, its effective management fee rate declines. The fee structure under the investment
130 | Semiannual Report
Franklin Value Investors Trust
Shareholder Information (continued)
Board Review of Investment Management Agreement (continued)
management agreements for each of Franklin Balance Sheet Investment Fund and Franklin Large Cap Value Fund contain breakpoints that continued to asset levels that exceed the present size of these Funds, and the Board believed that to the extent economies of scale may be realized by the Manager of these Funds and their affiliates, there was a sharing of benefits with each of these Funds and their shareholders. The fee structure of Franklin Small Cap Value Fund provides an initial fee of 0.75% on the first $500 million of Fund net assets; 0.625% on the next $500 million of Fund net assets, and 0.50% on Fund net assets in excess of $1 billion. At December 31, 2011, the Fund’s net assets were approximately $1.61 billion. In discussing such fees, management expressed its view that the existing fee schedule reflected anticipated economies of scale and pointed out the Fund’s favorable effective management fee and total expense comparisons within its Lipper expense group. Management also observed and the Board acknowledged the fact that the Fund had assets beyond the last breakpoint level and did not mean that it no longer benefited from economies of scale since the growth of assets being charged at the lowest 0.50% fee level resulted in a lower overall management fee rate. While intending to monitor future growth, the Board believed that to the extent economies of scale may be realized by the Manager and its affiliates, the current schedule of fees under the investment management agreement provides a reasonable sharing of benefits with the Fund and its shareholders. The fee structure of both Franklin MidCap Value Fund and Franklin All Cap Value Fund contains breakpoints and the Board felt that in view of their small size no economies of scale were realized in their operations, noting that the expenses of both Funds were subsidized by management. The fee structure under the investment management agreement for Franklin MicroCap Value Fund provides a flat fee of 0.75% at all asset levels. In discussing the absence of breakpoints with the independent Trustees, management pointed out that this Fund invests only in domestic and foreign securities with a market capitalization of less than $400 million that are believed to be undervalued. Management stated its belief that such limited investment options curtail the potential size of the Fund, thus preventing the type of economies of scale that might benefit other funds from increases in size and also pointed out that the Fund whose asset size was approximately $338 million at year-end has been closed to new investors, with limited exceptions, since January 14, 2004. Management also expressed its view that this fee was low for this type of a fund and pointed out the favorable comparison of fees and expenses within its Lipper expense group. The independent Trustees acknowledged that management’s explanation provided a reasonable basis for believing the existing fee rate under the investment management agreement was fair and that in the current circumstances, management was not benefiting from any meaningful economies of scale in its management of this Fund.
Semiannual Report | 131
Franklin Value Investors Trust
Shareholder Information (continued)
Proxy Voting Policies and Procedures
The Trust’s investment manager has established Proxy Voting Policies and Procedures (Policies) that the Trust uses to determine how to vote proxies relating to portfolio securities. Shareholders may view the Trust’s complete Policies online at franklintempleton.com. Alternatively, shareholders may request copies of the Policies free of charge by calling the Proxy Group collect at (954) 527-7678 or by sending a written request to: Franklin Templeton Companies, LLC, 300 S.E. 2nd Street, Fort Lauderdale, FL 33301, Attention: Proxy Group. Copies of the Trust’s proxy voting records are also made available online at franklintempleton.com and posted on the U.S. Securities and Exchange Commission’s website at sec.gov and reflect the most recent 12-month period ended June 30.
Quarterly Statement of Investments
The Trust files a complete statement of investments with the U.S. Securities and Exchange Commission for the first and third quarters for each fiscal year on Form N-Q. Shareholders may view the filed Form N-Q by visiting the Commission’s website at sec.gov. The filed form may also be viewed and copied at the Commission’s Public Reference Room in Washington, DC. Information regarding the operations of the Public Reference Room may be obtained by calling (800) SEC-0330.
132 | Semiannual Report

filings under the Securities Exchange Act of 1934 and the Investment Company Act of 1940 is recorded, processed, summarized and reported within the periods specified in the rules and forms of the Securities and Exchange Commission. Such information is accumulated and communicated to the Registrant’s management, including its principal executive officer and principal financial officer, as appropriate, to allow timely decisions regarding required disclosure. The Registrant’s management, including the principal executive officer and the principal financial officer, recognizes that any set of controls and procedures, no matter how well designed and operated, can provide only reasonable assurance of achieving the desired control objectives.
Within 90 days prior to the filing date of this Shareholder Report on Form N-CSR, the Registrant had carried out an evaluation, under the supervision and with the participation of the Registrant’s management, including the Registrant’s principal executive officer and the Registrant’s principal financial officer, of the effectiveness of the design and operation of the Registrant’s disclosure controls and procedures. Based on such evaluation, the Registrant’s principal executive officer and principal financial officer concluded that the Registrant’s disclosure controls and procedures are effective.
(b) Changes in Internal Controls.
There have been no significant
changes in the Registrant’s internal controls or in other factors that could significantly affect the internal controls subsequent to the date of their evaluation in connection with the preparation of this Shareholder Report on Form N-CSR.
Item 12. Exhibits.
(a)(1) Code of Ethics
(a)(2) Certifications pursuant to Section 302 of the Sarbanes-Oxley Act of 2002 of Laura F. Fergerson, Chief Executive Officer - Finance and Administration, and Matthew T. Hinkle, Chief Financial Officer and Chief Accounting Officer
(b) Certifications pursuant to Section 906 of the Sarbanes-Oxley Act of 2002 of Laura F. Fergerson, Chief Executive Officer - Finance and Administration, and Matthew T. Hinkle, Chief Financial Officer and Chief Accounting Officer
SIGNATURES
Pursuant to the requirements of the Securities Exchange Act of 1934 and the Investment Company Act of 1940, the registrant has duly caused this report to be signed on its behalf by the undersigned, thereunto duly authorized.
FRANKLIN VALUE INVESTORS TRUST
By /s/LAURA F. FERGERSON
Laura F. Fergerson
Chief Executive Officer –
Finance and Administration
Date June 26, 2012
Pursuant to the requirements of the Securities Exchange Act of 1934 and the Investment Company Act of 1940, this report has been signed below by the following persons on behalf of the registrant and in the capacities and on the dates indicated.
By /s/LAURA F. FERGERSON
Laura F. Fergerson
Chief Executive Officer –
Finance and Administration
Date June 26, 2012
By /s/MATTHEW T. HINKLE
Matthew T. Hinkle
Chief Financial Officer and
Chief Accounting Officer
Date June 26, 2012