
Semiannual Report
Economic and Market Overview
Modest growth for the U.S. economy, as measured by gross domestic product, characterized the six-month period ended April 30, 2013. Increasing job creation helped the unemployment rate decline during the period, and consumer spending remained strong. In the housing sector, accelerating new and existing homes sales accompanied record-low mortgage rates, affordable housing prices, low new-home inventories and a six-year low in U.S. foreclosures. Orders for manufactured goods and manufacturers’ inventory reached record levels in March and the sector expanded for the fifth consecutive month through period-end.
Businesses and investors awaited the U.S. election that resulted in an unchanged balance of power in Washington, given the re-election of President Obama and respective control of the House and Senate by Republicans and Democrats. Uncertainty surrounding budget deadlines set for the end of 2012 largely abated when an agreement between Congress and the President resolved many issues, including preserving lower income tax rates for most U.S. households. Concerns remained about the effects of the expired payroll tax cut, far-reaching federal spending cuts, and future negotiations regarding the federal debt ceiling.
U.S. stocks generated healthy returns as the Standard & Poor’s® 500 Index and Dow Jones Industrial Average reached all-time highs near period-end.1 Rising corporate profits and generally favorable economic data bolstered investor confidence, but some caution surrounded the extent to which positive business and market results were dependent on the Federal Reserve Board’s accommodative monetary policy.
The foregoing information reflects our analysis and opinions as of April 30, 2013. The information is not a com-
plete analysis of every aspect of any market, country, industry, security or fund. Statements of fact are from
sources considered reliable.
1. STANDARD & POOR’S®, S&P® and S&P 500® are registered trademarks of Standard & Poor’s Financial Services LLC.
Semiannual Report | 3
Franklin All Cap Value Fund
Your Fund’s Goal and Main Investments: Franklin All Cap Value Fund seeks long-term total return by primarily investing in stocks of companies of any size that we believe are undervalued at the time of purchase and have the potential for capital appreciation.
This semiannual report for Franklin All Cap Value Fund covers the period ended April 30, 2013.
Performance Overview
Franklin All Cap Value Fund – Class A delivered a +15.00% cumulative total return for the six months under review. In comparison, the Russell 3000® Value Index, which measures performance of those Russell 3000® Index companies with lower price-to-book ratios and lower forecasted growth values, generated a +16.33% total return.1 You can find more of the Fund’s performance data in the Performance Summary beginning on page 7.
Investment Strategy
Our goal is to invest in stocks of companies of any size that we determine are currently undervalued and have the potential for capital appreciation. The Fund purchases securities that are out of favor in the market for reasons we believe will prove to be temporary in nature, or that appear to be inexpensive measured by factors such as price relative to earnings, book value or cash flow. In addition, the Fund may invest in companies with valuable intangibles we believe are not reflected in the stock price. This strategy is not aimed at short-term trading gains, nor do we consider the composition of any index. Rather, we try to identify attractively priced, financially sound companies that meet our investment criteria, and we assume at purchase that we will hold the positions for several years.
1. Source: © 2013 Morningstar. All Rights Reserved. The information contained herein: (1) is proprietary to Morningstar
and/or its content providers; (2) may not be copied or distributed; and (3) is not warranted to be accurate, complete or
timely. Neither Morningstar nor its content providers are responsible for any damages or losses arising from any use of
this information. Russell® is a trademark of the Frank Russell Company. The index is unmanaged and includes rein-
vested dividends. One cannot invest directly in an index, and an index is not representative of the Fund’s portfolio.
The dollar value, number of shares or principal amount, and names of all portfolio holdings are listed in the Fund’s
Statement of Investments (SOI). The SOI begins on page 55.
4 | Semiannual Report
Manager’s Discussion
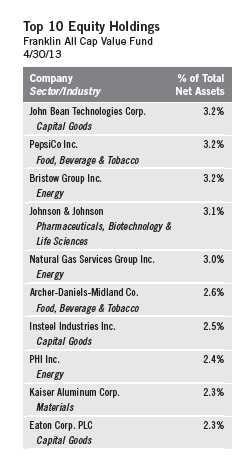
During the six months under review, contributors to absolute performance encompassed several of the Fund’s largest holdings. These included food processing equipment manufacturer John Bean Technologies, steel wire reinforcing products manufacturer Insteel Industries, helicopter transportation provider for the offshore energy industry, Bristow Group, energy equipment manufacturer Natural Gas Services Group and health care products manufacturer Johnson & Johnson.2
In contrast, detractors included helicopter transportation services provider PHI and oil and gas exploration and production company Apache. Other individual detractors included global software and services provider Microsoft, steel manufacturer Nucor and cable television provider Time Warner Cable.
During the period, we initiated positions in eight new holdings, including diversified oil services company Baker Hughes, bank holding company Keycorp, auto safety systems company Autoliv, audio and infotainment manufacturer Harman International, outdoor power equipment manufacturer Briggs & Stratton, auto service and retail chain Pep Boys – Manny, Moe & Jack, color, flavor and fragrance manufacturer Sensient Technologies and Nucor, mentioned above.
We also added to several other existing positions including the aforementioned Insteel Industries, vehicle chassis manufacturer Spartan Motors, and intimate apparel manufacturer Maidenform Brands, among others.
We liquidated our positions in Microsoft, Xerox, Time Warner Cable, Rockwell Automation and Gardner Denver, the latter of which was subject to an all cash takeover offer from KKR. We also reduced several existing positions, including International Business Machines, Kaiser Aluminum and Becton, Dickinson.
2. The consumer discretionary sector comprises automobiles and components, consumer durables and apparel, media and retailing in the SOI.

Semiannual Report | 5
Thank you for your participation in Franklin All Cap Value Fund. We look
forward to serving your future investment needs.

The foregoing information reflects our analysis, opinions and portfolio holdings as of April 30, 2013, the end of the
reporting period. The way we implement our main investment strategies and the resulting portfolio holdings may
change depending on factors such as market and economic conditions. These opinions may not be relied upon as
investment advice or an offer for a particular security. The information is not a complete analysis of every aspect
of any market, country, industry, security or the Fund. Statements of fact are from sources considered reliable, but
the investment manager makes no representation or warranty as to their completeness or accuracy. Although his-
torical performance is no guarantee of future results, these insights may help you understand our investment
management philosophy.
6 | Semiannual Report
Performance Summary as of 4/30/13
Franklin All Cap Value Fund
Your dividend income will vary depending on dividends or interest paid by securities in the Fund’s
portfolio, adjusted for operating expenses of each class. Capital gain distributions are net profits
realized from the sale of portfolio securities. The performance table does not reflect any taxes that
a shareholder would pay on Fund dividends, capital gain distributions, if any, or any realized gains
on the sale of Fund shares. Total return reflects reinvestment of the Fund’s dividends and capital
gain distributions, if any, and any unrealized gains or losses.
Semiannual Report | 7
Performance Summary (continued)
Performance1
Cumulative total return excludes sales charges. Average annual total returns and value of $10,000 investment include
maximum sales charges. Class A: 5.75% maximum initial sales charge; Class C: 1% contingent deferred sales charge in
first year only; Class R/Advisor Class: no sales charges.
Performance data represent past performance, which does not guarantee future results. Investment return and principal
value will fluctuate, and you may have a gain or loss when you sell your shares. Current performance may differ from
figures shown. For most recent month-end performance, go to franklintempleton.com or call (800) 342-5236.
The investment manager and administrator have contractually agreed to waive or assume certain expenses so that common
expenses (excluding Rule 12b-1 fees and acquired fund fees and expenses) for each class of the Fund do not exceed
0.95% (other than certain nonroutine expenses) until 2/28/14.
8 | Semiannual Report
Performance Summary (continued)
Endnotes
All investments involve risks, including possible loss of principal. Value securities may not increase in price as anticipated or may decline fur-
ther in value. While smaller and midsize companies may offer substantial opportunities for capital growth, they also involve heightened risks and
should be considered speculative. Historically, smaller and midsize company securities have been more volatile in price than larger company
securities, especially over the short term. The Fund may invest up to 25% of its total assets in foreign securities, which may involve special
risks, including currency fluctuations and economic and political uncertainty. The Fund is actively managed but there is no guarantee that the
manager’s investment decisions will produce the desired results. The Fund’s prospectus also includes a description of the main investment risks.
Class C: These shares have higher annual fees and expenses than Class A shares.
Class R: Shares are available to certain eligible investors as described in the prospectus. These shares have higher annual fees and expenses
than Class A shares.
Advisor Class: Shares are available to certain eligible investors as described in the prospectus.
1. Fund investment results reflect the expense reduction, without which the results would have been lower.
2. Cumulative total return represents the change in value of an investment over the periods indicated.
3. Average annual total return represents the average annual change in value of an investment over the periods indicated. Six-month return has not
been annualized.
4. These figures represent the value of a hypothetical $10,000 investment in the Fund over the periods indicated.
5. In accordance with SEC rules, we provide standardized average annual total return information through the latest calendar quarter.
6. Figures are as stated in the Fund’s current prospectus. In periods of market volatility, assets may decline significantly, causing total annual Fund
operating expenses to become higher than the figures shown.
Semiannual Report | 9
Your Fund’s Expenses
Franklin All Cap Value Fund
As a Fund shareholder, you can incur two types of costs:
- Transaction costs, including sales charges (loads) on Fund purchases; and
- Ongoing Fund costs, including management fees, distribution and service (12b-1) fees, and other Fund expenses. All mutual funds have ongoing costs, sometimes referred to as operating expenses.
The following table shows ongoing costs of investing in the Fund and can help you understand these costs and compare them with those of other mutual funds. The table assumes a $1,000 investment held for the six months indicated.
Actual Fund Expenses
The first line (Actual) for each share class listed in the table provides actual account values and expenses. The “Ending Account Value” is derived from the Fund’s actual return, which includes the effect of Fund expenses.
You can estimate the expenses you paid during the period by following these steps. Of course, your account value and expenses will differ from those in this illustration:
| 1. | Divide your account value by $1,000. |
| | If an account had an $8,600 value, then $8,600 ÷ $1,000 = 8.6. |
| 2. | Multiply the result by the number under the heading “Expenses Paid During Period.” |
| | If Expenses Paid During Period were $7.50, then 8.6 x $7.50 = $64.50. |
In this illustration, the estimated expenses paid this period are $64.50.
Hypothetical Example for Comparison with Other Funds
Information in the second line (Hypothetical) for each class in the table can help you compare ongoing costs of investing in the Fund with those of other mutual funds. This information may not be used to estimate the actual ending account balance or expenses you paid during the period. The hypothetical “Ending Account Value” is based on the actual expense ratio for each class and an assumed 5% annual rate of return before expenses, which does not represent the Fund’s actual return. The figure under the heading “Expenses Paid During Period” shows the hypothetical expenses your account would have incurred under this scenario. You can compare this figure with the 5% hypothetical examples that appear in shareholder reports of other funds.
10 | Semiannual Report
Your Fund’s Expenses (continued)
Please note that expenses shown in the table are meant to highlight ongoing costs and do not reflect
any transaction costs, such as sales charges. Therefore, the second line for each class is useful in
comparing ongoing costs only, and will not help you compare total costs of owning different
funds. In addition, if transaction costs were included, your total costs would have been higher.
Please refer to the Fund prospectus for additional information on operating expenses.

Semiannual Report | 11
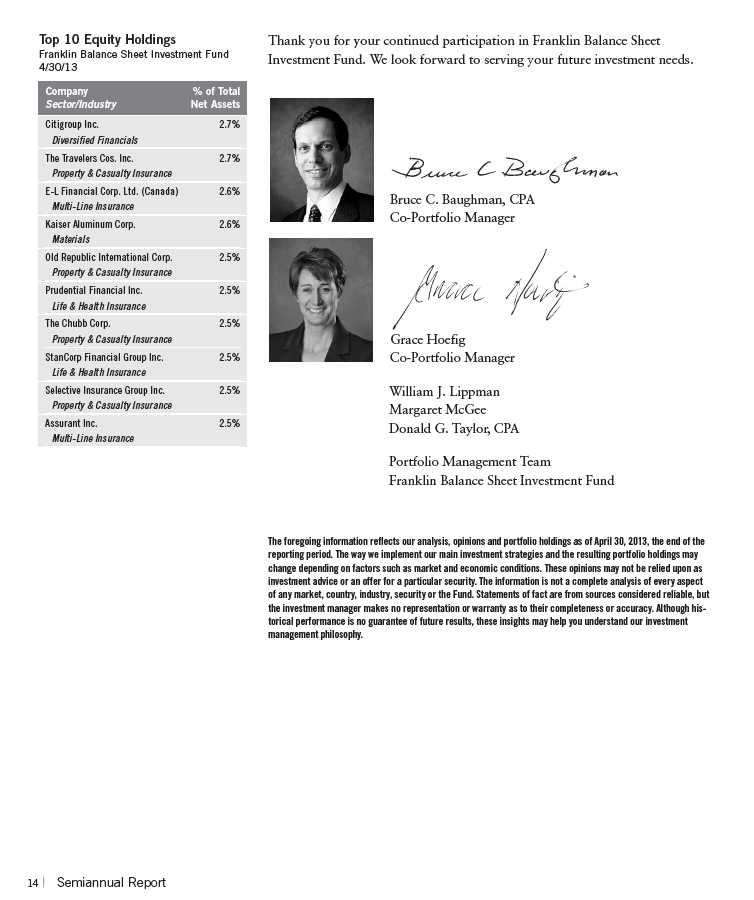
Franklin Balance Sheet Investment Fund
Your Fund’s Goal and Main Investments: Franklin Balance Sheet Investment Fund seeks high total return, of which capital appreciation and income are components, by investing most of its assets in equity securities of companies of any size that we believe are undervalued in the marketplace at the time of purchase but have the potential for capital appreciation.
We are pleased to bring you Franklin Balance Sheet Investment Fund’s semi-annual report for the period ended April 30, 2013.
Performance Overview
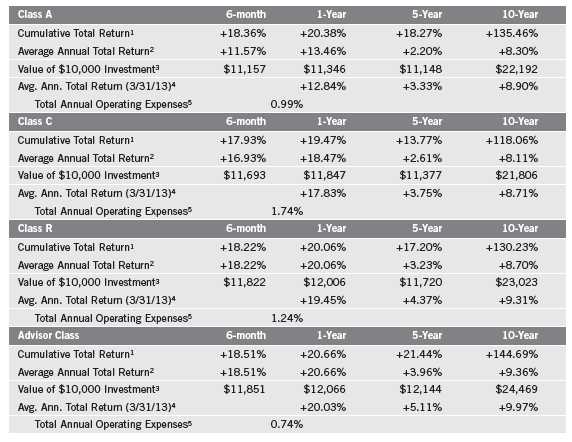
Franklin Balance Sheet Investment Fund – Class A delivered a cumulative total return of +18.36% for the six months under review. In comparison, the Russell 3000® Value Index, which measures performance of those Russell 3000® Index companies with lower price-to-book ratios and lower forecasted growth values, generated a +16.33% total return.1 Although this report covers a six-month period, our investment strategy aims for long-term results. You can find the Fund’s long-term performance data in the Performance Summary beginning on page 15.
Investment Strategy
Our strategy is to buy shares of financially sound, well-established companies at a low price-to-book value when we have reasonable confidence that book value will increase over several years. Book value per share is a company’s net worth or shareholders’ equity on an accounting or “book” basis, divided by shares outstanding. We generally define “low price-to-book value” as the lower two deciles (20%) of our investable universe, which we derive from a proprietary database for screening purposes. This strategy is not aimed at short-term trading gains, nor do we consider the composition of any index. Rather, we try to identify individual companies that meet our investment criteria, and we assume at purchase that we will hold the positions for several years.
1. Source: © 2013 Morningstar. All Rights Reserved. The information contained herein: (1) is proprietary to Morningstar
and/or its content providers; (2) may not be copied or distributed; and (3) is not warranted to be accurate, complete or
timely. Neither Morningstar nor its content providers are responsible for any damages or losses arising from any use of
this information. The index is unmanaged and includes reinvested dividends. One cannot invest directly in an index, and
an index is not representative of the Fund’s portfolio.
The dollar value, number of shares or principal amount, and names of all portfolio holdings are listed in the Fund’s
Statement of Investments (SOI). The SOI begins on page 62.
12 | Semiannual Report
Manager’s Discussion
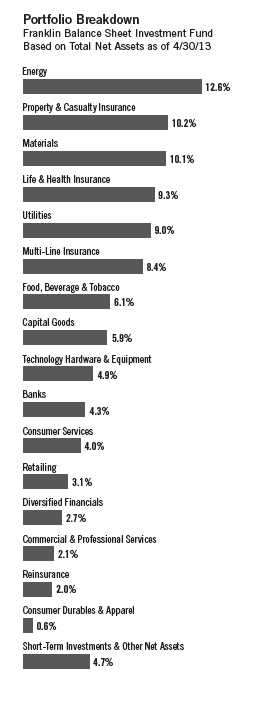
On April 30, 2013, the Fund’s total net assets were $1.32 billion, with short-term investments and other net assets making up 4.7%, compared with total net assets of $1.28 billion and short-term investments and other net assets of 2.4% on October 31, 2012. During the six-month period, we identified two new investment opportunities: oil and natural gas exploration and production company Devon Energy and restaurant chain operator Ruby Tuesday. We also added to existing positions in global agribusiness and food company Bunge, cruise ship operator Royal Caribbean Cruises and bank holding company Comerica, among others. Cash deployed into new or existing positions totaled $75 million.
Portfolio sales totaled $248 million. During the period, we liquidated the following holdings: Actavis (formerly Watson Pharmaceuticals), Teekay, CNH Global, Callaway Golf, Werner Enterprises, Texas Industries, and ConocoPhillips and its spin-off, Phillips 66. We also reduced numerous positions including Bristow Group, OfficeMax and Kaiser Aluminum.
During the six-month reporting period, contributors to absolute Fund performance included OfficeMax (office supplies retailer), as it was the subject of a takeover offer at a 20% premium to its then share price. A number of financials sector holdings such as insurers Old Republic International, StanCorp Financial Group, E-L Financial and Assurant also contributed.2 In contrast, detractors included energy sector holdings PHI, Devon Energy and ConocoPhillips. ESCO Technologies in the industrials sector and the aforementioned Actavis in the health care sector also hindered results.
2. The financials sector comprises banks, diversified financials, life and health insurance, multi-line insurance, property and casualty insurance, and reinsurance in the SOI.
Semiannual Report | 13
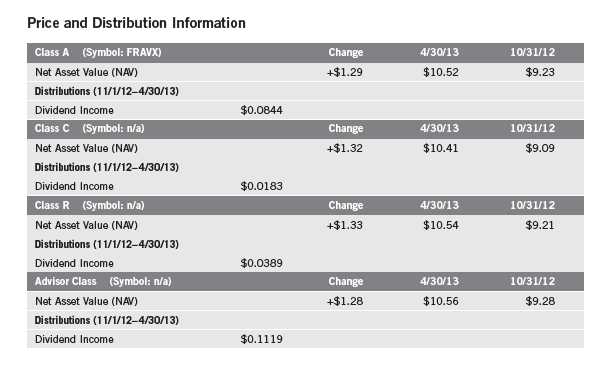
Performance Summary as of 4/30/13
Franklin Balance Sheet Investment Fund
Your dividend income will vary depending on dividends or interest paid by securities in the Fund’s
portfolio, adjusted for operating expenses of each class. Capital gain distributions are net profits
realized from the sale of portfolio securities. The performance table does not reflect any taxes that
a shareholder would pay on Fund dividends, capital gain distributions, if any, or any realized gains
on the sale of Fund shares. Total return reflects reinvestment of the Fund’s dividends and capital
gain distributions, if any, and any unrealized gains or losses.

Semiannual Report | 15
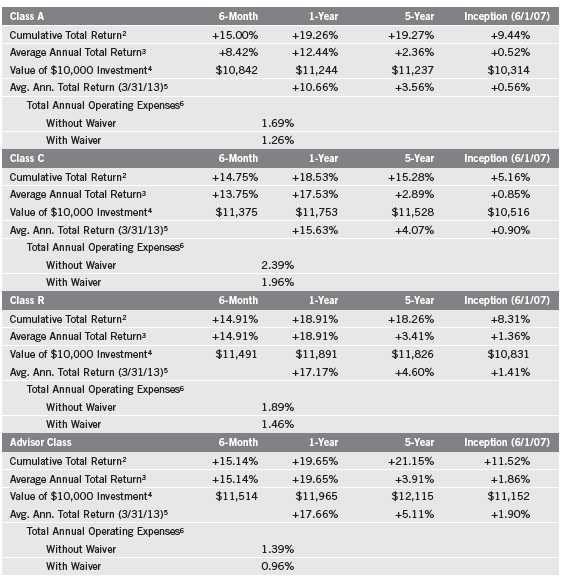
Performance Summary (continued)
Performance
Cumulative total return excludes sales charges. Average annual total returns and value of $10,000 investment include
maximum sales charges. Class A: 5.75% maximum initial sales charge; Class C: 1% contingent deferred sales charge in
first year only; Class R/Advisor Class: no sales charges.
Performance data represent past performance, which does not guarantee future results. Investment return and principal
value will fluctuate, and you may have a gain or loss when you sell your shares. Current performance may differ from
figures shown. For most recent month-end performance, go to franklintempleton.com or call (800) 342-5236.
16 | Semiannual Report
Performance Summary (continued)
Endnotes
All investments involve risks, including possible loss of principal. Value securities may not increase in price as anticipated or may decline further in value. While smaller and midsize companies may offer substantial opportunities for capital growth, they also involve heightened risks and should be considered speculative. Historically, smaller and midsize company securities have been more volatile in price than larger company securities, especially over the short term. The Fund may invest up to 25% of its total assets in foreign securities, which may involve special risks, including currency fluctuations and economic and political uncertainty. The Fund is actively managed but there is no guarantee that the manager’s investment decisions will produce the desired results. The Fund’s prospectus also includes a description of the main investment risks.
| |
Class C: | Prior to 1/1/04, these shares were offered with an initial sales charge; thus actual total returns would have differed. These shares have higher annual fees and expenses than Class A shares. |
| |
Class R: | Shares are available to certain eligible investors as described in the prospectus. These shares have higher annual fees and expenses than Class A shares. |
| |
Advisor Class: | Shares are available to certain eligible investors as described in the prospectus. |
1. Cumulative total return represents the change in value of an investment over the periods indicated.
2. Average annual total return represents the average annual change in value of an investment over the periods indicated. Six-month return has not been annualized.
3. These figures represent the value of a hypothetical $10,000 investment in the Fund over the periods indicated.
4. In accordance with SEC rules, we provide standardized average annual total return information through the latest calendar quarter.
5. Figures are as stated in the Fund’s current prospectus. In periods of market volatility, assets may decline significantly, causing total annual Fund operating expenses to become higher than the figures shown.
Semiannual Report | 17
Your Fund’s Expenses
Franklin Balance Sheet Investment Fund
As a Fund shareholder, you can incur two types of costs:
- Transaction costs, including sales charges (loads) on Fund purchases; and
- Ongoing Fund costs, including management fees, distribution and service (12b-1) fees, and other Fund expenses. All mutual funds have ongoing costs, sometimes referred to as operating expenses.
The following table shows ongoing costs of investing in the Fund and can help you understand these costs and compare them with those of other mutual funds. The table assumes a $1,000 investment held for the six months indicated.
Actual Fund Expenses
The first line (Actual) for each share class listed in the table provides actual account values and expenses. The “Ending Account Value” is derived from the Fund’s actual return, which includes the effect of Fund expenses.
You can estimate the expenses you paid during the period by following these steps. Of course, your account value and expenses will differ from those in this illustration:
| 1. | Divide your account value by $1,000. |
| | If an account had an $8,600 value, then $8,600 ÷ $1,000 = 8.6. |
| 2. | Multiply the result by the number under the heading “Expenses Paid During Period.” |
| | If Expenses Paid During Period were $7.50, then 8.6 x $7.50 = $64.50. |
In this illustration, the estimated expenses paid this period are $64.50.
Hypothetical Example for Comparison with Other Funds
Information in the second line (Hypothetical) for each class in the table can help you compare ongoing costs of investing in the Fund with those of other mutual funds. This information may not be used to estimate the actual ending account balance or expenses you paid during the period. The hypothetical “Ending Account Value” is based on the actual expense ratio for each class and an assumed 5% annual rate of return before expenses, which does not represent the Fund’s actual return. The figure under the heading “Expenses Paid During Period” shows the hypothetical expenses your account would have incurred under this scenario. You can compare this figure with the 5% hypothetical examples that appear in shareholder reports of other funds.
18 | Semiannual Report
Your Fund’s Expenses (continued)
Please note that expenses shown in the table are meant to highlight ongoing costs and do not reflect
any transaction costs, such as sales charges. Therefore, the second line for each class is useful in
comparing ongoing costs only, and will not help you compare total costs of owning different
funds. In addition, if transaction costs were included, your total costs would have been higher.
Please refer to the Fund prospectus for additional information on operating expenses.
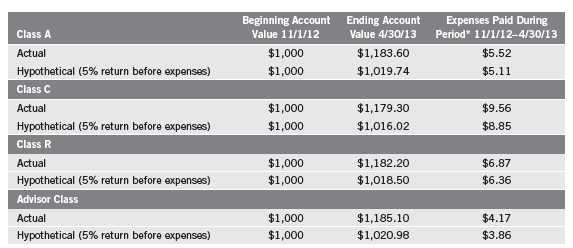
*Expenses are calculated using the most recent six-month expense ratio, annualized for each class (A: 1.02%; C: 1.77%; R: 1.27%; and
Advisor: 0.77%), multiplied by the average account value over the period, multiplied by 181/365 to reflect the one-half year period.
Semiannual Report | 19
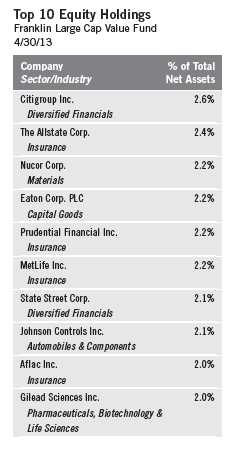
Franklin Large Cap Value Fund
Your Fund’s Goal and Main Investments: Franklin Large Cap Value Fund seeks long-term capital appreciation by investing at least 80% of its net assets in large capitalization companies that we believe are undervalued. We define large capitalization companies as those with market capitalizations that are similar in size at the time of purchase to those in the Russell 1000® Index.1

This semiannual report for Franklin Large Cap Value Fund covers the period ended April 30, 2013.
Performance Overview
Franklin Large Cap Value Fund – Class A delivered a +14.57% cumulative total return for the six months under review. In comparison, the Russell 1000® Value Index, which measures performance of those Russell 1000® Index companies with lower price-to-book ratios and lower forecasted growth values, generated a total return of +16.31%.2 Although this report covers a six-month period, our investment strategy aims for long-term results. You can find the Fund’s long-term performance data in the Performance Summary beginning on page 23.
Investment Strategy
We seek to invest in securities of large capitalization companies that we believe are selling below their underlying worth and hold them until they reach what we consider their fair market value. Our aim is to construct a diversified portfolio of fundamentally sound companies purchased at attractive prices, often when they are out of favor with other investors for reasons we believe are temporary. Portfolio securities are selected without regard to benchmark comparisons and are based on fundamental, bottom-up research focusing on several criteria, such as low price relative to earnings, cash flow or book value. We also consider stocks with recent sharp price declines that we believe still have significant growth potential or that possess valuable intangibles not reflected in the stock price.
1. The Russell 1000® Index is market capitalization weighted and measures performance of the largest companies in
the Russell 3000® Index, which represents the majority of the U.S. market’s total market capitalization.
2. Source: © 2013 Morningstar. All Rights Reserved. The information contained herein: (1) is proprietary to Morningstar
and/or its content providers; (2) may not be copied or distributed; and (3) is not warranted to be accurate, complete or
timely. Neither Morningstar nor its content providers are responsible for any damages or losses arising from any use of
this information. The index is unmanaged and includes reinvested dividends. One cannot invest directly in an index, and
an index is not representative of the Fund’s portfolio.
The dollar value, number of shares or principal amount, and names of all portfolio holdings are listed in the Fund’s
Statement of Investments (SOI). The SOI begins on page 69.
20 | Semiannual Report

Manager’s Discussion
During the six months under review, financials sector holdings contributed to absolute Fund performance, most notably institutional financial products and services provider State Street, financial conglomerate Citigroup, and property and casualty insurer Allstate.3 Consumer discretionary and health care sector holdings also contributed to results, especially auto components and building efficiency manufacturer Johnson Controls and biopharmaceutical firm Gilead Sciences.4 The Fund’s industrials sector holdings also aided performance.5
In contrast, detractors from performance included several energy sector holdings including oil and gas exploration and production companies Apache, Devon Energy and Exxon Mobil. Health care company Teva Pharmaceutical Industries and aluminum manufacturer Alcoa also hindered performance.
During the six-month period, the Fund initiated positions in the largest U.S. drug store operator Walgreen, electric utility Exelon and discount retailer Family Dollar Stores. We also increased our positions in the aforementioned Apache, agribusiness and food company Bunge, and petroleum refiner and marketer Valero Energy, among others.
We liquidated our positions in Johnson & Johnson and Abbott Laboratories. We also reduced our holdings in Xerox, State Street and Wal-Mart Stores, among others.
3. The financials sector comprises banks, diversified financials and insurance in the SOI.
4. The consumer discretionary sector comprises consumer durables and apparel, consumer services and retailing in
the SOI. The health care sector comprises health care equipment and services; and pharmaceuticals, biotechnology
and life sciences in the SOI.
5. The industrials sector comprises capital goods and transportation in the SOI.
Semiannual Report | 21
Thank you for your continued participation in Franklin Large Cap Value
Fund. We look forward to serving your future investment needs.


William J. Lippman
President and Lead Portfolio Manager
Bruce C. Baughman, CPA
Margaret McGee
Donald G. Taylor, CPA
Portfolio Management Team
Franklin Large Cap Value Fund
The foregoing information reflects our analysis, opinions and portfolio holdings as of April 30, 2013, the end of the
reporting period. The way we implement our main investment strategies and the resulting portfolio holdings may
change depending on factors such as market and economic conditions. These opinions may not be relied upon as
investment advice or an offer for a particular security. The information is not a complete analysis of every aspect of
any market, country, industry, security or the Fund. Statements of fact are from sources considered reliable, but the
investment manager makes no representation or warranty as to their completeness or accuracy. Although historical
performance is no guarantee of future results, these insights may help you understand our investment management
philosophy.
22 | Semiannual Report
Performance Summary as of 4/30/13
Franklin Large Cap Value Fund
Your dividend income will vary depending on dividends or interest paid by securities in the Fund’s
portfolio, adjusted for operating expenses of each class. Capital gain distributions are net profits
realized from the sale of portfolio securities. The performance table does not reflect any taxes that
a shareholder would pay on Fund dividends, capital gain distributions, if any, or any realized gains
on the sale of Fund shares. Total return reflects reinvestment of the Fund’s dividends and capital
gain distributions, if any, and any unrealized gains or losses.

Semiannual Report | 23
Performance Summary (continued)
Performance1
Cumulative total return excludes sales charges. Average annual total returns and value of $10,000 investment include
maximum sales charges. Class A: 5.75% maximum initial sales charge; Class C: 1% contingent deferred sales charge in
first year only; Class R/Advisor Class: no sales charges.
24 | Semiannual Report
Performance Summary (continued)
Endnotes
All investments involve risks, including possible loss of principal. Stock prices fluctuate, sometimes rapidly and dramatically, due to factors
affecting individual companies, particular industries or sectors, or general market conditions. These price movements may result from factors
affecting individual companies, industries or the securities market as a whole. The Fund may invest up to 25% of its total assets in foreign
securities, which may involve special risks, including currency fluctuations and economic and political uncertainty. The Fund is actively man-
aged but there is no guarantee that the manager’s investment decisions will produce the desired results. The Fund’s prospectus also includes
a description of the main investment risks.
Class C: Prior to 1/1/04, these shares were offered with an initial sales charge; thus actual total returns would have differed. These shares
have higher annual fees and expenses than Class A shares.
Class R: Shares are available to certain eligible investors as described in the prospectus. These shares have higher annual fees and expenses
than Class A shares.
Advisor Class: Shares are available to certain eligible investors as described in the prospectus.
1. Fund investment results reflect past expense reductions, without which the results would have been lower.
2. Cumulative total return represents the change in value of an investment over the periods indicated.
3. Average annual total return represents the average annual change in value of an investment over the periods indicated. Six-month return has not
been annualized.
4. These figures represent the value of a hypothetical $10,000 investment in the Fund over the periods indicated.
5. In accordance with SEC rules, we provide standardized average annual total return information through the latest calendar quarter.
6. Figures are as stated in the Fund’s current prospectus. In periods of market volatility, assets may decline significantly, causing total annual Fund
operating expenses to become higher than the figures shown.
7. Effective 11/1/05, the Fund began offering Advisor Class shares, which do not have sales charges or a Rule 12b-1 plan. Performance quotations
for this class reflect the following methods of calculation: (a) For periods prior to 11/1/05, a restated figure is used based upon the Fund’s Class A
performance, excluding the effect of Class A’s maximum initial sales charge, but reflecting the effect of the Class A Rule 12b-1 fees; and (b) for peri-
ods after 11/1/05, actual Advisor Class performance is used reflecting all charges and fees applicable to that class. Since 11/1/05 (commencement
of sales), the cumulative and average annual total returns of Advisor Class shares were +31.51% and +3.72%.
Semiannual Report | 25
Your Fund’s Expenses
Franklin Large Cap Value Fund
As a Fund shareholder, you can incur two types of costs:
- Transaction costs, including sales charges (loads) on Fund purchases; and
- Ongoing Fund costs, including management fees, distribution and service (12b-1) fees, and other Fund expenses. All mutual funds have ongoing costs, sometimes referred to as operating expenses.
The following table shows ongoing costs of investing in the Fund and can help you understand these costs and compare them with those of other mutual funds. The table assumes a $1,000 investment held for the six months indicated.
Actual Fund Expenses
The first line (Actual) for each share class listed in the table provides actual account values and expenses. The “Ending Account Value” is derived from the Fund’s actual return, which includes the effect of Fund expenses.
You can estimate the expenses you paid during the period by following these steps. Of course, your account value and expenses will differ from those in this illustration:
| 1. | Divide your account value by $1,000. |
| | If an account had an $8,600 value, then $8,600 ÷ $1,000 = 8.6. |
| 2. | Multiply the result by the number under the heading “Expenses Paid During Period.” |
| | If Expenses Paid During Period were $7.50, then 8.6 x $7.50 = $64.50. |
In this illustration, the estimated expenses paid this period are $64.50.
Hypothetical Example for Comparison with Other Funds
Information in the second line (Hypothetical) for each class in the table can help you compare ongoing costs of investing in the Fund with those of other mutual funds. This information may not be used to estimate the actual ending account balance or expenses you paid during the period. The hypothetical “Ending Account Value” is based on the actual expense ratio for each class and an assumed 5% annual rate of return before expenses, which does not represent the Fund’s actual return. The figure under the heading “Expenses Paid During Period” shows the hypothetical expenses your account would have incurred under this scenario. You can compare this figure with the 5% hypothetical examples that appear in shareholder reports of other funds.
26 | Semiannual Report
Your Fund’s Expenses (continued)
Please note that expenses shown in the table are meant to highlight ongoing costs and do not reflect
any transaction costs, such as sales charges. Therefore, the second line for each class is useful in
comparing ongoing costs only, and will not help you compare total costs of owning different
funds. In addition, if transaction costs were included, your total costs would have been higher.
Please refer to the Fund prospectus for additional information on operating expenses.

*Expenses are calculated using the most recent six-month expense ratio, annualized for each class (A: 1.37%; C: 2.08%; R: 1.58%; and
Advisor: 1.08%), multiplied by the average account value over the period, multiplied by 181/365 to reflect the one-half year period.
Semiannual Report | 27
Franklin MicroCap Value Fund
Your Fund’s Goal and Main Investments: Franklin MicroCap Value Fund seeks high total return, of which capital appreciation and income are components, by investing at least 80% of its net assets in securities of companies with market capitalizations under $500 million at the time of purchase that we believe are undervalued in the marketplace.1
This semiannual report for Franklin MicroCap Value Fund covers the period ended April 30, 2013.
Performance Overview
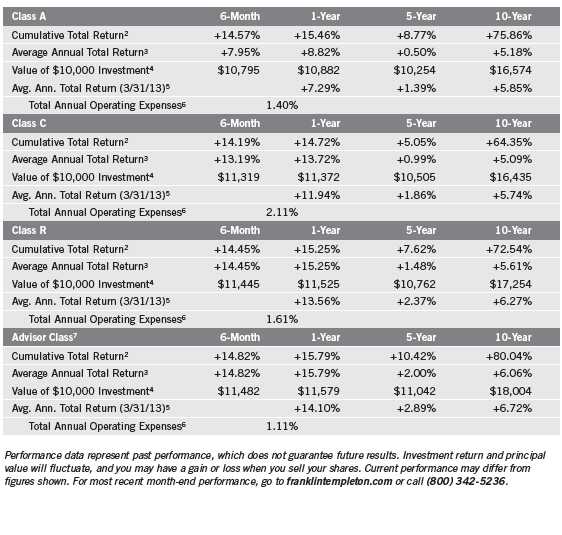
Franklin MicroCap Value Fund – Class A delivered a +14.93% cumulative total return for the six months under review. In comparison, the Russell 2000® Value Index, which measures performance of those Russell 2000® Index companies with lower price-to-book ratios and lower forecasted growth values, generated a +16.58% total return.2 Although this report covers a six-month period, our investment strategy aims for long-term results. You can find the Fund’s long-term performance data in the Performance Summary beginning on page 31.
Investment Strategy
Our strategy is to buy shares of financially sound, well-established companies at a low price-to-book value, where we have reasonable confidence that book value will increase over several years. We limit purchases to companies with market capitalizations of less than $500 million, which we define as “microcap.”1 Book value per share is a company’s net worth or shareholders’ equity on an accounting or “book” basis, divided by shares outstanding. This strategy is not aimed at short-term trading gains, nor do we consider the composition of any index. Rather, we try to identify individual companies that meet our investment criteria, and we assume at purchase that we will hold the positions for several years.
1. Effective 12/10/12, the maximum market capitalization for each investment that the Fund can invest in increased from $400 million at time of purchase to $500 million.
2. Source: © 2013 Morningstar. All Rights Reserved. The information contained herein: (1) is proprietary to Morningstar and/or its content providers; (2) may not be copied or distributed; and (3) is not warranted to be accurate, complete or timely. Neither Morningstar nor its content providers are responsible for any damages or losses arising from any use of this information. The index is unmanaged and includes reinvested dividends. One cannot invest directly in an index, and an index is not representative of the Fund’s portfolio.
The dollar value, number of shares or principal amount, and names of all portfolio holdings are listed in the Fund’s Statement of Investments (SOI). The SOI begins on page 74.
28 | Semiannual Report
Manager’s Discussion
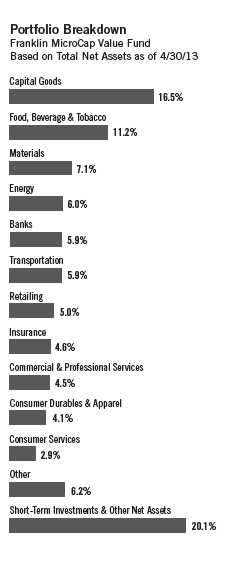
On April 30, 2013, the Fund’s total net assets were $463.5 million, with short-term investments and other net assets making up 20.1%, compared with total net assets of $367.9 million and short-term investments and other net assets of 9.3% on October 31, 2012. The Fund closed to new investors (with the exception of certain retirement accounts) in January 2004 and has remained closed except for two days in mid-February 2013. We opened the Fund on a limited basis so that we might increase the number of shareholders and broaden our investor base. The Fund’s being closed does not restrict existing shareholders from adding to or reducing their investments in the Fund, except that once an account is reduced to zero, it may not be reopened unless the Fund reopens.
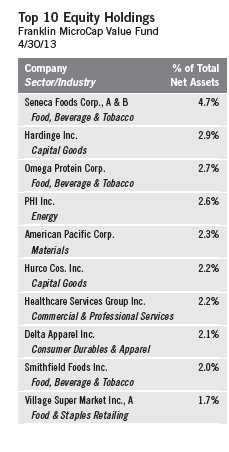
We identified seven new investment opportunities during the period under review: restaurant chain operator Ruby Tuesday, oil and gas drilling equipment provider Tesco, gaming company Full House Resorts, oil and gas drilling contractor Parker Drilling, oil and gas exploration and production company Magellan Petroleum, offshore oil and gas construction contractor Cal Dive International, and specialty insurance and reinsurance holding company American Safety Insurance Holdings. We also added to existing positions in cement maker and contractor Monarch Cement, fish meal and oil products producer Omega Protein, and bank holding company Penseco Financial Services, among others. Cash deployed into new and existing positions totaled $25.1 million during the period.
Portfolio sales over the semiannual period totaled $39.2 million. We liquidated positions in Bassett Furniture Industries, Destination XL Group (formerly Casual Male Retail Group), LCNB, Unifi, Tandy Brands Accessories, Coast Distribution System and Presidential Life, which was acquired by Athene Holdings. We reduced positions in Haverty Furniture, Saia and American Pacific, among others.
During the six months under review, contributors to absolute Fund performance included American Pacific (specialty chemicals), Saia (less than truckload carrier), the aforementioned Omega Protein, Haverty Furniture (furniture retailer) and Hardinge (machine tools). In contrast, detractors included PHI (helicopter transportation services), Delta Apparel (T-shirt manufacturer), Cobra Electronics (mobile communication products manufacturer), Healthcare Services Group (nursing, home housekeeping and food service) and ALCO Stores (general merchandise retailer).
Semiannual Report | 29
Thank you for your continued participation in Franklin MicroCap Value Fund.
We look forward to serving your future investment needs.


Bruce C. Baughman, CPA
Lead Portfolio Manager
William J. Lippman
Margaret McGee
Donald G. Taylor, CPA
Portfolio Management Team
Franklin MicroCap Value Fund
The foregoing information reflects our analysis, opinions and portfolio holdings as of April 30, 2013, the end of the
reporting period. The way we implement our main investment strategies and the resulting portfolio holdings may
change depending on factors such as market and economic conditions. These opinions may not be relied upon as
investment advice or an offer for a particular security. The information is not a complete analysis of every aspect
of any market, country, industry, security or the Fund. Statements of fact are from sources considered reliable, but
the investment manager makes no representation or warranty as to their completeness or accuracy. Although his-
torical performance is no guarantee of future results, these insights may help you understand our investment
management philosophy.
30 | Semiannual Report
Performance Summary as of 4/30/13
Franklin MicroCap Value Fund
Your dividend income will vary depending on dividends or interest paid by securities in the Fund’s
portfolio, adjusted for operating expenses of each class. Capital gain distributions are net profits
realized from the sale of portfolio securities. The performance table does not reflect any taxes that
a shareholder would pay on Fund dividends, capital gain distributions, if any, or any realized gains
on the sale of Fund shares. Total return reflects reinvestment of the Fund’s dividends and capital
gain distributions, if any, and any unrealized gains or losses.

Performance data represent past performance, which does not guarantee future results. Investment return and principal
value will fluctuate, and you may have a gain or loss when you sell your shares. Current performance may differ from
figures shown. For most recent month-end performance, go to franklintempleton.com or call (800) 342-5236.
Semiannual Report | 31
Performance Summary (continued)
Endnotes
All investments involve risks, including possible loss of principal. The Fund’s ability to invest in smaller company securities that may have
limited liquidity involves additional risks, such as relatively small revenues, limited product lines and small market share. Historically, these
stocks have exhibited greater price volatility than larger company stocks, especially over the short term. In addition, the Fund may invest up
to 25% of its total assets in foreign securities, which involve special risks, including currency fluctuations and economic and political uncer-
tainty. The Fund is actively managed but there is no guarantee that the manager’s investment decisions will produce the desired results. The
Fund’s prospectus also includes a description of the main investment risks.
Advisor Class: Shares are available to certain eligible investors as described in the prospectus.
1. Cumulative total return represents the change in value of an investment over the periods indicated.
2. Average annual total return represents the average annual change in value of an investment over the periods indicated. Six-month return has not
been annualized.
3. These figures represent the value of a hypothetical $10,000 investment in the Fund over the periods indicated.
4. In accordance with SEC rules, we provide standardized average annual total return information through the latest calendar quarter.
5. Figures are as stated in the Fund’s current prospectus. In periods of market volatility, assets may decline significantly, causing total annual Fund
operating expenses to become higher than the figures shown.
6. Effective 11/1/05, the Fund began offering Advisor Class shares, which do not have sales charges or a Rule 12b-1 plan. Performance quotations
for this class reflect the following methods of calculation: (a) For periods prior to 11/1/05, a restated figure is used based upon the Fund’s Class A
performance, excluding the effect of Class A’s maximum initial sales charge, but reflecting the effect of the Class A Rule 12b-1 fees; and (b) for peri-
ods after 11/1/05, actual Advisor Class performance is used reflecting all charges and fees applicable to that class. Since 11/1/05 (commencement
of sales), the cumulative and average annual total returns of Advisor Class shares were +78.08% and +8.01%.
32 | Semiannual Report
Your Fund’s Expenses
Franklin MicroCap Value Fund
As a Fund shareholder, you can incur two types of costs:
- Transaction costs, including sales charges (loads) on Fund purchases; and
- Ongoing Fund costs, including management fees, distribution and service (12b-1) fees, and other Fund expenses. All mutual funds have ongoing costs, sometimes referred to as operating expenses.
The following table shows ongoing costs of investing in the Fund and can help you understand these costs and compare them with those of other mutual funds. The table assumes a $1,000 investment held for the six months indicated.
Actual Fund Expenses
The first line (Actual) for each share class listed in the table provides actual account values and expenses. The “Ending Account Value” is derived from the Fund’s actual return, which includes the effect of Fund expenses.
You can estimate the expenses you paid during the period by following these steps. Of course, your account value and expenses will differ from those in this illustration:
| 1. | Divide your account value by $1,000. |
| | If an account had an $8,600 value, then $8,600 ÷ $1,000 = 8.6. |
| 2. | Multiply the result by the number under the heading “Expenses Paid During Period.” |
| | If Expenses Paid During Period were $7.50, then 8.6 x $7.50 = $64.50. |
In this illustration, the estimated expenses paid this period are $64.50.
Hypothetical Example for Comparison with Other Funds
Information in the second line (Hypothetical) for each class in the table can help you compare ongoing costs of investing in the Fund with those of other mutual funds. This information may not be used to estimate the actual ending account balance or expenses you paid during the period. The hypothetical “Ending Account Value” is based on the actual expense ratio for each class and an assumed 5% annual rate of return before expenses, which does not represent the Fund’s actual return. The figure under the heading “Expenses Paid During Period” shows the hypothetical expenses your account would have incurred under this scenario. You can compare this figure with the 5% hypothetical examples that appear in shareholder reports of other funds.
Semiannual Report | 33
Your Fund’s Expenses (continued)
Please note that expenses shown in the table are meant to highlight ongoing costs and do not reflect
any transaction costs, such as sales charges. Therefore, the second line for each class is useful in
comparing ongoing costs only, and will not help you compare total costs of owning different
funds. In addition, if transaction costs were included, your total costs would have been higher.
Please refer to the Fund prospectus for additional information on operating expenses.
34 | Semiannual Report
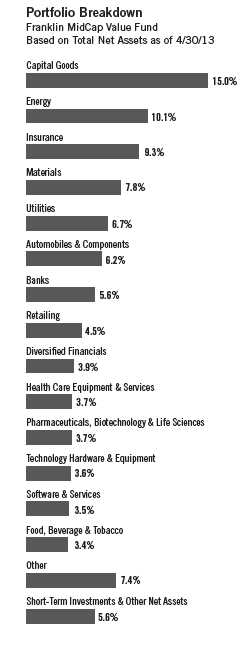
Franklin MidCap Value Fund
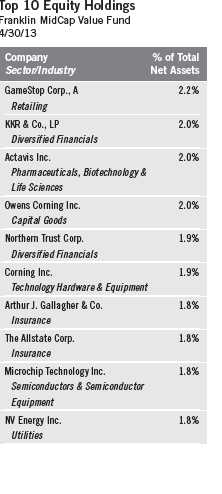
Your Fund’s Goal and Main Investments: Franklin MidCap Value Fund seeks long-term total return by investing at least 80% of net assets in securities of mid-capitalization companies that we believe are undervalued. We define mid-capitalization companies as those with market capitalizations that are similar in size at the time of purchase to those in the Russell Midcap® Index.1
This semiannual report for Franklin MidCap Value Fund covers the period ended April 30, 2013.
Performance Overview
Franklin MidCap Value Fund – Class A delivered a +16.33% cumulative total return for the six months under review. In comparison, the Russell Midcap® Value Index, which measures performance of those Russell Midcap® Index companies with lower price-to-book ratios and lower forecasted growth values, generated a +19.89% total return.2 Although this report covers a six-month period, our investment strategy aims for long-term results. You can find the Fund’s long-term performance data in the Performance Summary beginning on page 38.
Investment Strategy
Our goal is to invest in mid-capitalization companies that we determine are currently undervalued and have the potential for capital appreciation. The Fund purchases stocks that are out of favor in the market for reasons we believe will prove to be temporary in nature. In addition, the Fund may invest in companies with valuable intangibles we believe are not reflected in the stock price. This strategy is not aimed at short-term trading gains, nor do we consider the composition of any index. Rather, we try to identify attractively priced, financially sound companies that meet our investment criteria, and we assume at purchase that we will hold the positions for several years.
1. The Russell Midcap® Index is market capitalization weighted and measures performance of the smallest companies in the Russell 1000® Index, which represent a modest amount of the Russell 1000® Index’s total market capitalization.
2. Source: © 2013 Morningstar. All Rights Reserved. The information contained herein: (1) is proprietary to Morningstar and/or its content providers; (2) may not be copied or distributed; and (3) is not warranted to be accurate, complete or timely. Neither Morningstar nor its content providers are responsible for any damages or losses arising from any use of this information. The index is unmanaged and includes reinvested dividends. One cannot invest directly in an index, and an index is not representative of the Fund’s portfolio.
The dollar value, number of shares or principal amount, and names of all portfolio holdings are listed in the Fund’s Statement of Investments (SOI). The SOI begins on page 81.
Semiannual Report | 35
Manager’s Discussion
During the six months under review, contributors to absolute Fund performance included video game retailer GameStop, private equity investment group KKR & Co., defense and intelligence solutions provider SAIC and auto safety systems company Autoliv.
In contrast, detractors included coal producer Peabody Energy, cable television provider Time Warner Cable, discount retailer Family Dollar Stores and savings bank Hudson City Bancorp.
During the reporting period, the Fund initiated one new position in specialty glass and ceramics manufacturer Corning. Consistent with our value strategy, we added to existing positions in Nucor, Bunge and Peabody Energy, among others. We liquidated our positions in Old Republic International, Teekay, McCormick & Co. and Gardner Denver, which was subject to an all cash takeover offer from KKR. We also reduced our positions in JB Hunt Transport Services, Rockwell Automation and Hasbro, among others.
36 | Semiannual Report
Thank you for your continued participation in Franklin MidCap Value Fund.
We look forward to serving your future investment needs.

Bruce C. Baughman, CPA
William J. Lippman
Margaret McGee
Donald G. Taylor, CPA
Portfolio Management Team
Franklin MidCap Value Fund
CFA® is a trademark owned by CFA Institute.
The foregoing information reflects our analysis, opinions and portfolio holdings as of April 30, 2013, the end of the
reporting period. The way we implement our main investment strategies and the resulting portfolio holdings may
change depending on factors such as market and economic conditions. These opinions may not be relied upon as
investment advice or an offer for a particular security. The information is not a complete analysis of every aspect
of any market, country, industry, security or the Fund. Statements of fact are from sources considered reliable, but
the investment manager makes no representation or warranty as to their completeness or accuracy. Although his-
torical performance is no guarantee of future results, these insights may help you understand our investment
management philosophy.
Semiannual Report | 37
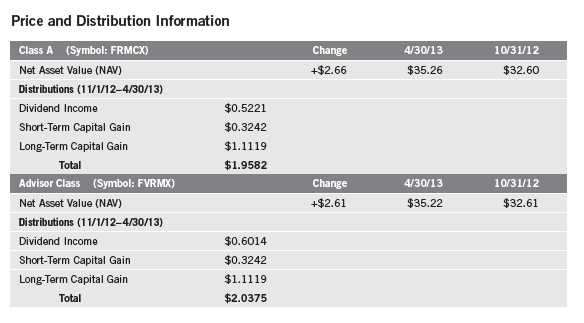
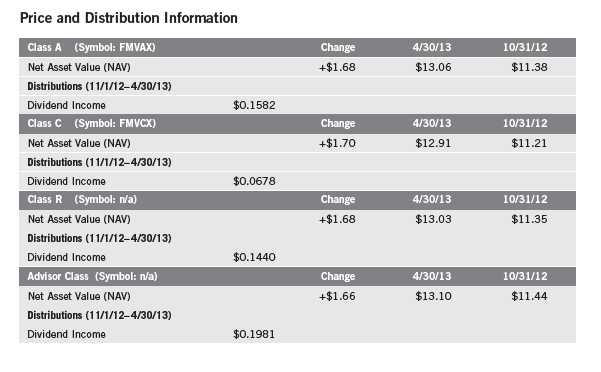
Performance Summary as of 4/30/13
Franklin MidCap Value Fund
Your dividend income will vary depending on dividends or interest paid by securities in the Fund’s
portfolio, adjusted for operating expenses of each class. Capital gain distributions are net profits
realized from the sale of portfolio securities. The performance table does not reflect any taxes that
a shareholder would pay on Fund dividends, capital gain distributions, if any, or any realized gains
on the sale of Fund shares. Total return reflects reinvestment of the Fund’s dividends and capital
gain distributions, if any, and any unrealized gains or losses.
38 | Semiannual Report
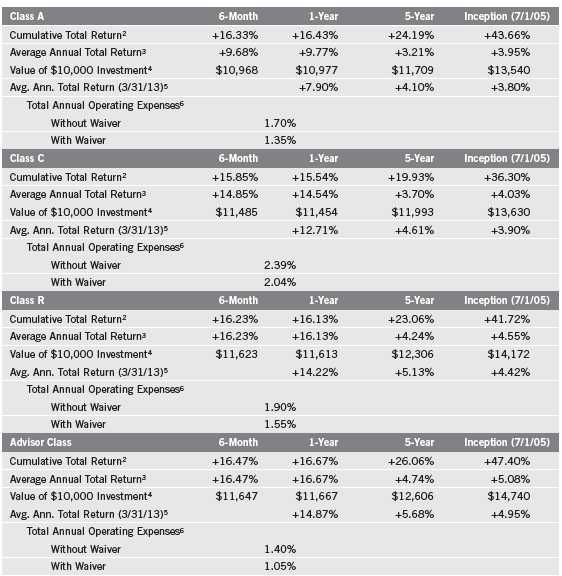
Performance Summary (continued)
Performance1
Cumulative total return excludes sales charges. Average annual total returns and value of $10,000 investment include
maximum sales charges. Class A: 5.75% maximum initial sales charge; Class C: 1% contingent deferred sales charge
in first year only; Class R/Advisor Class: no sales charges.
Performance data represent past performance, which does not guarantee future results. Investment return and principal
value will fluctuate, and you may have a gain or loss when you sell your shares. Current performance may differ from
figures shown. For most recent month-end performance, go to franklintempleton.com or call (800) 342-5236.
The investment manager and administrator have contractually agreed to waive or assume certain expenses so that common
expenses (excluding Rule 12b-1 fees and acquired fund fees and expenses) for each class of the Fund do not exceed
1.05% (other than certain nonroutine expenses) until 2/28/14.
Semiannual Report | 39
Performance Summary (continued)
Endnotes
All investments involve risks, including possible loss of principal. Stock prices fluctuate, sometimes rapidly and dramatically, due to factors affecting individual companies, particular industries or sectors, or general market conditions. Historically, midsize company securities have been more volatile in price than larger company securities, especially over the short term. Midsize companies may be more susceptible to particular economic events or competitive factors than are larger, more broadly diversified companies. In addition, the Fund may invest up to 25% of its total assets in foreign securities, which involve special risks, including currency fluctuations and economic and political uncertainty. The Fund is actively managed but there is no guarantee that the manager’s investment decisions will produce the desired results. The Fund’s prospectus also includes a description of the main investment risks.
| |
Class C: Class R: | These shares have higher annual fees and expenses than Class A shares. Shares are available to certain eligible investors as described in the prospectus. These shares have higher annual fees and expenses than Class A shares. |
Advisor Class: | Shares are available to certain eligible investors as described in the prospectus. |
1. Fund investment results reflect the expense reduction, without which the results would have been lower.
2. Cumulative total return represents the change in value of an investment over the periods indicated.
3. Average annual total return represents the average annual change in value of an investment over the periods indicated. Six-month return has not
been annualized.
4. These figures represent the value of a hypothetical $10,000 investment in the Fund over the periods indicated.
5. In accordance with SEC rules, we provide standardized average annual total return information through the latest calendar quarter.
6. Figures are as stated in the Fund’s current prospectus. In periods of market volatility, assets may decline significantly, causing total annual Fund
operating expenses to become higher than the figures shown.
40 | Semiannual Report
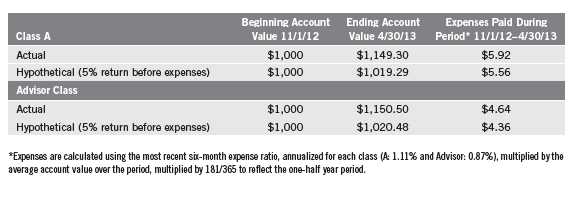
Your Fund’s Expenses
Franklin MidCap Value Fund
As a Fund shareholder, you can incur two types of costs:
- Transaction costs, including sales charges (loads) on Fund purchases; and
- Ongoing Fund costs, including management fees, distribution and service (12b-1) fees, and other Fund expenses. All mutual funds have ongoing costs, sometimes referred to as operating expenses.
The following table shows ongoing costs of investing in the Fund and can help you understand these costs and compare them with those of other mutual funds. The table assumes a $1,000 investment held for the six months indicated.
Actual Fund Expenses
The first line (Actual) for each share class listed in the table provides actual account values and expenses. The “Ending Account Value” is derived from the Fund’s actual return, which includes the effect of Fund expenses.
You can estimate the expenses you paid during the period by following these steps. Of course, your account value and expenses will differ from those in this illustration:
| 1. | Divide your account value by $1,000. |
| | If an account had an $8,600 value, then $8,600 ÷ $1,000 = 8.6. |
| 2. | Multiply the result by the number under the heading “Expenses Paid During Period.” |
| | If Expenses Paid During Period were $7.50, then 8.6 x $7.50 = $64.50. |
In this illustration, the estimated expenses paid this period are $64.50.
Hypothetical Example for Comparison with Other Funds
Information in the second line (Hypothetical) for each class in the table can help you compare ongoing costs of investing in the Fund with those of other mutual funds. This information may not be used to estimate the actual ending account balance or expenses you paid during the period. The hypothetical “Ending Account Value” is based on the actual expense ratio for each class and an assumed 5% annual rate of return before expenses, which does not represent the Fund’s actual return. The figure under the heading “Expenses Paid During Period” shows the hypothetical expenses your account would have incurred under this scenario. You can compare this figure with the 5% hypothetical examples that appear in shareholder reports of other funds.
Semiannual Report | 41
Your Fund’s Expenses (continued)
Please note that expenses shown in the table are meant to highlight ongoing costs and do not reflect
any transaction costs, such as sales charges. Therefore, the second line for each class is useful in
comparing ongoing costs only, and will not help you compare total costs of owning different
funds. In addition, if transaction costs were included, your total costs would have been higher.
Please refer to the Fund prospectus for additional information on operating expenses.

42 | Semiannual Report
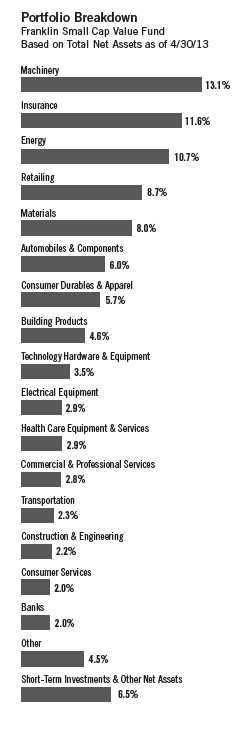
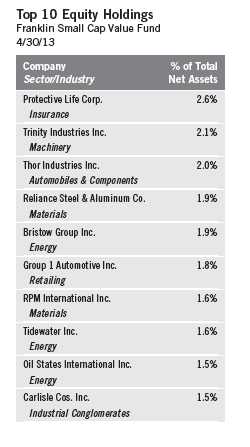
Franklin Small Cap Value Fund
Your Fund’s Goal and Main Investments: Franklin Small Cap Value Fund seeks long-term total return by investing at least 80% of net assets in securities of small-capitalization companies that we believe are undervalued. We define small-capitalization companies as those with market capitalizations less than $3.5 billion at the time of purchase.

This semiannual report for Franklin Small Cap Value Fund covers the period ended April 30, 2013.
Performance Overview
Franklin Small Cap Value Fund – Class A delivered a +16.52% cumulative total return for the six months under review. In comparison, the Russell 2500™ Value Index, which measures performance of those Russell 2500™ Index companies with lower price-to-book ratios and lower forecasted growth values, generated a total return of +18.83%.1 Although this report covers a six-month period, our investment strategy aims for long-term results. You can find the Fund’s long-term performance data in the Performance Summary beginning on page 46.
Investment Strategy
We seek to invest in small-capitalization companies that we believe are selling below their underlying worth and hold them until they reach what we consider their fair market value. We seek a diversified portfolio of fundamentally sound companies purchased at attractive prices, often when they are out of favor with other investors. Portfolio securities are selected without regard to benchmark comparisons and are based on fundamental, bottom-up research focusing on several criteria, such as low price relative to earnings, book value or cash flow. We also consider stocks with recent sharp price declines that we believe still have significant growth potential or that possess valuable intangibles not reflected in the stock price.
1. Source: © 2013 Morningstar. All Rights Reserved. The information contained herein: (1) is proprietary to Morningstar
and/or its content providers; (2) may not be copied or distributed; and (3) is not warranted to be accurate, complete or
timely. Neither Morningstar nor its content providers are responsible for any damages or losses arising from any use of
this information. The index is unmanaged and includes reinvested dividends. One cannot invest directly in an index, and
an index is not representative of the Fund’s portfolio.
The dollar value, number of shares or principal amount, and names of all portfolio holdings are listed in the Fund’s
Statement of Investments (SOI). The SOI begins on page 88.
Semiannual Report | 43
Manager’s Discussion
During the six months under review, contributors to absolute Fund performance included railcar manufacturer Trinity Industries, video game retailer GameStop, auto components supplier Autoliv, insurer Protective Life and helicopter transportation provider for the offshore energy industry, Bristow Group.
In contrast, detractors from performance included flexible circuit materials manufacturer Multi-Fineline Electronix, civil construction and transportation contractor Granite Construction, women’s fashion and accessories retailer Cato, brand marketing consultant Schawk and building products manufacturer Simpson Manufacturing.
During the reporting period, the Fund initiated new positions in audio and infotainment manufacturer Harman International Industries, men’s clothing designer and retailer Jos. A. Bank Clothiers, auto service and retail chain Pep Boys – Manny, Moe & Jack, and insurer Assurant. We also added to our positions in several holdings, including business-to-business rental provider McGrath RentCorp, insurer StanCorp Financial Group, and specialty chemicals and materials company Cabot, among others. We liquidated our positions in Graco, American Woodmark, Lancaster Colony and a few other holdings, and Gardner Denver, which was subject to an all cash takeover offer from KKR. We reduced our positions in several securities including Protective Life, Pier 1 Imports, Ingram Micro, Mueller Industries and Autoliv, among others.
44 | Semiannual Report
Thank you for your continued participation in Franklin Small Cap Value
Fund. We look forward to serving your future investment needs.

Bruce C. Baughman, CPA
Margaret McGee
Donald G. Taylor, CPA
Portfolio Management Team
Franklin Small Cap Value Fund
The foregoing information reflects our analysis, opinions and portfolio holdings as of April 30, 2013, the end of the
reporting period. The way we implement our main investment strategies and the resulting portfolio holdings may
change depending on factors such as market and economic conditions. These opinions may not be relied upon as
investment advice or an offer for a particular security. The information is not a complete analysis of every aspect of
any market, country, industry, security or the Fund. Statements of fact are from sources considered reliable, but the
investment manager makes no representation or warranty as to their completeness or accuracy. Although historical
performance is no guarantee of future results, these insights may help you understand our investment management
philosophy.
Semiannual Report | 45
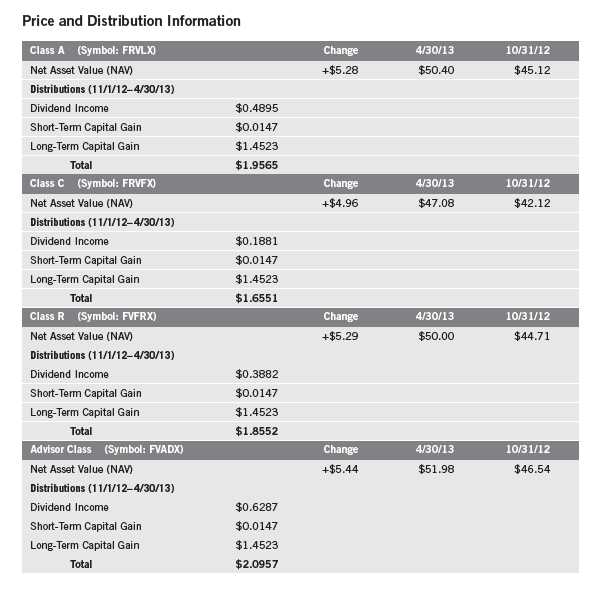
Performance Summary as of 4/30/13
Franklin Small Cap Value Fund
Your dividend income will vary depending on dividends or interest paid by securities in the Fund’s
portfolio, adjusted for operating expenses of each class. Capital gain distributions are net profits
realized from the sale of portfolio securities. The performance table does not reflect any taxes that
a shareholder would pay on Fund dividends, capital gain distributions, if any, or any realized gains
on the sale of Fund shares. Total return reflects reinvestment of the Fund’s dividends and capital
gain distributions, if any, and any unrealized gains or losses.
46 | Semiannual Report
Performance Summary (continued)
Performance
Cumulative total return excludes sales charges. Average annual total returns and value of $10,000 investment include
maximum sales charges. Class A: 5.75% maximum initial sales charge; Class C: 1% contingent deferred sales charge in
first year only; Class R/Advisor Class: no sales charges.
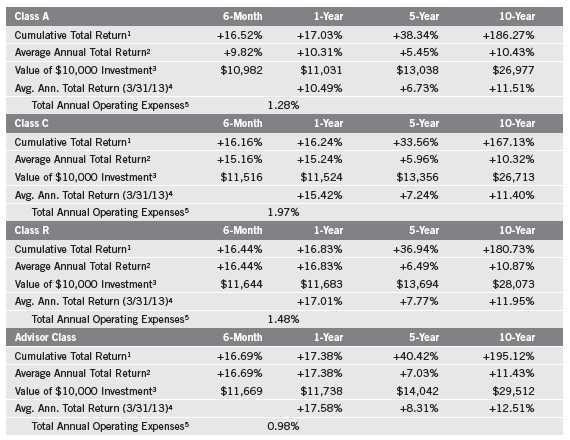
Performance data represent past performance, which does not guarantee future results. Investment return and principal
value will fluctuate, and you may have a gain or loss when you sell your shares. Current performance may differ from
figures shown. For most recent month-end performance, go to franklintempleton.com or call (800) 342-5236.
Semiannual Report | 47
Performance Summary (continued)
Endnotes
All investments involve risks, including possible loss of principal. The Fund’s investments in smaller company stocks carry special risks as such stocks have historically exhibited greater price volatility than larger company stocks, particularly over the short term. Additionally, smaller companies often have relatively small revenues, limited product lines and small market share. In addition, the Fund may invest up to 25% of its total assets in foreign securities, which involve special risks, including currency fluctuations and economic and political uncertainty. The Fund is actively managed but there is no guarantee that the manager’s investment decisions will produce the desired results. The Fund’s prospectus also includes a description of the main investment risks.
| |
Class C: | Prior to 1/1/04, these shares were offered with an initial sales charge; thus actual total returns would have differed. These shares have higher annual fees and expenses than Class A shares. |
| |
Class R: | Shares are available to certain eligible investors as described in the prospectus. These shares have higher annual fees and expenses than Class A shares. |
| |
Advisor Class: | Shares are available to certain eligible investors as described in the prospectus. |
1. Cumulative total return represents the change in value of an investment over the periods indicated.
2. Average annual total return represents the average annual change in value of an investment over the periods indicated. Six-month return has not
been annualized.
3. These figures represent the value of a hypothetical $10,000 investment in the Fund over the periods indicated.
4. In accordance with SEC rules, we provide standardized average annual total return information through the latest calendar quarter.
5. Figures are as stated in the Fund’s current prospectus. In periods of market volatility, assets may decline significantly, causing total annual Fund
operating expenses to become higher than the figures shown.
48 | Semiannual Report
Your Fund’s Expenses
Franklin Small Cap Value Fund
As a Fund shareholder, you can incur two types of costs:
- Transaction costs, including sales charges (loads) on Fund purchases; and
- Ongoing Fund costs, including management fees, distribution and service (12b-1) fees, and other Fund expenses. All mutual funds have ongoing costs, sometimes referred to as operating expenses.
The following table shows ongoing costs of investing in the Fund and can help you understand these costs and compare them with those of other mutual funds. The table assumes a $1,000 investment held for the six months indicated.
Actual Fund Expenses
The first line (Actual) for each share class listed in the table provides actual account values and expenses. The “Ending Account Value” is derived from the Fund’s actual return, which includes the effect of Fund expenses.
You can estimate the expenses you paid during the period by following these steps. Of course, your account value and expenses will differ from those in this illustration:
| 1. | Divide your account value by $1,000. |
| | If an account had an $8,600 value, then $8,600 ÷ $1,000 = 8.6. |
| 2. | Multiply the result by the number under the heading “Expenses Paid During Period.” |
| | If Expenses Paid During Period were $7.50, then 8.6 x $7.50 = $64.50. |
In this illustration, the estimated expenses paid this period are $64.50.
Hypothetical Example for Comparison with Other Funds
Information in the second line (Hypothetical) for each class in the table can help you compare ongoing costs of investing in the Fund with those of other mutual funds. This information may not be used to estimate the actual ending account balance or expenses you paid during the period. The hypothetical “Ending Account Value” is based on the actual expense ratio for each class and an assumed 5% annual rate of return before expenses, which does not represent the Fund’s actual return. The figure under the heading “Expenses Paid During Period” shows the hypothetical expenses your account would have incurred under this scenario. You can compare this figure with the 5% hypothetical examples that appear in shareholder reports of other funds.
Semiannual Report | 49
Your Fund’s Expenses (continued)
Please note that expenses shown in the table are meant to highlight ongoing costs and do not reflect
any transaction costs, such as sales charges. Therefore, the second line for each class is useful in
comparing ongoing costs only, and will not help you compare total costs of owning different
funds. In addition, if transaction costs were included, your total costs would have been higher.
Please refer to the Fund prospectus for additional information on operating expenses.
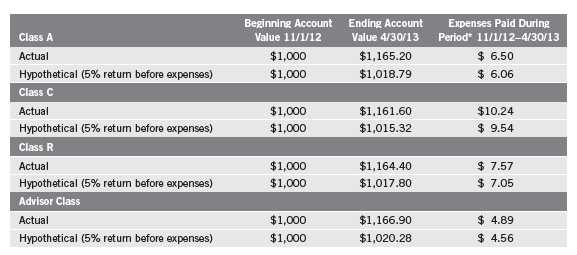
*Expenses are calculated using the most recent six-month expense ratio, annualized for each class (A: 1.21%; C: 1.91%; R: 1.41%; and
Advisor: 0.91%), multiplied by the average account value over the period, multiplied by 181/365 to reflect the one-half year period.
50 | Semiannual Report
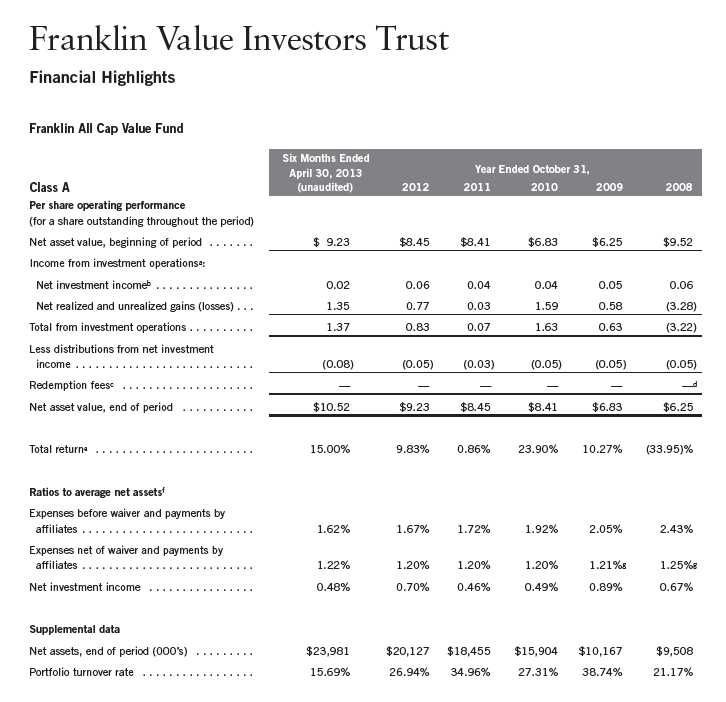
aThe amount shown for a share outstanding throughout the period may not correlate with the Statement of Operations for the period due to the timing of sales and repurchases of
the Fund shares in relation to income earned and/or fluctuating market value of the investments of the Fund.
bBased on average daily shares outstanding.
cEffective September 1, 2008, the redemption fee was eliminated.
dAmount rounds to less than $0.01 per share.
eTotal return does not reflect sales commissions or contingent deferred sales charges, if applicable, and is not annualized for periods less than one year.
fRatios are annualized for periods less than one year.
gBenefit of expense reduction rounds to less than 0.01%.
Semiannual Report | The accompanying notes are an integral part of these financial statements. | 51
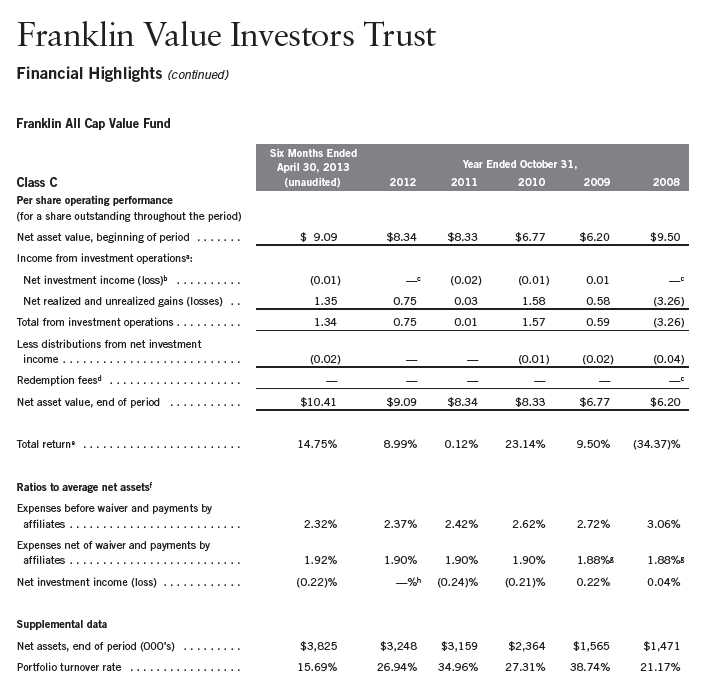
aThe amount shown for a share outstanding throughout the period may not correlate with the Statement of Operations for the period due to the timing of sales and repurchases of
the Fund shares in relation to income earned and/or fluctuating market value of the investments of the Fund.
bBased on average daily shares outstanding.
cAmount rounds to less than $0.01 per share.
dEffective September 1, 2008, the redemption fee was eliminated.
eTotal return does not reflect sales commissions or contingent deferred sales charges, if applicable, and is not annualized for periods less than one year.
fRatios are annualized for periods less than one year.
gBenefit of expense reduction rounds to less than 0.01%.
hRounds to less than 0.01%.
52 | The accompanying notes are an integral part of these financial statements. | Semiannual Report
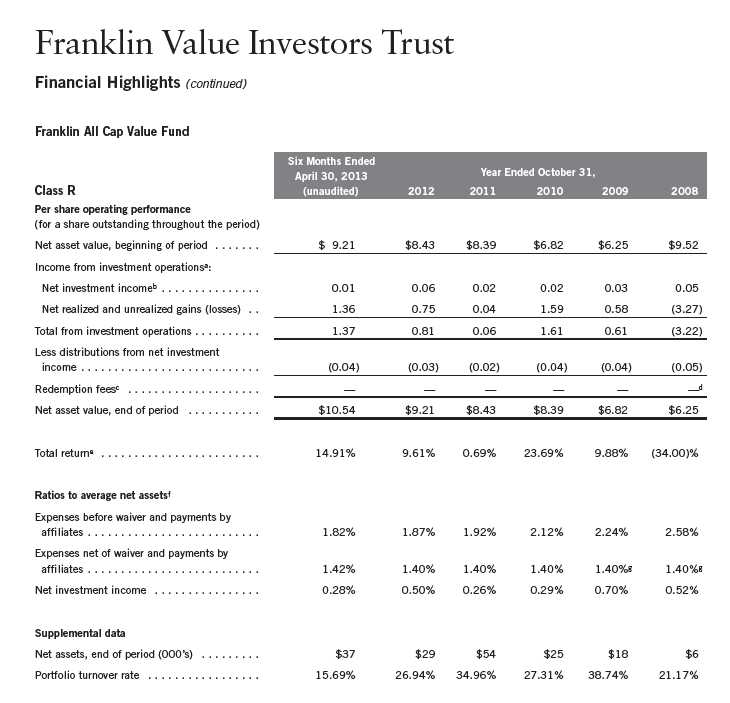
aThe amount shown for a share outstanding throughout the period may not correlate with the Statement of Operations for the period due to the timing of sales and repurchases of
the Fund shares in relation to income earned and/or fluctuating market value of the investments of the Fund.
bBased on average daily shares outstanding.
cEffective September 1, 2008, the redemption fee was eliminated.
dAmount rounds to less than $0.01 per share.
eTotal return does not reflect sales commissions or contingent deferred sales charges, if applicable, and is not annualized for periods less than one year.
fRatios are annualized for periods less than one year.
gBenefit of expense reduction rounds to less than 0.01%.
Semiannual Report | The accompanying notes are an integral part of these financial statements. | 53
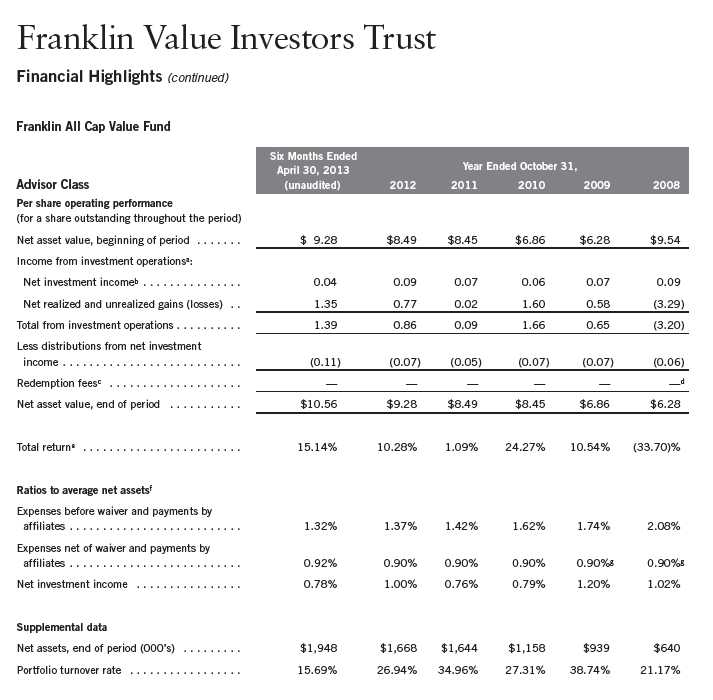
aThe amount shown for a share outstanding throughout the period may not correlate with the Statement of Operations for the period due to the timing of sales and repurchases of
the Fund shares in relation to income earned and/or fluctuating market value of the investments of the Fund.
bBased on average daily shares outstanding.
cEffective September 1, 2008, the redemption fee was eliminated.
dAmount rounds to less than $0.01 per share.
eTotal return is not annualized for periods less than one year.
fRatios are annualized for periods less than one year.
gBenefit of expense reduction rounds to less than 0.01%.
54 | The accompanying notes are an integral part of these financial statements. | Semiannual Report
Franklin Value Investors Trust
Statement of Investments, April 30, 2013 (unaudited)
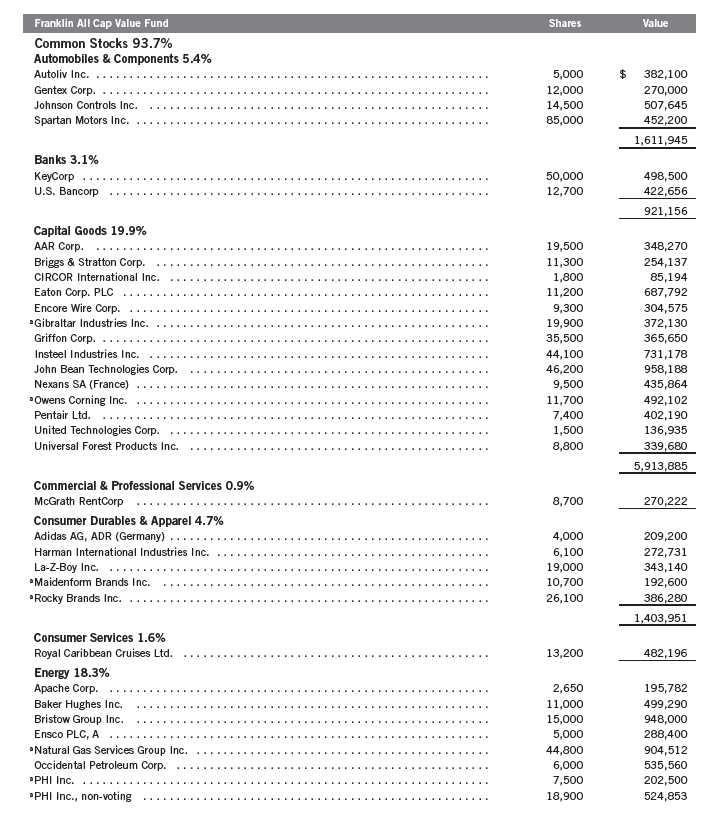
Semiannual Report | 55
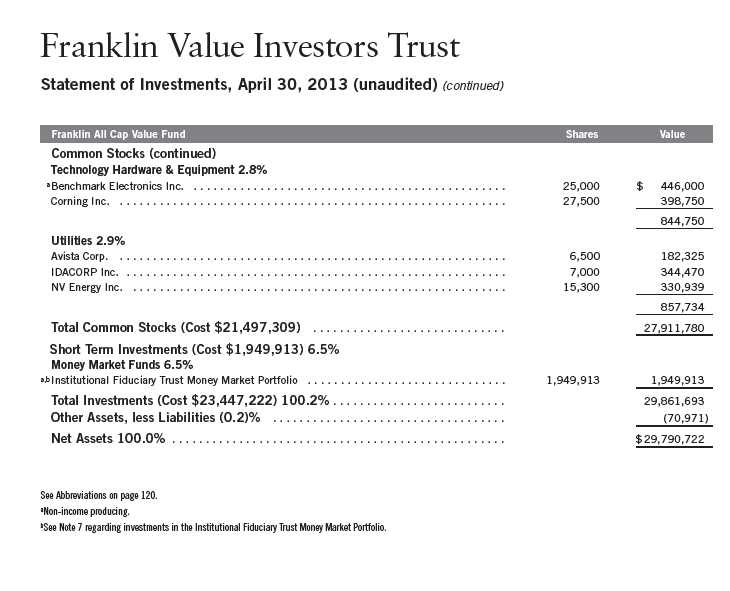
Franklin Value Investors Trust
Statement of Investments, April 30, 2013 (unaudited) (continued)

56 | Semiannual Report
Semiannual Report | The accompanying notes are an integral part of these financial statements. | 57
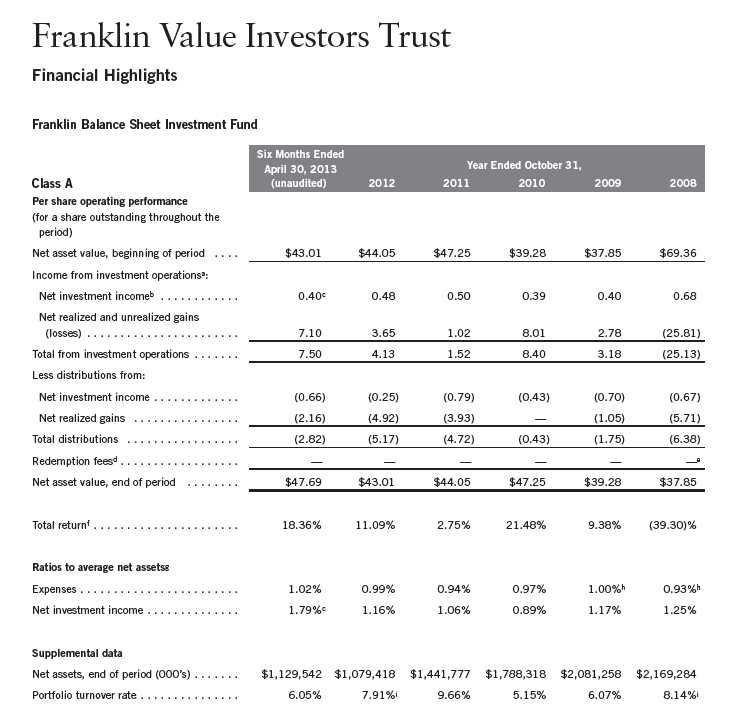
aThe amount shown for a share outstanding throughout the period may not correlate with the Statement of Operations for the period due to the timing of sales and repurchases of
the Fund shares in relation to income earned and/or fluctuating market value of the investments of the Fund.
bBased on average daily shares outstanding.
cNet investment income per share includes approximately $0.13 per share received in the form of special dividends. Excluding these amounts, the ratio of net investment income to
average net assets would have been 1.19%.
dEffective September 1, 2008, the redemption fee was eliminated.
eAmount rounds to less than $0.01 per share.
fTotal return does not reflect sales commissions or contingent deferred sales charges, if applicable, and is not annualized for periods less than one year.
gRatios are annualized for periods less than one year.
hBenefit of expense reduction rounds to less than 0.01%.
iExcludes the value of portfolio securities delivered as a result of redemptions in-kind.
58 | The accompanying notes are an integral part of these financial statements. | Semiannual Report
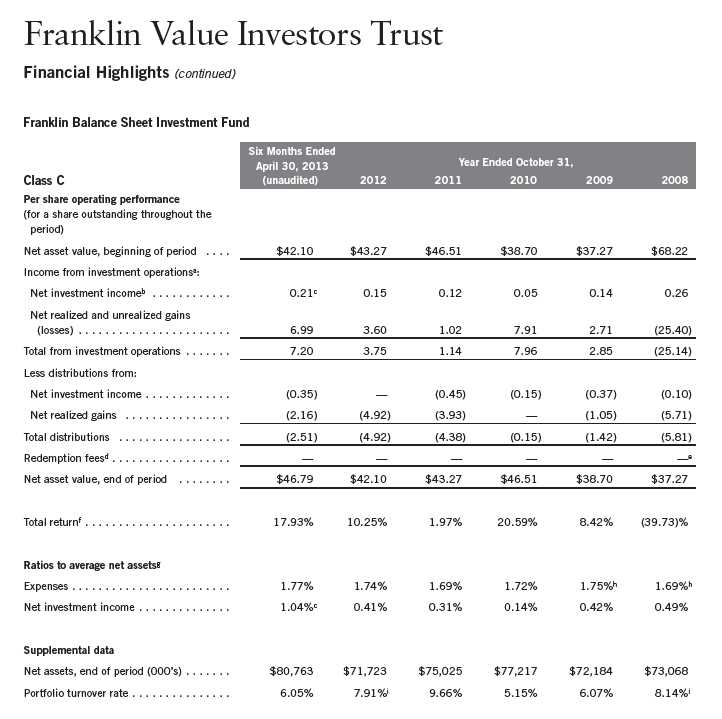
aThe amount shown for a share outstanding throughout the period may not correlate with the Statement of Operations for the period due to the timing of sales and repurchases of
the Fund shares in relation to income earned and/or fluctuating market value of the investments of the Fund.
bBased on average daily shares outstanding.
cNet investment income per share includes approximately $0.13 per share received in the form of special dividends. Excluding these amounts, the ratio of net investment income to
average net assets would have been 0.44%.
dEffective September 1, 2008, the redemption fee was eliminated.
eAmount rounds to less than $0.01 per share.
fTotal return does not reflect sales commissions or contingent deferred sales charges, if applicable, and is not annualized for periods less than one year.
gRatios are annualized for periods less than one year.
hBenefit of expense reduction rounds to less than 0.01%.
iExcludes the value of portfolio securities delivered as a result of redemptions in-kind.
Semiannual Report | The accompanying notes are an integral part of these financial statements. | 59
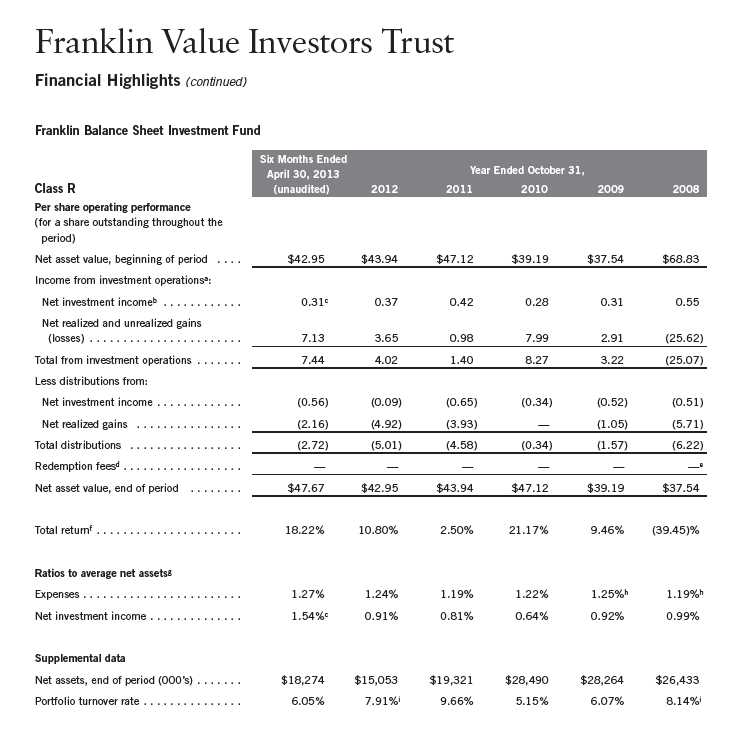
aThe amount shown for a share outstanding throughout the period may not correlate with the Statement of Operations for the period due to the timing of sales and repurchases of
the Fund shares in relation to income earned and/or fluctuating market value of the investments of the Fund.
bBased on average daily shares outstanding.
cNet investment income per share includes approximately $0.13 per share received in the form of special dividends. Excluding these amounts, the ratio of net investment income to
average net assets would have been 0.94%.
dEffective September 1, 2008, the redemption fee was eliminated.
eAmount rounds to less than $0.01 per share.
fTotal return does not reflect sales commissions or contingent deferred sales charges, if applicable, and is not annualized for periods less than one year.
gRatios are annualized for periods less than one year.
hBenefit of expense reduction rounds to less than 0.01%.
iExcludes the value of portfolio securities delivered as a result of redemptions in-kind.
60 | The accompanying notes are an integral part of these financial statements. | Semiannual Report
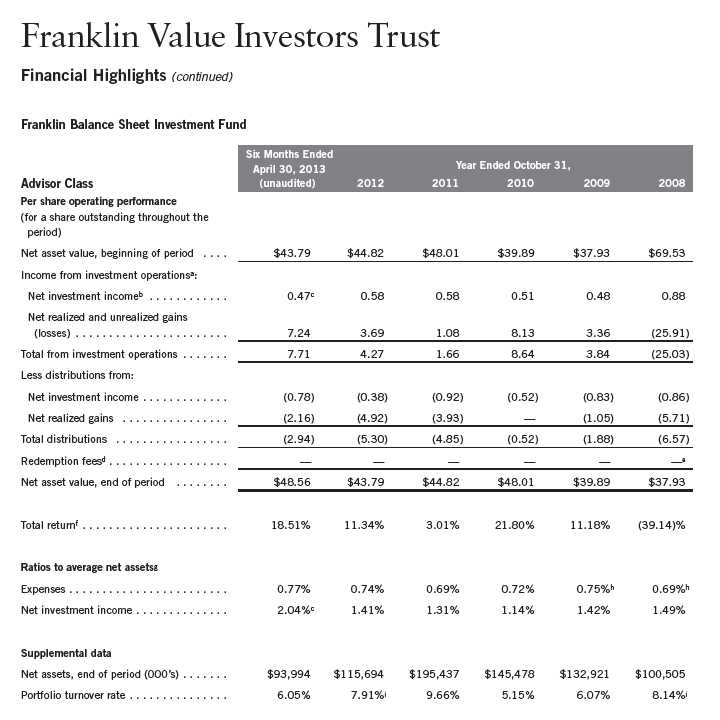
aThe amount shown for a share outstanding throughout the period may not correlate with the Statement of Operations for the period due to the timing of sales and repurchases of
the Fund shares in relation to income earned and/or fluctuating market value of the investments of the Fund.
bBased on average daily shares outstanding.
cNet investment income per share includes approximately $0.13 per share received in the form of special dividends. Excluding these amounts, the ratio of net investment income to
average net assets would have been 1.44%.
dEffective September 1, 2008, the redemption fee was eliminated.
eAmount rounds to less than $0.01 per share.
fTotal return is not annualized for periods less than one year.
gRatios are annualized for periods less than one year.
hBenefit of expense reduction rounds to less than 0.01%.
iExcludes the value of portfolio securities delivered as a result of redemptions in-kind.
Semiannual Report | The accompanying notes are an integral part of these financial statements. | 61
Franklin Value Investors Trust
Statement of Investments, April 30, 2013 (unaudited)
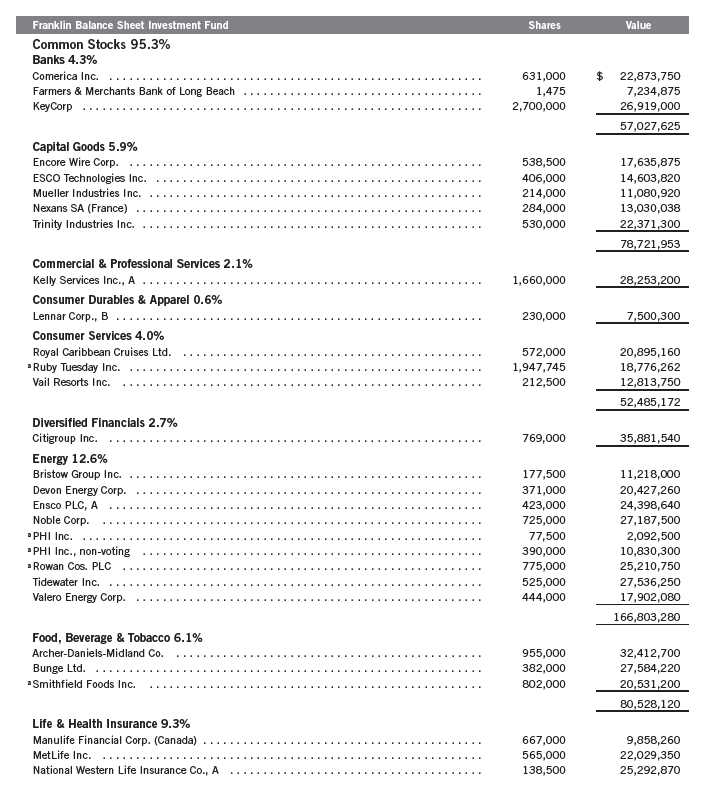
62 | Semiannual Report

Semiannual Report | 63

aNon-income producing.
bSee Note 9 regarding holdings of 5% voting securities.
cSecurity was purchased pursuant to Rule 144A under the Securities Act of 1933 and may be sold in transactions exempt from registration only to qualified institutional buyers or in
a public offering registered under the Securities Act of 1933. This security has been deemed liquid under guidelines approved by the Trust’s Board of Trustees. At April 30, 2013, the
value of this security was $2,520,000, representing 0.19% of net assets.
dSee Note 7 regarding investments in the Institutional Fiduciary Trust Money Market Portfolio.
64 | The accompanying notes are an integral part of these financial statements. | Semiannual Report

aThe amount shown for a share outstanding throughout the period may not correlate with the Statement of Operations for the period due to the timing of sales and repurchases of
the Fund shares in relation to income earned and/or fluctuating market value of the investments of the Fund.
bBased on average daily shares outstanding.
cEffective September 1, 2008, the redemption fee was eliminated.
dAmount rounds to less than $0.01 per share.
eTotal return does not reflect sales commissions or contingent deferred sales charges, if applicable, and is not annualized for periods less than one year.
fRatios are annualized for periods less than one year.
gBenefit of expense reduction rounds to less than 0.01%.
Semiannual Report | The accompanying notes are an integral part of these financial statements. | 65
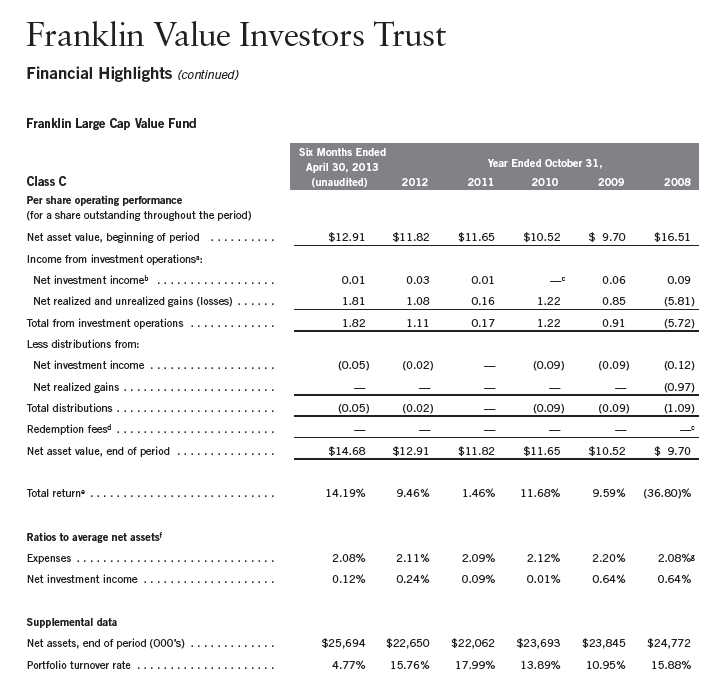
aThe amount shown for a share outstanding throughout the period may not correlate with the Statement of Operations for the period due to the timing of sales and repurchases of
the Fund shares in relation to income earned and/or fluctuating market value of the investments of the Fund.
bBased on average daily shares outstanding.
cAmount rounds to less than $0.01 per share.
dEffective September 1, 2008, the redemption fee was eliminated.
eTotal return does not reflect sales commissions or contingent deferred sales charges, if applicable, and is not annualized for periods less than one year.
fRatios are annualized for periods less than one year.
gBenefit of expense reduction rounds to less than 0.01%.
66 | The accompanying notes are an integral part of these financial statements. | Semiannual Report

aThe amount shown for a share outstanding throughout the period may not correlate with the Statement of Operations for the period due to the timing of sales and repurchases of
the Fund shares in relation to income earned and/or fluctuating market value of the investments of the Fund.
bBased on average daily shares outstanding.
cEffective September 1, 2008, the redemption fee was eliminated.
dAmount rounds to less than $0.01 per share.
eTotal return does not reflect sales commissions or contingent deferred sales charges, if applicable, and is not annualized for periods less than one year.
fRatios are annualized for periods less than one year.
gBenefit of expense reduction rounds to less than 0.01%.
Semiannual Report | The accompanying notes are an integral part of these financial statements. | 67
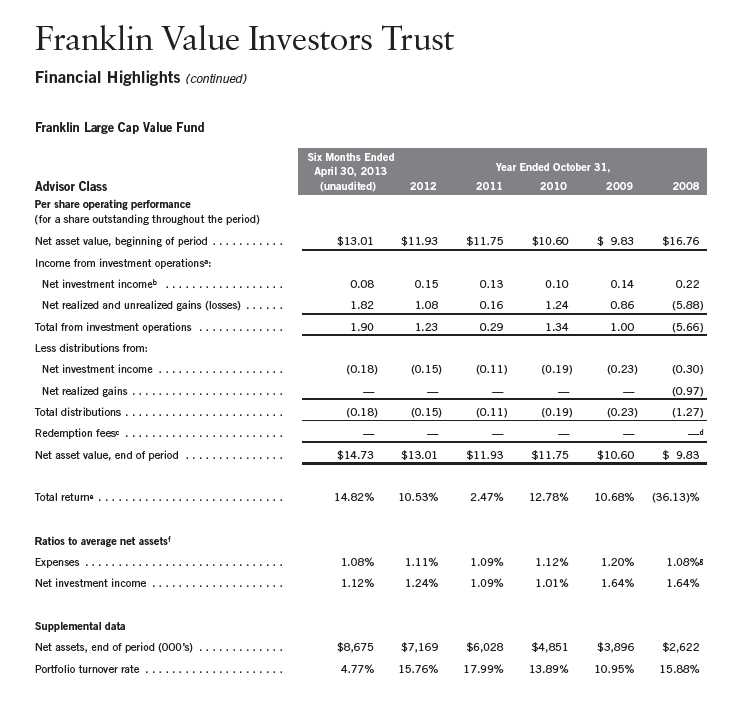
aThe amount shown for a share outstanding throughout the period may not correlate with the Statement of Operations for the period due to the timing of sales and repurchases of
the Fund shares in relation to income earned and/or fluctuating market value of the investments of the Fund.
bBased on average daily shares outstanding.
cEffective September 1, 2008, the redemption fee was eliminated.
dAmount rounds to less than $0.01 per share.
eTotal return is not annualized for periods less than one year.
fRatios are annualized for periods less than one year.
gBenefit of expense reduction rounds to less than 0.01%.
68 | The accompanying notes are an integral part of these financial statements. | Semiannual Report
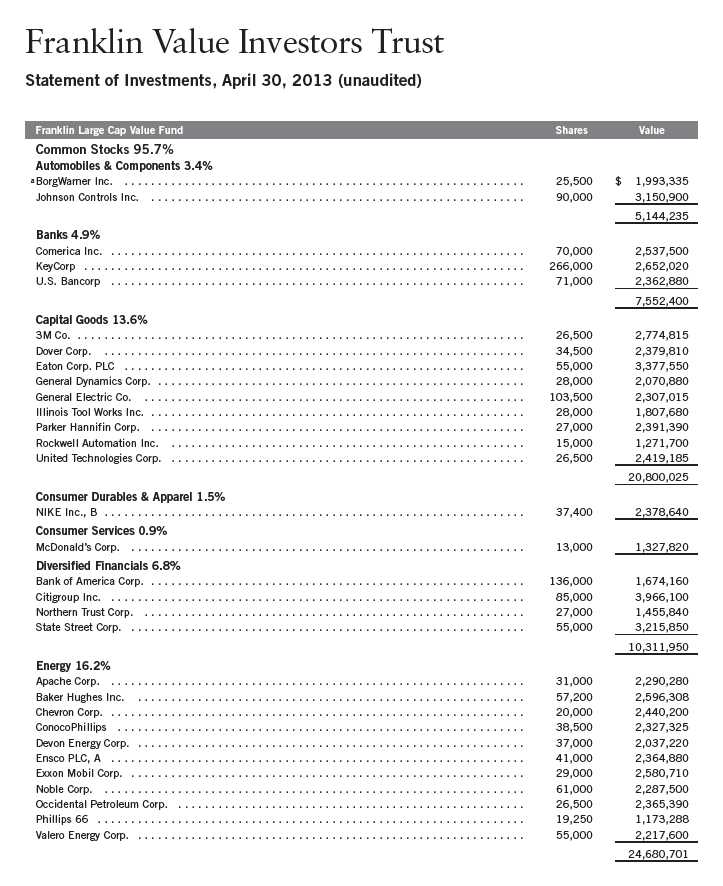
Semiannual Report | 69
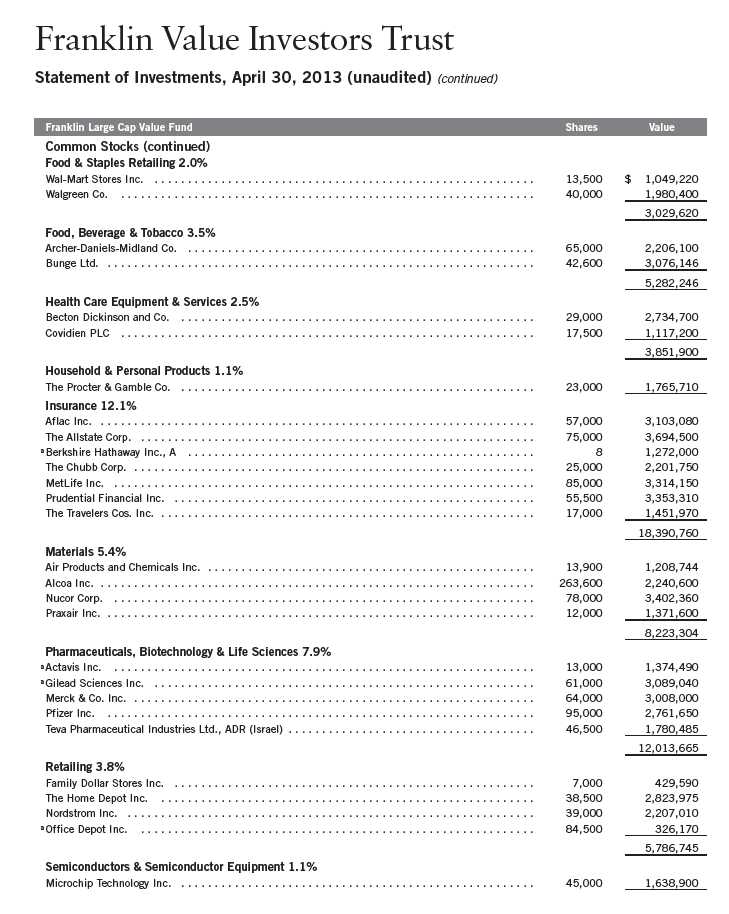
70 | Semiannual Report

Semiannual Report | The accompanying notes are an integral part of these financial statements. | 71
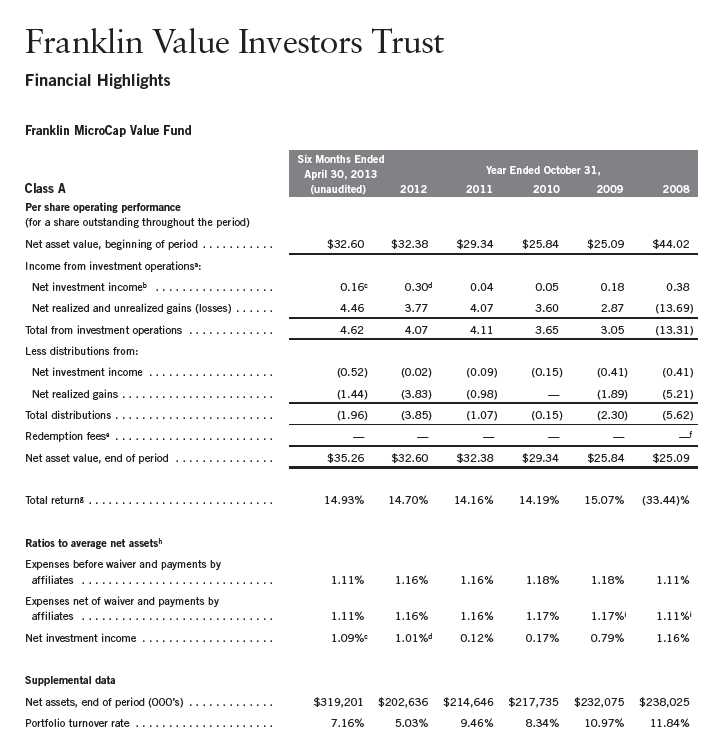
aThe amount shown for a share outstanding throughout the period may not correlate with the Statement of Operations for the period due to the timing of sales and repurchases of
the Fund shares in relation to income earned and/or fluctuating market value of the investments of the Fund.
bBased on average daily shares outstanding.
cNet investment income per share includes approximately $0.19 per share received in the form of special dividends. Excluding these amounts, the ratio of net investment income to
average net assets would have been (0.03)%.
dNet investment income per share includes approximately $0.23 per share received in the form of special dividends. Excluding these amounts, the ratio of net investment income to
average net assets would have been 0.25%.
eEffective September 1, 2008, the redemption fee was eliminated.
fAmount rounds to less than $0.01 per share.
gTotal return does not reflect sales commissions or contingent deferred sales charges, if applicable, and is not annualized for periods less than one year.
hRatios are annualized for periods less than one year.
iBenefit of expense reduction rounds to less than 0.01%.
72 | The accompanying notes are an integral part of these financial statements. | Semiannual Report
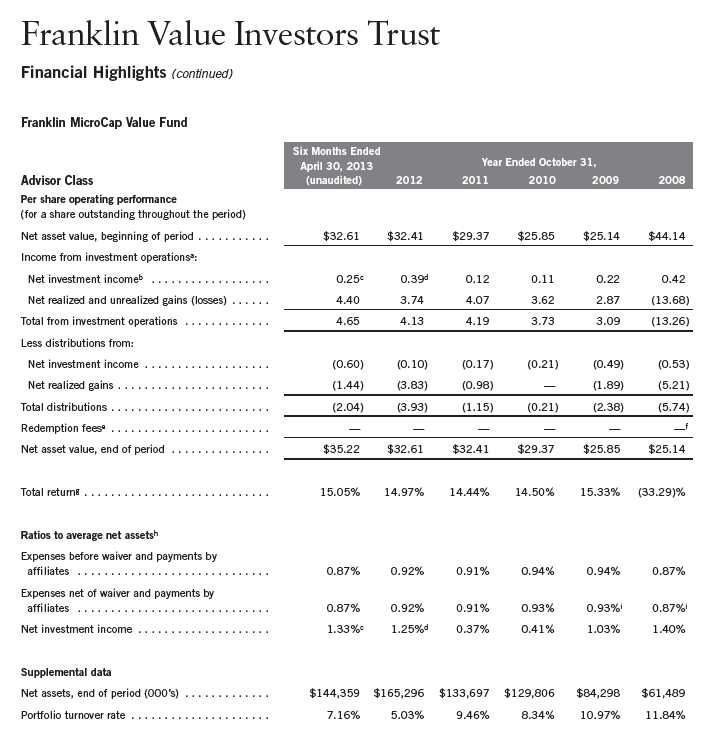
aThe amount shown for a share outstanding throughout the period may not correlate with the Statement of Operations for the period due to the timing of sales and repurchases of
the Fund shares in relation to income earned and/or fluctuating market value of the investments of the Fund.
bBased on average daily shares outstanding.
cNet investment income per share includes approximately $0.19 per share received in the form of special dividends. Excluding these amounts, the ratio of net investment income
to average net assets would have been 0.21%.
dNet investment income per share includes approximately $0.23 per share received in the form of special dividends. Excluding these amounts, the ratio of net investment income
to average net assets would have been 0.49%.
eEffective September 1, 2008, the redemption fee was eliminated.
fAmount rounds to less than $0.01 per share.
gTotal return is not annualized for periods less than one year.
hRatios are annualized for periods less than one year.
iBenefit of expense reduction rounds to less than 0.01%.
Semiannual Report | The accompanying notes are an integral part of these financial statements. | 73
Franklin Value Investors Trust
Statement of Investments, April 30, 2013 (unaudited)
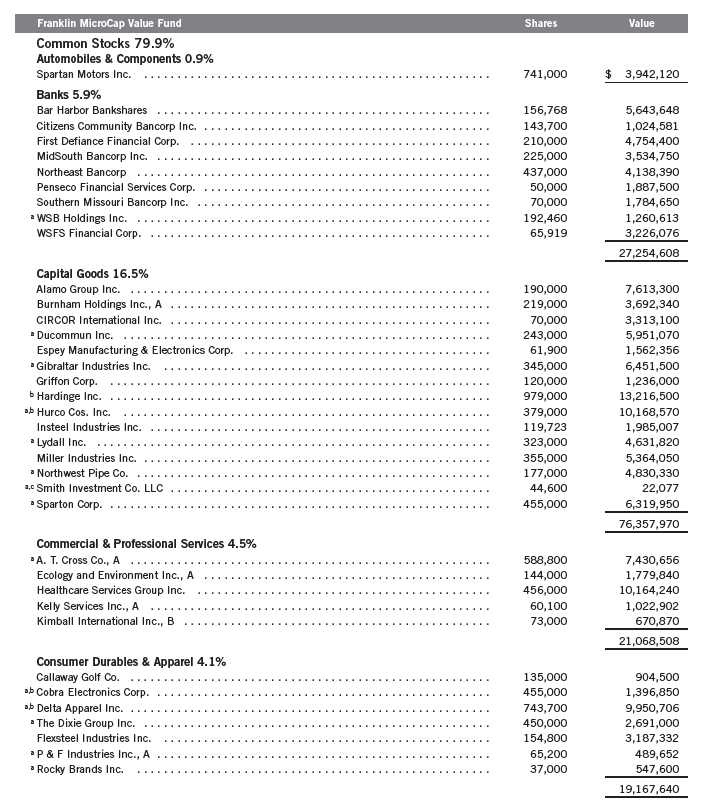
74 | Semiannual Report
Franklin Value Investors Trust
Statement of Investments, April 30, 2013 (unaudited) (continued)

Semiannual Report | 75
Franklin Value Investors Trust
Statement of Investments, April 30, 2013 (unaudited) (continued)
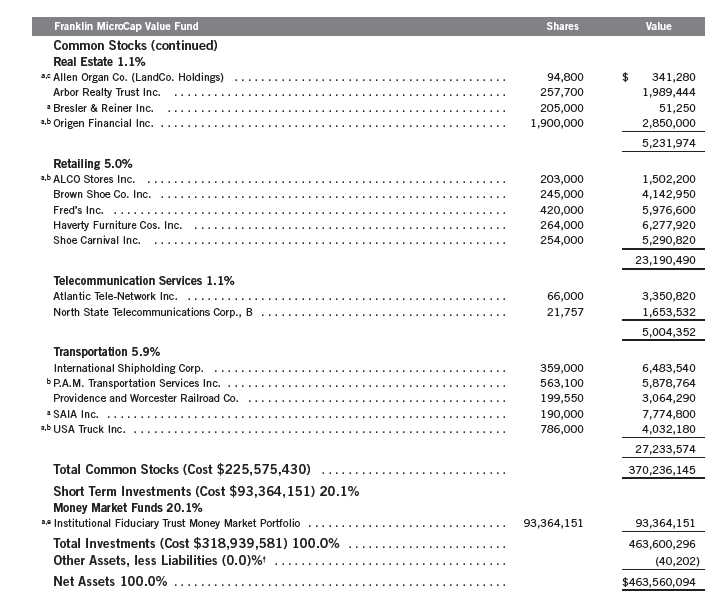
†Rounds to less than 0.1% of net assets.
aNon-income producing.
bSee Note 9 regarding holdings of 5% voting securities.
cSee Note 8 regarding restricted securities.
dAt April 30, 2013, pursuant to the Fund’s policies and the requirements of applicable securities law, the Fund may be restricted from trading this security for a limited or extended
period of time due to ownership limits and/or potential possession of material non-public information.
eSee Note 7 regarding investments in the Institutional Fiduciary Trust Money Market Portfolio.
76 | The accompanying notes are an integral part of these financial statements. | Semiannual Report
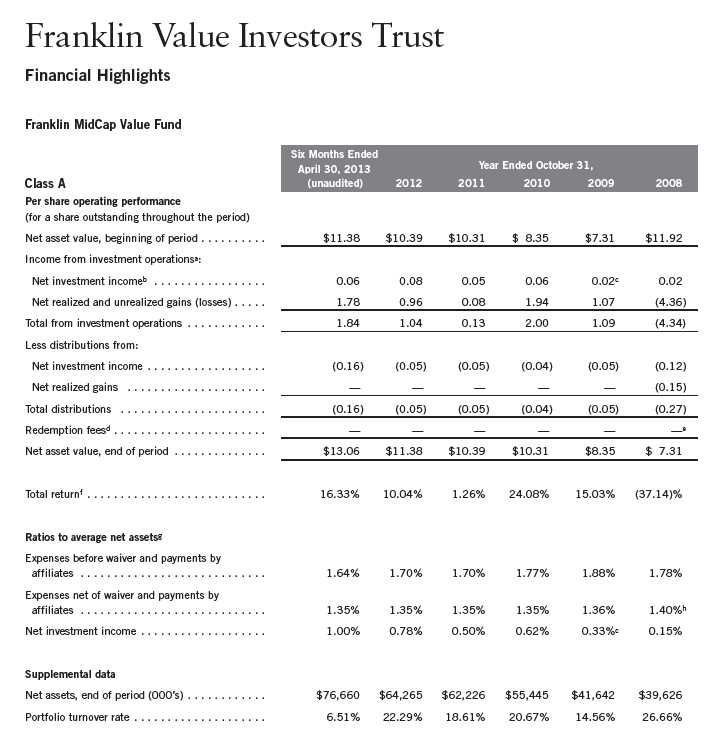
aThe amount shown for a share outstanding throughout the period may not correlate with the Statement of Operations for the period due to the timing of sales and repurchases of
the Fund shares in relation to income earned and/or fluctuating market value of the investments of the Fund.
bBased on average daily shares outstanding.
cNet investment income per share includes approximately $(0.06) per share of a return of capital adjustment to a previously recorded special dividend received by the Fund.
Excluding this non-recurring amount, the ratio of net investment income to average net assets would have been 1.16%.
dEffective September 1, 2008, the redemption fee was eliminated.
eAmount rounds to less than $0.01 per share.
fTotal return does not reflect sales commissions or contingent deferred sales charges, if applicable, and is not annualized for periods less than one year.
gRatios are annualized for periods less than one year.
hBenefit of expense reduction rounds to less than 0.01%.
Semiannual Report | The accompanying notes are an integral part of these financial statements. | 77
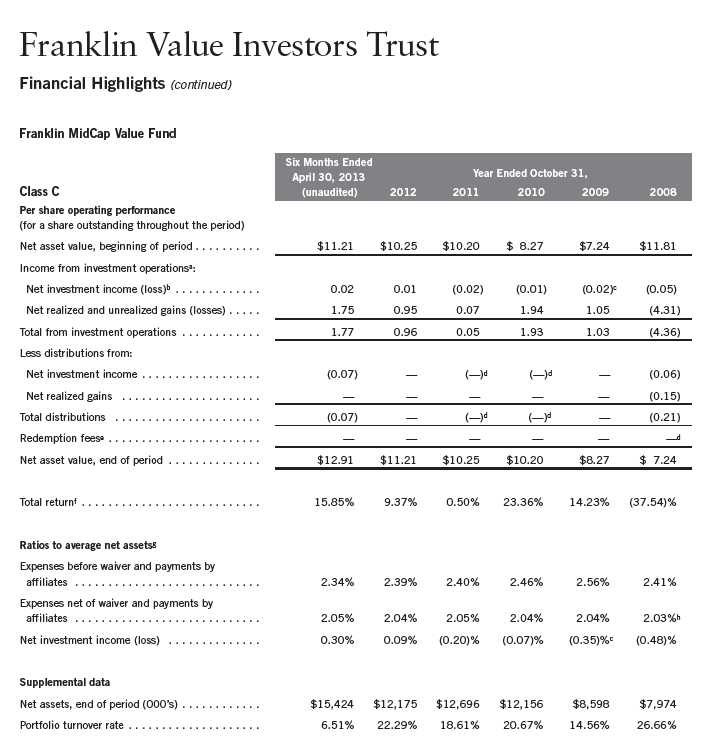
aThe amount shown for a share outstanding throughout the period may not correlate with the Statement of Operations for the period due to the timing of sales and repurchases of
the Fund shares in relation to income earned and/or fluctuating market value of the investments of the Fund.
bBased on average daily shares outstanding.
cNet investment income per share includes approximately $(0.06) per share of a return of capital adjustment to a previously recorded special dividend received by the Fund.
Excluding this non-recurring amount, the ratio of net investment income to average net assets would have been 0.48%.
dAmount rounds to less than $0.01 per share.
eEffective September 1, 2008, the redemption fee was eliminated.
fTotal return does not reflect sales commissions or contingent deferred sales charges, if applicable, and is not annualized for periods less than one year.
gRatios are annualized for periods less than one year.
hBenefit of expense reduction rounds to less than 0.01%.
78 | The accompanying notes are an integral part of these financial statements. | Semiannual Report
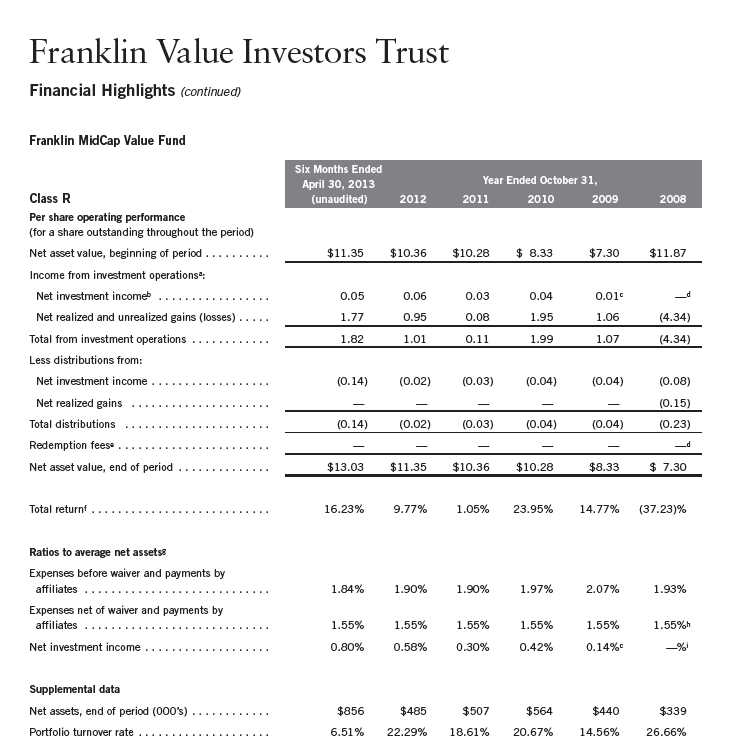
aThe amount shown for a share outstanding throughout the period may not correlate with the Statement of Operations for the period due to the timing of sales and repurchases of
the Fund shares in relation to income earned and/or fluctuating market value of the investments of the Fund.
bBased on average daily shares outstanding.
cNet investment income per share includes approximately $(0.06) per share of a return of capital adjustment to a previously recorded special dividend received by the Fund.
Excluding this non-recurring amount, the ratio of net investment income to average net assets would have been 0.97%.
dAmount rounds to less than $0.01 per share.
eEffective September 1, 2008, the redemption fee was eliminated.
fTotal return does not reflect sales commissions or contingent deferred sales charges, if applicable, and is not annualized for periods less than one year.
gRatios are annualized for periods less than one year.
hBenefit of expense reduction rounds to less than 0.01%.
iRounds to less than 0.01%.
Semiannual Report | The accompanying notes are an integral part of these financial statements. | 79
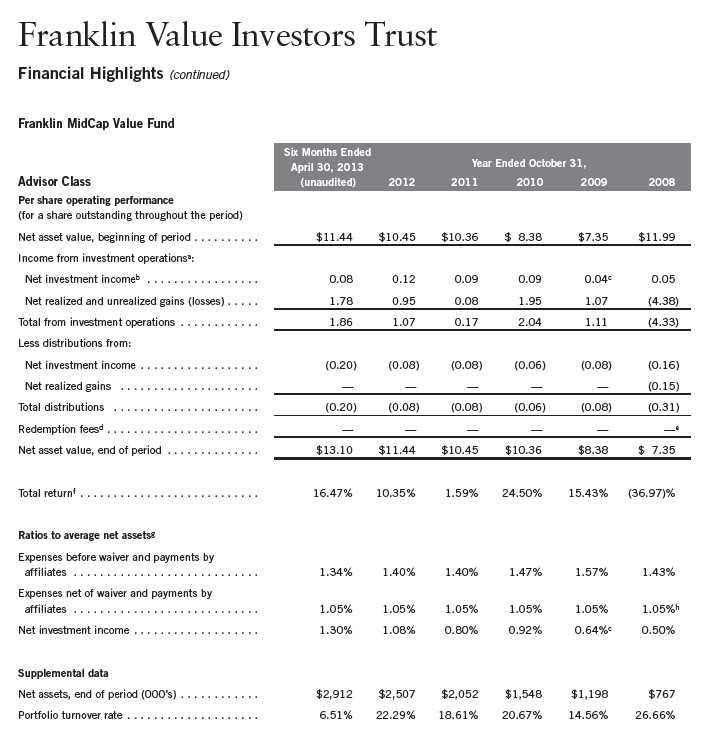
aThe amount shown for a share outstanding throughout the period may not correlate with the Statement of Operations for the period due to the timing of sales and repurchases of
the Fund shares in relation to income earned and/or fluctuating market value of the investments of the Fund.
bBased on average daily shares outstanding.
cNet investment income per share includes approximately $(0.06) per share of a return of capital adjustment to a previously recorded special dividend received by the Fund.
Excluding this non-recurring amount, the ratio of net investment income to average net assets would have been 1.47%.
dEffective September 1, 2008, the redemption fee was eliminated.
eAmount rounds to less than $0.01 per share.
fTotal return is not annualized for periods less than one year.
gRatios are annualized for periods less than one year.
hBenefit of expense reduction rounds to less than 0.01%.
80 | The accompanying notes are an integral part of these financial statements. | Semiannual Report
Franklin Value Investors Trust
Statement of Investments, April 30, 2013 (unaudited)
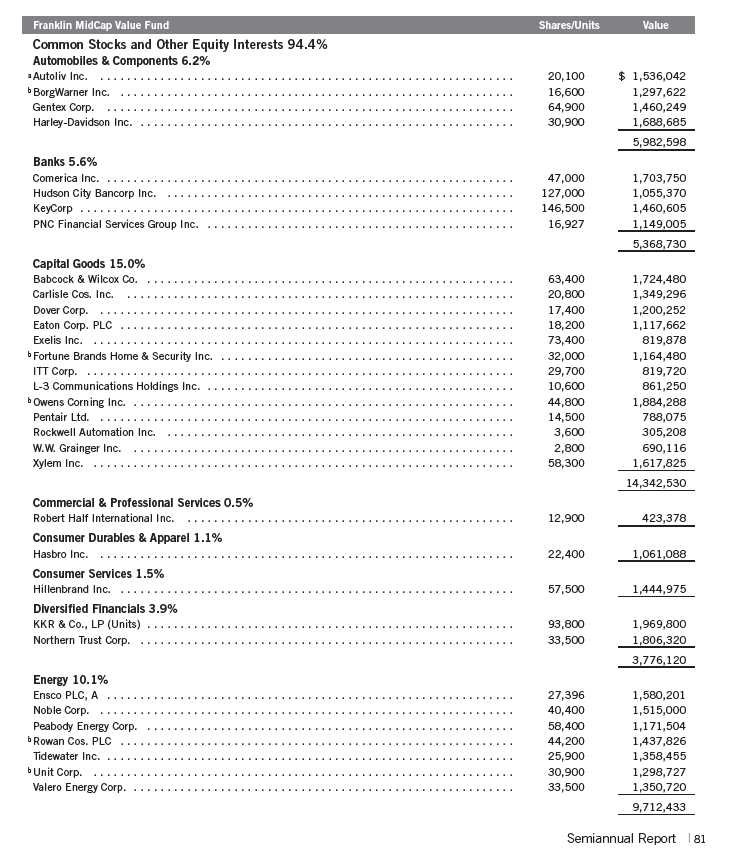

82 | Semiannual Report
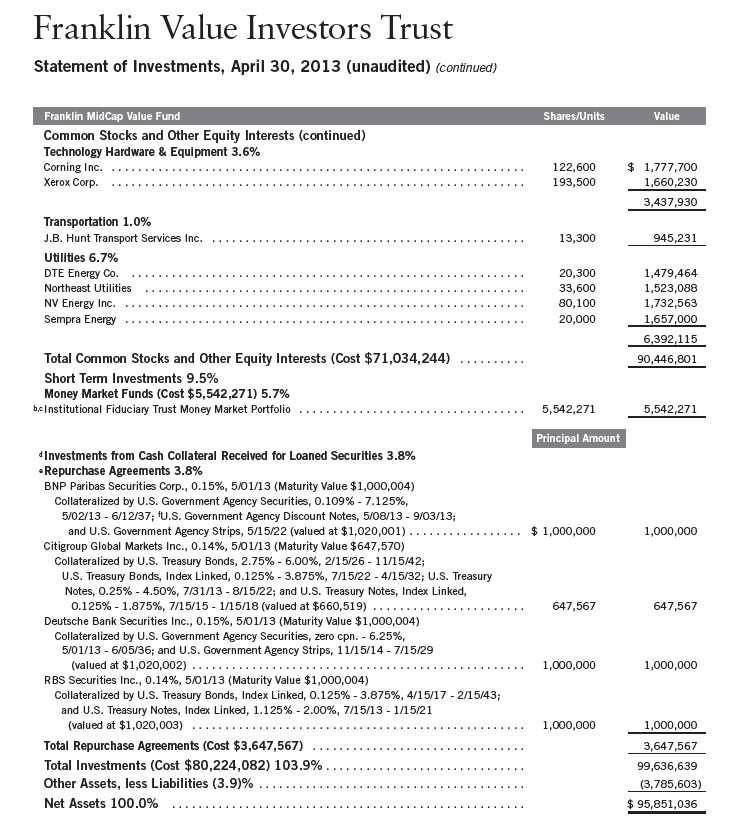
aA portion or all of the security is on loan at April 30, 2013. See Note 1(d).
bNon-income producing.
cSee Note 7 regarding investments in the Institutional Fiduciary Trust Money Market Portfolio.
dSee Note 1(d) regarding securities on loan.
eSee Note 1(c) regarding repurchase agreements.
fThe security is traded on a discount basis with no stated coupon rate.
Semiannual Report | The accompanying notes are an integral part of these financial statements. | 83

aThe amount shown for a share outstanding throughout the period may not correlate with the Statement of Operations for the period due to the timing of sales and repurchases of
the Fund shares in relation to income earned and/or fluctuating market value of the investments of the Fund.
bBased on average daily shares outstanding.
cNet investment income per share includes approximately $0.10 per share received in the form of special dividends. Excluding these amounts, the ratio of net investment income
to average net assets would have been 0.68%.
dNet investment income per share includes approximately $0.14 per share received in the form of special dividends. Excluding these amounts, the ratio of net investment income
to average net assets would have been 0.48%.
eEffective September 1, 2008, the redemption fee was eliminated.
fAmount rounds to less than $0.01 per share.
gTotal return does not reflect sales commissions or contingent deferred sales charges, if applicable, and is not annualized for periods less than one year.
hRatios are annualized for periods less than one year.
iBenefit of expense reduction rounds to less than 0.01%.
84 | The accompanying notes are an integral part of these financial statements. | Semiannual Report
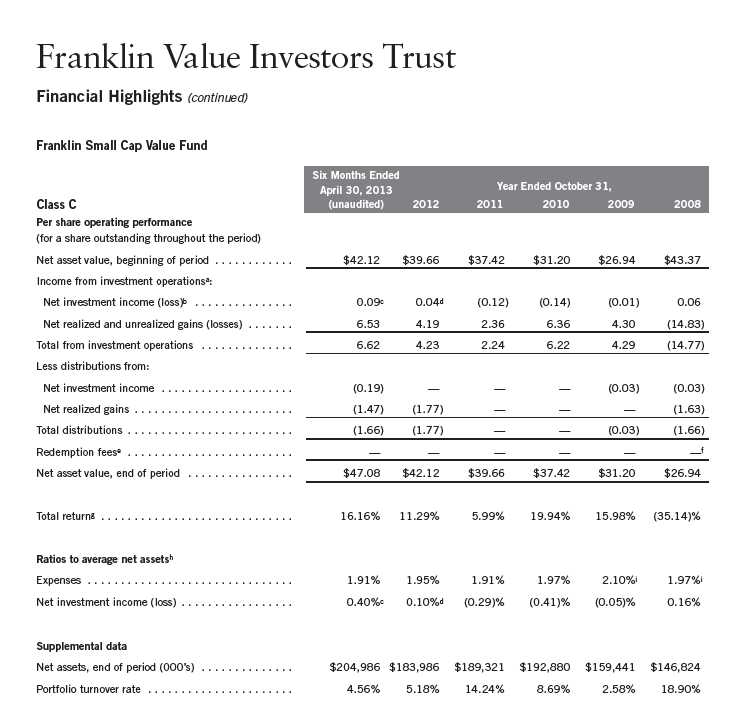
aThe amount shown for a share outstanding throughout the period may not correlate with the Statement of Operations for the period due to the timing of sales and repurchases of
the Fund shares in relation to income earned and/or fluctuating market value of the investments of the Fund.
bBased on average daily shares outstanding.
cNet investment income per share includes approximately $0.10 per share received in the form of special dividends. Excluding these amounts, the ratio of net investment income
to average net assets would have been (0.02)%.
dNet investment income per share includes approximately $0.14 per share received in the form of special dividends. Excluding these amounts, the ratio of net investment income
to average net assets would have been (0.21)%.
eEffective September 1, 2008, the redemption fee was eliminated.
fAmount rounds to less than $0.01 per share.
gTotal return does not reflect sales commissions or contingent deferred sales charges, if applicable, and is not annualized for periods less than one year.
hRatios are annualized for periods less than one year.
iBenefit of expense reduction rounds to less than 0.01%.
Semiannual Report | The accompanying notes are an integral part of these financial statements. | 85

aThe amount shown for a share outstanding throughout the period may not correlate with the Statement of Operations for the period due to the timing of sales and repurchases of
the Fund shares in relation to income earned and/or fluctuating market value of the investments of the Fund.
bBased on average daily shares outstanding.
cNet investment income per share includes approximately $0.10 per share received in the form of special dividends. Excluding these amounts, the ratio of net investment income
to average net assets would have been 0.48%.
dNet investment income per share includes approximately $0.14 per share received in the form of special dividends. Excluding these amounts, the ratio of net investment income
to average net assets would have been 0.28%.
eEffective September 1, 2008, the redemption fee was eliminated.
fAmount rounds to less than $0.01 per share.
gTotal return does not reflect sales commissions or contingent deferred sales charges, if applicable, and is not annualized for periods less than one year.
hRatios are annualized for periods less than one year.
iBenefit of expense reduction rounds to less than 0.01%.
86 | The accompanying notes are an integral part of these financial statements. | Semiannual Report

aThe amount shown for a share outstanding throughout the period may not correlate with the Statement of Operations for the period due to the timing of sales and repurchases of
the Fund shares in relation to income earned and/or fluctuating market value of the investments of the Fund.
bBased on average daily shares outstanding.
cNet investment income per share includes approximately $0.10 per share received in the form of special dividends. Excluding these amounts, the ratio of net investment income
to average net assets would have been 0.98%.
dNet investment income per share includes approximately $0.14 per share received in the form of special dividends. Excluding these amounts, the ratio of net investment income
to average net assets would have been 0.78%.
eEffective September 1, 2008, the redemption fee was eliminated.
fAmount rounds to less than $0.01 per share.
gTotal return is not annualized for periods less than one year.
hRatios are annualized for periods less than one year.
iBenefit of expense reduction rounds to less than 0.01%.
Semiannual Report | The accompanying notes are an integral part of these financial statements. | 87
Franklin Value Investors Trust
Statement of Investments, April 30, 2013 (unaudited)

88 | Semiannual Report
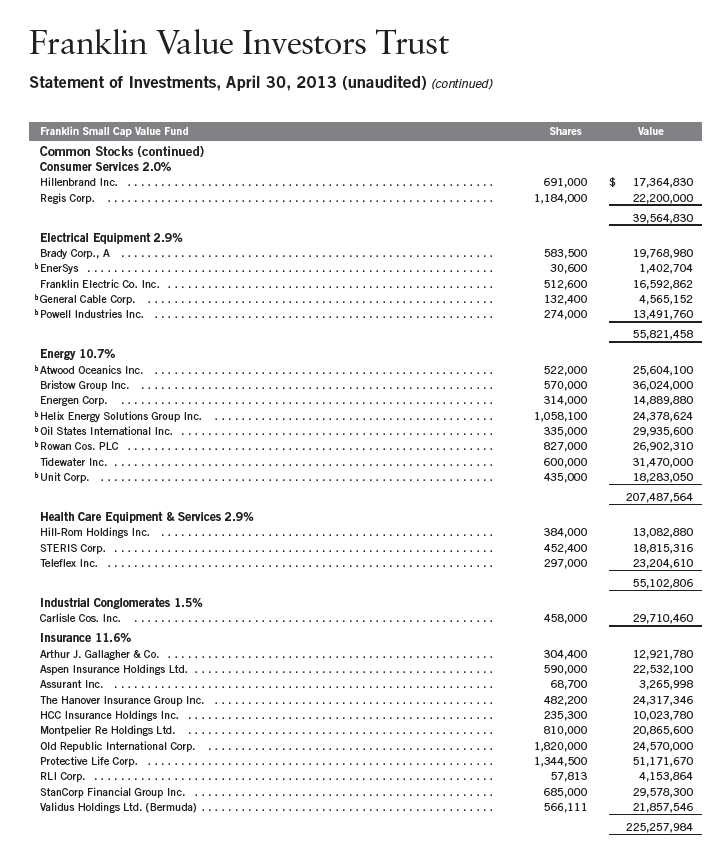
Semiannual Report | 89
Franklin Value Investors Trust
Statement of Investments, April 30, 2013 (unaudited) (continued)
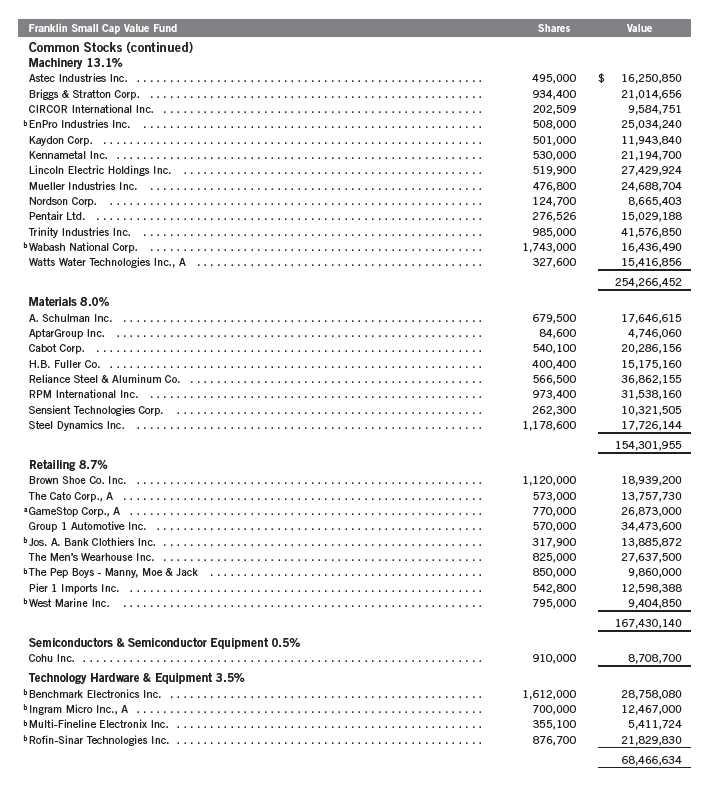
90 | Semiannual Report
Franklin Value Investors Trust
Statement of Investments, April 30, 2013 (unaudited) (continued)
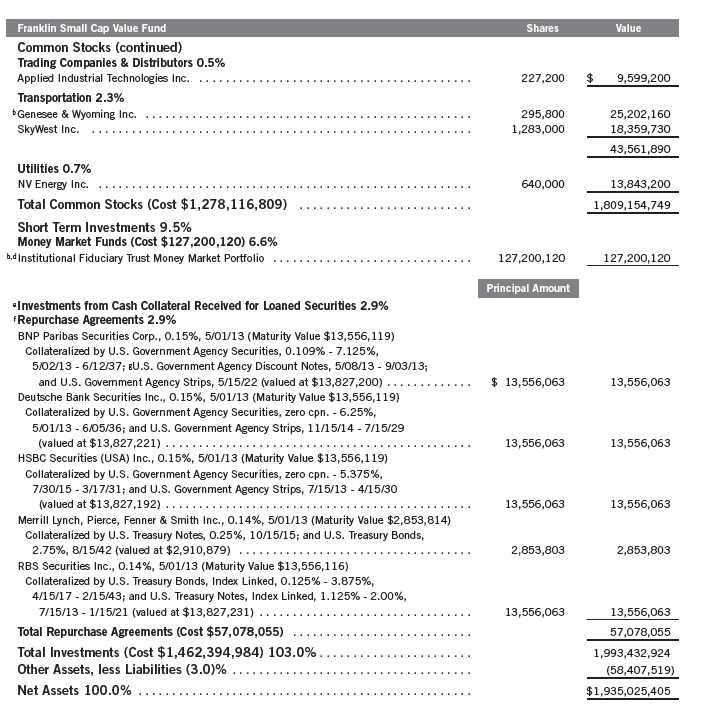
aA portion or all of the security is on loan at April 30, 2013. See Note 1(d).
bNon-income producing.
cSee Note 9 regarding holdings of 5% voting securities.
dSee Note 7 regarding investments in the Institutional Fiduciary Trust Money Market Portfolio.
eSee Note 1(d) regarding securities on loan.
fSee Note 1(c) regarding repurchase agreements.
gThe security is traded on a discount basis with no stated coupon rate.
Semiannual Report | The accompanying notes are an integral part of these financial statements. | 91
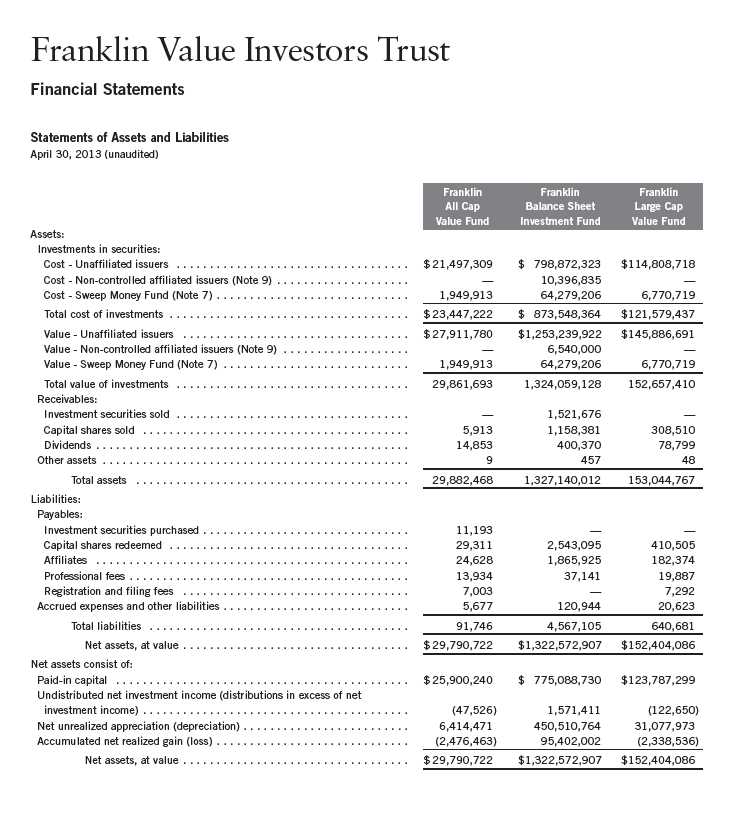
92 | The accompanying notes are an integral part of these financial statements. | Semiannual Report
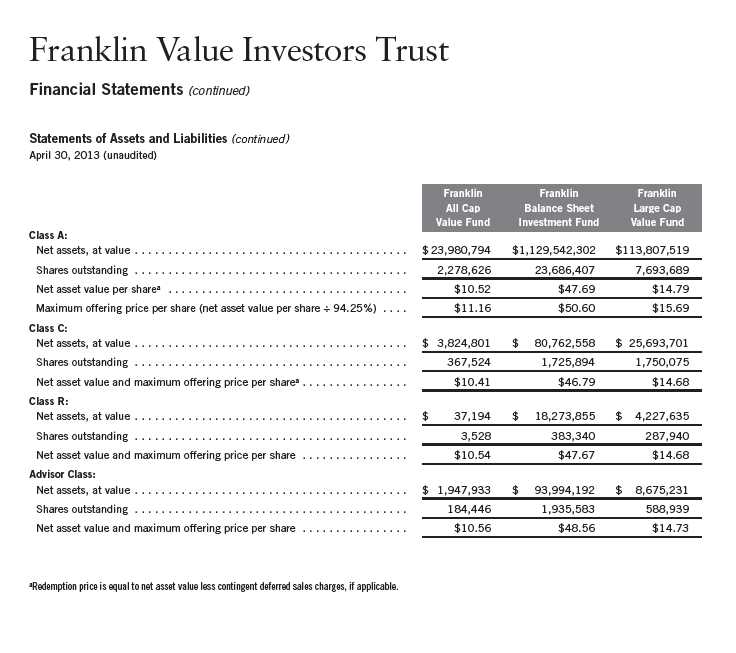
Semiannual Report | The accompanying notes are an integral part of these financial statements. | 93
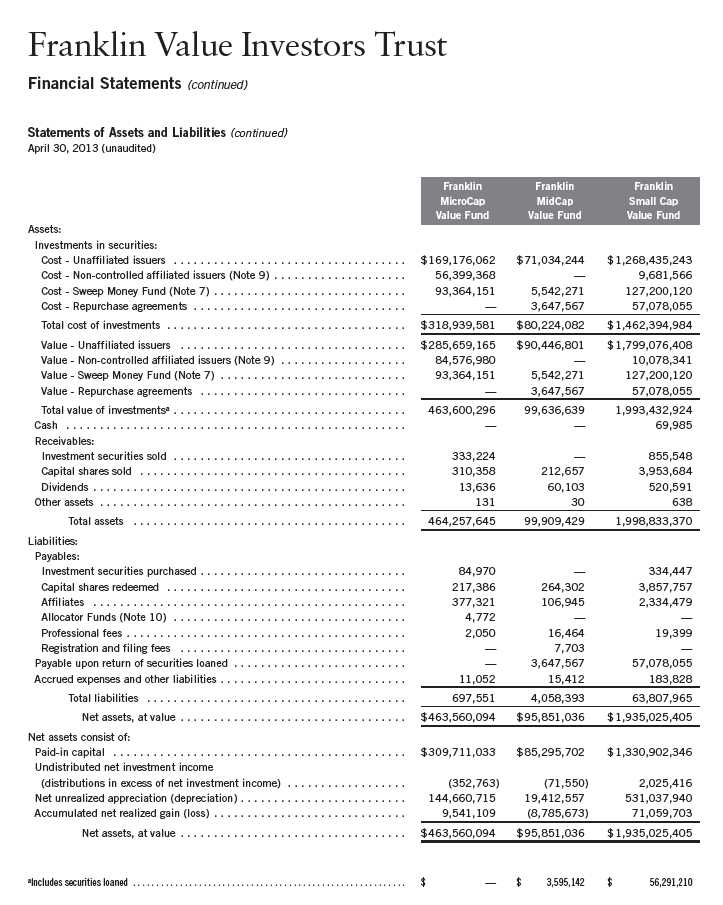
94 | The accompanying notes are an integral part of these financial statements. | Semiannual Report
Franklin Value Investors Trust
Financial Statements (continued)
Statements of Assets and Liabilities (continued)
April 30, 2013 (unaudited)
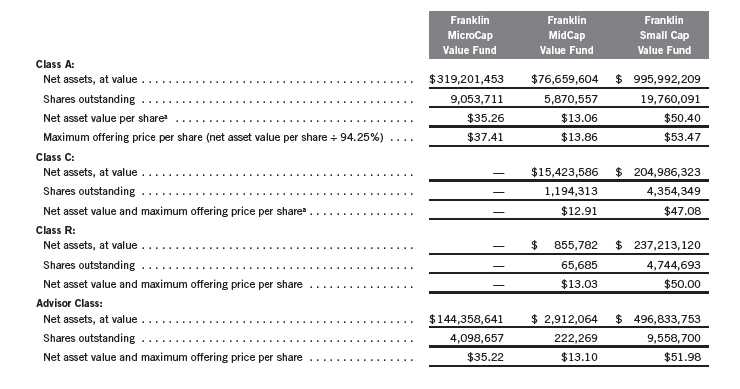
aRedemption price is equal to net asset value less contingent deferred sales charges, if applicable.
Semiannual Report | The accompanying notes are an integral part of these financial statements. | 95
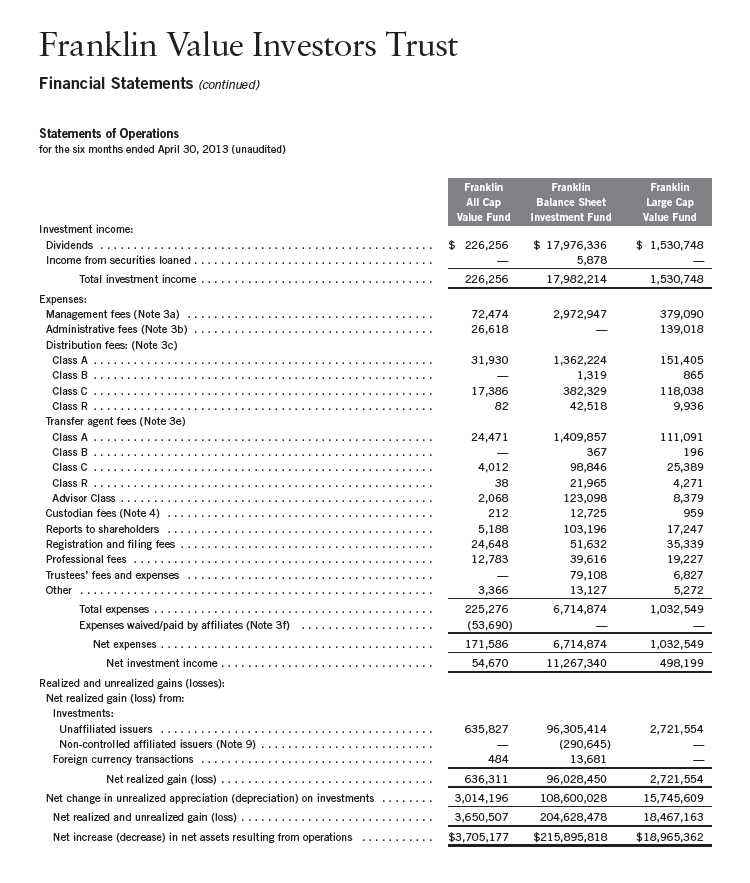
96 | The accompanying notes are an integral part of these financial statements. | Semiannual Report
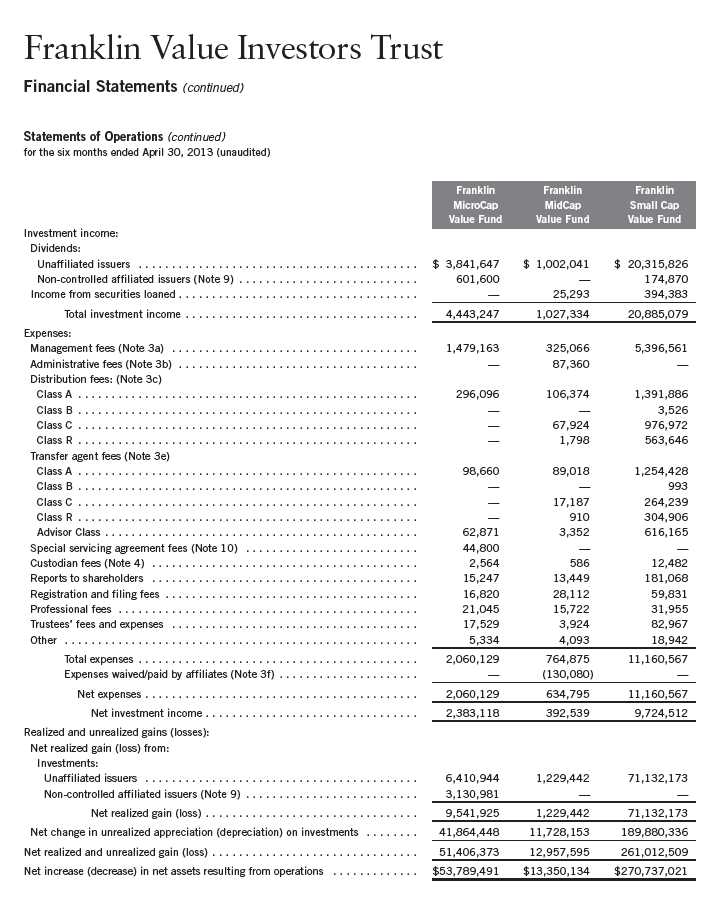
Semiannual Report | The accompanying notes are an integral part of these financial statements. | 97

98 | The accompanying notes are an integral part of these financial statements. | Semiannual Report
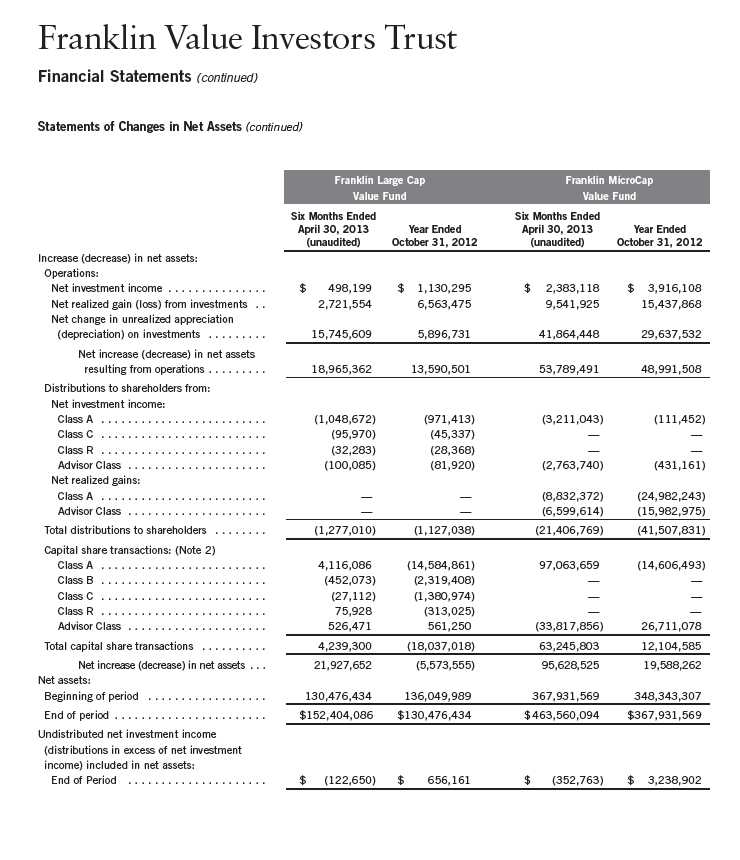
Semiannual Report | The accompanying notes are an integral part of these financial statements. | 99

100 | The accompanying notes are an integral part of these financial statements. | Semiannual Report
Franklin Value Investors Trust
Notes to Financial Statements (unaudited)
1. ORGANIZATION AND SIGNIFICANT ACCOUNTING POLICIES
Franklin Value Investors Trust (Trust) is registered under the Investment Company Act of 1940, as amended, (1940 Act) as an open-end investment company, consisting of six funds (Funds). The classes of shares offered within each of the Funds are indicated below. Each class of shares differs by its initial sales load, contingent deferred sales charges, voting rights on matters affecting a single class, its exchange privilege and fees primarily due to differing arrangements for distribution and transfer agent fees.
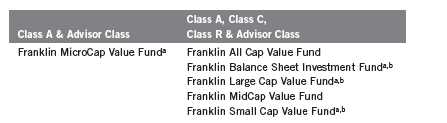
aEffective May 1, 2013, the funds began offering a new class of shares, Class R6. bEffective March 22, 2013, all Class B shares were converted to Class A.
The following summarizes the Funds’ significant accounting policies.
a. Financial Instrument Valuation
The Funds’ investments in financial instruments are carried at fair value daily. Fair value is the price that would be received to sell an asset or paid to transfer a liability in an orderly transaction between market participants on the measurement date. Under procedures approved by the Trust’s Board of Trustees (the Board), the Funds’ administrator, investment manager and other affiliates have formed the Valuation and Liquidity Oversight Committee (VLOC). The VLOC provides administration and oversight of the Funds’ valuation policies and procedures, which are approved annually by the Board. Among other things, these procedures allow the Funds to utilize independent pricing services, quotations from securities and financial instrument dealers, and other market sources to determine fair value.
Equity securities listed on an exchange or on the NASDAQ National Market System are valued at the last quoted sale price or the official closing price of the day, respectively. Foreign equity securities are valued as of the close of trading on the foreign stock exchange on which the security is primarily traded, or the NYSE, whichever is earlier. The value is then converted into its U.S. dollar equivalent at the foreign exchange rate in effect at the close of the NYSE on the day that the value of the security is determined. Over-the-counter (OTC) securities are valued within the range of the most recent quoted bid and ask prices. Securities that trade in multiple markets or on multiple exchanges are valued according to the broadest and most representative market. Certain equity securities are valued based upon fundamental characteristics or relationships to similar securities. Investments in open-end mutual funds are valued at the closing net asset value. Repurchase agreements are valued at cost, which approximates market value.
Semiannual Report | 101
Franklin Value Investors Trust
Notes to Financial Statements (unaudited) (continued)
| 1. | ORGANIZATION AND SIGNIFICANT ACCOUNTING POLICIES (continued) |
| a. | Financial Instrument Valuation (continued) |
The Funds have procedures to determine the fair value of financial instruments for which market prices are not reliable or readily available. Under these procedures, the VLOC convenes on a regular basis to review such financial instruments and considers a number of factors, including significant unobservable valuation inputs, when arriving at fair value. The VLOC primarily employs a market-based approach which may use related or comparable assets or liabilities, recent transactions, market multiples, book values, and other relevant information for the investment to determine the fair value of the investment. An income-based valuation approach may also be used in which the anticipated future cash flows of the investment are discounted to calculate fair value. Discounts may also be applied due to the nature or duration of any restrictions on the disposition of the investments. Due to the inherent uncertainty of valuations of such investments, the fair values may differ significantly from the values that would have been used had an active market existed. The VLOC employs various methods for calibrating these valuation approaches including a regular review of key inputs and assumptions, transactional back-testing or disposition analysis, and reviews of any related market activity.
Trading in securities on foreign securities stock exchanges and OTC markets may be completed before the daily close of business on the NYSE. Occasionally, events occur between the time at which trading in a foreign security is completed and the close of the NYSE that might call into question the reliability of the value of a portfolio security held by the fund. As a result, differences may arise between the value of the Funds’ portfolio securities as determined at the foreign market close and the latest indications of value at the close of the NYSE. In order to minimize the potential for these differences, the VLOC monitors price movements following the close of trading in foreign stock markets through a series of country specific market proxies (such as baskets of American Depositary Receipts, futures contracts and exchange traded funds). These price movements are measured against established trigger thresholds for each specific market proxy to assist in determining if an event has occurred that may call into question the reliability of the values of the foreign securities held by the Funds. If such an event occurs, the securities may be valued using fair value procedures, which may include the use of independent pricing services.
In addition, certain foreign markets may be open on days that the NYSE is closed, which could result in differences between the value of the Funds’ portfolio securities on the last business day and the last calendar day of the reporting period. Any significant security valuation changes due to an open foreign market are adjusted and reflected by the Funds for financial reporting purposes.
b. Foreign Currency Translation
Portfolio securities and other assets and liabilities denominated in foreign currencies are translated into U.S. dollars based on the exchange rate of such currencies against U.S. dollars on the date of valuation. The Funds may enter into foreign currency exchange contracts to facilitate transactions denominated in a foreign currency. Purchases and sales of securities, income and expense items
102 | Semiannual Report
Franklin Value Investors Trust
Notes to Financial Statements (unaudited) (continued)
| 1. | ORGANIZATION AND SIGNIFICANT ACCOUNTING POLICIES (continued) |
| b. | Foreign Currency Translation (continued) |
denominated in foreign currencies are translated into U.S. dollars at the exchange rate in effect on the transaction date. Portfolio securities and assets and liabilities denominated in foreign currencies contain risks that those currencies will decline in value relative to the U.S. dollar. Occasionally, events may impact the availability or reliability of foreign exchange rates used to convert the U.S. dollar equivalent value. If such an event occurs, the foreign exchange rate will be valued at fair value using procedures established and approved by the Board.
The Funds do not separately report the effect of changes in foreign exchange rates from changes in market prices on securities held. Such changes are included in net realized and unrealized gain or loss from investments on the Statements of Operations.
Realized foreign exchange gains or losses arise from sales of foreign currencies, currency gains or losses realized between the trade and settlement dates on securities transactions and the difference between the recorded amounts of dividends, interest, and foreign withholding taxes and the U.S. dollar equivalent of the amounts actually received or paid. Net unrealized foreign exchange gains and losses arise from changes in foreign exchange rates on foreign denominated assets and liabilities other than investments in securities held at the end of the reporting period.
c. Repurchase Agreements
Certain funds enter into repurchase agreements, which are accounted for as a loan by the fund to the seller, collateralized by securities which are delivered to the funds’ custodian. The market value, including accrued interest, of the initial collateralization is required to be at least 102% of the dollar amount invested by the fund, with the value of the underlying securities marked to market daily to maintain coverage of at least 100%. All repurchase agreements held by the funds at period end had been entered into on April 30, 2013.
d. Securities Lending
Certain funds participate in an agency based securities lending program. The fund receives cash collateral against the loaned securities in an amount equal to at least 102% of the market value of the loaned securities. Collateral is maintained over the life of the loan in an amount not less than 100% of the market value of loaned securities, as determined at the close of fund business each day; any additional collateral required due to changes in security values is delivered to the fund on the next business day. The collateral is invested in repurchase agreements as indicated on the Statements of Investments. The fund receives income from the investment of cash collateral, in addition to lending fees and rebates paid by the borrower. The fund bears the market risk with respect to the collateral investment, securities loaned, and the risk that the agent may default on its obligations to the fund. The securities lending agent has agreed to indemnify the fund in the event of default by a third party borrower.
Semiannual Report | 103
Franklin Value Investors Trust
Notes to Financial Statements (unaudited) (continued)
| 1. | ORGANIZATION AND SIGNIFICANT ACCOUNTING POLICIES (continued) |
| e. | Income and Deferred Taxes |
It is each fund’s policy to qualify as a regulated investment company under the Internal Revenue Code. Each fund intends to distribute to shareholders substantially all of its taxable income and net realized gains to relieve it from federal income and excise taxes. As a result, no provision for U.S. federal income taxes is required.
The Funds may be subject to foreign taxation related to income received, capital gains on the sale of securities and certain foreign currency transactions in the foreign jurisdictions in which it invests. Foreign taxes, if any, are recorded based on the tax regulations and rates that exist in the foreign markets in which the Funds invest. When a capital gain tax is determined to apply the Funds record an estimated deferred tax liability in an amount that would be payable if the securities were disposed of on the valuation date.
Each fund recognizes the tax benefits of uncertain tax positions only when the position is “more likely than not” to be sustained upon examination by the tax authorities based on the technical merits of the tax position. As of April 30, 2013, and for all open tax years, each fund has determined that no liability for unrecognized tax benefits is required in each fund’s financial statements related to uncertain tax positions taken on a tax return (or expected to be taken on future tax returns). Open tax years are those that remain subject to examination and are based on each tax jurisdiction statute of limitation.
f. Security Transactions, Investment Income, Expenses and Distributions
Security transactions are accounted for on trade date. Realized gains and losses on security transactions are determined on a specific identification basis. Estimated expenses are accrued daily. Dividend income is recorded on the ex-dividend date except that certain dividends from foreign securities are recognized as soon as the Funds are notified of the ex-dividend date. Distributions to shareholders are recorded on the ex-dividend date and are determined according to income tax regulations (tax basis). Distributable earnings determined on a tax basis may differ from earnings recorded in accordance with accounting principles generally accepted in the United States of America. These differences may be permanent or temporary. Permanent differences are reclassified among capital accounts to reflect their tax character. These reclassifications have no impact on net assets or the results of operations. Temporary differences are not reclassified, as they may reverse in subsequent periods.
Common expenses incurred by the Trust are allocated among the Funds based on the ratio of net assets of each fund to the combined net assets of the Trust. Fund specific expenses are charged directly to the fund that incurred the expense.
Realized and unrealized gains and losses and net investment income, not including class specific expenses, are allocated daily to each class of shares based upon the relative proportion of net assets of each class. Differences in per share distributions, by class, are generally due to differences in class specific expenses.
104 | Semiannual Report
Franklin Value Investors Trust
Notes to Financial Statements (unaudited) (continued)
| 1. | ORGANIZATION AND SIGNIFICANT ACCOUNTING POLICIES (continued) |
| f. | Security Transactions, Investment Income, Expenses and Distributions (continued) |
Distributions received by the funds from certain securities may be a return of capital (ROC). Such distributions reduce the cost basis of the securities, and any distributions in excess of the cost basis are recognized as capital gains.
g. Accounting Estimates
The preparation of financial statements in accordance with accounting principles generally accepted in the United States of America requires management to make estimates and assumptions that affect the reported amounts of assets and liabilities at the date of the financial statements and the amounts of income and expenses during the reporting period. Actual results could differ from those estimates.
h. Guarantees and Indemnifications
Under the Trust’s organizational documents, its officers and trustees are indemnified by the Trust against certain liabilities arising out of the performance of their duties to the Trust. Additionally, in the normal course of business, the Trust, on behalf of the Funds, enters into contracts with service providers that contain general indemnification clauses. The Trust’s maximum exposure under these arrangements is unknown as this would involve future claims that may be made against the Trust that have not yet occurred. Currently, the Trust expects the risk of loss to be remote.
2. SHARES OF BENEFICIAL INTEREST
At April 30, 2013, there were an unlimited number of shares authorized ($0.01 par value).
Transactions in the Funds’ shares were as follows:

Semiannual Report | 105
Franklin Value Investors Trust
Notes to Financial Statements (unaudited) (continued)
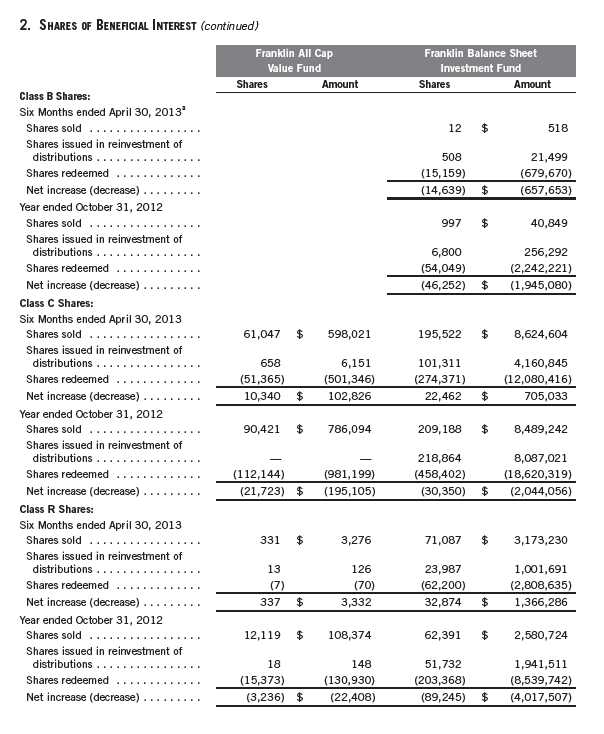
106 | Semiannual Report
Franklin Value Investors Trust
Notes to Financial Statements (unaudited) (continued)

Semiannual Report | 107
Franklin Value Investors Trust
Notes to Financial Statements (unaudited) (continued)
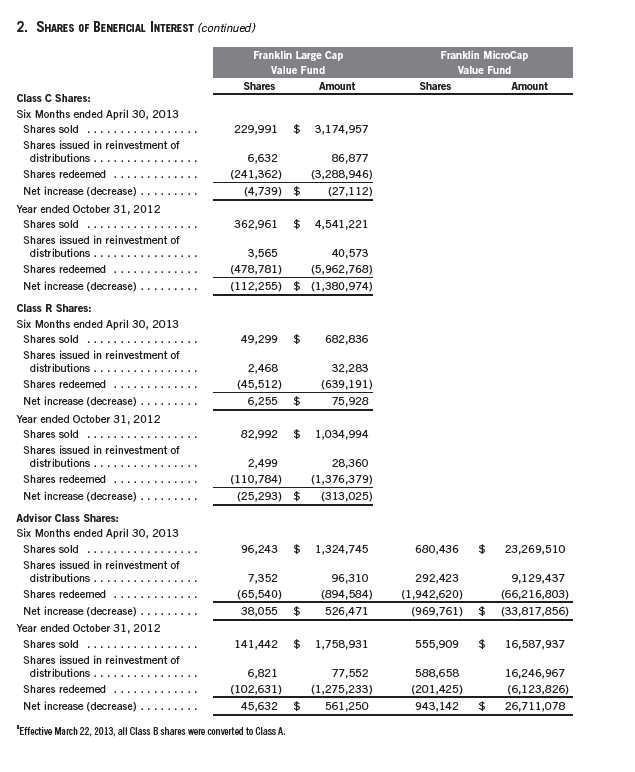
108 | Semiannual Report
Franklin Value Investors Trust
Notes to Financial Statements (unaudited) (continued)
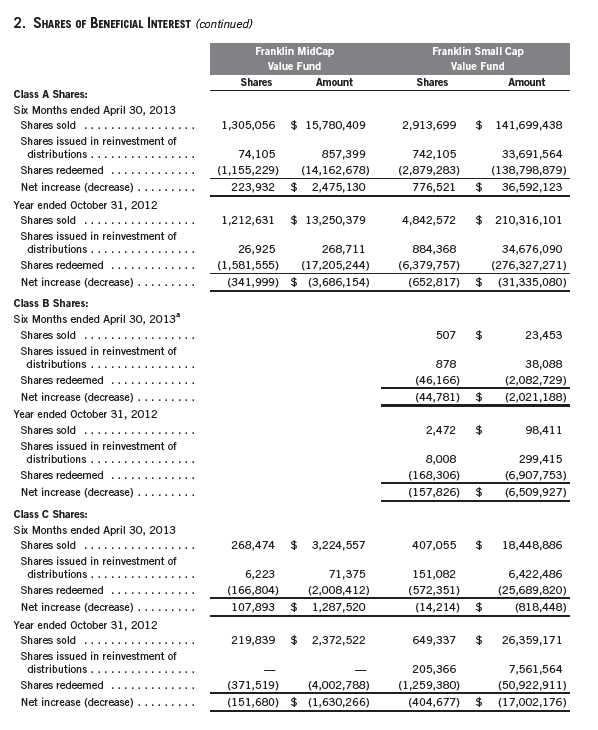
Semiannual Report | 109
Franklin Value Investors Trust
Notes to Financial Statements (unaudited) (continued)
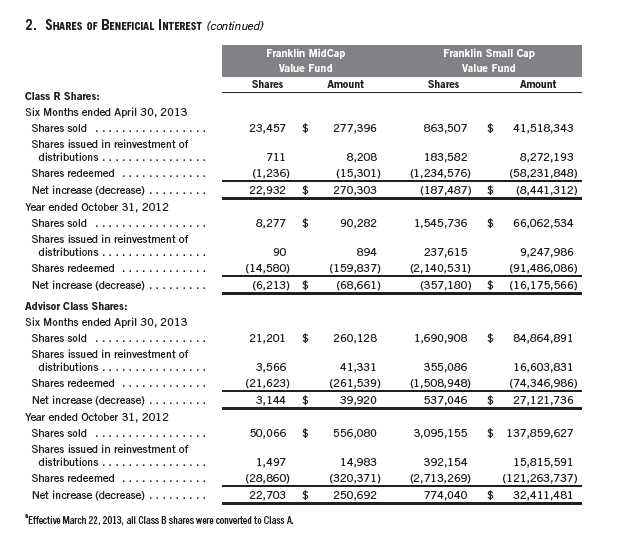
3. TRANSACTIONS WITH AFFILIATES
Franklin Resources, Inc. is the holding company for various subsidiaries that together are referred
to as Franklin Templeton Investments. Certain officers and trustees of the Trust are also officers
and/or directors of the following subsidiaries:
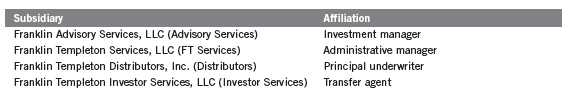
110 | Semiannual Report
Franklin Value Investors Trust
Notes to Financial Statements (unaudited) (continued)
| 3. | TRANSACTIONS WITH AFFILIATES (continued) |
| a. | Management Fees |
The Franklin All Cap Value Fund and the Franklin Large Cap Value Fund each pay an investment
management fee to Advisory Services based on the average daily net assets of each of the funds as
follows:
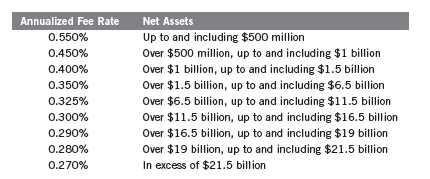
The Franklin Balance Sheet Investment Fund pays an investment management fee to Advisory
Services based on the average daily net assets of the fund as follows:
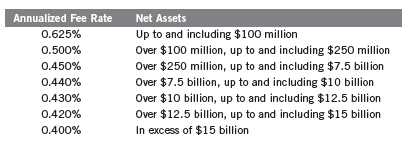
The Franklin MicroCap Value Fund pays an investment management fee to Advisory Services of
0.75% per year of the average daily net assets of the fund.
The Franklin MidCap Value Fund pays an investment management fee to Advisory Services
based on the average daily net assets of the fund as follows:
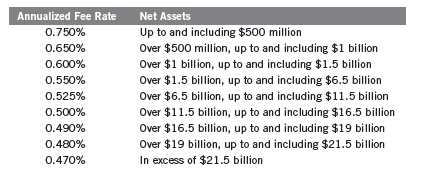
Semiannual Report | 111
Franklin Value Investors Trust
Notes to Financial Statements (unaudited) (continued)
| 3. | TRANSACTIONS WITH AFFILIATES (continued) |
| a. | Management Fees (continued) |
The Franklin Small Cap Value Fund pays an investment management fee to Advisory Services based on the average daily net assets of the fund as follows:
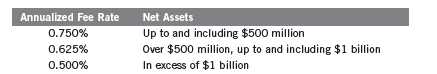
b. Administrative Fees
FT Services provides administrative services to the Funds. The Franklin All Cap Value Fund, the Franklin Large Cap Value Fund and the Franklin MidCap Value Fund each pay an administrative fee to FT Services of 0.20% per year of their respective average daily net assets. Under an agreement with Advisory Services, the administrative fee for the Franklin Balance Sheet Investment Fund, the Franklin MicroCap Value Fund and the Franklin Small Cap Value Fund is paid by Advisory Services based on each fund’s average daily net assets, and is not an additional expense of the funds.
On February 26, 2013, the Board approved the proposal to combine the investment management and administration agreements for the Franklin All Cap Value Fund, the Franklin Large Cap Value Fund, and the Franklin MidCap Value Fund. The fees to be paid under the new combined agreement will not exceed the aggregate fees that would have been paid under the separate agreements. The new agreement went into effect on May 1, 2013.
c. Distribution Fees
The Board has adopted distribution plans for each share class, with the exception of Class R6 and Advisor Class shares, pursuant to Rule 12b-1 under the 1940 Act. Distribution fees are not charged on shares held by affiliates. Under the Funds’ Class A reimbursement distribution plans, the Funds reimburse Distributors for costs incurred in connection with the servicing, sale and distribution of each fund’s shares up to the maximum annual plan rate for each class. Under the Class A reimbursement distribution plans, costs exceeding the maximum for the current plan year cannot be reimbursed in subsequent periods. In addition, under the Funds’ Class B, C and R compensation distribution plans, the Funds pay Distributors for costs incurred in connection with the servicing, sale and distribution of each fund’s shares up to the maximum annual plan rate for each class.
112 | Semiannual Report
Franklin Value Investors Trust
Notes to Financial Statements (unaudited) (continued)
| 3. | TRANSACTIONS WITH AFFILIATES (continued) |
| c. | Distribution Fees (continued) |
The maximum annual plan rates, based on the average daily net assets, for each class, are as follows:
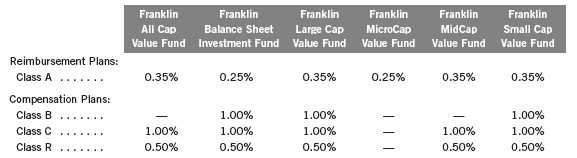
The Board has set the current rate at 0.30% per year for Class A shares for the Franklin All Cap Value Fund, the Franklin Large Cap Value Fund, the Franklin MidCap Value Fund, and the Franklin Small Cap Value Fund until further notice and approval by the Board.
d. Sales Charges/Underwriting Agreements
Front-end sales charges and contingent deferred sales charges (CDSC) do not represent expenses of the Funds. These charges are deducted from the proceeds of sales of fund shares prior to investment or from redemption proceeds prior to remittance, as applicable. Distributors has advised the Funds of the following commission transactions related to the sales and redemptions of the Funds’ shares for the period:
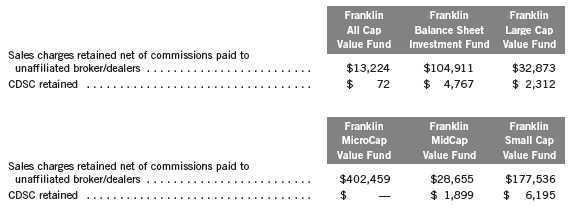
e. Transfer Agent Fees
Each class of shares, except for the R6 share class, pays transfer agent fees to Investor Services for its performance of shareholder servicing obligations and reimburses Investor Services for out of pocket expenses incurred, including shareholding servicing fees paid to third parties. These fees are allocated daily to such classes based upon the relative proportion of net assets of each class. The R6 share class pays Investor Services transfer agent fees specific to that class.
Semiannual Report | 113
Franklin Value Investors Trust
Notes to Financial Statements (unaudited) (continued)
| 3. | TRANSACTIONS WITH AFFILIATES (continued) |
| e. | Transfer Agent Fees (continued) |
For the period ended April 30, 2013, the Funds paid transfer agent fees as noted in the Statements of Operations of which the following amounts were retained by Investor Services:
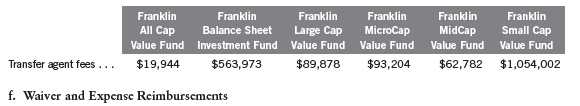
Advisory Services and FT Services have contractually agreed in advance to waive or limit their respective fees and to assume as their own expense certain expenses otherwise payable by the Franklin All Cap Value Fund and the Franklin MidCap Value Fund so that the expenses (excluding distribution fees, and acquired fund fees and expenses) for Class A, Class C, Class R and Advisor Class of the funds do not exceed 0.95% and 1.05%, respectively (other than certain non-routine expenses or costs, including those relating to litigation, indemnification, reorganizations, and liquidations) until February 28, 2014. Prior to March 1, 2013, expenses were limited to 0.90% for the Franklin All Cap Value Fund.
4. EXPENSE OFFSET ARRANGEMENT
The Funds have entered into an arrangement with their custodian whereby credits realized as a result of uninvested cash balances are used to reduce a portion of the Funds’ custodian expenses. During the period ended April 30, 2013, there were no credits earned.
5. INCOME TAXES
For tax purposes, capital losses may be carried over to offset future capital gains. Capital loss carryforwards with no expiration, if any, must be fully utilized before those with expiration dates.
At October 31, 2012, the capital loss carryforwards were as follows:
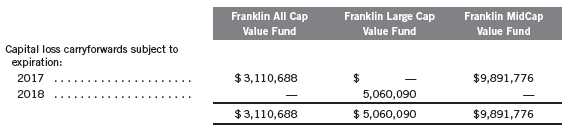
114 | Semiannual Report
Franklin Value Investors Trust
Notes to Financial Statements (unaudited) (continued)
5. INCOME TAXES (continued)
At April 30, 2013, the cost of investments and net unrealized appreciation (depreciation) for income tax purposes were as follows:

Differences between income and/or capital gains as determined on a book basis and a tax basis are primarily due to differing treatments of wash sales, pass-through entity income, corporate actions and gains realized on in-kind shareholder redemptions.
6. INVESTMENT TRANSACTIONS
Purchases and sales of investments (excluding short term securities) for the period ended April 30, 2013, were as follows:
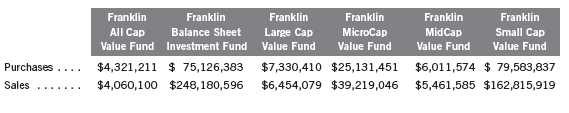
7. INVESTMENTS IN INSTITUTIONAL FIDUCIARY TRUST MONEY MARKET PORTFOLIO
The Funds invest in the Institutional Fiduciary Trust Money Market Portfolio (Sweep Money Fund), an open-end investment company managed by Franklin Advisers, Inc. (an affiliate of the investment manager). Management fees paid by the Funds are reduced on assets invested in the Sweep Money Fund, in an amount not to exceed the management and administrative fees paid by the Sweep Money Fund.
Semiannual Report | 115
Franklin Value Investors Trust
Notes to Financial Statements (unaudited) (continued)
8. RESTRICTED SECURITIES
The Funds invest in securities that are restricted under the Securities Act of 1933 (1933 Act) or which are subject to legal, contractual, or other agreed upon restrictions on resale. Restricted securities are often purchased in private placement transactions, and cannot be sold without prior registration unless the sale is pursuant to an exemption under the 1933 Act. Disposal of these securities may require greater effort and expense, and prompt sale at an acceptable price may be difficult. The Funds may have registration rights for restricted securities. The issuer generally incurs all registration costs.
At April 30, 2013, the Franklin MicroCap Value Fund held investments in restricted securities, excluding certain securities exempt from registration under the 1933 Act deemed to be liquid, as follows:

9. HOLDINGS OF 5% VOTING SECURITIES OF PORTFOLIO COMPANIES
The 1940 Act defines “affiliated companies” to include investments in portfolio companies in which a fund owns 5% or more of the outstanding voting securities. Investments in “affiliated companies” for the Franklin Balance Sheet Investment Fund, the Franklin MicroCap Value Fund and the Franklin Small Cap Value Fund for the period ended April 30, 2013, were as shown below.

116 | Semiannual Report
Franklin Value Investors Trust
Notes to Financial Statements (unaudited) (continued)
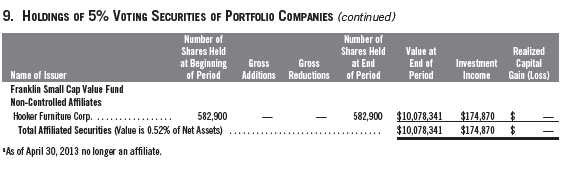
10. SPECIAL SERVICING AGREEMENT
The Franklin MicroCap Value Fund, which is an eligible underlying investment of one or more of the Franklin Templeton Fund Allocator Series Funds (Allocator Funds), participates in a Special Servicing Agreement (SSA) with the Allocator Funds and certain service providers of the fund and the Allocator Funds. Under the SSA, the fund may pay a portion of the Allocator Funds’ expenses (other than any asset allocation, administrative and distribution fees), to the extent such payments are less than the amount of the benefits realized or expected to be realized by the fund (e.g., due to reduced costs associated with servicing accounts) from the investment in the fund by the Allocator Funds. The Allocator Funds are either managed by Franklin Advisers, Inc. or administered by FT Services, affiliates of Advisory Services. For the period ended April 30, 2013, the fund was held by one or more of the Allocator Funds and the amount of expenses borne by the fund is noted in the Statements of Operations. At April 30, 2013, 9.98% of the fund’s outstanding shares were held by one or more of the Allocator Funds. Effective May 1, 2013, the SSA was discontinued until further notice and approval by the Board.
11. CREDIT FACILITY
The Funds, together with other U.S. registered and foreign investment funds (collectively, Borrowers), managed by Franklin Templeton Investments, are borrowers in a joint syndicated senior unsecured credit facility totaling $1.5 billion (Global Credit Facility) which matures on January 17, 2014. This Global Credit Facility provides a source of funds to the Borrowers for temporary and emergency purposes, including the ability to meet future unanticipated or unusually large redemption requests.
Under the terms of the Global Credit Facility, the Funds shall, in addition to interest charged on any borrowings made by the Funds and other costs incurred by the Funds, pay their share of fees and expenses incurred in connection with the implementation and maintenance of the Global Credit Facility, based upon their relative share of the aggregate net assets of all of the Borrowers, including an annual commitment fee of 0.07% based upon the unused portion of the Global Credit Facility. These fees are reflected in other expenses on the Statements of Operations. During the period ended April 30, 2013, the Funds did not use the Global Credit Facility.
Semiannual Report | 117
Franklin Value Investors Trust
Notes to Financial Statements (unaudited) (continued)
12. REDEMPTION IN-KIND
During the year ended October 31, 2012, the Franklin Balance Sheet Investment Fund realized $159,737,506 of net gains resulting from a redemption in-kind in which a shareholder redeemed fund shares for securities held by the Fund rather than for cash. Because such gains are not taxable to the Fund and are not distributed to remaining shareholders, they have been reclassified from accumulated net realized gains to paid-in capital.
13. FAIR VALUE MEASUREMENTS
The Funds follow a fair value hierarchy that distinguishes between market data obtained from independent sources (observable inputs) and the Funds’ own market assumptions (unobservable inputs). These inputs are used in determining the value of the Funds’ financial instruments and are summarized in the following fair value hierarchy:
- Level 1 – quoted prices in active markets for identical financial instruments
- Level 2 – other significant observable inputs (including quoted prices for similar financial instruments, interest rates, prepayment speed, credit risk, etc.)
- Level 3 – significant unobservable inputs (including the Funds’ own assumptions in deter- mining the fair value of financial instruments)
The inputs or methodology used for valuing financial instruments are not an indication of the risk associated with investing in those financial instruments.
For movements between the levels within the fair value hierarchy, the Funds have adopted a policy of recognizing the transfers as of the date of the underlying event which caused the movement.
A summary of inputs used as of April 30, 2013, in valuing the Funds’ assets carried at fair value, is as follows:
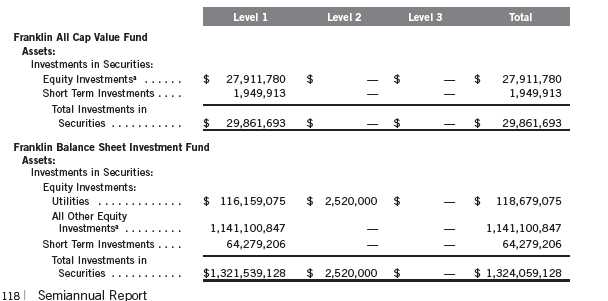
Franklin Value Investors Trust
Notes to Financial Statements (unaudited) (continued)
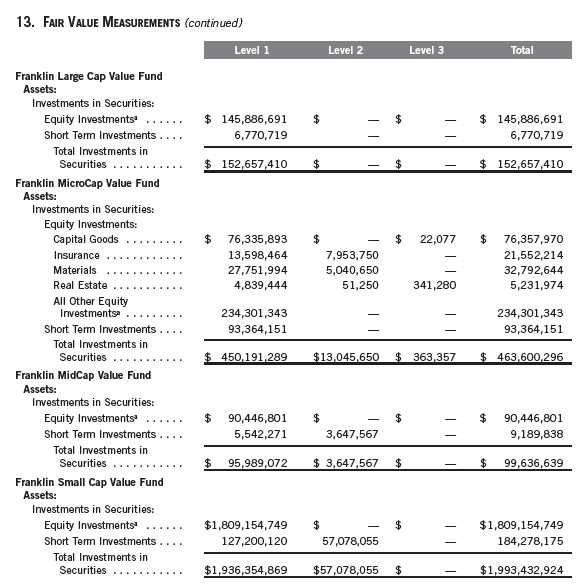
aFor detailed categories, see the accompanying Statement of Investments.
A reconciliation of assets in which Level 3 inputs are used in determining fair value is presented
when there are significant Level 3 investments at the end of the period.
Semiannual Report | 119
Franklin Value Investors Trust
Notes to Financial Statements (unaudited) (continued)
14. NEW ACCOUNTING PRONOUNCEMENTS
In December 2011, the Financial Accounting Standards Board (FASB) issued Accounting Standards Update (ASU) No. 2011-11, Balance Sheet (Topic 210): Disclosures about Offsetting Assets and Liabilities. The amendments in the ASU enhance disclosures about offsetting of financial assets and liabilities to enable investors to understand the effect of these arrangements on a fund’s financial position. In January 2013, FASB issued ASU No. 2013-01, Balance Sheet (Topic 210): Clarifying the Scope of Disclosures about Offsetting Assets and Liabilities. The amendments in ASU No. 2013-01 clarify the intended scope of disclosures required by ASU No. 2011-11. These ASUs are effective for interim and annual reporting periods beginning on or after January 1, 2013. The Funds believe the adoption of these ASUs will not have a material impact on their financial statements.
15. SUBSEQUENT EVENTS
The Funds have evaluated subsequent events through the issuance of the financial statements and determined that no events have occurred that require disclosure.
ABBREVIATIONS
Selected Portfolio
ADR - American Depositary Receipt
120 | Semiannual Report
Franklin Value Investors Trust
Shareholder Information
Board Review of Investment Management Agreement
At a meeting held February 26, 2013, the Board of Trustees (Board), including a majority of non-interested or independent Trustees, approved renewal of the investment management agreement for each of the Funds within the Trust (Fund(s)). In reaching this decision, the Board took into account information furnished throughout the year at regular Board meetings, as well as information prepared specifically in connection with the annual renewal review process. Information furnished and discussed throughout the year included investment performance reports and related financial information for each Fund, along with periodic reports on expenses, shareholder services, legal and compliance matters, risk control, pricing, brokerage commissions and execution and other services provided by the Investment Manager (Manager) and its affiliates, as well as a third-party survey of transfer agent fees charged funds within the Franklin Templeton Investments complex in comparison with those charged other fund complexes deemed comparable. Information furnished specifically in connection with the renewal process included a report for each Fund prepared by Lipper, Inc. (Lipper), an independent organization, as well as additional material, including a Fund profitability analysis prepared by management. The Lipper reports compared each Fund’s investment performance and expenses with those of other mutual funds deemed comparable to the Fund as selected by Lipper. The Fund profitability analysis discussed the profitability to Franklin Templeton Investments from its overall U.S. fund operations, as well as on an individual fund-by-fund basis. Additional material accompanying such profitability analysis included information on a fund-by-fund basis listing portfolio managers and other accounts they manage, as well as information on management fees charged by the Manager and its affiliates to U.S. mutual funds and other accounts, including management’s explanation of differences where relevant. Such material also included a memorandum prepared by management describing project initiatives and capital investments relating to the services provided to the Funds by the Franklin Templeton Investments organization, as well as a memorandum relating to economies of scale and an analysis concerning transfer agent fees charged by an affiliate of the Manager.
In considering such materials, the independent Trustees received assistance and advice from and met separately with independent counsel. While the investment management agreements for all Funds were considered at the same Board meeting, the Board dealt with each Fund separately. In approving continuance of the investment management agreement for each Fund, the Board, including a majority of independent Trustees, determined that the existing management fee structure was fair and reasonable and that continuance of the investment management agreement was in the best interests of each Fund and its shareholders. While attention was given to all information furnished, the following discusses some primary factors relevant to the Board’s decision.
NATURE, EXTENT AND QUALITY OF SERVICES. The Board was satisfied with the nature and quality of the overall services provided by the Manager and its affiliates to the Funds and their shareholders. In addition to investment performance and expenses discussed later, the Board’s opinion was based, in part, upon periodic reports furnished it showing that the investment policies and restrictions for each Fund were consistently complied with as well as other reports periodically furnished the Board covering matters such as the compliance of portfolio managers and other
Semiannual Report | 121
Franklin Value Investors Trust
Shareholder Information (continued)
Board Review of Investment Management Agreement (continued)
management personnel with the code of ethics adopted throughout the Franklin Templeton fund complex, the adherence to fair value pricing procedures established by the Board, and the accuracy of net asset value calculations. The Board also noted the extent of benefits provided Fund shareholders from being part of the Franklin Templeton family of funds, including the right to exchange investments between the same class of funds without a sales charge, the ability to reinvest Fund dividends into other funds and the right to combine holdings in other funds to obtain a reduced sales charge. Favorable consideration was given to management’s continuous efforts and expenditures in establishing back-up systems and recovery procedures to function in the event of a natural disaster, it being noted that such systems and procedures had functioned well during the Florida hurricanes and blackouts experienced in previous years, and that those operations in the New York/New Jersey area ran smoothly during the more recent Hurricane Sandy. Among other factors taken into account by the Board were the Manager’s best execution trading policies, including a favorable report on the efficiency of its trading operations by an independent portfolio trading analytical firm, which also covered foreign exchange transactions. Consideration was also given to the experience of each Fund’s portfolio management team, the number of accounts managed and general method of compensation. In this latter respect, the Board noted that a primary factor in management’s determination of a portfolio manager’s bonus compensation was the relative investment performance of the funds he or she managed and that a portion of such bonus was required to be invested in a predesignated list of funds within such person’s fund management area so as to be aligned with the interests of shareholders. In this respect, the Board after making inquiries of management, received assurances that bonus composition was not unduly influenced by one-year or short-term performance but was based primarily on longer periods consistent with the interests of long-term shareholders. The Board also took into account the quality of transfer agent and shareholder services provided Fund shareholders by an affiliate of the Manager and the continuous enhancements to the Franklin Templeton website. Particular attention was given to management’s conservative approach and diligent risk management procedures, including expanded collateralization requirements. It was noted that the Funds did not currently invest in derivatives or other complex instruments. The Board also took into account, among other things, management’s efforts in establishing a global credit facility for the benefit of the Funds and other accounts managed by Franklin Templeton Investments to provide a source of cash for temporary and emergency purposes or to meet unusual redemption requests as well as the strong financial position of the Manager’s parent company and its commitment to the mutual fund business as evidenced by its subsidization of money market funds.
INVESTMENT PERFORMANCE. The Board placed significant emphasis on the investment performance of each Fund in view of its importance to shareholders. While consideration was given to performance reports and discussions with the portfolio management team at Board meetings throughout the year, particular attention in assessing performance was given to the Lipper reports furnished for the agreement renewals. The Lipper reports prepared for each individual Fund showed the investment performance of its Class A shares in comparison to a performance universe
122 | Semiannual Report
Franklin Value Investors Trust
Shareholder Information (continued)
Board Review of Investment Management Agreement (continued)
selected by Lipper. Comparative performance for each Fund was shown for 2012 and for the previous 10 years ended December 31, 2012, for those Funds that had been in existence for such length of time, and for lesser periods for other Funds depending on when their operations commenced. The following summarizes the performance results for each of the Funds.
Franklin All Cap Value Fund – The performance universe for this Fund consisted of the Fund and all retail and institutional multi-cap value funds. The Lipper report showed the performance of the Fund to be in the second-lowest performing quintile of such universe during 2012, and on an annualized basis to be in the middle performing quintile of such universe for the previous three-year period, and the second-highest quintile of such universe during its five years of operation. The Board believed the Fund’s overall performance during its five-year period of operations was acceptable, noting that the Fund’s total return during 2012 as shown in the Lipper report exceeded 12.5%.
Franklin Balance Sheet Investment Fund – The performance universe for this Fund consisted of the Fund and all retail and institutional mid-cap value funds as selected by Lipper. The Lipper report showed the Fund’s total return during 2012 to be in the second-lowest quintile of such performance universe, and on an annualized basis to be in the lowest quintile of such universe for each of the previous three-, five- and 10-year periods. In discussing such performance, management pointed out that the Fund’s performance reflected adherence to its stated investment policy of investing in companies having low price-to-book ratios with strong balance sheets, which were generally out of favor during recent market periods. The Board believed the Fund’s performance did not warrant any change in portfolio management or the basic strategy employed and noted that the Fund’s 2012 total return as shown in the Lipper report exceeded 15.5%.
Franklin Large Cap Value Fund – The performance universe for this Fund consisted of the Fund and all retail and institutional large-cap value funds as selected by Lipper. The Lipper report comparison showed the Fund’s total return during 2012 to be in the lowest performing quintile of such universe, and on an annualized basis to also be in the lowest performing quintile of such universe for the previous three- and 10-year periods, and the second-lowest performing quintile of such universe for the previous five-year period. The Board was not satisfied with such performance, but believed that management was taking appropriate steps to improve it, including the hiring of an experienced analyst. The Board also noted that the Fund’s total return for 2012 as shown in the Lipper report exceeded 13%.
Franklin MicroCap Value Fund – The performance universe for this Fund consisted of the Fund and all retail and institutional small-cap value funds as selected by Lipper. The Lipper report comparison showed the Fund’s total return during 2012 to be in the highest performing quintile of such performance universe, and on an annualized basis to also be in the highest performing quin-tile of such universe for the previous three-year period and to be in the second-highest performing quintile of such universe during each of the previous five- and 10-year periods. The Board was satisfied with the Fund’s comparative performance as shown in the Lipper report.
Semiannual Report | 123
Franklin Value Investors Trust
Shareholder Information (continued)
Board Review of Investment Management Agreement (continued)
Franklin MidCap Value Fund – The performance universe for this Fund consisted of the Fund and all retail and institutional mid-cap value funds as selected by Lipper. The Lipper report showed the Fund’s total return for 2012 to be in the lowest performing quintile of such universe, and on an annualized basis to be in the second-lowest performing quintile of such universe for the previous three- and five-year periods. The Board was not satisfied with such performance, and discussed the Fund’s investment strategy with management and reasons for such comparative underperformance. Based on such discussions, the Board did not believe any immediate change in portfolio management was warranted, but intends to continuously monitor future performance. The Board also noted that the Fund’s 2012 total return as shown in the Lipper report exceeded 14%.
Franklin Small Cap Value Fund – The performance universe for this Fund consisted of the Fund and all retail and institutional small-cap value funds as selected by Lipper. The Lipper report comparison showed that the Fund’s total return for 2012 placed it in the second-highest performing quintile of such performance universe and that its total return on an annualized basis was in the highest performing quintile of such universe for the previous three-year period, in the second-highest performing quintile of such universe for the previous five-year period, and in the middle quintile of such universe for the previous 10-year period. The Board was satisfied with the Fund’s comparative performance as shown in the Lipper report.
COMPARATIVE EXPENSES. Consideration was given to a comparative analysis of the management fees and total expense ratio of each Fund compared with those of a group of other funds selected by Lipper as constituting its appropriate Lipper expense group. Lipper expense data is based upon information taken from each fund’s most recent annual report, which reflects historical asset levels that may be quite different from those currently existing, particularly in a period of market volatility. While recognizing such inherent limitation and the fact that expense ratios generally increase as assets decline and decrease as assets grow, the Board believed the independent analysis conducted by Lipper to be an appropriate measure of comparative expenses. In reviewing comparative costs, Lipper provides information on each Fund’s contractual investment management fee in comparison with the contractual investment management fee that would have been charged by other funds within its Lipper expense group assuming they were similar in size to the Fund, as well as the actual total expenses of the Fund in comparison with those of its expense group. The Lipper contractual investment management fee comparison includes within such fee any separate administrative fees, and the Lipper actual total expenses, for comparative consistency, are shown by Lipper for Fund Class A shares. Such expense comparisons in the case of each of Franklin Balance Sheet Investment Fund, Franklin MicroCap Value Fund, Franklin Small Cap Value Fund and Franklin All Cap Value Fund showed its contractual investment management fee rate and total expense ratio to be in either the least expensive or second least expensive quintile of its respective Lipper expense group. The Board was satisfied with the expenses of these Funds. The Lipper report for Franklin MidCap Value Fund showed both its contractual fee rate and its actual total expense ratio to be within five basis points above the median of its expense group. The Board found the expenses of such Fund to be acceptable, noting that they were being subsidized by management fee waivers. The Lipper report for Franklin Large Cap Value Fund showed its contractual
124 | Semiannual Report
Franklin Value Investors Trust
Shareholder Information (continued)
Board Review of Investment Management Agreement (continued)
investment management fee rate to be at the median of its expense group, and its actual total expense ratio to be within 13 basis points above the median of such expense group. The Board found the expenses of such Fund to be acceptable.
MANAGEMENT PROFITABILITY. The Board also considered the level of profits realized by the Manager and its affiliates in connection with the operation of each Fund. In this respect, the Board reviewed the Fund profitability analysis that addresses the overall profitability of Franklin Templeton’s U.S. fund business, as well as its profits in providing management and other services to each of the individual funds during the 12-month period ended September 30, 2012, being the most recent fiscal year-end for Franklin Resources, Inc., the Manager’s parent. In reviewing the analysis, attention was given to the methodology followed in allocating costs to each Fund, it being recognized that allocation methodologies are inherently subjective and various allocation methodologies may each be reasonable while producing different results. In this respect, the Board noted that, while being continuously refined and reflecting changes in the Manager’s own cost accounting, the cost allocation methodology was consistent with that followed in profitability report presentations for the Funds made in prior years and that the Funds’ independent registered public accounting firm had been engaged by the Manager to periodically review the reasonableness of the allocation methodologies solely for use by the Funds’ Board in reference to the profitability analysis. In reviewing and discussing such analysis, management discussed with the Board its belief that costs incurred in establishing the infrastructure necessary for the type of mutual fund operations conducted by the Manager and its affiliates may not be fully reflected in the expenses allocated to each Fund in determining its profitability, as well as the fact that the level of profits, to a certain extent, reflected operational cost savings and efficiencies initiated by management. The Board also took into account management’s expenditures in improving shareholder services provided the Funds, as well as the need to implement systems and meet additional regulatory and compliance requirements resulting from statutes such as the Sarbanes-Oxley and Dodd Frank Acts and recent SEC and other regulatory requirements. In addition, the Board considered a third-party study comparing the profitability of the Manager’s parent on an overall basis to other publicly held managers broken down to show profitability from management operations exclusive of distribution expenses, as well as profitability including distribution expenses. The Board also considered the extent to which the Manager and its affiliates might derive ancillary benefits from fund operations, including revenues generated from transfer agent services and potential benefits resulting from allocation of fund brokerage and the use of commission dollars to pay for research. Based upon its consideration of all these factors, the Board determined that the level of profits realized by the Manager and its affiliates from providing services to each Fund was not excessive in view of the nature, quality and extent of services provided.
ECONOMIES OF SCALE. The Board also considered whether economies of scale are realized by the Manager as the Funds grow larger and the extent to which this is reflected in the level of management fees charged. While recognizing that any precise determination is inherently subjective, the Board noted that based upon the Fund profitability analysis, it appears that as some funds get
Semiannual Report | 125
Franklin Value Investors Trust
Shareholder Information (continued)
Board Review of Investment Management Agreement (continued)
larger, at some point economies of scale do result in the Manager realizing a larger profit margin on management services provided such a fund. The Board also noted that economies of scale are shared with each Fund and its shareholders through management fee breakpoints so that as a Fund grows in size, its effective management fee rate declines. The fee structure under the investment management agreements for each of Franklin Balance Sheet Investment Fund and Franklin Large Cap Value Fund contains breakpoints that continued to asset levels that exceed the present size of these Funds, and the Board believed that to the extent economies of scale may be realized by the Manager of these Funds and their affiliates, there was a sharing of benefits with each of these Funds and its shareholders. The fee structure of Franklin Small Cap Value Fund provides an initial fee of 0.75% on the first $500 million of Fund net assets; 0.625% on the next $500 million of Fund net assets, and 0.50% on Fund net assets in excess of $1 billion. At December 31, 2012, the Fund’s net assets were approximately $1.75 billion. In discussing such fees, management expressed its view that the existing fee schedule reflected anticipated economies of scale and pointed out the Fund’s favorable effective management fee and total expense comparisons within its Lipper expense group. Management also observed and the Board acknowledged the fact that the Fund had assets beyond the last breakpoint level did not mean that it no longer benefited from economies of scale since the growth of assets being charged at the lowest 0.50% fee level resulted in a lower overall management fee rate. While intending to monitor future growth, the Board believed that to the extent economies of scale may be realized by the Manager and its affiliates, the current schedule of fees under the investment management agreement provides a reasonable sharing of benefits with the Fund and its shareholders. The fee structures of both Franklin MidCap Value Fund and Franklin All Cap Value Fund contain breakpoints and the Board felt that in view of their small size no economies of scale were realized in their operations, noting that the expenses of both Funds were subsidized by management. The fee structure under the investment management agreement for Franklin MicroCap Value Fund provides a flat fee of 0.75% at all asset levels. In discussing the absence of breakpoints with the independent Trustees, management pointed out that this Fund invests only in domestic and foreign securities with a market capitalization of less than $500 million that are believed to be undervalued. Management stated its belief that such limited investment options curtail the potential size of the Fund, thus preventing the type of economies of scale that might benefit other funds from increases in size and also pointed out that the Fund whose asset size was approximately $360 million at year-end has been closed to new investors, with limited exceptions, since January 14, 2004, and had a limited reopening on February 15, 2013, and closed again to new investors (with limited exceptions) on February 19, 2013. Management also expressed its view that this fee was low for this type of a fund and pointed out the favorable comparison of fees and expenses within its Lipper expense group. The independent Trustees acknowledged that management’s explanation provided a reasonable basis for believing the existing fee rate under the investment management agreement was fair and that in the current circumstances, management was not benefiting from any meaningful economies of scale in its management of this Fund.
126 | Semiannual Report
Franklin Value Investors Trust
Shareholder Information (continued)
Board Review of Investment Management Agreement (continued)
The investment management agreements for Franklin Balance Sheet Investment Fund, Franklin MicroCap Value Fund and Franklin Small Cap Value Fund cover both investment advisory and administrative services. In the case of each of Franklin Large Cap Value Fund, Franklin All Cap Value Fund and Franklin MidCap Value Fund, such services are provided under separate agreements with a fixed fee of 20 basis points being charged under an administration agreement for each Fund. At the February 26, 2013, Board meeting, the Board eliminated the separate agreements and approved a new form of investment management agreement for these Funds combining such services. In approving the new form of investment management agreements, the Board took into account the fact that the types of services and aggregate fee, including breakpoints, would be the same as provided under the previous separate agreements and that combining such services was consistent with Lipper’s methodology of considering contractual investment management fees to include any separately charged administrative fee. The Board also noted that combining the services under the new form of investment management agreement would have no impact on management’s subsidization of expenses of Franklin MidCap Value Fund and Franklin All Cap Value Fund.
Proxy Voting Policies and Procedures
The Trust’s investment manager has established Proxy Voting Policies and Procedures (Policies) that the Trust uses to determine how to vote proxies relating to portfolio securities. Shareholders may view the Trust’s complete Policies online at franklintempleton.com. Alternatively, shareholders may request copies of the Policies free of charge by calling the Proxy Group collect at (954) 527-7678 or by sending a written request to: Franklin Templeton Companies, LLC, 300 S.E. 2nd Street, Fort Lauderdale, FL 33301, Attention: Proxy Group. Copies of the Trust’s proxy voting records are also made available online at franklintempleton.com and posted on the U.S. Securities and Exchange Commission’s website at sec.gov and reflect the most recent 12-month period ended June 30.
Quarterly Statement of Investments
The Trust files a complete statement of investments with the U.S. Securities and Exchange Commission for the first and third quarters for each fiscal year on Form N-Q. Shareholders may view the filed Form N-Q by visiting the Commission’s website at sec.gov. The filed form may also be viewed and copied at the Commission’s Public Reference Room in Washington, DC. Information regarding the operations of the Public Reference Room may be obtained by calling (800) SEC-0330.
Semiannual Report | 127
This page intentionally left blank.

Item 2. Code of Ethics.
(a) The Registrant has adopted a code of ethics that applies to its
principal executive officers and principal financial and accounting
officer.
(c) N/A
(d) N/A
(f) Pursuant to Item 12(a)(1), the Registrant is attaching as an
exhibit a copy of its code of ethics that applies to its principal
executive officers and principal financial and accounting officer.
Item 3. Audit Committee Financial Expert.
(a)(1) The Registrant has an audit committee financial expert serving
on its audit committee.
(2) The audit committee financial expert is Frank T. Crohn and he is
"independent" as defined under the relevant Securities and Exchange
Commission Rules and Releases.
Item 4. Principal Accountant Fees and Services. N/A
Item 5. Audit Committee of Listed Registrants. N/A
Item 6. Schedule of Investments. N/A
Item 7. Disclosure of Proxy Voting Policies and Procedures for Closed-
End Management Investment Companies. N/A
Item 8. Portfolio Managers of Closed-End Management Investment
Companies. N/A
Item 9. Purchases of Equity Securities by Closed-End Management
Investment Company and Affiliated Purchasers. N/A
Item 10. Submission of Matters to a Vote of Security Holders.
There have been no changes to the procedures by which shareholders may
recommend nominees to the Registrant's Board of Trustees that would
require disclosure herein.
Item 11. Controls and Procedures.
(a) Evaluation of Disclosure Controls and Procedures. The Registrant
maintains disclosure controls and procedures that are designed to
ensure that information required to be disclosed in the Registrant’s
filings under the Securities Exchange Act of 1934 and the Investment
Company Act of 1940 is recorded, processed, summarized and reported
within the periods specified in the rules and forms of the Securities
and Exchange Commission. Such information is accumulated and
communicated to the Registrant’s management, including its principal
executive officer and principal financial officer, as appropriate, to
allow timely decisions regarding required disclosure. The Registrant’s
management, including the principal executive officer and the principal
financial officer, recognizes that any set of controls and procedures,
no matter how well designed and operated, can provide only reasonable
assurance of achieving the desired control objectives.
Within 90 days prior to the filing date of this Shareholder Report on
Form N-CSR, the Registrant had carried out an evaluation, under the
supervision and with the participation of the Registrant’s management,
including the Registrant’s principal executive officer and the
Registrant’s principal financial officer, of the effectiveness of the
design and operation of the Registrant’s disclosure controls and
procedures. Based on such evaluation, the Registrant’s principal
executive officer and principal financial officer concluded that the
Registrant’s disclosure controls and procedures are effective.
(b) Changes in Internal Controls. There have been no changes in the
Registrant’s internal controls or in other factors that could
materially affect the internal controls over financial reporting
subsequent to the date of their evaluation in connection with the
preparation of this Shareholder Report on Form N-CSR.
Item 12. Exhibits.
(a)(1) Code of Ethics
(a)(2) Certifications pursuant to Section 302 of the Sarbanes-Oxley Act
of 2002 of Laura F. Fergerson, Chief Executive Officer - Finance and
Administration, and Robert G. Kubilis, Chief Financial Officer and
Chief Accounting Officer
(b) Certifications pursuant to Section 906 of the Sarbanes-Oxley Act of
2002 of Laura F. Fergerson, Chief Executive Officer - Finance and
Administration, and Robert G. Kubilis, Chief Financial Officer and
Chief Accounting Officer
