UNITED STATES
SECURITIES AND EXCHANGE COMMISSION
Washington, DC 20549
FORM N-CSRS
CERTIFIED SHAREHOLDER REPORT OF REGISTERED MANAGEMENT INVESTMENT
COMPANIES
Investment Company Act file number 811-05878
Franklin Value Investors Trust___
(Exact name of registrant as specified in charter)
__One Franklin Parkway, San Mateo, CA 94403-1906_
(Address of principal executive offices) (Zip code)
Craig S. Tyle, One Franklin Parkway, San Mateo, CA 94403-1906_
(Name and address of agent for service)
Registrant's telephone number, including area Code: (650) 312-2000
Date of fiscal year end: 10/31
Date of reporting period: 4/30/16
Item 1. Reports to Stockholders.
.
| |
| Contents | |
| |
| Semiannual Report | |
| Economic and Market Overview | 3 |
| Franklin Balance Sheet Investment Fund | 4 |
| Franklin Large Cap Value Fund | 12 |
| Franklin MicroCap Value Fund | 20 |
| Franklin MidCap Value Fund | 26 |
| Franklin Small Cap Value Fund | 34 |
| Financial Highlights and Statements of Investments | 42 |
| Financial Statements | 82 |
| Notes to Financial Statements | 91 |
| Shareholder Information | 109 |
Visit franklintempleton.com for fund updates, to access your account, or to find helpful financial planning tools.
franklintempleton.com
Semiannual Report
Economic and Market Overview
The U.S. economy moderated in 2015’s fourth quarter and slowed further in 2016’s first quarter as exports, business investment and federal government spending declined. The manufacturing sector expanded in March and April after contracting for five consecutive months, while the services sector expanded throughout the six-month period under review. Growth in services contributed to new jobs and helped the unemployment rate to be largely stable at 5.0% throughout the review period.1 Home sales and prices rose amid relatively low mortgage rates. Monthly retail sales grew during most of the review period and rose to the highest level in April in more than a year, driven mainly by automobile sales. Inflation, as measured by the Consumer Price Index, remained relatively subdued due to low energy prices.
After maintaining a near-zero interest rate for seven years to support the U.S. economy’s recovery, the U.S. Federal Reserve (Fed) raised its target range for the federal funds rate to 0.25%–0.50% at its December meeting. At the time of the increase, policymakers cited the labor market’s considerable improvement and were reasonably confident that inflation would move back to the Fed’s 2.00% medium-term objective. The Fed maintained the rate through period-end, indicating it would monitor domestic and global developments and their implications on the labor markets as it tracks actual and expected progression toward its employment and inflation goals.
U.S. stock markets experienced sell-offs during the period under review, resulting from investor concerns about the timing of the Fed’s interest rate increases, global economic growth, China’s slowing economy and tumbling stock market, geopolitical tensions in certain regions and a plunge in crude oil prices. Investors generally remained confident, however as the Fed remained cautious about further interest rate increases, the eurozone economy improved, the European Central Bank expanded its quantitative easing measures and cut its benchmark interest rate to zero, the People’s Bank of China introduced further easing measures, and the Bank of Japan adopted a negative interest rate policy. The rally in crude oil prices toward period-end also boosted investor sentiment. Despite periods of volatility, the broad U.S. stock market ended the six-month period relatively flat, as measured by the Standard & Poor’s® 500 Index.
The foregoing information reflects our analysis and opinions as of April 30, 2016. The information is not a complete analysis of every aspect of any market, country, industry, security or fund. Statements of fact are from sources considered reliable.
1. Source: Bureau of Labor Statistics.
franklintempleton.com
Semiannual Report 3
Franklin Balance Sheet Investment Fund
This semiannual report for Franklin Balance Sheet Investment Fund covers the period ended April 30, 2016.
Your Fund’s Goal and Main Investments
The Fund seeks high total return, of which capital appreciation and income are components, by investing most of its assets in equity securities of companies of any size that we believe are undervalued in the marketplace at the time of purchase but have the potential for capital appreciation.
Performance Overview
The Fund’s Class A shares delivered a +1.11% cumulative total return for the six months under review. In comparison, the Russell 3000® Value Index, which measures performance of those Russell 3000® Index companies with lower price-to-book ratios and lower forecasted growth values, generated a +1.87% total return for the same period.1 You can find the Fund’s long-term performance data in the Performance Summary beginning on page 7.
Performance data represent past performance, which does not guarantee future results. Investment return and principal value will fluctuate, and you may have a gain or loss when you sell your shares. Current performance may differ from figures shown. For most recent month-end performance, go to franklintempleton.com or call (800) 342-5236.
Investment Strategy
Our strategy uses low price-to-book value as its primary reference valuation measure. Book value per share is a company’s net worth or shareholders’ equity on an accounting or “book” basis, divided by shares outstanding. The equity securities bought by the Fund will typically be purchased at a low price relative to book value. This strategy is not aimed at short-term trading gains, and we do not adhere to the composition of the benchmark. Rather, we try to identify individual companies that meet our investment criteria, with a 3-5 year investment horizon.
Manager’s Discussion
During the six months under review, holdings that contributed to Fund performance included Fabrinet, ORBCOMM and Century Aluminum. Fabrinet manufactures optical components and benefited during the period from growing data traffic demand, which fueled global telecommunications and data center networks’ need for optical components upgrades. We believe the company should continue to benefit from these

1. Source: Morningstar.
The index is unmanaged and includes reinvestment of any income or distributions. They do not reflect any fees, expenses or sales charges. One cannot invest directly in an
index, and an index is not representative of the Fund’s portfolio.
See www.franklintempletondatasources.com for additional data provider information.
The dollar value, number of shares or principal amount, and names of all portfolio holdings are listed in the Fund’s Statement of Investments (SOI).
The SOI begins on page 47.
4 Semiannual Report
franklintempleton.com
FRANKLIN BALANCE SHEET INVESTMENT FUND
trends for several years, which could expand profit margins and further enhance an already robust balance sheet. Shares of ORBCOMM, a wireless messaging services provider, improved partly due to the successful launch of its next generation satellites. The company also completed its decade-long capital expenditures program and subsequently stands to be free cash flow positive for the first time since 2006. Century Aluminum, an aluminum metal producer, improved its position as aluminum prices generally increased throughout the period. The company also implemented cost saving efficiencies and we believe these events should bode well for increased earnings and cash flows in the near term.
Detractors from Fund performance included National Western Life Group, Intrepid Potash and Citigroup. National Western Life Group, a life insurance provider, experienced lower earnings during the period as market volatility led to higher benefit costs in the company’s fixed-indexed annuities. The company also expected some temporary difficulties with its sales due to new U.S. Department of Labor regulations. The U.S. Federal Reserve’s decision to generally slow increasing rates also generally negatively impacted the life insurance industry. Intrepid Potash, a potash miner, continues to be plagued by its status as a high cost producer of potash. The domestic potash market is currently stressed by several issues including global over-supply of potash; a strong US dollar which encourages lower priced imports into the US; and weak demand from agricultural customers due to declining farm incomes. Intrepid is aggressively taking steps to mitigate losses from high cost production. Citigroup has made significant strides in recent years by fortifying its capital base and streamlining its operations, but as with most banking institutions, higher interest rates will be necessary for return on capital to move meaningfully higher. As the global economy continued to slow during the period, investor concerns surrounding a potential degrading credit quality reduced expectations for interest rates increases in 2016.
During the reporting period, several large new purchases included JP Morgan Chase, an investment banking services provider; Terex Corp, a machinery manufacturer; Marathon Oil, a liquid hydrocarbons and natural gas producer; Helmerich & Payne, an oil and gas drilling company; and Astec Industries, a construction equipment manufacturer; among several others. We also added to existing positions including Regal Beloit, an electric and mechanical products manufacturer; Chevron, an oil and gas company; and Devon Energy, an independent oil and gas exploration and production company. In contrast, the Fund’s largest liquidations included Apache Corp, Rofin-Sinar Technologies and Allegheny Technologies. We also reduced several holdings including KeyCorp, E-L Financial and Fresh Del Monte Produce. Additionally, StanCorp Financial’s acquisition by Meiji Yasuda Life Insurance was completed.
Thank you for your continued participation in Franklin Balance Sheet Investment Fund. We look forward to continuing to serve your investment needs.
| | |
| Top 10 Holdings | | |
| 4/30/16 | | |
| Company | % of Total | |
| Sector/Industry | Net Assets | |
| Corning Inc. | 3.7 | % |
| Technology Hardware & Equipment | | |
| First Solar Inc. | 3.0 | % |
| Semiconductors & Semiconductor Equipment | | |
| Photronics Inc. | 2.5 | % |
| Semiconductors & Semiconductor Equipment | | |
| Devon Energy Corp. | 2.5 | % |
| Energy | | |
| Fabrinet (Thailand) | 2.2 | % |
| Technology Hardware & Equipment | | |
| MKS Instruments Inc. | 2.1 | % |
| Semiconductors & Semiconductor Equipment | | |
| Encore Wire Corp. | 2.1 | % |
| Capital Goods | | |
| Citizens Financial Group Inc. | 2.0 | % |
| Banks | | |
| The Travelers Cos. Inc. | 1.9 | % |
| Property & Casualty Insurance | | |
| Bio-Rad Laboratories Inc. | 1.9 | % |
| Pharmaceuticals, Biotechnology & Life Sciences | | |

Bruce C. Baughman, CPA
Donald G. Taylor, CPA
Portfolio Management Team
franklintempleton.com
Semiannual Report 5
FRANKLIN BALANCE SHEET INVESTMENT FUND
The foregoing information reflects our analysis, opinions and portfolio holdings as of April 30, 2016, the end of the reporting period. The way we implement our main investment strategies and the resulting portfolio holdings may change depending on factors such as market and economic conditions. These opinions may not be relied upon as investment advice or an offer for a particular security. The information is not a complete analysis of every aspect of any market, country, industry, security or the Fund. Statements of fact are from sources considered reliable, but the investment manager makes no representation or warranty as to their completeness or accuracy. Although historical performance is no guarantee of future results, these insights may help you understand our investment management philosophy.
6 Semiannual Report
franklintempleton.com
FRANKLIN BALANCE SHEET INVESTMENT FUND
Performance Summary as of April 30, 2016
Your dividend income will vary depending on dividends or interest paid by securities in the Fund’s portfolio, adjusted for operating expenses of each class. Capital gain distributions are net profits realized from the sale of portfolio securities. The performance table does not reflect any taxes that a shareholder would pay on Fund dividends, capital gain distributions, if any, or any realized gains on the sale of Fund shares. Total return reflects reinvestment of the Fund’s dividends and capital gain distributions, if any, and any unrealized gains or losses.
| | | | | | |
| Net Asset Value | | | | | | |
| Share Class (Symbol) | | 4/30/16 | | 10/31/15 | | Change |
| A (FRBSX) | $ | 34.27 | $ | 40.06 | -$ | 5.79 |
| C (FCBSX) | $ | 33.05 | $ | 38.70 | -$ | 5.65 |
| R (FBSRX) | $ | 34.33 | $ | 40.06 | -$ | 5.73 |
| R6 (FBSIX) | $ | 35.19 | $ | 41.10 | -$ | 5.91 |
| Advisor (FBSAX) | $ | 35.24 | $ | 41.08 | -$ | 5.84 |
| |
| |
| Distributions1 (11/1/15–4/30/16) | | | | | | |
| | | Dividend | | Long-Term | | |
| Share Class | | Income | | Capital Gain | | Total |
| A | $ | 0.2796 | $ | 5.7721 | $ | 6.0517 |
| C | | — | $ | 5.7721 | $ | 5.7721 |
| R | $ | 0.1698 | $ | 5.7721 | $ | 5.9419 |
| R6 | $ | 0.4800 | $ | 5.7721 | $ | 6.2521 |
| Advisor | $ | 0.3673 | $ | 5.7721 | $ | 6.1394 |
See page 9 for Performance Summary footnotes.
franklintempleton.com
Semiannual Report 7
FRANKLIN BALANCE SHEET INVESTMENT FUND
PERFORMANCE SUMMARY
Performance as of 4/30/162
Cumulative total return excludes sales charges. Average annual total returns and value of $10,000 investment include maximum sales charges. Class A: 5.75% maximum initial sales charge; Class C: 1% contingent deferred sales charge in first year only;
Class R/R6/Advisor Class: no sales charges.
| | | | | | | | | | | | |
| | | | | | | Value of | Average Annual | | Total Annual Operating Expenses7 | |
| | Cumulative | | Average Annual | | $ | 10,000 | Total Return | | | | | |
| Share Class | Total Return3 | | Total Return4 | | | Investment5 | (3/31/16 | )6 | (with waiver) | | (without waiver) | |
| A | | | | | | | | | 0.95 | % | 0.96 | % |
| 6-Month | +1.11 | % | -4.69 | % | $ | 9,531 | | | | | | |
| 1-Year | -5.32 | % | -10.76 | % | $ | 8,924 | -10.42 | % | | | | |
| 5-Year | +29.92 | % | +4.14 | % | $ | 12,246 | +3.96 | % | | | | |
| 10-Year | +34.26 | % | +2.38 | % | $ | 12,654 | +2.35 | % | | | | |
| C | | | | | | | | | 1.70 | % | 1.71 | % |
| 6-Month | +0.72 | % | -0.13 | % | $ | 9,987 | | | | | | |
| 1-Year | -6.03 | % | -6.82 | % | $ | 9,318 | -6.47 | % | | | | |
| 5-Year | +25.17 | % | +4.59 | % | $ | 12,517 | +4.41 | % | | | | |
| 10-Year | +24.43 | % | +2.21 | % | $ | 12,443 | +2.18 | % | | | | |
| R | | | | | | | | | 1.20 | % | 1.21 | % |
| 6-Month | +0.96 | % | +0.96 | % | $ | 10,096 | | | | | | |
| 1-Year | -5.57 | % | -5.57 | % | $ | 9,443 | -5.20 | % | | | | |
| 5-Year | +28.32 | % | +5.11 | % | $ | 12,832 | +4.93 | % | | | | |
| 10-Year | +31.35 | % | +2.76 | % | $ | 13,135 | +2.73 | % | | | | |
| R6 | | | | | | | | | 0.51 | % | 0.52 | % |
| 6-Month | +1.35 | % | +1.35 | % | $ | 10,135 | | | | | | |
| 1-Year | -4.90 | % | -4.90 | % | $ | 9,510 | -4.54 | % | | | | |
| Since Inception (5/1/13) | +16.18 | % | +5.13 | % | $ | 11,618 | +4.70 | % | | | | |
| Advisor | | | | | | | | | 0.70 | % | 0.71 | % |
| 6-Month | +1.22 | % | +1.22 | % | $ | 10,122 | | | | | | |
| 1-Year | -5.11 | % | -5.11 | % | $ | 9,489 | -4.74 | % | | | | |
| 5-Year | +31.51 | % | +5.63 | % | $ | 13,151 | +5.45 | % | | | | |
| 10-Year | +39.53 | % | +3.39 | % | $ | 13,953 | +3.35 | % | | | | |
Performance data represent past performance, which does not guarantee future results. Investment return and principal value will fluctuate, and you may have a gain or loss when you sell your shares. Current performance may differ from figures shown. For most recent month-end performance, go to franklintempleton.com or call (800) 342-5236.
See page 9 for Performance Summary footnotes.
8 Semiannual Report
franklintempleton.com
FRANKLIN BALANCE SHEET INVESTMENT FUND
PERFORMANCE SUMMARY
All investments involve risks, including possible loss of principal. Value securities may not increase in price as anticipated or may decline further in value. While smaller and midsize companies may offer substantial opportunities for capital growth, they also involve heightened risks and should be considered speculative. Historically, smaller and midsize company securities have been more volatile in price than larger company securities, especially over the short term. The Fund may invest up to 25% of its total assets in foreign securities, which may involve special risks, including currency fluctuations and economic and political uncertainty. The Fund is actively managed but there is no guarantee that the manager’s investment decisions will produce the desired results. The Fund’s prospectus also includes a description of the main investment risks.
| |
| Class C: | These shares have higher annual fees and expenses than Class A shares. |
| Class R: | Shares are available to certain eligible investors as described in the prospectus. These shares have higher annual fees and expenses than Class A shares. |
| Class R6: | Shares are available to certain eligible investors as described in the prospectus. |
| Advisor Class: | Shares are available to certain eligible investors as described in the prospectus. |
1. The distribution amount is the sum of the dividend payments to shareholders for the period shown and includes only estimated tax-basis net investment income and capital
gain.
2. The Fund has a fee waiver associated with any investment in a Franklin Templeton money fund, contractually guaranteed through at least its current fiscal year-end. Fund
investment results reflect the fee waiver; without this reduction, the results would have been lower.
3. Cumulative total return represents the change in value of an investment over the periods indicated.
4. Average annual total return represents the average annual change in value of an investment over the periods indicated. Return for less than one year, ifany,hasnotbeen
annualized.
5. These figures represent the value of a hypothetical $10,000 investment in the Fund over the periods indicated.
6. In accordance with SEC rules, we provide standardized average annual total return information through the latest calendar quarter.
7. Figures are as stated in the Fund’s current prospectus and may differ from the expense ratios disclosed in the Financial Highlights in this report. In periods of market volatility,
assets may decline significantly, causing total annual Fund operating expenses to become higher than the figures shown.
franklintempleton.com
Semiannual Report 9
FRANKLIN BALANCE SHEET INVESTMENT FUND
Your Fund’s Expenses
As a Fund shareholder, you can incur two types of costs:
- Transaction costs, including sales charges (loads) on Fund purchases; and
- Ongoing Fund costs, including management fees, distribution and service (12b-1) fees, and other Fund expenses. All mutual funds have ongoing costs, sometimes referred to as operating expenses.
The following table shows ongoing costs of investing in the Fund and can help you understand these costs and compare them with those of other mutual funds. The table assumes a $1,000 investment held for the six months indicated.
Actual Fund Expenses
The first line (Actual) for each share class listed in the table provides actual account values and expenses. The “Ending Account Value” is derived from the Fund’s actual return, which includes the effect of Fund expenses.
You can estimate the expenses you paid during the period by following these steps. Of course, your account value and expenses will differ from those in this illustration:
| 1. | Divide your account value by $1,000. |
| | If an account had an $8,600 value, then $8,600 ÷ $1,000 = 8.6. |
| 2. | Multiply the result by the number under the heading “Expenses Paid During Period.” |
| | If Expenses Paid During Period were $7.50, then 8.6 x $7.50 = $64.50. |
In this illustration, the estimated expenses paid this period are $64.50.
Hypothetical Example for Comparison with Other Funds
Information in the second line (Hypothetical) for each class in the table can help you compare ongoing costs of investing in the Fund with those of other mutual funds. This information may not be used to estimate the actual ending account balance or expenses you paid during the period. The hypothetical “Ending Account Value” is based on the actual expense ratio for each class and an assumed 5% annual rate of return before expenses, which does not represent the Fund’s actual return. The figure under the heading “Expenses Paid During Period” shows the hypothetical expenses your account would have incurred under this scenario. You can compare this figure with the 5% hypothetical examples that appear in shareholder reports of other funds.
Please note that expenses shown in the table are meant to highlight ongoing costs and do not reflect any transaction costs, such as sales charges. Therefore, the second line for each class is useful in comparing ongoing costs only, and will not help you compare total costs of owning different funds. In addition, if transaction costs were included, your total costs would have been higher. Please refer to the Fund prospectus for additional information on operating expenses.
10 Semiannual Report
franklintempleton.com
| | | | | | |
| | | | | FRANKLIN BALANCE SHEET INVESTMENT FUND |
| | | | | | | YOUR FUND’S EXPENSES |
| |
| |
| |
| | | Beginning Account | | Ending Account | | Expenses Paid During |
| Share Class | | Value 11/1/15 | | Value 4/30/16 | | Period* 11/1/15–4/30/16 |
| A | | | | | | |
| Actual | $ | 1,000 | $ | 1,011.10 | $ | 4.70 |
| Hypothetical (5% return before expenses) | $ | 1,000 | $ | 1,020.19 | $ | 4.72 |
| C | | | | | | |
| Actual | $ | 1,000 | $ | 1,007.20 | $ | 8.43 |
| Hypothetical (5% return before expenses) | $ | 1,000 | $ | 1,016.46 | $ | 8.47 |
| R | | | | | | |
| Actual | $ | 1,000 | $ | 1,009.60 | $ | 5.95 |
| Hypothetical (5% return before expenses) | $ | 1,000 | $ | 1,018.95 | $ | 5.97 |
| R6 | | | | | | |
| Actual | $ | 1,000 | $ | 1,013.50 | $ | 2.55 |
| Hypothetical (5% return before expenses) | $ | 1,000 | $ | 1,022.33 | $ | 2.56 |
| Advisor | | | | | | |
| Actual | $ | 1,000 | $ | 1,012.20 | $ | 3.45 |
| Hypothetical (5% return before expenses) | $ | 1,000 | $ | 1,021.43 | $ | 3.47 |
*Expenses are calculated using the most recent six-month expense ratio, net of expense waivers, annualized for each class (A: 0.94%;
C: 1.69%; R: 1.19%; R6: 0.51%; and Advisor: 0.69%), multiplied by the average account value over the period, multiplied by 182/366 to reflect
the one-half year period.
franklintempleton.com
Semiannual Report 11
Franklin Large Cap Value Fund
This semiannual report for Franklin Large Cap Value Fund covers the period ended April 30, 2016. As previously communicated, shareholders approved the reorganization of Franklin Large Cap Value Fund into Franklin Rising Dividends Fund. The transaction was completed on May 20, 2016, and shares of Franklin Large Cap Value Fund share classes A, C, R and Advisor were exchanged for shares in Franklin Rising Dividends Fund share classes A, C, R and Advisor, respectively.
Your Fund’s Goal and Main Investments
The Fund seeks long-term capital appreciation by investing at least 80% of its net assets in large capitalization companies that we believe are undervalued. We define large capitalization companies as those with market capitalizations that are similar in size at the time of purchase to those in the Russell 1000® Index.1
Performance Overview
The Fund’s Class A shares had a -3.86% cumulative total return for the six months under review. In comparison, the Russell 1000® Value Index, which measures performance of those Russell 1000® Index companies with lower price-to-book ratios and lower forecasted growth values, generated a +1.93% total return.2 You can find the Fund’s long-term performance data in the Performance Summary beginning on page 15.
Performance data represent past performance, which does not guarantee future results. Investment return and principal value will fluctuate, and you may have a gain or loss when you sell your shares. Current performance may differ from figures shown. For most recent month-end performance, go to franklintempleton.com or call (800) 342-5236.
Investment Strategy
We seek to invest in securities of large capitalization companies that we believe are selling below their underlying worth and hold them until they reach what we consider their fair market value. Our aim is to construct a diversified portfolio of fundamentally sound companies purchased at attractive prices, often when they are out of favor with other investors for reasons we believe are temporary. Portfolio securities are selected without regard to benchmark comparisons and are based on fundamental, bottom-up research focusing on several criteria, such as low price relative to earnings, cash flow or book value. We also consider stocks with recent sharp price declines that we believe still have significant growth potential or that possess valuable intangibles not reflected in the stock price.
Manager’s Discussion
During the six months under review, holdings that contributed to Fund performance included Albemarle, Eaton and Chevron. Shares of Albemarle, a specialty and fine chemicals producer, rebounded strongly over the period as general economic concerns waned and the company reported better-than-expected earnings. The company’s 2016 outlook was more cautious than anticipated, but ongoing strength in key businesses and expectations for a significant increase in free cash flow generation benefited the company. Additionally, Albemarle struck an agreement with the Chilean government that extended the duration of its lithium production. Eaton, a manufacturer of engineered products for the industrial, vehicle, construction and aerospace markets, benefited from better-than-expected earnings due to improved cost controls, along with signs of an improving operating environment. The company remains one of the cheapest among large cap industrials. Chevron, an oil and gas company, experienced a share price increase partly due to improving oil prices, capital spending cuts and an improved outlook regarding oil production in the near term.
Detractors from Fund performance included Perrigo, Western Digital and HollyFrontier. Shares of Perrigo, a manufacturer of over-the-counter pharmaceuticals, declined after a weak earnings report led by underperformance in its recently acquired subsidiary Omega. During the period, Omega announced a series of restructuring and leadership changes, but a failed hostile takeover by Mylan delayed implementation of these beneficial changes. We continue to believe Perrigo’s capabilities position it uniquely within the generics and over-the-counter categories. Western Digital, a data storage solutions provider, experienced a weaker-than-expected demand for hard disk drives due to a weak personal computer environment. Investor concerns surrounding the merits of its
1. The Russell 1000 Index is market capitalization weighted and measures performance of the largest companies in the Russell 3000 Index, which represents the majority of the
U.S. market’s total market capitalization.
2. Source: Morningstar.
The index is unmanaged and includes reinvestment of any income or distributions. They do not reflect any fees, expenses or sales charges. One cannot invest directly in an
index, and an index is not representative of the Fund’s portfolio.
See www.franklintempletondatasources.com for additional data provider information.
The dollar value, number of shares or principal amount, and names of all portfolio holdings are listed in the Fund’s Statement of Investments (SOI).
The SOI begins on page 54.
12 Semiannual Report
franklintempleton.com
FRANKLIN LARGE CAP VALUE FUND
SanDisk acquisition also hurt the company. Shares of petroleum refiner and marketer HollyFrontier declined as profit margins were negatively affected by the narrowing spread between U.S. crude oil prices and international benchmarks. We exited the position during the period.
During the reporting period, we initiated one new position in the aforementioned Perrigo, and we added to some positions
including QUALCOMM, a telecommunications products and services provider; Microsoft, a software provider and KKR & Company, an investment and private equity asset manager. In contrast, we liquidated several positions held by the Fund including Xerox, Comerica, SanDisk, Regions Financial and Bank of America, among others. We reduced holdings in some positions including First Solar, MetLife and Prudential.
Thank you for your participation in Franklin Large Cap Value Fund. It has been a pleasure serving your investment needs.
| | |
| Top 10 Holdings | | |
| 4/30/16 | | |
| Company | % of Total | |
| Sector/Industry | Net Assets | |
| Microsoft Corp. | 2.9 | % |
| Software & Services | | |
| Perrigo Co. PLC | 2.7 | % |
| Pharmaceuticals, Biotechnology & Life Sciences | | |
| Johnson Controls Inc. | 2.4 | % |
| Automobiles & Components | | |
| Aflac Inc. | 2.2 | % |
| Insurance | | |
| QUALCOMM Inc. | 2.2 | % |
| Semiconductors & Semiconductor Equipment | | |
| Becton, Dickinson and Co. | 2.2 | % |
| Health Care Equipment & Services | | |
| NIKE Inc. | 2.2 | % |
| Consumer Durables & Apparel | | |
| The Allstate Corp. | 2.1 | % |
| Insurance | | |
| General Dynamics Corp. | 2.1 | % |
| Capital Goods | | |
| Corning Inc. | 2.1 | % |
| Technology Hardware & Equipment | | |


William J. Lippman
Lead Portfolio Manager
Jakov Stipanov, CFA
Donald G. Taylor, CPA
Bruce C. Baughman, CPA
Portfolio Management Team
CFA® is a trademark owned by CFA Institute.
franklintempleton.com
Semiannual Report 13
FRANKLIN LARGE CAP VALUE FUND
The foregoing information reflects our analysis, opinions and portfolio holdings as of April 30, 2016, the end of the reporting period. The way we implement our main investment strategies and the resulting portfolio holdings may change depending on factors such as market and economic conditions. These opinions may not be relied upon as investment advice or an offer for a particular security. The information is not a complete analysis of every aspect of any market, country, industry, security or the Fund. Statements of fact are from sources considered reliable, but the investment manager makes no representation or warranty as to their completeness or accuracy. Although historical performance is no guarantee of future results, these insights may help you understand our investment management philosophy.
14 Semiannual Report
franklintempleton.com
FRANKLIN LARGE CAP VALUE FUND
Performance Summary as of April 30, 2016
Your dividend income will vary depending on dividends or interest paid by securities in the Fund’s portfolio, adjusted for operating expenses of each class. Capital gain distributions are net profits realized from the sale of portfolio securities. The performance table does not reflect any taxes that a shareholder would pay on Fund dividends, capital gain distributions, if any, or any realized gains on the sale of Fund shares. Total return reflects reinvestment of the Fund’s dividends and capital gain distributions, if any, and any unrealized gains or losses.
| | | | | | | | |
| Net Asset Value | | | | | | | | |
| Share Class (Symbol) | | 4/30/16 | | 10/31/15 | | Change | | |
| A (FLVAX) | $ | 15.61 | $ | 17.86 | -$ | 2.25 | | |
| C (FLCVX) | $ | 15.45 | $ | 17.61 | -$ | 2.16 | | |
| R (FLCRX) | $ | 15.50 | $ | 17.71 | -$ | 2.21 | | |
| Advisor (N/A) | $ | 15.53 | $ | 17.81 | -$ | 2.28 | | |
| |
| |
| Distributions1 (11/1/15–4/30/16) | | | | | | | | |
| | | Dividend | | Short-Term | | Long-Term | | |
| Share Class | | Income | | Capital Gain | | Capital Gain | | Total |
| A | $ | 0.1595 | $ | 0.0214 | $ | 1.3867 | $ | 1.5676 |
| C | $ | 0.0255 | $ | 0.0214 | $ | 1.3867 | $ | 1.4336 |
| R | $ | 0.1167 | $ | 0.0214 | $ | 1.3867 | $ | 1.5248 |
| Advisor | $ | 0.2125 | $ | 0.0214 | $ | 1.3867 | $ | 1.6206 |
See page 17 for Performance Summary footnotes.
franklintempleton.com
Semiannual Report 15
FRANKLIN LARGE CAP VALUE FUND
PERFORMANCE SUMMARY
Performance as of 4/30/162
Cumulative total return excludes sales charges. Average annual total returns and value of $10,000 investment include maximum sales charges. Class A: 5.75% maximum initial sales charge; Class C: 1% contingent deferred sales charge in first year only;
Class R/Advisor Class: no sales charges.
| | | | | | | | | | |
| | Cumulative | | Average Annual | | | Value of | Average Annual | | Total Annual | |
| Share Class | Total Return3 | | Total Return4 | | $ | 10,000 Investment5 | Total Return (3/31/16)6 | | Operating Expenses7 | |
| A | | | | | | | | | 1.28 | % |
| 6-Month | -3.86 | % | -9.39 | % | $ | 9,061 | | | | |
| 1-Year | -9.20 | % | -14.40 | % | $ | 8,560 | -14.25 | % | | |
| 5-Year | +31.93 | % | +4.46 | % | $ | 12,435 | +4.82 | % | | |
| 10-Year | +38.05 | % | +2.67 | % | $ | 13,009 | +2.88 | % | | |
| C | | | | | | | | | 2.03 | % |
| 6-Month | -4.19 | % | -5.07 | % | $ | 9,493 | | | | |
| 1-Year | -9.87 | % | -10.69 | % | $ | 8,931 | -10.51 | % | | |
| 5-Year | +27.36 | % | +4.96 | % | $ | 12,736 | +5.34 | % | | |
| 10-Year | +28.78 | % | +2.56 | % | $ | 12,878 | +2.78 | % | | |
| R | | | | | | | | | 1.53 | % |
| 6-Month | -3.91 | % | -3.91 | % | $ | 9,609 | | | | |
| 1-Year | -9.39 | % | -9.39 | % | $ | 9,061 | -9.27 | % | | |
| 5-Year | +30.56 | % | +5.48 | % | $ | 13,056 | +5.84 | % | | |
| 10-Year | +35.26 | % | +3.07 | % | $ | 13,526 | +3.28 | % | | |
| Advisor | | | | | | | | | 1.03 | % |
| 6-Month | -3.74 | % | -3.74 | % | $ | 9,626 | | | | |
| 1-Year | -8.95 | % | -8.95 | % | $ | 9,105 | -8.83 | % | | |
| 5-Year | +33.85 | % | +6.00 | % | $ | 13,385 | +6.38 | % | | |
| 10-Year | +42.20 | % | +3.58 | % | $ | 14,220 | +3.80 | % | | |
Performance data represent past performance, which does not guarantee future results. Investment return and principal value will fluctuate, and you may have a gain or loss when you sell your shares. Current performance may differ from figures shown. For most recent month-end performance, go to franklintempleton.com or call (800) 342-5236.
See page 17 for Performance Summary footnotes.
16 Semiannual Report
franklintempleton.com
FRANKLIN LARGE CAP VALUE FUND
PERFORMANCE SUMMARY
All investments involve risks, including possible loss of principal. Stock prices fluctuate, sometimes rapidly and dramatically, due to factors affecting individual companies, particular industries or sectors, or general market conditions. These price movements may result from factors affecting individual companies, industries or the securities market as a whole. The Fund may invest up to 25% of its total assets in foreign securities, which may involve special risks, including currency fluctuations and economic and political uncertainty. The Fund is actively managed but there is no guarantee that the manager’s investment decisions will produce the desired results. The Fund’s prospectus also includes a description of the main investment risks.
| |
| Class C: | These shares have higher annual fees and expenses than Class A shares. |
| Class R: | Shares are available to certain eligible investors as described in the prospectus. These shares have higher annual fees and expenses than Class A shares. |
| Advisor Class: | Shares are available to certain eligible investors as described in the prospectus. |
1. The distribution amount is the sum of the dividend payments to shareholders for the period shown and includes only estimated tax-basis net investment income and capital
gain.
2. The Fund has a fee waiver associated with any investment in a Franklin Templeton money fund, contractually guaranteed through at least its current fiscal year-end. Fund
investment results reflect the fee waiver, to the extent applicable; without this reduction, the results would have been lower.
3. Cumulative total return represents the change in value of an investment over the periods indicated.
4. Average annual total return represents the average annual change in value of an investment over the periods indicated. Return for less than one year, ifany,hasnotbeen
annualized.
5. These figures represent the value of a hypothetical $10,000 investment in the Fund over the periods indicated.
6. In accordance with SEC rules, we provide standardized average annual total return information through the latest calendar quarter.
7. Figures are as stated in the Fund’s current prospectus and may differ from the expense ratios disclosed in the Financial Highlights in this report. In periods of market volatility,
assets may decline significantly, causing total annual Fund operating expenses to become higher than the figures shown.
franklintempleton.com
Semiannual Report 17
FRANKLIN LARGE CAP VALUE FUND
Your Fund’s Expenses
As a Fund shareholder, you can incur two types of costs:
- Transaction costs, including sales charges (loads) on Fund purchases; and
- Ongoing Fund costs, including management fees, distribution and service (12b-1) fees, and other Fund expenses. All mutual funds have ongoing costs, sometimes referred to as operating expenses.
The following table shows ongoing costs of investing in the Fund and can help you understand these costs and compare them with those of other mutual funds. The table assumes a $1,000 investment held for the six months indicated.
Actual Fund Expenses
The first line (Actual) for each share class listed in the table provides actual account values and expenses. The “Ending Account Value” is derived from the Fund’s actual return, which includes the effect of Fund expenses.
You can estimate the expenses you paid during the period by following these steps. Of course, your account value and expenses will differ from those in this illustration:
| 1. | Divide your account value by $1,000. |
| | If an account had an $8,600 value, then $8,600 ÷ $1,000 = 8.6. |
| 2. | Multiply the result by the number under the heading “Expenses Paid During Period.” |
| | If Expenses Paid During Period were $7.50, then 8.6 x $7.50 = $64.50. |
In this illustration, the estimated expenses paid this period are $64.50.
Hypothetical Example for Comparison with Other Funds
Information in the second line (Hypothetical) for each class in the table can help you compare ongoing costs of investing in the Fund with those of other mutual funds. This information may not be used to estimate the actual ending account balance or expenses you paid during the period. The hypothetical “Ending Account Value” is based on the actual expense ratio for each class and an assumed 5% annual rate of return before expenses, which does not represent the Fund’s actual return. The figure under the heading “Expenses Paid During Period” shows the hypothetical expenses your account would have incurred under this scenario. You can compare this figure with the 5% hypothetical examples that appear in shareholder reports of other funds.
Please note that expenses shown in the table are meant to highlight ongoing costs and do not reflect any transaction costs, such as sales charges. Therefore, the second line for each class is useful in comparing ongoing costs only, and will not help you compare total costs of owning different funds. In addition, if transaction costs were included, your total costs would have been higher. Please refer to the Fund prospectus for additional information on operating expenses.
18 Semiannual Report
franklintempleton.com
| | | | | | |
| | | | | | | FRANKLIN LARGE CAP VALUE FUND |
| | | | | | | YOUR FUND’S EXPENSES |
| |
| |
| |
| | | Beginning Account | | Ending Account | | Expenses Paid During |
| Share Class | | Value 11/1/15 | | Value 4/30/16 | | Period* 11/1/15–4/30/16 |
| A | | | | | | |
| Actual | $ | 1,000 | $ | 961.40 | $ | 6.39 |
| Hypothetical (5% return before expenses) | $ | 1,000 | $ | 1,018.35 | $ | 6.57 |
| C | | | | | | |
| Actual | $ | 1,000 | $ | 958.10 | $ | 9.93 |
| Hypothetical (5% return before expenses) | $ | 1,000 | $ | 1,014.72 | $ | 10.22 |
| R | | | | | | |
| Actual | $ | 1,000 | $ | 960.90 | $ | 7.61 |
| Hypothetical (5% return before expenses) | $ | 1,000 | $ | 1,017.11 | $ | 7.82 |
| Advisor | | | | | | |
| Actual | $ | 1,000 | $ | 962.60 | $ | 5.17 |
| Hypothetical (5% return before expenses) | $ | 1,000 | $ | 1,019.59 | $ | 5.32 |
*Expenses are calculated using the most recent six-month expense ratio, net of expense waivers, annualized for each class (A: 1.31%;
C: 2.04%; R: 1.56%; and Advisor: 1.06%), multiplied by the average account value over the period, multiplied by 182/366 to reflect the
one-half year period.
franklintempleton.com
Semiannual Report 19
Franklin Microcap Value Fund
We are pleased to bring you Franklin MicroCap Value Fund’s semiannual report for the period ended April 30, 2016. The Fund closed to new investors (with the exception of certain retirement accounts) in January 2004 and has remained closed except for two days in mid-February 2013, when the Fund was opened on a limited basis. Existing shareholders may add to or reduce their investments in the Fund; however, once an account is reduced to zero, it may not be reopened unless the Fund reopens.
Your Fund’s Goal and Main Investments
The Fund seeks high total return, of which capital appreciation and income are components, by investing at least 80% of its net assets in securities of companies with market capitalizations under $500 million at the time of purchase that we believe are undervalued in the marketplace.1
Performance Overview
The Fund’s Class A shares delivered a +5.80% cumulative total return for the six months under review. In comparison, the Russell 2000® Value Index, which measures performance of those Russell 2000® Index companies with lower price-to-book ratios and lower forecasted growth values, had a +1.18% total return.2 You can find the Fund’s long-term performance data in the Performance Summary beginning on page 23.
Performance data represent past performance, which does not guarantee future results. Investment return and principal value will fluctuate, and you may have a gain or loss when you sell your shares. Current performance may differ from figures shown. For most recent month-end performance, go to franklintempleton.com or call (800) 342-5236.
Investment Strategy
Our strategy is to buy shares of financially sound, well-established companies at a low price-to-book value, where we have reasonable confidence that book value will increase over several years. We limit purchases to companies with market capitalizations of less than $500 million, which we define as “microcap.”1 Book value per share is a company’s net worth or shareholders’ equity on an accounting or “book” basis, divided by shares outstanding. This strategy is not aimed at short-term trading gains, nor do we consider the composition of any index. Rather, we try to identify individual companies that meet our investment criteria, and we assume at purchase that we will hold the positions for several years.
Manager’s Discussion
During the six months under review, holdings that contributed to Fund performance included Olympic Steel, Hardinge and Delta Apparel. Olympic Steel, which processes and distributes flat-rolled and tubular steel, is highly sensitive to import pricing, dollar strength and domestic end markets. Recent trade actions to counter the effects of low priced imports stand to improve Olympic Steel’s cash margins. Hardinge manufactures metal cutting and grinding machines in the U.S., Europe and China. Despite currency headwinds, profit margins and cash flow increased in the fourth quarter of 2015. In August 2015, Hardinge announced a strategic review, which it expects to complete in mid-2016 and could lead to the sale of the company. Delta Apparel manufactures leisure and athletic wear, both branded and private label, primarily t-shirts and fleece garments. Delta stabilized market share losses at the Soffe brand, and its Salt Life brand appears to be a growth engine. Management highlighted their outlook for continued higher earnings and cash flows in their February earnings call.
Detractors from Fund performance included Ardmore Shipping, Ducommun and Global Power Equipment Group. Shares of Ardmore Shipping, a product and chemical tanker fleet operator, declined as a combination of routine refinery maintenance and an unscheduled outage at ExxonMobil’s Beaumont, Texas, complex hurt results. Ducommun makes structural and electronic parts and assemblies primarily for aerospace and defense applications. The company’s program to deleverage following the 2011 LaBarge Technologies acquisition faltered in mid-2015, when cost overruns on contracts and other stumbles led to impairments and management changes. Global Power Equipment Group makes equipment and offers engineering services for the power generation industry. In May, 2015 the company delayed filing quarterly results and indicated it would restate prior results because of accounting errors. In August, Global Power disclosed the loss of a long-term contract with a large customer.
1. Effective 12/10/12, the maximum market capitalization for each investment that the Fund can invest in increased from $400 million at time of purchase to $500 million.
2. Source: Morningstar.
The index is unmanaged and includes reinvestment of any income or distributions. They do not reflect any fees, expenses or sales charges. One cannot invest directly in an
index, and an index is not representative of the Fund’s portfolio.
See www.franklintempletondatasources.com for additional data provider information.
The dollar value, number of shares or principal amount, and names of all portfolio holdings are listed in the Fund’s Statement of Investments (SOI).
The SOI begins on page 60.
20 Semiannual Report
franklintempleton.com
FRANKLIN MICROCAP VALUE FUND
By the end of April, 2016 the company still had not reported results for any period since 2014 and has not produced restated results for any period.
During the reporting period, we initiated several positions including Armstrong Flooring, a flooring products provider; ORBCOMM, a wireless messaging services provider; Schnitzer Steel Industries, a metals recycling operator; Global Ship Lease, a containership chartering company and Americas Car Mart, an automotive retailer. We also added to some positions including Northwest Pipe, a water pipe fabricator; Orion Marine Group, a marine construction services provider and Gulf Island Fabrication, a specialized steel structure manufacturer. We exited positions in Lydall, Midsouth BanCorp, Kelly Services, Leapfrog Enterprises and Dixie Group. The Fund reduced its holdings in several positions in response to price appreciation including Omega Protein, Gibraltar Industries and John B. SanFilippo & Son.
Thank you for your continued participation in Franklin MicroCap Value Fund. We look forward to continuing to serve your investment needs.
| | |
| Top 10 Holdings | | |
| 4/30/16 | | |
| Company | % of Total | |
| Sector/Industry | Net Assets | |
| Seneca Foods Corp. | 4.9 | % |
| Food, Beverage & Tobacco | | |
| Delta Apparel Inc. | 3.5 | % |
| Consumer Durables & Apparel | | |
| Hurco Cos. Inc. | 3.4 | % |
| Machinery | | |
| Hardinge Inc. | 3.3 | % |
| Machinery | | |
| Healthcare Services Group Inc. | 3.0 | % |
| Commercial & Professional Services | | |
| PHI Inc. | 2.8 | % |
| Energy | | |
| Bar Harbor Bankshares | 2.3 | % |
| Banks | | |
| Baldwin & Lyons Inc. | 2.3 | % |
| Insurance | | |
| Olympic Steel Inc. | 2.3 | % |
| Materials | | |
| Miller Industries Inc. | 2.2 | % |
| Machinery | | |


Bruce C. Baughman, CPA
Lead Portfolio Manager
Donald G. Taylor, CPA
Portfolio Management Team
franklintempleton.com
Semiannual Report 21
FRANKLIN MICROCAP VALUE FUND
The foregoing information reflects our analysis, opinions and portfolio holdings as of April 30, 2016, the end of the reporting period. The way we implement our main investment strategies and the resulting portfolio holdings may change depending on factors such as market and economic conditions. These opinions may not be relied upon as investment advice or an offer for a particular security. The information is not a complete analysis of every aspect of any market, country, industry, security or the Fund. Statements of fact are from sources considered reliable, but the investment manager makes no representation or warranty as to their completeness or accuracy. Although historical performance is no guarantee of future results, these insights may help you understand our investment management philosophy.
22 Semiannual Report
franklintempleton.com
FRANKLIN MICROCAP VALUE FUND
Performance Summary as of April 30, 2016
Your dividend income will vary depending on dividends or interest paid by securities in the Fund’s portfolio, adjusted for operating expenses of each class. Capital gain distributions are net profits realized from the sale of portfolio securities. The performance table does not reflect any taxes that a shareholder would pay on Fund dividends, capital gain distributions, if any, or any realized gains on the sale of Fund shares. Total return reflects reinvestment of the Fund’s dividends and capital gain distributions, if any, and any unrealized gains or losses.
| | | | | | |
| Net Asset Value | | | | | | |
| Share Class (Symbol) | | 4/30/16 | | 10/31/15 | | Change |
| A (FRMCX) | $ | 30.62 | $ | 32.90 | -$ | 2.28 |
| R6 (FMCVX) | $ | 30.88 | $ | 33.09 | -$ | 2.21 |
| Advisor (FVRMX) | $ | 30.76 | $ | 33.00 | -$ | 2.24 |
| |
| |
| Distributions1 (11/1/15–4/30/16) | | | | | | |
| | | Long-Term | | | | |
| Share Class | | Capital Gain | | | | |
| A | $ | 3.8954 | | | | |
| R6 | $ | 3.8954 | | | | |
| Advisor | $ | 3.8954 | | | | |
See page 24 for Performance Summary footnotes.
franklintempleton.com
Semiannual Report 23
FRANKLIN MICROCAP VALUE FUND
PERFORMANCE SUMMARY
Performance as of 4/30/162
Cumulative total return excludes sales charges. Average annual total returns and value of $10,000 investment include maximum sales charges. Class A: 5.75% maximum initial sales charge;Class R6/Advisor Class: no sales charges.
| | | | | | | | | | | | |
| | | | | | | Value of | Average Annual | | Total Annual Operating Expenses7 | |
| | Cumulative | | Average Annual | | $ | 10,000 | Total Return | | | | | |
| Share Class | Total Return3 | | Total Return4 | | | Investment5 | (3/31/16 | )6 | (with waiver) | | (without waiver) | |
| A | | | | | | | | | 1.20 | % | 1.21 | % |
| 6-Month | +5.80 | % | -0.29 | % | $ | 9,971 | | | | | | |
| 1-Year | -0.75 | % | -6.45 | % | $ | 9,355 | -9.48 | % | | | | |
| 5-Year | +43.61 | % | +6.24 | % | $ | 13,535 | +5.38 | % | | | | |
| 10-Year | +75.11 | % | +5.14 | % | $ | 16,502 | +4.75 | % | | | | |
| R6 | | | | | | | | | 0.81 | % | 0.82 | % |
| 6-Month | +6.00 | % | +6.00 | % | $ | 10,600 | | | | | | |
| 1-Year | -0.36 | % | -0.36 | % | $ | 9,964 | -3.57 | % | | | | |
| Since Inception (5/1/13) | +20.36 | % | +6.38 | % | $ | 12,036 | +5.40 | % | | | | |
| Advisor | | | | | | | | | 0.96 | % | 0.97 | % |
| 6-Month | +5.91 | % | +5.91 | % | $ | 10,591 | | | | | | |
| 1-Year | -0.51 | % | -0.51 | % | $ | 9,949 | -3.72 | % | | | | |
| 5-Year | +45.34 | % | +7.76 | % | $ | 14,534 | +6.89 | % | | | | |
| 10-Year | +79.29 | % | +6.01 | % | $ | 17,929 | +5.62 | % | | | | |
Performance data represent past performance, which does not guarantee future results. Investment return and principal value will fluctuate, and you may have a gain or loss when you sell your shares. Current performance may differ from figures shown. For most recent month-end performance, go to franklintempleton.com or call (800) 342-5236.
All investments involve risks, including possible loss of principal. The Fund’s ability to invest in smaller company securities that may have limited liquidity involves additional risks, such as relatively small revenues, limited product lines and small market share. Historically, these stocks have exhibited greater price volatility than larger company stocks, especially over the short term. In addition, the Fund may invest up to 25% of its total assets in foreign securities, which involve special risks, including currency fluctuations and economic and political uncertainty. The Fund is actively managed but there is no guarantee that the manager’s investment decisions will produce the desired results. The Fund’s prospectus also includes a description of the main investment risks.
| |
| Class R6: | Shares are available to certain eligible investors as described in the prospectus. |
| Advisor Class: | Shares are available to certain eligible investors as described in the prospectus. |
1. The distribution amount is the sum of the dividend payments to shareholders for the period shown and includes only estimated tax-basis capital gain.
2. The Fund has a fee waiver associated with any investment in a Franklin Templeton money fund, contractually guaranteed through at least its current fiscal year-end. Fund
investment results reflect the fee waiver, to the extent applicable; without this reduction, the results would have been lower.
3. Cumulative total return represents the change in value of an investment over the periods indicated.
4. Average annual total return represents the average annual change in value of an investment over the periods indicated. Return for less than one year, ifany,hasnotbeen
annualized.
5. These figures represent the value of a hypothetical $10,000 investment in the Fund over the periods indicated.
6. In accordance with SEC rules, we provide standardized average annual total return information through the latest calendar quarter.
7. Figures are as stated in the Fund’s current prospectus and may differ from the expense ratios disclosed in the Financial Highlights in this report. In periods of market volatility,
assets may decline significantly, causing total annual Fund operating expenses to become higher than the figures shown.
24 Semiannual Report
franklintempleton.com
FRANKLIN MICROCAP VALUE FUND
Your Fund’s Expenses
As a Fund shareholder, you can incur two types of costs:
- Transaction costs, including sales charges (loads) on Fund purchases; and
- Ongoing Fund costs, including management fees, distribution and service (12b-1) fees, and other Fund expenses. All mutual funds have ongoing costs, sometimes referred to as operating expenses.
The following table shows ongoing costs of investing in the Fund and can help you understand these costs and compare them with those of other mutual funds. The table assumes a $1,000 investment held for the six months indicated.
Actual Fund Expenses
The first line (Actual) for each share class listed in the table provides actual account values and expenses. The “Ending Account Value” is derived from the Fund’s actual return, which includes the effect of Fund expenses.
You can estimate the expenses you paid during the period by following these steps. Of course, your account value and expenses will differ from those in this illustration:
| 1. | Divide your account value by $1,000. |
| | If an account had an $8,600 value, then $8,600 ÷ $1,000 = 8.6. |
| 2. | Multiply the result by the number under the heading “Expenses Paid During Period.” |
| | If Expenses Paid During Period were $7.50, then 8.6 x $7.50 = $64.50. |
In this illustration, the estimated expenses paid this period are $64.50.
Hypothetical Example for Comparison with Other Funds
Information in the second line (Hypothetical) for each class in the table can help you compare ongoing costs of investing in the Fund with those of other mutual funds. This information may not be used to estimate the actual ending account balance or expenses you paid during the period. The hypothetical “Ending Account Value” is based on the actual expense ratio for each class and an assumed 5% annual rate of return before expenses, which does not represent the Fund’s actual return. The figure under the heading “Expenses Paid During Period” shows the hypothetical expenses your account would have incurred under this scenario. You can compare this figure with the 5% hypothetical examples that appear in shareholder reports of other funds.
Please note that expenses shown in the table are meant to highlight ongoing costs and do not reflect any transaction costs, such as sales charges. Therefore, the second line for each class is useful in comparing ongoing costs only, and will not help you compare total costs of owning different funds. In addition, if transaction costs were included, your total costs would have been higher. Please refer to the Fund prospectus for additional information on operating expenses.
| | | | | | |
| | | Beginning Account | | Ending Account | | Expenses Paid During |
| Share Class | | Value 11/1/15 | | Value 4/30/16 | | Period* 11/1/15–4/30/16 |
| A | | | | | | |
| Actual | $ | 1,000 | $ | 1,058.00 | $ | 6.14 |
| Hypothetical (5% return before expenses) | $ | 1,000 | $ | 1,018.90 | $ | 6.02 |
| R6 | | | | | | |
| Actual | $ | 1,000 | $ | 1,060.00 | $ | 4.15 |
| Hypothetical (5% return before expenses) | $ | 1,000 | $ | 1,020.84 | $ | 4.07 |
| Advisor | | | | | | |
| Actual | $ | 1,000 | $ | 1,059.10 | $ | 4.91 |
| Hypothetical (5% return before expenses) | $ | 1,000 | $ | 1,020.09 | $ | 4.82 |
*Expenses are calculated using the most recent six-month expense ratio, net of expense waivers, annualized for each class (A: 1.20%;
R6: 0.81%; and Advisor: 0.96%), multiplied by the average account value over the period, multiplied by 182/366 to reflect the one-half year
period.
franklintempleton.com
Semiannual Report 25
Franklin Midcap Value Fund
This semiannual report for Franklin MidCap Value Fund covers the period ended April 30, 2016.
Your Fund’s Goal and Main Investments
The Fund seeks long-term total return by investing at least 80% of net assets in securities of mid-capitalization companies that we believe are undervalued. We define mid-capitalization companies as those with market capitalizations that are similar in size at the time of purchase to those in the Russell Midcap® Index.1
Performance Overview
The Fund’s Class A shares delivered a +1.01% cumulative total return for the six months under review. In comparison, the Russell Midcap® Value Index, which measures performance of those Russell Midcap® Index companies with lower price-to-book ratios and lower forecasted growth values, generated a +3.16% total return.2 You can find the Fund’s long-term performance data in the Performance Summary beginning on page 29.
Performance data represent past performance, which does not guarantee future results. Investment return and principal value will fluctuate, and you may have a gain or loss when you sell your shares. Current performance may differ from figures shown. For most recent month-end performance, go to franklintempleton.com or call (800) 342-5236.
Investment Strategy
Our goal is to invest in mid-capitalization companies that we determine are currently undervalued and have the potential for capital appreciation. The Fund purchases stocks that are out of favor in the market for reasons we believe will prove to be temporary in nature. In addition, the Fund may invest in companies with valuable intangibles we believe are not reflected in the stock price. This strategy is not aimed at short-term trading gains, nor do we consider the composition of any index. Rather, we try to identify attractively priced, financially sound companies that meet our investment criteria, and we assume at purchase that we will hold the position for several years.
1. The Russell Midcap Index is market capitalization weighted and measures performance of the smallest companies in the Russell 1000 Index, which represent a modest
amount of the Russell 1000 Index’s total market capitalization.
2. Source: Morningstar.
The index is unmanaged and includes reinvestment of any income or distributions. They do not reflect any fees, expenses or sales charges. One cannot invest directly in an
index, and an index is not representative of the Fund’s portfolio.
See www.franklintempletondatasources.com for additional data provider information.
The dollar value, number of shares or principal amount, and names of all portfolio holdings are listed in the Fund’s Statement of Investments (SOI).
The SOI begins on page 68.
26 Semiannual Report
franklintempleton.com
FRANKLIN MIDCAP VALUE FUND
Manager’s Discussion
During the six months under review, holdings that aided Fund performance included Tyson Foods, Albemarle and Autodesk. Tyson Foods, a producer of chicken, beef, pork and prepared food products, benefited from a strong quarterly earnings report, which further supported its planned and ongoing transformation in to a branded packaged food company. The company’s strategic acquisition of Hillshire Brands also continued to boost margins, while decreasing volatility related to the commodity meat processor cycle. Shares of Albemarle, a specialty and fine chemicals producer, rebounded strongly over the period as general economic concerns waned and the company reported better-than-expected earnings. The company’s 2016 outlook was more cautious than anticipated, but ongoing strength in key businesses and expectations for a significant increase in free cash flow generation benefited the company. Additionally, Albemarle struck an agreement with the Chilean government that extended the duration of its lithium production. Autodesk, a key contributor and software developer in the computer aided design market, reported stronger-than-expected subscriber growth despite an ongoing transition from a license-based to subscription-based business model. We anticipate the company’s free cash flow growth profile to be robust following the completion of the transition.
Detractors from Fund performance included Western Digital, Perrigo and HollyFrontier. Western Digital, a data storage solutions provider, experienced a weaker-than-expected demand for hard disk drives due to a weak personal computer environment. Investor concerns surrounding the merits of its SanDisk acquisition also hurt the company. Shares of Perrigo, a manufacturer of over-the-counter pharmaceuticals, declined after a weak earnings report led by underperformance in its recently acquired subsidiary Omega. During the period, Omega announced a series of restructuring and leadership changes, but a failed hostile takeover by Mylan delayed implementation of these beneficial changes. We continue to believe Perrigo’s capabilities position it uniquely within the generics and over-the-counter categories. Shares of petroleum refiner and marketer HollyFrontier declined as profit margins were negatively affected by the narrowing spread between U.S. crude oil prices and international benchmarks.
During the reporting period, the Fund initiated positions in Synchrony Financial, a financial services provider; JetBlue Airways, a commercial airline and XL Group, an insurance provider; Martin Marietta Materials, a supplier of construction and heavy building materials and Pinnacle Foods, a packaged foods company, among others. We also added to several positions with the largest purchases including Western Digital, a data storage solutions provider; Premier, a health care services and performance provider and WestRock, a paper and packaging solutions provisioner. The Fund exited positions including ITC Holdings, SanDisk, Pulte Group, Cadence Designs and KLA-Tencor, among others. We also reduced holdings in many positions including Progressive, Host Hotels & Resorts and Equity Lifestyle Properties.
Thank you for your continued participation in Franklin MidCap Value Fund. We look forward to continuing to serve your investment needs.
| | |
| Top 10 Holdings | | |
| 4/30/16 | | |
| Company | % of Total | |
| Sector/Industry | Net Assets | |
| Northern Trust Corp. | 1.6 | % |
| Diversified Financials | | |
| Synchrony Financial | 1.5 | % |
| Diversified Financials | | |
| Regions Financial Corp. | 1.5 | % |
| Banks | | |
| KeyCorp | 1.4 | % |
| Banks | | |
| Boston Properties Inc. | 1.4 | % |
| Real Estate | | |
| Raymond James Financial Inc. | 1.4 | % |
| Diversified Financials | | |
| Concho Resources Inc. | 1.4 | % |
| Energy | | |
| WestRock Co. | 1.3 | % |
| Materials | | |
| Western Digital Corp. | 1.3 | % |
| Technology Hardware & Equipment | | |
| Sempra Energy | 1.2 | % |
| Utilities | | |

Jakov Stipanov, CFA
Donald G. Taylor, CPA
Portfolio Management Team
franklintempleton.com
Semiannual Report 27
FRANKLIN MIDCAP VALUE FUND
The foregoing information reflects our analysis, opinions and portfolio holdings as of April 30, 2016, the end of the reporting period. The way we implement our main investment strategies and the resulting portfolio holdings may change depending on factors such as market and economic conditions. These opinions may not be relied upon as investment advice or an offer for a particular security. The information is not a complete analysis of every aspect of any market, country, industry, security or the Fund. Statements of fact are from sources considered reliable, but the investment manager makes no representation or warranty as to their completeness or accuracy. Although historical performance is no guarantee of future results, these insights may help you understand our investment management philosophy.
28 Semiannual Report
franklintempleton.com
FRANKLIN MIDCAP VALUE FUND
Performance Summary as of April 30, 2016
Your dividend income will vary depending on dividends or interest paid by securities in the Fund’s portfolio, adjusted for operating expenses of each class. Capital gain distributions are net profits realized from the sale of portfolio securities. The performance table does not reflect any taxes that a shareholder would pay on Fund dividends, capital gain distributions, if any, or any realized gains on the sale of Fund shares. Total return reflects reinvestment of the Fund’s dividends and capital gain distributions, if any, and any unrealized gains or losses.
| | | | | | | | |
| Net Asset Value | | | | | | | | |
| Share Class (Symbol) | | 4/30/16 | | 10/31/15 | | Change | | |
| A (FMVAX) | $ | 14.03 | $ | 15.22 | -$ | 1.19 | | |
| C (FMVCX) | $ | 13.80 | $ | 14.97 | -$ | 1.17 | | |
| R (N/A) | $ | 14.05 | $ | 15.19 | -$ | 1.14 | | |
| Advisor (N/A) | $ | 14.09 | $ | 15.31 | -$ | 1.22 | | |
| |
| |
| Distributions1 (11/1/15–4/30/16) | | | | | | | | |
| | | Dividend | | Short-Term | | Long-Term | | |
| Share Class | | Income | | Capital Gain | | Capital Gain | | Total |
| A | $ | 0.0678 | $ | 0.0351 | $ | 1.1821 | $ | 1.2850 |
| C | | — | $ | 0.0351 | $ | 1.1821 | $ | 1.2172 |
| R | $ | 0.0103 | $ | 0.0351 | $ | 1.1821 | $ | 1.2275 |
| Advisor | $ | 0.1136 | $ | 0.0351 | $ | 1.1821 | $ | 1.3308 |
See page 31 for Performance Summary footnotes.
franklintempleton.com
Semiannual Report 29
FRANKLIN MIDCAP VALUE FUND
PERFORMANCE SUMMARY
Performance as of 4/30/162
Cumulative total return excludes sales charges. Average annual total returns and value of $10,000 investment include maximum sales charges. Class A: 5.75% maximum initial sales charge; Class C: 1% contingent deferred sales charge in first year only;
Class R/Advisor Class: no sales charges.
| | | | | | | | | | | | |
| | | | | | | Value of | Average Annual | | Total Annual Operating Expenses7 | |
| | Cumulative | | Average Annual | | $ | 10,000 | Total Return | | | | | |
| Share Class | Total Return3 | | Total Return4 | | | Investment5 | (3/31/16 | )6 | (with waiver) | | (without waiver) | |
| A | | | | | | | | | 1.30 | % | 1.56 | % |
| 6-Month | +1.01 | % | -4.80 | % | $ | 9,520 | | | | | | |
| 1-Year | -4.27 | % | -9.77 | % | $ | 9,023 | -11.13 | % | | | | |
| 5-Year | +35.25 | % | +4.97 | % | $ | 12,747 | +5.35 | % | | | | |
| 10-Year | +57.61 | % | +4.04 | % | $ | 14,858 | +4.00 | % | | | | |
| C | | | | | | | | | 2.05 | % | 2.31 | % |
| 6-Month | +0.67 | % | -0.25 | % | $ | 9,975 | | | | | | |
| 1-Year | -4.86 | % | -5.73 | % | $ | 9,427 | -7.20 | % | | | | |
| 5-Year | +30.70 | % | +5.50 | % | $ | 13,070 | +5.84 | % | | | | |
| 10-Year | +47.27 | % | +3.95 | % | $ | 14,727 | +3.91 | % | | | | |
| R | | | | | | | | | 1.55 | % | 1.81 | % |
| 6-Month | +0.95 | % | +0.95 | % | $ | 10,095 | | | | | | |
| 1-Year | -4.40 | % | -4.40 | % | $ | 9,560 | -5.81 | % | | | | |
| 5-Year | +34.00 | % | +6.03 | % | $ | 13,400 | +6.39 | % | | | | |
| 10-Year | +54.80 | % | +4.47 | % | $ | 15,480 | +4.43 | % | | | | |
| Advisor | | | | | | | | | 1.05 | % | 1.31 | % |
| 6-Month | +1.13 | % | +1.13 | % | $ | 10,113 | | | | | | |
| 1-Year | -4.01 | % | -4.01 | % | $ | 9,599 | -5.42 | % | | | | |
| 5-Year | +37.25 | % | +6.54 | % | $ | 13,725 | +6.93 | % | | | | |
| 10-Year | +62.64 | % | +4.98 | % | $ | 16,264 | +4.95 | % | | | | |
Performance data represent past performance, which does not guarantee future results. Investment return and principal value will fluctuate, and you may have a gain or loss when you sell your shares. Current performance may differ from figures shown. For most recent month-end performance, go to franklintempleton.com or call (800) 342-5236.
See page 31 for Performance Summary footnotes.
30 Semiannual Report
franklintempleton.com
FRANKLIN MIDCAP VALUE FUND
PERFORMANCE SUMMARY
All investments involve risks, including possible loss of principal. Stock prices fluctuate, sometimes rapidly and dramatically, due to factors affecting individual companies, particular industries or sectors, or general market conditions. Historically, midsize company securities have been more volatile in price than larger company securities, especially over the short term. Midsize companies may be more susceptible to particular economic events or competitive factors than are larger, more broadly diversified companies. In addition, the Fund may invest up to 25% of its total assets in foreign securities, which involve special risks, including currency fluctuations and economic and political uncertainty. The Fund is actively managed but there is no guarantee that the manager’s investment decisions will produce the desired results. The Fund’s prospectus also includes a description of the main investment risks.
| |
| Class C: | These shares have higher annual fees and expenses than Class A shares. |
| Class R: | Shares are available to certain eligible investors as described in the prospectus. These shares have higher annual fees and expenses than Class A shares. |
| Advisor Class: | Shares are available to certain eligible investors as described in the prospectus. |
1. The distribution amount is the sum of the dividend payments to shareholders for the period shown and includes only estimated tax-basis net investment income and capital
gain.
2. The Fund has an expense reduction contractually guaranteed through at least 2/28/17 and a fee waiver associated with any investment in a Franklin Templeton money fund,
contractually guaranteed through at least its current fiscal year-end. Fund investment results reflect the expense reduction and fee waiver, to the extent applicable; without
these reductions, the results would have been lower.
3. Cumulative total return represents the change in value of an investment over the periods indicated.
4. Average annual total return represents the average annual change in value of an investment over the periods indicated. Return for less than one year, ifany,hasnotbeen
annualized.
5. These figures represent the value of a hypothetical $10,000 investment in the Fund over the periods indicated.
6. In accordance with SEC rules, we provide standardized average annual total return information through the latest calendar quarter.
7. Figures are as stated in the Fund’s current prospectus and may differ from the expense ratios disclosed in the Financial Highlights in this report. In periods of market volatility,
assets may decline significantly, causing total annual Fund operating expenses to become higher than the figures shown.
franklintempleton.com
Semiannual Report 31
FRANKLIN MIDCAP VALUE FUND
Your Fund’s Expenses
As a Fund shareholder, you can incur two types of costs:
- Transaction costs, including sales charges (loads) on Fund purchases; and
- Ongoing Fund costs, including management fees, distribution and service (12b-1) fees, and other Fund expenses. All mutual funds have ongoing costs, sometimes referred to as operating expenses.
The following table shows ongoing costs of investing in the Fund and can help you understand these costs and compare them with those of other mutual funds. The table assumes a $1,000 investment held for the six months indicated.
Actual Fund Expenses
The first line (Actual) for each share class listed in the table provides actual account values and expenses. The “Ending Account Value” is derived from the Fund’s actual return, which includes the effect of Fund expenses.
You can estimate the expenses you paid during the period by following these steps. Of course, your account value and expenses will differ from those in this illustration:
| 1. | Divide your account value by $1,000. |
| | If an account had an $8,600 value, then $8,600 ÷ $1,000 = 8.6. |
| 2. | Multiply the result by the number under the heading “Expenses Paid During Period.” |
| | If Expenses Paid During Period were $7.50, then 8.6 x $7.50 = $64.50. |
In this illustration, the estimated expenses paid this period are $64.50.
Hypothetical Example for Comparison with Other Funds
Information in the second line (Hypothetical) for each class in the table can help you compare ongoing costs of investing in the Fund with those of other mutual funds. This information may not be used to estimate the actual ending account balance or expenses you paid during the period. The hypothetical “Ending Account Value” is based on the actual expense ratio for each class and an assumed 5% annual rate of return before expenses, which does not represent the Fund’s actual return. The figure under the heading “Expenses Paid During Period” shows the hypothetical expenses your account would have incurred under this scenario. You can compare this figure with the 5% hypothetical examples that appear in shareholder reports of other funds.
Please note that expenses shown in the table are meant to highlight ongoing costs and do not reflect any transaction costs, such as sales charges. Therefore, the second line for each class is useful in comparing ongoing costs only, and will not help you compare total costs of owning different funds. In addition, if transaction costs were included, your total costs would have been higher. Please refer to the Fund prospectus for additional information on operating expenses.
32 Semiannual Report
franklintempleton.com
| | | | | | |
| | | | | | | FRANKLIN MIDCAP VALUE FUND |
| | | | | | | YOUR FUND’S EXPENSES |
| |
| |
| |
| | | Beginning Account | | Ending Account | | Expenses Paid During |
| Share Class | | Value 11/1/15 | | Value 4/30/16 | | Period* 11/1/15–4/30/16 |
| A | | | | | | |
| Actual | $ | 1,000 | $ | 1,010.10 | $ | 6.50 |
| Hypothetical (5% return before expenses) | $ | 1,000 | $ | 1,018.40 | $ | 6.52 |
| C | | | | | | |
| Actual | $ | 1,000 | $ | 1,006.70 | $ | 10.18 |
| Hypothetical (5% return before expenses) | $ | 1,000 | $ | 1,014.72 | $ | 10.22 |
| R | | | | | | |
| Actual | $ | 1,000 | $ | 1,009.50 | $ | 7.74 |
| Hypothetical (5% return before expenses) | $ | 1,000 | $ | 1,017.16 | $ | 7.77 |
| Advisor | | | | | | |
| Actual | $ | 1,000 | $ | 1,011.30 | $ | 5.25 |
| Hypothetical (5% return before expenses) | $ | 1,000 | $ | 1,019.64 | $ | 5.27 |
*Expenses are calculated using the most recent six-month expense ratio, net of expense waivers, annualized for each class (A: 1.30%;
C: 2.04%; R: 1.55%; and Advisor: 1.05%), multiplied by the average account value over the period, multiplied by 182/366 to reflect the
one-half year period.
franklintempleton.com
Semiannual Report 33
Franklin Small Cap Value Fund
This semiannual report for Franklin Small Cap Value Fund covers the period ended April 30, 2016. As previously communicated, shareholders approved the reorganization of Franklin All Cap Value Fund into Franklin Small Cap Value Fund. The transaction was completed on April 1, 2016, and shares of Franklin All Cap Value Fund share classes A, C, R and Advisor were exchanged for shares in Franklin Small Cap Value Fund share classes A, C, R and Advisor, respectively.
Your Fund’s Goal and Main Investments
The Fund seeks long-term total return by investing at least 80% of net assets in securities of small-capitalization companies that we believe are undervalued. We define small-capitalization companies as those with market capitalizations less than $3.5 billion at the time of purchase.
Performance Overview
The Fund’s Class A shares delivered a +2.25% cumulative total return for the six months under review. In comparison, the Russell 2500TM Value Index, which measures performance of those Russell 2500TM Index companies with lower price-to-book ratios and lower forecasted growth values, had a +2.20% total return.1 You can find the Fund’s long-term performance data in the Performance Summary beginning on page 37.
Performance data represent past performance, which does not guarantee future results. Investment return and principal value will fluctuate, and you may have a gain or loss when you sell your shares. Current performance may differ from figures shown. For most recent month-end performance, go to franklintempleton.com or call (800) 342-5236.
Investment Strategy
We seek to invest in small-capitalization companies that we believe are selling below their underlying worth and hold them until they reach what we consider their fair value. We seek a diversified portfolio of fundamentally sound companies purchased at attractive prices, often when they are out of favor with other investors. Portfolio securities are selected without regard to benchmark comparisons and are based on fundamental, bottom-up research focusing on several criteria, such as low price relative to earnings, book value or cash flow. We also consider stocks with recent sharp price declines that we believe still have significant growth potential or that possess valuable intangibles not reflected in the stock price.
Manager’s Discussion
During the six months under review, holdings that aided Fund performance included Astec Industries, Maple Leaf Foods and Granite Construction. Astec Industries, a manufacturer of road paving and construction related equipment, benefited from optimism surrounding further federal funding for highways, strong sales of new products and increased profitability due to improved product selections and increased overhead absorption. Maple Leaf Foods, a Canadian-based producer of fresh and packaged meats, experienced stronger-than-expected sales and profits. During the period, the company neared the end of its multi-year manufacturing and network optimization plan and also increased its dividend. Shares of construction contractor Granite Construction, improved due to moderately improving business trends and the aforementioned additional federal highway funding.
Detractors from Fund performance included Tailored Brands (formerly, Men’s Wearhouse), Bristow Group and A. Schulman. Tailored Brands, a specialty apparel retailer, reported weaker-than-expected results from its recently acquired Jos. A. Bank business as a change to a less promotional-driven model and a more challenging retail environment substantially impacted sales. Bristow Group, a provider of helicopter transportation services to the offshore oil and gas industry, along with search and rescue operations to government entities, reported weak earnings and cut its dividend as declining energy prices and competitor pressures affected both revenues and profitability. Shares of A. Schulman, a plastic compounds and resins supplier, declined due to challenging economic conditions and internal execution issues related to recent acquisitions. These conditions and challenges led to weaker-than-expected sales and earnings during the period.
During the reporting period, we added some new positions with the largest purchases including Cubic Corp, a transit and defense systems provider; Columbia Banking System, a bank; Brandywine Realty, a real estate investment trust; Esterline technologies, a specialized manufacturing company serving the aerospace and defense markets and Photronics, a manufacturer
1. Source: Morningstar.
The index is unmanaged and includes reinvestment of any income or distributions. They do not reflect any fees, expenses or sales charges. One cannot invest directly in an
index, and an index is not representative of the Fund’s portfolio.
See www.franklintempletondatasources.com for additional data provider information.
The dollar value, number of shares or principal amount, and names of all portfolio holdings are listed in the Fund’s Statement of Investments (SOI).
The SOI begins on page 78.
34 Semiannual Report
franklintempleton.com
FRANKLIN SMALL CAP VALUE FUND
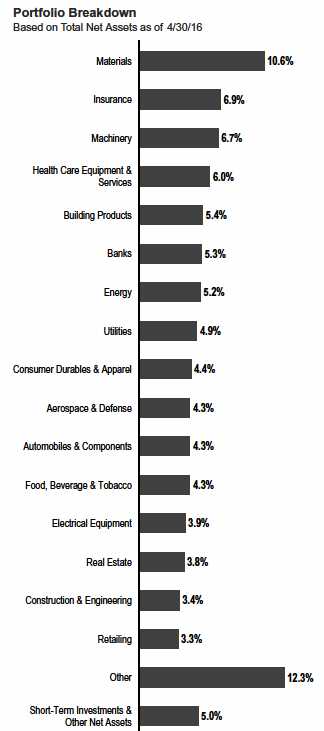
and seller of photomasks. The Fund also added to several holdings including IDACORP, an electric utility; Lakeland Financial, a bank and Oil States International, a deep-water facilities and drilling equipment provider. In contrast, the Fund exited positions in Pep Boys – Manny, Moe & Jack, StanCorp Financial, Ingram Micro, Bristow Group and Group 1 Automotive, among others. We reduced holdings in several positions including LA-Z-Boy, Wabash National and Universal Forest Products.
Thank you for your continued participation in Franklin Small Cap Value Fund. We look forward to continuing to serve your investment needs.
| | |
| Top 10 Holdings | | |
| 4/30/16 | | |
| Company | % of Total | |
| Sector/Industry | Net Assets | |
| Maple Leaf Foods Inc. | 3.0 | % |
| Food, Beverage & Tobacco | | |
| LTC Properties Inc. | 2.6 | % |
| Real Estate | | |
| Astec Industries Inc. | 2.5 | % |
| Machinery | | |
| Gerresheimer AG | 2.5 | % |
| Pharmaceuticals, Biotechnology & Life Sciences | | |
| AAR Corp. | 2.5 | % |
| Aerospace & Defense | | |
| Spire Inc. | 2.4 | % |
| Utilities | | |
| IDACORP Inc. | 2.4 | % |
| Utilities | | |
| Sensient Technologies Corp. | 2.3 | % |
| Materials | | |
| Carlisle Cos. Inc. | 2.2 | % |
| Industrial Conglomerates | | |
| STERIS PLC | 2.2 | % |
| Health Care Equipment & Services | | |

Christopher Meeker, CFA
Donald G. Taylor, CPA
Portfolio Management Team
franklintempleton.com
Semiannual Report 35
FRANKLIN SMALL CAP VALUE FUND
The foregoing information reflects our analysis, opinions and portfolio holdings as of April 30, 2016, the end of the reporting period. The way we implement our main investment strategies and the resulting portfolio holdings may change depending on factors such as market and economic conditions. These opinions may not be relied upon as investment advice or an offer for a particular security. The information is not a complete analysis of every aspect of any market, country, industry, security or the Fund. Statements of fact are from sources considered reliable, but the investment manager makes no representation or warranty as to their completeness or accuracy. Although historical performance is no guarantee of future results, these insights may help you understand our investment management philosophy.
36 Semiannual Report
franklintempleton.com
FRANKLIN SMALL CAP VALUE FUND
Performance Summary as of April 30, 2016
Your dividend income will vary depending on dividends or interest paid by securities in the Fund’s portfolio, adjusted for operating expenses of each class. Capital gain distributions are net profits realized from the sale of portfolio securities. The performance table does not reflect any taxes that a shareholder would pay on Fund dividends, capital gain distributions, if any, or any realized gains on the sale of Fund shares. Total return reflects reinvestment of the Fund’s dividends and capital gain distributions, if any, and any unrealized gains or losses.
| | | | | | |
| Net Asset Value | | | | | | |
| Share Class (Symbol) | | 4/30/16 | | 10/31/15 | | Change |
| A (FRVLX) | $ | 47.32 | $ | 51.72 | -$ | 4.40 |
| C (FRVFX) | $ | 42.86 | $ | 47.22 | -$ | 4.36 |
| R (FVFRX) | $ | 46.85 | $ | 51.18 | -$ | 4.33 |
| R6 (FRCSX) | $ | 49.19 | $ | 53.75 | -$ | 4.56 |
| Advisor (FVADX) | $ | 49.23 | $ | 53.67 | -$ | 4.44 |
| |
| |
| Distributions1 (11/1/15–4/30/16) | | | | | | |
| | | Dividend | | Long-Term | | |
| Share Class | | Income | | Capital Gain | | Total |
| A | $ | 0.2862 | $ | 4.9168 | $ | 5.2030 |
| C | | — | $ | 4.9168 | $ | 4.9168 |
| R | $ | 0.1586 | $ | 4.9168 | $ | 5.0754 |
| R6 | $ | 0.5870 | $ | 4.9168 | $ | 5.5038 |
| Advisor | $ | 0.4263 | $ | 4.9168 | $ | 5.3431 |
See page 39 for Performance Summary footnotes.
franklintempleton.com
Semiannual Report 37
FRANKLIN SMALL CAP VALUE FUND
PERFORMANCE SUMMARY
Performance as of 4/30/162
Cumulative total return excludes sales charges. Average annual total returns and value of $10,000 investment include maximum sales charges. Class A: 5.75% maximum initial sales charge; Class C: 1% contingent deferred sales charge in first year only;
Class R/R6/Advisor Class: no sales charges.
| | | | | | | | | | | | |
| | | | | | | Value of | Average Annual | | Total Annual Operating Expenses7 | |
| | Cumulative | | Average Annual | | $ | 10,000 | Total Return | | | | | |
| Share Class | Total Return3 | | Total Return4 | | | Investment5 | (3/31/16 | )6 | (with waiver) | | (without waiver) | |
| A | | | | | | | | | 1.12 | % | 1.13 | % |
| 6-Month | +2.25 | % | -3.64 | % | $ | 9,636 | | | | | | |
| 1-Year | -2.50 | % | -8.11 | % | $ | 9,189 | -8.88 | % | | | | |
| 5-Year | +39.38 | % | +5.61 | % | $ | 13,136 | +5.70 | % | | | | |
| 10-Year | +68.96 | % | +4.76 | % | $ | 15,924 | +4.72 | % | | | | |
| C | | | | | | | | | 1.87 | % | 1.88 | % |
| 6-Month | +1.89 | % | +0.98 | % | $ | 10,098 | | | | | | |
| 1-Year | -3.21 | % | -4.08 | % | $ | 9,592 | -4.90 | % | | | | |
| 5-Year | +34.56 | % | +6.12 | % | $ | 13,456 | +6.21 | % | | | | |
| 10-Year | +57.37 | % | +4.64 | % | $ | 15,737 | +4.60 | % | | | | |
| R | | | | | | | | | 1.37 | % | 1.38 | % |
| 6-Month | +2.13 | % | +2.13 | % | $ | 10,213 | | | | | | |
| 1-Year | -2.73 | % | -2.73 | % | $ | 9,727 | -3.56 | % | | | | |
| 5-Year | +37.97 | % | +6.65 | % | $ | 13,797 | +6.74 | % | | | | |
| 10-Year | +65.40 | % | +5.16 | % | $ | 16,540 | +5.12 | % | | | | |
| R6 | | | | | | | | | 0.62 | % | 0.63 | % |
| 6-Month | +2.50 | % | +2.50 | % | $ | 10,250 | | | | | | |
| 1-Year | -2.00 | % | -2.00 | % | $ | 9,800 | -2.83 | % | | | | |
| Since Inception (5/1/13) | +26.32 | % | +8.11 | % | $ | 12,632 | +7.96 | % | | | | |
| Advisor | | | | | | | | | 0.87 | % | 0.88 | % |
| 6-Month | +2.38 | % | +2.38 | % | $ | 10,238 | | | | | | |
| 1-Year | -2.24 | % | -2.24 | % | $ | 9,776 | -3.08 | % | | | | |
| 5-Year | +41.45 | % | +7.18 | % | $ | 14,145 | +7.27 | % | | | | |
| 10-Year | +73.92 | % | +5.69 | % | $ | 17,392 | +5.65 | % | | | | |
Performance data represent past performance, which does not guarantee future results. Investment return and principal value will fluctuate, and you may have a gain or loss when you sell your shares. Current performance may differ from figures shown. For most recent month-end performance, go to franklintempleton.com or call (800) 342-5236.
See page 39 for Performance Summary footnotes.
38 Semiannual Report
franklintempleton.com
FRANKLIN SMALL CAP VALUE FUND
PERFORMANCE SUMMARY
All investments involve risks, including possible loss of principal. The Fund’s investments in smaller company stocks carry special risks as such stocks have historically exhibited greater price volatility than larger company stocks, particularly over the short term. Additionally, smaller companies often have relatively small revenues, limited product lines and small market share. In addition, the Fund may invest up to 25% of its total assets in foreign securities, which involve special risks, including currency fluctuations and economic and political uncertainty. The Fund is actively managed but there is no guarantee that the manager’s investment decisions will produce the desired results. The Fund’s prospectus also includes a description of the main investment risks.
| |
| Class C: | These shares have higher annual fees and expenses than Class A shares. |
| Class R: | Shares are available to certain eligible investors as described in the prospectus. These shares have higher annual fees and expenses than Class A shares. |
| Class R6: | Shares are available to certain eligible investors as described in the prospectus. |
| Advisor Class: | Shares are available to certain eligible investors as described in the prospectus. |
1. The distribution amount is the sum of the dividend payments to shareholders for the period shown and includes only estimated tax-basis net investment income and capital
gain.
2. The Fund has a fee waiver associated with any investment in a Franklin Templeton money fund, contractually guaranteed through at least its current fiscal year-end. Fund
investment results reflect the fee waiver, to the extent applicable; without this reduction, the results would have been lower.
3. Cumulative total return represents the change in value of an investment over the periods indicated.
4. Average annual total return represents the average annual change in value of an investment over the periods indicated. Return for less than one year, ifany,hasnotbeen
annualized.
5. These figures represent the value of a hypothetical $10,000 investment in the Fund over the periods indicated.
6. In accordance with SEC rules, we provide standardized average annual total return information through the latest calendar quarter.
7. Figures are as stated in the Fund’s current prospectus and may differ from the expense ratios disclosed in the Financial Highlights in this report. In periods of market volatility,
assets may decline significantly, causing total annual Fund operating expenses to become higher than the figures shown.
franklintempleton.com
Semiannual Report 39
FRANKLIN SMALL CAP VALUE FUND
Your Fund’s Expenses
As a Fund shareholder, you can incur two types of costs:
- Transaction costs, including sales charges (loads) on Fund purchases; and
- Ongoing Fund costs, including management fees, distribution and service (12b-1) fees, and other Fund expenses. All mutual funds have ongoing costs, sometimes referred to as operating expenses.
The following table shows ongoing costs of investing in the Fund and can help you understand these costs and compare them with those of other mutual funds. The table assumes a $1,000 investment held for the six months indicated.
Actual Fund Expenses
The first line (Actual) for each share class listed in the table provides actual account values and expenses. The “Ending Account Value” is derived from the Fund’s actual return, which includes the effect of Fund expenses.
You can estimate the expenses you paid during the period by following these steps. Of course, your account value and expenses will differ from those in this illustration:
| 1. | Divide your account value by $1,000. |
| | If an account had an $8,600 value, then $8,600 ÷ $1,000 = 8.6. |
| 2. | Multiply the result by the number under the heading “Expenses Paid During Period.” |
| | If Expenses Paid During Period were $7.50, then 8.6 x $7.50 = $64.50. |
In this illustration, the estimated expenses paid this period are $64.50.
Hypothetical Example for Comparison with Other Funds
Information in the second line (Hypothetical) for each class in the table can help you compare ongoing costs of investing in the Fund with those of other mutual funds. This information may not be used to estimate the actual ending account balance or expenses you paid during the period. The hypothetical “Ending Account Value” is based on the actual expense ratio for each class and an assumed 5% annual rate of return before expenses, which does not represent the Fund’s actual return. The figure under the heading “Expenses Paid During Period” shows the hypothetical expenses your account would have incurred under this scenario. You can compare this figure with the 5% hypothetical examples that appear in shareholder reports of other funds.
Please note that expenses shown in the table are meant to highlight ongoing costs and do not reflect any transaction costs, such as sales charges. Therefore, the second line for each class is useful in comparing ongoing costs only, and will not help you compare total costs of owning different funds. In addition, if transaction costs were included, your total costs would have been higher. Please refer to the Fund prospectus for additional information on operating expenses.
40 Semiannual Report
franklintempleton.com
| | | | | | |
| | | | | | | FRANKLIN SMALL CAP VALUE FUND |
| | | | | | | YOUR FUND’S EXPENSES |
| |
| |
| |
| | | Beginning Account | | Ending Account | | Expenses Paid During |
| Share Class | | Value 11/1/15 | | Value 4/30/16 | | Period* 11/1/15–4/30/16 |
| A | | | | | | |
| Actual | $ | 1,000 | $ | 1,022.50 | $ | 5.68 |
| Hypothetical (5% return before expenses) | $ | 1,000 | $ | 1,019.24 | $ | 5.67 |
| C | | | | | | |
| Actual | $ | 1,000 | $ | 1,018.90 | $ | 9.44 |
| Hypothetical (5% return before expenses) | $ | 1,000 | $ | 1,015.51 | $ | 9.42 |
| R | | | | | | |
| Actual | $ | 1,000 | $ | 1,021.30 | $ | 6.94 |
| Hypothetical (5% return before expenses) | $ | 1,000 | $ | 1,018.00 | $ | 6.92 |
| R6 | | | | | | |
| Actual | $ | 1,000 | $ | 1,025.00 | $ | 3.17 |
| Hypothetical (5% return before expenses) | $ | 1,000 | $ | 1,021.73 | $ | 3.17 |
| Advisor | | | | | | |
| Actual | $ | 1,000 | $ | 1,023.80 | $ | 4.43 |
| Hypothetical (5% return before expenses) | $ | 1,000 | $ | 1,020.49 | $ | 4.42 |
*Expenses are calculated using the most recent six-month expense ratio, net of expense waivers, annualized for each class (A: 1.13%;
C: 1.88%; R: 1.38%; R6: 0.63%; and Advisor: 0.88%), multiplied by the average account value over the period, multiplied by 182/366 to reflect
the one-half year period.
franklintempleton.com
Semiannual Report 41
FRANKLIN VALUE INVESTORS TRUST
| | | | | | | | | | | | | | | | | | |
| Financial Highlights | | | | | | | | | | | | | | | | | | |
| Franklin Balance Sheet Investment Fund | | | | | | | | | | | | | | | | |
| | | Six Months Ended | | | | | | | | | | | | | | | | |
| | | April 30, 2016 | | | | | | Year Ended October 31, | | | | |
| | | (unaudited) | | | 2015 | | | 2014 | | | 2013 | | | 2012 | | | 2011 | |
| Class A | | | | | | | | | | | | | | | | | | |
| Per share operating performance | | | | | | | | | | | | | | | | | | |
| (for a share outstanding throughout the period) | | | | | | | | | | | | | | | | | | |
| Net asset value, beginning of period | $ | 40.06 | | $ | 51.55 | | $ | 53.98 | | $ | 43.01 | | $ | 44.05 | | $ | 47.25 | |
| Income from investment operationsa: | | | | | | | | | | | | | | | | | | |
| Net investment incomeb | | 0.10 | | | 0.19 | | | 0.46 | c | | 0.64 | d | | 0.48 | | | 0.50 | |
| Net realized and unrealized gains (losses) | | 0.16 | | | (3.92 | ) | | 3.06 | | | 13.15 | | | 3.65 | | | 1.02 | |
| Total from investment operations | | 0.26 | | | (3.73 | ) | | 3.52 | | | 13.79 | | | 4.13 | | | 1.52 | |
| Less distributions from: | | | | | | | | | | | | | | | | | | |
| Net investment income. | | (0.28 | ) | | (0.17 | ) | | (0.65 | ) | | (0.66 | ) | | (0.25 | ) | | (0.79 | ) |
| Net realized gains | | (5.77 | ) | | (7.59 | ) | | (5.30 | ) | | (2.16 | ) | | (4.92 | ) | | (3.93 | ) |
| Total distributions | | (6.05 | ) | | (7.76 | ) | | (5.95 | ) | | (2.82 | ) | | (5.17 | ) | | (4.72 | ) |
| Net asset value, end of period | $ | 34.27 | | $ | 40.06 | | $ | 51.55 | | $ | 53.98 | | $ | 43.01 | | $ | 44.05 | |
| |
| Total returne | | 1.11 | % | | (7.73 | )% | | 6.97 | % | | 33.97 | % | | 11.09 | % | | 2.75 | % |
| |
| Ratios to average net assetsf | | | | | | | | | | | | | | | | | | |
| Expenses before waiver and payments by | | | | | | | | | | | | | | | | | | |
| affiliates | | 0.96 | % | | 0.95 | % | | 0.90 | % | | 0.91 | % | | 0.99 | % | | 0.94 | % |
| Expenses net of waiver and payments by | | | | | | | | | | | | | | | | | | |
| affiliates | | 0.94 | %g | | 0.94 | % | | 0.89 | %g | | 0.91 | % | | 0.99 | % | | 0.94 | % |
| Net investment income | | 0.57 | % | | 0.45 | % | | 0.89 | %c | | 1.34 | %d | | 1.16 | % | | 1.06 | % |
| |
| Supplemental data | | | | | | | | | | | | | | | | | | |
| Net assets, end of period (000’s) | $ | 844,113 | | $ | 915,285 | | $ | 1,221,903 | | $ | 1,256,543 | | $ | 1,079,418 | | $ | 1,441,777 | |
| Portfolio turnover rate | | 11.84 | % | | 26.31 | % | | 25.08 | % | | 11.54 | % | | 7.91 | %h | | 9.66 | % |
aThe amount shown for a share outstanding throughout the period may not correlate with the Statement of Operations for the period due to the timing of sales and
repurchases of the Fund’s shares in relation to income earned and/or fluctuating fair value of the investments of the Fund.
bBased on average daily shares outstanding.
cNet investment income per share includes approximately $0.15 per share related to income received in the form of special dividends in connection with certain Fund
holdings. Excluding this amount, the ratio of net investment income to average net assets would have been 0.61%.
dNet investment income per share includes approximately $0.15 per share related to income received in the form of special dividends in connection with certain Fund
holdings. Excluding this amount, the ratio of net investment income to average net assets would have been 1.02%.
eTotal return does not reflect sales commissions or contingent deferred sales charges, if applicable, and is not annualized for periods less than one year.
fRatios are annualized for periods less than one year.
gBenefit of expense reduction rounds to less than 0.01%.
hExcludes the value of portfolio securities delivered as a result of a redemption in-kind.
42 Semiannual Report | The accompanying notes are an integral part of these financial statements. franklintempleton.com
| | | | | | | | | | | | | | | | | | |
| | | | | | | | | FRANKLIN VALUE INVESTORS TRUST | |
| | | | | | | | | | | | FINANCIAL HIGHLIGHTS | |
| |
| |
| Franklin Balance Sheet Investment Fund (continued) | | | | | | | | | | | | | | | | |
| | | Six Months Ended | | | | | | | | | | | | | | | | |
| | | April 30, 2016 | | | | | | Year Ended October 31, | | | | |
| | | (unaudited) | | | 2015 | | | 2014 | | | 2013 | | | 2012 | | | 2011 | |
| Class C | | | | | | | | | | | | | | | | | | |
| Per share operating performance | | | | | | | | | | | | | | | | | | |
| (for a share outstanding throughout the period) | | | | | | | | | | | | | | | | | | |
| Net asset value, beginning of period | $ | 38.70 | | $ | 50.22 | | $ | 52.77 | | $ | 42.10 | | $ | 43.27 | | $ | 46.51 | |
| Income from investment operationsa: | | | | | | | | | | | | | | | | | | |
| Net investment income (loss)b | | (0.03 | ) | | (0.12 | ) | | 0.07 | c | | 0.25 | d | | 0.15 | | | 0.12 | |
| Net realized and unrealized gains (losses) | | 0.15 | | | (3.81 | ) | | 2.99 | | | 12.93 | | | 3.60 | | | 1.02 | |
| Total from investment operations | | 0.12 | | | (3.93 | ) | | 3.06 | | | 13.18 | | | 3.75 | | | 1.14 | |
| Less distributions from: | | | | | | | | | | | | | | | | | | |
| Net investment income. | | — | | | — | | | (0.31 | ) | | (0.35 | ) | | — | | | (0.45 | ) |
| Net realized gains | | (5.77 | ) | | (7.59 | ) | | (5.30 | ) | | (2.16 | ) | | (4.92 | ) | | (3.93 | ) |
| Total distributions | | (5.77 | ) | | (7.59 | ) | | (5.61 | ) | | (2.51 | ) | | (4.92 | ) | | (4.38 | ) |
| Net asset value, end of period | $ | 33.05 | | $ | 38.70 | | $ | 50.22 | | $ | 52.77 | | $ | 42.10 | | $ | 43.27 | |
| |
| Total returne | | 0.72 | % | | (8.41 | )% | | 6.17 | % | | 33.01 | % | | 10.25 | % | | 1.97 | % |
| |
| Ratios to average net assetsf | | | | | | | | | | | | | | | | | | |
| Expenses before waiver and payments by | | | | | | | | | | | | | | | | | | |
| affiliates | | 1.71 | % | | 1.70 | % | | 1.65 | % | | 1.66 | % | | 1.74 | % | | 1.69 | % |
| Expenses net of waiver and payments by | | | | | | | | | | | | | | | | | | |
| affiliates | | 1.69 | %g | | 1.69 | % | | 1.64 | %g | | 1.66 | % | | 1.74 | % | | 1.69 | % |
| Net investment income (loss) | | (0.18 | )% | | (0.30 | )% | | 0.14 | %c | | 0.59 | %d | | 0.41 | % | | 0.31 | % |
| |
| Supplemental data | | | | | | | | | | | | | | | | | | |
| Net assets, end of period (000’s) | $ | 64,676 | | $ | 73,185 | | $ | 96,279 | | $ | 96,462 | | $ | 71,723 | | $ | 75,025 | |
| Portfolio turnover rate | | 11.84 | % | | 26.31 | % | | 25.08 | % | | 11.54 | % | | 7.91 | %h | | 9.66 | % |
aThe amount shown for a share outstanding throughout the period may not correlate with the Statement of Operations for the period due to the timing of sales and
repurchases of the Fund’s shares in relation to income earned and/or fluctuating fair value of the investments of the Fund.
bBased on average daily shares outstanding.
cNet investment income per share includes approximately $0.15 per share related to income received in the form of special dividends in connection with certain Fund
holdings. Excluding this amount, the ratio of net investment income to average net assets would have been (0.14)%.
dNet investment income per share includes approximately $0.15 per share related to income received in the form of special dividends in connection with certain Fund
holdings. Excluding this amount, the ratio of net investment income to average net assets would have been 0.27%.
eTotal return does not reflect sales commissions or contingent deferred sales charges, if applicable, and is not annualized for periods less than one year.
fRatios are annualized for periods less than one year.
gBenefit of expense reduction rounds to less than 0.01%.
hExcludes the value of portfolio securities delivered as a result of a redemption in-kind.
franklintempleton.com The accompanying notes are an integral part of these financial statements. | Semiannual Report 43
| | | | | | | | | | | | | | | | | | |
| FRANKLIN VALUE INVESTORS TRUST | | | | | | | | | | | | | | | | |
| FINANCIAL HIGHLIGHTS | | | | | | | | | | | | | | | | | | |
| |
| |
| Franklin Balance Sheet Investment Fund (continued) | | | | | | | | | | | | | | | | |
| | | Six Months Ended | | | | | | | | | | | | | | | | |
| | | April 30, 2016 | | | | | | Year Ended October 31, | | | | |
| | | (unaudited) | | | 2015 | | | 2014 | | | 2013 | | | 2012 | | | 2011 | |
| Class R | | | | | | | | | | | | | | | | | | |
| Per share operating performance | | | | | | | | | | | | | | | | | | |
| (for a share outstanding throughout the period) | | | | | | | | | | | | | | | | | | |
| Net asset value, beginning of period | $ | 40.06 | | $ | 51.48 | | $ | 53.90 | | $ | 42.95 | | $ | 43.94 | | $ | 47.12 | |
| Income from investment operationsa: | | | | | | | | | | | | | | | | | | |
| Net investment incomeb | | 0.05 | | | 0.09 | | | 0.36 | c | | 0.49 | d | | 0.37 | | | 0.42 | |
| Net realized and unrealized gains (losses) | | 0.16 | | | (3.91 | ) | | 3.01 | | | 13.18 | | | 3.65 | | | 0.98 | |
| Total from investment operations | | 0.21 | | | (3.82 | ) | | 3.37 | | | 13.67 | | | 4.02 | | | 1.40 | |
| Less distributions from: | | | | | | | | | | | | | | | | | | |
| Net investment income. | | (0.17 | ) | | (0.01 | ) | | (0.49 | ) | | (0.56 | ) | | (0.09 | ) | | (0.65 | ) |
| Net realized gains | | (5.77 | ) | | (7.59 | ) | | (5.30 | ) | | (2.16 | ) | | (4.92 | ) | | (3.93 | ) |
| Total distributions | | (5.94 | ) | | (7.60 | ) | | (5.79 | ) | | (2.72 | ) | | (5.01 | ) | | (4.58 | ) |
| Net asset value, end of period | $ | 34.33 | | $ | 40.06 | | $ | 51.48 | | $ | 53.90 | | $ | 42.95 | | $ | 43.94 | |
| |
| Total returne | | 0.96 | % | | (7.94 | )% | | 6.67 | % | | 33.67 | % | | 10.80 | % | | 2.50 | % |
| |
| Ratios to average net assetsf | | | | | | | | | | | | | | | | | | |
| Expenses before waiver and payments by | | | | | | | | | | | | | | | | | | |
| affiliates | | 1.21 | % | | 1.20 | % | | 1.15 | % | | 1.16 | % | | 1.24 | % | | 1.19 | % |
| Expenses net of waiver and payments by | | | | | | | | | | | | | | | | | | |
| affiliates | | 1.19 | %g | | 1.19 | % | | 1.14 | %g | | 1.16 | % | | 1.24 | % | | 1.19 | % |
| Net investment income | | 0.32 | % | | 0.20 | % | | 0.64 | %c | | 1.09 | %d | | 0.91 | % | | 0.81 | % |
| |
| Supplemental data | | | | | | | | | | | | | | | | | | |
| Net assets, end of period (000’s) | $ | 9,051 | | $ | 9,831 | | $ | 14,261 | | $ | 17,992 | | $ | 15,053 | | $ | 19,321 | |
| Portfolio turnover rate | | 11.84 | % | | 26.31 | % | | 25.08 | % | | 11.54 | % | | 7.91 | %h | | 9.66 | % |
aThe amount shown for a share outstanding throughout the period may not correlate with the Statement of Operations for the period due to the timing of sales and
repurchases of the Fund’s shares in relation to income earned and/or fluctuating fair value of the investments of the Fund.
bBased on average daily shares outstanding.
cNet investment income per share includes approximately $0.15 per share related to income received in the form of special dividends in connection with certain Fund
holdings. Excluding this amount, the ratio of net investment income to average net assets would have been 0.36%.
dNet investment income per share includes approximately $0.15 per share related to income received in the form of special dividends in connection with certain Fund
holdings. Excluding this amount, the ratio of net investment income to average net assets would have been 0.77%.
eTotal return is not annualized for periods less than one year.
fRatios are annualized for periods less than one year.
gBenefit of expense reduction rounds to less than 0.01%.
hExcludes the value of portfolio securities delivered as a result of a redemption in-kind.
44 Semiannual Report | The accompanying notes are an integral part of these financial statements. franklintempleton.com
FRANKLIN VALUE INVESTORS TRUST
FINANCIAL HIGHLIGHTS
| | | | | | | | | | | | |
| Franklin Balance Sheet Investment Fund (continued) | | | | | | | | | | | | |
| | | Six Months Ended | | | | | | | | | | |
| | | April 30, 2016 | | | Year Ended October 31, | |
| | | (unaudited) | | | 2015 | | | 2014 | | | 2013 | a |
| Class R6 | | | | | | | | | | | | |
| Per share operating performance | | | | | | | | | | | | |
| (for a share outstanding throughout the period) | | | | | | | | | | | | |
| Net asset value, beginning of period | $ | 41.10 | | $ | 52.70 | | $ | 55.06 | | $ | 47.79 | |
| Income from investment operationsb: | | | | | | | | | | | | |
| Net investment incomec | | 0.17 | | | 0.37 | | | 0.47 | d | | 0.32 | e |
| Net realized and unrealized gains (losses) | | 0.17 | | | (3.99 | ) | | 3.32 | | | 6.95 | |
| Total from investment operations | | 0.34 | | | (3.62 | ) | | 3.79 | | | 7.27 | |
| Less distributions from: | | | | | | | | | | | | |
| Net investment income | | (0.48 | ) | | (0.39 | ) | | (0.85 | ) | | — | |
| Net realized gains | | (5.77 | ) | | (7.59 | ) | | (5.30 | ) | | — | |
| Total distributions | | (6.25 | ) | | (7.98 | ) | | (6.15 | ) | | — | |
| Net asset value, end of period | $ | 35.19 | | $ | 41.10 | | $ | 52.70 | | $ | 55.06 | |
| |
| Total returnf | | 1.35 | % | | (7.33 | )% | | 7.37 | % | | 15.21 | % |
| |
| Ratios to average net assetsg | | | | | | | | | | | | |
| Expenses before waiver and payments by affiliates | | 0.53 | % | | 0.51 | % | | 0.50 | % | | 2.10 | % |
| Expenses net of waiver and payments by affiliates. | | 0.51 | %h | | 0.50 | % | | 0.49 | %h | | 0.51 | % |
| Net investment income | | 1.00 | % | | 0.89 | % | | 1.29 | %d | | 1.25 | %e |
| |
| Supplemental data | | | | | | | | | | | | |
| Net assets, end of period (000’s) | $ | 6,843 | | $ | 7,412 | | $ | 7,863 | | $ | 6 | |
| Portfolio turnover rate. | | 11.84 | % | | 26.31 | % | | 25.08 | % | | 11.54 | % |
aFor the period May 1, 2013 (effective date) to October 31, 2013.
bThe amount shown for a share outstanding throughout the period may not correlate with the Statement of Operations for the period due to the timing of sales and
repurchases of the Fund’s shares in relation to income earned and/or fluctuating fair value of the investments of the Fund.
cBased on average daily shares outstanding.
dNet investment income per share includes approximately $0.15 per share related to income received in the form of special dividends in connection with certain Fund
holdings. Excluding this amount, the ratio of net investment income to average net assets would have been 1.01%.
eNet investment income per share includes approximately $0.07 per share related to income received in the form of special dividends in connection with certain Fund
holdings. Excluding this amount, the ratio of net investment income to average net assets would have been 1.00%.
fTotal return is not annualized for periods less than one year.
gRatios are annualized for periods less than one year.
hBenefit of expense reduction rounds to less than 0.01%.
franklintempleton.com The accompanying notes are an integral part of these financial statements. | Semiannual Report 45
| | | | | | | | | | | | | | | | | | |
| FRANKLIN VALUE INVESTORS TRUST | | | | | | | | | | | | | | | | |
| FINANCIAL HIGHLIGHTS | | | | | | | | | | | | | | | | | | |
| |
| |
| Franklin Balance Sheet Investment Fund (continued) | | | | | | | | | | | | | | | | |
| | | Six Months Ended | | | | | | | | | | | | | | | | |
| | | April 30, 2016 | | | | | | Year Ended October 31, | | | | |
| | | (unaudited) | | | 2015 | | | 2014 | | | 2013 | | | 2012 | | | 2011 | |
| Advisor Class | | | | | | | | | | | | | | | | | | |
| Per share operating performance | | | | | | | | | | | | | | | | | | |
| (for a share outstanding throughout the period) | | | | | | | | | | | | | | | | | | |
| Net asset value, beginning of period | $ | 41.08 | | $ | 52.68 | | $ | 55.04 | | $ | 43.79 | | $ | 44.82 | | $ | 48.01 | |
| Income from investment operationsa: | | | | | | | | | | | | | | | | | | |
| Net investment incomeb | | 0.15 | | | 0.30 | | | 0.60 | c | | 0.79 | d | | 0.58 | | | 0.58 | |
| Net realized and unrealized gains (losses) | | 0.15 | | | (4.00 | ) | | 3.12 | | | 13.40 | | | 3.69 | | | 1.08 | |
| Total from investment operations | | 0.30 | | | (3.70 | ) | | 3.72 | | | 14.19 | | | 4.27 | | | 1.66 | |
| Less distributions from: | | | | | | | | | | | | | | | | | | |
| Net investment income. | | (0.37 | ) | | (0.31 | ) | | (0.78 | ) | | (0.78 | ) | | (0.38 | ) | | (0.92 | ) |
| Net realized gains | | (5.77 | ) | | (7.59 | ) | | (5.30 | ) | | (2.16 | ) | | (4.92 | ) | | (3.93 | ) |
| Total distributions | | (6.14 | ) | | (7.90 | ) | | (6.08 | ) | | (2.94 | ) | | (5.30 | ) | | (4.85 | ) |
| Net asset value, end of period | $ | 35.24 | | $ | 41.08 | | $ | 52.68 | | $ | 55.04 | | $ | 43.79 | | $ | 44.82 | |
| |
| Total returne | | 1.22 | % | | (7.51 | )% | | 7.23 | % | | 34.39 | % | | 11.34 | % | | 3.01 | % |
| |
| Ratios to average net assetsf | | | | | | | | | | | | | | | | | | |
| Expenses before waiver and payments by | | | | | | | | | | | | | | | | | | |
| affiliates | | 0.71 | % | | 0.70 | % | | 0.65 | % | | 0.66 | % | | 0.74 | % | | 0.69 | % |
| Expenses net of waiver and payments by | | | | | | | | | | | | | | | | | | |
| affiliates | | 0.69 | %g | | 0.69 | % | | 0.64 | %g | | 0.66 | % | | 0.74 | % | | 0.69 | % |
| Net investment income | | 0.82 | % | | 0.70 | % | | 1.14 | %c | | 1.59 | %d | | 1.41 | % | | 1.31 | % |
| |
| Supplemental data | | | | | | | | | | | | | | | | | | |
| Net assets, end of period (000’s) | $ | 60,903 | | $ | 69,330 | | $ | 115,254 | | $ | 107,925 | | $ | 115,694 | | $ | 195,437 | |
| Portfolio turnover rate | | 11.84 | % | | 26.31 | % | | 25.08 | % | | 11.54 | % | | 7.91 | %h | | 9.66 | % |
aThe amount shown for a share outstanding throughout the period may not correlate with the Statement of Operations for the period due to the timing of sales and
repurchases of the Fund’s shares in relation to income earned and/or fluctuating fair value of the investments of the Fund.
bBased on average daily shares outstanding.
cNet investment income per share includes approximately $0.15 per share related to income received in the form of special dividends in connection with certain Fund
holdings. Excluding this amount, the ratio of net investment income to average net assets would have been 0.86%.
dNet investment income per share includes approximately $0.15 per share related to income received in the form of special dividends in connection with certain Fund
holdings. Excluding this amount, the ratio of net investment income to average net assets would have been 1.27%.
eTotal return is not annualized for periods less than one year.
fRatios are annualized for periods less than one year.
gBenefit of expense reduction rounds to less than 0.01%.
hExcludes the value of portfolio securities delivered as a result of a redemption in-kind.
46 Semiannual Report | The accompanying notes are an integral part of these financial statements. franklintempleton.com
FRANKLIN VALUE INVESTORS TRUST
| | | |
| Statement of Investments, April 30, 2016 (unaudited) | | | |
| Franklin Balance Sheet Investment Fund | | | |
| | Shares | | Value |
| |
| Common Stocks 90.8% | | | |
| Banks 8.5% | | | |
| Citigroup Inc | 385,000 | $ | 17,817,800 |
| Citizens Financial Group Inc | 880,000 | | 20,108,000 |
| Comerica Inc | 244,000 | | 10,833,600 |
| Farmers & Merchants Bank of Long Beach | 1,475 | | 8,886,875 |
| JPMorgan Chase & Co | 156,300 | | 9,878,160 |
| KeyCorp | 888,200 | | 10,915,978 |
| Regions Financial Corp | 555,000 | | 5,205,900 |
| | | | 83,646,313 |
| Capital Goods 8.5% | | | |
| a AECOM | 127,200 | | 4,132,728 |
| a Aerovironment Inc | 171,771 | | 4,960,746 |
| Astec Industries Inc | 128,000 | | 6,195,200 |
| a Chart Industries Inc | 168,000 | | 4,324,320 |
| Cubic Corp | 134,000 | | 5,570,380 |
| Encore Wire Corp | 535,000 | | 20,463,750 |
| Granite Construction Inc | 82,000 | | 3,656,380 |
| Mueller Industries Inc | 396,000 | | 12,497,760 |
| Regal Beloit Corp | 173,000 | | 11,144,660 |
| Terex Corp | 287,000 | | 6,856,430 |
| a WESCO International Inc | 70,000 | | 4,115,300 |
| | | | 83,917,654 |
| Commercial & Professional Services 2.9% | | | |
| a Acco Brands Corp | 609,680 | | 5,816,347 |
| Heidrick & Struggles International Inc | 378,800 | | 7,473,724 |
| Kelly Services Inc., A | 584,000 | | 10,961,680 |
| Tetra Tech Inc | 155,000 | | 4,557,000 |
| | | | 28,808,751 |
| Consumer Durables & Apparel 1.0% | | | |
| M.D.C. Holdings Inc | 401,000 | | 9,868,610 |
| Consumer Services 2.6% | | | |
| a,b Ruby Tuesday Inc | 3,089,000 | | 13,591,600 |
| Vail Resorts Inc | 94,500 | | 12,250,980 |
| | | | 25,842,580 |
| Energy 13.4% | | | |
| Chevron Corp | 127,200 | | 12,997,296 |
| a Cloud Peak Energy Inc | 2,956,000 | | 6,532,760 |
| Devon Energy Corp | 700,400 | | 24,289,872 |
| Ensco PLC, A | 372,000 | | 4,449,120 |
| Helmerich & Payne Inc | 84,400 | | 5,580,528 |
| Marathon Oil Corp | 378,000 | | 5,326,020 |
| a McDermott International Inc | 2,033,100 | | 9,230,274 |
| Occidental Petroleum Corp | 199,500 | | 15,291,675 |
| a PHI Inc | 77,500 | | 1,621,300 |
| a PHI Inc., non-voting | 390,000 | | 8,743,800 |
| QEP Resources Inc | 743,200 | | 13,325,576 |
| Rowan Cos. PLC | 884,000 | | 16,628,040 |
| Superior Energy Services Inc | 459,000 | | 7,738,740 |
| | | | 131,755,001 |
franklintempleton.com
Semiannual Report 47
FRANKLIN VALUE INVESTORS TRUST
STATEMENT OF INVESTMENTS (UNAUDITED)
| | | |
| Franklin Balance Sheet Investment Fund (continued) | | | |
| | Shares | | Value |
| |
| Common Stocks (continued) | | | |
| Food, Beverage & Tobacco 4.9% | | | |
| Archer-Daniels-Midland Co | 375,000 | $ | 14,977,500 |
| Bunge Ltd | 218,100 | | 13,631,250 |
| Fresh Del Monte Produce Inc | 285,300 | | 12,342,078 |
| GrainCorp Ltd. (Australia) | 459,436 | | 2,860,842 |
| Sanderson Farms Inc | 50,000 | | 4,587,000 |
| | | | 48,398,670 |
| Health Care Equipment & Services 1.3% | | | |
| Invacare Corp | 504,000 | | 5,664,960 |
| National Healthcare Corp | 105,000 | | 6,767,250 |
| | | | 12,432,210 |
| Life & Health Insurance 6.8% | | | |
| E-L Financial Corp. Ltd. (Canada) | 28,020 | | 15,886,640 |
| MetLife Inc | 367,300 | | 16,565,230 |
| National Western Life Group Inc., A | 84,500 | | 18,311,150 |
| Prudential Financial Inc | 212,000 | | 16,459,680 |
| | | | 67,222,700 |
| Materials 4.8% | | | |
| Albemarle Corp | 62,000 | | 4,101,920 |
| Alcoa Inc | 1,015,830 | | 11,346,821 |
| APERAM (Luxembourg) | 147,000 | | 5,778,170 |
| a Century Aluminum Co | 843,000 | | 7,435,260 |
| Domtar Corp | 220,000 | | 8,500,800 |
| a Intrepid Potash Inc | 1,308,000 | | 1,674,240 |
| Materion Corp | 149,000 | | 4,319,510 |
| Reliance Steel & Aluminum Co | 60,000 | | 4,438,200 |
| | | | 47,594,921 |
| Media 1.5% | | | |
| News Corp., B | 857,000 | | 11,106,720 |
| Time Inc | 267,000 | | 3,924,900 |
| | | | 15,031,620 |
| Multi-line Insurance 2.9% | | | |
| American International Group Inc | 41,000 | | 2,288,620 |
| American National Insurance Co | 81,000 | | 9,405,720 |
| Assurant Inc | 192,000 | | 16,237,440 |
| | | | 27,931,780 |
| Pharmaceuticals, Biotechnology & Life Sciences 1.9% | | | |
| a Bio-Rad Laboratories Inc., A | 131,428 | | 18,643,062 |
| Property & Casualty Insurance 4.3% | | | |
| Chubb Ltd | 105,332 | | 12,414,429 |
| Selective Insurance Group Inc | 309,000 | | 10,725,390 |
| The Travelers Cos. Inc | 170,100 | | 18,693,990 |
| | | | 41,833,809 |
| Real Estate 1.1% | | | |
| a,b Trinity Place Holdings Inc | 1,498,034 | | 11,130,393 |
| Retailing 1.6% | | | |
| Abercrombie & Fitch Co., A | 247,000 | | 6,602,310 |
| Haverty Furniture Cos. Inc | 505,000 | | 9,428,350 |
| | | | 16,030,660 |
48 Semiannual Report
franklintempleton.com
FRANKLIN VALUE INVESTORS TRUST
STATEMENT OF INVESTMENTS (UNAUDITED)
| | | | |
| Franklin Balance Sheet Investment Fund (continued) | | | | |
| | Shares | | Value | |
| |
| Common Stocks (continued) | | | | |
| Semiconductors & Semiconductor Equipment 8.5% | | | | |
| Brooks Automation Inc | 969,000 | $ | 9,166,740 | |
| a First Solar Inc | 527,000 | | 29,427,680 | |
| MKS Instruments Inc | 577,700 | | 20,716,322 | |
| a Photronics Inc | 2,323,900 | | 24,586,862 | |
| | | | 83,897,604 | |
| Technology Hardware & Equipment 7.4% | | | | |
| Corning Inc | 1,975,900 | | 36,890,053 | |
| a Fabrinet (Thailand) | 670,200 | | 21,426,294 | |
| Ingram Micro Inc., A | 339,200 | | 11,855,040 | |
| a Rogers Corp | 50,000 | | 2,868,000 | |
| | | | 73,039,387 | |
| Telecommunication Services 2.8% | | | | |
| a Iridium Communications Inc | 1,305,883 | | 10,538,476 | |
| a ORBCOMM Inc | 1,750,000 | | 17,342,500 | |
| | | | 27,880,976 | |
| Utilities 4.1% | | | | |
| Eversource Energy | 136,000 | | 7,675,840 | |
| Great Plains Energy Inc | 252,999 | | 7,901,190 | |
| IDACORP Inc | 134,000 | | 9,745,820 | |
| PNM Resources Inc | 249,000 | | 7,888,320 | |
| Westar Energy Inc | 130,000 | | 6,709,300 | |
| | | | 39,920,470 | |
| Total Common Stocks (Cost $734,751,860) | | | 894,827,171 | |
| |
| Convertible Preferred Stocks (Cost $4,667,094) 0.6% | | | | |
| Telecommunication Services 0.6% | | | | |
| Iridium Communications Inc., 6.75%, cvt., pfd., B | 20,000 | | 6,015,000 | |
| Escrows and Litigation Trusts (Cost $—) 0.1% | | | | |
| Utilities 0.1% | | | | |
| a,c,d KGen Power Liquidating Trust, Contingent Distribution | 2,800,000 | | 1,206,643 | |
| Total Investments before Short Term Investments (Cost $739,418,954) | | | 902,048,814 | |
| |
| Short Term Investments (Cost $91,218,452) 9.3% | | | | |
| Money Market Funds 9.3% | | | | |
| a,e Institutional Fiduciary Trust Money Market Portfolio | 91,218,452 | | 91,218,452 | |
| Total Investments (Cost $830,637,406) 100.8% | | | 993,267,266 | |
| Other Assets, less Liabilities (0.8)% | | | (7,680,760 | ) |
| Net Assets 100.0% | | $ | 985,586,506 | |
aNon-income producing.
bSee Note 8 regarding holdings of 5% voting securities.
cContingent distributions represent the right to receive additional distributions, if any, during the reorganization of the underlying company.
dSecurity has been deemed illiquid because it may not be able to be sold within seven days.
eSee Note 3(f) regarding investments in affiliated management investment companies.
franklintempleton.com The accompanying notes are an integral part of these financial statements. | Semiannual Report 49
FRANKLIN VALUE INVESTORS TRUST
| | | | | | | | | | | | | | | | | | |
| Financial Highlights | | | | | | | | | | | | | | | | | | |
| Franklin Large Cap Value Fund | | | | | | | | | | | | | | | | | | |
| | | Six Months Ended | | | | | | | | | | | | | | | | |
| | | April 30, 2016 | | | | | | Year Ended October 31, | | | | |
| | | (unaudited) | | | 2015 | | | 2014 | | | 2013 | | | 2012 | | | 2011 | |
| Class A | | | | | | | | | | | | | | | | | | |
| Per share operating performance | | | | | | | | | | | | | | | | | | |
| (for a share outstanding throughout the period) | | | | | | | | | | | | | | | | | | |
| Net asset value, beginning of period | $ | 17.86 | | $ | 18.91 | | $ | 16.85 | | $ | 13.05 | | $ | 11.95 | | $ | 11.78 | |
| Income from investment operationsa: | | | | | | | | | | | | | | | | | | |
| Net investment incomeb | | 0.08 | | | 0.16 | | | 0.11 | | | 0.11 | | | 0.12 | | | 0.10 | |
| Net realized and unrealized gains (losses) | | (0.76 | ) | | (0.86 | ) | | 2.05 | | | 3.83 | | | 1.10 | | | 0.15 | |
| Total from investment operations | | (0.68 | ) | | (0.70 | ) | | 2.16 | | | 3.94 | | | 1.22 | | | 0.25 | |
| Less distributions from: | | | | | | | | | | | | | | | | | | |
| Net investment income. | | (0.16 | ) | | (0.11 | ) | | (0.10 | ) | | (0.14 | ) | | (0.12 | ) | | (0.08 | ) |
| Net realized gains | | (1.41 | ) | | (0.24 | ) | | — | | | — | | | — | | | — | |
| Total distributions | | (1.57 | ) | | (0.35 | ) | | (0.10 | ) | | (0.14 | ) | | (0.12 | ) | | (0.08 | ) |
| Net asset value, end of period | $ | 15.61 | | $ | 17.86 | | $ | 18.91 | | $ | 16.85 | | $ | 13.05 | | $ | 11.95 | |
| |
| Total returnc | | (3.86 | )% | | (3.75 | )% | | 12.86 | % | | 30.53 | % | | 10.31 | % | | 2.09 | % |
| |
| Ratios to average net assetsd | | | | | | | | | | | | | | | | | | |
| Expenses. | | 1.31 | %e | | 1.31 | %e | | 1.31 | %e | | 1.35 | % | | 1.40 | % | | 1.39 | % |
| Net investment income | | 1.04 | % | | 0.87 | % | | 0.61 | % | | 0.75 | % | | 0.95 | % | | 0.79 | % |
| |
| Supplemental data | | | | | | | | | | | | | | | | | | |
| Net assets, end of period (000’s) | $ | 134,343 | | $ | 150,557 | | $ | 163,384 | | $ | 138,325 | | $ | 96,584 | | $ | 101,711 | |
| Portfolio turnover rate | | 9.77 | % | | 16.14 | % | | 7.25 | % | | 5.81 | % | | 15.76 | % | | 17.99 | % |
aThe amount shown for a share outstanding throughout the period may not correlate with the Statement of Operations for the period due to the timing of sales and
repurchases of the Fund’s shares in relation to income earned and/or fluctuating fair value of the investments of the Fund.
bBased on average daily shares outstanding.
cTotal return does not reflect sales commissions or contingent deferred sales charges, if applicable, and is not annualized for periods less than one year.
dRatios are annualized for periods less than one year.
eBenefit of waiver and payments by affiliates rounds to less than 0.01%.
50 Semiannual Report | The accompanying notes are an integral part of these financial statements. franklintempleton.com
| | | | | | | | | | | | | | | | | | |
| | | | | | | | | FRANKLIN VALUE INVESTORS TRUST | |
| | | | | | | | | | | | FINANCIAL HIGHLIGHTS | |
| |
| |
| Franklin Large Cap Value Fund (continued) | | | | | | | | | | | | | | | | |
| | | Six Months Ended | | | | | | | | | | | | | | | | |
| | | April 30, 2016 | | | | | | Year Ended October 31, | | | | |
| | | (unaudited) | | | 2015 | | | 2014 | | | 2013 | | | 2012 | | | 2011 | |
| Class C | | | | | | | | | | | | | | | | | | |
| Per share operating performance | | | | | | | | | | | | | | | | | | |
| (for a share outstanding throughout the period) | | | | | | | | | | | | | | | | | | |
| Net asset value, beginning of period | $ | 17.61 | | $ | 18.67 | | $ | 16.66 | | $ | 12.91 | | $ | 11.82 | | $ | 11.65 | |
| Income from investment operationsa: | | | | | | | | | | | | | | | | | | |
| Net investment income (loss)b | | 0.02 | | | 0.03 | | | (0.01 | ) | | 0.01 | | | 0.03 | | | 0.01 | |
| Net realized and unrealized gains (losses) | | (0.74 | ) | | (0.85 | ) | | 2.02 | | | 3.79 | | | 1.08 | | | 0.16 | |
| Total from investment operations | | (0.72 | ) | | (0.82 | ) | | 2.01 | | | 3.80 | | | 1.11 | | | 0.17 | |
| Less distributions from: | | | | | | | | | | | | | | | | | | |
| Net investment income. | | (0.03 | ) | | — | | | — | | | (0.05 | ) | | (0.02 | ) | | — | |
| Net realized gains | | (1.41 | ) | | (0.24 | ) | | — | | | — | | | — | | | — | |
| Total distributions | | (1.44 | ) | | (0.24 | ) | | — | | | (0.05 | ) | | (0.02 | ) | | — | |
| Net asset value, end of period | $ | 15.45 | | $ | 17.61 | | $ | 18.67 | | $ | 16.66 | | $ | 12.91 | | $ | 11.82 | |
| |
| Total returnc | | (4.19 | )% | | (4.42 | )% | | 12.06 | % | | 29.59 | % | | 9.46 | % | | 1.46 | % |
| |
| Ratios to average net assetsd | | | | | | | | | | | | | | | | | | |
| Expenses. | | 2.04 | %e | | 2.03 | %e | | 2.00 | %e | | 2.06 | % | | 2.11 | % | | 2.09 | % |
| Net investment income (loss) | | 0.31 | % | | 0.15 | % | | (0.08 | )% | | 0.04 | % | | 0.24 | % | | 0.09 | % |
| |
| Supplemental data | | | | | | | | | | | | | | | | | | |
| Net assets, end of period (000’s) | $ | 32,389 | | $ | 36,825 | | $ | 39,232 | | $ | 33,287 | | $ | 22,650 | | $ | 22,062 | |
| Portfolio turnover rate | | 9.77 | % | | 16.14 | % | | 7.25 | % | | 5.81 | % | | 15.76 | % | | 17.99 | % |
aThe amount shown for a share outstanding throughout the period may not correlate with the Statement of Operations for the period due to the timing of sales and
repurchases of the Fund’s shares in relation to income earned and/or fluctuating fair value of the investments of the Fund.
bBased on average daily shares outstanding.
cTotal return does not reflect sales commissions or contingent deferred sales charges, if applicable, and is not annualized for periods less than one year.
dRatios are annualized for periods less than one year.
eBenefit of waiver and payments by affiliates rounds to less than 0.01%.
franklintempleton.com The accompanying notes are an integral part of these financial statements. | Semiannual Report 51
| | | | | | | | | | | | | | | | | | |
| FRANKLIN VALUE INVESTORS TRUST | | | | | | | | | | | | | | | | | | |
| FINANCIAL HIGHLIGHTS | | | | | | | | | | | | | | | | | | |
| |
| |
| Franklin Large Cap Value Fund (continued) | | | | | | | | | | | | | | | | | | |
| Six Months Ended | | | | | | | | | | | | | | | | |
| | | April 30, 2016 | | | | | | Year Ended October 31, | | | | |
| | | (unaudited) | | | 2015 | | | 2014 | | | 2013 | | | 2012 | | | 2011 | |
| Class R | | | | | | | | | | | | | | | | | | |
| Per share operating performance | | | | | | | | | | | | | | | | | | |
| (for a share outstanding throughout the period) | | | | | | | | | | | | | | | | | | |
| Net asset value, beginning of period | $ | 17.71 | | $ | 18.76 | | $ | 16.70 | | $ | 12.94 | | $ | 11.85 | | $ | 11.68 | |
| Income from investment operationsa: | | | | | | | | | | | | | | | | | | |
| Net investment incomeb | | 0.06 | | | 0.12 | | | 0.08 | | | 0.08 | | | 0.09 | | | 0.07 | |
| Net realized and unrealized gains (losses) | | (0.74 | ) | | (0.87 | ) | | 2.03 | | | 3.80 | | | 1.09 | | | 0.16 | |
| Total from investment operations | | (0.68 | ) | | (0.75 | ) | | 2.11 | | | 3.88 | | | 1.18 | | | 0.23 | |
| Less distributions from: | | | | | | | | | | | | | | | | | | |
| Net investment income. | | (0.12 | ) | | (0.06 | ) | | (0.05 | ) | | (0.12 | ) | | (0.09 | ) | | (0.06 | ) |
| Net realized gains | | (1.41 | ) | | (0.24 | ) | | — | | | — | | | — | | | — | |
| Total distributions | | (1.53 | ) | | (0.30 | ) | | (0.05 | ) | | (0.12 | ) | | (0.09 | ) | | (0.06 | ) |
| Net asset value, end of period | $ | 15.50 | | $ | 17.71 | | $ | 18.76 | | $ | 16.70 | | $ | 12.94 | | $ | 11.85 | |
| |
| Total returnc | | (3.91 | )% | | (4.01 | )% | | 12.69 | % | | 30.20 | % | | 10.07 | % | | 1.92 | % |
| |
| Ratios to average net assetsd | | | | | | | | | | | | | | | | | | |
| Expenses. | | 1.56 | %e | | 1.53 | %e | | 1.50 | %e | | 1.56 | % | | 1.61 | % | | 1.59 | % |
| Net investment income | | 0.79 | % | | 0.65 | % | | 0.42 | % | | 0.54 | % | | 0.74 | % | | 0.59 | % |
| |
| Supplemental data | | | | | | | | | | | | | | | | | | |
| Net assets, end of period (000’s) | $ | 4,002 | | $ | 4,322 | | $ | 4,822 | | $ | 4,531 | | $ | 3,644 | | $ | 3,638 | |
| Portfolio turnover rate | | 9.77 | % | | 16.14 | % | | 7.25 | % | | 5.81 | % | | 15.76 | % | | 17.99 | % |
aThe amount shown for a share outstanding throughout the period may not correlate with the Statement of Operations for the period due to the timing of sales and
repurchases of the Fund’s shares in relation to income earned and/or fluctuating fair value of the investments of the Fund.
bBased on average daily shares outstanding.
cTotal return is not annualized for periods less than one year.
dRatios are annualized for periods less than one year.
eBenefit of waiver and payments by affiliates rounds to less than 0.01%.
52 Semiannual Report | The accompanying notes are an integral part of these financial statements. franklintempleton.com
| | | | | | | | | | | | | | | | | | |
| | | | | | | | | FRANKLIN VALUE INVESTORS TRUST | |
| | | | | | | | | | | | FINANCIAL HIGHLIGHTS | |
| |
| |
| Franklin Large Cap Value Fund (continued) | | | | | | | | | | | | | | | | |
| | | Six Months Ended | | | | | | | | | | | | | | | | |
| | | April 30, 2016 | | | | | | Year Ended October 31, | | | | |
| | | (unaudited) | | | 2015 | | | 2014 | | | 2013 | | | 2012 | | | 2011 | |
| Advisor Class | | | | | | | | | | | | | | | | | | |
| Per share operating performance | | | | | | | | | | | | | | | | | | |
| (for a share outstanding throughout the period) | | | | | | | | | | | | | | | | | | |
| Net asset value, beginning of period | $ | 17.81 | | $ | 18.86 | | $ | 16.80 | | $ | 13.01 | | $ | 11.93 | | $ | 11.75 | |
| Income from investment operationsa: | | | | | | | | | | | | | | | | | | |
| Net investment incomeb | | 0.10 | | | 0.21 | | | 0.17 | | | 0.15 | | | 0.15 | | | 0.13 | |
| Net realized and unrealized gains (losses) | | (0.76 | ) | | (0.86 | ) | | 2.03 | | | 3.82 | | | 1.08 | | | 0.16 | |
| Total from investment operations | | (0.66 | ) | | (0.65 | ) | | 2.20 | | | 3.97 | | | 1.23 | | | 0.29 | |
| Less distributions from: | | | | | | | | | | | | | | | | | | |
| Net investment income. | | (0.21 | ) | | (0.16 | ) | | (0.14 | ) | | (0.18 | ) | | (0.15 | ) | | (0.11 | ) |
| Net realized gains | | (1.41 | ) | | (0.24 | ) | | — | | | — | | | — | | | — | |
| Total distributions | | (1.62 | ) | | (0.40 | ) | | (0.14 | ) | | (0.18 | ) | | (0.15 | ) | | (0.11 | ) |
| Net asset value, end of period | $ | 15.53 | | $ | 17.81 | | $ | 18.86 | | $ | 16.80 | | $ | 13.01 | | $ | 11.93 | |
| |
| Total returnc | | (3.74 | )% | | (3.46 | )% | | 13.19 | % | | 30.95 | % | | 10.53 | % | | 2.47 | % |
| |
| Ratios to average net assetsd | | | | | | | | | | | | | | | | | | |
| Expenses. | | 1.06 | %e | | 1.03 | %e | | 1.00 | %e | | 1.06 | % | | 1.11 | % | | 1.09 | % |
| Net investment income | | 1.29 | % | | 1.15 | % | | 0.92 | % | | 1.04 | % | | 1.24 | % | | 1.09 | % |
| |
| Supplemental data | | | | | | | | | | | | | | | | | | |
| Net assets, end of period (000’s) | $ | 6,091 | | $ | 6,828 | | $ | 6,858 | | $ | 10,454 | | $ | 7,169 | | $ | 6,028 | |
| Portfolio turnover rate | | 9.77 | % | | 16.14 | % | | 7.25 | % | | 5.81 | % | | 15.76 | % | | 17.99 | % |
aThe amount shown for a share outstanding throughout the period may not correlate with the Statement of Operations for the period due to the timing of sales and
repurchases of the Fund’s shares in relation to income earned and/or fluctuating fair value of the investments of the Fund.
bBased on average daily shares outstanding.
cTotal return is not annualized for periods less than one year.
dRatios are annualized for periods less than one year.
eBenefit of waiver and payments by affiliates rounds to less than 0.01%.
franklintempleton.com The accompanying notes are an integral part of these financial statements. | Semiannual Report 53
| | | |
| FRANKLIN VALUE INVESTORS TRUST | | | |
| |
| |
| |
| |
| Statement of Investments, April 30, 2016 (unaudited) | | | |
| Franklin Large Cap Value Fund | | | |
| | Shares/ | | |
| | Units | | Value |
| |
| Common Stocks and Other Equity Interests 93.8% | | | |
| Automobiles & Components 2.4% | | | |
| Johnson Controls Inc | 103,500 | $ | 4,284,900 |
| Banks 6.6% | | | |
| BB&T Corp | 69,000 | | 2,441,220 |
| Citigroup Inc | 68,000 | | 3,147,040 |
| KeyCorp | 246,000 | | 3,023,340 |
| U.S. Bancorp | 71,000 | | 3,030,990 |
| | | | 11,642,590 |
| Capital Goods 15.3% | | | |
| Dover Corp | 34,500 | | 2,266,650 |
| Eaton Corp. PLC | 55,000 | | 3,479,850 |
| General Dynamics Corp | 26,000 | | 3,653,520 |
| General Electric Co | 83,500 | | 2,567,625 |
| Illinois Tool Works Inc | 28,000 | | 2,926,560 |
| Parker Hannifin Corp | 27,000 | | 3,132,540 |
| Pentair PLC (United Kingdom) | 46,000 | | 2,671,680 |
| Rockwell Automation Inc | 15,000 | | 1,702,050 |
| Stanley Black & Decker Inc | 22,000 | | 2,462,240 |
| United Technologies Corp | 20,500 | | 2,139,585 |
| | | | 27,002,300 |
| Consumer Durables & Apparel 3.1% | | | |
| NIKE Inc., B | 64,800 | | 3,819,312 |
| Ralph Lauren Corp | 18,500 | | 1,724,385 |
| | | | 5,543,697 |
| Diversified Financials 6.5% | | | |
| a Berkshire Hathaway Inc., A | 8 | | 1,752,000 |
| Capital One Financial Corp | 20,456 | | 1,480,810 |
| Discover Financial Services | 47,000 | | 2,644,690 |
| KKR & Co., LP (common units) | 135,000 | | 1,836,000 |
| Northern Trust Corp | 14,000 | | 995,120 |
| State Street Corp | 45,000 | | 2,803,500 |
| | | | 11,512,120 |
| Energy 8.8% | | | |
| Baker Hughes Inc | 37,200 | | 1,798,992 |
| Chevron Corp | 30,000 | | 3,065,400 |
| Exxon Mobil Corp | 29,000 | | 2,563,600 |
| Occidental Petroleum Corp | 25,500 | | 1,954,575 |
| Phillips 66 | 19,250 | | 1,580,617 |
| Schlumberger Ltd | 33,000 | | 2,651,220 |
| Valero Energy Corp | 32,000 | | 1,883,840 |
| | | | 15,498,244 |
| Food & Staples Retailing 1.7% | | | |
| CVS Health Corp | 30,000 | | 3,015,000 |
| Food, Beverage & Tobacco 2.8% | | | |
| Archer-Daniels-Midland Co | 65,000 | | 2,596,100 |
| Bunge Ltd | 37,500 | | 2,343,750 |
| | | | 4,939,850 |
54 Semiannual Report
franklintempleton.com
FRANKLIN VALUE INVESTORS TRUST
STATEMENT OF INVESTMENTS (UNAUDITED)
| | | |
| Franklin Large Cap Value Fund (continued) | | | |
| | Shares/ | | |
| | Units | | Value |
| |
| Common Stocks and Other Equity Interests (continued) | | | |
| Health Care Equipment & Services 5.4% | | | |
| Abbott Laboratories | 53,300 | $ | 2,073,370 |
| Becton, Dickinson and Co | 24,000 | | 3,870,240 |
| Medtronic PLC | 45,400 | | 3,593,410 |
| | | | 9,537,020 |
| Household & Personal Products 0.9% | | | |
| The Procter & Gamble Co | 20,000 | | 1,602,400 |
| Insurance 7.4% | | | |
| Aflac Inc | 57,000 | | 3,931,290 |
| The Allstate Corp | 57,000 | | 3,707,850 |
| MetLife Inc | 20,000 | | 902,000 |
| Principal Financial Group Inc | 28,000 | | 1,195,040 |
| Prudential Financial Inc | 20,000 | | 1,552,800 |
| The Travelers Cos. Inc | 17,000 | | 1,868,300 |
| | | | 13,157,280 |
| Materials 6.0% | | | |
| Air Products and Chemicals Inc | 10,400 | | 1,517,256 |
| Albemarle Corp | 42,000 | | 2,778,720 |
| Alcoa Inc | 150,000 | | 1,675,500 |
| FMC Corp | 20,000 | | 865,200 |
| Nucor Corp | 48,000 | | 2,389,440 |
| Praxair Inc | 12,000 | | 1,409,520 |
| | | | 10,635,636 |
| Pharmaceuticals, Biotechnology & Life Sciences 9.2% | | | |
| Merck & Co. Inc | 64,000 | | 3,509,760 |
| Perrigo Co. PLC | 50,000 | | 4,833,500 |
| Pfizer Inc | 95,000 | | 3,107,450 |
| Roche Holding AG, ADR (Switzerland) | 70,000 | | 2,209,900 |
| Sanofi, ADR (France) | 65,000 | | 2,671,500 |
| | | | 16,332,110 |
| Retailing 4.5% | | | |
| The Home Depot Inc | 21,500 | | 2,878,635 |
| Nordstrom Inc | 39,000 | | 1,994,070 |
| Target Corp | 38,000 | | 3,021,000 |
| | | | 7,893,705 |
| Semiconductors & Semiconductor Equipment 4.1% | | | |
| a First Solar Inc | 20,000 | | 1,116,800 |
| Microchip Technology Inc | 45,000 | | 2,186,550 |
| QUALCOMM Inc | 77,500 | | 3,915,300 |
| | | | 7,218,650 |
| Software & Services 2.9% | | | |
| Microsoft Corp | 104,500 | | 5,211,415 |
| Technology Hardware & Equipment 4.8% | | | |
| Cisco Systems Inc | 70,000 | | 1,924,300 |
| Corning Inc | 195,000 | | 3,640,650 |
| TE Connectivity Ltd | 23,600 | | 1,403,728 |
| Western Digital Corp | 35,000 | | 1,430,275 |
| | | | 8,398,953 |
franklintempleton.com
Semiannual Report 55
FRANKLIN VALUE INVESTORS TRUST
STATEMENT OF INVESTMENTS (UNAUDITED)
| | | | |
| Franklin Large Cap Value Fund (continued) | | | | |
| | Shares/ | | | |
| | Units | | Value | |
| Common Stocks and Other Equity Interests (continued) | | | | |
| Transportation 1.4% | | | | |
| American Airlines Group Inc | 44,000 | $ | 1,526,360 | |
| Norfolk Southern Corp | 11,000 | | 991,210 | |
| | | | 2,517,570 | |
| Total Common Stocks and Other Equity Interests (Cost $123,637,109) | | | 165,943,440 | |
| |
| Short Term Investments (Cost $11,290,167) 6.4% | | | | |
| Money Market Funds 6.4% | | | | |
| a,b Institutional Fiduciary Trust Money Market Portfolio | 11,290,167 | | 11,290,167 | |
| Total Investments (Cost $134,927,276) 100.2% | | | 177,233,607 | |
| Other Assets, less Liabilities (0.2)% | | | (408,196 | ) |
| Net Assets 100.0% | | $ | 176,825,411 | |
See Abbreviations on page 108.
aNon-income producing.
bSee Note 3(f) regarding investments in affiliated management investment companies.
56 Semiannual Report | The accompanying notes are an integral part of these financial statements. franklintempleton.com
FRANKLIN VALUE INVESTORS TRUST
| | | | | | | | | | | | | | | | | | |
| Financial Highlights | | | | | | | | | | | | | | | | | | |
| Franklin MicroCap Value Fund | | | | | | | | | | | | | | | | | | |
| | | Six Months Ended | | | | | | | | | | | | | | | | |
| | | April 30, 2016 | | | | | | Year Ended October 31, | | | | |
| | | (unaudited) | | | 2015 | | | 2014 | | | 2013 | | | 2012 | | | 2011 | |
| Class A | | | | | | | | | | | | | | | | | | |
| Per share operating performance | | | | | | | | | | | | | | | | | | |
| (for a share outstanding throughout the period) | | | | | | | | | | | | | | | | | | |
| Net asset value, beginning of period | $ | 32.90 | | $ | 39.88 | | $ | 40.99 | | $ | 32.60 | | $ | 32.38 | | $ | 29.34 | |
| Income from investment operationsa: | | | | | | | | | | | | | | | | | | |
| Net investment income (loss)b | | 0.06 | | | —c | | | (0.07 | )d | | 0.10 | e | | 0.30 | f | | 0.04 | |
| Net realized and unrealized gains (losses) | | 1.56 | | | (3.33 | ) | | 1.44 | | | 10.25 | | | 3.77 | | | 4.07 | |
| Total from investment operations | | 1.62 | | | (3.33 | ) | | 1.37 | | | 10.35 | | | 4.07 | | | 4.11 | |
| Less distributions from: | | | | | | | | | | | | | | | | | | |
| Net investment income. | | — | | | — | | | (0.04 | ) | | (0.52 | ) | | (0.02 | ) | | (0.09 | ) |
| Net realized gains | | (3.90 | ) | | (3.65 | ) | | (2.44 | ) | | (1.44 | ) | | (3.83 | ) | | (0.98 | ) |
| Total distributions | | (3.90 | ) | | (3.65 | ) | | (2.48 | ) | | (1.96 | ) | | (3.85 | ) | | (1.07 | ) |
| Net asset value, end of period | $ | 30.62 | | $ | 32.90 | | $ | 39.88 | | $ | 40.99 | | $ | 32.60 | | $ | 32.38 | |
| |
| Total returng | | 5.80 | % | | (8.58 | )% | | 3.39 | % | | 33.64 | % | | 14.70 | % | | 14.16 | % |
| |
| Ratios to average net assetsh | | | | | | | | | | | | | | | | | | |
| Expenses before waiver and payments by | | | | | | | | | | | | | | | | | | |
| affiliates | | 1.21 | % | | 1.20 | % | | 1.16 | % | | 1.15 | % | | 1.16 | % | | 1.16 | % |
| Expenses net of waiver and payments by | | | | | | | | | | | | | | | | | | |
| affiliates | | 1.20 | %i | | 1.19 | % | | 1.14 | %i | | 1.15 | % | | 1.16 | % | | 1.16 | % |
| Net investment income (loss) | | 0.40 | % | | 0.02 | % | | (0.17 | )%d | | 0.36 | %e | | 1.01 | %f | | 0.12 | % |
| |
| Supplemental data | | | | | | | | | | | | | | | | | | |
| Net assets, end of period (000’s) | $ | 247,014 | | $ | 258,143 | | $ | 346,820 | | $ | 370,763 | | $ | 202,636 | | $ | 214,646 | |
| Portfolio turnover rate | | 4.96 | % | | 8.64 | % | | 11.63 | % | | 11.31 | % | | 5.03 | % | | 9.46 | % |
aThe amount shown for a outstanding throughout the period may not correlate with the Statement of Operations for the period due to the timing of sales and repurchases of
the Fund’s shares in relation to income earned and/or fluctuating fair value of the investments of the Fund.
bBased on average daily shares outstanding.
cAmount rounds to less than $0.01 per share.
dNet investment income per share includes approximately $0.06 per share related to income received in the form of special dividends in connection with certain Fund
holdings. Excluding this amount, the ratio of net investment income to average net assets would have been (0.31)%.
eNet investment income per share includes approximately $0.17 per share related to income received in the form of special dividends in connection with certain Fund
holdings. Excluding this amount, the ratio of net investment income to average net assets would have been (0.10)%.
fNet investment income per share includes approximately $0.23 per share related to income received in the form of special dividends in connection with certain Fund
holdings. Excluding this amount, the ratio of net investment income to average net assets would have been 0.25%.
gTotal return does not reflect sales commissions or contingent deferred sales charges, if applicable, and is not annualized for periods less than one year.
hRatios are annualized for periods less than one year.
iBenefit of expense reduction rounds to less than 0.01%.
franklintempleton.com The accompanying notes are an integral part of these financial statements. | Semiannual Report 57
| | | | | | | | | | | | |
| FRANKLIN VALUE INVESTORS TRUST | | | | | | | | | | | | |
| FINANCIAL HIGHLIGHTS | | | | | | | | | | | | |
| |
| |
| Franklin MicroCap Value Fund (continued) | | | | | | | | | | | | |
| | | Six Months Ended | | | | | | | | | | |
| | | April 30, 2016 | | | Year Ended October 31, | |
| | | (unaudited) | | | 2015 | | | 2014 | | | 2013 | a |
| Class R6 | | | | | | | | | | | | |
| Per share operating performance | | | | | | | | | | | | |
| (for a share outstanding throughout the period) | | | | | | | | | | | | |
| Net asset value, beginning of period | $ | 33.09 | | $ | 39.94 | | $ | 41.03 | | $ | 34.43 | |
| Income from investment operationsb: | | | | | | | | | | | | |
| Net investment incomec | | 0.11 | | | 0.14 | | | 0.03 | d | | 0.04 | |
| Net realized and unrealized gains (losses) | | 1.58 | | | (3.34 | ) | | 1.50 | | | 6.56 | |
| Total from investment operations | | 1.69 | | | (3.20 | ) | | 1.53 | | | 6.60 | |
| Less distributions from: | | | | | | | | | | | | |
| Net investment income | | — | | | — | | | (0.18 | ) | | — | |
| Net realized gains | | (3.90 | ) | | (3.65 | ) | | (2.44 | ) | | — | |
| Total distributions | | (3.90 | ) | | (3.65 | ) | | (2.62 | ) | | — | |
| Net asset value, end of period | $ | 30.88 | | $ | 33.09 | | $ | 39.94 | | $ | 41.03 | |
| |
| Total returne | | 6.00 | % | | (8.21 | )% | | 3.79 | % | | 19.17 | % |
| |
| Ratios to average net assetsf | | | | | | | | | | | | |
| Expenses before waiver and payments by affiliates | | 0.82 | % | | 0.81 | % | | 0.79 | % | | 0.79 | % |
| Expenses net of waiver and payments by affiliates. | | 0.81 | %g | | 0.80 | % | | 0.77 | %g | | 0.79 | % |
| Net investment income | | 0.79 | % | | 0.41 | % | | 0.20 | %d | | 0.19 | % |
| |
| Supplemental data | | | | | | | | | | | | |
| Net assets, end of period (000’s) | $ | 18,524 | | $ | 18,031 | | $ | 25,020 | | $ | 59,597 | |
| Portfolio turnover rate. | | 4.96 | % | | 8.64 | % | | 11.63 | % | | 11.31 | % |
aFor the period May 1, 2013 (effective date) to October 31, 2013.
bThe amount shown for a outstanding throughout the period may not correlate with the Statement of Operations for the period due to the timing of sales and repurchases of
the Fund’s shares in relation to income earned and/or fluctuating fair value of the investments of the Fund.
cBased on average daily shares outstanding.
dNet investment income per share includes approximately $0.06 per share related to income received in the form of special dividends in connection with certain Fund
holdings. Excluding this amount, the ratio of net investment income to average net assets would have been 0.06%.
eTotal return is not annualized for periods less than one year.
fRatios are annualized for periods less than one year.
gBenefit of expense reduction rounds to less than 0.01%.
58 Semiannual Report | The accompanying notes are an integral part of these financial statements. franklintempleton.com
| | | | | | | | | | | | | | | | | | |
| | | | | | | | | FRANKLIN VALUE INVESTORS TRUST | |
| | | | | | | | | | | | FINANCIAL HIGHLIGHTS | |
| |
| |
| Franklin MicroCap Value Fund (continued) | | | | | | | | | | | | | | | | |
| | | Six Months Ended | | | | | | | | | | | | | | | | |
| | | April 30, 2016 | | | | | | Year Ended October 31, | | | | |
| | | (unaudited) | | | 2015 | | | 2014 | | | 2013 | | | 2012 | | | 2011 | |
| Advisor Class | | | | | | | | | | | | | | | | | | |
| Per share operating performance | | | | | | | | | | | | | | | | | | |
| (for a share outstanding throughout the period) | | | | | | | | | | | | | | | | | | |
| Net asset value, beginning of period | $ | 33.00 | | $ | 39.90 | | $ | 40.99 | | $ | 32.61 | | $ | 32.41 | | $ | 29.37 | |
| Income from investment operationsa: | | | | | | | | | | | | | | | | | | |
| Net investment incomeb | | 0.09 | | | 0.09 | | | 0.04 | c | | 0.31 | d | | 0.39 | e | | 0.12 | |
| Net realized and unrealized gains (losses) | | 1.57 | | | (3.34 | ) | | 1.43 | | | 10.11 | | | 3.74 | | | 4.07 | |
| Total from investment operations | | 1.66 | | | (3.25 | ) | | 1.47 | | | 10.42 | | | 4.13 | | | 4.19 | |
| Less distributions from: | | | | | | | | | | | | | | | | | | |
| Net investment income. | | — | | | — | | | (0.12 | ) | | (0.60 | ) | | (0.10 | ) | | (0.17 | ) |
| Net realized gains | | (3.90 | ) | | (3.65 | ) | | (2.44 | ) | | (1.44 | ) | | (3.83 | ) | | (0.98 | ) |
| Total distributions | | (3.90 | ) | | (3.65 | ) | | (2.56 | ) | | (2.04 | ) | | (3.93 | ) | | (1.15 | ) |
| Net asset value, end of period | $ | 30.76 | | $ | 33.00 | | $ | 39.90 | | $ | 40.99 | | $ | 32.61 | | $ | 32.41 | |
| |
| Total returnf | | 5.91 | % | | (8.36 | )% | | 3.64 | % | | 33.93 | % | | 14.97 | % | | 14.44 | % |
| |
| Ratios to average net assetsg | | | | | | | | | | | | | | | | | | |
| Expenses before waiver and payments by | | | | | | | | | | | | | | | | | | |
| affiliates | | 0.97 | % | | 0.96 | % | | 0.92 | % | | 0.91 | % | | 0.92 | % | | 0.91 | % |
| Expenses net of waiver and payments by | | | | | | | | | | | | | | | | | | |
| affiliates | | 0.96 | %h | | 0.95 | % | | 0.90 | %h | | 0.91 | % | | 0.92 | % | | 0.91 | % |
| Net investment income | | 0.64 | % | | 0.26 | % | | 0.07 | %c | | 0.60 | %d | | 1.25 | %e | | 0.37 | % |
| |
| Supplemental data | | | | | | | | | | | | | | | | | | |
| Net assets, end of period (000’s) | $ | 60,263 | | $ | 67,538 | | $ | 89,880 | | $ | 116,292 | | $ | 165,296 | | $ | 133,697 | |
| Portfolio turnover rate | | 4.96 | % | | 8.64 | % | | 11.63 | % | | 11.31 | % | | 5.03 | % | | 9.46 | % |
aThe amount shown for a outstanding throughout the period may not correlate with the Statement of Operations for the period due to the timing of sales and repurchases of
the Fund’s shares in relation to income earned and/or fluctuating fair value of the investments of the Fund.
bBased on average daily shares outstanding.
cNet investment income per share includes approximately $0.06 per share related to income received in the form of special dividends in connection with certain Fund
holdings. Excluding this amount, the ratio of net investment income to average net assets would have been (0.07)%.
dNet investment income per share includes approximately $0.17 per share related to income received in the form of special dividends in connection with certain Fund
holdings. Excluding this amount, the ratio of net investment income to average net assets would have been 0.14%.
eNet investment income per share includes approximately $0.23 per share related to income received in the form of special dividends in connection with certain Fund
holdings. Excluding this amount, the ratio of net investment income to average net assets would have been 0.49%.
fTotal return is not annualized for periods less than one year.
gRatios are annualized for periods less than one year.
hBenefit of expense reduction rounds to less than 0.01%.
franklintempleton.com The accompanying notes are an integral part of these financial statements. | Semiannual Report 59
FRANKLIN VALUE INVESTORS TRUST
Statement of Investments, April 30, 2016 (unaudited)
Franklin MicroCap Value Fund
| | | |
| | Shares | | Value |
| |
| Common Stocks 96.8% | | | |
| Aerospace & Defense 2.7% | | | |
| a Ducommun Inc | 269,042 | $ | 4,280,458 |
| a Sparton Corp | 206,000 | | 4,420,760 |
| | | | 8,701,218 |
| Automobiles & Components 2.2% | | | |
| Spartan Motors Inc | 1,450,000 | | 7,047,000 |
| Banks 11.3% | | | |
| Bar Harbor Bankshares | 214,500 | | 7,443,150 |
| Citizens Community Bancorp Inc | 95,000 | | 871,150 |
| County Bancorp Inc | 50,000 | | 1,045,000 |
| First Defiance Financial Corp | 155,000 | | 6,134,900 |
| Investar Holding Corp | 200,000 | | 3,038,000 |
| b Northeast Bancorp | 459,500 | | 5,169,375 |
| Old Line Bancshares Inc | 94,145 | | 1,739,800 |
| Peoples Financial Services Corp | 87,543 | | 3,450,945 |
| Southern Missouri Bancorp Inc | 118,000 | | 2,922,860 |
| WSFS Financial Corp | 145,500 | | 4,967,370 |
| | | | 36,782,550 |
| Building Products 5.4% | | | |
| a Armstrong Flooring Inc | 160,000 | | 2,329,600 |
| Burnham Holdings Inc., A | 219,000 | | 3,580,650 |
| a,b Continental Materials Corp | 129,700 | | 1,849,522 |
| a Gibraltar Industries Inc | 261,000 | | 6,903,450 |
| Insteel Industries Inc | 100,000 | | 2,899,000 |
| | | | 17,562,222 |
| Commercial & Professional Services 3.4% | | | |
| Ecology and Environment Inc., A | 140,000 | | 1,533,000 |
| Healthcare Services Group Inc | 257,000 | | 9,727,450 |
| | | | 11,260,450 |
| Construction & Engineering 3.3% | | | |
| a Northwest Pipe Co | 267,600 | | 2,887,404 |
| a Orion Marine Group Inc | 460,000 | | 2,686,400 |
| a Sterling Construction Co | 963,400 | | 5,048,216 |
| | | | 10,622,020 |
| Consumer Durables & Apparel 4.7% | | | |
| a,b Delta Apparel Inc | 561,600 | | 11,372,400 |
| Flexsteel Industries Inc | 76,700 | | 3,136,263 |
| Rocky Brands Inc | 62,000 | | 747,100 |
| | | | 15,255,763 |
| Consumer Services 2.9% | | | |
| a,b Full House Resorts Inc | 1,600,000 | | 2,592,000 |
| a Golden Entertainment Inc | 129,800 | | 1,570,580 |
| a Ruby Tuesday Inc | 1,221,200 | | 5,373,280 |
| | | | 9,535,860 |
| Diversified Financials 0.8% | | | |
| KCAP Financial Inc | 734,225 | | 2,650,552 |
60 Semiannual Report
franklintempleton.com
FRANKLIN VALUE INVESTORS TRUST
STATEMENT OF INVESTMENTS (UNAUDITED)
| | | |
| Franklin MicroCap Value Fund (continued) | | |
| | Shares | | Value |
| |
| Common Stocks (continued) | | | |
| Electrical Equipment 0.5% | | | |
| a Broadwind Energy Inc | 28,621 | $ | 96,739 |
| a Global Power Equipment Group Inc | 675,000 | | 1,559,250 |
| | | | 1,655,989 |
| Energy 9.2% | | | |
| Ardmore Shipping Corp. (Ireland) | 365,000 | | 3,412,750 |
| a Cloud Peak Energy Inc | 480,000 | | 1,060,800 |
| Gulf Island Fabrication Inc | 160,000 | | 1,201,600 |
| a Natural Gas Services Group Inc | 200,000 | | 4,598,000 |
| a Parker Drilling Co | 900,000 | | 2,754,000 |
| a PHI Inc | 17,600 | | 368,192 |
| a PHI Inc., non-voting | 391,000 | | 8,766,220 |
| a Renewable Energy Group Inc | 270,000 | | 2,624,400 |
| Tesco Corp | 555,200 | | 5,252,192 |
| | | | 30,038,154 |
| Food & Staples Retailing 1.7% | | | |
| Village Super Market Inc., A | 227,000 | | 5,538,800 |
| Food, Beverage & Tobacco 7.9% | | | |
| John B. Sanfilippo & Son Inc | 71,300 | | 3,945,029 |
| a Omega Protein Corp | 320,000 | | 5,948,800 |
| a Seneca Foods Corp., A | 356,000 | | 11,602,040 |
| a Seneca Foods Corp., B | 121,500 | | 4,214,774 |
| | | | 25,710,643 |
| Health Care Equipment & Services 0.3% | | |
| Invacare Corp | 85,000 | | 955,400 |
| Industrial Conglomerates 0.0%† | | | |
| a,c Smith Investment Co. LLC | 44,600 | | 32,692 |
| Insurance 4.8% | | | |
| a,b ACMAT Corp., A | 235,600 | | 4,386,872 |
| Baldwin & Lyons Inc., B | 302,701 | | 7,398,012 |
| a Global Indemnity PLC, A | 74,000 | | 2,327,300 |
| a Hallmark Financial Services Inc | 138,000 | | 1,558,020 |
| | | | 15,670,204 |
| Machinery 11.3% | | | |
| Alamo Group Inc | 121,600 | | 6,863,104 |
| Dynamic Materials Corp | 114,000 | | 1,113,780 |
| b Hardinge Inc | 821,900 | | 10,684,700 |
| b Hurco Cos. Inc | 340,000 | | 11,009,200 |
| a Key Technology Inc | 10,050 | | 89,948 |
| Miller Industries Inc | 340,000 | | 7,228,400 |
| | | | 36,989,132 |
| Materials 6.3% | | | |
| Friedman Industries Inc | 116,000 | | 718,040 |
| Mercer International Inc. (Canada) | 200,000 | | 1,680,000 |
| The Monarch Cement Co | 140,744 | | 4,644,552 |
| Olympic Steel Inc | 327,000 | | 7,396,740 |
| Schnitzer Steel Industries Inc., A | 105,000 | | 2,165,100 |
| a Universal Stainless & Alloy Products Inc | 301,000 | | 3,922,030 |
| | | | 20,526,462 |
franklintempleton.com
Semiannual Report 61
FRANKLIN VALUE INVESTORS TRUST
STATEMENT OF INVESTMENTS (UNAUDITED)
| | | |
| Franklin MicroCap Value Fund (continued) | | | |
| | Shares | | Value |
| |
| Common Stocks (continued) | | | |
| Real Estate 1.7% | | | |
| a,c Allen Organ Co. (LandCo. Holdings) | 94,800 | $ | 303,104 |
| Arbor Realty Trust Inc | 220,000 | | 1,469,600 |
| a Bresler & Reiner Inc | 205,000 | | 108,650 |
| Griffin Industrial Realty Inc | 127,000 | | 3,263,900 |
| a,b Origen Financial Inc | 1,900,000 | | 273,600 |
| | | | 5,418,854 |
| Retailing 6.0% | | | |
| a America’s Car-Mart Inc | 50,000 | | 1,328,500 |
| Caleres Inc | 210,200 | | 5,299,142 |
| Fred’s Inc | 260,000 | | 3,814,200 |
| Haverty Furniture Cos. Inc | 182,900 | | 3,414,743 |
| Shoe Carnival Inc | 223,000 | | 5,715,490 |
| | | | 19,572,075 |
| Semiconductors & Semiconductor Equipment 1.5% | | | |
| a Photronics Inc | 452,000 | | 4,782,160 |
| Technology Hardware & Equipment 1.4% | | | |
| a Key Tronic Corp | 430,000 | | 3,065,900 |
| a Kimball Electronics Inc | 100,725 | | 1,101,932 |
| Richardson Electronics Ltd | 60,000 | | 312,000 |
| | | | 4,479,832 |
| Telecommunication Services 4.8% | | | |
| a Alaska Communications Systems Group Inc | 1,150,000 | | 2,081,500 |
| Atlantic Tele-Network Inc | 66,000 | | 4,746,060 |
| a Hawaiian Telcom Holdco Inc | 225,000 | | 5,181,750 |
| North State Telecommunications Corp., B | 21,757 | | 1,036,177 |
| a ORBCOMM Inc | 250,000 | | 2,477,500 |
| | | | 15,522,987 |
| Trading Companies & Distributors 1.0% | | | |
| Central Steel and Wire Co | 6,328 | | 2,847,600 |
| Houston Wire & Cable Co | 60,000 | | 438,600 |
| | | | 3,286,200 |
| Transportation 1.5% | | | |
| Global Ship Lease Inc., A (United Kingdom) | 550,000 | | 1,259,500 |
| International Shipholding Corp | 345,000 | | 862,500 |
| Providence and Worcester Railroad Co | 185,000 | | 2,941,500 |
| | | | 5,063,500 |
| Utilities 0.2% | | | |
| Gas Natural Inc | 85,000 | | 620,500 |
| Total Common Stocks (Cost $224,000,288) | | | 315,281,219 |
| |
| Short Term Investments (Cost $10,379,232) 3.2% | | | |
| Money Market Funds 3.2% | | | |
| a,d Institutional Fiduciary Trust Money Market Portfolio | 10,379,232 | | 10,379,232 |
| Total Investments (Cost $234,379,520) 100.0% | | | 325,660,451 |
| Other Assets, less Liabilities 0.0%† | | | 139,834 |
| Net Assets 100.0% | | $ | 325,800,285 |
62 Semiannual Report
franklintempleton.com
FRANKLIN VALUE INVESTORS TRUST
STATEMENT OF INVESTMENTS (UNAUDITED)
Franklin MicroCap Value Fund (continued)
†Rounds to less than 0.1% of net assets.
aNon-income producing.
bSee Note 8 regarding holdings of 5% voting securities.
cSee Note 7 regarding restricted securities.
dSee Note 3(f) regarding investments in affiliated management investment companies.
franklintempleton.com The accompanying notes are an integral part of these financial statements. | Semiannual Report 63
FRANKLIN VALUE INVESTORS TRUST
| | | | | | | | | | | | | | | | | | |
| Financial Highlights | | | | | | | | | | | | | | | | | | |
| Franklin MidCap Value Fund | | | | | | | | | | | | | | | | | | |
| | | Six Months Ended | | | | | | | | | | | | | | | | |
| | | April 30, 2016 | | | | | | Year Ended October 31, | | | | |
| | | (unaudited) | | | 2015 | | | 2014 | | | 2013 | | | 2012 | | | 2011 | |
| Class A | | | | | | | | | | | | | | | | | | |
| Per share operating performance | | | | | | | | | | | | | | | | | | |
| (for a share outstanding throughout the period) | | | | | | | | | | | | | | | | | | |
| Net asset value, beginning of period | $ | 15.22 | | $ | 16.13 | | $ | 14.76 | | $ | 11.38 | | $ | 10.39 | | $ | 10.31 | |
| Income from investment operationsa: | | | | | | | | | | | | | | | | | | |
| Net investment incomeb | | 0.06 | �� | | 0.11 | | | 0.08 | c | | 0.11 | d | | 0.08 | | | 0.05 | |
| Net realized and unrealized gains (losses) | | 0.04 | | | (0.60 | ) | | 1.37 | | | 3.43 | | | 0.96 | | | 0.08 | |
| Total from investment operations | | 0.10 | | | (0.49 | ) | | 1.45 | | | 3.54 | | | 1.04 | | | 0.13 | |
| Less distributions from: | | | | | | | | | | | | | | | | | | |
| Net investment income. | | (0.07 | ) | | (0.11 | ) | | (0.08 | ) | | (0.16 | ) | | (0.05 | ) | | (0.05 | ) |
| Net realized gains | | (1.22 | ) | | (0.31 | ) | | — | | | — | | | — | | | — | |
| Total distributions | | (1.29 | ) | | (0.42 | ) | | (0.08 | ) | | (0.16 | ) | | (0.05 | ) | | (0.05 | ) |
| Net asset value, end of period | $ | 14.03 | | $ | 15.22 | | $ | 16.13 | | $ | 14.76 | | $ | 11.38 | | $ | 10.39 | |
| |
| Total returne | | 1.01 | % | | (3.07 | )% | | 9.91 | % | | 31.47 | % | | 10.04 | % | | 1.26 | % |
| |
| Ratios to average net assetsf | | | | | | | | | | | | | | | | | | |
| Expenses before waiver and payments by | | | | | | | | | | | | | | | | | | |
| affiliates | | 1.54 | % | | 1.60 | % | | 1.56 | % | | 1.64 | % | | 1.70 | % | | 1.70 | % |
| Expenses net of waiver and payments by | | | | | | | | | | | | | | | | | | |
| affiliates | | 1.30 | % | | 1.34 | % | | 1.35 | %g | | 1.35 | % | | 1.35 | % | | 1.35 | % |
| Net investment income | | 0.93 | % | | 0.72 | % | | 0.50 | %c | | 0.83 | %d | | 0.78 | % | | 0.50 | % |
| |
| Supplemental data | | | | | | | | | | | | | | | | | | |
| Net assets, end of period (000’s) | $ | 126,607 | | $ | 127,043 | | $ | 128,483 | | $ | 102,866 | | $ | 64,265 | | $ | 62,226 | |
| Portfolio turnover rate | | 32.32 | % | | 61.80 | % | | 24.44 | % | | 10.00 | % | | 22.29 | % | | 18.61 | % |
aThe amount shown for a outstanding throughout the period may not correlate with the Statement of Operations for the period due to the timing of sales and repurchases of
the Fund’s shares in relation to income earned and/or fluctuating fair value of the investments of the Fund.
bBased on average daily shares outstanding.
cNet investment income per share includes approximately $0.02 per share related to income received in the form of special dividends in connection with certain Fund
holdings. Excluding this amount, the ratio of net investment income to average net assets would have been 0.38%.
dNet investment income per share includes approximately $0.03 per share related to income received in the form of special dividends in connection with certain Fund
holdings. Excluding this amount, the ratio of net investment income to average net assets would have been 0.61%.
eTotal return does not reflect sales commissions or contingent deferred sales charges, if applicable, and is not annualized for periods less than one year.
fRatios are annualized for periods less than one year.
gBenefit of expense reduction rounds to less than 0.01%.
64 Semiannual Report | The accompanying notes are an integral part of these financial statements. franklintempleton.com
| | | | | | | | | | | | | | | | | | |
| | | | | | | | | FRANKLIN VALUE INVESTORS TRUST | |
| | | | | | | | | | | | FINANCIAL HIGHLIGHTS | |
| |
| |
| Franklin MidCap Value Fund (continued) | | | | | | | | | | | | | | | | |
| | | Six Months Ended | | | | | | | | | | | | | | | | |
| | | April 30, 2016 | | | | | | Year Ended October 31, | | | | |
| | | (unaudited) | | | 2015 | | | 2014 | | | 2013 | | | 2012 | | | 2011 | |
| Class C | | | | | | | | | | | | | | | | | | |
| Per share operating performance | | | | | | | | | | | | | | | | | | |
| (for a share outstanding throughout the period) | | | | | | | | | | | | | | | | | | |
| Net asset value, beginning of period | $ | 14.97 | | $ | 15.87 | | $ | 14.55 | | $ | 11.21 | | $ | 10.25 | | $ | 10.20 | |
| Income from investment operationsa: | | | | | | | | | | | | | | | | | | |
| Net investment income (loss)b | | 0.01 | | | —c | | | (0.03 | )d | | 0.02 | e | | 0.01 | | | (0.02 | ) |
| Net realized and unrealized gains (losses) | | 0.04 | | | (0.59 | ) | | 1.36 | | | 3.39 | | | 0.95 | | | 0.07 | |
| Total from investment operations | | 0.05 | | | (0.59 | ) | | 1.33 | | | 3.41 | | | 0.96 | | | 0.05 | |
| Less distributions from: | | | | | | | | | | | | | | | | | | |
| Net investment income. | | — | | | — | | | (0.01 | ) | | (0.07 | ) | | — | | | (—)c | |
| Net realized gains | | (1.22 | ) | | (0.31 | ) | | — | | | — | | | — | | | — | |
| Total distributions | | (1.22 | ) | | (0.31 | ) | | (0.01 | ) | | (0.07 | ) | | — | | | (—)c | |
| Net asset value, end of period | $ | 13.80 | | $ | 14.97 | | $ | 15.87 | | $ | 14.55 | | $ | 11.21 | | $ | 10.25 | |
| |
| Total returnf | | 0.67 | % | | (3.75 | )% | | 9.12 | % | | 30.56 | % | | 9.37 | % | | 0.50 | % |
| |
| Ratios to average net assetsg | | | | | | | | | | | | | | | | | | |
| Expenses before waiver and payments by | | | | | | | | | | | | | | | | | | |
| affiliates | | 2.28 | % | | 2.31 | % | | 2.26 | % | | 2.34 | % | | 2.39 | % | | 2.40 | % |
| Expenses net of waiver and payments by | | | | | | | | | | | | | | | | | | |
| affiliates | | 2.04 | % | | 2.05 | % | | 2.05 | %h | | 2.05 | % | | 2.04 | % | | 2.05 | % |
| Net investment income (loss) | | 0.19 | % | | 0.01 | % | | (0.20 | )%d | | 0.13 | %e | | 0.09 | % | | (0.20 | )% |
| |
| Supplemental data | | | | | | | | | | | | | | | | | | |
| Net assets, end of period (000’s) | $ | 23,202 | | $ | 23,329 | | $ | 23,926 | | $ | 21,965 | | $ | 12,175 | | $ | 12,696 | |
| Portfolio turnover rate | | 32.32 | % | | 61.80 | % | | 24.44 | % | | 10.00 | % | | 22.29 | % | | 18.61 | % |
aThe amount shown for a outstanding throughout the period may not correlate with the Statement of Operations for the period due to the timing of sales and repurchases of
the Fund’s shares in relation to income earned and/or fluctuating fair value of the investments of the Fund.
bBased on average daily shares outstanding.
cAmount rounds to less than $0.01 per share.
dNet investment income per share includes approximately $0.02 per share related to income received in the form of special dividends in connection with certain Fund
holdings. Excluding this amount, the ratio of net investment income to average net assets would have been (0.32)%.
eNet investment income per share includes approximately $0.03 per share related to income received in the form of special dividends in connection with certain Fund
holdings. Excluding this amount, the ratio of net investment income to average net assets would have been (0.09)%.
fTotal return does not reflect sales commissions or contingent deferred sales charges, if applicable, and is not annualized for periods less than one year.
gRatios are annualized for periods less than one year.
hBenefit of expense reduction rounds to less than 0.01%.
franklintempleton.com The accompanying notes are an integral part of these financial statements. | Semiannual Report 65
| | | | | | | | | | | | | | | | | | |
| FRANKLIN VALUE INVESTORS TRUST | | | | | | | | | | | | | | | | | | |
| FINANCIAL HIGHLIGHTS | | | | | | | | | | | | | | | | | | |
| |
| |
| Franklin MidCap Value Fund (continued) | | | | | | | | | | | | | | | | | | |
| Six Months Ended | | | | | | | | | | | | | | | | |
| | | April 30, 2016 | | | | | | Year Ended October 31, | | | | |
| | | (unaudited) | | | 2015 | | | 2014 | | | 2013 | | | 2012 | | | 2011 | |
| Class R | | | | | | | | | | | | | | | | | | |
| Per share operating performance | | | | | | | | | | | | | | | | | | |
| (for a share outstanding throughout the period) | | | | | | | | | | | | | | | | | | |
| Net asset value, beginning of period | $ | 15.19 | | $ | 16.09 | | $ | 14.71 | | $ | 11.35 | | $ | 10.36 | | $ | 10.28 | |
| Income from investment operationsa: | | | | | | | | | | | | | | | | | | |
| Net investment incomeb | | 0.05 | | | 0.08 | | | 0.05 | c | | 0.08 | d | | 0.06 | | | 0.03 | |
| Net realized and unrealized gains (losses) | | 0.04 | | | (0.61 | ) | | 1.38 | | | 3.42 | | | 0.95 | | | 0.08 | |
| Total from investment operations | | 0.09 | | | (0.53 | ) | | 1.43 | | | 3.50 | | | 1.01 | | | 0.11 | |
| Less distributions from: | | | | | | | | | | | | | | | | | | |
| Net investment income. | | (0.01 | ) | | (0.06 | ) | | (0.05 | ) | | (0.14 | ) | | (0.02 | ) | | (0.03 | ) |
| Net realized gains | | (1.22 | ) | | (0.31 | ) | | — | | | — | | | — | | | — | |
| Total distributions | | (1.23 | ) | | (0.37 | ) | | (0.05 | ) | | (0.14 | ) | | (0.02 | ) | | (0.03 | ) |
| Net asset value, end of period | $ | 14.05 | | $ | 15.19 | | $ | 16.09 | | $ | 14.71 | | $ | 11.35 | | $ | 10.36 | |
| |
| Total returne | | 0.95 | % | | (3.30 | )% | | 9.75 | % | | 31.22 | % | | 9.77 | % | | 1.05 | % |
| |
| Ratios to average net assetsf | | | | | | | | | | | | | | | | | | |
| Expenses before waiver and payments by | | | | | | | | | | | | | | | | | | |
| affiliates | | 1.79 | % | | 1.81 | % | | 1.76 | % | | 1.84 | % | | 1.90 | % | | 1.90 | % |
| Expenses net of waiver and payments by | | | | | | | | | | | | | | | | | | |
| affiliates | | 1.55 | % | | 1.55 | % | | 1.55 | %g | | 1.55 | % | | 1.55 | % | | 1.55 | % |
| Net investment income | | 0.68 | % | | 0.51 | % | | 0.30 | %c | | 0.63 | %d | | 0.58 | % | | 0.30 | % |
| |
| Supplemental data | | | | | | | | | | | | | | | | | | |
| Net assets, end of period (000’s) | $ | 666 | | $ | 755 | | $ | 1,103 | | $ | 1,000 | | $ | 485 | | $ | 507 | |
| Portfolio turnover rate | | 32.32 | % | | 61.80 | % | | 24.44 | % | | 10.00 | % | | 22.29 | % | | 18.61 | % |
aThe amount shown for a outstanding throughout the period may not correlate with the Statement of Operations for the period due to the timing of sales and repurchases of
the Fund’s shares in relation to income earned and/or fluctuating fair value of the investments of the Fund.
bBased on average daily shares outstanding.
cNet investment income per share includes approximately $0.02 per share related to income received in the form of special dividends in connection with certain Fund
holdings. Excluding this amount, the ratio of net investment income to average net assets would have been 0.18%.
dNet investment income per share includes approximately $0.03 per share related to income received in the form of special dividends in connection with certain Fund
holdings. Excluding this amount, the ratio of net investment income to average net assets would have been 0.41%.
eTotal return is not annualized for periods less than one year.
fRatios are annualized for periods less than one year.
gBenefit of expense reduction rounds to less than 0.01%.
66 Semiannual Report | The accompanying notes are an integral part of these financial statements. franklintempleton.com
| | | | | | | | | | | | | | | | | | |
| | | | | | | | | FRANKLIN VALUE INVESTORS TRUST | |
| | | | | | | | | | | | FINANCIAL HIGHLIGHTS | |
| |
| |
| Franklin MidCap Value Fund (continued) | | | | | | | | | | | | | | | | |
| | | Six Months Ended | | | | | | | | | | | | | | | | |
| | | April 30, 2016 | | | | | | Year Ended October 31, | | | | |
| | | (unaudited) | | | 2015 | | | 2014 | | | 2013 | | | 2012 | | | 2011 | |
| Advisor Class | | | | | | | | | | | | | | | | | | |
| Per share operating performance | | | | | | | | | | | | | | | | | | |
| (for a share outstanding throughout the period) | | | | | | | | | | | | | | | | | | |
| Net asset value, beginning of period | $ | 15.31 | | $ | 16.23 | | $ | 14.84 | | $ | 11.44 | | $ | 10.45 | | $ | 10.36 | |
| Income from investment operationsa: | | | | | | | | | | | | | | | | | | |
| Net investment incomeb | | 0.08 | | | 0.16 | | | 0.13 | c | | 0.15 | d | | 0.12 | | | 0.09 | |
| Net realized and unrealized gains (losses) | | 0.03 | | | (0.62 | ) | | 1.38 | | | 3.45 | | | 0.95 | | | 0.08 | |
| Total from investment operations | | 0.11 | | | (0.46 | ) | | 1.51 | | | 3.60 | | | 1.07 | | | 0.17 | |
| Less distributions from: | | | | | | | | | | | | | | | | | | |
| Net investment income. | | (0.11 | ) | | (0.15 | ) | | (0.12 | ) | | (0.20 | ) | | (0.08 | ) | | (0.08 | ) |
| Net realized gains | | (1.22 | ) | | (0.31 | ) | | — | | | — | | | — | | | — | |
| Total distributions | | (1.33 | ) | | (0.46 | ) | | (0.12 | ) | | (0.20 | ) | | (0.08 | ) | | (0.08 | ) |
| Net asset value, end of period | $ | 14.09 | | $ | 15.31 | | $ | 16.23 | | $ | 14.84 | | $ | 11.44 | | $ | 10.45 | |
| |
| Total returne | | 1.13 | % | | (2.83 | )% | | 10.25 | % | | 31.94 | % | | 10.35 | % | | 1.59 | % |
| |
| Ratios to average net assetsf | | | | | | | | | | | | | | | | | | |
| Expenses before waiver and payments by | | | | | | | | | | | | | | | | | | |
| affiliates | | 1.29 | % | | 1.31 | % | | 1.26 | % | | 1.34 | % | | 1.40 | % | | 1.40 | % |
| Expenses net of waiver and payments by | | | | | | | | | | | | | | | | | | |
| affiliates | | 1.05 | % | | 1.05 | % | | 1.05 | %g | | 1.05 | % | | 1.05 | % | | 1.05 | % |
| Net investment income | | 1.18 | % | | 1.01 | % | | 0.80 | %c | | 1.13 | %d | | 1.08 | % | | 0.80 | % |
| |
| Supplemental data | | | | | | | | | | | | | | | | | | |
| Net assets, end of period (000’s) | $ | 4,491 | | $ | 4,706 | | $ | 4,369 | | $ | 3,596 | | $ | 2,507 | | $ | 2,052 | |
| Portfolio turnover rate | | 32.32 | % | | 61.80 | % | | 24.44 | % | | 10.00 | % | | 22.29 | % | | 18.61 | % |
aThe amount shown for a outstanding throughout the period may not correlate with the Statement of Operations for the period due to the timing of sales and repurchases of
the Fund’s shares in relation to income earned and/or fluctuating fair value of the investments of the Fund.
bBased on average daily shares outstanding.
cNet investment income per share includes approximately $0.02 per share related to income received in the form of special dividends in connection with certain Fund
holdings. Excluding this amount, the ratio of net investment income to average net assets would have been 0.68%.
dNet investment income per share includes approximately $0.03 per share related to income received in the form of special dividends in connection with certain Fund
holdings. Excluding this amount, the ratio of net investment income to average net assets would have been 0.91%.
eTotal return is not annualized for periods less than one year.
fRatios are annualized for periods less than one year.
gBenefit of expense reduction rounds to less than 0.01%.
franklintempleton.com The accompanying notes are an integral part of these financial statements. | Semiannual Report 67
| | | |
| FRANKLIN VALUE INVESTORS TRUST | | | |
| |
| |
| |
| |
| Statement of Investments, April 30, 2016 (unaudited) | | | |
| Franklin MidCap Value Fund | | | |
| | Shares/ | | |
| | Units | | Value |
| |
| Common Stocks and Other Equity Interests 98.5% | | | |
| Automobiles & Components 0.7% | | | |
| Harley-Davidson Inc | 24,400 | $ | 1,167,052 |
| Banks 5.9% | | | |
| Citizens Financial Group Inc | 79,600 | | 1,818,860 |
| Comerica Inc | 36,700 | | 1,629,480 |
| KeyCorp | 179,000 | | 2,199,910 |
| Regions Financial Corp | 239,600 | | 2,247,448 |
| SunTrust Banks Inc | 28,600 | | 1,193,764 |
| | | | 9,089,462 |
| Capital Goods 9.2% | | | |
| BWX Technologies Inc | 29,100 | | 971,649 |
| Carlisle Cos. Inc | 13,400 | | 1,365,460 |
| Dover Corp | 17,900 | | 1,176,030 |
| Fortune Brands Home & Security Inc | 13,400 | | 742,494 |
| ITT Corp | 21,300 | | 817,281 |
| L-3 Communications Holdings Inc | 9,300 | | 1,223,229 |
| Owens Corning Inc | 24,674 | | 1,136,731 |
| Parker Hannifin Corp | 9,800 | | 1,136,996 |
| Pentair PLC (United Kingdom) | 13,800 | | 801,504 |
| Regal Beloit Corp | 18,000 | | 1,159,560 |
| Rockwell Automation Inc | 3,800 | | 431,186 |
| W.W. Grainger Inc | 3,900 | | 914,628 |
| a WABCO Holdings Inc | 10,000 | | 1,121,600 |
| Xylem Inc | 31,700 | | 1,324,426 |
| | | | 14,322,774 |
| Commercial & Professional Services 0.5% | | | |
| Robert Half International Inc | 20,300 | | 777,693 |
| Consumer Durables & Apparel 3.7% | | | |
| Coach Inc | 18,700 | | 753,049 |
| Hasbro Inc | 10,100 | | 854,864 |
| a Michael Kors Holdings Ltd | 15,000 | | 774,900 |
| Polaris Industries Inc | 8,500 | | 831,980 |
| PVH Corp | 8,500 | | 812,600 |
| Ralph Lauren Corp | 7,700 | | 717,717 |
| a Toll Brothers Inc | 36,000 | | 982,800 |
| | | | 5,727,910 |
| Consumer Services 0.3% | | | |
| H&R Block Inc | 21,100 | | 427,064 |
| Diversified Financials 6.3% | | | |
| Invesco Ltd | 37,300 | | 1,156,673 |
| KKR & Co., LP (common units) | 100,800 | | 1,370,880 |
| Northern Trust Corp | 34,000 | | 2,416,720 |
| Raymond James Financial Inc | 41,200 | | 2,149,404 |
| a Synchrony Financial | 74,700 | | 2,283,579 |
| T. Rowe Price Group Inc | 5,100 | | 383,979 |
| | | | 9,761,235 |
68 Semiannual Report
franklintempleton.com
FRANKLIN VALUE INVESTORS TRUST
STATEMENT OF INVESTMENTS (UNAUDITED)
| | | |
| Franklin MidCap Value Fund (continued) | | | |
| | Shares/ | | |
| | Units | | Value |
| |
| Common Stocks and Other Equity Interests (continued) | | | |
| Energy 9.3% | | | |
| Cabot Oil & Gas Corp., A | 50,500 | $ | 1,181,700 |
| a Cheniere Energy Inc | 12,700 | | 493,776 |
| Cimarex Energy Co | 11,200 | | 1,219,456 |
| a Concho Resources Inc | 18,400 | | 2,137,528 |
| a Diamondback Energy Inc | 13,000 | | 1,125,540 |
| EQT Corp | 11,600 | | 813,160 |
| a FMC Technologies Inc | 14,300 | | 436,007 |
| Frank’s International NV | 49,000 | | 815,850 |
| Helmerich & Payne Inc | 19,500 | | 1,289,340 |
| HollyFrontier Corp | 25,800 | | 918,480 |
| National Oilwell Varco Inc | 12,300 | | 443,292 |
| Noble Energy Inc | 45,300 | | 1,635,783 |
| Pioneer Natural Resources Co | 11,200 | | 1,860,320 |
| | | | 14,370,232 |
| Food, Beverage & Tobacco 2.1% | | | |
| Ingredion Inc | 7,000 | | 805,630 |
| a Pilgrim’s Pride Corp | 18,100 | | 487,071 |
| Pinnacle Foods Inc | 32,300 | | 1,375,657 |
| Tyson Foods Inc | 9,500 | | 625,290 |
| | | | 3,293,648 |
| Health Care Equipment & Services 5.0% | | | |
| DENTSPLY SIRONA Inc | 13,000 | | 774,800 |
| Hill-Rom Holdings Inc | 14,000 | | 676,900 |
| a Laboratory Corp. of America Holdings | 6,698 | | 839,393 |
| a LifePoint Health Inc | 10,800 | | 729,648 |
| a Mednax Inc | 11,200 | | 798,448 |
| a Premier Inc., A | 45,000 | | 1,521,450 |
| ResMed Inc | 13,900 | | 775,620 |
| Zimmer Biomet Holdings Inc | 13,800 | | 1,597,626 |
| | | | 7,713,885 |
| Insurance 7.7% | | | |
| Arthur J. Gallagher & Co | 17,200 | | 791,888 |
| The Hartford Financial Services Group Inc | 33,200 | | 1,473,416 |
| Principal Financial Group Inc | 44,500 | | 1,899,260 |
| The Progressive Corp | 43,900 | | 1,431,140 |
| RenaissanceRe Holdings Ltd | 11,100 | | 1,231,101 |
| W. R. Berkley Corp | 34,100 | | 1,909,600 |
| Willis Towers Watson PLC | 14,200 | | 1,773,580 |
| XL Group PLC (Ireland) | 41,700 | | 1,364,841 |
| | | | 11,874,826 |
| Materials 9.2% | | | |
| Albemarle Corp | 23,798 | | 1,574,476 |
| Alcoa Inc | 59,500 | | 664,615 |
| Ashland Inc | 14,220 | | 1,586,952 |
| Celanese Corp., A | 16,400 | | 1,159,480 |
| Domtar Corp | 37,900 | | 1,464,456 |
| Freeport-McMoRan Inc., B | 30,000 | | 420,000 |
| Martin Marietta Materials Inc | 9,900 | | 1,675,377 |
| The Mosaic Co | 52,700 | | 1,475,073 |
franklintempleton.com
Semiannual Report 69
FRANKLIN VALUE INVESTORS TRUST
STATEMENT OF INVESTMENTS (UNAUDITED)
| | | |
| Franklin MidCap Value Fund (continued) | | | |
| | Shares/ | | |
| | Units | | Value |
| |
| Common Stocks and Other Equity Interests (continued) | | | |
| Materials (continued) | | | |
| Newmont Mining Corp | 8,500 | $ | 297,245 |
| Nucor Corp | 25,300 | | 1,259,434 |
| Tahoe Resources Inc | 20,800 | | 293,904 |
| Teck Resources Ltd., B (Canada) | 34,200 | | 418,950 |
| WestRock Co | 47,456 | | 1,986,033 |
| | | | 14,275,995 |
| Media 1.0% | | | |
| John Wiley & Sons Inc., A | 14,500 | | 719,055 |
| TEGNA Inc | 32,500 | | 759,200 |
| | | | 1,478,255 |
| Pharmaceuticals, Biotechnology & Life Sciences 3.0% | | | |
| Agilent Technologies Inc | 19,000 | | 777,480 |
| a Bio-Rad Laboratories Inc., A | 5,748 | | 815,354 |
| a Mallinckrodt PLC | 12,400 | | 775,248 |
| a Medivation Inc | 16,500 | | 953,700 |
| Perrigo Co. PLC | 13,800 | | 1,334,046 |
| | | | 4,655,828 |
| Real Estate 11.5% | | | |
| Alexandria Real Estate Equities Inc | 9,000 | | 836,550 |
| Apartment Investment & Management Co., A | 21,500 | | 861,290 |
| Boston Properties Inc | 17,000 | | 2,190,620 |
| Camden Property Trust | 10,700 | | 863,811 |
| DDR Corp | 62,500 | | 1,093,750 |
| Duke Realty Corp | 39,400 | | 861,678 |
| Equity Lifestyle Properties Inc | 13,400 | | 917,766 |
| General Growth Properties Inc | 38,100 | | 1,067,943 |
| Host Hotels & Resorts Inc | 93,100 | | 1,472,842 |
| Kilroy Realty Corp | 13,500 | | 874,935 |
| Liberty Property Trust | 23,900 | | 834,110 |
| Prologis Inc | 36,600 | | 1,662,006 |
| a Realogy Holdings Corp | 34,500 | | 1,233,030 |
| UDR Inc | 23,200 | | 810,144 |
| Weingarten Realty Investors | 24,600 | | 908,232 |
| Weyerhaeuser Co | 39,700 | | 1,275,164 |
| | | | 17,763,871 |
| Retailing 2.2% | | | |
| Big Lots Inc | 17,300 | | 793,378 |
| DSW Inc., A | 31,700 | | 778,869 |
| GameStop Corp., A | 19,500 | | 639,600 |
| The Gap Inc | 24,500 | | 567,910 |
| a Office Depot Inc | 25,000 | | 147,000 |
| Staples Inc | 50,700 | | 517,140 |
| | | | 3,443,897 |
| Semiconductors & Semiconductor Equipment 3.8% | | | |
| a First Solar Inc | 25,300 | | 1,412,752 |
| Lam Research Corp | 20,200 | | 1,543,280 |
| Maxim Integrated Products Inc | 18,200 | | 650,104 |
| Microchip Technology Inc | 18,800 | | 913,492 |
| NVIDIA Corp | 18,200 | | 646,646 |
70 Semiannual Report
franklintempleton.com
FRANKLIN VALUE INVESTORS TRUST
STATEMENT OF INVESTMENTS (UNAUDITED)
| | | |
| Franklin MidCap Value Fund (continued) | | | |
| | Shares/ | | |
| | Units | | Value |
| |
| Common Stocks and Other Equity Interests (continued) | | | |
| Semiconductors & Semiconductor Equipment (continued) | | | |
| Teradyne Inc | 40,800 | $ | 771,528 |
| | | | 5,937,802 |
| Software & Services 3.9% | | | |
| Amdocs Ltd | 13,400 | | 757,636 |
| a Autodesk Inc | 19,500 | | 1,166,490 |
| Leidos Holdings Inc | 13,125 | | 651,131 |
| a Mobileye NV | 29,500 | | 1,125,425 |
| a PTC Inc | 21,300 | | 776,598 |
| Science Applications International Corp | 16,071 | | 853,210 |
| Total System Services Inc | 13,400 | | 685,276 |
| | | | 6,015,766 |
| Technology Hardware & Equipment 2.4% | | | |
| Corning Inc | 42,100 | | 786,007 |
| a Keysight Technologies Inc | 39,150 | | 1,021,032 |
| Western Digital Corp | 48,400 | | 1,977,866 |
| | | | 3,784,905 |
| Telecommunication Services 0.8% | | | |
| CenturyLink Inc | 13,100 | | 405,445 |
| a Level 3 Communications Inc | 16,500 | | 862,290 |
| | | | 1,267,735 |
| Transportation 1.6% | | | |
| J.B. Hunt Transport Services Inc | 9,900 | | 820,512 |
| a JetBlue Airways Corp | 82,100 | | 1,624,759 |
| | | | 2,445,271 |
| Utilities 8.4% | | | |
| American Water Works Co. Inc | 13,400 | | 974,984 |
| a Calpine Corp | 87,600 | | 1,382,328 |
| CenterPoint Energy Inc | 42,400 | | 909,480 |
| CMS Energy Corp | 45,800 | | 1,863,144 |
| DTE Energy Co | 19,700 | | 1,756,452 |
| Eversource Energy | 31,700 | | 1,789,148 |
| FirstEnergy Corp | 25,500 | | 831,045 |
| Sempra Energy | 18,700 | | 1,932,645 |
| UGI Corp | 38,900 | | 1,565,336 |
| | | | 13,004,562 |
| Total Common Stocks and Other Equity Interests (Cost $136,372,802) | | | 152,599,668 |
| |
| Management Investment Companies (Cost $6,785) 0.0%† | | | |
| Diversified Financials 0.0%† | | | |
| iShares Russell Mid-Cap Value ETF | 100 | | 7,242 |
| Total Investments before Short Term Investments (Cost $136,379,587) | | | 152,606,910 |
franklintempleton.com
Semiannual Report 71
FRANKLIN VALUE INVESTORS TRUST
STATEMENT OF INVESTMENTS (UNAUDITED)
| | | |
| Franklin MidCap Value Fund (continued) | | | |
| | Shares | | Value |
| Short Term Investments (Cost $2,299,038) 1.5% | | | |
| Money Market Funds 1.5% | | | |
| a,b Institutional Fiduciary Trust Money Market Portfolio | 2,299,038 | $ | 2,299,038 |
| Total Investments (Cost $138,678,625) 100.0% | | | 154,905,948 |
| Other Assets, less Liabilities 0.0%† | | | 60,119 |
| Net Assets 100.0% | | $ | 154,966,067 |
See Abbreviations on page 108.
†Rounds to less than 0.1% of net assets.
aNon-income producing.
bSee Note 3(f) regarding investments in affiliated management investment companies.
72 Semiannual Report | The accompanying notes are an integral part of these financial statements. franklintempleton.com
FRANKLIN VALUE INVESTORS TRUST
| | | | | | | | | | | | | | | | | | |
| Financial Highlights | | | | | | | | | | | | | | | | | | |
| Franklin Small Cap Value Fund | | | | | | | | | | | | | | | | | | |
| | | Six Months Ended | | | | | | | | | | | | | | | | |
| | | April 30, 2016 | | | | | | Year Ended October 31, | | | | |
| | | (unaudited) | | | 2015 | | | 2014 | | | 2013 | | | 2012 | | | 2011 | |
| Class A | | | | | | | | | | | | | | | | | | |
| Per share operating performance | | | | | | | | | | | | | | | | | | |
| (for a share outstanding throughout the period) | | | | | | | | | | | | | | | | | | |
| Net asset value, beginning of period | $ | 51.72 | | $ | 58.96 | | $ | 59.76 | | $ | 45.12 | | $ | 42.25 | | $ | 39.69 | |
| Income from investment operationsa: | | | | | | | | | | | | | | | | | | |
| Net investment incomeb | | 0.12 | | | 0.30 | c | | 0.16 | d | | 0.30 | e | | 0.34 | f | | 0.18 | |
| Net realized and unrealized gains (losses) | | 0.69 | | | (2.33 | ) | | 2.03 | | | 16.30 | | | 4.47 | | | 2.50 | |
| Total from investment operations | | 0.81 | | | (2.03 | ) | | 2.19 | | | 16.60 | | | 4.81 | | | 2.68 | |
| Less distributions from: | | | | | | | | | | | | | | | | | | |
| Net investment income. | | (0.29 | ) | | (0.12 | ) | | (0.25 | ) | | (0.49 | ) | | (0.17 | ) | | (0.12 | ) |
| Net realized gains | | (4.92 | ) | | (5.09 | ) | | (2.74 | ) | | (1.47 | ) | | (1.77 | ) | | — | |
| Total distributions | | (5.21 | ) | | (5.21 | ) | | (2.99 | ) | | (1.96 | ) | | (1.94 | ) | | (0.12 | ) |
| Net asset value, end of period | $ | 47.32 | | $ | 51.72 | | $ | 58.96 | | $ | 59.76 | | $ | 45.12 | | $ | 42.25 | |
| |
| Total returng | | 2.25 | % | | (3.31 | )% | | 3.76 | % | | 38.15 | % | | 12.08 | % | | 6.73 | % |
| |
| Ratios to average net assetsh | | | | | | | | | | | | | | | | | | |
| Expenses before waiver and payments by | | | | | | | | | | | | | | | | | | |
| affiliates | | 1.14 | % | | 1.16 | % | | 1.13 | % | | 1.19 | % | | 1.26 | % | | 1.21 | % |
| Expenses net of waiver and payments by | | | | | | | | | | | | | | | | | | |
| affiliates | | 1.13 | %i | | 1.15 | % | | 1.13 | %i,j | | 1.19 | % | | 1.26 | % | | 1.21 | % |
| Net investment income | | 0.53 | % | | 0.56 | %c | | 0.27 | %d | | 0.57 | %e | | 0.79 | %f | | 0.41 | % |
| |
| Supplemental data | | | | | | | | | | | | | | | | | | |
| Net assets, end of period (000’s) | $ | 1,061,388 | | $ | 1,062,353 | | $ | 1,294,724 | | $ | 1,224,592 | | $ | 856,541 | | $ | 829,710 | |
| Portfolio turnover rate | | 17.53 | % | | 25.88 | % | | 21.30 | % | | 13.04 | % | | 5.18 | % | | 14.24 | % |
aThe amount shown for a outstanding throughout the period may not correlate with the Statement of Operations for the period due to the timing of sales and repurchases of
the Fund’s shares in relation to income earned and/or fluctuating fair value of the investments of the Fund.
bBased on average daily shares outstanding.
cNet investment income per share includes approximately $0.11 per share related to income received in the form of special dividends in connection with certain Fund
holdings. Excluding this amount, the ratio of net investment income to average net assets would have been 0.36%.
dNet investment income per share includes approximately $0.04 per share related to income received in the form of special dividends in connection with certain Fund
holdings. Excluding this amount, the ratio of net investment income to average net assets would have been 0.21%.
eNet investment income per share includes approximately $0.10 per share related to income received in the form of special dividends in connection with certain Fund
holdings. Excluding this amount, the ratio of net investment income to average net assets would have been 0.38%.
fNet investment income per share includes approximately $0.14 per share related to income received in the form of special dividends in connection with certain Fund
holdings. Excluding this amount, the ratio of net investment income to average net assets would have been 0.48%.
gTotal return does not reflect sales commissions or contingent deferred sales charges, if applicable, and is not annualized for periods less than one year.
hRatios are annualized for periods less than one year.
iBenefit of expense reduction rounds to less than 0.01%.
jBenefit of waiver and payments by affiliates rounds to less than 0.01%.
franklintempleton.com The accompanying notes are an integral part of these financial statements. | Semiannual Report 73
| | | | | | | | | | | | | | | | | | |
| FRANKLIN VALUE INVESTORS TRUST | | | | | | | | | | | | | | | | | | |
| FINANCIAL HIGHLIGHTS | | | | | | | | | | | | | | | | | | |
| |
| |
| Franklin Small Cap Value Fund (continued) | | | | | | | | | | | | | | | | | | |
| Six Months Ended | | | | | | | | | | | | | | | | |
| | | April 30, 2016 | | | | | | Year Ended October 31, | | | | |
| | | (unaudited) | | | 2015 | | | 2014 | | | 2013 | | | 2012 | | | 2011 | |
| Class C | | | | | | | | | | | | | | | | | | |
| Per share operating performance | | | | | | | | | | | | | | | | | | |
| (for a share outstanding throughout the period) | | | | | | | | | | | | | | | | | | |
| Net asset value, beginning of period | $ | 47.22 | | $ | 54.53 | | $ | 55.62 | | $ | 42.12 | | $ | 39.66 | | $ | 37.42 | |
| Income from investment operationsa: | | | | | | | | | | | | | | | | | | |
| Net investment income (loss)b | | (0.04 | ) | | (0.07 | )c | | (0.24 | )d | | (0.05 | )e | | 0.04 | f | | (0.12 | ) |
| Net realized and unrealized gains (losses) | | 0.60 | | | (2.15 | ) | | 1.89 | | | 15.21 | | | 4.19 | | | 2.36 | |
| Total from investment operations | | 0.56 | | | (2.22 | ) | | 1.65 | | | 15.16 | | | 4.23 | | | 2.24 | |
| Less distributions from: | | | | | | | | | | | | | | | | | | |
| Net investment income. | | — | | | — | | | — | | | (0.19 | ) | | — | | | — | |
| Net realized gains | | (4.92 | ) | | (5.09 | ) | | (2.74 | ) | | (1.47 | ) | | (1.77 | ) | | — | |
| Total distributions | | (4.92 | ) | | (5.09 | ) | | (2.74 | ) | | (1.66 | ) | | (1.77 | ) | | — | |
| Net asset value, end of period | $ | 42.86 | | $ | 47.22 | | $ | 54.53 | | $ | 55.62 | | $ | 42.12 | | $ | 39.66 | |
| |
| Total returng | | 1.89 | % | | (4.01 | )% | | 3.03 | % | | 37.23 | % | | 11.29 | % | | 5.99 | % |
| |
| Ratios to average net assetsh | | | | | | | | | | | | | | | | | | |
| Expenses before waiver and payments by | | | | | | | | | | | | | | | | | | |
| affiliates | | 1.89 | % | | 1.87 | % | | 1.83 | % | | 1.89 | % | | 1.95 | % | | 1.91 | % |
| Expenses net of waiver and payments by | | | | | | | | | | | | | | | | | | |
| affiliates | | 1.88 | %i | | 1.86 | % | | 1.83 | %i,j | | 1.89 | % | | 1.95 | % | | 1.91 | % |
| Net investment income (loss) | | (0.22 | )% | | (0.15 | )%c | | (0.43 | )%d | | (0.13 | )%e | | 0.10 | %f | | (0.29 | )% |
| |
| Supplemental data | | | | | | | | | | | | | | | | | | |
| Net assets, end of period (000’s) | $ | 223,371 | | $ | 229,119 | | $ | 266,845 | | $ | 247,742 | | $ | 183,986 | | $ | 189,321 | |
| Portfolio turnover rate | | 17.53 | % | | 25.88 | % | | 21.30 | % | | 13.04 | % | | 5.18 | % | | 14.24 | % |
aThe amount shown for a outstanding throughout the period may not correlate with the Statement of Operations for the period due to the timing of sales and repurchases of
the Fund’s shares in relation to income earned and/or fluctuating fair value of the investments of the Fund.
bBased on average daily shares outstanding.
cNet investment income per share includes approximately $0.11 per share related to income received in the form of special dividends in connection with certain Fund
holdings. Excluding this amount, the ratio of net investment income to average net assets would have been (0.35)%.
dNet investment income per share includes approximately $0.04 per share related to income received in the form of special dividends in connection with certain Fund
holdings. Excluding this amount, the ratio of net investment income to average net assets would have been (0.49)%.
eNet investment income per share includes approximately $0.10 per share related to income received in the form of special dividends in connection with certain Fund
holdings. Excluding this amount, the ratio of net investment income to average net assets would have been (0.32)%.
fNet investment income per share includes approximately $0.14 per share related to income received in the form of special dividends in connection with certain Fund
holdings. Excluding this amount, the ratio of net investment income to average net assets would have been (0.21)%.
gTotal return does not reflect sales commissions or contingent deferred sales charges, if applicable, and is not annualized for periods less than one year.
hRatios are annualized for periods less than one year.
iBenefit of expense reduction rounds to less than 0.01%.
jBenefit of waiver and payments by affiliates rounds to less than 0.01%.
74 Semiannual Report | The accompanying notes are an integral part of these financial statements. franklintempleton.com
| | | | | | | | | | | | | | | | | | |
| | | | | | | | | FRANKLIN VALUE INVESTORS TRUST | |
| | | | | | | | | | | | FINANCIAL HIGHLIGHTS | |
| |
| |
| Franklin Small Cap Value Fund (continued) | | | | | | | | | | | | | | | | |
| | | Six Months Ended | | | | | | | | | | | | | | | | |
| | | April 30, 2016 | | | | | | Year Ended October 31, | | | | |
| | | (unaudited) | | | 2015 | | | 2014 | | | 2013 | | | 2012 | | | 2011 | |
| Class R | | | | | | | | | | | | | | | | | | |
| Per share operating performance | | | | | | | | | | | | | | | | | | |
| (for a share outstanding throughout the period) | | | | | | | | | | | | | | | | | | |
| Net asset value, beginning of period | $ | 51.18 | | $ | 58.40 | | $ | 59.21 | | $ | 44.71 | | $ | 41.88 | | $ | 39.35 | |
| Income from investment operationsa: | | | | | | | | | | | | | | | | | | |
| Net investment incomeb | | 0.06 | | | 0.19 | c | | 0.04 | d | | 0.21 | e | | 0.26 | f | | 0.09 | |
| Net realized and unrealized gains (losses) | | 0.69 | | | (2.32 | ) | | 2.02 | | | 16.15 | | | 4.42 | | | 2.48 | |
| Total from investment operations | | 0.75 | | | (2.13 | ) | | 2.06 | | | 16.36 | | | 4.68 | | | 2.57 | |
| Less distributions from: | | | | | | | | | | | | | | | | | | |
| Net investment income. | | (0.16 | ) | | (—)g | | | (0.13 | ) | | (0.39 | ) | | (0.08 | ) | | (0.04 | ) |
| Net realized gains | | (4.92 | ) | | (5.09 | ) | | (2.74 | ) | | (1.47 | ) | | (1.77 | ) | | — | |
| Total distributions | | (5.08 | ) | | (5.09 | ) | | (2.87 | ) | | (1.86 | ) | | (1.85 | ) | | (0.04 | ) |
| Net asset value, end of period | $ | 46.85 | | $ | 51.18 | | $ | 58.40 | | $ | 59.21 | | $ | 44.71 | | $ | 41.88 | |
| |
| Total returnh | | 2.13 | % | | (3.53 | )% | | 3.55 | % | | 37.91 | % | | 11.85 | % | | 6.53 | % |
| |
| Ratios to average net assetsi | | | | | | | | | | | | | | | | | | |
| Expenses before waiver and payments by | | | | | | | | | | | | | | | | | | |
| affiliates | | 1.39 | % | | 1.37 | % | | 1.33 | % | | 1.39 | % | | 1.46 | % | | 1.41 | % |
| Expenses net of waiver and payments by | | | | | | | | | | | | | | | | | | |
| affiliates | | 1.38 | %j | | 1.36 | % | | 1.33 | %j,k | | 1.39 | % | | 1.46 | % | | 1.41 | % |
| Net investment income | | 0.28 | % | | 0.35 | %c | | 0.07 | %d | | 0.37 | %e | | 0.59 | %f | | 0.21 | % |
| |
| Supplemental data | | | | | | | | | | | | | | | | | | |
| Net assets, end of period (000’s) | $ | 206,493 | | $ | 221,939 | | $ | 280,908 | | $ | 272,697 | | $ | 220,539 | | $ | 221,524 | |
| Portfolio turnover rate | | 17.53 | % | | 25.88 | % | | 21.30 | % | | 13.04 | % | | 5.18 | % | | 14.24 | % |
aThe amount shown for a outstanding throughout the period may not correlate with the Statement of Operations for the period due to the timing of sales and repurchases of
the Fund’s shares in relation to income earned and/or fluctuating fair value of the investments of the Fund.
bBased on average daily shares outstanding.
cNet investment income per share includes approximately $0.11 per share related to income received in the form of special dividends in connection with certain Fund
holdings. Excluding this amount, the ratio of net investment income to average net assets would have been 0.15%.
dNet investment income per share includes approximately $0.04 per share related to income received in the form of special dividends in connection with certain Fund
holdings. Excluding this amount, the ratio of net investment income to average net assets would have been 0.01%.
eNet investment income per share includes approximately $0.10 per share related to income received in the form of special dividends in connection with certain Fund
holdings. Excluding this amount, the ratio of net investment income to average net assets would have been 0.18%.
fNet investment income per share includes approximately $0.14 per share related to income received in the form of special dividends in connection with certain Fund
holdings. Excluding this amount, the ratio of net investment income to average net assets would have been 0.28%.
gAmount rounds to less than $0.01 per share.
hTotal return is not annualized for periods less than one year.
iRatios are annualized for periods less than one year.
jBenefit of expense reduction rounds to less than 0.01%.
kBenefit of waiver and payments by affiliates rounds to less than 0.01%.
franklintempleton.com The accompanying notes are an integral part of these financial statements. | Semiannual Report 75
| | | | | | | | | | | | |
| FRANKLIN VALUE INVESTORS TRUST | | | | | | | | | | | | |
| FINANCIAL HIGHLIGHTS | | | | | | | | | | | | |
| |
| |
| Franklin Small Cap Value Fund (continued) | | | | | | | | | | | | |
| | | Six Months Ended | | | | | | | | | | |
| | | April 30, 2016 | | | Year Ended October 31, | |
| | | (unaudited) | | | 2015 | | | 2014 | | | 2013 | a |
| Class R6 | | | | | | | | | | | | |
| Per share operating performance | | | | | | | | | | | | |
| (for a share outstanding throughout the period) | | | | | | | | | | | | |
| Net asset value, beginning of period | $ | 53.75 | | $ | 61.09 | | $ | 61.78 | | $ | 50.83 | |
| Income from investment operationsb: | | | | | | | | | | | | |
| Net investment incomec | | 0.24 | | | 0.62 | d | | 0.42 | e | | 0.19 | |
| Net realized and unrealized gains (losses) | | 0.71 | | | (2.43 | ) | | 2.16 | | | 10.76 | |
| Total from investment operations | | 0.95 | | | (1.81 | ) | | 2.58 | | | 10.95 | |
| Less distributions from: | | | | | | | | | | | | |
| Net investment income | | (0.59 | ) | | (0.44 | ) | | (0.53 | ) | | — | |
| Net realized gains | | (4.92 | ) | | (5.09 | ) | | (2.74 | ) | | — | |
| Total distributions | | (5.51 | ) | | (5.53 | ) | | (3.27 | ) | | — | |
| Net asset value, end of period | $ | 49.19 | | $ | 53.75 | | $ | 61.09 | | $ | 61.78 | |
| |
| Total returnf | | 2.50 | % | | (2.80 | )% | | 4.31 | % | | 21.54 | % |
| |
| Ratios to average net assetsg | | | | | | | | | | | | |
| Expenses before waiver and payments by affiliates | | 0.64 | % | | 0.62 | % | | 0.60 | % | | 2.09 | % |
| Expenses net of waiver and payments by affiliates. | | 0.63 | %h | | 0.61 | % | | 0.60 | %h,i | | 0.64 | % |
| Net investment income | | 1.03 | % | | 1.10 | %d | | 0.80 | %e | | 0.68 | % |
| |
| Supplemental data | | | | | | | | | | | | |
| Net assets, end of period (000’s) | $ | 67,738 | | $ | 59,339 | | $ | 34,278 | | $ | 17 | |
| Portfolio turnover rate. | | 17.53 | % | | 25.88 | % | | 21.30 | % | | 13.04 | % |
aFor the period May 1, 2013 (effective date) to October 31, 2013.
bThe amount shown for a outstanding throughout the period may not correlate with the Statement of Operations for the period due to the timing of sales and repurchases of
the Fund’s shares in relation to income earned and/or fluctuating fair value of the investments of the Fund.
cBased on average daily shares outstanding.
dNet investment income per share includes approximately $0.11 per share related to income received in the form of special dividends in connection with certain Fund
holdings. Excluding this amount, the ratio of net investment income to average net assets would have been 0.90%.
eNet investment income per share includes approximately $0.04 per share received in the form of special dividends in connection with certain Fund’s holdings. Excluding
these amounts, the ratio of net investment income to average net assets would have been 0.74%.
fTotal return is not annualized for periods less than one year.
gRatios are annualized for periods less than one year.
hBenefit of expense reduction rounds to less than 0.01%.
iBenefit of waiver and payments by affiliates rounds to less than 0.01%.
76 Semiannual Report | The accompanying notes are an integral part of these financial statements. franklintempleton.com
| | | | | | | | | | | | | | | | | | |
| | | | | | | | | FRANKLIN VALUE INVESTORS TRUST | |
| | | | | | | | | | | | FINANCIAL HIGHLIGHTS | |
| |
| |
| Franklin Small Cap Value Fund (continued) | | | | | | | | | | | | | | | | |
| | | Six Months Ended | | | | | | | | | | | | | | | | |
| | | April 30, 2016 | | | | | | Year Ended October 31, | | | | |
| | | (unaudited) | | | 2015 | | | 2014 | | | 2013 | | | 2012 | | | 2011 | |
| Advisor Class | | | | | | | | | | | | | | | | | | |
| Per share operating performance | | | | | | | | | | | | | | | | | | |
| (for a share outstanding throughout the period) | | | | | | | | | | | | | | | | | | |
| Net asset value, beginning of period | $ | 53.67 | | $ | 61.01 | | $ | 61.72 | | $ | 46.54 | | $ | 43.53 | | $ | 40.87 | |
| Income from investment operationsa: | | | | | | | | | | | | | | | | | | |
| Net investment incomeb | | 0.19 | | | 0.47 | c | | 0.34 | d | | 0.46 | e | | 0.48 | f | | 0.32 | |
| Net realized and unrealized gains (losses) | | 0.72 | | | (2.41 | ) | | 2.10 | | | 16.82 | | | 4.60 | | | 2.57 | |
| Total from investment operations | | 0.91 | | | (1.94 | ) | | 2.44 | | | 17.28 | | | 5.08 | | | 2.89 | |
| Less distributions from: | | | | | | | | | | | | | | | | | | |
| Net investment income. | | (0.43 | ) | | (0.31 | ) | | (0.41 | ) | | (0.63 | ) | | (0.30 | ) | | (0.23 | ) |
| Net realized gains | | (4.92 | ) | | (5.09 | ) | | (2.74 | ) | | (1.47 | ) | | (1.77 | ) | | — | |
| Total distributions | | (5.35 | ) | | (5.40 | ) | | (3.15 | ) | | (2.10 | ) | | (2.07 | ) | | (0.23 | ) |
| Net asset value, end of period | $ | 49.23 | | $ | 53.67 | | $ | 61.01 | | $ | 61.72 | | $ | 46.54 | | $ | 43.53 | |
| |
| Total returng | | 2.38 | % | | (3.03 | )% | | 4.07 | % | | 38.56 | % | | 12.42 | % | | 7.05 | % |
| |
| Ratios to average net assetsh | | | | | | | | | | | | | | | | | | |
| Expenses before waiver and payments by | | | | | | | | | | | | | | | | | | |
| affiliates | | 0.89 | % | | 0.87 | % | | 0.83 | % | | 0.89 | % | | 0.96 | % | | 0.91 | % |
| Expenses net of waiver and payments by | | | | | | | | | | | | | | | | | | |
| affiliates | | 0.88 | %i | | 0.86 | % | | 0.83 | %i,j | | 0.89 | % | | 0.96 | % | | 0.91 | % |
| Net investment income | | 0.78 | % | | 0.85 | %c | | 0.57 | %d | | 0.87 | %e | | 1.09 | %f | | 0.71 | % |
| |
| Supplemental data | | | | | | | | | | | | | | | | | | |
| Net assets, end of period (000’s) | $ | 558,639 | | $ | 635,499 | | $ | 816,430 | | $ | 653,660 | | $ | 419,840 | | $ | 359,034 | |
| Portfolio turnover rate | | 17.53 | % | | 25.88 | % | | 21.30 | % | | 13.04 | % | | 5.18 | % | | 14.24 | % |
aThe amount shown for a outstanding throughout the period may not correlate with the Statement of Operations for the period due to the timing of sales and repurchases of
the Fund’s shares in relation to income earned and/or fluctuating fair value of the investments of the Fund.
bBased on average daily shares outstanding.
cNet investment income per share includes approximately $0.11 per share related to income received in the form of special dividends in connection with certain Fund
holdings. Excluding this amount, the ratio of net investment income to average net assets would have been 0.65%.
dNet investment income per share includes approximately $0.04 per share related to income received in the form of special dividends in connection with certain Fund
holdings. Excluding this amount, the ratio of net investment income to average net assets would have been 0.51%.
eNet investment income per share includes approximately $0.10 per share related to income received in the form of special dividends in connection with certain Fund
holdings. Excluding this amount, the ratio of net investment income to average net assets would have been 0.68%.
fNet investment income per share includes approximately $0.14 per share related to income received in the form of special dividends in connection with certain Fund
holdings. Excluding this amount, the ratio of net investment income to average net assets would have been 0.78%.
gTotal return is not annualized for periods less than one year.
hRatios are annualized for periods less than one year.
iBenefit of expense reduction rounds to less than 0.01%.
jBenefit of waiver and payments by affiliates rounds to less than 0.01%.
franklintempleton.com The accompanying notes are an integral part of these financial statements. | Semiannual Report 77
| | | |
| FRANKLIN VALUE INVESTORS TRUST | | | |
| |
| |
| |
| |
| Statement of Investments, April 30, 2016 (unaudited) | | | |
| Franklin Small Cap Value Fund | | | |
| | Shares | | Value |
| |
| Common Stocks 94.4% | | | |
| Aerospace & Defense 4.3% | | | |
| a AAR Corp | 2,174,007 | $ | 52,263,128 |
| Cubic Corp | 570,600 | | 23,719,842 |
| b Esterline Technologies Corp | 234,400 | | 16,093,904 |
| | | | 92,076,874 |
| Automobiles & Components 4.3% | | | |
| Drew Industries Inc | 630,000 | | 40,842,900 |
| Gentex Corp | 726,100 | | 11,646,644 |
| Spartan Motors Inc | 5,000 | | 24,300 |
| Thor Industries Inc | 470,100 | | 30,095,802 |
| Winnebago Industries Inc | 395,100 | | 8,549,964 |
| | | | 91,159,610 |
| Banks 5.3% | | | |
| BNC Bancorp | 77,100 | | 1,723,956 |
| Chemical Financial Corp | 866,455 | | 33,323,859 |
| Columbia Banking System Inc | 661,500 | | 19,507,635 |
| EverBank Financial Corp | 1,480,800 | | 22,330,464 |
| Lakeland Financial Corp | 388,000 | | 18,348,520 |
| Peoples Bancorp Inc | 421,800 | | 9,064,482 |
| TrustCo Bank Corp. NY | 1,103,300 | | 7,072,153 |
| | | | 111,371,069 |
| Building Products 5.4% | | | |
| b Armstrong Flooring Inc | 301,500 | | 4,389,840 |
| b Gibraltar Industries Inc | 922,700 | | 24,405,415 |
| Griffon Corp | 638,000 | | 10,086,780 |
| Insteel Industries Inc | 77,000 | | 2,232,230 |
| Simpson Manufacturing Co. Inc | 756,600 | | 28,448,160 |
| Universal Forest Products Inc | 580,500 | | 44,495,325 |
| | | | 114,057,750 |
| Commercial & Professional Services 2.2% | | | |
| b Huron Consulting Group Inc | 264,600 | | 14,714,406 |
| McGrath RentCorp | 815,800 | | 19,889,204 |
| MSA Safety Inc | 269,000 | | 12,936,210 |
| | | | 47,539,820 |
| Construction & Engineering 3.4% | | | |
| EMCOR Group Inc | 644,000 | | 31,221,120 |
| Granite Construction Inc | 936,370 | | 41,752,738 |
| | | | 72,973,858 |
| Consumer Durables & Apparel 4.4% | | | |
| b BRP Inc. (Canada) | 1,436,100 | | 22,846,135 |
| Brunswick Corp | 82,300 | | 3,952,869 |
| b Crocs Inc | 2,237,700 | | 18,684,795 |
| b Helen of Troy Ltd | 39,000 | | 3,881,670 |
| Hooker Furniture Corp | 410,900 | | 10,190,320 |
| La-Z-Boy Inc | 549,700 | | 14,220,739 |
| b M/I Homes Inc | 943,300 | | 18,960,330 |
| | | | 92,736,858 |
| Consumer Services 0.3% | | | |
| Brinker International Inc | 134,500 | | 6,230,040 |
78 Semiannual Report
franklintempleton.com
FRANKLIN VALUE INVESTORS TRUST
STATEMENT OF INVESTMENTS (UNAUDITED)
| | | |
| Franklin Small Cap Value Fund (continued) | | | |
| | Shares | | Value |
| |
| Common Stocks (continued) | | | |
| Electrical Equipment 3.9% | | | |
| Encore Wire Corp | 12,400 | $ | 474,300 |
| EnerSys | 559,500 | | 32,658,015 |
| Franklin Electric Co. Inc | 221,500 | | 6,997,185 |
| Regal Beloit Corp | 649,000 | | 41,808,580 |
| | | | 81,938,080 |
| Energy 4.6% | | | |
| Energen Corp | 452,700 | | 19,235,223 |
| b Helix Energy Solutions Group Inc | 1,030,200 | | 8,890,626 |
| Hunting PLC (United Kingdom) | 3,291,209 | | 17,627,213 |
| b Natural Gas Services Group Inc | 13,000 | | 298,870 |
| b Oil States International Inc | 874,300 | | 30,285,752 |
| b PHI Inc | 40,000 | | 836,800 |
| b PHI Inc., non-voting | 71,200 | | 1,596,304 |
| b Unit Corp | 1,427,400 | | 18,070,884 |
| | | | 96,841,672 |
| Food, Beverage & Tobacco 4.3% | | | |
| AGT Food and Ingredients Inc. (Canada) | 121,300 | | 3,923,231 |
| Dairy Crest Group PLC (United Kingdom) | 145,789 | | 1,203,725 |
| GrainCorp Ltd. (Australia) | 647,746 | | 4,033,422 |
| b Landec Corp | 1,258,780 | | 14,161,275 |
| Maple Leaf Foods Inc. (Canada) | 3,106,600 | | 64,359,051 |
| b Omega Protein Corp | 186,100 | | 3,459,599 |
| | | | 91,140,303 |
| Health Care Equipment & Services 6.0% | | | |
| Hill-Rom Holdings Inc | 599,000 | | 28,961,650 |
| Invacare Corp | 928,300 | | 10,434,092 |
| STERIS PLC | 654,900 | | 46,281,783 |
| Teleflex Inc | 260,700 | | 40,611,846 |
| | | | 126,289,371 |
| Industrial Conglomerates 2.2% | | | |
| Carlisle Cos. Inc | 458,000 | | 46,670,200 |
| Insurance 6.9% | | | |
| Arthur J. Gallagher & Co | 304,400 | | 14,014,576 |
| Aspen Insurance Holdings Ltd | 855,700 | | 39,661,695 |
| Endurance Specialty Holdings Ltd | 203,337 | | 13,009,501 |
| The Hanover Insurance Group Inc | 310,198 | | 26,602,581 |
| Old Republic International Corp | 1,448,500 | | 26,782,765 |
| Validus Holdings Ltd | 585,411 | | 26,981,593 |
| | | | 147,052,711 |
| Machinery 6.7% | | | |
| Astec Industries Inc | 1,097,000 | | 53,094,800 |
| Hillenbrand Inc | 519,400 | | 15,743,014 |
| John Bean Technologies Corp | 18,000 | | 938,520 |
| c Lindsay Corp | 232,900 | | 17,807,534 |
| Miller Industries Inc | 50,000 | | 1,063,000 |
| Mueller Industries Inc | 1,198,500 | | 37,824,660 |
| Mueller Water Products Inc., A | 1,086,100 | | 11,675,575 |
| b Wabash National Corp | 900 | | 12,825 |
franklintempleton.com
Semiannual Report 79
FRANKLIN VALUE INVESTORS TRUST
STATEMENT OF INVESTMENTS (UNAUDITED)
| | | |
| Franklin Small Cap Value Fund (continued) | | | |
| | Shares | | Value |
| |
| Common Stocks (continued) | | | |
| Machinery (continued) | | | |
| Watts Water Technologies Inc., A | 80,000 | $ | 4,469,600 |
| | | | 142,629,528 |
| Materials 10.6% | | | |
| A. Schulman Inc | 7,776 | | 216,873 |
| AptarGroup Inc | 84,600 | | 6,429,600 |
| Axiall Corp | 1,639,196 | | 38,603,066 |
| Carpenter Technology Corp | 236,200 | | 8,363,842 |
| b Detour Gold Corp. (Canada) | 1,199,100 | | 25,730,857 |
| H.B. Fuller Co | 893,900 | | 39,975,208 |
| Minerals Technologies Inc | 229,400 | | 13,741,060 |
| OceanaGold Corp. (Australia) | 4,954,500 | | 17,739,089 |
| RPM International Inc | 253,100 | | 12,789,143 |
| Sensient Technologies Corp | 718,800 | | 48,339,300 |
| Stepan Co | 189,200 | | 11,596,068 |
| | | | 223,524,106 |
| Pharmaceuticals, Biotechnology & Life Sciences 2.5% | | | |
| Gerresheimer AG (Germany) | 711,900 | | 52,941,188 |
| Real Estate 3.8% | | | |
| Brandywine Realty Trust | 1,644,200 | | 24,580,790 |
| LTC Properties Inc | 1,185,831 | | 55,010,700 |
| | | | 79,591,490 |
| Retailing 3.3% | | | |
| Caleres Inc | 722,600 | | 18,216,746 |
| The Cato Corp., A | 613,500 | | 22,447,965 |
| b Genesco Inc | 316,400 | | 21,888,552 |
| b West Marine Inc | 815,200 | | 8,168,304 |
| | | | 70,721,567 |
| Semiconductors & Semiconductor Equipment 2.6% | | | |
| Cohu Inc | 1,000,000 | | 11,560,000 |
| MKS Instruments Inc | 816,700 | | 29,286,862 |
| b Photronics Inc | 1,390,200 | | 14,708,316 |
| | | | 55,555,178 |
| Software & Services 0.6% | | | |
| Mentor Graphics Corp | 677,800 | | 13,528,888 |
| Technology Hardware & Equipment 0.6% | | | |
| b Rofin-Sinar Technologies Inc | 364,700 | | 11,739,693 |
| Telecommunication Services 0.1% | | | |
| b ORBCOMM Inc | 277,500 | | 2,750,025 |
| Transportation 1.2% | | | |
| b SAIA Inc | 363,300 | | 10,506,636 |
| b Spirit Airlines Inc | 323,100 | | 14,193,783 |
| | | | 24,700,419 |
80 Semiannual Report
franklintempleton.com
FRANKLIN VALUE INVESTORS TRUST
STATEMENT OF INVESTMENTS (UNAUDITED)
| | | | | | |
| Franklin Small Cap Value Fund (continued) | | | | | | |
| | | | Shares | | Value | |
| Common Stocks (continued) | | | | | | |
| Utilities 4.9% | | | | | | |
| Connecticut Water Service Inc | | | 48,500 | $ | 2,280,470 | |
| IDACORP Inc | | | 681,520 | | 49,566,950 | |
| Spire Inc | | | 806,600 | | 51,590,136 | |
| | | | | | 103,437,556 | |
| Total Common Stocks (Cost $1,641,716,672) | | | | | 1,999,197,854 | |
| |
| |
| | | | Principal | | | |
| | | | Amount | | | |
| Corporate Bonds (Cost $16,394,551) 0.6% | | | | | | |
| Energy 0.6% | | | | | | |
| Unit Corp., senior sub. note, 6.625%, 5/15/21 | | $ | 17,386,000 | | 11,865,945 | |
| Total Investments before Short Term Investments (Cost $1,658,111,223) | | | | | 2,011,063,799 | |
| |
| |
| | | | Shares | | | |
| Short Term Investments 6.3% | | | | | | |
| Money Market Funds (Cost $124,340,193) 5.9% | | | | | | |
| b,d Institutional Fiduciary Trust Money Market Portfolio | | | 124,340,193 | | 124,340,193 | |
| e Investments from Cash Collateral Received for Loaned Securities 0.4% | | | | | | |
| Money Market Funds (Cost $7,153,000) 0.3% | | | | | | |
| b,d Institutional Fiduciary Trust Money Market Portfolio | | | 7,153,000 | | 7,153,000 | |
| |
| |
| | | | Principal | | | |
| | | | Amount | | | |
| f Repurchase Agreement (Cost $1,788,466) 0.1% | | | | | | |
| Joint Repurchase Agreement, 0.28%, 5/02/16 (Maturity Value $1,788,508) | | | | | | |
| BNP Paribas Securities Corp. | | | | | | |
| Collateralized by U.S. Treasury Bill, 5/19/16 - 2/02/17; U.S. Treasury Bond, 7.25% - 8.75%, 5/15/16 - | | | | | | |
| 5/15/20; U.S. Treasury Note, 0.375% - 2.875%, 4/30/16 - 11/30/19; U.S. Treasury Note, Index | | | | | | |
| Linked, 2.50% - 2.625%, 7/15/16 - 7/15/17; U.S. Treasury Strips, 8/15/19 (valued at $1,824,236) | | $ | 1,788,466 | | 1,788,466 | |
| Total Investments from Cash Collateral Received for Loaned Securities | | | | | | |
| (Cost $8,941,466) | | | | | 8,941,466 | |
| Total Investments (Cost $1,791,392,882) 101.3% | | | | | 2,144,345,458 | |
| Other Assets, less Liabilities (1.3)% | | | | | (26,716,039 | ) |
| Net Assets 100.0% | | | | $ | 2,117,629,419 | |
aSee Note 8 regarding holdings of 5% voting securities.
bNon-income producing.
cA portion or all of the security is on loan at April 30, 2016. See Note 1(d).
dSee Note 3(f) regarding investments in affiliated management investment companies.
eSee Note 1(d) regarding securities on loan.
fSee Note 1(c) regarding joint repurchase agreement.
franklintempleton.com The accompanying notes are an integral part of these financial statements. | Semiannual Report 81
| | | | | | | |
| FRANKLIN VALUE INVESTORS TRUST | | | | | | | |
| |
| |
| |
| |
| Financial Statements | | | | | | | |
| |
| |
| Statements of Assets and Liabilities | | | | | | | |
| April 30, 2016 (unaudited) | | | | | | | |
| |
| | | Franklin Balance Sheet | | Franklin Large Cap | | | Franklin MicroCap |
| | | Investment Fund | | Value Fund | | | Value Fund |
| Assets: | | | | | | | |
| Investments in securities: | | | | | | | |
| Cost - Unaffiliated issuers | $ | 704,525,297 | $ | 123,637,109 | | $ | 197,877,939 |
| Cost - Non-controlled affiliates (Note 3f and 8) | | 126,112,109 | | 11,290,167 | | | 36,501,581 |
| Total cost of investments | $ | 830,637,406 | $ | 134,927,276 | | $ | 234,379,520 |
| Value - Unaffiliated issuers | $ | 877,326,821 | $ | 165,943,440 | | $ | 267,943,550 |
| Value - Non-controlled affiliates (Note 3f and 8) | | 115,940,445 | | 11,290,167 | | | 57,716,901 |
| Total value of investments | | 993,267,266 | | 177,233,607 | | | 325,660,451 |
| Receivables: | | | | | | | |
| Investment securities sold | | 2,422,113 | | — | | | 1,146,123 |
| Capital shares sold | | 842,607 | | 23,066 | | | 163,948 |
| Dividends. | | 152,110 | | 105,282 | | | 111,222 |
| Other assets | | 550 | | 108 | | | 178 |
| Total assets | | 996,684,646 | | 177,362,063 | | | 327,081,922 |
| Liabilities: | | | | | | | |
| Payables: | | | | | | | |
| Investment securities purchased | | 7,213,043 | | — | | | 553,792 |
| Capital shares redeemed | | 2,785,285 | | 285,218 | | | 355,731 |
| Management fees | | 360,967 | | 106,747 | | | 194,212 |
| Distribution fees | | 230,880 | | 51,736 | | | 47,625 |
| Transfer agent fees | | 385,394 | | 44,473 | | | 100,153 |
| Trustees’ fees and expenses | | 4,555 | | 757 | | | 1,129 |
| Accrued expenses and other liabilities. | | 118,016 | | 47,721 | | | 28,995 |
| Total liabilities | | 11,098,140 | | 536,652 | | | 1,281,637 |
| Net assets, at value | $ | 985,586,506 | $ | 176,825,411 | | $ | 325,800,285 |
| Net assets consist of: | | | | | | | |
| Paid-in capital | $ | 793,347,397 | $ | 142,096,185 | | $ | 210,473,508 |
| Undistributed net investment income | | 40,416 | | 385,824 | | | 323,773 |
| Net unrealized appreciation (depreciation) | | 162,629,860 | | 42,306,331 | | | 91,280,931 |
| Accumulated net realized gain (loss) | | 29,568,833 | | (7,962,929 | ) | | 23,722,073 |
| Net assets, at value | $ | 985,586,506 | $ | 176,825,411 | | $ | 325,800,285 |
82 Semiannual Report | The accompanying notes are an integral part of these financial statements. franklintempleton.com
| | | | | | | | |
| | | | | | | FRANKLIN VALUE INVESTORS TRUST |
| | | | | | | FINANCIAL STATEMENTS |
| |
| |
| Statements of Assets and Liabilities (continued) | | | | | | | | |
| April 30, 2016 (unaudited) | | | | | | | | |
| |
| | | | Franklin Balance Sheet | | | Franklin Large Cap | | Franklin MicroCap |
| | | | Investment Fund | | | Value Fund | | Value Fund |
| Class A: | | | | | | | | |
| Net assets, at value | $ | | 844,113,384 | $ | | 134,342,951 | $ | 247,013,636 |
| Shares outstanding. | | | 24,634,743 | | | 8,605,711 | | 8,068,083 |
| Net asset value per sharea | | $ | 34.27 | | $ | 15.61 | $ | 30.62 |
| Maximum offering price per share (net asset value per share | | | | | | | | |
| ÷ 94.25%) | | $ | 36.36 | | $ | 16.56 | $ | 32.49 |
| Class C: | | | | | | | | |
| Net assets, at value | $ | | 64,676,001 | $ | | 32,389,361 | | |
| Shares outstanding. | | | 1,957,052 | | | 2,095,912 | | |
| Net asset value and maximum offering price per sharea | | $ | 33.05 | | $ | 15.45 | | |
| Class R: | | | | | | | | |
| Net assets, at value | $ | | 9,050,925 | $ | | 4,001,924 | | |
| Shares outstanding. | | | 263,638 | | | 258,231 | | |
| Net asset value and maximum offering price per share | | $ | 34.33 | | $ | 15.50 | | |
| Class R6: | | | | | | | | |
| Net assets, at value | $ | | 6,842,958 | | | | $ | 18,524,015 |
| Shares outstanding. | | | 194,479 | | | | | 599,859 |
| Net asset value and maximum offering price per share | | $ | 35.19 | | | | $ | 30.88 |
| Advisor Class : | | | | | | | | |
| Net assets, at value | $ | | 60,903,238 | $ | | 6,091,175 | $ | 60,262,634 |
| Shares outstanding. | | | 1,728,059 | | | 392,132 | | 1,958,850 |
| Net asset value and maximum offering price per share | | $ | 35.24 | | $ | 15.53 | $ | 30.76 |
aRedemption price is equal to net asset value less contingent deferred sales charges, if applicable.
franklintempleton.com The accompanying notes are an integral part of these financial statements. | Semiannual Report 83
| | | | | |
| FRANKLIN VALUE INVESTORS TRUST | | | | | |
| FINANCIAL STATEMENTS | | | | | |
| |
| |
| Statements of Assets and Liabilities (continued) | | | | | |
| April 30, 2016 (unaudited) | | | | | |
| |
| | | Franklin MidCap | | | Franklin Small Cap |
| | | Value Fund | | | Value Fund |
| Assets: | | | | | |
| Investments in securities: | | | | | |
| Cost - Unaffiliated issuers | $ | 136,379,587 | | $ | 1,610,215,878 |
| Cost - Non-controlled affiliates (Note 3f and 8) | | 2,299,038 | | | 179,388,538 |
| Cost - Repurchase agreements | | — | | | 1,788,466 |
| Total cost of investments | $ | 138,678,625 | | $ | 1,791,392,882 |
| Value - Unaffiliated issuers | $ | 152,606,910 | | $ | 1,958,800,671 |
| Value - Non-controlled affiliates (Note 3f and 8) | | 2,299,038 | | | 183,756,321 |
| Value - Repurchase agreements | | — | | | 1,788,466 |
| Total value of investmentsa | | 154,905,948 | | | 2,144,345,458 |
| Receivables: | | | | | |
| Investment securities sold | | 1,999,799 | | | 7,039,999 |
| Capital shares sold | | 190,374 | | | 2,349,474 |
| Dividends | | 29,960 | | | 1,153,541 |
| Other assets | | 85 | | | 11,428 |
| Total assets | | 157,126,166 | | | 2,154,899,900 |
| Liabilities: | | | | | |
| Payables: | | | | | |
| Investment securities purchased | | 1,720,069 | | | 21,244,939 |
| Capital shares redeemed | | 217,348 | | | 4,288,460 |
| Management fees. | | 90,165 | | | 984,946 |
| Distribution fees | | 45,254 | | | 485,489 |
| Transfer agent fees | | 43,241 | | | 1,153,857 |
| Trustees’ fees and expenses | | 42 | | | 59,042 |
| Payable upon return of securities loaned | | — | | | 8,941,466 |
| Accrued expenses and other liabilities | | 43,980 | | | 112,282 |
| Total liabilities | | 2,160,099 | | | 37,270,481 |
| Net assets, at value | $ | 154,966,067 | | $ | 2,117,629,419 |
| Net assets consist of: | | | | | |
| Paid-in capital | $ | 139,228,949 | | $ | 1,678,520,992 |
| Undistributed net investment income | | 149,905 | | | 2,092,580 |
| Net unrealized appreciation (depreciation) | | 16,227,323 | | | 348,463,691 |
| Accumulated net realized gain (loss) | | (640,110 | ) | | 88,552,156 |
| Net assets, at value | $ | 154,966,067 | | $ | 2,117,629,419 |
| |
| |
| |
| |
| aIncludes securities loaned | $ | — | | $ | 8,708,794 |
84 Semiannual Report | The accompanying notes are an integral part of these financial statements. franklintempleton.com
| | | | | | | |
| | | | FRANKLIN VALUE INVESTORS TRUST |
| | | | FINANCIAL STATEMENTS |
| |
| |
| Statements of Assets and Liabilities (continued) | | | | | | | |
| April 30, 2016 (unaudited) | | | | | | | |
| |
| | | | Franklin MidCap | | Franklin Small Cap |
| | | | Value Fund | | | | Value Fund |
| Class A: | | | | | | | |
| Net assets, at value | $ | | 126,607,091 | $ | 1,061,387,821 |
| Shares outstanding | | | 9,022,650 | | | | 22,429,323 |
| Net asset value per sharea | | $ | 14.03 | | | $ | 47.32 |
| Maximum offering price per share (net asset value per share ÷ 94.25%) | | $ | 14.89 | | | $ | 50.21 |
| Class C: | | | | | | | |
| Net assets, at value | $ | | 23,201,921 | | $ | | 223,371,330 |
| Shares outstanding | | | 1,681,848 | | | | 5,211,910 |
| Net asset value and maximum offering price per sharea | | $ | 13.80 | | | $ | 42.86 |
| Class R: | | | | | | | |
| Net assets, at value | $ | | 666,327 | | $ | | 206,493,325 |
| Shares outstanding | | | 47,433 | | | | 4,407,479 |
| Net asset value and maximum offering price per share | | $ | 14.05 | | | $ | 46.85 |
| Class R6: | | | | | | | |
| Net assets, at value | | | | | $ | | 67,738,322 |
| Shares outstanding | | | | | | | 1,376,959 |
| Net asset value and maximum offering price per share | | | | | | $ | 49.19 |
| Advisor Class : | | | | | | | |
| Net assets, at value | $ | | 4,490,728 | | $ | | 558,638,621 |
| Shares outstanding | | | 318,649 | | | | 11,348,082 |
| Net asset value and maximum offering price per share | | $ | 14.09 | | | $ | 49.23 |
aRedemption price is equal to net asset value less contingent deferred sales charges, if applicable.
franklintempleton.com The accompanying notes are an integral part of these financial statements. | Semiannual Report 85
| | | | | | | | | |
| FRANKLIN VALUE INVESTORS TRUST | | | | | | | | | |
| FINANCIAL STATEMENTS | | | | | | | | | |
| |
| |
| Statements of Operations | | | | | | | | | |
| for the six months ended April 30, 2016 (unaudited) | | | | | | | | | |
| |
| | | Franklin Balance Sheet | | | Franklin Large Cap | | | Franklin MicroCap | |
| | | Investment Fund | | | Value Fund | | | Value Fund | |
| Investment income: | | | | | | | | | |
| Dividends: | | | | | | | | | |
| Unaffiliated issuers | $ | 7,342,260 | | $ | 2,174,389 | | $ | 2,390,157 | |
| Non-controlled affiliates (Note 8) | | — | | | — | | | 107,436 | |
| Total investment income. | | 7,342,260 | | | 2,174,389 | | | 2,497,593 | |
| Expenses: | | | | | | | | | |
| Management fees (Note 3a) | | 2,305,327 | | | 694,218 | | | 1,174,795 | |
| Distribution fees: (Note 3c) | | | | | | | | | |
| Class A | | 1,034,925 | | | 173,574 | | | 287,613 | |
| Class C | | 328,602 | | | 163,209 | | | — | |
| Class R | | 22,116 | | | 9,922 | | | — | |
| Transfer agent fees: (Note 3e) | | | | | | | | | |
| Class A | | 757,140 | | | 134,066 | | | 183,820 | |
| Class C | | 60,102 | | | 32,476 | | | — | |
| Class R | | 8,088 | | | 3,884 | | | — | |
| Class R6 | | 154 | | | 32 | | | 118 | |
| Advisor Class | | 55,330 | | | 6,084 | | | 45,067 | |
| Custodian fees (Note 4) | | 6,337 | | | 866 | | | 1,425 | |
| Reports to shareholders. | | 72,885 | | | 15,075 | | | 23,813 | |
| Registration and filing fees | | 84,452 | | | 38,362 | | | 35,207 | |
| Professional fees | | 42,486 | | | 18,655 | | | 29,703 | |
| Trustees’ fees and expenses | | 30,108 | | | 5,587 | | | 9,440 | |
| Other. | | 36,990 | | | 31,178 | | | 4,781 | |
| Total expenses | | 4,845,042 | | | 1,327,188 | | | 1,795,782 | |
| Expense reductions (Note 4) | | (8 | ) | | — | | | (60 | ) |
| Expenses waived/paid by affiliates (Note 3f and 3g) | | (87,021 | ) | | (8,867 | ) | | (13,161 | ) |
| Net expenses | | 4,758,013 | | | 1,318,321 | | | 1,782,561 | |
| Net investment income | | 2,584,247 | | | 856,068 | | | 715,032 | |
| Realized and unrealized gains (losses): | | | | | | | | | |
| Net realized gain (loss) from: | | | | | | | | | |
| Investments: | | | | | | | | | |
| Unaffiliated issuers | | 30,398,805 | | | (7,961,446 | ) | | 22,186,626 | |
| Non-controlled affiliates (Note 8) | | — | | | — | | | 1,536,373 | |
| Foreign currency transactions | | (205,675 | ) | | (825 | ) | | — | |
| Net realized gain (loss) | | 30,193,130 | | | (7,962,271 | ) | | 23,722,999 | |
| Net change in unrealized appreciation (depreciation) on: | | | | | | | | | |
| Investments | | (23,924,858 | ) | | (1,878,813 | ) | | (6,808,181 | ) |
| Net realized and unrealized gain (loss) | | 6,268,272 | | | (9,841,084 | ) | | 16,914,818 | |
| Net increase (decrease) in net assets resulting from | | | | | | | | | |
| operations | $ | 8,852,519 | | $ | (8,985,016 | ) | $ | 17,629,850 | |
86 Semiannual Report | The accompanying notes are an integral part of these financial statements. franklintempleton.com
| | | | | | |
| | | FRANKLIN VALUE INVESTORS TRUST | |
| | | FINANCIAL STATEMENTS | |
| |
| |
| Statements of Operations (continued) | | | | | | |
| for the six months ended April 30, 2016 (unaudited) | | | | | | |
| |
| | | Franklin MidCap | | | Franklin Small Cap | |
| | | Value Fund | | | Value Fund | |
| Investment income: | | | | | | |
| Dividends: | | | | | | |
| Unaffiliated issuers | $ | 1,634,027 | | $ | 15,578,394 | |
| Non-controlled affiliates (Note 8) | | — | | | 434,903 | |
| Interest. | | — | | | 597,354 | |
| Income from securities loaned (net of fees and rebates) | | 4,087 | | | 163,377 | |
| Total investment income | | 1,638,114 | | | 16,774,028 | |
| Expenses: | | | | | | |
| Management fees (Note 3a) | | 699,495 | | | 5,984,340 | |
| Distribution fees: (Note 3c) | | | | | | |
| Class A. | | 150,314 | | | 1,235,875 | |
| Class C. | | 109,728 | | | 1,052,112 | |
| Class R. | | 1,614 | | | 507,802 | |
| Transfer agent fees: (Note 3e) | | | | | | |
| Class A. | | 133,554 | | | 1,261,015 | |
| Class C. | | 24,637 | | | 269,336 | |
| Class R. | | 716 | | | 258,976 | |
| Class R6. | | — | | | 3,481 | |
| Advisor Class | | 4,797 | | | 710,914 | |
| Custodian fees (Note 4) | | 678 | | | 16,556 | |
| Reports to shareholders | | 17,024 | | | 168,996 | |
| Registration and filing fees | | 33,009 | | | 94,716 | |
| Professional fees | | 27,299 | | | 45,599 | |
| Trustees’ fees and expenses | | 3,712 | | | 59,042 | |
| Other | | 3,237 | | | 33,250 | |
| Total expenses | | 1,209,814 | | | 11,702,010 | |
| Expense reductions (Note 4) | | — | | | (35 | ) |
| Expenses waived/paid by affiliates (Note 3f and 3g) | | (174,788 | ) | | (130,562 | ) |
| Net expenses | | 1,035,026 | | | 11,571,413 | |
| Net investment income | | 603,088 | | | 5,202,615 | |
| Realized and unrealized gains (losses): | | | | | | |
| Net realized gain (loss) from: | | | | | | |
| Investments: | | | | | | |
| Unaffiliated issuers | | (375,348 | ) | | 87,680,853 | |
| Non-controlled affiliates (Note 8) | | — | | | 1,184,605 | |
| Realized gain distributions from REITs | | 153,129 | | | 16,155 | |
| Foreign currency transactions | | — | | | (311,179 | ) |
| Net realized gain (loss) | | (222,219 | ) | | 88,570,434 | |
| Net change in unrealized appreciation (depreciation) on: | | | | | | |
| Investments. | | 823,734 | | | (57,964,336 | ) |
| Translation of other assets and liabilities | | | | | | |
| denominated in foreign currencies | | — | | | 2,280 | |
| Net change in unrealized appreciation (depreciation) | | 823,734 | | | (57,962,056 | ) |
| Net realized and unrealized gain (loss) | | 601,515 | | | 30,608,378 | |
| Net increase (decrease) in net assets resulting from operations | $ | 1,204,603 | | $ | 35,810,993 | |
franklintempleton.com The accompanying notes are an integral part of these financial statements. | Semiannual Report 87
| | | | | | | | | | | | |
| FRANKLIN VALUE INVESTORS TRUST | | | | | | | | | | | | |
| FINANCIAL STATEMENTS | | | | | | | | | | | | |
| |
| |
| Statements of Changes in Net Assets | | | | | | | | | | | | |
| |
| | | Franklin Balance Sheet | | | | | | | |
| | | Investment Fund | | | Franklin Large Cap Value Fund | |
| | | Six Months Ended | | | | | | Six Months Ended | | | | |
| | | April 30, 2016 | | | Year Ended | | | April 30, 2016 | | | Year Ended | |
| | | (unaudited) | | | October 31, 2015 | | | (unaudited) | | | October 31, 2015 | |
| Increase (decrease) in net assets: | | | | | | | | | | | | |
| Operations: | | | | | | | | | | | | |
| Net investment income | $ | 2,584,247 | | $ | 5,345,173 | | $ | 856,068 | | $ | 1,664,604 | |
| Net realized gain (loss) | | 30,193,130 | | | 149,270,750 | | | (7,962,271 | ) | | 16,137,812 | |
| Net change in unrealized appreciation | | | | | | | | | | | | |
| (depreciation) | | (23,924,858 | ) | | (260,058,370 | ) | | (1,878,813 | ) | | (26,095,364 | ) |
| Net increase (decrease) in net assets | | | | | | | | | | | | |
| resulting from operations | | 8,852,519 | | | (105,442,447 | ) | | (8,985,016 | ) | | (8,292,948 | ) |
| Distributions to shareholders from: | | | | | | | | | | | | |
| Net investment income: | | | | | | | | | | | | |
| Class A. | | (6,163,509 | ) | | (3,957,412 | ) | | (1,330,562 | ) | | (918,042 | ) |
| Class C. | | — | | | — | | | (52,616 | ) | | — | |
| Class R. | | (40,973 | ) | | (1,756 | ) | | (28,250 | ) | | (16,051 | ) |
| Class R6 | | (86,862 | ) | | (57,404 | ) | | (108,614 | ) | | (77,645 | ) |
| Advisor Class | | (567,388 | ) | | (644,542 | ) | | (80,459 | ) | | (59,539 | ) |
| Net realized gains: | | | | | | | | | | | | |
| Class A. | | (127,240,321 | ) | | (177,375,288 | ) | | (11,747,021 | ) | | (2,085,669 | ) |
| Class C. | | (10,707,264 | ) | | (14,401,328 | ) | | (2,905,479 | ) | | (507,761 | ) |
| Class R. | | (1,392,805 | ) | | (1,988,576 | ) | | (340,868 | ) | | (61,773 | ) |
| Class R6 | | (1,044,533 | ) | | (1,129,406 | ) | | (616,690 | ) | | (97,927 | ) |
| Advisor Class | | (8,916,476 | ) | | (15,940,901 | ) | | (533,149 | ) | | (88,111 | ) |
| Total distributions to shareholders | | (156,160,131 | ) | | (215,496,613 | ) | | (17,743,708 | ) | | (3,912,518 | ) |
| Capital share transactions: (Note 2) | | | | | | | | | | | | |
| Class A. | | 54,504,334 | | | (39,456,578 | ) | | 2,946,353 | | | (3,971,569 | ) |
| Class C. | | 1,984,745 | | | (1,325,175 | ) | | 133,980 | | | (134,925 | ) |
| Class R. | | 602,691 | | | (1,483,804 | ) | | 222,014 | | | (255,021 | ) |
| Class R6 | | 476,870 | | | 1,316,064 | | | (6,189,727 | ) | | 632,155 | |
| Advisor Class | | 282,977 | | | (18,629,141 | ) | | 187,230 | | | 359,608 | |
| Total capital share transactions | | 57,851,617 | | | (59,578,634 | ) | | (2,700,150 | ) | | (3,369,752 | ) |
| Net increase (decrease) in net assets . | | (89,455,995 | ) | | (380,517,694 | ) | | (29,428,874 | ) | | (15,575,218 | ) |
| Net assets: | | | | | | | | | | | | |
| Beginning of period. | | 1,075,042,501 | | | 1,455,560,195 | | | 206,254,285 | | | 221,829,503 | |
| End of period | $ | 985,586,506 | | $ | 1,075,042,501 | | $ | 176,825,411 | | $ | 206,254,285 | |
| Undistributed net investment income included | | | | | | | | | | | | |
| in net assets: | | | | | | | | | | | | |
| End of period | $ | 40,416 | | $ | 4,314,901 | | $ | 385,824 | | $ | 1,130,257 | |
88 Semiannual Report | The accompanying notes are an integral part of these financial statements. franklintempleton.com
| | | | | | | | | | | | | | | | |
| | | | | | | | FRANKLIN VALUE INVESTORS TRUST | |
| | | | | | | | | | | | FINANCIAL STATEMENTS | |
| |
| |
| Statements of Changes in Net Assets (continued) | | | | | | | | | | | | | | |
| |
| | | Franklin MicroCap Value Fund | | | Franklin MidCap Value Fund | |
| | | Six Months Ended | | | | | | | Six Months Ended | | | | | |
| | | April 30, 2016 | | | | Year Ended | | | April 30, 2016 | | | | Year Ended | |
| | | | (unaudited) | | | October 31, 2015 | | | | (unaudited) | | | October 31, 2015 | |
| Increase (decrease) in net assets: | | | | | | | | | | | | | | | | |
| Operations: | | | | | | | | | | | | | | | | |
| Net investment income | | $ | 715,032 | | | $ | 321,845 | | | $ | 603,088 | | | $ | 1,000,348 | |
| Net realized gain (loss) | | | 23,722,999 | | | | 38,812,000 | | | | (222,219 | ) | | | 12,284,486 | |
| Net change in unrealized appreciation | | | | | | | | | | | | | | | | |
| (depreciation) | | | (6,808,181 | ) | | | (75,270,265 | ) | | | 823,734 | | | | (18,638,584 | ) |
| Net increase (decrease) in net assets | | | | | | | | | | | | | | | | |
| resulting from operations | | | 17,629,850 | | | | (36,136,420 | ) | | | 1,204,603 | | | | (5,353,750 | ) |
| Distributions to shareholders from: | | | | | | | | | | | | | | | | |
| Net investment income: | | | | | | | | | | | | | | | | |
| Class A. | | | — | | | | — | | | | (566,124 | ) | | | (866,505 | ) |
| Class R. | | | — | | | | — | | | | (487 | ) | | | (3,785 | ) |
| Advisor Class | | | — | | | | — | | | | (34,226 | ) | | | (42,471 | ) |
| Net realized gains: | | | | | | | | | | | | | | | | |
| Class A. | | | (29,640,506 | ) | | | (31,272,031 | ) | | | (10,163,516 | ) | | | (2,473,197 | ) |
| Class C. | | | — | | | | — | | | | (1,887,875 | ) | | | (466,142 | ) |
| Class R. | | | — | | | | — | | | | (57,562 | ) | | | (18,353 | ) |
| Class R6 | | | (2,087,901 | ) | | | (2,229,315 | ) | | | — | | | | — | |
| Advisor Class | | | (7,083,319 | ) | | | (7,981,634 | ) | | | (366,722 | ) | | | (84,941 | ) |
| Total distributions to shareholders | | | (38,811,726 | ) | | | (41,482,980 | ) | | | (13,076,512 | ) | | | (3,955,394 | ) |
| Capital share transactions: (Note 2) | | | | | | | | | | | | | | | | |
| Class A. | | | 5,279,472 | | | | (29,885,991 | ) | | | 9,167,589 | | | | 6,132,968 | |
| Class C. | | | — | | | | — | | | | 1,717,928 | | | | 853,401 | |
| Class R. | | | — | | | | — | | | | (35,776 | ) | | | (300,745 | ) |
| Class R6 | | | 1,530,493 | | | | (2,944,946 | ) | | | — | | | | — | |
| Advisor Class | | | (3,539,549 | ) | | | (7,557,529 | ) | | | 153,983 | | | | 577,641 | |
| Total capital share transactions | | | 3,270,416 | | | | (40,388,466 | ) | | | 11,003,724 | | | | 7,263,265 | |
| Net increase (decrease) in net assets . | | | (17,911,460 | ) | | | (118,007,866 | ) | | | (868,185 | ) | | | (2,045,879 | ) |
| Net assets: | | | | | | | | | | | | | | | | |
| Beginning of period. | | | 343,711,745 | | | | 461,719,611 | | | | 155,834,252 | | | | 157,880,131 | |
| End of period | $ | 325,800,285 | | $ | 343,711,745 | | $ | 154,966,067 | | $ | 155,834,252 | |
| Undistributed net investment income included | | | | | | | | | | | | | | | | |
| in net assets: | | | | | | | | | | | | | | | | |
| End of period | | $ | 323,773 | | | $ | — | | | $ | 149,905 | | | $ | 147,654 | |
| Distributions in excess of net investment | | | | | | | | | | | | | | | | |
| income included in net assets: | | | | | | | | | | | | | | | | |
| End of period | | $ | — | | | $ | (391,259 | ) | | $ | — | | | $ | — | |
franklintempleton.com The accompanying notes are an integral part of these financial statements. | Semiannual Report 89
| | | | | | |
| FRANKLIN VALUE INVESTORS TRUST | | | | | | |
| FINANCIAL STATEMENTS | | | | | | |
| |
| |
| Statements of Changes in Net Assets (continued) | | | | | | |
| |
| | | Franklin Small Cap Value Fund | |
| | | Six Months Ended | | | | |
| | | April 30, 2016 | | | Year Ended | |
| | | (unaudited) | | | October 31, 2015 | |
| Increase (decrease) in net assets: | | | | | | |
| Operations: | | | | | | |
| Net investment income. | $ | 5,202,615 | | $ | 14,135,832 | |
| Net realized gain (loss) | | 88,570,434 | | | 207,937,724 | |
| Net change in unrealized appreciation (depreciation) | | (57,962,056 | ) | | (301,245,883 | ) |
| Net increase (decrease) in net assets resulting from operations | | 35,810,993 | | | (79,172,327 | ) |
| Distributions to shareholders from: | | | | | | |
| Net investment income: | | | | | | |
| Class A | | (5,809,070 | ) | | (2,585,362 | ) |
| Class R | | (679,366 | ) | | (8,002 | ) |
| Class R6 | | (693,643 | ) | | (298,630 | ) |
| Advisor Class | | (4,845,956 | ) | | (4,065,275 | ) |
| Net realized gains: | | | | | | |
| Class A | | (99,834,697 | ) | | (110,504,165 | ) |
| Class C | | (23,379,919 | ) | | (24,786,735 | ) |
| Class R | | (21,061,215 | ) | | (23,952,774 | ) |
| Class R6 | | (5,810,056 | ) | | (3,448,309 | ) |
| Advisor Class | | (55,891,621 | ) | | (67,827,243 | ) |
| Total distributions to shareholders. | | (218,005,543 | ) | | (237,476,495 | ) |
| Capital share transactions: (Note 2) | | | | | | |
| Class A | | 85,408,878 | | | (82,172,729 | ) |
| Class C | | 14,215,467 | | | (2,782,028 | ) |
| Class R | | 2,754,535 | | | (26,620,260 | ) |
| Class R6 | | 13,020,794 | | | 31,865,969 | |
| Advisor Class | | (23,824,570 | ) | | (88,579,327 | ) |
| Total capital share transactions | | 91,575,104 | | | (168,288,375 | ) |
| Net increase (decrease) in net assets | | (90,619,446 | ) | | (484,937,197 | ) |
| Net assets: | | | | | | |
| Beginning of period | | 2,208,248,865 | | | 2,693,186,062 | |
| End of period | $ | 2,117,629,419 | | $ | 2,208,248,865 | |
| Undistributed net investment income included in net assets: | | | | | | |
| End of period | $ | 2,092,580 | | $ | 8,918,000 | |
90 Semiannual Report | The accompanying notes are an integral part of these financial statements. franklintempleton.com
FRANKLIN VALUE INVESTORS TRUST
Notes to Financial Statements (unaudited)
1. Organization and Significant Accounting Policies
Franklin Value Investors Trust (Trust) is registered under the Investment Company Act of 1940 (1940 Act) as an open-end management investment company, consisting of five separate funds (Funds) and applies the specialized accounting and reporting guidance in U.S. Generally Accepted Accounting Principles (U.S. GAAP). The classes of shares offered within each of the Funds are indicated below. Each class of shares differs by its initial sales load, contingent deferred sales charges, voting rights on matters affecting a single class, its exchange privilege and fees primarily due to differing arrangements for distribution and transfer agent fees.
|
| Class A, Class R6 & Advisor Class |
| Franklin MicroCap Value Funda |
| Class A, Class C, Class R & Advisor Class |
| Franklin Large Cap Value Fundb |
| Franklin MidCap Value Fund |
| Class A, Class C, Class R, Class R6 & Advisor Class |
| Franklin Balance Sheet Investment Fund |
| Franklin Small Cap Value Fund |
| aFranklin MicroCap Value Fund was closed to new investors with limited exceptions |
| effective January 2004, and has remained closed except for two days in |
| mid-February 2013, when the Fund was opened on a limited basis. |
| bEffective March 1, 2016, all Class R6 shares of Franklin Large Cap Value Fund |
| were fully redeemed. Subsequent to the redemption, Class R6 shares of the Fund |
| were no longer publicly offered. |
The following summarizes the Funds’ significant accounting policies.
a. Financial Instrument Valuation
The Funds’ investments in financial instruments are carried at fair value daily. Fair value is the price that would be received to sell an asset or paid to transfer a liability in an orderly transaction between market participants on the measurement date. The Funds calculate the net asset value (NAV) per share as of 4 p.m. Eastern time each day the New York Stock Exchange (NYSE) is open for trading. Under compliance policies and procedures approved by the Trust’s Board of Trustees (the Board), the Funds’ administrator has responsibility for oversight of valuation, including leading the cross-functional Valuation and Liquidity Oversight Committee (VLOC). The VLOC provides administration and oversight of the Funds’ valuation policies and procedures, which are approved annually by the Board. Among other things, these procedures allow the Funds to utilize independent pricing services, quotations from securities and financial instrument dealers, and other market sources to determine fair value.
Equity securities and exchange traded funds listed on an exchange or on the NASDAQ National Market System are valued at the last quoted sale price or the official closing price of the day, respectively. Foreign equity securities are valued as of the close of trading on the foreign stock exchange on which the security is primarily traded or as 4 p.m. Eastern time, whichever is earlier. The value is then converted into its U.S. dollar equivalent at the foreign exchange rate in effect at 4 p.m. Eastern time on the day that the value of the security is determined. Over-the-counter (OTC) securities are valued within the range of the most recent quoted bid and ask prices. Securities that trade in multiple markets or on multiple exchanges are valued according to the broadest and most representative market. Certain equity securities are valued based upon fundamental characteristics or relationships to similar securities.
Debt securities generally trade in the OTC market rather than on a securities exchange. The Funds’ pricing services use multiple valuation techniques to determine fair value. In instances where sufficient market activity exists, the pricing services may utilize a market-based approach through which quotes from market makers are used to determine fair value. In instances where sufficient market activity may not exist or is limited, the pricing services also utilize proprietary valuation models which may consider market characteristics such as benchmark yield curves, credit spreads, estimated default rates, anticipated market interest rate volatility, coupon rates, anticipated timing of principal repayments, underlying collateral, and other unique security features in order to estimate the relevant cash flows, which are then discounted to calculate the fair value.
Investments in open-end mutual funds are valued at the closing NAV. Repurchase agreements are valued at cost, which approximates fair value.
The Funds have procedures to determine the fair value of financial instruments for which market prices are not reliable or readily available. Under these procedures, the VLOC convenes on a regular basis to review such financial instruments and considers a number of factors, including significant unobservable valuation inputs, when arriving at fair value. The VLOC primarily employs a market-based approach which may use related or comparable assets or liabilities, recent
franklintempleton.com
Semiannual Report 91
FRANKLIN VALUE INVESTORS TRUST
NOTES TO FINANCIAL STATEMENTS (UNAUDITED)
1. Organization and Significant Accounting
Policies (continued)
a. Financial Instrument Valuation (continued)
transactions, market multiples, book values, and other relevant information for the investment to determine the fair value of the investment. An income-based valuation approach may also be used in which the anticipated future cash flows of the investment are discounted to calculate fair value. Discounts may also be applied due to the nature or duration of any restrictions on the disposition of the investments. Due to the inherent uncertainty of valuations of such investments, the fair values may differ significantly from the values that would have been used had an active market existed. The VLOC employs various methods for calibrating these valuation approaches including a regular review of key inputs and assumptions, transactional back-testing or disposition analysis, and reviews of any related market activity.
Trading in securities on foreign securities stock exchanges and OTC markets may be completed before 4 p.m. Eastern time. In addition, trading in certain foreign markets may not take place on every NYSE business day. Occasionally, events occur between the time at which trading in a foreign security is completed and the close of the NYSE that might call into question the reliability of the value of a portfolio security held by the Fund. As a result, differences may arise between the value of the Funds’ portfolio securities as determined at the foreign market close and the latest indications of value at the close of the NYSE. In order to minimize the potential for these differences, the VLOC monitors price movements following the close of trading in foreign stock markets through a series of country specific market proxies (such as baskets of American Depositary Receipts, futures contracts and exchange traded funds). These price movements are measured against established trigger thresholds for each specific market proxy to assist in determining if an event has occurred that may call into question the reliability of the values of the foreign securities held by the Funds. If such an event occurs, the securities may be valued using fair value procedures, which may include the use of independent pricing services.
When the last day of the reporting period is a non-business day, certain foreign markets may be open on those days that the NYSE is closed, which could result in differences between the value of the Funds’ portfolio securities on the last business day and the last calendar day of the reporting period. Any significant security valuation changes due to an open foreign market are adjusted and reflected by the Funds for financial reporting purposes.
b. Foreign Currency Translation
Portfolio securities and other assets and liabilities denominated in foreign currencies are translated into U.S. dollars based on the exchange rate of such currencies against U.S. dollars on the date of valuation. The Funds may enter into foreign currency exchange contracts to facilitate transactions denominated in a foreign currency. Purchases and sales of securities, income and expense items denominated in foreign currencies are translated into U.S. dollars at the exchange rate in effect on the transaction date. Portfolio securities and assets and liabilities denominated in foreign currencies contain risks that those currencies will decline in value relative to the U.S. dollar. Occasionally, events may impact the availability or reliability of foreign exchange rates used to convert the U.S. dollar equivalent value. If such an event occurs, the foreign exchange rate will be valued at fair value using procedures established and approved by the Board.
The Funds do not separately report the effect of changes in foreign exchange rates from changes in market prices on securities held. Such changes are included in net realized and unrealized gain or loss from investments in the Statements of Operations.
Realized foreign exchange gains or losses arise from sales of foreign currencies, currency gains or losses realized between the trade and settlement dates on securities transactions and the difference between the recorded amounts of dividends, interest, and foreign withholding taxes and the U.S. dollar equivalent of the amounts actually received or paid. Net unrealized foreign exchange gains and losses arise from changes in foreign exchange rates on foreign denominated assets and liabilities other than investments in securities held at the end of the reporting period.
c. Joint Repurchase Agreement
Certain or all Funds enter into a joint repurchase agreement whereby their uninvested cash balance is deposited into a joint cash account with other funds managed by the investment manager or an affiliate of the investment manager and is used to invest in one or more repurchase agreements. The value and face amount of the joint repurchase agreement are allocated to the funds based on their pro-rata interest. A repurchase agreement is accounted for as a loan by the Fund to the seller,
92 Semiannual Report
franklintempleton.com
FRANKLIN VALUE INVESTORS TRUST
NOTES TO FINANCIAL STATEMENTS (UNAUDITED)
collateralized by securities which are delivered to the Funds’ custodian. The fair value, including accrued interest, of the initial collateralization is required to be at least 102% of the dollar amount invested by the funds, with the value of the underlying securities marked to market daily to maintain coverage of at least 100%. Repurchase agreements are subject to the terms of Master Repurchase Agreements (MRAs) with approved counterparties (sellers). The MRAs contain various provisions, including but not limited to events of default and maintenance of collateral for repurchase agreements. In the event of default by either the seller or the Funds, certain MRAs may permit the non-defaulting party to net and close-out all transactions, if any, traded under such agreements. The Funds may sell securities they hold as collateral and apply the proceeds towards the repurchase price and any other amounts owed by the seller to the Funds in the event of default by the seller. This could involve costs or delays in addition to a loss on the securities if their value falls below the repurchase price owed by the seller. The joint repurchase agreement held by the Funds at period end, as indicated in the Statements of Investments, had been entered into on April 30, 2016.
d. Securities Lending
Certain or all Funds participate in an agency based securities lending program to earn additional income. The Fund receives cash collateral against the loaned securities in an amount equal to at least 102% of the fair value of the loaned securities. Collateral is maintained over the life of the loan in an amount not less than 100% of the fair value of loaned securities, as determined at the close of Fund business each day; any additional collateral required due to changes in security values is delivered to the Fund on the next business day. The collateral is deposited into a joint cash account with other funds and is used to invest in a money market fund managed by Franklin Advisers, Inc., an affiliate of the Funds, and/or a joint repurchase agreement. The Fund may receive income from the investment of cash collateral, in addition to lending fees and rebates paid by the borrower. Income from securities loaned is reported separately in the Statements of Operations. The Fund bears the market risk with respect to the collateral investment, securities loaned, and the risk that the agent may default on its obligations to the Fund. If the borrower defaults on its obligation to return the securities loaned, the Fund has the right to repurchase the securities in the open market using the collateral received. The securities lending agent has agreed to indemnify the Fund in the event of default by a third party borrower.
e. Income and Deferred Taxes
It is each Fund’s policy to qualify as a regulated investment company under the Internal Revenue Code. Each Fund intends to distribute to shareholders substantially all of its taxable income and net realized gains to relieve it from federal income and excise taxes. As a result, no provision for U.S. federal income taxes is required.
The Funds may be subject to foreign taxation related to income received, capital gains on the sale of securities and certain foreign currency transactions in the foreign jurisdictions in which the Funds invest. Foreign taxes, if any, are recorded based on the tax regulations and rates that exist in the foreign markets in which the Funds invest. When a capital gain tax is determined to apply, certain or all Funds record an estimated deferred tax liability in an amount that would be payable if the securities were disposed of on the valuation date. As a result of several court cases, in certain countries across the European Union, certain or all Funds filed additional tax reclaims for previously withheld taxes on dividends earned in those countries (EU reclaims). These additional filings are subject to various administrative proceedings by the local jurisdictions’ tax authorities within the European Union, as well as a number of related judicial proceedings. Income recognized, if any, for EU reclaims is reflected as other income in the Statements of Operations and any related receivable, if any, is reflected as European Union tax reclaims in the Statements of Assets and Liabilities. When uncertainty exists as to the ultimate resolution of these proceedings, the likelihood of receipt of these EU reclaims, and the potential timing of payment, no amounts are reflected in the financial statements.
Each Fund may recognize an income tax liability related to its uncertain tax positions under U.S. GAAP when the uncertain tax position has a less than 50% probability that it will be sustained upon examination by the tax authorities based on its technical merits. As of April 30, 2016, each Fund has determined that no tax liability is required in its financial statements related to uncertain tax positions for any open tax years (or expected to be taken in future tax years). Open tax years are those that remain subject to examination and are based on each tax jurisdiction’s statute of limitation.
franklintempleton.com
Semiannual Report 93
FRANKLIN VALUE INVESTORS TRUST
NOTES TO FINANCIAL STATEMENTS (UNAUDITED)
1. Organization and Significant Accounting
Policies (continued)
f. Security Transactions, Investment Income, Expenses and Distributions
Security transactions are accounted for on trade date. Realized gains and losses on security transactions are determined on a specific identification basis. Interest income and estimated expenses are accrued daily. Dividend income is recorded on the ex-dividend date except for certain dividends from foreign securities where the dividend rate is not available. In such cases, the dividend is recorded as soon as the information is received by the Funds. Distributions to shareholders are recorded on the ex-dividend date and are determined according to income tax regulations (tax basis). Distributable earnings determined on a tax basis may differ from earnings recorded in accordance with U.S. GAAP. These differences may be permanent or temporary. Permanent differences are reclassified among capital accounts to reflect their tax character. These reclassifications have no impact on net assets or the results of operations. Temporary differences are not reclassified, as they may reverse in subsequent periods.
Common expenses incurred by the Trust are allocated among the Funds based on the ratio of net assets of each Fund to the combined net assets of the Trust. Fund specific expenses are charged directly to the Fund that incurred the expense.
Realized and unrealized gains and losses and net investment income, not including class specific expenses, are allocated daily to each class of shares based upon the relative proportion of net assets of each class. Differences in per share distributions, by class, are generally due to differences in class specific expenses.
g. Accounting Estimates
The preparation of financial statements in accordance with U.S. GAAP requires management to make estimates and assumptions that affect the reported amounts of assets and liabilities at the date of the financial statements and the amounts of income and expenses during the reporting period. Actual results could differ from those estimates.
h. Guarantees and Indemnifications
Under the Trust’s organizational documents, its officers and trustees are indemnified by the Trust against certain liabilities arising out of the performance of their duties to the Trust. Additionally, in the normal course of business, the Trust, on behalf of the Funds, enters into contracts with service providers that contain general indemnification clauses. The Trust’s maximum exposure under these arrangements is unknown as this would involve future claims that may be made against the Trust that have not yet occurred. Currently, the Trust expects the risk of loss to be remote.
94 Semiannual Report
franklintempleton.com
FRANKLIN VALUE INVESTORS TRUST
NOTES TO FINANCIAL STATEMENTS (UNAUDITED)
2. Shares of Beneficial Interest
At April 30, 2016, there were an unlimited number of shares authorized ($0.01 par value). Transactions in the Funds’ shares were as follows:
| | | | | | | | | | | | |
| | Franklin Balance Sheet | | | | | | | |
| | Investment Fund | | Franklin Large Cap Value Fund | |
| | Shares | | | | Amount | | Shares | | | | Amount | |
| Class A Shares: | | | | | | | | | | | | |
| Six Months ended April 30, 2016 | | | | | | | | | | | | |
| Shares sold | 2,431,389 | | | $ | 82,414,664 | | 563,978 | | | $ | 8,865,152 | |
| Shares issued in reinvestment of distributions | 3,737,816 | | | 124,132,878 | | 787,582 | | | | 12,349,286 | |
| Shares redeemed | (4,379,782 | ) | | (152,043,208 | ) | (1,177,337 | ) | | (18,268,085 | ) |
| Net increase (decrease) | 1,789,423 | | | $ | 54,504,334 | | 174,223 | | | $ | 2,946,353 | |
| Year ended October 31, 2015 | | | | | | | | | | | | |
| Shares sold | 2,982,041 | | $ | 127,746,082 | | 1,528,813 | | $ | 28,241,217 | |
| Shares issued in reinvestment of distributions | 4,080,647 | | | 169,142,832 | | 156,111 | | | | 2,813,128 | |
| Shares redeemed | (7,922,471 | ) | | (336,345,492 | ) | (1,895,152 | ) | | (35,025,914 | ) |
| Net increase (decrease) | (859,783 | ) | | $ | (39,456,578 | ) | (210,228 | ) | | $ | (3,971,569 | ) |
| Class C Shares: | | | | | | | | | | | | |
| Six Months ended April 30, 2016 | | | | | | | | | | | | |
| Shares sold | 129,532 | | | $ | 4,251,638 | | 155,631 | | | $ | 2,450,331 | |
| Shares issued in reinvestment of distributions | 328,845 | | | | 10,562,502 | | 175,040 | | | | 2,725,377 | |
| Shares redeemed | (392,345 | ) | | | (12,829,395 | ) | (325,660 | ) | | | (5,041,728 | ) |
| Net increase (decrease) | 66,032 | | | $ | 1,984,745 | | 5,011 | | | $ | 133,980 | |
| Year ended October 31, 2015 | | | | | | | | | | | | |
| Shares sold | 190,088 | | | $ | 7,865,985 | | 513,908 | | | $ | 9,421,096 | |
| Shares issued in reinvestment of distributions | 350,650 | | | | 14,131,204 | | 26,467 | | | | 473,494 | |
| Shares redeemed | (567,025 | ) | | | (23,322,364 | ) | (550,438 | ) | | (10,029,515 | ) |
| Net increase (decrease) | (26,287 | ) | | $ | (1,325,175 | ) | (10,063 | ) | | $ | (134,925 | ) |
| Class R Shares: | | | | | | | | | | | | |
| Six Months ended April 30, 2016 | | | | | | | | | | | | |
| Shares sold | 19,138 | | | $ | 649,374 | | 33,141 | | | $ | 488,394 | |
| Shares issued in reinvestment of distributions | 43,057 | | | | 1,433,778 | | 23,662 | | | | 368,649 | |
| Shares redeemed | (43,958 | ) | | | (1,480,461 | ) | (42,578 | ) | | | (635,029 | ) |
| Net increase (decrease) | 18,237 | | | $ | 602,691 | | 14,225 | | | $ | 222,014 | |
| Year ended October 31, 2015 | | | | | | | | | | | | |
| Shares sold | 43,924 | | | $ | 1,888,602 | | 48,533 | | | $ | 884,334 | |
| Shares issued in reinvestment of distributions | 47,914 | | | | 1,990,332 | | 4,341 | | | | 77,744 | |
| Shares redeemed | (123,440 | ) | | | (5,362,738 | ) | (65,943 | ) | | | (1,217,099 | ) |
| Net increase (decrease) | (31,602 | ) | | $ | (1,483,804 | ) | (13,069 | ) | | $ | (255,021 | ) |
franklintempleton.com
Semiannual Report 95
| | | | | | | | | | | | | |
| FRANKLIN VALUE INVESTORS TRUST | | | | | | | | | | | | | |
| NOTES TO FINANCIAL STATEMENTS (UNAUDITED) | | | | | | | | | | | | | |
| |
| |
| |
| |
| 2. Shares of Beneficial Interest (continued) | | | | | | | | | | | | | |
| |
| | Franklin Balance Sheet | | | | | | | |
| | Investment Fund | | Franklin Large Cap Value Fund | |
| | Shares | | | | Amount | | Shares | | | | Amount | |
| Class R6 Shares: | | | | | | | | | | | | | |
| Six Months endedApril 30, 2016a | | | | | | | | | | | | | |
| Shares sold | 63,959 | | $ | | 2,202,767 | | 73,360 | | | $ | 1,141,394 | |
| Shares issued in reinvestment of distributions | 722 | | | | | 24,574 | | — | | | | — | |
| Shares redeemed | (50,524 | ) | | | (1,750,471 | ) | (506,761 | ) | | | (7,331,121 | ) |
| Net increase (decrease) | 14,157 | | $ | | | 476,870 | | (433,401 | ) | | $ | (6,189,727 | ) |
| Year ended October 31, 2015 | | | | | | | | | | | | | |
| Shares sold | 82,914 | | $ | | 3,565,508 | | 170,683 | | | $ | 3,154,787 | |
| Shares redeemed | (51,792 | ) | | | (2,249,444 | ) | (136,630 | ) | | | (2,522,632 | ) |
| Net increase (decrease) | 31,122 | | $ | | 1,316,064 | | 34,053 | | | $ | 632,155 | |
| Advisor Class Shares: | | | | | | | | | | | | | |
| Six Months ended April 30, 2016 | | | | | | | | | | | | | |
| Shares sold | 164,214 | | $ | | 5,989,833 | | 98,515 | | | $ | 1,448,615 | |
| Shares issued in reinvestment of distributions | 267,802 | | | | 9,137,398 | | 34,477 | | | | 537,489 | |
| Shares redeemed | (391,784 | ) | | | (14,844,254 | ) | (124,187 | ) | | | (1,798,874 | ) |
| Net increase (decrease) | 40,232 | | $ | | | 282,977 | | 8,805 | | | $ | 187,230 | |
| Year ended October 31, 2015 | | | | | | | | | | | | | |
| Shares sold | 962,485 | | $ | | 40,938,747 | | 71,923 | | | $ | 1,333,749 | |
| Shares issued in reinvestment of distributions | 382,991 | | | | 16,242,641 | | 7,482 | | | | 134,147 | |
| Shares redeemed | (1,845,642 | ) | | | (75,810,529 | ) | (59,609 | ) | | | (1,108,288 | ) |
| Net increase (decrease) | (500,166 | ) | $ | | (18,629,141 | ) | 19,796 | | | $ | 359,608 | |
| |
| |
| | Franklin MicroCap Value Fund | | Franklin MidCap Value Fund | |
| | Shares | | | | | Amount | | Shares | | | | Amount | |
| Class A Shares: | | | | | | | | | | | | | |
| Six Months ended April 30, 2016 | | | | | | | | | | | | | |
| Shares sold | 218,449 | | | | $ | 6,176,768 | | 1,052,320 | | $ | 14,260,399 | |
| Shares issued in reinvestment of distributions | 996,581 | | | | | 28,382,616 | | 789,108 | | | | 10,581,939 | |
| Shares redeemed | (992,993 | ) | | | | (29,279,912 | ) | (1,163,392 | ) | | | (15,674,749 | ) |
| Net increase (decrease) | 222,037 | | | | $ | 5,279,472 | | 678,036 | | | $ | 9,167,589 | |
| Year ended October 31, 2015 | | | | | | | | | | | | | |
| Shares sold | 324,987 | | | $ | 11,261,598 | | 1,884,426 | | $ | 29,749,760 | |
| Shares issued in reinvestment of distributions | 882,953 | | | | | 29,834,976 | | 214,510 | | | | 3,273,429 | |
| Shares redeemed | (2,058,848 | ) | | | | (70,982,565 | ) | (1,718,427 | ) | | | (26,890,221 | ) |
| Net increase (decrease) | (850,908 | ) | | $ | (29,885,991 | ) | 380,509 | | | $ | 6,132,968 | |
96 Semiannual Report
franklintempleton.com
FRANKLIN VALUE INVESTORS TRUST
NOTES TO FINANCIAL STATEMENTS (UNAUDITED)
| | | | | | | | | | |
| | Franklin MicroCap Value Fund | | Franklin MidCap Value Fund | |
| | Shares | | | Amount | | Shares | | | Amount | |
| Class C Shares: | | | | | | | | | | |
| Six Months ended April 30, 2016 | | | | | | | | | | |
| Shares sold | | | | | | 241,423 | | $ | 3,264,458 | |
| Shares issued in reinvestment of distributions | | | | | | 138,620 | | | 1,832,553 | |
| Shares redeemed | | | | | | (256,746 | ) | | (3,379,083 | ) |
| Net increase (decrease) | | | | | | 123,297 | | $ | 1,717,928 | |
| Year ended October 31, 2015 | | | | | | | | | | |
| Shares sold | | | | | | 406,918 | | $ | 6,357,539 | |
| Shares issued in reinvestment of distributions | | | | | | 29,826 | | | 450,366 | |
| Shares redeemed | | | | | | (386,023 | ) | | (5,954,504 | ) |
| Net increase (decrease) | | | | | | 50,721 | | $ | 853,401 | |
| Class R Shares: | | | | | | | | | | |
| Six Months ended April 30, 2016 | | | | | | | | | | |
| Shares sold | | | | | | 3,125 | | $ | 42,703 | |
| Shares issued in reinvestment of distributions | | | | | | 4,322 | | | 58,049 | |
| Shares redeemed | | | | | | (9,743 | ) | | (136,528 | ) |
| Net increase (decrease) | | | | | | (2,296 | ) | $ | (35,776 | ) |
| Year ended October 31, 2015 | | | | | | | | | | |
| Shares sold | | | | | | 9,507 | | $ | 151,491 | |
| Shares issued in reinvestment of distributions | | | | | | 1,451 | | | 22,138 | |
| Shares redeemed | | | | | | (29,779 | ) | | (474,374 | ) |
| Net increase (decrease) | | | | | | (18,821 | ) | $ | (300,745 | ) |
| Class R6 Shares: | | | | | | | | | | |
| Six Months ended April 30, 2016 | | | | | | | | | | |
| Shares sold | 103,564 | | $ | 2,985,189 | | | | | | |
| Shares issued in reinvestment of distributions | 950 | | | 27,259 | | | | | | |
| Shares redeemed | (49,511 | ) | | (1,481,955 | ) | | | | | |
| Net increase (decrease) | 55,003 | | $ | 1,530,493 | | | | | | |
| Year ended October 31, 2015 | | | | | | | | | | |
| Shares sold | 114,444 | | $ | 3,929,258 | | | | | | |
| Shares issued in reinvestment of distributions | 8,160 | | | 276,364 | | | | | | |
| Shares redeemed | (204,167 | ) | | (7,150,568 | ) | | | | | |
| Net increase (decrease) | (81,563 | ) | $ | (2,944,946 | ) | | | | | |
| Advisor Class Shares: | | | | | | | | | | |
| Six Months ended April 30, 2016 | | | | | | | | | | |
| Shares sold | 144,958 | | $ | 4,192,250 | | 26,257 | | $ | 384,086 | |
| Shares issued in reinvestment of distributions | 227,808 | | | 6,513,025 | | 27,118 | | | 365,015 | |
| Shares redeemed | (460,215 | ) | | (14,244,824 | ) | (42,036 | ) | | (595,118 | ) |
| Net increase (decrease) | (87,449 | ) | $ | (3,539,549 | ) | 11,339 | | $ | 153,983 | |
| Year ended October 31, 2015 | | | | | | | | | | |
| Shares sold | 801,057 | | $ | 27,290,882 | | 77,835 | | $ | 1,210,833 | |
| Shares issued in reinvestment of distributions | 218,953 | | | 7,405,000 | | 7,944 | | | 121,696 | |
| Shares redeemed | (1,226,178 | ) | | (42,253,411 | ) | (47,730 | ) | | (754,888 | ) |
| Net increase (decrease) | (206,168 | ) | $ | (7,557,529 | ) | 38,049 | | $ | 577,641 | |
franklintempleton.com
Semiannual Report 97
FRANKLIN VALUE INVESTORS TRUST
NOTES TO FINANCIAL STATEMENTS (UNAUDITED)
| | | | | | |
| 2. Shares of Beneficial Interest (continued) | | | | | | |
| |
| | Franklin Small Cap Value Fund | |
| | Shares | | | | Amount | |
| Class A Shares: | | | | | | |
| Six Months ended April 30, 2016 | | | | | | |
| Shares sold | 2,113,191 | | | $ | 99,464,669 | |
| Shares issued in reinvestment of distributions. | 2,182,073 | | | | 96,404,003 | |
| Shares issued on reorganization (Note 9) | 771,169 | | | | 32,670,477 | |
| Shares redeemed | (3,178,072 | ) | | | (143,130,271 | ) |
| Net increase (decrease) | 1,888,361 | | | $ | 85,408,878 | |
| Year ended October 31, 2015 | | | | | | |
| Shares sold | 3,824,195 | | $ | 204,728,167 | |
| Shares issued in reinvestment of distributions. | 2,025,011 | | | | 103,336,289 | |
| Shares redeemed | (7,267,182 | ) | | | (390,237,185 | ) |
| Net increase (decrease) | (1,417,976 | ) | | $ | (82,172,729 | ) |
| Class C Shares: | | | | | | |
| Six Months ended April 30, 2016 | | | | | | |
| Shares sold | 381,393 | | | $ | 16,203,706 | |
| Shares issued in reinvestment of distributions. | 535,257 | | | | 21,474,531 | |
| Shares issued on reorganization (Note 9) | 148,730 | | | | 5,709,810 | |
| Shares redeemed | (705,849 | ) | | | (29,172,580 | ) |
| Net increase (decrease) | 359,531 | | | $ | 14,215,467 | |
| Year ended October 31, 2015 | | | | | | |
| Shares sold | 670,073 | | | $ | 32,945,114 | |
| Shares issued in reinvestment of distributions. | 479,995 | | | | 22,502,184 | |
| Shares redeemed | (1,191,237 | ) | | | (58,229,326 | ) |
| Net increase (decrease) | (41,169 | ) | | $ | (2,782,028 | ) |
| Class R Shares: | | | | | | |
| Six Months ended April 30, 2016 | | | | | | |
| Shares sold | 467,609 | | | $ | 21,217,207 | |
| Shares issued in reinvestment of distributions. | 473,666 | | | | 20,737,082 | |
| Shares issued on reorganization (Note 9) | 1,308 | | | | 54,856 | |
| Shares redeemed | (871,235 | ) | | | (39,254,610 | ) |
| Net increase (decrease) | 71,348 | | | $ | 2,754,535 | |
| Year ended October 31, 2015 | | | | | | |
| Shares sold | 948,990 | | | $ | 50,222,888 | |
| Shares issued in reinvestment of distributions. | 450,281 | | | | 22,784,204 | |
| Shares redeemed | (1,873,284 | ) | | | (99,627,352 | ) |
| Net increase (decrease) | (474,013 | ) | | $ | (26,620,260 | ) |
98 Semiannual Report
franklintempleton.com
FRANKLIN VALUE INVESTORS TRUST
NOTES TO FINANCIAL STATEMENTS (UNAUDITED)
| | | | | | |
| | Franklin Small Cap Value Fund | |
| | Shares | | | | Amount | |
| Class R6 Shares: | | | | | | |
| Six Months ended April 30, 2016 | | | | | | |
| Shares sold | 327,826 | | | $ | 15,844,215 | |
| Shares issued in reinvestment of distributions. | 94,970 | | | | 4,353,446 | |
| Shares redeemed | (149,918 | ) | | | (7,176,867 | ) |
| Net increase (decrease) | 272,878 | | | $ | 13,020,794 | |
| Year ended October 31, 2015 | | | | | | |
| Shares sold | 1,056,050 | | | $ | 59,655,409 | |
| Shares issued in reinvestment of distributions. | 30,966 | | | | 1,634,378 | |
| Shares redeemed | (544,057 | ) | | | (29,423,818 | ) |
| Net increase (decrease) | 542,959 | | | $ | 31,865,969 | |
| Advisor Class Shares: | | | | | | |
| Six Months ended April 30, 2016 | | | | | | |
| Shares sold | 1,387,292 | | | $ | 64,689,453 | |
| Shares issued in reinvestment of distributions. | 1,240,446 | | | | 56,948,853 | |
| Shares issued on reorganization (Note 9) | 57,090 | | | | 2,515,323 | |
| Shares redeemed | (3,177,972 | ) | | | (147,978,199 | ) |
| Net increase (decrease) | (493,144 | ) | | $ | (23,824,570 | ) |
| Year ended October 31, 2015 | | | | | | |
| Shares sold | 3,869,868 | | $ | 215,282,871 | |
| Shares issued in reinvestment of distributions. | 1,276,090 | | | | 67,403,070 | |
| Shares redeemed | (6,686,035 | ) | | | (371,265,268 | ) |
| Net increase (decrease) | (1,540,077 | ) | | $ | (88,579,327 | ) |
aEffective March 1, 2016, all Class R6 shares of Franklin Large Cap Value Fund were fully redeemed. Subsequent to the redemption, Class R6 shares of the Fund were no
longer publicly offered.
3. Transactions with Affiliates
Franklin Resources, Inc. is the holding company for various subsidiaries that together are referred to as Franklin Templeton Investments. Certain officers and trustees of the Trust are also officers and/or directors of the following subsidiaries:
| |
| Subsidiary | Affiliation |
| Franklin Advisory Services, LLC (Advisory Services) | Investment manager |
| Franklin Templeton Services, LLC (FT Services) | Administrative manager |
| Franklin Templeton Distributors, Inc. (Distributors) | Principal underwriter |
| Franklin Templeton Investor Services, LLC (Investor Services) | Transfer agent |
franklintempleton.com
Semiannual Report 99
FRANKLIN VALUE INVESTORS TRUST
NOTES TO FINANCIAL STATEMENTS (UNAUDITED)
| 3. | Transactions with Affiliates (continued) |
| a. | Management Fees |
Franklin Balance Sheet Investment Fund pays an investment management fee to Advisory Services based on the average daily net assets of the fund as follows:
| | |
| Annualized Fee Rate | | Net Assets |
| 0.625 | % | Up to and including $100 million |
| 0.500 | % | Over $100 million, up to and including $250 million |
| 0.450 | % | Over $250 million, up to and including $7.5 billion |
| 0.440 | % | Over $7.5 billion, up to and including $10 billion |
| 0.430 | % | Over $10 billion, up to and including $12.5 billion |
| 0.420 | % | Over $12.5 billion, up to and including $15 billion |
| 0.400 | % | In excess of $15 billion |
Franklin Large Cap Value Fund pays an investment management fee to Advisory Services based on the average daily net assets of each of the funds as follows:
| | |
| Annualized Fee Rate | | Net Assets |
| 0.750 | % | Up to and including $500 million |
| 0.650 | % | Over $500 million, up to and including $1 billion |
| 0.600 | % | Over $1 billion, up to and including $1.5 billion |
| 0.550 | % | Over $1.5 billion, up to and including $6.5 billion |
| 0.525 | % | Over $6.5 billion, up to and including $11.5 billion |
| 0.500 | % | Over $11.5 billion, up to and including $16.5 billion |
| 0.490 | % | Over $16.5 billion, up to and including $19 billion |
| 0.480 | % | Over $19 billion, up to and including $21.5 billion |
| 0.470 | % | In excess of $21.5 billion |
|
| Franklin MicroCap Value Fund pays an investment management fee to Advisory Services of 0.75% per year of the average daily net |
| assets of the fund. |
| |
| Franklin MidCap Value Fund pays an investment management fee to Advisory Services based on the average daily net assets of the |
| fund as follows: |
| | |
| Annualized Fee Rate | | Net Assets |
| 0.950 | % | Up to and including $500 million |
| 0.850 | % | Over $500 million, up to and including $1 billion |
| 0.800 | % | Over $1 billion, up to and including $1.5 billion |
| 0.750 | % | Over $1.5 billion, up to and including $6.5 billion |
| 0.725 | % | Over $6.5 billion, up to and including $11.5 billion |
| 0.700 | % | Over $11.5 billion, up to and including $16.5 billion |
| 0.690 | % | Over $16.5 billion, up to and including $19 billion |
| 0.680 | % | Over $19 billion, up to and including $21.5 billion |
| 0.670 | % | In excess of $21.5 billion |
100 Semiannual Report
franklintempleton.com
FRANKLIN VALUE INVESTORS TRUST
NOTES TO FINANCIAL STATEMENTS (UNAUDITED)
Franklin Small Cap Value Fund pays an investment management fee to Advisory Services based on the average daily net assets of the fund as follows:
| | |
| Annualized Fee Rate | | Net Assets |
| 0.750 | % | Up to and including $500 million |
| 0.625 | % | Over $500 million, up to and including $1 billion |
| 0.500 | % | Over $1 billion, up to and including $5 billion |
| 0.490 | % | In excess of $5 billion |
For the period ended April 30, 2016, each Fund’s annualized effective investment management fee rate based on average daily net assets was as follows:
| | | | | | | | | | |
| | Franklin Balance | | Franklin Large | | | | | | Franklin Small | |
| | Sheet | | Cap | | Franklin MicroCap | | Franklin MidCap | | Cap | |
| | Investment Fund | | Value Fund | | Value Fund | | Value Fund | | Value Fund | |
| |
| | 0.476 | % | 0.750 | % | 0.750 | % | 0.950 | % | 0.592 | % |
| |
| b. | Administrative Fees | | | | | | | | | |
Under an agreement with Advisory Services, FT Services provides administrative services to the Funds. The fee is paid by Advisory Services based on the Funds’ average daily net assets, and is not an additional expense of the Funds.
c. Distribution Fees
The Board has adopted distribution plans for each share class, with the exception of Class R6 and Advisor Class shares, pursuant to Rule 12b-1 under the 1940 Act. Under the Funds’ Class A reimbursement distribution plan, the Funds reimburse Distributors for costs incurred in connection with the servicing, sale and distribution of each Fund’s shares up to the maximum annual plan rate. Under the Class A reimbursement distribution plans, costs exceeding the maximum for the current plan year cannot be reimbursed in subsequent periods. In addition, under the Funds’ Class C and R compensation distribution plans, the Funds pay Distributors for costs incurred in connection with the servicing, sale and distribution of each Fund’s shares up to the maximum annual plan rate for each class. The plan year, for purposes of monitoring compliance with the maximum annual plan rates, is February 1 through January 31 for each Fund.
The maximum annual plan rates, based on the average daily net assets, for each class, are as follows:
| | | | | | | | | | |
| | Franklin Balance Sheet | | Franklin Large Cap | | Franklin MicroCap | | Franklin MidCap | | Franklin Small Cap | |
| | Investment Fund | | Value Fund | | Value Fund | | Value Fund | | Value Fund | |
| |
| Reimbursement | | | | | | | | | | |
| Plans: | | | | | | | | | | |
| Class A | 0.25 | % | 0.35 | % | 0.25 | % | 0.35 | % | 0.35 | % |
| Compensation Plans: | | | | | | | | | | |
| Class C | 1.00 | % | 1.00 | % | — | | 1.00 | % | 1.00 | % |
| Class R | 0.50 | % | 0.50 | % | — | | 0.50 | % | 0.50 | % |
For Franklin Large Cap Value Fund, Franklin MidCap Value Fund, and Franklin Small Cap Value Fund, the Board has set the current rate at 0.25% per year for Class A shares, effective August 1, 2015, until further notice and approval by the Board. Prior to August 1, 2015, the Board had set the rate at 0.30% per year for Class A shares.
franklintempleton.com
Semiannual Report 101
FRANKLIN VALUE INVESTORS TRUST
NOTES TO FINANCIAL STATEMENTS (UNAUDITED)
| 3. | Transactions with Affiliates (continued) |
| d. | Sales Charges/Underwriting Agreements |
Front-end sales charges and contingent deferred sales charges (CDSC) do not represent expenses of the Funds. These charges are deducted from the proceeds of sales of fund shares prior to investment or from redemption proceeds prior to remittance, as applicable. Distributors has advised the Funds of the following commission transactions related to the sales and redemptions of the Funds’ shares for the period:
| | | | | | | | | | |
| | | Franklin Balance Sheet | | Franklin Large Cap | | Franklin MicroCap | | Franklin MidCap | | Franklin Small Cap |
| | | Investment Fund | | Value Fund | | Value Fund | | Value Fund | | Value Fund |
| |
| Sales charges | | | | | | | | | | |
| retained net of | | | | | | | | | | |
| commissions paid to | | | | | | | | | | |
| unaffiliated | | | | | | | | | | |
| brokers/dealers | $ | 124,989 | $ | 20,480 | $ | 5,940 | $ | 37,180 | $ | 166,336 |
| CDSC retained | $ | 3,624 | $ | 2,527 | $ | 21 | $ | 1,603 | $ | 9,521 |
e. Transfer Agent Fees
Each class of shares, except for Class R6, pays transfer agent fees to Investor Services for its performance of shareholder servicing obligations and reimburses Investor Services for out of pocket expenses incurred, including shareholder servicing fees paid to third parties. These fees are allocated daily based upon their relative proportion of such classes’ aggregate net assets. Class R6 pays Investor Services transfer agent fees specific to that class.
For the period ended April 30, 2016, the Funds paid transfer agent fees as noted in the Statements of Operations of which the following amounts were retained by Investor Services:
| | | | | | | | | | |
| | | Franklin Balance Sheet | | Franklin Large Cap | | Franklin MicroCap | | Franklin MidCap | | Franklin Small Cap |
| | | Investment Fund | | Value Fund | | Value Fund | | Value Fund | | Value Fund |
| |
| Transfer agent fees | $ | 382,703 | $ | 96,868 | $ | 87,325 | $ | 87,547 | $ | 1,048,951 |
f. Investments in Affiliated Management Investment Companies
Certain or all Funds invest in an affiliated management investment company for purposes other than exercising a controlling influence over the management or policies. Management fees paid by the Funds are waived on assets invested in the affiliated management investment company, as noted in the Statements of Operations, in an amount not to exceed the management and administrative fees paid directly or indirectly by each affiliate. Prior to November 1, 2013, the waiver was accounted for as a reduction to management fees.
| | | | | | | | | | | | | |
| | | | | | | | | | | | | % of | |
| | | | | | | | | | | | | Affiliated | |
| | Number of | | | | Number of | | | | | | | Fund Shares | |
| | Shares Held | | | | Shares | | Value | | | | | Outstanding | |
| | at Beginning | Gross | Gross | | Held at End | | at End | | Investment | | Realized | Held at End | |
| | of Period | Additions | Reductions | | of Period | | of Period | | Income | | Gain (Loss) | of Period | |
| |
| Franklin Balance Sheet Investment Fund | | | | | | | | | | | | |
| Non-Controlled Affiliates | | | | | | | | | | | | | |
| Institutional Fiduciary Trust Money | | | | | | | | | | | | | |
| Market Portfolio | 102,695,280 | 134,964,560 | (146,441,388 | ) | 91,218,452 | $ | 91,218,452 | $ | — | $ | — | 0.46 | % |
| |
| Franklin Large Cap Value Fund | | | | | | | | | | | | | |
| Non-Controlled Affiliates | | | | | | | | | | | | | |
| Institutional Fiduciary Trust Money | | | | | | | | | | | | | |
| Market Portfolio | 7,732,885 | 31,134,565 | (27,577,284 | ) | 11,290,166 | $ | 11,290,166 | $ | — | $ | — | 0.06 | % |
102 Semiannual Report
franklintempleton.com
| | | | | | | | | | | | | |
| | | | | | | | FRANKLIN VALUE INVESTORS TRUST | |
| | | | NOTES TO FINANCIAL STATEMENTS (UNAUDITED) | |
| |
| |
| |
| |
| | | | | | | | | | | | | % of | |
| | | | | | | | | | | | | Affiliated | |
| | Number of | | | | Number of | | | | | | | Fund Shares | |
| | Shares Held | | | | Shares | | Value | | | | | Outstanding | |
| | at Beginning | Gross | Gross | | Held at End | | at End | Investment | Realized | Held at End | |
| | of Period | Additions | Reductions | | of Period | | of Period | Income | Gain (Loss) | of Period | |
| Franklin MicroCap Value Fund | | | | | | | | | | | | | |
| Non-Controlled Affiliates | | | | | | | | | | | | | |
| Institutional Fiduciary Trust Money | | | | | | | | | | | | | |
| Market Portfolio | 16,116,739 | 32,911,446 | (38,648,953 | ) | 10,379,232 | $ | 10,379,232 | $ | — | $ | — | 0.05 | % |
| Franklin MidCap Value Fund | | | | | | | | | | | | | |
| Non-Controlled Affiliates | | | | | | | | | | | | | |
| Institutional Fiduciary Trust Money | | | | | | | | | | | | | |
| Market Portfolio | 2,941,745 | 26,621,546 | (27,264,253 | ) | 2,299,038 | $ | 2,299,038 | $ | — | $ | — | 0.01 | % |
| Franklin Small Cap Value Fund | | | | | | | | | | | | | |
| Non-Controlled Affiliates | | | | | | | | | | | | | |
| Institutional Fiduciary Trust Money | | | | | | | | | | | | | |
| Market Portfolio | 156,137,127 | 273,580,489 | (298,224,423 | ) | 131,493,193 | $ | 131,493,193 | $ | — | $ | — | 0.66 | % |
| |
| g. Waiver and Expense Reimbursements | | | | | | | | | | | | |
Advisory Services has contractually agreed in advance to waive or limit its fees and to assume as its own expense certain expenses otherwise payable by Franklin MidCap Value Fund so that the expenses (excluding distribution fees and acquired fund fees and expenses) for Class A, Class C, Class R and Advisor Class of the fund does not exceed 1.05% (other than certain non-routine expenses or costs, including those relating to litigation, indemnification, reorganizations, and liquidations) until February 28, 2017.
Additionally, Investor Services has contractually agreed in advance to waive or limit its fees so that the Class R6 transfer agent fees do not exceed 0.01% until February 28, 2017. For Franklin Balance Sheet Investment Fund, Franklin Large Cap Value Fund and Franklin MicroCap Value Fund, there were no Class R6 transfer agent fees waived during the period ended April 30, 2016.
4. Expense Offset Arrangement
The Funds have entered into an arrangement with their custodian whereby credits realized as a result of uninvested cash balances are used to reduce a portion of the Funds’ custodian expenses. During the period ended April 30, 2016, the custodian fees were reduced as noted in the Statements of Operations.
5. Income Taxes
For tax purposes, the Funds may elect to defer any portion of a late-year ordinary loss to the first day of the following fiscal year. At October 31, 2015, Franklin MicroCap Value Fund deferred late-year ordinary losses of $316,437.
At April 30, 2016, the cost of investments and net unrealized appreciation (depreciation), for income tax purposes were as follows:
| | | | | | | | | |
| | | Franklin Balance Sheet | | | Franklin Large Cap | | | Franklin MicroCap | |
| | | Investment Fund | | | Value Fund | | | Value Fund | |
| Cost of investments | $ | 831,693,715 | | $ | 134,927,276 | | $ | 234,454,343 | |
| |
| Unrealized appreciation | $ | 253,383,548 | | $ | 49,124,944 | | $ | 128,377,067 | |
| Unrealized depreciation | | (91,809,997 | ) | | (6,818,613 | ) | | (37,170,959 | ) |
| Net unrealized appreciation (depreciation) | $ | 161,573,551 | | $ | 42,306,331 | | $ | 91,206,108 | |
franklintempleton.com
Semiannual Report 103
FRANKLIN VALUE INVESTORS TRUST
NOTES TO FINANCIAL STATEMENTS (UNAUDITED)
| | | | | | |
| 5. Income Taxes (continued) | | | | | | |
| |
| | | Franklin MidCap | | | Franklin Small Cap | |
| | | Value Fund | | | Value Fund | |
| Cost of investments | $ | 139,087,349 | | $ | 1,795,312,009 | |
| |
| Unrealized appreciation. | $ | 25,261,877 | | $ | 488,153,848 | |
| Unrealized depreciation. | | (9,443,278 | ) | | (139,120,399 | ) |
| Net unrealized appreciation (depreciation) | $ | 15,818,599 | | $ | 349,033,449 | |
Differences between income and/or capital gains as determined on a book basis and a tax basis are primarily due to differing treatments of pass-through entity income, corporate actions and wash sales.
6. Investment Transactions
Purchases and sales of investments (excluding short term securities) for the period ended April 30, 2016, were as follows:
| | | | | | | | | | |
| | | Franklin Balance Sheet | | Franklin Large Cap | | Franklin MicroCap | | Franklin MidCap | | Franklin Small Cap |
| | | Investment Fund | | Value Fund | | Value Fund | | Value Fund | | Value Fund |
| Purchases | $ | 108,116,169 | $ | 17,642,590 | $ | 15,262,298 | $ | 47,798,442 | $ | 342,594,770 |
| Sales | $ | 179,834,586 | $ | 41,130,495 | $ | 44,781,996 | $ | 48,825,179 | $ | 485,349,590 |
At April 30, 2016, in connection with securities lending transactions, certain or all Funds loaned investments and received cash collateral as follows:
| | |
| | | Franklin Small Cap |
| | | Value Fund |
| Securities lending transactionsa,b: | | |
| Equity investments | $ | 8,941,466 |
aThe agreements open at period end can be terminated at any time.
aGross amount of recognized liabilities for securities lending transactions is included in payable upon return of securities loaned in the Statements of Assets and Liabilities.
7. Restricted Securities
Certain or all Funds invest in securities that are restricted under the Securities Act of 1933 (1933 Act) or which are subject to legal, contractual, or other agreed upon restrictions on resale. Restricted securities are often purchased in private placement transactions, and cannot be sold without prior registration unless the sale is pursuant to an exemption under the 1933 Act. Disposal of these securities may require greater effort and expense, and prompt sale at an acceptable price may be difficult. The Funds may have registration rights for restricted securities. The issuer generally incurs all registration costs.
At April 30, 2016, Franklin MicroCap Value Fund held investments in restricted securities, excluding certain securities exempt from registration under the 1933 Act deemed to be liquid, as follows:
| | | | | | |
| | | Acquisition | | | | |
| Shares | Issuer | Dates | | Cost | | Value |
| 94,800 | Allen Organ Co. (LandCo. Holdings) | 9/07/06 | $ | 181,146 | $ | 303,104 |
| 44,600 | Smith Investment Co. LLC | 1/20/09 | | — | | 32,692 |
| | Total Restricted Securities (Value is 0.10% of Net Assets) | | $ | 181,146 | $ | 335,796 |
104 Semiannual Report
franklintempleton.com
FRANKLIN VALUE INVESTORS TRUST
NOTES TO FINANCIAL STATEMENTS (UNAUDITED)
8. Holdings of 5% Voting Securities of Portfolio Companies
The 1940 Act defines "affiliated companies" to include investments in portfolio companies in which a fund owns 5% or more of the outstanding voting securities. Investments in "affiliated companies" for Franklin Balance Sheet Investment Fund, Franklin MicroCap Value Fund and Franklin Small Cap Value Fund for the period ended April 30, 2016, were as shown below.
| | | | | | | | | | | |
| | Number of | | | | Number of | | | | | | Realized |
| | Shares Held | | | | Shares | | Value at | | | | Capital |
| | at Beginning | Gross | Gross | | Held at End | | End of | | Investment | | Gain |
| Name of Issuer | of Period | Additions | Reductions | | of Period | | Period | | Income | | (Loss) |
| Franklin Balance Sheet Investment Fund | | | | | | | | | | |
| Non-Controlled Affiliates | | | | | | | | | | | |
| Ruby Tuesday Inc | 3,089,000 | — | — | | 3,089,000 | $ | 13,591,600 | $ | — | $ | — |
| Trinity Place Holdings Inc | 1,200,000 | 298,034 | — | | 1,498,034 | | 11,130,393 | | — | | — |
| Total Affiliated Securities (Value is 2.51% of Net Assets) | | | | $ | 24,721,993 | $ | — | $ | — |
| Franklin MicroCap Value Fund | | | | | | | | | | | |
| Non-Controlled Affiliates | | | | | | | | | | | |
| ACMAT Corp., A | 235,600 | — | — | | 235,600 | $ | 4,386,872 | $ | — | $ | — |
| Continental Materials Corp | 129,700 | — | — | | 129,700 | | 1,849,522 | | — | | — |
| Delta Apparel Inc | 640,000 | — | (78,400 | ) | 561,600 | | 11,372,400 | | — | | 1,081,519 |
| Full House Resorts Inc | 1,600,000 | — | — | | 1,600,000 | | 2,592,000 | | — | | — |
| Hardinge Inc | 934,900 | — | (113,000 | ) | 821,900 | | 10,684,700 | | 36,916 | | 168,481 |
| Hurco Cos. Inc | 365,000 | — | (25,000 | ) | 340,000 | | 11,009,200 | | 61,330 | | 286,373 |
| Northeast Bancorp | 459,500 | — | — | | 459,500 | | 5,169,375 | | 9,190 | | — |
| Origen Financial Inc | 1,900,000 | — | — | | 1,900,000 | | 273,600 | | — | | — |
| Total Affiliated Securities (Value is 14.53% of Net Assets) | | | | $ | 47,337,669 | $ | 107,436 | $ | 1,536,373 |
| Franklin Small Cap Value Fund | | | | | | | | | | | |
| Non-Controlled Affiliates | | | | | | | | | | | |
| AAR Corp | 2,063,800 | 110,207 | — | | 2,174,007 | $ | 52,263,128 | $ | 318,323 | $ | — |
| Hooker Furniture Corp | 582,900 | — | (172,000 | ) | 410,900 | | —a | | 116,580 | | 1,184,605 |
| Total Affiliated Securities (Value is 2.47% of Net Assets) | | | | $ | 52,263,128 | $ | 434,903 | $ | 1,184,605 |
| |
| aAs of April 30, 2016, no longer an affiliate. | | | | | | | | | | | |
9. Reorganization
On April 1, 2016, Franklin Small Cap Value Fund (Surviving Fund), pursuant to a plan of reorganization approved on March 11, 2016 by shareholders of Franklin All Cap Value Fund (Acquired Fund), acquired 100% of the Acquired Fund’s net assets, primarily made up of investment securities, which included $4,489,865 of unrealized appreciation (depreciation), through a tax-free exchange of 978,296 shares of the Surviving Fund (Valued at $40,950,466). Immediately after the completion of the reorganization, the combined net assets of the Surviving Fund were $2,113,985,094.
The primary purpose for the reorganization was to combine the Acquired Fund with a larger fund that has generally similar goals and investment policies. The estimated cost of the reorganization was $122,000 of which the Surviving Fund and the Acquired Fund each paid 25% and Advisory Services paid 50%. The allocated portion of the Surviving Fund’s reorganization expenses are included with other expenses in the Statements of Operations.
franklintempleton.com
Semiannual Report 105
FRANKLIN VALUE INVESTORS TRUST
NOTES TO FINANCIAL STATEMENTS (UNAUDITED)
9. Reorganization (continued)
Assuming the reorganization had been completed on November 1, 2015, the Surviving Fund’s pro forma results of operations would have been as follows:
| | | | | | |
| | | | | | | Net Increase |
| | | | | Net Realized and | | (Decrease) |
| | | | | Unrealized Gain | | in Net Assets from |
| Period | | Net Investment Income | | (Loss) | | Operations |
| |
| For the period November 1, 2015, through April 30, 2016 | $ | 5,366,243 | $ | 30,974,053 | $ | 36,340,296 |
Subsequent to the reorganization, the Surviving Fund has been managed as a single entity. Accordingly, it is impracticable to identify the amount of net investment income attributable to the Acquired Fund’s assets after the completion of the reorganization.
10. Credit Facility
Certain or all Funds, together with other U.S. registered and foreign investment funds (collectively, Borrowers), managed by Franklin Templeton Investments, are borrowers in a joint syndicated senior unsecured credit facility totaling $2 billion (Global Credit Facility) which matures on February 10, 2017. This Global Credit Facility provides a source of funds to the Borrowers for temporary and emergency purposes, including the ability to meet future unanticipated or unusually large redemption requests.
Under the terms of the Global Credit Facility, the Funds shall, in addition to interest charged on any borrowings made by the Funds and other costs incurred by the Funds, pay their share of fees and expenses incurred in connection with the implementation and maintenance of the Global Credit Facility, based upon their relative share of the aggregate net assets of all of the Borrowers, including an annual commitment fee of 0.07% based upon the unused portion of the Global Credit Facility. Effective February 12, 2016, the annual commitment fee is 0.15%. These fees are reflected in other expenses in the Statements of Operations. During the period ended April 30, 2016, the Funds did not use the Global Credit Facility.
11. Fair Value Measurements
The Funds follow a fair value hierarchy that distinguishes between market data obtained from independent sources (observable inputs) and the Funds’ own market assumptions (unobservable inputs). These inputs are used in determining the value of the Funds’ financial instruments and are summarized in the following fair value hierarchy:
- Level 1 – quoted prices in active markets for identical financial instruments
- Level 2 – other significant observable inputs (including quoted prices for similar financial instruments, interest rates, prepayment speed, credit risk, etc.)
- Level 3 – significant unobservable inputs (including the Funds’ own assumptions in determining the fair value of financial instruments)
The input levels are not necessarily an indication of the risk or liquidity associated with financial instruments at that level.
For movements between the levels within the fair value hierarchy, the Funds have adopted a policy of recognizing the transfers as of the date of the underlying event which caused the movement.
106 Semiannual Report
franklintempleton.com
FRANKLIN VALUE INVESTORS TRUST
NOTES TO FINANCIAL STATEMENTS (UNAUDITED)
A summary of inputs used as of April 30, 2016, in valuing the Funds’ assets carried at fair value, is as follows:
| | | | | | | | |
| | | Level 1 | | Level 2 | | Level 3 | | Total |
| Franklin Balance Sheet Investment Fund | | | | | | | | |
| Assets: | | | | | | | | |
| Investments in Securities: | | | | | | | | |
| Equity Investments:a | | | | | | | | |
| Telecommunication Services | $ | 27,880,976 | $ | 6,015,000 | $ | — | $ | 33,895,976 |
| All Other Equity Investmentsb | | 866,946,195 | | — | | — | | 866,946,195 |
| Escrows and Litigation Trusts | | — | | — | | 1,206,643 | | 1,206,643 |
| Short Term Investments | | 91,218,452 | | — | | — | | 91,218,452 |
| Total Investments in Securities | $ | 986,045,623 | $ | 6,015,000 | $ | 1,206,643 | $ | 993,267,266 |
| |
| Franklin Large Cap Value Fund | | | | | | | | |
| Assets: | | | | | | | | |
| Investments in Securities: | | | | | | | | |
| Equity Investmentsb | $ | 165,943,440 | $ | — | $ | — | $ | 165,943,440 |
| Short Term Investments | | 11,290,167 | | — | | — | | 11,290,167 |
| Total Investments in Securities | $ | 177,233,607 | $ | — | $ | — | $ | 177,233,607 |
| |
| Franklin MicroCap Value Fund | | | | | | | | |
| Assets: | | | | | | | | |
| Investments in Securities: | | | | | | | | |
| Equity Investments: | | | | | | | | |
| Industrial Conglomerates | $ | — | $ | — | $ | 32,692 | $ | 32,692 |
| Real Estate | | 5,007,100 | | 108,650 | | 303,104 | | 5,418,854 |
| Trading Companies & Distributors | | 438,600 | | 2,847,600 | | — | | 3,286,200 |
| All Other Equity Investmentsb | | 306,543,473 | | — | | — | | 306,543,473 |
| Short Term Investments | | 10,379,232 | | — | | — | | 10,379,232 |
| Total Investments in Securities | $ | 322,368,405 | $ | 2,956,250 | $ | 335,796 | $ | 325,660,451 |
| |
| Franklin MidCap Value Fund | | | | | | | | |
| Assets: | | | | | | | | |
| Investments in Securities: | | | | | | | | |
| Equity Investmentsb | $ | 152,606,910 | $ | — | $ | — | $ | 152,606,910 |
| Short Term Investments | | 2,299,038 | | — | | — | | 2,299,038 |
| Total Investments in Securities | $ | 154,905,948 | $ | — | $ | — | $ | 154,905,948 |
| |
| Franklin Small Cap Value Fund | | | | | | | | |
| Assets: | | | | | | | | |
| Investments in Securities: | | | | | | | | |
| Equity Investmentsb | $ | 1,999,197,854 | $ | — | $ | — | $ | 1,999,197,854 |
| Corporate Bonds | | — | | 11,865,945 | | — | | 11,865,945 |
| Short Term Investments | | 131,493,193 | | 1,788,466 | | — | | 133,281,659 |
| Total Investments in Securities | $ | 2,130,691,047 | $ | 13,654,411 | $ | — | $ | 2,144,345,458 |
aIncludes common and convertible preferred stocks as well as other equity investments.
bFor detailed categories, see the accompanying Statement of Investments.
A reconciliation of assets in which Level 3 inputs are used in determining fair value is presented when there are significant Level 3 financial instruments at the end of the period.
franklintempleton.com
Semiannual Report 107
FRANKLIN VALUE INVESTORS TRUST
NOTES TO FINANCIAL STATEMENTS (UNAUDITED)
12. Subsequent Events
The Funds have evaluated subsequent events through the issuance of the financial statements and determined that no events have occurred that require disclosure except for the following:
On May 20, 2016, Franklin Rising Dividends Fund (Acquiring Fund), pursuant to an agreement and Plan of Reorganization approved on April 29, 2016 by shareholders of Franklin Large Cap Value Fund (Target), acquired 100% of the Target’s net assets, primarily made up of investment securities, through a tax-free exchange of shares of the Acquiring Fund for the net assets of the Target. Capital losses obtained by the Acquiring Fund may be carried over to offset future capital gains subject to limitations.
| |
| Abbreviations |
| Selected Portfolio |
| ADR | American Depositary Receipt |
| ETF | Exchange Traded Fund |
108 Semiannual Report
franklintempleton.com
FRANKLIN VALUE INVESTORS TRUST
Shareholder Information
Board Review of Investment Management Agreement
At a meeting held February 23, 2016, the Board of Trustees (Board), including a majority of trustees that are not “interested persons” as such term is defined in section 2(a)(19) of the Investment Company Act of 1940 (hereinafter referred to as “non-interested Trustees” or “independent Trustees”), approved renewal of the investment management agreement for each of the Funds within the Trust (Fund(s)). In reaching this decision, the Board took into account information furnished throughout the year at regular Board meetings, as well as information prepared specifically in connection with the annual renewal review process. Information furnished and discussed throughout the year included investment performance reports and related financial information for each Fund, along with periodic reports on expenses, shareholder services, legal and compliance matters, risk control, pricing, brokerage commissions and execution, and other services provided by the Investment Manager (Manager) and its affiliates, as well as marketing support payments made to financial intermediaries. Information furnished specifically in connection with the renewal process included a report for each Fund prepared by Broadridge Financial Solutions, Inc. (Broadridge), an independent organization, as well as additional material, including a Fund profitability analysis prepared by management. The Broadridge reports, which utilize data from Lipper Inc. (Lipper), compared each Fund’s investment performance and expenses with those of other mutual funds deemed comparable to the Fund as selected by Lipper. The Fund profitability analysis discussed the profitability to Franklin Templeton Investments (FTI) from its overall U.S. fund operations, as well as on an individual fund-by-fund basis. Additional material accompanying such profitability analysis included information on a fund-by-fund basis listing portfolio managers and other accounts they manage, as well as information on management fees charged by the Manager and its affiliates to U.S. funds and other accounts, including management’s explanation of differences where relevant. Such material also included a memorandum prepared by management describing project initiatives and capital investments relating to the services provided to the Funds by the FTI organization, as well as a memorandum relating to economies of scale and an analysis concerning transfer agent fees charged by an affiliate of the Manager. The Board also noted that they received an annual report on all marketing support payments made by FTI to financial intermediaries, as well as a memorandum relating to third-party servicing arrangements in response to a Guidance Update from the U.S. Securities and Exchange Commission (SEC) relating to mutual fund distribution and sub accounting fees.
In considering such materials, the independent Trustees received assistance and advice from and met separately with independent counsel. While the investment management agreements for all Funds were considered at the same Board meeting, the Board dealt with each Fund separately. In approving continuance of the investment management agreement for each Fund, the Board, including a majority of independent Trustees, determined that the existing management fee structure was fair and reasonable and that continuance of the investment management agreement was in the best interests of such Fund and its shareholders. While attention was given to all information furnished, the following discusses some primary factors relevant to the Board’s decision.
NATURE, EXTENT AND QUALITY OF SERVICES. The Board was satisfied with the nature and quality of the overall services provided by the Manager and its affiliates to the Funds and their shareholders, other than as noted below with respect to performance. The Board’s opinion was based, in part, upon periodic reports furnished it showing that the investment policies and restrictions for each Fund were consistently complied with as well as other reports periodically furnished the Board covering matters such as the compliance of portfolio managers and other management personnel with the code of ethics adopted throughout the Franklin Templeton fund complex, the adherence to fair value pricing procedures established by the Board, and the accuracy of net asset value calculations. The Board also noted the extent of benefits provided Fund shareholders from being part of the Franklin Templeton family of funds, including the right to exchange investments between the same class of shares of different funds without a sales charge, the ability to reinvest Fund dividends into other funds and the right to combine holdings in other funds to obtain a reduced sales charge. Favorable consideration was given to management’s continual efforts and expenditures in establishing effective business continuity plans and developing strategies to address cybersecurity threats. Among other factors taken into account by the Board were the Manager’s best execution trading policies, including a favorable report on the efficiency of its trading operations by an
franklintempleton.com
Semiannual Report 109
FRANKLIN VALUE INVESTORS TRUST
SHAREHOLDER INFORMATION
independent portfolio trading analytical firm, which also covered foreign exchange transactions. Consideration was also given to the experience of each Fund’s portfolio management team, the number of accounts managed and general method of compensation. In this latter respect, the Board noted that a primary factor in management’s determination of a portfolio manager’s bonus compensation was the relative investment performance of the funds he or she managed and that a portion of such bonus was required to be invested in a pre-designated list of funds within such person’s fund management area so as to be aligned with the interests of shareholders. In this respect, the Board, after making inquiries of management, received assurances that bonus composition was not unduly influenced by one-year or short-term performance but was based primarily on longer periods consistent with the interests of long-term shareholders. The Board also took into account the cost and quality of transfer agent and shareholder services provided Fund shareholders by an affiliate of the Manager, and steps taken by FTI to enhance analytical support to the investment management groups and provide additional oversight of liquidity risk and complex securities. It was noted that the Funds did not currently invest in derivatives or other complex instruments. The Board also took into account, among other things, management’s efforts in establishing a global credit facility for the benefit of the Funds and other accounts managed by FTI to provide a source of cash for temporary and emergency purposes or to meet unusual redemption requests as well as the strong financial position of the Manager’s parent company and its commitment to the mutual fund business as evidenced by its continued introduction of new funds and reassessment of the fund offerings in response to the market environment.
INVESTMENT PERFORMANCE. The Board placed significant emphasis on the investment performance of each Fund in view of its importance to shareholders. While consideration was given to performance reports and discussions with the portfolio management team at Board meetings throughout the year, particular attention in assessing performance was given to the Broadridge reports furnished for the agreement renewals. The Broadridge reports prepared for each individual Fund showed the investment performance of its Class A shares in comparison to a performance universe selected by Lipper. Comparative performance for each Fund was shown for 2015 and for the previous 10 years ended December 31, 2015, for those Funds that had been in existence for such length of time and for lesser periods for other Funds depending on when their operations commenced. The following summarizes the performance results for each of the Funds.
Franklin All Cap Value Fund - The performance universe for this Fund consisted of the Fund and all retail and institutional multi-cap value funds. The Broadridge report showed the performance of the Fund to be in the lowest performing quintile of such universe during 2015, and on an annualized basis to be in the lowest performing quintile of such universe for the previous three- and five-year periods. Management explained the factors affecting performance this year and noted their proposal, which was approved by the Board in October 2015, to reorganize the Fund into Franklin Small Cap Value Fund, effective on or about April 1, 2016. In view of this pending reorganization, the Board did not believe that further action was warranted.
Franklin Balance Sheet Investment Fund - The performance universe for this Fund consisted of the Fund and all retail and institutional mid-cap value funds as selected by Lipper. The Broadridge report showed the Fund’s total return during 2015 to be in the lowest performing quintile of its performance universe, and on an annualized basis to be in the lowest performing quintile of such universe for the previous three-, five- and 10-year periods. In discussing such performance, management pointed out that the Fund’s performance reflected adherence to its stated investment policy of investing in companies having low price-to-book ratios with strong balance sheets, which have been out of favor during the past five years but which appear, in management’s opinion to warrant continued investment. Management noted that investment in the energy sector was a large factor in the Fund’s relative underperformance and that, over time that exposure had been reduced. Management explained that it had been focused on the
110 Semiannual Report
franklintempleton.com
FRANKLIN VALUE INVESTORS TRUST
SHAREHOLDER INFORMATION
investment process with the goal of delivering improved returns. While not satisfied with the Fund’s relative performance as set forth in the Broadridge report, the Board accepted management’s explanation and noted that the Fund’s annualized returns for the three- and five-year periods exceeded 7% and 6%, respectively.
Franklin Large Cap Value Fund - The performance universe for this Fund consisted of the Fund and all retail and institutional large-cap value funds as selected by Lipper. The Broadridge report comparison showed the Fund’s total return during 2015 to be in the lowest performing quintile of such universe, and on an annualized basis to be in the lowest performing quintile of such universe for the previous three-, five- and 10-year periods. The Board noted that during the past year management had proposed and the Board had approved the reorganization of the Fund into the Franklin Rising Dividends Fund, a fund with several similar principal investment strategies and investment risks but a larger asset size, lower annual fund operating expenses, better historical performance and more favorable sales prospects. In view of this planned reorganization, the Board did not believe that further action was warranted.
Franklin MicroCap Value Fund - The performance universe for this Fund consisted of the Fund and all retail and institutional small-cap value funds as selected by Lipper. The Broadridge report comparison showed the Fund’s total return during 2015 to be in the second-lowest performing quintile of such performance universe, and on an annualized basis to be in the lowest performing quintile of such universe for the previous three-year period and the middle performing quintile during the previous five- and 10-year periods. The Board discussed with management the Fund’s limited investment opportunities with respect to companies with market capitalizations of less than $500 million and the factors that may influence performance in the future. They also discussed the impact of the Fund’s exposure to the energy sector and the impact of allocation during the period. They discussed their work with Franklin’s portfolio analytics team to develop strategies to address allocation effects going forward. Taking this into account and noting the Fund’s longer term positive annualized returns—over 6%, 7% and 6% over the past three-, five- and 10-year periods, respectively—the Board found the performance to be acceptable.
Franklin MidCap Value Fund - The performance universe for this Fund consisted of the Fund and all retail and institutional mid-cap value funds as selected by Lipper. The Broadridge report showed the Fund’s total return for 2015 to be in the second-lowest performing quintile of such universe, and on an annualized basis to be in the lowest performing quintile of such universe for the previous three-, five- and 10-year periods. The Board was not satisfied with such performance, and discussed the Fund’s investment strategy with management and reasons for such comparative underperformance. Management discussed the impact of the materials and financial sectors on short-term results and the energy sector on longer term results. They discussed the implementation of changes to the investment process to incorporate a more robust screening process. Over the past year, the Fund was repositioned and the cash level was reduced. While expressing disappointment with the results, the Board noted that additions to the portfolio management team were made in 2014 and the more recent changes in process needed time to work, and so determined that no further change in portfolio management was warranted at this time. The Board noted that, while the Fund’s 2015 total return as shown in the Broadridge report was -7.58%, its annualized return for the three- and five-year periods was in excess of 9% and 7%, respectively.
Franklin Small Cap Value Fund - The performance universe for this Fund consisted of the Fund and all retail and institutional small-cap value funds as selected by Lipper. The Broadridge report comparison showed that the Fund’s total return for 2015 placed it in the second-lowest performing quintile of such performance universe and that its total return on an annualized basis was in the second-lowest performing quintile of such universe for the previous three- and five-year periods, and in the middle performing quintile of such universe for the previous 10-year period. Management discussed with the Board steps being taken to address the underperformance of the Fund, including reduced exposure to poorly performing sectors. In light of management’s discussion, the Board found the Fund’s overall comparative performance as shown in the Broadridge report to be acceptable and noted that its annualized returns in the three-, five- and 10-year periods exceeded 7%, 7% and 6%, respectively.
franklintempleton.com
Semiannual Report 111
FRANKLIN VALUE INVESTORS TRUST
SHAREHOLDER INFORMATION
COMPARATIVE EXPENSES. Consideration was given to a comparative analysis of the management fees and total expense ratio of each Fund compared with those of a group of other funds selected by Lipper as constituting its appropriate Lipper expense group. Lipper expense data is based upon information taken from each fund’s most recent annual report, which reflects historical asset levels that may be quite different from those currently existing, particularly in a period of market volatility. While recognizing such inherent limitation and the fact that expense ratios generally increase as assets decline and decrease as assets grow, the Board believed the independent analysis conducted by Lipper to be an appropriate measure of comparative expenses. In reviewing comparative costs, Lipper provides information on each Fund’s contractual investment management fee in comparison with the contractual investment management fee that would have been charged by other funds within its Lipper expense group assuming they were similar in size to the Fund, as well as the actual total expenses of the Fund in comparison with those of its expense group. The Lipper contractual investment management fee comparison includes within such fee any separate administrative fees, and the Lipper actual total expenses, for comparative consistency, are shown by Lipper for Fund Class A shares for funds having multiple share classes. Such expense comparisons in the case of Franklin All Cap Value Fund, Franklin Balance Sheet Investment Fund, Franklin MicroCap Value Fund, and Franklin Small Cap Value Fund, showed its contractual investment management fee rate and total expense ratios to be in either the least expensive or second-least expensive quintile of its respective Lipper expense group. The Board was satisfied with the expenses of these Funds. The Broadridge report for Franklin Large Cap Value Fund showed its contractual fee rates to be in the second-highest expensive quintile of its expense group, with the actual total expense ratio of Franklin Large Cap Value Fund at approximately 14.5 basis points above the median of such expense group. The Broadridge report for Franklin MidCap Value Fund showed its contractual investment management fee rate to be 10 basis points above the median of its expense group, and its actual total expense ratio to be approximately 10 basis points above the median of such expense group after the fee waiver. The Board found the expenses of such Funds to be acceptable, noting that the expenses of Franklin MidCap Value Fund and Franklin All Cap Value Fund were being subsidized by management.
MANAGEMENT PROFITABILITY. The Board also considered the level of profits realized by the Manager and its affiliates in connection with the operation of each Fund. In this respect, the Board reviewed the Fund profitability analysis that addresses the overall profitability of Franklin Templeton’s U.S. fund business, as well as its profits in providing management and other services to each of the individual funds during the 12-month period ended September 30, 2015, being the most recent fiscal year-end for Franklin Resources, Inc., the Manager’s parent. In reviewing the analysis, the Board recognized that allocation methodologies are inherently subjective and various allocation methodologies may be reasonable while producing different results. In this respect, the Board noted that while management continuously makes refinements to its methodologies in response to organizational and product related changes, the overall approach as defined by the primary drivers and activity measurements has remained consistent with that used in the Fund’s profitability report presentations from prior years. Additionally, the Funds’ independent registered public accounting firm had been engaged by the Manager to periodically review the reasonableness of the allocation methodologies to be used solely by the Funds’ Board in reference to the profitability analysis. In reviewing and discussing such analysis, management discussed with the Board its belief that costs incurred in establishing the infrastructure necessary for the type of mutual fund operations conducted by the Manager and its affiliates may not be fully reflected in the expenses allocated to each Fund in determining its profitability, as well as the fact that the level of profits, to a certain extent, reflected operational cost savings and efficiencies initiated by management. The Board also took into account management’s expenditures in improving shareholder services provided the Funds, as well as the need to implement systems and meet additional regulatory and compliance requirements resulting from statutes such as the Sarbanes-Oxley and Dodd-Frank Acts and recent SEC and other regulatory requirements. In addition, the Board considered a third-party study comparing the profitability of the Manager’s parent on an overall basis to other publicly held managers broken down to show profitability from management operations exclusive of distribution expenses, as well as profitability including distribution expenses. The Board also considered the extent to which the Manager and its affiliates might derive ancillary benefits from fund operations, including
112 Semiannual Report
franklintempleton.com
FRANKLIN VALUE INVESTORS TRUST
SHAREHOLDER INFORMATION
revenues generated from transfer agent services and potential benefits resulting from personnel and systems enhancements necessitated by fund growth, increased leverage with service providers and counterparties, allocation of fund brokerage and the use of commission dollars to pay for research. Based upon its consideration of all these factors, the Board determined that the level of profits realized by the Manager and its affiliates from providing services to each Fund was not excessive in view of the nature, quality and extent of services provided.
ECONOMIES OF SCALE. The Board also considered whether economies of scale are realized by the Manager as the Funds grow larger and the extent to which this is reflected in the level of management fees charged. While recognizing that any precise determination is inherently subjective, the Board noted that based upon the Fund profitability analysis, it appears that as some funds get larger, at some point economies of scale do result in the Manager realizing a larger profit margin on management services provided such a fund. The Board also noted that economies of scale are shared with each Fund and its shareholders through management fee breakpoints so that as a Fund grows in size, its effective management fee rate declines. The Board believed that to the extent economies of scale may be realized by the Manager of these Funds and their affiliates, there was a sharing of benefits with each of these Funds and their shareholders. The fee structure of Franklin Small Cap Value Fund provides an initial fee of 0.75% on the first $500 million of Fund net assets; 0.625% on the next $500 million of Fund net assets, 0.50% on Fund net assets in excess of $1 billion, and 0.49% on net assets in excess of $5 billion. At December 31, 2015, the Fund’s net assets were approximately $2.06 billion. The Board believed that to the extent economies of scale may be realized by the Manager and its affiliates, the schedule of fees under the investment management agreement, which was revised in 2014 to add an additional breakpoint, provides a reasonable sharing of benefits with the Fund and its shareholders. The fee structure of both Franklin MidCap Value Fund and Franklin All Cap Value Fund contain breakpoints and the Board felt that in view of their small size no economies of scale were realized in their operations, noting that the expenses of both Funds were subsidized by management. The fee structure under the investment management agreement for Franklin MicroCap Value Fund provides a flat fee of 0.75% at all asset levels. In discussing the absence of breakpoints with the independent Trustees, management pointed out that this Fund invests only in domestic and foreign securities with a market capitalization
of less than $500 million that are believed to be undervalued. Management stated its belief that such limited investment options curtail the potential size of the Fund, thus preventing the type of economies of scale that might benefit other funds from increases in size and also pointed out that the Fund, whose asset size was approximately $317 million at year-end, has been closed to new investors, with limited exceptions, since January 14, 2004, and had a very brief re-opening on February 15, 2013 and closed again to new investors (with limited exceptions) on February 19, 2013. Management also expressed its view that this fee was relatively low for this type of a fund and pointed out the favorable comparison of fees and expenses within its Lipper expense group. The independent Trustees acknowledged that management’s explanation provided a reasonable basis for believing the existing fee rate under the investment management agreement was fair and that, in view of the Fund’s current modest size, management was not benefiting from any meaningful economies of scale in its management of this Fund.
Proxy Voting Policies and Procedures
The Trust’s investment manager has established Proxy Voting Policies and Procedures (Policies) that the Trust uses to determine how to vote proxies relating to portfolio securities. Shareholders may view the Trust’s complete Policies online at franklintempleton.com. Alternatively, shareholders may request copies of the Policies free of charge by calling the Proxy Group collect at (954) 527-7678 or by sending a written request to: Franklin Templeton Companies, LLC, 300 S.E. 2nd Street, Fort Lauderdale, FL 33301, Attention: Proxy Group. Copies of the Trust’s proxy voting records are also made available online at franklintempleton.com and posted on the U.S. Securities and Exchange Commission’s website at sec.gov and reflect the most recent 12-month period ended June 30.
Quarterly Statement of Investments
The Trust files a complete statement of investments with the U.S. Securities and Exchange Commission for the first and third quarters for each fiscal year on Form N-Q. Shareholders may view the filed Form N-Q by visiting the Commission’s website at sec.gov. The filed form may also be viewed and copied at the Commission’s Public Reference Room in Washington, DC. Information regarding the operations of the Public Reference Room may be obtained by calling (800) SEC-0330.
franklintempleton.com
Semiannual Report 113
This page intentionally left blank.
This page intentionally left blank.
This page intentionally left blank.
Item 2. Code of Ethics.
(a) The Registrant has adopted a code of ethics that applies to its principal executive officers and principal financial and accounting officer.
(c) N/A
(d) N/A
(f) Pursuant to Item 12(a)(1), the Registrant is attaching as an exhibit a copy of its code of ethics that applies to its principal executive officers and principal financial and accounting officer.
Item 3. Audit Committee Financial Expert.
(a)(1) The Registrant has an audit committee financial expert serving on its audit committee.
(2) The audit committee financial expert is David W. Niemiec and he is "independent" as defined under the relevant Securities and Exchange Commission Rules and Releases.
Item 4. Principal Accountant Fees and Services. N/A
Item 5. Audit Committee of Listed Registrants. N/A
Item 6. Schedule of Investments. N/A
Item 7. Disclosure of Proxy Voting Policies and Procedures for Closed-End Management Investment Companies. N/A
Item 8. Portfolio Managers of Closed-End Management Investment Companies. N/A
Item 9. Purchases of Equity Securities by Closed-End Management Investment Company and Affiliated Purchasers. N/A
Item 10. Submission of Matters to a Vote of Security Holders.
There have been no changes to the procedures by which shareholders may recommend nominees to the Registrant's Board of Trustees that would require disclosure herein.
Item 11. Controls and Procedures.
(a) Evaluation of Disclosure Controls and Procedures. The Registrant maintains disclosure controls and procedures that are designed to ensure that information required to be disclosed in the Registrant’s filings under the Securities Exchange Act of 1934 and the Investment Company Act of 1940 is recorded, processed, summarized and reported within the periods specified in the rules and forms of the Securities and Exchange Commission. Such information is accumulated and communicated to the Registrant’s management, including its principal executive officer and principal financial officer, as appropriate, to allow timely decisions regarding required disclosure. The Registrant’s management, including the principal executive officer and the principal financial officer, recognizes that any set of controls and procedures, no matter how well designed and operated, can provide only reasonable assurance of achieving the desired control objectives.
Within 90 days prior to the filing date of this Shareholder Report on Form N-CSR, the Registrant had carried out an evaluation, under the supervision and with the participation of the Registrant’s management, including the Registrant’s principal executive officer and the Registrant’s principal financial officer, of the effectiveness of the design and operation of the Registrant’s disclosure controls and procedures. Based on such evaluation, the Registrant’s principal executive officer and principal financial officer concluded that the Registrant’s disclosure controls and procedures are effective.
(b) Changes in Internal Controls. There have been no changes in the Registrant’s internal controls or in other factors that could materially affect the internal controls over financial reporting subsequent to the date of their evaluation in connection with the preparation of this Shareholder Report on Form N-CSR.
Item 12. Exhibits.
(a)(1) Code of Ethics
(a)(2) Certifications pursuant to Section 302 of the Sarbanes-Oxley Act of 2002 of Laura F. Fergerson, Chief Executive Officer - Finance and Administration, and Robert G. Kubilis, Chief Financial Officer and Chief Accounting Officer
(b) Certifications pursuant to Section 906 of the Sarbanes-Oxley Act of 2002 of Laura F. Fergerson, Chief Executive Officer - Finance and Administration, and Robert G. Kubilis, Chief Financial Officer and Chief Accounting Officer
SIGNATURES
Pursuant to the requirements of the Securities Exchange Act of 1934 and the Investment Company Act of 1940, the registrant has duly caused this report to be signed on its behalf by the undersigned, thereunto duly authorized.
FRANKLIN VALUE INVESTORS TRUST
By /s/ Laura F. Fergerson
Laura F. Fergerson
Chief Executive Officer –
Finance and Administration
Date June 24, 2016
Pursuant to the requirements of the Securities Exchange Act of 1934 and the Investment Company Act of 1940, this report has been signed below by the following persons on behalf of the registrant and in the capacities and on the dates indicated.
By /s/ Laura F. Fergerson
Laura F. Fergerson
Chief Executive Officer –
Finance and Administration
Date June 24, 2016
By /s/ Robert G. Kubilis
Robert G. Kubilis
Chief Financial Officer and
Chief Accounting Officer
Date June 24, 2016